raman identification of materials used for jewellery and mosaics in ifriqiya
TRANSCRIPT
JOURNAL OF RAMAN SPECTROSCOPYJ. Raman Spectrosc. 2003; 34: 205–213Published online in Wiley InterScience (www.interscience.wiley.com). DOI: 10.1002/jrs.977
Raman identification of materials used for jewelleryand mosaics in Ifriqiya
Philippe Colomban,1∗ Gregory March,1 Leo Mazerolles,2 Tijani Karmous,3 Naceur Ayed,3
Abdelmajid Ennabli4 and Hedi Slim4
1 Laboratoire de Dynamique, Interaction et Reactivite (LADIR), UMR 7075 CNRS and Universite Pierre et Marie Curie, 2 rue Henry-Dunant, 94320Thiais, France2 CECM, UPR 2801 CNRS, 15 rue Georges Urbain, 94407 Vitry-sur-Seine, France3 Unite de Recherche 1201, Institut des Sciences Appliquees et de Technologie, BP 676, 1080 Tunis, Tunisia4 Institut National du Patrimoine, 4 Place du Chateau, 1008 Tunis, Bab Menara, Tunisia
Received 25 October 2002; Accepted 7 December 2002
Beads, rings and mosaic tessarae from Tunisia (Carthage and Utica, 1st centuries BC and AD, El Djem,2nd–3rd centuries and Mahdia, 10th century) were analysed by Raman spectroscopy for non-destructivedifferentiation of various types of glasses (most have Si- and Na/Ca-rich compositions, some others arelead-containing glass) and identification of synthetic or natural minerals (crystal or stone). The results arediscussed in the light of chemical analyses. A green glass is coloured by a Cr-based nanosized pigment anda red mosaic tesserae is obtained by a colloidal dispersion of gold (Cassius purple). Cassiterite (SnO2) isused as an opacifier or fluxing agent. The examination of glass mosaic and jewellery microstructure showsthat some pieces are made of sintered glass, i.e. using a paste technology. Copyright 2003 John Wiley &Sons, Ltd.
KEYWORDS: glass; structure; composition; archaeometry; processing
INTRODUCTION
From the fourth millennium BC onwards, alkali glazes wereused in the Near East and Egypt.1 – 3 More complex glassycompositions were also used as the constituent of colouredenamels, applied on ceramics (first ash-based enamels inChina, one millennium BC, lead-based glasses a few centuriesAD, later mixed with powdered rocks).1,4 – 6 Lead-basedglasses appeared during the Roman era (1st century BC to1st century AD) and, at the same period or possibly a fewcenturies earlier in China.4 First, the glass was handled asa paste. Then blowing techniques developed, many itemscould be manufactured and the technology spread out overthe entire Mediterranean world. Glass ingots appeared veryearly, indicating a large trading activity. Glass of mosaictessarae has been manufactured by drawing a rod, cutting itinto slices and assembling the pieces in a mould for forming.2
From the composition of Roman and Mediterranean glass,it was concluded that they were mixtures of calcium-containing silica sand and a soda-based alkaline plant ashcoming from Syria (and later from Spain), along with desert
ŁCorrespondence to: Philippe Colomban, Laboratoire deDynamique, Interaction et Reactivite (LADIR), UMR 7075 CNRSand Universite Pierre et Marie Curie, 2 rue Henry-Dunant, 94320Thiais, France. E-mail: [email protected]
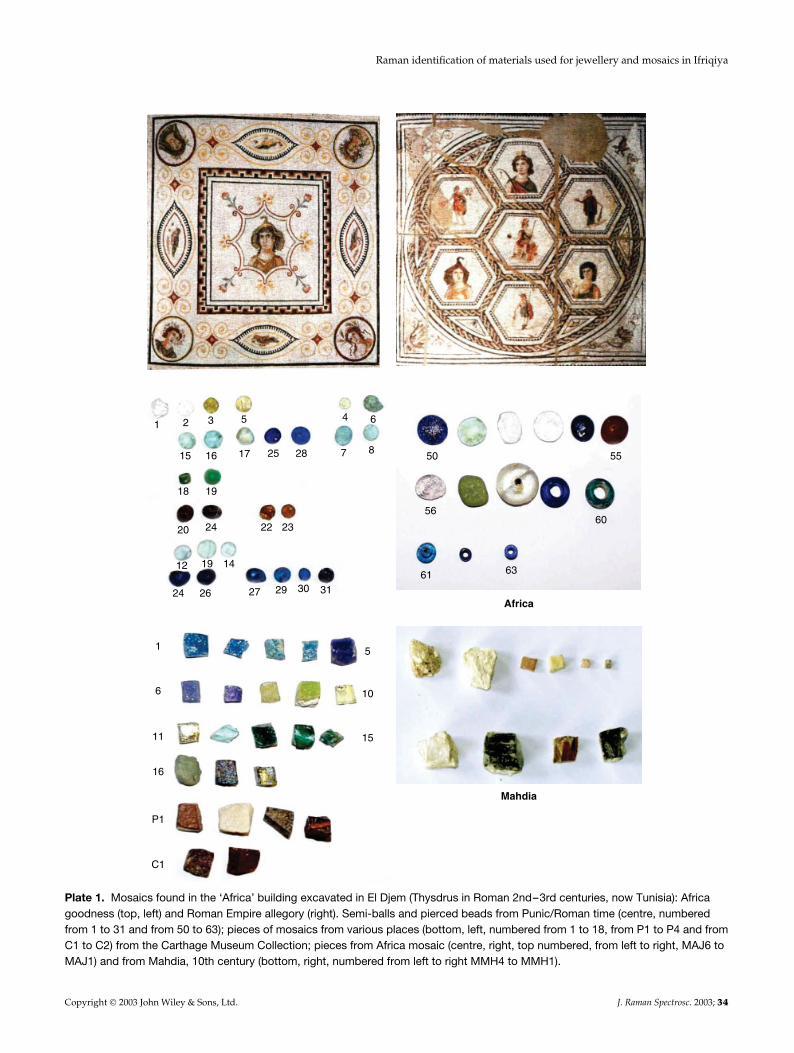
natron deposits from Egypt. Glass items were produced inancient Egypt (ca 1500 BC) and the technique developedto cover the whole Mediterranean basin at the end of theRoman Republic. In addition to many types of vases, a lotof small items (braces, amulets, eyes for statue, beads, etc.)of different colour were produced, especially in Alexandria,and sold by the Phoenicians. Small, light-green beads werefound in Punic places dating from the 6th century BC.7,8 TheMuseum of Carthage has a large collection of uncut or semi-cut optically clear ‘stones’ (elements of finger rings), elementsof necklaces (pendants, beads) and mosaic pieces collected indifferent places in Ifriqiya.9 – 12 Until now, identification wasmade using visual criteria among a variety of stones, viz.rock crystal, cornelian, agate, jasper, lapis lazuli, haematite,coral, etc., and glass. The number of mosaics that were foundin Tunisia is very important and plays a prominent role in theknowledge of Punic and Roman mosaic art. Many importantpieces have been excavated in El Djem, the old Thysdrus(2nd–3rd centuries).13 – 14 The so-called Africa building offersan outstanding piece (>3000 m2) from a talented Romanmaker (the 2nd–3rd centuries AD) with the figure of theAfrica goodness and an allegory of the Empire, showingthe main countries: Egypt, Asia, Spain, Sicily and Ifriqiya(Plate 1). The technique of producing mosaics continued fora long time and the Mahdia (10th century) is an example of
Copyright 2003 John Wiley & Sons, Ltd.
206 Ph. Colomban et al.
this production. Because some of the pieces of ‘stones’ usedfor the mosaic look like glass, we used Raman scattering tocompare the different fragments of ceramics with jewelleryfrom old archaeological excavations.
Many research groups have demonstrated the value ofRaman spectroscopy as a technique for the characterizationof archaeological and historical artefacts.15 – 24 Each crystallinephase exhibits a characteristic Raman fingerprint and it ispossible to identify a crystalline phase by comparing theRaman spectrum with reference spectra, in a similar waythat diffraction patterns may be compared with references.A great advantage of Raman spectroscopy is that spectracan be recorded in a time ranging from a few secondsto a few tenths of minutes, a much smaller time thanusing x-ray diffraction. Further, because of their multiphase(crystalline and amorphous) character, with the size ofeach phase ranging from sub-µm to mm, many materialsneed to be analysed point by point in small volumes. Itis another important advantage of Raman spectroscopyto allow such a measurement. Nano phases dispersed inamorphous or crystalline phases can even be detected atvery low concentration, provided that the phase is builtwith electron-rich bonds (resonance Raman spectroscopy).With a suitable choice of optical objectives and a hole forconfocal setting, one can detect structural phases existingwith µm size and in the glass depth. For instance, using að100 magnification, 0.9 aperture objective and the confocalhole of 100 µm, it is possible to analyse sample volumes ofseveral µm3. The smallest volume to be analysed is less than1 µm3, with a confocal hole of several tens of micrometres.Analysis, from the top surface to the body–glaze interfacein ceramics or at the grain boundary in sintered glass, ispossible by changing the focalization point.
In previous studies on ceramic glazes,20 – 24 we showedthat a clear differentiation between the various ceramicglazes (glassy coatings on ceramics) is possible, because theconnectivity of the SiO4 polymeric unit can be determinedfrom the relative intensity of the Si–O bending (ca 500 cm�1)and stretching (ca 1000 cm�1) modes envelope. Comparisonof the centre of gravity of the Si–O stretching modecomponents allows for a more precise characterization ofthe different glasses, particularly with respect to the firingtemperature. Thus, a differentiation between lead-based andalkali-based glasses is possible.21,24 Furthermore, the wholeRaman fingerprint can give information about the glassstructure and, subsequently, the technology used.24 Therelationship of glass production and technology with themanufacture of faience enamel being suspected, we havestarted a comparative study of glass-made artefacts (thiswork) and glazed ceramics in Ifriqiya.25 In this study weused a series of glass items whose origin was not exactlyknown, in order to perform some destructive investigations(required for confirmation of the Raman investigations). Ourgoal is the evaluation of Raman (micro)spectroscopy as aclassification technique for glass-made artefacts.
EXPERIMENTAL
TechniquesBackscattering micro Raman spectroscopy was performedon the samples. Surface and near-surface volumes couldbe analysed specifically using the highest magnification(ð500 or ð1000). Wavelengths of 458, 488, 633 and 647 nmwere used as excitation sources. Shorter wavelengths givestrong Raman scattering and provide a large spectralwindow whereas red lines are used for analysis of the low-wavenumber region, below 200 cm�1. Two spectrometerswere used: (i) a notch filtered Infinity spectrograph (DILOR,Lille, France) equipped with a Peltier-cooled CCD and withexciting power between 0.01 and 0.1 mW; and (ii) a (DILOR)XY spectrograph equipped with a liquid nitrogen-cooledCCD matrix (2000 ð 256 pixels). The exciting power was0.5–5 mW on the sample. The spectral resolution was either<1 cm�1 (XY system) or 2 cm�1 (Infinity system).
The elemental composition of the major elements (Na, Ca,Si, Al, etc.) were determined by chemical analysis of pow-dered samples at the Service Central d’Analyse (CNRS, Ver-naison, France). X-ray fluorescence measurements (PhilipsXL 30 instrument) were performed for some samples (stuckusing silver lacquer and free of any coatings). Additionally,a few Au–Pd-coated samples were analysed by EDX usinga Leo 1530 electron microscope (Germany) equipped witha Princeton Gamma Tech (USA) EDX accessory (with a BNwindow allowing C and O detection). Data were processedusing IMIX-10 software.
Sample compositions were classified using Statistikasoftware (Statsoft, 1993), through the Euclidean distancesmethod.
SamplesThe different sites (Carthage, Utica, etc.) from which thestudied material had been excavated in the past are oldPhoenician cities. Glass production in Carthage, Dermechand Kerkouane is well established.9 – 14 Semi-cut elementsof rings (1–31, 50–57) are shown in the centre of Plate 1[some beads with a central hole are also considered (58–63)].Typical sizes are 10 mm in diameter and 5 mm in thickness.The biggest sample is item 58 (diameter 17 mm, thickness8 mm) and the smallest is item 62 (external diameter 4 mm,thickness 4 mm).
Mosaic tessarae are shown at the bottom of Plate 1 (firstcenturies BC and AD; 1–18, P1–P4, C1–C2; IInd–IIIrd cen-turies, MAJ1–MAJ6; Xth century, MMH1–MMH4). Typicalsizes are 6 ð 7 ð 5 mm. The smallest item is 5 ð 6 ð 5 mm(15) and is 3 ð 3 ð 4 mm (1a). The largest one is MMH3 ofsize 22 ð 20 ð 18 mm.
RESULTS AND DISCUSSION
Recognition of the glassy character of the sampleRepresentative Raman spectra of the semi-cut glass beadsand rings of Plate 1 are presented in Fig. 1. Except for
Copyright 2003 John Wiley & Sons, Ltd. J. Raman Spectrosc. 2003; 34: 205–213
Raman identification of materials used for jewellery and mosaics in Ifriqiya
1
15
18
20
12
24 26 27 29 30
1 5
10
15
6
11
16
P1
C1
31
19 14
24 22 23
19
16 17 25 28 50 55
60
6361
56
7 8
32 5 4 6
Africa
Mahdia
Plate 1. Mosaics found in the ‘Africa’ building excavated in El Djem (Thysdrus in Roman 2nd–3rd centuries, now Tunisia): Africagoodness (top, left) and Roman Empire allegory (right). Semi-balls and pierced beads from Punic/Roman time (centre, numberedfrom 1 to 31 and from 50 to 63); pieces of mosaics from various places (bottom, left, numbered from 1 to 18, from P1 to P4 and fromC1 to C2) from the Carthage Museum Collection; pieces from Africa mosaic (centre, right, top numbered, from left to right, MAJ6 toMAJ1) and from Mahdia, 10th century (bottom, right, numbered from left to right MMH4 to MMH1).
Copyright 2003 John Wiley & Sons, Ltd. J. Raman Spectrosc. 2003; 34
Ph. Colomban et al.
(a)
(b)
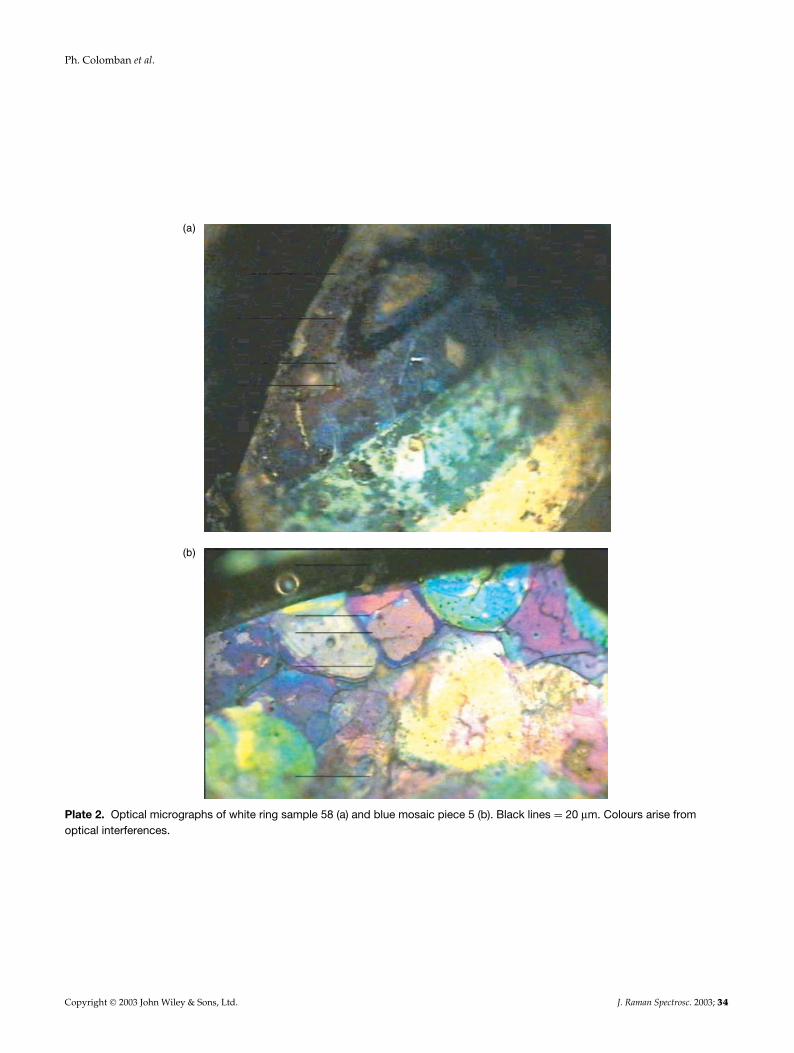
Plate 2. Optical micrographs of white ring sample 58 (a) and blue mosaic piece 5 (b). Black lines D 20 µm. Colours arise fromoptical interferences.
Copyright 2003 John Wiley & Sons, Ltd. J. Raman Spectrosc. 2003; 34
Raman identification of materials used for jewellery and mosaics in Ifriqiya 207
200 400 600 800 1000 1200
3
950995
1098
560
420
350 480 640 900888848
1080
985
555
795
1bis
26
25
17
19
18
20
22
2
Inte
nsity
/ ar
bitr
. uni
ts
Wavenumber / cm-1
400 800 1200 1600
R 11 mW
540
61
63
62
52
51
54
57
5558
58*
350450
600790
1048
1090
982
580490
462
1080990
830310
830780
11001005
950580
550
1515
425
56016051465
13151045800
480
Wavenumber / cm-1
Inte
nsity
/ ar
bitr
. uni
ts
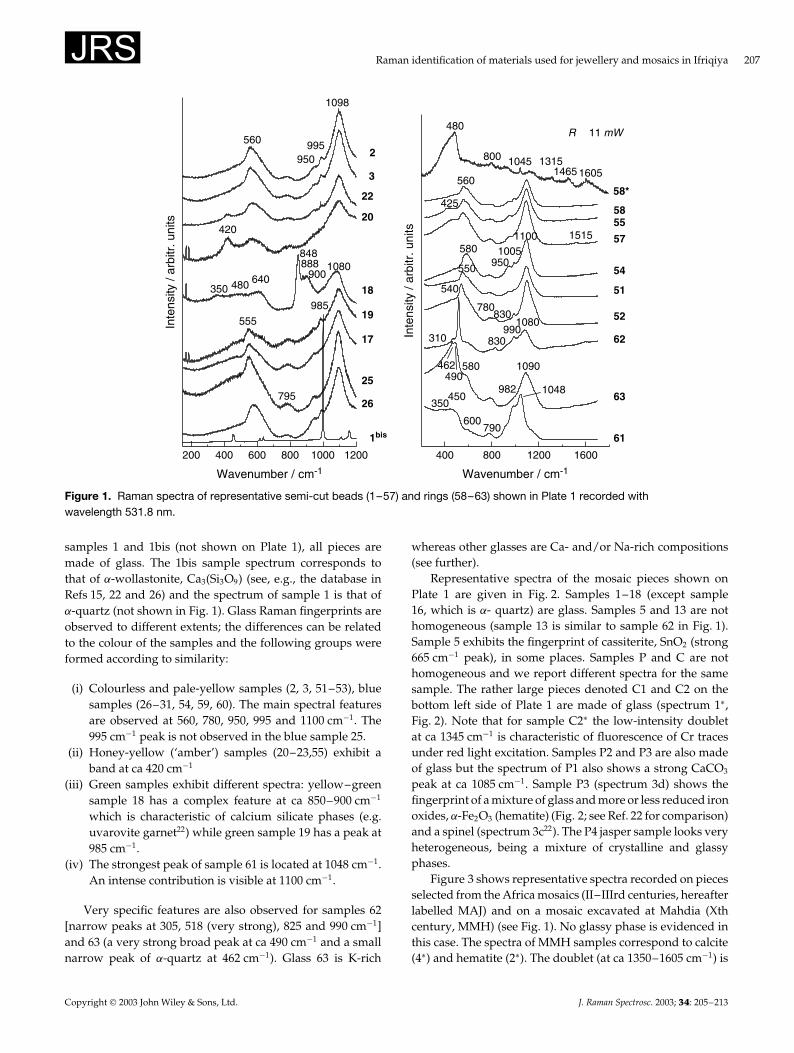
Figure 1. Raman spectra of representative semi-cut beads (1–57) and rings (58–63) shown in Plate 1 recorded withwavelength 531.8 nm.
samples 1 and 1bis (not shown on Plate 1), all pieces aremade of glass. The 1bis sample spectrum corresponds tothat of ˛-wollastonite, Ca3(Si3O9) (see, e.g., the database inRefs 15, 22 and 26) and the spectrum of sample 1 is that of˛-quartz (not shown in Fig. 1). Glass Raman fingerprints areobserved to different extents; the differences can be relatedto the colour of the samples and the following groups wereformed according to similarity:
(i) Colourless and pale-yellow samples (2, 3, 51–53), bluesamples (26–31, 54, 59, 60). The main spectral featuresare observed at 560, 780, 950, 995 and 1100 cm�1. The995 cm�1 peak is not observed in the blue sample 25.
(ii) Honey-yellow (‘amber’) samples (20–23,55) exhibit aband at ca 420 cm�1
(iii) Green samples exhibit different spectra: yellow–greensample 18 has a complex feature at ca 850–900 cm�1
which is characteristic of calcium silicate phases (e.g.uvarovite garnet22) while green sample 19 has a peak at985 cm�1.
(iv) The strongest peak of sample 61 is located at 1048 cm�1.An intense contribution is visible at 1100 cm�1.
Very specific features are also observed for samples 62[narrow peaks at 305, 518 (very strong), 825 and 990 cm�1]and 63 (a very strong broad peak at ca 490 cm�1 and a smallnarrow peak of ˛-quartz at 462 cm�1). Glass 63 is K-rich
whereas other glasses are Ca- and/or Na-rich compositions(see further).
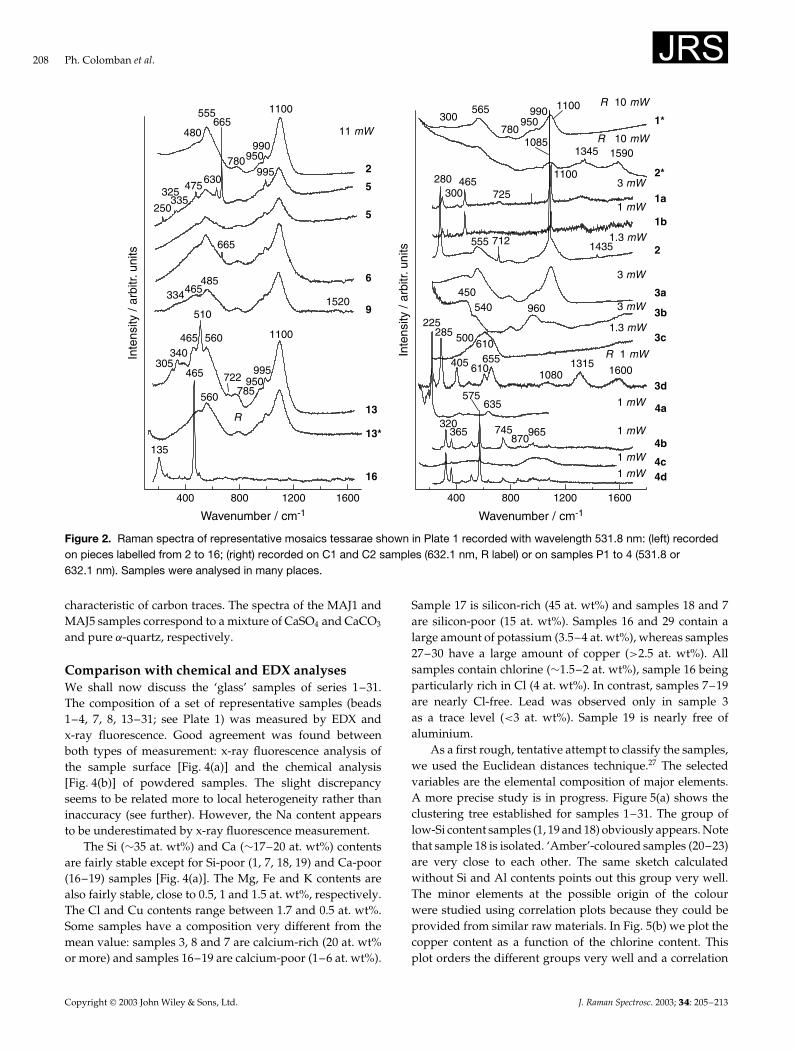
Representative spectra of the mosaic pieces shown onPlate 1 are given in Fig. 2. Samples 1–18 (except sample16, which is ˛- quartz) are glass. Samples 5 and 13 are nothomogeneous (sample 13 is similar to sample 62 in Fig. 1).Sample 5 exhibits the fingerprint of cassiterite, SnO2 (strong665 cm�1 peak), in some places. Samples P and C are nothomogeneous and we report different spectra for the samesample. The rather large pieces denoted C1 and C2 on thebottom left side of Plate 1 are made of glass (spectrum 1Ł,Fig. 2). Note that for sample C2Ł the low-intensity doubletat ca 1345 cm�1 is characteristic of fluorescence of Cr tracesunder red light excitation. Samples P2 and P3 are also madeof glass but the spectrum of P1 also shows a strong CaCO3
peak at ca 1085 cm�1. Sample P3 (spectrum 3d) shows thefingerprint of a mixture of glass and more or less reduced ironoxides, ˛-Fe2O3 (hematite) (Fig. 2; see Ref. 22 for comparison)and a spinel (spectrum 3c22). The P4 jasper sample looks veryheterogeneous, being a mixture of crystalline and glassyphases.
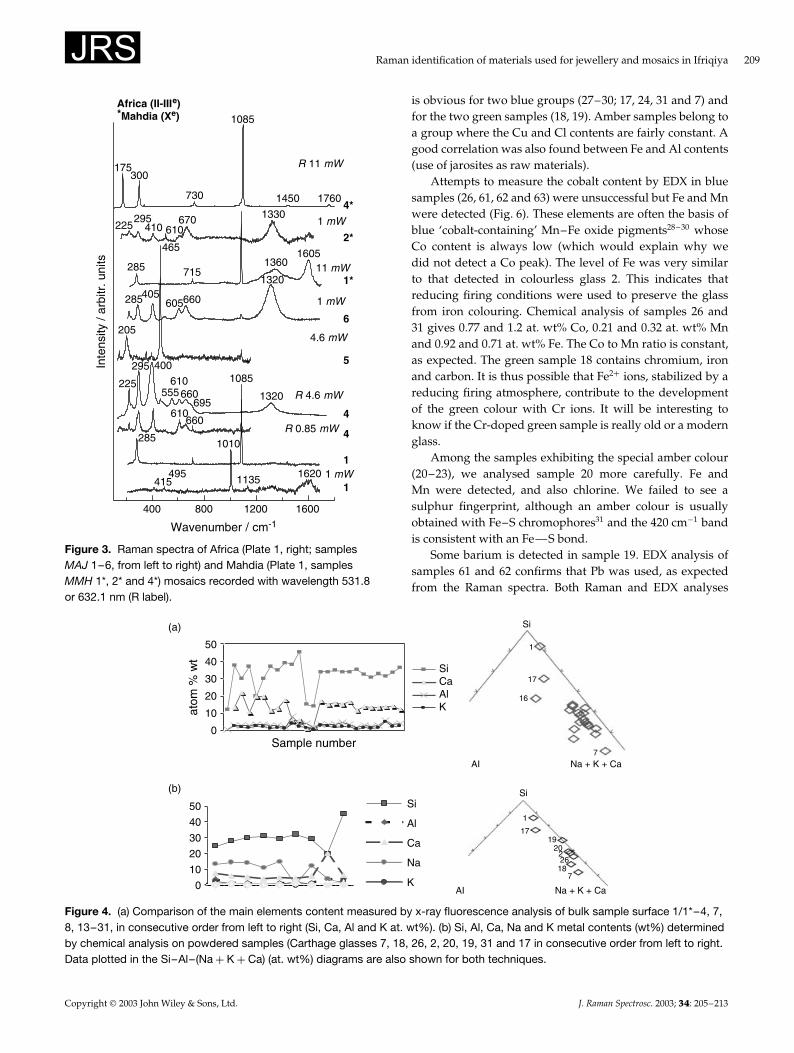
Figure 3 shows representative spectra recorded on piecesselected from the Africa mosaics (II–IIIrd centuries, hereafterlabelled MAJ) and on a mosaic excavated at Mahdia (Xthcentury, MMH) (see Fig. 1). No glassy phase is evidenced inthis case. The spectra of MMH samples correspond to calcite(4Ł) and hematite (2Ł). The doublet (at ca 1350–1605 cm�1) is
Copyright 2003 John Wiley & Sons, Ltd. J. Raman Spectrosc. 2003; 34: 205–213
208 Ph. Colomban et al.
400 800 1200 1600
R
11 mW
16
13*
13
9
6
5
5
2
560
465
135
305340
465
510
560
722785
950995
1100
485465334
1520
665
995630
475335
325
250
1100
990950780
665555
480
Wavenumber / cm-1
Inte
nsity
/ ar
bitr.
uni
ts
400 800 1200 1600
1 mW
1 mW
1 mW
4a1 mW
R 1 mW
1.3 mW
3 mW
3 mW
1 mW
1.3 mW
3 mW
R 10 mW
R 10 mW
4d4c
4b
3d
3c
3b
3a
2
1b
1a
2*
1*300
965870
745
575635
365320
16001315
1080
655610405
285225
610500
960540450
1435712555
280725
465300
15901345
1100
1085
1100990950
780
565
Inte
nsity
/ ar
bitr.
uni
ts
Wavenumber / cm-1
Figure 2. Raman spectra of representative mosaics tessarae shown in Plate 1 recorded with wavelength 531.8 nm: (left) recordedon pieces labelled from 2 to 16; (right) recorded on C1 and C2 samples (632.1 nm, R label) or on samples P1 to 4 (531.8 or632.1 nm). Samples were analysed in many places.
characteristic of carbon traces. The spectra of the MAJ1 andMAJ5 samples correspond to a mixture of CaSO4 and CaCO3
and pure ˛-quartz, respectively.
Comparison with chemical and EDX analysesWe shall now discuss the ‘glass’ samples of series 1–31.The composition of a set of representative samples (beads1–4, 7, 8, 13–31; see Plate 1) was measured by EDX andx-ray fluorescence. Good agreement was found betweenboth types of measurement: x-ray fluorescence analysis ofthe sample surface [Fig. 4(a)] and the chemical analysis[Fig. 4(b)] of powdered samples. The slight discrepancyseems to be related more to local heterogeneity rather thaninaccuracy (see further). However, the Na content appearsto be underestimated by x-ray fluorescence measurement.
The Si (¾35 at. wt%) and Ca (¾17–20 at. wt%) contentsare fairly stable except for Si-poor (1, 7, 18, 19) and Ca-poor(16–19) samples [Fig. 4(a)]. The Mg, Fe and K contents arealso fairly stable, close to 0.5, 1 and 1.5 at. wt%, respectively.The Cl and Cu contents range between 1.7 and 0.5 at. wt%.Some samples have a composition very different from themean value: samples 3, 8 and 7 are calcium-rich (20 at. wt%or more) and samples 16–19 are calcium-poor (1–6 at. wt%).
Sample 17 is silicon-rich (45 at. wt%) and samples 18 and 7are silicon-poor (15 at. wt%). Samples 16 and 29 contain alarge amount of potassium (3.5–4 at. wt%), whereas samples27–30 have a large amount of copper (>2.5 at. wt%). Allsamples contain chlorine (¾1.5–2 at. wt%), sample 16 beingparticularly rich in Cl (4 at. wt%). In contrast, samples 7–19are nearly Cl-free. Lead was observed only in sample 3as a trace level (<3 at. wt%). Sample 19 is nearly free ofaluminium.
As a first rough, tentative attempt to classify the samples,we used the Euclidean distances technique.27 The selectedvariables are the elemental composition of major elements.A more precise study is in progress. Figure 5(a) shows theclustering tree established for samples 1–31. The group oflow-Si content samples (1, 19 and 18) obviously appears. Notethat sample 18 is isolated. ‘Amber’-coloured samples (20–23)are very close to each other. The same sketch calculatedwithout Si and Al contents points out this group very well.The minor elements at the possible origin of the colourwere studied using correlation plots because they could beprovided from similar raw materials. In Fig. 5(b) we plot thecopper content as a function of the chlorine content. Thisplot orders the different groups very well and a correlation
Copyright 2003 John Wiley & Sons, Ltd. J. Raman Spectrosc. 2003; 34: 205–213
Raman identification of materials used for jewellery and mosaics in Ifriqiya 209
400 800 1200 1600
Africa (II-III )*Mahdia (Xe)
1 mW
R 0.85 mW
R 4.6 mW
4.6 mW
1 mW
11 mW
1 mW
R 11 mW
1
1
4
4
5
6
1*
2*
4*
16201135495415
1010285
660610
1320
1085
695660
610555
400295
225
205
465
1320
660605405285
16051360
715285
1330670610410
295225
17601450
1085
730
300175
Inte
nsity
/ ar
bitr
. uni
ts
Wavenumber / cm-1
e
Figure 3. Raman spectra of Africa (Plate 1, right; samplesMAJ 1–6, from left to right) and Mahdia (Plate 1, samplesMMH 1*, 2* and 4*) mosaics recorded with wavelength 531.8or 632.1 nm (R label).
is obvious for two blue groups (27–30; 17, 24, 31 and 7) andfor the two green samples (18, 19). Amber samples belong toa group where the Cu and Cl contents are fairly constant. Agood correlation was also found between Fe and Al contents(use of jarosites as raw materials).
Attempts to measure the cobalt content by EDX in bluesamples (26, 61, 62 and 63) were unsuccessful but Fe and Mnwere detected (Fig. 6). These elements are often the basis ofblue ‘cobalt-containing’ Mn–Fe oxide pigments28 – 30 whoseCo content is always low (which would explain why wedid not detect a Co peak). The level of Fe was very similarto that detected in colourless glass 2. This indicates thatreducing firing conditions were used to preserve the glassfrom iron colouring. Chemical analysis of samples 26 and31 gives 0.77 and 1.2 at. wt% Co, 0.21 and 0.32 at. wt% Mnand 0.92 and 0.71 at. wt% Fe. The Co to Mn ratio is constant,as expected. The green sample 18 contains chromium, ironand carbon. It is thus possible that Fe2C ions, stabilized by areducing firing atmosphere, contribute to the developmentof the green colour with Cr ions. It will be interesting toknow if the Cr-doped green sample is really old or a modernglass.
Among the samples exhibiting the special amber colour(20–23), we analysed sample 20 more carefully. Fe andMn were detected, and also chlorine. We failed to see asulphur fingerprint, although an amber colour is usuallyobtained with Fe–S chromophores31 and the 420 cm�1 bandis consistent with an Fe—S bond.
Some barium is detected in sample 19. EDX analysis ofsamples 61 and 62 confirms that Pb was used, as expectedfrom the Raman spectra. Both Raman and EDX analyses
0
10
20
30
40
50
(a)
(b)
Sample number
atom
% w
t
SiCaAlK
0
10
20
30
40
50 Si
Al
Ca
Na
K
Si
Si
1
1
1719
20226
187
17
16
7
AI Na + K + Ca
AI Na + K + Ca
Figure 4. (a) Comparison of the main elements content measured by x-ray fluorescence analysis of bulk sample surface 1/1*–4, 7,8, 13–31, in consecutive order from left to right (Si, Ca, Al and K at. wt%). (b) Si, Al, Ca, Na and K metal contents (wt%) determinedby chemical analysis on powdered samples (Carthage glasses 7, 18, 26, 2, 20, 19, 31 and 17 in consecutive order from left to right.Data plotted in the Si–Al–(Na C K C Ca) (at. wt%) diagrams are also shown for both techniques.
Copyright 2003 John Wiley & Sons, Ltd. J. Raman Spectrosc. 2003; 34: 205–213
210 Ph. Colomban et al.
Linkage Distance
1716783
27302826292423222120151425133142
18191
0 5 10 15 20 25 30 35
Low SiCr
blue
amber
blue
(a)
(b)
0.5
0.5
1.5
2.5
3.5
4.5
1.5 2.5
Cl / %
Cu
/ %
3.5 4.5
16
222523
2624
27
29
28
30
202131
8
7
151413
1719
18
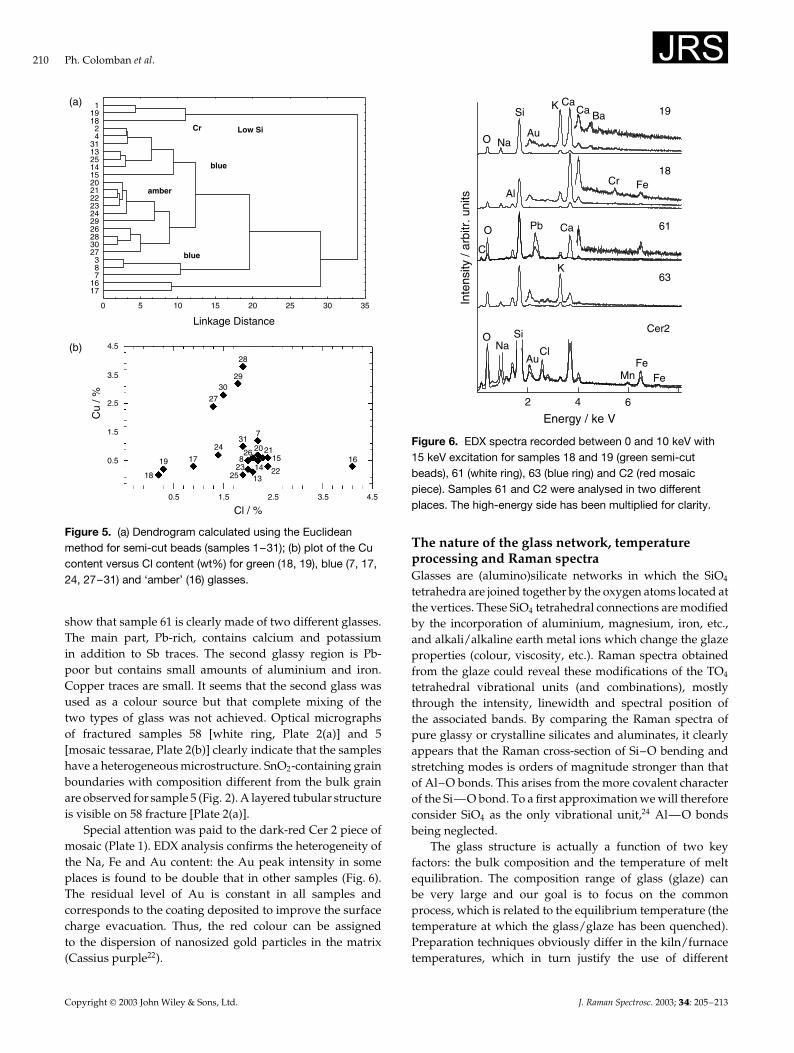
Figure 5. (a) Dendrogram calculated using the Euclideanmethod for semi-cut beads (samples 1–31); (b) plot of the Cucontent versus Cl content (wt%) for green (18, 19), blue (7, 17,24, 27–31) and ‘amber’ (16) glasses.
show that sample 61 is clearly made of two different glasses.The main part, Pb-rich, contains calcium and potassiumin addition to Sb traces. The second glassy region is Pb-poor but contains small amounts of aluminium and iron.Copper traces are small. It seems that the second glass wasused as a colour source but that complete mixing of thetwo types of glass was not achieved. Optical micrographsof fractured samples 58 [white ring, Plate 2(a)] and 5[mosaic tessarae, Plate 2(b)] clearly indicate that the sampleshave a heterogeneous microstructure. SnO2-containing grainboundaries with composition different from the bulk grainare observed for sample 5 (Fig. 2). A layered tubular structureis visible on 58 fracture [Plate 2(a)].
Special attention was paid to the dark-red Cer 2 piece ofmosaic (Plate 1). EDX analysis confirms the heterogeneity ofthe Na, Fe and Au content: the Au peak intensity in someplaces is found to be double that in other samples (Fig. 6).The residual level of Au is constant in all samples andcorresponds to the coating deposited to improve the surfacecharge evacuation. Thus, the red colour can be assignedto the dispersion of nanosized gold particles in the matrix(Cassius purple22).
Fe
NaSi
AuCl
K
Ca
O
642
Energy / ke V
Inte
nsity
/ ar
bitr
. uni
ts
FeMn
PbO
C
Cr FeAl
Cer2
63
61
18
19BaCaK
Au
Si
NaO
Ca
Figure 6. EDX spectra recorded between 0 and 10 keV with15 keV excitation for samples 18 and 19 (green semi-cutbeads), 61 (white ring), 63 (blue ring) and C2 (red mosaicpiece). Samples 61 and C2 were analysed in two differentplaces. The high-energy side has been multiplied for clarity.
The nature of the glass network, temperatureprocessing and Raman spectraGlasses are (alumino)silicate networks in which the SiO4
tetrahedra are joined together by the oxygen atoms located atthe vertices. These SiO4 tetrahedral connections are modifiedby the incorporation of aluminium, magnesium, iron, etc.,and alkali/alkaline earth metal ions which change the glazeproperties (colour, viscosity, etc.). Raman spectra obtainedfrom the glaze could reveal these modifications of the TO4
tetrahedral vibrational units (and combinations), mostlythrough the intensity, linewidth and spectral position ofthe associated bands. By comparing the Raman spectra ofpure glassy or crystalline silicates and aluminates, it clearlyappears that the Raman cross-section of Si–O bending andstretching modes is orders of magnitude stronger than thatof Al–O bonds. This arises from the more covalent characterof the Si—O bond. To a first approximation we will thereforeconsider SiO4 as the only vibrational unit,24 Al—O bondsbeing neglected.
The glass structure is actually a function of two keyfactors: the bulk composition and the temperature of meltequilibration. The composition range of glass (glaze) canbe very large and our goal is to focus on the commonprocess, which is related to the equilibrium temperature (thetemperature at which the glass/glaze has been quenched).Preparation techniques obviously differ in the kiln/furnacetemperatures, which in turn justify the use of different
Copyright 2003 John Wiley & Sons, Ltd. J. Raman Spectrosc. 2003; 34: 205–213
Raman identification of materials used for jewellery and mosaics in Ifriqiya 211
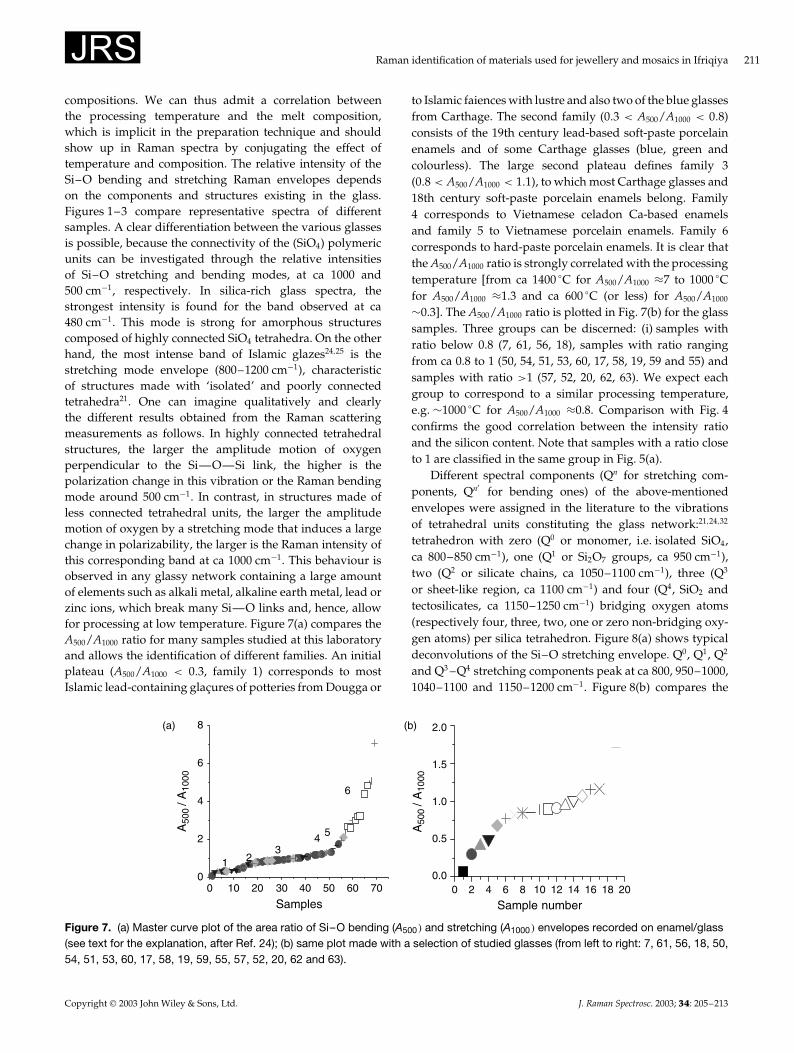
compositions. We can thus admit a correlation betweenthe processing temperature and the melt composition,which is implicit in the preparation technique and shouldshow up in Raman spectra by conjugating the effect oftemperature and composition. The relative intensity of theSi–O bending and stretching Raman envelopes dependson the components and structures existing in the glass.Figures 1–3 compare representative spectra of differentsamples. A clear differentiation between the various glassesis possible, because the connectivity of the (SiO4) polymericunits can be investigated through the relative intensitiesof Si–O stretching and bending modes, at ca 1000 and500 cm�1, respectively. In silica-rich glass spectra, thestrongest intensity is found for the band observed at ca480 cm�1. This mode is strong for amorphous structurescomposed of highly connected SiO4 tetrahedra. On the otherhand, the most intense band of Islamic glazes24,25 is thestretching mode envelope (800–1200 cm�1), characteristicof structures made with ‘isolated’ and poorly connectedtetrahedra21. One can imagine qualitatively and clearlythe different results obtained from the Raman scatteringmeasurements as follows. In highly connected tetrahedralstructures, the larger the amplitude motion of oxygenperpendicular to the Si—O—Si link, the higher is thepolarization change in this vibration or the Raman bendingmode around 500 cm�1. In contrast, in structures made ofless connected tetrahedral units, the larger the amplitudemotion of oxygen by a stretching mode that induces a largechange in polarizability, the larger is the Raman intensity ofthis corresponding band at ca 1000 cm�1. This behaviour isobserved in any glassy network containing a large amountof elements such as alkali metal, alkaline earth metal, lead orzinc ions, which break many Si—O links and, hence, allowfor processing at low temperature. Figure 7(a) compares theA500/A1000 ratio for many samples studied at this laboratoryand allows the identification of different families. An initialplateau (A500/A1000 < 0.3, family 1) corresponds to mostIslamic lead-containing glacures of potteries from Dougga or
to Islamic faiences with lustre and also two of the blue glassesfrom Carthage. The second family (0.3 < A500/A1000 < 0.8)consists of the 19th century lead-based soft-paste porcelainenamels and of some Carthage glasses (blue, green andcolourless). The large second plateau defines family 3(0.8 < A500/A1000 < 1.1), to which most Carthage glasses and18th century soft-paste porcelain enamels belong. Family4 corresponds to Vietnamese celadon Ca-based enamelsand family 5 to Vietnamese porcelain enamels. Family 6corresponds to hard-paste porcelain enamels. It is clear thatthe A500/A1000 ratio is strongly correlated with the processingtemperature [from ca 1400 °C for A500/A1000 ³7 to 1000 °Cfor A500/A1000 ³1.3 and ca 600 °C (or less) for A500/A1000
¾0.3]. The A500/A1000 ratio is plotted in Fig. 7(b) for the glasssamples. Three groups can be discerned: (i) samples withratio below 0.8 (7, 61, 56, 18), samples with ratio rangingfrom ca 0.8 to 1 (50, 54, 51, 53, 60, 17, 58, 19, 59 and 55) andsamples with ratio >1 (57, 52, 20, 62, 63). We expect eachgroup to correspond to a similar processing temperature,e.g. ¾1000 °C for A500/A1000 ³0.8. Comparison with Fig. 4confirms the good correlation between the intensity ratioand the silicon content. Note that samples with a ratio closeto 1 are classified in the same group in Fig. 5(a).
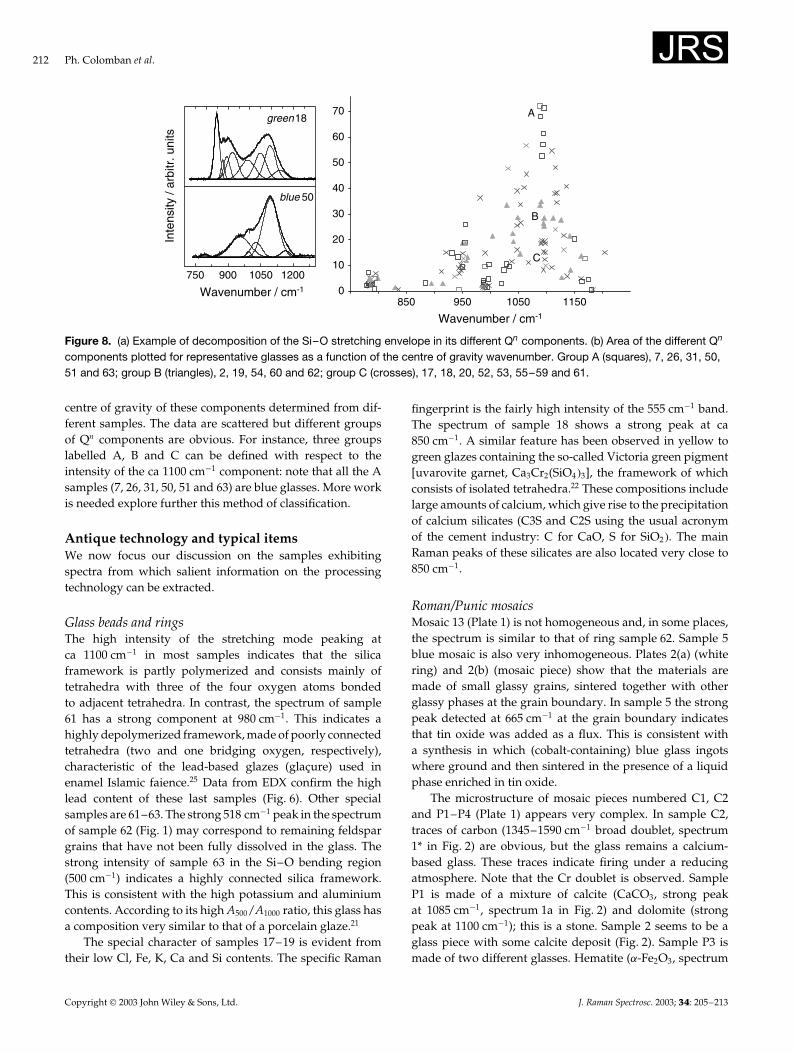
Different spectral components (Qn for stretching com-ponents, Qn0 for bending ones) of the above-mentionedenvelopes were assigned in the literature to the vibrationsof tetrahedral units constituting the glass network:21,24,32
tetrahedron with zero (Q0 or monomer, i.e. isolated SiO4,ca 800–850 cm�1), one (Q1 or Si2O7 groups, ca 950 cm�1),two (Q2 or silicate chains, ca 1050–1100 cm�1), three (Q3
or sheet-like region, ca 1100 cm�1) and four (Q4, SiO2 andtectosilicates, ca 1150–1250 cm�1) bridging oxygen atoms(respectively four, three, two, one or zero non-bridging oxy-gen atoms) per silica tetrahedron. Figure 8(a) shows typicaldeconvolutions of the Si–O stretching envelope. Q0, Q1, Q2
and Q3 –Q4 stretching components peak at ca 800, 950–1000,1040–1100 and 1150–1200 cm�1. Figure 8(b) compares the
200 40 603010 50 700
2
4
6
8
6
543
21
A50
0 / A
1000
Samples
(b)
0 2 4 6 8 10 12 14 16 18 200.0
0.5
1.0
1.5
2.0
A50
0 / A
1000
Sample number
(a)
Figure 7. (a) Master curve plot of the area ratio of Si–O bending (A500� and stretching (A1000� envelopes recorded on enamel/glass(see text for the explanation, after Ref. 24); (b) same plot made with a selection of studied glasses (from left to right: 7, 61, 56, 18, 50,54, 51, 53, 60, 17, 58, 19, 59, 55, 57, 52, 20, 62 and 63).
Copyright 2003 John Wiley & Sons, Ltd. J. Raman Spectrosc. 2003; 34: 205–213
212 Ph. Colomban et al.
green18
750 900 1050 1200
blue 50
Inte
nsity
/ ar
bitr
. uni
ts
Wavenumber / cm-1
Wavenumber / cm-1
C
B
A
0
10
20
30
40
50
60
70
850 950 1050 1150
Figure 8. (a) Example of decomposition of the Si–O stretching envelope in its different Qn components. (b) Area of the different Qn
components plotted for representative glasses as a function of the centre of gravity wavenumber. Group A (squares), 7, 26, 31, 50,51 and 63; group B (triangles), 2, 19, 54, 60 and 62; group C (crosses), 17, 18, 20, 52, 53, 55–59 and 61.
centre of gravity of these components determined from dif-ferent samples. The data are scattered but different groupsof Qn components are obvious. For instance, three groupslabelled A, B and C can be defined with respect to theintensity of the ca 1100 cm�1 component: note that all the Asamples (7, 26, 31, 50, 51 and 63) are blue glasses. More workis needed explore further this method of classification.
Antique technology and typical itemsWe now focus our discussion on the samples exhibitingspectra from which salient information on the processingtechnology can be extracted.
Glass beads and ringsThe high intensity of the stretching mode peaking atca 1100 cm�1 in most samples indicates that the silicaframework is partly polymerized and consists mainly oftetrahedra with three of the four oxygen atoms bondedto adjacent tetrahedra. In contrast, the spectrum of sample61 has a strong component at 980 cm�1. This indicates ahighly depolymerized framework, made of poorly connectedtetrahedra (two and one bridging oxygen, respectively),characteristic of the lead-based glazes (glacure) used inenamel Islamic faience.25 Data from EDX confirm the highlead content of these last samples (Fig. 6). Other specialsamples are 61–63. The strong 518 cm�1 peak in the spectrumof sample 62 (Fig. 1) may correspond to remaining feldspargrains that have not been fully dissolved in the glass. Thestrong intensity of sample 63 in the Si–O bending region(500 cm�1) indicates a highly connected silica framework.This is consistent with the high potassium and aluminiumcontents. According to its high A500/A1000 ratio, this glass hasa composition very similar to that of a porcelain glaze.21
The special character of samples 17–19 is evident fromtheir low Cl, Fe, K, Ca and Si contents. The specific Raman
fingerprint is the fairly high intensity of the 555 cm�1 band.The spectrum of sample 18 shows a strong peak at ca850 cm�1. A similar feature has been observed in yellow togreen glazes containing the so-called Victoria green pigment[uvarovite garnet, Ca3Cr2(SiO4�3], the framework of whichconsists of isolated tetrahedra.22 These compositions includelarge amounts of calcium, which give rise to the precipitationof calcium silicates (C3S and C2S using the usual acronymof the cement industry: C for CaO, S for SiO2�. The mainRaman peaks of these silicates are also located very close to850 cm�1.
Roman/Punic mosaicsMosaic 13 (Plate 1) is not homogeneous and, in some places,the spectrum is similar to that of ring sample 62. Sample 5blue mosaic is also very inhomogeneous. Plates 2(a) (whitering) and 2(b) (mosaic piece) show that the materials aremade of small glassy grains, sintered together with otherglassy phases at the grain boundary. In sample 5 the strongpeak detected at 665 cm�1 at the grain boundary indicatesthat tin oxide was added as a flux. This is consistent witha synthesis in which (cobalt-containing) blue glass ingotswhere ground and then sintered in the presence of a liquidphase enriched in tin oxide.
The microstructure of mosaic pieces numbered C1, C2and P1–P4 (Plate 1) appears very complex. In sample C2,traces of carbon (1345–1590 cm�1 broad doublet, spectrum1* in Fig. 2) are obvious, but the glass remains a calcium-based glass. These traces indicate firing under a reducingatmosphere. Note that the Cr doublet is observed. SampleP1 is made of a mixture of calcite (CaCO3, strong peakat 1085 cm�1, spectrum 1a in Fig. 2) and dolomite (strongpeak at 1100 cm�1); this is a stone. Sample 2 seems to be aglass piece with some calcite deposit (Fig. 2). Sample P3 ismade of two different glasses. Hematite (˛-Fe2O3, spectrum
Copyright 2003 John Wiley & Sons, Ltd. J. Raman Spectrosc. 2003; 34: 205–213
Raman identification of materials used for jewellery and mosaics in Ifriqiya 213
3d in Fig. 2), reduced iron spinel (Fe3O4, spectrum 3c) andcarbon traces (1345–1590 cm�1 doublet overlapping with themagnon peak of hematite at 1315 cm�1� are observed fromplace to place. The black and red-striped sample P4 is alsomade of different phases: spectrum 4b corresponds to thatof hematite22 whereas another phase (spectrum 4d) has notbeen identified.
Mahdia and Africa mosaicsSamples 1 and 4 of Mahdia mosaic consist of calcite (strongpeak at 1085 cm�1, Fig. 3); samples 2* and 3 contain hematite(˛-Fe2O3).
Sample 1 of Africa mosaic is covered with carbon (typicaldoublet at 1345–1590 cm�1) and gypsum (strong peak at1010 cm�1); samples 2 and 3 are also pieces of calcite. Sample3 consists of calcite with hematite, which has been somewhatreduced. This could indicate that the stone has been thermallytreated to develop the ‘right’ coloration or that a fire hasoccurred. Sample 5 contains gypsum, calcite and quartz (inspectrum 5 in Fig. 3, only this last phase is visible).
CONCLUSION
Raman spectroscopy allows fairly rapid classification ofthe present materials: for most of the natural or syntheticminerals, identification is obvious by comparison with adatabase. For glassy phases, the composition used (lead- oralkali-based) can be recognized very easily. Raman micro-spectrometry appears to be a powerful non-destructive tech-nique for analysing the microstructure of ancient (precious)artefacts and differentiate the technology used to processthe samples. We have tried to develop a better knowledgeof the relationship between glass composition and Ramanspectral components in order to predict more quantitativelythe glass composition and the firing technology. Monitoringthe relative intensity ratio between the Si–O bending andstretching envelope appears to be a simple and rapid way ofdoing so and classifying glasses in groups elaborated withsimilar technology. Antique mosaics and beads seem to bemade by sintering a mixture of glasses, i.e. by a technologyrelated to the ‘old’ paste handling. On the other hand, the10th century Mahdia mosaic used stone pieces.
AcknowledgementsMr G. Sagon is acknowledged for his help in recording the Ramanspectra. Thanks are due to Mrs A. M. Lagarde for preparation of thedrawings and to Dr A. Louhichi for very fruitful discussions.
REFERENCES1. Richardson DW. The Magic of Ceramics, American Ceramic
Society: Westerville, 2000.
2. McCray PW, Kingery WD. In Prehistory and History ofGlassmaking Technology, Ceramics and Civilization, vol. VIII,McCray PW, Kingery WD (eds). American Ceramic Society:Westerville, 1998; 1.
3. Paynter S, Tite M. In The Social Context Technological Change,Shirland AJ (ed.). Oxford Books: Oxford, 2001; chapt. 13.
4. Tite MS, Freestone I, Mason R, Molera J, Vendrell-Saz M,Wood N. Archaeometry 2000; 40: 241.
5. Freestone I, Gaimster D (eds). Pottery in the Making–WorldCeramic Tradition. British Museum Press: London, 1977.
6. Cooper E. Ten Thousand Years of Pottery. University ofPennsylvania Press: Philadelphia, PA, 2000.
7. Delattre RP. Mem. Soc. Antiq. Fr. 1895; 56: 325.8. Delattre RP. Cah. Musee Lavig. St.-Louis Carthage 1895; 35: Figs
1–8.9. Picard C. La Vie Quotidienne a Carthage. Hachette: Paris, 1982;
111.10. Moscati S, Fenici I. Carthage–Carthagene, Societa e Costume
Association. Turin, 1976; 501.11. Fantar MH. Bull. Assoc. Intern. Hist. Verre (Liege), 1971–72; 6: 17.12. Yacoub M. Splendeurs des Mosaiques de Tunisie, Agence
Nationale du Patrimoine, Tunis 1995.13. Eastman EM. In Actes du VIIIeme Colloque International pour
l’Etude de la Mosaıque Antique et Medievale, Lausanne, 6–11 October1997, Paunier D, Schmidt C (eds). Cah. Archeol. Romande Lausanne2001; 85–1: 183.
14. Cintas P, Gobert EG. Rev. Tunis. 1939; 166.15. Bell IM, Clark RJH, Gibbs PJ. Spectrochim. Acta, Part A 1997; 53:
2159.16. Edwards HGM. In Encyclopedia of Spectroscopy and Spectrometry,
Lindon J, Tranter G, Holmes J (eds). Academic Press: London,1999; 2.
17. Burgio L, Clark RJH. Acta Chem. Scand. 1999; 53: 181.18. Edwards HGM, Farwell DW, Rull Perez F, Jorge Villar S. J.
Raman Spectrosc. 1999; 30: 307.19. Smith DC, Vernioles JC. J. Raman Spectrosc. 1997; 28: 195.20. Liem NQ, Sagon G, Quang VX, Tan HV, Colomban Ph. J. Raman
Spectrosc. 2000; 31: 933.21. Colomban Ph, Treppoz F. J. Raman Spectrosc. 2001; 32: 93.22. Colomban Ph, Sagon G, Faurel X. J. Raman Spectrosc. 2001; 32:
351.23. Colomban Ph. Asian Chem. Lett. 2001; 5: 125.24. Colomban Ph. J. Non-Cryst. Solids in press.25. Colomban Ph, Sagon G, Louhichi A, Binous H, Ayed N. Rev.
Archeom. 2002; 25: 101.26. Griffith WP. In Infrared and Raman Spectroscopy of Lunar and
Terrestrial Minerals, Karr C Jr (ed). Academic Press: New York,1975, chapt. 12.
27. Picon M. Le Traitement des Donnees d’ Analyses, PACT,‘Datation–Caracterisation des Ceramiques Anciennes’, vol. 10,Hackens T, Schvoere M (eds). Conseil de L’Europe: Strasbourg,1984; 379.
28. Gratuze B, Soulier I, Blet M, Vallaury L. Rev. Archeom. 1996; 20:77.
29. Colomban Ph. In Arts du Vietnam. Noppe C, Hubert J-F. LaRenaissance du Livre: Tournai, 2002; 100.
30. Porter Y. Taoci 2000; 1: 5. SFECO-Editions Findakly: Paris.31. Shi XY, Brungs MP. Phys. Chem. Glasses 1965; 6: 130.32. Seifert F, Mysen BO, Virgo D. Am. Mineral. 1982; 67: 696.
Copyright 2003 John Wiley & Sons, Ltd. J. Raman Spectrosc. 2003; 34: 205–213