quantitative rt-pcr gene expression analysis of laser microdissected tissue samples
TRANSCRIPT

Quantitative RT-PCR gene expression analysis of lasermicrodissected tissue samples
Heidi S. Erickson, Ph.D.1, Paul S. Albert, Ph.D.2, John W. Gillespie, M.D.3, Jaime Rodriguez-Canales, M.D.1, W. Marston Linehan, M.D.4, Peter A. Pinto, M.D.4, Rodrigo F. Chuaqui, M.D.1, and Michael R. Emmert-Buck, M.D., Ph.D.11 Pathogenetics Unit, Laboratory of Pathology and Urologic Oncology Branch, National CancerInstitute, National Institutes of Health, Bethesda, Maryland 208922 Biometric Research Branch, Division of Cancer Treatment and Diagnosis, National CancerInstitute, National Institutes of Health, Bethesda, Maryland, 208523 SAIC-Frederick, Inc., National Cancer Institute at Frederick, Frederick, Maryland 217024 Urologic Oncology Branch, National Cancer Institute, National Institutes of Health 20892
AbstractQuantitative reverse transcription polymerase chain reaction (qRT-PCR) is a valuable tool formeasuring gene expression in biological samples. However, unique challenges are encountered whenstudies are performed on cells microdissected from tissues derived from animal models or the clinic,including specimen related issues, variability of RNA template quality and quantity, andnormalization. qRT-PCR using small amounts of mRNA derived from dissected cell populationsrequires adaptation of standard methods to allow meaningful comparisons across sample sets. Theprotocol described here presents the rationale, technical steps, normalization strategy, and dataanalysis necessary to generate reliable gene expression measurements of transcripts from dissectedsamples. The entire protocol from tissue microdissection through qRT-PCR analysis requiresapproximately 16 hours.
Keywordsquantitative measurements; microdissected tissues; qRT-PCR; validation; gene expression analysis;protocol; normalization strategy
INTRODUCTIONThere is significant interest in the biomedical community in quantitative mRNA expressionanalysis of microdissected cells from animal models or clinical specimens. Thesemeasurements can be performed as either a primary investigative tool or as a method toindependently validate results from expression microarray experiments1–15. The present report
Corresponding Author: Michael R. Emmert-Buck, Pathogenetics Unit, Laboratory of Pathology and Urologic Oncology Branch, NationalCancer Institute, National Institutes of Health, Bethesda, Maryland 20892. [email protected] Requests Author: Heidi S. Erickson, Department of Thoracic/Head and Neck Medical Oncology, Division of Cancer Medicine,University of Texas M.D. Anderson Cancer Center, Houston, Texas 77030. [email protected] was performed at the Pathogenetics Unit, Laboratory of Pathology and Urologic Oncology Branch, National Cancer Institute,National Institutes of Health, Bethesda, Maryland 20892COMPETING INTERESTS STATEMENTThe authors declare no competing financial interests.
NIH Public AccessAuthor ManuscriptNat Protoc. Author manuscript; available in PMC 2010 January 1.
Published in final edited form as:Nat Protoc. 2009 ; 4(6): 902–922. doi:10.1038/nprot.2009.61.
NIH
-PA Author Manuscript
NIH
-PA Author Manuscript
NIH
-PA Author Manuscript

provides a comprehensive protocol for analyzing microdissected samples5;16. To date, this isthe only available protocol detailing the use of qRT-PCR for the comparative analysis ofdiseased and normal frozen microdissected tissues using an appropriate normalization strategy.The protocol is generally accessible to researchers with the potential application to all cell typefrom snap-frozen specimens, but as with any scientific methodology the user may need tomodify conditions to meet their individual experimental requirements.
In our experience, qRT-PCR can be applied successfully to microdissected samples, thoughthere are several challenges and caveats that need to be considered. Clinical specimens inparticular require special diligence and care as upstream processing steps can significantlyinfluence downstream molecular results17–21. Due to the potential importance of these caveatsin influencing expression results, a brief overview of each issue is first provided followed bythe detailed protocol for measuring mRNA.
TISSUE CONSIDERATIONSInvestigators need to be aware of upstream influences on data derived from tissue specimens,especially those from the clinic. Potentially confounding patient-related issues includedemographics, disease status, and past and present therapies. In addition, one needs to becognizant of changes that can occur in the clinic during surgery, tissue acquisition, and in thepathology laboratory, including; time to freezing, freezing method, tissue type, storage, andthe effects of endogenous proteases and RNases. More information on these topics and ageneral review can be found at the National Cancer Institute Office of Biorepositories andBiospecimen Research (http://biospecimens.cancer.gov/) and is addressed by otherresearchers22–34.
TISSUE HANDLING, PROCESSING, AND EMBEDDINGIt is important to consider the route the specimen takes from the time it leaves the patient30 oranimal model to the purification of analytes, including how the tissue is handled up until it isprocessed. Tissue handling steps are dependent on tissue sample size35. Biopsies are typicallysmall and are snap-frozen or placed in fixative immediately after removal from the body.Alternatively, surgical specimens (e.g. entire prostate) are large and need gross processing intosmaller pieces prior to snap-freezing or fixing. Snap-frozen tissue is embedded in OptimumCutting Temperature Compound (OCT) and stored at −80°C, and fixed tissue is almost alwaysformalin-fixed and embedded in paraffin to form a tissue block and stored at room temperature(20 – 25°C). Fixation and embedding provides for optimal histopathological review under lightmicroscopy, although the biomolecules are compromised due to the cross-linking effects offormalin, as well as the embedding process. In contrast, snap-frozen samples provide thehighest quality DNA, mRNA, and protein for analysis, although the histological detail of thesections is inferior to that of fixed and embedded samples. The majority of microdissection-based mRNA expression studies are performed on frozen samples. If the tissue is adequatelypreserved, it is feasible to recover sufficient RNA quantities (100 to 200 ng) to make accuratemeasurements without pre-amplification of the transcriptome16. If it is not possible toimmediately freeze tissue during collection then RNase inhibitors such as RNA Later can beused. While this approach is useful for preserving RNA in bulk tissue, it may not be suitablefor microdissection due to the effect on tissue histology. If microdissection is required, it isrecommended that the effect of RNA Later on tissue histology be investigated before using iton samples.
TISSUE SECTIONING AND STAININGOnce the tissue sample has been located in the database and retrieved from the freezer orarchive, it is ready for sectioning onto glass slides (see Step 3 and Fig. 3a–e). The thickness
Erickson et al. Page 2
Nat Protoc. Author manuscript; available in PMC 2010 January 1.
NIH
-PA Author Manuscript
NIH
-PA Author Manuscript
NIH
-PA Author Manuscript

that tissue sections are cut at varies depending upon the experimental design, with 3–5 μmbeing typical26;36–38 for ethanol fixed paraffin embedded (EFPE) and formalin fixed paraffinembedded (FFPE) tissues. However, we have found that cutting OCT-embedded frozen tissuesat 8 μm gives excellent results for downstream RNA analysis, without increasing the tissueopacity or chance of dissecting contaminating cells. Frozen tissue sections are generally storedfor no more than one month36 and microdissection is performed within a few weeks of cutting.However, improved RNA recovery has been observed from frozen tissue sections stored for ≤two weeks. When cryostat sectioning, investigators should be aware of contamination issuesthat may be due to tissue carryover from other tissue blocks. Thus, clean uncharged slides,disposable cryostat blades, clean brushes, and RNA clean protocols are recommended. Toreduce tissue waste, it is recommended that the tissue be aligned as closely as possible withthe cryostat blade prior to cutting tissue sections. In addition, investigators often prepare 10recuts (or more) at a time, with sections one, five, and 10 hematoxylin and eosin (H&E) stainedand coverslipped for review of the histopathology.
Prior to microdissection, it is necessary to stain the tissue section to allow visualization of thecells of interest. H&E is a standard approach for visualization and is used widely. However,more recently methyl green was shown to have the least fluorescent interference for qRT-PCR39. Therefore, to investigate this more thoroughly, we performed analysis of three differentstaining methods (H&E, hematoxylin, and methyl green) on replicate histological sections priorto microdissection to determine if any of the stains caused a detectable fluorescent interferenceof subsequent qRT-PCR reactions. No statistically significant CT value difference for the threestains was found using an F-test16. Therefore, H&E continues to be an excellent choice forstaining tissue sections prior to LCM (see Step 4, Box 1 and Fig. 3f).
PATHOLOGY EVALUATION OF TISSUE FOR MICRODISSECTIONTissue sections need to be reviewed and annotated prior to microdissection to histologicallyidentify the desired cells for microdissection. Therefore, an evaluation of the tissue samplesby a pathologist or a scientist trained in histologic cell identification of frozen tissues isneeded36 before, during and after microdissection (see Step 5, Box 2 and Fig. 2). Also ofimportance is the orientation of the specimen in the tissue block. This is particularly importantso that the cells of interest are adequately represented on the slide. Pathology slide reviewincludes the evaluation of the tissue integrity, histopathology, determination of the adequacyof the sample for microdissection based on the amount of the target cell population, andannotation of the target cells on the slide. The pathologist also can give advice on the stainingprocedure that will help to better identify the cells of interest under the microscope duringdissection.
TISSUE MICRODISSECTIONLaser based techniques have now made tissue microdissection a routine step in obtainingprecise quantitative gene expression measurements from dissected tissue samples. Lasercapture microdissection (LCM) was invented at the National Institutes of Health (NIH) anddeveloped through a cooperative research and development agreement with ArcturusEngineering, Inc. (www.arctur.com), to facilitate fast, simple, and reliable tissuemicrodissection37;40. Several laser based microdissection platforms are now available forprocurement of pure populations of cells. A thorough review of the various microdissectionplatforms and protocols for LCM has been detailed previously in Nature Protocols36.
RNA RECOVERY AND ASSESSMENTTissue samples may contain qPCR inhibitory agents41–46. In our experience OCT is a majorfactor in qPCR inhibition, therefore it is important to extract and isolate RNA from the
Erickson et al. Page 3
Nat Protoc. Author manuscript; available in PMC 2010 January 1.
NIH
-PA Author Manuscript
NIH
-PA Author Manuscript
NIH
-PA Author Manuscript

microdissected sample prior to qRT-PCR analysis. Many methods for RNA extraction andisolation are available on the market. Choice of the appropriate method depends on the typeof starting tissue sample, whether it is derived from cells in culture, bulk tissue, tissue scrapes,or small cell quantities (e.g. microdissection). In addition, it is recommended that an RNA onlyworkspace is available for RNA extraction.
RNA purification methods for downstream qRT-PCR analysis have been discussed in detailpreviously47. For a microdissection-based approach, samples are placed in lysis buffer andstored at −80°C. To be rigorous in ensuring the total RNA isolated is free of large DNAfragments, the sample is subjected to DNase during the extraction process because DNA isoften a contaminant when using glass filter RNA extraction methods2;16. To reduce bias, totalRNA from all microdissected samples in a given study should be extracted using the exactsame method and aliquotted prior to analysis and storage at −80°C.
RNA quantitation methods are numerous and each technique has its own strengths andweaknesses47;48. However, it is imperative that the quantitation method chosen is appropriatefor the range of RNA obtained during dissection which is generally on the order of 5–20 pgper cell. Since microdissection yields low quantities of RNA (Table 1), NanoDrop total RNAquantitation technique (NanoDrop Technologies, Wilmington, DE, USA) is an excellent choicedue to the small quantity of sample that is required for the assay.
The RNA quality in frozen tissue samples can vary due to the upstream effects of tissuehandling, but are generally higher than EFPE and FFPE processed specimens. There are severalschools of thought regarding RNA quality related to qRT-PCR that are reviewedelsewhere48. For assessing total RNA from frozen microdissected tissues, the Bioanalyzersystem (Agilent Technologies, Inc., Santa Clara, CA, USA) and RNA integrity number (RIN)provides an adequate assessment of total RNA quality (Table 1). This is best utilized in concertwith NanoDrop quantitation to select the appropriate Bioanalyzer kit (either Pico- or Nano-Chip) since the recovered total RNA quantity varies per microdissection (see Box 5).
qRT-PCR ASSAYSince limited quantities of total RNA from clinical or animal model tissue samples are typicallyused as the starting template, it is recommended to perform two-step qRT-PCR, with one RTtube per sample producing enough cDNA to perform 12 qPCR reactions, allowing for triplicateanalysis of three genes of interest and one endogenous control reference gene. The presentprotocol is optimized for bias reduction; therefore, RNA pre-amplification is not used.However, if an investigator chooses to use an RNA pre-amplification step (see below), theprotocol should be adjusted accordingly.
qPCR assays use one of two fluorescent detection chemistries. The first, SybrGreen, employsone pair of specific primers and the fluorescent dye incorporates into the DNA duringamplification49. The second utilizes one pair of specific primers and a gene specific fluorescentprobe that increases the specificity of the assay. The most common probe detection chemistryis TaqMan (Applied Biosystems, Foster City, CA, USA) in which the signal is generated bycleavage of the fluorescent quencher during the reaction cycle. This is the detection chemistrydescribed in the protocol below; however, fluorescent probe expense may be an issue for someusers.
For downstream qRT-PCR application, RNA quality of RIN >5 is considered good and RIN>8 is considered excellent50. In general, highly fragmented RNA from FFPE samples is notoptimal for qRT-PCR amplification; however, informative qRT-PCR results can be obtainedfrom frozen samples that demonstrate some RNA degradation (RIN 2<x<5). The use of randomhexamers as primers for RT diminishes the effects of degradation by generating more complete
Erickson et al. Page 4
Nat Protoc. Author manuscript; available in PMC 2010 January 1.
NIH
-PA Author Manuscript
NIH
-PA Author Manuscript
NIH
-PA Author Manuscript

cDNA coverage of genes than with oligo dT priming. A more complete review of issues relatedto RT and qPCR has been discussed elsewhere47;48;51–58. In addition, our experience suggeststhat single-plexing of the qPCR reaction (i.e. separate reactions from the same cDNA samplefor the gene(s) of interest and the endogenous control reference gene) reduces the potential forcompetitive inhibition by the two primer and probe sets and subsequently improves detectioncapabilities by 2–3 CT values, which is important when analyzing transcripts that may beexpressed at a lower level. Spiking the master mix with additional Taq polymerase (1 μl/qPCRreaction) increases the detection capabilities by another 2–3 CT values. In addition, we havefound that by using larger qPCR reaction volumes (50μl) CT values were further improved.Smaller reaction volumes (e.g. 20 μl) without additional Taq polymerase spiking may be usedsuccessfully to obtain quantitative gene expression measurements; however, investigators mustweigh the cost of larger reaction volumes and additional Taq polymerase to the potentialdecrease in detection capabilities for the specific experiment and transcripts to be detected.
The number of gene transcripts that can be analyzed from a typical microdissection from frozentissue samples using qRT-PCR is limited. Moreover, the ability to analyze qPCR efficiencyand standard curves is not possible due to the small sample quantity generated bymicrodissected tissues48. Therefore, the use of a comparable positive control total RNA sample(i.e. if using microdissected frozen human esophageal tissue the positive control would bepurchased total human esophagus RNA) in the qRT-PCR is necessary.
As an example, a typical prostate epithelium microdissection of 3000 laser shots (~10,000cells), allows for the procurement of ±160 ng of total RNA, which is enough to analyze thetranscripts of nine genes of interest and one endogenous control reference gene. For prostatestroma, microdissection of 3000 laser shots typically yields ±24 ng total RNA, which is onlyenough template to analyze one gene of interest and one endogenous control reference gene.To procure ~10,000 cells from stroma the microdissection laser shots are generally increasedfour times, depending on the cellular density.
NORMALIZATION STRATEGYA normalization control is critical when attempting to quantitatively compare gene expressionlevels between two biologic samples (e.g. diseased cells versus normal cells). Housekeepinggenes such as ACTB and GAPDH have historically been used for normalization because theywere presumed to be stably expressed in all cell types. In addition, cell analyte content (i.e.amounts of RNA, DNA, or protein), numbers of cells, and averages of multiple genes fromexpression arrays are sometimes used as normalization approaches. The majority of the qRT-PCR studies in the literature use a common set of housekeeping genes as endogenous controlsfor normalization. These mRNAs are generally effective, but their expression levels have beenshown to vary among different cell types, samples, and environments59–70. Therefore,universally stable endogenous control genes have not been found71. For example, ACTB hasconsistently stable levels of gene expression in cultured prostate cancer DU-145 and PC-3 cells67. But our experience and the experience of others72 have demonstrated that the same invitro expression levels are not always observed in ex vivo tissue samples. Therefore, ahousekeeping gene such as ACTB may not be the most stable endogenous control gene for usein qRT-PCR studies using tissue samples. In addition to issues related to tissue type, diseasestates (e.g. cancer or other proliferative processes) and procurement methods may introducevariability in housekeeping gene expression60;73–77. Therefore, for each tissue type andexperimental system a reliable and accurate normalization strategy must be determined andvalidated.
To address this in prostate, our group analyzed three gene expression normalization strategies(LCM cell count; total RNA measurement; and endogenous housekeeping genes) using
Erickson et al. Page 5
Nat Protoc. Author manuscript; available in PMC 2010 January 1.
NIH
-PA Author Manuscript
NIH
-PA Author Manuscript
NIH
-PA Author Manuscript

microdissected frozen samples16. Briefly, the data demonstrated that microdissection cellcounting was not a reliable normalization method. Within replicate dissections, a sizeablevariation of up to 1.84 CT values was seen which could induce a bias of up to 3.6 fold betweensamples. Since gene expression changes of approximately three to four fold (1.5 – 2 CT values)are regarded as potentially biologically important78, the use of microdissected cell count is notrecommended as a normalization strategy.
The second normalization method analyzed was the use of total RNA quantity as an internalcontrol for qRT-PCR from microdissected tissues. Total RNA was recovered and quantifiedby the NanoDrop method from microdissected cells from triplicate serial sections. The datademonstrated that RNA quantitation alone produces a large variance which prohibits using thisapproach for normalization.
Even though the data showed that neither microdissection cell count nor total RNAmeasurement are precise enough to serve as a normalization strategy for microdissected tissue,they are practical first and second steps in calibrating ‘ballpark’ RNA input levels that cansuccessfully be examined by qRT-PCR.
The third normalization method analyzed was the use of endogenous housekeeping genes asan internal reference control for qRT-PCR from microdissected tissues. Endogenoushousekeeping genes were found to offer an excellent representation of the cellulartranscriptome and the use of only one or two housekeeping genes (i.e. PGK1 or 18s and HPRTfor paired samples) was precise enough to serve as an internal reference control for quantitativegene expression analysis. The need to normalize with only one or two housekeeping genes isimportant, since limited amounts of RNA are typically procured from microdissected tissuesamples.
Several methods for relative quantitation exist, including the most commonly used 2−ΔΔCT
method79;80. This approach is recommended for dissected cells as it allows for the maximalnumber of genes that can be analyzed from one sample. Assuming comparable amplificationefficiencies between the gene(s) of interest and the calibrator, this method eliminates the needfor generating standard curves since the gene of interest data is normalized to the calibrator(endogenous housekeeping reference control gene)81.
EXPERIMENTAL DESIGNGeneral considerations
Before beginning the protocol, the following general guidelines should be considered: 1) Usea clean dead air hood that is dedicated for setting up RT and PCR reactions in preparing allqRT-PCR reactions to avoid contamination. All pipettes, pipette tips, tubes, pens, min-centrifuge, and vortex should be contained inside the hood. 2) Keep all reagents on ice. 3)Protect all TaqMan probes and master mixes from light (i.e. keep in dark). 4) Mix (vortex orswirl, depending) and spin down all source vials prior to opening. 5) Always run a no templatecontrol (NTC), a no RT, and a positive control ((+) C) for each RT and primer/probe set forqPCR. 6) In loading reaction tubes, load in this order: 1) NTC; 2) no RT; 3) unknowns; and 4)(+) C. This will minimize the potential for contamination carryover. 7) Aliquot source vials tominimize freeze-thaw cycles. 8) To prevent pipetting errors, prepare master mixes of reagentswherever possible to minimize the number of pipette steps made. 9) Use powder-free glovesto prevent optical reader interference. 10) Use a common positive control commercial totalRNA for all qRT-PCR reactions for the same tissue type. This will allow a common referencefrom plate to plate, allowing data to be analyzed across batches.
Erickson et al. Page 6
Nat Protoc. Author manuscript; available in PMC 2010 January 1.
NIH
-PA Author Manuscript
NIH
-PA Author Manuscript
NIH
-PA Author Manuscript
TissuesTo obtain total RNA from microdissected tissues, the following considerations must be takeninto account: 1) Sample has been snap-frozen properly prior to storage. 2) Tissue block ismaintained at optimal temperature during sectioning. 3) Cryostat and all sectioning and stainingconsumables are free of contaminating tissues. 4) Once the tissue section is cut from the block,mount the section on an uncharged glass slide at room temperature. An uncharged slide willallow the tissue to more easily be procured/lifted off the glass slide during the microdissectionprocess. The glass slide with the tissue section on it should then be placed immediately on dryice. Do not let the tissue section defrost. 5) Prior to choosing the tissue block for use in thestudy, do a scrape of the tissue section and do RNA extraction and isolation followed byquantitation and qualitation analysis to assess RNA integrity. 6) Frozen tissue sections shouldnot be stored for more than 2 weeks prior to use. 7) Once the tissue section is out of the freezer,no more than 30 min should elapse before putting the microdissected tissue into lysis buffer.
RNA Isolation and MeasurementRNase-free techniques need to be followed stringently to prevent experiment failure due tocontamination. This can be accomplished by: (1) wearing powder-free disposable gloves, (2)avoiding touching RNase contaminated surfaces, (3) changing gloves often, (4) cleaning benchtops and hood surfaces with an RNase decontaminant solution prior to use, (5) using a dedicatedRNA bench and equipment, and (6) using reagents and consumables that are free ofcontaminants (e.g. RNases, other RNA or DNA, PCR products, thawed tissue fragments, orchemical contaminants).
Extract and isolate RNA using a total RNA extraction kit that is appropriate for the amount ofmicrodissected tissue procured. In our experience the PicoPure RNA extraction kit (ArcturusEngineering, Inc.), a glass filter-based method, provides the largest and most reproducible totalRNA yields from microdissected tissue samples.
After RNA purification, DNase treatment for 15 min is recommended2;16. For most genes aDNase step is not necessary. It is best to design and use cDNA-specific primers and probes toreduce the need for a DNase treatment. But for some pseudogenes a DNase step is necessary.Therefore, it is generally recommended to add a DNase treatment to the RNA extraction if thekit chosen does not include one. In this protocol, DNase treatment is recommended to preventinterference by the PicoPure RNA Isolation Kit (Agilent, Inc.) components that may causeartifacts during downstream Agilent 2100 Bioanalyzer assessment of quality and gDNAcontamination. However, if investigators choose not to use a DNase step, downstream qualityassessment using the Agilent 2100 Bioanalyzer may be confounded.
Immediately after total RNA extraction and before storage at −80°C, be sure to aliquot samplesinto volumes appropriate for quantitation (1 μl), qualitation (2 μl), and multiple RT reactions(4 μl each). It is recommended to use an elution buffer volume of 20 μl to recover enough totalRNA to make the previous aliquots. Keep total RNA aliquots frozen at −80°C until ready foruse in RT reaction.
This RNA extraction and isolation protocol eliminates the presence of qRT-PCR inhibitors inthe total RNA sample; however, qRT-PCR inhibition due to template overload is still possible.
Following total RNA purification, quality and quantity measurement is recommended16.Because of the very small total RNA quantities obtained from microdissected tissues (Table1), it is difficult to impossible to adjust or equalize total RNA quantities across samples priorto qRT-PCR. However, it is important to know the starting quantities and qualities of totalRNA in order to “ballpark” starting template input16 and it is recommended to quantify totalRNA using the NanoDrop ND-1000 spectrophotometer (260/280 nm; NanoDrop
Erickson et al. Page 7
Nat Protoc. Author manuscript; available in PMC 2010 January 1.
NIH
-PA Author Manuscript
NIH
-PA Author Manuscript
NIH
-PA Author Manuscript

Technologies, Inc.). This method only requires 1 μl of sample and can be used withconcentrations as low as 2 ng/μl. Since total RNA concentrations per μl from microdissectedtissue samples (Table 1) generally fall below the quantity detection limits of the Bioanalyzer(>25 ng/μl; Agilent Technologies, Inc.), this method of total RNA quantitation is not sensitiveenough for routine use. RNA qualitation of total RNA from microdissected tissue samplesyields quantities too small to routinely use conventional gel electrophoresis to determine RNAintegrity. Therefore, it is recommended to use the Agilent 2100 Bioanalyzer (AgilentTechnologies, Inc.) because it only requires 1 μl of sample for analysis of 18S and 28S rRNAand provides an RNA integrity number (RIN).
ControlsAn LCM negative control is prepared for each tissue section by making 3000 laser shots in atissue free portion of the tissue section. This sample is processed throughout the entireexperiment in parallel with microdissected tissue samples to control for contaminating RNA.
The choice of positive control total RNA origin (i.e. organism, organ, and tissue type) isdependent on the tissue samples being analyzed, but is typically from the same organism andtissue type, e.g. positive control of total human prostate RNA for experimental microdissectedfrozen human prostate tumor and normal tissue samples. However, if the desired tissue type isnot commercially available, a good alternative is to use organism specific universal RNA.
Once initial positive control concentrations are determined, the investigator should choose thethree positive controls that are closest in concentration to the total RNA amount from themicrodissected sample.
An endogenous control reference gene(s) that shows stable expression in the samples beinganalyzed is used in the third step of the normalization strategy16. It is recommended that if asingle endogenous control reference gene can be used for the study, that just one is used, seeErickson et al for a discussion of this topic. Primer and probe design has been discussedextensively in a previous issue of Nature Protocols48. TaqMan® chemistry based primer/probesets (e.g. AB Assays-on-demand, AB Assays-by-Design, or other TaqMan chemistry primer/probe sets) are recommended for use with RNA from microdissected samples because ofimproved specificity over primer only based detection chemistries (e.g. SYBR). For microarraygene expression profile validation, it is recommended to design all primer/probe sets to amplifythe same region of the cDNA sequence as the gene specific microarray probe set used to derivethe data.
Using a single endogenous control housekeeping gene, it is possible to analyze up to 9 genesof interest from a single microdissection (Fig. 4). For both the genes of interest and theendogenous control reference gene(s), non-primer-limited primer/probe sets can be used insingle-plex reactions. If performing multi-plex reactions, it is recommended to use primer-limited primer/probe sets for amplification of the endogenous control gene, as this limitsamplification of the gene once the signal threshold is reached. In multi-plex reactions, choosedifferent reporter dyes for the genes of interest (e.g. FAM) and the endogenous controlreference gene (e.g. VIC/HEX). For single-plex reactions, it is not necessary to choose differentreporter dyes or use primer-limited primer/probe sets. However, if using the endogenouscontrol reference gene(s) for other types qRT-PCR experiments, it may be more cost effectiveto use VIC labeled primer-limited primer/probe sets.
qRT-PCRTotal RNA yield from microdissected tissue determines the number of genes of that can beanalyzed by qRT-PCR. Each qPCR reaction requires 4 ng of total RNA starting template that
Erickson et al. Page 8
Nat Protoc. Author manuscript; available in PMC 2010 January 1.
NIH
-PA Author Manuscript
NIH
-PA Author Manuscript
NIH
-PA Author Manuscript

was used for RT. For example, if the microdissection of epithelium yielded ~160 ng of totalRNA, this would allow for the analysis of 9 genes of interest and one endogenous controlhousekeeping gene. However, if the microdissection of stroma yielded ~24 ng of total RNA,only one gene of interest and one housekeeping gene can be analyzed. Stroma should beanalyzed for cellular density and the number of laser shots adjusted to increase the total RNAyield.
Total RNA samples from microdissected tissues are limited and precious. Therefore, it isimperative that primers and probe sets are validated to ensure that they specifically amplifytheir intended target sequence linearly and reproducibly prior to using the microdissected RNAsamples. This can be accomplished by using a commercially available tissue specific total RNAto perform serial dilutions. The serially diluted RNA is then applied to the qRT-PCR protocolusing the specific primers and probe sets. The CT values, PCR efficiencies, and standard curvesare evaluated. Following primer and probe set specificity and sensitivity, cDNA generatedfrom the RT portion of the protocol can be used for qPCR assay. qPCR assays should beperformed in triplicate as technical replicates to assess precision of assay.
qRT-PCR of microdissected tissues is done in two steps (RT and qPCR) to maximize thenumber of genes that can be analyzed from one sample (Fig. 4). During RT, random hexamersshould be used as reverse primers to counter the effects of degradation of mRNA. Perform RTand qPCR of matched disease and normal tissue sample total RNA at the same time. Threetechnical replicates of qPCR are used to assess precision of the assay, and endogenous controlgene primer/probe sets are analyzed for each sample and control. This qPCR protocol describedhere employs 50 PCR cycles instead of the usual 40, although with microdissected sampleswe find that more than 90% of genes do not have CT values > 40. 50 cycles are used for qPCRto ensure that the NTCs for a gene of interest have 10 CT values later than the sample gene ofinterest expression in cases where low level of gene expression (e.g. 37 CT values) areencountered. This ensures that if the NTCs demonstrate ‘no CT’ at 50 cycles, the qPCR reagentsare free of contamination. In addition, the observation of 10 CT difference comparing no-RTwith RT-positive samples means there is negligible contamination (0.1%) of genomicDNA92;93. However, because PCR efficiency changes with the length of the experiment, it isrecommended to test the in-run PCR efficiency of gene specific primer/probe sets at the Ctrange of the gene of interest using a standard cDNA dilution series. In our experience addingadditional Taq polymerase is valuable in lowering CT values and improving technical replicatestandard deviations16. However, investigators should be aware that changes such as Taqconcentrations can change PCR efficiencies.
AnalysisTo ensure standardization of analysis techniques, one qPCR method and software analysismethod should be used throughout an entire study. Although beyond the scope of this protocol,a detailed review of qRT-PCR data analysis for amplification plots, primer/probe efficiencies,standard curve generation, and general qRT-PCR analysis has been described in a previousissue of Nature Protocols48.
The normalization strategy dictates the analysis method that can be used. Based upon theoptimal normalization strategy for qRT-PCR from microdissected tissues16 when comparingdiseased and normal tissues, data is analyzed via relative quantitation analysis using the2−ΔDelta;CT method 94. This is not the only analysis method; however, investigators shouldassess if their study requires absolute quantitation using a standard curve. It is alwaysrecommended to assay the PCR efficiencies of each gene primer/probe set to be used in relativeor absolute quantitation studies. In summary, all samples are analyzed relative to anendogenous control housekeeping gene from the same sample total RNA to generate the
Erickson et al. Page 9
Nat Protoc. Author manuscript; available in PMC 2010 January 1.
NIH
-PA Author Manuscript
NIH
-PA Author Manuscript
NIH
-PA Author Manuscript

normalized ΔCT value. And subsequently, normalized disease tissue qPCR data is analyzedrelative to normalized matched normal tissue qPCR data to generate the Δ ΔCT value.
CONCLUSIONThe protocol described in this report allows for quantitative analysis of mRNA dissected fromanimal model tissues or clinical specimens. However, it is important that investigators factortissue-related variables, especially from clinical samples, into their experimental design anddata analysis. Precise expression measurements from phenotypicaly- or molecularly-definedcell populations in tissue samples likely will have significant value for both laboratoryresearchers and clinical investigators.
MATERIALSREAGENTS
• Dry ice. ! CAUTION Dry ice can burn skin on contact and vapors can causeasphyxiation. Take appropriate precautions when using dry ice.
• Optimal Cutting Temperature (OCT) compound (Sakura Finetek Corp., Tissue-Tek,cat. no. 4583) for cryo-preservation.
• Frozen tissue specimens sectioned at 8 μm. ▲CRITICAL Do not store tissue sectionsfor more than one month (≤ two weeks is preferred) prior to microdissection. !CAUTION Follow established protocols for safely working with bloodbornepathogens for all human and animal biologic samples. For animal samples, follow allInstitutional Animal Care and Use Committee protocol regulations. For humansamples, follow all established Institutional Review Board clinical protocolregulations, including patient consent and sample anonymization.
• Mayer’s Hematoxylin solution (Sigma, cat. no. MHS128). ! CAUTION Contacthazard.
• Scott’s Blueing Solution (Fisher, cat. no. CS410-4D) or alkaline water.▲CRITICAL The reddish color of Mayer’s Hematoxylin will turn blue with mildalkaline treatment, such as that of Scott’s Blueing Solution. Omitting the alkalinetreatment step will make histopathological analysis of tissue and cell morphologydifficult.
• Eosin Y solution (Sigma, cat. no. HT110116). ! CAUTION Contact hazard.Flammable.
• Absolute (100%) ethanol (molecular grade, Sigma, cat. no. E7023). ! CAUTIONContact hazard. Flammable. ▲CRITICAL In humid climates (> 40%), monitor thewater content of the ethanol, and change the solution as often as necessary. It isgenerally recommended to change all solutions in staining process every week ormore frequently if staining > 20 slides.
• 95% and 70% ethanol. Prepare with Milli-Q-filtered water (Millipore).▲CRITICAL If making solutions in batches do not store for more than one week at4 °C.
• Xylene (Sigma Aldrich, cat. no. 247642) ! CAUTION Vapor and contact hazard.Vapor is harmful or fatal. Use appropriate safety measures for working with anddisposing of hazardous materials. ▲CRITICAL Xylene substitutes (e.g. Citra-Solv)may diminish microdissection efficiency of some tissue types.
Erickson et al. Page 10
Nat Protoc. Author manuscript; available in PMC 2010 January 1.
NIH
-PA Author Manuscript
NIH
-PA Author Manuscript
NIH
-PA Author Manuscript

• RNA extraction buffers (PicoPure RNA extraction kit, Arcturus Molecular Devices,cat. no. KIT0204).
• RNase-free DNase Set (50) (Qiagen, cat. no. 79254).
• RNA qualitation (see Reagent Setup): RNA 6000 Pico Series II Assay (AgilentTechnologies, 5067-1513) and/or RNA 6000 Nano Series II Assay (AgilentTechnologies, 5067-1511).
• RNase/DNase-free water (e.g. Ambion Applied Biosystems, cat. no. AM9937).
• Tissue specific total RNA (e.g. Ambion Applied Biosystems, cat. nos. vary dependingon the species and organ) to use as positive control template.
• RT-PCR grade water (e.g. Ambion Applied Biosystems, cat. no. AM9935).
• RT assay: Reverse transcription reagents (e.g. Applied Biosystems, High CapacitycDNA Reverse Transcription Kit, cat. no. 4368813, TaqMan® Reverse TranscriptionReagents, cat. no. N8080234), Random hexamers (e.g. Applied Biosystems, cat. no.N8080127). Additional information for other reverse transcription reagents has beencovered in a previous issue of Nature Protocols48.
• Primer/probe sets for genes of interest and endogenous controls: Assays-on-DemandTaqMan® MGB Probe (Applied Biosystems, Inventoried or Made to order, cat. no.4331182 or 4351372), Assays-by-Design: Primers (Applied Biosystems, cat. no.4304970) and TaqMan® MGB Probe (Applied Biosystems, cat. no. 4316034). Primerand probe design considerations have been covered in a previous issue of NatureProtocols48.
• TE Buffer pH 7.0–8.0 (e.g. 1x TE Buffer pH 8.0, Quality Biological, Inc. cat. no.351-011-131).
• qPCR assay: 2x TaqMan Universal Master Mix (Applied Biosystems, cat. no.4304437), AmpliTaq Gold® DNA Polymerase, LD (Applied Biosystems, cat. no.4338857). Other companies such as Stratagene offer qPCR reagents. Additionalinformation for non-TaqMan chemistry based qPCR assay reagents has been coveredin a previous issue of Nature Protocols48.
EQUIPMENT• Protective personal wear, including lab coats, powder free latex and/or nitrile gloves,
and safety glasses.
• Biohazard or medical pathological waste container.
• −80 °C freezer.
• −20 °C freezer.
• 4 °C refrigerator.
• Cryomolds (Sakura Finetek Corp., Tissue-Tek, cat. no. 4557).
• Cryostat (e.g. Leica CM 1900 UV, Leica Microsystems).
• Uncharged slides and coverslips of the size appropriate for the tissue specimen to besectioned. There are many distributors for these consumables (e.g. Fisher Scientific,cat. no. NC9744786, cat. no. 22-037-169).
• LCM system (e.g. PixCell II, Arcturus Molecular Devices). Considerations for thechoice of LCM systems have been discussed in a previous issue of NatureProtocols36.
Erickson et al. Page 11
Nat Protoc. Author manuscript; available in PMC 2010 January 1.
NIH
-PA Author Manuscript
NIH
-PA Author Manuscript
NIH
-PA Author Manuscript
• Adhesive pads (e.g. Post-it Note®, 3M)
• CapSure Macro LCM Caps (Arcturus Molecular Devices, cat. no. LCM0211).
▲CRITICAL Because tissue is in direct contact with the cap, it is important to usethe adhesive pad to remove any tissue debris. If extraneous tissue is not carefullyremoved, it will be available for RNA extraction and may contaminate the sample.
• Microcentrifuge tubes: MicroAmp 500 μl Thin-walled PCR Reaction Tubes (AppliedBiosystems, cat. no. 9N801-0611) or Safe-Lock 500 μl Eppendorf Tubes (BrinkmannInstruments, cat. no. 2236361-1). ▲CRITICAL To prevent lysis buffer leakageduring pre-extraction heat incubation, the use of either of these tubes arerecommended.
• Oven (e.g. Hybaid Mini MK-II hybridization oven, Hybaid, cat. no. Mini Oven MKII)
• Agilent 2100 Bioanalyzer (Agilent Technologies, Inc., cat. no. G2940CA).
• NanoDrop® ND-1000 UV-Vis Spectrophotometer (NanoDrop Technologies,Wilmington, DE, USA).
• Dedicated PCR Hood (e.g. AirClean 600 PCR Workstation, AirClean Systems, cat.no. AC632DB Dead Air Box).
• Microfuge tubes: 1.7 ml DNase/RNase free microfuge tubes (Costar, cat. no. 3560),0.65 ml DNase/RNase free microfuge tubes (Costar, cat. no. 32090, 0.65 ml DNase/RNase free PCR thin-walled tubes (e.g. .PGC, cat. no. 502-075). Considerations forthe choice of plastic ware have been discussed in a previous issue of NatureProtocols48.
• Barrier filter pipette tips (e.g. CLP Direct Barrier Tips cat. nos. BT10XL, BT20,BT100, BT200, BT1000).
• PCR thermocycler (e.g. MJ Research PTC-200 thermocylcer, MJ Research).
• qPCR thermocycler: (e.g. Stratagene Mx3000P™ Real-Time PCR machine,Stratagene, Inc.; Applied Biosystems 7500 Real-Time PCR System, AppliedBiosystems). Considerations for the choice of qPCR thermocycler have beendiscussed in a previous issue of Nature Protocols48.
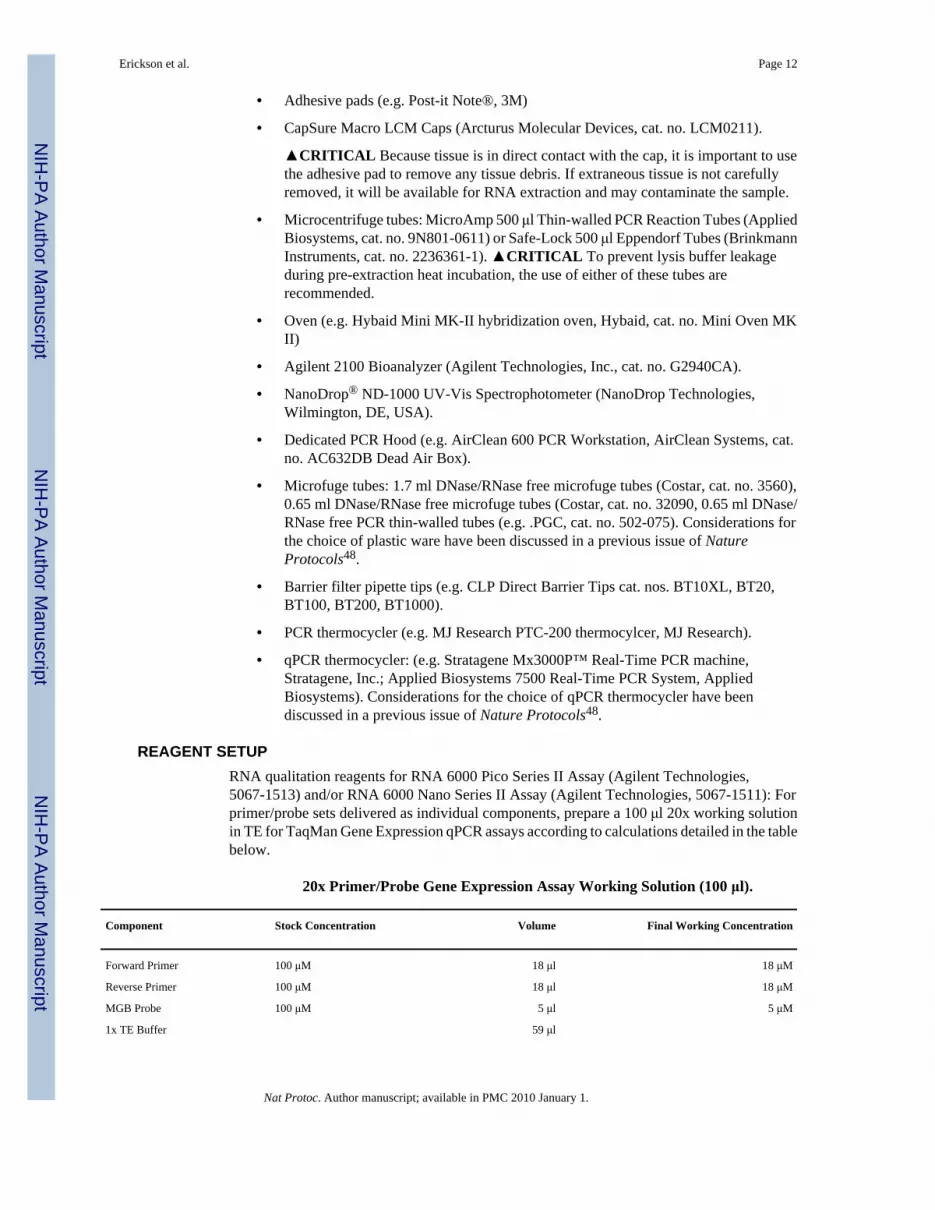
REAGENT SETUPRNA qualitation reagents for RNA 6000 Pico Series II Assay (Agilent Technologies,5067-1513) and/or RNA 6000 Nano Series II Assay (Agilent Technologies, 5067-1511): Forprimer/probe sets delivered as individual components, prepare a 100 μl 20x working solutionin TE for TaqMan Gene Expression qPCR assays according to calculations detailed in the tablebelow.
20x Primer/Probe Gene Expression Assay Working Solution (100 μl).
Component Stock Concentration Volume Final Working Concentration
Forward Primer 100 μM 18 μl 18 μM
Reverse Primer 100 μM 18 μl 18 μM
MGB Probe 100 μM 5 μl 5 μM
1x TE Buffer 59 μl
Erickson et al. Page 12
Nat Protoc. Author manuscript; available in PMC 2010 January 1.
NIH
-PA Author Manuscript
NIH
-PA Author Manuscript
NIH
-PA Author Manuscript
Component Stock Concentration Volume Final Working Concentration
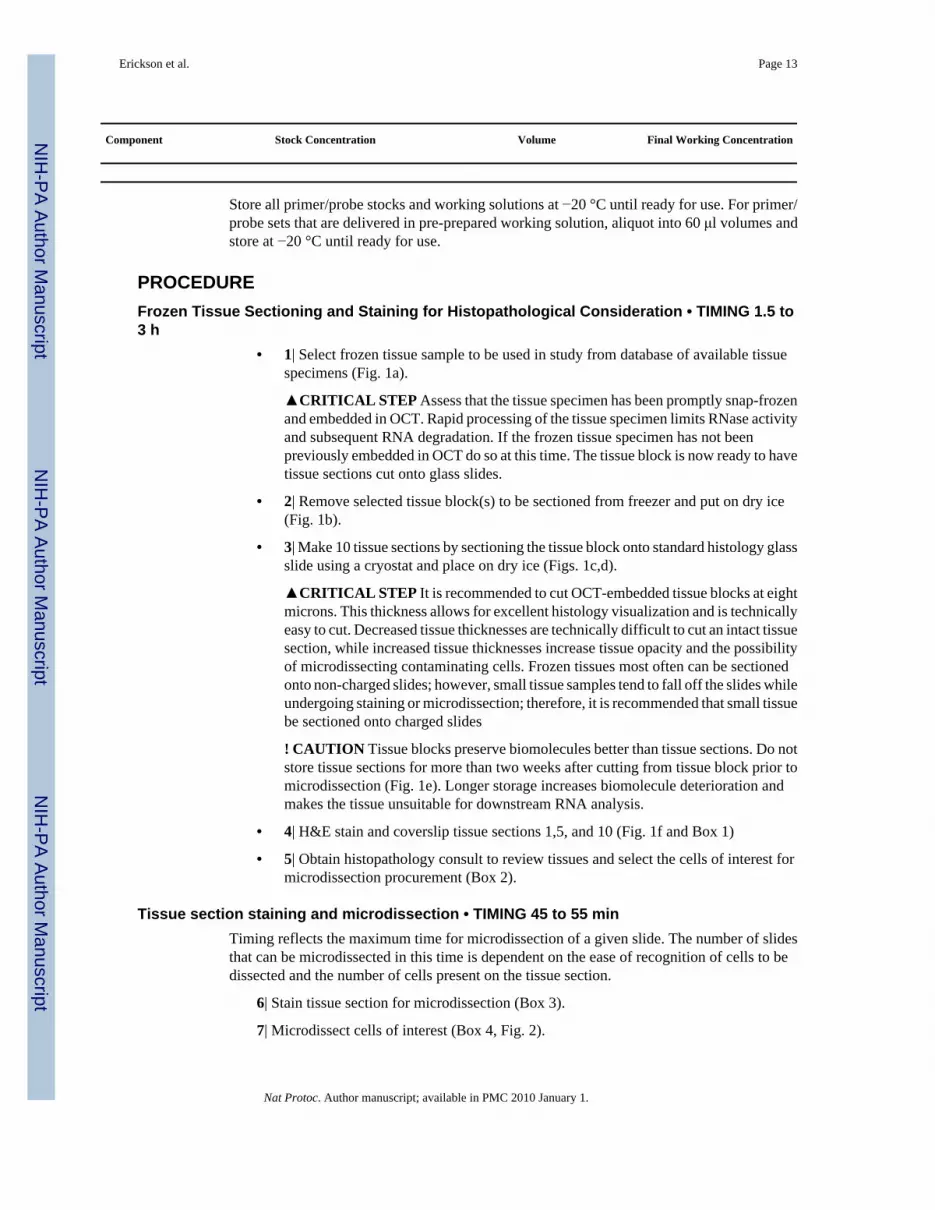
Store all primer/probe stocks and working solutions at −20 °C until ready for use. For primer/probe sets that are delivered in pre-prepared working solution, aliquot into 60 μl volumes andstore at −20 °C until ready for use.
PROCEDUREFrozen Tissue Sectioning and Staining for Histopathological Consideration • TIMING 1.5 to3 h
• 1| Select frozen tissue sample to be used in study from database of available tissuespecimens (Fig. 1a).
▲CRITICAL STEP Assess that the tissue specimen has been promptly snap-frozenand embedded in OCT. Rapid processing of the tissue specimen limits RNase activityand subsequent RNA degradation. If the frozen tissue specimen has not beenpreviously embedded in OCT do so at this time. The tissue block is now ready to havetissue sections cut onto glass slides.
• 2| Remove selected tissue block(s) to be sectioned from freezer and put on dry ice(Fig. 1b).
• 3| Make 10 tissue sections by sectioning the tissue block onto standard histology glassslide using a cryostat and place on dry ice (Figs. 1c,d).
▲CRITICAL STEP It is recommended to cut OCT-embedded tissue blocks at eightmicrons. This thickness allows for excellent histology visualization and is technicallyeasy to cut. Decreased tissue thicknesses are technically difficult to cut an intact tissuesection, while increased tissue thicknesses increase tissue opacity and the possibilityof microdissecting contaminating cells. Frozen tissues most often can be sectionedonto non-charged slides; however, small tissue samples tend to fall off the slides whileundergoing staining or microdissection; therefore, it is recommended that small tissuebe sectioned onto charged slides
! CAUTION Tissue blocks preserve biomolecules better than tissue sections. Do notstore tissue sections for more than two weeks after cutting from tissue block prior tomicrodissection (Fig. 1e). Longer storage increases biomolecule deterioration andmakes the tissue unsuitable for downstream RNA analysis.
• 4| H&E stain and coverslip tissue sections 1,5, and 10 (Fig. 1f and Box 1)
• 5| Obtain histopathology consult to review tissues and select the cells of interest formicrodissection procurement (Box 2).
Tissue section staining and microdissection • TIMING 45 to 55 minTiming reflects the maximum time for microdissection of a given slide. The number of slidesthat can be microdissected in this time is dependent on the ease of recognition of cells to bedissected and the number of cells present on the tissue section.
6| Stain tissue section for microdissection (Box 3).
7| Microdissect cells of interest (Box 4, Fig. 2).
Erickson et al. Page 13
Nat Protoc. Author manuscript; available in PMC 2010 January 1.
NIH
-PA Author Manuscript
NIH
-PA Author Manuscript
NIH
-PA Author Manuscript

▲CRITICAL STEP The first step in normalization is to ensure the same number of shots(assuming similar cellular density) are microdissected for both the cells of interest (e.g.diseased epithelium) and the calibrator cells (e.g. normal epithelium)16. It is recommendedto aim for about 10,000 cells / 3,000 shots for each of the tissue samples to be procuredby microdissection if there is no previous experience with RNA quantity and quality ofthis particular tissue type / cell type to be microdissected. If there is no previous experience,perform a test microdissection followed by RNA quantity and quality assessment todetermine the number of cells / number of laser shots that will be required for the studytissues.
? TROUBLESHOOTING8| Place LCM cap on dry ice and proceed directly to pre-RNA extraction, prepare LCMnegative control, or dissection of another area of the tissue with another cap.
▲CRITICAL STEP If more than one cap needs to be used to procure the necessarynumber of cells for a single cell type sample (e.g. 20,000 shots for prostate stroma), pre-RNA extraction should begin for the first cap (cap A) before moving to microdissectionwith the second cap (cap B). Begin microdissection using cap B while cap A is undergoingheat incubation (see step 12.). An LCM negative control is prepared for each tissue sectionby making 3000 laser shots in a tissue free portion of the tissue section. This sample isprocessed throughout the rest of the Protocol in parallel with microdissected tissue samplesto control for contaminating RNA.
! CAUTION If time is running out (i.e. time elapsed from beginning of staining to end ofmicrodissection for a single slide is quickly approaching the 30 min time limit), it is bestto put cap A on dry ice while proceeding to microdissection with cap B. In this instance,pre-RNA extraction batch processing can be done once all caps containing microdissectedcells for a single tissue section have been collected.
Pre-RNA extraction • TIMING 1 hr 40 min9| Add 50 μl extraction buffer into labeled microfuge tube.
10| Place cap containing microdissected cells onto microcentrifuge tube containing lysisbuffer.
▲CRITICAL STEP If multiple caps (e.g. cap A, cap B, cap C, etc.) containingmicrodissected cells were generated for one tissue cell type sample, the caps can beprocessed sequentially in the single volume of extraction buffer36. For cap A, follow steps10 through 14. Discard cap A and transfer the lysate to a clean labeled microfuge tube.Repeat steps 10 through 15 for additional caps.
11| Invert tube and flick it to cause the buffer to cover the cap.
12| Heat at 42 oC for 30 min.
13| Mix by pulse vortex.
14| Centrifuge for 2 min at 800 x g in room temperature.
15| Discard cap and close microfuge tube containing cell extract.
▲CRITICAL STEP If multiple pre-RNA extraction cell extracts for one tissue cell typesample were batch processed from multiple caps (e.g. cap A, cap B, cap C, etc.), insteadof sequential processing as described in step 10, pool all cell extracts into a clean labeledmicrofuge tube and record total volume of pooled cell extracts. This volume will be inmultiples of 50 μl depending on the number of single cap derived cell extracts that werepooled (e.g. 3 caps = 150 μl total cell extract volume).
Erickson et al. Page 14
Nat Protoc. Author manuscript; available in PMC 2010 January 1.
NIH
-PA Author Manuscript
NIH
-PA Author Manuscript
NIH
-PA Author Manuscript

16| Place in −80 oC freezer for 1 hr or until ready to extract RNA. It is recommended toincorporate this step for all microdissected tissue samples for RNA extraction andsubsequent transcript analysis. This ensures equal treatment of all tissue samples to beanalyzed and reduces bias that may be incorporated by not all microdissected tissues beingsubjected to −80 oC freezing.
■ PAUSE POINT Samples may be stored at −80 oC at this point until ready to extractRNA.
RNA Extraction • TIMING 45 min17| Remove microfuge tubes containing cell extract from pre-RNA extraction step fromthe −80oC freezer.
18| Place in wet ice to transfer to RNA clean bench for RNA extraction.
19| Pre-condition the RNA purification columns: add 250 μl of conditioning buffer to theRNA purification columns, incubate at room temperature for 5 min, then centrifuge thecolumns at 16,000 x g for 1 min at room temperature.
20| Add 50 μl of 70% ethanol to the microfuge tube containing the cell extract from Pre-RNA extraction. This results in a 1:1 ratio of 70% ethanol:cell extract.
▲CRITICAL STEP If multiple pre-RNA extraction cell extracts for one tissue cell typesample were batch processed from multiple caps (e.g. cap A, cap B, cap C, etc.), asdescribed in step 17, use the recorded pooled cell extract volume to determine the necessaryvolume of 70% ethanol (e.g. 150 μl pooled cell extract requires 150 μl 70% ethanol).
21| Add cell extract and ethanol mixture to the RNA purification columns.
▲CRITICAL STEP There is no limit to the amount of RNA the column can handle.However, the column can only handle 200 μl of ethanol:cell extract at one time. Therefore,for volumes > 200 μl, repeat step 21 and 22 using sequential aliquots of the ethanol:cellextract that are 200 μl until all ethanol:cell extract has been loaded to the column and spundown.
22| Centrifuge at 100 x g K for 2 min at room temperature. Flow-through collection tubeis large enough to collect all flow-through between steps 22 to 33 and steps 35 to 38.Therefore it is not necessary to discard flow-through between these steps. If processingan ethanol:cell extract volume > 200 μl, discard flow through after the final time repeatingstep 23.
23| Centrifuge at 16,000 x g for 30 s at room temperature.
24| Add 100 μl of wash buffer 1 (W1) to the columns.
25| Centrifuge at 8,000 x g for 1 min at room temperature.
26| Add 40 μl of DNAse solution (35 μl RDD buffer and 5 μl DNAse) to the columns.
27| Incubate at room temperature for 15 min.
28| Add 40 μl of W1 to the columns.
29| Centrifuge at 8,000 x g for 15 s at room temperature.
30| Add 100 μl wash buffer 2 (W2) to the columns.
31| Centrifuge at 8,000 x g for 1 min at room temperature..
32| Add another 100 μl of W2 to the columns.
33| Centrifuge at 16,000 x g for 2 min at room temperature.
Erickson et al. Page 15
Nat Protoc. Author manuscript; available in PMC 2010 January 1.
NIH
-PA Author Manuscript
NIH
-PA Author Manuscript
NIH
-PA Author Manuscript

34| Transfer each of the columns to a labeled microfuge tube.
35| Add 10 μl of elution buffer to the columns.
▲CRITICAL STEP To improve RNA elution, it is recommended to elute the RNA intwo 10 μl volumes instead of using one 20 μl volume. Depending upon experimentaltissues being used, an investigator may choose to elute in one 20 μl volume, and stillrecover adequate quantities of total RNA.
36| Centrifuge at 1,000 x g for 1 min at room temperature.
37| Centrifuge at 16,000 x g for 1 min at room temperature to elute the RNA.
38| Repeat steps 35 through 37.
39| Remove column from the labeled microfuge tube. The elution buffer containing thetotal RNA sample will be collected at the bottom of the microfuge tube.
40| Save column and flow through until after RNA quantitation analysis.
41| Aliquot each total RNA sample as follows for quantitation, qualitation, and qRT-PCRanalysis (Fig. 4). Pipette 3 μl of total RNA sample into a microfuge tube for quantitationand qualitation analysis. Aliquot the remaining total RNA into 4 μl volumes by pipettinginto labeled microfuge tubes for qRT-PCR analysis.
42| As total RNA samples are aliquoted, place on either dry or wet ice depending ondownstream analysis. If time permits, it is recommended to immediately proceed to RNAquantitation and qualitation at this point using the 3 μl aliquot intended for quantitationand qualitation analysis; therefore, put these samples on wet ice. If total RNA measurementcannot be conducted promptly, place samples on dry ice and move to −80 oC freezer untilready to use.
▲CRITICAL STEP Place total RNA aliquots intended for qRT-PCR analysis in−80 oC freezer for 1 hr or until ready to run qRT-PCR. It is recommended to incorporatethis step for all total RNA samples for qRT-PCR analysis. This ensures equal treatmentof all tissue samples to be analyzed and reduces bias that may be incorporated by notsubjecting all RNA samples to −80 oC freezing.
■ PAUSE POINT Samples may be stored at −80 oC at this point until ready for qRT-PCRanalysis.
Preparation of Positive Control Total RNA Dilutions • TIMING 20 minPrepare dilution series of commercially available total RNA sample covering the expectedranges of total RNA concentrations recovered from microdissected tissue samples, as follows.These will be used as positive controls throughout total RNA measurement, primer/probeamplification efficiency assay, and qRT-PCR analysis of samples from microdissected tissues.All dilutions, other than 1:1, are made in RNase/DNase free microcentrifuge tubes usingRNase/DNase free molecular grade water (H2O).
Dilution Total RNA concentration Recipe
1:1 1000.0 ng/μl 100 μl of 1000.0 ng/μl total RNA
1:5 200.0 ng/μl 20 μl of 1:1 in 80 μl of H2O
1:10 100.0 ng/μl 10 μl of 1:1 in 90 μl of H2O
1:20 50.0 ng/μl 5 μl of 1:1 in 95 μl of H2O
1:50 20.0 ng/μl 10 μl of 1:5 in 90 μl of H2O
Erickson et al. Page 16
Nat Protoc. Author manuscript; available in PMC 2010 January 1.
NIH
-PA Author Manuscript
NIH
-PA Author Manuscript
NIH
-PA Author Manuscript

Dilution Total RNA concentration Recipe
1:100 10.0 ng/μl 10 μl of 1:10 in 90 μl of H2O
1:200 5.0 ng/μl 10 μl of 1:20 in 90 μl of H2O
1:500 2.0 ng/μl 10 μl of 1:50 in 90 μl of H2O
43| Pulse vortex and pulse centrifuge all dilutions at room temperature and place on wetice.
44| Aliquot 3 μl of diluted samples to use as positive control total RNA measurement andplace on wet ice. As samples are aliquoted, place on either dry or wet ice depending ontime constraints. If time permits, it is recommended to immediately proceed to RNAquantitation and qualitation at this point using the 3 μl aliquots intended for quantitationand qualitation analysis; therefore, put these positive control dilution samples on wet ice.If total RNA measurement cannot be conducted promptly, place positive control dilutionsamples on dry ice and move to −80 oC freezer until ready to use.
45| Prepare 20 μl aliquots of diluted samples for future use in total RNA measurementsand qRT-PCR analysis. Place positive control dilution samples on dry ice and move to−80 oC freezer until ready to use.
■ PAUSE POINT Samples may be stored at −80 oC at this point until ready fordownstream analysis.
46| Aliquot 4 μl of commercially available RNase/DNase free molecular grade water touse as negative control and for blanking the system.
▲CRITICAL STEP Use water that does not have DEPC or any other chemicalcompound in it. The quantitation method is spectrophotometry based; therefore, anyadditional compound that may be in the water used as a blank or negative control willconfound the data and not give accurate representation of the total RNA concentrationfound within the sample aliquots.
Total RNA Quantitation Analysis • TIMING 2 min per sample47| Place 3 μl aliquots of all controls (see step 45) and total RNA samples frommicrodissected tissue samples (from step 42) on wet ice. Mix the controls and samples byvortexing and spin down by centrifugation. Place tubes back on wet ice.
48| Follow NanoDrop manufacturer’s protocol for RNA analysis.
▲CRITICAL STEP To prevent contamination carryover and ensure accurate dataanalysis, analyze samples and controls in the following order: (1) negative control water,(2) all experimental total RNA samples from microdissected tissues, (3) positive controlRNA samples, and (4) negative control water. The use of the negative control water at theend of quantitation analysis used to determine whether residual total RNA may be presentin the NanoDrop equipment. If negative control water analysis demonstrates the presenceof total RNA, clean the analysis equipment and re-measure total RNA quantities of allsamples and controls.
? TROUBLESHOOTING49| Place remaining 2μl of RNA sample back on wet ice after quantitation analysis.
Erickson et al. Page 17
Nat Protoc. Author manuscript; available in PMC 2010 January 1.
NIH
-PA Author Manuscript
NIH
-PA Author Manuscript
NIH
-PA Author Manuscript

Total RNA Integrity Qualitation Analysis • TIMING 50 min per chip plus an initial 30 min tobring kit reagents to room temperature
50| Analyze sample total RNA concentrations (ng/μl) to determine which total RNAqualitation assay to use (i.e. BioAnalyzer RNA 6000 Pico Assay or RNA 6000 NanoAssay) for each individual sample (Box 5).
51| Use the remaining 2μl from the above 3 μl aliquot used for quantitation analysis thatis on wet ice for qualitation analysis.
52| Bring appropriate kit reagents to room temperature in the dark for 30 min.
53| Follow manufacturer’s protocol with the following modification: After preparing thegel-dye mix, incubate all samples, controls, and ladder at 70°C for 2 minutes. Then quenchon ice for 2 min, vortex, and spin down. Load sample within 10 min. Continue withmanufacturer’s protocol until completion of quantitation analysis
▲CRITICAL STEP Due to potential evaporation during the sample denaturation, it isrecommended to use the remaining 2 μl of total RNA aliquot for heat incubation. Thisensures that a full 1 μl is available to meet sample requirement volume for qualitationanalysis. Accurate pipetting is critical since only 1 μl of the samples are loaded into thechip wells. During chip and sample loading process, ensure that no air bubbles are formedas this may confound qualitation analysis.
54| Review data for each sample and controls. Assess ladder, peaks, electropherograms,and RINs. RNA quality of RIN >5 is considered good quality total RNA and RIN >8 isconsidered excellent total RNA quality 50.
? TROUBLESHOOTING■ PAUSE POINT All sample aliquots (see steps 42 and 44) are stored at −80 oC and do notneed to be removed until ready for downstream analysis.
Primer/Probe Specific qPCR Assay Efficiency Determination • TIMING 3.5 hr55| Test assay efficiency, sensitivity, and reproducibility of all primer/probe sets using thepositive control total RNA dilution series prepared in step 12. The qRT-PCR assay willbe carried out in a two-step reaction; therefore, specific primer/probe qPCR test assayswill be conducted using the same parameters as the experimental assay parameters fortemplate, RT, and qPCR reagent concentrations. See step 25 below for experimentalprotocol for RT and qPCR. For one RT tube of each positive control dilution series sample,12 qPCR assays will be able to be performed. Using three qPCR technical replicates percDNA sample and primer/probe set, four primer/probe sets can be analyzed. Usualconvention is to test three genes of interest and one endogenous control primer/probe setper RT tube generated cDNA sample.
▲CRITICAL All qRT-PCR set up should be done in a dedicated PCR hood providing aclean controlled environment (Fig. 3; Box 6).
56| Analyze each qPCR assay individually by evaluating efficiencies and standard curves.The detection limits will be determined by the lowest dilution sample concentration thatgenerates repeatable CT values within the three technical replicates.
qRT-PCR Assay▲CRITICAL All qRT-PCR set up should be done in a dedicated PCR hood providing a cleancontrolled environment (Fig. 3; Box 6).
Erickson et al. Page 18
Nat Protoc. Author manuscript; available in PMC 2010 January 1.
NIH
-PA Author Manuscript
NIH
-PA Author Manuscript
NIH
-PA Author Manuscript

Reverse Transcription (RT) • TIMING 1.5 to 2 hr57| Prepare cDNA by reverse transcription (RT) of all individual total RNA samples andcontrols (NTC, no-RT, and (+) C) using TaqMan RT Reagents (Applied Biosystems, Inc.(ABI), Foster City, CA, USA; Cat # N808-0234), with random hexamers as the RTprimers. Random hexamers have been shown to minimize potential effects of startingtemplate degradation and improve qPCR analysis of short amplicons (<200 bp).
▲CRITICAL STEP Prior to planning and running the RT, plan the qPCR plate setupand determine the number of qPCR reactions (Fig. 5) that will be run from each of thesamples and controls to determine the number of RT reactions that will be needed.
58| In a 1.7 or 2 ml microfuge tube, prepare a master mix of the following RT reactioncomponents multiplied by the number of reactions plus one (for pipetting loss) as outlinedin the table below. Vortex and spin down all RT master mix components and templatesprior to use.
▲ CRITICAL STEP Prepare no-RT mastermix for each of the samples. Do not addreverse transcriptase to the RT master mix, instead add 1.25 μl additional H2O to themastermix. Prepare one additional RT reaction with (+) C to be analyzed with the no-RTcontrols.
Reagent Volume to add per reaction
10x Buffer 5.00 μl
MgCl2 11.00 μl
10mM dNTP 10.00 μl
RNase Inhibitor 1.00 μl
Random Hexamers 2.50 μl
Multiscribe RT Enzyme 1.25 μl
H2O 15.25 μl
59| Vortex and spin down master mix.
60| Add 46 μl of RT master mix to labeled PCR tubes.
61| Add 4 μl H2O to the NTC RT reaction tube. Add 4 μl of template total RNA per RTreaction tube and no-RT control reaction tube. Add 4 μl (+) C total RNA to the positivecontrol RT reaction tube. The final reaction volume will be 50 μl. Vortex and spin down,avoiding bubbles.
62| Run all RT reactions in PCR thermocycler using the following protocol as suggestedby manufacturer (ABI):
Cycles Temperature Time
1 cycle 25 oC 10 min
48 oC 30 min
95 oC 5 min
63| Immediately place samples on ice and spin down after 2 min.
Erickson et al. Page 19
Nat Protoc. Author manuscript; available in PMC 2010 January 1.
NIH
-PA Author Manuscript
NIH
-PA Author Manuscript
NIH
-PA Author Manuscript

64| Use RT product cDNA immediately in qPCR reactions or store at −20 oC.
▲CRITICAL STEP If analyzing nine genes of interest from one microdissected sample,prepare three RT reactions from each of the microdissected RNA samples (Fig. 4). Thefirst of three cDNA samples will be used in the first qPCR run. Place the other two cDNAsamples on wet ice until use. All three qPCR runs should be done consecutively on thesame day as RT reaction. After running all three qPCR plates, analyze all no-RT controlsand the additional (+) C RT cDNA in an additional qPCR plate.
■ PAUSE POINT If this cannot be done, store remaining cDNA samples at −80 oC untiluse.
qPCR • TIMING 3 hr per 96-well plate (1 hr for setup, 2 hr for qPCR)Conduct single-plex qPCR analysis of all individual cDNA samples and controls (NTC, no-RT, and (+) C) generated from above RT using 2x TaqMan Universal Master Mix andAmpliTaq Gold, and specific primer/probe sets (Applied Biosystems, Inc. (ABI), Foster City,CA, USA).
65| For each of the primer/probe sets, prepare a master mix in a 1.7 or 2 ml microfuge tubeof the following qPCR reaction components multiplied by the number of reactions plusone (for pipetting loss) as outlined in the table below. Vortex and spin down all cDNAtemplates and qPCR master mix components, except for 2x TaqMan Universal PCRMaster Mix, prior to use.
! Caution The 2x TaqMan Universal Master Mix is viscous and will bubble uponvortexing. Mix gently instead of vortexing.
Reagent Volume to add per reaction
2x TaqMan Universal PCR MM 25.00 μl
Amplitaq Gold 1.00 μl
H2O 17.50 μl
FAM or VIC primer/probe set 2.50 μl
66| Mix gently and spin down master mix.
! Caution Do not vortex qPCR master mix as micro bubbles will form, interfering withqPCR optical detection analysis.
67| Add 46 μl of qPCR master mix to designated wells in 96-well plate (Fig. 5).
68| Add 4 μl H2O to the NTC qPCR wells. Add 4 μl of template cDNA per RT reactiontube and no-RT control reaction tube. Add 4 μl (+) C cDNA to the (+) C wells. Pipette upand down, avoiding bubbles, when adding template to master mix to mix thoroughly.
! Caution Do not depress the pipette all the way down as this may cause bubbles to occurin the well.
69| Place optical caps or film over the wells of the plate. Mix gently and spin down
70| Run all qPCR reactions in qPCR thermocycler using the following protocol:
Erickson et al. Page 20
Nat Protoc. Author manuscript; available in PMC 2010 January 1.
NIH
-PA Author Manuscript
NIH
-PA Author Manuscript
NIH
-PA Author Manuscript

Cycles Temperature Time
1 cycle 50 oC 2 min
50 cycles 95 oC 15 s
60 oC 1 min
▲CRITICAL STEP 50 cycles are used for qPCR to ensure that the NTCs for a gene ofinterest have 10 CT values later than the sample gene of interest expression in cases wherelow level of gene expression (e.g. 37 CT values) are encountered. This ensures that if theNTCs demonstrate ‘no CT’ at 50 cycles, the qPCR reagents are free of contamination. Inaddition, the observation of 10 CT difference comparing no-RT with RT-positive samples,negligible contamination (0.1%) of genomic DNA contamination is confirmed92;93.
? TROUBLESHOOTING■ PAUSE POINT Upon qPCR data collection, data is saved at this point, and can be analyzedlater.
Data Analysis • TIMING 2.5 h71| Data from qRT-PCR of microdissected tissue samples is normalized using endogenouscontrol housekeeping gene expression. Therefore, relative quantitation is the analysismethod that must be used. The recommended method for relative quantitation is the2−Δ ΔCt method94 summarized in the following table. A brief discussion of biologic foldchange expression classifications can be found in Box 7.
? TROUBLESHOOTING
Relative Quantitation:
Steps Formula Definitions
1. Gene expressionnormalization within asample
Δ CT = X – EC For a given sample (diseased or normal), X is the gene of interest CT value andEC is the endogenous control CT value.
2. Gene expressioncomparison
Δ Δ CT = CTx - CTcb For a given case (comparing diseased (D) and normal (N) tissues from the sameorganism) x is the sample of interest and cb is the calibrator. The calibrator canbe D or N sample if we are asking different questions.
3. Biologic fold change 2−Δ ΔCT Translates the CT value to assign biologic significance in terms of biologic foldchange. If CT is a positive number after calculating 2- CT transform by 1/x to obtainthe underexpression value.
TIMINGSteps 1–5 , 1.5 to 3 h
Steps 6–8, 45 to 55 min
Steps 9–16, 1 hr 40 min
Steps 17–42, 45 min
Steps 43–46, 20 min
Erickson et al. Page 21
Nat Protoc. Author manuscript; available in PMC 2010 January 1.
NIH
-PA Author Manuscript
NIH
-PA Author Manuscript
NIH
-PA Author Manuscript

Steps 47–49, 2 min per sample
Steps 50 – 54, 50 min per chip plus an initial 30 min to bring kit reagents to room temperature
Steps 55 – 56, 3.5 h
Steps 57 – 64, 1.5 to 2 h
Steps 65 –70, 3 h per 96-well plate
Step 71, 2.5 h
ANTICIPATED RESULTSFig. 4 depicts the specific capture of the cells of interest from a heterogeneous cellularenvironment via laser capture microdissection using the PixCell II (Arcturus MolecularDevices).
Table 1 describes the quantity and quality of RNA yields from typical microdissections fromvarious tissues. Attention to cellular density per laser shot is important to estimate in advancethe total RNA recovery (e.g. prostate stroma compared to breast stroma number of laser shotsto obtain similar quantities of total RNA).
Fig. 6 presents an example of the amplification plot results from qRT-PCR analysis of epithelialmicrodissected prostate tumor and matched normal tissue samples.
A review of example CT value ranges that can be anticipated for endogenous controlhousekeeping genes and the corresponding RNA quantity/quality measurements can be foundin Erickson et al.’s Laboratory Investigation paper16. Other examples of CT value ranges havepreviously been published4;16 and can be reviewed for further information.
? TROUBLESHOOTINGTroubleshooting qRT-PCR data is a complex process when working with tissue samples.Standard total RNA controls, such as commercially available, high-quality total RNA fromtissue, should be used for qRT-PCR, including primer/probe optimization and efficiencyassessment, as well as standard curve generation. It is recommended that the total RNA chosenfor this purpose be from the same organ as the one being analyzed in the qRT-PCR study.However, when working with animal model or clinical tissue samples, RT and qPCR onlyrepresent the last two steps of a series of protocols that have been applied sequentially togenerate the quantitative gene expression data. Incorporating appropriate controls during eachstep, these steps leading to qRT-PCR include: tissue collection, tissue processing, tissuesectioning and staining, microdissection, and RNA extraction and isolation. Assuming propertechniques have been used for collecting the samples (in particular, reasonable reduction ofthe time from tissue removal to freezing), as well as adequate snap freezing techniques, theissue of little or no RNA recovery can still be faced.
In general, sets of tissues from different animal subjects or patients are analyzed in eachexperiment. Therefore, the situation varies if the negative results are observed in all or just inone or a few samples. In the former case general explanations are found, such as an improperRNA extraction technique. Investigators can even use high quality RNA to “re-extract” andmake sure its integrity is intact throughout the extraction. It is ideal to use a RNA quality andquantity “proven” tissue control side by side with the experimental samples when perform theextraction. This “proven” tissue serves as a “tissue extraction positive control”. DNasetreatment is one common source for RNA degradation. Another general problem could be
Erickson et al. Page 22
Nat Protoc. Author manuscript; available in PMC 2010 January 1.
NIH
-PA Author Manuscript
NIH
-PA Author Manuscript
NIH
-PA Author Manuscript

improper storing such as freezer malfunctions, or storing the tissues too long in the freezer. Ithas been observed that after storage for a year, RNA can be compromised even at -80C.
If only a few individual samples demonstrate poor RNA recovery or higher than expectedCT values are seen, general experimental protocol issues can be ruled out. In this case, the mosttypical explanation is RNA integrity in the individual sample. This can often be attributed toRNA degradation prior to freezing or poor tissue processing. In addition, certain organ typesmay also contain higher level of RNases. Brain tissue inherently contains less RNases thanother tissues, with pancreas, spleen, and intestinal mucosa having the most34. Another step inthe protocol to examine is the dissection process. Issues of cell procurement (lifting on the cap)during the laser process as well as cellular density of the dissection area of interest need to betaken into account. In the case of variable cell density, it has been observed that five to sixtimes more laser shots are needed to obtain equivalent total RNA yields in stroma comparedto epithelium.
Finally, troubleshooting issues can also arise at the phase of the analysis of the data. Thisincludes, but is not limited to, the use of inappropriate normalization strategies, high variability(i.e. large standard deviations) between qPCR replicates that is sometimes observed in lowexpressed transcripts, and the appropriate data analysis strategy (e.g. relative quantitation fordata obtained from qRT-PCR of microdissected tissues). Also, a key point in the analysis is todefine a threshold of what fold change (2−ΔΔCT) is meaningful between samples (e.g. paireddiseased and normal tissue samples). The natural trend is to consider a larger fold change asbiologically more relevant. However, smaller differences in expression can still be importantin disease progression. For instance, the loss of function of just one allele (haploinsufficiency)may be critical in several neoplastic and non-neoplastic processes96;97.
General qRT-PCR and LCM troubleshooting issues have been addressed previously in aprevious issues of Nature Protocols36;48. Additional troubleshooting advice specificallyrelated to qRT-PCR of microdissected tissue samples can be found in Table 2.
BOX 1
FROZEN TISSUE SECTION STAINING FOR HISTOPATHOLOGYCONSIDERATION AND ARCHIVE
Frozen tissue sections numbers 1, 5, and 10 should be H&E stained and cover slipped forhistopathology consideration (Box 2) and archival reference. The fixation step (Step 1, 70%ethanol) should be at least one minute for tissue morphology preservation. It isrecommended to use the same fixative as the one used for tissue sections intended formicrodissection (i.e. 70% ethanol). This assures the generation of similar tissue morphologyfor histologic review. In general, 70% ethanol fixation is an acceptable fixative for tissuemorphology preservation. However, other fixatives, such as formalin, can be used toimprove tissue morphology preservation for histopathologic assessment. Dependent uponthe tissue, times in hematoxylin and eosin should be modified to obtain the desired stainingtone.
Prepare individual staining dishes with the following solutions and treat slides for thedescribed durations. All solution preparation and staining are conducted at roomtemperature. After each incubation, slides should be briefly drained and then moved to thenext solution:
1. 70% ethanol, 1 – 2 min
2. DI H2O, 30 s
Erickson et al. Page 23
Nat Protoc. Author manuscript; available in PMC 2010 January 1.
NIH
-PA Author Manuscript
NIH
-PA Author Manuscript
NIH
-PA Author Manuscript

3. Mayer's Hematoxylin, 1 min
4. DI H2O, 30 s
5. Scott’s Bluing, 30 s
6. 70% ethanol, 30 s
7. Eosin Y, 30 s
8. 95% ethanol, 1 min
9. 95% ethanol, 1 min
10. 100% ethanol, 1 min
11. 100% ethanol, 1 min
12. Xylene, 1 min
13. Xylene, 1 min
14. Xylene, 1 min
15. Coverslip using xylene-based mounting media.
16. Allow slide to dry, 10 – 15 min. Be sure that the mounting media is dry beforestoring the slide sideways in a slide box.
17. Stained tissue section is now ready for histopathology review.
BOX 2
HISTOPATHOLOGICAL CONSIDERATIONS FOR TISSUEMICRODISSECTION
The goals of histopathology consideration before proceeding with tissue microdissectionare: 1) to evaluate the total amount of tissue and the amount of the target cells in the tissuesection present in the block, 2) to study the histopathology of the tissue specimen andidentify the target cells, and 3) to plan the microdissection for each specimen, taking inaccount the heterogeneity of tissue samples.
Recommendations
1. Always make a regular H&E slide for histopathologic analysis (Box 1) beforeproceeding with tissue microdissection. Traditional H&E staining (using longertimes in each solution than H&E for LCM) and cover slipping of sections 1, 5, and10 for histopathologic analysis are recommended prior to beginning the study.These sections will serve as a permanent record of tissue specimen status and showhistologic changes that occur in the deeper sections.
2. Always label the slides with the tissue block identification label, the number ofthe recut (e.g. 1, 2, 3, etc.), and the date the section was cut from the tissue block.
3. If you are unsure of the tissue histology represented in the traditional H&Es,consult with a pathologist to review the slides to accomplish the general goalslisted above.
4. Keep the traditional H&Es used for histopathologic assessment with you whenperforming the tissue microdissection. These slides will help in identifying thecells of interest in the tissue section being used for microdissection. Both slidescan be compared side by side.
Erickson et al. Page 24
Nat Protoc. Author manuscript; available in PMC 2010 January 1.
NIH
-PA Author Manuscript
NIH
-PA Author Manuscript
NIH
-PA Author Manuscript

5. Only dissect cells that can be clearly identified. If there is any doubt, do not dissectit without consulting with a pathologist.
BOX 3
FROZEN TISSUE SECTION STAINING FOR MICRODISSECTION
To improve cell adhesion to the LCM cap, create a “rougher” tissue surface prior to stainingby melting the frozen tissue section. This is achieved by placing the underside of the slideon the back of the hand for ~30 s after the slide containing the tissue section is removedfrom the freezer. Times in parentheses should be used in laboratories located in humidenvironments. In addition, the longer times in absolute ethanol and xylene arerecommended, even in semi-arid environments, to achieve strong dehydration to facilitatelifting cells from the glass slide.
! CAUTION In our experience, the times in ethanol and xylenes baths does not affect thequality of RNA. But, always use RNase free water for the staining baths and always usefresh solutions and cleaned jars.
Prepare individual staining dishes with the following solutions and treat slides for thedescribed durations. All solution preparation and staining are conducted at roomtemperature. After each incubation, slides should be briefly drained and then moved to thenext solution:
1. 70% ethanol, 15 s (30 s)
2. DI H2O, 15 s
3. Mayer's Hematoxylin, 30 s
4. DI H2O, 15 s
5. Scott’s Bluing, 15 s
6. 70% ethanol, 15 s
7. Eosin Y – 2–5 s
8. 95% ethanol, 15 s (30 – 60 s)
9. 95% ethanol, 15 s (30 – 60 s)
10. 100% ethanol, 15 s (30 s – 2 min)
11. 100% ethanol, 15 s (30 s – 2 min)
12. Xylene, 60 s (1 min)
13. Xylene, 60 s (1 min)
14. Xylene, 60 s (1 min)
15. Completely remove xylene from tissue by air-drying for approximately 2 min (5min). ! CAUTION The use of an air gun is not recommended as it may removetissue.
16. Stained tissue section is now ready for microdissection. ! CAUTION No morethan 30 minutes should elapse from staining until tissue is microdissected andplaced into lysis buffer.
Erickson et al. Page 25
Nat Protoc. Author manuscript; available in PMC 2010 January 1.
NIH
-PA Author Manuscript
NIH
-PA Author Manuscript
NIH
-PA Author Manuscript

BOX 4
FROZEN TISSUE MICRODISSECTION METHOD
Appropriate frozen tissue processing, sectioning (Box 1) and staining for microdissection(Box 3) should be observed. Histopathology consultation should be used to ensure that thecells of interest are the only cells procured (Box 2). If in doubt, do not procure those cells.
Microdissection
1. Put the glass slide with the stained tissue section on the laser microscope stage.
2. Put a LCM cap (cap) onto the tissue. Use microscopic visualization (lowestmagnification) to guide cap placement onto the tissue.
3. Take road map image. This is done initially while visualizing the tissue sectionunder the microscope.
4. Prior to beginning microdissection, focus the laser (infrared or UV) and set up theappropriate laser parameters (power, duration of the pulse). Test the laser in a freespace within the cap area, with no tissue, to evaluate the laser parameters.
5. Fire the laser over the cells to be dissected until the desired number of laser shotshas been taken.
6. Take a pre-dissection image. This is done prior to lifting the tissue.
7. Lift the cap up from the tissue to remove the laser targeted cells of interest.
8. Take a post-dissection image. This is done after lifting the cells of interest fromthe remaining tissue section.
9. Take a cap image. This is done to visualize the dissected cells.
10. Check efficiency of tissue lifting onto cap under a light microscope. Record thepercentage of lifting by noting the overall average percentage of the laser spotsoccupied by dissected cells. In addition, the presence of any contaminating cellsshould be noted.
11. If contaminating cells are present on the cap, clean the cap with a sterile adhesivetape or similar note paper. This is accomplished by gently placing the cap on topof the sticky border of the paper a couple of times.
12. Re-examine the cap by light microscopy. If contaminating cells are still present,repeat step 10 and 11 until no contaminating cells are present.
13. Place the cap onto a microcentrifuge tube containing lysis buffer. Lysis buffer isprovided in the RNA extraction kit.
BOX 5
CONSIDERATIONS FOR QUALITATION OF TOTAL RNA FROMMICRODISSECTED TISSUES
When generating total RNA from microdissected tissues, the quantity of total RNArecovered per sample varies depending on many variables, including, but not limited to, thesubject, tissue type, tissue processing and storage. As such, total RNA concentrations perμl of elution buffer often fall in range of one of the detection capabilities of the Bioanalyzerquantitation Pico- and Nano-Assays. The Agilent RNA 6000 Pico Kit has a qualitative rangeof 50 – 5000 pg/μl and is not suitable for quantitation. The Agilent RNA 6000 Nano Kit
Erickson et al. Page 26
Nat Protoc. Author manuscript; available in PMC 2010 January 1.
NIH
-PA Author Manuscript
NIH
-PA Author Manuscript
NIH
-PA Author Manuscript

has a qualitative range of 5 – 500 ng/μl and quantitative range of 25–500 ng/μl. Thereforeit is imperative to perform NanoDrop quantitation prior to Bioanalyzer qualitation analysisto determine which kit (i.e. Pico or Nano) is appropriate. In addition, one method ofquantitation and one method of qualitation should be used throughout the study for all tissuesamples. Therefore, since RNA quantities vary and are predominantly < 25 ng/μl (theminimum for Bioanalyzer quantitation analysis is ≥ 25ng/μl), NanoDrop is the preferredtechnique for RNA quantitation.
1. Perform total RNA quantitation of samples using NanoDrop quantitationtechnique for RNA.
2. Choose appropriate Bioanalyzer qualitation method.
A. Use Agilent 6000 Pico Kit for samples with total RNA quantities < 5ng/μl.
B. Use Agilent 6000 Nano Kit for samples with total RNA quantities >5ng/μl.
3. Perform total RNA qualitation of samples using appropriate Agilent RNA 6000kit.
BOX 6
CLEANING PROCEDURES FOR MAINTENANCE OF THE RT-PCRPREPARATION HOOD
To maintain a clean environment for qRT-PCR setup, it is imperative to use a dedicateddead air hood and dedicated equipment such as pipettes, pipette tips, tubes, racks, vortexer,and mini-centrifuge. PCR hood and/or reagent/template contamination may adversely affectthe results of the qRT-PCR experiment. This contamination potential can be negated byoptimal hood and equipment cleaning as described below.
• Regular cleaning should take place before and after each experiment is completed.
• Weekly cleaning and maintenance should also take place.
• Additional barrier tips, caps, tubes, extra trash bags bottles of 10% bleach, 70%ethyl alcohol, RNase Away, and paper towels and gloves should be located withinreach of the hood.
• Any time one goes in and out of the PCR hood, gloves must be changed.
• While working in the PCR hood, it is necessary to wear the designated clean PCRhood lab coat with elastic cuffs.
• For UV light use, make sure all pipette tips are unstacked and the centrifuge lid isopen. This allows UV to reach all areas of potential contamination during the UVsterilization process.
• Fresh 10% bleach solution should be made for each weekly cleaning
1. As supplies dwindle in the PCR hood, they should be replaced as soon as possible.
Regular Cleaning
1. Use in succession: 10% bleach followed by 70% ethanol on the inside of the hoodto:
a. Wipe all sides and back of the hood.
Erickson et al. Page 27
Nat Protoc. Author manuscript; available in PMC 2010 January 1.
NIH
-PA Author Manuscript
NIH
-PA Author Manuscript
NIH
-PA Author Manuscript

b. Wipe bottom of hood.
c. Wipe outside of all containers.
d. Wipe around both centrifuge and vortex.
e. Wipe outsides of pipette tip boxes.
f. Wipe down pipettes.
g. Wipe sides of the hood.
h. Wipe all parts of the pull up access panel on both front and back.
i. Wipe and dry PCR-only ice bucket.
2. Turn UV light switch all the way to start.
3. Replace plastic backed paper mats (“diapers”) on outside counter of PCR hood asneeded.
Weekly Maintenance
In addition to regular single use cleaning, perform the following each week:
1. Follow all bleach and ethanol steps by RNase-Away.
2. Replace plastic backed paper mats on outside counter for PCR hood. Tape downmats to counter area to prevent it from sliding.
3. Mark mats with “FOR PCR ONLY” to remind others to respect the integrity ofthe PCR clean area.
4. Compile list of consumables that are running low/need to be ordered (tips, tubes,caps, plates, and plastic bags). Keep two boxes minimum of the consumables atall times. When the second to last box of consumables gets opened, an order shouldbe placed.
5. Record date weekly maintenance was completed by writing on tape and placingon top of hood.
UV light
The UV integrity is good for 1000 hrs per bulb. One hour is clocked/used every time thelight is turned on, even if the light is only on for 5 minutes.
1. Change UV light every six months to a year, depending on use. If heavy use ofUV, record each time UV is turned on and change when 1000 uses has occurred.
2. Update tape on hood with date UV light changed.
A review of qPCR efficiencies and standard curves has been discussed in a previous issueof Nature Protocols48.
BOX 7
BIOLOGIC FOLD CHANGE EXPRESSION CLASSIFICATIONS
Biologic fold change (relative quantitation) of a diseased tissue sample compared to anormal tissue sample can be calculated using the relative quantitation 2−ΔΔCT method 94.Expression classifications (adapted from Xu et al. 77) can be used to define generalthresholds of overexpression, underexpression, or no change for a gene of interest.
Erickson et al. Page 28
Nat Protoc. Author manuscript; available in PMC 2010 January 1.
NIH
-PA Author Manuscript
NIH
-PA Author Manuscript
NIH
-PA Author Manuscript

• Overexpression in disease tissue (D) compared to normal tissue (N) (D>N),defined as
– 1+ (1.5–5-fold),
– 2+ (5.1–10-fold),
– 3+ (10.1–20-fold) and
– 4+ (>20-fold);
• Underexpression in disease tissue (D<N), defined as
– 1– (1.5–5-fold),
– 2– (5.1–10-fold),
– 3– (10.1–20-fold) and
– 4– (>20-fold);
• No change (D=N), refers to the difference of gene expression between D and N as<1.5-fold.
AcknowledgmentsThe authors appreciatively thank S. Gonzalez and A. Velasco (The Catholic University, Santiago, Chile) for theircollaboration in providing the frozen prostate whole-mount tissue blocks used to assess normalization strategies. RFCand MRE-B are Federal employee inventors on NIH patents covering LCM and xMD technologies and are entitledto receive royalty payments through the NIH Technology Transfer program. This research was supported by theIntramural Research Program of the NIH, National Cancer Institute, Center for Cancer Research.
References1. Best CJ, et al. Molecular differentiation of high- and moderate-grade human prostate cancer by cDNA
microarray analysis. Diagn Mol Pathol 2003;12:63–70. [PubMed: 12766610]2. Best CJ, et al. Molecular alterations in primary prostate cancer after androgen ablation therapy. Clin
Cancer Res 2005;11:6823–34. [PubMed: 16203770]3. Best CJ, Emmert-Buck MR. Molecular profiling of tissue samples using laser capture microdissection.
Expert Rev Mol Diagn 2001;1:53–60. [PubMed: 11901800]4. Richardson AM, et al. Global expression analysis of prostate cancer-associated stroma and epithelia.
Diagn Mol Pathol 2007;16:189–97. [PubMed: 18043281]5. Wiese AH, et al. Identification of gene signatures for invasive colorectal tumor cells. Cancer Detect
Prev 2007;31:282–95. [PubMed: 17936523]6. Lee S, et al. Alterations of gene expression in the development of early hyperplastic precursors of
breast cancer. Am J Pathol 2007;171:252–62. [PubMed: 17591970]7. Turashvili G, et al. Novel markers for differentiation of lobular and ductal invasive breast carcinomas
by laser microdissection and microarray analysis. BMC Cancer 2007;7:55. [PubMed: 17389037]8. Jaeger J, et al. Gene expression signatures for tumor progression, tumor subtype, and tumor thickness
in laser-microdissected melanoma tissues. Clin Cancer Res 2007;13:806–15. [PubMed: 17289871]9. Sunde JS, et al. Expression profiling identifies altered expression of genes that contribute to the
inhibition of transforming growth factor-beta signaling in ovarian cancer. Cancer Res 2006;66:8404–12. [PubMed: 16951150]
10. Dahl E, et al. Molecular profiling of laser-microdissected matched tumor and normal breast tissueidentifies karyopherin alpha2 as a potential novel prognostic marker in breast cancer. Clin CancerRes 2006;12:3950–60. [PubMed: 16818692]
11. Tsai MF, et al. A new tumor suppressor DnaJ-like heat shock protein, HLJ1, and survival of patientswith non-small-cell lung carcinoma. J Natl Cancer Inst 2006;98:825–38. [PubMed: 16788156]
Erickson et al. Page 29
Nat Protoc. Author manuscript; available in PMC 2010 January 1.
NIH
-PA Author Manuscript
NIH
-PA Author Manuscript
NIH
-PA Author Manuscript

12. Scott M, et al. Altered patterns of transcription of the septin gene, SEPT9, in ovarian tumorigenesis.Int J Cancer 2006;118:1325–9. [PubMed: 16161048]
13. Luzzi VI, Holtschlag V, Watson MA. Gene expression profiling of primary tumor cell populationsusing laser capture microdissection, RNA transcript amplification, and GeneChip microarrays.Methods Mol Biol 2005;293:187–207. [PubMed: 16028420]
14. Yao F, et al. Microarray analysis of fluoro-gold labeled rat dopamine neurons harvested by lasercapture microdissection. J Neurosci Methods 2005;143:95–106. [PubMed: 15814141]
15. Chan S, et al. The use of laser capture microdissection (LCM) and quantitative polymerase chainreaction to define thyroid hormone receptor expression in human 'term' placenta. Placenta2004;25:758–62. [PubMed: 15450397]
16. Erickson HS, et al. Assessment of normalization strategies for quantitative RT-PCR usingmicrodissected tissue samples. Lab Invest 2007;87:951–62. [PubMed: 17643124]
17. Ransohoff DF. Lessons from controversy: ovarian cancer screening and serum proteomics. J NatlCancer Inst 2005;97:315–9. [PubMed: 15713968]
18. Ransohoff DF. Bias as a threat to the validity of cancer molecular-marker research. Nat Rev Cancer2005;5:142–9. [PubMed: 15685197]
19. Ransohoff DF. Rules of evidence for cancer molecular-marker discovery and validation. Nat RevCancer 2004;4:309–14. [PubMed: 15057290]
20. Ransohoff DF, McNaughton Collins M, Fowler FJ. Why is prostate cancer screening so commonwhen the evidence is so uncertain? A system without negative feedback. Am J Med 2002;113:663–7. [PubMed: 12505117]
21. Twombly R. Identity crisis: finding, defining, and integrating biomarkers still a challenge. J NatlCancer Inst 2006;98:11–2. [PubMed: 16391366]
22. Compton C. Getting to personalized cancer medicine: taking out the garbage. Cancer 2007;110:1641–3. [PubMed: 17763370]
23. Vaught JB. Biorepository and biospecimen science: a new focus for CEBP. Cancer EpidemiolBiomarkers Prev 2006;15:1572–3. [PubMed: 16985012]
24. Lin DW, et al. Influence of surgical manipulation on prostate gene expression: implications formolecular correlates of treatment effects and disease prognosis. J Clin Oncol 2006;24:3763–70.[PubMed: 16822846]
25. Micke P, et al. Biobanking of fresh frozen tissue: RNA is stable in nonfixed surgical specimens. LabInvest 2006;86:202–11. [PubMed: 16402036]
26. Bova GS, et al. Optimal molecular profiling of tissue and tissue components: defining the bestprocessing and microdissection methods for biomedical applications. Mol Biotechnol 2005;29:119–52. [PubMed: 15699569]
27. Gillespie JW, et al. Molecular profiling of cancer. Toxicol Pathol 2004;32 (Suppl 1):67–71. [PubMed:15209405]
28. Ahram M, et al. Evaluation of ethanol-fixed, paraffin-embedded tissues for proteomic applications.Proteomics 2003;3:413–21. [PubMed: 12687609]
29. Perlmutter MA, et al. Comparison of snap freezing versus ethanol fixation for gene expressionprofiling of tissue specimens. J Mol Diagn 2004;6:371–7. [PubMed: 15507677]
30. Leiva IM, Emmert-Buck MR, Gillespie JW. Handling of clinical tissue specimens for molecularprofiling studies. Curr Issues Mol Biol 2003;5:27–35. [PubMed: 12793526]
31. Chuaqui RF, et al. Post-analysis follow-up and validation of microarray experiments. Nat Genet2002;32 (Suppl):509–14. [PubMed: 12454646]
32. Gillespie JW, et al. Evaluation of non-formalin tissue fixation for molecular profiling studies. Am JPathol 2002;160:449–57. [PubMed: 11839565]
33. Emmert-Buck MR, et al. Molecular profiling of clinical tissues specimens: feasibility andapplications. J Mol Diagn 2000;2:60–6. [PubMed: 11272889]
34. Ellem KA, Colter JS. A consideration of the ribonucleic acid depolymerase-inhibitor systems ofmouse tissues. J Cell Comp Physiol 1961;58:267–76. [PubMed: 13889895]
35. Erickson HS, Gillespie JW, Emmert-Buck MR. Tissue microdissection. 2008;424:433–48.36. Espina V, et al. Laser-capture microdissection. Nat Protoc 2006;1:586–603. [PubMed: 17406286]
Erickson et al. Page 30
Nat Protoc. Author manuscript; available in PMC 2010 January 1.
NIH
-PA Author Manuscript
NIH
-PA Author Manuscript
NIH
-PA Author Manuscript

37. Emmert-Buck MR, et al. Laser capture microdissection. Science 1996;274:998–1001. [PubMed:8875945]
38. Bonner RF, et al. Laser capture microdissection: molecular analysis of tissue. Science 1997;278:1481–1483. [PubMed: 9411767]
39. Okuducu AF, et al. Influence of histochemical stains on quantitative gene expression analysis afterlaser-assisted microdissection. Int J Mol Med 2003;11:449–53. [PubMed: 12632096]
40. Rubin MA. Tech.Sight. Understanding disease cell by cell. Science 2002;296:1329–30. [PubMed:12016318]
41. Radstrom P, et al. Pre-PCR processing: strategies to generate PCR-compatible samples. MolBiotechnol 2004;26:133–46. [PubMed: 14764939]
42. Lefevre J, et al. Prevalence of selective inhibition of HPV-16 DNA amplification in cervicovaginallavages. J Med Virol 2004;72:132–7. [PubMed: 14635021]
43. Sunen E, et al. Comparison of two methods for the detection of hepatitis A virus in clam samples(Tapes spp.) by reverse transcription-nested PCR. Int J Food Microbiol 2004;91:147–54. [PubMed:14996458]
44. Perch-Nielsen IR, et al. Removal of PCR inhibitors using dielectrophoresis as a selective filter in amicrosystem. Lab Chip 2003;3:212–6. [PubMed: 15100777]
45. Jiang J, et al. Development of procedures for direct extraction of Cryptosporidium DNA from waterconcentrates and for relief of PCR inhibitors. Appl Environ Microbiol 2005;71:1135–41. [PubMed:15746310]
46. Guy RA, et al. Real-time PCR for quantification of Giardia and Cryptosporidium in environmentalwater samples and sewage. Appl Environ Microbiol 2003;69:5178–85. [PubMed: 12957899]
47. Bustin SA, Nolan T. Pitfalls of quantitative real-time reverse-transcription polymerase chain reaction.J Biomol Tech 2004;15:155–66. [PubMed: 15331581]
48. Nolan T, Hands RE, Bustin SA. Quantification of mRNA using real-time RT-PCR. Nat Protoc2006;1:1559–82. [PubMed: 17406449]
49. Morrison TB, Weis JJ, Wittwer CT. Quantification of low-copy transcripts by continuous SYBRGreen I monitoring during amplification. Biotechniques 1998;24:954–8. 960–962. [PubMed:9631186]
50. Fleige S, Pfaffl MW. RNA integrity and the effect on the real-time qRT-PCR performance. MolAspects Med 2006;27:126–39. [PubMed: 16469371]
51. Hilscher C, Vahrson W, Dittmer DP. Faster quantitative real-time PCR protocols may lose sensitivityand show increased variability. Nucleic Acids Res 2005;33 :e182. [PubMed: 16314296]
52. Stanley KK, Szewczuk E. Multiplexed tandem PCR: gene profiling from small amounts of RNAusing SYBR Green detection. Nucleic Acids Res 2005;33:e180. [PubMed: 16314310]
53. Suslov O, Steindler DA. PCR inhibition by reverse transcriptase leads to an overestimation ofamplification efficiency. Nucleic Acids Res 2005;33:e181. [PubMed: 16314311]
54. Stahlberg A, et al. Properties of the reverse transcription reaction in mRNA quantification. Clin Chem2004;50:509–15. [PubMed: 14726469]
55. Stahlberg A, Kubista M, Pfaffl M. Comparison of reverse transcriptases in gene expression analysis.Clin Chem 2004;50:1678–80. [PubMed: 15331507]
56. Lewis, FMN. Extraction of Total RNa from Formalin-Fixed Paraffin-Embedded Tissue. IUL Press;La Jolla, California: 2004.
57. Lekanne Deprez RH, et al. Sensitivity and accuracy of quantitative real-time polymerase chainreaction using SYBR green I depends on cDNA synthesis conditions. Anal Biochem 2002;307:63–9. [PubMed: 12137780]
58. Vandesompele J, De Paepe A, Speleman F. Elimination of primer-dimer artifacts and genomiccoamplification using a two-step SYBR green I real-time RT-PCR. Anal Biochem 2002;303:95–8.[PubMed: 11906156]
59. Simon, R., et al. Design and analysis of DNA microarray investigations. Springer; New York: 2004.60. Murphy RM, et al. Effects of creatine supplementation on housekeeping genes in human skeletal
muscle using real-time RT-PCR. Physiol Genomics 2003;12:163–74. [PubMed: 12419855]
Erickson et al. Page 31
Nat Protoc. Author manuscript; available in PMC 2010 January 1.
NIH
-PA Author Manuscript
NIH
-PA Author Manuscript
NIH
-PA Author Manuscript

61. Khimani AH, et al. Housekeeping genes in cancer: normalization of array data. Biotechniques2005;38:739–45. [PubMed: 15948292]
62. Warrington JA, et al. Comparison of human adult and fetal expression and identification of 535housekeeping/maintenance genes. Physiol Genomics 2000;2:143–7. [PubMed: 11015593]
63. Ross DT, et al. Systematic variation in gene expression patterns in human cancer cell lines. Nat Genet2000;24:227–35. [PubMed: 10700174]
64. Thellin O, et al. Housekeeping genes as internal standards: use and limits. J Biotechnol 1999;75:291–5. [PubMed: 10617337]
65. Suzuki T, Higgins PJ, Crawford DR. Control selection for RNA quantitation. Biotechniques2000;29:332–7. [PubMed: 10948434]
66. Bustin SA. Absolute quantification of mRNA using real-time reverse transcription polymerase chainreaction assays. J Mol Endocrinol 2000;25:169–93. [PubMed: 11013345]
67. Aerts JL, Gonzales MI, Topalian SL. Selection of appropriate control genes to assess expression oftumor antigens using real-time RT-PCR. Biotechniques 2004;36:84–6. 88, 90–1. [PubMed:14740490]
68. Biederman J, Yee J, Cortes P. Validation of internal control genes for gene expression analysis indiabetic glomerulosclerosis. Kidney Int 2004;66:2308–14. [PubMed: 15569320]
69. Tsuji N, et al. Selection of an internal control gene for quantitation of mRNA in colonic tissues.Anticancer Res 2002;22:4173–8. [PubMed: 12553051]
70. Gorzelniak K, et al. Validation of endogenous controls for gene expression studies in humanadipocytes and preadipocytes. Horm Metab Res 2001;33:625–7. [PubMed: 11607884]
71. Vandesompele J, et al. Accurate normalization of real-time quantitative RT-PCR data by geometricaveraging of multiple internal control genes. Genome Biol 2002;3:34.
72. Mamo S, et al. Quantitative evaluation and selection of reference genes in mouse oocytes and embryoscultured in vivo and in vitro. BMC Dev Biol 2007;7:14. [PubMed: 17341302]
73. Mahoney DJ, et al. Real-time RT-PCR analysis of housekeeping genes in human skeletal musclefollowing acute exercise. Physiol Genomics 2004;18:226–31. [PubMed: 15161965]
74. Pogue-Geile KL, Greenberger JS. Effect of the irradiated microenvironment on the expression andretrotransposition of intracisternal type A particles in hematopoietic cells. Exp Hematol2000;28:680–9. [PubMed: 10880754]
75. Barnard GF, et al. Increased expression of human ribosomal phosphoprotein P0 messenger RNA inhepatocellular carcinoma and colon carcinoma. Cancer Res 1992;52:3067–72. [PubMed: 1350508]
76. Henry JL, Coggin DL, King CR. High-level expression of the ribosomal protein L19 in human breasttumors that overexpress erbB-2. Cancer Res 1993;53:1403–8. [PubMed: 8095182]
77. Vaarala MH, et al. Several genes encoding ribosomal proteins are over-expressed in prostate-cancercell lines: confirmation of L7a and L37 over-expression in prostate-cancer tissue samples. Int JCancer 1998;78:27–32. [PubMed: 9724090]
78. Xu LL, et al. Quantitative expression profile of PSGR in prostate cancer. Prostate Cancer ProstaticDis 2006;9:56–61. [PubMed: 16231015]
79. Morrison T, et al. Nanoliter high throughput quantitative PCR. Nucleic Acids Res 2006;34 :e123.[PubMed: 17000636]
80. Fink L, et al. Real-time quantitative RT-PCR after laser-assisted cell picking. Nat Med 1998;4:1329–33. [PubMed: 9809560]
81. Tsai WJ, et al. Real-Time PCR Quantification Using Cloned Standards and Multiple HousekeepingGenes. Protocol Online. 2007
82. Fend F, et al. Immuno-LCM: laser capture microdissection of immunostained frozen sections formRNA analysis. Am J Pathol 1999;154:61–6. [PubMed: 9916919]
83. Tangrea MA, et al. Expression microdissection: operator-independent retrieval of cells for molecularprofiling. Diagn Mol Pathol 2004;13:207–12. [PubMed: 15538110]
84. Grover AC, et al. Tumor-associated endothelial cells display GSTP1 and RARbeta2 promotermethylation in human prostate cancer. J Transl Med 2006;4:13. [PubMed: 16512911]
85. Hanson JA, et al. Gene promoter methylation in prostate tumor-associated stromal cells. J Natl CancerInst 2006;98:255–61. [PubMed: 16478744]
Erickson et al. Page 32
Nat Protoc. Author manuscript; available in PMC 2010 January 1.
NIH
-PA Author Manuscript
NIH
-PA Author Manuscript
NIH
-PA Author Manuscript

86. Fink L, et al. Laser-microdissection for cell type- and compartment-specific analyses on genomic andproteomic level. Exp Toxicol Pathol 2006;57 (Suppl 2):25–9. [PubMed: 16581237]
87. Wilhelm J, et al. Systematic comparison of the T7-IVT and SMART-based RNA preamplificationtechniques for DNA microarray experiments. Clin Chem 2006;52:1161–7. [PubMed: 16627562]
88. Fink L, et al. cDNA array hybridization after laser-assisted microdissection from nonneoplastic tissue.Am J Pathol 2002;160:81–90. [PubMed: 11786402]
89. Chenchik, A., et al. Gene Cloning and Analysis by RT-PCR. BioTechniques Books; Westborough,MA: Generation and use of high-quality cDNA from small amounts of total RNA byu SMART PCR.
90. Brenan CJ, Morrison T. High throughput, nanoliter quantitative PCR. Drug Discovery Today:Technologies 2005;2:247–253.
91. Zhang A, et al. Small interfering RNA and gene expression analysis using a multiplex branched DNAassay without RNA purification. J Biomol Screen 2005;10:549–56. [PubMed: 16103413]
92. Canales RD, et al. Evaluation of DNA microarray results with quantitative gene expression platforms.Nat Biotechnol 2006;24:1115–22. [PubMed: 16964225]
93. Schmid H, et al. Validation of endogenous controls for gene expression analysis in microdissectedhuman renal biopsies. Kidney Int 2003;64:356–60. [PubMed: 12787429]
94. Cohen CD, et al. Quantitative gene expression analysis in renal biopsies: a novel protocol for a high-throughput multicenter application. Kidney Int 2002;61:133–40. [PubMed: 11786093]
95. Livak KJ, Schmittgen TD. Analysis of relative gene expression data using real-time quantitative PCRand the 2(-Delta Delta C(T)) Method. Methods 2001;25:402–8. [PubMed: 11846609]
96. Guidi CJ, et al. Functional interaction of the retinoblastoma and Ini1/Snf5 tumor suppressors in cellgrowth and pituitary tumorigenesis. Cancer Res 2006;66:8076–82. [PubMed: 16912184]
97. King TA, et al. Heterogenic loss of the wild-type BRCA allele in human breast tumorigenesis. AnnSurg Oncol 2007;14:2510–8. [PubMed: 17597348]
Erickson et al. Page 33
Nat Protoc. Author manuscript; available in PMC 2010 January 1.
NIH
-PA Author Manuscript
NIH
-PA Author Manuscript
NIH
-PA Author Manuscript

Figure 1.Tissue sectioning and staining flowchart. (a) Tissue block is removed from the −80 °Cbiorepository and (b) placed immediately on dry ice. (c) The OCT embedded tissue block isplaced in the cryostat and adhered to a chuck using OCT. It is important to level the block toreduce facing off tissue loss. Make 8 μm thick sections and place onto labeled glass slide.Repeat 9 times for a total of 10 tissue sections. (d) Place the tissue sections immediately ondry ice. (e) Replace tissue block back into the −80 °C biorepository. If tissue sections are notgoing to be used immediately, store at −80 °C until use. (f) If tissue sections are going to beused immediately, stain tissue sections 1, 5, and 10 by traditional H&E staining method (Box1). Follow with histopathologic analysis to assess the cells of interest to be microdissected
Erickson et al. Page 34
Nat Protoc. Author manuscript; available in PMC 2010 January 1.
NIH
-PA Author Manuscript
NIH
-PA Author Manuscript
NIH
-PA Author Manuscript

(Box 2). Keep the other sections on dry ice or store at −80 °C until ready to performmicrodissection (Box 4). Immediately prior to microdissection, use the same tissue stainingstation to stain sections for microdissection (Box 3).
Erickson et al. Page 35
Nat Protoc. Author manuscript; available in PMC 2010 January 1.
NIH
-PA Author Manuscript
NIH
-PA Author Manuscript
NIH
-PA Author Manuscript

Figure 2.Frozen prostate epithelium laser capture microdissection (LCM) procurement sequence. (a)Roadmap prior to microdissection (solid arrow indicates epithelium; dashed arrow indicatesnerve). (b) Post microdissection (solid arrow indicates lifted epithelial area). (c) Microdissectedepithelial cells on LCM cap (Hematoxylin and eosin (H&E) stained. Original magnification100X).
Erickson et al. Page 36
Nat Protoc. Author manuscript; available in PMC 2010 January 1.
NIH
-PA Author Manuscript
NIH
-PA Author Manuscript
NIH
-PA Author Manuscript

Figure 3.Dedicated RT-PCR Hood Setup. The clean dead air hood with UV sterilization capability usedfor setting up RT and PCR reactions is imperative in preventing contamination. All necessaryequipment should be dedicated and remain beside or in the hood at all times, depending on thespecific use. Dedicated equipment and consumables presented in this figure outside the hoodremains outside the hood. This includes: (a) gloves, (b), 10% bleach, 70% ethanol, and RNaseAway solutions, (c) ice bucket, (d) blotter paper, (e) paper towels, and (f) tube racks in thedrawer which provides a dark environment for thawing out light sensitive reagents. Thededicated equipment and consumables presented inside the hood remain inside the hood at alltimes except when adding sterile pipette tip boxes, tubes, and clean waste bags or removingempty pipette tip boxes or full waste bags. This includes: (g) tube and plate racks, (h) mini-centrifuge, (i) vortexer, (j) pipette tips, (k), pipettes, (l) waste receptacle with bag inside,(m) pens, scissors, tube cap sealing tool, and (n) tube containers with sterile tubes. The UVbulb is located in the top of the dead air hood and the timer is located outside the hood (o).cDNA tubes (after RT) should be quenched on ice in dedicated ice bucket. The tubes containingreagents or cDNA may be brought into the hood for use and removed after use. After each useand between RT and PCR, the hood should be cleaned and UV sterilized to preventcontamination.
Erickson et al. Page 37
Nat Protoc. Author manuscript; available in PMC 2010 January 1.
NIH
-PA Author Manuscript
NIH
-PA Author Manuscript
NIH
-PA Author Manuscript

Figure 4.qRT-PCR from microdissected tissue process flowchart. Beginning with a typical dissectionof ~10,000 cells (3,000 laser shots), total RNA is extracted and isolated. This process yields~160 ng of total RNA in a volume of 20 μl. The total RNA is aliquotted into four 4 μl volumesand one 3 μl volume. The 3 μl volume is used for RNA measurement. The remaining aliquotsare used for qRT-PCR with one aliquot used as the no-RT control and the remaining threealiquots are used in RT to generate three 50 μl volumes of cDNA. Each of these 50 μl volumesis used for qPCR triplicate replicate analysis of three genes of interest and one endogenouscontrol housekeeping gene. The genes of interest may be different between the three sub-samples, but the same endogenous control housekeeping gene must be analyzed from each ofthe RT tubes.
Erickson et al. Page 38
Nat Protoc. Author manuscript; available in PMC 2010 January 1.
NIH
-PA Author Manuscript
NIH
-PA Author Manuscript
NIH
-PA Author Manuscript

Figure 5.Example qPCR 96-well setup. Using this layout, three genes of interest and one endogenouscontrol housekeeping gene can be analyzed by qPCR from six samples and appropriate controlcDNAs (one RT tube per template). This setup may be used to analyze additional genes ofinterest from the microdissected sample using the same endogenous control housekeepinggene. Example cDNA samples (e.g. 1N, 1T, 2N, 2T, 3N, 3T) are from three cases of matchedtumor (T) and normal (N) tissues. To prevent the introduction of bias, it is important to processboth diseased and normal tissue samples at the same time. Plate two would include genes ofinterest four through 6. Plate three would include genes of interest seven through nine. All no-RT controls are run on a separate plate using (+) C and NTCs.
Erickson et al. Page 39
Nat Protoc. Author manuscript; available in PMC 2010 January 1.
NIH
-PA Author Manuscript
NIH
-PA Author Manuscript
NIH
-PA Author Manuscript

Figure 6.Typical TaqMan qPCR amplification plots for 96-well setup. ΔRn versus cycles linear view.Primer/probe concentrations are optimized for highest ΔRn and lowest CT values formicrodissected tissue sample templates. All samples endogenous control housekeeping geneanalysis used VIC/HEX labeled primer-limited primer/probe sets. Genes of interest were FAMlabeled non-primer limited primer/probe sets. NTCs were all negative as evidenced by noamplification crossing the threshold resulting in no CT values. Triplicate technical replicatesare good with similar amplification efficiencies and standard of pipetting.
Erickson et al. Page 40
Nat Protoc. Author manuscript; available in PMC 2010 January 1.
NIH
-PA Author Manuscript
NIH
-PA Author Manuscript
NIH
-PA Author Manuscript

NIH
-PA Author Manuscript
NIH
-PA Author Manuscript
NIH
-PA Author Manuscript
Erickson et al. Page 41
Table 1Representative total RNA quantity and quality from microdissected frozen tissue samples a.
Tissue Neoplastic Status # LCM ShotsTotal RNA Quantity
(ng/ul)Total RNA Quality
(RINb)
Epithelium: Range = 8.4 – 20.42 Range = 4.2 – 7.8
Breast Normal 2000 12.29 7.6
Tumor 3000 13.51 7.8
Colon Normal 3000 13.2 4.2
Tumor 3000 12.57 6.5
Esophagus Normal 4000 16.59 5.1
Tumor 3700 20.42 4.5
Prostate Normal 3000 8.4 6.2
Tumor 3000 10.8 5.6
Urethra Normal 2000 13.87 6.1
Stroma: Range = 4.81 – 8.86 Range = 4.8 – 6.9
Breast Normal 3000 6.53 6.8
Tumor 2400 8.86 6.5
Prostate Normal 20,000 6.65 6.9
Tumor 20,000 6.37 5.7
Urethra Normal 3000 4.81 4.8
aThis data was generated at the Pathogenetics Unit, NCI and is representative of frozen microdissected total RNA from these tissues.
bRIN = RNA Integrity Number. Algorithm assigning value to RNA quality, as calculated by Bioanalyzer 2100 (Agilent, Inc.).
Nat Protoc. Author manuscript; available in PMC 2010 January 1.

NIH
-PA Author Manuscript
NIH
-PA Author Manuscript
NIH
-PA Author Manuscript
Erickson et al. Page 42
Table 2Troubleshooting.
Problems Possible reason Solution
LCM (Step 7)
No cells captured in LCMcap.
Tissue section mounted on acharged (plus) slide.
Mount the tissue section on uncharged slides for LCM.
Tissue section on slide notsufficiently dry.
Change solutions including ethanol and xylenes. Now increase thetimes of dehydration in ethanol 95%, 100% and xylene at 2 minuteseach bath.
Contamination of LCMcap with non-dissectedextra tissue.
Tissue section could be too dry. Check the dissected cells in the cap under the microscope. If there isextra tissue, remove it with a sterile adhesive tape or similar note paper.Gently place the cap with the film on the sticky border of the sterileadhesive tape or similar note paper a couple of times. Eliminate theused sterile adhesive tape or similar note paper. Now, check the capagain under the microscope. The extra tissue will be removed from thecap (attached to the sticky paper) while the dissected cells will remainembedded in the film and will be not removed by the sticky paper.
RNA Quantity and Quality (Steps 49 and 53)
No quantity or quality datareported by NanoDrop orBioanalyzer analysis,respectively.
Tissue section stored in freezer toolong.
Use tissue section within 2 weeks of sectioning and freezing.
RNase rich tissue (e.g. pancreas,duodenum, colon, etc.).
Stain and dissect as quickly as possible. Add RNase inhibitors tostaining solutions.
Cell not captured by LCM in thecap.
Always check lifting of captured cells on the cap under the microscopeafter LCM before proceeding to RNA extraction.
Nanogram quantity of sampleappropriate for the Bioanalyzerchip chosen (Pico v. Nano)
Use the appropriate chip for the quantity of total RNA determined byNanoDrop.
Washed RNA through the columnduring RNA extraction
Pool all flow-through and re-extract all flow through and recover theRNA.
Total RNA not aliquottedappropriately leading to multiplefree-thaw degradation.
Aliquot total RNA prior to initial storage at −80°C
Tissue block assessment byscraping tissue section andperforming RNA extraction,quantity, and quality assessmentsprior to microdissection was notdone.
Perform tissue block assessment prior to microdissection.
Low RIN number. Tissue or RNA degradation Continue with qRT-PCR analysis. Use random hexamers in RT stepto minimize effects of degradation. Determine acceptable RIN rangefor the tissue type being used in the study. For prostate, esophagus andurethra, we have found that even low RINs (RIN >2) produce specificrepeatable qRT- PCR results.
qRT-PCR (Step 67)
No CT values reported. Poor quality and quantity or totalRNA template used for RT.
See above RNA Quantity and Quality section.
RT failed to generate cDNA. Check positive control. If positive control for a particular primer/probeset did generate CT values and the endogenous control gene analyzedfor the sample generated CT values, then it can be concluded that cDNAwas generated and the sample may not be expressing the transcript ofinterest within qRT-PCR detectable quantities. If not, repeat RT.
Only ran qPCR for 40 cycles. Use RT generated cDNA to run qPCR for 50 cycles.
No CT values reported inone paired sample and notthe other.
Identical number of LCM shots/number of cells not collected forRNA extraction.
Use comparable number of cells/laser shots for RNA extraction anddownstream qRT-PCR. If comparable numbers of cells and total RNAwere used for downstream qRT-PCR, transcript in one sample (e.g.diseased sample or normal sample) may not be expressed withindetectable levels. At this point it is imperative to ascertain that the
Nat Protoc. Author manuscript; available in PMC 2010 January 1.

NIH
-PA Author Manuscript
NIH
-PA Author Manuscript
NIH
-PA Author Manuscript
Erickson et al. Page 43
Problems Possible reason Solution
endogenous control qRT-PCR for that sample did generate a CT value.If not, see No CT values reported section above.
Analysis (Step 68)
Under expression or downregulation of geneexpression unable to bedetermined.
ΔΔCT value is positive. Multiply positive ΔΔCT value by 1/x. Then perform 2−ΔΔCT foldchange calculation using this number. This fold change value willrepresent the under expression compared to the calibrator.
Nat Protoc. Author manuscript; available in PMC 2010 January 1.