quantitative control of early flowering in white lupin ... - mdpi
TRANSCRIPT
International Journal of
Molecular Sciences
Article
Quantitative Control of Early Flowering in White Lupin(Lupinus albus L.)
Sandra Rychel-Bielska 1 , Anna Surma 2, Wojciech Bielski 2 , Bartosz Kozak 1 , Renata Galek 1
and Michał Ksiazkiewicz 2,*
�����������������
Citation: Rychel-Bielska, S.; Surma,
A.; Bielski, W.; Kozak, B.; Galek, R.;
Ksiazkiewicz, M. Quantitative
Control of Early Flowering in White
Lupin (Lupinus albus L.). Int. J. Mol.
Sci. 2021, 22, 3856. https://doi.org/
10.3390/ijms22083856
Academic Editor:
Pedro Martínez-Gómez
Received: 15 February 2021
Accepted: 3 April 2021
Published: 8 April 2021
Publisher’s Note: MDPI stays neutral
with regard to jurisdictional claims in
published maps and institutional affil-
iations.
Copyright: © 2021 by the authors.
Licensee MDPI, Basel, Switzerland.
This article is an open access article
distributed under the terms and
conditions of the Creative Commons
Attribution (CC BY) license (https://
creativecommons.org/licenses/by/
4.0/).
1 Department of Genetics, Plant Breeding and Seed Production, Wroclaw University of Environmental and LifeSciences, 50-363 Wrocław, Poland; [email protected] (S.R.-B.);[email protected] (B.K.); [email protected] (R.G.)
2 Department of Gene Structure and Function, Institute of Plant Genetics, Polish Academy of Sciences,60-479 Poznan, Poland; [email protected] (A.S.); [email protected] (W.B.)
* Correspondence: [email protected]; Tel.: +48-61-655026
Abstract: White lupin (Lupinus albus L.) is a pulse annual plant cultivated from the tropics to temper-ate regions for its high-protein grain as well as a cover crop or green manure. Wild populations aretypically late flowering and have high vernalization requirements. Nevertheless, some early flower-ing and thermoneutral accessions were found in the Mediterranean basin. Recently, quantitative traitloci (QTLs) explaining flowering time variance were identified in bi-parental population mapping,however, phenotypic and genotypic diversity in the world collection has not been addressed yet. Inthis study, a diverse set of white lupin accessions (n = 160) was phenotyped for time to floweringin a controlled environment and genotyped with PCR-based markers (n = 50) tagging major QTLsand selected homologs of photoperiod and vernalization pathway genes. This survey highlightedquantitative control of flowering time in white lupin, providing statistically significant associationsfor all major QTLs and numerous regulatory genes, including white lupin homologs of CONSTANS,FLOWERING LOCUS T, FY, MOTHER OF FT AND TFL1, PHYTOCHROME INTERACTING FACTOR4, SKI-INTERACTING PROTEIN 1, and VERNALIZATION INDEPENDENCE 3. This revealed thecomplexity of flowering control in white lupin, dispersed among numerous loci localized on sev-eral chromosomes, provided economic justification for future genome-wide association studies orgenomic selection rather than relying on simple marker-assisted selection.
Keywords: vernalization; markers; flowering; quantitative trait; selection
1. Introduction
White lupin (Lupinus albus L.) is an annual legume plant cultivated for animal feed andhuman consumption in Europe, Africa and Australia [1]. It is also a valuable component incrop rotation and organic farming, thanks to its nitrogen fixation via diazotrophic symbiosisand mobilization of soil phosphorus by formation of cluster roots [2–4]. White lupin seedsare a valuable source of protein (38–42% dry weight) and oil (10–13%) with advantageousomega-6 to omega-3 acid ratios [5–7]. Moreover, white lupin consumption has positivenutraceutical impact, reducing hyperglycaemia, hypercholesterolemia and hypertension [8].For many years, wide use of lupins for human consumption was hampered by their bittertaste caused by a high alkaloid content, but this issue has been fixed in modern cultivars [9].Considering the agronomic characteristics of white lupin, there is still high potential forfurther yield increases and drought tolerance improvement by exploitation of existinggermplasm resources [10–13].
It is assumed that white lupin originated from the Balkan-Mediterranean area [14].Native adaptation to environmental conditions of many lupin landraces is the requirementof a prolonged cold period, named vernalization, to initiate flowering. Thus, in lateflowering and vernalization-responsive lines, time to flowering is reduced proportionally
Int. J. Mol. Sci. 2021, 22, 3856. https://doi.org/10.3390/ijms22083856 https://www.mdpi.com/journal/ijms
Int. J. Mol. Sci. 2021, 22, 3856 2 of 19
to the length of the vernalization period [15]. White lupin is currently grown under widerange of climatic conditions, including humid tropics, the Mediterranean basin as well astemperate zones with humid or intermediate continental climates. In some of these regionshighly delayed flowering in the absence of vernalization is a very undesired trait.
Moreover, white lupin was revealed to be susceptible to anthracnose, a very devastat-ing disease first reported in Brazil in 1912, then in the USA in 1939, and, finally, until 1997,it appeared in all major regions where white lupin was cultivated [16–19]. Unfortunately,major European early flowering white lupin donors were found to be very susceptibleto anthracnose [20,21]. Substantial levels of resistance to anthracnose were found onlyin several accessions originating from mountainous regions of Ethiopia, particularly inlines P27174, P27175, and P27178 [22]. Marker-based studies revealed that Ethiopian whitelupins are relatively closely related to each other and very distinct from the improvedgermplasm originating from Europe [23]. A reference anthracnose resistance donor, lineP27174, was found to carry two major undesired traits, namely a high vernalization require-ment and high alkaloid content, and as such was exploited, together with Kiev Mutantcarrying opposite traits, for the development of mapping populations and the construc-tion of the linkage map [24]. Following progress in molecular techniques, this linkagemap was subsequently improved with novel markers [25,26]. The most recent versionof the linkage map served as an anchor for the establishment of two genome sequenceassemblies [27,28]. Quantitative trait loci (QTL) mapping, based on the same mappingpopulation, revealed the presence of two major QTLs for anthracnose resistance, locatedin the linkage groups ALB02 and ALB04, as well as five major QTLs for flowering time,two of them located in the linkage group ALB02 (including one overlapping with themajor anthracnose resistance locus), another two in the linkage group ALB13, and one inthe linkage group ALB16 [24–26]. The white lupin molecular toolbox has been recentlysupplemented with PCR-based markers suitable for tracking Ethiopian alleles of majoranthracnose resistance loci, alkaloid locus pauper and main candidate genes controllingflowering induction [29–31]. Interestingly, white lupin breeders revealed that joining ofearly flowering with anthracnose resistance in the progeny descending from the crossbetween Kiev Mutant and P27174 was ineffective, however, replacement of the Ukrainiandonor of early flowering by the other (French) thermoneutral germplasm made this processmuch more feasible [22,32]. Such an observation highlighted the hypothetical presence ofadditional genes controlling early flowering in white lupin collection, genetically differentthan those revealed in population mapping.
Indeed, the lack of knowledge on distribution of alleles controlling flowering timein worldwide white lupin germplasm collection hampers selection of compatible earlyflowering germplasm for crosses in current breeding approaches. The present studyaimed to address this issue by combining phenotyping of time to flowering in diversifiedgermplasm collection with genotyping of marker alleles across all major QTL loci conferringflowering time control as well as some candidate genes from flowering regulation pathways.This approach provided novel evidences for quantitative regulation of flowering inductionin white lupin and designated novel candidate donors of earliness and thermoneutralityfor further improvement of this species as a crop.
2. Results2.1. Early Flowering and Thermoneutrality Is Present in Primitive and Domesticated Germplasm
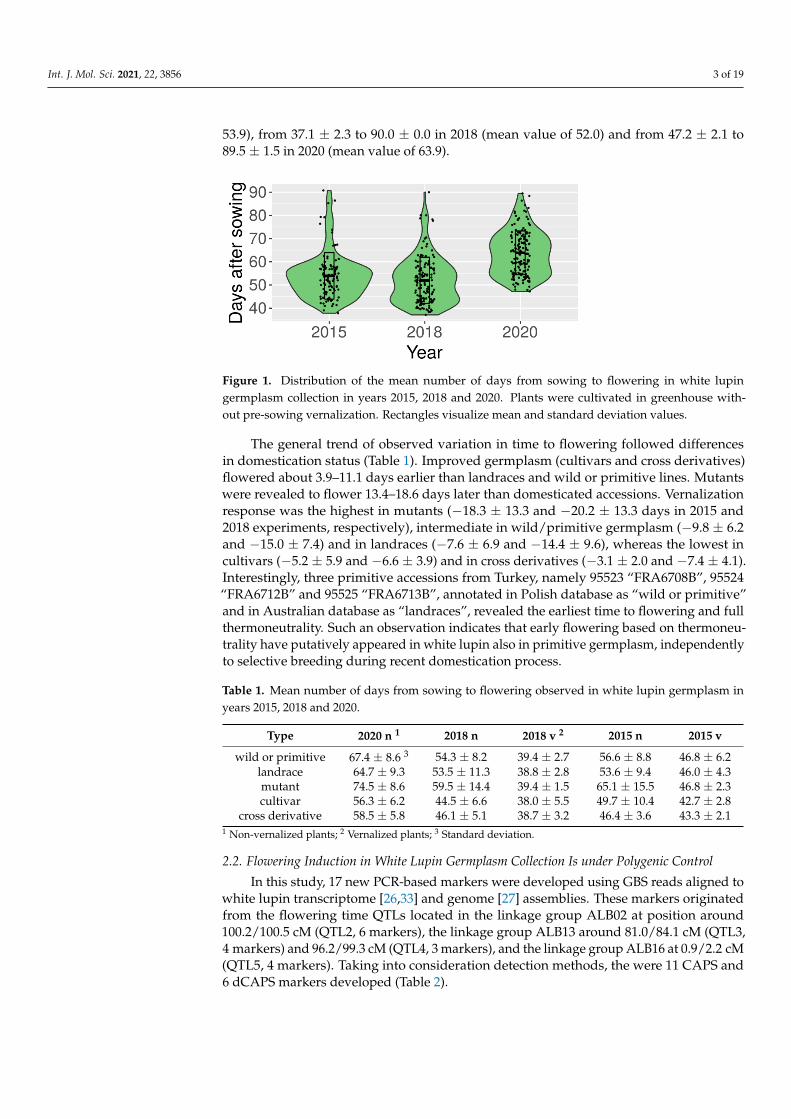
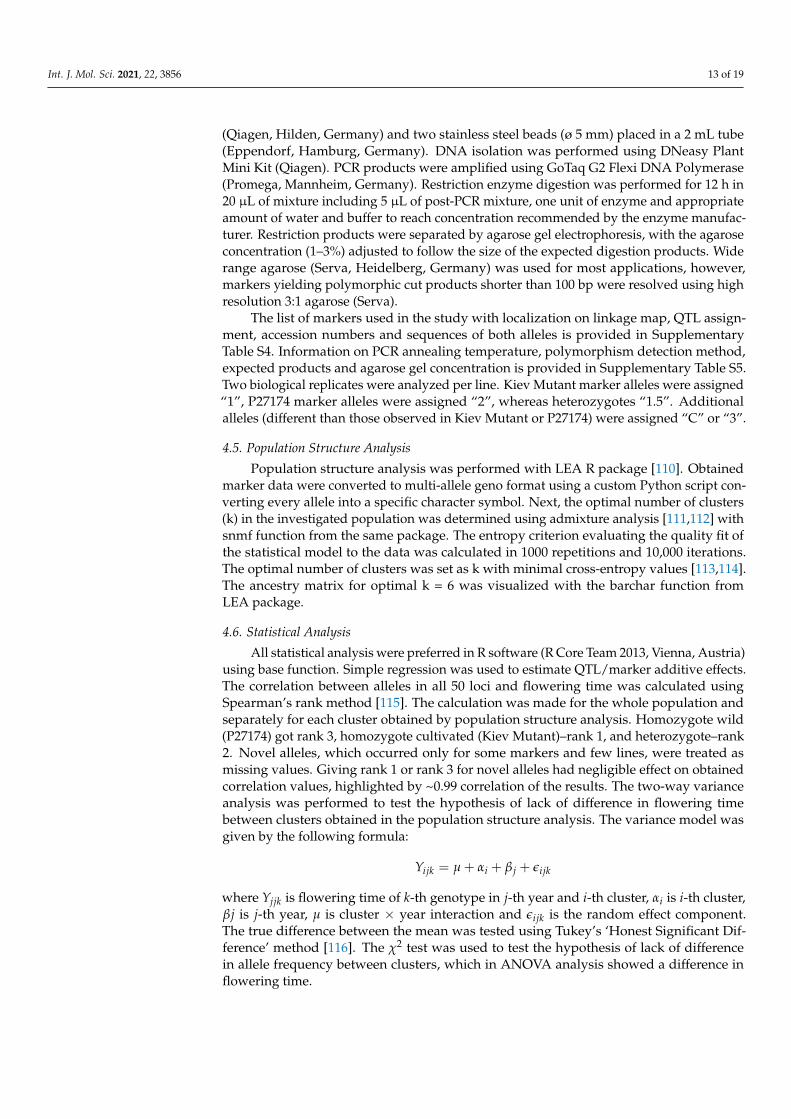
A white lupin germplasm collection (Supplementary Table S1) was phenotyped ingreenhouse conditions for time from sowing to flowering without vernalization in threeyears, 2015, 2018 and 2020. In two years—2015 and 2018—vernalization responsivenesswas evaluated as well. Observation data is provided in Supplementary Table S2, whereascalculated mean values with standard deviation are given in Supplementary Table S3.The number of days from sowing to flowering in the absence of vernalization revealedcontinuous distribution with two major peaks and high variability between genotypes(Figure 1). Observed values ranged from 37.8 ± 0.4 to 90.8 ± 6.5 in 2015 (mean value of
Int. J. Mol. Sci. 2021, 22, 3856 3 of 19
53.9), from 37.1 ± 2.3 to 90.0 ± 0.0 in 2018 (mean value of 52.0) and from 47.2 ± 2.1 to89.5 ± 1.5 in 2020 (mean value of 63.9).
Int. J. Mol. Sci. 2021, 22, x FOR PEER REVIEW 3 of 19
was evaluated as well. Observation data is provided in Supplementary Table S2, whereas
calculated mean values with standard deviation are given in Supplementary Table S3.
The number of days from sowing to flowering in the absence of vernalization revealed
continuous distribution with two major peaks and high variability between genotypes
(Figure 1). Observed values ranged from 37.8 ± 0.4 to 90.8 ± 6.5 in 2015 (mean value of
53.9), from 37.1 ± 2.3 to 90.0 ± 0.0 in 2018 (mean value of 52.0) and from 47.2 ± 2.1 to 89.5 ±
1.5 in 2020 (mean value of 63.9).
Figure 1. Distribution of the mean number of days from sowing to flowering in white lupin
germplasm collection in years 2015, 2018 and 2020. Plants were cultivated in greenhouse without
pre-sowing vernalization. Rectangles visualize mean and standard deviation values.
The general trend of observed variation in time to flowering followed differences in
domestication status (Table 1). Improved germplasm (cultivars and cross derivatives)
flowered about 3.9–11.1 days earlier than landraces and wild or primitive lines. Mutants
were revealed to flower 13.4–18.6 days later than domesticated accessions. Vernalization
response was the highest in mutants (−18.3 ± 13.3 and −20.2 ± 13.3 days in 2015 and 2018
experiments, respectively), intermediate in wild/primitive germplasm (−9.8 ± 6.2 and
−15.0 ± 7.4) and in landraces (−7.6 ± 6.9 and −14.4 ± 9.6), whereas the lowest in cultivars
(−5.2 ± 5.9 and −6.6 ± 3.9) and in cross derivatives (−3.1 ± 2.0 and −7.4 ± 4.1). Interestingly,
three primitive accessions from Turkey, namely 95523 “FRA6708B”, 95524 “FRA6712B”
and 95525 “FRA6713B”, annotated in Polish database as “wild or primitive” and in
Australian database as “landraces”, revealed the earliest time to flowering and full
thermoneutrality. Such an observation indicates that early flowering based on
thermoneutrality have putatively appeared in white lupin also in primitive germplasm,
independently to selective breeding during recent domestication process.
Table 1. Mean number of days from sowing to flowering observed in white lupin germplasm in
years 2015, 2018 and 2020.
Type 2020 n 1 2018 n 2018 v 2 2015 n 2015 v
wild or primitive 67.4 ± 8.6 3 54.3 ± 8.2 39.4 ± 2.7 56.6 ± 8.8 46.8 ± 6.2
landrace 64.7 ± 9.3 53.5 ± 11.3 38.8 ± 2.8 53.6 ± 9.4 46.0 ± 4.3
mutant 74.5 ± 8.6 59.5 ± 14.4 39.4 ± 1.5 65.1 ± 15.5 46.8 ± 2.3
cultivar 56.3 ± 6.2 44.5 ± 6.6 38.0 ± 5.5 49.7 ± 10.4 42.7 ± 2.8
cross derivative 58.5 ± 5.8 46.1 ± 5.1 38.7 ± 3.2 46.4 ± 3.6 43.3 ± 2.1 1 Non-vernalized plants; 2 Vernalized plants; 3 Standard deviation.
2.2. Flowering Induction in White Lupin Germplasm Collection Is under Polygenic Control
In this study, 17 new PCR-based markers were developed using GBS reads aligned
to white lupin transcriptome [26,33] and genome [27] assemblies. These markers
originated from the flowering time QTLs located in the linkage group ALB02 at position
around 100.2/100.5 cM (QTL2, 6 markers), the linkage group ALB13 around 81.0/84.1 cM
(QTL3, 4 markers) and 96.2/99.3 cM (QTL4, 3 markers), and the linkage group ALB16 at
Figure 1. Distribution of the mean number of days from sowing to flowering in white lupingermplasm collection in years 2015, 2018 and 2020. Plants were cultivated in greenhouse with-out pre-sowing vernalization. Rectangles visualize mean and standard deviation values.
The general trend of observed variation in time to flowering followed differencesin domestication status (Table 1). Improved germplasm (cultivars and cross derivatives)flowered about 3.9–11.1 days earlier than landraces and wild or primitive lines. Mutantswere revealed to flower 13.4–18.6 days later than domesticated accessions. Vernalizationresponse was the highest in mutants (−18.3 ± 13.3 and −20.2 ± 13.3 days in 2015 and2018 experiments, respectively), intermediate in wild/primitive germplasm (−9.8 ± 6.2and −15.0 ± 7.4) and in landraces (−7.6 ± 6.9 and −14.4 ± 9.6), whereas the lowest incultivars (−5.2 ± 5.9 and −6.6 ± 3.9) and in cross derivatives (−3.1 ± 2.0 and −7.4 ± 4.1).Interestingly, three primitive accessions from Turkey, namely 95523 “FRA6708B”, 95524“FRA6712B” and 95525 “FRA6713B”, annotated in Polish database as “wild or primitive”and in Australian database as “landraces”, revealed the earliest time to flowering and fullthermoneutrality. Such an observation indicates that early flowering based on thermoneu-trality have putatively appeared in white lupin also in primitive germplasm, independentlyto selective breeding during recent domestication process.
Table 1. Mean number of days from sowing to flowering observed in white lupin germplasm inyears 2015, 2018 and 2020.
Type 2020 n 1 2018 n 2018 v 2 2015 n 2015 v
wild or primitive 67.4 ± 8.6 3 54.3 ± 8.2 39.4 ± 2.7 56.6 ± 8.8 46.8 ± 6.2landrace 64.7 ± 9.3 53.5 ± 11.3 38.8 ± 2.8 53.6 ± 9.4 46.0 ± 4.3mutant 74.5 ± 8.6 59.5 ± 14.4 39.4 ± 1.5 65.1 ± 15.5 46.8 ± 2.3cultivar 56.3 ± 6.2 44.5 ± 6.6 38.0 ± 5.5 49.7 ± 10.4 42.7 ± 2.8
cross derivative 58.5 ± 5.8 46.1 ± 5.1 38.7 ± 3.2 46.4 ± 3.6 43.3 ± 2.11 Non-vernalized plants; 2 Vernalized plants; 3 Standard deviation.
2.2. Flowering Induction in White Lupin Germplasm Collection Is under Polygenic Control
In this study, 17 new PCR-based markers were developed using GBS reads aligned towhite lupin transcriptome [26,33] and genome [27] assemblies. These markers originatedfrom the flowering time QTLs located in the linkage group ALB02 at position around100.2/100.5 cM (QTL2, 6 markers), the linkage group ALB13 around 81.0/84.1 cM (QTL3,4 markers) and 96.2/99.3 cM (QTL4, 3 markers), and the linkage group ALB16 at 0.9/2.2 cM(QTL5, 4 markers). Taking into consideration detection methods, the were 11 CAPS and6 dCAPS markers developed (Table 2).
Int. J. Mol. Sci. 2021, 22, 3856 4 of 19
Table 2. New molecular markers developed in this study to supplement marker-assisted tracking of flowering time QTLs inwhite lupin germplasm collection.
MarkerName QTL Primers (5′→3′) Detection
MethodProducts KievMutant (bp) Products P27174 (bp)
TP56963 2 TGCTCGAAATGCCCAAATCCATCATTGATGCTCGCAGTGAAGAGATAA
CAPS,HinfI 878, 384 878, 304, 80
TP235608 2 GTAGTCCCAAACATGAACGCAGTCATCTGCATACTTGTCATTCCT
CAPS,AflII 217 179.38
TP94353 2 CAGCATTTATGTTGTTGGGACAGGAACCCTGCAATTTGGATAAGG
CAPS,RsaI 60, 51 111
TP278885 2 CCATTTGAATAGCTGCAAATCGCTTCCGCCTTTGATTGTTGAAGCCTATGC
dCAPS,HpaII 112 86, 26
TP115697 2 TGGCTCCTGTTATGTCACTCATGAATTTGAGACAAACTCAGTGGTA
dCAPS,RsaI 111, 24 135
TP114357 2 GCCATTCTGGATGGATAACCGTGGACCATCAGCTGACTTCAA
dCAPS,HpaII 124 105, 19
TP100150 3 TATTGCAGCCAATCCATCACTCACTTTCTTCATCTGATGTTGACGA
CAPS,HpyCh4V 87, 38, 30, 5 117, 38, 5
TP288840 3 CTGCAATATATTCTTTAAGACCTGATCTGGAGGAATCTAATATAAGTTGTT
dCAPS,MboI 60 37, 23
TP3177 3 CGTGACAAGTGTTCCACGGATCTGGTTGGAAGCTTGTTGTG
CAPS,SspI 169 114, 55
TP360542 3 GAGCCAGGAATAAGGGTGGTGACTGGATAGTAAAACCCCATAGAATTACT
dCAPS,TaqI 113 82, 31
TP345457 4 CACAATTCACTACCACAGATCAACCGATTTCGTCCATCCAAGGATTCTTC
CAPS,BseDI 227, 39, 12 143, 84, 39, 12
TP11750 4 AAAACCACTGAAAAGGTTCCACACAGGCGATAATATACTCGTCCA
CAPS,AciI 209 135, 74
TP402859 4 CTGGTGGCAAAAGAAGCAGAAAAAGCCAGGAAAGCACATTGG
CAPS,HpaII 198 112, 86
TP2488 5 ACCTTGTTATTGATGCTAGCTTCTTGTTTGAGGGAAGGCAGGTGGAAT
dCAPS,TspEI 48, 25, 21 48, 46
TP86766 5 CAGCATGCAAGAAAGCTGTCCTTTCTTCTCCTTCTCTTTC
CAPS,DdeI 64 48, 16
TP47264 5 TAACATGCAGCACTCACCAACTCTGGTTTCTGGGTAATGAGGA
CAPS,MboI 171 105, 66
TP30473 5 CAGCACACAACCGCAATAACATAATTACAGGAAAATATGGTCTTG
CAPS,HpyCH4V 28.25 53
Together with the previously published markers [26,29,30], the final set used forgenotyping of white lupin germplasm collection consisted of 50 markers which enabledus to track all major QTLs of flowering time and 29 white lupin homologs of floweringinduction pathway genes (Supplementary Tables S4 and S5). Novel alleles (not present inthe parental lines of mapping population) were identified for markers FTc1-F4 (16 lines),CO-F1 (2 lines), TP56963 (two lines), MFT-FT3-F1 (one line), and TP114357 (one line). Allmarkers were polymorphic in the analyzed white lupin germplasm collection, however,minor allele frequency (MAF) varied from 0.6% to 48.8% (Supplementary Table S6). Twentyfour markers had MAF below 25%, including six markers with MAF below 5% (FRI-F1,ESD4-F8, FTa1-F2, ESD4-F7, SKIP1-F2, and FKF-F2M). Interestingly, two of these markers,FTa1-F2 and SKIP1-F2, were localized in two major QTLs of white lupin flowering time.Moreover, in markers with MAF up to 25.2%, minor alleles were always originating from
Int. J. Mol. Sci. 2021, 22, 3856 5 of 19
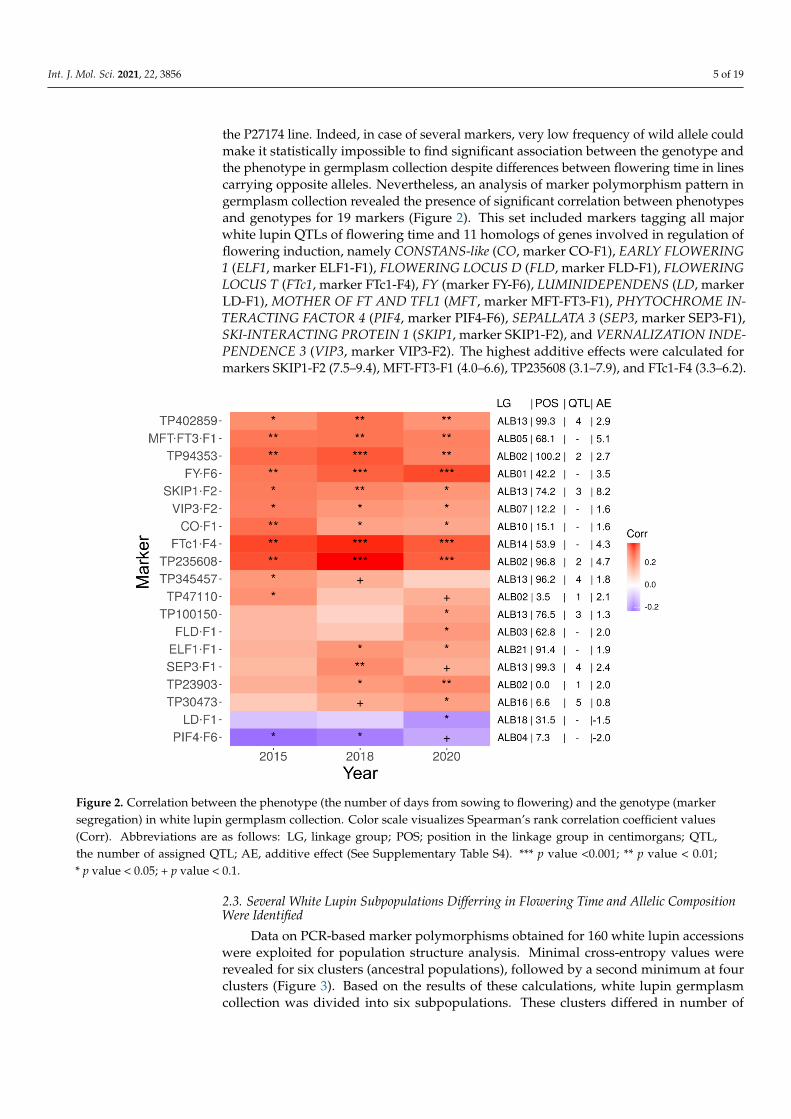
the P27174 line. Indeed, in case of several markers, very low frequency of wild allele couldmake it statistically impossible to find significant association between the genotype andthe phenotype in germplasm collection despite differences between flowering time in linescarrying opposite alleles. Nevertheless, an analysis of marker polymorphism pattern ingermplasm collection revealed the presence of significant correlation between phenotypesand genotypes for 19 markers (Figure 2). This set included markers tagging all majorwhite lupin QTLs of flowering time and 11 homologs of genes involved in regulation offlowering induction, namely CONSTANS-like (CO, marker CO-F1), EARLY FLOWERING1 (ELF1, marker ELF1-F1), FLOWERING LOCUS D (FLD, marker FLD-F1), FLOWERINGLOCUS T (FTc1, marker FTc1-F4), FY (marker FY-F6), LUMINIDEPENDENS (LD, markerLD-F1), MOTHER OF FT AND TFL1 (MFT, marker MFT-FT3-F1), PHYTOCHROME IN-TERACTING FACTOR 4 (PIF4, marker PIF4-F6), SEPALLATA 3 (SEP3, marker SEP3-F1),SKI-INTERACTING PROTEIN 1 (SKIP1, marker SKIP1-F2), and VERNALIZATION INDE-PENDENCE 3 (VIP3, marker VIP3-F2). The highest additive effects were calculated formarkers SKIP1-F2 (7.5–9.4), MFT-FT3-F1 (4.0–6.6), TP235608 (3.1–7.9), and FTc1-F4 (3.3–6.2).
Int. J. Mol. Sci. 2021, 22, x FOR PEER REVIEW 5 of 19
of wild allele could make it statistically impossible to find significant association between
the genotype and the phenotype in germplasm collection despite differences between
flowering time in lines carrying opposite alleles. Nevertheless, an analysis of marker
polymorphism pattern in germplasm collection revealed the presence of significant
correlation between phenotypes and genotypes for 19 markers (Figure 2). This set
included markers tagging all major white lupin QTLs of flowering time and 11 homologs
of genes involved in regulation of flowering induction, namely CONSTANS-like (CO,
marker CO-F1), EARLY FLOWERING 1 (ELF1, marker ELF1-F1), FLOWERING LOCUS D
(FLD, marker FLD-F1), FLOWERING LOCUS T (FTc1, marker FTc1-F4), FY (marker
FY-F6), LUMINIDEPENDENS (LD, marker LD-F1), MOTHER OF FT AND TFL1 (MFT,
marker MFT-FT3-F1), PHYTOCHROME INTERACTING FACTOR 4 (PIF4, marker
PIF4-F6), SEPALLATA 3 (SEP3, marker SEP3-F1), SKI-INTERACTING PROTEIN 1 (SKIP1,
marker SKIP1-F2), and VERNALIZATION INDEPENDENCE 3 (VIP3, marker VIP3-F2).
The highest additive effects were calculated for markers SKIP1-F2 (7.5–9.4), MFT-FT3-F1
(4.0–6.6), TP235608 (3.1–7.9), and FTc1-F4 (3.3–6.2).
Figure 2. Correlation between the phenotype (the number of days from sowing to flowering) and the genotype (marker
segregation) in white lupin germplasm collection. Color scale visualizes Spearman’s rank correlation coefficient values
(Corr). Abbreviations are as follows: LG, linkage group; POS; position in the linkage group in centimorgans; QTL, the
number of assigned QTL; AE, additive effect (See Supplementary Table S4). ***-p value <0.001; **-p value < 0.01; *-p value <
0.05; + p value < 0.1.
2.3. Several White Lupin Subpopulations Differring in Flowering Time and Allelic Composition
Were Identified
Data on PCR-based marker polymorphisms obtained for 160 white lupin accessions
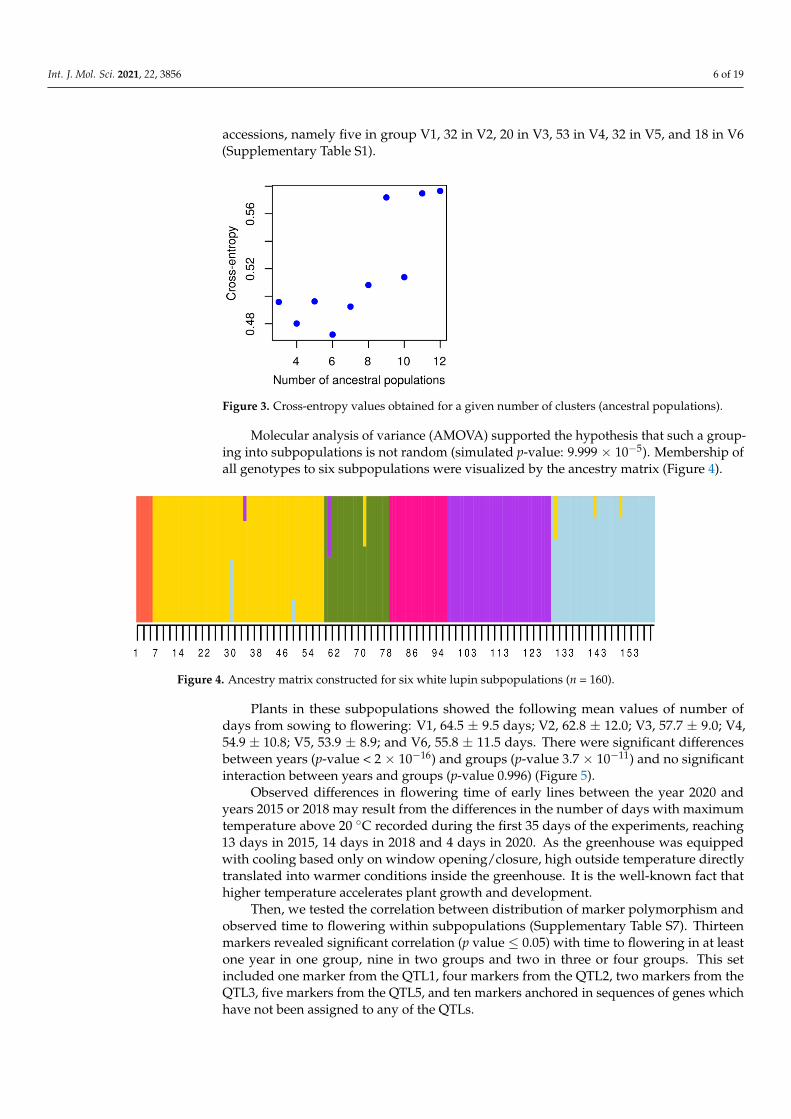
were exploited for population structure analysis. Minimal cross-entropy values were
revealed for six clusters (ancestral populations), followed by a second minimum at four
clusters (Figure 3). Based on the results of these calculations, white lupin germplasm
collection was divided into six subpopulations. These clusters differed in number of
accessions, namely five in group V1, 32 in V2, 20 in V3, 53 in V4, 32 in V5, and 18 in V6
(Supplementary Table S1).
Figure 2. Correlation between the phenotype (the number of days from sowing to flowering) and the genotype (markersegregation) in white lupin germplasm collection. Color scale visualizes Spearman’s rank correlation coefficient values(Corr). Abbreviations are as follows: LG, linkage group; POS; position in the linkage group in centimorgans; QTL,the number of assigned QTL; AE, additive effect (See Supplementary Table S4). *** p value <0.001; ** p value < 0.01;* p value < 0.05; + p value < 0.1.
2.3. Several White Lupin Subpopulations Differring in Flowering Time and Allelic CompositionWere Identified
Data on PCR-based marker polymorphisms obtained for 160 white lupin accessionswere exploited for population structure analysis. Minimal cross-entropy values wererevealed for six clusters (ancestral populations), followed by a second minimum at fourclusters (Figure 3). Based on the results of these calculations, white lupin germplasmcollection was divided into six subpopulations. These clusters differed in number of
Int. J. Mol. Sci. 2021, 22, 3856 6 of 19
accessions, namely five in group V1, 32 in V2, 20 in V3, 53 in V4, 32 in V5, and 18 in V6(Supplementary Table S1).
Int. J. Mol. Sci. 2021, 22, x FOR PEER REVIEW 6 of 19
Figure 3. Cross-entropy values obtained for a given number of clusters (ancestral populations).
Molecular analysis of variance (AMOVA) supported the hypothesis that such a
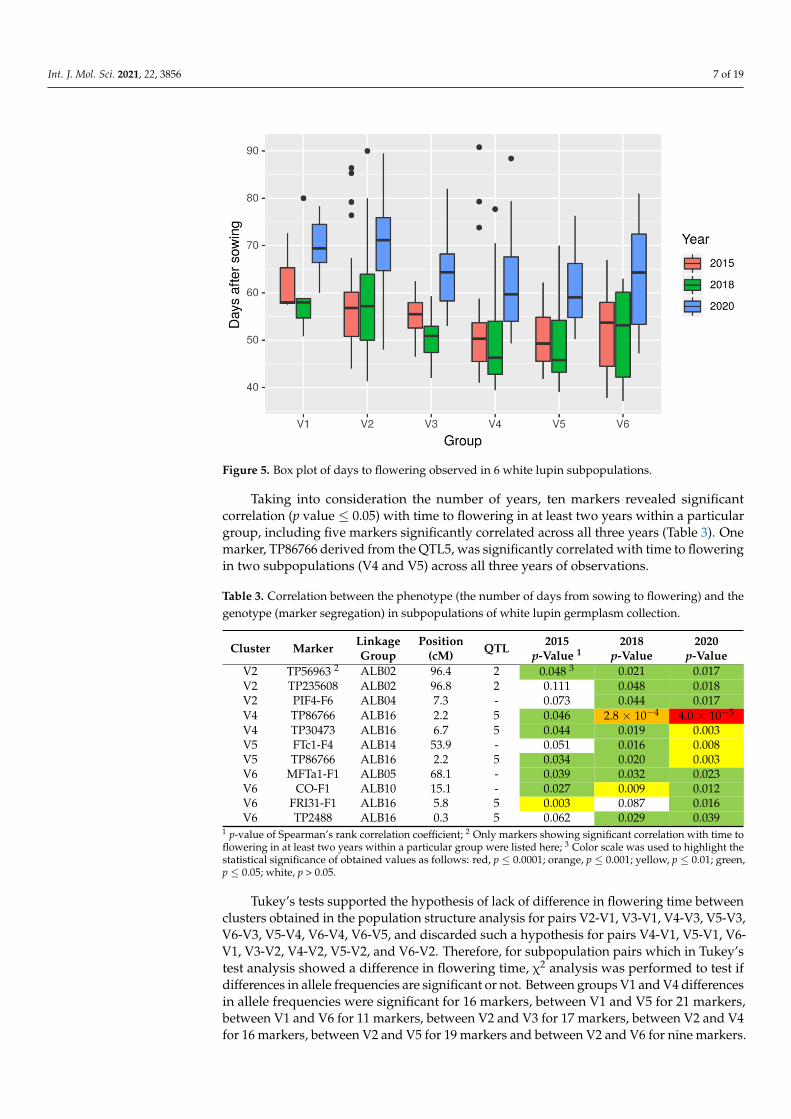
grouping into subpopulations is not random (simulated p-value: 9.999 × 10⁻⁵). Membership
of all genotypes to six subpopulations were visualized by the ancestry matrix (Figure 4).
Figure 4. Ancestry matrix constructed for six white lupin subpopulations (n = 160).
Plants in these subpopulations showed the following mean values of number of
days from sowing to flowering: V1, 64.5 ± 9.5 days; V2, 62.8 ± 12.0; V3, 57.7 ± 9.0; V4, 54.9
± 10.8; V5, 53.9 ± 8.9; and V6, 55.8 ± 11.5 days. There were significant differences between
years (p-value < 2 × 10⁻¹⁶) and groups (p-value 3.7 × 10⁻¹¹) and no significant interaction
between years and groups (p-value 0.996) (Figure 5).
Observed differences in flowering time of early lines between the year 2020 and
years 2015 or 2018 may result from the differences in the number of days with maximum
temperature above 20 °C recorded during the first 35 days of the experiments, reaching
13 days in 2015, 14 days in 2018 and 4 days in 2020. As the greenhouse was equipped
with cooling based only on window opening/closure, high outside temperature directly
translated into warmer conditions inside the greenhouse. It is the well-known fact that
higher temperature accelerates plant growth and development.
Then, we tested the correlation between distribution of marker polymorphism and
observed time to flowering within subpopulations (Supplementary Table S7). Thirteen
markers revealed significant correlation (p value ≤ 0.05) with time to flowering in at least
one year in one group, nine in two groups and two in three or four groups. This set
included one marker from the QTL1, four markers from the QTL2, two markers from the
QTL3, five markers from the QTL5, and ten markers anchored in sequences of genes
which have not been assigned to any of the QTLs.
Figure 3. Cross-entropy values obtained for a given number of clusters (ancestral populations).
Molecular analysis of variance (AMOVA) supported the hypothesis that such a group-ing into subpopulations is not random (simulated p-value: 9.999 × 10⁻⁵). Membership ofall genotypes to six subpopulations were visualized by the ancestry matrix (Figure 4).
Int. J. Mol. Sci. 2021, 22, x FOR PEER REVIEW 6 of 19
Figure 3. Cross-entropy values obtained for a given number of clusters (ancestral populations).
Molecular analysis of variance (AMOVA) supported the hypothesis that such a
grouping into subpopulations is not random (simulated p-value: 9.999 × 10⁻⁵). Membership
of all genotypes to six subpopulations were visualized by the ancestry matrix (Figure 4).
Figure 4. Ancestry matrix constructed for six white lupin subpopulations (n = 160).
Plants in these subpopulations showed the following mean values of number of
days from sowing to flowering: V1, 64.5 ± 9.5 days; V2, 62.8 ± 12.0; V3, 57.7 ± 9.0; V4, 54.9
± 10.8; V5, 53.9 ± 8.9; and V6, 55.8 ± 11.5 days. There were significant differences between
years (p-value < 2 × 10⁻¹⁶) and groups (p-value 3.7 × 10⁻¹¹) and no significant interaction
between years and groups (p-value 0.996) (Figure 5).
Observed differences in flowering time of early lines between the year 2020 and
years 2015 or 2018 may result from the differences in the number of days with maximum
temperature above 20 °C recorded during the first 35 days of the experiments, reaching
13 days in 2015, 14 days in 2018 and 4 days in 2020. As the greenhouse was equipped
with cooling based only on window opening/closure, high outside temperature directly
translated into warmer conditions inside the greenhouse. It is the well-known fact that
higher temperature accelerates plant growth and development.
Then, we tested the correlation between distribution of marker polymorphism and
observed time to flowering within subpopulations (Supplementary Table S7). Thirteen
markers revealed significant correlation (p value ≤ 0.05) with time to flowering in at least
one year in one group, nine in two groups and two in three or four groups. This set
included one marker from the QTL1, four markers from the QTL2, two markers from the
QTL3, five markers from the QTL5, and ten markers anchored in sequences of genes
which have not been assigned to any of the QTLs.
Figure 4. Ancestry matrix constructed for six white lupin subpopulations (n = 160).
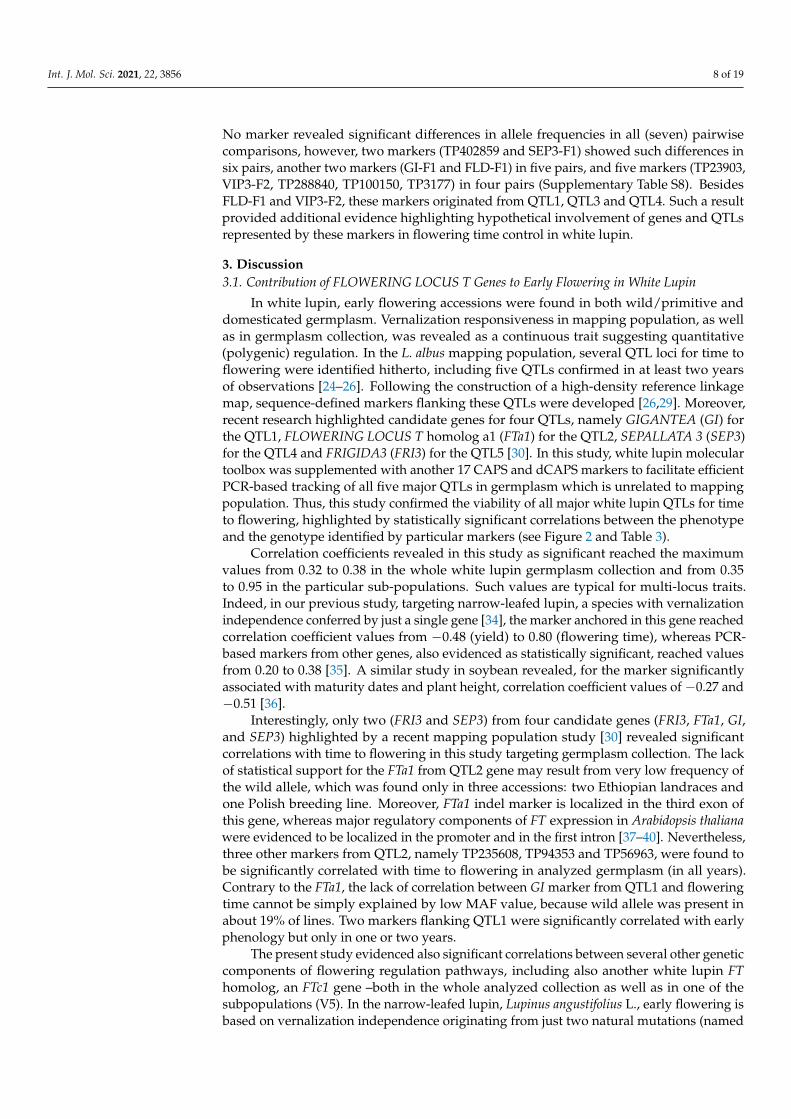
Plants in these subpopulations showed the following mean values of number ofdays from sowing to flowering: V1, 64.5 ± 9.5 days; V2, 62.8 ± 12.0; V3, 57.7 ± 9.0; V4,54.9 ± 10.8; V5, 53.9 ± 8.9; and V6, 55.8 ± 11.5 days. There were significant differencesbetween years (p-value < 2 × 10⁻¹⁶) and groups (p-value 3.7 × 10⁻¹¹) and no significantinteraction between years and groups (p-value 0.996) (Figure 5).
Observed differences in flowering time of early lines between the year 2020 andyears 2015 or 2018 may result from the differences in the number of days with maximumtemperature above 20 ◦C recorded during the first 35 days of the experiments, reaching13 days in 2015, 14 days in 2018 and 4 days in 2020. As the greenhouse was equippedwith cooling based only on window opening/closure, high outside temperature directlytranslated into warmer conditions inside the greenhouse. It is the well-known fact thathigher temperature accelerates plant growth and development.
Then, we tested the correlation between distribution of marker polymorphism andobserved time to flowering within subpopulations (Supplementary Table S7). Thirteenmarkers revealed significant correlation (p value ≤ 0.05) with time to flowering in at leastone year in one group, nine in two groups and two in three or four groups. This setincluded one marker from the QTL1, four markers from the QTL2, two markers from theQTL3, five markers from the QTL5, and ten markers anchored in sequences of genes whichhave not been assigned to any of the QTLs.
Int. J. Mol. Sci. 2021, 22, 3856 7 of 19Int. J. Mol. Sci. 2021, 22, x FOR PEER REVIEW 7 of 19
Figure 5. Box plot of days to flowering observed in 6 white lupin subpopulations.
Taking into consideration the number of years, ten markers revealed significant
correlation (p value ≤ 0.05) with time to flowering in at least two years within a particular
group, including five markers significantly correlated across all three years (Table 3). One
marker, TP86766 derived from the QTL5, was significantly correlated with time to
flowering in two subpopulations (V4 and V5) across all three years of observations.
Table 3. Correlation between the phenotype (the number of days from sowing to flowering) and
the genotype (marker segregation) in subpopulations of white lupin germplasm collection.
Cluster Marker Linkage
Group
Position
(cM) QTL
2015
p-Value 1
2018
p-Value
2020
p-Value
V2 TP56963 2 ALB02 96.4 2 0.048 3 0.021 0.017
V2 TP235608 ALB02 96.8 2 0.111 0.048 0.018
V2 PIF4-F6 ALB04 7.3 - 0.073 0.044 0.017
V4 TP86766 ALB16 2.2 5 0.046 2.8 × 10⁻⁴ 4.0 × 10⁻⁵
V4 TP30473 ALB16 6.7 5 0.044 0.019 0.003
V5 FTc1-F4 ALB14 53.9 - 0.051 0.016 0.008
V5 TP86766 ALB16 2.2 5 0.034 0.020 0.003
V6 MFTa1-F1 ALB05 68.1 - 0.039 0.032 0.023
V6 CO-F1 ALB10 15.1 - 0.027 0.009 0.012
V6 FRI31-F1 ALB16 5.8 5 0.003 0.087 0.016
V6 TP2488 ALB16 0.3 5 0.062 0.029 0.039 1 p-value of Spearman’s rank correlation coefficient; 2 Only markers showing significant correlation
with time to flowering in at least two years within a particular group were listed here; 3 Color scale
was used to highlight the statistical significance of obtained values as follows: red, p ≤ 0.0001;
orange, p ≤ 0.001; yellow, p ≤ 0.01; green, p ≤ 0.05; white, p > 0.05.
Tukey’s tests supported the hypothesis of lack of difference in flowering time
between clusters obtained in the population structure analysis for pairs V2-V1, V3-V1,
V4-V3, V5-V3, V6-V3, V5-V4, V6-V4, V6-V5, and discarded such a hypothesis for pairs
V4-V1, V5-V1, V6-V1, V3-V2, V4-V2, V5-V2, and V6-V2. Therefore, for subpopulation
pairs which in Tukey’s test analysis showed a difference in flowering time, χ2 analysis
was performed to test if differences in allele frequencies are significant or not. Between
groups V1 and V4 differences in allele frequencies were significant for 16 markers,
Figure 5. Box plot of days to flowering observed in 6 white lupin subpopulations.
Taking into consideration the number of years, ten markers revealed significantcorrelation (p value ≤ 0.05) with time to flowering in at least two years within a particulargroup, including five markers significantly correlated across all three years (Table 3). Onemarker, TP86766 derived from the QTL5, was significantly correlated with time to floweringin two subpopulations (V4 and V5) across all three years of observations.
Table 3. Correlation between the phenotype (the number of days from sowing to flowering) and thegenotype (marker segregation) in subpopulations of white lupin germplasm collection.
Cluster Marker LinkageGroup
Position(cM) QTL 2015
p-Value 12018
p-Value2020
p-ValueV2 TP56963 2 ALB02 96.4 2 0.048 3 0.021 0.017V2 TP235608 ALB02 96.8 2 0.111 0.048 0.018V2 PIF4-F6 ALB04 7.3 - 0.073 0.044 0.017V4 TP86766 ALB16 2.2 5 0.046 2.8 × 10⁻⁴ 4.0 × 10⁻⁵
V4 TP30473 ALB16 6.7 5 0.044 0.019 0.003V5 FTc1-F4 ALB14 53.9 - 0.051 0.016 0.008V5 TP86766 ALB16 2.2 5 0.034 0.020 0.003V6 MFTa1-F1 ALB05 68.1 - 0.039 0.032 0.023V6 CO-F1 ALB10 15.1 - 0.027 0.009 0.012V6 FRI31-F1 ALB16 5.8 5 0.003 0.087 0.016V6 TP2488 ALB16 0.3 5 0.062 0.029 0.039
1 p-value of Spearman’s rank correlation coefficient; 2 Only markers showing significant correlation with time toflowering in at least two years within a particular group were listed here; 3 Color scale was used to highlight thestatistical significance of obtained values as follows: red, p ≤ 0.0001; orange, p ≤ 0.001; yellow, p ≤ 0.01; green,p ≤ 0.05; white, p > 0.05.
Tukey’s tests supported the hypothesis of lack of difference in flowering time betweenclusters obtained in the population structure analysis for pairs V2-V1, V3-V1, V4-V3, V5-V3,V6-V3, V5-V4, V6-V4, V6-V5, and discarded such a hypothesis for pairs V4-V1, V5-V1, V6-V1, V3-V2, V4-V2, V5-V2, and V6-V2. Therefore, for subpopulation pairs which in Tukey’stest analysis showed a difference in flowering time, χ2 analysis was performed to test ifdifferences in allele frequencies are significant or not. Between groups V1 and V4 differencesin allele frequencies were significant for 16 markers, between V1 and V5 for 21 markers,between V1 and V6 for 11 markers, between V2 and V3 for 17 markers, between V2 and V4for 16 markers, between V2 and V5 for 19 markers and between V2 and V6 for nine markers.
Int. J. Mol. Sci. 2021, 22, 3856 8 of 19
No marker revealed significant differences in allele frequencies in all (seven) pairwisecomparisons, however, two markers (TP402859 and SEP3-F1) showed such differences insix pairs, another two markers (GI-F1 and FLD-F1) in five pairs, and five markers (TP23903,VIP3-F2, TP288840, TP100150, TP3177) in four pairs (Supplementary Table S8). BesidesFLD-F1 and VIP3-F2, these markers originated from QTL1, QTL3 and QTL4. Such a resultprovided additional evidence highlighting hypothetical involvement of genes and QTLsrepresented by these markers in flowering time control in white lupin.
3. Discussion3.1. Contribution of FLOWERING LOCUS T Genes to Early Flowering in White Lupin
In white lupin, early flowering accessions were found in both wild/primitive anddomesticated germplasm. Vernalization responsiveness in mapping population, as wellas in germplasm collection, was revealed as a continuous trait suggesting quantitative(polygenic) regulation. In the L. albus mapping population, several QTL loci for time toflowering were identified hitherto, including five QTLs confirmed in at least two yearsof observations [24–26]. Following the construction of a high-density reference linkagemap, sequence-defined markers flanking these QTLs were developed [26,29]. Moreover,recent research highlighted candidate genes for four QTLs, namely GIGANTEA (GI) forthe QTL1, FLOWERING LOCUS T homolog a1 (FTa1) for the QTL2, SEPALLATA 3 (SEP3)for the QTL4 and FRIGIDA3 (FRI3) for the QTL5 [30]. In this study, white lupin moleculartoolbox was supplemented with another 17 CAPS and dCAPS markers to facilitate efficientPCR-based tracking of all five major QTLs in germplasm which is unrelated to mappingpopulation. Thus, this study confirmed the viability of all major white lupin QTLs for timeto flowering, highlighted by statistically significant correlations between the phenotypeand the genotype identified by particular markers (see Figure 2 and Table 3).
Correlation coefficients revealed in this study as significant reached the maximumvalues from 0.32 to 0.38 in the whole white lupin germplasm collection and from 0.35to 0.95 in the particular sub-populations. Such values are typical for multi-locus traits.Indeed, in our previous study, targeting narrow-leafed lupin, a species with vernalizationindependence conferred by just a single gene [34], the marker anchored in this gene reachedcorrelation coefficient values from −0.48 (yield) to 0.80 (flowering time), whereas PCR-based markers from other genes, also evidenced as statistically significant, reached valuesfrom 0.20 to 0.38 [35]. A similar study in soybean revealed, for the marker significantlyassociated with maturity dates and plant height, correlation coefficient values of −0.27 and−0.51 [36].
Interestingly, only two (FRI3 and SEP3) from four candidate genes (FRI3, FTa1, GI,and SEP3) highlighted by a recent mapping population study [30] revealed significantcorrelations with time to flowering in this study targeting germplasm collection. The lackof statistical support for the FTa1 from QTL2 gene may result from very low frequency ofthe wild allele, which was found only in three accessions: two Ethiopian landraces andone Polish breeding line. Moreover, FTa1 indel marker is localized in the third exon ofthis gene, whereas major regulatory components of FT expression in Arabidopsis thalianawere evidenced to be localized in the promoter and in the first intron [37–40]. Nevertheless,three other markers from QTL2, namely TP235608, TP94353 and TP56963, were found tobe significantly correlated with time to flowering in analyzed germplasm (in all years).Contrary to the FTa1, the lack of correlation between GI marker from QTL1 and floweringtime cannot be simply explained by low MAF value, because wild allele was present inabout 19% of lines. Two markers flanking QTL1 were significantly correlated with earlyphenology but only in one or two years.
The present study evidenced also significant correlations between several other geneticcomponents of flowering regulation pathways, including also another white lupin FThomolog, an FTc1 gene –both in the whole analyzed collection as well as in one of thesubpopulations (V5). In the narrow-leafed lupin, Lupinus angustifolius L., early flowering isbased on vernalization independence originating from just two natural mutations (named
Int. J. Mol. Sci. 2021, 22, 3856 9 of 19
Ku and Jul) discovered in domesticated germplasm in 1960s [41,42]. Ku is based on a large(1.4 kbp) deletion in the promoter region of one of the four L. angustifolius FT homologs,FTc1 [34]. This deletion carries potential binding sites for several transcription factorsacting as FT gene repressors in A. thaliana [43]. The second L. angustifolius domesticatedearly phenology mutation, Jul, was recently revealed to be a 5162 bp deletion in the FTc1promoter region, fully encompassing the Ku indel [44]. Recently, a fourth FTc1 allele, Pal,was found in a wild population originating from Palestine, carrying 1208 bp deletionpartially overlapping with Ku [44,45]. Recent gene-based genome-wide association studyconfirmed that this series of indels in FTc1 has a major effect on time to flowering andmaturity in diversified narrow-leafed germplasm collection [35].
The release of two white lupin high quality genome assemblies [27,28] provided anunprecedented opportunity to search for similar indels in FT homologs in this species,both by whole-genome shotgun and PCR-based approaches. Recent comparative mappingapproach performed in yellow lupin, Lupinus luteus L., revealed that a major QTL forvernalization responsiveness in this species is localized in a linkage map segment syntenicto the narrow-leafed lupin genome region carrying the FTc1 gene [46–48]. All these obser-vations support the conclusion on the highly conserved contribution of the FTc1 homologsinto vernalization pathway in the Old World lupin clade.
The involvement of an FTc in flowering time control is relatively rare phenomenon inplants, as FTc homologs appeared only in legumes as a result of whole-genome duplicationevent(s) [43]. Thus, in the legume model plant, Medicago truncatula L., vernalization respon-siveness is more likely conferred by the MtFTa1 gene (which is also highly induced by longday conditions), whereas photoperiod pathway by the MtFTb1 and MtFTb2 genes [49–51].In pea, FT genes showed transcriptional sub-functionalization and one of those, FTa1,underlies the pea GIGAS locus, essential for flowering under long-days and positive forflowering under short-days [50]. In soybean, which is a vernalization independent species,three genes belonging to FTa and FTc clades confer just the photoperiod response [52–55]. Inchickpea, altered expression of a cluster of three FT genes (FTa1, FTa2 and FTc) is associatedwith early phenology [56], however, a major QTL for vernalization response in this speciesis localized in a genome region lacking any FT homolog [57].
3.2. Candidates from Photoperiod, Vernalization, Autonomous and Heat-Responsive Pathways forFlowering Time Control in White Lupin
Besides FTc1, our study revealed significant correlations between time to floweringand sequence polymorphism in markers anchored in the sequences of the following genes:CO-like, ELF1, FLD, FRI, FY, LD, MFT, PIF4, SEP3, SKIP1, and VIP3. Without any dataabout linkage disequilibrium decay we could not infer about the size of haplotype blocksrepresented by these markers. Therefore, we focused on the analysis of hypotheticalinvolvement of genes represented by particular markers in regulation of flowering time inwhite lupin.
CO-F1 marker was found to be significantly correlated with flowering time of whitelupin in all three experiments, both in the whole set of lines as well as in one of thesubpopulations (V6). CO gene is a well-known central regulator of photoperiod pathwayin A. thaliana [58,59]. In M. truncatula, a homolog of this gene was localized in the major QTLfor flowering date and revealed different expression profiles in parental lines contrastingfor flowering time [60,61]. The association between CO-like gene and flowering time wasalso confirmed for Medicago sativa [62]. These observations support the concept of choosingCO gene as one of the targets in artificial selection in white lupin.
ELF1-F1 marker revealed significant correlation in two years (2018 and 2020). The lackof statistical support for correlation in the first experiment might be related with the lowernumber of white lupin lines analyzed, especially those with late flowering phenotype. ELF1gene is hypothetically involved in flowering regulation in A. thaliana, however, particularmechanism has not been yet deciphered [63]. ELF1, together with an FLD gene and other sixpotential flowering time-regulating genes, were highlighted by genome-scale associationand QTL mapping of complex flowering time trait in chickpea [64].
Int. J. Mol. Sci. 2021, 22, 3856 10 of 19
FLD-F1 and LD-F1 markers showed significant correlation with flowering time inthe last year, whereas FY-F6 marker in all three years. FLD, FY and LD in A. thaliana arecomponents of the autonomous pathway that promotes flowering independently of thephotoperiod and vernalization [65,66]. It was evidenced that soybean genome encodesa functional copy of an FLD gene which promotes flowering when introduced into lateflowering A. thaliana fld mutant [67].
FRI31-F1 marker revealed significant association with flowering time in one of thesubpopulations (V6) in the years 2015 and 2020. Besides the floral repressor FLOWERINGLOCUS C (FLC), FRI is a second key component of vernalization pathway in A. thaliana,and allelic variation of FRI accounts for the majority of natural flowering time variationin germplasm collection of this species [68,69]. FRI upregulates expression of the FLC byacting in a supercomplex that establishes a local chromosomal environment facilitatingproduction of the FLC mRNA [70]. Nevertheless, despite revealed significant associationbetween the FRI marker and time to flowering in white lupin, direct translation of thismechanism from A. thaliana into this species is not possible, due to the lack of any FLChomolog in white lupin and other legume genomes, except soybean [30,71,72]. Interestingly,in soybean, SNP variation in FRI sequence was also found to be highly associated withflowering time, shedding new light on potential contribution of this gene into floweringregulation network apart from the vernalization pathway [73].
VIP3-F2 marker, tagging another component of vernalization pathway in A. thaliana,was significantly associated with white lupin flowering time in all experiments. It wasrevealed that loss-of-function mutation in the VIP3 gene suppress the effect of FRI on FLCexpression and flowering time in A. thaliana [74,75]. To our best knowledge, the presentstudy is the first report on association between VIP3 and flowering time in legumes.
Similarly to VIP3-F2, SKIP1-F2 marker also revealed significant correlation with whitelupin flowering time in all experiments. SKIP is a component of flowering regulationnetwork linking alternative splicing and the circadian clock in A. thaliana [76]. It works asa splicing factor as part of the spliceosome and as a transcriptional activator interactingwith EARLY FLOWERING 7 (ELF7) [77]. SKIP is required for the splicing of serratedleaves and early flowering (SEF) pre-messenger RNA (mRNA) in A. thaliana [78]. A SKIPhomolog in soybean, GmGBP1, acts as a positive regulator upstream of GmFT2a andGmFT5a and promotes flowering on short days. Moreover, natural variation in GmGBP1promoter sequence is associated with photoperiod control of soybean flowering timeand maturity [79]. Transgenic A. thaliana with the ectopic overexpression of GmGBPrevealed advanced flowering under long days via photoperiodic and gibberellin pathways(including CO and FT genes) and delayed flowering under short days via autonomouspathway (SVP and FLC) [80].
PIF4-F6 marker was significantly correlated with white lupin flowering time in twoyears (both in the whole set of lines and in the subpopulation V2). PIF4 is associated invariation of ecologically important traits in A. thaliana, including time to flowering [81].Expression of PIF4 is induced proportionally to the increase of ambient temperature (atleast in the range 12–27 ◦C), resulting in strong induction of the FT gene and overcomeof late flowering phenotype of A. thaliana [82]. Similar correlation of PIF4 expressionand temperature was also observed in soybean [83]. In our study, PIF4 marker revealedsignificant association with flowering time in white lupin collection in 2015 and 2018, andnon-significant in 2020. Indeed, the number of days with temperature above 20 ◦C duringfirst 40 days of the experiment was higher in 2015 and 2018 years than in 2020 (14 and17 vs. 7). Such an observation may explain observed differences in correlation values andprovide some support on the conserved function of PIF4 as a thermosensory activator offlowering in white lupin.
Two MFT markers, MFTa1-F1 and MFT-FT3-F1) showed significant correlation withwhite lupin flowering time in all years, one in the whole collection and the second in thesubpopulation V6 (together with CO and FRI). MFT genes constitute the basal clade amongphosphatidylethanolamine-binding (PEPB) domain genes and are present in angiosperms,
Int. J. Mol. Sci. 2021, 22, 3856 11 of 19
gymnosperms, lycophytes and bryophytes [84]. Duplication of an ancient MFT-like genehypothetically contributed to the radiation of seed plants [85]. Overexpression of the MFTgene in A. thaliana resulted in slightly early flowering under long days [86]. It was recentlyevidenced that the MFT functions as a key A. thaliana repressor of germination underfar-red light conditions [87]. Moreover, MFT is considered a potential candidate gene for amajor QTL that alters A. thaliana flowering time at elevated CO2 [88]. CO2 concentration ingreenhouse at seedling stage can be higher than outside due to the vigorous soil respirationand lower canopy photosynthetic rate [89]. Thus, any of the mentioned functions could beassigned to explain observed significant correlation between white lupin flowering timeand MFT gene-based marker polymorphism.
3.3. Perspectives for Molecular-Assisted Breeding of White Lupin
High number of markers which significantly correlated with flowering time suggeststhat genome-wide selection should be a method of choice for white lupin breeders, ratherthan the classical approach utilizing marker-assisted selection. Introduction of preferredalleles on one-by-one basis can be inefficient, due to epistatic interactions between majorcomponents of flowering regulatory network [90]. Phenotyping studies revealed that whitelupin germplasm collection has variability of many agronomic traits, including, besides timeto flowering, winter survival, pod fertility, pod wall proportion, number of leaves on themain stem, several yield related traits and anthracnose resistance [11–13,29,91–94]. Despiterelatively small genotype sample size (83 landraces and eight varieties), genomic predictionfor grain yield, winter plant survival and onset of flowering provided prospective output,manifested by model-based predictive ability values as high as 0.84–0.86 [10]. In that studytwo models were tested, Bayesian Lasso [95] and ridge regression best linear unbiasedprediction (rrBLUB) [96,97], providing similar results. Genomic prediction of grain yield inthree European sites with contrasting climate (Mediterranean, subcontinental or oceanic)displayed relatively high intra-environment (up to 0.71) and cross-environment (up to 0.51)predictive abilities, providing economic justification for genomic selection strategy in whitelupin breeding [11].
3.4. Concluding Remarks
This study provided novel evidence for quantitative control of flowering time inwhite lupin by supporting all major QTLs derived from mapping population studiesas well as designating new candidate genes from major molecular pathways regulatingflowering induction in plants. A very high majority of markers revealed an associationof a Kiev Mutant allele with accelerated flowering, indicating that desired alleles havebeen already introduced into domesticated germplasm. Nevertheless, two importantcomponents of flowering regulatory network, PIF4 and LD, showed an opposite association,opening up the development potential for white lupin breeders. Taking into considerationthe results of studies obtained for other legume species, such as narrow-leafed lupin orsoybean [34,79,98], resequencing of candidate genes in wider germplasm background,including also promoter regions, could be valuable by providing novel alleles conferringearly or intermediate phenology.
4. Materials and Methods4.1. Plant Material
The set of 160 L. albus lines, derived from the European Lupin Gene ResourcesDatabase maintained by Poznan Plant Breeders Ltd. station located in Wiatrowo as wellas from the National Centre for Plant Genetic Resources: Polish Genebank, Plant Breed-ing and Acclimatization Institute–National Research Institute, Radzików, 05–870 Błonie,Poland, was used in the study. This germplasm collection contained 63 wild or primitivepopulations, 51 landraces, 31 cultivars, 12 cross derivatives and three mutants. These linesoriginated from 23 countries. The information on germplasm donor, country of origin anddomestication status was provided in Supplementary Table S1.
Int. J. Mol. Sci. 2021, 22, 3856 12 of 19
4.2. Profiling of Time to Flowering and Vernalization Responsiveness in Controlled Environment
Phenotyping experiments were performed in a greenhouse located at the Institute ofPlant Genetics, Polish Academy of Sciences, Poznan, Poland (52◦26′ N 16◦54′ E) duringgrowing seasons of 2015 (sowing date 10.04), 2018 (sowing date 22.03) and 2020 (sowingdate 19.03) under ambient long day photoperiod (12–17 h). To randomize greenhouse-related effects between years and lines, the experiment was performed every year in adifferent greenhouse and in a different design (Supplementary Figure S1). Automaticheating was used to keep the minimum air temperature above 18 ◦C. Cooling was main-tained by temperature-dependent ventilation system (activated at 22 ◦C). Vernalizationwas carried out by placing seeds for 23 days at 5 ◦C in darkness on moist filter paper inPetri dishes. Non-vernalized plants were sown five days before the end of vernalizationperiod and cultivated at ~23 ◦C to keep a similar thermal time [99]. Time to floweringwas recorded as the number of days from sowing of vernalized plants until the first fullycolored petal was developed. Observations were made for each plant separately. Theaverage number of plants with observations in 2015 was 5.1 for non-vernalized variant(min 3, max 9, n = 105) and 4.6 for vernalized variant (min 3, max 8, n = 104), in 2018 itwas 7.9 for non-vernalized variant (min 3, max 10, n = 140) and 9.0 for vernalized variant(min 3, max 10, n = 138) whereas in 2020 it was 8.8 in non-vernalized variant (min 3, max 10,n = 160). Daily mean and maximum air temperature and daily sunshine hours recorded bythe nearby localized meteorological station (Poznan-Ławica, 5.1 km away) and theoreticalphotoperiod hours calculated for this latitude (covering 100 days from sowing date) wereprovided for reference in Supplementary Table S9.
4.3. Development of Molecular Markers for Flowering Time QTLs
PCR-based molecular markers were developed for single nucleotide polymorphisms(SNPs) localized on the white lupin linkage map in the proximity of all major QTLs for flow-ering time. The following QTLs [26,30] were explored: linkage group ALB02 (QTL1, posi-tion around 2.2 cM), ALB02 (QTL2, 100.2/100.5 cM), ALB13 (QTL3, 81.0/84.1 cM and QTL4,96.2/99.3 cM), and ALB16 (QTL5, 0.9/2.2 cM). Genotyping-by-sequencing (GBS) readswhich were previously mapped in these regions, were aligned to transcriptome sequencesof parental lines of L. albus mapping population [26] as well as the reference transcrip-tome of L. albus roots and leaves (https://legumeinfo.org/data/public/Lupinus_albus/(accessed date 7 April 2021), gene index LAGI01) [33]. BLASTn algorithm [100] imple-mented in Geneious v8.1 (Biomatters, New Zealandf) [101] was used for this alignmentwith max 2 mismatches allowed per sequence.
To map intron/exon boundaries, matched transcript sequences were extracted and re-aligned to the genome scaffolds [27] using progressive Mauve algorithm with gapped alignerMUSCLE 3.6 [102,103]. Mauve alignments consisting of GBS reads, Kiev Mutant, P27174and LAGI01 transcripts, and genome scaffolds, were screened for the presence of poly-morphic loci. The primers flanking these loci were designed using Primer3Plus [104,105].Depending on the availability of restriction enzymes, SNPs were transformed the cleavedamplified polymorphic sequence (CAPS) [106] or derived CAPS (dCAPS) [107] mark-ers. Restriction sites and dCAPS primers were identified using dCAPS Finder 2.0 andSNP2dCAPS [108,109].
4.4. Genotyping of White Lupin Germplasm with PCR-Based Markers
The white lupin germplasm collection which was subjected to phenotyping of flower-ing time and vernalization responsiveness, was also genotyped with PCR-based markers.The set of markers included markers for flowering time QTLs developed in this study aswell as previously published markers designed for white lupin homologs of floweringcontrol genes [30] and those developed for the anthracnose resistance QTL localized at thelinkage group ALB02 overlapping with the flowering time QTL1 [29]. Young 5 week-oldleaves were collected from plants cultivated in greenhouse and immediately frozen underliquid nitrogen. Frozen plant tissue (50–100 mg) was homogenized using TissueLyser II
Int. J. Mol. Sci. 2021, 22, 3856 13 of 19
(Qiagen, Hilden, Germany) and two stainless steel beads (ø 5 mm) placed in a 2 mL tube(Eppendorf, Hamburg, Germany). DNA isolation was performed using DNeasy PlantMini Kit (Qiagen). PCR products were amplified using GoTaq G2 Flexi DNA Polymerase(Promega, Mannheim, Germany). Restriction enzyme digestion was performed for 12 h in20 µL of mixture including 5 µL of post-PCR mixture, one unit of enzyme and appropriateamount of water and buffer to reach concentration recommended by the enzyme manufac-turer. Restriction products were separated by agarose gel electrophoresis, with the agaroseconcentration (1–3%) adjusted to follow the size of the expected digestion products. Widerange agarose (Serva, Heidelberg, Germany) was used for most applications, however,markers yielding polymorphic cut products shorter than 100 bp were resolved using highresolution 3:1 agarose (Serva).
The list of markers used in the study with localization on linkage map, QTL assign-ment, accession numbers and sequences of both alleles is provided in SupplementaryTable S4. Information on PCR annealing temperature, polymorphism detection method,expected products and agarose gel concentration is provided in Supplementary Table S5.Two biological replicates were analyzed per line. Kiev Mutant marker alleles were assigned“1”, P27174 marker alleles were assigned “2”, whereas heterozygotes “1.5”. Additionalalleles (different than those observed in Kiev Mutant or P27174) were assigned “C” or “3”.
4.5. Population Structure Analysis
Population structure analysis was performed with LEA R package [110]. Obtainedmarker data were converted to multi-allele geno format using a custom Python script con-verting every allele into a specific character symbol. Next, the optimal number of clusters(k) in the investigated population was determined using admixture analysis [111,112] withsnmf function from the same package. The entropy criterion evaluating the quality fit ofthe statistical model to the data was calculated in 1000 repetitions and 10,000 iterations.The optimal number of clusters was set as k with minimal cross-entropy values [113,114].The ancestry matrix for optimal k = 6 was visualized with the barchar function fromLEA package.
4.6. Statistical Analysis
All statistical analysis were preferred in R software (R Core Team 2013, Vienna, Austria)using base function. Simple regression was used to estimate QTL/marker additive effects.The correlation between alleles in all 50 loci and flowering time was calculated usingSpearman’s rank method [115]. The calculation was made for the whole population andseparately for each cluster obtained by population structure analysis. Homozygote wild(P27174) got rank 3, homozygote cultivated (Kiev Mutant)–rank 1, and heterozygote–rank2. Novel alleles, which occurred only for some markers and few lines, were treated asmissing values. Giving rank 1 or rank 3 for novel alleles had negligible effect on obtainedcorrelation values, highlighted by ~0.99 correlation of the results. The two-way varianceanalysis was performed to test the hypothesis of lack of difference in flowering timebetween clusters obtained in the population structure analysis. The variance model wasgiven by the following formula:
Yijk = µ + αi + β j + εijk
where Yjjk is flowering time of k-th genotype in j-th year and i-th cluster, αi is i-th cluster,βj is j-th year, µ is cluster × year interaction and εijk is the random effect component.The true difference between the mean was tested using Tukey’s ‘Honest Significant Dif-ference’ method [116]. The χ2 test was used to test the hypothesis of lack of differencein allele frequency between clusters, which in ANOVA analysis showed a difference inflowering time.
Int. J. Mol. Sci. 2021, 22, 3856 14 of 19
Supplementary Materials: The following are available online at https://www.mdpi.com/article/10.3390/ijms22083856/s1, Table S1: White lupin lines used in the study, Table S2: Number of days fromsowing to flowering observed for white lupin lines used in the study, Table S3: Mean values andstandard deviation of flowering time observed for white lupin lines used in the study, Table S4: The listof markers used in the study with localization on linkage map, QTL assignment, accession numbersand sequences of both alleles, Table S5: PCR annealing temperature, polymorphism detection method,expected products and agarose gel concentration for markers used in the study, Table S6: Resultsof genotyping of white lupin germplasm collection with PCR-based markers, Table S7: p-values ofSpearman’s rank correlation coefficient calculated for flowering time and marker distribution in whitelupin germplasm collection, Table S8: p-values of Chi-square test of differences in allele frequenciesbetween subpopulations, Table S9: Meteorological conditions recorded by the nearby localizedmeteorological station (Poznan-Ławica, 5.1 km) and theoretical photoperiod hours calculated forthis latitude (covering 100 days from sowing date). Figure S1. Orientation of greenhouses andarrangement of tables in plant phenotyping experiments.
Author Contributions: Conceptualization, M.K., R.G. and S.R.-B.; methodology, S.R.-B., A.S. andW.B.; software, B.K.; validation, B.K., M.K. and S.R.-B.; formal analysis, B.K. and M.K.; investigation,S.R.-B., A.S. and W.B.; resources, M.K. and S.R.-B.; data curation, B.K. and M.K.; writing—originaldraft preparation, M.K.; writing—review and editing, S.R.-B., R.G., B.K. and M.K.; supervision, M.K.and S.R.-B.; project administration, S.R.-B.; funding acquisition, S.R.-B. All authors have read andagreed to the published version of the manuscript.
Funding: This research was funded by the Polish National Science Centre, grant number 2019/32/C/NZ9/00055. The APC was funded by the Wroclaw University of Environmental and Life Sciences,Wrocław, Poland and by the Polish National Science Centre.
Institutional Review Board Statement: Not applicable.
Informed Consent Statement: Not applicable.
Data Availability Statement: All data generated in this study are included in this published articleand its supplementary information files.
Acknowledgments: Authors thank Magdalena Tomaszewska from Legume Genomics Team of theInstitute of Plant Genetics, Polish Academy of Sciences for help in plant sowing and leaf sampling.
Conflicts of Interest: The authors declare no conflict of interest. The funders had no role in the designof the study; in the collection, analyses, or interpretation of data; in the writing of the manuscript, orin the decision to publish the results.
References1. Gladstones, J.S. Lupins as crop plants. Field Crop Abstr. 1970, 23, 26.2. Lambers, H.; Clements, J.C.; Nelson, M.N. How a phosphorus-acquisition strategy based on carboxylate exudation powers the
success and agronomic potential of lupines (Lupinus, Fabaceae). Am. J. Bot. 2013, 100, 263–288. [CrossRef]3. Watt, M.; Evans, J.R. Phosphorus acquisition from soil by white lupin (Lupinus albus L.) and soybean (Glycine max L.), species
with contrasting root development. Plant Soil 2003, 248, 271–283. [CrossRef]4. Schulze, J.; Temple, G.; Temple, S.J.; Beschow, H.; Vance, C.P. Nitrogen fixation by white lupin under phosphorus deficiency. Ann.
Bot. 2006, 98, 731–740. [CrossRef] [PubMed]5. Papineau, J.; Huyghe, C. Le Lupin Doux Protéagineux; France Agricole: Paris, France, 2004; p. 176.6. Annicchiarico, P.; Manunza, P.; Arnoldi, A.; Boschin, G. Quality of Lupinus albus L. (white lupin) seed: Extent of genotypic and
environmental effects. J. Agric. Food Chem. 2014, 62, 6539–6545. [CrossRef]7. Boschin, G.; D’Agostina, A.; Annicchiarico, P.; Arnoldi, A. The fatty acid composition of the oil from Lupinus albus cv. Luxe as
affected by environmental and agricultural factors. Eur. Food Res. Technol. 2007, 225, 769–776. [CrossRef]8. Arnoldi, A.; Greco, S. Nutritional and nutraceutical characteristics of lupin protein. Nutrafoods 2011, 10, 23–29. [CrossRef]9. Kroc, M.; Rybinski, W.; Wilczura, P.; Kamel, K.A.; Kaczmarek, Z.; Barzyk, P.; Swiecicki, W. Quantitative and qualitative analysis of
alkaloids composition in the seeds of a white lupin (Lupinus albus L.) collection. Genet. Resour. Crop Evol. 2017, 64, 1853–1860.[CrossRef]
10. Annicchiarico, P.; Nazzicari, N.; Ferrari, B. Genetic and genomic resources in white lupin and the application of genomic selection.In The Lupin Genome; Singh, K.B., Kamphuis, L.G., Nelson, M.N., Eds.; Springer International Publishing: Cham, Switzerland,2020; pp. 139–149.
11. Annicchiarico, P.; Nazzicari, N.; Ferrari, B.; Harzic, N.; Carroni, A.M.; Romani, M.; Pecetti, L. Genomic prediction of grain yield incontrasting environments for white lupin genetic resources. Mol. Breed. 2019, 39, 142. [CrossRef]
Int. J. Mol. Sci. 2021, 22, 3856 15 of 19
12. Annicchiarico, P.; Romani, M.; Pecetti, L. White lupin (Lupinus albus) variation for adaptation to severe drought stress. Plant Breed.2018, 137, 782–789. [CrossRef]
13. Annicchiarico, P.; Harzic, N.; Carroni, A.M. Adaptation, diversity, and exploitation of global white lupin (Lupinus albus L.)landrace genetic resources. Field Crops Res. 2010, 119, 114–124. [CrossRef]
14. Gladstones, J.S. The Mediterranean white lupin. J. Dep. Agric. West. Aust. Ser. 4 1976, 17, 70–74.15. Adhikari, K.N.; Buirchell, B.J.; Sweetingham, M.W. Length of vernalization period affects flowering time in three lupin species.
Plant Breed. 2012, 131, 631–636. [CrossRef]16. Weimer, J.L. Anthracnose of lupines. Phytopathology 1943, 33, 249–252.17. Talhinhas, P.; Baroncelli, R.; Floch, G.L. Anthracnose of lupins caused by Colletotrichum lupini: A recent disease and a successful
worldwide pathogen. J. Plant Pathol. 2016, 98, 5–14.18. Frencel, I.M. Report on first detection of anthracnose (Colletotrichum gloeosporioides) on lupins in Poland. Plant Dis. 1998, 82, 350.
[CrossRef]19. Gondran, J.; Bateman, G.L.; Milford, G.F.J.; Bayer, J.; Beerepoot, L.; Boller, B.; Caligari, P.D.S.; Carrasco-Lopez, J.M.; Crowley, J.G.;
da Rocha, J.J.P.; et al. Anthracnose of white lupin (Lupinus albus): European prospects for a future sustainable crop. In Towards the21st Century. Proceedings of the 8th International Lupin Conference; Hill, G.D., Ed.; International Lupin Association: Asilomar, CA,USA, 1996; pp. 512–518.
20. Thomas, G.J.; Sweetingham, M.W. Cultivar and environment influence the development of lupin anthracnose caused byColletotrichum lupini. Australas. Plant Path. 2004, 33, 571–577. [CrossRef]
21. Sweetingham, M.W.; Frencel, I.; Buirchell, B.J.; Barzyk, P.; Lewartowska, E.; Yang, H.A.; Ponomaryova, L.; Yakasheva, A.;Adhikari, K.N.; Francis, C.M.; et al. Collaborative anthracnose resistance screening in Poland, Russia and Australia. México,where old and new world lupins meet. In Proceedings of the 11th International Lupin Conference, Guadalajara, Mexico, 4–9 May2005; International Lupin Association: Canterbury, New Zealand, 2006.
22. Adhikari, K.N.; Buirchell, B.J.; Thomas, G.J.; Sweetingham, M.W.; Yang, H. Identification of anthracnose resistance in Lupinusalbus L. and its transfer from landraces to modern cultivars. Crop Pasture Sci. 2009, 60, 472–479. [CrossRef]
23. Atnaf, M.; Yao, N.; Martina, K.; Dagne, K.; Wegary, D.; Tesfaye, K. Molecular genetic diversity and population structure ofEthiopian white lupin landraces: Implications for breeding and conservation. PLoS ONE 2017, 12, e0188696. [CrossRef]
24. Phan, H.T.T.; Ellwood, S.R.; Adhikari, K.; Nelson, M.N.; Oliver, R.P. The first genetic and comparative map of white lupin (Lupinusalbus L.): Identification of QTLs for anthracnose resistance and flowering time, and a locus for alkaloid content. DNA Res. 2007,14, 59–70. [CrossRef]
25. Vipin, C.A.; Luckett, D.J.; Harper, J.D.I.; Ash, G.J.; Kilian, A.; Ellwood, S.R.; Phan, H.T.T.; Raman, H. Construction of integratedlinkage map of a recombinant inbred line population of white lupin (Lupinus albus L.). Breed. Sci. 2013, 63, 292–300. [CrossRef][PubMed]
26. Ksiazkiewicz, M.; Nazzicari, N.; Yang, H.; Nelson, M.N.; Renshaw, D.; Rychel, S.; Ferrari, B.; Carelli, M.; Tomaszewska, M.;Stawinski, S.; et al. A high-density consensus linkage map of white lupin highlights synteny with narrow-leafed lupin andprovides markers tagging key agronomic traits. Sci. Rep. 2017, 7, 15335. [CrossRef]
27. Hufnagel, B.; Marques, A.; Soriano, A.; Marquès, L.; Divol, F.; Doumas, P.; Sallet, E.; Mancinotti, D.; Carrere, S.; Marande, W.; et al.High-quality genome sequence of white lupin provides insight into soil exploration and seed quality. Nat. Commun. 2020, 11, 492.[CrossRef] [PubMed]
28. Xu, W.; Zhang, Q.; Yuan, W.; Xu, F.; Muhammad Aslam, M.; Miao, R.; Li, Y.; Wang, Q.; Li, X.; Zhang, X.; et al. The genomeevolution and low-phosphorus adaptation in white lupin. Nat. Commun. 2020, 11, 1069. [CrossRef] [PubMed]
29. Rychel-Bielska, S.; Nazzicari, N.; Plewinski, P.; Bielski, W.; Annicchiarico, P.; Ksiazkiewicz, M. Development of PCR-basedmarkers and whole-genome selection model for anthracnose resistance in white lupin (Lupinus albus L.). J. Appl. Genet. 2020, 61,531–545. [CrossRef]
30. Rychel, S.; Ksiazkiewicz, M.; Tomaszewska, M.; Bielski, W.; Wolko, B. FLOWERING LOCUS T, GIGANTEA, SEPALLATA andFRIGIDA homologs are candidate genes involved in white lupin (Lupinus albus L.) early flowering. Mol. Breed. 2019, 39, 43.[CrossRef]
31. Rychel, S.; Ksiazkiewicz, M. Development of gene-based molecular markers tagging low alkaloid pauper locus in white lupin(Lupinus albus L.). J. Appl. Genet. 2019, 60, 269–281. [CrossRef] [PubMed]
32. Adhikari, K.N.; Thomas, G.; Diepeveen, D.; Trethowan, R. Overcoming the barriers of combining early flowering and anthracnoseresistance in white lupin (Lupinus albus L.) for the Northern Agricultural Region of Western Australia. Crop Pasture Sci. 2013, 64,914–921. [CrossRef]
33. O’Rourke, J.A.; Yang, S.S.; Miller, S.S.; Bucciarelli, B.; Liu, J.; Rydeen, A.; Bozsoki, Z.; Uhde-Stone, C.; Tu, Z.J.; Allan, D.; et al. AnRNA-Seq transcriptome analysis of orthophosphate-deficient white lupin reveals novel insights into phosphorus acclimation inplants. Plant Physiol. 2013, 161, 705–724. [CrossRef]
34. Nelson, M.N.; Ksiazkiewicz, M.; Rychel, S.; Besharat, N.; Taylor, C.M.; Wyrwa, K.; Jost, R.; Erskine, W.; Cowling, W.A.; Berger, J.D.;et al. The loss of vernalization requirement in narrow-leafed lupin is associated with a deletion in the promoter and de-repressedexpression of a Flowering Locus T (FT) homologue. New Phytol. 2017, 213, 220–232. [CrossRef]
Int. J. Mol. Sci. 2021, 22, 3856 16 of 19
35. Plewinski, P.; Cwiek-Kupczynska, H.; Rudy, E.; Bielski, W.; Rychel-Bielska, S.; Stawinski, S.; Barzyk, P.; Krajewski, P.; Naganowska,B.; Wolko, B.; et al. Innovative transcriptome-based genotyping highlights environmentally responsive genes for phenology,growth and yield in a non-model grain legume. Plant Cell Environ. 2020, 43, 2680–2698. [CrossRef]
36. Zhang, J.; Song, Q.; Cregan, P.B.; Nelson, R.L.; Wang, X.; Wu, J.; Jiang, G.-L. Genome-wide association study for flowering time,maturity dates and plant height in early maturing soybean (Glycine max) germplasm. BMC Genom. 2015, 16, 217. [CrossRef][PubMed]
37. Ho, W.W.; Weigel, D. Structural features determining flower-promoting activity of Arabidopsis FLOWERING LOCUS T. Plant Cell2014, 26, 552–564. [CrossRef] [PubMed]
38. Cao, S.; Kumimoto, R.W.; Gnesutta, N.; Calogero, A.M.; Mantovani, R.; Holt, B.F., 3rd. A distal CCAAT/NUCLEAR FACTOR Ycomplex promotes chromatin looping at the FLOWERING LOCUS T promoter and regulates the timing of flowering in Arabidopsis.Plant Cell 2014, 26, 1009–1017. [CrossRef] [PubMed]
39. Liu, L.; Adrian, J.; Pankin, A.; Hu, J.; Dong, X.; von Korff, M.; Turck, F. Induced and natural variation of promoter lengthmodulates the photoperiodic response of FLOWERING LOCUS T. Nat. Commun. 2014, 5, 4558. [CrossRef]
40. Turck, F.; Fornara, F.; Coupland, G. Regulation and identity of florigen: FLOWERING LOCUS T moves center stage. Annu. Rev.Plant Biol. 2008, 59, 573–594. [CrossRef]
41. Mikołajczyk, J. Genetic studies in Lupinus angustifolius. Part. III. Inheritance of the alkaloid content, seed hardness and length ofthe growing season in blue lupin. Genet. Pol. 1966, 7, 181–196.
42. Gladstones, J.; Hill, G. Selection for economic characters in Lupinus angustifolius and L. digitatus. 2. Time of flowering. Aust. J. Exp.Agric. 1969, 9, 213–220. [CrossRef]
43. Ksiazkiewicz, M.; Rychel, S.; Nelson, M.N.; Wyrwa, K.; Naganowska, B.; Wolko, B. Expansion of the phosphatidylethanolaminebinding protein family in legumes: A case study of Lupinus angustifolius L. FLOWERING LOCUS T homologs, LanFTc1 andLanFTc2. BMC Genom. 2016, 17, 820. [CrossRef]
44. Taylor, C.M.; Kamphuis, L.G.; Zhang, W.; Garg, G.; Berger, J.D.; Mousavi-Derazmahalleh, M.; Bayer, P.E.; Edwards, D.; Singh,K.B.; Cowling, W.A.; et al. INDEL variation in the regulatory region of the major flowering time gene LanFTc1 is associated withvernalization response and flowering time in narrow-leafed lupin (Lupinus angustifolius L.). Plant Cell Environ. 2019, 42, 174–187.[CrossRef] [PubMed]
45. Rychel-Bielska, S.; Plewinski, P.; Kozak, B.; Galek, R.; Ksiazkiewicz, M. Photoperiod and vernalization control of flowering-relatedgenes: A case study of the narrow-leafed lupin (Lupinus angustifolius L.). Front. Plant Sci. 2020, 11, 572135. [CrossRef]
46. Iqbal, M.M.; Erskine, W.; Berger, J.D.; Nelson, M.N. Phenotypic characterisation and linkage mapping of domestication syndrometraits in yellow lupin (Lupinus luteus L.). Theor. Appl. Genet. 2020, 133, 2975–2987. [CrossRef] [PubMed]
47. Iqbal, M.M.; Huynh, M.; Udall, J.A.; Kilian, A.; Adhikari, K.N.; Berger, J.D.; Erskine, W.; Nelson, M.N. The first genetic map foryellow lupin enables genetic dissection of adaptation traits in an orphan grain legume crop. BMC Genet. 2019, 20, 68. [CrossRef][PubMed]
48. Lichtin, N.; Salvo-Garrido, H.; Till, B.; Caligari, P.D.S.; Rupayan, A.; Westermeyer, F.; Olivos, M. Genetic and comparativemapping of Lupinus luteus L. highlight syntenic regions with major orthologous genes controlling anthracnose resistance andflowering time. Sci. Rep. 2020, 10, 19174. [CrossRef] [PubMed]
49. Laurie, R.E.; Diwadkar, P.; Jaudal, M.; Zhang, L.; Hecht, V.; Wen, J.; Tadege, M.; Mysore, K.S.; Putterill, J.; Weller, J.L.; et al. TheMedicago FLOWERING LOCUS T homolog, MtFTa1, is a key regulator of flowering time. Plant Physiol. 2011, 156, 2207–2224.[CrossRef] [PubMed]
50. Hecht, V.; Laurie, R.E.; Vander Schoor, J.K.; Ridge, S.; Knowles, C.L.; Liew, L.C.; Sussmilch, F.C.; Murfet, I.C.; Macknight, R.C.;Weller, J.L. The pea GIGAS gene is a FLOWERING LOCUS T homolog necessary for graft-transmissible specification of floweringbut not for responsiveness to photoperiod. Plant Cell 2011, 23, 147–161. [CrossRef]
51. Thomson, G.; Taylor, J.; Putterill, J. The transcriptomic response to a short day to long day shift in leaves of the reference legumeMedicago truncatula. PeerJ 2019, 7, e6626. [CrossRef]
52. Kong, F.; Liu, B.; Xia, Z.; Sato, S.; Kim, B.M.; Watanabe, S.; Yamada, T.; Tabata, S.; Kanazawa, A.; Harada, K.; et al. Twocoordinately regulated homologs of FLOWERING LOCUS T are involved in the control of photoperiodic flowering in soybean.Plant Physiol. 2010, 154, 1220–1231. [CrossRef]
53. Takeshima, R.; Hayashi, T.; Zhu, J.; Zhao, C.; Xu, M.; Yamaguchi, N.; Sayama, T.; Ishimoto, M.; Kong, L.; Shi, X.; et al. A soybeanquantitative trait locus that promotes flowering under long days is identified as FT5a, a FLOWERING LOCUS T ortholog. J. Exp.Bot. 2016, 67, 5247–5258. [CrossRef]
54. Chen, L.; Cai, Y.; Qu, M.; Wang, L.; Sun, H.; Jiang, B.; Wu, T.; Liu, L.; Sun, S.; Wu, C.; et al. Soybean adaption to high-latituderegions is associated with natural variations of GmFT2b, an ortholog of FLOWERING LOCUS T. Plant Cell Environ. 2020, 43,934–944. [CrossRef]
55. Liu, W.; Jiang, B.; Ma, L.; Zhang, S.; Zhai, H.; Xu, X.; Hou, W.; Xia, Z.; Wu, C.; Sun, S.; et al. Functional diversification of FloweringLocus T homologs in soybean: GmFT1a and GmFT2a/5a have opposite roles in controlling flowering and maturation. New Phytol.2018, 217, 1335–1345. [CrossRef]
56. Ortega, R.; Hecht, V.F.G.; Freeman, J.S.; Rubio, J.; Carrasquilla-Garcia, N.; Mir, R.R.; Penmetsa, R.V.; Cook, D.R.; Millan, T.; Weller,J.L. Altered expression of an FT cluster underlies a major locus controlling domestication-related changes to chickpea phenologyand growth habit. Front. Plant Sci. 2019, 10, 824. [CrossRef]
Int. J. Mol. Sci. 2021, 22, 3856 17 of 19
57. Samineni, S.; Kamatam, S.; Thudi, M.; Varshney, R.K.; Gaur, P.M. Vernalization response in chickpea is controlled by a major QTL.Euphytica 2016, 207, 453–461. [CrossRef]
58. Valverde, F.; Mouradov, A.; Soppe, W.; Ravenscroft, D.; Samach, A.; Coupland, G. Photoreceptor regulation of CONSTANSprotein in photoperiodic flowering. Science 2004, 303, 1003–1006. [CrossRef]
59. Valverde, F. CONSTANS and the evolutionary origin of photoperiodic timing of flowering. J. Exp. Bot. 2011, 62, 2453–2463.[CrossRef] [PubMed]
60. Pierre, J.B.; Huguet, T.; Barre, P.; Huyghe, C.; Julier, B. Detection of QTLs for flowering date in three mapping populations of themodel legume species Medicago truncatula. Theor. Appl. Genet. 2008, 117, 609–620. [CrossRef] [PubMed]
61. Pierre, J.-B.; Bogard, M.; Herrmann, D.; Huyghe, C.; Julier, B. A CONSTANS-like gene candidate that could explain most of thegenetic variation for flowering date in Medicago truncatula. Mol. Breed. 2011, 28, 25–35. [CrossRef]
62. Herrmann, D.; Barre, P.; Santoni, S.; Julier, B. Association of a CONSTANS-LIKE gene to flowering and height in autotetraploidalfalfa. Theor. Appl. Genet. 2010, 121, 865–876. [CrossRef] [PubMed]
63. Chou, M.L.; Yang, C.H. Late-flowering genes interact with early-flowering genes to regulate flowering time in Arabidopsis thaliana.Plant Cell Physiol. 1999, 40, 702–708. [CrossRef]
64. Upadhyaya, H.D.; Bajaj, D.; Das, S.; Saxena, M.S.; Badoni, S.; Kumar, V.; Tripathi, S.; Gowda, C.L.; Sharma, S.; Tyagi, A.K.; et al. Agenome-scale integrated approach aids in genetic dissection of complex flowering time trait in chickpea. Plant Mol. Biol. 2015, 89,403–420. [CrossRef]
65. He, Y.; Michaels, S.D.; Amasino, R.M. Regulation of flowering time by histone acetylation in Arabidopsis. Science 2003, 302,1751–1754. [CrossRef] [PubMed]
66. Mouradov, A.; Cremer, F.; Coupland, G. Control of flowering time. Plant Cell 2002, 14, S111. [CrossRef] [PubMed]67. Hu, Q.; Jin, Y.; Shi, H.; Yang, W. GmFLD, a soybean homolog of the autonomous pathway gene FLOWERING LOCUS D, promotes
flowering in Arabidopsis thaliana. BMC Plant Biol. 2014, 14, 263. [CrossRef] [PubMed]68. Johanson, U.; West, J.; Lister, C.; Michaels, S.; Amasino, R.; Dean, C. Molecular analysis of FRIGIDA, a major determinant of
natural variation in Arabidopsis flowering time. Science 2000, 290, 344–347. [CrossRef]69. Shindo, C.; Aranzana, M.J.; Lister, C.; Baxter, C.; Nicholls, C.; Nordborg, M.; Dean, C. Role of FRIGIDA and FLOWERING LOCUS
C in determining variation in flowering time of Arabidopsis. Plant Physiol. 2005, 138, 1163–1173. [CrossRef]70. Li, Z.; Jiang, D.; He, Y. FRIGIDA establishes a local chromosomal environment for FLOWERING LOCUS C mRNA production.
Nat. Plants 2018, 4, 836–846. [CrossRef]71. Hecht, V.; Foucher, F.; Ferrandiz, C.; Macknight, R.; Navarro, C.; Morin, J.; Vardy, M.E.; Ellis, N.; Beltran, J.P.; Rameau, C.; et al.
Conservation of Arabidopsis flowering genes in model legumes. Plant Physiol. 2005, 137, 1420–1434. [CrossRef]72. Lyu, J.; Cai, Z.; Li, Y.; Suo, H.; Yi, R.; Zhang, S.; Nian, H. The floral repressor GmFLC-like is involved in regulating flowering time
mediated by low temperature in soybean. Int. J. Mol. Sci. 2020, 21, 1322. [CrossRef]73. Li, M.; Liu, Y.; Tao, Y.; Xu, C.; Li, X.; Zhang, X.; Han, Y.; Yang, X.; Sun, J.; Li, W.; et al. Identification of genetic loci and candidate
genes related to soybean flowering through genome wide association study. BMC Genom. 2019, 20, 987. [CrossRef] [PubMed]74. Michaels, S.D.; Bezerra, I.C.; Amasino, R.M. FRIGIDA-related genes are required for the winter-annual habit in Arabidopsis. Proc.
Natl. Acad. Sci. USA 2004, 101, 3281–3285. [CrossRef]75. Zhang, H.; Ransom, C.; Ludwig, P.; van Nocker, S. Genetic analysis of early flowering mutants in Arabidopsis defines a class of
pleiotropic developmental regulator required for expression of the flowering-time switch FLOWERING LOCUS C. Genetics 2003,164, 347–358.
76. Wang, X.; Wu, F.; Xie, Q.; Wang, H.; Wang, Y.; Yue, Y.; Gahura, O.; Ma, S.; Liu, L.; Cao, Y.; et al. SKIP is a component of thespliceosome linking alternative splicing and the circadian clock in Arabidopsis. Plant Cell 2012, 24, 3278–3295. [CrossRef] [PubMed]
77. Li, Y.; Yang, J.; Shang, X.; Lv, W.; Xia, C.; Wang, C.; Feng, J.; Cao, Y.; He, H.; Li, L.; et al. SKIP regulates environmental fitness andfloral transition by forming two distinct complexes in Arabidopsis. New Phytol. 2019, 224, 321–335. [CrossRef] [PubMed]
78. Cui, Z.; Tong, A.; Huo, Y.; Yan, Z.; Yang, W.; Yang, X.; Wang, X.-X. SKIP controls flowering time via the alternative splicing of SEFpre-mRNA in Arabidopsis. BMC Biol. 2017, 15, 80. [CrossRef] [PubMed]
79. Zhao, L.; Li, M.; Xu, C.; Yang, X.; Li, D.; Zhao, X.; Wang, K.; Li, Y.; Zhang, X.; Liu, L.; et al. Natural variation in GmGBP1 promoteraffects photoperiod control of flowering time and maturity in soybean. Plant J. 2018, 96, 147–162. [CrossRef] [PubMed]
80. Zhang, Y.; Zhao, L.; Li, H.; Gao, Y.; Li, Y.; Wu, X.; Teng, W.; Han, Y.; Zhao, X.; Li, W. GmGBP1, a homolog of human ski interactingprotein in soybean, regulates flowering and stress tolerance in Arabidopsis. BMC Plant Biol. 2013, 13, 21. [CrossRef]
81. Brock, M.T.; Maloof, J.N.; Weinig, C. Genes underlying quantitative variation in ecologically important traits: PIF4 (phytochromeinteracting factor 4) is associated with variation in internode length, flowering time, and fruit set in Arabidopsis thaliana. Mol. Ecol.2010, 19, 1187–1199. [CrossRef] [PubMed]
82. Kumar, S.V.; Lucyshyn, D.; Jaeger, K.E.; Alós, E.; Alvey, E.; Harberd, N.P.; Wigge, P.A. Transcription factor PIF4 controls thethermosensory activation of flowering. Nature 2012, 484, 242–245. [CrossRef] [PubMed]
83. Arya, H.; Singh, M.B.; Bhalla, P.L. Genomic and molecular analysis of conserved and unique features of soybean PIF4. Sci. Rep.2018, 8, 12569. [CrossRef]
84. Karlgren, A.; Gyllenstrand, N.; Kallman, T.; Sundstrom, J.F.; Moore, D.; Lascoux, M.; Lagercrantz, U. Evolution of the PEBP genefamily in plants: Functional diversification in seed plant evolution. Plant Physiol. 2011, 156, 1967–1977. [CrossRef]
Int. J. Mol. Sci. 2021, 22, 3856 18 of 19
85. Hedman, H.; Kallman, T.; Lagercrantz, U. Early evolution of the MFT-like gene family in plants. Plant Mol. Biol. 2009, 70, 359–369.[CrossRef] [PubMed]
86. Yoo, S.Y.; Kardailsky, I.; Lee, J.S.; Weigel, D.; Ahn, J.H. Acceleration of flowering by overexpression of MFT (MOTHER OF FTAND TFL1). Mol. Cells 2004, 17, 95–101.
87. Vaistij, F.E.; Barros-Galvão, T.; Cole, A.F.; Gilday, A.D.; He, Z.; Li, Y.; Harvey, D.; Larson, T.R.; Graham, I.A. MOTHER-OF-FT-AND-TFL1 represses seed germination under far-red light by modulating phytohormone responses in Arabidopsis thaliana. Proc.Natl. Acad. Sci. USA 2018, 115, 8442–8447. [CrossRef]
88. Ward, J.K.; Samanta Roy, D.; Chatterjee, I.; Bone, C.R.; Springer, C.J.; Kelly, J.K. Identification of a major QTL that alters floweringtime at elevated [CO2] in Arabidopsis thaliana. PLoS ONE 2012, 7, e49028. [CrossRef] [PubMed]
89. Wei, M.; Xing, Y.; Wang, X.; Ma, H. [Variation of CO2 concentration in solar greenhouse in Northern China]. J. Appl. Ecol. 2003, 14,354–358.
90. Caicedo, A.L.; Stinchcombe, J.R.; Olsen, K.M.; Schmitt, J.; Purugganan, M.D. Epistatic interaction between Arabidopsis FRI andFLC flowering time genes generates a latitudinal cline in a life history trait. Proc. Natl. Acad. Sci. USA 2004, 101, 15670–15675.[CrossRef] [PubMed]
91. Lagunes-Espinoza, L.C.; Huyghe, C.; Papineau, J.; Pacault, D. Effect of genotype and environment on pod wall proportion inwhite lupin: Consequences to seed yield. Aust. J. Agric. Res. 1999, 50, 575–582. [CrossRef]
92. Julier, B.; Huyghe, C.; Papineau, J.; Milford, G.F.J.; Day, J.M.; Billot, C.; Mangin, P. Seed yield and yield stability of determinateand indeterminate autumn-sown white lupins (Lupinus albus) grown at different locations in France and the UK. J. Agric. Sci.1993, 121, 177–186. [CrossRef]
93. Julier, B.; Huyghe, C. Description and model of the architecture of four genotypes of determinate autumn-sown white lupin(Lupinus albus L.) as influenced by location, sowing date and density. Ann. Bot. 1993, 72, 493–501. [CrossRef]
94. Alkemade, J.; Messmer, M.; Arncken, C.; Leska, A.; Annicchiarico, P.; Nazzicari, N.; Ksiazkiewicz, M.; Voegele, R.T.; Finckh, M.;Hohmann, P. A high-throughput phenotyping tool to identify field-relevant anthracnose resistance in white lupin. Plant Dis. 2020.[CrossRef]
95. Park, T.; Casella, G. The Bayesian Lasso. J. Am. Stat. Assoc. 2008, 103, 681–686. [CrossRef]96. Meuwissen, T.H.; Hayes, B.J.; Goddard, M.E. Prediction of total genetic value using genome-wide dense marker maps. Genetics
2001, 157, 1819–1829.97. Searle, S.R.; Casella, G.; McCulloch, C.E. Variance Components; John Wiley & Sons: New York, NY, USA, 2008.98. Jiang, B.; Zhang, S.; Song, W.; Khan, M.A.A.; Sun, S.; Zhang, C.; Wu, T.; Wu, C.; Han, T. Natural variations of FT family genes in
soybean varieties covering a wide range of maturity groups. BMC Genom. 2019, 20, 230. [CrossRef]99. Huyghe, C. Winter growth of autumn-sown white lupin (Lupinus albus L.) main apex growth model. Ann. Bot. 1991, 67, 429–434.
[CrossRef]100. Altschul, S.F.; Gish, W.; Miller, W.; Myers, E.W.; Lipman, D.J. Basic local alignment search tool. J. Mol. Biol. 1990, 215, 403–410.
[CrossRef]101. Kearse, M.; Moir, R.; Wilson, A.; Stones-Havas, S.; Cheung, M.; Sturrock, S.; Buxton, S.; Cooper, A.; Markowitz, S.; Duran, C.; et al.
Geneious Basic: An integrated and extendable desktop software platform for the organization and analysis of sequence data.Bioinformatics 2012, 28, 1647–1649. [CrossRef]
102. Darling, A.C.; Mau, B.; Blattner, F.R.; Perna, N.T. Mauve: Multiple alignment of conserved genomic sequence with rearrangements.Genome Res. 2004, 14, 1394–1403. [CrossRef] [PubMed]
103. Edgar, R.C. MUSCLE: Multiple sequence alignment with high accuracy and high throughput. Nucleic Acids Res. 2004, 32,1792–1797. [CrossRef]
104. Untergasser, A.; Cutcutache, I.; Koressaar, T.; Ye, J.; Faircloth, B.C.; Remm, M.; Rozen, S.G. Primer3–new capabilities and interfaces.Nucleic Acids Res. 2012, 40, e115. [CrossRef] [PubMed]
105. Untergasser, A.; Nijveen, H.; Rao, X.; Bisseling, T.; Geurts, R.; Leunissen, J.A.M. Primer3Plus, an enhanced web interface toPrimer3. Nucleic Acids Res. 2007, 35, W71–W74. [CrossRef]
106. Konieczny, A.; Ausubel, F.M. A procedure for mapping Arabidopsis mutations using co-dominant ecotype-specific PCR-basedmarkers. Plant J. 1993, 4, 403–410. [CrossRef] [PubMed]
107. Neff, M.M.; Neff, J.D.; Chory, J.; Pepper, A.E. dCAPS, a simple technique for the genetic analysis of single nucleotide polymor-phisms: Experimental applications in Arabidopsis thaliana genetics. Plant J. 1998, 14, 387–392. [CrossRef] [PubMed]
108. Neff, M.M.; Turk, E.; Kalishman, M. Web-based primer design for single nucleotide polymorphism analysis. Trends Genet. 2002,18, 613–615. [CrossRef]
109. Thiel, T.; Kota, R.; Grosse, I.; Stein, N.; Graner, A. SNP2CAPS: A SNP and INDEL analysis tool for CAPS marker development.Nucleic Acids Res. 2004, 32, e5. [CrossRef] [PubMed]
110. Frichot, E.; François, O. LEA: An R package for landscape and ecological association studies. Methods Ecol. Evol. 2015, 6, 925–929.[CrossRef]
111. Patterson, N.; Price, A.L.; Reich, D. Population structure and eigenanalysis. PLoS Genet. 2006, 2, e190. [CrossRef] [PubMed]112. Pritchard, J.K.; Stephens, M.; Donnelly, P. Inference of population structure using multilocus genotype data. Genetics 2000, 155,
945–959. [PubMed]

Int. J. Mol. Sci. 2021, 22, 3856 19 of 19
113. Frichot, E.; Mathieu, F.; Trouillon, T.; Bouchard, G.; François, O. Fast and efficient estimation of individual ancestry coefficients.Genetics 2014, 196, 973–983. [CrossRef]
114. Alexander, D.H.; Lange, K. Enhancements to the ADMIXTURE algorithm for individual ancestry estimation. BMC Bioinform.2011, 12, 246. [CrossRef]
115. Kendall, M.G. A New Measure of Rank Correlation. Biometrika 1938, 30, 81–93. [CrossRef]116. Miller, R.G. Normal Univariate Techniques. In Simultaneous Statistical Inference; Springer: New York, NY, USA, 1981; pp. 37–108.