quantifying threats to biodiversity and prioritizing responses
TRANSCRIPT
diversity
Article
Quantifying Threats to Biodiversity and Prioritizing Responses:An Example from Papua New Guinea
Thomas H. White, Jr. 1,*, Patricia Bickley 2, Cory Brown 3, Dave E. Busch 4, Guy Dutson 5, Holly Freifeld 6,Douglas Krofta 7, Sean Lawlor 2, Dan Polhemus 8 and Rachel Rounds 8
�����������������
Citation: White, T.H., Jr.; Bickley, P.;
Brown, C.; Busch, D.E.; Dutson, G.;
Freifeld, H.; Krofta, D.; Lawlor, S.;
Polhemus, D.; Rounds, R.
Quantifying Threats to Biodiversity
and Prioritizing Responses: An
Example from Papua New Guinea.
Diversity 2021, 13, 248. https://
doi.org/10.3390/d13060248
Academic Editors: Michael Wink and
Karl Cottenie
Received: 23 April 2021
Accepted: 28 May 2021
Published: 4 June 2021
Publisher’s Note: MDPI stays neutral
with regard to jurisdictional claims in
published maps and institutional affil-
iations.
Copyright: © 2021 by the authors.
Licensee MDPI, Basel, Switzerland.
This article is an open access article
distributed under the terms and
conditions of the Creative Commons
Attribution (CC BY) license (https://
creativecommons.org/licenses/by/
4.0/).
1 Puerto Rican Parrot Recovery Program, United States Fish and Wildlife Service, Rio Grande, PR 00745, USA2 United States Department of Interior—International Technical Assistance Program, Washington, DC 20240,
USA; [email protected] (P.B.); [email protected] (S.L.)3 Division of International Affairs, United States Fish and Wildlife Service, Washington, DC 20011, USA;
[email protected] College of Agricultural, Human and Natural Resources Sciences, Washington State University, Vancouver,
WA 99164, USA; [email protected] Biodiversity Solutions—Australia, Ocean Grove, VIC 3221, Australia; [email protected] United States Fish and Wildlife Service-Pacific Region, Portland, OR 97232, USA; [email protected] Branch of Listing Policy & Support, United States Fish and Wildlife Service (Retired), Washington, DC 22041,
USA; [email protected] United States Fish and Wildlife Service-Pacific Islands Office, Honolulu, HI 96822, USA;
[email protected] (D.P.); [email protected] (R.R.)* Correspondence: [email protected]
Abstract: Accurately identifying threats to global biodiversity is the first step towards effectivelycountering or ameliorating them. However, such threats are usually only qualitatively categorized,without any comparative quantitative assessment of threat levels either within or across ecosystems.As part of recent efforts in Papua New Guinea to develop a long-term strategic plan for reducingthreats to biodiversity at the national level, we developed a novel and quantitative method for notonly assessing relative effects of specific biodiversity threats across multiple ecosystems, but alsoidentifying and prioritizing conservation actions best suited for countering identified threats. Todo so, we used an abbreviated quantitative SWOT (Strengths, Weaknesses, Opportunities, Threats)analysis and multivariate cluster analysis to identify the most significant threats to biodiversity inPapua New Guinea. Of 27 specific threats identified, there were nine major threats (each >5% of total)which accounted for approximately 72% of the total quantified biodiversity threat in Papua NewGuinea. We then used the information to identify underlying crosscutting threat drivers and specificconservation actions that would have the greatest probability of reducing biodiversity threats acrossmultiple ecosystem realms. We categorized recommended actions within three strategic categories;with actions within each category targeting two different spatial scales. Our integrated quantitativeapproach to identifying and addressing biodiversity threats is intuitive, comprehensive, repeatableand computationally simple. Analyses of this nature can be invaluable for avoiding not only wastedresources, but also ineffective measures for conserving biodiversity.
Keywords: Papua New Guinea; biodiversity; threats; conservation; SWOT analysis; ecosystem;planning; resources; prioritization
1. Introduction
The island of New Guinea (comprised of West Papua and Papua New Guinea) is thelargest tropical island in the world, with a total land area of approximately 785,750 km2.Due mainly to its great elevation range (sea-level to 4500 m ASL), combined with a tropicalclimate and diverse topography and geologic origins, Papua New Guinea (hereafter, PNG)harbors diverse and unique life zones and forested habitats not found elsewhere in thePacific Islands [1–4] (Figures 1 and 2). After the Amazon and Congo basins, the forests
Diversity 2021, 13, 248. https://doi.org/10.3390/d13060248 https://www.mdpi.com/journal/diversity
Diversity 2021, 13, 248 2 of 19
of PNG comprise the third largest expanse of tropical forest in the world and are interna-tionally recognized for their high biodiversity and ecological importance, both locally andglobally [5–7]. Indeed, some areas of PNG (i.e., the islands of the Bismarck Archipelago)are currently classified as part of a global “biodiversity hotspot” ([8,9]. Host to one of therichest assemblages of vertebrates on Earth, the forests of PNG harbor at least 1786 speciesof birds, mammals, reptiles, and amphibians [7]—over 5 percent of the world’s total—withmany yet undiscovered and undescribed. Covering nearly 282,000 km2 and 80 percent ofthe land mass of PNG [7], these forests have in recent decades come under increasing pres-sure from logging activities, agroforestry-related land clearing, mining activities, oil andgas development, and increasing subsistence agriculture arising from a rapidly increasinghuman population [4–11].
Diversity 2021, 13, x FOR PEER REVIEW 2 of 21
the Pacific Islands [1–4] (Figures 1 and 2). After the Amazon and Congo basins, the forests of PNG comprise the third largest expanse of tropical forest in the world and are interna-tionally recognized for their high biodiversity and ecological importance, both locally and globally [5–7]. Indeed, some areas of PNG (i.e., the islands of the Bismarck Archipelago) are currently classified as part of a global “biodiversity hotspot” ([8,9]. Host to one of the richest assemblages of vertebrates on Earth, the forests of PNG harbor at least 1786 species of birds, mammals, reptiles, and amphibians [7]—over 5 percent of the world’s total—with many yet undiscovered and undescribed. Covering nearly 282,000 km2 and 80 per-cent of the land mass of PNG [7], these forests have in recent decades come under increas-ing pressure from logging activities, agroforestry-related land clearing, mining activities, oil and gas development, and increasing subsistence agriculture arising from a rapidly increasing human population [4–11].
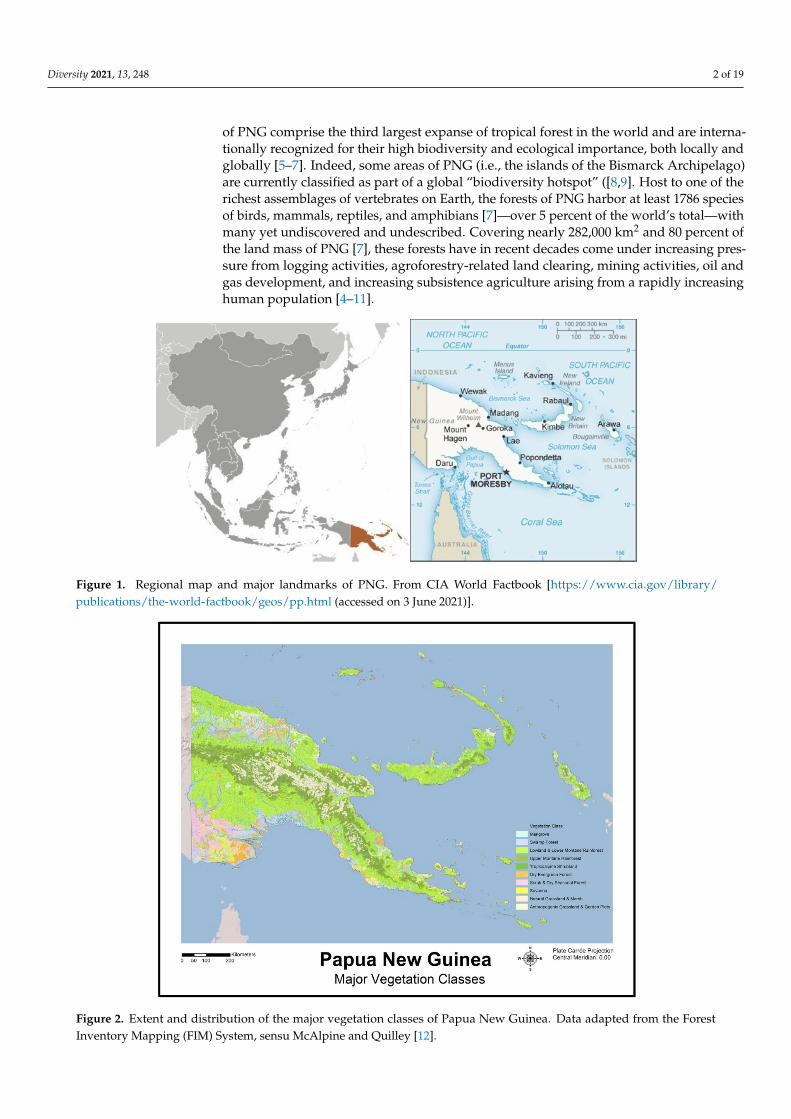
Figure 1. Regional map and major landmarks of PNG. From CIA World Factbook [https://www.cia.gov/library/publications/the-world-factbook/geos/pp.html (accessed on 3 June 2021].
Figure 1. Regional map and major landmarks of PNG. From CIA World Factbook [https://www.cia.gov/library/publications/the-world-factbook/geos/pp.html (accessed on 3 June 2021)].
Diversity 2021, 13, x FOR PEER REVIEW 3 of 21
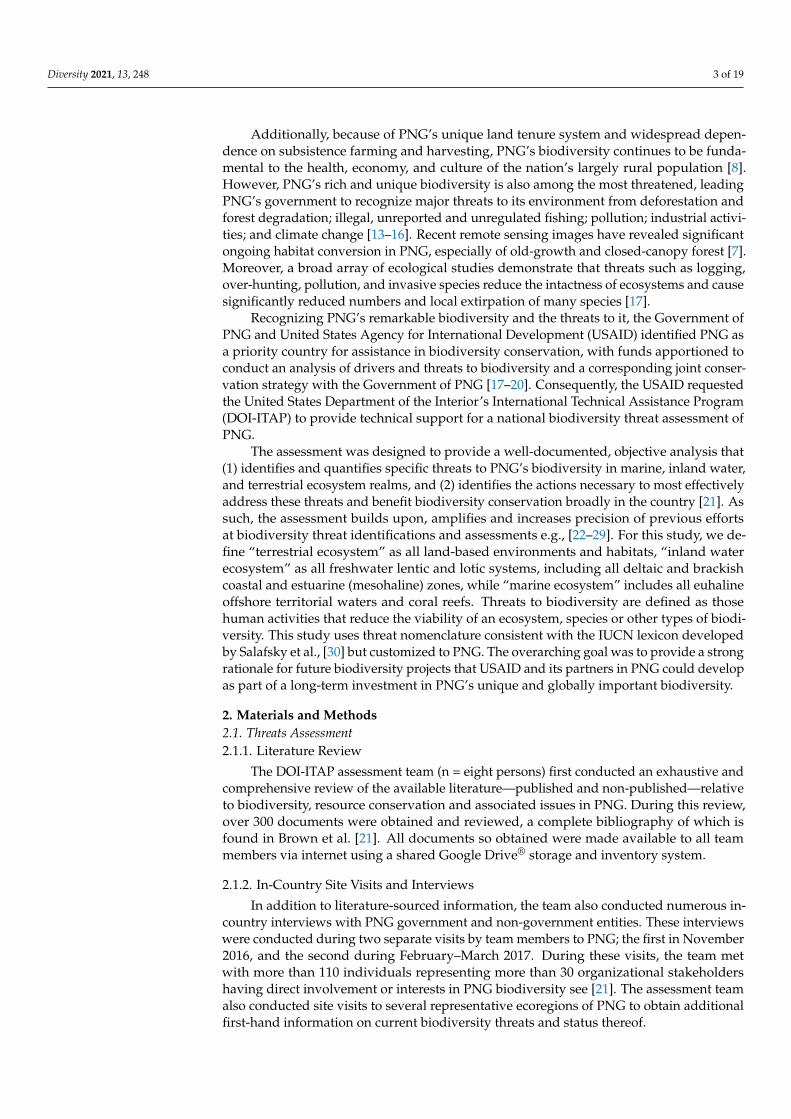
Figure 2. Extent and distribution of the major vegetation classes of Papua New Guinea. Data adapted from the Forest Inventory Mapping (FIM) System, sensu McAlpine and Quilley [12].
Additionally, because of PNG’s unique land tenure system and widespread depend-ence on subsistence farming and harvesting, PNG’s biodiversity continues to be funda-mental to the health, economy, and culture of the nation’s largely rural population [8]. However, PNG’s rich and unique biodiversity is also among the most threatened, leading PNG’s government to recognize major threats to its environment from deforestation and forest degradation; illegal, unreported and unregulated fishing; pollution; industrial ac-tivities; and climate change [13–16]. Recent remote sensing images have revealed signifi-cant ongoing habitat conversion in PNG, especially of old-growth and closed-canopy for-est [7]. Moreover, a broad array of ecological studies demonstrate that threats such as log-ging, over-hunting, pollution, and invasive species reduce the intactness of ecosystems and cause significantly reduced numbers and local extirpation of many species [17].
Recognizing PNG’s remarkable biodiversity and the threats to it, the Government of PNG and United States Agency for International Development (USAID) identified PNG as a priority country for assistance in biodiversity conservation, with funds apportioned to conduct an analysis of drivers and threats to biodiversity and a corresponding joint conservation strategy with the Government of PNG [17—20]. Consequently, the USAID requested the United States Department of the Interior’s International Technical Assis-tance Program (DOI-ITAP) to provide technical support for a national biodiversity threat assessment of PNG.
The assessment was designed to provide a well-documented, objective analysis that (1) identifies and quantifies specific threats to PNG’s biodiversity in marine, inland water, and terrestrial ecosystem realms, and (2) identifies the actions necessary to most effec-tively address these threats and benefit biodiversity conservation broadly in the country [21]. As such, the assessment builds upon, amplifies and increases precision of previous efforts at biodiversity threat identifications and assessments e.g., [22–29]. For this study, we define “terrestrial ecosystem” as all land-based environments and habitats, “inland water ecosystem” as all freshwater lentic and lotic systems, including all deltaic and
Figure 2. Extent and distribution of the major vegetation classes of Papua New Guinea. Data adapted from the ForestInventory Mapping (FIM) System, sensu McAlpine and Quilley [12].
Diversity 2021, 13, 248 3 of 19
Additionally, because of PNG’s unique land tenure system and widespread depen-dence on subsistence farming and harvesting, PNG’s biodiversity continues to be funda-mental to the health, economy, and culture of the nation’s largely rural population [8].However, PNG’s rich and unique biodiversity is also among the most threatened, leadingPNG’s government to recognize major threats to its environment from deforestation andforest degradation; illegal, unreported and unregulated fishing; pollution; industrial activi-ties; and climate change [13–16]. Recent remote sensing images have revealed significantongoing habitat conversion in PNG, especially of old-growth and closed-canopy forest [7].Moreover, a broad array of ecological studies demonstrate that threats such as logging,over-hunting, pollution, and invasive species reduce the intactness of ecosystems and causesignificantly reduced numbers and local extirpation of many species [17].
Recognizing PNG’s remarkable biodiversity and the threats to it, the Government ofPNG and United States Agency for International Development (USAID) identified PNG asa priority country for assistance in biodiversity conservation, with funds apportioned toconduct an analysis of drivers and threats to biodiversity and a corresponding joint conser-vation strategy with the Government of PNG [17–20]. Consequently, the USAID requestedthe United States Department of the Interior’s International Technical Assistance Program(DOI-ITAP) to provide technical support for a national biodiversity threat assessment ofPNG.
The assessment was designed to provide a well-documented, objective analysis that(1) identifies and quantifies specific threats to PNG’s biodiversity in marine, inland water,and terrestrial ecosystem realms, and (2) identifies the actions necessary to most effectivelyaddress these threats and benefit biodiversity conservation broadly in the country [21]. Assuch, the assessment builds upon, amplifies and increases precision of previous effortsat biodiversity threat identifications and assessments e.g., [22–29]. For this study, we de-fine “terrestrial ecosystem” as all land-based environments and habitats, “inland waterecosystem” as all freshwater lentic and lotic systems, including all deltaic and brackishcoastal and estuarine (mesohaline) zones, while “marine ecosystem” includes all euhalineoffshore territorial waters and coral reefs. Threats to biodiversity are defined as thosehuman activities that reduce the viability of an ecosystem, species or other types of biodi-versity. This study uses threat nomenclature consistent with the IUCN lexicon developedby Salafsky et al., [30] but customized to PNG. The overarching goal was to provide a strongrationale for future biodiversity projects that USAID and its partners in PNG could developas part of a long-term investment in PNG’s unique and globally important biodiversity.
2. Materials and Methods2.1. Threats Assessment2.1.1. Literature Review
The DOI-ITAP assessment team (n = eight persons) first conducted an exhaustive andcomprehensive review of the available literature—published and non-published—relativeto biodiversity, resource conservation and associated issues in PNG. During this review,over 300 documents were obtained and reviewed, a complete bibliography of which isfound in Brown et al. [21]. All documents so obtained were made available to all teammembers via internet using a shared Google Drive® storage and inventory system.
2.1.2. In-Country Site Visits and Interviews
In addition to literature-sourced information, the team also conducted numerous in-country interviews with PNG government and non-government entities. These interviewswere conducted during two separate visits by team members to PNG; the first in November2016, and the second during February–March 2017. During these visits, the team metwith more than 110 individuals representing more than 30 organizational stakeholdershaving direct involvement or interests in PNG biodiversity see [21]. The assessment teamalso conducted site visits to several representative ecoregions of PNG to obtain additionalfirst-hand information on current biodiversity threats and status thereof.
Diversity 2021, 13, 248 4 of 19
2.1.3. Quantitative Threat Assessment and Ranking
To provide an objective, quantitative and data-driven method for assessing relativethreat levels, we used a modified version of quantitative SWOT (Strengths, Weaknesses,Opportunities, Threats) analysis [31]. Quantitative SWOT analysis has several desirablecharacteristics as applied to environmental assessments. The method is simple, versatile,repeatable and intuitive. Importantly, the ability to effectively combine mixed data (cardi-nal, categorical, and continuous) together with multidisciplinary expert knowledge [27,31]into a single structured model provides a comprehensive, practical and uniform metric forcomparing multiple threats and prioritizing biodiversity conservation strategies [29,31].Because our specific objective was to assess current threats to biodiversity, we thereforeabbreviated the SWOT approach to focus only on the category of “Threats”.
Specific threats were identified based on the literature review, and the collectiveknowledge and experience of team members, several of which (G.D., D.K., D.P.) also hadextensive prior experience working in PNG. These threat tables were also periodically up-dated and refined during the analytical process as additional information became available.Once a complete listing of threats was compiled, a quantitative SWOT template [31] wasused to assign a “weight” ranging from 100–1000 for each threat in terms of its relativeimpact (i.e., 100 = very minor impact; 1000 = extreme impact) on biodiversity in othersimilar settings. That is, we considered how each threat was known to affect biodiversityin other tropical, insular environments (e.g., Madagascar, Hawaii, Hispaniola, Indonesia,Mauritius, Jamaica). Threat weightings were based on the expert-based team consensus,the members of which all had prior or ongoing experience working in tropical, insularenvironments. The value of expert-based assessments in ecology and conservation hasbecome increasingly recognized, particularly in cases of varying degrees of epistemic un-certainty, as in this assessment e.g., [27,29,31]. Once all threat weightings were determined,an importance coefficient (IC) was computed for each threat that reflected its relevance tooverall threat levels. The individual ICs were calculated as follows: ICi = Wi/ΣWi-n; whereWi is the respective threat weight, ΣWi-n is the sum of all individual threat weights, andthus ΣICi-n = 1. Because there were ecosystem-specific differences in both the number andimpact of individual threats, the individual threat weights and ICs also varied accordinglyamong the three ecosystem categories.
Threat levels were also affected by three additional coefficients: spatial, temporaland probability of occurrence. The spatial coefficient (SC) reflects the geographic extentof a given threat across PNG. If the threat applied equally over the entire country, the SCwas 1. However, if the threat was spatially disproportional, then the SC was allocatedaccordingly. Spatial coefficients for each threat were determined based on a combination ofpublished reports, PNG government documents and reports, and geospatial evaluationusing overlaid data themes. Similarly, the temporal coefficient (TC) applies to threats thataffect the country only periodically or cyclically during any given year (e.g., anthropogenicfires). Finally, the probability of occurrence (POC) coefficient indicates the likelihood that agiven threat will be present or occur in any given year. A POC of 1 indicates that the factoris always present or occurs each year. Thus, these coefficients attenuate the relative weight(i.e., IC) of individual threats according to PNG-specific conditions. For example, twodifferent threats may have the same general impact (i.e., weight) on biodiversity, but if oneonly affects 10 percent of the country, while the other affects 95 percent, then the relativeimpact (i.e., ICA) of the latter would be higher. All coefficients were based on existing dataand information extracted from the available published literature and PNG Governmentreports and policy documents. Any threats not subject to measurable spatial, temporal orprobability of occurrence variations were assigned default coefficients of 1, respectively.
Finally, for each threat the team assigned on a scale of 0–10, two numerical values foreach threat level: optimal and actual. For any given threat, optimal level was assigned adefault value of 10, as it represents the ideal scenario in terms of biodiversity conservation.Most critical however, were the values for actual level, as they represented the teamconsensus on the actual state of the threats for PNG. Actual values were based on how,
Diversity 2021, 13, 248 5 of 19
or to what extent, the threats currently exist or operate in PNG relative to their impacton biodiversity. In this case, a value of 10 represents either absence of the threat, or thecomplete mitigation or abatement of it. Conversely, a value of zero would represent animminent, existential threat to those aspects of biodiversity thus affected (i.e., “worst casescenario”). Importantly, estimates of actual values also considered relative impacts onoverall biodiversity by the specific threats. For example, two different threats could eachhave the same weight and coefficients, but if one affects areas of greater species diversityand/or endemism (e.g., montane rainforests), then the actual value for this threat wouldbe scored lower (i.e., greater severity) than that of a threat affecting primarily areas oflesser biodiversity (e.g., coastal scrub forests). The team used all available information—published, non-published and geospatial—as well as information obtained from in-countryinterviews and discussions, in order to assign actual values. For this estimate, the initialnonbiased starting point was a value of five. The team then decided whether the impact ofa given threat on biodiversity in PNG was less severe (>5) or more severe (<5), and to whatdegree.
To estimate and quantitatively compare individual threats using the SWOT template,three indices were also calculated: optimal quality (OQ), actual quality (AQ), and thequality deviation index (QD). The OQ is the highest potential “quality” for the threat,while the AQ is the observed or actual quality based on the PNG-specific team assess-ments. For each threat, these indices were obtained by multiplying the associated optimaland actual quality values by all four corresponding coefficients. The final quality in-dices (optimal, actual) were then computed as the sum of the previous values as follows:Qo,a = Σi-n (Vo,a * Ii * Si * Ti * Pi); where:
Qo,a = Threat level (optimal, actual).Vo,a = Optimal and actual values, respectively, of each threat.Ii = Importance coefficient of each threat.Si = Spatial coefficient of each threat.Ti = Temporal coefficient of each threat.Pi = Probability of occurrence coefficient of each threat.
And, where the quality deviation index (QD) = Qo − Qa.The QD provides detailed and valuable insights for threat evaluation. Analysis of
individual partial QDs can reveal whether certain threats to biodiversity could feasiblybe mitigated or improved by conservation actions. For example, some threats may beimpractical or impossible to improve over the time frame of interest. Other factors however,may be more amenable to control or reduction via conservation actions. Thus, the relativecontributions of individual threats to the total QD can be used to identify where specificconservation efforts (i.e., resource allocations) may have the greatest positive impact onbiodiversity conservation. For instance, if threats “x” and “y” contribute 23 percent tothe overall threat QD, then effective mitigation or reduction of those threats may reducebiodiversity threat level by a similar amount commensurate with conservation successsee [31]. Examination of the component (i.e., ecosystem) subtotals for threat percentagescan also indicate which ecosystem(s) face greater overall threat levels.
Finally, once overall percentages were calculated for all threats, we then assignedeach threat to one of three practical and intuitive categories: High, Medium, and Low.We defined “High” threats as those factors currently contributing to substantial (>5%of total threat) ongoing biodiversity loss, “Medium” threats as those which have thepotential to become more serious (i.e., High) threats to biodiversity in the immediatelyforeseeable future, and “Low” threats as those factors which are not considered to becomesignificant causes of biodiversity loss in PNG in the immediately foreseeable future. Forthis, we defined “immediately foreseeable future” as a 5-year time horizon from date ofthe assessment.
Because the categorization of threats was based on their quantitative contributions tothe overall biodiversity threat in PNG, we used multivariate cluster analysis as a quantita-tive threat classification method [32]. Specifically, we used a 3-centroid Euclidian distance
Diversity 2021, 13, 248 6 of 19
model to assign individual threat percentages to one of three threat categories [33]. Thisallowed us to base our threat classifications on the actual data structure, rather than on anyarbitrary or subjective considerations [21]. Threat classifications are presented graphicallyas a dendrogram generated from the cluster analysis. All statistical calculations wereperformed using the MINITAB® Version 13 Statistical Package for Windows®.
2.2. Situation Modeling
We used Situation Model (SM) guidance provided by USAID [34] to evaluate thebiodiversity threat context, utilizing our literature review, in-country observations anddiscussions, as well as our SWOT and geospatial analyses [21]. Situation Modeling has beenused for over two decades in the fields of public health and international development, andalso provides a concise and effective way of depicting relationships among factors whichaffect biodiversity [34]. We relied partially upon the generic tropical forest and Philippines-oriented terrestrial ecosystem SM, as well as guidelines for the level of detail about driversand threats to include [34,35]. Detailed descriptions and methods for constructing SMs arefound in USAID [34].
Drivers, threats, and stressors identified were consistent with those identified inthe USAID Tropical Forestry and Biodiversity Conservation Assessment (i.e., climatechange, overexploitation and unsustainable harvest, habitat loss, invasive species andpollution) [36]. Our process enabled us to develop a comprehensive SM for biodiversityincluding terrestrial, inland water, and marine systems, as well as social, economic andgovernance drivers.
Within each strategic approach, we created recommendations at two different scales:community and national. Community level, for the purposes of this assessment, is definedto include Provincial, District and local-level governments along with local clan and villagegovernance. The community-level recommendations focus on engaging communities inbiodiversity conservation through education, training, and land use planning. The national-level recommendations focus on supporting government and educational institutions andother civil society. Government agencies can provide policies and regulation to guideconservation, law enforcement, and science-based technical assistance to communitiesand NGOs working in conservation. Higher education institutions can provide trainingand education across a wide-range of topics to support both the central government andlocal communities to develop a cohort of PNG citizens who are trained and empowered inconservation science and practice.
2.3. Results Chains and Response Prioritizations
To develop specific recommendations for biodiversity threat reduction we also lookedat each of the “High” threats identified in the SWOT analysis and then identified thosestrategic approaches that could alter the linkages between drivers and threats or reducethe effect of the threats to biodiversity [36,37]. We then evaluated all potential strategic ap-proaches relative to how many of the “High” threats each approach addressed. We distilledthis into three primary strategic approaches: (1) Strengthening capacity for environmentaldecision-making, (2) Legal and policy education and training, and (3) Integrated land useplanning. Although priority was given to addressing the top threats, the recommendedstrategic approaches also simultaneously address a large number of lesser (Medium, Low)threats. We used Results Chains to clearly illustrate the interactive linkages between rec-ommended actions and desired results across all three strategic approaches at both thecommunity and national levels [21,37]. Detailed descriptions and methods for constructingResults Chains are found in USAID [37].
3. Results3.1. SWOT Threat Assessment and Rankings
Of the 27 individual threats identified across all ecosystem realms, nine (9) wereranked as “High”, six (6) were ranked as “Medium”, and twelve (12) were ranked as “Low”
Diversity 2021, 13, 248 7 of 19
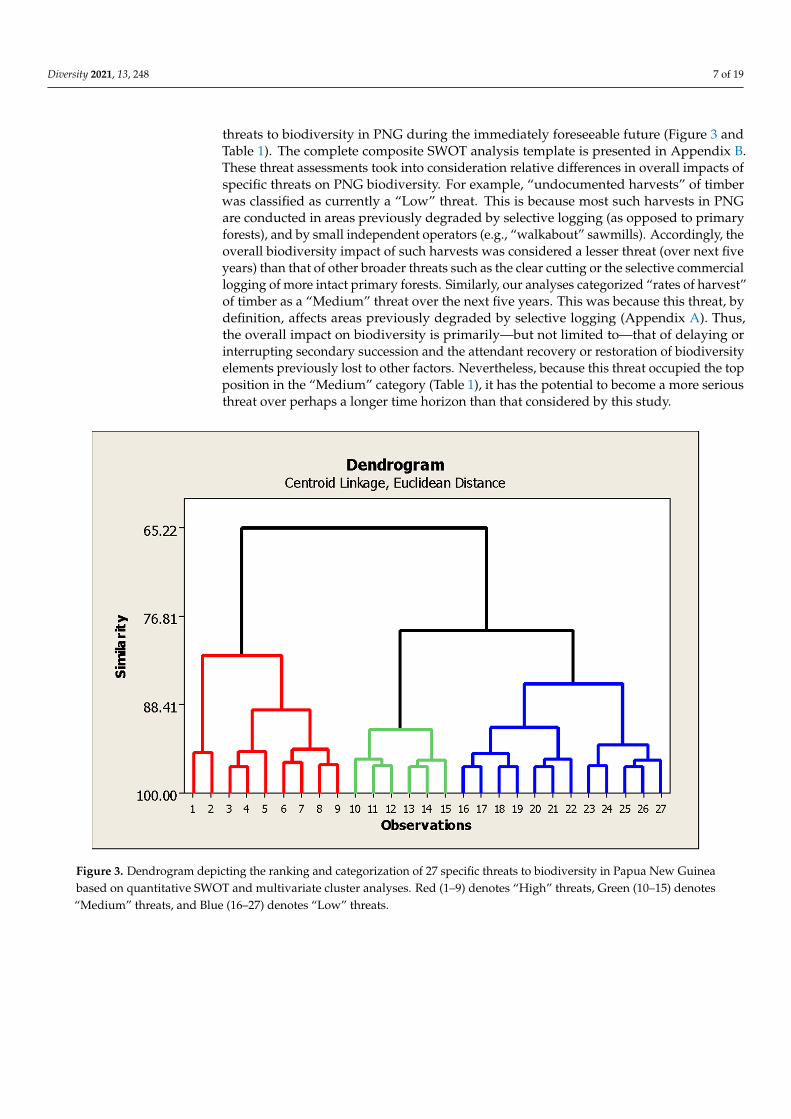
threats to biodiversity in PNG during the immediately foreseeable future (Figure 3 andTable 1). The complete composite SWOT analysis template is presented in Appendix B.These threat assessments took into consideration relative differences in overall impacts ofspecific threats on PNG biodiversity. For example, “undocumented harvests” of timberwas classified as currently a “Low” threat. This is because most such harvests in PNGare conducted in areas previously degraded by selective logging (as opposed to primaryforests), and by small independent operators (e.g., “walkabout” sawmills). Accordingly, theoverall biodiversity impact of such harvests was considered a lesser threat (over next fiveyears) than that of other broader threats such as the clear cutting or the selective commerciallogging of more intact primary forests. Similarly, our analyses categorized “rates of harvest”of timber as a “Medium” threat over the next five years. This was because this threat, bydefinition, affects areas previously degraded by selective logging (Appendix A). Thus,the overall impact on biodiversity is primarily—but not limited to—that of delaying orinterrupting secondary succession and the attendant recovery or restoration of biodiversityelements previously lost to other factors. Nevertheless, because this threat occupied the topposition in the “Medium” category (Table 1), it has the potential to become a more seriousthreat over perhaps a longer time horizon than that considered by this study.
Diversity 2021, 13, x FOR PEER REVIEW 8 of 21
By ecosystem category, the SWOT results indicated that the greatest proportion (ap-proximately 40%) of the total threat to PNG biodiversity directly affects the terrestrial eco-system (Appendix B), with the inland water and marine ecosystems subjected to 33 per-cent and 27 percent of the overall threat, respectively. Moreover, of the nine threats ranked as “High”, seven were threats common to two or more ecosystems, while two (i.e., IUU marine fishing, regulated commercial marine fishing) were specific to the marine ecosys-tem. In aggregate, the nine major threats accounted for approximately 72% (average 8% each) of the total quantified biodiversity threat in PNG (Appendix B). Clearly, in terms of overall biodiversity impact, these highest ranked threats are quantitatively noteworthy as reflected by their distinct “lineage” identified via the cluster analysis (Figure 3), compared to “Medium” and “Low” ranked threats which accounted for a remaining 16 percent (av-erage 2.7%) and 12 percent (average 1%), respectively. In terms of overall impact on PNG biodiversity, “High” threats were on average three times more severe than “Medium” threats, which were in turn about three times more severe on average than “Low” ranked threats. Importantly for resource allocation purposes, the seven “High” threats that are shared by multiple ecosystems also accounted for 57 percent of the total biodiversity threat, and were also primarily terrestrial in origin (with IUU fishing and commercial ma-rine fishing being the exceptions). Indeed, of the 27 total identified biodiversity threats, closer examination of only those shared by all three ecosystem realms reveals that these cross-realm threats (n = 8), and which originate within the terrestrial component also ac-count—either directly or indirectly—for approximately 45 percent of the overall threat to biodiversity across all ecosystems in PNG (Appendix B). This suggests that conservation efforts focused on countering or mitigating the broader suite of these and other cross-realm terrestrial based threats would have the greatest positive impact in reducing current overall biodiversity loss in PNG, via a “multiplier effect” across multiple ecosystems.
Figure 3. Dendrogram depicting the ranking and categorization of 27 specific threats to biodiversity in Papua New Guinea based on quantitative SWOT and multivariate cluster analyses. Red (1–9) denotes “High” threats, Green (10–15) denotes “Medium” threats, and Blue (16–27) denotes “Low” threats.
Figure 3. Dendrogram depicting the ranking and categorization of 27 specific threats to biodiversity in Papua New Guineabased on quantitative SWOT and multivariate cluster analyses. Red (1–9) denotes “High” threats, Green (10–15) denotes“Medium” threats, and Blue (16–27) denotes “Low” threats.
Diversity 2021, 13, 248 8 of 19
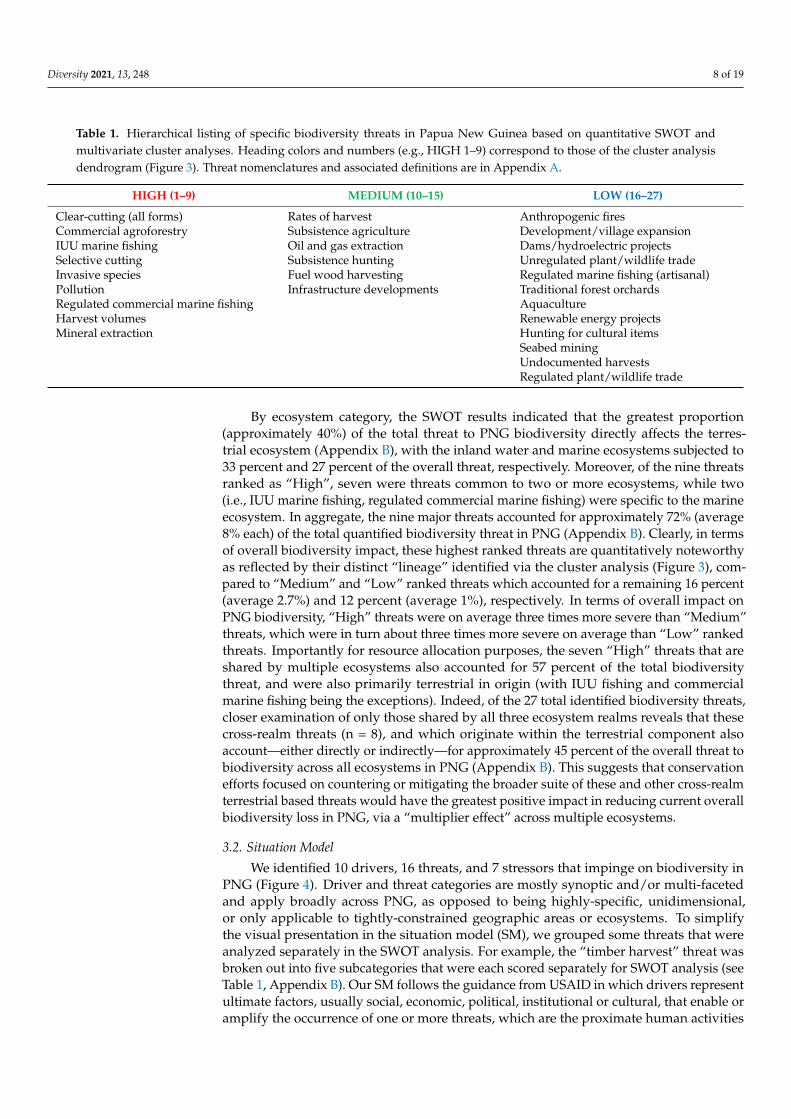
Table 1. Hierarchical listing of specific biodiversity threats in Papua New Guinea based on quantitative SWOT andmultivariate cluster analyses. Heading colors and numbers (e.g., HIGH 1–9) correspond to those of the cluster analysisdendrogram (Figure 3). Threat nomenclatures and associated definitions are in Appendix A.
HIGH (1–9) MEDIUM (10–15) LOW (16–27)
Clear-cutting (all forms) Rates of harvest Anthropogenic firesCommercial agroforestry Subsistence agriculture Development/village expansionIUU marine fishing Oil and gas extraction Dams/hydroelectric projectsSelective cutting Subsistence hunting Unregulated plant/wildlife tradeInvasive species Fuel wood harvesting Regulated marine fishing (artisanal)Pollution Infrastructure developments Traditional forest orchardsRegulated commercial marine fishing AquacultureHarvest volumes Renewable energy projectsMineral extraction Hunting for cultural items
Seabed miningUndocumented harvestsRegulated plant/wildlife trade
By ecosystem category, the SWOT results indicated that the greatest proportion(approximately 40%) of the total threat to PNG biodiversity directly affects the terres-trial ecosystem (Appendix B), with the inland water and marine ecosystems subjected to33 percent and 27 percent of the overall threat, respectively. Moreover, of the nine threatsranked as “High”, seven were threats common to two or more ecosystems, while two(i.e., IUU marine fishing, regulated commercial marine fishing) were specific to the marineecosystem. In aggregate, the nine major threats accounted for approximately 72% (average8% each) of the total quantified biodiversity threat in PNG (Appendix B). Clearly, in termsof overall biodiversity impact, these highest ranked threats are quantitatively noteworthyas reflected by their distinct “lineage” identified via the cluster analysis (Figure 3), com-pared to “Medium” and “Low” ranked threats which accounted for a remaining 16 percent(average 2.7%) and 12 percent (average 1%), respectively. In terms of overall impact onPNG biodiversity, “High” threats were on average three times more severe than “Medium”threats, which were in turn about three times more severe on average than “Low” rankedthreats. Importantly for resource allocation purposes, the seven “High” threats that areshared by multiple ecosystems also accounted for 57 percent of the total biodiversitythreat, and were also primarily terrestrial in origin (with IUU fishing and commercialmarine fishing being the exceptions). Indeed, of the 27 total identified biodiversity threats,closer examination of only those shared by all three ecosystem realms reveals that thesecross-realm threats (n = 8), and which originate within the terrestrial component alsoaccount—either directly or indirectly—for approximately 45 percent of the overall threat tobiodiversity across all ecosystems in PNG (Appendix B). This suggests that conservationefforts focused on countering or mitigating the broader suite of these and other cross-realmterrestrial based threats would have the greatest positive impact in reducing current overallbiodiversity loss in PNG, via a “multiplier effect” across multiple ecosystems.
3.2. Situation Model
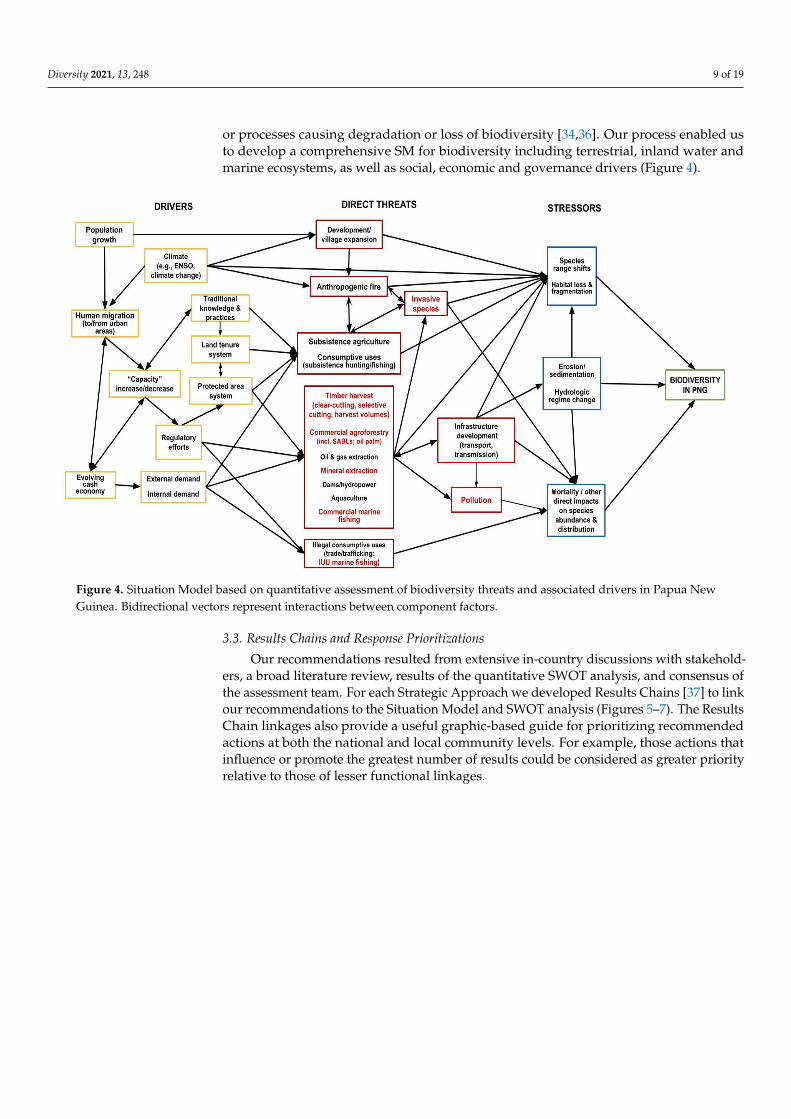
We identified 10 drivers, 16 threats, and 7 stressors that impinge on biodiversity inPNG (Figure 4). Driver and threat categories are mostly synoptic and/or multi-facetedand apply broadly across PNG, as opposed to being highly-specific, unidimensional,or only applicable to tightly-constrained geographic areas or ecosystems. To simplifythe visual presentation in the situation model (SM), we grouped some threats that wereanalyzed separately in the SWOT analysis. For example, the “timber harvest” threat wasbroken out into five subcategories that were each scored separately for SWOT analysis (seeTable 1, Appendix B). Our SM follows the guidance from USAID in which drivers representultimate factors, usually social, economic, political, institutional or cultural, that enable oramplify the occurrence of one or more threats, which are the proximate human activities
Diversity 2021, 13, 248 9 of 19
or processes causing degradation or loss of biodiversity [34,36]. Our process enabled usto develop a comprehensive SM for biodiversity including terrestrial, inland water andmarine ecosystems, as well as social, economic and governance drivers (Figure 4).
Diversity 2021, 13, x FOR PEER REVIEW 10 of 21
3.2. Situation Model We identified 10 drivers, 16 threats, and 7 stressors that impinge on biodiversity in
PNG (Figure 4). Driver and threat categories are mostly synoptic and/or multi-faceted and apply broadly across PNG, as opposed to being highly-specific, unidimensional, or only applicable to tightly-constrained geographic areas or ecosystems. To simplify the visual presentation in the situation model (SM), we grouped some threats that were analyzed separately in the SWOT analysis. For example, the “timber harvest” threat was broken out into five subcategories that were each scored separately for SWOT analysis (see Table 1, Appendix B). Our SM follows the guidance from USAID in which drivers represent ulti-mate factors, usually social, economic, political, institutional or cultural, that enable or amplify the occurrence of one or more threats, which are the proximate human activities or processes causing degradation or loss of biodiversity [34,36]. Our process enabled us to develop a comprehensive SM for biodiversity including terrestrial, inland water and marine ecosystems, as well as social, economic and governance drivers (Figure 4).
Figure 4. Situation Model based on quantitative assessment of biodiversity threats and associated drivers in Papua New Guinea. Bidirectional vectors represent interactions between component factors.
3.3. Results Chains and Response Prioritizations Our recommendations resulted from extensive in-country discussions with stake-
holders, a broad literature review, results of the quantitative SWOT analysis, and consen-sus of the assessment team. For each Strategic Approach we developed Results Chains [37] to link our recommendations to the Situation Model and SWOT analysis (Figures 5–7). The Results Chain linkages also provide a useful graphic-based guide for prioritizing recommended actions at both the national and local community levels. For example, those actions that influence or promote the greatest number of results could be considered as greater priority relative to those of lesser functional linkages.
Figure 4. Situation Model based on quantitative assessment of biodiversity threats and associated drivers in Papua NewGuinea. Bidirectional vectors represent interactions between component factors.
3.3. Results Chains and Response Prioritizations
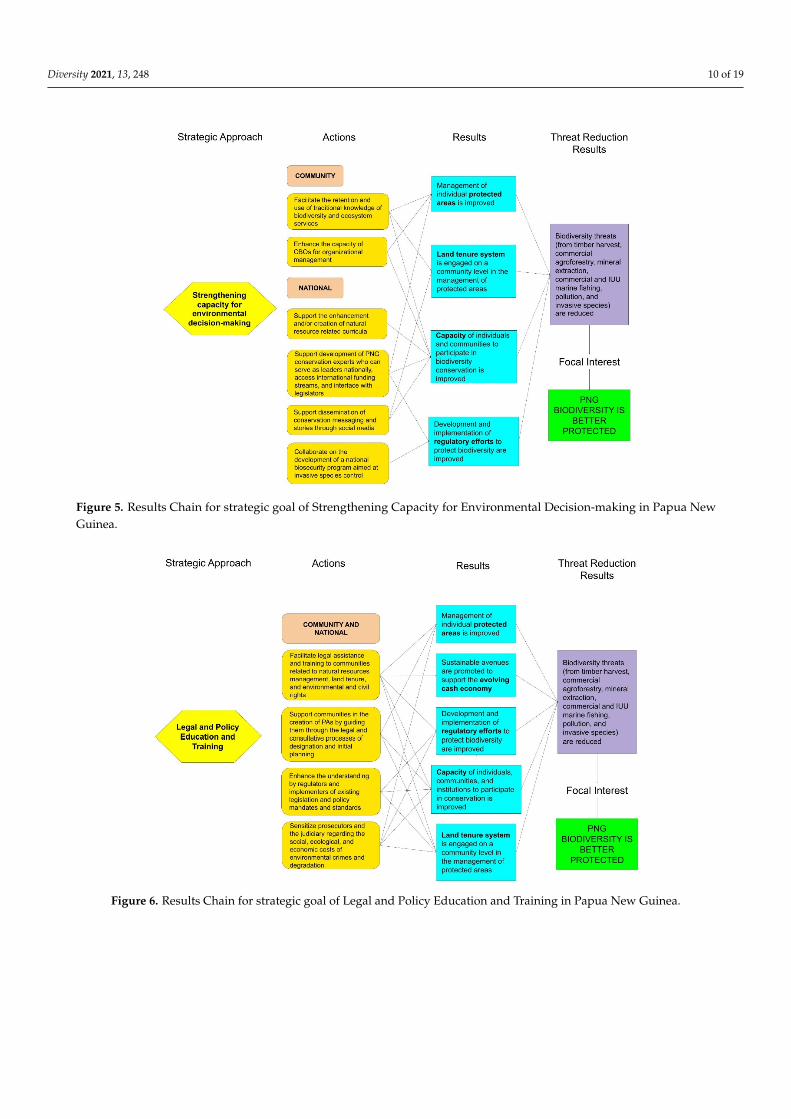
Our recommendations resulted from extensive in-country discussions with stakehold-ers, a broad literature review, results of the quantitative SWOT analysis, and consensus ofthe assessment team. For each Strategic Approach we developed Results Chains [37] to linkour recommendations to the Situation Model and SWOT analysis (Figures 5–7). The ResultsChain linkages also provide a useful graphic-based guide for prioritizing recommendedactions at both the national and local community levels. For example, those actions thatinfluence or promote the greatest number of results could be considered as greater priorityrelative to those of lesser functional linkages.
Diversity 2021, 13, 248 10 of 19Diversity 2021, 13, x FOR PEER REVIEW 11 of 21
Figure 5. Results Chain for strategic goal of Strengthening Capacity for Environmental Decision-making in Papua New Guinea.
Figure 6. Results Chain for strategic goal of Legal and Policy Education and Training in Papua New Guinea.
Figure 5. Results Chain for strategic goal of Strengthening Capacity for Environmental Decision-making in Papua NewGuinea.
Diversity 2021, 13, x FOR PEER REVIEW 11 of 21
Figure 5. Results Chain for strategic goal of Strengthening Capacity for Environmental Decision-making in Papua New Guinea.
Figure 6. Results Chain for strategic goal of Legal and Policy Education and Training in Papua New Guinea.
Figure 6. Results Chain for strategic goal of Legal and Policy Education and Training in Papua New Guinea.
Diversity 2021, 13, 248 11 of 19Diversity 2021, 13, x FOR PEER REVIEW 12 of 21
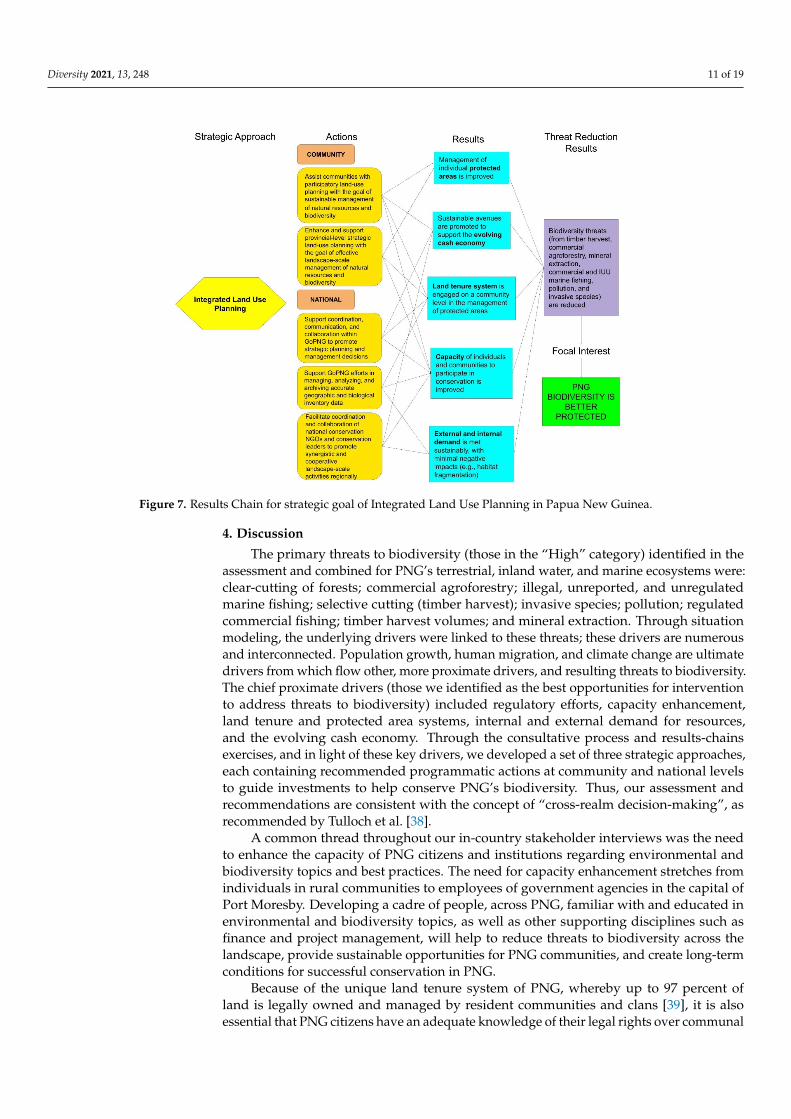
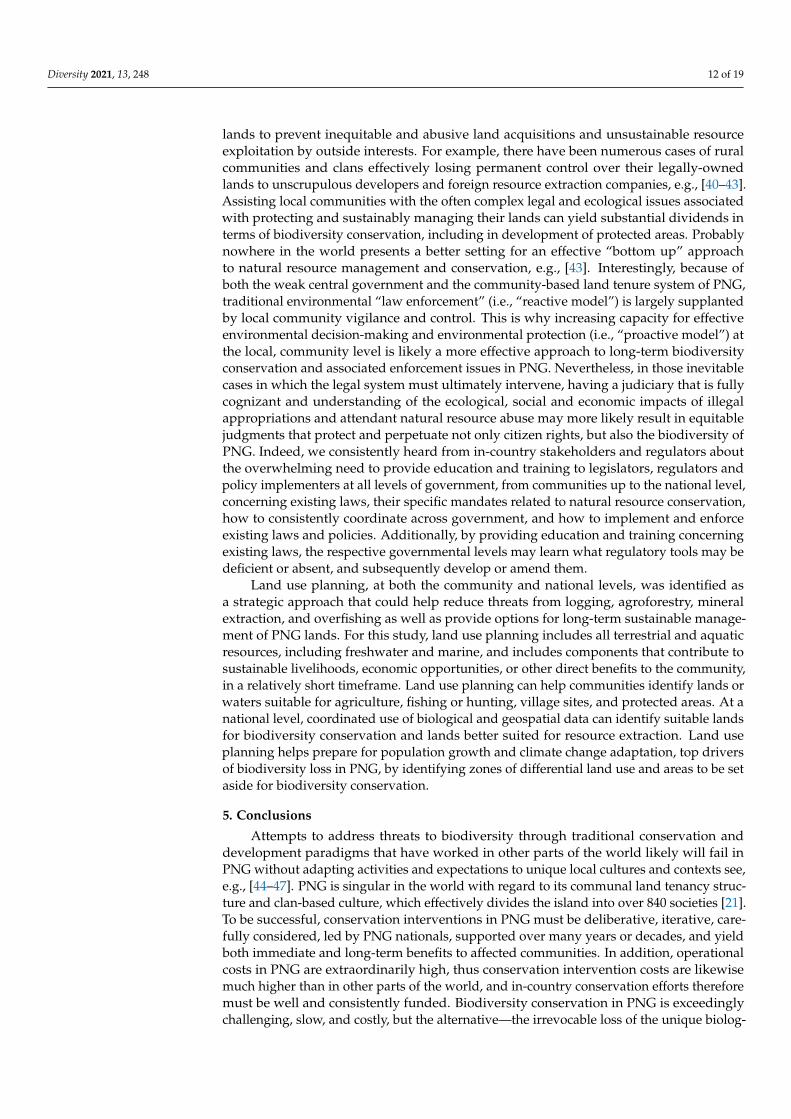
Figure 7. Results Chain for strategic goal of Integrated Land Use Planning in Papua New Guinea.
4. Discussion The primary threats to biodiversity (those in the “High” category) identified in the
assessment and combined for PNG’s terrestrial, inland water, and marine ecosystems were: clear-cutting of forests; commercial agroforestry; illegal, unreported, and unregu-lated marine fishing; selective cutting (timber harvest); invasive species; pollution; regu-lated commercial fishing; timber harvest volumes; and mineral extraction. Through situ-ation modeling, the underlying drivers were linked to these threats; these drivers are nu-merous and interconnected. Population growth, human migration, and climate change are ultimate drivers from which flow other, more proximate drivers, and resulting threats to biodiversity. The chief proximate drivers (those we identified as the best opportunities for intervention to address threats to biodiversity) included regulatory efforts, capacity enhancement, land tenure and protected area systems, internal and external demand for resources, and the evolving cash economy. Through the consultative process and results-chains exercises, and in light of these key drivers, we developed a set of three strategic approaches, each containing recommended programmatic actions at community and na-tional levels to guide investments to help conserve PNG’s biodiversity. Thus, our assess-ment and recommendations are consistent with the concept of “cross-realm decision-mak-ing”, as recommended by Tulloch et al. [38].
A common thread throughout our in-country stakeholder interviews was the need to enhance the capacity of PNG citizens and institutions regarding environmental and biodiversity topics and best practices. The need for capacity enhancement stretches from individuals in rural communities to employees of government agencies in the capital of Port Moresby. Developing a cadre of people, across PNG, familiar with and educated in environmental and biodiversity topics, as well as other supporting disciplines such as fi-nance and project management, will help to reduce threats to biodiversity across the land-scape, provide sustainable opportunities for PNG communities, and create long-term con-ditions for successful conservation in PNG.
Figure 7. Results Chain for strategic goal of Integrated Land Use Planning in Papua New Guinea.
4. Discussion
The primary threats to biodiversity (those in the “High” category) identified in theassessment and combined for PNG’s terrestrial, inland water, and marine ecosystems were:clear-cutting of forests; commercial agroforestry; illegal, unreported, and unregulatedmarine fishing; selective cutting (timber harvest); invasive species; pollution; regulatedcommercial fishing; timber harvest volumes; and mineral extraction. Through situationmodeling, the underlying drivers were linked to these threats; these drivers are numerousand interconnected. Population growth, human migration, and climate change are ultimatedrivers from which flow other, more proximate drivers, and resulting threats to biodiversity.The chief proximate drivers (those we identified as the best opportunities for interventionto address threats to biodiversity) included regulatory efforts, capacity enhancement,land tenure and protected area systems, internal and external demand for resources,and the evolving cash economy. Through the consultative process and results-chainsexercises, and in light of these key drivers, we developed a set of three strategic approaches,each containing recommended programmatic actions at community and national levelsto guide investments to help conserve PNG’s biodiversity. Thus, our assessment andrecommendations are consistent with the concept of “cross-realm decision-making”, asrecommended by Tulloch et al. [38].
A common thread throughout our in-country stakeholder interviews was the needto enhance the capacity of PNG citizens and institutions regarding environmental andbiodiversity topics and best practices. The need for capacity enhancement stretches fromindividuals in rural communities to employees of government agencies in the capital ofPort Moresby. Developing a cadre of people, across PNG, familiar with and educated inenvironmental and biodiversity topics, as well as other supporting disciplines such asfinance and project management, will help to reduce threats to biodiversity across thelandscape, provide sustainable opportunities for PNG communities, and create long-termconditions for successful conservation in PNG.
Because of the unique land tenure system of PNG, whereby up to 97 percent ofland is legally owned and managed by resident communities and clans [39], it is alsoessential that PNG citizens have an adequate knowledge of their legal rights over communal
Diversity 2021, 13, 248 12 of 19
lands to prevent inequitable and abusive land acquisitions and unsustainable resourceexploitation by outside interests. For example, there have been numerous cases of ruralcommunities and clans effectively losing permanent control over their legally-ownedlands to unscrupulous developers and foreign resource extraction companies, e.g., [40–43].Assisting local communities with the often complex legal and ecological issues associatedwith protecting and sustainably managing their lands can yield substantial dividends interms of biodiversity conservation, including in development of protected areas. Probablynowhere in the world presents a better setting for an effective “bottom up” approachto natural resource management and conservation, e.g., [43]. Interestingly, because ofboth the weak central government and the community-based land tenure system of PNG,traditional environmental “law enforcement” (i.e., “reactive model”) is largely supplantedby local community vigilance and control. This is why increasing capacity for effectiveenvironmental decision-making and environmental protection (i.e., “proactive model”) atthe local, community level is likely a more effective approach to long-term biodiversityconservation and associated enforcement issues in PNG. Nevertheless, in those inevitablecases in which the legal system must ultimately intervene, having a judiciary that is fullycognizant and understanding of the ecological, social and economic impacts of illegalappropriations and attendant natural resource abuse may more likely result in equitablejudgments that protect and perpetuate not only citizen rights, but also the biodiversity ofPNG. Indeed, we consistently heard from in-country stakeholders and regulators aboutthe overwhelming need to provide education and training to legislators, regulators andpolicy implementers at all levels of government, from communities up to the national level,concerning existing laws, their specific mandates related to natural resource conservation,how to consistently coordinate across government, and how to implement and enforceexisting laws and policies. Additionally, by providing education and training concerningexisting laws, the respective governmental levels may learn what regulatory tools may bedeficient or absent, and subsequently develop or amend them.
Land use planning, at both the community and national levels, was identified asa strategic approach that could help reduce threats from logging, agroforestry, mineralextraction, and overfishing as well as provide options for long-term sustainable manage-ment of PNG lands. For this study, land use planning includes all terrestrial and aquaticresources, including freshwater and marine, and includes components that contribute tosustainable livelihoods, economic opportunities, or other direct benefits to the community,in a relatively short timeframe. Land use planning can help communities identify lands orwaters suitable for agriculture, fishing or hunting, village sites, and protected areas. At anational level, coordinated use of biological and geospatial data can identify suitable landsfor biodiversity conservation and lands better suited for resource extraction. Land useplanning helps prepare for population growth and climate change adaptation, top driversof biodiversity loss in PNG, by identifying zones of differential land use and areas to be setaside for biodiversity conservation.
5. Conclusions
Attempts to address threats to biodiversity through traditional conservation anddevelopment paradigms that have worked in other parts of the world likely will fail inPNG without adapting activities and expectations to unique local cultures and contexts see,e.g., [44–47]. PNG is singular in the world with regard to its communal land tenancy struc-ture and clan-based culture, which effectively divides the island into over 840 societies [21].To be successful, conservation interventions in PNG must be deliberative, iterative, care-fully considered, led by PNG nationals, supported over many years or decades, and yieldboth immediate and long-term benefits to affected communities. In addition, operationalcosts in PNG are extraordinarily high, thus conservation intervention costs are likewisemuch higher than in other parts of the world, and in-country conservation efforts thereforemust be well and consistently funded. Biodiversity conservation in PNG is exceedinglychallenging, slow, and costly, but the alternative—the irrevocable loss of the unique biolog-
Diversity 2021, 13, 248 13 of 19
ical and cultural richness of this island nation—is unimaginable. The combined actionsrecommended in this study could deliver a strategic, cost-effective, and lasting legacy forPNG’s biodiversity and people.
Author Contributions: Conceptualization, P.B., T.H.W.J., D.P., H.F., D.K.; methodology, T.H.W.J.,H.F., C.B., D.E.B., G.D., D.K., D.P., R.R.; formal analysis, D.K., D.P., R.R., T.H.W.J.; investigation, C.B.,D.E.B., G.D., H.F., D.K., S.L., D.P., R.R., T.H.W.J.; resources, P.B., S.L.; data curation, C.B., D.E.B.,D.P., G.D., D.K., T.H.W.J.; writing—original draft preparation, T.H.W.J.; writing—review and editing,T.H.W.J., C.B.; supervision, P.B.; project administration, P.B., S.L. All authors have read and agreed tothe published version of the manuscript.
Funding: This research was funded by the United States Agency for International Development andthe United States Department of Interior.
Institutional Review Board Statement: Not applicable.
Informed Consent Statement: Not applicable.
Acknowledgments: We are grateful to the United States Department of Interior, United StatesAgency for International Development and the Government of Papua New Guinea for financialand logistical support of this study. A special thank you to the residents of Kenangi village, Ikanofivillage, Pari village, Komunive Mudmen village and Gahavisuka National Park for hosting us andcandidly sharing their insights on biodiversity, climate change, and development. We also thank KennMondiai, Melinda Kera, Cecil Senive, Noel Gisawo, and all the staff of Partners with Melanesianswho facilitated our in-country visits and logistics, arranged meetings and interviews with keystakeholders, and kept us in good spirits and good health. Michael Bongro and other colleaguesfrom the PNG Conservation and Environmental Protection Authority (CEPA) also provided insights,support, and expertise that greatly assisted the research. Benedicte Veizaga provided technicalassistance with graphics of Figure 4. The findings and conclusions in this article are those of theauthors and do not necessarily represent the views of the U.S. Fish and Wildlife Service. Use of tradenames in this article does not imply endorsement by the United States government.
Conflicts of Interest: The authors declare no conflict of interest.
Appendix A
Working definitions of the 27 distinct threats to biodiversity in Papua New Guineaidentified for quantitative SWOT analysis.
1. CLEAR-CUTTING: The complete removal and elimination of forests and forestedland cover, regardless of forest type/location.
2. SELECTIVE-CUTTING: The harvest and removal of trees from forests based on suchcriteria as size, form, or species and which leaves other non-target trees in place.
3. HARVEST VOLUMES: Total amount of timber removed from a given forested area(s)during timber harvests, usually measured in terms of stand basal area or cubic metersof merchantable wood.
4. RATES OF HARVEST: The time period (rotation) between successive loggings of agiven forested tract or area.
5. UNDOCUMENTED HARVESTS: Removal of timber from a forest without officialgovernment and/or landowner sanction, nor with any archival records of such.Includes non-commercial small-scale reentry logging of previously logged areas.
6. COMMERCIAL AGROFORESTRY: Large-scale conversion of forests to production ofagricultural products, typically for export (e.g., oil palm, tea, coconuts). This includesland clearing associated with SABLs (Special Agricultural and Business Leases).
7. SUBSISTENCE AGRICULTURE: Small-scale agricultural activities primarily for localconsumption by individual families or villages. Includes small-scale production ofagricultural products for sale in local markets or villages.
8. MINERAL EXTRACTION: All forms of mining (e.g., gold, copper, chromium, nickel)and associated activities. Does not include “seabed mining” which is considered adistinct and separate threat in this assessment.
Diversity 2021, 13, 248 14 of 19
9. OIL AND GAS EXTRACTION: All activities associated with the exploration, acquisi-tion, and distribution of naturally occurring raw petroleum products (i.e., crude oil,natural gas).
10. DEVELOPMENT/VILLAGE EXPANSION: The increase in geographic extent (“foot-print”) of a given village. This includes the establishment of new villages due topopulation increases in existing villages.
11. ANTHROPOGENIC FIRES: Fires started in, or spread to, forested or other areas byhuman activities, such as from land-clearing activities, hunting activities, cookingfires, burning of garbage, or arson.
12. INFRASTRUCTURE DEVELOPMENTS: Increases in the physical structure(s) associ-ated with human settlements and activities. Includes roads, bridges, communicationtowers, shopping centers, etc.
13. INVASIVE SPECIES: Any non-native organism (including plants, insects, vertebrates,fungi, diseases) that become – or may become – established in a given area,and whichmay eliminate, replace, infect, parasitize, or otherwise out-compete native species.
14. SUBSISTENCE HUNTING/FISHING/HARVESTING: The harvesting of wild an-imals (e.g., birds, mammals, reptiles, fish, mollusks) for non-commercial personalconsumption by individuals, families, or villages.
15. HUNTING FOR CULTURAL ITEMS: The harvesting of wild animals (e.g., birds,mammals, reptiles, mollusks) to obtain parts of said animals for use in traditional orceremonial objects or rituals.
16. PLANT AND WILDLIFE TRADE (REGULATED): The commercial exploitation ofnative plants and animals according to established laws and regulations.
17. PLANT AND WILDLIFE TRADE (UNREGULATED): The commercial exploitationof native plants and animals without established laws and regulations or other suchguidelines or controls. Includes all forms of “illegal” trade and trafficking.
18. TRADITIONAL FOREST ORCHARDS: The long-standing Melanesian practice of thesmall-scale selective planting and inter-cropping of various tree species in a givenarea in order to provide a varied and long-term source of fruits, nuts, wood, fiber andother useful products for personal use and consumption.
19. FUEL WOOD HARVESTING: Cutting and/or collection of wood from the forest foruse in household cooking or heating.
20. DAMS/HYDROELECTRIC PROJECTS: The use of artificial structures for impedingor altering stream flows for production of electricity, flood control, or to providesources of irrigation water.
21. RENEWABLE ENERGY PROJECTS: Production of electricity via solar or wind power.22. POLLUTION: Any environmental contaminants resulting from human activities. In-
cludes household sewage, solid waste, industrial effluents, and agricultural chemicals.23. REGULATED MARINE FISHING (ARTISANAL): Small-scale harvesting of fish or
other aquatic organisms, for commercial or non-commercial purposes, via use oftraditional gear and techniques and according to established laws and regulations.
24. AQUACULTURE: The production – commercial or otherwise – of aquatic organismsin controlled structures or environments. Includes activities such as “fish farming”.
25. IUU MARINE FISHING: The “Illegal, Unregulated, Unreported” harvesting of fish orother marine species for commercial purposes. In PNG, includes (but not limited to)harvesting of tuna stocks and bêche de mer (sea cucumber) by foreign fishing fleets.
26. REGULATED MARINE FISHING (COMMERCIAL): The large-scale commercialharvest of marine fisheries resources according to established laws and regulations.
27. SEABED MINING: The extraction of submerged minerals and resources from the seafloor, either by dredging sand and/or sediments, or lifting benthic material in anyother manner.
Appendix B
Diversity 2021, 13, 248 15 of 19
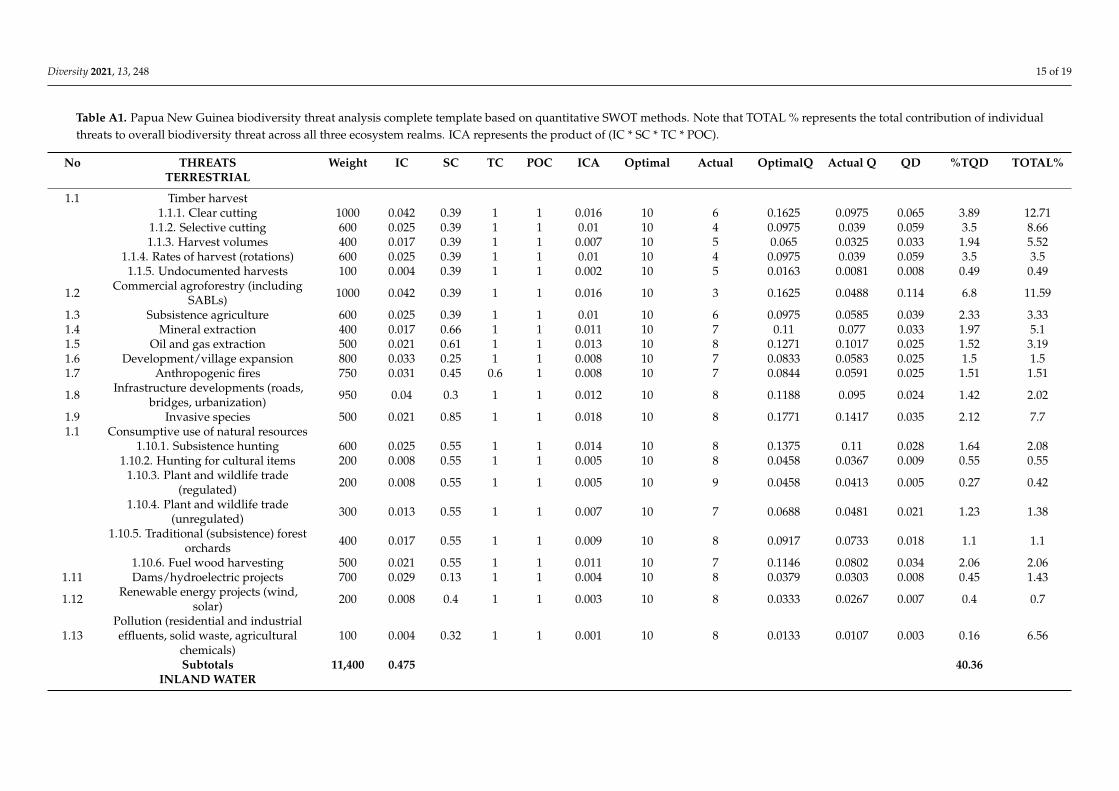
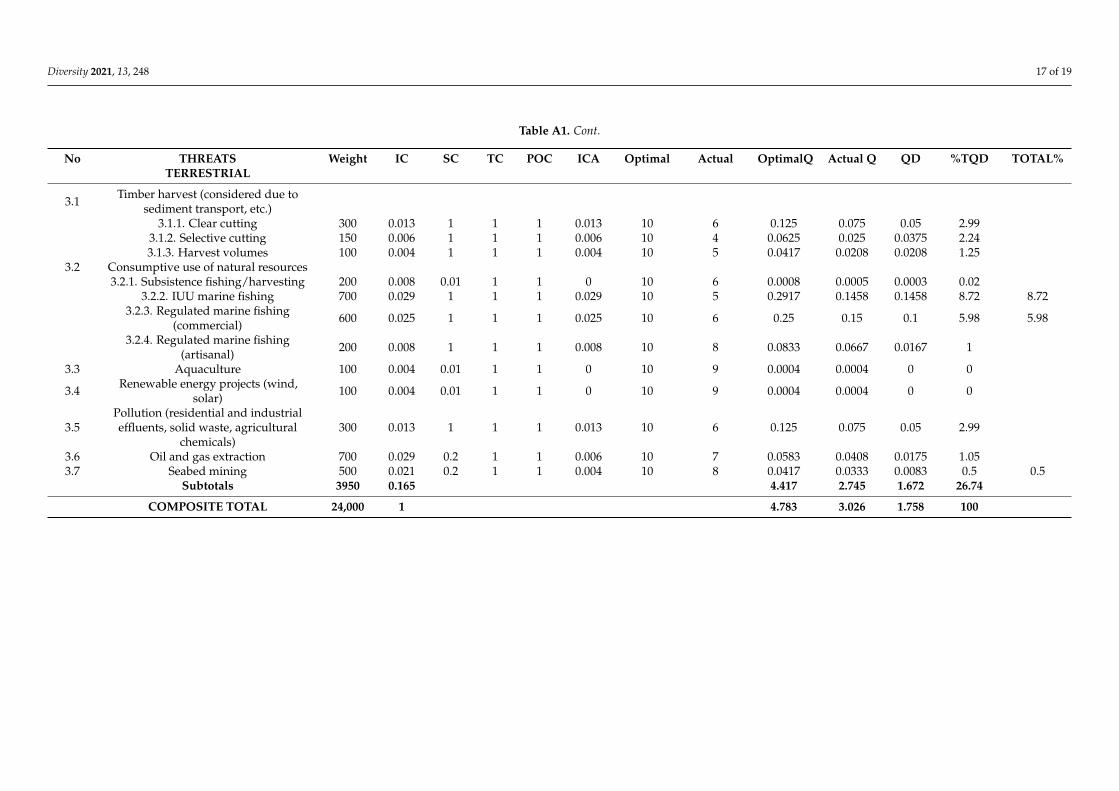
Table A1. Papua New Guinea biodiversity threat analysis complete template based on quantitative SWOT methods. Note that TOTAL % represents the total contribution of individualthreats to overall biodiversity threat across all three ecosystem realms. ICA represents the product of (IC * SC * TC * POC).
No THREATS Weight IC SC TC POC ICA Optimal Actual OptimalQ Actual Q QD %TQD TOTAL%TERRESTRIAL
1.1 Timber harvest1.1.1. Clear cutting 1000 0.042 0.39 1 1 0.016 10 6 0.1625 0.0975 0.065 3.89 12.71
1.1.2. Selective cutting 600 0.025 0.39 1 1 0.01 10 4 0.0975 0.039 0.059 3.5 8.661.1.3. Harvest volumes 400 0.017 0.39 1 1 0.007 10 5 0.065 0.0325 0.033 1.94 5.52
1.1.4. Rates of harvest (rotations) 600 0.025 0.39 1 1 0.01 10 4 0.0975 0.039 0.059 3.5 3.51.1.5. Undocumented harvests 100 0.004 0.39 1 1 0.002 10 5 0.0163 0.0081 0.008 0.49 0.49
1.2 Commercial agroforestry (includingSABLs) 1000 0.042 0.39 1 1 0.016 10 3 0.1625 0.0488 0.114 6.8 11.59
1.3 Subsistence agriculture 600 0.025 0.39 1 1 0.01 10 6 0.0975 0.0585 0.039 2.33 3.331.4 Mineral extraction 400 0.017 0.66 1 1 0.011 10 7 0.11 0.077 0.033 1.97 5.11.5 Oil and gas extraction 500 0.021 0.61 1 1 0.013 10 8 0.1271 0.1017 0.025 1.52 3.191.6 Development/village expansion 800 0.033 0.25 1 1 0.008 10 7 0.0833 0.0583 0.025 1.5 1.51.7 Anthropogenic fires 750 0.031 0.45 0.6 1 0.008 10 7 0.0844 0.0591 0.025 1.51 1.51
1.8 Infrastructure developments (roads,bridges, urbanization) 950 0.04 0.3 1 1 0.012 10 8 0.1188 0.095 0.024 1.42 2.02
1.9 Invasive species 500 0.021 0.85 1 1 0.018 10 8 0.1771 0.1417 0.035 2.12 7.71.1 Consumptive use of natural resources
1.10.1. Subsistence hunting 600 0.025 0.55 1 1 0.014 10 8 0.1375 0.11 0.028 1.64 2.081.10.2. Hunting for cultural items 200 0.008 0.55 1 1 0.005 10 8 0.0458 0.0367 0.009 0.55 0.55
1.10.3. Plant and wildlife trade(regulated) 200 0.008 0.55 1 1 0.005 10 9 0.0458 0.0413 0.005 0.27 0.42
1.10.4. Plant and wildlife trade(unregulated) 300 0.013 0.55 1 1 0.007 10 7 0.0688 0.0481 0.021 1.23 1.38
1.10.5. Traditional (subsistence) forestorchards 400 0.017 0.55 1 1 0.009 10 8 0.0917 0.0733 0.018 1.1 1.1
1.10.6. Fuel wood harvesting 500 0.021 0.55 1 1 0.011 10 7 0.1146 0.0802 0.034 2.06 2.061.11 Dams/hydroelectric projects 700 0.029 0.13 1 1 0.004 10 8 0.0379 0.0303 0.008 0.45 1.43
1.12 Renewable energy projects (wind,solar) 200 0.008 0.4 1 1 0.003 10 8 0.0333 0.0267 0.007 0.4 0.7
1.13Pollution (residential and industrialeffluents, solid waste, agricultural
chemicals)100 0.004 0.32 1 1 0.001 10 8 0.0133 0.0107 0.003 0.16 6.56
Subtotals 11,400 0.475 40.36INLAND WATER
Diversity 2021, 13, 248 16 of 19
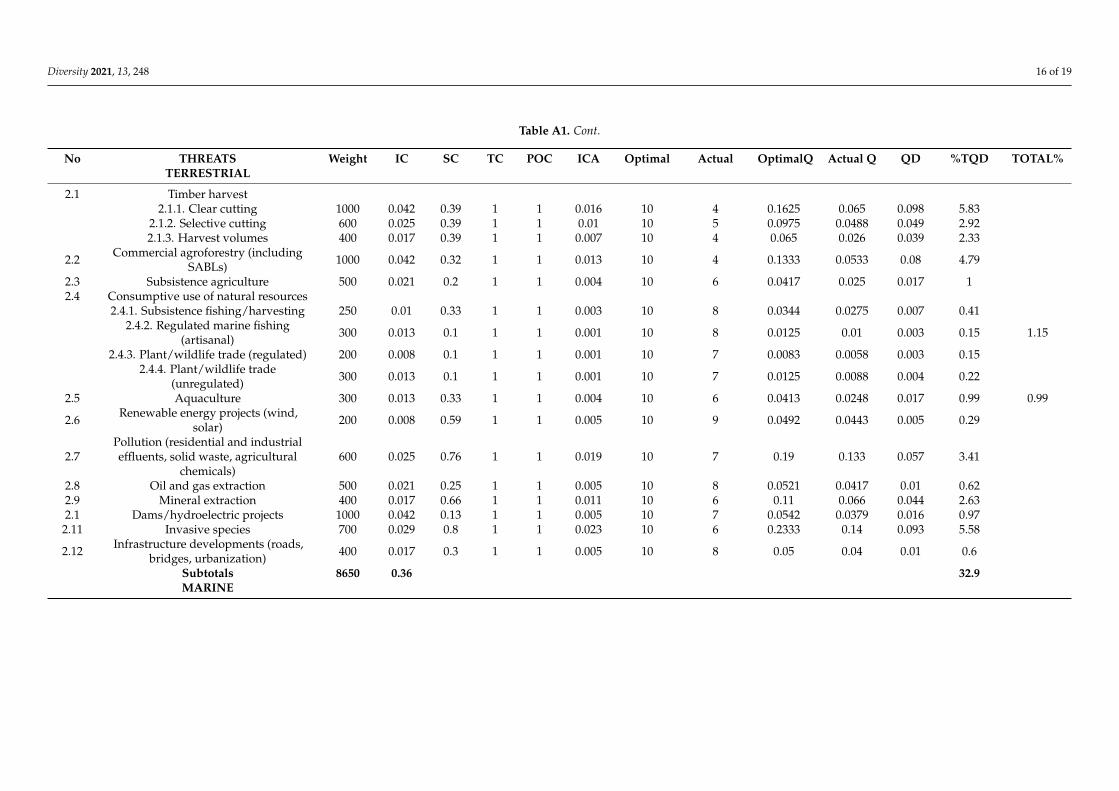
Table A1. Cont.
No THREATS Weight IC SC TC POC ICA Optimal Actual OptimalQ Actual Q QD %TQD TOTAL%TERRESTRIAL
2.1 Timber harvest2.1.1. Clear cutting 1000 0.042 0.39 1 1 0.016 10 4 0.1625 0.065 0.098 5.83
2.1.2. Selective cutting 600 0.025 0.39 1 1 0.01 10 5 0.0975 0.0488 0.049 2.922.1.3. Harvest volumes 400 0.017 0.39 1 1 0.007 10 4 0.065 0.026 0.039 2.33
2.2 Commercial agroforestry (includingSABLs) 1000 0.042 0.32 1 1 0.013 10 4 0.1333 0.0533 0.08 4.79
2.3 Subsistence agriculture 500 0.021 0.2 1 1 0.004 10 6 0.0417 0.025 0.017 12.4 Consumptive use of natural resources
2.4.1. Subsistence fishing/harvesting 250 0.01 0.33 1 1 0.003 10 8 0.0344 0.0275 0.007 0.412.4.2. Regulated marine fishing
(artisanal) 300 0.013 0.1 1 1 0.001 10 8 0.0125 0.01 0.003 0.15 1.15
2.4.3. Plant/wildlife trade (regulated) 200 0.008 0.1 1 1 0.001 10 7 0.0083 0.0058 0.003 0.152.4.4. Plant/wildlife trade
(unregulated) 300 0.013 0.1 1 1 0.001 10 7 0.0125 0.0088 0.004 0.22
2.5 Aquaculture 300 0.013 0.33 1 1 0.004 10 6 0.0413 0.0248 0.017 0.99 0.99
2.6 Renewable energy projects (wind,solar) 200 0.008 0.59 1 1 0.005 10 9 0.0492 0.0443 0.005 0.29
2.7Pollution (residential and industrialeffluents, solid waste, agricultural
chemicals)600 0.025 0.76 1 1 0.019 10 7 0.19 0.133 0.057 3.41
2.8 Oil and gas extraction 500 0.021 0.25 1 1 0.005 10 8 0.0521 0.0417 0.01 0.622.9 Mineral extraction 400 0.017 0.66 1 1 0.011 10 6 0.11 0.066 0.044 2.632.1 Dams/hydroelectric projects 1000 0.042 0.13 1 1 0.005 10 7 0.0542 0.0379 0.016 0.972.11 Invasive species 700 0.029 0.8 1 1 0.023 10 6 0.2333 0.14 0.093 5.58
2.12 Infrastructure developments (roads,bridges, urbanization) 400 0.017 0.3 1 1 0.005 10 8 0.05 0.04 0.01 0.6
Subtotals 8650 0.36 32.9MARINE
Diversity 2021, 13, 248 17 of 19
Table A1. Cont.
No THREATS Weight IC SC TC POC ICA Optimal Actual OptimalQ Actual Q QD %TQD TOTAL%TERRESTRIAL
3.1 Timber harvest (considered due tosediment transport, etc.)
3.1.1. Clear cutting 300 0.013 1 1 1 0.013 10 6 0.125 0.075 0.05 2.993.1.2. Selective cutting 150 0.006 1 1 1 0.006 10 4 0.0625 0.025 0.0375 2.243.1.3. Harvest volumes 100 0.004 1 1 1 0.004 10 5 0.0417 0.0208 0.0208 1.25
3.2 Consumptive use of natural resources3.2.1. Subsistence fishing/harvesting 200 0.008 0.01 1 1 0 10 6 0.0008 0.0005 0.0003 0.02
3.2.2. IUU marine fishing 700 0.029 1 1 1 0.029 10 5 0.2917 0.1458 0.1458 8.72 8.723.2.3. Regulated marine fishing
(commercial) 600 0.025 1 1 1 0.025 10 6 0.25 0.15 0.1 5.98 5.98
3.2.4. Regulated marine fishing(artisanal) 200 0.008 1 1 1 0.008 10 8 0.0833 0.0667 0.0167 1
3.3 Aquaculture 100 0.004 0.01 1 1 0 10 9 0.0004 0.0004 0 0
3.4 Renewable energy projects (wind,solar) 100 0.004 0.01 1 1 0 10 9 0.0004 0.0004 0 0
3.5Pollution (residential and industrialeffluents, solid waste, agricultural
chemicals)300 0.013 1 1 1 0.013 10 6 0.125 0.075 0.05 2.99
3.6 Oil and gas extraction 700 0.029 0.2 1 1 0.006 10 7 0.0583 0.0408 0.0175 1.053.7 Seabed mining 500 0.021 0.2 1 1 0.004 10 8 0.0417 0.0333 0.0083 0.5 0.5
Subtotals 3950 0.165 4.417 2.745 1.672 26.74
COMPOSITE TOTAL 24,000 1 4.783 3.026 1.758 100
Diversity 2021, 13, 248 18 of 19
References1. Polhemus, D.A.; Englund, R.A.; Allen, G.R. Freshwater biotas of New Guinea and nearby islands: Analysis of endemism, richness,
and threats. Bishop Mus. Tech. Rep. 2004, 31, 1–62.2. Hope, G. The sensitivity of the high mountain ecosystems of New Guinea to climatic change and anthropogenic impact. Arctic
Antarct. Alp. Res. 2014, 46, 777–786. [CrossRef]3. Zeriga-Alone, T.; Whitmore, N.; Sinclair, J.R. (Eds.) The Hindenburg Wall: A Review of Existing Knowledge; Wildlife Conservation
Society Papua New Guinea Program: Goroka, Papua New Guinea, 2012.4. Shearman, P.L.; Ash, J.; Mackey, B.; Bryan, J.E.; Lokes, B. Forest conversion and degradation in Papua New Guinea 1972–2000.
Biotropica 2009, 41, 379–390. [CrossRef]5. Shearman, P.L.; Bryan, J.E. A bioregional analysis of the distribution of rainforest cover, deforestation and degradation in Papua
New Guinea. Aust. Ecol. 2011, 36, 9–24. [CrossRef]6. Gideon, O. The flora of New Guinea: Its origins, affinities, and patterns of diversity and endemism. In The State of the Forests
of Papua New Guinea 2014. Measuring Change over Period 2002–2014; Bryan, J.E., Shearman, P.L., Eds.; University of Papua NewGuinea: Port Moresby, Papua New Guinea, 2015; pp. 115–135.
7. Bryan, J.E.; Shearman, P.L.; Aoro, G.; Wavine, F.; Zerry, J. (Eds.) The Current State of PNG’s Forests and Changes Between 2002 & 2014;University of Papua New Guinea: Port Moresby, Papua New Guinea, 2015.
8. Mittermeier, R.A.; Gil, P.R.; Mittermeier, C.G. Megadiversity—Earth’s Biologically Wealthiest Nations; Agrupación Sierra Madre S.C.:D.F. Mexico, Mexico, 1997.
9. Aalsbersberg, B.; Lokani, P.; Tuiwawa, M.; Waqa-Sakiti, H.; Tordoff, A.W. Ecosystem Profile: East Melanesian Islands BiodiversityHotspot; Critical Ecosystem Partnership Fund: Arlington, VA, USA, 2012.
10. Shearman, P.L.; Bryan, J.E.; Ash, J.; Hunnam, P.; Mackey, B.; Lokes, B. The State of the Forests of Papua New Guinea. Mapping theExtent and Condition of Forest Cover and Measuring the Drivers of Forest Change in the Period 1972–2002; University of Papua NewGuinea: Port Moresby, Papua New Guinea, 2008.
11. Beehler, B.M.; Sine, R. A Rapid Biodiversity Assessment of the Kaijende Highlands, Enga Province, Papua New: Birds of the KaijendeHighlands, Enga Province, Papua New Guinea; Conservation International: Washington, DC, USA, 2007.
12. McAlpine, J.; Quigley, J. Forest Resources of Papua New Guinea: Summary Statistics from the Forest Inventory Mapping (FIM) System;Australian Agency for International Development: Canberra, ACT, Australian, 1998.
13. Osborne, P.L. Biological and cultural diversity in Papua New Guinea: Conservation, conflicts, constraints and compromise. Ambio1995, 24, 231–237.
14. Alcorn, J.B. (Ed.) Papua New Guinea Conservation Needs Assessment, Vol. 1; The Biodiversity Support Program: Boroko, Papua NewGuinea, 1993.
15. Filer, C. The nature of human threat to Papua New Guinea’s biodiversity. In Papua New Guinea Country Study on Biodiversity;Sekhran, N., Miller, S.E., Eds.; PNG Department of Environment and Conservation Conservation Resource Centre: Boroko, PapuaNew Guinea, 1994; pp. 187–199.
16. Sekran, N.; Miller, S. (Eds.) Papua New Guinea Country Study on Biological Diversity; Papua New Guinea Department of Environmentand Conservation: Port Moresby, Papua New Guinea, 1996.
17. United Nations Environment Programme and Global Environmental Facility (UNEP-GEF). Papua New Guinea’s Fourth NationalReport to the Convention on Biological Diversity; United Nations Environment Programme: Port Moresby, Papua New Guinea;Global Environmental Facility: Washington, DC, USA, 2010.
18. Secretariat of the Convention on Biological Diversity (SEC CBD). Global Biodiversity Outlook 3; Secretariat of the Convention onBiological Diversity: Montréal, QC, Canada, 2010.
19. US Agency for International Development (USAID). USAID’s Biodiversity Conservation and Forestry Programs, 2015 Report: FY 2014Results and Funding; US Agency for International Development: Washington, DC, USA, 2015.
20. US Department of State (USDOS). Project Agreement Between the United States of America and The Independent State of Papua NewGuinea for Environmental Programming; U.S. Department of State: Port Moresby, Papua New Guinea, 2016.
21. Brown, C.; Busch, D.; Dutson, G.; Freifeld, H.; Krofta, D.; Polhemus, D.; Rounds, R.; White, T. Papua New Guinea BiodiversityAssessment: Final Report; United States Department of the Interior—International Technical Assistance Program: Washington,DC, USA, 2017.
22. Salafsky, N.; Margoluis, R. Threat reduction assessment: A practical and cost-effective approach to evaluating conservation anddevelopment projects. Conserv. Biol. 1999, 13, 830–841. [CrossRef]
23. Faith, D.P.; Nix, H.A.; Margules, C.R.; Hutchinson, M.F.; Walker, P.A.; West, J.; Stein, J.L.; Kesteven, J.L.; Allison, A.; Natera, G.The BioRap biodiversity assessment and planning study for Papua New Guinea. Pac. Conserv. Biol. 2001, 6, 279–288. [CrossRef]
24. Faith, D.P.; Margules, C.R.; Walker, P.A.; Stein, J.; Natera, G. Practical application of biodiversity surrogates and percentage targetsfor conservation in Papua New Guinea. Pac. Conserv. Biol. 2001, 6, 289–303. [CrossRef]
25. Faith, D.P.; Margules, C.R.; Walker, P.A. A biodiversity of conservation plan for Papua New Guinea based on biodiversitytrade-offs analysis. Pac. Conserv. Biol. 2001, 6, 304–324. [CrossRef]
26. Faith, D.P.; Walker, P.A.; Margules, C.R. Some future prospects for systematic biodiversity planning in Papua New Guinea—andfor biodiversity planning in general. Pac. Conserv. Biol. 2001, 6, 325–343. [CrossRef]
Diversity 2021, 13, 248 19 of 19
27. MacMillan, D.C.; Marshall, K. The Delphi process–an expert-based approach to ecological modelling in data-poor environments.Anim. Conserv. 2006, 9, 11–19. [CrossRef]
28. Battisti, C.; Luiselli, L.; Pantano, D.; Teofili, C. On threats analysis approach applied to a Mediterranean wetland: Is the assessmentof human-induced threats related to different level of expertise of respondents? Biodivers. Conserv. 2008, 16, 1529–1542. [CrossRef]
29. Battisti, C.; Fanelli, G.; Marini, F.; Amori, G.; Luiselli, L. Assessing the nature reserve management effort using an expert-basedthreat analysis approach. Diversity 2020, 12, 145. [CrossRef]
30. Salafsky, N.; Salzer, D.; Stattersfield, A.J.; Hilton-Taylor, C.; Neugarten, R.; Butchart, S.H.M.; Collen, B.; Cox, N.; Master, L.L.;O’Connor, S.; et al. A standard lexicon for biodiversity conservation: Unified classifications of threats and actions. Conserv. Biol.2008, 22, 97–911. [CrossRef]
31. White, T.H.; Barros, Y.d.M.; Develey, P.F.; Llerandi-Roman, I.C.; Monsegur-Rivera, O.; Trujillo-Pinto, A. Improving reintroductionplanning and implementation through quantitative SWOT analysis. J. Nat. Conserv. 2015, 28, 149–159. [CrossRef]
32. Johnson, R.; Wichern, D. Applied Multivariate Statistical Methods, 3rd ed.; Prentice Hall: Hoboken, NJ, USA, 1992.33. Lance, G.N.; Williams, W.T. A general theory of classification sorting strategies, I. Hierarchical systems. Comp. J. 1967, 9, 373–380.
[CrossRef]34. US Agency for International Development (USAID). Developing Situation Models in USAID Biodiversity Programming; US Agency
for International Development: Washington, DC, USA, 2016. Available online: https://biodiversitylinks.org/projects/completed-projects/measuring-impact/how-to-guides-for-usaid-biodiversity-programming/how-to-guides-for-usaid-biodiversity-programming/ (accessed on 22 May 2021).
35. US Agency for International Development (USAID). Pacific Islands Tropical Forestry and Biodiversity Conservation Assessment;USAID/Asia: Manila, PH, USA, 2012.
36. US Agency for International Development (USAID). Defining Outcomes & Indicators for Monitoring, Evaluation, and Learningin USAID Biodiversity Programming; US Agency for International Development: Washington, DC, USA, 2016. Available on-line: https://biodiversitylinks.org/projects/completed-projects/measuring-impact/how-to-guides-for-usaid-biodiversity-programming/how-to-guides-for-usaid-biodiversity-programming/ (accessed on 22 May 2021).
37. US Agency for International Development (USAID). Using Results Chains to Depict Theories of Change in USAID Bio-diversity Programming; US Agency for International Development: Washington, DC, USA, 2016. Available online:https://biodiversitylinks.org/projects/completed-projects/measuring-impact/how-to-guides-for-usaid-biodiversity-programming/how-to-guides-for-usaid-biodiversity-programming/ (accessed on 22 May 2021).
38. Tulloch, V.J.D.; Atkinson, S.; Possingham, H.P.; Peterson, N.; Linke, S.; Allan, J.R.; Kaiye, A.; Keako, M.; Sabi, J.; Suruman, B.; et al.Minimizing cross-realm threats from land-use change: A national-scale conservation framework connecting land, freshwater andmarine systems. Biol. Conserv. 2021, 254, 1–12. [CrossRef]
39. Australian Agency for International Development (AUSAID). Making land work: Reconciling customary land and development in thePacific—Case studies on customary land and development in the Pacific; Commonwealth of Australia: Canberra, ACT, Australia, 2008.
40. Laurance, W.F.; Kakul, T.; Keenan, R.J.; Sayer, J.; Passingan, S.; Clements, G.R.; Villegas, F.; Sodhi, N.S. Predatory corporations,failing governance, and the fate of forests in Papua New Guinea. Conserv. Lett. 2011, 4, 95–100. [CrossRef]
41. Numapo, J. Commission of Inquiry into the Special Agriculture and Business Lease (SABL): Final Report; GoPNG Commission ofInquiry: Port Moresby, Papua New Guinea, 2013.
42. Gabriel, J.; Wood, M. The Rimbunan Hijau Group in the forests of Papua New Guinea. J. Pac. Hist. 2015, 50, 322–343. [CrossRef]43. Mosseau, F.; Lau, P. The Great Timber Heist: The Logging Industry in Papua New Guinea; The Oakland Institute: Oakland, CA, USA,
2015.44. Sakata, H.; Prideaux, B. An alternative approach to community-based ecotourism: A bottom-up locally initiated non-monetised
project in Papua New Guinea. J. Sustain. Tour. 2013, 21, 880–899. [CrossRef]45. Filer, C. Why green grabs don’t work in Papua New Guinea. J. Peas. Stud. 2012, 39, 599–617. [CrossRef]46. Melick, D.R.; Kinch, J.P.; Govan, H. How global biodiversity targets risk becoming counterproductive: The case of Papua New
Guinea. Conserv. Soc. 2012, 10, 344–353. [CrossRef]47. Balboa, C.A. How successful transnational non-governmental organizations set themselves up for failure on the ground. World
Develop. 2014, 54, 273–287. [CrossRef]