quantifying diagenetic and stratigraphic controls on fracture intensity in platform carbonates: an...
TRANSCRIPT

lable at ScienceDirect
Journal of Structural Geology 32 (2010) 1943e1959
Contents lists avai
Journal of Structural Geology
journal homepage: www.elsevier .com/locate/ jsg
Quantifying diagenetic and stratigraphic controls on fracture intensity in platformcarbonates: An example from the Sierra Madre Oriental, northeast Mexico
Orlando J. Ortega a,*, Julia F.W. Gale b, Randall Marrett c
a Shell International E&P, 150 North Dairy Ashford, A-1014 Houston, TX 77079, USAbBureau of Economic Geology, Jackson School of Geosciences, The University of Texas at Austin, TX 78713, USAcDepartment of Geological Sciences, Jackson School of Geosciences, University of Texas at Austin, 1 University Station C1100, Austin, TX 78712, USA
a r t i c l e i n f o
Article history:Received 30 September 2009Received in revised form29 June 2010Accepted 2 July 2010Available online 14 July 2010
* Corresponding author.E-mail address: [email protected] (O.J. Or
0191-8141/$ e see front matter � 2010 Elsevier Ltd.doi:10.1016/j.jsg.2010.07.004
a b s t r a c t
Normalized fracture intensity measured along 1D scanlines was used to compare fracture intensity fordifferent sedimentary facies, stratigraphic position, bed thickness and degree of dolomitization incarbonate beds of the Cupido and Tamaulipas formations, northeast Mexico. We calculated the fractureintensity for individual beds, for single and combined fracture sets, and the statistical significance ofrelationships using bivariate weighted regressions and multivariate methods. Results suggest that thedegree of dolomitization is positively correlated with fracture intensity and has the strongest correlation,followed by the position of the bed in the stratigraphic cycle and the mud content. Dolomite content,normalized position in the parasequence, environment of deposition, and mud content show a signifi-cant degree of correlation among themselves and should be considered dependent variables for statis-tical purposes. Geological observations suggest that dolomite precipitation and fracturing occurred, atleast in part, synchronously in these rocks. A fracture-intensity distribution model integrating sequence-stratigraphic and diagenetic history is proposed for the Cupido and Tamaulipas formations with potentialuse in similar carbonate successions. Our analysis does not support the classic bed-thicknessefracture-spacing relationship.
� 2010 Elsevier Ltd. All rights reserved.
1. Introduction
Fracture intensity (abundance) is one of the key parametersneeded for an understanding of fluid flow in otherwise low-permeability rocks, yet it is difficult to measure directly in thesubsurface because of sampling problems. Predictive models (e.g.,Mueller, 1991; Rives et al., 1992; Fischer et al., 1995; Bai and Pollard,2000; Philip et al., 2005) require testing with datasets that face thesame problems. Nelson (2001) identified the principal geologiccontrols on fracture intensity as (1) composition, (2) texture(including grain size and porosity), (3) stratigraphy (bed thickness),and (4) structural position. Structural position has been the subjectof many studies of fracture intensity (e.g., Antonellini and Mollema,2000; Casey and Butler, 2004; papers in Hennings, 2009). Althoughstructural effects are locally important in the folded platform-carbonate rocks of the Sierra Madre Oriental, Mexico, our focus ison diagenetic, bed thickness and stratigraphic controls on fractureintensity. We selected outcrops in the same structural position inthe limb region of kilometer-scale folds, away from hinges, and
tega).
All rights reserved.
where bedding dip is constant. Variation of fracture intensitybetween outcrops due to structural position is therefore mini-mized. We used a size-normalized fracture-intensity measurementmethod described by Ortega et al. (2006). Normalized fractureintensity is determined in the context of varying sedimentaryfacies, dolomite content, bed thickness, and position of beds infifth-order stratigraphic cycles. We attempted to answer thefollowing questions. Which stratigraphic parameters exert thestrongest control on fracture intensity? Is there a predictablepattern of fracture-intensity distribution?
2. Previous fracture-intensity studies
Compositional controls on fracture intensity have been studiedin laboratory experiments (e.g., Handin et al., 1963) and in outcropsand core (Das Gupta, 1978; Sinclair, 1980; Narr, 1991; Gillespie et al.,1993, 1999, 2001; Mandal et al., 1994; Nelson and Serra, 1995;Nelson, 2001). Handin et al. (1963) found that fracture intensitydecreases from quartzites to dolostones, to sandstones, to lime-stones, and that the increase in ductility with burial is greater forlimestones than for other sedimentary rocks. Sinclair (1980) sug-gested that fine-grained carbonates have higher fracture intensity
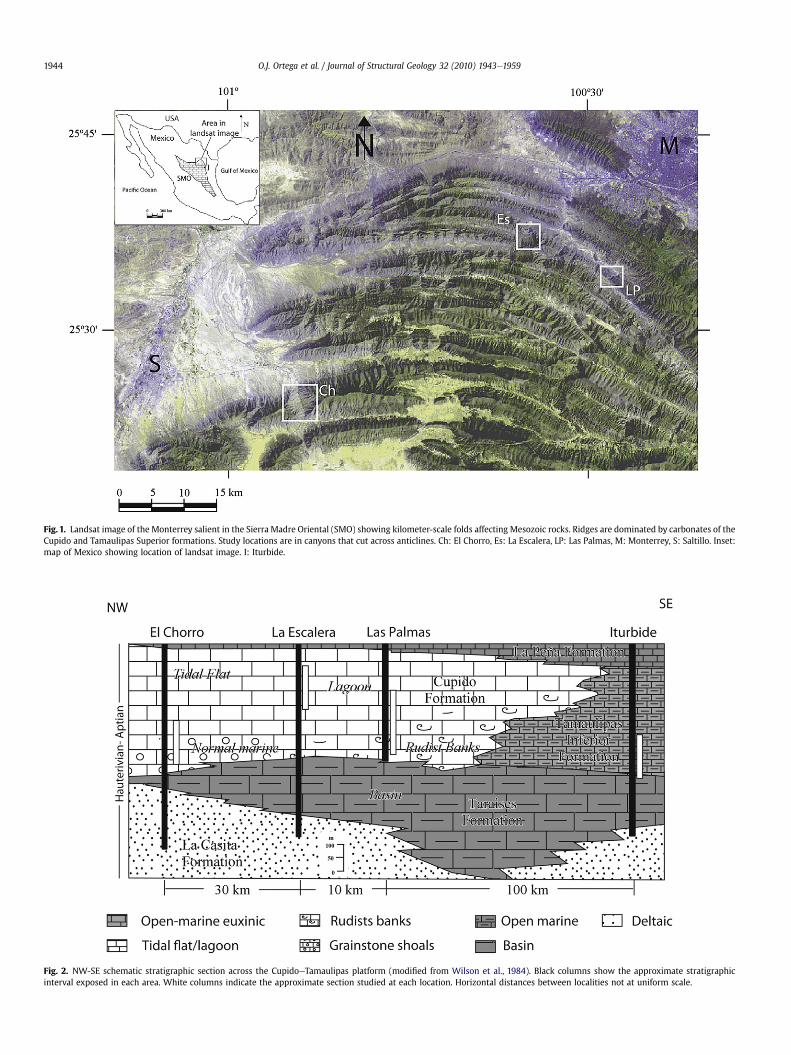
Fig. 1. Landsat image of the Monterrey salient in the Sierra Madre Oriental (SMO) showing kilometer-scale folds affecting Mesozoic rocks. Ridges are dominated by carbonates of theCupido and Tamaulipas Superior formations. Study locations are in canyons that cut across anticlines. Ch: El Chorro, Es: La Escalera, LP: Las Palmas, M: Monterrey, S: Saltillo. Inset:map of Mexico showing location of landsat image. I: Iturbide.
Fig. 2. NW-SE schematic stratigraphic section across the CupidoeTamaulipas platform (modified from Wilson et al., 1984). Black columns show the approximate stratigraphicinterval exposed in each area. White columns indicate the approximate section studied at each location. Horizontal distances between localities not at uniform scale.
O.J. Ortega et al. / Journal of Structural Geology 32 (2010) 1943e19591944

Fig. 3. Variation of facies, bed thickness, and dolomite content among layers studied.The facies definition includes textural groups and depositional environment inter-pretations. Some histograms exclude multifacies beds and/or chert beds. Total dolo-mite content is based on thin-section point counting. From Ortega et al. (2006).
A
A
B
B
A
B
B
C
C
D
T
T
A B
C
C
M
Fig. 4. Unfolded fracture orientation data, San Blas Anticline. (A) La Escalera; (B) LasPalmas. Simple rotations of poles to fractures around fold axis restoring bedding tohorizontal. Fold axis is indicated by a crossed large square. Restoration reveals twodominant fracture orientations approximately 60e70� apart. Crosscutting relation-ships between sets A and B are mutual suggesting that these sets are synchronous. SetC crosscuts sets A and B at both localities. Set D restores to a horizontal attitudesuggesting it might be related to tectonic stylolites and folding. T are poles to tectonicstylolites and M are poles to late, mud-filled fractures.
D2
D1C
C
B
A
A
B
A B
D2D1
C
CB
A
A
B
Fig. 5. Unfolded fracture orientation data, El Chorro Anticline. (A) Unfolding abouta horizontal fold axis. (B) Further rotation of 38� clockwise about a vertical axis assuggested by palaeomagnetic data (Kleist et al., 1984). Fracture sets D1 and D2 areyoungest and are probably associated with folding. Fracture sets A, B, and C probablyformed when bedding was horizontal. Set C lies subparallel to the fold axis and mayhave been formed during the shortening event that produced the fold.
O.J. Ortega et al. / Journal of Structural Geology 32 (2010) 1943e1959 1945
than coarse-grained carbonates. Das Gupta (1978) concluded thatgreater dolomitization correlates with higher fracture intensity;although dolomitized beds were thinner than limestone beds inthat study and separation of bed thickness from dolomitizationeffects on fracture intensity is difficult.
Carbonate mechanical and fracture stratigraphy was addressedby Corbett et al. (1987), Ferrill and Morris (2008), Laubach et al.(2009), and several papers in a special issue of the Journal ofStructural Geology, “Deformation in Carbonates” (Agosta and Tondi,2009). For example, Zahm et al. (2010) used integration of facies,rock strength, and mud content within a sequence-stratigraphicframework as a means of predicting faulting and jointing in lime-stone outcrops. Their study found that “fracture deformationintensity” was higher in transgressive system tracts (TST) than inhighstand system tracts (HST). The TST in that study also had moreargillaceous, thinner cycles and rocks with lower unconfinedstrength. There was, however, no dolomitization component intheir example and as we will show here, dolomitization overridesfacies and mud-content controls on fracture intensity.
3. Study area
The study area is in the north-central part of the Sierra MadreOriental (SMO) fold and thrust belt in northeastern Mexico (Fig. 1).An Upper HauterivianeLower Aptian platform-to-basin carbonatesystem, comprising the Cupido, Tamaulipas Superior, and
A
B
A
C
D
Fig. 6. Unfolded fracture orientation data, Iturbide Anticline. Unfolding is about a foldaxis plunging 20� southeast. Fracture set D is the youngest and is probably associatedwith tectonic stylolites (T) and folding. Fracture sets A, B, and C probably formed whenbedding was horizontal e they are close in orientation to similarly labeled sets at otherlocations.
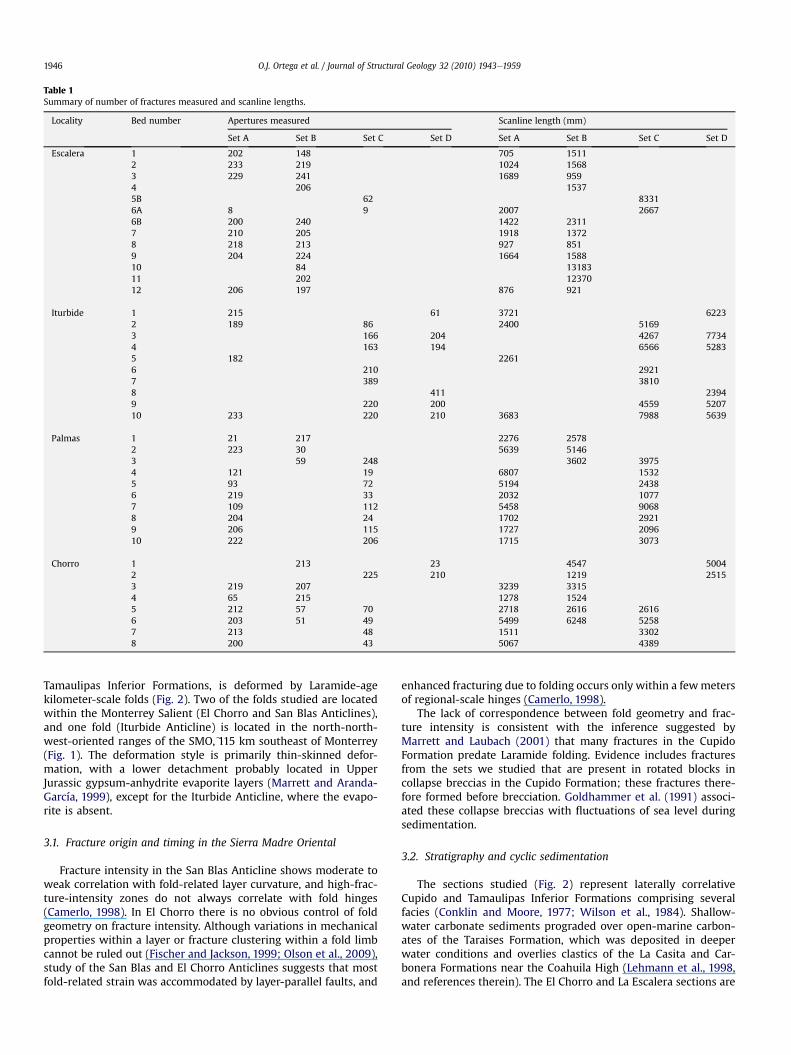
Table 1Summary of number of fractures measured and scanline lengths.
Locality Bed number Apertures measured Scanline length (mm)
Set A Set B Set C Set D Set A Set B Set C Set D
Escalera 1 202 148 705 15112 233 219 1024 15683 229 241 1689 9594 206 15375B 62 83316A 8 9 2007 26676B 200 240 1422 23117 210 205 1918 13728 218 213 927 8519 204 224 1664 158810 84 1318311 202 1237012 206 197 876 921
Iturbide 1 215 61 3721 62232 189 86 2400 51693 166 204 4267 77344 163 194 6566 52835 182 22616 210 29217 389 38108 411 23949 220 200 4559 520710 233 220 210 3683 7988 5639
Palmas 1 21 217 2276 25782 223 30 5639 51463 59 248 3602 39754 121 19 6807 15325 93 72 5194 24386 219 33 2032 10777 109 112 5458 90688 204 24 1702 29219 206 115 1727 209610 222 206 1715 3073
Chorro 1 213 23 4547 50042 225 210 1219 25153 219 207 3239 33154 65 215 1278 15245 212 57 70 2718 2616 26166 203 51 49 5499 6248 52587 213 48 1511 33028 200 43 5067 4389
O.J. Ortega et al. / Journal of Structural Geology 32 (2010) 1943e19591946
Tamaulipas Inferior Formations, is deformed by Laramide-agekilometer-scale folds (Fig. 2). Two of the folds studied are locatedwithin the Monterrey Salient (El Chorro and San Blas Anticlines),and one fold (Iturbide Anticline) is located in the north-north-west-oriented ranges of the SMO,e115 km southeast of Monterrey(Fig. 1). The deformation style is primarily thin-skinned defor-mation, with a lower detachment probably located in UpperJurassic gypsum-anhydrite evaporite layers (Marrett and Aranda-García, 1999), except for the Iturbide Anticline, where the evapo-rite is absent.
3.1. Fracture origin and timing in the Sierra Madre Oriental
Fracture intensity in the San Blas Anticline shows moderate toweak correlation with fold-related layer curvature, and high-frac-ture-intensity zones do not always correlate with fold hinges(Camerlo, 1998). In El Chorro there is no obvious control of foldgeometry on fracture intensity. Although variations in mechanicalproperties within a layer or fracture clustering within a fold limbcannot be ruled out (Fischer and Jackson, 1999; Olson et al., 2009),study of the San Blas and El Chorro Anticlines suggests that mostfold-related strain was accommodated by layer-parallel faults, and
enhanced fracturing due to folding occurs only within a fewmetersof regional-scale hinges (Camerlo, 1998).
The lack of correspondence between fold geometry and frac-ture intensity is consistent with the inference suggested byMarrett and Laubach (2001) that many fractures in the CupidoFormation predate Laramide folding. Evidence includes fracturesfrom the sets we studied that are present in rotated blocks incollapse breccias in the Cupido Formation; these fractures there-fore formed before brecciation. Goldhammer et al. (1991) associ-ated these collapse breccias with fluctuations of sea level duringsedimentation.
3.2. Stratigraphy and cyclic sedimentation
The sections studied (Fig. 2) represent laterally correlativeCupido and Tamaulipas Inferior Formations comprising severalfacies (Conklin and Moore, 1977; Wilson et al., 1984). Shallow-water carbonate sediments prograded over open-marine carbon-ates of the Taraises Formation, which was deposited in deeperwater conditions and overlies clastics of the La Casita and Car-bonera Formations near the Coahuila High (Lehmann et al., 1998,and references therein). The El Chorro and La Escalera sections are

Fracturing (D)
Diageneticevents
Early LateRelative timing
MicritizationBioturbationEarly CompactionCalcite C1
Calcite C2Dissolution
Dolomite D1Fracturing (A,B,C)
Pressure solutionDolomite D2
Tectonic Stylolites
Tectonicdeformation
Uplifting
RecrystallizationDedolomitizationSilicification
Calcite C4
Exhumation Joints
BurialPre-burial
Dissolution CollapseCalcite C3
Fig. 7. Paragenetic sequence for shallow-water facies of the Cupido Formation at ElChorro, La Escalera and Las Palmas. Fracturing events in the diagenetic history of theCupido Formation (modified from Monroy et al., 2001). Star: most probable timing forbreccia collapse. Black dots: interpreted timing for fracturing events. Dashed line:possible extent of event. Solid line: probable timing on the basis of field observations,petrography and kinematic analyses (Ortega, 2002).
O.J. Ortega et al. / Journal of Structural Geology 32 (2010) 1943e1959 1947
dominated by lagoonal and intertidal carbonate facies. The LasPalmas section contains abundant bivalve bioherms and grainstoneshoals of the platform’s outer margin. The section at Iturbide iscomposed mainly of open-marine, deeper water, fine-grainedcarbonates of the Tamaulipas Inferior and Taraises Formations(Wilson et al., 1984; Goldhammer et al., 1991, and referencestherein).
Sedimentation in the inner platform facies of the CupidoFormation is cyclic (Wilson et al., 1984; Goldhammer, 1999,Lehmann et al., 1998) and has been interpreted as an effect ofclimatic and autogenic processes on Milankovitch-driven eustaticsea-level fluctuations (Lehmann et al., 1998). Each parasequencecomprises an upward-shallowing succession of lagoonal burrowedlimestones on top of hard grounds or sedimentary breccias, fol-lowed by grainstone shoals or rudist bioherms, and is capped bycryptalgal/microbial laminites and/or evaporites. By quantifyingtextural, diagenetic, and rock-composition controls on opening-mode fracture intensity, we also assess to what degree the under-lying architecture of a carbonate platform may be used to predictfracture stratigraphy and intensity.
3.3. Diagenesis
Most dolomitized layers are at or near the tops of para-sequences, suggesting focused, localized dolomitization in shallow-water environments. Similar distribution of dolomitization withinparasequences was described by Lehmann et al. (1998) in rocks ofsimilar age adjacent to the Monterrey Salient. Other dolomitizationevents also affected these rocks. Burial-related dolomitizationevents are supported by petrographic textures, fluid inclusionanalyses, and results of isotopic analyses in host rock and fractures(Monroy-Santiago et al., 2001; Guzzy-Arredondo et al., 2007;Fischer et al., 2009).
Monroy-Santiago et al. (2001) recognized recrystallization,dedolomitization, and silicification as late diagenetic events in all
locations. Recrystallization largely postdated dolomitization, asindicated by corroded dolomite crystals that have lost their orig-inal euhedral facets. Silica replacement (silicification) occurred intwo forms: (1) late, euhedral quartz crystals in fractures, withinclusions of calcite and dolomite crystals and (2) rare, micro-crystalline quartz and chalcedony, selectively replacing dolomi-tized allochems. Evidence of dedolomitization in the CupidoFormation is documented by aggressive replacement of dolomiteby calcite. This late diagenetic event was probably contempora-neous with exhumation and circulation of phreatic waters(Monroy-Santiago et al., 2001).
4. Methodology
Ortega et al. (2006) discussed the problem of lack of explicitaccounting for fracture size in previous studies of fracture intensityor spacing (e.g., Bogdonov, 1947; Ladeira and Price, 1981; Narr andSuppe, 1991; Wu and Pollard, 1995; Narr, 1996). Ortega et al. (2006)demonstrated that fracture size and intensity are covariant andproposed a scale-independent approach to fracture intensity andspacing quantification. We adopt their methods for reportingfracture intensity, which they defined for 1D data as the number offractures encountered per unit length along a sample line orientedperpendicular to a fracture set. We used a fracture-aperturecomparator to measure fracture apertures down to e50 mm bycomparing apertures (wall-to-wall width of fracture) with printedlines of calibrated width from 50 mm to 5 mm (Ortega et al., 2006).Fracture intensities were then determined for apertures � 0.2 mmfrom the best-fit aperture-size distribution models for measure-ments of each set. The 0.2-mm size was chosen for comparisonbecause it is within the midsize range (log scale) for each pop-ulation. More than 14,200 fracture-aperture values from 42 bedscompose the fracture-size database.
Orientation, morphology, and width (kinematic aperture oropening displacement); crosscutting relationships; compositionand texture of fracture fill; and mechanical layer thickness wererecorded for each fracture set. Mechanical bed thickness, rangingfrom <10 cm to nearly 2 m, was defined by bed-perpendicularfracture extent (height). At least four fracture sets were identified ateach location and have been labeled A, B, C, D, and M from oldest toyoungest. Fracture sets with the same label that are from differentlocalities are not necessarily of the same age.
For this study, beds were chosen to represent contrasting sedi-mentary facies and varying bed thickness and degree of dolomiti-zation (Fig. 3). Fracture-intensity analyses were made for twobroadly defined sedimentary facies: mud supported and grainsupported. Dolomite content in the rocks studied ranges from 0 to100%. Most beds are either highly dolomitized or not dolomitized(Fig. 3). Degree of dolomitization was determined in thin sectionsstained with Alizarin Red, although the relative proportions ofdolomite that precipitated in different dolomitization events wasnot quantified. Sedimentary facies and diagenetic modificationwere described by Ortega (2002).
Effects of sedimentary and diagenetic factors on fractureintensity were analyzed first by an investigation of simple corre-lations of each variable and fracture intensity. The number ofobservations together with the coefficient of determination ofweighted regression analyses provided a tool for evaluating relativeimportance of stratigraphic and diagenetic controls on fractureintensity (Young, 1962). These regressions take into accountuncertainties associated with fracture-intensity determinationsfollowing the methodology of Jensen et al. (1997). Multivariateanalysis allowed the individual contributions of each factor andtheir cross-correlations to be taken into account (Swan andSandilands, 1995).
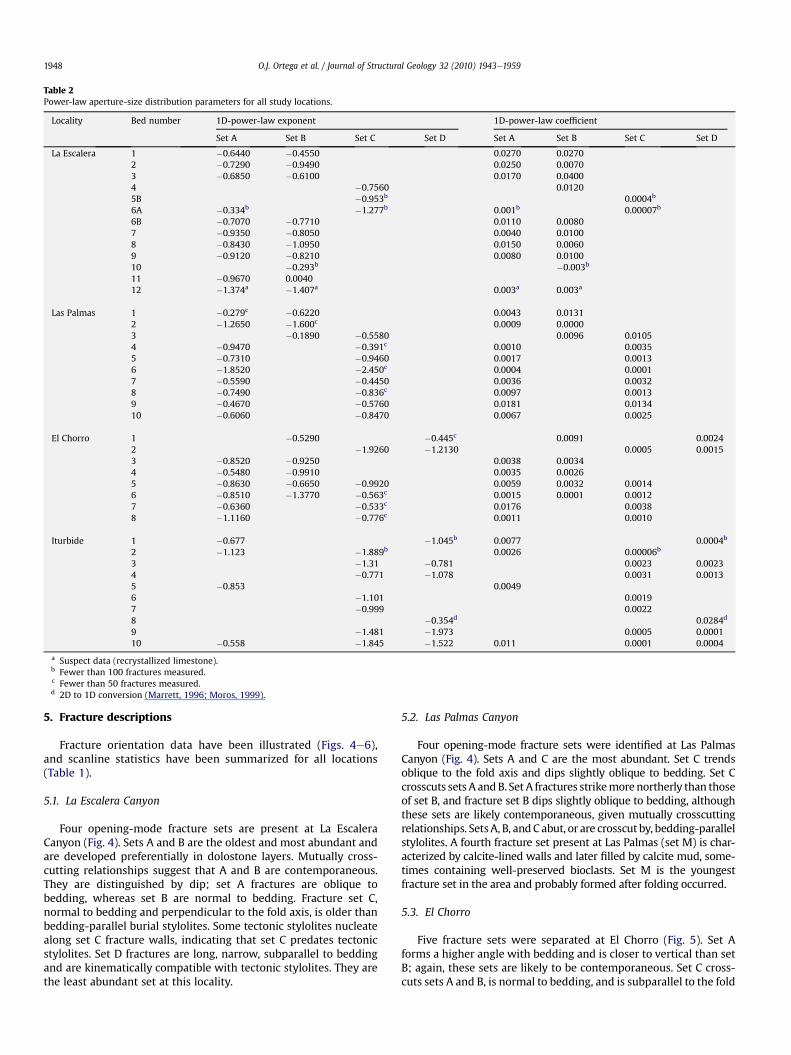
Table 2Power-law aperture-size distribution parameters for all study locations.
Locality Bed number 1D-power-law exponent 1D-power-law coefficient
Set A Set B Set C Set D Set A Set B Set C Set D
La Escalera 1 �0.6440 �0.4550 0.0270 0.02702 �0.7290 �0.9490 0.0250 0.00703 �0.6850 �0.6100 0.0170 0.04004 �0.7560 0.01205B �0.953b 0.0004b
6A �0.334b �1.277b 0.001b 0.00007b
6B �0.7070 �0.7710 0.0110 0.00807 �0.9350 �0.8050 0.0040 0.01008 �0.8430 �1.0950 0.0150 0.00609 �0.9120 �0.8210 0.0080 0.010010 �0.293b �0.003b
11 �0.9670 0.004012 �1.374a �1.407a 0.003a 0.003a
Las Palmas 1 �0.279c �0.6220 0.0043 0.01312 �1.2650 �1.600c 0.0009 0.00003 �0.1890 �0.5580 0.0096 0.01054 �0.9470 �0.391c 0.0010 0.00355 �0.7310 �0.9460 0.0017 0.00136 �1.8520 �2.450c 0.0004 0.00017 �0.5590 �0.4450 0.0036 0.00328 �0.7490 �0.836c 0.0097 0.00139 �0.4670 �0.5760 0.0181 0.013410 �0.6060 �0.8470 0.0067 0.0025
El Chorro 1 �0.5290 �0.445c 0.0091 0.00242 �1.9260 �1.2130 0.0005 0.00153 �0.8520 �0.9250 0.0038 0.00344 �0.5480 �0.9910 0.0035 0.00265 �0.8630 �0.6650 �0.9920 0.0059 0.0032 0.00146 �0.8510 �1.3770 �0.563c 0.0015 0.0001 0.00127 �0.6360 �0.533c 0.0176 0.00388 �1.1160 �0.776c 0.0011 0.0010
Iturbide 1 �0.677 �1.045b 0.0077 0.0004b
2 �1.123 �1.889b 0.0026 0.00006b
3 �1.31 �0.781 0.0023 0.00234 �0.771 �1.078 0.0031 0.00135 �0.853 0.00496 �1.101 0.00197 �0.999 0.00228 �0.354d 0.0284d
9 �1.481 �1.973 0.0005 0.000110 �0.558 �1.845 �1.522 0.011 0.0001 0.0004
a Suspect data (recrystallized limestone).b Fewer than 100 fractures measured.c Fewer than 50 fractures measured.d 2D to 1D conversion (Marrett, 1996; Moros, 1999).
O.J. Ortega et al. / Journal of Structural Geology 32 (2010) 1943e19591948
5. Fracture descriptions
Fracture orientation data have been illustrated (Figs. 4e6),and scanline statistics have been summarized for all locations(Table 1).
5.1. La Escalera Canyon
Four opening-mode fracture sets are present at La EscaleraCanyon (Fig. 4). Sets A and B are the oldest and most abundant andare developed preferentially in dolostone layers. Mutually cross-cutting relationships suggest that A and B are contemporaneous.They are distinguished by dip; set A fractures are oblique tobedding, whereas set B are normal to bedding. Fracture set C,normal to bedding and perpendicular to the fold axis, is older thanbedding-parallel burial stylolites. Some tectonic stylolites nucleatealong set C fracture walls, indicating that set C predates tectonicstylolites. Set D fractures are long, narrow, subparallel to beddingand are kinematically compatible with tectonic stylolites. They arethe least abundant set at this locality.
5.2. Las Palmas Canyon
Four opening-mode fracture sets were identified at Las PalmasCanyon (Fig. 4). Sets A and C are the most abundant. Set C trendsoblique to the fold axis and dips slightly oblique to bedding. Set Ccrosscuts sets A andB. Set A fractures strikemorenortherly than thoseof set B, and fracture set B dips slightly oblique to bedding, althoughthese sets are likely contemporaneous, given mutually crosscuttingrelationships. SetsA, B, andC abut, or are crosscut by, bedding-parallelstylolites. A fourth fracture set present at Las Palmas (set M) is char-acterized by calcite-lined walls and later filled by calcite mud, some-times containing well-preserved bioclasts. Set M is the youngestfracture set in the area and probably formed after folding occurred.
5.3. El Chorro
Five fracture sets were separated at El Chorro (Fig. 5). Set Aforms a higher angle with bedding and is closer to vertical than setB; again, these sets are likely to be contemporaneous. Set C cross-cuts sets A and B, is normal to bedding, and is subparallel to the fold
0.100
0.200
Set A Set B Combined Sets AB Set C Set D All Sets
Grain supported Mud supported
Grain supported Mud supportedGrain supported Mud supported
Open marine mudstones Chert
Frac
ture
Int
ensi
ty, I
(nu
mbe
r of
frac
ture
s >
0.2
mm
wid
e/m
m)
Frac
ture
Int
ensi
ty, I
(nu
mbe
r of
frac
ture
s >
0.2
mm
wid
e/m
m)
El Chorro Canyon
0.000
0.010
0.020
0.030
0.040
0.050
0.060
0.070La Escalera Canyon
0.000
0.050
0.100
0.150
Las Palmas CanyonIturbide Anticline
0
0.020
0.040
0.060
0.080
0.100
0.120
0.000
0.020
0.040
0.060
0.080
Fig. 8. Sedimentary facies control on fracture intensity.
O.J. Ortega et al. / Journal of Structural Geology 32 (2010) 1943e1959 1949
axis. Sets D1 and D2 are vertical and are interpreted as conjugateshear-vein setsdD1 is oblique to the fold axis and forms a lowanglewith bedding, whereas D2 is parallel to bedding and is similar tofracture set D at La Escalera Canyon in morphology and geometricrelationships.
5.4. Iturbide
Four fracture sets are present at Iturbide (Fig. 6). Fractures aregenerally long and narrow, but fractures that reach bed boundaries
0
0.005
0.010
0.015
0.020
0.070
Frac
ture
Int
ensi
ty, I
(nu
mbe
r of
fra
ctur
es >
0.2
mm
wid
e/m
m)
I = 0.00001 M + 0.0045 = 0.0098
Mud content, M (%)
I = 0.0002 M + 0.0030
El Chorro C
Mud content, M (%)
weighted regression
r2
r2
= 0.3263
weighted regression
0
0.010
0.020
0.030
0.040
0.050
0.060
0 20 40 60 80 100
Set A
0 20 40 60 80 100
Set C
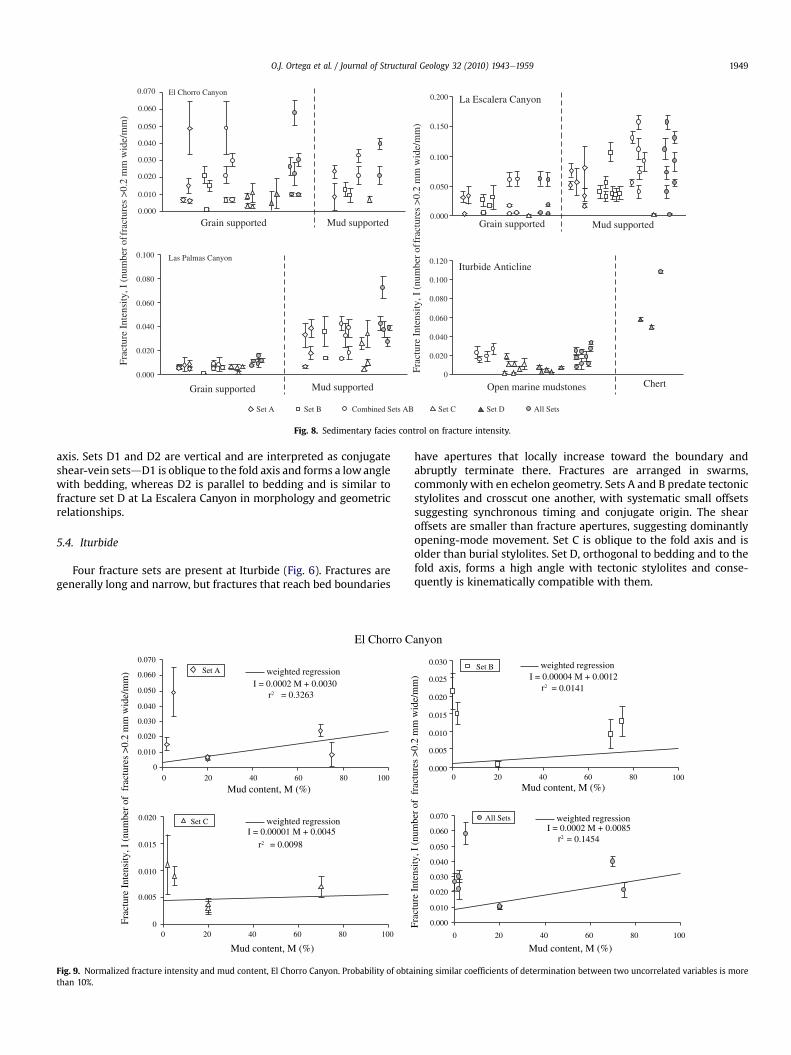
Fig. 9. Normalized fracture intensity and mud content, El Chorro Canyon. Probability of obtathan 10%.
have apertures that locally increase toward the boundary andabruptly terminate there. Fractures are arranged in swarms,commonly with en echelon geometry. Sets A and B predate tectonicstylolites and crosscut one another, with systematic small offsetssuggesting synchronous timing and conjugate origin. The shearoffsets are smaller than fracture apertures, suggesting dominantlyopening-mode movement. Set C is oblique to the fold axis and isolder than burial stylolites. Set D, orthogonal to bedding and to thefold axis, forms a high angle with tectonic stylolites and conse-quently is kinematically compatible with them.
0.030
0.040
0.050
0.020
0.060
0.025
0.020
I = 0.00004 M + 0.0012
I = 0.0002 M + 0.0085 = 0.1454
Frac
ture
Int
ensi
ty, I
(nu
mbe
r of
fra
ctur
es >
0.2
mm
wid
e/m
m)
Mud content, M (%)
Mud content, M (%)
= 0.0141
anyon
weighted regression
r2
r2
weighted regression
0.000
0.005
0.010
0.015
0.030
0 20 40 60 80 100
Set B
0.000
0.010
0.070
0 20 40 60 80 100
All Sets
ining similar coefficients of determination between two uncorrelated variables is more

I = 0.0011 M + 0.0065 = 0.7664
weighted regressionI = -0.00004 M + 0.0071
= 0.0360
weighted regression
I = 0.0005 M + 0.0072 = 0.5351
weighted regression
I = 0.0004 M + 0.0013 = 0.6569
La Escalera CanyonFr
actu
re I
nten
sity
, I (
num
ber
of f
ract
ures
>0.
2 m
m w
ide/
mm
)
Frac
ture
Int
ensi
ty, I
(nu
mbe
r of
fra
ctur
es >
0.2
mm
wid
e/m
m)
Mud content, M (%)
Set A
weighted regression
Mud content, M (%)
Set B
Mud content, M (%)
Combined Sets AB
Mud content, M (%)
All sets
0
0.020
0.040
0.060
0.080
0.100
0.120
0.140
0 20 40 60 80 1000.000
0.020
0.040
0.060
0.080
0.100
0.120
0.140
0 20 40 60 80 100
0.000
0.050
0.100
0.150
0.200
0 20 40 60 80 1000.000
0.050
0.100
0.150
0.200
0 20 40 60 80 100
r2r2
r2 r2
Fig. 10. Normalized fracture intensity and mud content, La Escalera Canyon. The coefficients of determination for regressions vary from r2 ¼ 0.5351 for set B to r2 ¼ 0.7664 for sets Aand B combined, suggesting that there is less than a 2% chance that these variables are uncorrelated. The slope of the regression lines suggests that mud content can producea variation of fracture intensity from 0.04 to 0.12 fractures/mm, in fractures with aperture greater than 0.2 mm.
O.J. Ortega et al. / Journal of Structural Geology 32 (2010) 1943e19591950
5.5. Petrography
Petrographic analyses of samples from the 43 carbonate bedsstudied allowed a comparison with the paragenetic sequenceestablished by Monroy-Santiago et al. (2001) (Fig. 7). Petrographywas described by Ortega (2002), and his findings relevant to thisstudy are summarized here. Fractures are partly or completelysealed, and cements include calcite, dolomite, and quartz. Fracturesin dolostones, lined by euhedral dolomite crystals, contain
I = 0.00006 M + 0.0021
= 0..2159
Mud content, M (%)
Frac
ture
Int
ensi
ty, I
(nu
mbe
r of
fra
ctur
es >
0.2
mm
wid
e/m
m)
Las Palmas C
I = 0.00004 M + 0.0050 = 0.1195
Mud content, M (%)
weighted regression
weighted regression
0.000
0.010
0.020
0.030
0.040
0.050
0 20 40 60 80 100
Set A
0
0.01
0.02
0.03
0.04
0.05
0 20 40 60 80 100
Set C
r2
r2
r2
Fig. 11. Normalized fracture intensity and mud content, Las Palmas Canyon. The coefficientsA, r2 ¼ 0.2159 for set C, r2 ¼ 0.0913 for all sets combined. Probability of obtaining similar
dolomite bridges from wall to wall, suggesting that dolomite wasthe first mineral phase filling these fractures. Multiple dolomitebridges adjacent to one another give a fibrous texture to the frac-ture fill, with saw-tooth contacts between the fibers. Ramsay (1980)described similar fibrous veins and interpreted them as indicativeof cementation synchronous with fracture opening. Calcite cementprecipitated after dolomite precipitated, filling the remaining porespace in fractures. Dolomite is synkinematic, calcite is post-kinematic (Laubach, 2003; Gale et al., 2010), and dolomite-lined
I = 0.0001 M + 0.0096 = 0.0913
Frac
ture
Int
ensi
ty, I
(nu
mbe
r of
fra
ctur
es >
0.2
mm
wid
e/m
m)
anyon
Mud content, M (%)
I = 0.0023 M - 0.1351 = 0.960
Mud content, M (%)
weighted regression
weighted regression
0
0.01
0.02
0.03
0.04
0.05
0.06
0.07
0.08
0 20 40 60 80 100
Set B
0
0.02
0.04
0.06
0.08
0.1
0 20 40 60 80 100
All Sets
r2
r2
of determination for these weighted regressions show a large range: r2 ¼ 0.1195 for setcoefficients of determination between two uncorrelated variables is >10%.

0.02
0.04
0.05
0.10
0.15
0.20
SLE
SLE
SHESHE
SHE
SHE
SLE
IntT
SLEIntTSLE
IntTSHE
SHESHESHESHE
IntT: Intertidal SHE: Subtidal High Energy SLE: Subtidal Low Energy OpM: Open Marine
IntT
IntT
IntT
SHE
SLE
IntTIntTSLE
SHE
SHESHE
SLE
Sort
ed T
otal
Fra
ctur
e In
tens
ity, I
(nu
mbe
r of
fr
actu
res
>0.
2 m
m w
ide/
mm
)
Sort
ed T
otal
Fra
ctur
e In
tens
ity, I
(nu
mbe
r of
frac
ture
s >
0.2
mm
wid
e/m
m)
El Chorro CanyonI = 0.0062 N- 0.0006
= 0.8953
0.00
0.01
0.02
0.03
0.04
0.05
0.06
0.07
0 2 4 6 8Sorted number, N
SLE
Las Palmas CanyonI = 0.0063N - 0.0075
= 0.8562
0.00
0.02
0.04
0.06
0.08
0 2 4 6 8 10
La Escalera CanyonI = 0.0126N - 0.0262
= 0.9577
00 2 4 6 8 10 12
SHE
Sorted number, N
Sorted number, N
Iturbide AnticlineI = 0.0031N + 0.0044
= 0.9728
0
0 2 4 6 8Sorted number, N
OpMOpM
OpMOpMOpMOpM
OpMOpM
OpM
r2 r2
r2
r2
Fig. 12. Total normalized fracture intensity and interpreted environment of deposition. Fracture intensity was sorted from lowest to highest, and beds numbered sequentially.
O.J. Ortega et al. / Journal of Structural Geology 32 (2010) 1943e1959 1951
fractures most likely contained significant and persistent open porespace until fractures were sealed by late calcite, possibly late in theCupido Formation’s burial history (Monroy-Santiago et al., 2001).Recrystallization did not occur in all limestone beds, but wherepresent, it blurred the contrast between mineral fill in older frac-tures and matrix and obscured fractures having apertures smallerthan the mean recrystallized grain size. Only a few grainstones andboundstones recrystallized to sparry calcite. In these cases, frac-tures with apertures < 0.1 mm can be indistinguishable frommatrix. Dedolomitization and silicification affected dolomite andcalcite cements in fractures and matrix.
Set A
0.00
0.02
0.04
0.06
0.08
0.10
0.12
0.14
0 500 1000 1500 2000Bed thickness, h (mm)
Frac
ture
Int
ensi
ty, I
(nu
mbe
r of
fra
ctur
es >
0.2
mm
wid
e/m
m)
Set AB
0.00
0.05
0.10
0.15
0.20
0 500 1000 1500 2000Bed thickness, h (mm)
weighted regressionI=-6 10-6 h + 0.0336
r2= 0.0226
weighted regressionI= -8 10-6 h + 0.0865
r2= 0.0114
Fig. 13. Bed thickness control on fracture intensity in dolostone beds (>50% dolomite contenbeds, is r2 ¼ 0.0226, and the coefficient of determination for set B, based on 9 beds, is r2 ¼ 0close to zero (r2 ¼ 0.0114).
6. Normalized fracture-intensity results and statistical analysisof controls on fracture intensity
Aperture-size data for each scanline were plotted as cumu-lativeefrequency plots, and best-fit size distribution equationswere defined. Power-law exponents and coefficients obtained fromthe equations are summarized in Table 2. We used these equationsto obtain normalized fracture-intensity numbers and plotted them(Figs. 8e23). The plots show variation in intensity with a series ofparameters: facies type, mud content, depositional environment,bed thickness, and dolomite content.
Set B
0.00
0.02
0.04
0.06
0.08
0.10
0.12
0.14
0 500 1000 1500 2000Bed thickness, h (mm)
All sets
0.00
0.05
0.10
0.15
0.20
0 500 1000 1500 2000Bed thickness, h (mm)
weighted regressionI= 3 10-6 h + 0.0384
r2= 0.0088
weighted regressionI= -8 10-6 h + 0.0865
r2= 0.0114
Frac
ture
Int
ensi
ty, I
(nu
mbe
r of
fra
ctur
es >
0.2
mm
wid
e/m
m)
t), La Escalera Canyon. The coefficient of determination for set A, based on data from 8.0088. The coefficient of determination to the combination of sets A and B is also very

Set AB
0.00
0.01
0.02
0.03
0.04
0 200 400 600 800 1000
Bed thickness, h (mm)
Frac
ture
Int
ensi
ty, I
(nu
mbe
r of
fra
ctur
es >
0.2
mm
wid
e/m
m)
weighted regressionI=-1.3 10-5 h + 0.0147
r2= 0.4548
Set C
0.00
0.01
0.02
0.03
0 500 1000 1500
Bed thickness, h (mm)
Set D
0.000
0.002
0.004
0.006
0.008
0.010
0.012
0 500 1000 1500
Bed thickness, h (mm)
weighted regressionI=6 10-6 h + 0.0008
r2= 0.9689
weighted regressionI=-1.9 10-8 h + 0.0022
r2= 2 10-6
All sets
0.000
0.010
0.020
0.030
0.040
0 500 1000 1500
Bed thickness , h (mm)
weighted regressionI=9 10-6 h + 0.0130
r2= 0.2343
Frac
ture
Int
ensi
ty, I
(nu
mbe
r of
fra
ctur
es >
0.2
mm
wid
e/m
m)
Fig. 14. Bed thickness control on fracture intensity, open-marine mudstones, Iturbide Anticline. Weighted regression to fracture intensity for all sets yields a low coefficient ofdetermination (r2 ¼ 0.2343) suggesting that fracture intensity increases with bed thickness, similar to the relationship obtained for fracture sets AB and D, although there is morethan 10% probability of obtaining this degree of correlation for similar number of data points between uncorrelated variables.
O.J. Ortega et al. / Journal of Structural Geology 32 (2010) 1943e19591952
6.1. Sedimentary facies control on fracture intensity
Facies were interpreted by thin-section analysis of rockcomposition, texture, biologic content, energy level during depo-sition (following Dunham, 1962), and position of the bed withinstratigraphic cycles. Intensities were compared for mud-supportedvs. grain-supported facies at the different localities (Fig. 8), andthen intensities were analyzed against mud content by set for ElChorro, La Escalera, and Las Palmas (Figs. 9e11).
6.1.1. El ChorroFracture intensities in grain-supported and mud-supported
beds overlap considerably (Fig. 8). Weighted regressions suggest
Frac
ture
Int
ensi
ty, I
(nu
mbe
r of
fra
ctur
es >
0.2
mm
wid
e/m
m)
Set A
0
0.01
0.02
0 500 1000 1500 2000Bed thickness, h (mm)
Set C
0
0.010
0.020
0.030
0 500 1000 1500Bed thickness, h (mm)
weighted regressionI=-1.6 10-6 h + 0.0079
r2= 0.0694
weighted regressionI=2 10-6 h + 0.0016
r2= 0.0285
Fig. 15. Normalized fracture intensity and bed thickness, lim
that fracture intensity of each set increases with an increase in mudcontent in the rock but that the correlation is weak (Fig. 9). Mostbeds studied are grain supported; only two layers have >50% mudcontent.
6.1.2. La EscaleraFracture intensity and mud content have a modest, positive
correlation in Sets A, B, and AB combined (Fig. 10). Fracture set Cintensity was measured in only two beds with low fractureintensityda grain-supported bed and a mud-supported subtidalfacies layer. If these results are included in the plot for all sets(Fig. 10), then the weighted regressions indicate no correlationbetween mud content and fracture intensity.
Set AB
0
0.01
0.02
0.03
0.04
0.05
0.06
0 500 1000 1500 2000Bed thickness, h (mm)
All sets
0
0.01
0.02
0.03
0.04
0.05
0.06
0 500 1000 1500Bed thickness, h (mm)
Frac
ture
Int
ensi
ty, I
(nu
mbe
r of
fra
ctur
es >
0.2
mm
wid
e/m
m)
weighted regressionI=3 10-6 h + 0.0069
r2= 0.0749
weighted regressionI=1.1 10-5 h + 0.0086
r2= 0.2562
estones (<50% dolomite content), Las Palmas Canyon.
Frac
ture
Int
ensi
ty, I
(nu
mbe
r of
fra
ctur
es >
0.2
mm
wid
e/m
m)
Frac
ture
Int
ensi
ty, I
(nu
mbe
r of
frac
ture
s >
0.2
mm
wid
e/m
m)
Set A
0
0.01
0.02
0.03
0.04
0.05
0 100 200 300 400 500 600Bed thickness, h (mm)
Set C
0
0.01
0.02
0.03
0.04
0.05
0 100 200 300 400 500 600
Bed thickness, h (mm)
All sets
0
0.02
0.04
0.06
0.08
0.10
0 100 200 300 400 500 600
Bed thickness, h (mm)
weighted regressionI=1.2 10-5 h + 0.0237
r2= 0.0327
weighted regressionI=-1.7 10-5 h + 0.0135
r2= 0.4771
weighted regressionI=4 10-8 h + 0.0354
r2= 2 10-7
Fig. 16. Normalized fracture intensity and bed thickness, dolostones (>50% dolomite content), Las Palmas Canyon.
O.J. Ortega et al. / Journal of Structural Geology 32 (2010) 1943e1959 1953
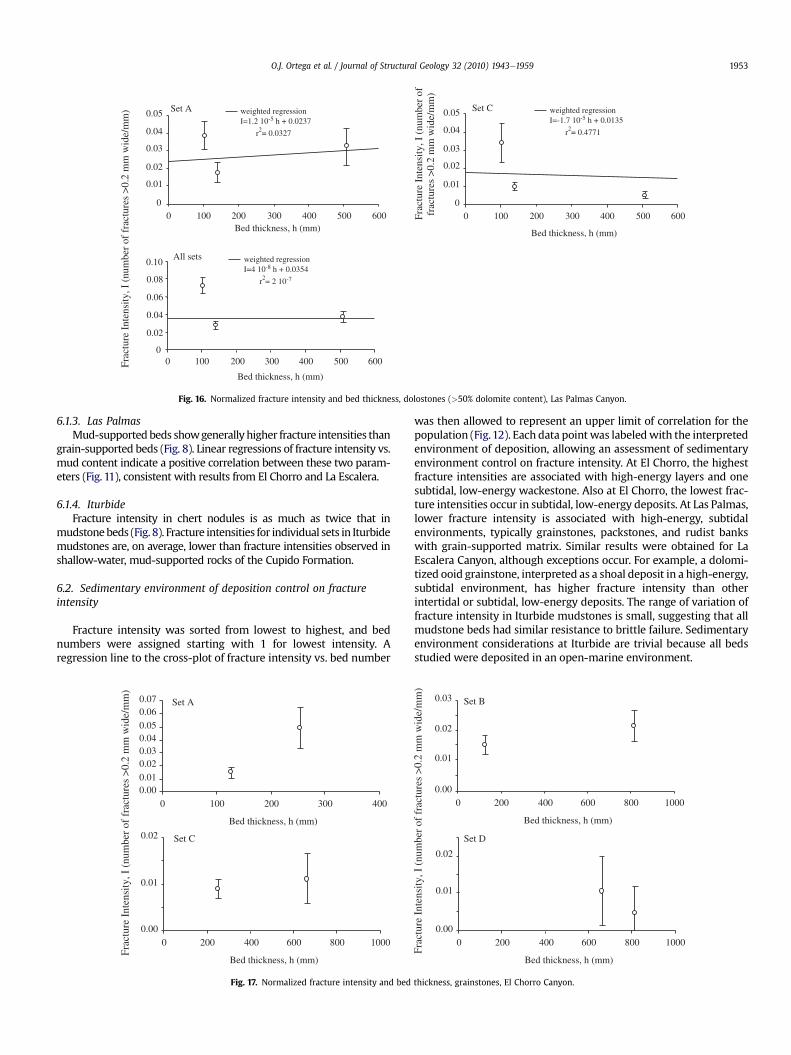
6.1.3. Las PalmasMud-supported beds showgenerally higher fracture intensities than
grain-supported beds (Fig. 8). Linear regressions of fracture intensity vs.mud content indicate a positive correlation between these two param-eters (Fig. 11), consistent with results from El Chorro and La Escalera.
6.1.4. IturbideFracture intensity in chert nodules is as much as twice that in
mudstonebeds (Fig. 8). Fracture intensities for individual sets in Iturbidemudstones are, on average, lower than fracture intensities observed inshallow-water, mud-supported rocks of the Cupido Formation.
6.2. Sedimentary environment of deposition control on fractureintensity
Fracture intensity was sorted from lowest to highest, and bednumbers were assigned starting with 1 for lowest intensity. Aregression line to the cross-plot of fracture intensity vs. bed number
Set A
0.000.010.020.030.040.050.060.07
0 100 200 300 400
Bed thickness, h (mm)
Set C
0.00
0.01
0.02
0 200 400 600 800 1000
Bed thickness, h (mm)
Frac
ture
Int
ensi
ty, I
(nu
mbe
r of
fra
ctur
es >
0.2
mm
wid
e/m
m)
Fig. 17. Normalized fracture intensity and bed
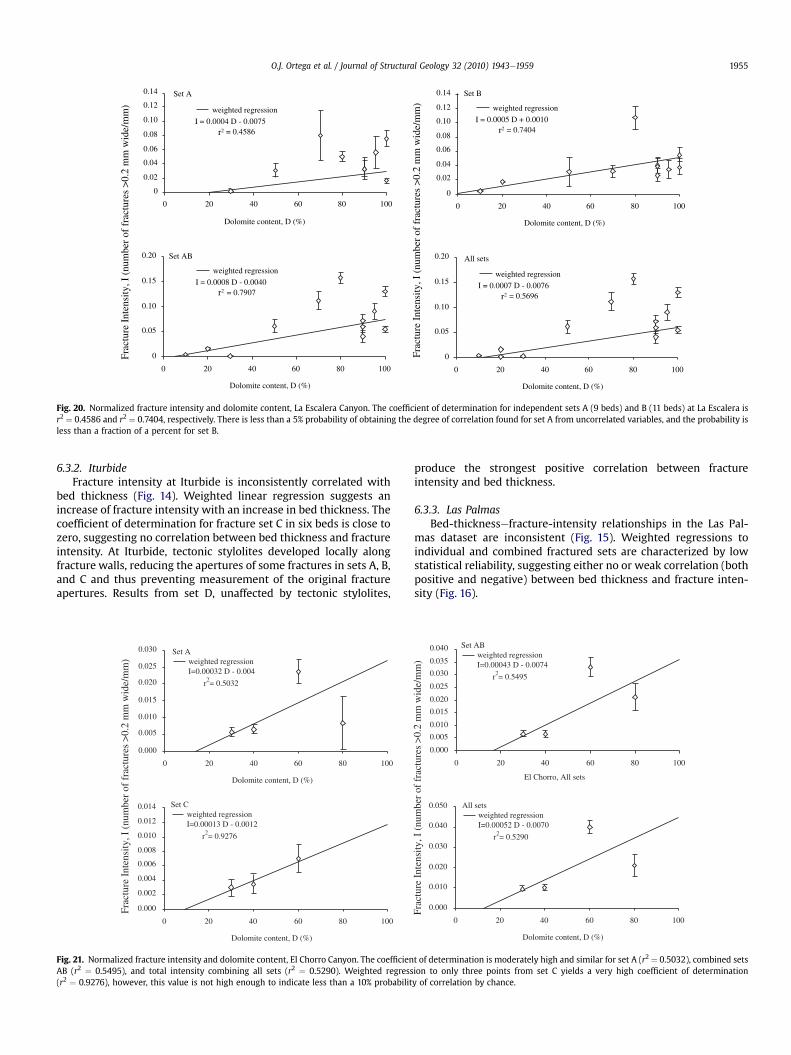
was then allowed to represent an upper limit of correlation for thepopulation (Fig.12). Each data point was labeledwith the interpretedenvironment of deposition, allowing an assessment of sedimentaryenvironment control on fracture intensity. At El Chorro, the highestfracture intensities are associated with high-energy layers and onesubtidal, low-energy wackestone. Also at El Chorro, the lowest frac-ture intensities occur in subtidal, low-energy deposits. At Las Palmas,lower fracture intensity is associated with high-energy, subtidalenvironments, typically grainstones, packstones, and rudist bankswith grain-supported matrix. Similar results were obtained for LaEscalera Canyon, although exceptions occur. For example, a dolomi-tized ooid grainstone, interpreted as a shoal deposit in a high-energy,subtidal environment, has higher fracture intensity than otherintertidal or subtidal, low-energy deposits. The range of variation offracture intensity in Iturbide mudstones is small, suggesting that allmudstone beds had similar resistance to brittle failure. Sedimentaryenvironment considerations at Iturbide are trivial because all bedsstudied were deposited in an open-marine environment.
Set B
0.00
0.01
0.02
0.03
0 200 400 600 800 1000
Bed thickness, h (mm)
Set D
0.00
0.01
0.02
0 200 400 600 800 1000
Bed thickness, h (mm)
Frac
ture
Int
ensi
ty, I
(nu
mbe
r of
fra
ctur
es >
0.2
mm
wid
e/m
m)
thickness, grainstones, El Chorro Canyon.

Set AB
0.000
0.010
0.020
0.030
0.040
0 200 400 600 800 1000Bed thickness, h (mm)
All sets (non-dolomitized grainstones)
0.000.010.020.030.040.050.060.07
0 200 400 600 800 1000Bed thickness, h (mm)
All sets (dolostones)
0.00
0.01
0.02
0.03
0.04
0.05
0 200 400 600 800 1000Bed thickness, h (mm)
Frac
ture
Int
ensi
ty, I
(nu
mbe
r of
fra
ctur
es >
0.2
mm
wid
e/m
m)
Frac
ture
Int
ensi
ty, I
(nu
mbe
r of
fra
ctur
es >
0.2
mm
wid
e/m
m)
weighted regressionI=7 10-6 h + 0.0042
r2= 0.0470
weighted regressionI=4 10-6 h + 0.002
r2= 0.262
weighted regressionI=-1.3 10-5 h + 0.036
r2= 0.138
weighted regressionI=1.3 10-6 h + 0.005
r2= 0.099
Set C
0.000
0.002
0.004
0.006
0.008
0.010
0 200 400 600 800 1000
Bed thickness, h (mm)
Fig. 18. Normalized fracture intensity and bed thickness, dolostones (>70% dolomite content), El Chorro Canyon.
O.J. Ortega et al. / Journal of Structural Geology 32 (2010) 1943e19591954
6.3. Bed-thickness control on fracture intensity
Ideally, comparison of fracture intensities would be made inbeds having different thicknesses, at the same locality, and similarmechanical properties at the time of fracturing. Although westudied fracture intensity in more than 40 beds from Cupido andTamaulipas Inferior Formations, finding a representative subset ofbeds that meets all these requirements was difficult. Because thesedimentary facies does not have a first-order control on fractureintensity, we analyzed bed thickness vs. fracture-intensity rela-tionships in all limestone beds from Las Palmas as one group, andthe remaining three dolostones as a separate group. Similarly, at El
0
0.01
0.02
0.03
0.04
0.05 weighted regressionI=0.00023 D + 0.0017
r2= 0.6932
Set C
0
0.01
0.02
0.03
0.04
0.05weighted regressionI=0.00008 D + 0.0009
r2= 0.3295
Frac
ture
Int
ensi
ty, I
(nu
mbe
r of
fra
ctur
es >
0.2
mm
wid
e/m
m)
Set A
0 20 40 60 80 100
Dolomite content, D (%)
0 20 40 60 80 100
Dolomite content, D (%)
Fig. 19. Normalized fracture intensity and dolomite content, Las Palmas Canyon. The coefficiis high (r2 ¼ 0.72), suggesting that there is less than 1% probability of obtaining this degre
Chorro, limestones and dolostones were analyzed as two separategroups.
6.3.1. La EscaleraWeighted regressions for dolostones suggest that there is little
to no correlation between bed thickness and fracture intensity at LaEscalera Canyon (Fig. 13). The coefficient of determination for least-squares regression to total fracture intensity is close to zero.Weighted regression lines for individual fracture sets also yield lowcoefficients of determination. Results for set C are not shownbecause this set is sufficiently developed in only two limestonebeds and regression to only two points is trivial.
Set AB
All sets
0
0.02
0.04
0.06
0.08
0.10
weighted regressionI=0.00021 D + 0.0039
r2= 0.5138
weighted regressionI=0.0005 D + 0.0041
r2= 0.7185
Frac
ture
Int
ensi
ty, I
(nu
mbe
r of
fra
ctur
es >
0.2
mm
wid
e/m
m)
0 20 40 60 80 100
Dolomite content, D (%)
0
0.01
0.02
0.03
0.04
0.05
0.06
0 20 40 60 80 100
Dolomite content, D (%)
ent of determination for a linear weighted regression to total fracture intensity per bede of correlation from spurious data.
0
0.05
0.10
0.15
0.20
0 20 40 60 80 100
Dolomite content, D (%)
I = 0.0004 D - 0.0075 = 0.4586
Set A
0
0.02
0.04
0.06
0.08
0.10
0.12
0.14
0 20 40 60 80 100
Dolomite content, D (%)
weighted regression
Set B
0
0.02
0.04
0.06
0.08
0.10
0.12
0.14
0 20 40 60 80 100
Dolomite content, D (%)
I = 0.0005 D + 0.0010 = 0.7404
weighted regression
Set AB All sets
0
0.05
0.10
0.15
0.20
0 20 40 60 80 100
Dolomite content, D (%)
I = 0.0008 D - 0.0040 = 0.7907
weighted regression
I = 0.0007 D - 0.0076 = 0.5696
weighted regression
Frac
ture
Int
ensi
ty, I
(nu
mbe
r of
fra
ctur
es >
0.2
mm
wid
e/m
m)
Frac
ture
Int
ensi
ty, I
(nu
mbe
r of
fra
ctur
es >
0.2
mm
wid
e/m
m)
r2 r2
r2r2
Fig. 20. Normalized fracture intensity and dolomite content, La Escalera Canyon. The coefficient of determination for independent sets A (9 beds) and B (11 beds) at La Escalera isr2 ¼ 0.4586 and r2 ¼ 0.7404, respectively. There is less than a 5% probability of obtaining the degree of correlation found for set A from uncorrelated variables, and the probability isless than a fraction of a percent for set B.
O.J. Ortega et al. / Journal of Structural Geology 32 (2010) 1943e1959 1955
6.3.2. IturbideFracture intensity at Iturbide is inconsistently correlated with
bed thickness (Fig. 14). Weighted linear regression suggests anincrease of fracture intensity with an increase in bed thickness. Thecoefficient of determination for fracture set C in six beds is close tozero, suggesting no correlation between bed thickness and fractureintensity. At Iturbide, tectonic stylolites developed locally alongfracture walls, reducing the apertures of some fractures in sets A, B,and C and thus preventing measurement of the original fractureapertures. Results from set D, unaffected by tectonic stylolites,
Set A
0.000
0.005
0.010
0.015
0.020
0.025
0.030
0 20 40 60 80 100
Dolomite content, D (%)
weighted regressionI=0.00032 D - 0.004
r2= 0.5032
Frac
ture
Int
ensi
ty, I
(nu
mbe
r of
fra
ctur
es >
0.2
mm
wid
e/m
m)
0.000
0.002
0.004
0.006
0.008
0.010
0.012
0.014
0 20 40 60 80 100
Dolomite content, D (%)
Set Cweighted regressionI=0.00013 D - 0.0012
r2= 0.9276
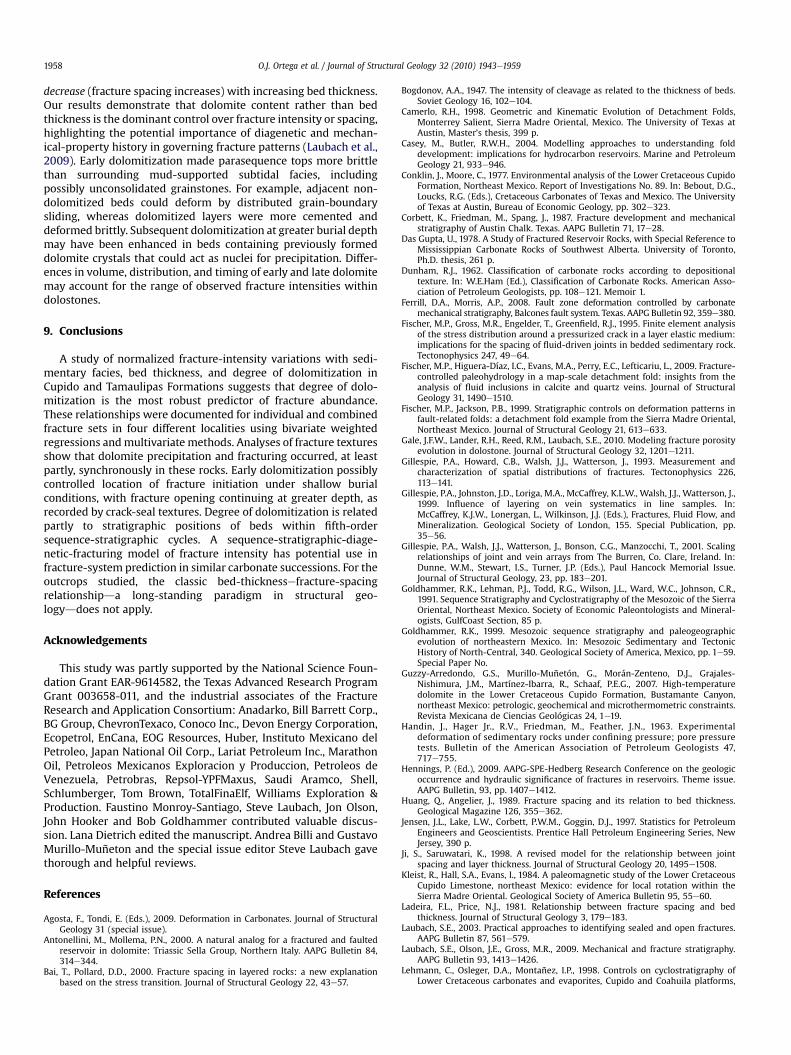
Fig. 21. Normalized fracture intensity and dolomite content, El Chorro Canyon. The coefficienAB (r2 ¼ 0.5495), and total intensity combining all sets (r2 ¼ 0.5290). Weighted regress(r2 ¼ 0.9276), however, this value is not high enough to indicate less than a 10% probabilit
produce the strongest positive correlation between fractureintensity and bed thickness.
6.3.3. Las PalmasBed-thicknessefracture-intensity relationships in the Las Pal-
mas dataset are inconsistent (Fig. 15). Weighted regressions toindividual and combined fractured sets are characterized by lowstatistical reliability, suggesting either no or weak correlation (bothpositive and negative) between bed thickness and fracture inten-sity (Fig. 16).
Frac
ture
Int
ensi
ty, I
(nu
mbe
r of
fra
ctur
es >
0.2
mm
wid
e/m
m)
0.000
0.005
0.010
0.015
0.020
0.025
0.030
0.035
0.040
0 20 40 60 80 100
Set ABweighted regressionI=0.00043 D - 0.0074
r2= 0.5495
El Chorro, All sets
0.000
0.010
0.020
0.030
0.040
0.050
0 20 40 60 80 100
Dolomite content, D (%)
All setsweighted regressionI=0.00052 D - 0.0070
r2= 0.5290
t of determination is moderately high and similar for set A (r2 ¼ 0.5032), combined setsion to only three points from set C yields a very high coefficient of determinationy of correlation by chance.

Fig. 22. Schematic distribution of fracture intensity and degree of dolomitization in peritidal and subtidal parasequences at La Escalera Canyon.
O.J. Ortega et al. / Journal of Structural Geology 32 (2010) 1943e19591956
6.3.4. El ChorroEl Chorro beds can be separated into limestones (Fig. 17) and
dolostones (Fig.18). Most data suggest no relationship between bedthickness and fracture intensity. The second-most-common rela-tionship is a positive correlation and the least common is an inverserelationship.
6.4. Dolomitization control on fracture intensity
Consistency in the relationship between dolomite content andfracture intensity and moderate to high coefficients of determina-tion indicates that dolomite content and fracture intensity aresystematically related. This relationship, and the presence of syn-kinematic dolomite in the fractures, suggests that fracturing anddolomitization are linked processes.
Fig. 23. Schematic distribution of fracture intensity and dolomite distrib
6.4.1. Las PalmasThere is a positive correlation between normalized fracture
intensity and dolomite content at Las Palmas (Fig. 19). Linearregressions for individual set A, combined sets AB, and set C at LasPalmas Canyon also suggest a positive correlation between fractureintensity and dolomite content.
6.4.2. La EscaleraLa Escalera data also suggest a positive correlation between
fracture intensity and dolomite content (Fig. 20). Coefficients ofdetermination from data at La Escalera are similar to those from LasPalmas. Different degrees of dolomitization are present at Las Pal-mas Canyon, although at La Escalera most beds are highly dolo-mitized, and control for weakly dolomitized beds is only sparse.Petrographic work on La Escalera and Las Palmas samples suggests
ution in peritidal and subtidal parasequences at Las Palmas Canyon.

Table 3Summary output of multiple linear-regression analysis for combined fracture sets A, B and C, fracture intensity and stratigraphic variables.
Regression statistics
Multiple R 0.682644663R square 0.466003736Adjusted R square 0.404975591Standard error 0.027759922Observations 40
df SS MS F Significance F
Regression 4 0.02353725 0.005884 7.635882 0.000156164Residual 35 0.026971465 0.000771Total 39 0.050508714
Coefficients Standard error t Stat P-value Lower 95% Upper 95%
Intercept �0.02881704 0.015525799 �1.85607 0.071878 �0.060336131 0.002702Dolomite 0.000382674 0.000133816 2.859702 0.007102 0.000111013 0.000654Mud 0.000183544 0.000113896 1.611499 0.116054 �4.76784E � 05 0.000415Position 0.000653642 0.000235163 2.779525 0.008699 0.000176235 0.001131Thickness �3.6505E � 06 9.60945E � 06 �0.37988 0.706328 �2.31587E � 05 1.59E � 05
O.J. Ortega et al. / Journal of Structural Geology 32 (2010) 1943e1959 1957
that some dolomite postdates the fractures. This may explain thescatter of data in both localities.
6.4.3. El ChorroDolomite content at El Chorro is >30% in four beds studied and
is very low in the other four. Dolomite content vs. fracture-intensityanalyses are consistent with results obtained in Las Palmas and LaEscalera, suggesting a positive correlation between fracture inten-sity and dolomite content (Fig. 21).
6.5. Cyclostratigraphic control on fracture intensity
Fracture intensity in beds generally increases toward the top ofthe parasequences in the peritidal facies (Figs. 22 and 23). Becausedolomitized cycle tops dominate the section, there is an impressionof a correlation between stratigraphic position and fracture inten-sity. Some subtidal cycles capped by grainstone shoals or bivalvebanks do not, however, show an increase of fracture intensitytoward the top of the parasequence. For example, in the middlepart of the Las Palmas section, a succession of subtidal cycles iscapped by limestone grainstone shoals and/or rudist bioherms thatare mostly barren of fractures. Moreover, subtidal cycles with nofractured layers lack dolostone caps. We conclude that it is thedegree of dolomitization that is important rather than position inthe cycle.
7. Correlation between stratigraphic variables
In the previous section, fracture intensity was the dependentvariable, whereas dolomite content, sedimentary facies, position ofthe bed in the stratigraphic cycle, and bed thickness were inde-pendent variables. In this section, degree of correlation betweenindependent variables is analyzed. Correlation among independentvariables indicates a need for multivariate techniques in order forthe data to be studied (Swan and Sandilands, 1995). In a prelimi-nary bivariate analysis, dolomite content, normalized position inthe parasequence, environment of deposition, and mud contentshow moderate correlation. There is no correlation between bedthickness and the other variables.
Multiple-regression analysis of 40 beds yields results similar tothose obtained from bivariate analyses. Four variables wereincluded in the multivariate analysis: dolomite content, mudcontent, position of bed in the stratigraphic cycle, and bed thick-ness. In multiple linear-regression analysis, variables that areknown to have little effect on fracture intensitydfor example, bed
thicknessdshould be excluded. Because the bed-thickness effecton fracture intensity has been an important paradigm, however,this variable was included in the analysis. Fracture sets A, B, and Cmost likely formed before folding, allowing them to be studied asa group. Set D and set M fractures are excluded because theyformed by a mechanism different from that of sets A, B, and C.Results of multivariate analysis of combined sets A, B, and C areshown in Table 3.
Multiple linear-regression coefficients of determination suggesta reliable correlation between variables considered and fractureintensity. F-tests suggest high confidence in the coefficient ofdetermination, with negligible (<0.1%) probability of similar degreeof correlation by chance. Dolomite content is the most importantfactor influencing fracture intensity and contributes nearly 60% ofthe effect on fracture intensity. T-tests on dolomite content suggest>9% confidence in determination of this coefficient. Normalizedposition in the stratigraphic cycle is also an important parameterdetermining fracture intensity. T-tests suggest a confidence level of93%. The F value allows rejection of the null hypothesis (no corre-lation), with <1% probability of obtaining these coefficients ofdetermination by chance. T-tests suggest that correlation betweenfracture intensity, dolomite content, and position of bed in a cycle isstatistically significant, with >95% reliability in the coefficients ofdetermination. Mud-content and bed-thickness T-test statisticssuggest, respectively, poor and negligible correlations with fractureintensity. Multiple-regression analysis for combined sets AB and Cseparately and for total fracture intensity at La Escalera yieldedresults similar to those reported in Table 3, although degree ofcorrelation is lower, and the coefficients are less reliable.
8. Discussion
The dominant control of fracture intensity in the carbonateplatform studied is degree of dolomitization, which is linked partlyto stratigraphic position because the tops of peritidal para-sequences are preferentially dolomitized. However, the link is notuniversal because dolomitization fronts can extend to includesubtidal facies (Morrow, 1982) and subtidal parasequences with noperitidal caps may lack dolomitized layers.
Fracture intensity shows no significant correlation with bedthickness in most cases. In a few cases where there is weakcorrelation, intensity generally increases with an increase in bedthickness. This increase is opposite to the expected behavior(Huang and Angelier, 1989; Ji and Saruwatari, 1998; Nelson, 2001,and references therein), in which fracture intensity is expected to
O.J. Ortega et al. / Journal of Structural Geology 32 (2010) 1943e19591958
decrease (fracture spacing increases) with increasing bed thickness.Our results demonstrate that dolomite content rather than bedthickness is the dominant control over fracture intensity or spacing,highlighting the potential importance of diagenetic and mechan-ical-property history in governing fracture patterns (Laubach et al.,2009). Early dolomitization made parasequence tops more brittlethan surrounding mud-supported subtidal facies, includingpossibly unconsolidated grainstones. For example, adjacent non-dolomitized beds could deform by distributed grain-boundarysliding, whereas dolomitized layers were more cemented anddeformed brittly. Subsequent dolomitization at greater burial depthmay have been enhanced in beds containing previously formeddolomite crystals that could act as nuclei for precipitation. Differ-ences in volume, distribution, and timing of early and late dolomitemay account for the range of observed fracture intensities withindolostones.
9. Conclusions
A study of normalized fracture-intensity variations with sedi-mentary facies, bed thickness, and degree of dolomitization inCupido and Tamaulipas Formations suggests that degree of dolo-mitization is the most robust predictor of fracture abundance.These relationships were documented for individual and combinedfracture sets in four different localities using bivariate weightedregressions andmultivariate methods. Analyses of fracture texturesshow that dolomite precipitation and fracturing occurred, at leastpartly, synchronously in these rocks. Early dolomitization possiblycontrolled location of fracture initiation under shallow burialconditions, with fracture opening continuing at greater depth, asrecorded by crack-seal textures. Degree of dolomitization is relatedpartly to stratigraphic positions of beds within fifth-ordersequence-stratigraphic cycles. A sequence-stratigraphic-diage-netic-fracturing model of fracture intensity has potential use infracture-system prediction in similar carbonate successions. For theoutcrops studied, the classic bed-thicknessefracture-spacingrelationshipda long-standing paradigm in structural geo-logyddoes not apply.
Acknowledgements
This study was partly supported by the National Science Foun-dation Grant EAR-9614582, the Texas Advanced Research ProgramGrant 003658-011, and the industrial associates of the FractureResearch and Application Consortium: Anadarko, Bill Barrett Corp.,BG Group, ChevronTexaco, Conoco Inc., Devon Energy Corporation,Ecopetrol, EnCana, EOG Resources, Huber, Instituto Mexicano delPetroleo, Japan National Oil Corp., Lariat Petroleum Inc., MarathonOil, Petroleos Mexicanos Exploracion y Produccion, Petroleos deVenezuela, Petrobras, Repsol-YPFMaxus, Saudi Aramco, Shell,Schlumberger, Tom Brown, TotalFinaElf, Williams Exploration &Production. Faustino Monroy-Santiago, Steve Laubach, Jon Olson,John Hooker and Bob Goldhammer contributed valuable discus-sion. Lana Dietrich edited the manuscript. Andrea Billi and GustavoMurillo-Muñeton and the special issue editor Steve Laubach gavethorough and helpful reviews.
References
Agosta, F., Tondi, E. (Eds.), 2009. Deformation in Carbonates. Journal of StructuralGeology 31 (special issue).
Antonellini, M., Mollema, P.N., 2000. A natural analog for a fractured and faultedreservoir in dolomite: Triassic Sella Group, Northern Italy. AAPG Bulletin 84,314e344.
Bai, T., Pollard, D.D., 2000. Fracture spacing in layered rocks: a new explanationbased on the stress transition. Journal of Structural Geology 22, 43e57.
Bogdonov, A.A., 1947. The intensity of cleavage as related to the thickness of beds.Soviet Geology 16, 102e104.
Camerlo, R.H., 1998. Geometric and Kinematic Evolution of Detachment Folds,Monterrey Salient, Sierra Madre Oriental, Mexico. The University of Texas atAustin, Master’s thesis, 399 p.
Casey, M., Butler, R.W.H., 2004. Modelling approaches to understanding folddevelopment: implications for hydrocarbon reservoirs. Marine and PetroleumGeology 21, 933e946.
Conklin, J., Moore, C., 1977. Environmental analysis of the Lower Cretaceous CupidoFormation, Northeast Mexico. Report of Investigations No. 89. In: Bebout, D.G.,Loucks, R.G. (Eds.), Cretaceous Carbonates of Texas and Mexico. The Universityof Texas at Austin, Bureau of Economic Geology, pp. 302e323.
Corbett, K., Friedman, M., Spang, J., 1987. Fracture development and mechanicalstratigraphy of Austin Chalk. Texas. AAPG Bulletin 71, 17e28.
Das Gupta, U., 1978. A Study of Fractured Reservoir Rocks, with Special Reference toMississippian Carbonate Rocks of Southwest Alberta. University of Toronto,Ph.D. thesis, 261 p.
Dunham, R.J., 1962. Classification of carbonate rocks according to depositionaltexture. In: W.E.Ham (Ed.), Classification of Carbonate Rocks. American Asso-ciation of Petroleum Geologists, pp. 108e121. Memoir 1.
Ferrill, D.A., Morris, A.P., 2008. Fault zone deformation controlled by carbonatemechanical stratigraphy, Balcones fault system. Texas. AAPG Bulletin 92, 359e380.
Fischer, M.P., Gross, M.R., Engelder, T., Greenfield, R.J., 1995. Finite element analysisof the stress distribution around a pressurized crack in a layer elastic medium:implications for the spacing of fluid-driven joints in bedded sedimentary rock.Tectonophysics 247, 49e64.
Fischer, M.P., Higuera-Díaz, I.C., Evans, M.A., Perry, E.C., Lefticariu, L., 2009. Fracture-controlled paleohydrology in a map-scale detachment fold: insights from theanalysis of fluid inclusions in calcite and quartz veins. Journal of StructuralGeology 31, 1490e1510.
Fischer, M.P., Jackson, P.B., 1999. Stratigraphic controls on deformation patterns infault-related folds: a detachment fold example from the Sierra Madre Oriental,Northeast Mexico. Journal of Structural Geology 21, 613e633.
Gale, J.F.W., Lander, R.H., Reed, R.M., Laubach, S.E., 2010. Modeling fracture porosityevolution in dolostone. Journal of Structural Geology 32, 1201e1211.
Gillespie, P.A., Howard, C.B., Walsh, J.J., Watterson, J., 1993. Measurement andcharacterization of spatial distributions of fractures. Tectonophysics 226,113e141.
Gillespie, P.A., Johnston, J.D., Loriga, M.A., McCaffrey, K.L.W., Walsh, J.J., Watterson, J.,1999. Influence of layering on vein systematics in line samples. In:McCaffrey, K.J.W., Lonergan, L., Wilkinson, J.J. (Eds.), Fractures, Fluid Flow, andMineralization. Geological Society of London, 155. Special Publication, pp.35e56.
Gillespie, P.A., Walsh, J.J., Watterson, J., Bonson, C.G., Manzocchi, T., 2001. Scalingrelationships of joint and vein arrays from The Burren, Co. Clare, Ireland. In:Dunne, W.M., Stewart, I.S., Turner, J.P. (Eds.), Paul Hancock Memorial Issue.Journal of Structural Geology, 23, pp. 183e201.
Goldhammer, R.K., Lehman, P.J., Todd, R.G., Wilson, J.L., Ward, W.C., Johnson, C.R.,1991. Sequence Stratigraphy and Cyclostratigraphy of the Mesozoic of the SierraOriental, Northeast Mexico. Society of Economic Paleontologists and Mineral-ogists, GulfCoast Section, 85 p.
Goldhammer, R.K., 1999. Mesozoic sequence stratigraphy and paleogeographicevolution of northeastern Mexico. In: Mesozoic Sedimentary and TectonicHistory of North-Central, 340. Geological Society of America, Mexico, pp. 1e59.Special Paper No.
Guzzy-Arredondo, G.S., Murillo-Muñetón, G., Morán-Zenteno, D.J., Grajales-Nishimura, J.M., Martínez-Ibarra, R., Schaaf, P.E.G., 2007. High-temperaturedolomite in the Lower Cretaceous Cupido Formation, Bustamante Canyon,northeast Mexico: petrologic, geochemical and microthermometric constraints.Revista Mexicana de Ciencias Geológicas 24, 1e19.
Handin, J., Hager Jr., R.V., Friedman, M., Feather, J.N., 1963. Experimentaldeformation of sedimentary rocks under confining pressure; pore pressuretests. Bulletin of the American Association of Petroleum Geologists 47,717e755.
Hennings, P. (Ed.), 2009. AAPG-SPE-Hedberg Research Conference on the geologicoccurrence and hydraulic significance of fractures in reservoirs. Theme issue.AAPG Bulletin, 93, pp. 1407e1412.
Huang, Q., Angelier, J., 1989. Fracture spacing and its relation to bed thickness.Geological Magazine 126, 355e362.
Jensen, J.L., Lake, L.W., Corbett, P.W.M., Goggin, D.J., 1997. Statistics for PetroleumEngineers and Geoscientists. Prentice Hall Petroleum Engineering Series, NewJersey, 390 p.
Ji, S., Saruwatari, K., 1998. A revised model for the relationship between jointspacing and layer thickness. Journal of Structural Geology 20, 1495e1508.
Kleist, R., Hall, S.A., Evans, I., 1984. A paleomagnetic study of the Lower CretaceousCupido Limestone, northeast Mexico: evidence for local rotation within theSierra Madre Oriental. Geological Society of America Bulletin 95, 55e60.
Ladeira, F.L., Price, N.J., 1981. Relationship between fracture spacing and bedthickness. Journal of Structural Geology 3, 179e183.
Laubach, S.E., 2003. Practical approaches to identifying sealed and open fractures.AAPG Bulletin 87, 561e579.
Laubach, S.E., Olson, J.E., Gross, M.R., 2009. Mechanical and fracture stratigraphy.AAPG Bulletin 93, 1413e1426.
Lehmann, C., Osleger, D.A., Montañez, I.P., 1998. Controls on cyclostratigraphy ofLower Cretaceous carbonates and evaporites, Cupido and Coahuila platforms,

O.J. Ortega et al. / Journal of Structural Geology 32 (2010) 1943e1959 1959
northeastern Mexico. Journal of Sedimentary Research, Section B: Stratigraphyand Global Studies 68, 1109e1130.
Mandal, N., Deb, S.K., Khan, D., 1994. Evidence for a non-linear relationship betweenfracture spacing and layer thickness. Journal of Structural Geology 16, 1275e1281.
Marrett, R., 1996. Aggregate properties of fracture populations. Journal of StructuralGeology 18, 169e631. 178.
Marrett, R., Aranda-García, M., 1999. Structure and kinematic development of theSierra Madre Oriental fold-thrust belt, Mexico. In: Stratigraphy and Structure ofthe Jurassic and Cretaceous Platform and Basin Systems of the Sierra MadreOriental, Monterrey and Saltillo Areas, Northeastern Mexico, a Field Book andRelated Papers. South Texas Geological Society. . Special Publication for theAnnual Meeting of the American Association of Petroleum Geologists and theSEPM. Society for Sedimentary Geology, San Antonio, p. 69-98.
Marrett, R., Laubach, S.E., 2001. Fracturing during diagenesis. In: Marrett, R. (Ed.),Monterrey Salient Genesis and Controls of Reservoir-Scale Carbonate Defor-mation. The University of Texas at Austin, Mexico, pp. 109e123. Bureau ofEconomic Geology, Field Trip Guidebook 28.
Monroy-Santiago, F., Laubach, S.E., Marrett, R., 2001. Preliminary diagenetic andstable isotope analyses of fractures in the Cupido Formation, Sierra MadreOriental. In: Marrett, R. (Ed.), Genesis and Controls of Reservoir-ScaleCarbonate Deformation, Monterrey Salient. The University of Texas at Austin,Mexico, pp. 83e107. Bureau of Economic Geology, Field Trip Guidebook 28.
Moros, J.G., 1999. Relationship Between Fracture Aperture and Length in Sedi-mentary Rocks. The University of Texas at Austin, Master’s thesis, 120 p.
Morrow, D.W., 1982. Diagenesis 2. Dolomite, part 2: dolomitization models andancient dolostones. Geoscience Canada 9, 95e107.
Mueller, M.C., 1991. Prediction of lateral variability in fracture intensity usingmulticomponent shear-wave surface seismic as a precursor to horizontal dril-ling in the Austin Chalk. Geophysical Journal International 107, 409e415.
Narr, W., 1991. Fracture density in the deep subsurface; techniques with applicationto Point Arguello Oil Field. AAPG Bulletin 75, 1300e1323.
Narr, W., 1996. Estimating average fracture spacing in subsurface rock. AAPGBulletin 80, 1565e1586.
Narr, W., Suppe, J., 1991. Joint spacing in sedimentary rocks. Journal of StructuralGeology 13, 1037e1048.
Nelson, R.A., 2001. Geologic Analysis of Naturally Fractured Reservoirs, second ed.Gulf Publishing, Houston, 320 p.
Nelson, R.A., Serra, S., 1995. Vertical and lateral variations in fracture spacing infolded carbonate sections and its relation to locating horizontal wells. TheJournal of Canadian Petroleum Technology 34, 51e56.
Olson, J.E., Laubach, S.E., Lander, R.H., 2009. Natural fracture characterization intight gas sandstones: integrating mechanics and diagenesis. AAPG Bulletin 93,1535e1549.
Ortega, O.J., 2002. Fracture-Size Scaling and Stratigraphic Controls on FractureIntensity. The University of Texas at Austin, PhD dissertation, 426 p.
Ortega, O.J., Marrett, R., Laubach, S.E., 2006. A scale-independent approach tofracture intensity and average fracture spacing. AAPG Bulletin 90,193e208.
Philip, Z.G., Jennings Jr., J.W., Olson, J.E., Laubach, S.E., Holder, J., 2005. Modelingcoupled fracture-matrix fluid flow in geomechanically simulated fracturenetworks. SPE Reservoir Evaluation and Engineering 8, 300e309.
Ramsay, J.G., 1980. The crack-seal mechanism of rock deformation. Nature 284,135e139.
Rives, T., Razack, M., Petit, J.-P., Rawnsley, K.D., 1992. Joint spacing: analog andnumerical simulations. Journal of Structural Geology 14, 925e937.
Sinclair, S.W., 1980. Analysis of Macroscopic Fractures on Teton Anticline, North-western Montana. Texas A&M University, Masters thesis, 102 p.
Swan, A.R.H., Sandilands, M., 1995. Introduction to Geological Data Analysis.Blackwell Science, Oxford, 446 p.
Wilson, J.L., Ward, W., Finneran, J., 1984. A Field Guide to Upper Jurassic and LowerCretaceous Carbonate Platform and Basin Systems, Monterrey-Saltillo area,Northeast Mexico. Society of Economic Paleontologists and Mineralogists,GulfCoast Section, 76 p.
Wu, H., Pollard, D.D., 1995. An experimental study of the relationship between jointspacing and layer thickness. Journal of Structural Geology 17, 887e905.
Young, D.H., 1962. Statistical Treatment of Experimental Data. McGraw-Hill BookCompany Inc., New York, 172 p.
Zahm, C.K., Zahm, L.C., Bellian, J.A., 2010. Integrated fracture prediction usingsequence stratigraphy within a carbonate fault damage zone, Texas, USA.Journal of Structural Geology 32, 1363e1374.