quantification of the antibacterial properties of artemisia absinthium, a. vulgaris, chrysanthemum...
TRANSCRIPT
Whole effluent toxicity is most often considered as a static parameter. However, toxicity might changeas degradation processes, especially biodegradation goes by and intermediate products appear. Theseintermediates can even be more toxic than the original effluent was, posing higher risk to the ecosystemof the recipient water body. In our test series it was assessed how toxicity of a municipal wastewater sam-ple changes during biodegradation taking into consideration different temperature regimes (10, 20 and30 °C). Results proved our null hypothesis: after the high initial toxicity of the fresh effluent sample tox-icity did show a further increase. Biodegradation resulted in toxicity reduction only after an app. 2 week-period.
Keywords: Whole effluent toxicity – environmental risk – biodegradation – bioluminescence – ToxAlert
INTRODUCTION
In many countries, both chemical and biological analysis/testing of effluents arerequired by regulations either before discharging to sewage treatment plants orbefore discharging to the recipient. However, most legislation is directed towardsregulation of discharges to the receiving environment. In Europe, the most compre-hensive legal mean is the EU Water Framework Directive (2000), which aims atmaintaining and improving the aquatic environment in the Community, and is con-cerned primarily with protecting receiving waters from pollution.
Numerous authors have used ecotoxicological tests to assess the effectiveness ofwastewater purification/treatment processes [3, 7]. Toxicity, however, is not a static
Acta Biologica Hungarica 60 (3), pp. 293–299 (2009)
DOI: 10.1556/ABiol.60.2009.3.6
0236-5383/$ 20.00 © 2009 Akadémiai Kiadó, Budapest
WHOLE EFFLUENT RISK ESTIMATIONFOR A SMALL RECIPIENT WATERCOURSE
MAHA REFAEY, NÓRA KOVÁTS,* Á. KÁRPÁTI and P. THURY
Institute of Environmental Engineering, University of Pannonia, 8200 VeszprémP.O. Box 158, e-mail: [email protected]
(Received: December 1, 2008; accepted: January 30, 2009)
* Corresponding author; e-mail: [email protected]
294 MAHA REFAEY et al.
Acta Biologica Hungarica 60, 2009
parameter: toxic potential of an effluent will change due to degradation processessuch as photolysis, hydrolysis, oxidization and biodegradation. The risk of toxiceffects in the recipient depends primarily on the time-related variation of toxicity ofthe effluent.
Ready biodegradability of an effluent is a key parameter to assess hazards an efflu-ent poses to its environment either it is treated in a municipal treatment plant or dis-charged to a recipient surface water [17].
The latest version of OECD tests for ready biodegradability [13] aims at predict-ing whether a chemical has the potential to be easily biodegraded in the environment.In these protocols usually oxygen uptake is measured, involving long-term (14 to 28-day) respirometer testing. However, these tests which use chemical end-points suchas COD do not give an indication on how toxicity of the chemical will change due tothe formation of intermediate products. These tests were not designed to predict thebehaviour of effluents in the aquatic ecosystem. Therefore although some methodshave been described to evaluate the biodegradability of chemicals in environmentalwater [10], no relevant OECD Test Guidelines have been proposed so far. Instead,simulation tests exist such as the stream model of Shimp et al. [15] or the die-awaytest of Anderson et al. [1].
Biodegradation in the environment is affected by many factors such as concentra-tion of the effluent, exposure and the composition of microbial communities. In arecipient water presence of competent bacteria can be expected [20]. For testingbiodegradability, it has been recognised that a mixed community of natural origin ismore capable of degrading a wide range of compounds than pure cultures of select-ed strains [13].
During degradation processes not only concentration of the chemicals (and there-fore exposure) will change but also, photo-degradable, hydrolytically unstable, oxi-dizable and biodegradable substances in addition may form such breakdown prod-ucts which can be even more toxic than the parent substance was. Evaluation of thebiodegradability is a key element of hazard identification of whole effluents, and itshould comprise toxicity testing as well [22–23].
The fact that during degradation such intermediate products might appear whichare more toxic is not only a hypothetical suggestion [4] but has been demonstratedexperimentally for selected types of industrial wastewaters of high organic mattercontent [8]. It seems very likely that toxic wastewater effluents can pose even moreserious risk to the environment long after they were discharged.
Our basic aim was to test how degradation processes, especially biodegradationaffect the toxicity of communal wastewater and to predict its behaviour at differenttemperature regimes of 10, 20 and 30 °C. Also, tests were designed to reveal if inocu-lum taken from the recipient water body can influence the biodegradation process, inother words, what potential different microbial communities have to degrade com-munal wastewater.
MATERIALS AND METHODS
Raw wastewater sample was collected from the municipal treatment plant ofVeszprém. Capacity of the plant is 12,000 m3/day.
For toxicity assessment, a commercial assay marketed as ToxAlert® (Merck) wasused using the luminescent seawater bacterium Vibrio fischeri NRRL B-1117.Bacterial bioluminescence is attributed to the activation of the enzyme luciferasewith luciferin [11]. The attenuation of light emitted by bacteria in presence of a tox-icant is related to the inhibition of this reaction. Reduction in light output may bemeasured after exposure to a toxic sample for 5 to 30 minutes.
This test was selected as (1) being similar to measuring respiration inhibition,since luminescence is a measure of the rate at which the bacteria produce ATP in thecourse of their respiratory metabolism and (2) having a very short exposure, there-fore being able to give an indication of actual (instantaneous) toxicity.
The protocol described by BS EN ISO 11348.3, Part 3 – Method using freeze-dried bacteria [2] was used. The ToxAlert®100 luminometer calculates all valuesautomatically.
For providing a competent bacterial community, inoculum was taken from therecipient stream, Channel Séd [21]. Inoculum and the sample were mixed in a 1:1ratio. For each test, the dilution series of 6.25%, 12.5%, 25%, 50% and 100% sam-ple was used as suggested by the WET method manuals [18, 19]. Samples were aer-ated prior to toxicity testing.
Three temperature regimes were set: one series of samples was kept at 10 °C, thesecond at room temperature (app. 22 °C) and the third at 30 °C.
Samples were marked during the assay as follows:R10: raw sample at 10 °CR22: raw sample at room temperature (22 °C)R30: raw sample at 30 °CRS10: raw sample + inoculum from the recipient water body (Séd) at 10 °CRS22: raw sample + inoculum from the recipient water body (Séd) at room tem-
perature (22 °C)RS30: raw sample + inoculum from the recipient water body (Séd) at 30 °CToxicity tests were conducted regularly. First measurement was made at the begin-
ning of the study (Day 0), followed by the second one on Day 5, assuming a lag peri-od of 5 days [12]. From Day 5 to Day 26, toxicity measurements were completedapp. at weekly intervals, as our previous study [18] suggested that most significantchanges can be expected during the first month. Also, most biodegradability test pro-tocols cover 28 days [13]. Bioassays were completed from Day 26 to Day 96 app. attwo-week intervals, till Day 96. In order to represent real-world conditions, the min-imum incubation time is considered 8 weeks [14, 16]. However, Strevett et al. [16]report that for some chemicals this period may be insufficient, requiring an incuba-tion time of 100 days. A final assay was completed on Day 153.
COD measurements were also made, following the protocol described by MSZISO 6060: 1991 standard.
Whole effluent risk estimation 295
Acta Biologica Hungarica 60, 2009
296 MAHA REFAEY et al.
Acta Biologica Hungarica 60, 2009
RESULTS
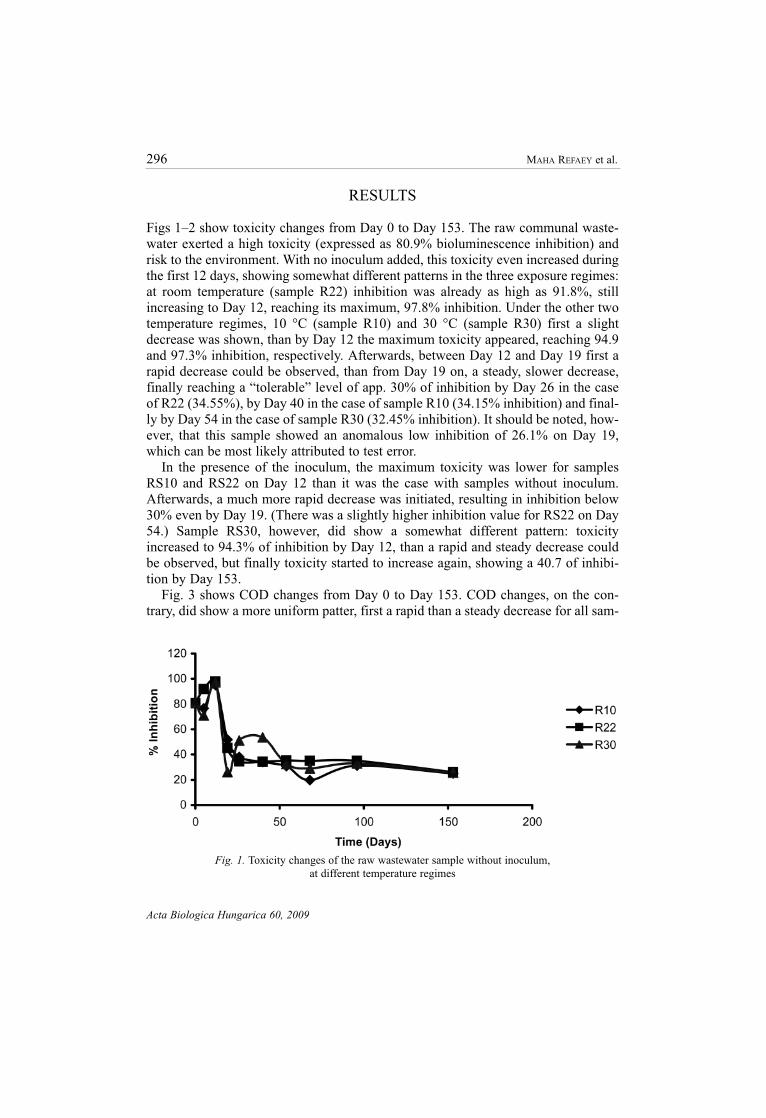
Figs 1–2 show toxicity changes from Day 0 to Day 153. The raw communal waste-water exerted a high toxicity (expressed as 80.9% bioluminescence inhibition) andrisk to the environment. With no inoculum added, this toxicity even increased duringthe first 12 days, showing somewhat different patterns in the three exposure regimes:at room temperature (sample R22) inhibition was already as high as 91.8%, stillincreasing to Day 12, reaching its maximum, 97.8% inhibition. Under the other twotemperature regimes, 10 °C (sample R10) and 30 °C (sample R30) first a slightdecrease was shown, than by Day 12 the maximum toxicity appeared, reaching 94.9and 97.3% inhibition, respectively. Afterwards, between Day 12 and Day 19 first arapid decrease could be observed, than from Day 19 on, a steady, slower decrease,finally reaching a “tolerable” level of app. 30% of inhibition by Day 26 in the caseof R22 (34.55%), by Day 40 in the case of sample R10 (34.15% inhibition) and final-ly by Day 54 in the case of sample R30 (32.45% inhibition). It should be noted, how-ever, that this sample showed an anomalous low inhibition of 26.1% on Day 19,which can be most likely attributed to test error.
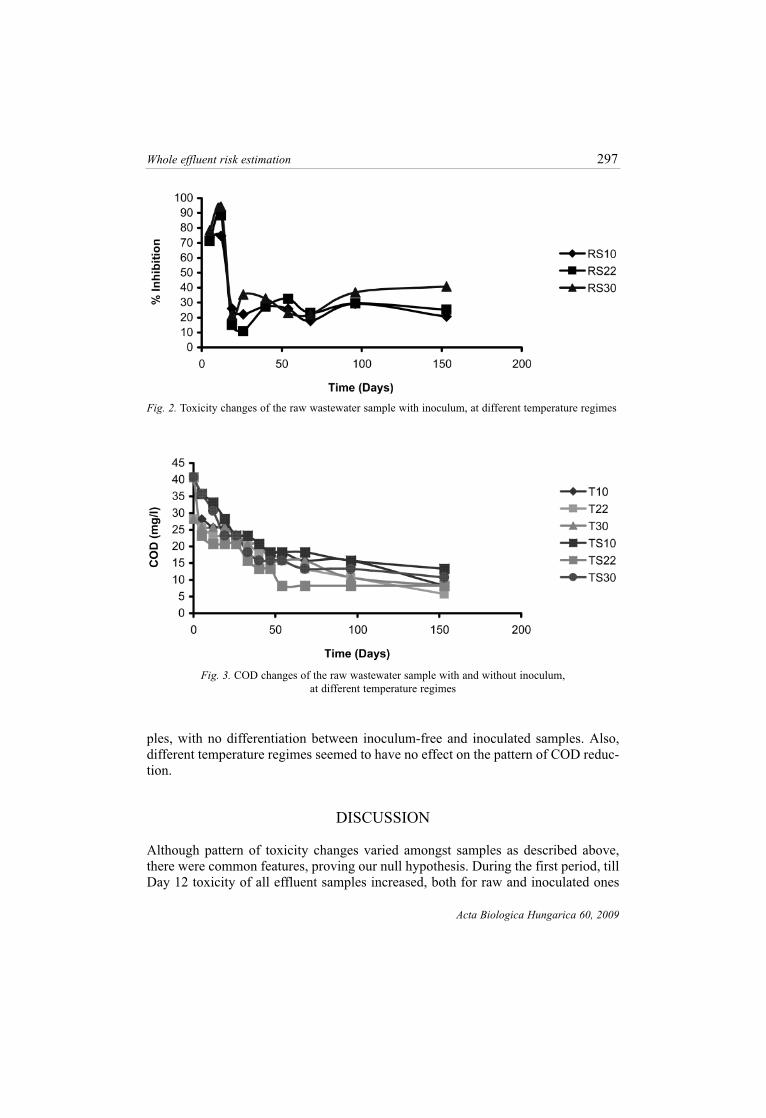
In the presence of the inoculum, the maximum toxicity was lower for samplesRS10 and RS22 on Day 12 than it was the case with samples without inoculum.Afterwards, a much more rapid decrease was initiated, resulting in inhibition below30% even by Day 19. (There was a slightly higher inhibition value for RS22 on Day54.) Sample RS30, however, did show a somewhat different pattern: toxicityincreased to 94.3% of inhibition by Day 12, than a rapid and steady decrease couldbe observed, but finally toxicity started to increase again, showing a 40.7 of inhibi-tion by Day 153.
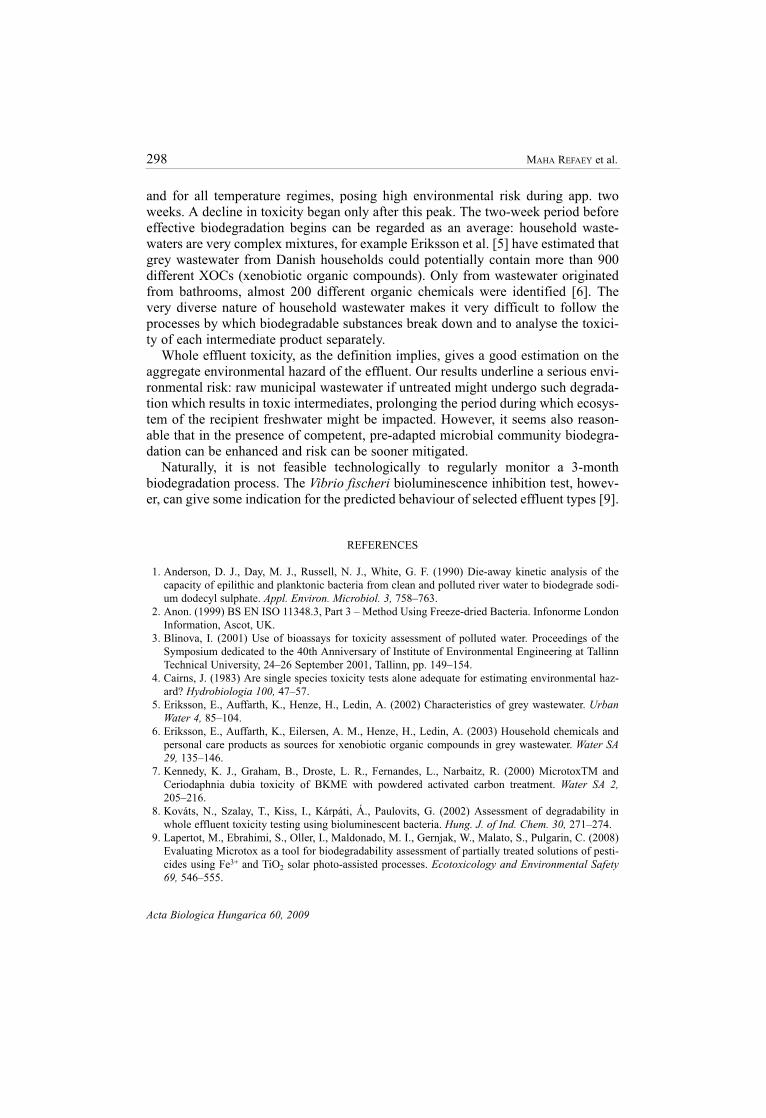
Fig. 3 shows COD changes from Day 0 to Day 153. COD changes, on the con-trary, did show a more uniform patter, first a rapid than a steady decrease for all sam-
Fig. 1. Toxicity changes of the raw wastewater sample without inoculum,at different temperature regimes
ples, with no differentiation between inoculum-free and inoculated samples. Also,different temperature regimes seemed to have no effect on the pattern of COD reduc-tion.
DISCUSSION
Although pattern of toxicity changes varied amongst samples as described above,there were common features, proving our null hypothesis. During the first period, tillDay 12 toxicity of all effluent samples increased, both for raw and inoculated ones
Whole effluent risk estimation 297
Acta Biologica Hungarica 60, 2009
Fig. 2. Toxicity changes of the raw wastewater sample with inoculum, at different temperature regimes
Fig. 3. COD changes of the raw wastewater sample with and without inoculum,at different temperature regimes
298 MAHA REFAEY et al.
Acta Biologica Hungarica 60, 2009
and for all temperature regimes, posing high environmental risk during app. twoweeks. A decline in toxicity began only after this peak. The two-week period beforeeffective biodegradation begins can be regarded as an average: household waste-waters are very complex mixtures, for example Eriksson et al. [5] have estimated thatgrey wastewater from Danish households could potentially contain more than 900different XOCs (xenobiotic organic compounds). Only from wastewater originatedfrom bathrooms, almost 200 different organic chemicals were identified [6]. Thevery diverse nature of household wastewater makes it very difficult to follow theprocesses by which biodegradable substances break down and to analyse the toxici-ty of each intermediate product separately.
Whole effluent toxicity, as the definition implies, gives a good estimation on theaggregate environmental hazard of the effluent. Our results underline a serious envi-ronmental risk: raw municipal wastewater if untreated might undergo such degrada-tion which results in toxic intermediates, prolonging the period during which ecosys-tem of the recipient freshwater might be impacted. However, it seems also reason-able that in the presence of competent, pre-adapted microbial community biodegra-dation can be enhanced and risk can be sooner mitigated.
Naturally, it is not feasible technologically to regularly monitor a 3-monthbiodegradation process. The Vibrio fischeri bioluminescence inhibition test, howev-er, can give some indication for the predicted behaviour of selected effluent types [9].
REFERENCES
1. Anderson, D. J., Day, M. J., Russell, N. J., White, G. F. (1990) Die-away kinetic analysis of thecapacity of epilithic and planktonic bacteria from clean and polluted river water to biodegrade sodi-um dodecyl sulphate. Appl. Environ. Microbiol. 3, 758–763.
2. Anon. (1999) BS EN ISO 11348.3, Part 3 – Method Using Freeze-dried Bacteria. Infonorme LondonInformation, Ascot, UK.
3. Blinova, I. (2001) Use of bioassays for toxicity assessment of polluted water. Proceedings of theSymposium dedicated to the 40th Anniversary of Institute of Environmental Engineering at TallinnTechnical University, 24–26 September 2001, Tallinn, pp. 149–154.
4. Cairns, J. (1983) Are single species toxicity tests alone adequate for estimating environmental haz-ard? Hydrobiologia 100, 47–57.
5. Eriksson, E., Auffarth, K., Henze, H., Ledin, A. (2002) Characteristics of grey wastewater. Urban
Water 4, 85–104.6. Eriksson, E., Auffarth, K., Eilersen, A. M., Henze, H., Ledin, A. (2003) Household chemicals and
personal care products as sources for xenobiotic organic compounds in grey wastewater. Water SA
29, 135–146.7. Kennedy, K. J., Graham, B., Droste, L. R., Fernandes, L., Narbaitz, R. (2000) MicrotoxTM and
Ceriodaphnia dubia toxicity of BKME with powdered activated carbon treatment. Water SA 2,
205–216.8. Kováts, N., Szalay, T., Kiss, I., Kárpáti, Á., Paulovits, G. (2002) Assessment of degradability in
whole effluent toxicity testing using bioluminescent bacteria. Hung. J. of Ind. Chem. 30, 271–274.9. Lapertot, M., Ebrahimi, S., Oller, I., Maldonado, M. I., Gernjak, W., Malato, S., Pulgarin, C. (2008)
Evaluating Microtox as a tool for biodegradability assessment of partially treated solutions of pesti-cides using Fe3+ and TiO2 solar photo-assisted processes. Ecotoxicology and Environmental Safety
69, 546–555.
10. Means, J. L., Anderson, S. J. (1981) Comparison of five different methods for measuring biodegrad-ability in aqueous environment. Water Air Soil Poll. 16, 301–315.
11. Nealson, K. H., Hastings, J. W. (1979) Bacterial bioluminescence: its control and ecological signifi-cance. Microbiol. Rev. 43, 496–518.
12. Nyholm, N., Lindgaard-Jorgensen, P., Hansen, N. (1984) Biodegradation of 4-Nitrophenol inStandardized Aquatic Degradation Tests, Ecotox. Environ. Safety vol. 8, pp. 451–470.
13. OECD (Organisation for Economic Co-operation and Development) (1995) Detailed review paper onbiodegradability testing. Environment Monograph No. 98.
14. Shelton, D. R., Tiedje, J. M. (1984) General method for determining anaerobic biodegradation poten-tial. Appl. Environ. Microbiol. 47, 850–857.
15. Shimp, R. J., Schwab, B. S., Larson, R. J. (1989) Adaptation to a quaternary ammonium surfactantby suspended microbial communities in a model stream. Environ. Toxicol. Chem. 8, 723–730.
16. Strevett, K., Davidova, I., Suflita, J. M. (2002) A comprehensive review of the screening methodol-ogy for anaerobic biodegradability of surfactants. Re/Views Env. Science Biotechnol. 1, 143–167.
17. Tisler, T., Zagorc-Koncan, J., Ros, M., Cotman, M. (1999) Biodegradation and toxicity of wastewaterfrom industry producing mineral fibres for thermal insulation. Chemosphere 38, 1347–1352.
18. USEPA (1993) Methods for Measuring the Acute Toxicity of Effluents and Receiving Waters toFreshwater and Marine Organisms, 4th ed., EPA/600/4-90/027F. U.S. Environmental ProtectionAgency, National Exposure Research Laboratory, Cincinnati, OH.
19. USEPA (1994) Short-term Methods for Estimating the Chronic Toxicity of Effluents and ReceivingWaters to Freshwater Organisms, 3rd ed., EPA/600/4-91/002. U.S. Environmental ProtectionAgency, National Exposure Research Laboratory, Cincinnati, OH.
20. Ward, D. M., Brock, T. D. (1976) Nutrient limitation of oil biodegradation in lakes of varying waterquality in Vilas County. Trans. Wisc. Acad. Sci., Vol. 64, pp. 240–249.
21. Wylie, G. D., Jones, J. R., Johnson, B. T. (1982) Evaluation of the river dye-away biodegradation test.JWPCF 54, 1231–1236.
22. Zgajnar-Gotvajn, A., Zagorc-Koncan, J. (1998) Whole effluent and single substances approach: atool for hazardous wastewater management. Water. Sci. Technol. 37, 219–227.
23. Zgajnar-Gotvajn, A., Zagorc-Koncan, J. (2003) Hazard identification of pharmaceutical wastewatersusing biodegradability studies. Water. Sci. Technol. 47, 197–204.
Whole effluent risk estimation 299
Acta Biologica Hungarica 60, 2009
