qmobile case study
TRANSCRIPT
Determinants of Brand Equity of QMobile: A case study
of Pakistan
Arshian Aslam Sharif∗ Syed Waqas Bukhari†‡
Abstract: The purpose of this paper is to examine the determinants of brand equityof QMobile users. A random survey was taken using a systematic sampling of collegesand universities in a metropolitan city, Karachi, Pakistan. The questionnaire was usedto collect data. The impact of each determinant was explored by using factor analysisand multiple regression analysis. The results suggested that all the determinants havea significant impact on brand equity whereas brand response has no impact on brandequity dimension.
Keywords: Brand equity, brand loyalty, brand image, QMobile
1 Introduction
QMobile is a local mobile brand that was successfully launched in Pakistani marketwhere numerous mobile companies were already investing. The brand of QMobilestarted few years back with the commitment to cater each class of Pakistani marketthrough their excellent quality cell phones. The main distinctive feature of Q phonesis that it is the only Pakistani brand in mobile phones market that has made a strongplace in the minds of customers within a very short span of time. Today, QMobileranks itself as the second largest mobile phone brand in Pakistan that has positioneditself drastically in the minds of customers.
The purpose of this study is to find out various determinants affecting the brandequity of QMobile in Pakistan (Karachi). The variables used are perceived quality,brand image, brand loyalty, brand strength and brand responses (emotional and ra-tional responses). Around three decades back, the idea of brand equity was developedwhen people were working and exploring things in the field of marketing. A lot ofwork has been done on brand equity since then.(Cobb, Tong, & Hawley, 1995)
Another classification of branding is business to business branding. Normally com-panies do not focus on branding for the products operating in B to B pattern as theythink that in B to B marketing, personal relations and good communication matterrather than promoting the business through official brands.(Baumgarth & Bincke-banck, 2011)Hence, B to B brand equity is developed through people and their goodhuman relations. People who actually perform the tasks in B to B branding are the
∗Research Associate, IQRA University, Karachi 75300, Pakistan.†Business Graduate,Iqra University, Karachi 75300, Pakistan.‡The aurthor would like to thank Mr. Tehseen Jawaid and the two reviewers of the journals
for their comments on an earlier version of this paper. All remaining error are the author‘s
49
Journal of Management ScienceVol. 1(1): 49-60, 2014
Determinants of Brand Equity of QMobile
sales people. They convince the buyers, develop good relations with them throughtheir good communication skills and motivate them to purchase. B to B branding isnot focused by some organizations as they believe that in this business, buyers buyproducts rationally and so promoting the goods emotionally through brands does notwork.(Rosenbroijer, 2001)But in today?s competitive environment, business brandingshould not be ignored.
Many researchers have explained the concept of brand equity in numerous waysusing various variables. The concept of brand equity is usual concept when it comesto conduct a study or research on this marketing term. Whether we talk about goodsor services, all the studies done in the past on brand equity show that the better abrand?s equity is, the more are the chances of profit in a business. Factors that af-fect brand equity the most are; perceived quality, brand image, brand awareness andassociation and brand loyalty. Apart from this, many studies have also declared thetwo common variables, brand awareness and brand association as two different vari-ables; however, in past they were considered to be the same concepts of awareness andassociation(Ahmad & Butt, 2012).
Despite the enormous amount of work done on brand equity in different sectors,many gaps are still left to be covered as the concept of brand equity is very broad. It isthe brand equity of QMobile through which they have been able to progress rapidly inpast few years and have became the mainstream brand of mobile phone market in Pak-istan’s telecom sector. The purpose of this study is to find out various determinantsaffecting the brand equity of QMobile in Pakistan (Karachi) on which no research hasbeen conducted yet.
The direct beneficiaries of this study would be the policy maker and marketingmanagers of QMobile itself as they would be able to see through this particular re-search that how various factors put their impact over the brand equity of QMobile andthen they can work accordingly to further improve their brand. The decision makersoperating in QMobile can easily see that how people react, what do they demand andhow do the customers perceive their brand.
Apart from QMobile, this study can also benefit the other local and global brandsoperating in mobile industry of Pakistan like Nokia, Samsung, Sony, HTC, iPhone,Megagate and Voice etc. so as to the impact of various variables over brand equity andcan work for improvement and betterment of the brand. Such studies not only savethe time, money and energy of people sitting in an industry and guide them to utilizetheir resources in correct dimensions. Apart from the industrialists and marketingmanagers, this paper can also be helpful for other researchers and students.
QMobile has successfully introduced itself in Pakistani market through continuousinnovation and diverse technology. Along with this, QMobile has also created robustbrand equity in the market through which they have been progressing swiftly since2011 and became one of the massive brand of mobile phone market in Pakistan tele-com sector. The purpose of this study is to find out the brand equity of QMobile inPakistan (Karachi) on which no research has been conducted until now. So this studywill help marketing manager of QMobile to identify the various factors of brand equityof QMobile. Moreover this study can also be helpful for other researchers and studentsfor their guidance.
50
Journal of Management Science
The rest of the study is organized as follows. Section 2 analyses the experientialliterature on the determinants of brand equity of QMobile in Pakistan. Section 3represents the modeling framework for examination of the determinants. Section 4represents the estimation results of factor analysis and multiple regression analysis.Final section concludes the study and provides some policy implementations and rec-ommendation regarding determinants of brand equity of QMobile in Pakistan.
2 Review of Literature
Many studies have been conducted in the past on brand equity. Following are someof the studies included in this paper.
Lassar, Mittal, and Sharma (1995) examined the brand equity of television monitor(Sony, RCA and Goldstar) and three watches (Seiko, Bullova and Timex) by using 113questionnaires. The variables were brand performance, social image, value and trust-worthiness. The results showed that consumers demonstrate a halo across dimensionsof brand equity. This suggests that if consumers evaluate a brand to perform well,consumers also expect the brand to have high levels of value, or be more trustworthy.
Pappu, Quester, and Cooksey (2000) aimed at identifying brand equity?s deter-minants in Australian TV and car market. Structural equation modeling (SEM)andconfirmatory factor analysis have been used as the statistical techniques for the studywith the sample size of 539 respondents. The variables used were perceived qual-ity, brand awareness, brand loyalty and brand association. All the variables showedsignificant positive results for brand equity supporting the Aaker?s model of brandequity. The recommendation was to consider brand association and awareness as twodifferent variables as they are taken as one variable by some researchers. Work uponall the four used variables is recommended to be done in order to enhance brand equity.
Pappu and Quester (2006) aimed to establish the relation between customer sat-isfaction and brand equity in the retail market of Australia using 601 questionnaires.Multivariate analysis of variance and confirmatory factor analysis were applied whileretailer associations, retailer loyalty, retailer awareness and retailer perceived qualitywere the components of brand equity used in the research. Positive correlation wasfound for all the variables used for brand equity. It is shown through the results thatin case of department store, all four used variables vary depending on customer sat-isfaction. However, in specialty stores, retailer perceived quality, retailer associationsquality and retailer awareness vary depending upon the customer satisfaction that theretailer maintains with the buyer. The researchers recommended that better brandequity can only be developed by satisfying the customers in accordance with theirdifferent needs.
Yasin, Noor, and Mohammad (2007) aimed to find how country-of-origin image putits effect on brand equity. The study was conducted in Malaysian electrical appliances(household) using a sample of 501 customers. The statistical techniques applied werefactor and regression analysis while the variables were brand awareness/associations,brand distinctiveness and brand loyalty. It is shown through the results that country
51
Determinants of Brand Equity of QMobile
of origin and image of a brand exerts positive and significant impact over brand equity.They recommended working upon country of origin image and brand loyalty so thatequity can be improved timely and well maintained.
Jung and Sung (2008) seek to examine that how brand equity changes with thechange in culture. Responses were collected from 300 participants and they wereSouth Koreans living in Korea and America along with Americans residing in USA.Multivariate analysis of variance was used as the statistical technique and perceivedquality, brand loyalty and brand association or awareness were used as the variablesof the study. The results were found to be interesting. They concluded that the brandequity is affected more significantly and positively in Americans comparatively thanthe other two nations. Brand loyalty was found to give the greatest impact over brandequity. It was suggested that apart from the different determinants of brand equity,target market should also be kept in mind when the managers tend to maximize thebrand equity.
Tong and Hawley (2009) investigated brand equity’s components in Chinese sportswear market. The study was conducted using a sample of 304 participants. Confirma-tory factor analysis and structural equation modeling were the statistical techniquesthat were used. Brand association, brand loyalty, brand awareness and perceivedquality were the used variables for this research. Brand loyalty and brand associationshowed direct significant effect over brand equity. On the other hand, perceived qual-ity and brand awareness did not show any significant direct impact over brand equity.The researchers suggested considering all the variables to make brand equity better,but brand loyalty and awareness should be emphasized more.
Rios and Riquelme (2010) examined to identify the variables that give impact overbrand equity. Furthermore, the purpose of this study was to see the way various mar-keting activities enhance brand equity of the companies operating online in Australia.The sample size taken for the study was 318. SEM and factor analysis techniques wereused. Value and trust association, brand loyalty and awareness were the variables ofthis study. Apart from brand value association, all the remaining variables showedpositive effect on brand equity. It was suggested to follow the findings and work ac-cordingly.
Pike, Bianchi, Kerr, and Patti (2010) identified that how various factors influ-ence brand equity in Australian tourism industry taking response from 845 customers.SEM and confirmatory factor analysis techniques were used. Brand salience, brandloyalty, perceived quality and brand image were the four variables taken in this study.The results surprisingly showed that all the four variables do not affect brand equitypositively and significantly. It was suggested that marketing managers should keep acheck on all the variables that affect brand equity and managers should also keep acheck and maintain brand equity timely.
Mourad, Ennew, and Kortam (2011) tend to identify the variables affecting brandequity in the field of higher education. The study was conducted in Egypt taking asample size of 600 students. Factor analysis and multiple regression techniques wereapplied in this study and the variables included were consumer- specific attributes,brand awareness and image. It was revealed through the findings that brand equitydoes not get affected by consumer specific attributes. However, brand image showed
52
Journal of Management Science
more significant positive effect over brand equity than brand awareness. It was sug-gested to follow the findings and work accordingly.
Pinar, Girard, and Eser (2012) seek to identify how the brand equity in Turkishbanking industry is affected by various components. They took a sample of 607 par-ticipants and they used the statistical technique of ANOVA was used for this study.Perceived quality, brand and organizational association, brand image, loyalty andawareness were the variables used by the researchers. It was revealed through thefindings that perceived quality, brand loyalty, image and association were higher inprivate banks. For state banks, organizational association was the highest affectingvariable of brand equity while brand equity proved to be the lowest in foreign banks.It was suggested to work on all the used variables in this study in order to make brandequity better in banking sector.
Wang and Li (2012) seek to identify how the brand equity is affected in the mo-bile industry. The research was conducted in Taiwan in which 497 customers wereused as a sample. Factor analysis and SEM (structural equation modeling) were usedto execute this study. Perceived quality, perceived enjoyment, brand loyalty, brandawareness and association, usability, personalization, identifiability and purchase in-tention were the different variables used in this study. The brand equity was found tobe affected positively and significantly by all the variables. They suggested followingthe findings and working accordingly.
Das, Datta, and Guin (2012) found that how a retailer?s personality influencesthe brand equity for the retail brands in a department. The study was executed inIndia taking a sample of 355 customers. SEM was used as the statistical technique.Some new and different sort of variables used for this study included dependability,empathy, sophistication, vibrancy and authenticity. The findings were surprising thatis brand equity was found to have no impact from vibrancy and authenticity, however,the variables of empathy and dependability showed positive significant effect over thebrand equity. They suggested follow the findings and working accordingly.
Many researches have conducted research on the topic of determinant of brandequity; some new and different kind of variables used for those studies included brandloyalty, brand awareness and association, personality, purchase intention, perceivedquality, brand image, brand organization and many more. Most of the variables havea positive and significant impact on the brand equity, so the results indicate that allthe above mentioned variables are very crucial for determining the brand equity.
3 Methodology
Research is defined as a method of finding the answers of different queries in a system-atic way using the information found through various sources. Through research, onecannot only find a problem’s solution but the study can also have a better understand-ing of the proposed idea.(Neuman, 1997) When the research is focused then there aremainly two types of research approach namely quantitative and qualitative approach.This study is following the quantitative approach of research in which relationshipsof various hypotheses are tested with the help of different statistical techniques. The
53
Determinants of Brand Equity of QMobile
quantitative approach is also called hypothetic-deductive approach in which a theoryis tested.(Sarangi, 2010) It has many applications in a variety of fields. An example inrelation to quantitative research is to find out the factors that affect the brand equityof Nike in Pakistan. The quantitative research is also related to another classificationof research, explanatory research that is discussed as follows.
The purpose of this research is explanatory in which cause and effect of variablesare checked using the statistical techniques. Other kinds of research purpose are de-scriptive and explanatory research. This study is following the correlational design ofresearch that describes what sort of relationship exists among the variables. The cor-relation among the variables could be positive and negative both. Positive correlationindicates that the variables are directly proportional to each other; however, negativecorrelation indicates that the variables are inversely proportional to each other.
The correlation design is used to check the relation between two or more thantwo variables.(Lucy, 1996) Purposive sampling is done by collecting Primary data.Questionnaires using Likert scale were used to collect the data of 290 respondents ofQMobile. The statistical techniques used to execute the results of this research wereRegression and Factor Analysis. Firstly, Factor Analysis was applied which is a datareduction technique. The data collected through different questionnaires was passedthrough the process of Factor Analysis in which all attributes of any data consisting ofsimilar properties are reduced to one factor. Next, the technique of regression analysisis used for this research, which is a dependence technique. It explains the change,which occurs in a dependent variable due to some change in one or multiple indepen-dent variables.
The regression having multiple independent variables is called multiple regressionanalysis. Both the techniques of factor and regression analysis have many uses innumerous fields like marketing, physical science, psychology etc.(Neuman, 1997) Theresearch model for this study is as follows.
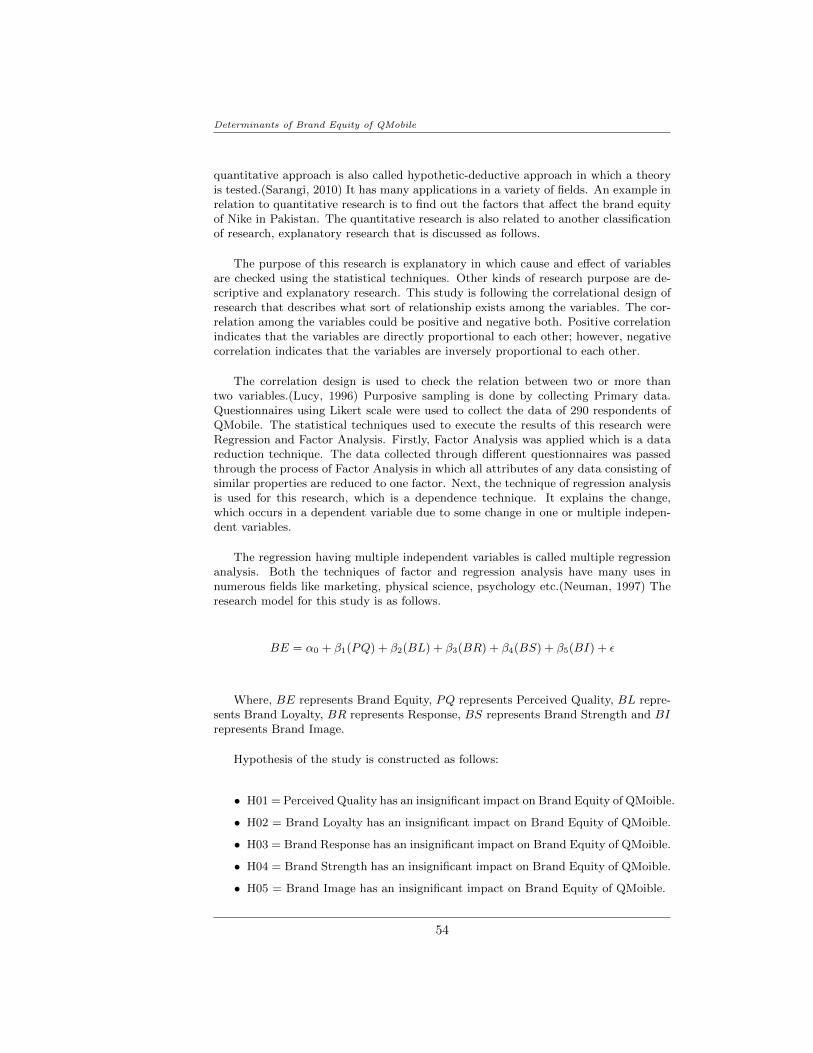
BE = α0 + β1(PQ) + β2(BL) + β3(BR) + β4(BS) + β5(BI) + ε
Where, BE represents Brand Equity, PQ represents Perceived Quality, BL repre-sents Brand Loyalty, BR represents Response, BS represents Brand Strength and BIrepresents Brand Image.
Hypothesis of the study is constructed as follows:
• H01 = Perceived Quality has an insignificant impact on Brand Equity of QMoible.
• H02 = Brand Loyalty has an insignificant impact on Brand Equity of QMoible.
• H03 = Brand Response has an insignificant impact on Brand Equity of QMoible.
• H04 = Brand Strength has an insignificant impact on Brand Equity of QMoible.
• H05 = Brand Image has an insignificant impact on Brand Equity of QMoible.
54
Journal of Management Science
4 Data Analysis
The outcomes of different test like Reliability, Factor and Regression Analysis arediscussed in this section.
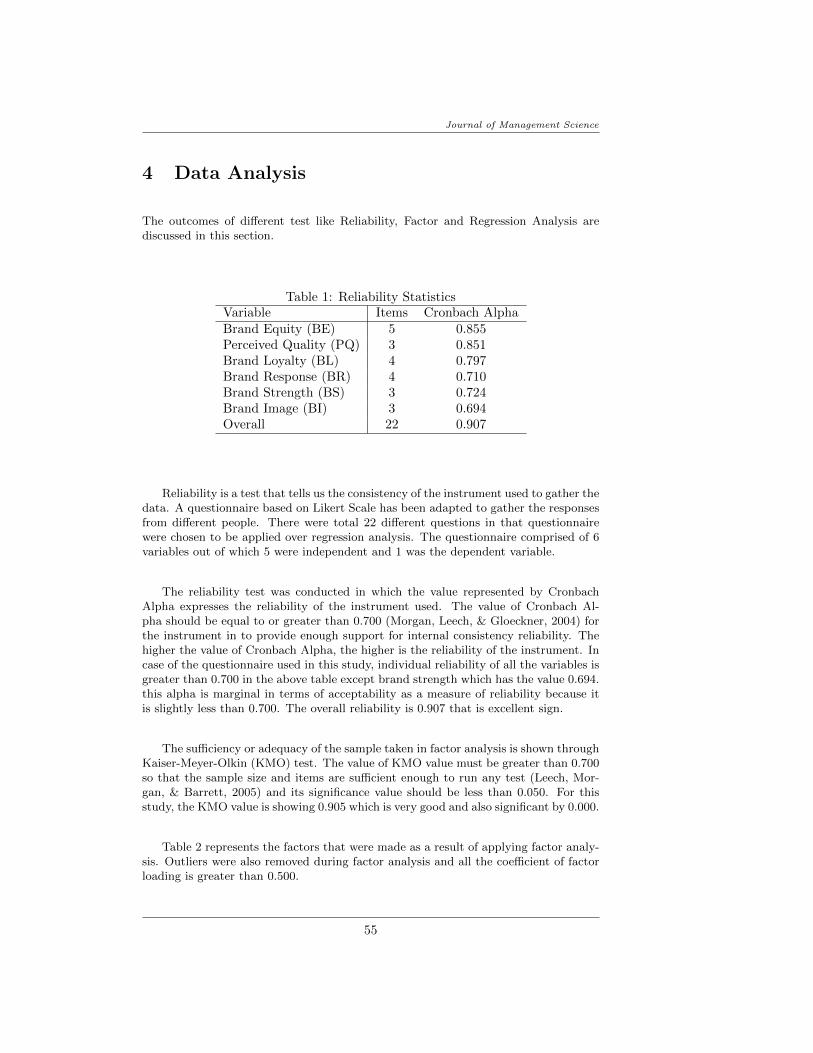
Table 1: Reliability StatisticsVariable Items Cronbach AlphaBrand Equity (BE) 5 0.855Perceived Quality (PQ) 3 0.851Brand Loyalty (BL) 4 0.797Brand Response (BR) 4 0.710Brand Strength (BS) 3 0.724Brand Image (BI) 3 0.694Overall 22 0.907
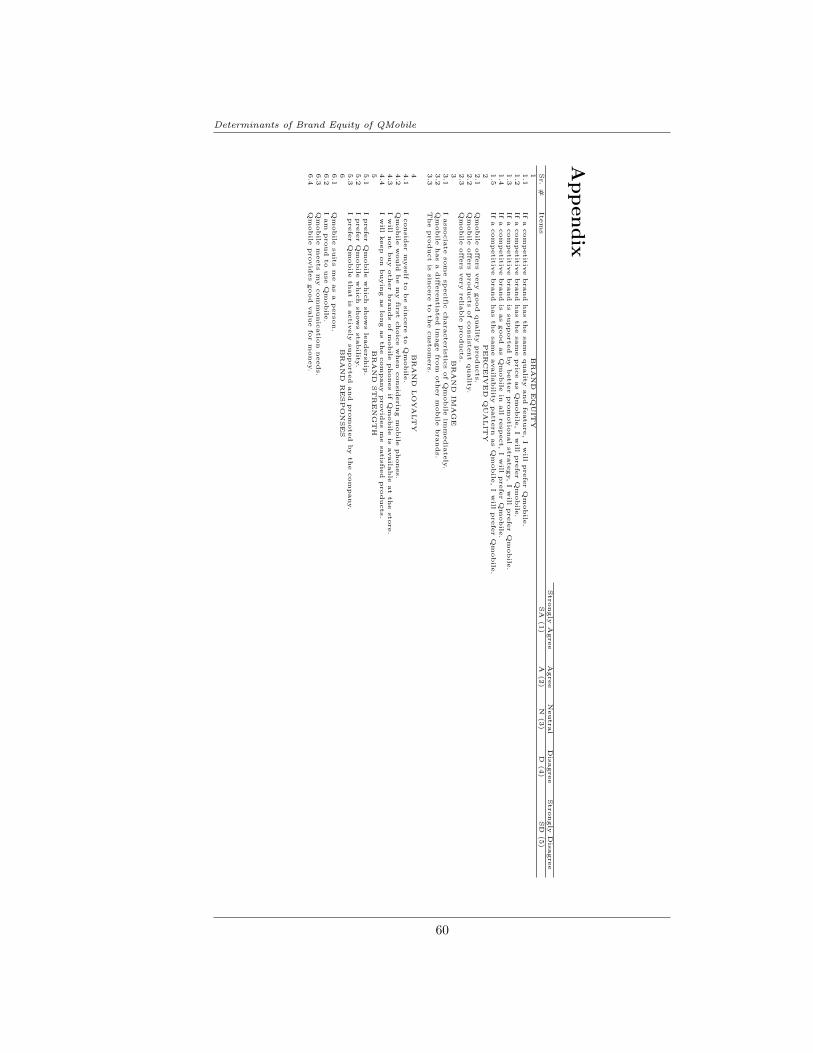
Reliability is a test that tells us the consistency of the instrument used to gather thedata. A questionnaire based on Likert Scale has been adapted to gather the responsesfrom different people. There were total 22 different questions in that questionnairewere chosen to be applied over regression analysis. The questionnaire comprised of 6variables out of which 5 were independent and 1 was the dependent variable.
The reliability test was conducted in which the value represented by CronbachAlpha expresses the reliability of the instrument used. The value of Cronbach Al-pha should be equal to or greater than 0.700 (Morgan, Leech, & Gloeckner, 2004) forthe instrument in to provide enough support for internal consistency reliability. Thehigher the value of Cronbach Alpha, the higher is the reliability of the instrument. Incase of the questionnaire used in this study, individual reliability of all the variables isgreater than 0.700 in the above table except brand strength which has the value 0.694.this alpha is marginal in terms of acceptability as a measure of reliability because itis slightly less than 0.700. The overall reliability is 0.907 that is excellent sign.
The sufficiency or adequacy of the sample taken in factor analysis is shown throughKaiser-Meyer-Olkin (KMO) test. The value of KMO value must be greater than 0.700so that the sample size and items are sufficient enough to run any test (Leech, Mor-gan, & Barrett, 2005) and its significance value should be less than 0.050. For thisstudy, the KMO value is showing 0.905 which is very good and also significant by 0.000.
Table 2 represents the factors that were made as a result of applying factor analy-sis. Outliers were also removed during factor analysis and all the coefficient of factorloading is greater than 0.500.
55
Determinants of Brand Equity of QMobile
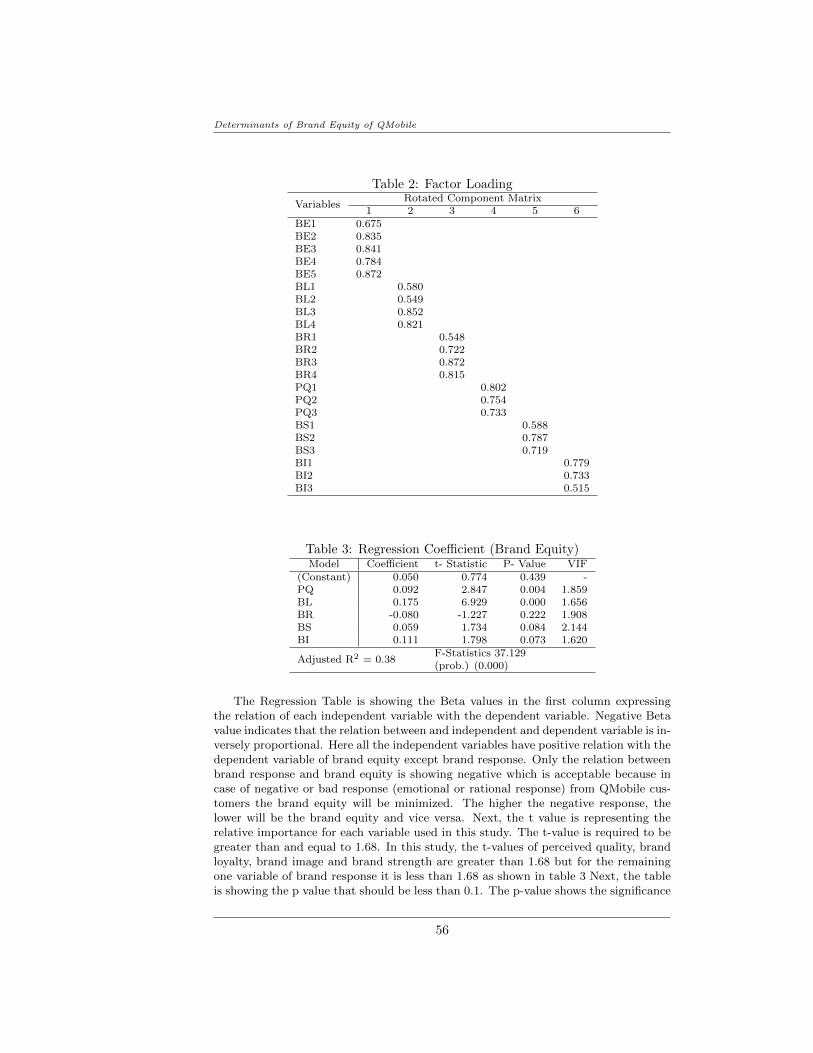
Table 2: Factor Loading
VariablesRotated Component Matrix
1 2 3 4 5 6BE1 0.675BE2 0.835BE3 0.841BE4 0.784BE5 0.872BL1 0.580BL2 0.549BL3 0.852BL4 0.821BR1 0.548BR2 0.722BR3 0.872BR4 0.815PQ1 0.802PQ2 0.754PQ3 0.733BS1 0.588BS2 0.787BS3 0.719BI1 0.779BI2 0.733BI3 0.515
Table 3: Regression Coefficient (Brand Equity)Model Coefficient t- Statistic P- Value VIF
(Constant) 0.050 0.774 0.439 -PQ 0.092 2.847 0.004 1.859BL 0.175 6.929 0.000 1.656BR -0.080 -1.227 0.222 1.908BS 0.059 1.734 0.084 2.144BI 0.111 1.798 0.073 1.620
Adjusted R2 = 0.38F-Statistics 37.129(prob.) (0.000)
The Regression Table is showing the Beta values in the first column expressingthe relation of each independent variable with the dependent variable. Negative Betavalue indicates that the relation between and independent and dependent variable is in-versely proportional. Here all the independent variables have positive relation with thedependent variable of brand equity except brand response. Only the relation betweenbrand response and brand equity is showing negative which is acceptable because incase of negative or bad response (emotional or rational response) from QMobile cus-tomers the brand equity will be minimized. The higher the negative response, thelower will be the brand equity and vice versa. Next, the t value is representing therelative importance for each variable used in this study. The t-value is required to begreater than and equal to 1.68. In this study, the t-values of perceived quality, brandloyalty, brand image and brand strength are greater than 1.68 but for the remainingone variable of brand response it is less than 1.68 as shown in table 3 Next, the tableis showing the p value that should be less than 0.1. The p-value shows the significance
56
Journal of Management Science
of variables. Like the t values in this research, the p-values are also less than 0.1 forall variables except brand response. The last column of table 3 is showing the VIF i.e.multi collinearity. Multi collinearity means that the dependent variable is affected byindependent variables and also the independent variables affect each other. The VIFvalue needs to be less than 10 for zero multi collinearity. In this study as we can seenone of the variables are showing multi collinearity.
The regression table also shows the Adjusted R Square that tells the variance per-centage in dependent variable explained by independent variables. Here the value ofAdjusted R Square is 0.38 representing that 38% of the variance in brand equity isexplained by perceived quality, brand loyalty, brand image, brand strength and brandresponse.
The results shown in table 3 are indicating that perceived quality, brand loyalty,brand strength and brand image give positive significant impact on brand equity whichmeans the higher the brand loyalty, perceived quality, brand strength and image, thehigher would be the brand equity of QMobile in Pakistan, however, brand responsedo not leave any significant impact or its contribution to enhance the brand equity ofQMobile in Pakistan is not significantly important. Brand response also has negativeimpact over the brand equity of QMobile in Pakistan as a customer’s response couldalso be negative, leading towards negative brand equity.
5 Conclusion and Managerial Implications
This study was executed to find out the determinants of brand equity of QMobile inPakistan (Karachi). The data was gathered through a questionnaire in which LikertScale was used to measure the responses of the customers who fall between 16 to 60years of age. Questions used in the studies of past researchers were adopted in the ques-tionnaire used for this study. The questionnaire also proved to be reliable with 90% ofreliability. Factor and regression analysis were also conducted. The last test appliedto this study was regression analysis that is conducted to see how each independentvariable affects the dependent variable. It was seen through regression analysis thatperceived quality, brand loyalty, brand strength and brand image have positive signif-icant impact on brand equity showing that the higher the values of these independentvariables, the higher would be the brand equity of QMobile in Pakistan. But brandresponse gave negative insignificant effect over the brand equity which means that thehigher the negative response from QMobile customers the lower will be its brand equity.
On the completion of this study and after seeing the results of factor and regres-sion analysis, following suggestions are made in order to improve the brand equityof QMobile in Pakistan. These suggestions could be beneficial for the managers andmarketers operating in mobile industry of Pakistan. This study can also benefit manyresearchers in future.
Constant efforts to further improve and maintain the quality of QMobile in Pak-istan should be made. The mobile phones of this organization should have consistencyin their quality so that they always meet their customers? expectations. As brandimage has also proven to be an important element to improve the brand equity, so
57
Determinants of Brand Equity of QMobile
the company should continue to have strong differentiation among QMobile and othermobile phones in Pakistan. A strong and positive image should be developed in theminds of mobile phone customers. The company should continue to develop uniqueattributes of QMobile in order to build strong brand strength. QMobile should alsoinitiate brand loyalty programs to achieve positive response and loyalty from all thecustomers. They should also now put more focus on brand building through advertis-ing and other marketing programs to compete with other global/international brandsin the market.
References
Ahmad, S., & Butt, M. M. (2012). Can after sale service generate brand equity?Marketing intelligence and planning , 30 (3), 307-323.
Baumgarth, C., & Binckebanck, L. (2011). Sales force impact on b-to-b brandequity:conceptual framework and empirical test. Journal of Product andBrand Management , 20 (6), 487-498.
Cobb, W., Tong, X., & Hawley, J. M. (1995). Measuring customer-based brandequity: empirical evidence from the sportswear market in china. Journalof Product and Brand Management , 3 (4), 262-271.
Das, G., Datta, B., & Guin, K. K. (2012). Impact of retailer personality onconsumer-based retailer equity: An empirical study of retail brands. AsiaPacific Journal of Marketing and Logistics, 24 (4), 619-639.
Jung, J., & Sung, E. (2008). Consumer-based brand equity: Comparisonsamong americans and south koreans in the usa and south koreans in korea.Journal of Fashion Marketing and Management , 12 (1), 24-35.
Lassar, W., Mittal, B., & Sharma, A. (1995). Measuring customer-based brandequity. Journal of Consumer Marketing , 12 (4), 11-19.
Leech, N. L., Morgan, G. A., & Barrett, K. (2005). Spss for intermediatestatistics use and interpretation (2nd ed.).
Lucy, T. (1996). Does image of country-of-origin matter to brand equity. Journalof Product and Brand Management , 4 (1), 48-68.
Morgan, G. A., Leech, N. L., & Gloeckner, G. W. (2004). Spss for introductorystatistics use and interpretation (2nd ed.).
Mourad, M., Ennew, C., & Kortam, W. (2011). Brand equity in higher educa-tion. Marketing Intelligence and Planning , 29 (4), 403-420.
Neuman, W. (1997). Brand equity of machinery appliances in industrial sector.International Journal of Industrial Marketing , 1 (4), 345-359.
Pappu, R., & Quester, P. G. (2006). Does customer satisfaction lead to improvedbrand equity? an empirical examination of two categories of retail brands.Journal of Product and Brand Management , 15 (1), 4-14.
Pappu, R., Quester, P. G., & Cooksey, R. W. (2000). Consumer-based brand eq-uity: improving the measurement - empirical evidence. Journal of Productand Brand Management , 14 (3), 143-154.
58
Journal of Management Science
Pike, S., Bianchi, C., Kerr, G., & Patti, C. (2010). Consumer-based brandequity for australia as a long-haul tourism destination in an emergingmarket. International Marketing Review , 27 (4), 434-449.
Pinar, M., Girard, T., & Eser, Z. (2012). Consumer-based brand equity inbanking industry: A comparison of local and global banks in turkey. In-ternational Journal of Bank Marketing , 30 (5), 359-375.
Rios, R., & Riquelme, H. (2010). Sources of brand equity for online companies.Journal of Research in Interactive Marketing , 4 (3), 214-240.
Rosenbroijer, R. (2001). Brand equity of electric appliances in industrial sector.International Journal of Industrial Marketing , 5 (4), 345-359.
Sarangi, P. (2010). Significant components of service brand equity in health-caresector. International Journal of Healthcare Quality Assurance, 23 (4),743-758.
Tong, X., & Hawley, J. M. (2009). Measuring customer-based brand equity: em-pirical evidence from the sportswear market in china. Journal of Productand Brand Management , 18 (4), 262-271.
Wang, W., & Li, H. (2012). Factors influencing mobile services adoption: abrand-equity perspective. Internet Research, 22 (2), 142-179.
Yasin, N. M., Noor, M. N., & Mohammad, O. (2007). Does image of country-of-origin matter to brand equity? Journal of Product and Brand Manage-ment , 16 (1), 38-48.
59
Determinants of Brand Equity of QMobile
Appendix
Strongly
Agree
Agree
Neutral
Disagree
Strongly
Disagree
Sr.
#It
em
sSA
(1)
A(2)
N(3)
D(4)
SD
(5)
1BRAND
EQ
UIT
Y1.1
Ifa
com
petitiv
ebrand
has
the
sam
equalit
yand
feature,Iwill
prefe
rQ
mobile
.1.2
Ifa
com
petitiv
ebrand
has
the
sam
epric
eas
Qm
obile
,Iwill
prefe
rQ
mobile
.1.3
Ifa
com
petitiv
ebrand
issupported
by
better
prom
otio
nalstrategy,Iwill
prefe
rQ
mobile
.1.4
Ifa
com
petitiv
ebrand
isas
good
as
Qm
obile
inall
respect,Iwill
prefe
rQ
mobile
.1.5
Ifa
com
petitiv
ebrand
has
the
sam
eavaila
bilit
ypattern
as
Qm
obile
,Iwill
prefe
rQ
mobile
.2
PERCEIV
ED
QUALIT
Y2.1
Qm
obile
offe
rs
very
good
qualit
yproducts.
2.2
Qm
obile
offe
rs
products
ofconsistent
qualit
y.
2.3
Qm
obile
offe
rs
very
relia
ble
products.
3BRAND
IMAG
E3.1
Iassocia
te
som
especific
characteristic
sofQ
mobile
imm
edia
tely
.3.2
Qm
obile
has
adiffe
rentia
ted
image
from
other
mobile
brands.
3.3
The
product
issin
cere
to
the
custom
ers.
4BRAND
LOYALTY
4.1
Iconsid
er
myself
to
be
sin
cere
to
Qm
obile
.4.2
Qm
obile
would
be
my
first
choic
ewhen
consid
erin
gm
obile
phones.
4.3
Iwill
not
buy
other
brands
ofm
obile
phones
ifQ
mobile
isavaila
ble
at
the
store.
4.4
Iwill
keep
on
buyin
gas
long
as
the
com
pany
provid
es
me
satisfie
dproducts.
5BRAND
STRENG
TH
5.1
Iprefe
rQ
mobile
which
shows
leadership
.5.2
Iprefe
rQ
mobile
which
shows
stabilit
y.
5.3
Iprefe
rQ
mobile
that
isactiv
ely
supported
and
prom
oted
by
the
com
pany.
6BRAND
RESPO
NSES
6.1
Qm
obile
suits
me
as
aperson.
6.2
Iam
proud
to
use
Qm
obile
.6.3
Qm
obile
meets
my
com
munic
atio
nneeds.
6.4
Qm
obile
provid
es
good
valu
efo
rm
oney.
60