q3 2021 - worldline
TRANSCRIPT
India Digital Payments
Report
Q3 2021
Deepak Chandnani
Managing Director, Worldline South Asia & Middle East
Despite the setbacks brought by Covid19 over the past two years, digital payments continued its
growth even in the rural pockets across the country. The PIDF status update published by RBI
states that over 5.6 million physical and digital devices have been deployed across tier 3-6
centers in addition to north-eastern states as at end of September 2021.
Owing to India's robust growth across diverse sectors such as Telecom, Healthcare, IT, Retail,
Automobile, Agriculture among others, the need for sustainable, secure and inclusive payment
methods is gaining momentum.
Worldline is at the forefront of this digital revolution and is shaping new ways of paying, living,
doing business by forming creative collaborations with clients. We develop tailor-made solutions
to meet the growing demands of banks, merchants and consumers alike. Our in-store and e-
commerce solutions in India are powering small, medium and large merchant touchpoints
across categories like groceries, restaurants, apparel, pharmacy, gaming, utility and financial
services etc. We are excited about bringing a state-of-the-art cross-border solution for digital
payments in the new year that will surely be a game changer in the business.
As we continue on our mission to offer a safe, efficient and trusted solutions to a forward-looking
India, I am pleased to share the Q3 2021 Digital Payments Report covering an overview of
Indian Digital transactions processed in July-Sept along with insights based on transactions that
we processed in our network.
In addition, we give our perspective on the shift to the mobile that is happening at an
unprecedented pace.
With 1.18 billion
wireless telecom
subscriptions, the world’s
second-largest internet
population, nearly 1 billion
cards, 2.25 billion PPIs,
and a plethora of
innovative digital payment
modes, India is poised to
be one the largest and
fastest growing digital
payments market in the
world.
The Great Mobile ShiftPage 1
Merchant Acquiring Page 2
Card Issuance Page 6
Prepaid Payment InstrumentsPage 8
Mobile and Internet based paymentsPage 10
Unified Payments InterfacePage 11
National Electronic Toll CollectionPage 12
Bharat BillPayPage 12
Aadhaar Enabled Payment Services Page 14
Contents
Sunil Rongala
Vice President – Strategy, Innovation & Analytics
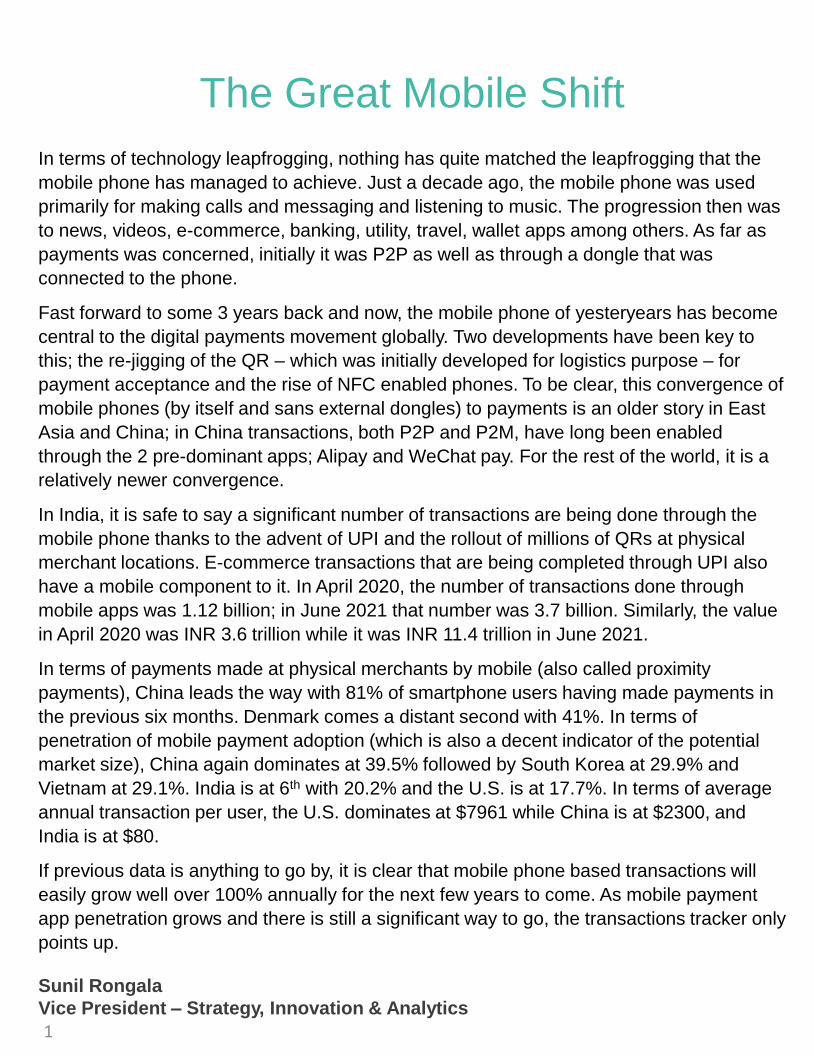
In terms of technology leapfrogging, nothing has quite matched the leapfrogging that the
mobile phone has managed to achieve. Just a decade ago, the mobile phone was used
primarily for making calls and messaging and listening to music. The progression then was
to news, videos, e-commerce, banking, utility, travel, wallet apps among others. As far as
payments was concerned, initially it was P2P as well as through a dongle that was
connected to the phone.
Fast forward to some 3 years back and now, the mobile phone of yesteryears has become
central to the digital payments movement globally. Two developments have been key to
this; the re-jigging of the QR – which was initially developed for logistics purpose – for
payment acceptance and the rise of NFC enabled phones. To be clear, this convergence of
mobile phones (by itself and sans external dongles) to payments is an older story in East
Asia and China; in China transactions, both P2P and P2M, have long been enabled
through the 2 pre-dominant apps; Alipay and WeChat pay. For the rest of the world, it is a
relatively newer convergence.
In India, it is safe to say a significant number of transactions are being done through the
mobile phone thanks to the advent of UPI and the rollout of millions of QRs at physical
merchant locations. E-commerce transactions that are being completed through UPI also
have a mobile component to it. In April 2020, the number of transactions done through
mobile apps was 1.12 billion; in June 2021 that number was 3.7 billion. Similarly, the value
in April 2020 was INR 3.6 trillion while it was INR 11.4 trillion in June 2021.
In terms of payments made at physical merchants by mobile (also called proximity
payments), China leads the way with 81% of smartphone users having made payments in
the previous six months. Denmark comes a distant second with 41%. In terms of
penetration of mobile payment adoption (which is also a decent indicator of the potential
market size), China again dominates at 39.5% followed by South Korea at 29.9% and
Vietnam at 29.1%. India is at 6th with 20.2% and the U.S. is at 17.7%. In terms of average
annual transaction per user, the U.S. dominates at $7961 while China is at $2300, and
India is at $80.
If previous data is anything to go by, it is clear that mobile phone based transactions will
easily grow well over 100% annually for the next few years to come. As mobile payment
app penetration grows and there is still a significant way to go, the transactions tracker only
points up.
1
The Great Mobile Shift
2021: Q3 in Review
We have analysed transactions available in public
databases as well as transactions processed by us
in Q3 2021 (July - September) and derived some
unique insights.
2
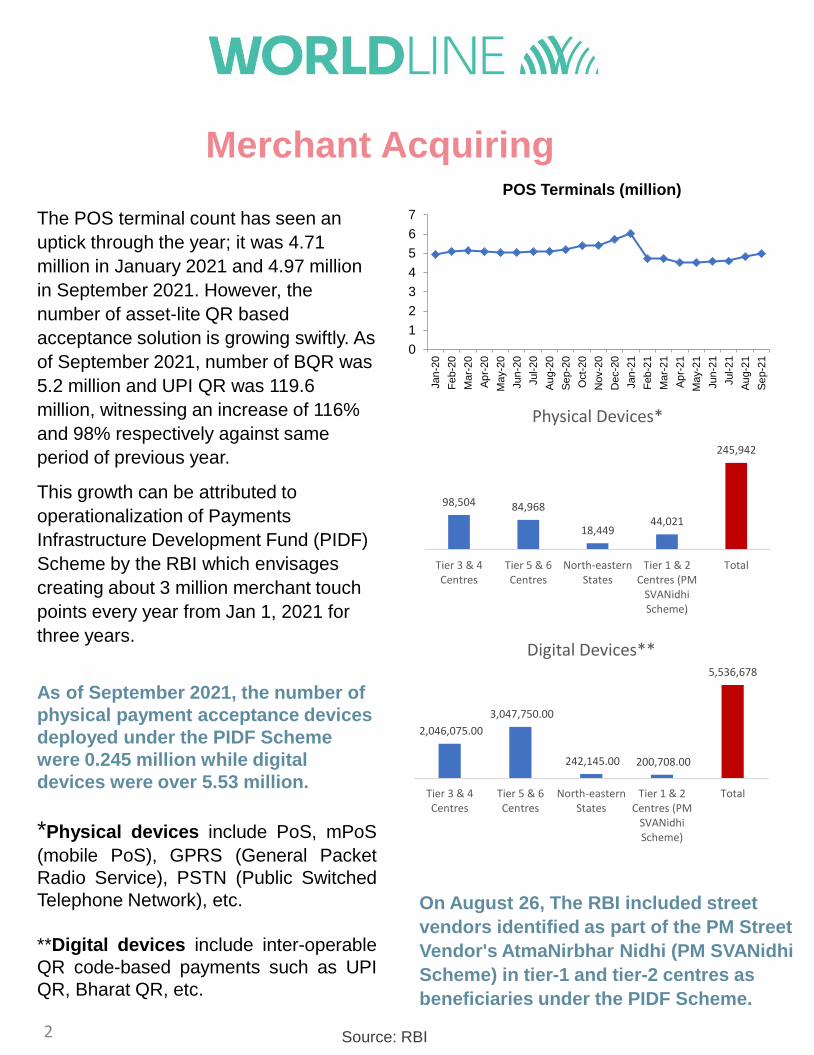
The POS terminal count has seen an
uptick through the year; it was 4.71
million in January 2021 and 4.97 million
in September 2021. However, the
number of asset-lite QR based
acceptance solution is growing swiftly. As
of September 2021, number of BQR was
5.2 million and UPI QR was 119.6
million, witnessing an increase of 116%
and 98% respectively against same
period of previous year.
This growth can be attributed to
operationalization of Payments
Infrastructure Development Fund (PIDF)
Scheme by the RBI which envisages
creating about 3 million merchant touch
points every year from Jan 1, 2021 for
three years.
As of September 2021, the number of
physical payment acceptance devices
deployed under the PIDF Scheme
were 0.245 million while digital
devices were over 5.53 million.
*Physical devices include PoS, mPoS
(mobile PoS), GPRS (General Packet
Radio Service), PSTN (Public Switched
Telephone Network), etc.
**Digital devices include inter-operable
QR code-based payments such as UPI
QR, Bharat QR, etc.
Source: RBI
0
1
2
3
4
5
6
7
Jan
-20
Fe
b-2
0
Ma
r-20
Ap
r-20
May-2
0
Jun
-20
Jul-2
0
Au
g-2
0
Se
p-2
0
Oct-
20
Nov-2
0
Dec-2
0
Jan
-21
Feb-2
1
Ma
r-21
Ap
r-21
Ma
y-2
1
Jun
-21
Jul-2
1
Au
g-2
1
Se
p-2
1
POS Terminals (million)
On August 26, The RBI included street
vendors identified as part of the PM Street
Vendor's AtmaNirbhar Nidhi (PM SVANidhi
Scheme) in tier-1 and tier-2 centres as
beneficiaries under the PIDF Scheme.
98,504 84,968
18,44944,021
245,942
Tier 3 & 4Centres
Tier 5 & 6Centres
North-easternStates
Tier 1 & 2Centres (PM
SVANidhiScheme)
Total
Physical Devices*
2,046,075.00
3,047,750.00
242,145.00 200,708.00
5,536,678
Tier 3 & 4Centres
Tier 5 & 6Centres
North-easternStates
Tier 1 & 2Centres (PM
SVANidhiScheme)
Total
Digital Devices**
Merchant Acquiring
3
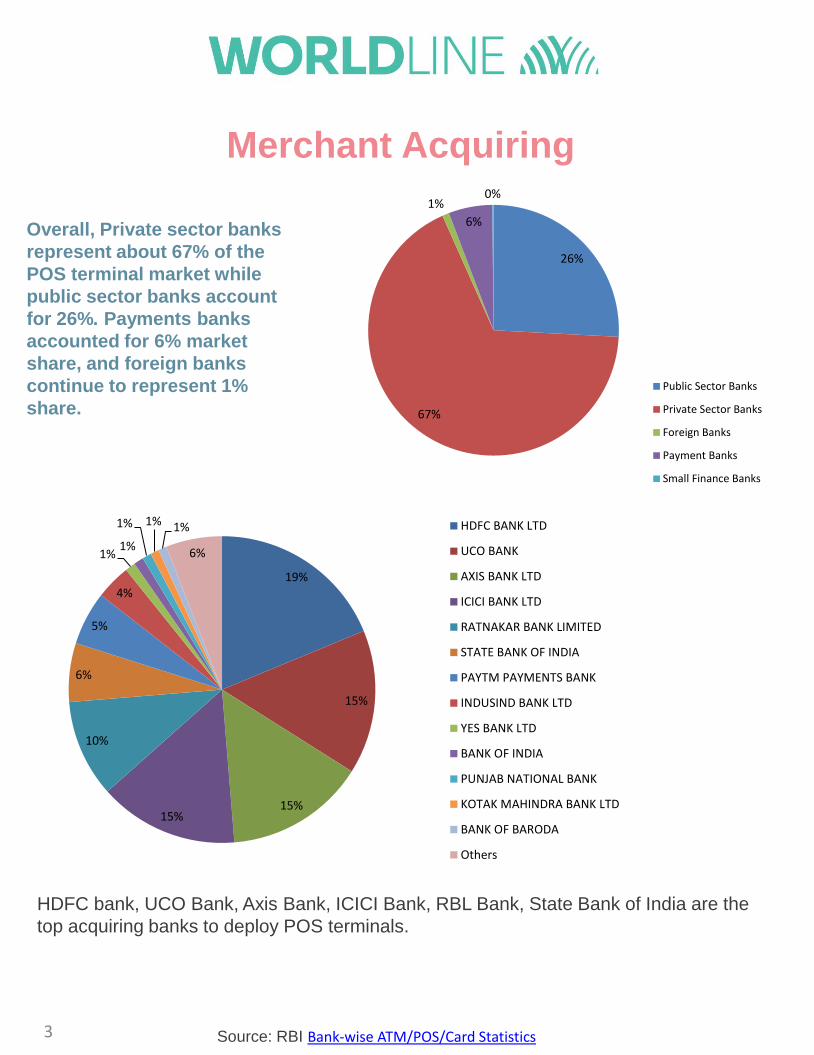
Overall, Private sector banks
represent about 67% of the
POS terminal market while
public sector banks account
for 26%. Payments banks
accounted for 6% market
share, and foreign banks
continue to represent 1%
share.
Source: RBI Bank-wise ATM/POS/Card Statistics
26%
67%
1%
6%
0%
Public Sector Banks
Private Sector Banks
Foreign Banks
Payment Banks
Small Finance Banks
19%
15%
15%15%
10%
6%
5%
4%
1%1%
1% 1% 1%
6%
HDFC BANK LTD
UCO BANK
AXIS BANK LTD
ICICI BANK LTD
RATNAKAR BANK LIMITED
STATE BANK OF INDIA
PAYTM PAYMENTS BANK
INDUSIND BANK LTD
YES BANK LTD
BANK OF INDIA
PUNJAB NATIONAL BANK
KOTAK MAHINDRA BANK LTD
BANK OF BARODA
Others
HDFC bank, UCO Bank, Axis Bank, ICICI Bank, RBL Bank, State Bank of India are the
top acquiring banks to deploy POS terminals.
Merchant Acquiring
At physical merchant touch points, groceries,
restaurants, clothing and apparel, pharmacy
and medical, hotels, jewelry retail, specialty
retail, household appliances and
departmental stores together accounted for
over 40% in terms of volume and about 50%
in terms value in Q3 2021.
In the online space, e-commerce (shopping
for goods and services), gaming, utility &
financial services contributed to over 85%
transaction in terms of volume and 41% in
value in Q3 2021.
4
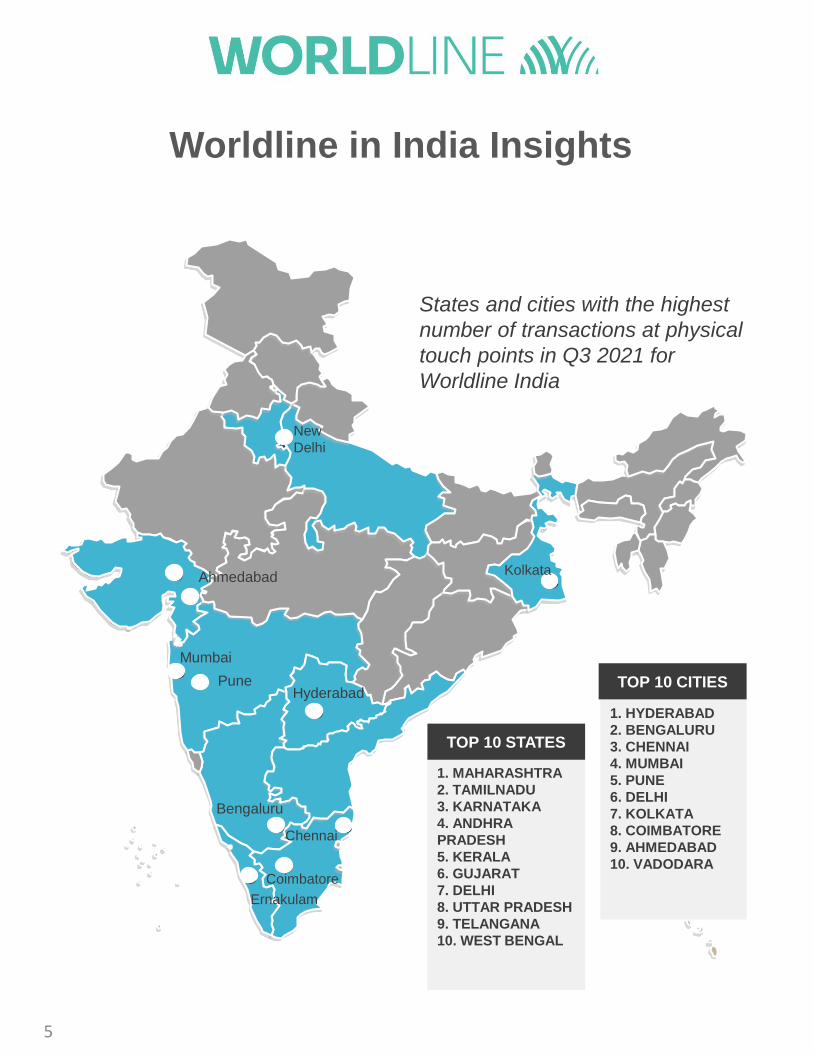
Top 10 states with the highest
transactions at physical touch points in
Q3 2021 for Worldline India:
Maharashtra, Tamil Nadu, Karnataka,
Andhra Pradesh, Kerala, Gujarat, Delhi,
Uttar Pradesh, Telangana and West
Bengal
Top 10 cities with the highest number
of transactions at physical touch points
in Q3 2021 for Worldline India:
Hyderabad, Bengaluru, Chennai, Mumbai,
Pune, Delhi, Kolkata, Coimbatore,
Ahmedabad and Vadodara.
Worldline in India Insights
1. MAHARASHTRA
2. TAMILNADU
3. KARNATAKA
4. ANDHRA
PRADESH
5. KERALA
6. GUJARAT
7. DELHI
8. UTTAR PRADESH
9. TELANGANA
10. WEST BENGAL
TOP 10 STATES
1. HYDERABAD
2. BENGALURU
3. CHENNAI
4. MUMBAI
5. PUNE
6. DELHI
7. KOLKATA
8. COIMBATORE
9. AHMEDABAD
10. VADODARA
TOP 10 CITIES
Ernakulam
Mumbai
Pune
Bengaluru
Hyderabad
Chennai
Coimbatore
New
Delhi
Kolkata
States and cities with the highest
number of transactions at physical
touch points in Q3 2021 for
Worldline India
5
Ahmedabad
Worldline in India Insights
6
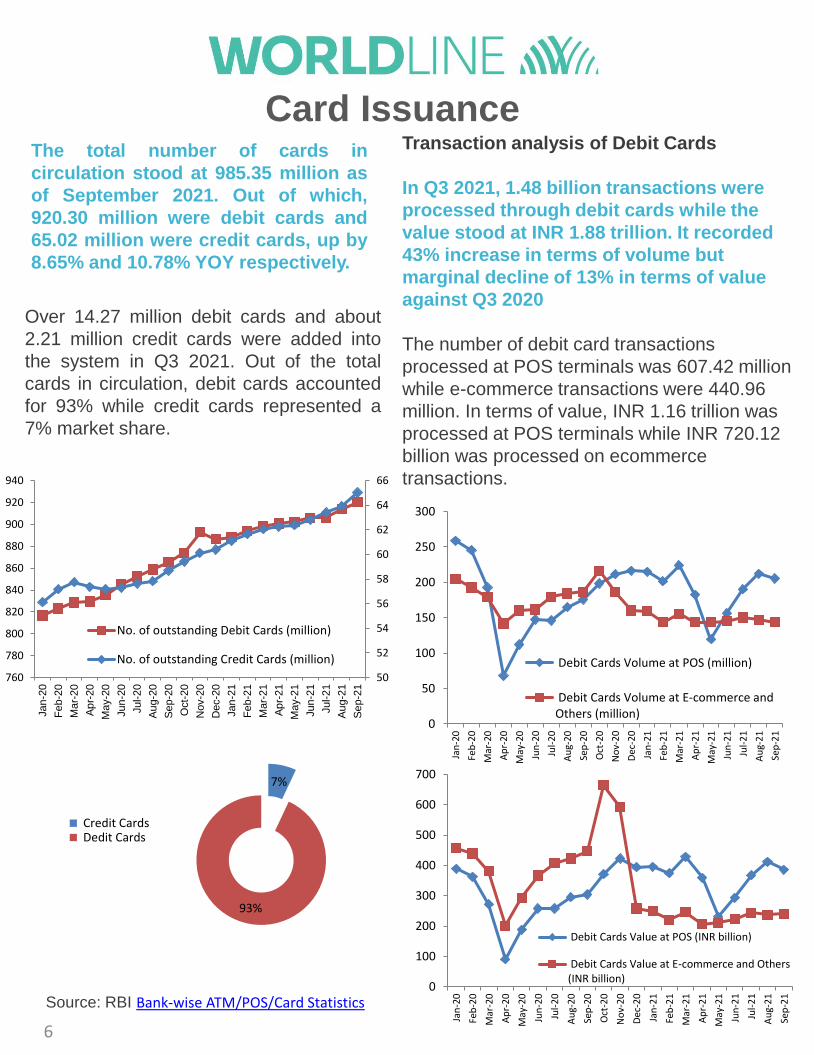
The total number of cards in
circulation stood at 985.35 million as
of September 2021. Out of which,
920.30 million were debit cards and
65.02 million were credit cards, up by
8.65% and 10.78% YOY respectively.
Transaction analysis of Debit Cards
In Q3 2021, 1.48 billion transactions were
processed through debit cards while the
value stood at INR 1.88 trillion. It recorded
43% increase in terms of volume but
marginal decline of 13% in terms of value
against Q3 2020
The number of debit card transactions
processed at POS terminals was 607.42 million
while e-commerce transactions were 440.96
million. In terms of value, INR 1.16 trillion was
processed at POS terminals while INR 720.12
billion was processed on ecommerce
transactions.
Source: RBI Bank-wise ATM/POS/Card Statistics0
100
200
300
400
500
600
700
Jan
-20
Feb
-20
Mar
-20
Ap
r-2
0
May
-20
Jun
-20
Jul-
20
Au
g-2
0
Sep
-20
Oct
-20
No
v-2
0
Dec
-20
Jan
-21
Feb
-21
Mar
-21
Ap
r-2
1
May
-21
Jun
-21
Jul-
21
Au
g-2
1
Sep
-21
Debit Cards Value at POS (INR billion)
Debit Cards Value at E-commerce and Others(INR billion)
0
50
100
150
200
250
300
Jan
-20
Feb
-20
Mar
-20
Ap
r-2
0
May
-20
Jun
-20
Jul-
20
Au
g-2
0
Sep
-20
Oct
-20
No
v-2
0
Dec
-20
Jan
-21
Feb
-21
Mar
-21
Ap
r-2
1
May
-21
Jun
-21
Jul-
21
Au
g-2
1
Sep
-21
Debit Cards Volume at POS (million)
Debit Cards Volume at E-commerce andOthers (million)
7%
93%
Credit Cards Dedit Cards
Over 14.27 million debit cards and about
2.21 million credit cards were added into
the system in Q3 2021. Out of the total
cards in circulation, debit cards accounted
for 93% while credit cards represented a
7% market share.
50
52
54
56
58
60
62
64
66
760
780
800
820
840
860
880
900
920
940
Jan
-20
Fe
b-2
0
Ma
r-20
Ap
r-20
Ma
y-2
0
Jun
-20
Jul-2
0
Au
g-2
0
Se
p-2
0
Oct-
20
Nov-2
0
Dec-2
0
Jan
-21
Fe
b-2
1
Ma
r-21
Ap
r-21
Ma
y-2
1
Jun
-21
Jul-2
1
Au
g-2
1
Se
p-2
1
No. of outstanding Debit Cards (million)
No. of outstanding Credit Cards (million)
Card Issuance
7
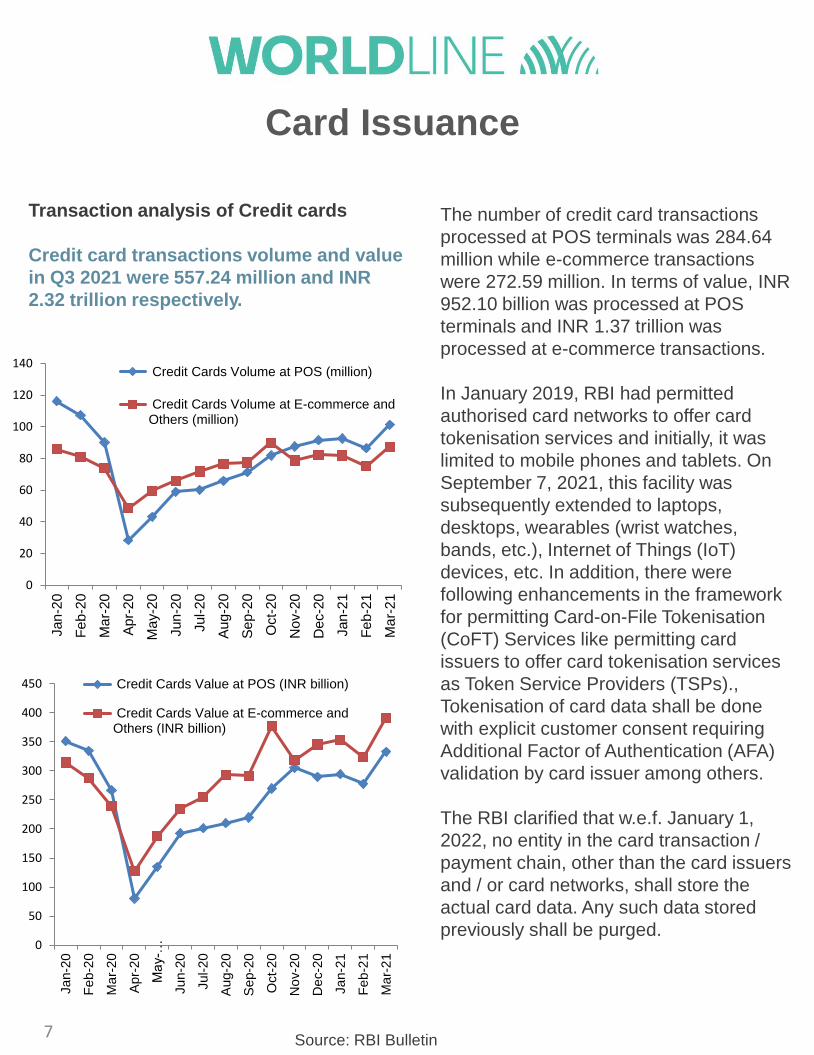
The number of credit card transactions
processed at POS terminals was 284.64
million while e-commerce transactions
were 272.59 million. In terms of value, INR
952.10 billion was processed at POS
terminals and INR 1.37 trillion was
processed at e-commerce transactions.
In January 2019, RBI had permitted
authorised card networks to offer card
tokenisation services and initially, it was
limited to mobile phones and tablets. On
September 7, 2021, this facility was
subsequently extended to laptops,
desktops, wearables (wrist watches,
bands, etc.), Internet of Things (IoT)
devices, etc. In addition, there were
following enhancements in the framework
for permitting Card-on-File Tokenisation
(CoFT) Services like permitting card
issuers to offer card tokenisation services
as Token Service Providers (TSPs).,
Tokenisation of card data shall be done
with explicit customer consent requiring
Additional Factor of Authentication (AFA)
validation by card issuer among others.
The RBI clarified that w.e.f. January 1,
2022, no entity in the card transaction /
payment chain, other than the card issuers
and / or card networks, shall store the
actual card data. Any such data stored
previously shall be purged.
0
20
40
60
80
100
120
140
Jan
-20
Fe
b-2
0
Ma
r-20
Ap
r-2
0
May-2
0
Jun
-20
Jul-
20
Au
g-2
0
Se
p-2
0
Oct-
20
No
v-2
0
De
c-2
0
Jan
-21
Fe
b-2
1
Ma
r-21
Credit Cards Volume at POS (million)
Credit Cards Volume at E-commerce andOthers (million)
0
50
100
150
200
250
300
350
400
450
Jan-2
0
Fe
b-2
0
Ma
r-2
0
Apr-
20
Ma
y-…
Jun-2
0
Jul-2
0
Aug-2
0
Sep-2
0
Oct-
20
No
v-2
0
De
c-2
0
Jan-2
1
Feb
-21
Ma
r-2
1
Credit Cards Value at POS (INR billion)
Credit Cards Value at E-commerce andOthers (INR billion)
Transaction analysis of Credit cards
Credit card transactions volume and value
in Q3 2021 were 557.24 million and INR
2.32 trillion respectively.
Source: RBI Bulletin
Card Issuance
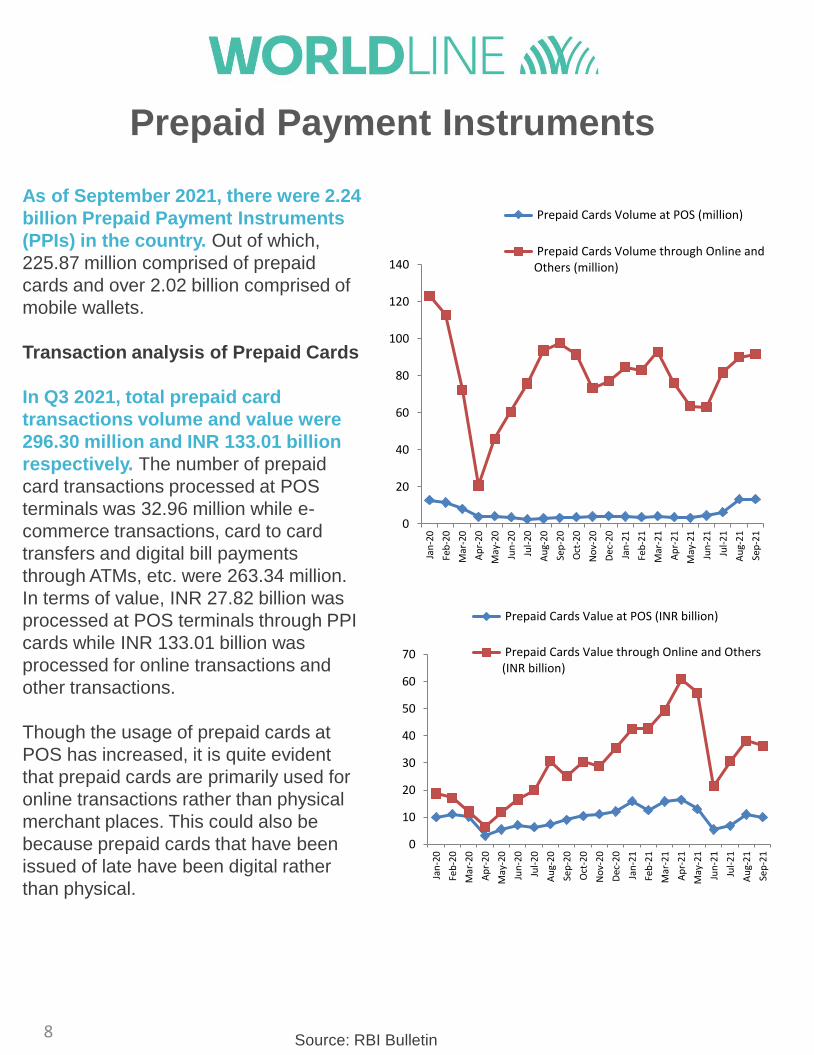
As of September 2021, there were 2.24
billion Prepaid Payment Instruments
(PPIs) in the country. Out of which,
225.87 million comprised of prepaid
cards and over 2.02 billion comprised of
mobile wallets.
Transaction analysis of Prepaid Cards
In Q3 2021, total prepaid card
transactions volume and value were
296.30 million and INR 133.01 billion
respectively. The number of prepaid
card transactions processed at POS
terminals was 32.96 million while e-
commerce transactions, card to card
transfers and digital bill payments
through ATMs, etc. were 263.34 million.
In terms of value, INR 27.82 billion was
processed at POS terminals through PPI
cards while INR 133.01 billion was
processed for online transactions and
other transactions.
Though the usage of prepaid cards at
POS has increased, it is quite evident
that prepaid cards are primarily used for
online transactions rather than physical
merchant places. This could also be
because prepaid cards that have been
issued of late have been digital rather
than physical.
8Source: RBI Bulletin
0
20
40
60
80
100
120
140
Jan
-20
Feb
-20
Mar
-20
Ap
r-2
0
May
-20
Jun
-20
Jul-
20
Au
g-2
0
Sep
-20
Oct
-20
No
v-2
0
Dec
-20
Jan
-21
Feb
-21
Mar
-21
Ap
r-2
1
May
-21
Jun
-21
Jul-
21
Au
g-2
1
Sep
-21
Prepaid Cards Volume at POS (million)
Prepaid Cards Volume through Online andOthers (million)
0
10
20
30
40
50
60
70
Jan
-20
Feb
-20
Mar
-20
Ap
r-2
0
May
-20
Jun
-20
Jul-
20
Au
g-2
0
Sep
-20
Oct
-20
No
v-2
0
Dec
-20
Jan
-21
Feb
-21
Mar
-21
Ap
r-2
1
May
-21
Jun
-21
Jul-
21
Au
g-2
1
Sep
-21
Prepaid Cards Value at POS (INR billion)
Prepaid Cards Value through Online and Others(INR billion)
Prepaid Payment Instruments
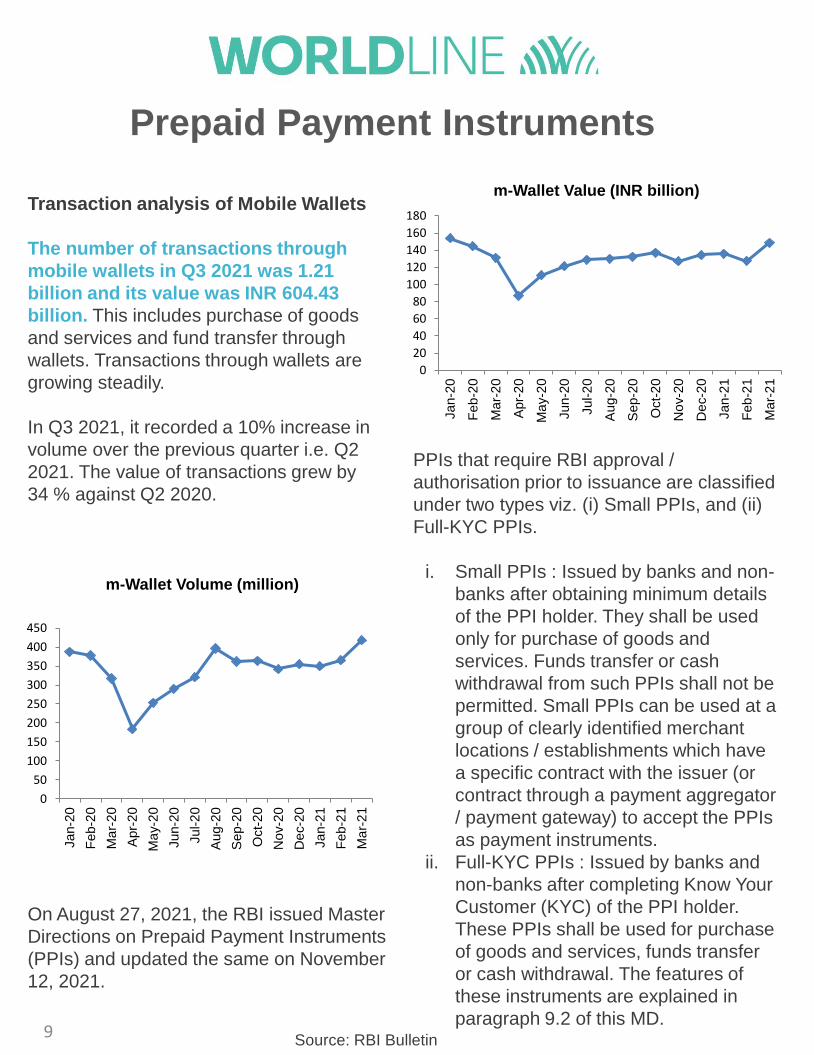
Transaction analysis of Mobile Wallets
The number of transactions through
mobile wallets in Q3 2021 was 1.21
billion and its value was INR 604.43
billion. This includes purchase of goods
and services and fund transfer through
wallets. Transactions through wallets are
growing steadily.
In Q3 2021, it recorded a 10% increase in
volume over the previous quarter i.e. Q2
2021. The value of transactions grew by
34 % against Q2 2020.
9
0
50
100
150
200
250
300
350
400
450
Jan-2
0
Feb
-20
Ma
r-2
0
Apr-
20
Ma
y-2
0
Jun-2
0
Jul-2
0
Aug-2
0
Sep-2
0
Oct-
20
No
v-2
0
De
c-2
0
Jan-2
1
Feb
-21
Ma
r-2
1
m-Wallet Volume (million)
0
20
40
60
80
100
120
140
160
180
Jan-2
0
Feb
-20
Ma
r-2
0
Apr-
20
Ma
y-2
0
Jun-2
0
Jul-2
0
Aug-2
0
Sep-2
0
Oct-
20
No
v-2
0
De
c-2
0
Jan-2
1
Feb
-21
Ma
r-2
1
m-Wallet Value (INR billion)
PPIs that require RBI approval /
authorisation prior to issuance are classified
under two types viz. (i) Small PPIs, and (ii)
Full-KYC PPIs.
i. Small PPIs : Issued by banks and non-
banks after obtaining minimum details
of the PPI holder. They shall be used
only for purchase of goods and
services. Funds transfer or cash
withdrawal from such PPIs shall not be
permitted. Small PPIs can be used at a
group of clearly identified merchant
locations / establishments which have
a specific contract with the issuer (or
contract through a payment aggregator
/ payment gateway) to accept the PPIs
as payment instruments.
ii. Full-KYC PPIs : Issued by banks and
non-banks after completing Know Your
Customer (KYC) of the PPI holder.
These PPIs shall be used for purchase
of goods and services, funds transfer
or cash withdrawal. The features of
these instruments are explained in
paragraph 9.2 of this MD.Source: RBI Bulletin
On August 27, 2021, the RBI issued Master
Directions on Prepaid Payment Instruments
(PPIs) and updated the same on November
12, 2021.
Prepaid Payment Instruments
10
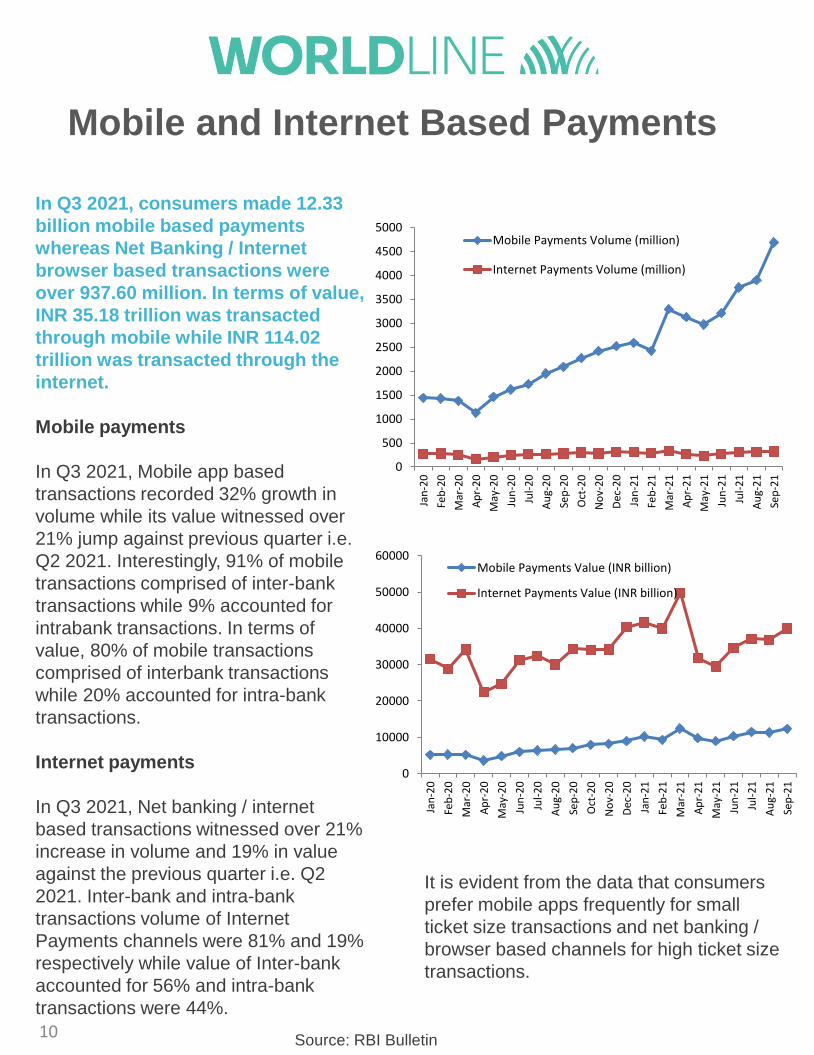
In Q3 2021, consumers made 12.33
billion mobile based payments
whereas Net Banking / Internet
browser based transactions were
over 937.60 million. In terms of value,
INR 35.18 trillion was transacted
through mobile while INR 114.02
trillion was transacted through the
internet.
Mobile payments
In Q3 2021, Mobile app based
transactions recorded 32% growth in
volume while its value witnessed over
21% jump against previous quarter i.e.
Q2 2021. Interestingly, 91% of mobile
transactions comprised of inter-bank
transactions while 9% accounted for
intrabank transactions. In terms of
value, 80% of mobile transactions
comprised of interbank transactions
while 20% accounted for intra-bank
transactions.
Internet payments
In Q3 2021, Net banking / internet
based transactions witnessed over 21%
increase in volume and 19% in value
against the previous quarter i.e. Q2
2021. Inter-bank and intra-bank
transactions volume of Internet
Payments channels were 81% and 19%
respectively while value of Inter-bank
accounted for 56% and intra-bank
transactions were 44%.
It is evident from the data that consumers
prefer mobile apps frequently for small
ticket size transactions and net banking /
browser based channels for high ticket size
transactions.
Source: RBI Bulletin
0
500
1000
1500
2000
2500
3000
3500
4000
4500
5000
Jan
-20
Feb
-20
Mar
-20
Ap
r-2
0
May
-20
Jun
-20
Jul-
20
Au
g-2
0
Sep
-20
Oct
-20
No
v-2
0
Dec
-20
Jan
-21
Feb
-21
Mar
-21
Ap
r-2
1
May
-21
Jun
-21
Jul-
21
Au
g-2
1
Sep
-21
Mobile Payments Volume (million)
Internet Payments Volume (million)
0
10000
20000
30000
40000
50000
60000
Jan
-20
Feb
-20
Mar
-20
Ap
r-2
0
May
-20
Jun
-20
Jul-
20
Au
g-2
0
Sep
-20
Oct
-20
No
v-2
0
Dec
-20
Jan
-21
Feb
-21
Mar
-21
Ap
r-2
1
May
-21
Jun
-21
Jul-
21
Au
g-2
1
Sep
-21
Mobile Payments Value (INR billion)
Internet Payments Value (INR billion)
Mobile and Internet Based Payments
11
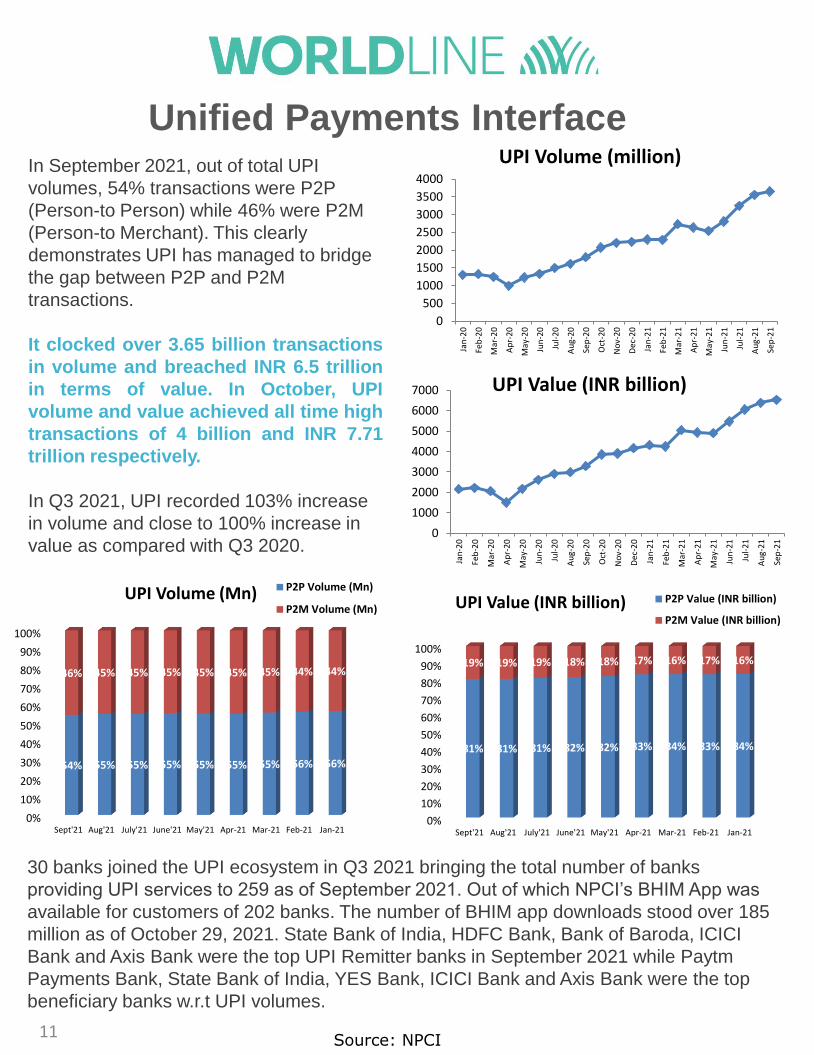
In September 2021, out of total UPI
volumes, 54% transactions were P2P
(Person-to Person) while 46% were P2M
(Person-to Merchant). This clearly
demonstrates UPI has managed to bridge
the gap between P2P and P2M
transactions.
It clocked over 3.65 billion transactions
in volume and breached INR 6.5 trillion
in terms of value. In October, UPI
volume and value achieved all time high
transactions of 4 billion and INR 7.71
trillion respectively.
In Q3 2021, UPI recorded 103% increase
in volume and close to 100% increase in
value as compared with Q3 2020.
Source: NPCI
30 banks joined the UPI ecosystem in Q3 2021 bringing the total number of banks
providing UPI services to 259 as of September 2021. Out of which NPCI’s BHIM App was
available for customers of 202 banks. The number of BHIM app downloads stood over 185
million as of October 29, 2021. State Bank of India, HDFC Bank, Bank of Baroda, ICICI
Bank and Axis Bank were the top UPI Remitter banks in September 2021 while Paytm
Payments Bank, State Bank of India, YES Bank, ICICI Bank and Axis Bank were the top
beneficiary banks w.r.t UPI volumes.
0
500
1000
1500
2000
2500
3000
3500
4000
Jan
-20
Feb
-20
Mar
-20
Ap
r-2
0
May
-20
Jun
-20
Jul-
20
Au
g-2
0
Sep
-20
Oct
-20
No
v-20
Dec
-20
Jan
-21
Feb
-21
Mar
-21
Ap
r-2
1
May
-21
Jun
-21
Jul-
21
Au
g-2
1
Sep
-21
UPI Volume (million)
0
1000
2000
3000
4000
5000
6000
7000
Jan
-20
Feb
-20
Mar
-20
Ap
r-20
May
-20
Jun
-20
Jul-
20
Au
g-20
Sep
-20
Oct
-20
No
v-20
Dec
-20
Jan
-21
Feb
-21
Mar
-21
Ap
r-21
May
-21
Jun
-21
Jul-
21
Au
g-21
Sep
-21
UPI Value (INR billion)
0%
10%
20%
30%
40%
50%
60%
70%
80%
90%
100%
Sept'21 Aug'21 July'21 June'21 May'21 Apr-21 Mar-21 Feb-21 Jan-21
54% 55% 55% 55% 55% 55% 55% 56% 56%
46% 45% 45% 45% 45% 45% 45% 44% 44%
UPI Volume (Mn) P2P Volume (Mn)
P2M Volume (Mn)
0%
10%
20%
30%
40%
50%
60%
70%
80%
90%
100%
Sept'21 Aug'21 July'21 June'21 May'21 Apr-21 Mar-21 Feb-21 Jan-21
81% 81% 81% 82% 82% 83% 84% 83% 84%
19% 19% 19% 18% 18% 17% 16% 17% 16%
UPI Value (INR billion) P2P Value (INR billion)
P2M Value (INR billion)
Unified Payments Interface
12
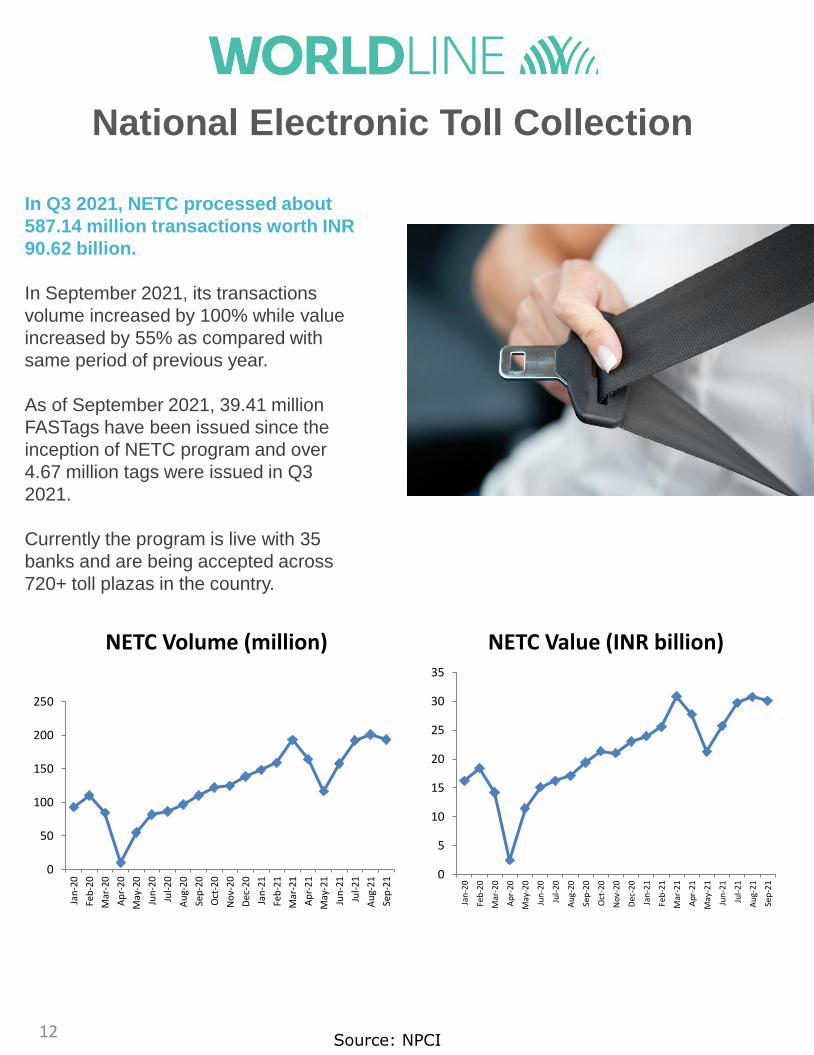
In Q3 2021, NETC processed about
587.14 million transactions worth INR
90.62 billion.
In September 2021, its transactions
volume increased by 100% while value
increased by 55% as compared with
same period of previous year.
As of September 2021, 39.41 million
FASTags have been issued since the
inception of NETC program and over
4.67 million tags were issued in Q3
2021.
Currently the program is live with 35
banks and are being accepted across
720+ toll plazas in the country.
Source: NPCI
0
50
100
150
200
250
Jan
-20
Feb
-20
Mar
-20
Ap
r-2
0
May
-20
Jun
-20
Jul-
20
Au
g-2
0
Sep
-20
Oct
-20
No
v-2
0
Dec
-20
Jan
-21
Feb
-21
Mar
-21
Ap
r-2
1
May
-21
Jun
-21
Jul-
21
Au
g-2
1
Sep
-21
NETC Volume (million)
0
5
10
15
20
25
30
35
Jan
-20
Feb
-20
Mar
-20
Ap
r-20
May
-20
Jun
-20
Jul-
20
Au
g-2
0
Sep
-20
Oct
-20
No
v-20
Dec
-20
Jan
-21
Feb
-21
Mar
-21
Ap
r-21
May
-21
Jun
-21
Jul-
21
Au
g-2
1
Sep
-21
NETC Value (INR billion)
National Electronic Toll Collection
13
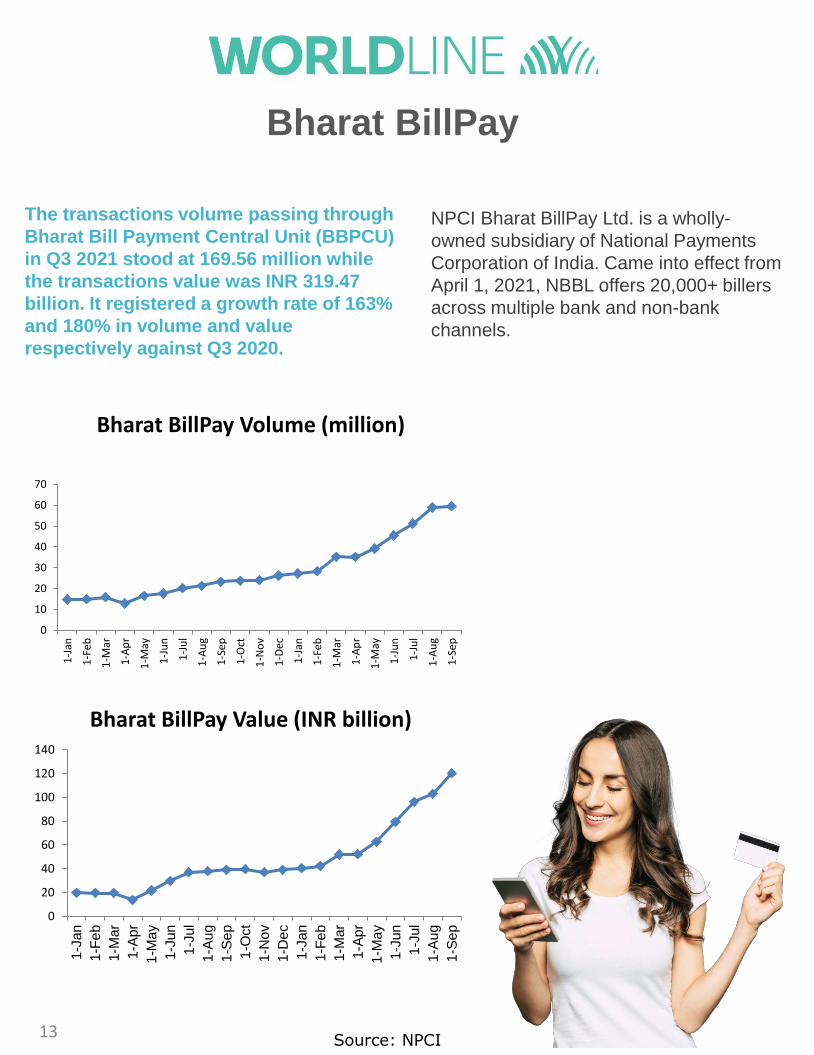
The transactions volume passing through
Bharat Bill Payment Central Unit (BBPCU)
in Q3 2021 stood at 169.56 million while
the transactions value was INR 319.47
billion. It registered a growth rate of 163%
and 180% in volume and value
respectively against Q3 2020.
NPCI Bharat BillPay Ltd. is a wholly-
owned subsidiary of National Payments
Corporation of India. Came into effect from
April 1, 2021, NBBL offers 20,000+ billers
across multiple bank and non-bank
channels.
Source: NPCI
0
20
40
60
80
100
120
140
1-J
an
1-F
eb
1-M
ar
1-A
pr
1-M
ay
1-J
un
1-J
ul
1-A
ug
1-S
ep
1-O
ct
1-N
ov
1-D
ec
1-J
an
1-F
eb
1-M
ar
1-A
pr
1-M
ay
1-J
un
1-J
ul
1-A
ug
1-S
ep
Bharat BillPay Value (INR billion)
0
10
20
30
40
50
60
70
1-J
an
1-F
eb
1-M
ar
1-A
pr
1-M
ay
1-J
un
1-J
ul
1-A
ug
1-S
ep
1-O
ct
1-N
ov
1-D
ec
1-J
an
1-F
eb
1-M
ar
1-A
pr
1-M
ay
1-J
un
1-J
ul
1-A
ug
1-S
ep
Bharat BillPay Volume (million)
Bharat BillPay
14
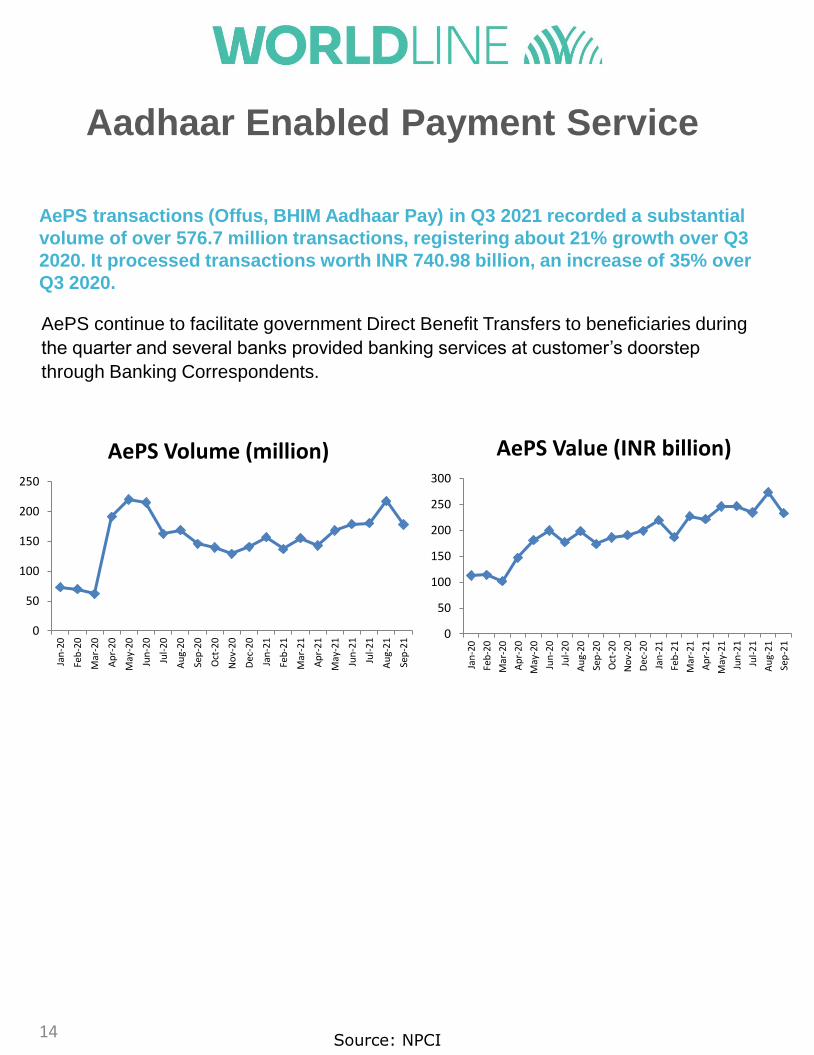
AePS transactions (Offus, BHIM Aadhaar Pay) in Q3 2021 recorded a substantial
volume of over 576.7 million transactions, registering about 21% growth over Q3
2020. It processed transactions worth INR 740.98 billion, an increase of 35% over
Q3 2020.
AePS continue to facilitate government Direct Benefit Transfers to beneficiaries during
the quarter and several banks provided banking services at customer’s doorstep
through Banking Correspondents.
Source: NPCI
0
50
100
150
200
250
300Ja
n-2
0
Feb
-20
Mar
-20
Ap
r-2
0
May
-20
Jun
-20
Jul-
20
Au
g-2
0
Sep
-20
Oct
-20
No
v-2
0
Dec
-20
Jan
-21
Feb
-21
Mar
-21
Ap
r-2
1
May
-21
Jun
-21
Jul-
21
Au
g-2
1
Sep
-21
AePS Value (INR billion)
0
50
100
150
200
250
Jan
-20
Feb
-20
Mar
-20
Ap
r-2
0
May
-20
Jun
-20
Jul-
20
Au
g-2
0
Sep
-20
Oct
-20
No
v-2
0
Dec
-20
Jan
-21
Feb
-21
Mar
-21
Ap
r-2
1
May
-21
Jun
-21
Jul-
21
Au
g-2
1
Sep
-21
AePS Volume (million)
Aadhaar Enabled Payment Service
Worldline [Euronext: WLN] is the European leader in the payments and transactional
services industry and #4 player worldwide. With its global reach and its commitment to
innovation, Worldline is the technology partner of choice for merchants, banks and third-
party acquirers as well as public transport operators, government agencies and
industrial companies in all sectors. Powered by over 20,000 employees in more than 50
countries, Worldline provides its clients with sustainable, trusted and secure solutions
across the payment value chain, fostering their business growth wherever they are.
Services offered by Worldline in the areas of Merchant Services; Terminals, Solutions &
Services; Financial Services and Mobility & e-Transactional Services include domestic
and cross-border commercial acquiring, both in-store and online, highly-secure payment
transaction processing, a broad portfolio of payment terminals as well as e-ticketing and
digital services in the industrial environment. In 2020 Worldline generated a proforma
revenue of 4.8 billion euros. worldline.com
Worldline India is a transactions facilitator across the spectrum of the digital payments
ecosystem and provides both products and services along the full length and breadth of
the payments value chain. We are involved in Merchant Acquiring, Card Issuance,
Loyalty solutions for petroleum companies, Internet Payment Gateway, National
Electronic Toll Collection, Risk Mitigation, Reconciliation and Value-added services.
Worldline is the partner of choice for merchants, banks, government agencies and
industrial companies, delivering best-in-class digital transaction services.
Worldline’s corporate purpose is to design and operate digital payment and
transactional solutions that enable sustainable economic growth and reinforce trust and
security. Worldline India is constantly investing in the latest technologies to increase
efficiencies, drive innovation and deliver customer delight. We have a presence in over
50 countries and can leverage our access to global innovations to offer significant tech
stack strength in our offerings. We have a dedicated workforce and service capabilities
to ensure complete control on every aspect of the acquiring business – from the
terminal to the switch – through ownership of all IP and source codes. We bring value to
our customers by offering end-to-end solutions covering every aspect of the merchant
acquiring value chain; terminals, platforms, processing, risk management, reconciliation,
and helpdesk among others.
About Worldline

This report has been prepared by
Sunil Rongala
Vice President
Strategy, Innovation & Analytics
Manish Kohli
Manager
Marketing & Communications
Tanha Naik
Strategy & Corporate Affairs