pulmonary function and cardiorespiratory fitness in idiopathic
TRANSCRIPT

Pulmonary function and
cardiorespiratory fitness in idiopathic
Parkinson’s disease
Ailish Kathleen O’Callaghan
A thesis submitted for admission to the degree of
Doctor of Philosophy at Newcastle University
Northumbria Healthcare NHS Foundation Trust
Institute of Health and Society
April 2017

iii
Abstract
Idiopathic Parkinson’s disease (IPD) is a progressive neurodegenerative
disorder, secondary to dopaminergic depletion, which primarily affects motor
control via the basal ganglia. It is a multi system disease affecting dopaminergic
neurones throughout the body. The Parkinsonian syndromes are associated
with excess morbidity and mortality from respiratory causes. Pulmonary function
studies have yielded conflicting results in IPD. There is a lack of high quality
research examining the effect of exercise on pulmonary function and aerobic
capacity in IPD. Understanding the pattern of any respiratory dysfunction and
impairment in cardiorespiratory fitness in IPD, and interventions that could
modify these, are of importance in dyspnoea, hypoxia, hypercapnia,
pneumonia, speech, swallowing, sleep disordered breathing, daytime
somnolence, acute respiratory failure, extubation difficulties, increased
respiratory infections and reduced exercise tolerance and functional capacity.
We recruited 103 individuals with IPD, at different disease stages, from the
Northumbria Parkinson’s Disease Service to define the pattern of pulmonary
dysfunction and respiratory muscle strength. 100 participants completed a
cross-sectional study comprising demographics, questionnaires and
comprehensive pulmonary function testing, including spirometry, flow volume
loops, lung volume assessment and respiratory muscle strength testing. Of
these 100, 32 volunteered for a randomised control trial (RCT) with additional
measurements of aerobic capacity, assessed by cardiopulmonary exercise
testing, and exercise capacity, assessed by six minute walk testing. The
participants were randomised, 1:1, control:intervention. The intervention group
participated in a 12 week, 3 times weekly, exercise intervention. The baseline
assessments were repeated in both groups immediately after the intervention,
with 27 completing the RCT.
The cross-sectional pulmonary function study revealed an increased prevalence
of obstructive spirometry, upper airway obstruction and inspiratory muscle
weakness in this population. The randomised control trial demonstrated
statistically significant improvements in the intervention group only in; aerobic
capacity, exercise capacity, subjective parkinsonian symptoms, quality of life,
depression, anxiety, sleep and sleepiness.

iv
Dedication
For everyone affected by Parkinson’s

v
Acknowledgements
I would like to express my sincere gratitude to everyone who has been involved
with the study. I would like to thank my supervisors, Professor Richard Walker
and Professor Michael Trenell, for their enthusiasm, support, guidance and
patience. I would also like to thank Keith Gray, who provided very welcome
advice on statistical analysis. Sincere thanks go to the entire Northumbria
Parkinson’s disease team, but in particular Parkinson’s specialist nurses Karen
Ullyart and Catherine Jones, who dedicated a large amount of time and effort to
recruitment and assessment for the study. Thanks also go to Djordje Jakovljevic
and Sarah Moore of the Movelab for their knowledge and assistance, and Dr
Stephen Bourke of Northumbria Healthcare for his knowledge and advice.
Sincere thanks also go to the Northumbria lung function department, led by
Helen Morrow, for their expert assessments and flexibility. Personally, and from
the participants in the randomised control trial, I would like to thank the Healthy
Living Centre staff, led by Maureen Turner, for their enthusiastic, friendly, safe
and welcoming delivery of the exercise intervention. Vitally I would like to
express my sincere gratitude to the patients who willingly and generously gave
their time and enthusiasm to participate in this research, I have met amazing
and inspiring people affected by Parkinson’s during this study and you have
taught me a huge amount.
Finally I would like to thank my family; my mother, Sue, my brother, Carey, and
my late father, Peter, for their unconditional love, support and encouragement
which has got me to where I am today and to my wonderful husband,
Christopher, I will never be able to thank you enough for your love, support,
encouragement and patience. I am so very grateful, thank you.

vi
vii
Publications and presentations
Publications A.K. O’Callaghan, D.G. Jakovljevic, M.I. Trenell, R.W. Walker. The effect of an
exercise intervention on aerobic capacity in idiopathic Parkinson’s disease.
Movement Disorders 2014; 29 S1: S255.
A.K. O’Callaghan, D.G. Jakovljevic, M.I. Trenell, R.W. Walker. The effects of an
exercise intervention on cardiovascular system and skeletal muscle function in
idiopathic Parkinson’s disease. Movement Disorders 2014; 29 S1: S255.
O’Callaghan A, Jakovljevic D, Trenell M, Walker R. Maximum heart rate in
idiopathic Parkinson’s disease. Abstract Book 20th World Congress on
Parkinson’s Disease and Related Disorders, Geneva, Switzerland, December 8-
11, 2013; no. 081: page 26.
O’Callaghan A, Walker R. First-degree atrioventricular block in idiopathic
Parkinson’s disease. Abstract Book 20th World Congress on Parkinson’s
Disease and Related Disorders, Geneva, Switzerland, December 8-11, 2013;
no. 084: page 27.
O’Callaghan A, Walker R. Electrocardiographic artefact in idiopathic Parkinson’s
disease. Abstract Book 20th World Congress on Parkinson’s Disease and
Related Disorders, Geneva, Switzerland, December 8-11, 2013; no. 082: page
26.
White R, O’Callaghan A, van Hees V, Gray W, Jakovljevic D, Trenell M, Walker
R. The relationship between aerobic capacity, exercise capacity and physical
activity in idiopathic Parkinson’s disease. Abstract Book 20th World Congress
on Parkinson’s Disease and Related Disorders, Geneva, Switzerland,
December 8-11, 2013; no. 279: page 77.
viii
Presentations
2015 Platform presentation - Exercise and cardiorespiratory function in idiopathic
Parkinson’s disease. British Geriatric Society Movement Disorders Section Meeting,
Birmingham.
2014 Poster presentation - A randomised control trial of structured exercise therapy
on quality of life, sleep and mood in Parkinson’s. Parkinson’s UK research
conference, York.
2014 Poster presentation - The effect of an exercise intervention on aerobic
capacity in idiopathic Parkinson’s disease. 18th International Congress of Parkinson's
Disease and Movement Disorders, Stockholm, Sweden.
2014 Poster presentation - The effects of an exercise intervention on cardiovascular
system and skeletal muscle function in idiopathic Parkinson’s disease. 18th
International Congress of Parkinson's Disease and Movement Disorders, Stockholm,
Sweden.
2014 Platform presentation - The effect of an exercise intervention on
cardiopulmonary outcome measures in idiopathic Parkinson’s disease. Three Rivers
Parkinson’s meeting, Durham.
2013 Platform presentation - Maximum heart rate in idiopathic Parkinson’s disease.
XX World Congress on Parkinson’s Disease and Related Disorders, Geneva,
Switzerland.
2013 Poster presentation - First-degree atrioventricular block in idiopathic
Parkinson’s disease. XX World Congress on Parkinson’s Disease and Related
Disorders, Geneva, Switzerland.
2013 Poster presentation - Electrocardiographic artefact in idiopathic Parkinson’s
disease. XX World Congress on Parkinson’s Disease and Related Disorders,
Geneva, Switzerland.

ix
2013 Poster presentation - The relationship between aerobic capacity, exercise
capacity and physical activity in idiopathic Parkinson’s disease. XX World Congress
on Parkinson’s Disease and Related Disorders, Geneva, Switzerland.
x
Statement of work undertaken
Previous training in respiratory medicine, prior to geriatric medicine with a
specialist interest in movement disorders, fostered my interest in pulmonary
function and cardiorespiratory fitness in this group. I devised the concept for the
study. The design of both parts of the study, cross-sectional and randomised
control trial, was collaborative between myself and with input from my
supervisors, Professor Walker and Professor Trenell. The funding for the project
was applied for by myself from Parkinson’s UK and The British Geriatrics
Society and awarded in the forms of an innovation grant and a SpR start up
grant respectively. I applied for ethical approval and attended the Research
Ethics Committee with Professor Walker.
I oversaw the running of the cross-sectional and randomised control trial
sections of the study. The assessment visits were conducted by either myself or
one of the Northumbria Parkinson’s specialist nurses. The pulmonary function
testing was performed by the Pulmonary Function Department at North
Tyneside General Hospital. All testing was performed by qualified, experienced
respiratory physiologists accredited to the Association for Respiratory
Technology and Physiology (ARTP). The cardiopulmonary exercise testing was
performed by myself accompanied by either an exercise physiologist or
physiotherapist. The exercise intervention was supervised by Moor Park
Healthy Living Centre (HLC) staff (trained to British Association of Cardiac
Rehabilitation level 4 and GP referral qualification level 3) and frequently myself
also.
Processing and analysis of data was my own work. Statistical analysis was
undertaken by myself, with invaluable advice from Keith Gray.
xi
Table of Contents
Abstract .............................................................................................................. iii
Dedication .......................................................................................................... iv
Acknowledgements ............................................................................................. v
Publications and presentations ......................................................................... vii
Statement of work undertaken ............................................................................ x
List of tables ...................................................................................................... xv
List of figures....................................................................................................xvii
Abbreviations .................................................................................................. xviii
Chapter 1. Overview ...................................................................................... 1
1.1 Background and rationale to study ........................................................ 1
1.2 Outline of study aims and hypotheses ................................................... 2
Chapter 2. Introduction and literature review ................................................. 3
2.1 General introduction .............................................................................. 3
2.2 Parkinson’s disease ............................................................................... 3
2.2.1 Epidemiology ................................................................................... 4
2.2.2 Aetiology ......................................................................................... 5
2.2.3 Pathophysiology .............................................................................. 7
2.2.4 Clinical features ............................................................................. 10
2.2.5 Diagnosis ...................................................................................... 16
2.2.6 Treatment ...................................................................................... 19
2.2.7 Prognosis ...................................................................................... 22
2.3 Pulmonary function .............................................................................. 24
2.3.1 Quantification of pulmonary function ............................................. 25
2.3.2 Spirometry ..................................................................................... 25
2.3.3 Flow volume loops ......................................................................... 28
2.3.4 Lung volumes ................................................................................ 32
xii
2.3.5 Diffusion capacity .......................................................................... 34
2.3.6 Respiratory muscle function .......................................................... 36
2.3.7 Pulmonary function and ageing ..................................................... 38
2.3.8 Pulmonary function and neurodegenerative disease .................... 40
2.3.9 Pulmonary function and Parkinson’s disease ................................ 43
2.4 Cardiorespiratory fitness ...................................................................... 64
2.4.1 Quantification of cardiorespiratory fitness ..................................... 66
2.4.2 Cardiorespiratory fitness and ageing ............................................. 68
2.4.3 Cardiorespiratory fitness and neurodegenerative disease ............ 68
2.4.4 Cardiorespiratory fitness and Parkinson’s disease ........................ 69
Chapter 3. Methods: Cross-sectional study; the pattern of pulmonary
dysfunction in idiopathic Parkinson’s disease ................................................... 73
3.1 Participant recruitment ......................................................................... 73
3.2 Inclusion criteria ................................................................................... 73
3.3 Exclusion criteria .................................................................................. 74
3.4 Study journey, assessments, questionnaires and outcome measures 74
3.4.1 Assessment document .................................................................. 75
3.4.2 MDS-UPDRS ................................................................................ 77
3.4.3 PDQ-39 ......................................................................................... 77
3.4.4 SCOPA-SLEEP ............................................................................. 78
3.4.5 HADS ............................................................................................ 78
3.5 Pulmonary function measurement ....................................................... 79
3.5.1 Spirometry ..................................................................................... 80
3.5.2 Lung volumes ................................................................................ 81
3.5.3 Diffusion ........................................................................................ 82
3.6 Respiratory muscle strength ................................................................ 83
Chapter 4. Results, Discussions and Conclusions: Cross-sectional study;
The pattern of pulmonary dysfunction in idiopathic Parkinson’s disease .......... 84
xiii
4.1 Demographic features.......................................................................... 85
4.2 UPDRS Results ................................................................................... 87
4.2.1 Discussion ..................................................................................... 90
4.3 PDQ-39, SCOPA-SLEEP, HADS Results ............................................ 91
4.3.1 Discussion ..................................................................................... 92
4.4 Pulmonary Function Results ................................................................ 95
4.4.1 Discussion ................................................................................... 110
4.5 Strengths and limitations .................................................................... 119
4.6 Conclusion ......................................................................................... 119
Chapter 5. Methods: Randomised control trial; the effect of an exercise
intervention on pulmonary function, cardiorespiratory fitness and exercise
capacity in idiopathic Parkinson’s disease ...................................................... 121
5.1 Participant recruitment ....................................................................... 121
5.2 Inclusion criteria ................................................................................. 121
5.3 Exclusion criteria ................................................................................ 122
5.4 Study journey, assessments, questionnaires and outcome measures
122
5.4.1 Assessment document ................................................................ 125
5.4.2 MDS-UPDRS .............................................................................. 125
5.4.3 PDQ-39 ....................................................................................... 125
5.4.4 SCOPA-SLEEP ........................................................................... 125
5.4.5 HADS .......................................................................................... 125
5.4.6 ECG ............................................................................................ 126
5.5 Pulmonary function measurement ..................................................... 126
5.6 Cardiorespiratory fitness measurement ............................................. 126
5.7 Exercise capacity, six minute walk testing ......................................... 128
5.8 The structured exercise therapy intervention ..................................... 129
5.9 Follow up 12 week assessments ....................................................... 132
5.10 Sample size calculations ................................................................ 132
xiv
Chapter 6. Results: Randomised control trial; The effect of an exercise
intervention on pulmonary function, cardiorespiratory fitness and exercise
capacity in idiopathic Parkinson’s disease ...................................................... 133
6.1.1 Discussion ................................................................................... 146
6.1.2 Discussion: Effect of an exercise intervention on cardiorespiratory
fitness and exercise capacity ................................................................... 147
6.1.3 Discussion: Effect of an exercise intervention on pulmonary
function and respiratory muscle strength ................................................. 149
6.1.4 Discussion: Effect of an exercise intervention on parkinsonian
symptoms, Parkinson’s disease stage, quality of life, sleep, anxiety and
depression ............................................................................................... 150
6.1.5 Discussion: Heart rate response to exercise ............................... 152
6.2 Strengths and limitations ................................................................... 153
6.3 Conclusion ......................................................................................... 155
Chapter 7. Conclusion and future studies .................................................. 156
7.1 Overall conclusions ............................................................................ 156
7.2 Future studies .................................................................................... 156
Appendix A. Cross-sectional study; participant information sheet, consent form
and assessment document ............................................................................. 157
Appendix B. Rating scales .............................................................................. 165
Appendix C. Randomised control trial; participant information sheet, consent
form and assessment document ..................................................................... 166
Appendix D. Additional work resulting from thesis and ongoing analyses ...... 178
References ..................................................................................................... 180
xv
List of tables
Table 1: UK Brain Bank Parkinson's disease diagnostic criteria ....................... 17
Table 2: Pharmacological therapy options ........................................................ 21
Table 3: Summary of the literature on pulmonary function in Parkinson's disease
.......................................................................................................................... 47
Table 4: Comparison of the basic demographics between non-smokers and
smokers ............................................................................................................ 87
Table 5: Comparison of UPDRS, Hoehn and Yahr and motor phenotype
between non-smokers and smokers ................................................................. 88
Table 6: Comparison of PDQ-39 summary index, SCOPA-SLEEP and HADS
between non-smokers and smokers ................................................................. 92
Table 7: Comparison of group median results of spirometry and lung volumes
between non-smokers and smokers ................................................................. 97
Table 8: Summary of pattern of lung function in non-smokers and smokers .... 99
Table 9: Severity of obstruction in non-smokers and smokers with obstructive
spirometry ....................................................................................................... 101
Table 10: Demographics, motor phenotype and UPDRS scores comparison;
non-smokers and smokers, normal lung function and obstructive lung function
........................................................................................................................ 103
Table 11: PDQ-39, SCOPA-SLEEP and HADS scores comparison; non-
smokers and smokers, normal lung function and obstructive lung function .... 104
Table 12: Prevalence of indicators of UAO in non-smokers and smokers ...... 106
Table 13: Cumulative numbers of UAO criteria in non-smokers and smokers 107
Table 14: Respiratory muscle strength in non-smokers and smokers ............. 109
Table 15: The exercise intervention ................................................................ 131
Table 16: Demographics of the control and intervention groups pre and post the
exercise intervention ....................................................................................... 136
Table 17: UPDRS and Hoehn and Yahr scores pre and post intervention ...... 137
Table 18: Resting cardiovascular parameters and peak heart rate pre and post
intervention ..................................................................................................... 139
Table 19: Cardiorespiratory fitness and exercise capacity pre and post
intervention ..................................................................................................... 140

xvi
Table 20: PDQ 39 single index, SCOPA-SLEEP and HADS scores pre and post
intervention ..................................................................................................... 143
Table 21: Pulmonary function and respiratory muscle strength pre and post
intervention ..................................................................................................... 144
Table 22: Heart rate response to cardiopulmonary exercise test .................... 145
xvii
List of figures
Figure 1: Normal Spirometry ............................................................................. 26
Figure 2: Obstructive spirometry ....................................................................... 27
Figure 3: Restrictive Spirometry ........................................................................ 28
Figure 4: Labelled flow volume loop .................................................................. 29
Figure 5: Normal flow volume loop .................................................................... 30
Figure 6: Obstructive flow volume loop ............................................................. 30
Figure 7: Restrictive flow volume loop .............................................................. 30
Figure 8: Flow volume loops: a.Fixed UAO b.Variable extrathoracic UAO
c.Variable intrathoracic UAO ............................................................................. 31
Figure 9: Static lung volumes and capacities .................................................... 33
Figure 10: Volume-time display illustrating plethysmography sequence ........... 34
Figure 11: Flow-volume curves illustrating Type A and Type B pattern ............ 49
Figure 12: Cross-sectional study patient journey .............................................. 75
Figure 13: Cross-sectional study recruitment, drop-out and completion ........... 84
Figure 14: Motor phenotype of smokers group ................................................. 89
Figure 15: Motor phenotype of non-smokers group .......................................... 89
Figure 16: Pattern of lung function in non-smokers ......................................... 100
Figure 17: Pattern of lung function in smokers ................................................ 100
Figure 18: Cumulative numbers of UAO criteria in non-smokers and smokers
........................................................................................................................ 108
Figure 19: Randomised control trial patient journey ........................................ 124
Figure 20: The electromagnetically controlled recumbent bicycle ergometer
(Corival, Lode, Groningen, Netherlands) ........................................................ 128
Figure 21: The Metalyzer (Cortex, Leipzig, Germany) .................................... 128
Figure 22: Randomised control trial; recruitment, drop out and completion .... 134
Figure 23: Effects of exercise intervention on median change from baseline
anaerobic threshold percentage of VO2max predicted ................................... 141
Figure 24: Effects of exercise intervention on median change from baseline on
VO2peak, cardiorespiratory fitness ................................................................. 141

xviii
Abbreviations
ABG = Arterial blood gas
ALS = Amyotrophic lateral sclerosis
ANS = Autonomic nervous system
ARTP = Association for Respiratory Technology and Physiology
ATS = American Thoracic Society
a-vO2 diff = Arterial-venous oxygen difference
BDNF = Brain derived neurotrophic factor
BMI = Body Mass Index
BTS = British Thoracic Society
cmH2O = cm water pressure
CBD = Corticobasal degeneration
CO = Carbon monoxide
CO2 = Carbon dioxide
COMT = Catechol-O-methyl transferase
COPD = Chronic obstructive pulmonary disease
CPET = Cardiopulmonary exercise test
CT = Computed tomography
DBP = Diastolic blood pressure
DLB = Dementia with Lewy bodies
DLCO = Diffusing capacity of the lung for carbon monoxide
ECCS = European Community for Coal and Steel
ECG = Electrocardiogram
ERS = European Respiratory Society
ERV = Expiratory reserve volume
FBC = Full blood count
FEF = Forced expiratory flow
FEV = Forced expiratory volume
FEV1 = Forced expiratory volume in one second
FH = Family history
FIF = Forced inspiratory flow
FRC = Functional residual capacity
FVC = Forced vital capacity
xix
HADS = Hospital Anxiety and Depression Scale
Hb = Haemoglobin
He = Helium
HIT = High intensity interval training
HLC = Healthy Living Centre
HR = Heart rate
IC = Inspiratory capacity
ICD = Impulse control disorders
IPD = Idiopathic Parkinson’s disease
IRV = Inspiratory reserve volume
ITGV = Intrathoracic gas volume
IVC = Inspiratory vital capacity
KCO = Transfer coefficient
kPa = kilopascal
LBs = Lewy bodies
LLN = Lower limit of normal
LNs = Lewy neurites
LRRK2 = Leucine rich repeat kinase 2
MDS-UPDRS = Movement Disorders Society Unified Parkinson's Disease
Rating Scale
MEF = Maximum expiratory flow
MEP = Maximal expiratory pressure
MET = Metabolic equivalent
MG = Myasthenia gravis
MIF = Maximum inspiratory flow
MIP = Maximal inspiratory pressure
MMEF = Maximum mid expiratory flow
MMSE = Mini mental state examination
MND = Motor neuron disease
MoCA = Montreal Cognitive Assessment
MPPP = Desmethylprodine 1,3-Dimethyl-4-phenyl-4-propionoxypiperidine
MPTP = 1-methyl-4-phenyl-1,2,3,6-tetrahydropyridine
MRI = Magnetic resonance imaging
MS = Multiple sclerosis
MSA = Multiple system atrophy
xx
MVV = Minute ventilatory volume
N2 = Nitrogen
NICE = National Institute for Health and Care Excellence
NIV = Non-invasive ventilation
OSA = Obstructive sleep apnoea
O2 = Oxygen
Psniff = Sniff nasal inspiratory pressure
PaO2 =Partial pressure of oxygen
PaCO2 = Partial pressure of carbon dioxide
PCF = Peak cough flow
PD = Parkinson’s disease
PDQ-39 = Parkinson’s Disease Questionnaire
PDSS = Parkinson’s Disease Sleep Scale
PEmax = Maximal expiratory pressure
PEF = Peak expiratory flow
PFT = Pulmonary function test
PImax = Maximal inspiratory pressure
PIF = Peak inspiratory flow
PIGD = Postural instability gait difficulty
PINK1 = PTEN-induced putative kinase 1
PMH = Past medical history
PSP = Progressive supranuclear palsy
QT = Cardiac output
RAW = Airway resistance
RCT = Randomised control trial
RBD = REM sleep behaviour disorder
REM = Rapid eye movement
RMW = Respiratory muscle weakness
RV = Residual volume
SBP = Systolic blood pressure
SH = Social history
SMR = Standardised mortality ratio
SNc = Substantia nigra pars compacta
SNCA = α-Synuclein
SNIP = Sniff nasal inspiratory pressure
xxi
SPECT = Single-photon emission computed tomography
SV = Stroke volume
SVC = Slow vital capacity
TD = Tremor dominant
TGV = Thoracic gas volume
TLC = Total lung capacity
TLCO = Transfer factor of the lung for carbon monoxide
TV = Tidal volume
UAO = Upper airway obstruction
UK = United Kingdom
UPDRS = Unified Parkinson’s Disease Rating Scale
VA = Alveolar volume
VC = Vital capacity
VO2max = Maximal oxygen consumption
VO2peak = Peak oxygen consumption
VTA = Ventral tegmental area
6MWD = Six minute walk distance
6MWT = Six minute walk test

1
Chapter 1. Overview
1.1 Background and rationale to study
Pulmonary complications associated with idiopathic Parkinson’s disease (IPD)
are a common reason for hospital admission (Woodford and Walker, 2005, Tan
et al., 1998). Lee et al 2007, evaluated symptom burden experienced by
patients with IPD with 35.8% reporting shortness of breath on exertion, 17.9%
reporting cough and 13% reporting sputum production (Lee et al., 2007). A
higher proportion of patients with IPD die from pneumonia than in the general
population (Pennington et al., 2010). Previous research into the effect of PD on
pulmonary function has produced varied and conflicting results. Obstructive and
restrictive ventilatory defect patterns and upper-airway and intercostal muscle
problems have all been reported.
A recent review of exercise and parkinsonism underlined the improvements
pertaining to both the functional deficits and neurological biomarker
manifestations of the disorder and concluded that physical exercise co-
administered with antiparkinsonian medication ought to contribute to an
enrichment of aspects of functioning and the quality of life of PD patients
(Archer et al., 2011). The review however mentioned little evidence of the effect
of exercise on pulmonary function, aerobic capacity, respiratory muscle strength
and breathlessness and literature review has found this area to be lacking in
high quality studies. The potential benefits of an exercise intervention on factors
that relate to poor quality of life in Parkinson’s disease should not be
underestimated. Literature review has indicated the negative impact of PD on
quality of life, with many contributing factors: bradykinesia, tremor, rigidity, gait
disturbance, postural instability, pain, fatigue, depression, cognitive alterations,
sleep disturbances, drooling, limitations to social functioning and economic
implications (Chrischilles et al., 2002, Whetten-Goldstein et al., 1997, Schrag et
al., 2000, Leibner et al., 2010, Karlsen et al., 1999, Schenkman et al., 2001,
Morimoto et al., 2003).
Thus further research looking at pulmonary function, respiratory muscle
strength, aerobic capacity, and exercise capacity in different stages of the
disease, and the response to an exercise intervention in IPD, was indicated.
With the significant impact of IPD symptoms on quality of life there was further
2
justification in assessing this secondary outcome measure of an exercise
intervention also. A cross-sectional study of pulmonary function and respiratory
muscle strength in IPD was undertaken. Additionally a randomised control trial
(RCT) to research the effect of structured exercise therapy on cardiorespiratory
fitness (aerobic capacity), exercise capacity and pulmonary function was also
undertaken. The background, methods, results and conclusions of the cross-
sectional study and the RCT are discussed in this thesis.
1.2 Outline of study aims and hypotheses
The aims of this study were; to establish if pulmonary function is impaired in IPD
and secondly to establish whether pulmonary function, cardiorespiratory fitness
and exercise capacity can be improved in IPD with structured exercise therapy.
These aims were achieved through the following objectives; to define the
pattern of respiratory dysfunction in IPD and to establish whether a community
based structured exercise therapy programme improves pulmonary function,
cardiorespiratory fitness (aerobic capacity) and exercise capacity in people with
IPD.
The hypotheses of this study were:
1. Pulmonary function is impaired in IPD
2. Structured exercise therapy can improve cardiorespiratory fitness in IPD
3. Structured exercise therapy can improve exercise capacity in IPD
4. Structured exercise therapy can improve pulmonary function in IPD
3
Chapter 2. Introduction and literature review
2.1 General introduction
This thesis details a cross-sectional study of pulmonary function and respiratory
muscle strength in IPD, and a RCT to research the effect of structured exercise
therapy on cardiorespiratory fitness (aerobic capacity), exercise capacity and
pulmonary function in IPD. Chapter 2 is the introduction and literature review
that is divided into 3 sections; Parkinson’s disease, pulmonary function and
cardiorespiratory fitness. The PD section focuses on; epidemiology, aetiology,
pathophysiology, clinical features, diagnosis, treatment and prognosis. The
pulmonary function section focuses on; quantification of pulmonary function,
spirometry, flow volume loops, lung volumes, diffusion capacity, respiratory
muscle function, pulmonary function and ageing, pulmonary function and
neurodegenerative disease and pulmonary function and PD. The
cardiorespiratory fitness section focuses on; quantification of cardiorespiratory
fitness, cardiorespiratory fitness and ageing, cardiorespiratory fitness and
neurodegenerative disease and cardiorespiratory fitness and PD. Chapter 3
details the methods of the cross-sectional study; the pattern of pulmonary
dysfunction in IPD. Chapter 4 reports the results, discussion and conclusion of
the cross-sectional study. Chapter 5 details the methods of the RCT; the effect
of an exercise intervention on pulmonary function, cardiorespiratory fitness and
exercise capacity in IPD. Chapter 6 reports the results, discussion and
conclusion of the RCT. Finally, prior to the references and appendices, chapter
7 is the overall conclusions and suggestions for further studies.
2.2 Parkinson’s disease
Parkinson’s disease (PD) is a complex, progressive, neurodegenerative
disorder, secondary to dopaminergic depletion, which primarily affects motor
control via the basal ganglia. PD has both motor and non-motor symptoms due
to a spreading process of neuronal loss (Dexter and Jenner, 2013). It is a multi-
system disease affecting dopaminergic neurones throughout the body. To date
only symptomatic treatment exists, the degenerative process cannot be
arrested and the cause remains elusive (Dexter and Jenner, 2013). Although
the UK Brain Bank Criteria for PD diagnosis focuses mainly on motor
symptoms, it is accepted that non-motor symptoms also contribute to the
significant symptom burden experienced by patients with PD. The myriad of

4
potential non-motor symptoms associated with PD has led to increasing
research in this area in attempts to improve quality of life in those affected.
2.2.1 Epidemiology
The median age of onset of PD is 60 years and the incidence of PD rises with
age up to the start of the ninth decade after which there is a decrease (Lees et
al., 2009, Taylor et al., 2005). A wealth of data exists supporting that men are
more likely to develop PD than women, however a systematic review of twenty
five incidence studies highlighted that this difference may be restricted to
western populations and is more pronounced in those over 70 years of age,
with only five of the reviewed studies reporting a significantly higher incidence in
men (Twelves et al., 2003).
The reported prevalence of PD varies throughout the world. This variance is
likely multifactorial due to populations and ages studied, methodological and
diagnostic criteria differences. In the United Kingdom (UK) PD is the second
most common neurodegenerative disorder after Alzheimer’s disease (Archibald
and Burn, 2008). Local incidence and prevalence studies in the North east of
England found the crude incidence of PD in more urban areas (Newcastle and
Gateshead) to be 15.9 per 100 000 persons per year or 12.0 per 100 000 when
age standardised to European studies and in a more rural population crude and
age-adjusted prevalence estimates of 148 cases and 139 cases per 100,000
respectively (Duncan et al., 2014, Porter et al., 2006). A systematic review of 39
European incidence and prevalence studies found 87% reported estimates of
prevalence rates, while only 13% reported incidence rates with crude
prevalence rate estimates ranging from 65.6 per 100,000 to 12,500 per 100,000
and incidence estimates from 5 per 100,000 to 346 per 100,000 (von
Campenhausen et al., 2005). Despite prevalence rate calculations being crude,
PD appears less common in Asian countries (Chen and Tsai, 2010). In 2009,
using the world’s largest anonymised longitudinal computerised database of
medical records, UK PD prevalence rates were found to be 30.9/10,000 for
males and 24.1/10,000 for females translating to 69,850 males and 57,043
females with the condition (Parkinson's UK, 2009). A 2017 Parkinson’s UK
publication updated UK incidence and prevalence figures using data taken from
the May 2016 static version of the Clinical Practice Research Datalink (CPRD)
using the primary care database (GOLD). The data included patients aged 20 or
5
over with a record for Parkinson’s in their file from the 1st January 1988 to the
31st December 2015. Prevalence rates refer to that in 2015, incidence rates
use combined data over a 5 year period (2011-2015) to give more reliable
estimates. The data revealed that in the UK in 2015 approximately 2 in 1000
people live with PD. This can be broken down more specifically into 18 in every
10000 females and 25 in every 10000 males. Focussing on the adult population
alone this is approximately 3 in every 1000 people (22 in every 10000 women
and 32 in every 10000) men. This data indicates that in 2015 there were around
137000 people in the UK with PD (57.7% male). Incidence figures concluded
that around 3 in every 10000 women and 4 in every 10000 men will have a new
diagnosis of PD each year with incidence numbers suggesting around 17300
new diagnoses of PD in the UK each year (Parkinson'sUK, 2017).
Thus between the 2009 and 2017 Parkinson’s UK publications the prevalence
of PD in the UK has risen by over 10000. The most likely reason for this
increase and the increase in incidence is that the UK population is increasingly
ageing with increasing life expectancy, and with the median age of onset of PD
being 60 years PD is more common in this older expanding age group.
Improvements in the way PD is diagnosed both with improved clinical
knowledge and the introduction of improved tests, for example DaTSCANTM,
this has likely contributed to higher diagnosis rates and thus increased
prevalence and incidence. With projected increases in the elderly population
and increasing research into knowledge and diagnostic testing, the prevalence
and incidence of PD is set to increase.
2.2.2 Aetiology
Although biblical texts vaguely describe cases that may be consistent with what
we now identify as PD, no clear, succinct case series describing clinical
features was published until the 1817 “An Essay on the Shaking Palsy” by
Hoxton surgeon and apothecary, James Parkinson (Stern, 1989, Parkinson,
2002). Subsequent neurologists advanced our knowledge of the disease, most
notably the eminent Jean-Martin Charcot who advocated the label “maladie de
Parkinson” or Parkinson’s disease in place of “Paralysis Agitans” or the
“Shaking Palsy” (Lees, 2007). Despite advances, the large time scale and
extensive research, the cause of PD remains elusive. As highlighted, age is a
6
major risk factor however the cause of PD is likely a complex interaction
between genetic and environmental factors.
Considered a sporadic disease, the cause of PD in 95% of cases remains
unknown and is so called idiopathic Parkinson’s disease (IPD). Only as recently
as the last two decades have susceptibility factors and causative factors been
identified in familial PD in the remaining 5% (Schapira, 2006, Lesage and Brice,
2009). Increasing research evidence supports conclusions that PD development
is contributed to by abnormal handling of misfolded proteins by the ubiquitin-
proteasome and autophagy-lysosomal systems, increased oxidative stress,
mitochondrial and lysosomal dysfunctions (Lesage and Brice, 2009). After age,
family history remains the second largest risk factor for developing PD with
those with PD being four times more likely to have an affected first degree
relative (Payami et al., 1994).
Genetic studies have identified a number of genetic mutations associated with
autosomal dominant and autosomal recessive familial PD. Mutations inherited
in an autosomal dominant manner include those in the α-Synuclein (SNCA) and
leucine rich repeat kinase 2 (LRRK2) genes (Polymeropoulos et al., 1997,
Zimprich et al., 2004). Those inherited in an autosomal recessive manner
include mutations in Parkin, PTEN-induced putative kinase 1 (PINK1), DJ-1 and
ATP13A2 (Kitada et al., 1998, Valente et al., 2004a, Valente et al., 2004b,
Bonifati et al., 2003, Ramirez et al., 2006). Mutations in LRRK 2 are the most
common, particularly in north African Arabs, Ashkenazi Jews and in the
Portuguese, with Parkin mutations being the second commonest genetic cause
(Healy et al., 2008, Lees et al., 2009). Genetic mutations are more common in
those with young onset parkinsonism however their clinical presentation,
associated features and pathology vary between mutations. Mutations in LRRK
2 resemble sporadic PD but tend to follow a more benign course with reduced
incidence of dementia (Lees et al., 2009). Unfortunately current PD genetics
nomenclature is a constant source of confusion and misinterpretation with an
incomplete list of genes, and inconsistencies with confirmed, non-confirmed and
duplicated loci (Marras et al., 2012, Klein and Westenberger, 2012).
A selection of environmental factors have been implicated in the aetiology of
PD. Dating back over 30 years, prospective and retrospective studies have
demonstrated an inverse correlation between PD and smoking concluding there
is a reduced risk of developing PD in smokers (Checkoway et al., 2002, Marttila
7
and Rinne, 1980, Baumann et al., 1980). A more recent study including 305,468
participants, of whom 1,662 had PD, found compared with never smokers, the
multivariate odds ratios (OR) were 0.78 for past smokers and 0.56 for current
smokers and on close inspection of the data found that smoking duration was
more associated with lower PD risk than smoking intensity (Chen et al., 2010).
Epidemiological, clinical and animal studies also support the antiparkinsonian
potential of caffeine, an adenosine A2A receptor antagonist, with data to
suggest that caffeine may confer protection against dopaminergic neuron
degeneration and delay disease onset and progression (Prediger, 2010).
Istradefylline, a caffeine analog and adenosine A2A receptor antagonist, has
recently received approval for use in limited countries (Dungo and Deeks,
2013). With dopamine’s links to pleasure seeking behaviour, some debate
remains as to whether the reduced caffeine and smoking in the premorbid state
are epiphenomena rather than causally related and reflect premorbid attitude
and low sensation seeking character traits (Evans et al., 2006, Jimenez-
Jimenez et al., 1992).
In 1976 a Maryland scientist made an error whilst trying to manufacture
Desmethylprodine 1,3-Dimethyl-4-phenyl-4-propionoxypiperidine (MPPP), an
illegal synthetic opioid, and instead created 1-methyl-4-phenyl-1,2,3,6-
tetrahydropyridine (MPTP) having injected this he rapidly developed symptoms
of PD within days, a similar effect was noted in a group of heroin users in 1982
who injected MPTP contaminated heroin (Langston, 1996, Langston et al.,
1983). Pathological data showed MPTP was selectively neurotoxic to
dopaminergic neurons in the substantia nigra (Langston et al., 1983). The
discovery of the neurotoxic effect of MPTP created a research rejuvenation in
PD particularly focused on potential environmental neurotoxins. Research
supports, in varying strengths, the associations between pesticide exposure,
rural living, farming, well-water drinking and the development of PD, however
further research is warranted in this area as stronger associations were noted in
those with genetic susceptibility (Priyadarshi et al., 2001, Gorell et al., 1998,
Semchuk et al., 1992, Freire and Koifman, 2012).
2.2.3 Pathophysiology
Movement occurs in response to signals from the corticospinal and
reticulospinal tracts, with the corticospinal being of most importance. The
8
corticospinal tract, whilst having contributions from some pre-motor areas,
originates predominantly from the primary motor cortex. The primary motor
cortex receives input from cortical and subcortical structures. The basal ganglia
is one of the major subcortical systems that receives input from the cortex and
sends processed information via the thalamus back to the cortex and mainly
influences the magnitude of, and which, movements to make (Wolters and
Baumann, 2014).
The basal ganglia is composed of four main nuclei; striatum, pallidum,
subthalamic nucleus and substantia nigra. The striatum is comprised of the
caudate nucleus, putamen and nucleus accumbens. The pallidum is comprised
of the ventral pallidum and internal and external globus pallidus. The substantia
nigra consists of the pars compacta, which contains the dopaminergic neurons,
and the pars reticulata. The basal ganglia receive inputs from almost all parts of
the cerebral cortex with the striatum being the main input structure. Dopamine
fibres stemming from the substantia nigra pars compacta (SNc) and the ventral
tegmental area (VTA), medial to the substantia nigra, modulate information
transfer at striatum level (Wolters and Baumann, 2014). Whilst the majority of
projections terminate in the striatum and pallidum, other projections extend to
the cortex, thalamus and alternative brainstem areas (Archibald and Burn,
2008). Deficiency of dopamine is the characteristic hallmark of PD, from
profound dopaminergic cell loss in the SNc causing degeneration of these
projections (Archibald and Burn, 2008). The effect of this dopamine loss is
malfunction of the extremely complex direct and indirect pathways, excitatory
and inhibitory circuits.
Accompanying this selective loss of dopaminergic neurons, pathological
confirmation of diagnosis focuses on the finding of Lewy bodies (LBs) and Lewy
neurites (LNs) (Dickson et al., 2009). LBs are cytoplasmic inclusions whilst LNs
are abnormal neuritic depositions (Dijkstra et al., 2014). The major component
of LBs and LNs is a protein called α-synuclein (Spillantini et al., 1997). α-
synuclein is normally highly abundant in the brain and other tissues, however
the exact physiological function of this protein is not yet fully understood but is
considered to have a role in neurotransmitter release including dopamine
(Marques and Outeiro, 2012). In LBs and LNs, α-synuclein forms abnormal
aggregations leading to cellular dysfunction. Although research continues into
the actual pathological role of LBs and LNs, the most probable conclusion is
9
that they lead to cell death (Cookson, 2009). Whilst α-synuclein is the main
component of these inclusions, over 70 other components have also been
identified including; synphilin-1-binding proteins and components of the
ubiquitin-proteasome system (Wakabayashi et al., 2007, Beyer et al., 2009). As
discussed the aetiology in 95% of cases of PD is unknown, with identified
genetic mutations, including mutations in the α-synuclein gene, in the remaining
5%. In this remaining 95% evidence suggests a role for inflammation, oxidative
stress, environmental toxins, excitotoxicity and loss of neurotrophic support in
promoting this abnormal protein misfolding within the brains of individuals
affected by PD (Brundin et al., 2008).
The pathological processes occurring in PD begin years, even decades, before
the appearance of the classical motor features and presentation of the affected
individual to medical services. This period is often termed the premotor phase.
Research over the last two decades has confirmed that the pathological lesions
associated with PD are far more widespread and extensive than just involving
the SNc. Heiko Braak and colleagues described a theory of pathological
progression involving six stages marked by the continued development of LBs
and LNs. Stages I and II incorporate pathology in the olfactory regions and
lower brain stem (dorsal motor nucleus of the vagus nerve, intermediate
reticular zone, coeruleus-subcoeruleus complex). In stages III and IV
aggregations progress to basal portions of the midbrain and forebrain (notably
the SNc), and the temporal mesocortex including the transentorhinal region and
also involving the hippocampus. In stages V and VI, we see the final stages and
the greatest topographic disease extent, with the temporal mesocortex as a
beginning point lesions progress to involve the entire neocortex (Braak et al.,
2004). The progression of LB and LN pathology has been correlated with the
appearance and progression of motor and non-motor symptoms of PD (Halliday
and McCann, 2010). Initially termed the presymptomatic phase, when pathology
would be restricted to Braak stages I-III, non-motor symptoms may be apparent,
for example anosmia, and thus this is better termed the premotor phase (Braak
et al., 2004, Halliday and McCann, 2010). Braak stages IV-VI herald the more
recognisable motor symptoms, with later stages showing cognitive disturbances
(Halliday and McCann, 2010, Halliday et al., 2011).
Although there is widespread support for the Braak hypothesis, questions
remain around the lack of correlation between the staging and clinical severity
10
highlighted by many asymptomatic elderly with widespread α-synuclein
deposition (Burke et al., 2008). Importantly not all familial cases of PD have LB
pathology but all have SNc degeneration (Santpere and Ferrer, 2009). The
propagation of cellular pathology in PD continues to receive considerable
research interest. Post mortem studies of individuals with advanced PD who
received fetal nigral mesencephalic cell transplantation demonstrated Lewy
pathology within the grafted neurons and laboratory and animal studies have
confirmed that α-synuclein can transfer from affected to unaffected nerve cells
which supports the hypothesis that α-synuclein is a prion-like protein and PD
thus a prion-like disorder (Olanow and Brundin, 2013). Acknowledged by Braak
and colleagues, Lewy pathology is not restricted to the brain, with involvement
of the enteric nervous system and early positive biopsies of the gastrointestinal
system (Braak et al., 2003, Hawkes et al., 2007, Lebouvier et al., 2010). Lewy
pathology has also been found to affect the autonomic nervous system,
including the cardiovascular autonomic system, with research in this area
importantly continuing to answer currently elusive questions surrounding why
not all individuals with PD suffer autonomic dysfunction and why presence of
pathology does not always translate into symptoms (Ferrer, 2011). As well as
the widely known dopaminergic depletion, PD is also associated with impaired
noradrenergic, cholinergic and serotoninergic innervation (Ferrer, 2011).
Once considered a motor disorder, PD is increasingly recognised as a complex
multi system disease and the complexity and scale of the identified pathology
correlates with the vast array of potential signs and symptoms of the disease.
The identification of potentially quantifiable or accessible markers of PD,
including neurotransmitters and biopsy targets, remains of high importance
particularly in potentially identifying those in the so called premotor or
presymptomatic phase of the disease if neuroprotective therapy is developed.
2.2.4 Clinical features
There is considerable heterogeneity in the clinical phenotype of PD and the
multisystem disease pathology leads to a wide range of possible signs and
symptoms (Foltynie et al., 2002). PD is characterised by a multifaceted picture
of motor and non-motor symptoms that is not only different between patients but
along the course of disease in individual patients (Moustafa and Poletti, 2013).
11
The four cardinal clinical features and motor symptoms of PD are; bradykinesia,
tremor at rest, rigidity and postural instability, with bradykinesia being the key
clinical feature in order to make a diagnosis. Bradykinesia strictly means
slowness of a performed movement however the term is often used
interchangeably with akinesia or hypokinesia (Berardelli et al., 2001). Akinesia
refers to paucity of a spontaneous movement or associated movement, for
example facial movement or arm swing with gait respectively; and hypokinesia
means movements are small in addition to being slow (Berardelli et al., 2001).
The classical tremor associated with PD is a tremor of 4-6 Hz at rest that begins
unilaterally. Hand tremors are often described as “pill rolling” and tremor can be
evident in the legs, lips, chin and jaw with postural re-emergent tremor also a
feature. (Jankovic, 2008). The classical tremor characteristically disappears or
improves with action or on sleeping (Jankovic, 2008). Rigidity in PD refers to
increased resistance when passively stretching a muscle (Berardelli et al.,
1983). This rigidity is frequently described as “lead pipe rigidity” describing
rigidity present throughout the full range of movement. A cogwheel sensation
represents tremor superimposed on rigidity. Rigidity may be felt in the limbs or
more proximally, termed axial rigidity, in the neck and trunk. Postural instability
is a particularly disabling feature with many contributory factors, in addition to
loss of postural reflexes, contributing to balance impairment and falls (Bloem,
1992).
Freezing, considered an akinesia, is a debilitating motor symptom that
predominantly affects gait but can affect other actions including speech.
Although more common in the “off” state, it can also occur in the “on” state and
affected individuals describe a sudden feeling that their feet are glued to the
floor and they are unable to move them. Freezing is a transient phenomenon
during which individuals may have to implement sensory tricks or cues to
continue the intended movement (Nieuwboer, 2008). Widely acknowledged and
frequently termed secondary motor symptoms seen in PD include; hypomimia,
bulbar dysfunction (manifested as dysarthria, dysphagia, sialorrhea and
hypophonia), gait disturbances (shuffling, festination), reduced arm swing,
difficulty standing from a sitting position, difficulty turning in bed, micrographia,
slow activities of daily living, glabellar reflex, dystonia, neuro-ophthalmological
problems (reduced blink rate, eyelid opening apraxia and blepharospasm which
is considered focal dystonia), striatal deformity, scoliosis and camptocormia
12
(Jankovic, 2008). Camptocormia, caused by axial dystonia in PD, is an
abnormal flexion of the trunk that appears in the standing position, worsens on
walking and abates when supine (Lenoir et al., 2010). Originally thought to be a
rare symptom, a recent single centre study of 275 patients reported prevalence
rates of Camptocormia of 6.9% (Tiple et al., 2009).
The importance of the identification of non-motor symptoms in PD is becoming
increasingly recognised. Non-motor symptoms are sometimes present pre-
diagnosis, almost always occur with advancing disease and significantly
contribute to impaired quality of life, morbidity and mortality (Chaudhuri et al.,
2006, Chaudhuri and Schapira, 2009). Non-motor symptoms are under
recognised and under reported resulting in under treatment, with up to 62% of
non-motor symptoms remaining undeclared due to embarrassment or lack of
knowledge of their association with PD (Chaudhuri et al., 2010). Potential
individual non-motor symptoms are so numerous that they are best considered
in groups; neuropsychiatric, sleep disorders, autonomic symptoms,
gastrointestinal symptoms and sensory symptoms.
Neuropsychiatric symptoms are wide ranging from depression, apathy, anxiety,
anhedonia, fatigue, repetitive behaviour, delirium, hallucinations, delusions and
dementia (Chaudhuri et al., 2006). Depression is more prevalent in PD than in
the general population and also a diagnosis is more common in PD patients
before the onset or diagnosis of their PD (Ishihara and Brayne, 2006). The
prevalence of dementia in PD is high and is associated with a more rapid
decline (Aarsland et al., 2003, Aarsland et al., 2004). Some of the myriad of
potential neuropsychiatric symptoms, including delirium, obsessional
behaviours and impulse control disorders may also be a consequence of drug
treatment for other PD symptoms.
Rapid eye movement (REM) sleep behaviour disorder (RBD) is seen in
association with PD and remains an important potential preclinical marker for
researchers with 40% of individuals with a diagnosis of idiopathic RBD
developing an alpha-synuclein pathology after an average of five years follow
up (Britton and Chaudhuri, 2009). Nocturnal sleep disturbances also include
insomnia, nightmares, restless legs, vivid dreaming and sleep disordered
breathing and day time symptoms of excessive sleepiness are common
(Chaudhuri et al., 2006, Kumar et al., 2002, Chotinaiwattarakul et al., 2011).
13
Urinary symptoms associated with autonomic disturbance, are the most
commonly reported non-motor symptom in PD (Martinez-Martin et al., 2007).
Urinary symptoms include urgency, nocturia and frequency, with additional
autonomic symptoms of sweating, orthostatic hypotension, sexual dysfunction
and dry eyes (Chaudhuri et al., 2006). Symptoms of orthostatic hypotension
also increase risk of falls and subsequent injury and loss of confidence.
Gastrointestinal non-motor symptoms; nausea, constipation, reflux,
incontinence, share commonality with autonomic symptoms as part of the
disease complex (Chaudhuri et al., 2006).
Sensory symptoms, particularly pain, are frequently not recognised as part of
the PD complex and can be difficult to quantify and categorise. Pain, of varying
characteristics, is a frequent sensory symptom observed in PD (Beiske et al.,
2009). Musculoskeletal, dystonic, neuropathic and central pains have all been
reported with musculoskeletal pain present in up to 70% (Beiske et al., 2009).
Like RBD, olfactory dysfunction with hyposmia is a common finding in PD and a
diagnosis of idiopathic olfactory dysfunction is associated with an increased risk
of developing PD and thus may also prove to be an important pre-clinical
marker when researching neuroprotective agents (Ponsen et al., 2004).
By the time motor symptoms are recognised the pathological process in PD is
advanced. The duration of this pre-motor phase, during which
neurodegeneration is occurring, remains contentious with estimations ranging
from 3.1 to 20 years (Hoehn and Yahr, 1967, Fearnley and Lees, 1991,
Vingerhoets et al., 1994, Morrish et al., 1996). It is accepted that motor
symptoms occur when dopaminergic cell loss in the SNc reaches a critical level
and this is most frequently quoted to be 50-60% loss. Non-motor symptoms
predominate in this pre-motor phase and identification of these could provide
the key for neuroprotection. In addition to RBD and hyposmia, there is strong
evidence for constipation and depression as pre-motor characteristics and
increasing evidence that urinary and sexual dysfunction and chronotropic
insufficiency may also serve as potential pre-motor PD biomarkers (Chaudhuri
et al., 2006, Palma et al., 2013, Palma and Kaufmann, 2014). Weaker evidence
exists for the suggested links of restless-legs syndrome, apathy, fatigue and
anxiety to the pre-motor phase (Chaudhuri et al., 2006).
The symptom burden experienced by individuals with PD is easily apparent and
with the absence of curative treatment, reduction of symptom load remains the
14
aim. The most common tool for assessing symptom load in PD is the Unified
Parkinson’s Disease Rating Scale (UPDRS) however this is more focussed on
motor rather than non-motor symptoms. Prior to 2006 there was no single
instrument for comprehensive assessment of non-motor symptoms thus the
Non Motor Symptoms Screening Questionnaire (NMSQuest) was developed
and validated (Martinez-Martin et al., 2007). An observational, multicentre,
international cross-sectional study of 545 PD patients used the NMSQuest to
quantify the prevalence of non-motor symptoms and reported urinary symptoms
to be the most prevalent, in particular nocturia reported in 61.9% (Martinez-
Martin et al., 2007). The NMSQuest has 9 domains with a number of questions
in each domain. In the afore mentioned study the percentage of individuals
scoring the maximum for each domain was reported as; urinary 59%,
depression/anxiety 48%, apathy/attention/memory 42%, sleep disorder 37%,
sexual function 33%, cardiovascular 32%, digestive 29%, miscellaneous 25%,
hallucinations/delusions 17% and importantly only 1.6% (8 individuals) reported
no non-motor symptoms at all (Martinez-Martin et al., 2007).
While no unequivocally neuroprotective or neurorestorative treatments for PD
exist, the management remains that of symptom control. Symptom control is
one of the central goals of palliative medicine and assessment tools from this
specialty can provide important information to help manage PD patients.
Despite the introduction of the NMSQuest and the use of the UPDRS, not all
potential PD associated symptoms are identified with these tools. A descriptive
cross-sectional survey using a standard palliative care assessment tool
highlighted the frequency of other symptoms in a representative population with
IPD (n=123) including shortness of breath on exertion (35.8%), cough (17.9%)
and sputum (13%) (Lee et al., 2007). The use of this alternative tool reported
concerning percentages reporting respiratory symptoms, a domain not covered
in alternative assessments.
Categorising patients can be very useful particularly when considering
treatment and prognosis. With the myriad of potential symptoms in IPD,
categorising individuals on clinical (motor) phenotype, based on signs and
symptoms, into tremor dominant (TD) or postural instability gait difficulty (PIGD)
subtypes is a recognised technique. Formulas have been developed to
categorise TD and PIGD phenotypes from the UPDRS making this widely used
(Stebbins et al., 2013). Large studies provide support for these clinical
15
phenotypes that have in addition been reported to have differences on
molecular imaging and basal ganglia output (Jankovic et al., 1990, Zaidel et al.,
2009, Schillaci et al., 2011).
Whilst formulas have been developed, research continues to identify clinical
features associated with different phenotypes that may have prognostic and
treatment implications. Prior to interpretation of extrapolated data from the
Tracking Parkinson’s study, no large scale studies (n > 400) had specifically
focused on the association of vascular risk factors and vascular disease with
motor features and cognition in early PD. Cardiovascular disease describes a
group of diseases of the heart and blood vessels for example; angina,
myocardial infarction, stroke, transient ischaemic attack and peripheral arterial
disease. Vascular risk factors are characteristics or exposures that increase the
likelihood of developing vascular disease or diseases. Vascular risk factors are
numerous and include for example; smoking, hypertension,
hypercholesterolaemia, obesity and diabetes. Common cerebrovascular
pathologies, including macroscopic infarcts, microinfarcts, and
arteriolosclerosis, often seen in older persons, can cause mild parkinsonian
signs, particularly parkinsonian gait (Buchman et al., 2011). This is often termed
vascular parkinsonism. Malek et al reported,from 1759 PD cases, patients with
cerebrovascular disease, in the manner of previous stroke or transient
ischaemic attack, were more likely to have PIGD phenotype and cognitive
impairment, this however failed to reach statistical significance after age, sex
and disease duration adjustments. They also reported more than 2 vascular risk
factors were associated with worse UPDRS 3 motor scores and cognitive
impairment. In those who had had structural brain imaging, the presence of
white matter change was associated with PIGD and cognitive impairment. The
latter two associations reached statistical significance (Malek et al., 2016).
Differentiating between the TD and PIGD phenotypes, and identifying risk
factors for these phenotypes, is important both clinically and in research
settings as they have been correlated to different associated features,
progression and prognosis.
16
2.2.5 Diagnosis
Parkinson’s disease is a clinical diagnosis which can only be pathologically
confirmed by the findings of LB pathology on post mortem. Advances in
structural and functional neuroimaging have provided support in the diagnosis
of PD and differential diagnosis of other parkinsonian disorders. To make a
diagnosis of PD requires the essential finding of bradykinesia with at least one
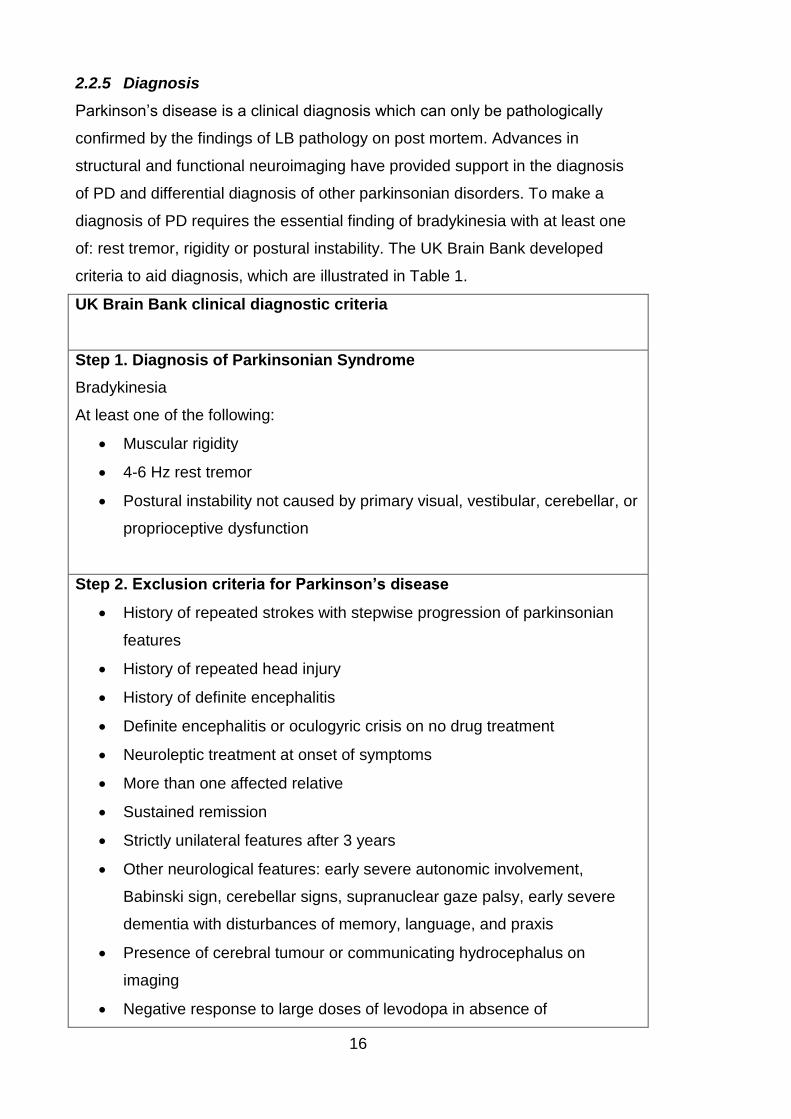
of: rest tremor, rigidity or postural instability. The UK Brain Bank developed
criteria to aid diagnosis, which are illustrated in Table 1.
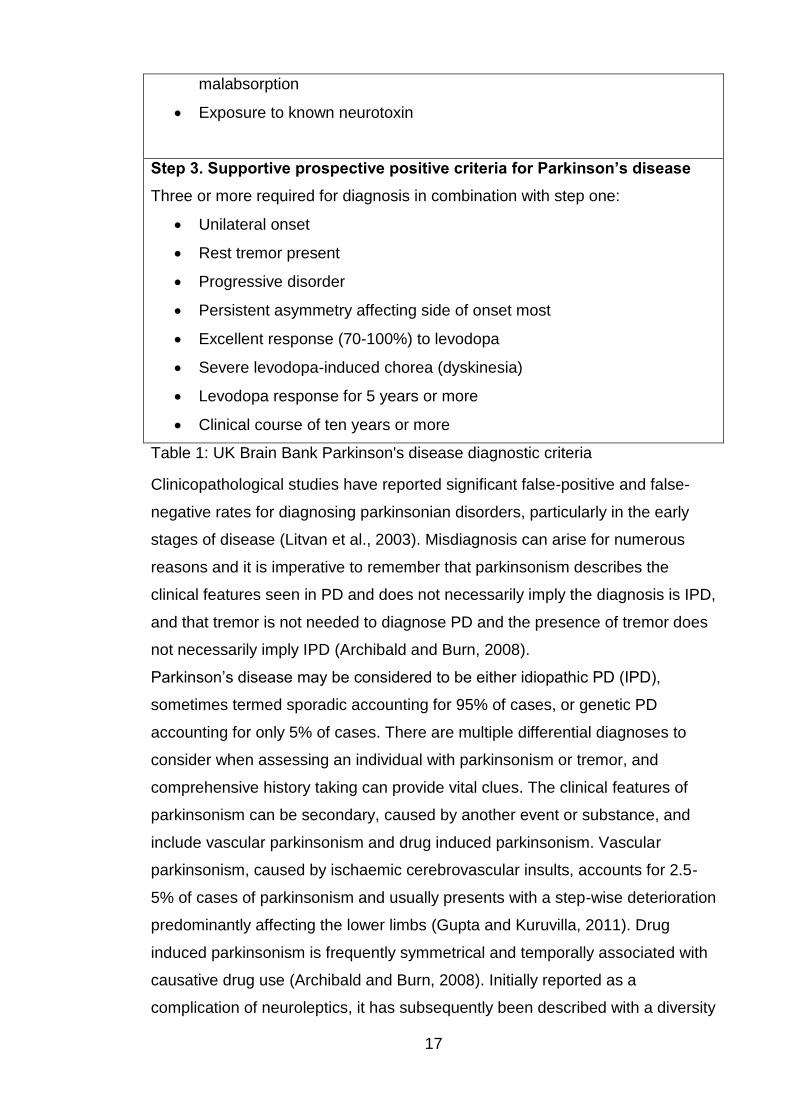
UK Brain Bank clinical diagnostic criteria
Step 1. Diagnosis of Parkinsonian Syndrome
Bradykinesia
At least one of the following:
Muscular rigidity
4-6 Hz rest tremor
Postural instability not caused by primary visual, vestibular, cerebellar, or
proprioceptive dysfunction
Step 2. Exclusion criteria for Parkinson’s disease
History of repeated strokes with stepwise progression of parkinsonian
features
History of repeated head injury
History of definite encephalitis
Definite encephalitis or oculogyric crisis on no drug treatment
Neuroleptic treatment at onset of symptoms
More than one affected relative
Sustained remission
Strictly unilateral features after 3 years
Other neurological features: early severe autonomic involvement,
Babinski sign, cerebellar signs, supranuclear gaze palsy, early severe
dementia with disturbances of memory, language, and praxis
Presence of cerebral tumour or communicating hydrocephalus on
imaging
Negative response to large doses of levodopa in absence of
17
malabsorption
Exposure to known neurotoxin
Step 3. Supportive prospective positive criteria for Parkinson’s disease
Three or more required for diagnosis in combination with step one:
Unilateral onset
Rest tremor present
Progressive disorder
Persistent asymmetry affecting side of onset most
Excellent response (70-100%) to levodopa
Severe levodopa-induced chorea (dyskinesia)
Levodopa response for 5 years or more
Clinical course of ten years or more
Table 1: UK Brain Bank Parkinson's disease diagnostic criteria
Clinicopathological studies have reported significant false-positive and false-
negative rates for diagnosing parkinsonian disorders, particularly in the early
stages of disease (Litvan et al., 2003). Misdiagnosis can arise for numerous
reasons and it is imperative to remember that parkinsonism describes the
clinical features seen in PD and does not necessarily imply the diagnosis is IPD,
and that tremor is not needed to diagnose PD and the presence of tremor does
not necessarily imply IPD (Archibald and Burn, 2008).
Parkinson’s disease may be considered to be either idiopathic PD (IPD),
sometimes termed sporadic accounting for 95% of cases, or genetic PD
accounting for only 5% of cases. There are multiple differential diagnoses to
consider when assessing an individual with parkinsonism or tremor, and
comprehensive history taking can provide vital clues. The clinical features of
parkinsonism can be secondary, caused by another event or substance, and
include vascular parkinsonism and drug induced parkinsonism. Vascular
parkinsonism, caused by ischaemic cerebrovascular insults, accounts for 2.5-
5% of cases of parkinsonism and usually presents with a step-wise deterioration
predominantly affecting the lower limbs (Gupta and Kuruvilla, 2011). Drug
induced parkinsonism is frequently symmetrical and temporally associated with
causative drug use (Archibald and Burn, 2008). Initially reported as a
complication of neuroleptics, it has subsequently been described with a diversity
18
of drugs including antiemetics, anti- vertigo drugs, antidepressants, calcium
channel antagonists, antiarrhythmics, antiepileptics and others. Whilst
traditionally considered reversible after drug withdrawal it persists in excess of
10% of people which may indicate drug-unmasked PD (Mena and de Yebenes,
2006).
Parkinson-plus syndromes, also known as atypical parkinsonian disorders or
disorders of multiple system degeneration, display the classical features of a
parkinsonian disorder but with extra features that differentiate them from IPD.
The Parkinson-plus syndromes include; multiple system atrophy (MSA),
progressive supranuclear palsy (PSP), corticobasal degeneration (CBD) and
dementia with Lewy bodies (DLB). Accompanying the parkinsonism and
amongst other symptoms, MSA is associated with cerebellar features and early
autonomic features, PSP with early backward falls and supranuclear
opthalmoplegia, CBD with apraxia, alien limb phenomena and aphasia, and
DLB with hallucinations and early cognitive decline (Poewe and Wenning,
2002). Further differential diagnoses that need to be considered include
functional or non-organic disorders, normal pressure hydrocephalus and
Wilson’s disease (Archibald and Burn, 2008). In the presence of tremor,
essential tremor, cerebellar disorders, physiological causes of tremor (e.g.
thyrotoxicosis) and dystonic tremor need to be excluded (Bhidayasiri, 2005).
Advances in functional imaging techniques over recent years have assisted in
improving diagnostic accuracy and thus guiding appropriate management.
Conventional structural imaging techniques, for example magnetic resonance
imaging (MRI), are useful in the investigation of suspected vascular
parkinsonism or for the exclusion of space occupying lesions. By labelling the
dopamine transporters in the basal ganglia with radioisotopes, Ioflupane (123I)
(DaTSCANTM), single-photon emission computed tomography (SPECT) images
can be obtained to assess the integrity of the dopaminergic system. Normal
images suggest a diagnosis not involving nigrostriatal neurodegeneration, for
example essential tremor, vascular parkinsonism or drug induced parkinsonism
(Cummings et al., 2011). Abnormal imaging indicates underlying nigrostriatal
neurodegeneration thus supports a diagnosis of PD or a Parkinson-plus
syndrome but cannot differentiate between these (Cummings et al., 2011).
Further imaging techniques, not necessarily brain imaging, can be useful in
attempting to distinguish between PD and a Parkinson-plus syndrome. These
19
include autonomic testing and myocardial MIBG scintigraphy which measures
the postganglionic sympathetic cardiac innervation, which can be a helpful test
to differentiate PD from MSA. Despite imaging test advances, these remain
imperfect and whilst very useful the diagnosis remains clinical.
2.2.6 Treatment
The management of Parkinson’s disease requires a comprehensive multi-
disciplinary approach. Over the course of the disease involvement can include;
specialist Parkinson’s clinic (usually consultant neurologist or consultant
geriatrician), specialist nurses, physiotherapy, speech and language therapy,
occupational therapy, dieticians and palliative care. Support groups are
available to provide input for both individuals with PD and their carers, families
and friends. Management focuses on treatment of motor symptoms and non-
motor symptoms, complications of PD and also side effects of pharmacological
therapy. It is very important to address and manage non-motor symptoms
individually as although the pharmacological therapies used to treat motor
symptoms can improve a selection of non-motor symptoms they can also
conversely cause or exacerbate others.
No pharmacological therapy has been proven to be unequivocally
neuroprotective and thus treatment remains guided by symptoms. In view of this
not all patients require treatment initiation at diagnosis. NICE refer to ‘early
disease’ as those individuals who have developed functional disability and
require symptomatic therapy, and ‘later disease’ as those on levodopa who
have developed motor complications (NICE, 2006). Whilst dopaminergic
replacement therapy remains the basis of pharmacological management,
guidelines to date have been unable to recommend one specific universal first
line treatment in early disease or adjuvant for later disease further highlighting
the need for individuals with PD to be managed by experienced teams.
Pharmacological treatment options are summarised in Table 2, adapted from
NICE guidance and Archibald and Burn (NICE, 2006, Archibald and Burn,
2008).

20
Dru
g c
lass
Su
itab
le
for
ea
rly
trea
tmen
t
Ex
am
ple
s
Mo
de o
f a
cti
on
B
en
efi
ts
Dis
ad
va
nta
ges
P
ote
nti
al
sid
e-
eff
ec
ts
Le
vo
do
pa
Y
es
Co
-ca
reld
opa
(S
ine
me
t)
Co
-be
ne
ldo
pa
(M
ad
op
ar)
Upta
ke
by
do
pa
min
erg
ic
ne
uro
ns t
ha
t re
ma
in
Con
ve
rsio
n t
o
do
pa
min
e a
nd
re
lea
se
d.
Well
tole
rate
d
Go
od d
egre
e o
f sym
pto
m c
ontr
ol
Titra
tion
ea
sy
Diffe
ren
t p
rep
ara
tio
ns
ava
ilab
le (
sta
nd
ard
, m
od
ifie
d-r
ele
ase
, d
ispe
rsib
le)
Half-life
60
min
ute
s
Mo
tor
com
plic
ation
s
En
d-d
ose
eff
ect
Incre
ase r
isk
dyskin
esia
s
Mo
difie
d-r
ele
ase
p
rep
ara
tio
ns s
ho
uld
n
ot b
e u
se
d t
o
de
lay o
nse
t of
mo
tor
com
plic
ation
s
Nau
se
a
Vo
mitin
g
Po
stu
ral
hyp
ote
nsio
n
Confu
sio
n
So
mn
ole
nce
V
ivid
dre
am
s
Hallu
cin
atio
ns
Dop
am
ine
a
go
nis
ts (
ora
l o
r tr
an
sde
rma
l)
Ye
s
Rop
inirole
(ora
l)
Pra
mip
exo
le (
ora
l)
Rotigo
tin
e
(tra
nsd
erm
al)
Direct
stim
ula
tio
n
of
do
pam
ine
re
ce
pto
rs
Mo
de
rate
de
gre
e o
f sym
pto
m c
ontr
ol
Half-life
va
rie
s
So
me
ava
ilab
le in
sta
nda
rd a
nd
m
od
ifie
d-r
ele
ase
Few
er
late
moto
r co
mp
licatio
ns
Eld
erly t
ole
rate
le
ss
we
ll S
ide
eff
ects
more
p
ote
nt
As f
or
levo
dop
a
Impu
lse c
on
trol
dis
ord
ers
(IC
D)
Skin
irr
ita
tio
n fo
r tr
an
sd
erm
al
Dop
am
ine
a
go
nis
ts
(sub
cu
tan
eo
us)
No
A
pom
orp
hin
e
Direct
stim
ula
tio
n
of
do
pam
ine
re
ce
pto
rs (
D1 a
nd
D
2)
Rap
id o
nse
t U
sefu
l in
se
ve
re
mo
tor
com
plic
ation
s
Non
ora
l ro
ute
Non
ora
l S
ho
rt h
alf-life
th
us
co
ntinu
ou
s infu
sio
n
Exp
en
siv
e
As f
or
levo
dop
a
Infu
sio
n s
ite
rea
ctio
ns
Mo
no
am
ine
oxid
ase
in
hib
ito
rs
Typ
e B
Ye
s
Rasa
gili
ne
S
ele
gili
ne
In
hib
it M
AO
-B a
nd
in
cre
ase
s a
va
ilab
le
do
pa
min
e in
syn
ap
tic c
left
Well
tole
rate
d
On
ce
da
ily
Lim
ited
sym
pto
m
co
ntr
ol com
pa
red t
o
oth
er
age
nts
Hea
da
ch
e
Urina
ry
sym
pto
ms
Dep
ressio
n
Dry
mo
uth

21
Po
stu
ral
hyp
ote
nsio
n
CO
MT
in
hib
ito
rs
No
E
nta
ca
pon
e
To
lcap
on
e
Inh
ibit c
ate
ch
ol-
O-
me
thyl tr
an
sfe
rase
Incre
ase h
alf-life
of
levo
do
pa
Red
uce m
oto
r fluctu
atio
ns
To
lcap
on
e c
an
ca
use
he
pa
tic
da
ma
ge
thu
s
mo
nito
rin
g o
f liv
er
fun
ction
te
sts
re
qu
ire
d
As f
or
levo
dop
a
Dia
rrh
oe
a c
an
be
p
rom
ine
nt a
nd
ca
use
in
tole
ran
ce
U
rine
dis
colo
ure
d
ora
nge
Dyskin
esia
Am
an
tad
ine
N
o
Am
an
tad
ine
G
luta
ma
te
rece
pto
r a
nta
go
nis
t In
cre
ase
s
do
pa
min
e r
ele
ase
a
nd
blo
cks
reu
pta
ke
Help
red
uce
d
yskin
esia
L
imited
evid
en
ce
S
pe
cia
list
ad
min
istr
ation
Confu
sio
n
Hallu
cin
atio
ns
Agita
tio
n
Insom
nia
A
nkle
oe
de
ma
L
ive
do
reticula
ris
Tab
le 2
: P
ha
rma
co
logic
al th
era
py o
ption
s
22
In advanced disease if severe motor fluctuations, arising from pulsatile
dopaminergic stimulation, become unmanageable despite optimising oral or
subcutaneous therapy, consideration can be given to the use of deep brain
stimulation or continuous infusion of levodopa/carbidopa intestinal gel
(Duodopa) via a percutaneous tube.
As illustrated in Table 2, potential side effects of dopaminergic therapy are
numerous and a number are specific to anti-parkinsonian medication for
example impulse control disorders. Clinicians need to remain aware of the rare
iatrogenic disturbance of dopamine dysregulation syndrome, where individuals
develop an addiction to dopaminergic therapy and self-administer doses in
excess of those required to control motor symptoms (O'Sullivan et al., 2009).
Ergot derivative dopamine agonist drugs which are no longer prescribed,
including pergolide and cabergoline, are associated with valvular heart disease
and lung fibrosis in addition to the other possible side effects from the drug
class. Only in recent years has their prescription discontinued thus it must be
remembered that many individuals with PD may have already been treated with
these drugs for protracted periods.
Dopaminergic therapy must not be abruptly withdrawn as abrupt discontinuation
and occasionally reduction of dose can precipitate neuroleptic malignant
syndrome (Healy et al., 2008). With this is mind it is important to not allow
medication to fail or a failure in administration of dopaminergic therapy.
Alternative methods of administration of medication need to be considered and
planned, for example in those who cannot swallow or are undergoing
operations. Transdermal applications and nasogastric tubes are possible
options. The complexity of PD, disease progression and antiparkinsonian
medication titration, combination and potential side-effects make PD best
managed by specialist services.
2.2.7 Prognosis
By definition PD is a neurodegenerative disease and while no neuroprotective
agents exist, the disease process will continue to progress. Prognosis
significantly varies between individuals with PD, however the commonly
described clinical phenotypes of TD and PIGD are associated with differing
decline rates notably in motor, non-motor and cognitive symptoms. Tremor
progresses more slowly than other motor features (Vu et al., 2012).
23
The PIGD phenotype usually presents a more severe pattern of non-motor
features, faster motor deterioration, a higher risk of developing mild cognitive
impairment, faster rate of cognitive decline and is a risk factor for developing
dementia (Moustafa and Poletti, 2013, Vu et al., 2012, Poletti et al., 2012, Burn
et al., 2006). Depression, apathy and hallucinations are more prominent in the
PIGD phenotype (Reijnders et al., 2009). PIGD appears to be less treatment
responsive in those patients in the early stages of disease (Vu et al., 2012).In
contrast, the TD phenotype is characterised by a less severe picture, slower
motor decline, slower cognitive decline, lower dementia incidence and lower
rates of depression, apathy and hallucinations (Moustafa and Poletti, 2013).
Older age at onset, PIGD, dementia and depression are associated with
progression of disability and a negative impact on survival (Auyeung et al.,
2012, Post et al., 2007).
Individuals with PD are hospitalised in reported frequencies of up to 28% per
annum, approximately 1.5 times more frequently, and generally up to 14 days
longer, than non PD patients (Gerlach et al., 2011). Whilst in hospital,
medication errors are frequent adverse events and after surgery PD patients
have increased incidence of infection, confusion and falls (Gerlach et al., 2011).
Not only does the increased hospitalisation have a negative clinical impact on
the individual but also a socioeconomic one. A local study of emergency
hospital admissions in IPD patients over a 4 year period, identified 246
emergency admissions accounted for by 129 patients (Woodford and Walker,
2005). The most common reasons for admission in this population were falls
(13%) and pneumonia (11%) (Woodford and Walker, 2005). International
retrospective studies corroborated the high frequency of these reasons to
precipitate admission in PD with pneumonia or chest infection reported as the
reason for admission in up to 22% and aspiration pneumonia rates more than 6
times higher than in controls (Vossius et al., 2010, Guneysel et al., 2008,
Temlett and Thompson, 2006, Guttman et al., 2004, Tan et al., 1998). Other
infections (including urinary tract), delirium, psychological symptoms, motor
complications and PD related symptoms were also responsible for precipitating
admissions.
A longitudinal, multicentre study in Australia followed PD patients, who were
initially levodopa naïve at recruitment and had a mean pre-study disease
duration of 23.5 months, over a 15 year period (Hely et al., 2005). One-third of
24
the patients had survived 15 years with non-dopaminergic problems dominating
the clinical picture at that time; falls occurs in 81%, cognitive decline in 84%,
dementia in 48% and choking, hallucinations and depression each in 50% (Hely
et al., 2005). Hely et al, reported a significantly elevated standardised mortality
ratio (SMR) at 1.86 with pneumonia being the most common cause of death in
27% with a SMR >10 (Hely et al., 2005). A local study (n=143) looked at cause
of death in IPD over an 8 year period finding pneumonia as the terminal event in
45% and for those that died in hospital pneumonia was the reason for
admission in 30% (Pennington et al., 2010). Previous studies corroborated high
death rates from pneumonia in PD reporting rates from 20% to 27% in PD
compared to 7% to 9% in control populations (Pennington et al., 2010, D'Amelio
et al., 2006, Fall et al., 2003, Beyer et al., 2001). With individuals with PD
demonstrating higher death rates from pneumonia, and conversely lower death
rates from ischaemic heart disease, as well as higher rates of admission for
chest infection and pneumonia than the general population, further research
into cardiopulmonary function in IPD is indicated.
2.3 Pulmonary function
The respiratory or pulmonary system is comprised of the airways, lungs,
muscles of respiration and the associated vasculature. The airways include the
nose, nasal cavities, mouth, pharynx, larynx, trachea and bronchi. Within the
lungs the bronchi branch into secondary then tertiary bronchi that divide into
bronchioles. The bronchioles branch repeatedly into terminal bronchioles that
subdivide into microscopic respiratory bronchioles and further subdivide into
alveolar ducts. Surrounding these ducts are alveoli and alveolar sacs. These
alveoli, the building blocks of the lungs’ sponge like structure, are surrounded
by a mesh of capillaries and are the site of gas exchange with the blood. The
muscles involved in respiration include the diaphragm, intercostal muscles and
the accessory muscles in the neck and surrounding the upper airway.
Dysfunction of the respiratory system leads to increased morbidity and mortality
and deterioration in quality of life. Signs and symptoms of respiratory
dysfunction vary dependent on the part or parts of the pulmonary system
involved. Potential signs and symptoms are numerous and may include; cough,
difficulty coughing, dyspnoea, pneumonia, aspiration, reduced exercise
tolerance, speech difficulties, hypophonia, atelectasis, hypoxia, hypercapnia,
25
sleep disordered breathing, excessive daytime somnolence, acute respiratory
failure and difficulty in extubation. Iatrogenic causes of pulmonary dysfunction
by medication may also be temporary or permanent.
Concomitantly with history and examination, measurement of respiratory
function can be used to establish if any abnormality is present and identify
particular disorders. Respiratory testing can be used to assess severity,
prognosticate and serial measurements are useful to assess response to
treatment or progression of disease.
2.3.1 Quantification of pulmonary function
Pulmonary function tests (PFTs) are a collection of non-invasive tests that
measure airflow, lung volumes, gas exchange and respiratory muscle strength.
Interpretation of tests should always begin with a review of test quality
(Pellegrino et al., 2005). Quality control is important and technicians must have
sufficient education and training to understand the fundamentals of the tests,
signs of pulmonary disease and management of the acquired data (Miller et al.,
2005a). Interpretation of PFTs is based on comparisons of measured data with
reference values based on healthy subjects. Reference or predicted values
should be obtained from studies of healthy subjects with the same
anthropometric and ethnic characteristics as the subjects being tested
(Pellegrino et al., 2005). When performing PFTs, dynamic studies (spirometry,
flow volume loops, peak expiratory flow rates) are performed first followed by
lung volumes and subsequently diffusion capacity (Ranu et al., 2011).
Bronchodilator response and respiratory muscle strength testing may also be
done in appropriate subjects.
2.3.2 Spirometry
Spirometry measures lung function by quantifying the volume and flow of air,
measuring volume against time. Measurements most importantly include forced
expiratory volume in one second (FEV1), forced vital capacity (FVC) and the
subsequent ratio of these values. FEV1 is the maximal volume of air exhaled in
the first second of a forced expiration from a situation of maximal inspiration and
is measured in litres. FVC is the maximal volume of air exhaled with maximally
forced effort from a maximal inspiration, also measured in litres. FVC can also
be thought of as vital capacity (VC) performed with a maximally forced
expiratory effort (Miller et al., 2005b). VC is the volume change at the mouth
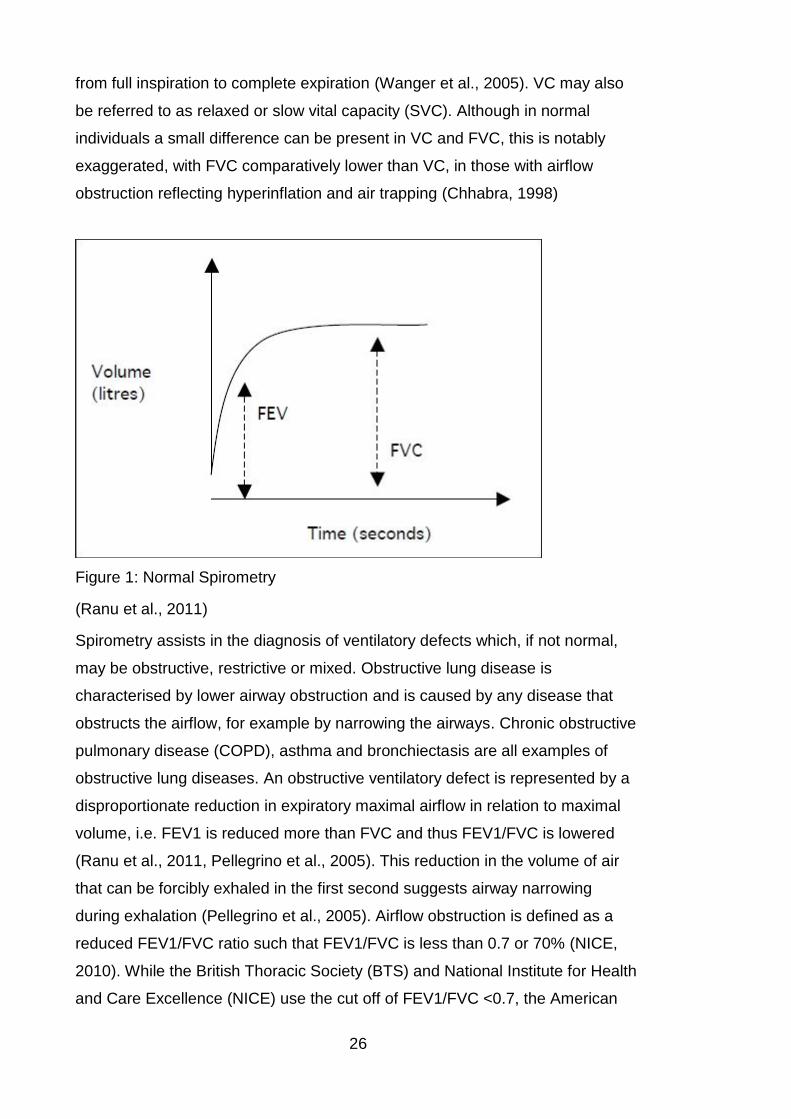
26
from full inspiration to complete expiration (Wanger et al., 2005). VC may also
be referred to as relaxed or slow vital capacity (SVC). Although in normal
individuals a small difference can be present in VC and FVC, this is notably
exaggerated, with FVC comparatively lower than VC, in those with airflow
obstruction reflecting hyperinflation and air trapping (Chhabra, 1998)
Figure 1: Normal Spirometry
(Ranu et al., 2011)
Spirometry assists in the diagnosis of ventilatory defects which, if not normal,
may be obstructive, restrictive or mixed. Obstructive lung disease is
characterised by lower airway obstruction and is caused by any disease that
obstructs the airflow, for example by narrowing the airways. Chronic obstructive
pulmonary disease (COPD), asthma and bronchiectasis are all examples of
obstructive lung diseases. An obstructive ventilatory defect is represented by a
disproportionate reduction in expiratory maximal airflow in relation to maximal
volume, i.e. FEV1 is reduced more than FVC and thus FEV1/FVC is lowered
(Ranu et al., 2011, Pellegrino et al., 2005). This reduction in the volume of air
that can be forcibly exhaled in the first second suggests airway narrowing
during exhalation (Pellegrino et al., 2005). Airflow obstruction is defined as a
reduced FEV1/FVC ratio such that FEV1/FVC is less than 0.7 or 70% (NICE,
2010). While the British Thoracic Society (BTS) and National Institute for Health
and Care Excellence (NICE) use the cut off of FEV1/FVC <0.7, the American
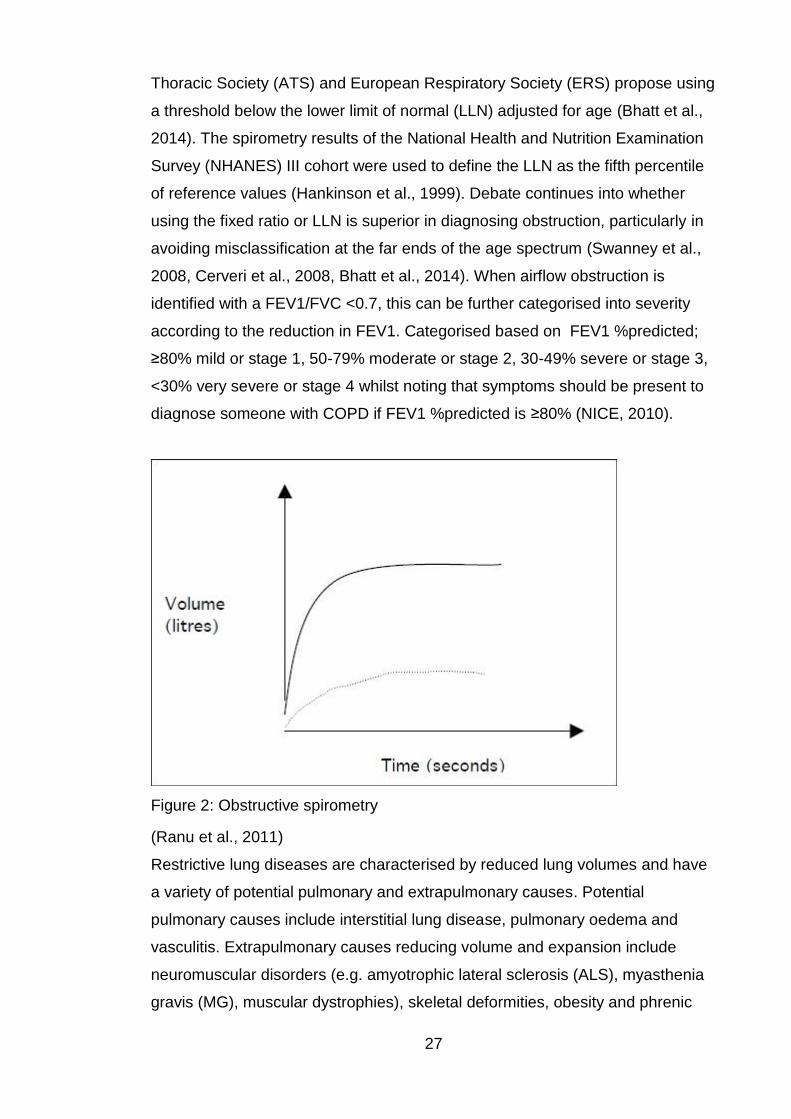
27
Thoracic Society (ATS) and European Respiratory Society (ERS) propose using
a threshold below the lower limit of normal (LLN) adjusted for age (Bhatt et al.,
2014). The spirometry results of the National Health and Nutrition Examination
Survey (NHANES) III cohort were used to define the LLN as the fifth percentile
of reference values (Hankinson et al., 1999). Debate continues into whether
using the fixed ratio or LLN is superior in diagnosing obstruction, particularly in
avoiding misclassification at the far ends of the age spectrum (Swanney et al.,
2008, Cerveri et al., 2008, Bhatt et al., 2014). When airflow obstruction is
identified with a FEV1/FVC <0.7, this can be further categorised into severity
according to the reduction in FEV1. Categorised based on FEV1 %predicted;
≥80% mild or stage 1, 50-79% moderate or stage 2, 30-49% severe or stage 3,
<30% very severe or stage 4 whilst noting that symptoms should be present to
diagnose someone with COPD if FEV1 %predicted is ≥80% (NICE, 2010).
Figure 2: Obstructive spirometry
(Ranu et al., 2011)
Restrictive lung diseases are characterised by reduced lung volumes and have
a variety of potential pulmonary and extrapulmonary causes. Potential
pulmonary causes include interstitial lung disease, pulmonary oedema and
vasculitis. Extrapulmonary causes reducing volume and expansion include
neuromuscular disorders (e.g. amyotrophic lateral sclerosis (ALS), myasthenia
gravis (MG), muscular dystrophies), skeletal deformities, obesity and phrenic
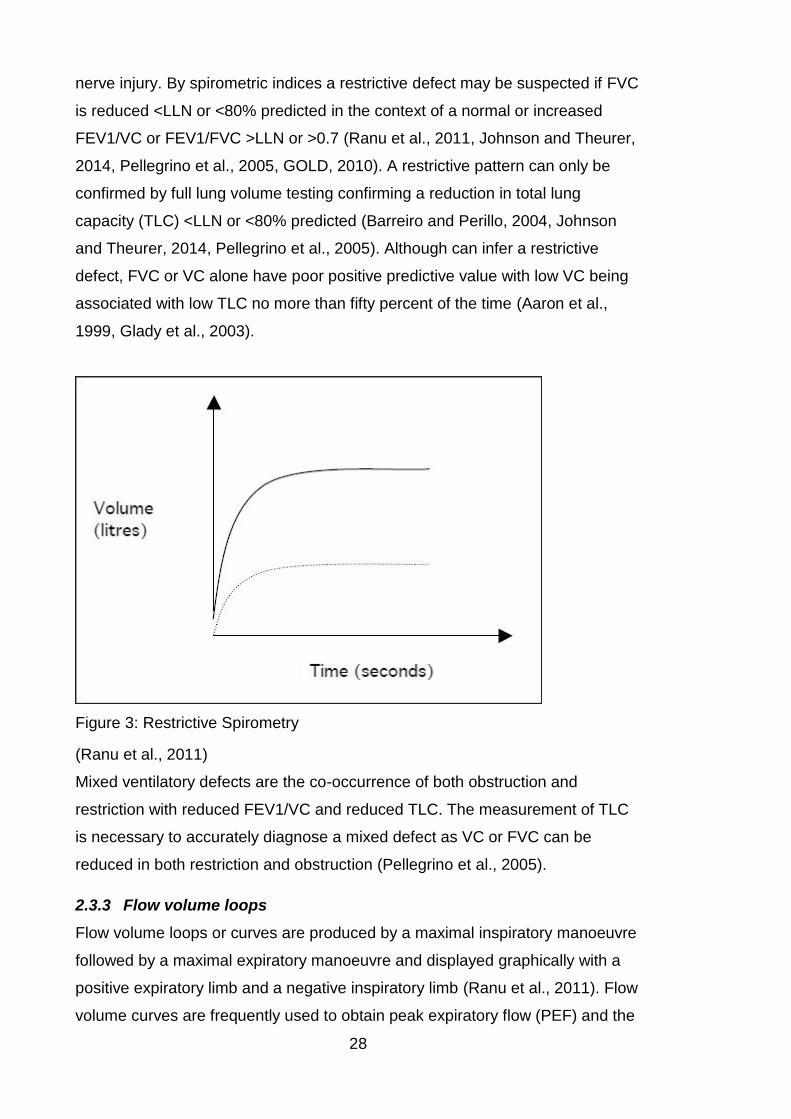
28
nerve injury. By spirometric indices a restrictive defect may be suspected if FVC
is reduced <LLN or <80% predicted in the context of a normal or increased
FEV1/VC or FEV1/FVC >LLN or >0.7 (Ranu et al., 2011, Johnson and Theurer,
2014, Pellegrino et al., 2005, GOLD, 2010). A restrictive pattern can only be
confirmed by full lung volume testing confirming a reduction in total lung
capacity (TLC) <LLN or <80% predicted (Barreiro and Perillo, 2004, Johnson
and Theurer, 2014, Pellegrino et al., 2005). Although can infer a restrictive
defect, FVC or VC alone have poor positive predictive value with low VC being
associated with low TLC no more than fifty percent of the time (Aaron et al.,
1999, Glady et al., 2003).
Figure 3: Restrictive Spirometry
(Ranu et al., 2011)
Mixed ventilatory defects are the co-occurrence of both obstruction and
restriction with reduced FEV1/VC and reduced TLC. The measurement of TLC
is necessary to accurately diagnose a mixed defect as VC or FVC can be
reduced in both restriction and obstruction (Pellegrino et al., 2005).
2.3.3 Flow volume loops
Flow volume loops or curves are produced by a maximal inspiratory manoeuvre
followed by a maximal expiratory manoeuvre and displayed graphically with a
positive expiratory limb and a negative inspiratory limb (Ranu et al., 2011). Flow
volume curves are frequently used to obtain peak expiratory flow (PEF) and the
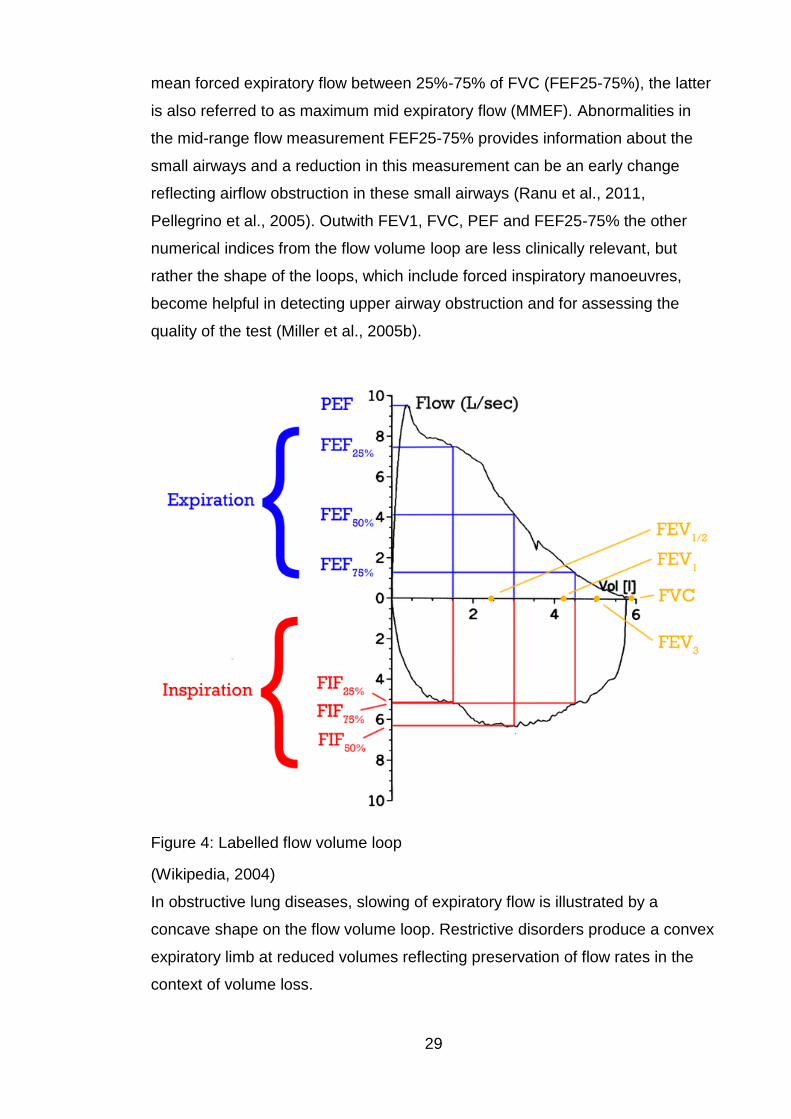
29
mean forced expiratory flow between 25%-75% of FVC (FEF25-75%), the latter
is also referred to as maximum mid expiratory flow (MMEF). Abnormalities in
the mid-range flow measurement FEF25-75% provides information about the
small airways and a reduction in this measurement can be an early change
reflecting airflow obstruction in these small airways (Ranu et al., 2011,
Pellegrino et al., 2005). Outwith FEV1, FVC, PEF and FEF25-75% the other
numerical indices from the flow volume loop are less clinically relevant, but
rather the shape of the loops, which include forced inspiratory manoeuvres,
become helpful in detecting upper airway obstruction and for assessing the
quality of the test (Miller et al., 2005b).
Figure 4: Labelled flow volume loop
(Wikipedia, 2004)
In obstructive lung diseases, slowing of expiratory flow is illustrated by a
concave shape on the flow volume loop. Restrictive disorders produce a convex
expiratory limb at reduced volumes reflecting preservation of flow rates in the
context of volume loss.
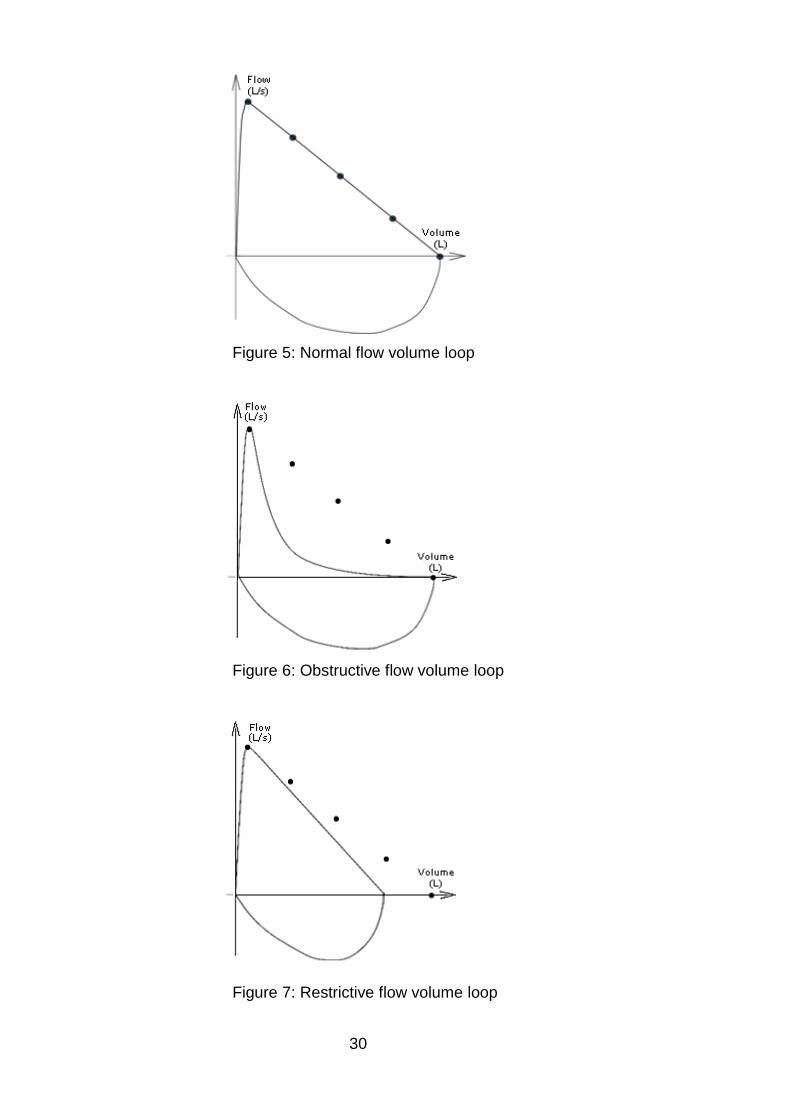
30
Figure 5: Normal flow volume loop
Figure 6: Obstructive flow volume loop
Figure 7: Restrictive flow volume loop
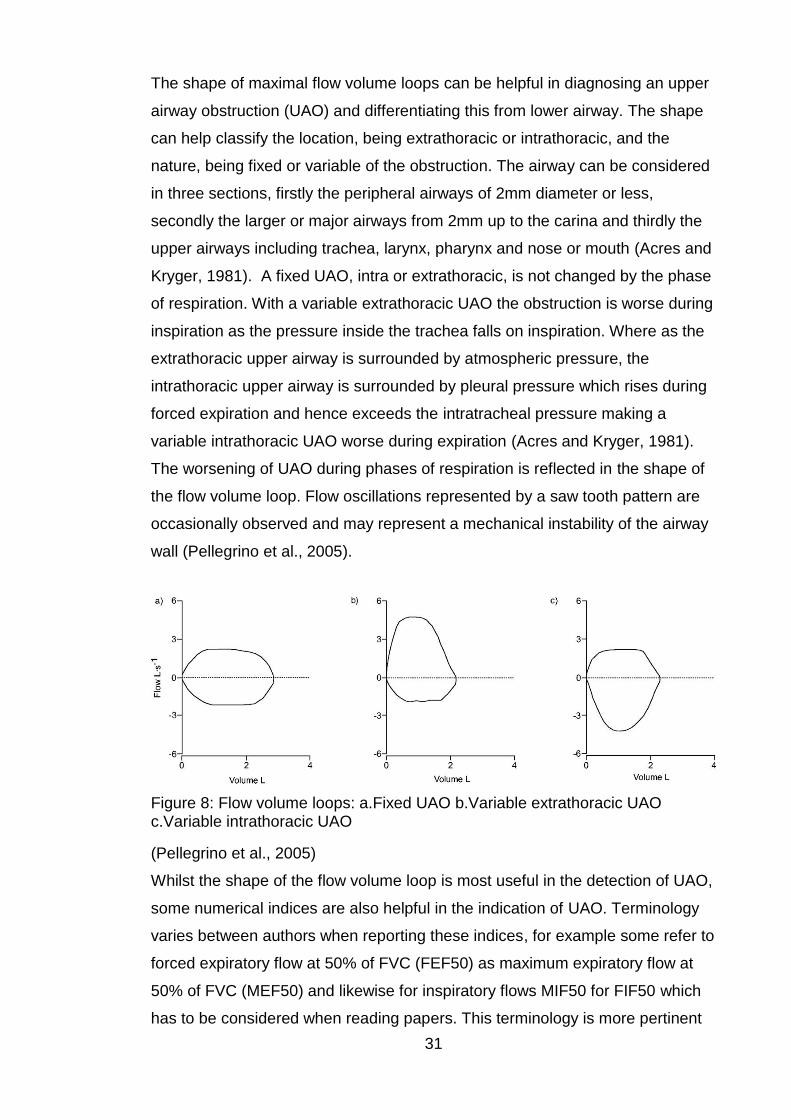
31
The shape of maximal flow volume loops can be helpful in diagnosing an upper
airway obstruction (UAO) and differentiating this from lower airway. The shape
can help classify the location, being extrathoracic or intrathoracic, and the
nature, being fixed or variable of the obstruction. The airway can be considered
in three sections, firstly the peripheral airways of 2mm diameter or less,
secondly the larger or major airways from 2mm up to the carina and thirdly the
upper airways including trachea, larynx, pharynx and nose or mouth (Acres and
Kryger, 1981). A fixed UAO, intra or extrathoracic, is not changed by the phase
of respiration. With a variable extrathoracic UAO the obstruction is worse during
inspiration as the pressure inside the trachea falls on inspiration. Where as the
extrathoracic upper airway is surrounded by atmospheric pressure, the
intrathoracic upper airway is surrounded by pleural pressure which rises during
forced expiration and hence exceeds the intratracheal pressure making a
variable intrathoracic UAO worse during expiration (Acres and Kryger, 1981).
The worsening of UAO during phases of respiration is reflected in the shape of
the flow volume loop. Flow oscillations represented by a saw tooth pattern are
occasionally observed and may represent a mechanical instability of the airway
wall (Pellegrino et al., 2005).
Figure 8: Flow volume loops: a.Fixed UAO b.Variable extrathoracic UAO c.Variable intrathoracic UAO
(Pellegrino et al., 2005)
Whilst the shape of the flow volume loop is most useful in the detection of UAO,
some numerical indices are also helpful in the indication of UAO. Terminology
varies between authors when reporting these indices, for example some refer to
forced expiratory flow at 50% of FVC (FEF50) as maximum expiratory flow at
50% of FVC (MEF50) and likewise for inspiratory flows MIF50 for FIF50 which
has to be considered when reading papers. This terminology is more pertinent
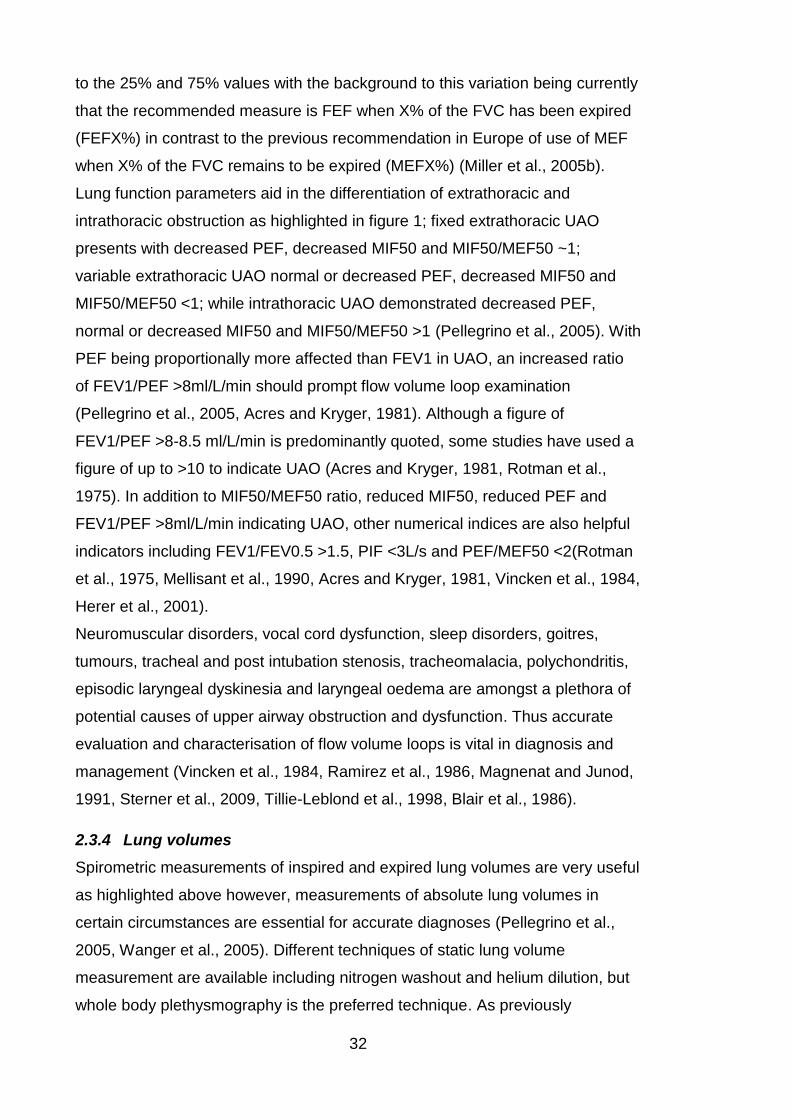
32
to the 25% and 75% values with the background to this variation being currently
that the recommended measure is FEF when X% of the FVC has been expired
(FEFX%) in contrast to the previous recommendation in Europe of use of MEF
when X% of the FVC remains to be expired (MEFX%) (Miller et al., 2005b).
Lung function parameters aid in the differentiation of extrathoracic and
intrathoracic obstruction as highlighted in figure 1; fixed extrathoracic UAO
presents with decreased PEF, decreased MIF50 and MIF50/MEF50 ~1;
variable extrathoracic UAO normal or decreased PEF, decreased MIF50 and
MIF50/MEF50 <1; while intrathoracic UAO demonstrated decreased PEF,
normal or decreased MIF50 and MIF50/MEF50 >1 (Pellegrino et al., 2005). With
PEF being proportionally more affected than FEV1 in UAO, an increased ratio
of FEV1/PEF >8ml/L/min should prompt flow volume loop examination
(Pellegrino et al., 2005, Acres and Kryger, 1981). Although a figure of
FEV1/PEF >8-8.5 ml/L/min is predominantly quoted, some studies have used a
figure of up to >10 to indicate UAO (Acres and Kryger, 1981, Rotman et al.,
1975). In addition to MIF50/MEF50 ratio, reduced MIF50, reduced PEF and
FEV1/PEF >8ml/L/min indicating UAO, other numerical indices are also helpful
indicators including FEV1/FEV0.5 >1.5, PIF <3L/s and PEF/MEF50 <2(Rotman
et al., 1975, Mellisant et al., 1990, Acres and Kryger, 1981, Vincken et al., 1984,
Herer et al., 2001).
Neuromuscular disorders, vocal cord dysfunction, sleep disorders, goitres,
tumours, tracheal and post intubation stenosis, tracheomalacia, polychondritis,
episodic laryngeal dyskinesia and laryngeal oedema are amongst a plethora of
potential causes of upper airway obstruction and dysfunction. Thus accurate
evaluation and characterisation of flow volume loops is vital in diagnosis and
management (Vincken et al., 1984, Ramirez et al., 1986, Magnenat and Junod,
1991, Sterner et al., 2009, Tillie-Leblond et al., 1998, Blair et al., 1986).
2.3.4 Lung volumes
Spirometric measurements of inspired and expired lung volumes are very useful
as highlighted above however, measurements of absolute lung volumes in
certain circumstances are essential for accurate diagnoses (Pellegrino et al.,
2005, Wanger et al., 2005). Different techniques of static lung volume
measurement are available including nitrogen washout and helium dilution, but
whole body plethysmography is the preferred technique. As previously
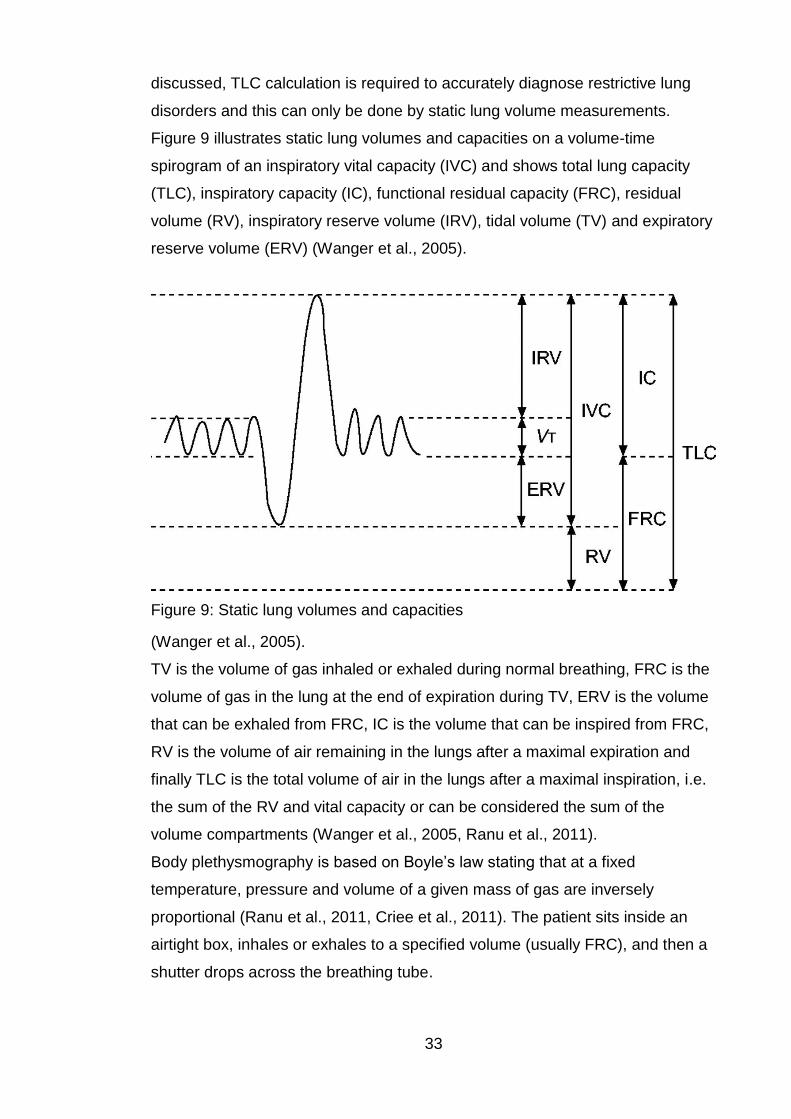
33
discussed, TLC calculation is required to accurately diagnose restrictive lung
disorders and this can only be done by static lung volume measurements.
Figure 9 illustrates static lung volumes and capacities on a volume-time
spirogram of an inspiratory vital capacity (IVC) and shows total lung capacity
(TLC), inspiratory capacity (IC), functional residual capacity (FRC), residual
volume (RV), inspiratory reserve volume (IRV), tidal volume (TV) and expiratory
reserve volume (ERV) (Wanger et al., 2005).
Figure 9: Static lung volumes and capacities
(Wanger et al., 2005).
TV is the volume of gas inhaled or exhaled during normal breathing, FRC is the
volume of gas in the lung at the end of expiration during TV, ERV is the volume
that can be exhaled from FRC, IC is the volume that can be inspired from FRC,
RV is the volume of air remaining in the lungs after a maximal expiration and
finally TLC is the total volume of air in the lungs after a maximal inspiration, i.e.
the sum of the RV and vital capacity or can be considered the sum of the
volume compartments (Wanger et al., 2005, Ranu et al., 2011).
Body plethysmography is based on Boyle’s law stating that at a fixed
temperature, pressure and volume of a given mass of gas are inversely
proportional (Ranu et al., 2011, Criee et al., 2011). The patient sits inside an
airtight box, inhales or exhales to a specified volume (usually FRC), and then a
shutter drops across the breathing tube.
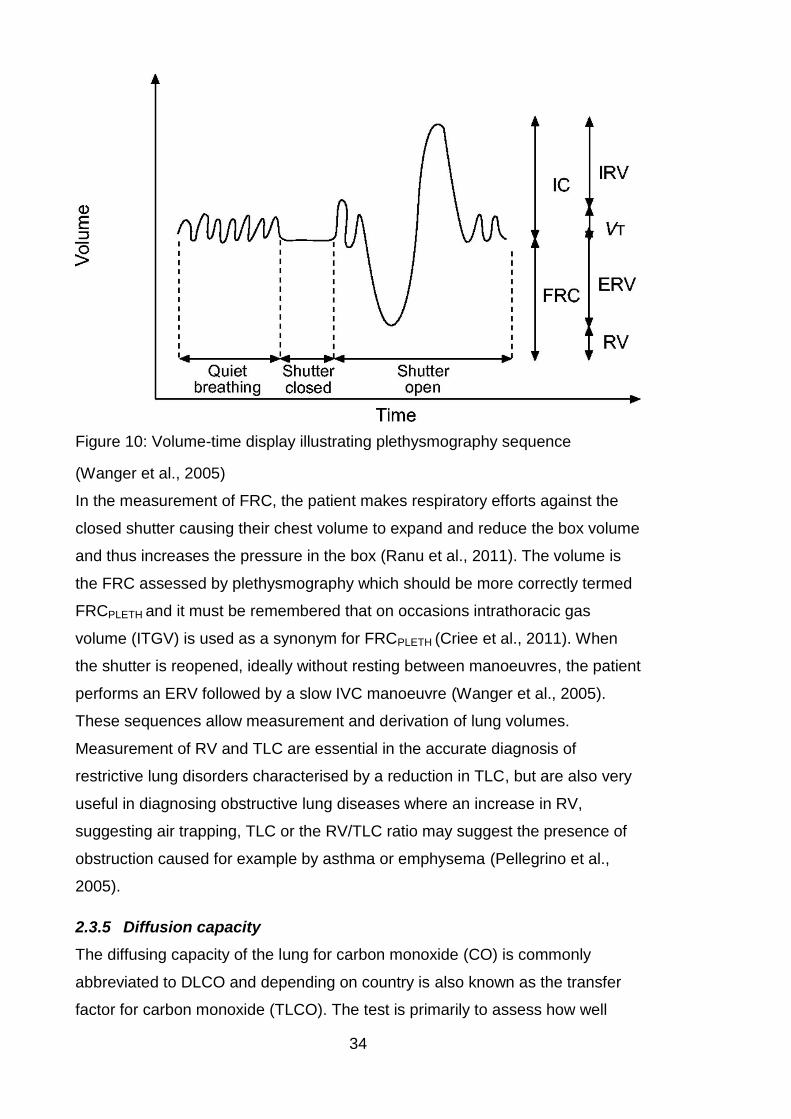
34
Figure 10: Volume-time display illustrating plethysmography sequence
(Wanger et al., 2005)
In the measurement of FRC, the patient makes respiratory efforts against the
closed shutter causing their chest volume to expand and reduce the box volume
and thus increases the pressure in the box (Ranu et al., 2011). The volume is
the FRC assessed by plethysmography which should be more correctly termed
FRCPLETH and it must be remembered that on occasions intrathoracic gas
volume (ITGV) is used as a synonym for FRCPLETH (Criee et al., 2011). When
the shutter is reopened, ideally without resting between manoeuvres, the patient
performs an ERV followed by a slow IVC manoeuvre (Wanger et al., 2005).
These sequences allow measurement and derivation of lung volumes.
Measurement of RV and TLC are essential in the accurate diagnosis of
restrictive lung disorders characterised by a reduction in TLC, but are also very
useful in diagnosing obstructive lung diseases where an increase in RV,
suggesting air trapping, TLC or the RV/TLC ratio may suggest the presence of
obstruction caused for example by asthma or emphysema (Pellegrino et al.,
2005).
2.3.5 Diffusion capacity
The diffusing capacity of the lung for carbon monoxide (CO) is commonly
abbreviated to DLCO and depending on country is also known as the transfer
factor for carbon monoxide (TLCO). The test is primarily to assess how well
35
oxygen moves in an out of the lungs by measuring gas diffusion across the
alveolar membrane. Gas diffusion is affected by the pulmonary vascular bed
and the surface area and integrity of the alveolar membrane (Ranu et al., 2011).
DLCO is normally reported as the absolute number and also when divided by
alveolar volume (VA), the DLCO/VA, referred to as the transfer coefficient
(KCO) (Kaminsky et al., 2007). KCO is most useful in interpretation of results,
for example an individual who had had a pneumonectomy would have a falsely
low DLCO if not corrected for VA as the remaining lung may be functioning
normally. Neither KCO nor VA are constants and thus it must be remembered
that the same DLCO can occur with different combinations of KCO and VA
whilst at the same time suggesting different pathologies (Hughes and Pride,
2012). A critical part of diffusion capacity testing is the binding of CO to
haemoglobin (Hb) and as such the presence of anaemia may decrease DLCO,
or polycythaemia may increase DLCO thus correction equations are usually
done to account for differences in Hb.
Diffusion capacity is measured by the single breath technique which involves
measuring CO uptake over a breath hold phase. MacIntyre et al (2005), as part
of the ATS/ERS task force series on standardisation of lung volume, review and
discuss the technique of DLCO testing in great detail. The test system has a
source of test gas, a method of measuring inspired and expired volume over
time and gas analysers. The test gas comprises known concentrations of the
CO and a tracer gas (commonly helium (He),) to measure VA, with the balance
of the gas including oxygen (O2) and nitrogen (N2). With nose clip and
mouthpiece in place the DLCO test begins with unforced exhalation to RV, the
mouthpiece is connected to the test gas source and the patient inhales rapidly
to TLC. It is important that the inspired volume is as close to known VC as
possible and that inspiration is rapid. The patient then is asked to breath-hold
for 10 ± 2 seconds prior to an unforced, smooth expiratory manoeuvre which
should be less than 4 seconds. The DLCO calculations are then based on
alveolar gas samples from the expired collected gases, with the first amount of
gas from the physiological dead-space being discarded to collect a valid sample
(Macintyre et al., 2005).
Large lung volumes, asthma and obesity are the commonest causes of a high
DLCO, whilst polycythaemia, left-right shunt and pulmonary haemorrhage
although causative are observed less frequently (Saydain et al., 2004).
36
Conditions that reduce one or more of volume of pulmonary capillary blood,
membrane conductivity and CO-Hb chemical reaction rate can all lead to
reduced DLCO including; anaemia, pulmonary emboli, emphysema, interstitial
lung disease, pulmonary oedema, pulmonary vasculitis and pulmonary
hypertension (Macintyre et al., 2005). Extrapulmonary reduction in lung inflation,
for example respiratory muscle weakness, reduced effort or thoracic deformity,
resulting in reduced VA can reduce DLCO and in this context highlights the
importance of reviewing the KCO and clinical picture to form an appropriate
diagnosis (Macintyre et al., 2005, Hughes and Pride, 2012, Siegler and Zorab,
1982, Hart et al., 2002).
2.3.6 Respiratory muscle function
Respiratory muscle function tests should be performed as part of a more
comprehensive diagnostic process including examination, spirometry, lung
volumes and diffusion capacity. Respiratory muscle dysfunction is to be
differentiated from lung function abnormalities (Troosters et al., 2005). In
generalised neuromuscular disorders it is unusual for the respiratory muscles to
be unaffected (Polkey et al., 1995). Severe generalised respiratory muscle
weakness manifests as breathlessness and tachypnoea, and when sufficiently
severe nocturnal hypoventilation disturbs sleep, cognitive function and causes
daytime somnolence (Polkey et al., 1995, Smith et al., 1988). The final sequelae
are ventilatory failure and cor pulmonale (Polkey et al., 1995). Inspiratory
muscle weakness can in part explain dyspnoea and poor exercise tolerance
(Troosters et al., 2005). Expiratory muscle and bulbar weakness leads to
speech problems and impairs cough and predisposes to mucus retention,
pneumonia and aspiration (Troosters et al., 2005, Polkey et al., 1995). Poor
respiratory muscle strength has been shown to be a predictive factor for
mortality in both neuromuscular disease, for example ALS and non
neuromuscular disorders such as congestive cardiac failure (Polkey et al., 2016,
Meyer et al., 2001).
Respiratory muscle strength tests should be performed in those at risk of
weakness, for example neuromuscular and metabolic disorders and in those
with clinical signs and symptoms suggestive of respiratory muscle weakness;
unexplained reduction in VC, Carbon dioxide (CO2) retention (especially in the
absence of airflow obstruction), orthopnoea, short sentences whilst speaking,
37
dyspnoea during bathing/swimming, tachypnoea, paradoxical abdominal and
chest wall movements, problems with cough and recurrent infections and
generalised muscle weakness (Troosters et al., 2005).
Respiratory muscles strength is generally measured by the pressures
generated during inspiration or expiration and is commonly measured in either
cm water pressure (cmH2O) or kilopascals (kPa). Pressure is most commonly
measured at the mouth and nose but can be further assessed by oesophageal,
gastric and transdiaphragmatic pressures. The maximal expiratory pressure and
maximal inspiratory pressure measured at the mouth are commonly abbreviated
to MEP or PEmax and MIP or PImax respectively. Sniff nasal inspiratory pressure
(SNIP or Psniff) measures inspiratory muscle function and being a natural
manoeuvre can often be found easier to perform by many patients (Verin et al.,
2001, Miller et al., 1985). Portable pressure meters facilitate easy bedside or
departmental measurement.
The procedure must be explained clearly to the patient. Via a mouthpiece
attached to the pressure meter, which is typically flanged, the patient performs
the maximal effort manoeuvres and is asked to maintain the pressure. Multiple
efforts are recorded, looking for reproducibility and the maximum pressure.
Conventionally MIP is measured (Mueller manoeuvre) from RV and MEP
(Valsalva manoeuvre) is measured from TLC (Polkey et al., 1995). The
pressure maintained for at least one second, plateau pressure, is usually
reported for MIP and MEP (Troosters et al., 2005). To measure SNIP a nasal
plug is attached to the portable pressure device. Sniff nasal inspiratory pressure
measurement is a simple procedure. From end expiration, a nasal plug is
placed in one occluded nostril and a maximal sniff manoeuvre is performed
through the contralateral nostril (Fitting, 2006, Heritier et al., 1994). In normal
subjects maximal expiratory pressures are expected to be higher than
inspiratory pressures, however SNIP results are generally higher than MIP
results (Fitting, 2006, Troosters et al., 2005). This paradox is probably explained
by the ease in which SNIP is performed compared to MIP and the subsequent
more complete neuromuscular activation (Fitting, 2006). In patients with severe
neuromuscular weakness, such as in advanced ALS, the SNIP manoeuvre can
be more feasible and a determinant of VC (Fitting, 2006, Fitting et al., 1999,
Stefanutti et al., 2000).
38
It is important that respiratory muscle testing is interpreted in the context of
other pulmonary function tests as, with the exception of patients with severe
neuromuscular disease in the advanced stages, respiratory muscle dysfunction
does not correlate with lung function impairment (Troosters et al., 2005). It
should be remembered that respiratory muscle test results must be interpreted
with caution for a number of reasons. Patients may have had difficulty
performing the tests for either physiological reasons or difficulty in
understanding the instructions. If appropriate equipment or technique is not
used, cheek and buccal muscles contribute to pressure generation and
particular mouthpieces may result in additional leaks (Troosters et al., 2005,
Koulouris et al., 1988). In the testing of inspiratory or expiratory muscles, the
pressure is generated by all the muscles being tested and is, as such, not
muscle specific. Furthermore, neuromuscular junction, muscle fibre, peripheral
nerve, anterior horn, spinal cord or cerebral dysfunction may manifest as
reduced respiratory muscle strength (Troosters et al., 2005).
2.3.7 Pulmonary function and ageing
In the majority of populations throughout the world life expectancy is increasing
with a resultant increase in the population over the age of 65. The presence of
disease will lead to functional decline and with advancing age comes reduced
capacity to deal with disease. Ageing makes individuals more vulnerable as it is
also associated with loss of protective mechanisms including a reduction in
response to hypoxia and hypercapnia (Peterson et al., 1981). To distinguish
from abnormal pathology it is important to understand the physiological changes
that occur in normal ageing and their clinical manifestations. Changes in
pulmonary function with ageing are important to appreciate particularly in areas
such as anaesthesia in the elderly.
The lung matures to optimal function between the ages of 20 and 25 years,
plateaus to age 35 and thereafter there is a progressive decline in lung function
(Sharma and Goodwin, 2006). Ageing affects a number of parameters of lung
function and thus ventilation, gas exchange and compliance. Ageing brings a
reduction in chest wall compliance through changes to the thoracic cage.
Calcification of the costal cartilages and chondrosternal junctions, osteoporotic
height loss and kyphosis reduce the ability of the thoracic cage to expand
(Estenne et al., 1985, Edge et al., 1964, Sharma and Goodwin, 2006).
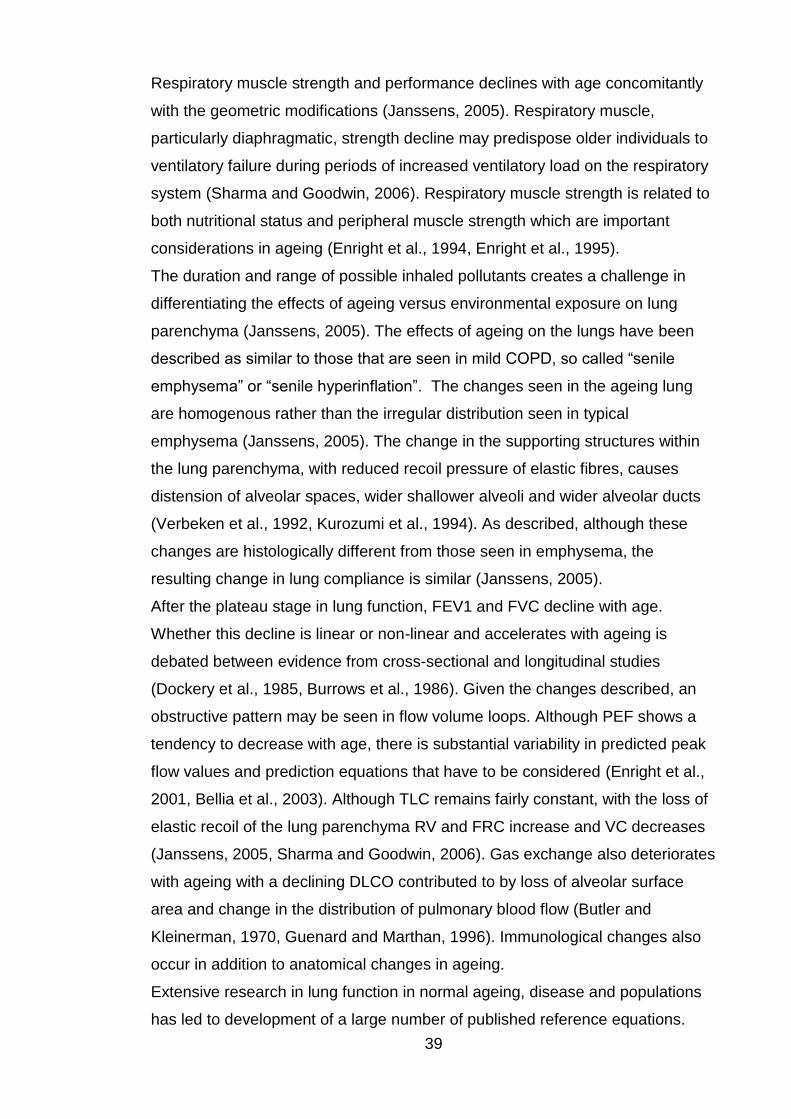
39
Respiratory muscle strength and performance declines with age concomitantly
with the geometric modifications (Janssens, 2005). Respiratory muscle,
particularly diaphragmatic, strength decline may predispose older individuals to
ventilatory failure during periods of increased ventilatory load on the respiratory
system (Sharma and Goodwin, 2006). Respiratory muscle strength is related to
both nutritional status and peripheral muscle strength which are important
considerations in ageing (Enright et al., 1994, Enright et al., 1995).
The duration and range of possible inhaled pollutants creates a challenge in
differentiating the effects of ageing versus environmental exposure on lung
parenchyma (Janssens, 2005). The effects of ageing on the lungs have been
described as similar to those that are seen in mild COPD, so called “senile
emphysema” or “senile hyperinflation”. The changes seen in the ageing lung
are homogenous rather than the irregular distribution seen in typical
emphysema (Janssens, 2005). The change in the supporting structures within
the lung parenchyma, with reduced recoil pressure of elastic fibres, causes
distension of alveolar spaces, wider shallower alveoli and wider alveolar ducts
(Verbeken et al., 1992, Kurozumi et al., 1994). As described, although these
changes are histologically different from those seen in emphysema, the
resulting change in lung compliance is similar (Janssens, 2005).
After the plateau stage in lung function, FEV1 and FVC decline with age.
Whether this decline is linear or non-linear and accelerates with ageing is
debated between evidence from cross-sectional and longitudinal studies
(Dockery et al., 1985, Burrows et al., 1986). Given the changes described, an
obstructive pattern may be seen in flow volume loops. Although PEF shows a
tendency to decrease with age, there is substantial variability in predicted peak
flow values and prediction equations that have to be considered (Enright et al.,
2001, Bellia et al., 2003). Although TLC remains fairly constant, with the loss of
elastic recoil of the lung parenchyma RV and FRC increase and VC decreases
(Janssens, 2005, Sharma and Goodwin, 2006). Gas exchange also deteriorates
with ageing with a declining DLCO contributed to by loss of alveolar surface
area and change in the distribution of pulmonary blood flow (Butler and
Kleinerman, 1970, Guenard and Marthan, 1996). Immunological changes also
occur in addition to anatomical changes in ageing.
Extensive research in lung function in normal ageing, disease and populations
has led to development of a large number of published reference equations.
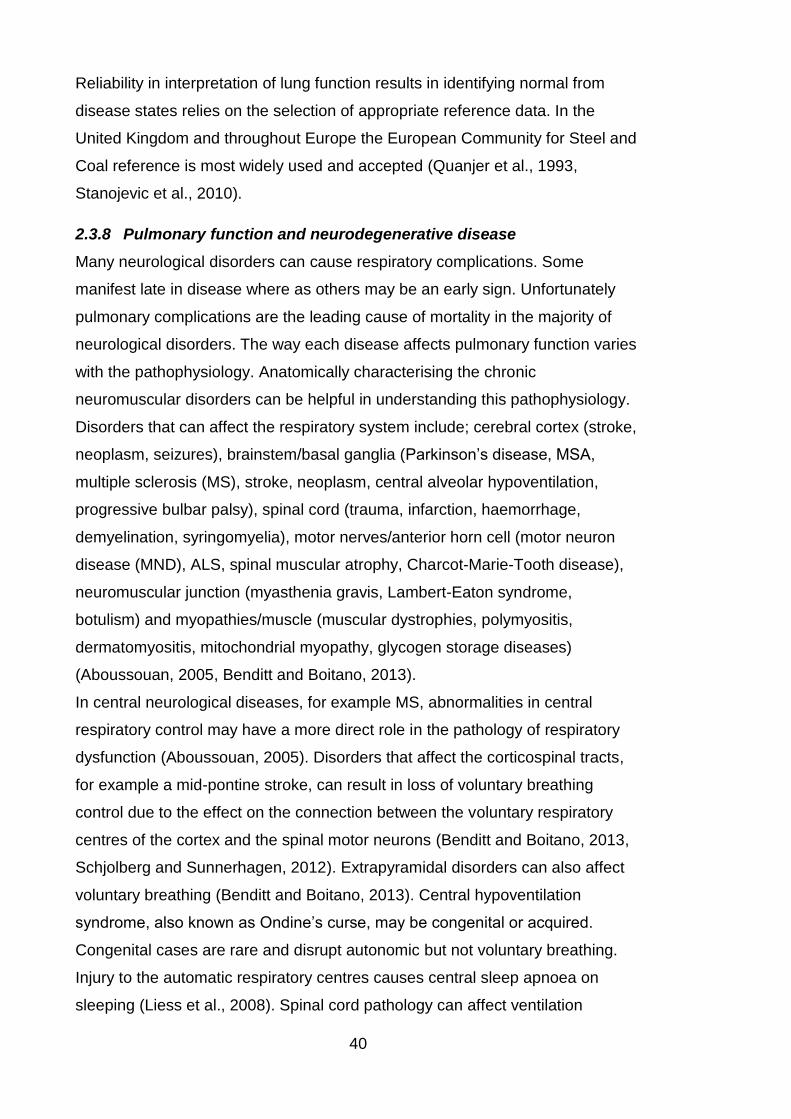
40
Reliability in interpretation of lung function results in identifying normal from
disease states relies on the selection of appropriate reference data. In the
United Kingdom and throughout Europe the European Community for Steel and
Coal reference is most widely used and accepted (Quanjer et al., 1993,
Stanojevic et al., 2010).
2.3.8 Pulmonary function and neurodegenerative disease
Many neurological disorders can cause respiratory complications. Some
manifest late in disease where as others may be an early sign. Unfortunately
pulmonary complications are the leading cause of mortality in the majority of
neurological disorders. The way each disease affects pulmonary function varies
with the pathophysiology. Anatomically characterising the chronic
neuromuscular disorders can be helpful in understanding this pathophysiology.
Disorders that can affect the respiratory system include; cerebral cortex (stroke,
neoplasm, seizures), brainstem/basal ganglia (Parkinson’s disease, MSA,
multiple sclerosis (MS), stroke, neoplasm, central alveolar hypoventilation,
progressive bulbar palsy), spinal cord (trauma, infarction, haemorrhage,
demyelination, syringomyelia), motor nerves/anterior horn cell (motor neuron
disease (MND), ALS, spinal muscular atrophy, Charcot-Marie-Tooth disease),
neuromuscular junction (myasthenia gravis, Lambert-Eaton syndrome,
botulism) and myopathies/muscle (muscular dystrophies, polymyositis,
dermatomyositis, mitochondrial myopathy, glycogen storage diseases)
(Aboussouan, 2005, Benditt and Boitano, 2013).
In central neurological diseases, for example MS, abnormalities in central
respiratory control may have a more direct role in the pathology of respiratory
dysfunction (Aboussouan, 2005). Disorders that affect the corticospinal tracts,
for example a mid-pontine stroke, can result in loss of voluntary breathing
control due to the effect on the connection between the voluntary respiratory
centres of the cortex and the spinal motor neurons (Benditt and Boitano, 2013,
Schjolberg and Sunnerhagen, 2012). Extrapyramidal disorders can also affect
voluntary breathing (Benditt and Boitano, 2013). Central hypoventilation
syndrome, also known as Ondine’s curse, may be congenital or acquired.
Congenital cases are rare and disrupt autonomic but not voluntary breathing.
Injury to the automatic respiratory centres causes central sleep apnoea on
sleeping (Liess et al., 2008). Spinal cord pathology can affect ventilation
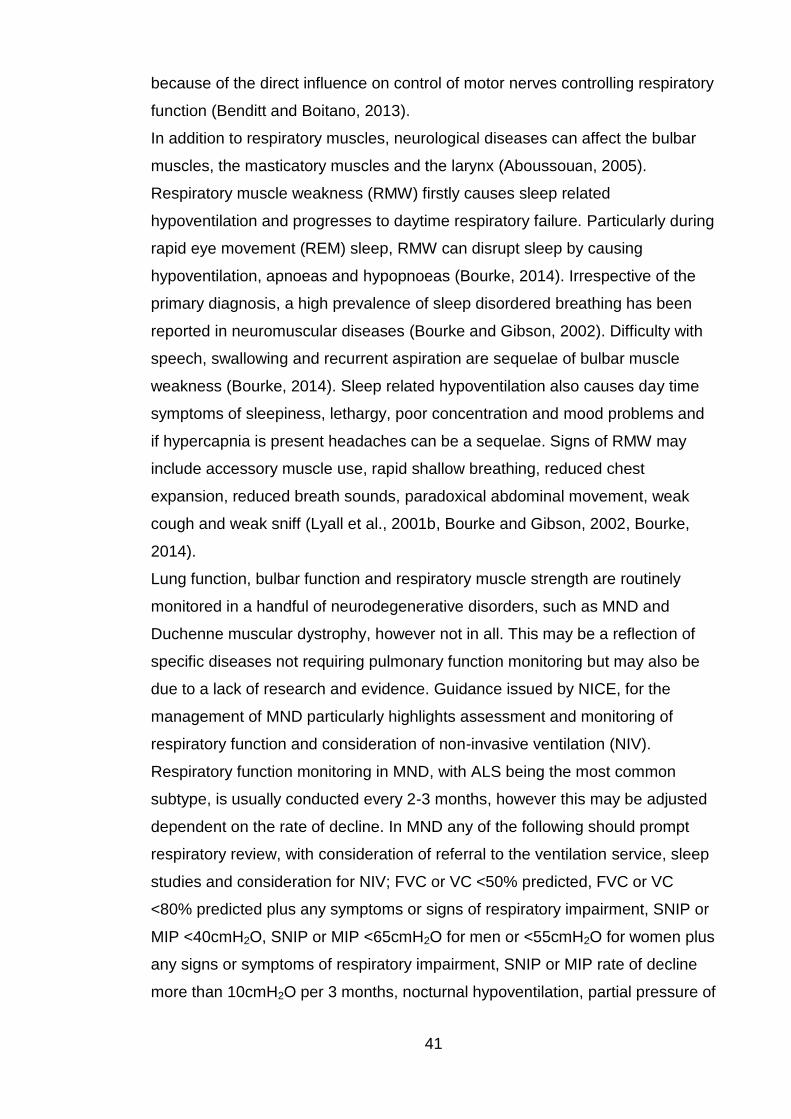
41
because of the direct influence on control of motor nerves controlling respiratory
function (Benditt and Boitano, 2013).
In addition to respiratory muscles, neurological diseases can affect the bulbar
muscles, the masticatory muscles and the larynx (Aboussouan, 2005).
Respiratory muscle weakness (RMW) firstly causes sleep related
hypoventilation and progresses to daytime respiratory failure. Particularly during
rapid eye movement (REM) sleep, RMW can disrupt sleep by causing
hypoventilation, apnoeas and hypopnoeas (Bourke, 2014). Irrespective of the
primary diagnosis, a high prevalence of sleep disordered breathing has been
reported in neuromuscular diseases (Bourke and Gibson, 2002). Difficulty with
speech, swallowing and recurrent aspiration are sequelae of bulbar muscle
weakness (Bourke, 2014). Sleep related hypoventilation also causes day time
symptoms of sleepiness, lethargy, poor concentration and mood problems and
if hypercapnia is present headaches can be a sequelae. Signs of RMW may
include accessory muscle use, rapid shallow breathing, reduced chest
expansion, reduced breath sounds, paradoxical abdominal movement, weak
cough and weak sniff (Lyall et al., 2001b, Bourke and Gibson, 2002, Bourke,
2014).
Lung function, bulbar function and respiratory muscle strength are routinely
monitored in a handful of neurodegenerative disorders, such as MND and
Duchenne muscular dystrophy, however not in all. This may be a reflection of
specific diseases not requiring pulmonary function monitoring but may also be
due to a lack of research and evidence. Guidance issued by NICE, for the
management of MND particularly highlights assessment and monitoring of
respiratory function and consideration of non-invasive ventilation (NIV).
Respiratory function monitoring in MND, with ALS being the most common
subtype, is usually conducted every 2-3 months, however this may be adjusted
dependent on the rate of decline. In MND any of the following should prompt
respiratory review, with consideration of referral to the ventilation service, sleep
studies and consideration for NIV; FVC or VC <50% predicted, FVC or VC
<80% predicted plus any symptoms or signs of respiratory impairment, SNIP or
MIP <40cmH2O, SNIP or MIP <65cmH2O for men or <55cmH2O for women plus
any signs or symptoms of respiratory impairment, SNIP or MIP rate of decline
more than 10cmH2O per 3 months, nocturnal hypoventilation, partial pressure of
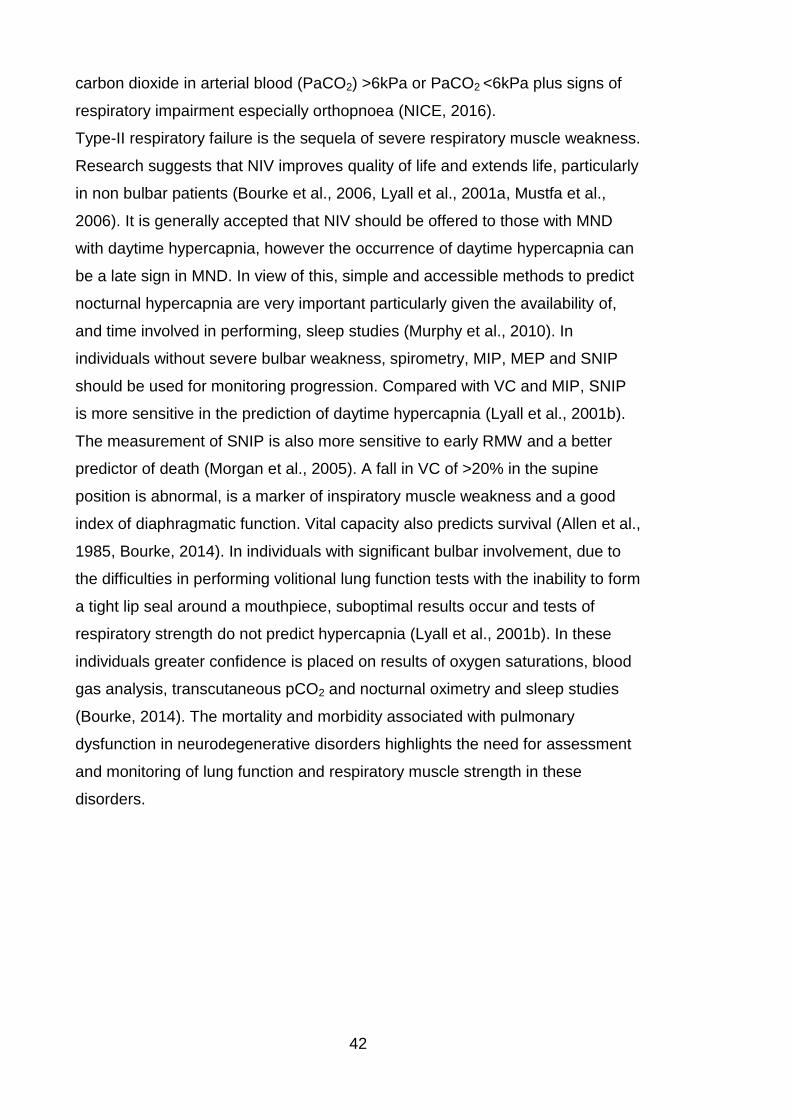
42
carbon dioxide in arterial blood (PaCO2) >6kPa or PaCO2 <6kPa plus signs of
respiratory impairment especially orthopnoea (NICE, 2016).
Type-II respiratory failure is the sequela of severe respiratory muscle weakness.
Research suggests that NIV improves quality of life and extends life, particularly
in non bulbar patients (Bourke et al., 2006, Lyall et al., 2001a, Mustfa et al.,
2006). It is generally accepted that NIV should be offered to those with MND
with daytime hypercapnia, however the occurrence of daytime hypercapnia can
be a late sign in MND. In view of this, simple and accessible methods to predict
nocturnal hypercapnia are very important particularly given the availability of,
and time involved in performing, sleep studies (Murphy et al., 2010). In
individuals without severe bulbar weakness, spirometry, MIP, MEP and SNIP
should be used for monitoring progression. Compared with VC and MIP, SNIP
is more sensitive in the prediction of daytime hypercapnia (Lyall et al., 2001b).
The measurement of SNIP is also more sensitive to early RMW and a better
predictor of death (Morgan et al., 2005). A fall in VC of >20% in the supine
position is abnormal, is a marker of inspiratory muscle weakness and a good
index of diaphragmatic function. Vital capacity also predicts survival (Allen et al.,
1985, Bourke, 2014). In individuals with significant bulbar involvement, due to
the difficulties in performing volitional lung function tests with the inability to form
a tight lip seal around a mouthpiece, suboptimal results occur and tests of
respiratory strength do not predict hypercapnia (Lyall et al., 2001b). In these
individuals greater confidence is placed on results of oxygen saturations, blood
gas analysis, transcutaneous pCO2 and nocturnal oximetry and sleep studies
(Bourke, 2014). The mortality and morbidity associated with pulmonary
dysfunction in neurodegenerative disorders highlights the need for assessment
and monitoring of lung function and respiratory muscle strength in these
disorders.
43
2.3.9 Pulmonary function and Parkinson’s disease
“He fetched his breath rather hard” was noted as a clinical feature by James
Parkinson in his initial description of the disease in his 1817 essay on the
shaking palsy (Parkinson, 1817). Despite this early recognition of respiratory
involvement in PD little remains known and debate continues about the pattern
of ventilatory dysfunction associated with the disease. Obstructive patterns,
restrictive patterns, upper airway obstruction, respiratory muscle weakness and
sleep breathing disorders have all been described but there is little consensus
across the studies. Patterns of ventilatory dysfunction in previous research are
summarised in table 3 below, however the complexity and variety of the
techniques used and outcome measures in each study warrants significant
further discussion.

44
Au
tho
r, y
ea
r N
um
be
r of
pa
tien
ts
Pa
tte
rn o
f d
ysfu
nctio
n
MIP
/SN
IP
ME
P
UA
O
Eff
ect of
do
pa
min
erg
ic
trea
tme
nt
Neu
et a
l, 1
967
2
3 (
10
M, 1
3F
) P
ark
inso
nis
m
Ob
str
uctive
R
ed
uced
MIP
R
ed
uced
Pa
uls
on
et a
l,
19
70
22
P
ark
inso
nis
m
MV
V in
cre
ased
Ob
eno
ur
et
al,
19
72
31
(18
M, 1
3F
) P
D
11
Ob
str
uctive
Unch
an
ge
d
Vin
cke
n e
t a
l,
19
84
27
(19
M, 8
F)
Extr
ap
yra
mid
al
dis
ord
ers
2
4 a
bn
orm
al flo
w
vo
lum
e lo
op
s
10
UA
O b
y
au
tho
r’s c
rite
ria
Tze
lep
is e
t a
l,
19
88
9
PD
N
orm
al
Norm
al M
IP
Hove
sta
dt
et
al,
19
89
31
(16
M, 1
5F
) P
D
Norm
al
Red
uced
Red
uced
20
-22
abn
orm
al
flow
vo
lum
e loo
ps
18
ha
d b
etw
ee
n
1-3
UA
O
pa
ram
ete
rs
De B
ruin
et
al,
19
93
10
(8M
, 2
F)
Norm
al
Red
uced
Red
uced
off
tre
atm
ent
8 a
bn
orm
al
cu
rve
s
PE
F r
edu
ce
d
2 f
ixe
d
extr
ath
ora
cic
o
bstr
uction
1 in
trath
ora
cic
o
bstr
uction
ME
P a
nd
PIF
in
cre
ase
d
(sig
nific
an
t)
MIP
and
PE
F
incre
ase
d
(mo
de
rate
)
Ma
xim
al flow
vo
lum
e c
urv
es
imp
rove
d

45
Izqu
ierd
o-A
lon
so
e
t a
l, 1
99
4
63
(39
M, 2
4F
) 8
5%
Restr
ictive
4
9.2
%
pa
tho
logic
al
cu
rve
s
21
typ
e A
9
typ
e B
1
ob
str
uctive
3
patie
nts
had
at
lea
st
2
sp
iro
metr
ic
ind
ices o
f U
AO
Sa
bate
et
al,
19
96
58
(30
M, 2
8F
) 1
8 O
bstr
uctive
1
6 R
estr
ictive
R
ed
uced
Red
uced
36
UA
O o
n 3
sp
iro
metr
ic
ind
ices
Ko
se
oglu
et
al,
19
97
9 (
4M
, 5
F)
1 R
estr
ictive
1
Ob
str
uctive
4
UA
O o
n 2
sp
iro
metr
ic
ind
ices
1 t
yp
e A
cu
rve
2
typ
e B
cu
rve
Can
nin
g e
t a
l,
19
97
16
(13
M, 3
F)
Norm
al
Norm
al
Norm
al
16
cu
rve
s w
ith
o
ne
or
mo
re
ab
no
rma
l fe
atu
res
10
UA
O b
y
au
tho
r’s c
rite
ria
Ve
rcue
il et
al,
19
99
11
(5M
, 6
F)
Le
ngth
en
ing o
f in
sp
ira
tory
du
ratio
n

46
Po
lati e
t a
l,
20
01
21
(10
M, 1
1F
)
3 o
f 6
ex-
sm
oke
rs
Ob
str
uctive
2
of
15
non
-sm
oke
rs
Ob
str
uctive
Here
r et
al,
20
01
21
(14
M, 7
F)
5
patie
nts
had
at
lea
st fo
ur
UA
O
crite
ria
Aft
er
levo
dop
a
2 o
f th
e 5
me
t U
AO
crite
ria
De P
and
is e
t a
l,
20
02
12
(5M
, 7
F)
Restr
ictive
FE
V1
an
d F
VC
im
pro
ve
d in
on
sta
te
Wein
er
et a
l,
20
02
20
(10
M, 1
0F
) R
estr
ictive
R
ed
uced
Red
uced
F
EV
1 a
nd
FV
C
un
cha
nge
d w
ith
tr
ea
tme
nt
MIP
and
ME
P
incre
ase
d w
ith
tr
ea
tme
nt
(no
t sig
nific
an
tly)
Card
oso
et
al,
20
02
40
(21
M, 1
9F
) R
estr
ictive
N
ot
red
uce
d
co
mpa
red t
o
co
ntr
ol
Not
red
uce
d
co
mpa
red t
o
co
ntr
ol
Ma
ria
et
al,
20
03
15
(12
M, 3
F)
Norm
al
Red
uced
Red
uced
Haa
s e
t a
l,
20
04
66
(47
M, 1
9F
)
Red
uced
Red
uced
Sa
thya
pra
bh
a e
t a
l,
20
05
35
3
3 R
estr
ictive
2
Ob
str
uctive
R
ed
uced
R
ed
uced
F
EV
1,
FV
C, P
EF
, M
IP,
ME
P
imp
rove
d in
on
sta
te

47
Mik
ae
lee
et
al,
20
06
25
(19
M, 6
F)
13
Ob
str
uctive
1
UA
O
on
au
tho
rs
crite
ria
Silv
erm
an
et a
l,
20
06
28
(14
M, 1
4F
)
30
.8%
Lo
w
69
.2%
N
orm
al
71
.4%
Lo
w
28
.6%
No
rma
l
Pa
l e
t a
l,
20
07
53
(38
M, 1
5F
) R
estr
ictive
R
ed
uced
Red
uced
All
PF
T p
ara
mete
rs
imp
rove
d w
ith
le
vo
do
pa
Sh
ahe
en
et a
l,
20
09
3
0 (
28
M, 2
F)
19
Re
str
ictive
5
Ob
str
uctive
Imp
rove
d in o
n
sta
te (
no
t sig
nific
an
t)
Se
ccom
be
et a
l,
20
11
19
(17
M, 2
F)
16
No
rma
l 2
Re
str
ictive
1
Mild
airflow
lim
ita
tio
n
13
(68%
) L
ow
1
5 (
79%
) L
ow
N
il
Gu
ede
s a
t a
l,
20
12
26
(16
M, 1
0F
)
Red
uced
Red
uced
M
IP a
nd
ME
P n
ot
sig
nific
an
tly
imp
rove
d in
on
sta
te
Wang e
t a
l,
20
14
30
PD
(16
M,
14
F)
27
MS
A (
14
M,
13
F)
17
(56.7
%)
Restr
ictive
1 (
3.3
%)
Cen
tral
ob
str
uctive
1
3 (
43.3
%)
Pe
rip
he
ric
ob
str
uctive
Red
uced
Red
uced
Tab
le 3
: S
um
ma
ry o
f th
e lite
ratu
re o
n p
ulm
ona
ry f
un
ctio
n in P
ark
inso
n's
dis
ea
se
48
Given the morbidity and mortality from pulmonary complications in PD, and the
identification in 1817, it is surprising that Interest in pulmonary function tests in
PD only seemed to begin in the late 1960’s with the 1967 study by Neu et al,
comprising 23 patients with Parkinsonism (Neu et al., 1967). The patients
included had a diagnosis of Parkinsonism rather than IPD and no smoking
history was documented. The measurement techniques, interpretation and
reference values are different to those used currently. Notwithstanding this, the
authors concluded the pattern was predominantly one of obstructive ventilatory
defect based on the airway resistance being almost double the predicted values
and more consistently present than any reduction in VC. This was heralded as
precisely the pattern found in individuals with bronchial asthma or emphysema.
They also commented on significant reductions in MIP, MEP, MIF and MEF and
increasing dysfunction correlated with severity of disease. Parasympathetic
hyperactivity was postulated as the cause of the obstructive pattern (Neu et al.,
1967). A basic 1970 study of 22 patients with Parkinsonism, demonstrated an
improvement in minute ventilatory volume (MVV) following administration of
levodopa. Although change was seen in MVV, VC was not significantly altered
following levodopa, however it must be noted that little detail was given about
the participants including pre-existing lung disease and smoking history
(Paulson and Tafrate, 1970).
Obenour et al, 1972, performed spirometry and plethysmography on 31 patients
with PD and noted expiratory flow obstruction in 11 of the 31. In both the
obstructed and non-obstructed groups increased RV and FRC were consistent
with air trapping. Airway resistance (RAW) was higher in the obstructed group
and lung recoil at TLC was lower in this group also. The baseline lung function
was assessed without the individuals on levodopa therapy. After 6 weeks of
levodopa therapy all assessments were repeated and despite an improvement
in neurological outcome measures there was no improvement in pulmonary
function. Unfortunately smokers and individuals with known obstructive lung
disease were not excluded from the study and whilst the authors concluded the
air trapping was a result of neurologic effects of PD on chest wall mechanics, it
is likely that the expiratory flow obstruction was a result of co-existing lung
disease (Obenour et al., 1972)
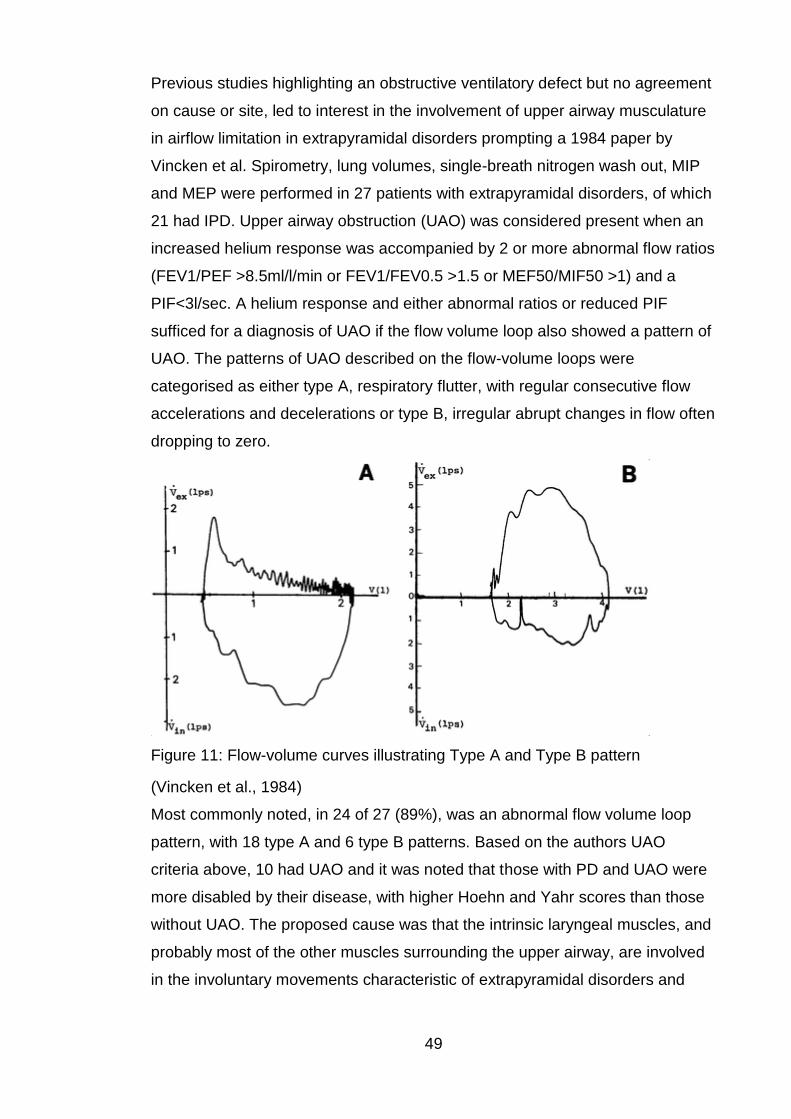
49
Previous studies highlighting an obstructive ventilatory defect but no agreement
on cause or site, led to interest in the involvement of upper airway musculature
in airflow limitation in extrapyramidal disorders prompting a 1984 paper by
Vincken et al. Spirometry, lung volumes, single-breath nitrogen wash out, MIP
and MEP were performed in 27 patients with extrapyramidal disorders, of which
21 had IPD. Upper airway obstruction (UAO) was considered present when an
increased helium response was accompanied by 2 or more abnormal flow ratios
(FEV1/PEF >8.5ml/l/min or FEV1/FEV0.5 >1.5 or MEF50/MIF50 >1) and a
PIF<3l/sec. A helium response and either abnormal ratios or reduced PIF
sufficed for a diagnosis of UAO if the flow volume loop also showed a pattern of
UAO. The patterns of UAO described on the flow-volume loops were
categorised as either type A, respiratory flutter, with regular consecutive flow
accelerations and decelerations or type B, irregular abrupt changes in flow often
dropping to zero.
Figure 11: Flow-volume curves illustrating Type A and Type B pattern
(Vincken et al., 1984)
Most commonly noted, in 24 of 27 (89%), was an abnormal flow volume loop
pattern, with 18 type A and 6 type B patterns. Based on the authors UAO
criteria above, 10 had UAO and it was noted that those with PD and UAO were
more disabled by their disease, with higher Hoehn and Yahr scores than those
without UAO. The proposed cause was that the intrinsic laryngeal muscles, and
probably most of the other muscles surrounding the upper airway, are involved
in the involuntary movements characteristic of extrapyramidal disorders and
50
airflow resistance is also exacerbated by contraction of upper airway muscles
out of phase of those with the chest wall (Vincken et al., 1984)
Tzelepis et al, 1988, identified the lack of studies looking at respiratory muscle
dysfunction and undertook a 9 person study in mild to moderate PD, with the
benefit of a control group. In this small study there was no evidence of
obstructive or restrictive dysfunction and it was concluded that while the
patients were able to perform single respiratory efforts well, demonstrating
normal lung volumes and MIP, they had problems performing repetitive
inspiratory resistive-loaded ventilatory efforts associated with an increased
oxygen cost of breathing and decreased efficiency compared to controls.
Proposed mechanisms included altered neural drive to the muscles, alterations
of muscle fibre composition and abnormal agonist-antagonist muscle activity
(Tzelepis et al., 1988).
Prior to 1989, studies had predominantly included patients with mild disease
which was highlighted by Hovestadt and Bogaard et al who studied pulmonary
function in 31 patients with more advanced disease, at least Hoehn and Yahr III.
They also excluded those with known lung disease or any structural upper
airway abnormality. All patients were on levodopa and anticholinergic drugs.
Interestingly, like the previous studies, there was heavy use of anticholinergic
drugs in the management of PD. This is no longer standard practice. They
reported a trend for most parameters to decrease with increasing Hoehn and
Yahr stage. Significant differences between the means of the groups were only
seen for the effort dependent variables of PIF, PEF, MIP and MEP, with MIP,
MEP, PEF and MEF50 significantly below normal values. Forced inspiratory
volume in 1 second, VC and FEV1/VC were relatively normal. This study was
reported in two different papers and there was some inconsistency in reporting
(Hovestadt et al., 1989, Bogaard et al., 1989). Both papers reported, according
to the classification by Vincken et al, 4 patients had a type A flow-volume curve,
however one paper reported 16 had a type B curve while the other reported 18
had a type B curve (Bogaard et al., 1989, Hovestadt et al., 1989, Vincken et al.,
1984). The reason for this inconsistency was not apparent. The authors
considered PIF, FEV1/PEF and MEF50/MIF50 to be indicators of UAO and
reported 9 patients had an abnormal value for 1 parameter, 8 patients 2 and 1
patient all 3 parameters (Hovestadt et al., 1989). They hypothesized that
muscle weakness and hypokinesia resulted in a lower and less explosive
51
muscle force which reflected the lower values of the effort dependent variables.
Upper airway obstruction was a prominent feature, type A curves were
assumed to be caused by tremor of the muscles of the upper airway and poor
co-ordination of ventilatory system muscles, whilst type B curves were
postulated to be predominantly due to muscle weakness (Bogaard et al., 1989,
Hovestadt et al., 1989).
The effect of Parkinson’s treatment on pulmonary function was considered in a
10 patient study by De Bruin et al in 1993. They assessed MIP, MEP,
spirometry and maximal inspiratory and expiratory flow volume curves, in PD
patients aged 42 to 60 years old, off treatment and repeated all measurements
on treatment with apomorphine. Although an unusual study in current times,
due to the young age of the participants and the dopaminergic medication of
choice being apomorphine, the study yielded interesting results. Treatment
improved neurological scores (modified Webster scale) however FVC off
treatment was 84% predicted and did not change with treatment. Despite the
relatively normal FEV1/FVC, only 2 of 10 patients had normal flow volume
curves with the most common abnormality, both on and off treatment, being the
increased volume expired before PEF achieved and absence of the sharp peak
and resultant rapid decline in maximum expiratory flow. Off treatment MIP, MEP
and PEF were all low with percent predicted values of 28.5%, 35.4% and 58.1%
respectively and PIF was also low at 3.83L/s. On treatment significant
improvements were seen in MEP (49.9% predicted) and PIF (4.37 L/s) and
moderate improvements were seen in MIP (37.9% predicted) and PEF (70.0%)
predicted. The study has to be interpreted with caution as there was no
exclusion if patients had pre-existing respiratory disease. The authors
concluded that PD patients have reductions in maximum flows and pressures
during maximal efforts and these difficulties are improved with dopamine
agonist treatment (de Bruin et al., 1993).
In 1994 Izquierdo-Alonso et al, undertook a larger study investigating pulmonary
function in 63 patients with PD with maximal inspiratory and expiratory flow
volume curves. There spirometric findings were in contrast to those found in
previous studies with 54 patients (85%) having a FEV1/FVC ratio equal to or
higher than 80% suggesting a restrictive element of pulmonary dysfunction.
They also noted some weak but significant correlations between PD scales
(UPDRS and Webster scales) and spirographic parameters, noting those with
52
more severe disease had lower FVC%, PIF and PEF and that those with motor
fluctuations and or dyskinesia had lower FVC% and FEV1%. Thirty one (49.2%)
had abnormal flow volume curves with 21 type A, 9 type B and 1 obstructive
and 3 patients had 2 or more spirometric indices (FEV1/PEF, FEV1/FEV0.5,
FEF50/FIF50) of UAO. Although the authors studied patients in Hoehn and
Yahr categories I-V, again the results need to be interpreted with caution as 29
patients were treated with pergolide which is known to cause pleuropulmonary
fibrosis which could show a restrictive pattern of spirometry. In addition the
authors used FEV1/FVC to define restriction rather than TLC which would give
far superior accuracy to results. Upper airway dysfunction and a restrictive
pattern were heralded as the defining results and it was speculated that the
restriction may be attributable to poor coordination or muscular rigidity limiting
forced respiratory movements and also reduction in pulmonary compliance due
to microatelectasias as a consequence of muscle dysfunction (Izquierdo-Alonso
et al., 1994).
In 1996 Sabate et al, published a study of 58 patients that further complicated
the picture of pulmonary dysfunction in PD by reporting a variety of
dysfunctions. They undertook spirometry, lung volumes, airway resistance by
body plethysmography, MIP and MEP in PD patients who had not received any
dopaminergic medication for 8 hours prior to testing. Based on 3 spirometric
indices (PIF <3 l/s, FEV1/PEF >8.5 l/min and MEF50/MIF50 >1) they reported
36 had evidence of UAO. Central obstruction or peripheral obstruction was seen
in 18 patients and restrictive dysfunction was noted in 16 patients. Restrictive
dysfunction was described as TLC <85% or FEV1/FVC >80% with FVC <80%,
however the authors failed to publish the number with TLC <85%. Interestingly,
they noted 16 patients had evidence of air trapping with RV >120% and RV/TLC
>40% and 7 patients had a TLC >120% suggesting lung insufflation. Maximal
inspiratory and expiratory mouth pressures were reduced and whilst FVC, FEV1
and FEV1/FVC% were all reported to be significantly below normal values the
group means for these spirometric indices were all above 81% of predicted. An
increase in the passive resistance to airflow (RAW) was also found,
bradykinesia was higher in those with UAO, rigidity higher in those with
obstruction and those with evidence of pulmonary dysfunction had evidence of
impact on scores of activities of daily living. In summary evidence was reported
that PD patients have a reduction in MIP and MEP and a high incidence of
53
restrictive and upper, central and peripheral obstructive patterns (Sabate et al.,
1996a, Sabate et al., 1996b).
Pulmonary rehabilitation is a widely accepted and successful therapy for
individuals with COPD with origins dating back to the middle of the 20th century
(Casaburi, 2008). With this in mind it is somewhat surprising that there has
been very little research on the effect of pulmonary rehabilitation in other
disorders including PD where there has been documented evidence of
pulmonary dysfunction. Koseoglu et al, 1997, with the knowledge that
ventilatory and upper extremity exercise programs enhance maximal ventilatory
capability and improve the effectiveness of ventilation during exercise,
assessed 9 PD patients’ pulmonary function and six-minute walk test (6MWT)
before and after a 5 week exercise training programme as part of a
comprehensive pulmonary rehabilitation programme (Koseoglu et al., 1997,
Ries, 1994, Celli, 1994). Nine normal age matched control subjects also
participated. The program comprised 60 minute sessions, 3 times per week for
5 weeks and included diaphragmatic breathing exercise, air-shifting techniques,
voluntary isocapnoeic hyperpnea and unsupported upper extremity exercise. At
baseline a spirometric restrictive defect was seen in 1 patient, obstructive defect
in 1 patient (who was also a smoker) and 4 patients had evidence of UAO as
judged by 2 spirometric indices (PEF and FEF50/FIF50). As may be expected,
statistically significant differences were seen between the PD group and the
control group on FVC, FEV1, FEF50, FEF25-75, MVV, PEF, PIF, IC, VC,
FEF50/FIF50 and 6MWT with all values being lower in the PD group. When
compared to baseline, a slight increase was seen at follow up in FVC, FEV1,
FEF50, FEF25-75, PEF, PIF, VC, ERV, TV and MVV and a slight reduction
seen in IC and respiratory rate, however these changes failed to reach
statistical significance. A statistically significant increase was seen however in
minute ventilation and 6MWT. Although the authors concluded this study
suggested that exercise training in PD could decrease ventilatory requirements
for a given workload, increase ventilatory muscle force and exercise tolerance
and improve the effort dependent spirometry variables and ventilatory pattern
during exercise, these results and conclusions should be interpreted with
caution given the small number of participants, 2 of whom did not complete the
study, and importantly the high use of anticholinergic medications which have a
54
large amount of systemic effects including on the respiratory system that can
result in bronchodilation (Koseoglu et al., 1997).
Following Koseoglu et al’s interest in the effect of upper extremity exercise on
pulmonary function, Canning et al, 1997, sought to determine if abnormalities in
respiratory function and gait affect exercise capacity. As part of this study they
undertook spirometry, flow volume loops, lung volumes and mouth pressures in
16 participants with PD, Hoehn and Yahr stages I – III. Individual
measurements of FEV1, FVC and FEV1/FVC were all normal and lung volumes
did not indicate any obstructive or restrictive patterns. In contrast to previous
studies, mean MIP and MEP were not significantly different to predicted values.
In support of previous studies, PIF was significantly reduced and every subject’s
flow volume loop had at least one abnormal characteristic of a rounded off PEF,
low PIF, high MEF50/MIF50 >1 and tremor. Ten patients fulfilled the criteria for
UAO with FEV1/PEF <8.5ml/L/min, MEF50/MIF50 >1 and a PIF <80% predicted
normal value. In this study the authors chose to use PIF<80% predicted normal
value rather than the more commonly used PIF <3L/sec in the identification of
UAO because they felt the latter failed to take into account variation in predicted
normal values caused by height and gender. Interestingly they noted that while
presence of UAO did not significantly correlate with percent predicted peak
oxygen consumption achieved on maximal exercise testing, percent predicted
PIF achieved did correlate with peak oxygen consumption. Noting the reduced
flow rates, notably PIF, respiratory muscle weakness is often thought to
contribute, however mouth pressures which were normal in this study provide
only a global indication of respiratory muscle strength and may be altered by
coordination of individual muscles. The authors concluded rather than weak
inspiratory muscles in particular, it was more likely that flow rates and MIP
would decrease because of poor coordination of respiratory muscles for a fast
forceful manoeuver (Canning et al., 1997).
In 1999, identifying that little research had looked at breathing patterns at rest in
PD, rather than forced manoeuvers, Vercueil et al undertook a small study, of
11 patients with IPD, focused on breathing patterns at rest both in the off state
and then in the on state after administration of levodopa. The study had a
number of limitations including size, akinetic rigid type patients only included
and a number of patients exhibiting dyskinesia in the on state. The amount of
ventilatory changes induced by levodopa varied massively among the patients,

55
however the most prominent effect on the pattern of breathing seemed to be an
increase in the inspiratory duration. All patients reported levodopa alleviated
any breathing discomfort. The authors concluded the larger change observed in
the inspiratory rather than the expiratory duration was due to levodopa
administration having more effect on those muscles with a high degree of
postural function for example the external intercostals (Vercueil et al., 1999).
These conclusions were reached based on the results of previous studies.
Electromyography (EMG) of respiratory muscles in PD showed that the
diaphragm exhibited a close to normal activity and other muscle showed a
continuous activity that could be related to parkinsonian rigidity thus arguing in
favour of unimpaired central respiratory rhythm generation (Petit and Delhez,
1961, Estenne et al., 1984). Findings by Rimmer et al, also supported this
conclusion that when activated by postural movements the internal intercostals
were strongly inhibited during inspiration but the external intercostals showed
increases in inspiratory activity above and beyond that for postural muscular
activity thus suggesting the internal intercostals (mainly active during expiration)
provide a more ventilatory than postural role but vice versa for the external
intercostals which have a more postural than ventilatory role (Rimmer et al.,
1995).
As recently as the last decade, Pergolide with the potential to cause pulmonary
fibrosis was still commonly used in the treatment of PD. In 2001 a study of
pulmonary function in 21 PD patients was published by Polati et al, however in
this study it has to be acknowledged that 15 of the 21 included were on
Pergolide and 6 were also ex-smokers. They hypothesized that spirometric
studies may serve as an indicator of patient’s neurophysiological conditions.
Spirometry was performed in 21 PD patients (Hoehn and Yahr I-III) and 16
healthy, age matched, non-smoker volunteers. Results showed 3 of 6 ex-
smokers and 2 of 15 non-smokers had obstructive ventilatory defects however
they defined this as FEV1/VC <89% predicted. They noted FEV1 and MEF25
were unsurprisingly decreased in the ex-smokers, however more noteworthy
that MVV, PEF and MEF75 were significantly lower in the non-smoker PD group
than the controls. There was a trend across the pulmonary function tests to
deteriorate with advancing disease state, as defined by Hoehn and Yahr, with
MVV best correlating with disease severity. Typically reduced in obstructive
disease, MVV is usually preserved in restrictive disease and can be used as an
56
indicator in neuromuscular disorders that impair the strength and endurance of
ventilatory muscles. Impairment of MVV in PD is likely as a result of
bradykinesia and rigidity of respiratory muscles impairing repetitive motor tasks
(Polatli et al., 2001).
With previous studies reporting a range in prevalence of UAO in PD and
conflicting reports from Obenour et al and De Bruin et al with regards to the
effect of dopaminergic medication on pulmonary function, Herer et al, 2001,
published a study investigating the effects of levodopa on pulmonary function
and specifically UAO. Spirometry and maximal inspiratory and expiratory flow
volume curves were performed in 21 PD patients, Hoehn and Yahr II-IV, age
range 52-89 years, 12 hours after withdrawal from anti parkinsonian drugs, then
repeated after administration of placebo or weight dependent Co-beneldopa.
The study was then repeated in all patients at 24 hours. The authors considered
UAO to be present if at least 4 of the following 6 criteria were present; curve
had a characteristic UAO saw-tooth sign, PIF <3L/s, FEV1/PEF >8.5mL/L/min,
FEV1/FEV0.5 >1.5, FEF50/FIF50 >1 and a PEF/FEF50 <2. At baseline UAO
was observed in 5 patients and after levodopa therapy 3 of these 5 no longer
met the authors’ criteria for UAO. Levodopa administration induced significant
variations in PEF and the UAO ratios of FEV1/PEF and FEV1/FEV0.5. This
study supported the hypothesis that levodopa improves lung function however
the study was small, used levodopa doses that may have been insufficient in
some patients and acknowledging that PEF measurements are subject to
variability they failed to specify reproducibility criteria (Herer et al., 2001).
A brief paper published in 2002 by De Pandis et al further supported the finding
of a restrictive pattern of pulmonary function in advanced PD. They performed
spirometry and arterial blood gases (ABG) in the on and off states of 12
individuals with PD staged at least Hoehn and Yahr III. The authors concluded
the spirometry results revealed a restrictive pattern in both the on and off states
and that ABG analysis revealed normal values for PaO2, PaCO2 and pH in both
the on and off states but a significant increase in PaCO2 was seen in the off
state (De Pandis et al., 2002). Although interesting, these results need to be
interpreted with caution for a number of reasons; TLC was not measured and
the presentation of the results in the publication in tabulated form did not include
any units and by postulating the units it could be interpreted that PaO2 was at
57
the lower end of normal and more importantly that the authors misinterpreted
their on state spirometry results and it did not truly show restriction.
A further publication in 2002 by Weiner et al, reported spirometry, respiratory
muscle strength and perception of dyspnoea in the on and off state of 20
individuals with PD, Hoehn and Yahr stages II-III and compared their results to
20 healthy, age and sex matched controls. They reported that predominantly
patients had spirometry data indicating a mild restrictive pattern and that the
mean FEV1 and FVC were not significantly different in the on and off states.
Similar to previous studies the MIP and MEP in the off state were significantly
reduced at 45% and 57% of predicted values respectively and although these
values tended to improve in the on state the results were not statistically
significant. Although using an uncommon technique to assess perception of
dyspnoea, this was increased in the off state and improved in the on state, but
despite this improvement those with PD reported more dyspnoea than controls.
Close correlation was noted only between MIP and perception of dyspnoea in
the off state. Although limited by size and technique, including no measurement
of TLC, this study highlights dyspnoea, the pathophysiology of which is poorly
understood. Weiner et al speculate that dyspnoea may be caused by a
mismatch between incoming afferent information from airways, lungs,
respiratory muscles and chest wall structure receptors and central respiratory
motor activity, which may be similar to the sensory-motor disparity in limb
muscles in PD (Weiner et al., 2002).
2002 brought a further publication of Brazilian data by Cardoso and Pereira.
They reported spirometry and respiratory muscle strength tests of 40 PD
patients, age 50 – 80, Hoehn and Yahr I-III, compared to 40 matched healthy
controls. In support of studies in the same year a predominantly restrictive
picture was reported noting a reduction in VC and FVC in the PD group,
however in contrast to other studies there was no difference in MIP and MEP
between the PD group and control group (Cardoso and Pereira, 2002). The
breakdown in numbers for each Hoehn and Yahr group were not stated thus if
predominantly early disease no difference in mouth pressures may have been
observed. Basing a diagnosis of restriction on FEV1 and FVC measurements
without measuring TLC, raises questions about the validity of data as poor
technique by the investigator or patient, or submaximal effort, can produce
results with FEV1 and FVC readings consistent with false positive restriction.
58
As part of a wider study into sleep breathing disorders in PD, Maria et al, 2003,
reported basic spirometry, MIP and MEP in 15 PD patients and 15 matched
healthy controls. FEV1, FVC and FEV1/FVC were normal in both groups,
however median values for MIP and MEP were significantly reduced, 55%
predicted and 45% predicted respectively, in the PD group (Maria et al., 2003).
The study did not exclude ex-smokers and also predominantly included those
with mild disease severity which the authors based on UPDRS scores, rather
than Hoehn and Yahr stage, which makes the study difficult to compare with
others.
Whilst not publishing exact figures, Haas et al’s 2004 study focussed on
respiratory muscle strength tests yielded interesting results. Respiratory mouth
pressures, activities of daily living, activity levels and quality of life
questionnaires, peak heart rate, peak oxygen consumption, lactate thresholds
and stages completed on a cycle ergometer test were recorded in 66
participants with PD and 32 age-matched healthy controls. Whilst MIP and MEP
were found to be significantly lower in the PD group this did not affect the
results of the questionnaires but did correlate with lactate thresholds and
ergometer stages completed. With an average Hoehn and Yahr stage of 2, this
study supported a weakness of respiratory muscles in mild to moderate PD,
which seemed to affect individuals during exercise but not during tasks that
required a smaller effort, for example activities of daily living (Haas et al., 2004).
The strength of skeletal muscles was not measured during this study and given
the positive findings at ergometer stages and lactate threshold, a contribution by
limb weakness cannot be excluded. Nonetheless, the results remain relevant as
previous studies have shown that whole body exercise training has the potential
to improve respiratory muscles, improving inspiratory muscle strength has
benefited other patient groups and athletes and can be safely done in patients
with neuromuscular disorders (Enright et al., Rutchik et al., 1998, Sánchez
Riera et al., 2001, Cahalin et al., 1997, McCool and Tzelepis, 1995, Koessler et
al., 2001, Powers and Criswell, 1996).
With this interest in inspiratory muscle training Inzelberg et al, 2005, measured
respiratory muscle strength and endurance, perception of dyspnoea and quality
of life in 20 PD patients, Hoehn and Yahr stages II-III. The patients were then
divided into 2 groups of 10, 1 group received 12 weeks of ½ hour, 6 times per
week specific inspiratory muscle training and the other group received sham
59
training. Significant improvements in inspiratory muscle strength, endurance
and perception of dyspnoea were seen only in the intervention group, MIP
increased from a mean of 62.0 to 78.0 cmH2O (Inzelberg et al., 2005). Despite
the small size of the study this highlights a potential role for inspiratory muscle
training in PD.
With the afore lack of clarity and conflicting reports on the effect of
dopaminergic medication on pulmonary function, Sathyaprabha et al,
researched this further in a study published in 2005. Spirometry, respiratory
muscle strength and MVV were performed in the off and on states (after
levodopa therapy) on 35 PD patients and 35 healthy age-matched controls. At
baseline they reported the PD group had significantly lower FEV1, FVC, PEF,
MVV, MIP and MEP compared to the controls and 33 of 35 PD patients showed
restrictive spirometry and 2 obstructive. Following administration of levodopa all
the above indices significantly improved (Sathyaprabha et al., 2005). The
results of this study, although supporting studies in the same era that the
predominant pattern of spirometric dysfunction was restrictive, need to be
interpreted with caution; lung volumes with TLC were not measured and hence
not contributory to a diagnosis of restriction, the mean age in the PD group was
only 53 and 32 patients were Hoehn and Yahr stage II and 3 stage I, thus
earlier disease than other studies. Although the authors felt the restrictive
pattern of pulmonary dysfunction demonstrated was probably due to abnormally
low chest wall compliance secondary to rigidity, I suspect that given the patient
demographics these results more likely represent a false positive finding of
restriction due to poor spirometry technique.
Previous studies had predominantly used spirometry alone rather than including
body plethysmography for assessment of lung volumes. A small study based in
Iran, Mikaelee et al 2006, undertook lung function testing including body
plethysmographic measurements of lung volumes in 25 PD patients, Hoehn and
Yahr I-V, mean age 63.8 ± 11.1 and compared to 20 control subjects. In the PD
group an obstructive pattern of respiratory dysfunction was found in 13 (52%)
and evidence of air trapping in 56% with a markedly raised RV. In contrast to
previous studies no evidence of restrictive spirometry was found and only 1 in
the PD group had evidence of UAO (based on abnormal PIF and FEV1/PEF).
Although there was a trend towards a correlation between increasing Hoehn
and Yahr scores and abnormal pulmonary function, this was not statistically
60
significant (Mikaelee et al., 2006). Despite use of this methodology, the small
numbers in the study and attempts to further sub analyse data based on each
Hoehn and Yahr group led to results lacking statistical significance.
An eminent American group in the field of speech and language therapy,
including authors Erin Silverman and Christine Sapienza, published a study on
mouth pressures in 2006 in 28 PD patients, mean age 64, Hoehn and Yahr
stages II-III. MIP was less impaired than MEP when compared to controls,
69.2% of MIP measurements were within or above normal as opposed to only
28.6% of MEP measurements being within normal range. Whilst their MEP
findings supported previous studies, their MIP findings contrasted. The authors
acknowledged potential difficulties in comparing studies including clinician
measurement technique and pharmacological differences, however
hypothesized interesting possible reasons for the apparent difference in the
responses of the inspiratory and expiratory muscles (Silverman et al., 2006).
The inspiratory and expiratory muscles assume different roles within the
breathing cycle; during tidal volume breathing the inspiratory muscles have
constant activation (e.g. the scalenes and parasternal intercostals are always
active during quiet breathing), however abdominal/expiratory muscles play less
of a role because expiration during tidal volume breathing is due to passive
recoil (De Troyer and Estenne, 1984). It is feasible that in the presence of
disease the inspiratory muscles may lose less strength than the expiratory
muscles due to baseline EMG activity of inspiratory muscles always being
greater than that of expiratory muscles during quiet breathing (Silverman et al.,
2006).
Members of the same group from the National Institute of Mental Health and
Neurosciences in Bangalore who published a 35 patient study in 2005, reported
a further study in 53 patients in 2007. Pal et al, assessed spirometry, MIP and
MEP in the off state and the on state (after levodopa administration) in PD
patients Hoehn and Yahr II-IV (predominantly stage II) with a mean duration of
PD of 3.1 years, as compared to 53 healthy age matched controls. They did not
publish if these participants included those from the previous study. Nineteen of
the PD group were smokers and 5 of the control group, with all smokers being
male. Whilst spirometry was measured with standardised commercially
available equipment, the pressure monitor used to measure MIP and MEP was
fabricated. They concluded the pattern of pulmonary dysfunction in the PD
61
group was restrictive however did not publish exact numbers and they noted a
significant impairment in FEV1, FVC, PEF, MVV, MEP and MIP in both the off
and on state in the PD group compared to the controls. All PFT parameters
improved with levodopa but remained worse than the control group.
Interestingly they recorded the percent predicted values of FVC, FEV1, MVV,
MIP and MEP to be significantly lower in women than men in the PD group only.
Although there were several correlations between PFT parameters and UPDRS
motor subscores these did not reach statistical significance likely due to the low
numbers in the study (Pal et al., 2007). Whilst an interesting study it was limited
by use of fabricated rather than standardised equipment, low numbers, lack of
lung volumes assessed by body plethysmography and over 35% of the group
being smokers.
A further 2 years passed without any significant publications pertaining to
pulmonary function in IPD. In 2009, Shaheen et al published a basic spirometry
study of 30 patients with IPD, mean age 67.7 years, mean disease duration 3
years, with 77% tremor dominant disease and 23% presenting mainly with
akinesia. Pulmonary function tests comprised FEV1 and FVC in the off and on
states (after levodopa) compared to a 15 participant age and sex matched
control group. They concluded, similar to Pal et al above, the pattern of
dysfunction was predominantly restrictive, with a restrictive defect observed in
19 (63.3%) and an obstructive defect observed in 5 (16.7%) of PD patients.
Thus 80% had abnormal spirometry and whilst they noted pulmonary function
parameters improved with levodopa treatment, the improvement did not reach
statistical significance (Shaheen H.A., 2009). Although supporting the findings
of studies conducted in proximity, the small numbers and simplicity of the study
unfortunately lessen its impact.
Identifying that respiratory involvement in PD could potentially occur through
more than one mechanism, i.e. peripheral or central, Seccombe et al undertook
a 19 patient study, published in 2011, to identify further evidence of abnormal
ventilatory control in PD. With the Braak hypothesis suggesting the earliest
evidence of the disease is in the medulla, enteric nervous system and olfactory
bulb then slowly spreading to the mid-brain and finally to the cortex, this raises
the question that medullary (brain stem) ventilatory control could be affected in
PD (Braak et al., 2004). Predominantly lung function studies have looked at
peripheral motor manifestations such as tremor or rigidity affecting lung function
62
rather than the effect brain stem involvement has on respiratory control.
Seccombe et al, measured spirometry, lung volumes (body plethysmography),
respiratory muscle strength, response to hypoxic gas inhalation and
hypercapnic ventilatory response and occlusion pressure in 19 patients with PD
in the on state. Normal lung function was observed in 16, mild airflow limitation
in 1 and 2 were restrictive based on TLC. No flow volume loops were consistent
with upper airway obstruction. MIP and MEP were reduced in 68% and 78% of
patients respectively. Four patients were unable to maintain an adequate seal to
complete the hypercapnic ventilatory response (which was abnormal in 47%)
and occlusion pressure (which was abnormal in 73%). Most subjects had
normal ABGs before and following the altitude simulation test. The authors
demonstrated impaired respiratory drive in response to hypercapnia and the
abnormal occlusion pressure response indicated central drive impairment,
however it has to be remembered that respiratory muscle myopathy may have
an inhibitory effect on this central measure and it is possible that reduced
respiratory muscle strength contributed in some way to the abnormal response
observed (Seccombe et al., 2011). While a comprehensive battery of tests were
undertaken in this study, the Hoehn and Yahr stages were I-III with 3
participants unclassified and the medication usage was very varied with 19
taking levodopa/carbidopa, 11 on dopamine agonists (9 pramipexole, 2
cabergoline, 1 overnight apomorphine), 10 on entacapone (COMT inhibitor), 2
on amantadine and 1 had undergone deep brain stimulation. With all these
variables and a small number of participants, the results are difficult to interpret.
In 2012 Guedes et el, published a limited study focussed on MIP and MEP in 26
patients with PD, age range 50 – 75, Hoehn and Yahr II-III compared to 26
gender age matched controls. The PD group had measurements in the on and
off states. In support of previous studies MIP and MEP in PD in both the on and
off states were lower than the control group. This failed to reach significance in
the female PD MIP results. In contrast to previous studies, with the exception of
PD female MEP results, any change in respiratory muscle strength in the on
and off states failed to reach statistical significance. Given their results that
dopamine replacement had little impact on the measured respiratory
parameters, the authors proposed that respiratory dysfunction in PD may be
unrelated to dopaminergic dysfunction (Guedes et al., 2012). I suspect this may
prove to be inaccurate with the original small number in the study and the
63
dichotomising of results in already small numbers leading to a lack of statistical
significance.
Finally, identifying the limited pulmonary function comparative data in PD and
healthy subjects, and even more limited data between different parkinsonian
disorders, Wang et al, 2014, compared spirometry, lung volumes (body
plethysmography), DLCO, MIP and MEP in PD, MSA and healthy subjects.
They tested 30 PD (mean age 61.8, mean disease duration 4.9 years), 27 MSA
(mean age 59.85, mean disease duration 3.63 years) and 20 healthy elderly
controls (mean age 60.85). Hoehn and Yahr stage was II-V for the PD group
and the MSA group comprised 20 probable and 7 possible MSA. Spirometry
showed a restrictive pattern in 56.7% of PD patients (63% MSA), central
obstructive in 3.3% PD (0% MSA) and peripheric obstructive pattern in 43.3% of
PD (29.6% MSA). Compared to controls, both PD and MSA groups had lower
VC and higher RV, while there were no significant differences in TLC between
the groups. In both the PD and MSA groups, VC, FEV1 and FVC decreased
and MIP and MEP decreased markedly. Interestingly DLCO was only notably
reduced in the MSA group. In PD patients, VC, FVC, FEV1, PEF, MIP and MEP
all negatively correlated with UPDRS-III motor section, concluding the more
seriously the patient is affected by motor symptoms, rather than the disease
duration, has the greater influence on pulmonary function (Wang et al., 2014).
When reviewing this study, the authors based the conclusion of restrictive
dysfunction in this Chinese PD population on the results of spirometric tests and
not TLC. From the graphical representation of TLC it would appear that the
mean percentage predicted TLC was above 80% in all groups which would
indicate an alternative conclusion. This study highlights the need for further
research into pulmonary function in all parkinsonian syndromes.
This comprehensive literature review of pulmonary function in PD, highlights the
small number of studies, with small numbers of participants and the disparity in
results and conclusions. Aside from the numbers involved, the reviewed studies
have a number of factors that must be taken into account; varying age groups,
different Hoehn and Yahr stages and varying definitions of PD. The selection of
antiparkinsonian medication used across the studies is vast, including a number
of drug groups, or individual drugs, that are no longer commonly used
predominantly due to their side effects. The studies reviewed did not
consistently use standardised equipment and definitions in pulmonary function
64
testing and presumably due to availability, the majority lacked measurement of
lung volumes by body plethysmography resulting in patterns of dysfunction
being determined by spirometry alone which can lead to interpretive errors
particularly in restrictive dysfunction. These findings highlight the need for
significant further research using gold standard techniques to assess pulmonary
function in PD and the parkinsonian syndromes.
2.4 Cardiorespiratory fitness
Cardiorespiratory fitness describes the ability of the circulatory and respiratory
systems to supply oxygen to muscles during sustained physical activity. The
system needs to be able to adapt and respond when demand increases, such
as during exercise. Exercise induces short term and long term effects on the
cardiorespiratory system. When exercise commences the pulmonary ventilation
needs to increase and the cardiovascular system is required to predictably
respond proportional to the skeletal muscle oxygen demands.
Pulmonary ventilation primarily increases due to stimulation of the respiratory
centres in the brain stem from the motor cortex and feedback from the
proprioceptors in the active muscles and joints. In normal untrained adults this
can range from 10L/min at rest to over 100L/min on maximal exercise and in
highly trained, large, male athletes over 200L/min at maximum (Manley, 1996).
Cardiac output (QT) is the volume of blood the heart pumps out in one minute
and is the product of the stroke volume (SV) ,which is the amount of blood
pumped out per beat, and the number of heart beats per minute (heart rate
(HR)) (Vincent, 2008). The arterial-venous oxygen difference (a-vO2 diff) is the
difference between the oxygen concentration of the arterial and mixed venous
blood (Manley, 1996). An individual’s aerobic capacity or maximum oxygen
uptake (VO2max) is a function of, and thus limited by, the ability of the
cardiovascular system to supply (QT) and/or the skeletal muscles to use (a-vO2
diff) oxygen (Manley, 1996, Jakovljevic et al., 2012b).
As work increases the QT increases in an almost linear pattern up to a
maximum. This occurs due to increases in HR and SV (Manley, 1996). Although
both HR and SV increase with exertion, the contribution to the increase QT is
much greater from the increase in HR particularly at high exertion
(Higginbotham et al., 1986). Maximal achievable heart rate
65
(HRmax) is related to age and although there are numerous prediction
equations, HRmax = 220-age is commonly accepted and used (Robergs and
Landwher, 2002). During exercise, blood flow changes with more blood being
sent to skeletal muscles, and as temperature rises to the skin. Mean arterial
pressure increases in response to exercise, predominantly due to a rise in
systolic blood pressure while diastolic blood pressure remains near resting
levels. In normotensive individuals systolic blood pressure rises linearly peaking
at maximum between 200 to 240 mmHg (Manley, 1996). After exercise, blood
pressure drops below pre-exercise resting levels in an aptly named
phenomenon called post-exercise hypotension. Whilst this mechanism is
caused largely by decreased vascular resistance many aspects remain
misunderstood (Halliwill et al., 2013). During increasing work the a-vO2 diff
increases as a result of increased oxygen extraction from arterial blood as it
passes through exercising muscle. Coronary blood flow increases during
exercise due to an increase in perfusion pressure of the coronary artery and
from coronary vasodilation (Manley, 1996).
While exercise produces short term responses to meet immediate demand,
exercise training produces long term adaptations. These adaptations are not
purely limited to cardiovascular, respiratory and skeletal muscles but also
include bone, metabolic and hormonal adaptations. The magnitude of these
adaptations depends on a number of factors including pre-exercise fitness level,
type of exercise programme, intensity and duration for example. After
endurance training, SV is increased at rest and during submaximal and maximal
exercise, whilst HR is decreased at rest and during submaximal exercise and
unchanged at maximal work rates. Training increases plasma volume and end
diastolic volume and results in more elastic recoil. Long term responses also
include hypertrophy of cardiac muscle fibres and reduction in blood pressure.
Respiratory adaptations with training are predominantly an increase in
pulmonary ventilation and an increase in pulmonary diffusion during maximal
exertion. Dependent on training modality, skeletal muscles undergo fiber
hypertrophy and hyperplasia and increased recruitment (Manley, 1996).
Endurance training also facilitates a greater capacity for blood flow in skeletal
muscles by increasing the numbers of capillaries (Prior et al., 2004).
The most widely accepted measure of cardiorespiratory fitness or aerobic
capacity is peak oxygen consumption (VO2peak). As alluded to above, although
66
VO2peak and VO2max are often used interchangeably there is an important
distinction in that VO2peak is the highest value achieved on a particular test
where as VO2max refers to the highest value that is considered to be attainable
by an individual.
2.4.1 Quantification of cardiorespiratory fitness
There are a number of commonly used surrogate measures of cardiorespiratory
fitness for example; the six minute walk test (6MWT), which is the distance an
individual covers when walking for 6 minutes on a measured track, the multi-
stage fitness test (also known as the beep test or pacer test) and motion
sensors. The gold standard measure of cardiorespiratory fitness is peak oxygen
uptake (VO2peak), usually measured during large muscle dynamic activity such
as running or cycling. Although the gold standard, this technique is not always
readily available as it requires trained operators and relatively expensive
equipment. The most common modalities for clinical testing are the treadmill or
cycle ergometer. Stationary cycle ergometers are particularly useful in groups
where use of the treadmill may be hazardous. Individuals with significant gait
abnormalities, including PD where problems can occur with freezing of gait, are
safer using a cycle ergometer. It has to be remembered that stationary cycling
may be an unfamiliar activity to some individuals and the exercise test may end
prematurely, usually due to localised leg fatigue, with resultant lower values in
VO2peak as compared to treadmill testing (Hambrecht et al., 1992, Myers et al.,
1991).
VO2peak is the most accurate measurement of functional capacity and an
indicator of overall cardiopulmonary health (ATS/ACCP, 2003). During an
exercise test, blood pressure and continuous electrocardiogram (ECG) and
expired gas composition, oxygen (O2) and carbon dioxide (CO2), are measured.
VO2max is achieved when oxygen consumption remains plateaued at a steady
state despite increasing workload. The exercise test protocol selected should
consider the purpose, outcomes desired, and characteristics of the group or
individual being tested, e.g. age, disease and symptomology (ACSM, 2010).
The most familiar and common protocol is the Bruce protocol for treadmill
testing which uses relatively large increments (metabolic equivalents (METS) or
watts) every 3 minutes. The Ellestad protocol also uses large increments, where
the Naughton or Balke-Ware protocols use smaller increments. With larger
67
increments changes in physiological response tend to be less uniform and
these protocols tend to be better suited to younger or more physically active
individuals. Protocols with smaller increments or alternative ramp protocols are
preferable for those who are older, deconditioned or with chronic diseases
(ACSM, 2010). Rather than incremental increases, in ramp protocols the work
rate increases in a constant and continuous manner (Kaminsky and Whaley,
1998, Myers et al., 1992, Myers et al., 1991). The increasingly popular ramp
protocols are advantageous as they avoid large unequal increments in
workload, there is uniform increase in haemodynamic and physiologic
responses, the protocol can be individualised and most importantly they offer
more accurate estimates of ventilatory thresholds and exercise capacity (Myers
et al., 1991). When an exercise test is completed, and the individual is in the
post exercise period, monitoring must continue for at least 5 minutes or until any
ECG changes return to baseline and any symptoms resolve and heart rate and
blood pressure return to near baseline (ACSM, 2010).
As discussed, whilst dependent on a number of factors, absolute VO2max
levels are typically higher in males than females. As a guide, an untrained
healthy male may have a VO2max of 35-40 ml/kg/min (Guyton and Hall, 2011).
The highest VO2max results tend to be seen in elite endurance sportspersons,
for example runners, rowers and cyclists, with values in the most elite
approaching 100ml/kg/min. To highlight these exceptional VO2max results in
the top elite athletes, thoroughbred racehorses exercising on an inclined
treadmill were recorded as demonstrating VO2max results of 131-153 ml/kg/min
(Rose et al., 1988).
While predominantly discussing VO2max, it is important to mention, as above,
the concept of metabolic equivalents or METS. One MET is the amount of
oxygen consumed sitting at rest and is equal to 3.5ml O2 per kg body weight
and as such, the energy cost of an activity can be calculated by dividing the
relative O2 cost of the activity in ml/kg/min by 3.5. The MET concept provides a
simple technique to describe functional capacity and with known energy
expenditure values, in METS and watt units, for household task and recreational
activities allows simple visual imagery of energy expenditure (Jette et al., 1990).
68
2.4.2 Cardiorespiratory fitness and ageing
Ageing, including in the absence of disease, is associated with a progressive
decline in cardiorespiratory fitness, or VO2max, and a resultant reduction in
capacity for physical activity. As an individual’s aerobic capacity or VO2max is a
function of, and thus limited by, the ability of the cardiovascular system to
supply (QT) and/or the skeletal muscles to use (a-vO2 diff) oxygen, it stands to
reason that ageing’s effects on these factors are causative in the decline. Until
late middle age, reduced cardiac output and possible maldistribution of cardiac
output play a dominant role in reductions in oxygen delivery (Betik and Hepple,
2008). As demonstrated by maximal heart rate prediction equations, maximal
heart rate achievable declines with age which contributes to decreased cardiac
output. Sarcopenia, a degenerative loss of skeletal muscle mass and strength,
is associated with ageing. Ageing, particularly extreme old age, is also
associated with a decline in skeletal muscle oxidative capacity, due in part to
mitochondrial dysfunction, but interestingly the structure of the capillary bed
does not appear to decline in a way that would affect the capacity for oxygen
diffusion (Betik and Hepple, 2008). Although a small study, and older subjects
having an average age of 58, Kim et al concluded muscle mass is associated
with VO2max however it appeared that VO2max was less influenced by muscle
mass in older subjects than in younger subjects (Kim et al., 2016).
Despite the effects of ageing, in older persons aerobic exercise training can
improve VO2max. This was demonstrated in a 41 trial meta-analysis of studies
including 2012 older subjects (within-group mean age of 60 years and older),
reporting greater improvement in VO2max to be associated with training length
greater than 20 weeks and intensity between 60-70% of VO2max (Huang et al.,
2005). With cardiorespiratory fitness associated with cardiovascular and all
cause mortality this highlights the protective benefits available by improving
aerobic capacity in older adults.
2.4.3 Cardiorespiratory fitness and neurodegenerative disease
Neurodegenerative disease is a somewhat umbrella term for a range of
diseases that affect the neurons. These include diseases such as PD,
Parkinson’s plus syndromes, Alzheimer’s, Amyotrophic Lateral Sclerosis (ALS),
Huntington’s, spinal muscular atrophy, spinocerebellar ataxias and prion
disease. Despite being grouped together, these disorders are markedly different
69
and affect cellular, physiological and cognitive function in different ways that all
may affect cardiorespiratory fitness. There is a body of evidence that suggests
physical activity and higher cardiorespiratory fitness levels can delay the onset
and reduce the morbidity associated with neurodegenerative diseases
(Scarmeas et al., 2011, Ahlskog, 2011, Archer et al., 2011).
Even in early stage ALS, with skeletal muscle mass similar to normal, research
demonstrates a reduction in VO2peak (Mezzani et al., 2012). In Alzheimer’s
type dementia (AD) cardiorespiratory fitness is lower than normal subjects,
including in early disease. Lower cardiorespiratory fitness in AD is associated
with progression of dementia severity and brain atrophy, indicating a link
between progression of dementia severity and cardiopulmonary health. In non-
demented subjects there is also a trend for lower aerobic capacity to be related
to cognitive decline (Vidoni et al., 2012).
The evidence, although vast, highlighting impaired cardiorespiratory fitness in
neurodegenerative disorders, also highlights the potential morbidity and
mortality benefits from improving cardiorespiratory fitness, particularly in
cognitive function which supports the neuroplasticity effects of exercise.
2.4.4 Cardiorespiratory fitness and Parkinson’s disease
Advancing PD and increased severity of disease are associated with reduced
physical activity and a more sedentary lifestyle. A recent review of exercise and
parkinsonism underlined the improvements pertaining to both the functional
deficits and neurological biomarker manifestations of the disorder and
concluded that physical exercise co-administered with antiparkinsonian
medication ought to contribute to an enrichment of aspects of functioning and
the quality of life of PD patients (Archer et al., 2011). The review however
mentioned little evidence of the effect of exercise on aerobic capacity in PD and
literature review has found this area to be lacking in high quality studies. A
number of studies used estimates of V02max, for example based on heart rate,
rather than actually measuring it, or used surrogate markers of aerobic capacity.
For a measure to be valid it needs to be reliable and repeatable in the proposed
subject population, thus a “gold standard” measure must be highly reproducible
in repeated measurements obtained from the same subject under the same
circumstances and must show little within-subject variation. Katzel et al,
measured VO2peak in 70 individuals with PD (Hoehn and Yahr stages 1.5 to 3)
70
on a maximal effort treadmill test. A second test was performed a week later in
all 70, and a further week later a third test was performed in 21. Their results
demonstrated measurement of VO2peak in PD was reliable and repeatable with
an intraclass correlation coefficient (ICC) of 0.90 for VO2 peak in ml/kg/min.
Maximum heart rate and final speed achieved were also highly reliable with
ICCs of 0.91 and 0.94 respectively. In their study population VO2peak values
were generally 20% lower than age-matched controls without PD tested in the
same laboratory (Katzel et al., 2011).
Given the pathophysiology of PD it would be reasonable to assume that aerobic
capacity would be lower in individuals with PD than in those without, however
the limited number of studies reporting VO2peak in PD have been mixed with
some reporting values similar to healthy matched controls (Canning et al., 1997,
Protas et al., 1996, Saltin and Landin, 1975, Stanley et al., 1999). Directly
comparing all studies is difficult due not only to the study population
demographics, but also that some studies used treadmill testing and others a
cycle ergometer. Protas et al, identified that aerobic capacity in PD had not
been characterised and undertook cycle ergometer and arm-cranking
ergometer tests in 8 men with PD (Hoehn and Yahr II-III) and 7 controls. They
reported no difference between the groups for VO2peak, and in both groups
VO2peak was lower for the arm-cranking test when compared to the lower
extremity test. Interestingly they commented that peakVO2 values for both
groups were comparable to maximal published values for cycle ergometer tests
in older men (Protas et al., 1996).
In 1997, Canning et al published exercise results of 16 patients with mild to
moderate PD. Thirteen men and 3 women, Hoehn and Yahr I-III, performed an
incremental exercise test to peak work capacity on an electronically braked
cycle ergometer. Similar to the results of Protas et al, they found VO2peak
values in subjects with PD were not significantly different to normal values.
While sedentary subjects produced lower VO2peak scores than exercising
subjects, there was no significant correlation between percent predicted
VO2peak and PD disease severity (Canning et al., 1997). When interpreting the
results of these studies, the small number of participants has to be
acknowledged. In contrast to the findings of Canning et al, an abstract
published in 2013, in a larger participant group, reported aerobic capacity in PD
was affected by rigidity, gait and posture (Sacheli et al., 2013). However very
71
little detail was included in the abstract about aerobic capacity and
measurements and it would appear the abstract has not further been expanded
and published as a paper.
In agreement with the afore mentioned studies, Stanley et al found no
significant differences in VO2max between those with PD and healthy controls
in their study population. They performed cycle ergometry on 20 individuals with
PD and 23 healthy controls. Interestingly however they did report that in
comparison of time those with PD were unable to exercise for as long before
reaching VO2max which may indicate that those with PD may be less efficient
during exercise and thus unable to exercise for as long (Stanley et al., 1999).
With a plethora of evidence focussed on the effect of exercise in PD on
outcomes such as cognition, quality of life and gait and balance, there is a
distinct paucity of research looking at the effect of exercise interventions on
aerobic capacity or VO2peak in PD. Bergen et al 2002, investigated the effect of
a 16 week aerobic exercise intervention on aerobic capacity and movement
initiation time for PD patients finding peak V02 scores significantly improved
post intervention, by 26%, as compared to the control group, but only 4 patients
(Hoehn and Yahr 2) completed the intervention (Bergen et al., 2002). Though
obviously a very small study, this does suggest that aerobic capacity in PD may
benefit from exercise interventions.
While investigating the safety and feasibility of a 3 month progressive treadmill
aerobic exercise programme for individuals with PD with gait impairment, 5
individuals underwent pre and post programme graded treadmill exercise
testing. The study subjects were a limited group with Hoehn and Yahr stage II
or above and presence of gait impairment (dragging a leg, freezing or
festination), and no change was found in VO2peak post intervention (Skidmore
et al., 2008). Similar to previous studies participant numbers were small.
Limitations to this study also include; the dependency of the participant group,
gait impairment and the exercise test modality. It should also be noted that a
number of falls or near misses were observed.
Shulman et al, compared the effects of 3 types of physical exercise on
VO2peak in individuals with PD. A total of 67 participants (Hoehn and Yahr I-III)
were recruited and randomised to 3 month interventions of one of; higher
intensity treadmill training, lower intensity treadmill training or stretching and
resistance exercise programmes. Pre and post intervention VO2peak was
72
measured via treadmill test. Despite a drop-out rate from the study of 19%, both
treadmill exercises improved VO2peak (7-8% increase, p<0.05) significantly
more than the stretching and resistance exercise group (Shulman et al., 2013).
Despite the limitations of this study, it does support the findings by Bergen et al
that aerobic exercise interventions can improve cardiorespiratory fitness in
individuals with PD.
This comprehensive review of aerobic capacity in PD highlights the paucity of
research of baseline aerobic capacity and also the effect of exercise
interventions to improve cardiorespiratory fitness in PD. Given the significance
of impaired aerobic capacity and the potential benefits of improvement, this
area warrants significant further research.
73
Chapter 3. Methods: Cross-sectional study; the pattern of
pulmonary dysfunction in idiopathic Parkinson’s disease
This project consisted of 2 distinct studies; a cross-sectional study focusing on
the pattern of pulmonary dysfunction in IPD, and a randomised control trial
(RCT) evaluating the effect of an exercise intervention on pulmonary function,
cardiorespiratory fitness and exercise capacity in idiopathic Parkinson’s
disease. These studies will be described separately. The studies were funded
by an innovation grant from Parkinson’s UK and a British Geriatrics Society SpR
start-up grant. The Newcastle and North Tyneside 1 Research Ethics
Committee reviewed the study application on 8th May 2012. Following minor
amendments, ethical approval was granted on 30th May 2012.
3.1 Participant recruitment
Participant recruitment commenced in August 2012. Individuals with IPD were
recruited from the Northumbria Healthcare NHS Foundation Trust Parkinson’s
Service, where over 700 patients are on the Northumbria database (though
some of these will not meet the Brain Bank Criteria for IPD, and will have other
causes of parkinsonism). The service covers a large geographical, mixed rural
and urban area in North-East England. Patients were approached in both
medical and specialist nurse clinics, and given verbal information and written
information sheets to take away (see appendices 9.1). The target recruitment
for the study was 100, larger than any previous studies of pulmonary function in
PD. Patients who were willing to participate, fulfilled all inclusion criteria and
with an absence of exclusion criteria were recruited to the study and asked to
sign a consent form (see appendices 9.2). The study consisted of 2 visits.
3.2 Inclusion criteria
Inclusion criteria for the study were:
Idiopathic Parkinson’s Disease by the UK PD Society Brain Bank
Criteria.
Hoehn and Yahr Stage I-IV.
Ability to provide written informed consent.
Aged 18 years or over.
74
3.3 Exclusion criteria
Exclusion criteria for the study were:
Other forms of Parkinsonism e.g. drug induced.
Significant medical conditions which would preclude lung function testing.
Pregnancy.
Recent diagnosis of a blood clot, deep vein thrombosis, pulmonary
embolism or myocardial infarction.
Unstable cardiac status, haemoptysis, pneumothorax, thoracic,
abdominal or cerebral aneurysm.
Recent eye, thoracic or abdominal surgery.
3.4 Study journey, assessments, questionnaires and outcome measures
After recruitment participants were booked to attend 2 visits at North Tyneside
General Hospital. Visit 1 took place in the Education Centre at North Tyneside
General Hospital and Visit 2, approximately 1 week later, in the Pulmonary
Function Department at North Tyneside General Hospital, Rake Lane, North
Shields, NE29 8NH. Transport was arranged if required and travel expenses
were reimbursed. Participants received no payment for participation in the
study.
At visit 1, consent was confirmed and an assessment document was completed.
The assessment included patient demographics, details of the patient’s PD, PD
medication, PD symptoms, respiratory symptoms, past medical history (PMH),
family history (FH), social history (SH), exercise history and general
examination. The Movement Disorders Society Unified Parkinson's Disease
Rating Scale (MDS-UPDRS), the Parkinson’s Disease Questionnaire (PDQ-39),
SCOPA-SLEEP questionnaire, Hospital Anxiety and Depression Scale (HADS),
Montreal Cognitive Assessment (MoCA) and an electrocardiogram (ECG) were
completed. Permissions were granted for use of all rating scales. At visit 2, full
pulmonary function tests were undertaken, with spirometry, lung volumes
(plethysmography), diffusion and respiratory muscle strength tests, Mouth
Pressures and Sniff Nasal Inspiratory Pressure (SNIP). Figure 12, below,
illustrates the patient journey.
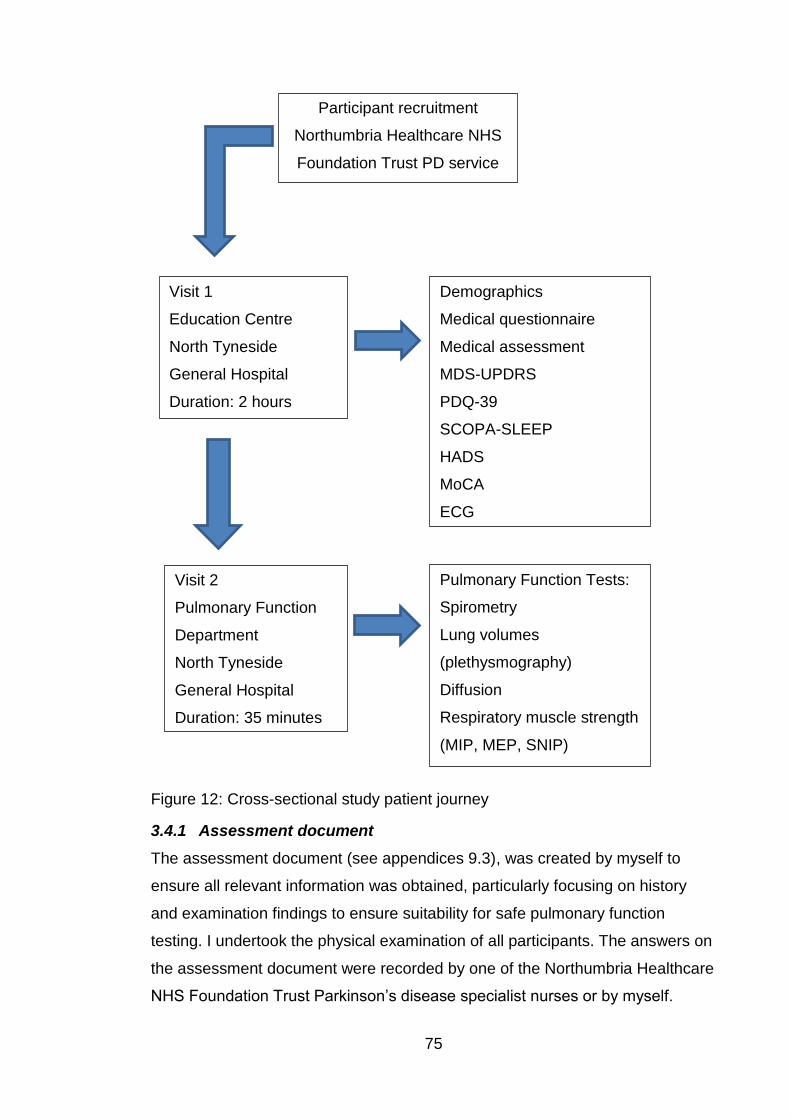
75
Figure 12: Cross-sectional study patient journey
3.4.1 Assessment document
The assessment document (see appendices 9.3), was created by myself to
ensure all relevant information was obtained, particularly focusing on history
and examination findings to ensure suitability for safe pulmonary function
testing. I undertook the physical examination of all participants. The answers on
the assessment document were recorded by one of the Northumbria Healthcare
NHS Foundation Trust Parkinson’s disease specialist nurses or by myself.
Participant recruitment
Northumbria Healthcare NHS
Foundation Trust PD service
Visit 1
Education Centre
North Tyneside
General Hospital
Duration: 2 hours
Demographics
Medical questionnaire
Medical assessment
MDS-UPDRS
PDQ-39
SCOPA-SLEEP
HADS
MoCA
ECG
Visit 2
Pulmonary Function
Department
North Tyneside
General Hospital
Duration: 35 minutes
Pulmonary Function Tests:
Spirometry
Lung volumes
(plethysmography)
Diffusion
Respiratory muscle strength
(MIP, MEP, SNIP)
76
Each participant was allocated a unique identification number and visit number
date, age, height and weight were recorded. Details about their PD were
obtained; disease duration since diagnosis, symptoms present at onset of PD
(bradykinesia, rigidity, tremor, postural instability), laterality of symptoms at
onset of PD, current anti-parkinsonian medication, dosage and date
commenced and any previous anti-parkinsonian medication used and when
discontinued. Accurate medication history was important to identify any
individuals who had been exposed to ergot derived dopamine agonists, for
example pergolide or cabergoline, due to the potential for these to cause
cardiac and pulmonary fibrosis and hence influence pulmonary function test
results. Participants were asked about the presence of symptoms that can be
associated with PD or PD treatment; hallucinations, REM sleep behaviour
disorder, anosmia and history of impulse control disorders. If participants had
undergone structural imaging (magnetic resonance imaging (MRI) or computed
tomography (CT)) or functional imaging (e.g. DaTSCAN) during their diagnostic
work up, the results of these were recorded.
Complete past medical and surgical history was documented and participants
were specifically asked regarding any history of cardiovascular disease, stroke,
transient ischaemic attacks, peripheral vascular disease, hypertension,
dyslipidaemia, diabetes, pulmonary disease, pneumothorax, haemoptysis, joint
problems, aneurysms, recent surgery, venous thromboembolism and any
chance of current pregnancy. Full medication history and allergy history was
documented. Family history was recorded, particularly focussed on
parkinsonism, PD, PD plus syndromes, tremor, neurological disorders, stroke,
malignancy and cardiac or pulmonary disorders.
Smokers were not excluded from the study, thus not restricting potential
numbers of participants, however the results were dichotomised to analyse
smokers and non-smokers separately. In view of this, smoking history was
careful documented, identifying if individuals were current, ex or never smokers,
and pack year history (which can also be calculated for tobacco rather than just
cigarette smokers). Social history (SH) was completed by recording of
occupations, exposure to pets and alcohol history. Detailed SH was important to
identify any factors which may increase risk of pulmonary disease such as
exposure to asbestos or birds (which can cause bird fancier’s lung, a type of
77
hypersensitivity pneumonitis). Exercise history was recorded including weekly
frequency, duration and type of exercise.
Finally participants were examined; cardiovascular, respiratory and
gastrointestinal systems, blood pressure, pulse and oxygen saturations were
recorded, and an ECG was performed.
3.4.2 MDS-UPDRS
The Movement Disorders Society Unified Parkinson's Disease Rating Scale
(MDS-UPDRS) is a validated PD rating scale that is used very commonly in PD
research and clinical practice. The MDS sponsored new version of the UPDRS
was developed in response to critique of the weaknesses and ambiguities of the
original UPDRS. The MDS-UPDRS is divided into four sections; Part I non-
motor experiences of daily living, Part II motor experiences of daily living, Part
III motor examination and Part IV motor complications. Part III is the only part
that is solely completed by the rater, at the end of which an assessment of
Hoehn and Yahr stage is made. The Hoehn and Yahr score from 0-V describes
the stage of PD objectively rated, where 0 is asymptomatic and V is wheelchair
bound or bedridden. Throughout the MDS-UPDRS, higher scores reflect worse
signs and symptoms (see appendices 9.4). Use of the MDS-UPDRS also
facilitates categorisation of patients into tremor dominant (TD) or postural
instability gait difficulty (PIGD) subtypes, based on formulas developed from
MDS-UPDRS scores (Stebbins et al., 2013). The MDS-UPDRS raters were
either myself or one of the Northumbria Healthcare NHS Foundation Trust
Parkinson’s specialist nurses, all of whom are trained in performing the rating
scale.
3.4.3 PDQ-39
The Parkinson’s Disease Questionnaire (PDQ-39) is a subjectively completed
quality of life questionnaire (Peto et al., 1995). A short form of the questionnaire,
the PDQ-8, is also validated for use (Jenkinson et al., 1997). The PDQ-39
provides a summary index score for the entire questionnaire and separate
scores across 8 domains or scales; mobility, activities of daily living (ADL),
emotional well-being, stigma, social support, cognitions, communication and
bodily discomfort (see appendices 9.4). In similarity to the MDS-UPDRS, higher
scores reflect worse symptoms. The PDQ-39 was selected for use in this study
for a number of reasons; it is validated; it is a MDS recommended scale for use
78
in PD; it is very commonly used in PD research thus allowing comparisons; it is
comprehensive and data exists on sensitivity to change of the PDQ-39 and
minimally important difference.
3.4.4 SCOPA-SLEEP
The SCOPA-SLEEP scale is a valid and reliable scale to quantify sleep issues
in PD. The SCOPA–SLEEP consists of two sections (night –time sleep
problems and daytime sleepiness) and an additional 7-point question as a
global measure of night time sleep quality. The night-time sleep problems
subscale includes; sleep initiation, duration, fragmentation, efficiency and early
wakening. The daytime sleepiness subscale includes frequency of falling asleep
unexpectedly in particular situations, having difficulty staying awake and
daytime sleepiness. As previously, higher scores reflect worse symptoms
(Marinus et al., 2003). The SCOPA-SLEEP scale was selected for use in this
study over other sleep scales due to it assessing both nocturnal sleep disorders
and daytime somnolence to a similar extent. For example the Parkinson's
Disease Sleep Scale (PDSS) can be used to obtain a profile about potential
causes of bad sleep, but is barely useful in the assessment of daytime
sleepiness (Martinez-Martin et al., 2008). The SCOPA-SLEEP is a subjectively
completed rating scale which is recommended by the MDS (see appendices
9.4).
3.4.5 HADS
Although prevalence rates of anxiety and depression in PD vary across studies,
it is widely acknowledged that rates are substantial (Pontone et al., 2009,
Reijnders et al., 2008). No PD specific rating scales of anxiety and depression
are commonly used. The Hospital Anxiety and Depression Scale (HADS) is a
14 item scale - 7 items relate to anxiety and 7 to depression. This outcome
measure was specifically developed to differentiate anxiety and depression from
common somatic symptoms of illness, for example fatigue or insomnia, thus
creating a tool for the detection of anxiety and depression in individuals with
physical health problems. Each item on the questionnaire is scored from 0-3,
thus a person can score up to 21 for either anxiety or depression (Snaith and
Zigmond, 2000). A systematic review of a large number of studies concluded a
cut-off point of 8/21 for diagnosis of anxiety or depression (Bjelland et al., 2002).
79
The HADS is a MDS recommended rating scale for use in individuals with PD
(see appendices 9.4).
3.5 Pulmonary function measurement
Participants attended the Pulmonary Function Department at North Tyneside
General Hospital. All testing was performed by qualified, experienced
respiratory physiologists accredited to the Association for Respiratory
Technology and Physiology (ARTP). The ARTP are the professional guardians
of physiological measurement in respiratory medicine in the UK and provide the
only national, professionally recognised, qualifications in respiratory function
testing and spirometry. They achieve this through standards of training and
quality assurance (ARTP, 2017). The variability in lung function measurements
can be very high, unless high-quality measurements, expertly trained staff and
high-quality assurance processes are in place, thus the decision to perform all
testing with respiratory physiologists to ensure gold standard testing. All
equipment used was regularly calibrated according to guidelines.
Before testing commenced all patients had height and weight recorded, to
enable calculation of Body Mass Index (BMI). If standing height could not be
measured easily, for example due to severe kyphoscoliosis, arm span was
measured instead, which is normal practice in these circumstances. Smoking
history and use of inhalers the same day was also documented.
When performing PFTs, dynamic studies (spirometry, flow volume loops, peak
expiratory flow rates) are performed first followed by lung volumes and diffusion
capacity (Ranu et al., 2011). Respiratory muscle strength testing is performed
subsequently. Interpretation of PFTs is based on comparisons of data with
reference (predicted) values. The European Community for Coal and Steel
(ECCS) have published comprehensive listings of reference equations which
were used in this study (Quanjer et al., 1993). Medisoft’s BodyBox 5500 was
used for measurement of spirometry, lung volumes and diffusion. Micro
Medical’s MicroRPMTM respiratory pressure meter was used for respiratory
muscle strength testing. In association with the BodyBox 5500, the computer
software used was Medisoft Expair 2010, 1.29, 13. All equipment met the
specification standards of the ATS and ERS.
All procedures were explained before and during the testing and
encouragement during testing is important to achieve optimal accurate results.
80
Test procedures followed the recommendations of the BTS and the ARTP
publication on guidelines for the measurement or respiratory function
(ARTP/BTS, 1994).
3.5.1 Spirometry
Participants were tested in an upright sitting position and wearing a nose clip.
The spirometer was fitted with a bacterial filter. The participant then sealed their
mouth around the mouthpiece of the spirometer and breathed in and out
normally for the measurement of tidal volumes (TV). Relaxed or slow vital
capacity (VC) was measured next; the patient was instructed to breathe in as
deeply as possible (to full inspiration), seal the lips tightly around the
mouthpiece and then breathe out into the spirometer at a sustained,
comfortable speed to full expiration. For VC the best result was recorded from a
maximum of 4 tests.
Forced expiratory volume in 1 second (FEV1), forced vital capacity (FVC) and
flow volume curves were measured next. The equipment was able to measure
the maximal flow volume curve, FEV1, FVC and PEF using the same expiratory
manoeuvre, however to facilitate reader understanding of the technique I shall
describe these separately starting with FEV1 and FVC measurement. The
participant was instructed to breathe in to maximal inspiration then form a tight
seal with the lips around the spirometer mouthpiece and breathe out as hard
and fast as possible until no further air could be exhaled. A maximum of 8 tests
were done to achieve 3 reproducible tests. Three valid, or technically
acceptable tests, should have FEV1 and FVC highest values within 5% or
100mls. The highest FEV1 and FVC, which did not have to come from the same
test, were selected for reporting. Potential sources of errors which would lead to
a test being rejected included; leak at the mouth, not inspiring to TLC, tongue or
false teeth obstructing mouthpiece, poorly coordinated start to the manoeuvre,
coughing and sub-maximal effort (ARTP, 2003).
Peak expiratory flow (PEF) was measured as part of the forced expiratory
manoeuvre used to measure FEV1 and FVC, and the highest value which
correlated with the highest FEV1 was recorded. The maximal flow volume
curves measurement technique is largely to similar to that described above. A
nose clip is essential and the participant was asked to breathe in to full
inspiration and then seal lips tightly around the mouth piece and blow out as
81
hard and fast as possible until the lungs were empty and then breathe in as
hard and fast as possible until the lungs were completely full again. Criteria for
test acceptability was as for FEV1 and FVC testing, and the flow volume curve
was visibly displayed for inspection. Values for maximum expiratory flow (MEF)
and maximum inspiratory flow (MIF) were recorded from these curves.
3.5.2 Lung volumes
Lung volumes were measured using whole body plethysmography in a constant
volume box. This technique, discussed in section 2.3.4, was described by
Dubois et al, and later reviewed in an ERS/ATS workshop series (Dubois et al.,
1956, Coates et al., 1997). Boyle’s law (pressure x volume = constant) is the
fundamental basis for its operation (ARTP, 2003). The patient was enclosed in
an airtight box, the door was shut and temperature and pressure were allowed
to stabilise. A pneumotachograph at the mouth allowed measurement of airflow
and a shutter was used to occlude the airway during the testing when required.
Pressure was measured in the box and at the mouth by pressure transducers.
When respiratory efforts continue and the mouthpiece is occluded, changes in
the box pressure reflect rarefaction and compression of gas within the thorax
and can be used to calculate thoracic gas volume (TGV) (ARTP, 2003).
The procedure was clearly explained as breathing against a closed shutter can
be an unusual feeling for patients. With a nose clip insitu, the patient was
attached to the mouthpiece and was asked to breathe normally. The shutter
was closed at the end of a tidal expiration and the patient was asked to
pant/breathe gently against the shutter (approximately 1 breath per second).
The shutter was reopened and the patient was asked to breathe fully in to
maximal inspiration and then fully out (relaxed or slow VC). This recorded
inspiratory vital capacity (IVC) and expiratory reserve volume (ERV). The
computer software then applied a line of best fit for calculation of total lung
capacity (TLC) and residual volume (RV). The procedure was repeated to
ensure reproducibility and when this was achieved, with 2 functional residual
capacity (FRC) recordings within a 5% match, the mean of the 2 was calculated
and recorded.
Unlike other lung function tests, there is no maximum number criteria for
attempts as lung volume measurement is less effort dependent. Individuals with
82
severe airflow limitation may tire however. Due to the technique, sources of
error with whole body plethysmography are very few (ARTP, 2003).
3.5.3 Diffusion
The gas exchange characteristics of the lungs were assessed by measuring
Transfer factor for carbon monoxide (TLCO), by the single breath breath-hold
technique. This has to be done after measurement of VC as this figure is
required for the procedure. The apparatus consisted of an industrial gases
cylinder with the gas mix in, an inspiratory start bag and a bag to collect the
expired sample. The cylinder (BOC) contents at the start of the test were carbon
monoxide (CO) 0.28%, helium (He) 14%, oxygen (O2) 18% and nitrogen
balance. The inspiratory start bag (1.8L) was filled with the test gas and
composition analysed by the machine. Volumes could be reduced in patients
with small lung volumes.
With a nose clip insitu, the patient was connected to the system via a
mouthpiece. The patient was instructed from RV (having breathed out as far as
possible), to take a sharp breath in and maximally inhale as far as possible. For
a valid reading the patient had to inspire >85% of VC. The patient was then
asked to breath hold for 10 seconds (should not be less than 6 seconds) and
then breathe out slowly, as far as possible, to maximal expiration into the
expired sample bag. Of note it is more important to inspire >85% VC than
breath hold for 10 seconds for valid results. During the exhalation, the initial
portion (washout) from the anatomical and instrument deadspace was
discarded to ensure that sample is representative of alveolar gas (ARTP, 2003).
The gas concentrations in the expired bag were then analysed and compared to
the inspired bag to calculate TLCO and hence gas exchange characteristics.
A maximum of 5 attempts (due to carbon monoxide) were performed, with the
aim to produce 2 reproducible TLCO results within 5% of each other. At least 4
minutes was left between attempts. The recorded results were a mean of the 2
best results. If TLCO was not reproducible within 5%, the best was recorded
and a comment made. Diffusion results were reported for assumed
haemoglobins and correction equations were done for those participants with
documented recent haemoglobin results.
83
3.6 Respiratory muscle strength
Respiratory muscle strength was measured using a hand-held respiratory
pressure meter, the Micro Medical MicroRPMTM. The MicroRPM was used to
measure the maximal expiratory pressure at the mouth (MEP), the maximal
inspiratory pressure at the mouth (MIP) and the sniff nasal inspiratory pressure
(SNIP). There was no set amount of maximal tests and the tests were repeated
until 3 were reproducible within 10%. The best result was recorded. Nose clips
are not used during respiratory muscle strength testing.
To assess MEP, the expiratory valve, the bacterial filter and the rubber
mouthpiece were attached. The meter was put in “MIP/MEP” function. The
patient was requested to inhale maximally (to TLC), put the mouthpiece with the
bite blocks between the teeth and the lips over the flange and then blow out as
hard as possible.
To assess MIP, the inspiratory valve, the bacterial filter and the rubber
mouthpiece were attached. The meter was put in “MIP/MEP” function. The
patient was instructed to exhale maximally, until the lungs felt empty (RV), and
with mouthpiece as before, then take a fast, as hard as possible, breath in.
To assess SNIP, the nasal plug adaptor and appropriately sized nasal probe
were attached to the MicroRPM. The meter was put in “SNIP” mode. The nasal
probe was inserted into one nostril, with the patient supporting the probe. At the
end of a normal breathing cycle, the patient was asked to perform a short sharp
sniff with as much effort as possible. The other nostril was not occluded during
the procedure. Each nostril was tried once and then the nostril that achieved the
highest result was repeatedly used until 3 results were reproducible within 10%.
Results for MIP and MEP reflect the highest value maintained over 1 second, as
opposed to SNIP which records the highest value.
Respiratory muscle strength testing concluded the pulmonary function tests.
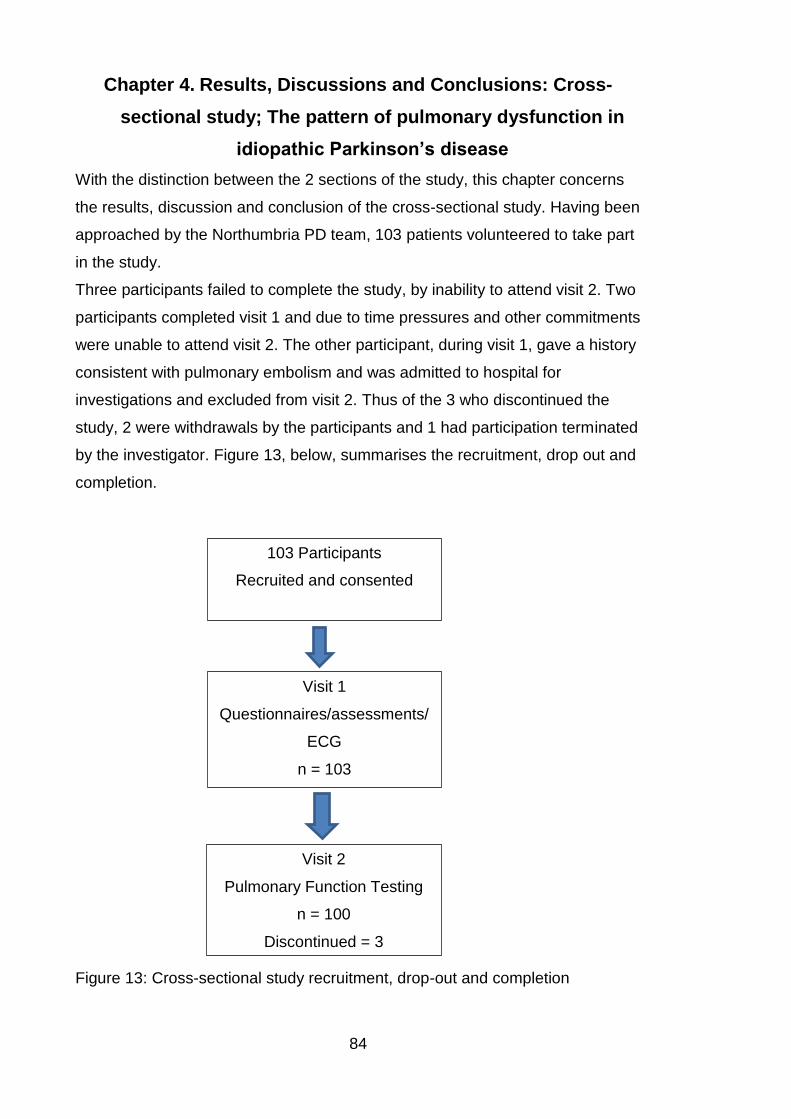
84
Chapter 4. Results, Discussions and Conclusions: Cross-
sectional study; The pattern of pulmonary dysfunction in
idiopathic Parkinson’s disease
With the distinction between the 2 sections of the study, this chapter concerns
the results, discussion and conclusion of the cross-sectional study. Having been
approached by the Northumbria PD team, 103 patients volunteered to take part
in the study.
Three participants failed to complete the study, by inability to attend visit 2. Two
participants completed visit 1 and due to time pressures and other commitments
were unable to attend visit 2. The other participant, during visit 1, gave a history
consistent with pulmonary embolism and was admitted to hospital for
investigations and excluded from visit 2. Thus of the 3 who discontinued the
study, 2 were withdrawals by the participants and 1 had participation terminated
by the investigator. Figure 13, below, summarises the recruitment, drop out and
completion.
Figure 13: Cross-sectional study recruitment, drop-out and completion
103 Participants
Recruited and consented
Visit 1
Questionnaires/assessments/
ECG
n = 103
Visit 2
Pulmonary Function Testing
n = 100
Discontinued = 3
85
Results were inputted by a research assistant and second checked by myself.
Only very few data points were missing from the entire dataset of the cross-
sectional study (3 participants had some answers missing from the PDQ-39, 2
had answers missing from the HADS and 1 had answers missing from the
SCOPA-SLEEP). As a consequence no attempt was made to impute the
missing values and the data are presented as collected. Where data are
missing they have been listed. As such missing data have been assumed to be
missing completely at random and so non-informative. The data from both
groups were not normally distributed, on review of histograms, as such medians
and interquartile ranges are quoted and non-parametric tests (Mann-Whitney U
tests) were used to analyse the unpaired data. Visual inspection of the data
distribution using histograms was used for assessing normality. The statistical
normality tests are auxiliary to the graphical assessment. Statistical tests have
the advantage of making an objective normality assessment, but are
disadvantaged by sometimes lacking sensitivity at low sample sizes (having
little power to reject the null hypothesis and thus passing normality tests) or
being overly sensitive to large sample sizes (significant results derived even in
the case of a small deviation from normality) (Ghasemi and Zahediasl, 2012). In
cases where there was any discrepancy in the distribution on visual inspection,
the statistical Kolmogorov-Smirnov test of normality was used. For categorical
data, e.g. male or female, Chi-square test was used. Alpha was set at 0.05.
4.1 Demographic features
Smokers and those with known obstructive lung disease, for example asthma or
COPD, were not excluded from the study. However the results were
dichotomised and analysed as 2 separate groups. One group was termed
“smokers” and included any individual with a known history of obstructive lung
disease and those who had a 10 pack year or greater smoking history. The
other group were termed “non-smokers” and included any participant without
known lung disease, lifelong non-smokers and those with a smoking history of
less than 10 pack years. The term “pack year” is a widely used quantification of
a person’s smoking history to measure tobacco exposure. One pack year is
equivalent to smoking 20 cigarettes per day for 1 year, thus if an individual
smoked 40 cigarettes a day for 10 years they would have a 20 pack year
smoking history.
86
The results were dichotomised to avoid any false positive results as the
prevalence of obstructive pulmonary function test results would be expected to
be higher in the “smokers”. Table 4, below, illustrates a comparison of the basic
demographics between the 2 groups (non-smokers and smokers). There were
64 in the non-smokers group and 36 in the smokers group. The smokers and
those with known obstructive lung disease group comprised 20 smokers with a
history of 10 or more pack years (but without a known diagnosis of obstructive
lung disease), 13 with a diagnosis of asthma and 3 with a diagnosis of COPD.
The 3 with COPD all had pack year histories over 10 years. Of the 13 with a
past medical history of asthma, 3 had pack year histories over 10 years also, 3
had smoking histories of less than 10 years and 3 were not prescribed any
inhalers at all. The participants were asked if they had ever been given a
diagnosis of asthma but were not asked how the diagnosis was made, thus it
has to be remembered that there is a possibility of historically incorrect
diagnoses of asthma particularly if spirometry with reversibility testing has not
been accurately performed by trained individuals. Thus 26 of the 36 in the
smokers group had a smoking history of 10 or more pack years.
Particularly in a research setting it is difficult to interpret results and make
comparisons when patients are on a number of different medications and at
different doses. To address this issue, Tomlinson et al calculated conversion
factors for different antiparkinsonian drugs to give a total daily levodopa
equivalent dose (LED). They undertook a systematic review of studies
identifying 56 primary reports of LED estimates, extracted data, calculated
modal and mean LEDs and derived a standardised LED for each
antiparkinsonian drug. The conversion factor for each drug was to have the
same antiparkinsonian effect as 100mg of levodopa. Thus for immediate
release levodopa the conversion factor was x1, controlled release levodopa
x0.75, Duodopa x1.11, Pramipexole (as salt) x100, Ropinirole x20, Rotigotine
x30, Selegiline (oral) x10, Rasagiline x100, Amantadine x1, Apomorphine x10
and Entacapone was levodopa x0.33 (Tomlinson et al., 2010). This formula was
used to calculate LEDs in this study making it comparable to other large studies
including PD MED and PD SURG.
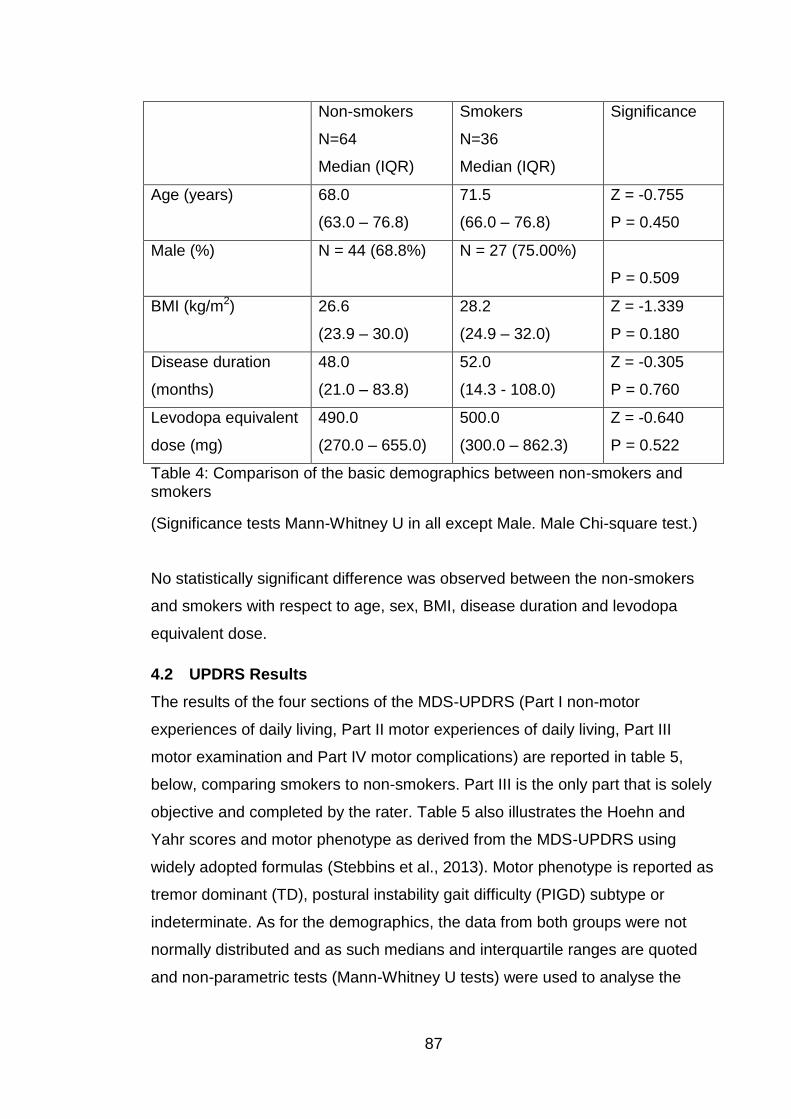
87
Non-smokers
N=64
Median (IQR)
Smokers
N=36
Median (IQR)
Significance
Age (years) 68.0
(63.0 – 76.8)
71.5
(66.0 – 76.8)
Z = -0.755
P = 0.450
Male (%)
N = 44 (68.8%) N = 27 (75.00%)
P = 0.509
BMI (kg/m2)
26.6
(23.9 – 30.0)
28.2
(24.9 – 32.0)
Z = -1.339
P = 0.180
Disease duration
(months)
48.0
(21.0 – 83.8)
52.0
(14.3 - 108.0)
Z = -0.305
P = 0.760
Levodopa equivalent
dose (mg)
490.0
(270.0 – 655.0)
500.0
(300.0 – 862.3)
Z = -0.640
P = 0.522
Table 4: Comparison of the basic demographics between non-smokers and smokers
(Significance tests Mann-Whitney U in all except Male. Male Chi-square test.)
No statistically significant difference was observed between the non-smokers
and smokers with respect to age, sex, BMI, disease duration and levodopa
equivalent dose.
4.2 UPDRS Results
The results of the four sections of the MDS-UPDRS (Part I non-motor
experiences of daily living, Part II motor experiences of daily living, Part III
motor examination and Part IV motor complications) are reported in table 5,
below, comparing smokers to non-smokers. Part III is the only part that is solely
objective and completed by the rater. Table 5 also illustrates the Hoehn and
Yahr scores and motor phenotype as derived from the MDS-UPDRS using
widely adopted formulas (Stebbins et al., 2013). Motor phenotype is reported as
tremor dominant (TD), postural instability gait difficulty (PIGD) subtype or
indeterminate. As for the demographics, the data from both groups were not
normally distributed and as such medians and interquartile ranges are quoted
and non-parametric tests (Mann-Whitney U tests) were used to analyse the
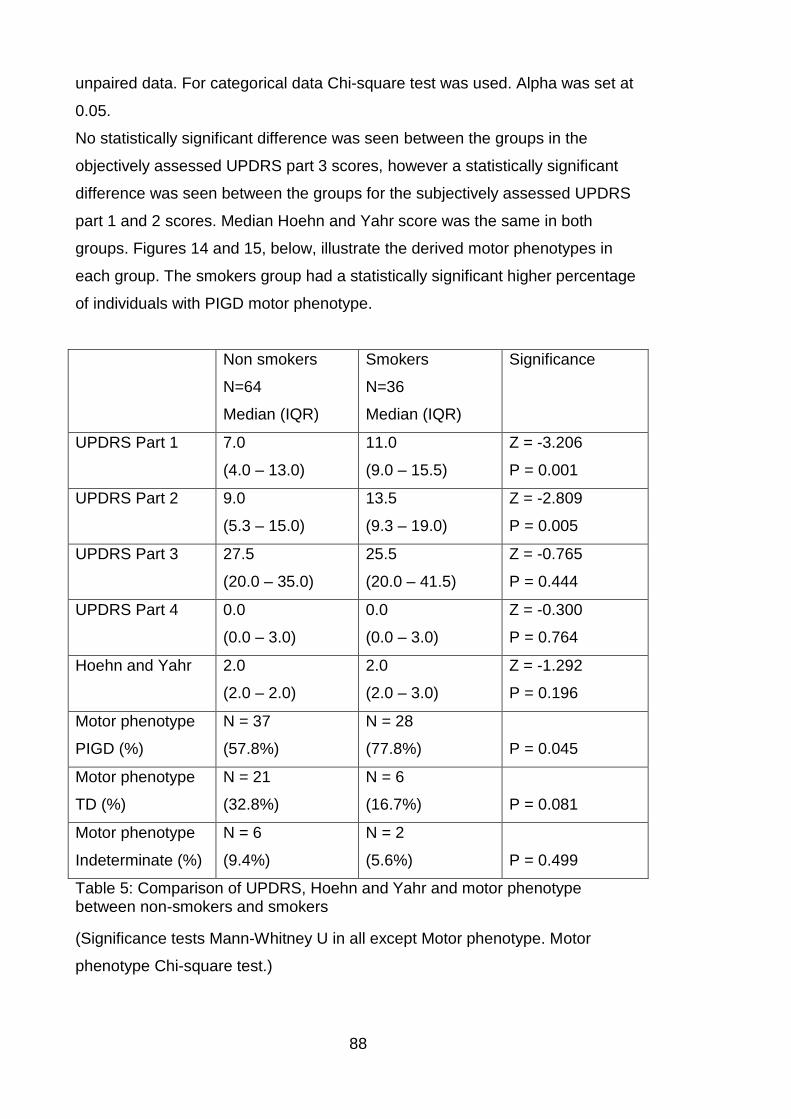
88
unpaired data. For categorical data Chi-square test was used. Alpha was set at
0.05.
No statistically significant difference was seen between the groups in the
objectively assessed UPDRS part 3 scores, however a statistically significant
difference was seen between the groups for the subjectively assessed UPDRS
part 1 and 2 scores. Median Hoehn and Yahr score was the same in both
groups. Figures 14 and 15, below, illustrate the derived motor phenotypes in
each group. The smokers group had a statistically significant higher percentage
of individuals with PIGD motor phenotype.
Non smokers
N=64
Median (IQR)
Smokers
N=36
Median (IQR)
Significance
UPDRS Part 1
7.0
(4.0 – 13.0)
11.0
(9.0 – 15.5)
Z = -3.206
P = 0.001
UPDRS Part 2
9.0
(5.3 – 15.0)
13.5
(9.3 – 19.0)
Z = -2.809
P = 0.005
UPDRS Part 3
27.5
(20.0 – 35.0)
25.5
(20.0 – 41.5)
Z = -0.765
P = 0.444
UPDRS Part 4
0.0
(0.0 – 3.0)
0.0
(0.0 – 3.0)
Z = -0.300
P = 0.764
Hoehn and Yahr
2.0
(2.0 – 2.0)
2.0
(2.0 – 3.0)
Z = -1.292
P = 0.196
Motor phenotype
PIGD (%)
N = 37
(57.8%)
N = 28
(77.8%)
P = 0.045
Motor phenotype
TD (%)
N = 21
(32.8%)
N = 6
(16.7%)
P = 0.081
Motor phenotype
Indeterminate (%)
N = 6
(9.4%)
N = 2
(5.6%)
P = 0.499
Table 5: Comparison of UPDRS, Hoehn and Yahr and motor phenotype between non-smokers and smokers
(Significance tests Mann-Whitney U in all except Motor phenotype. Motor
phenotype Chi-square test.)
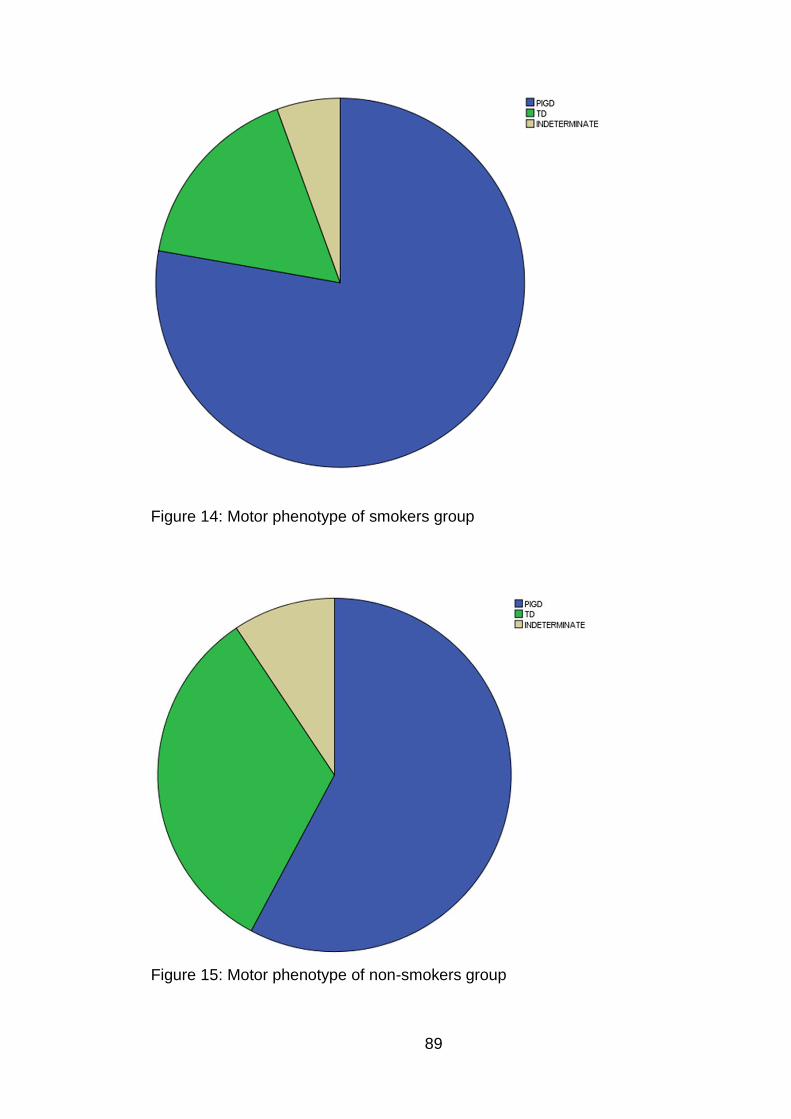
89
Figure 14: Motor phenotype of smokers group
Figure 15: Motor phenotype of non-smokers group
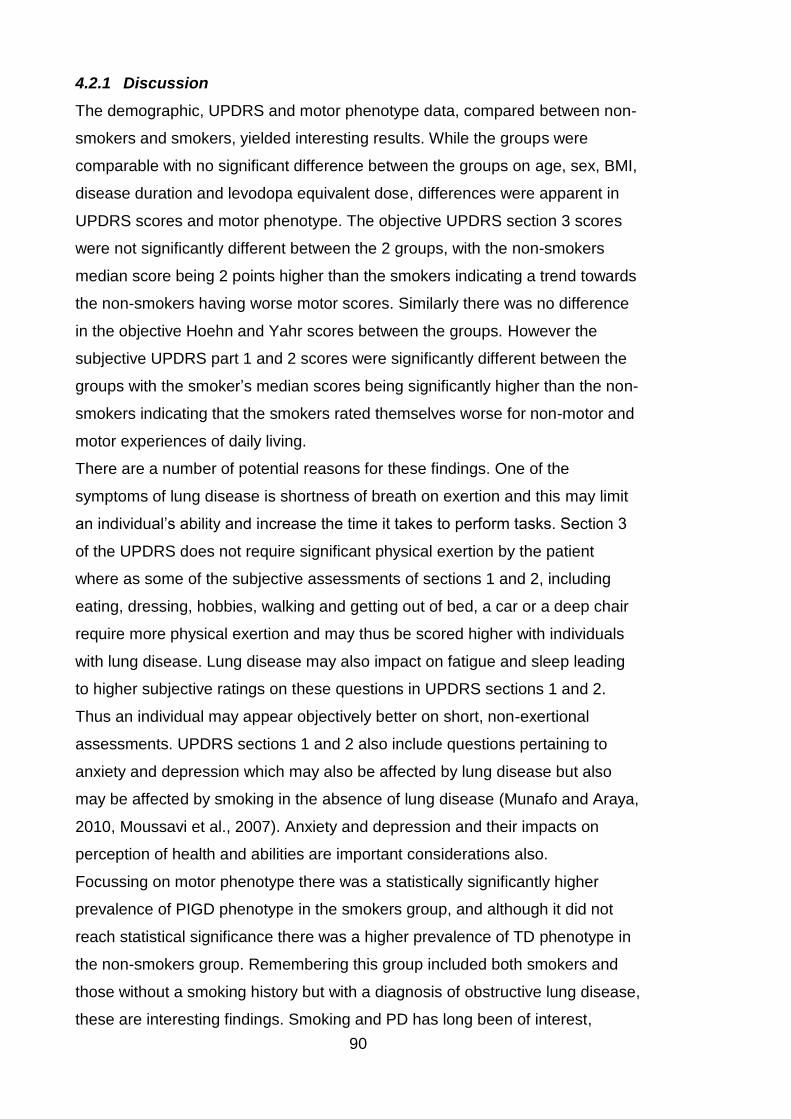
90
4.2.1 Discussion
The demographic, UPDRS and motor phenotype data, compared between non-
smokers and smokers, yielded interesting results. While the groups were
comparable with no significant difference between the groups on age, sex, BMI,
disease duration and levodopa equivalent dose, differences were apparent in
UPDRS scores and motor phenotype. The objective UPDRS section 3 scores
were not significantly different between the 2 groups, with the non-smokers
median score being 2 points higher than the smokers indicating a trend towards
the non-smokers having worse motor scores. Similarly there was no difference
in the objective Hoehn and Yahr scores between the groups. However the
subjective UPDRS part 1 and 2 scores were significantly different between the
groups with the smoker’s median scores being significantly higher than the non-
smokers indicating that the smokers rated themselves worse for non-motor and
motor experiences of daily living.
There are a number of potential reasons for these findings. One of the
symptoms of lung disease is shortness of breath on exertion and this may limit
an individual’s ability and increase the time it takes to perform tasks. Section 3
of the UPDRS does not require significant physical exertion by the patient
where as some of the subjective assessments of sections 1 and 2, including
eating, dressing, hobbies, walking and getting out of bed, a car or a deep chair
require more physical exertion and may thus be scored higher with individuals
with lung disease. Lung disease may also impact on fatigue and sleep leading
to higher subjective ratings on these questions in UPDRS sections 1 and 2.
Thus an individual may appear objectively better on short, non-exertional
assessments. UPDRS sections 1 and 2 also include questions pertaining to
anxiety and depression which may also be affected by lung disease but also
may be affected by smoking in the absence of lung disease (Munafo and Araya,
2010, Moussavi et al., 2007). Anxiety and depression and their impacts on
perception of health and abilities are important considerations also.
Focussing on motor phenotype there was a statistically significantly higher
prevalence of PIGD phenotype in the smokers group, and although it did not
reach statistical significance there was a higher prevalence of TD phenotype in
the non-smokers group. Remembering this group included both smokers and
those without a smoking history but with a diagnosis of obstructive lung disease,
these are interesting findings. Smoking and PD has long been of interest,
91
particularly in the research setting, dating back nearly half a century,
prospective and retrospective studies have demonstrated an inverse correlation
between PD and smoking concluding a reduced risk of developing PD in
smokers and a recent large study concluded smoking duration was more
associated with lower PD risk than smoking intensity (Baumann et al., 1980,
Marttila and Rinne, 1980, Checkoway et al., 2002, Chen et al., 2010). Thus
considering smokers alone, do one or more of the 600 ingredients in cigarettes,
creating more than 7000 chemicals when burnt, have cellular influences that
affect the expressed phenotype of PD to give a higher prevalence of the PIGD
phenotype? This question remains unanswered in current published research.
Depression, apathy and hallucinations are more prominent in the PIGD
phenotype which may have contributed to the UPDRS part 1 and 2 scores
being higher in the smokers group (Reijnders et al., 2009). The PIGD
phenotype usually presents a more severe pattern of non-motor features, faster
motor deterioration, faster rate of cognitive decline and is associated with
progression of disability and a negative impact on survival (Burn et al., 2006,
Post et al., 2007, Auyeung et al., 2012, Poletti et al., 2012, Vu et al., 2012,
Moustafa and Poletti, 2013). With these facts in mind, considering the patients
included in the smokers group that do not have a smoking history but have a
historical diagnosis of obstructive lung disease caused by asthma, the question
arises about the potential of a misdiagnosis of asthma. It is a feasible
suggestion that their obstructive spirometry could be caused by PD rather than
asthma and given the pathophysiology would be more likely to be present in the
PIGD than TD phenotype. Including these participants in the smokers group
may give the impression of a higher prevalence of PIGD in this group. This
theory is further discussed with the pulmonary function results.
4.3 PDQ-39, SCOPA-SLEEP, HADS Results
The results of the patient reported questionnaires are reported in table 6, below.
The Parkinson’s Disease Questionnaire (PDQ-39), subjectively completed
quality of life questionnaire, summary index score for the entire questionnaire is
quoted. The SCOPA-SLEEP scale to quantify sleep issues is described as
SCOPA B (sleep at night), SCOPA C (global measure of night time sleep
quality) and SCOPA D (sleep during the day and evening). The Hospital Anxiety
and Depression Scale (HADS) is separately documented as HADS A (anxiety)
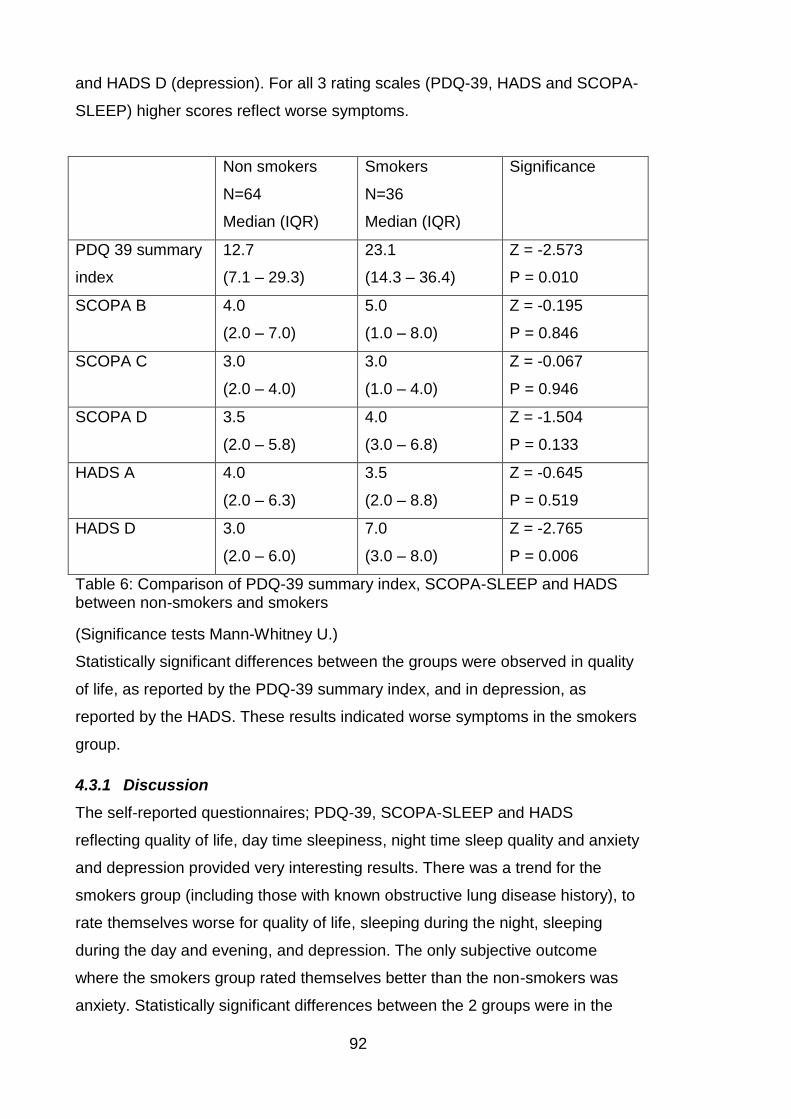
92
and HADS D (depression). For all 3 rating scales (PDQ-39, HADS and SCOPA-
SLEEP) higher scores reflect worse symptoms.
Non smokers
N=64
Median (IQR)
Smokers
N=36
Median (IQR)
Significance
PDQ 39 summary
index
12.7
(7.1 – 29.3)
23.1
(14.3 – 36.4)
Z = -2.573
P = 0.010
SCOPA B
4.0
(2.0 – 7.0)
5.0
(1.0 – 8.0)
Z = -0.195
P = 0.846
SCOPA C
3.0
(2.0 – 4.0)
3.0
(1.0 – 4.0)
Z = -0.067
P = 0.946
SCOPA D
3.5
(2.0 – 5.8)
4.0
(3.0 – 6.8)
Z = -1.504
P = 0.133
HADS A
4.0
(2.0 – 6.3)
3.5
(2.0 – 8.8)
Z = -0.645
P = 0.519
HADS D
3.0
(2.0 – 6.0)
7.0
(3.0 – 8.0)
Z = -2.765
P = 0.006
Table 6: Comparison of PDQ-39 summary index, SCOPA-SLEEP and HADS between non-smokers and smokers
(Significance tests Mann-Whitney U.)
Statistically significant differences between the groups were observed in quality
of life, as reported by the PDQ-39 summary index, and in depression, as
reported by the HADS. These results indicated worse symptoms in the smokers
group.
4.3.1 Discussion
The self-reported questionnaires; PDQ-39, SCOPA-SLEEP and HADS
reflecting quality of life, day time sleepiness, night time sleep quality and anxiety
and depression provided very interesting results. There was a trend for the
smokers group (including those with known obstructive lung disease history), to
rate themselves worse for quality of life, sleeping during the night, sleeping
during the day and evening, and depression. The only subjective outcome
where the smokers group rated themselves better than the non-smokers was
anxiety. Statistically significant differences between the 2 groups were in the
93
PDQ-39 summary index and in the depression scores, with the smokers
reporting significantly worse symptoms reflected by higher scores. There was a
large difference in the median PDQ-39 scores between the 2 groups with the
smokers’ median of 23.1 and the non-smokers’ median of 12.7. These scores
mirror the subjective UPDRS part 1 and 2 scores, reported in section 4.2, with
the smokers’ median scores being significantly higher than the non-smokers.
However it must be remembered that the objectively assessed UPDRS part 3
scores (see section 4.2) and Hoehn and Yahr scores were not significantly
different between the 2 groups. Thus despite no objective difference in motor
scores and PD disease severity, the smokers reported worse quality of life and
higher depression scores.
The PDQ-39 asks participants questions with the prefix “due to having
Parkinson’s disease, how often in the last month have you……” with a variety of
questions to follow such as “had difficulty walking half a mile?”. A large number
of the questions require significant activity such as; had difficulty with leisure
activities, looking after your home, difficulty washing and dressing or have you
been confined to the house. Smokers or those with lung disease may suffer
symptoms such as breathlessness on exertion that limit their activities and
although the questionnaire asks the effect of having PD on their activities, it is
feasible that individuals may have answered describing the effect of respiratory
symptoms on their activities in addition to their PD symptoms resulting in higher
scores in the smoker’s group. With the breadth of potential PD symptoms, it
can be difficult for both patients and clinicians to ascertain which symptoms are
attributable to PD and which are caused by other conditions. There is significant
crossover of questions in the PDQ-39 and the HADS, with the PDQ-39
enquiring about feelings of being frightened, worried, angry, bitter, depressed,
isolated, lonely, weepy, tearful and anxious. Thus using the PDQ-39 summary
index score, which includes all domains, those individuals with higher anxiety
and depression (particularly depression) scores will record worse quality of life
scores reflected in higher PDQ-39 scores.
The smokers group includes those with a known diagnosis of a chronic
obstructive lung disease and those with a significant smoking history. Thus
there are two distinct areas to consider within this group; the effect of chronic
respiratory disease on quality of life, anxiety, depression and sleep and
separately the effect of smoking on these outcomes. Quality of life is a
94
multifaceted, complex concept and most studies in individuals with chronic
diseases refer to health related quality of life (Megari, 2013). The World Health
Organization defines quality of life as “an individual's perception of their position
in life in the context of the culture and value systems in which they live and in
relation to their goals, expectations, standards and concerns” (WHOQOLGroup,
1993). Health related quality of life is multidimensional and comprises at least
three broad domains, physical, psychological and social functioning, that are
affected by an individual’s disease and/or treatment (Sprangers, 2002). As
individuals are living longer and the management of chronic diseases improves,
the prevalence of those living with a chronic disease that can adversely affect
their quality of life has increased. Although there are cultural differences in
results, depression is frequently found to have a greater impact on health
related quality of life than other chronic diseases (Megari, 2013). If individuals
have the comorbid state of depression this incrementally worsens health
compared with depression alone, with another chronic disease alone and with
combinations of chronic diseases without depression (Moussavi et al., 2007).
Both Asthma and COPD are known to have a negative impact on quality of life
and this further deteriorates with increasing disease severity (Stahl et al., 2005,
Gonzalez-Barcala et al., 2012). Anxiety and depression are particularly common
in patients with COPD. Whilst the prevalence varies considerably among
studies it is probably higher than is currently reported. Significant symptoms of
depression have been reported in up to 74% of those with COPD (Rubio et al.,
2009, Yellowlees et al., 1987, Karajgi et al., 1990, Light et al., 1985, Yohannes
et al., 2000). Similarly to COPD, asthma is associated with increased
prevalence of anxiety and depression and the presence of an anxiety or
depression is highly associated with increased asthma symptom burden
(Moussas et al., 2008, Richardson et al., 2006). With 16 of the 36 participants in
the smokers group having a diagnosis of COPD or asthma it is likely that their
chronic respiratory disease contributed to the higher and thus significantly
worse scores for quality of life as assessed by the PDQ-39 and depression as
rated by the HADS.
The causal direction between smoking and anxiety and depression remains a
debated one and for obvious ethical reasons, randomised control trials cannot
be conducted to unequivocally answer this question. Smokers often describe
the anxiolytic and antidepressant effects of smoking, but evidence exists to
95
suggest that smoking may increase negative affect suggesting the association
is in the opposite direction and that smoking leads to depression (Boden et al.,
2010, Munafo and Araya, 2010). Many questions remain; does depression
cause people to smoke to self-medicate symptoms? Does smoking cause
increased depression risk via neurotransmitter pathway alterations in chronic
exposure? Is the relationship bidirectional in that acute or infrequent smoking
reduces negative affect, but chronic smoking exacerbates it (Munafo and Araya,
2010)? Depression and lower quality of life are associated with higher
probabilities of smoking initiation and lower likelihoods of successful cessation
of smoking. There is a negative relationship between smoking and quality of life,
with the degree related to the number of cigarettes smoked. Interestingly
passive smoking is also negatively associated with quality of life, whilst
cessation of smoking improves quality of life (Goldenberg et al., 2014).
Whichever the direction of the causal association, with 26 out of 36 in the
smokers group having a significant smoking history, this provides an
explanation to the observed statistically significantly worse subjective
assessments of quality of life and depression in the smokers group.
4.4 Pulmonary Function Results
The pulmonary function testing provided both quantitative and qualitative results
for each participant. The pulmonary function and respiratory muscle strength
tests reported in excess of 25 variables for each participant thus appropriate
selection of quantitative variables is vital to ensure the results can be easily
interpreted and compared to previous studies. The flow volume loops also
provided visual qualitative information pertaining to upper airway obstruction.
Initially the PFT results were reviewed to ascertain in the lung function is
normal, if there is evidence of airflow obstruction or if there is any evidence of
restriction. The PFT data from both groups (smokers and non-smokers) were
not normally distributed, on review of histograms, as such medians and
interquartile ranges are quoted where appropriate. Visual inspection of the data
distribution using histograms was used for assessing normality, as in chapter 4
in cases where there was any discrepancy in the distribution on visual
inspection the statistical Kolmogorov-Smirnov test of normality was used.
Focusing first on the spirometry, lung volumes and flow volume loop results, the
results are best displayed in 2 ways; with median and interquartile ranges and
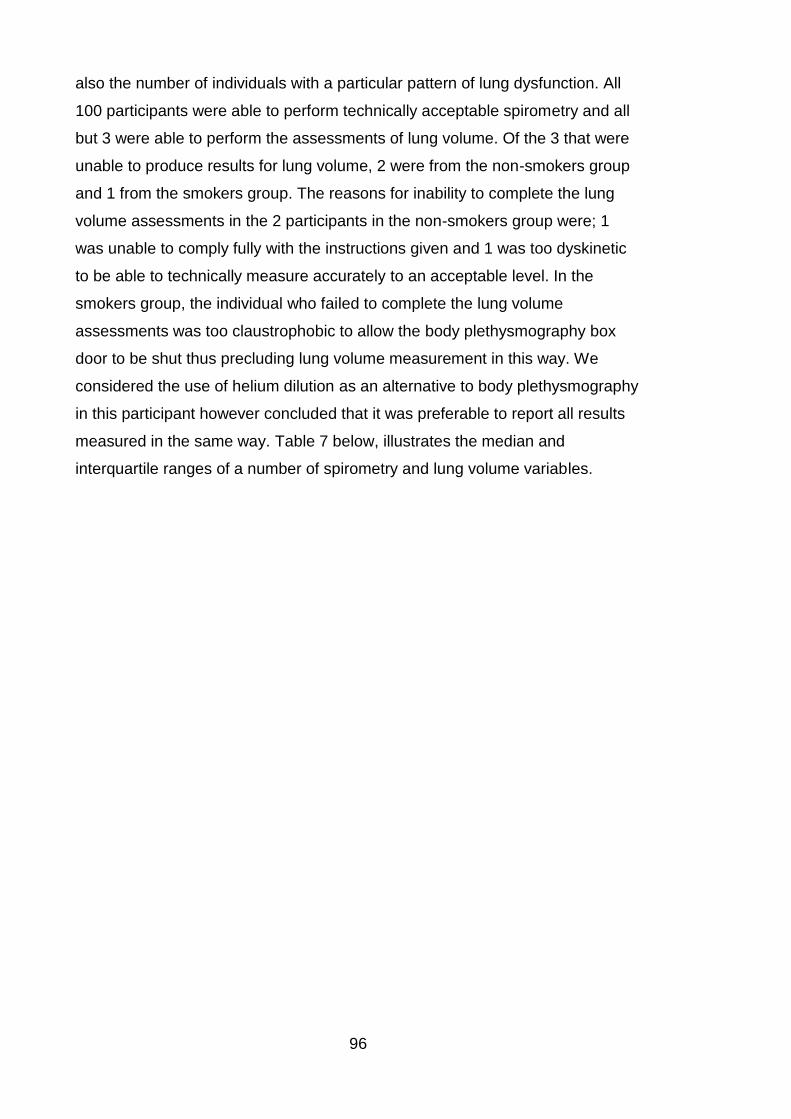
96
also the number of individuals with a particular pattern of lung dysfunction. All
100 participants were able to perform technically acceptable spirometry and all
but 3 were able to perform the assessments of lung volume. Of the 3 that were
unable to produce results for lung volume, 2 were from the non-smokers group
and 1 from the smokers group. The reasons for inability to complete the lung
volume assessments in the 2 participants in the non-smokers group were; 1
was unable to comply fully with the instructions given and 1 was too dyskinetic
to be able to technically measure accurately to an acceptable level. In the
smokers group, the individual who failed to complete the lung volume
assessments was too claustrophobic to allow the body plethysmography box
door to be shut thus precluding lung volume measurement in this way. We
considered the use of helium dilution as an alternative to body plethysmography
in this participant however concluded that it was preferable to report all results
measured in the same way. Table 7 below, illustrates the median and
interquartile ranges of a number of spirometry and lung volume variables.
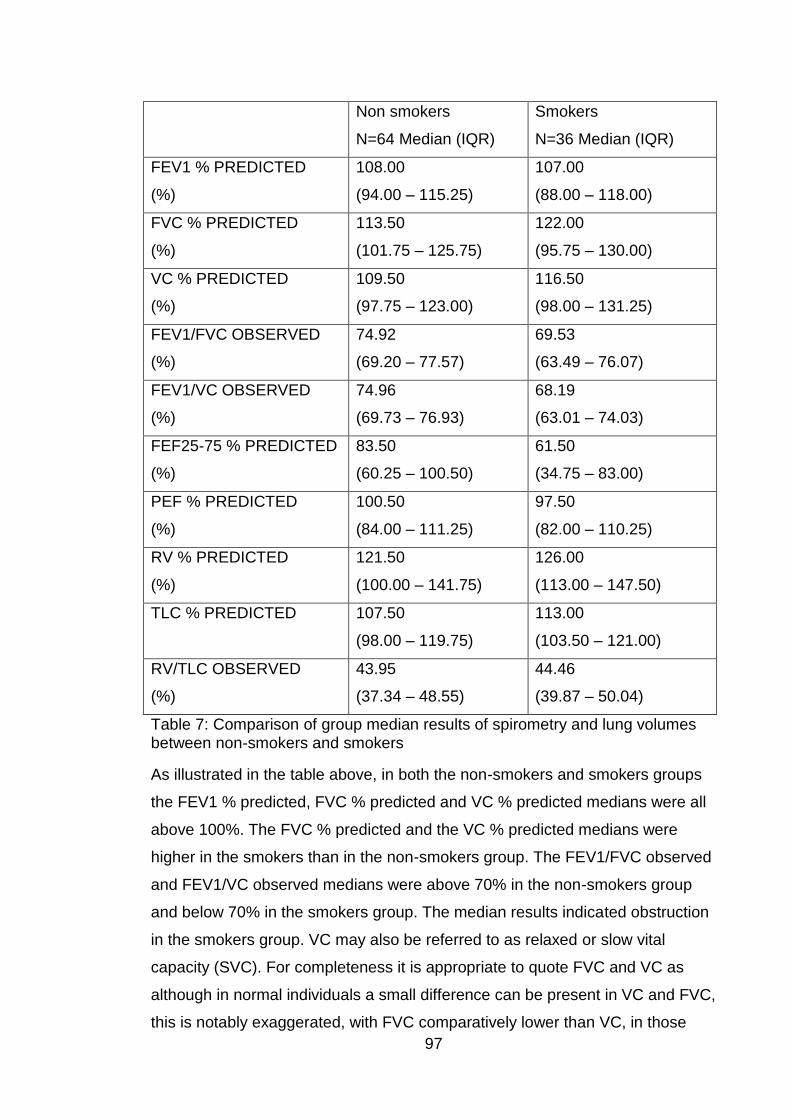
97
Non smokers
N=64 Median (IQR)
Smokers
N=36 Median (IQR)
FEV1 % PREDICTED
(%)
108.00
(94.00 – 115.25)
107.00
(88.00 – 118.00)
FVC % PREDICTED
(%)
113.50
(101.75 – 125.75)
122.00
(95.75 – 130.00)
VC % PREDICTED
(%)
109.50
(97.75 – 123.00)
116.50
(98.00 – 131.25)
FEV1/FVC OBSERVED
(%)
74.92
(69.20 – 77.57)
69.53
(63.49 – 76.07)
FEV1/VC OBSERVED
(%)
74.96
(69.73 – 76.93)
68.19
(63.01 – 74.03)
FEF25-75 % PREDICTED
(%)
83.50
(60.25 – 100.50)
61.50
(34.75 – 83.00)
PEF % PREDICTED
(%)
100.50
(84.00 – 111.25)
97.50
(82.00 – 110.25)
RV % PREDICTED
(%)
121.50
(100.00 – 141.75)
126.00
(113.00 – 147.50)
TLC % PREDICTED
107.50
(98.00 – 119.75)
113.00
(103.50 – 121.00)
RV/TLC OBSERVED
(%)
43.95
(37.34 – 48.55)
44.46
(39.87 – 50.04)
Table 7: Comparison of group median results of spirometry and lung volumes between non-smokers and smokers
As illustrated in the table above, in both the non-smokers and smokers groups
the FEV1 % predicted, FVC % predicted and VC % predicted medians were all
above 100%. The FVC % predicted and the VC % predicted medians were
higher in the smokers than in the non-smokers group. The FEV1/FVC observed
and FEV1/VC observed medians were above 70% in the non-smokers group
and below 70% in the smokers group. The median results indicated obstruction
in the smokers group. VC may also be referred to as relaxed or slow vital
capacity (SVC). For completeness it is appropriate to quote FVC and VC as
although in normal individuals a small difference can be present in VC and FVC,
this is notably exaggerated, with FVC comparatively lower than VC, in those
98
with airflow obstruction reflecting hyperinflation and air trapping. In addition, as
VC should be better than FVC, if a large difference is present between the 2
measurements with VC being lower than FVC, this could indicate an imperfect
procedure.
Measurements of FEF25-75% provide information about the small airways and
a reduction in this measurement can be an early change reflecting airflow
obstruction in these small airways (Ranu et al., 2011, Pellegrino et al., 2005).
While a reduction was noted in FEF25-75 % predicted in both groups, the
median %predicted in the non-smokers was still above 80% whilst the smokers
however had a median FEF25-75 %predicted of 61.50 indicating more
involvement in small airways in the smokers group. Median PEF% predicted in
both groups was above 97% and indeed exceeded 100% in the non-smokers
group.
Focusing on median lung volumes, both RV and TLC % predicted in both the
smokers and non-smokers groups exceeded 100%. Whilst measurement of RV
and TLC are essential in the accurate diagnosis of restrictive lung disorders
characterised by a reduction in TLC, they are also very useful in diagnosing
obstructive lung diseases where an increase in RV, suggests air trapping, TLC
or the RV/TLC ratio may suggest the presence of obstruction (Pellegrino et al.,
2005). Both the non-smokers and the smokers had median results which may
suggest air trapping with RV % predicted >120% and RV/TLC % observed
>40% in both groups.
Whilst looking at the medians for variables in each group is important, it is
arguably more informative to look at the pattern of lung dysfunction to ascertain
if each individual has a normal, obstructive, restrictive or mixed (obstructive and
restrictive) pattern of lung function. Obstructive lung function is indicated by a
FEV1/FVC <70%, restrictive lung function is indicated by a FEV1/FVC >70%
and FVC <80% predicted, but most importantly a TLC <80% predicted. Mixed
ventilatory defects are the co-occurrence of both obstruction and restriction with
reduced FEV1/FVC and reduced TLC. The measurement of TLC is necessary
to accurately diagnose a mixed defect as VC or FVC can be reduced in both
restriction and obstruction. Table 8, below, summarises the patterns of lung
function in the non-smokers and smokers groups.
99
Non smokers
N=64
Number (%)
Smokers
N=36
Number (%)
Normal lung
function
44
(68.75%)
17
(47.22%)
Obstructive lung
function
18
(28.13%)
18
(50.00%)
Restrictive lung
function
2
(3.13%)
1
(2.78%)
Mixed obstructive and
restrictive lung function
0
(0.00%)
0
(0.00%)
Table 8: Summary of pattern of lung function in non-smokers and smokers
Those individuals categorised as having normal lung function all had FEV1/FVC
≥70% and a TLC ≥80% predicted. Those individuals classed as having
obstructive lung function all had a FEV1/FVC <70% and a TLC ≥80% predicted.
Two participants in the non-smokers group were classed as having restrictive
lung function and one in the smokers group was classed as having restrictive
lung function. These 3 participants warrant further explanation and results
interpretation, in these 3, with caution. One of these 2 participants in the non-
smokers group had a FEV1/FVC of 79.56%, FEV1/VC of 81.59% and a FVC of
71% predicted and as such had spirometric evidence of restriction, however this
was the same participant in which the gold standard to assess restriction, TLC,
could not be measured as he was too dyskinetic. The other participant in the
non-smokers group classed as restriction based on TLC had spirometry results
that were not consistent with restriction or obstruction, with a TLC of 78%
predicted, FEV1/FVC of 78.88%, FEV1/VC of 78.95% and a FVC of 87%
predicted. Similarly to the last participant, the individual in the smokers group
categorised as restriction on TLC, with a TLC of 75% predicted, had a normal
FEV1/FVC, normal FEV1/VC and a FVC >100% predicted.
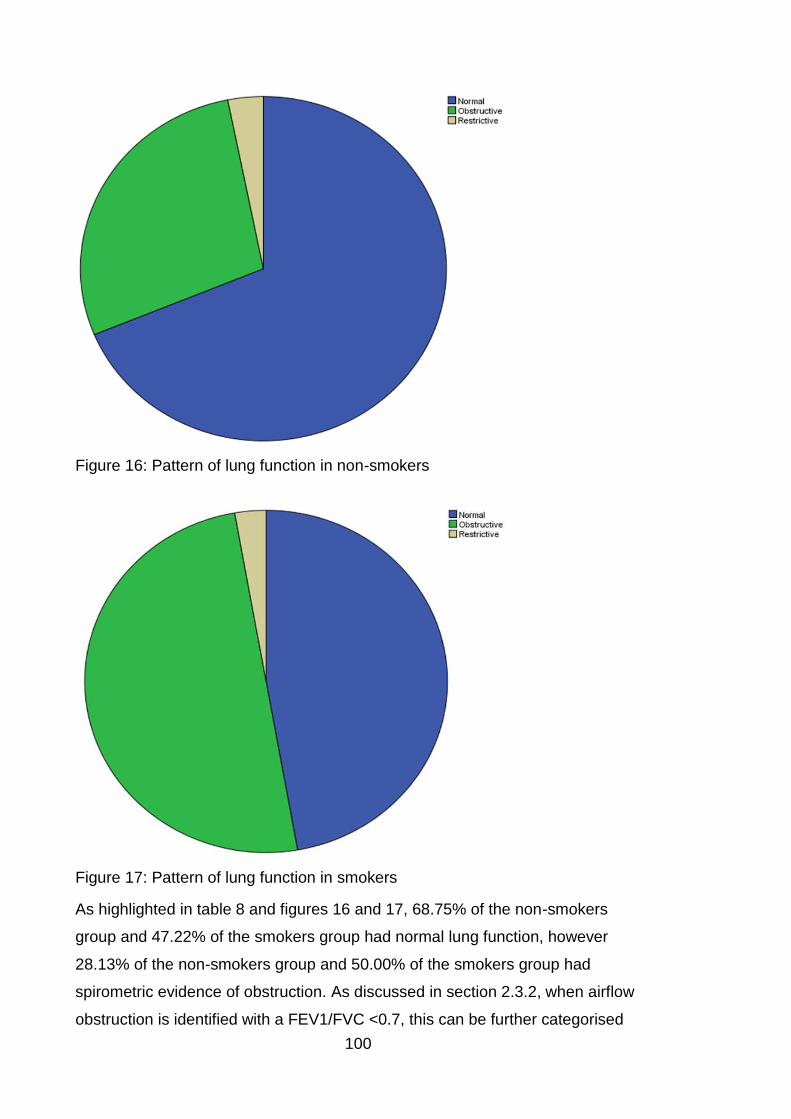
100
Figure 16: Pattern of lung function in non-smokers
Figure 17: Pattern of lung function in smokers
As highlighted in table 8 and figures 16 and 17, 68.75% of the non-smokers
group and 47.22% of the smokers group had normal lung function, however
28.13% of the non-smokers group and 50.00% of the smokers group had
spirometric evidence of obstruction. As discussed in section 2.3.2, when airflow
obstruction is identified with a FEV1/FVC <0.7, this can be further categorised
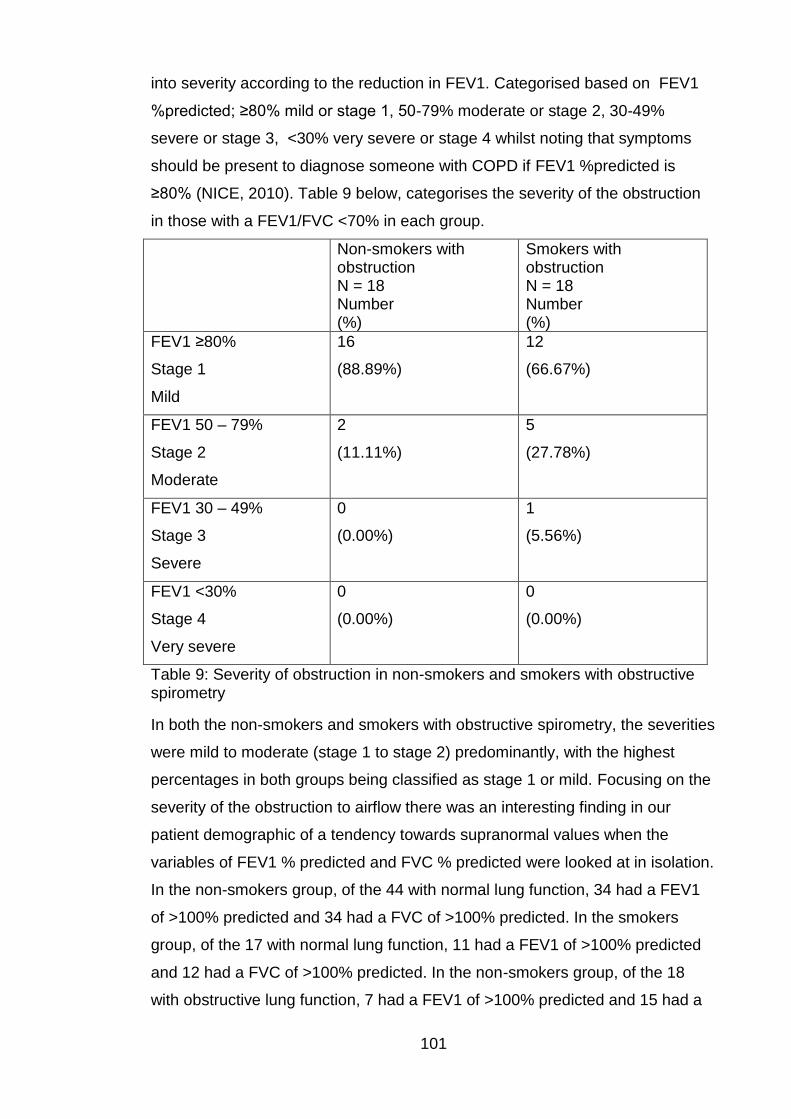
101
into severity according to the reduction in FEV1. Categorised based on FEV1
%predicted; ≥80% mild or stage 1, 50-79% moderate or stage 2, 30-49%
severe or stage 3, <30% very severe or stage 4 whilst noting that symptoms
should be present to diagnose someone with COPD if FEV1 %predicted is
≥80% (NICE, 2010). Table 9 below, categorises the severity of the obstruction
in those with a FEV1/FVC <70% in each group.
Non-smokers with obstruction N = 18 Number (%)
Smokers with obstruction N = 18 Number (%)
FEV1 ≥80%
Stage 1
Mild
16
(88.89%)
12
(66.67%)
FEV1 50 – 79%
Stage 2
Moderate
2
(11.11%)
5
(27.78%)
FEV1 30 – 49%
Stage 3
Severe
0
(0.00%)
1
(5.56%)
FEV1 <30%
Stage 4
Very severe
0
(0.00%)
0
(0.00%)
Table 9: Severity of obstruction in non-smokers and smokers with obstructive spirometry
In both the non-smokers and smokers with obstructive spirometry, the severities
were mild to moderate (stage 1 to stage 2) predominantly, with the highest
percentages in both groups being classified as stage 1 or mild. Focusing on the
severity of the obstruction to airflow there was an interesting finding in our
patient demographic of a tendency towards supranormal values when the
variables of FEV1 % predicted and FVC % predicted were looked at in isolation.
In the non-smokers group, of the 44 with normal lung function, 34 had a FEV1
of >100% predicted and 34 had a FVC of >100% predicted. In the smokers
group, of the 17 with normal lung function, 11 had a FEV1 of >100% predicted
and 12 had a FVC of >100% predicted. In the non-smokers group, of the 18
with obstructive lung function, 7 had a FEV1 of >100% predicted and 15 had a
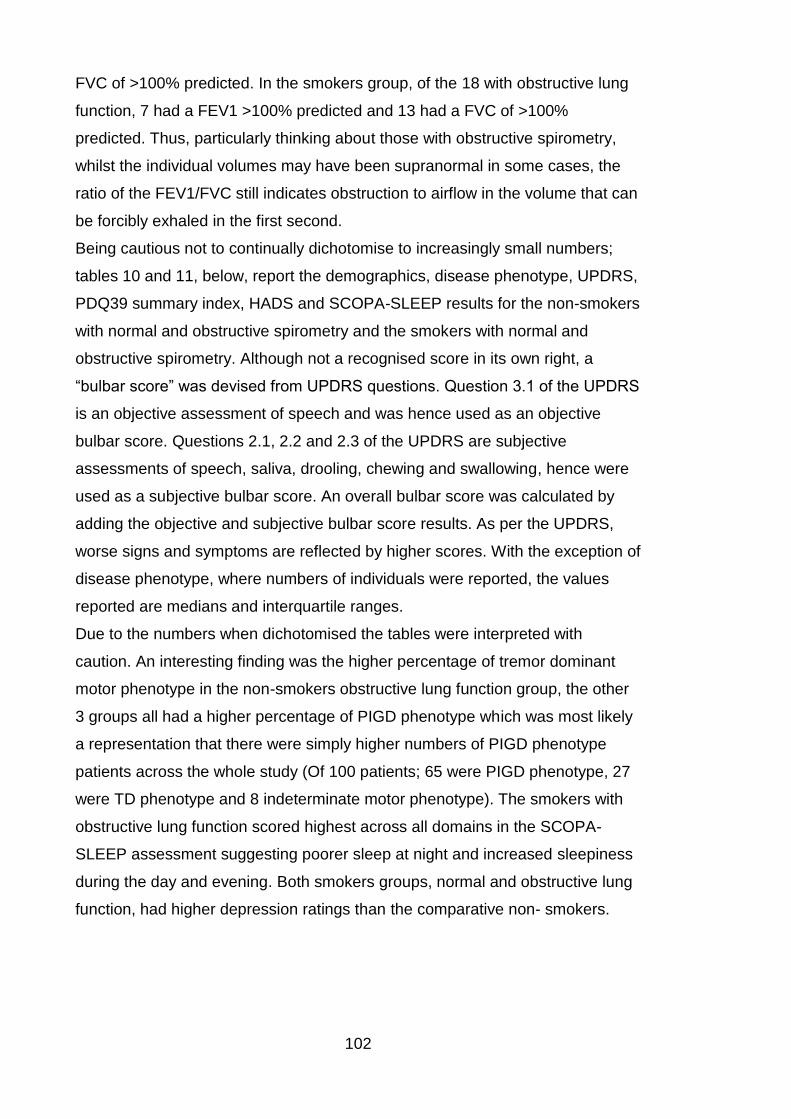
102
FVC of >100% predicted. In the smokers group, of the 18 with obstructive lung
function, 7 had a FEV1 >100% predicted and 13 had a FVC of >100%
predicted. Thus, particularly thinking about those with obstructive spirometry,
whilst the individual volumes may have been supranormal in some cases, the
ratio of the FEV1/FVC still indicates obstruction to airflow in the volume that can
be forcibly exhaled in the first second.
Being cautious not to continually dichotomise to increasingly small numbers;
tables 10 and 11, below, report the demographics, disease phenotype, UPDRS,
PDQ39 summary index, HADS and SCOPA-SLEEP results for the non-smokers
with normal and obstructive spirometry and the smokers with normal and
obstructive spirometry. Although not a recognised score in its own right, a
“bulbar score” was devised from UPDRS questions. Question 3.1 of the UPDRS
is an objective assessment of speech and was hence used as an objective
bulbar score. Questions 2.1, 2.2 and 2.3 of the UPDRS are subjective
assessments of speech, saliva, drooling, chewing and swallowing, hence were
used as a subjective bulbar score. An overall bulbar score was calculated by
adding the objective and subjective bulbar score results. As per the UPDRS,
worse signs and symptoms are reflected by higher scores. With the exception of
disease phenotype, where numbers of individuals were reported, the values
reported are medians and interquartile ranges.
Due to the numbers when dichotomised the tables were interpreted with
caution. An interesting finding was the higher percentage of tremor dominant
motor phenotype in the non-smokers obstructive lung function group, the other
3 groups all had a higher percentage of PIGD phenotype which was most likely
a representation that there were simply higher numbers of PIGD phenotype
patients across the whole study (Of 100 patients; 65 were PIGD phenotype, 27
were TD phenotype and 8 indeterminate motor phenotype). The smokers with
obstructive lung function scored highest across all domains in the SCOPA-
SLEEP assessment suggesting poorer sleep at night and increased sleepiness
during the day and evening. Both smokers groups, normal and obstructive lung
function, had higher depression ratings than the comparative non- smokers.
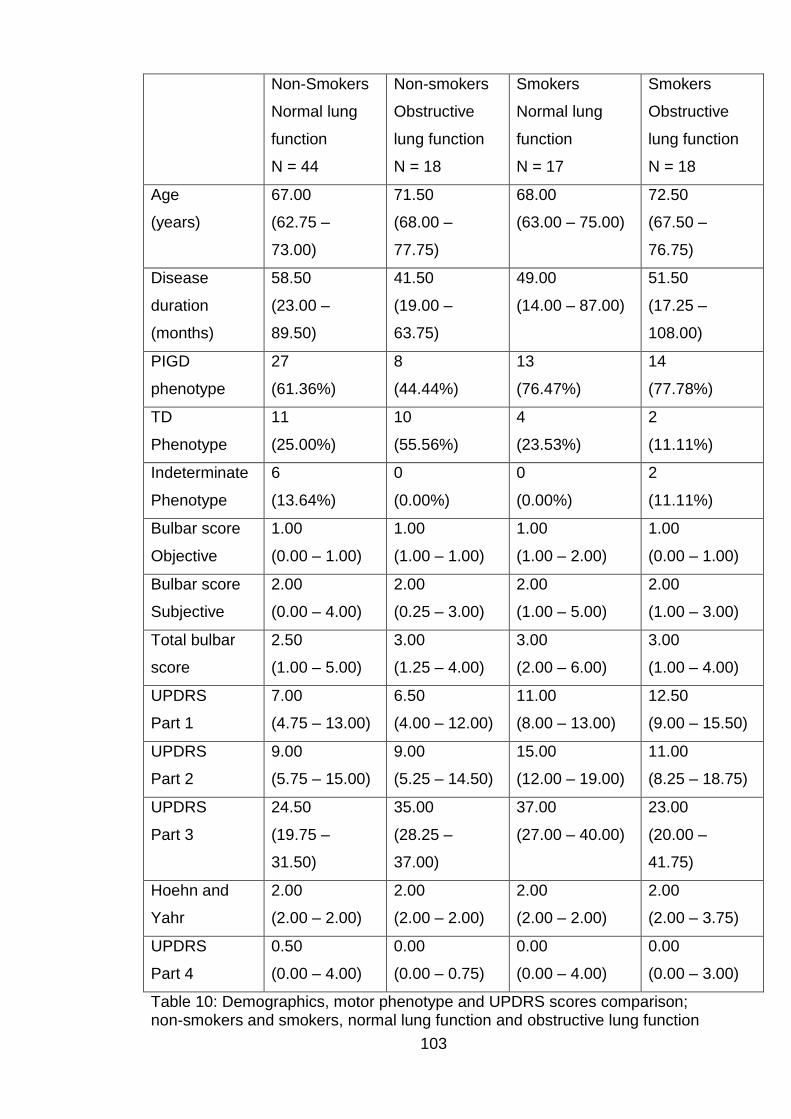
103
Non-Smokers
Normal lung
function
N = 44
Non-smokers
Obstructive
lung function
N = 18
Smokers
Normal lung
function
N = 17
Smokers
Obstructive
lung function
N = 18
Age
(years)
67.00
(62.75 –
73.00)
71.50
(68.00 –
77.75)
68.00
(63.00 – 75.00)
72.50
(67.50 –
76.75)
Disease
duration
(months)
58.50
(23.00 –
89.50)
41.50
(19.00 –
63.75)
49.00
(14.00 – 87.00)
51.50
(17.25 –
108.00)
PIGD
phenotype
27
(61.36%)
8
(44.44%)
13
(76.47%)
14
(77.78%)
TD
Phenotype
11
(25.00%)
10
(55.56%)
4
(23.53%)
2
(11.11%)
Indeterminate
Phenotype
6
(13.64%)
0
(0.00%)
0
(0.00%)
2
(11.11%)
Bulbar score
Objective
1.00
(0.00 – 1.00)
1.00
(1.00 – 1.00)
1.00
(1.00 – 2.00)
1.00
(0.00 – 1.00)
Bulbar score
Subjective
2.00
(0.00 – 4.00)
2.00
(0.25 – 3.00)
2.00
(1.00 – 5.00)
2.00
(1.00 – 3.00)
Total bulbar
score
2.50
(1.00 – 5.00)
3.00
(1.25 – 4.00)
3.00
(2.00 – 6.00)
3.00
(1.00 – 4.00)
UPDRS
Part 1
7.00
(4.75 – 13.00)
6.50
(4.00 – 12.00)
11.00
(8.00 – 13.00)
12.50
(9.00 – 15.50)
UPDRS
Part 2
9.00
(5.75 – 15.00)
9.00
(5.25 – 14.50)
15.00
(12.00 – 19.00)
11.00
(8.25 – 18.75)
UPDRS
Part 3
24.50
(19.75 –
31.50)
35.00
(28.25 –
37.00)
37.00
(27.00 – 40.00)
23.00
(20.00 –
41.75)
Hoehn and
Yahr
2.00
(2.00 – 2.00)
2.00
(2.00 – 2.00)
2.00
(2.00 – 2.00)
2.00
(2.00 – 3.75)
UPDRS
Part 4
0.50
(0.00 – 4.00)
0.00
(0.00 – 0.75)
0.00
(0.00 – 4.00)
0.00
(0.00 – 3.00)
Table 10: Demographics, motor phenotype and UPDRS scores comparison; non-smokers and smokers, normal lung function and obstructive lung function
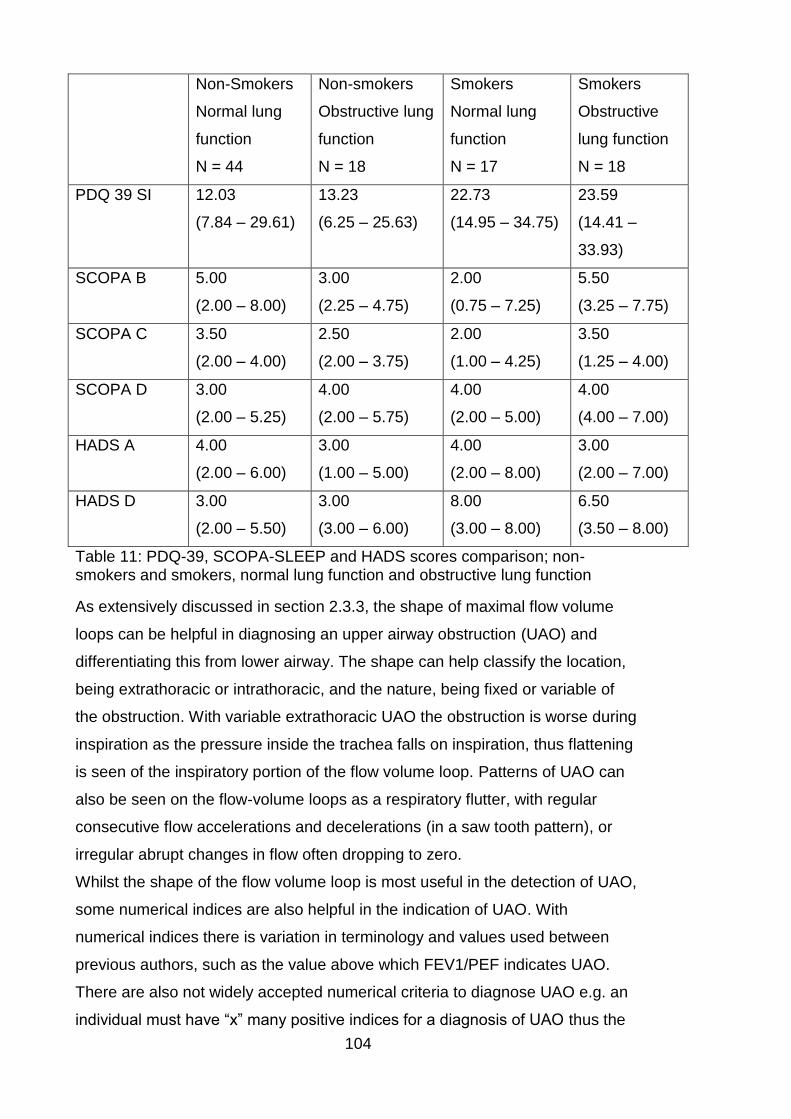
104
Non-Smokers
Normal lung
function
N = 44
Non-smokers
Obstructive lung
function
N = 18
Smokers
Normal lung
function
N = 17
Smokers
Obstructive
lung function
N = 18
PDQ 39 SI 12.03
(7.84 – 29.61)
13.23
(6.25 – 25.63)
22.73
(14.95 – 34.75)
23.59
(14.41 –
33.93)
SCOPA B 5.00
(2.00 – 8.00)
3.00
(2.25 – 4.75)
2.00
(0.75 – 7.25)
5.50
(3.25 – 7.75)
SCOPA C 3.50
(2.00 – 4.00)
2.50
(2.00 – 3.75)
2.00
(1.00 – 4.25)
3.50
(1.25 – 4.00)
SCOPA D 3.00
(2.00 – 5.25)
4.00
(2.00 – 5.75)
4.00
(2.00 – 5.00)
4.00
(4.00 – 7.00)
HADS A 4.00
(2.00 – 6.00)
3.00
(1.00 – 5.00)
4.00
(2.00 – 8.00)
3.00
(2.00 – 7.00)
HADS D 3.00
(2.00 – 5.50)
3.00
(3.00 – 6.00)
8.00
(3.00 – 8.00)
6.50
(3.50 – 8.00)
Table 11: PDQ-39, SCOPA-SLEEP and HADS scores comparison; non-smokers and smokers, normal lung function and obstructive lung function
As extensively discussed in section 2.3.3, the shape of maximal flow volume
loops can be helpful in diagnosing an upper airway obstruction (UAO) and
differentiating this from lower airway. The shape can help classify the location,
being extrathoracic or intrathoracic, and the nature, being fixed or variable of
the obstruction. With variable extrathoracic UAO the obstruction is worse during
inspiration as the pressure inside the trachea falls on inspiration, thus flattening
is seen of the inspiratory portion of the flow volume loop. Patterns of UAO can
also be seen on the flow-volume loops as a respiratory flutter, with regular
consecutive flow accelerations and decelerations (in a saw tooth pattern), or
irregular abrupt changes in flow often dropping to zero.
Whilst the shape of the flow volume loop is most useful in the detection of UAO,
some numerical indices are also helpful in the indication of UAO. With
numerical indices there is variation in terminology and values used between
previous authors, such as the value above which FEV1/PEF indicates UAO.
There are also not widely accepted numerical criteria to diagnose UAO e.g. an
individual must have “x” many positive indices for a diagnosis of UAO thus the
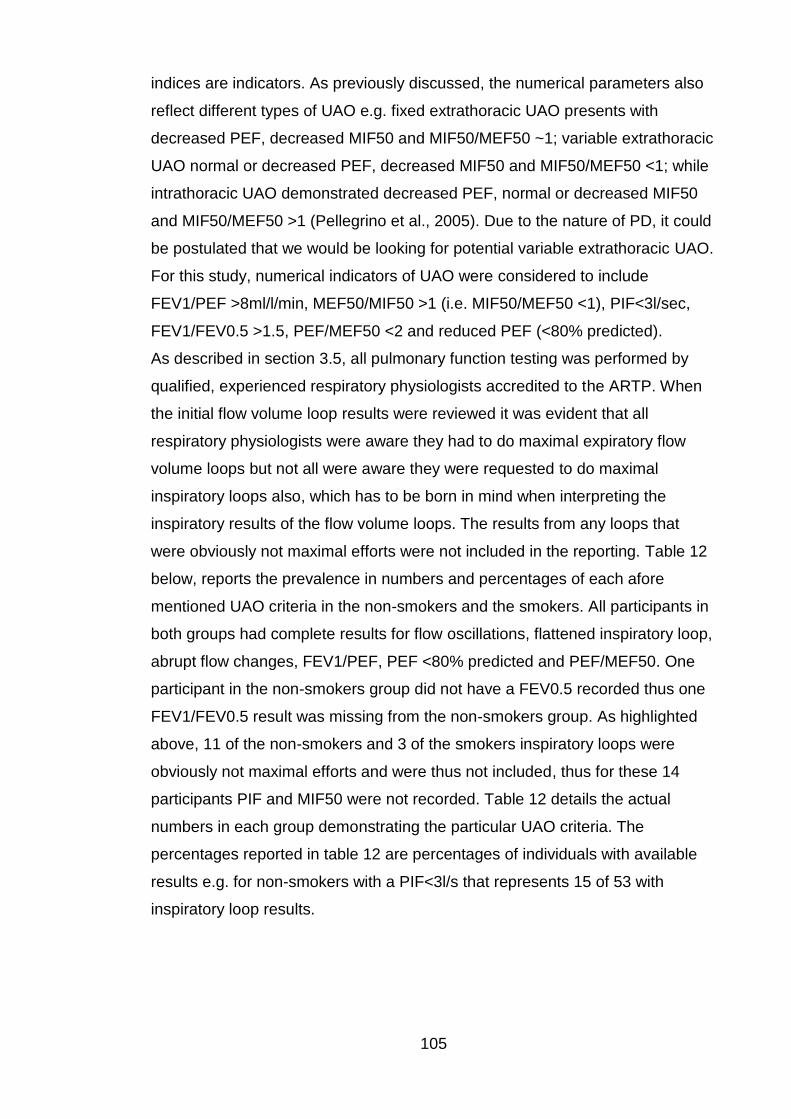
105
indices are indicators. As previously discussed, the numerical parameters also
reflect different types of UAO e.g. fixed extrathoracic UAO presents with
decreased PEF, decreased MIF50 and MIF50/MEF50 ~1; variable extrathoracic
UAO normal or decreased PEF, decreased MIF50 and MIF50/MEF50 <1; while
intrathoracic UAO demonstrated decreased PEF, normal or decreased MIF50
and MIF50/MEF50 >1 (Pellegrino et al., 2005). Due to the nature of PD, it could
be postulated that we would be looking for potential variable extrathoracic UAO.
For this study, numerical indicators of UAO were considered to include
FEV1/PEF >8ml/l/min, MEF50/MIF50 >1 (i.e. MIF50/MEF50 <1), PIF<3l/sec,
FEV1/FEV0.5 >1.5, PEF/MEF50 <2 and reduced PEF (<80% predicted).
As described in section 3.5, all pulmonary function testing was performed by
qualified, experienced respiratory physiologists accredited to the ARTP. When
the initial flow volume loop results were reviewed it was evident that all
respiratory physiologists were aware they had to do maximal expiratory flow
volume loops but not all were aware they were requested to do maximal
inspiratory loops also, which has to be born in mind when interpreting the
inspiratory results of the flow volume loops. The results from any loops that
were obviously not maximal efforts were not included in the reporting. Table 12
below, reports the prevalence in numbers and percentages of each afore
mentioned UAO criteria in the non-smokers and the smokers. All participants in
both groups had complete results for flow oscillations, flattened inspiratory loop,
abrupt flow changes, FEV1/PEF, PEF <80% predicted and PEF/MEF50. One
participant in the non-smokers group did not have a FEV0.5 recorded thus one
FEV1/FEV0.5 result was missing from the non-smokers group. As highlighted
above, 11 of the non-smokers and 3 of the smokers inspiratory loops were
obviously not maximal efforts and were thus not included, thus for these 14
participants PIF and MIF50 were not recorded. Table 12 details the actual
numbers in each group demonstrating the particular UAO criteria. The
percentages reported in table 12 are percentages of individuals with available
results e.g. for non-smokers with a PIF<3l/s that represents 15 of 53 with
inspiratory loop results.
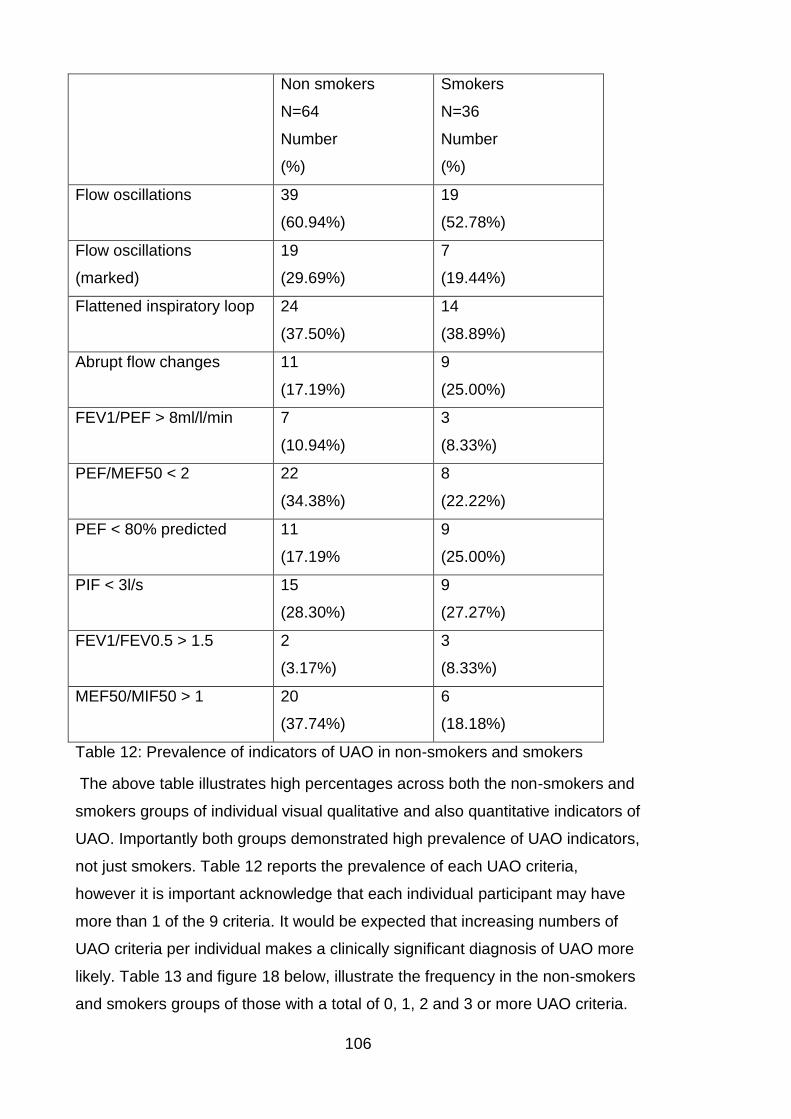
106
Non smokers
N=64
Number
(%)
Smokers
N=36
Number
(%)
Flow oscillations
39
(60.94%)
19
(52.78%)
Flow oscillations
(marked)
19
(29.69%)
7
(19.44%)
Flattened inspiratory loop 24
(37.50%)
14
(38.89%)
Abrupt flow changes 11
(17.19%)
9
(25.00%)
FEV1/PEF > 8ml/l/min 7
(10.94%)
3
(8.33%)
PEF/MEF50 < 2 22
(34.38%)
8
(22.22%)
PEF < 80% predicted 11
(17.19%
9
(25.00%)
PIF < 3l/s 15
(28.30%)
9
(27.27%)
FEV1/FEV0.5 > 1.5 2
(3.17%)
3
(8.33%)
MEF50/MIF50 > 1 20
(37.74%)
6
(18.18%)
Table 12: Prevalence of indicators of UAO in non-smokers and smokers
The above table illustrates high percentages across both the non-smokers and
smokers groups of individual visual qualitative and also quantitative indicators of
UAO. Importantly both groups demonstrated high prevalence of UAO indicators,
not just smokers. Table 12 reports the prevalence of each UAO criteria,
however it is important acknowledge that each individual participant may have
more than 1 of the 9 criteria. It would be expected that increasing numbers of
UAO criteria per individual makes a clinically significant diagnosis of UAO more
likely. Table 13 and figure 18 below, illustrate the frequency in the non-smokers
and smokers groups of those with a total of 0, 1, 2 and 3 or more UAO criteria.
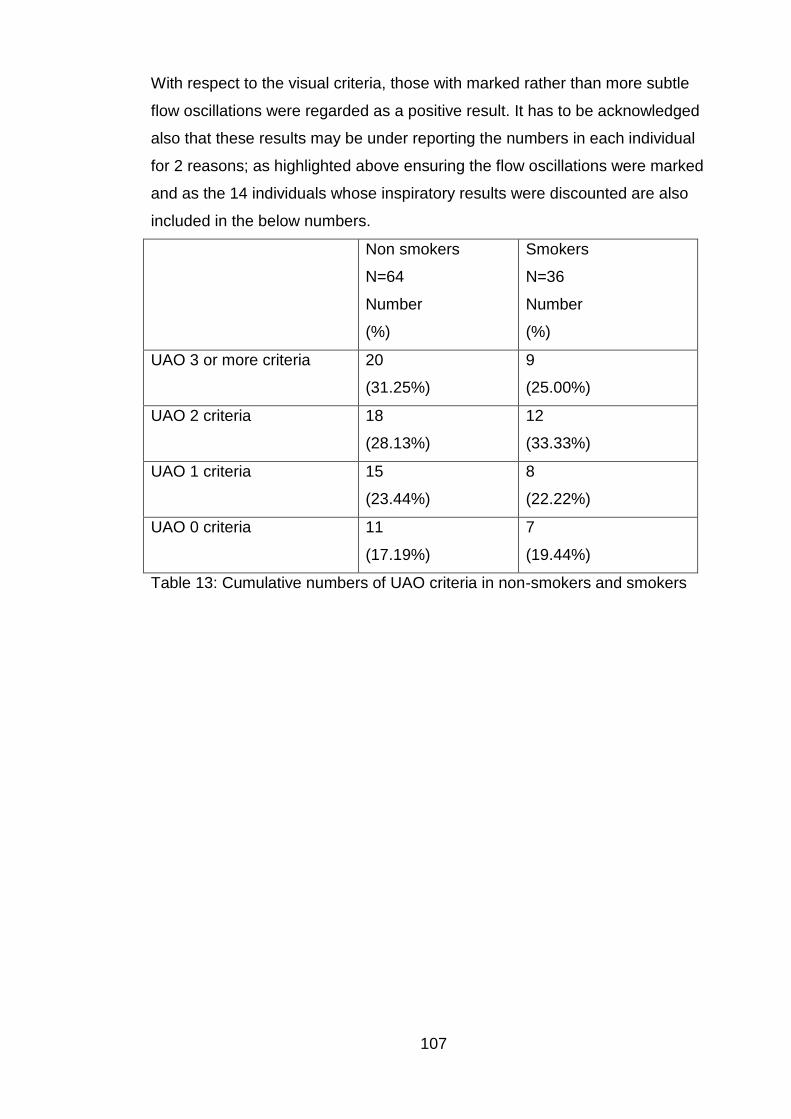
107
With respect to the visual criteria, those with marked rather than more subtle
flow oscillations were regarded as a positive result. It has to be acknowledged
also that these results may be under reporting the numbers in each individual
for 2 reasons; as highlighted above ensuring the flow oscillations were marked
and as the 14 individuals whose inspiratory results were discounted are also
included in the below numbers.
Non smokers
N=64
Number
(%)
Smokers
N=36
Number
(%)
UAO 3 or more criteria
20
(31.25%)
9
(25.00%)
UAO 2 criteria 18
(28.13%)
12
(33.33%)
UAO 1 criteria 15
(23.44%)
8
(22.22%)
UAO 0 criteria 11
(17.19%)
7
(19.44%)
Table 13: Cumulative numbers of UAO criteria in non-smokers and smokers
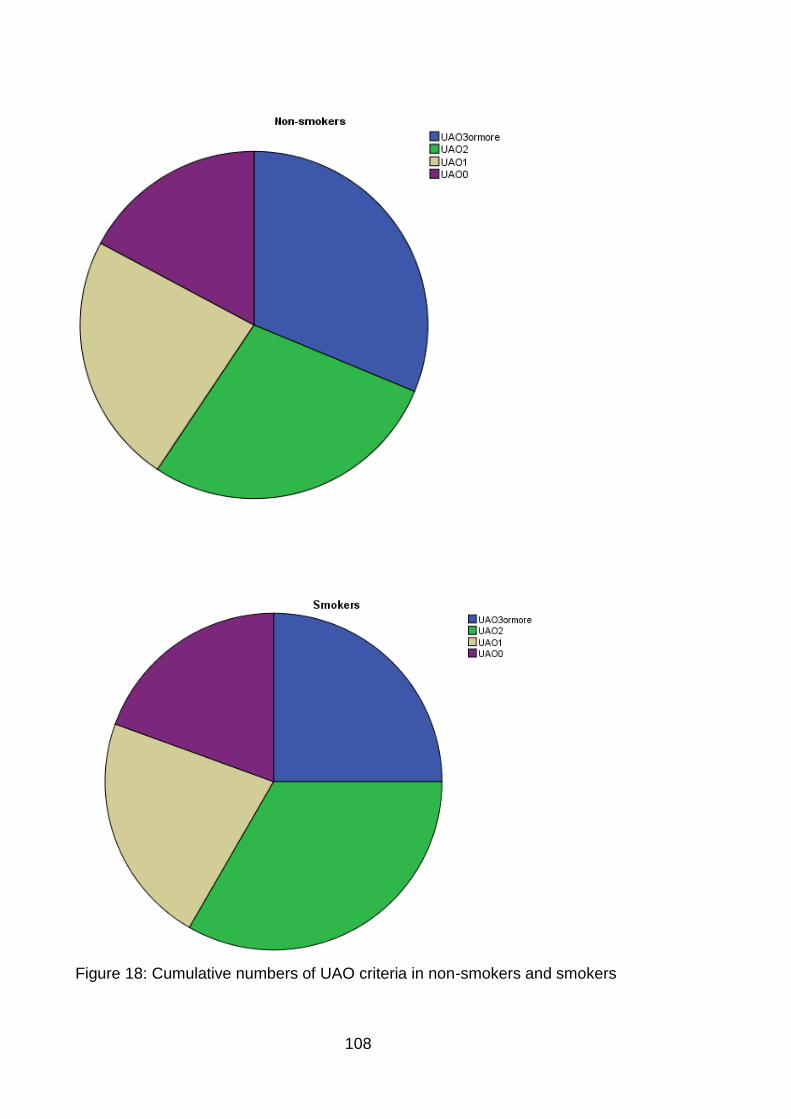
108
Figure 18: Cumulative numbers of UAO criteria in non-smokers and smokers
109
Cumulative numbers of UAO criteria in both the non-smokers and smokers are
high with it being more common to have criteria indicating UAO than no
indicators of UAO. In the non-smokers and smokers groups, 31.25% and
25.00% respectively had 3 or more criteria of UAO, which is also a probable
underestimation. Noting the higher number in the non-smokers and those
without known obstructive lung disease indicates this result cannot be attributed
to smoking, COPD or asthma.
Finally in the pulmonary function test results section, as discussed in section
2.3.6, respiratory muscle function tests should be performed as part of a more
comprehensive diagnostic process and respiratory muscle dysfunction is to be
differentiated from lung function abnormalities (Troosters et al., 2005). In
generalised neuromuscular disorders it is unusual for the respiratory muscles to
be unaffected (Polkey et al., 1995). The maximal expiratory pressure and
maximal inspiratory pressure measured at the mouth are abbreviated to MEP
and MIP respectively and sniff nasal inspiratory pressure to SNIP. In normal
subjects maximal expiratory pressures are expected to be higher than
inspiratory pressures, however SNIP results are generally higher than MIP
results (Troosters et al., 2005, Fitting, 2006). Table 14 below, illustrates the
median values and interquartile ranges of the percent predicted MEP, MIP and
SNIP results for the non-smokers and smokers.
Non smokers
N=64
Median
(IQR)
Smokers
N=36
Median
(IQR)
MEP % predicted 82.34
(58.55 – 98.42)
96.82
(80.74 – 105.20)
MIP % predicted 79.02
(57.80 – 92.53)
82.21
(69.70 – 102.08)
SNIP % predicted 58.53
(35.89 – 81.50)
63.96
(43.30 – 82.81)
Table 14: Respiratory muscle strength in non-smokers and smokers
The results of the respiratory muscle strength tests are illustrated as percent
predicted values and thus take into account that values for expiratory muscle
tests are usually higher than inspiratory muscle tests. In both the non-smokers
110
and smokers inspiratory muscle function seems to be more affected and
impaired than expiratory muscle function. Unlike normal individuals, SNIP
percent predicted results are worse than MIP results in both the non-smokers
and smokers. Interestingly the percent predicted MEP, MIP and SNIP median
values are worse in all 3 domains in the non-smokers compared to the smokers,
noting that the smoker’s median percent predicted MEP is greater than 96%.
The pulmonary function and respiratory muscle strength tests have yielded
some fascinating results in this cross-sectional study and will be discussed in
detail.
4.4.1 Discussion
Pulmonary function and respiratory muscle strength tests should be performed
as part of a comprehensive diagnostic process and each of the tests
complement each other to aid in diagnostic accuracy. As such it is appropriate
to discuss the results together. The PFT and respiratory muscle strength tests
have yielded very interesting, surprising and novel results.
Twenty seven studies were reviewed in section 2.3.9, Pulmonary function in
Parkinson’s disease, however it is difficult to compare these due to the different
assessments and outcome variables, for example some studies only looked at
respiratory muscle strength tests and not spirometry. Studies that looked at
spirometry, with or without body plethysmography, tended to report the
percentage of or number of participants with either normal, restrictive or
obstructive lung function. Eight of the studies reported the predominant pattern
of respiratory dysfunction seen in PD was restriction, these were predominantly
more recent studies (Izquierdo-Alonso et al., 1994, De Pandis et al., 2002,
Weiner et al., 2002, Cardoso and Pereira, 2002, Sathyaprabha et al., 2005, Pal
et al., 2007, Shaheen H.A., 2009, Wang et al., 2014). Of these 8 studies only 1
performed body plethysmography for measurement of TLC, however they
reported their findings of restrictive dysfunction based on the spirometry findings
not TLC (Wang et al., 2014).
Based on the findings of restrictive lung function in a number of neuromuscular
diseases, e.g. muscular dystrophy and amyotrophic lateral sclerosis, and
previous research, particularly in more recent years, of lung function in PD
pointing towards restrictive spirometry it would not be unreasonable to consider
this as a likely potential result of PFT testing in PD. The results however have
111
indicated that this is not the case in our patient demographic. Highlighted in
tables 7 and 8, with reduced TLC being the gold standard for diagnosing
restriction, both the non-smokers and smokers had median TLCs of over 100%
predicted and only 3 participants out of 100 were diagnosed as having
restrictive lung function. One of these diagnoses was based on the results of
FEV1 and FVC alone, without TLC, as the patient was too dyskinetic to tolerate
lung volume testing. Thus the prevalence of restrictive lung function in our
group is very low. As mentioned this is contrary to a number of previous studies
of lung function in PD. Most previous studies based their diagnoses of
restriction on spirometry variables, FEV1 and FVC, alone without the benefit of
lung volumes. Poor instruction, poor technique and insufficient effort can
produce low FEV1 and FVC values with a ratio diagnostic of restriction and thus
give false positive results. Given the findings in this study using gold standard
tests performed by qualified, experienced respiratory physiologists accredited to
the ARTP, it is likely that in this demographic restriction is rare and that previous
studies have produced false positive results by not basing the conclusions on
TLC. Interestingly, of the 27 studies reviewed in section 2.3.9, Pulmonary
function in Parkinson’s disease, only 5 studies recorded TLC measurements. Of
these 5 studies, 1 reported the finding of predominantly normal lung function, 2
predominantly obstructive dysfunction, 1 reported from 58 patients 18 had
obstructive dysfunction and 16 had restrictive dysfunction and finally 1 reported
predominantly restrictive dysfunction (Obenour et al., 1972, Sabate et al.,
1996a, Sabate et al., 1996b, Mikaelee et al., 2006, Seccombe et al., 2011,
Wang et al., 2014). The 1 study that measured TLC and reported a
predominantly restrictive pattern of pulmonary dysfunction based this on
spirometry results and not the TLC results. Looking at the graphical
representation of the TLC results in the afore mentioned paper this was not
consistent with a finding of restrictive dysfunction (Wang et al., 2014).
Whilst 44 (68.75%) of the non-smokers and 17 (47.22%) of the smokers had
normal lung function, 18 (28.13%) of the non-smokers and 18 (50.00%) of the
smokers had obstructive lung function. No participants had mixed obstructive
and restrictive pictures. It is an expected finding of a high prevalence of
obstruction in those with known asthma or COPD and those with a known
significant smoking history. With only 50% in the smokers group demonstrating
obstructive spirometry it does however raise the question of previous accurate
112
diagnoses of those labelled with obstructive lung disease. An unexpected
finding was in the non-smokers that over 25% had obstruction based on
FEV1/FVC ratio. This result is even more interesting when the severity of the
obstruction is categorised as highlighted in table 9. Of the 18 non-smokers with
obstructive spirometry, 16 (88.89%) were categorised as stage 1 or mild with a
FEV1 ≥80% predicted. Of these, 7 had a FEV1 of >100% predicted. As reported
in table 7, when looking at FEV1 and FVC in isolation and not as a ratio there is
a tendency towards supranormal results with the median FEV1 and median
FVC results, in both the smokers and non-smokers, being more than 100%
predicted. In the non-smokers with normal lung function, 34 out of 44 had a
FEV1 and FVC of >100% predicted and in the smokers with normal lung
function, 11 had a FEV1 of >100% predicted and 12 had a FVC of >100%
predicted. In addition to questioning the previous diagnoses of some of those
diagnosed with obstructive lung disease these findings raise questions; why
does there seem to be a high prevalence of supranormal (>100% predicted)
values of FEV1 and FVC in this population and why do over 25% of non-
smokers with PD have obstructive spirometry?
In this study “supranormal” values are described as those >100% predicted,
and whilst it is unlikely that values less than 120% predicted are clinically
relevantly “supranormal”, these are interesting findings none the less. These
supranormal FEV1 and FVC values also further add evidence that restriction is
not a typical characteristic in this demographic. It could be postulated that the
reference (predicted) equations used in this study, and routinely in clinical
practice, of European Community for Coal and Steel (ECCS) published in 1993,
may be out of date and do not reflect current populations. As described in
section 2.2.2, dating back over 30 years, prospective and retrospective studies
have demonstrated an inverse correlation between PD and smoking concluding
a reduced risk of developing PD in smokers. With this in mind, the individuals
with PD in this study may represent a large proportion of those with no direct
smoking or passive smoking history and resultant supranormal FEV1 and FVC
values.
Over 25% of the non-smokers group had evidence of obstruction based on the
ratio of FEV1/FVC. Whilst in this group the individual measurements of FEV1
and FVC in some participants may have been normal or supranormal, the ratio
of FEV1/FVC still indicated obstruction to airflow in the volume that could be
113
forcibly exhaled in the first second compared to the FVC. Obstructive lung
disease is characterised by lower airway obstruction and is caused by any
disease that obstructs the airflow, for example by narrowing the airways (e.g.
asthma). An obstructive ventilatory defect is represented by a disproportionate
reduction in expiratory maximal airflow in relation to maximal volume, i.e. FEV1
is reduced more than FVC and thus FEV1/FVC is lowered (Ranu et al., 2011,
Pellegrino et al., 2005). This reduction in the volume of air that can be forcibly
exhaled in the first second suggests airway narrowing during exhalation
(Pellegrino et al., 2005). Generating maximal flows during FVC manoeuvres
requires rapid activation of appropriate driving pressures by respiratory
muscles, coordinated with stabilisation of extrathoracic airway muscles to
optimise the dimensions of, and flow through, the extrathoracic airway. With this
in mind, could upper airway obstruction (UAO) be sufficiently severe to limit
airflow and demonstrate obstructive spirometry or is the obstruction from, or
contributed to by, another site. As highlighted in the results there is evidence of
UAO which will be further discussed in detail, however noting the median
results of FEF25-75 % predicted of 83.50% and 61.50% in the non-smokers
and smokers respectively purely attributing obstructive spirometry to UAO may
not be appropriate. Although the FEF25-75 was above 80% predicted in the
non-smokers, as reported in table 7, noting the other supranormal values in this
demographic this may reflect a reduction. Changes in FEF25-75 provide
information about the small airways and a reduction in this measurement is
often an early change reflecting airflow obstruction in these small airways.
Thus other contributors to obstruction need to be considered. The majority of
PD patients have symptoms or signs of dysautonomia. Dysfunction of
components of the autonomic nervous system (ANS) can produce characteristic
clinical signs and symptoms. Cardiovascular dysautonomia is commonly
reviewed where as other dysautonomias may be overlooked (Goldstein, 2014).
Dysautonomia of the respiratory system does not appear to be researched in
PD but could easily be a cause of obstruction. Bronchial smooth muscle and
mucous glands both affect the diameter of airways and thus resistance to
airflow, i.e. obstruction. The afore mentioned are also the targets of the ANS
within the respiratory system with the upper thoracic sympathetic ganglia, and
the dorsal motor nucleus of the vagus providing the autonomic nerves to the
airways. The parasympathetic ganglia found in the bronchi and bronchioles
114
innervate airway smooth muscle and glands. The parasympathetic innervation
of bronchial smooth muscle is greater than that of the sympathetic system and
stimulation of the vagus causes bronchoconstriction and the vagus also causes
secretion of mucus. Thus it could be postulated that dysautonomia associated
with PD causing parasympathetic over activity could be the cause of airway
narrowing, increased resistance to airflow and the subsequent obstructive
spirometry.
Consideration of possible causes of obstruction also need to be reflected back
to the pathophysiology of PD, particularly alpha-synuclein and Lewy pathology.
As already discussed Lewy pathology is not restricted to the brain and has also
been found to affect the autonomic nervous system, including the
cardiovascular autonomic system. There is increasing research and interest in
the involvement of the enteric nervous system and early positive biopsies of the
gastrointestinal system (Braak et al., 2003, Hawkes et al., 2007, Lebouvier et
al., 2010). Questions do still remain surrounding why not all individuals with PD
suffer autonomic dysfunction and why presence of pathology does not always
translate into symptoms (Ferrer, 2011). However despite the interest in Lewy
body formation in the bowel, there seems to have been little or no research
looking at potential Lewy body formation and lung and airway parenchyma.
Previous cellular research reported that in addition to a presynaptic nerve
terminal protein, alpha-synuclein is also expressed in cultured human
astrocytes and its levels are increased by stimulation with interleukin-1beta.
This suggests it has potential involvement in inflammatory processes and
immune responses. The authors further investigated the effect of inflammatory
stimuli on alpha-synuclein expression in human macrophages and particularly
noted that alpha-synuclein immunoreactivity was present in alveolar
macrophages from human lung tissues (Tanji et al., 2002). This potential
involvement of alpha-synuclein in inflammatory processes and presence in the
lung could feasible contribute to airway obstruction.
Focusing on a more clinical level, the cardinal features and motor symptoms of
PD; bradykinesia, tremor and rigidity, could be causing obstructive lung
function. Bradykinesia being slowness of movement and hypokinesia meaning
movements are small in addition to being slow. Rigidity is frequently described
as “lead pipe rigidity” and may be felt in the limbs or more proximally, termed
axial rigidity, in the neck and trunk. Tremor can be frequently evident in the legs,
115
lips, chin and jaw and patients often describe a sensation of internal tremor, a
feeling of tremor inside the chest, abdomen, arms, or legs that cannot be seen
on the outside (Shulman et al., 1996). Pulmonary function testing tests many
effort dependent variables and also those over a timed period. Focusing on
FEV1 and the ratio of FEV1/FVC that represents obstruction, is represented by
a comparatively lower (more affected) FEV1 than FVC. The slowness of
movement of bradykinesia and potential start hesitation may affect the
recording of FEV1, as this is a measurement over the first 1 second of the
procedure, more markedly than it affects FVC resulting in lower FEV1 than
would be expected and thus resultant obstruction. Air flow, particularly when
considering the upper airways, requires considerable coordination to achieve
maximal flow and no restriction to the flow. Tremor, rigidity and bradykinesia
could contribute to disorganised movements of respiratory muscles that become
important variables in inducing obstruction. It is important to acknowledge when
considering FEV1 and PEF measurements, the initial 25-33% of FVC exhaled
depends primarily on muscular effort rather than the mechanical
characteristics of the lungs and hence these measurements also reflect the
calibre of the central airways and force exerted by expiratory muscles and this
initial activation could be impaired by the clinical features of PD. It also has to
be considered that disorganised movements of the respiratory muscles could be
caused by dyskinesia, dystonia and medication and also affect lung function.
Upper airways obstruction warrants a significant amount of discussion and
consideration if involvement of the upper airway musculature is significantly
severe enough to limit air flow.
The upper airway can be considered to extend from the mouth to the carina,
subdivided into extrathoracic and intrathoracic portions. During inspiration, the
intrathoracic airways expand with the expanding lungs and the calibre of
extrathoracic airways diminishes in caliber due to their intraluminal pressure
being lower than the atmospheric pressure. During expiration this pattern is
reversed. Large airway flow is turbulent and this turbulence increases if the
diameter of the airway reduces. As extensively discussed in section 2.3.3, the
most useful indicator of UAO is visual inspection of the flow volume loop.
Numeric indices can be indicators of UAO and those highlighted in table 12
represent different aspects of UAO however no “formula” as such exists to
define UAO from a combination of numerical indices, they are however
116
indicators. It would stand to reason that the more numeric indicators of UAO an
individual demonstrates the more likely that this is clinically significant.
Focusing on tables 12 and 13 and on figure 18, the most striking feature is the
prevalence of visual and numeric indicators of UAO and the cumulative
numbers of indicators in each individual. Each numeric indicator of UAO is seen
in between 3.17% and 37.74% of non-smokers and 8.33% and 27.27% of
smokers. In the non-smokers the most commonly seen numeric indicator is
MEF50/MIF50 >1 and in the smokers is PIF <3l/s. Reflecting back to flow
volume loops, these 2 indicators suggest the inspiratory portion is more affected
which would be seen in variable extrathoracic UAO. This finding is supported by
visual inspection for flattened inspiratory loop which was seen in 37.50% and
38.89% of non-smokers and smokers respectively. Other visual indicators of
UAO were even more commonly seen, with flow oscillations “saw tooth” seen in
60.94% (marked in 29.69%) and 52.78% (marked in 19.44%) of non-smokers
and smokers respectively. Abrupt flow changes were seen in 17.19% of non-
smokers and 25.00% of smokers. Cumulative numbers of UAO criteria were
high in both groups with it being more common to have criteria indicating UAO
than no indicators of UAO. Given the highlighted prevalence of UAO in this
group it is entirely feasible that involvement of the upper airway musculature is
significantly severe enough to limit air flow and demonstrate obstructive
spirometry.
Thus it has to be considered why and what causes UAO and turbulent airflow to
be so prevalent in this patient demographic. The intrathoracic airway has the
relative protection of the thoracic cage, however the extrathoracic airway is
surrounded closely by muscles required for respiration and the accessory
muscles in the neck. It is known that PD demonstrates axial involvement and
thus it is more than feasible that these muscles are affected. Bradykinesia and
rigidity of these muscles could lead to UAO and given that muscle dysfunction
in PD is often asymmetrical, this may lead to laterality of muscles and different
muscles affected in asymmetrical ways which may cause distortion of the upper
airway and disorganised movements subsequently causing UAO. Abrupt
changes, at times down to baseline on the flow volume loops, suggest
intermittent airway closure which again may be caused by disorganised upper
airway musculature movement. Dyskinesia seen in some individuals with PD
may also potential involve the upper airway musculature and cause abrupt
117
changes and distortions. Given the pathophysiology of PD and clinical signs of
tremor, it is likely that regular “saw tooth” oscillations causing UAO are caused
by tremor of the upper airway musculature. It has to be born in mind, particularly
when considering symptoms and future research, this finding was historically
believed to be predominantly characteristic of the upper-airway narrowing seen
in obstructive sleep apnoea (OSA). The intermittent nocturnal hypopharyngeal
obstruction in OSA is probably the commonest form of UAO and flow volume
loops in these patients may have this “saw tooth” sign of regular oscillations
(Krieger et al., 1985).
Finally respiratory muscle function tests are to be considered, importantly as it
is very unusual for respiratory muscles to be spared in neuromuscular
disorders. In normal individuals, expiratory pressures are higher than inspiratory
pressures and SNIP results are generally higher than MIP results. As detailed in
table 14 the respiratory muscle strength tests in this demographic revealed very
interesting results. The smokers group demonstrated higher percent predicted
values than the non-smokers in all the expiratory and inspiratory strength tests.
This is in itself an interesting finding with various potential causes for this; it may
be that the severity of axial disease involvement in this group was less or even
chronic respiratory symptoms have conditioned these muscles for example for
stronger cough. In both the non-smokers and smokers, inspiratory results were
worse than expiratory results; with median MEP percent predicted of 82.34 and
96.82, MIP of 79.02 and 82.21 and SNIP of 58.53 and 63.96 in non-smokers
and smokers respectively. As discussed in section 2.3.6 severe generalised
respiratory muscle weakness manifests as breathlessness and tachypnoea and
nocturnal hypoventilation disturbs sleep, cognitive function and causes daytime
somnolence, finally resulting in ventilatory failure and cor pulmonale. Inspiratory
muscle weakness tends to cause dyspnoea and poor exercise tolerance, while
expiratory muscle and bulbar weakness leads to speech problems, impaired
cough and predisposes to mucus retention, pneumonia and aspiration.
Two interesting features warrant further discussion; why is SNIP worse than
MIP and why are inspiratory muscles seemingly more affected than expiratory
muscles? It would be expected that SNIP results would be higher than MIP but
the opposite was true in our population. Considering the Braak hypothesis and
olfactory bulb involvement in PD it may be postulated that these patients
struggle to perform the SNIP manoeuvre. Another possibility is the effect of start
118
hesitation and bradykinesia; SNIP is a ballistic manoeuvre requiring immediate
activation and force with the highest value recorded, where as MIP is a
sustained over 1 second measurement. Given the pathophysiology of PD it is
possible that the ballistic nature of a SNIP manoeuvre is more difficult for this
group. Inspiratory muscles being more affected than expiratory muscles is a
fascinating finding as it has previously been suggested that in the presence of
disease the inspiratory muscles may lose less strength than the expiratory
muscles due to baseline EMG activity of inspiratory muscles always being
greater than that of expiratory muscles during quiet breathing with the
inspiratory and expiratory muscles assuming different roles within the breathing
cycle; during tidal volume breathing the inspiratory muscles have constant
activation, whilst abdominal/expiratory muscles assume less of a role because
expiration during tidal breathing is due to passive recoil (De Troyer and
Estenne, 1984, Silverman et al., 2006). The worse inspiratory results in this
demographic may be due to the asymmetric nature of PD and a tendency to not
affect all muscles equally and could also be due to difficulty coordinating
muscular manoeuvres, particularly unfamiliar ones, with MIP being a less
intuitive and automatic procedure than MEP.
The results of the cross-sectional study have shown a notable prevalence of
obstruction, upper airways obstruction and inspiratory muscle weakness in this
population. This pattern of dysfunction of the respiratory system could lead to
increased morbidity and mortality. With inspiratory muscle weakness individuals
could suffer dyspnoea, hypoxia, tachypnoea, increased respiratory infections
reduced exercise tolerance and impaired functional capacity. Speaking and
swallowing require coordinated, precise upper airway movements; UAO could
contribute to speech and swallowing difficulties, hypophonia, sleep disordered
breathing, excessive daytime somnolence, acute respiratory failure and difficulty
in extubation. Given these significant findings, further research is warranted to
assess the benefit of rehabilitation of the pulmonary system, both
pharmacologically and non-pharmacologically. The effect of dopaminergic
treatment on pulmonary function needs to be assessed in detail and
rehabilitation, by general and specific inspiratory muscle training, warrants
significant further study.
119
4.5 Strengths and limitations
The cross-sectional study had both strengths and limitations. The study had a
significant amount of strengths which most notably included; the largest study to
date in pulmonary function in PD, dichotomising but including both smokers and
non-smokers, testing performed to gold standards by experienced respiratory
physiologists accredited to ARTP and body plethysmography assessment of
lung volumes to determine TLC. There were also some limitations to the study;
in retrospect with the results we have obtained it would have been useful to also
assess peak cough flow (PCF) and airway resistance (RAW), as described in
the results a number of inspiratory flow volume loops were excluded, it would
have been interesting to perform more comprehensive bulbar function
assessments and including more participants with higher Hoehn and Yahr
scores would also have been very informative. As detailed in the patient
information sheet, capillary blood gas sampling was attempted, this was chosen
above arterial blood gas sampling to be less invasive and painful however the
sampling technique was not successful in this study population and was
abandoned after a number of attempts. Although a commonly used technique in
neonates and paediatrics, in adults the blood would not advance successfully
down the glass sampling tube and as such the analyser could not produce a
result. Given the broad ranging nature of the variables studied it was decided
not to apply corrections for multiple comparisons. Since the study was largely
observational and exploratory, on balance it was felt that each variable
considered was sufficiently unique and so no two variables were from the same
family, to make correction for multiple comparisons unnecessary. This is
however acknowledged as a limitation as it is important to recognise that in
some cases significance may have been over estimated for this reason.
4.6 Conclusion
Reflecting back to the hypothesis that pulmonary function is impaired in PD and
the aim and objective of the cross-sectional part of the study; to establish
whether pulmonary function is impaired in IPD and to define the pattern of
respiratory dysfunction in IPD, the hypothesis is accepted and the aim and
objective have been achieved. The results of the cross-sectional study have
shown a notable prevalence of obstructive spirometry, upper airways
obstruction and inspiratory muscle weakness in this population. This pattern

120
was observed in both non-smokers and smokers or those with known
obstructive lung disease. This pattern of dysfunction of the respiratory system
could lead to increased morbidity and mortality. Given these significant findings,
further research is warranted to assess the benefit of rehabilitation of the
pulmonary system, both pharmacologically and non-pharmacologically. The
effect of dopaminergic treatment on pulmonary function needs to be assessed
in detail and rehabilitation, by general and specific inspiratory muscle training,
warrants significant further study.
121
Chapter 5. Methods: Randomised control trial; the effect of an
exercise intervention on pulmonary function,
cardiorespiratory fitness and exercise capacity in idiopathic
Parkinson’s disease
The second part of the study was a RCT looking at the effect of an exercise
intervention on pulmonary function, cardiorespiratory fitness and exercise
capacity in IPD.
5.1 Participant recruitment
As per the cross-sectional study, participant recruitment commenced in August
2012. Individuals with IPD were recruited from the Northumbria Healthcare NHS
Foundation Trust Parkinson’s Service. Patients were approached in both
medical and specialist nurse clinics, and given verbal information and written
information sheets to take away (see appendices 9.5). The target recruitment
for the study was 30. These 30 were included in the 100 in the cross-sectional
study as the baseline demographics, assessments and lung function testing
were the same. Patients who were willing to participate, fulfilled all inclusion
criteria and with an absence of exclusion criteria, were recruited to the study
and asked to sign a consent form (see appendices 9.6). The study consisted of
6 visits. At Visit 1 the participants were randomised 1:1 to a control or an
intervention group. The baseline assessments took place over 3 visits during a
2 week period. The control group then received normal care for 12 weeks and
the intervention group took part in a 12 week exercise intervention. After the 12
week period, all baseline assessments were repeated over the 3 visits during a
2 week period.
5.2 Inclusion criteria
Inclusion criteria for the study were:
Idiopathic Parkinson’s Disease by the UK PD Society Brain Bank
Criteria.
Hoehn and Yahr Stage I-III.
Ability to provide written informed consent.
Aged 18 years or over.
122
5.3 Exclusion criteria
Exclusion criteria for the study were:
Other forms of Parkinsonism e.g. drug induced.
Significant medical conditions which would preclude lung function testing.
Significant medical conditions which would preclude exercise.
Pregnancy.
Recent diagnosis of a blood clot, deep vein thrombosis, pulmonary
embolism or myocardial infarction.
Unstable cardiac status, haemoptysis, pneumothorax, thoracic,
abdominal or cerebral aneurysm.
Recent eye, thoracic or abdominal surgery
5.4 Study journey, assessments, questionnaires and outcome measures
After recruitment participants were booked to attend 6 visits. Visits 1 and 4 took
place in the Education Centre at North Tyneside General Hospital. Visits 2 and
5 took place in the Pulmonary Function Department at North Tyneside General
Hospital. Visits 3 and 6 took place at the MoveLab, Clinical Research Facility,
Royal Victoria Infirmary, Queen Victoria Road, Newcastle upon Tyne, NE1 4LP.
Transport was arranged if required and travel expenses were reimbursed.
Participants received no payment for participation in the study.
At visit 1, consent was confirmed and an assessment document was completed.
The assessment included patient demographics, details of the patient’s PD, PD
medication, PD symptoms, respiratory symptoms, past medical history (PMH),
family history (FH), social history (SH), exercise history, speech assessment
and general examination. The Movement Disorders Society Unified Parkinson's
Disease Rating Scale (MDS-UPDRS), the Parkinson’s Disease Questionnaire
(PDQ-39), SCOPA-SLEEP questionnaire, Hospital Anxiety and Depression
Scale (HADS), Mini Mental State Examination (MMSE), Trail Making Test and
an electrocardiogram (ECG) were completed. Clinical Research Facility
Standard Operating Procedures documentation was completed. Blood tests
were taken for full blood count (FBC) and brain derived neurotrophic factor
(BDNF). Permissions were granted for use of all rating scales. At the end of visit
1 the participants were randomised to either the control group or the
intervention group. The randomisation process involved the participants blindly
drawing out of a bag a piece of paper. The piece of paper had either 1 or 0 on it,
123
1 denoted randomisation to the intervention group, 0 denoted randomisation to
the control group.
At visit 2, full pulmonary function tests were undertaken, with spirometry, lung
volumes (plethysmography), diffusion and respiratory muscle strength tests
Mouth Pressures and Sniff Nasal Inspiratory Pressure (SNIP).
At visit 3, cardiorespiratory fitness (aerobic capacity) was assessed with a
Cardiopulmonary Exercise Test (CPET), measuring VO2peak. A Montreal
Cognitive assessment (MoCA) was performed and exercise capacity was
measured by the Six Minute Walk Test (6MWT).
After the first 3 visits, the control group received normal care for 12 weeks and
the intervention group participated in a 12 week exercise intervention at Moor
Park Healthy Living Centre, Drury Lane, North Shields, NE29 8SR. After the 12
week period, all baseline assessments were repeated in both the control and
intervention groups. Visits 4, 5 and 6 followed the same format as visits 1, 2 and
3 respectively. Figure 19, below, illustrates the patient journey.
There was a minor change in the order of the assessments detailed in the
patient information sheet and the patient journey above. The MoCA and 6MWT
were performed at visits 3 and 6 instead of 1 and 4. The change was made in
the 6MWT location due to the Clinical Research Facility having a more suitable
and quiet location than the Jubilee Day Hospital for setting out the length of
course required for the 6MWT. The MoCA was changed so that it was not
performed on the same day as the MMSE and in addition was performed
between the CPET and the 6MWT to allow the patients a period of physical rest
between the two physically demanding assessments.
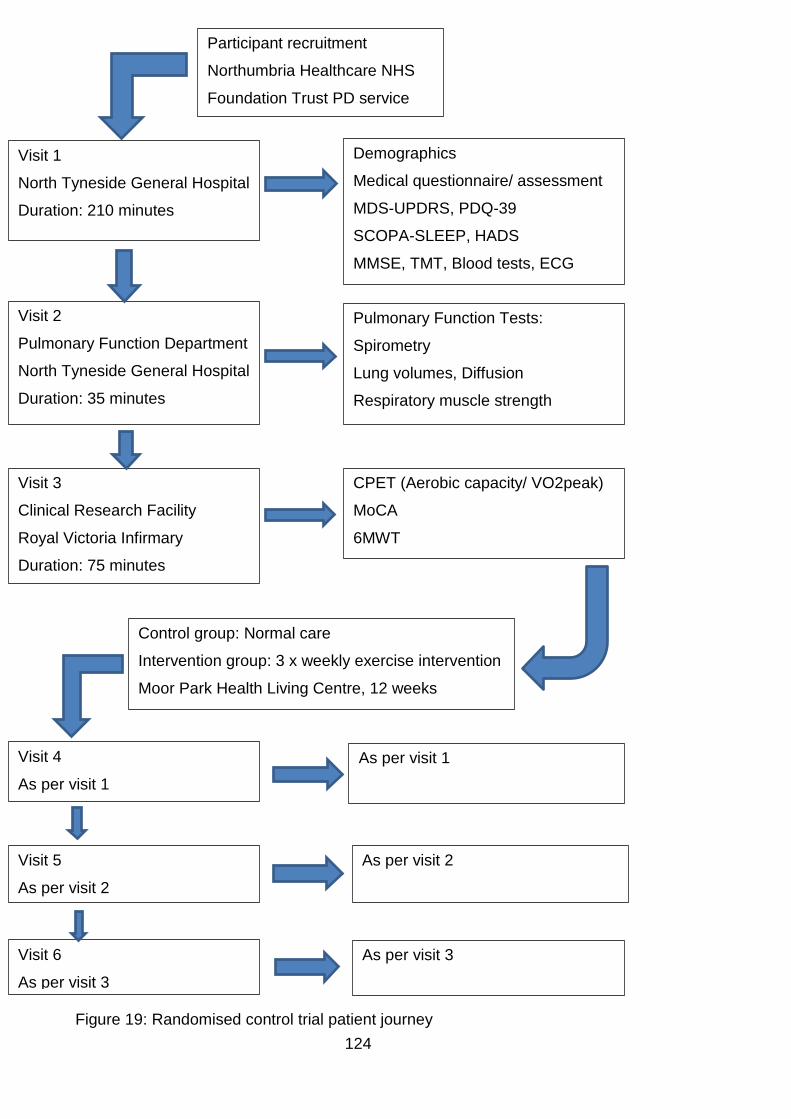
124
Figure 19: Randomised control trial patient journey
Participant recruitment
Northumbria Healthcare NHS
Foundation Trust PD service
Visit 1
North Tyneside General Hospital
Duration: 210 minutes
Demographics
Medical questionnaire/ assessment
MDS-UPDRS, PDQ-39
SCOPA-SLEEP, HADS
MMSE, TMT, Blood tests, ECG
Visit 2
Pulmonary Function Department
North Tyneside General Hospital
Duration: 35 minutes
Pulmonary Function Tests:
Spirometry
Lung volumes, Diffusion
Respiratory muscle strength
Visit 3
Clinical Research Facility
Royal Victoria Infirmary
Duration: 75 minutes
CPET (Aerobic capacity/ VO2peak)
MoCA
6MWT
Control group: Normal care
Intervention group: 3 x weekly exercise intervention
Moor Park Health Living Centre, 12 weeks
Visit 4
As per visit 1
As per visit 1
Visit 5
As per visit 2
As per visit 2
Visit 6
As per visit 3
As per visit 3
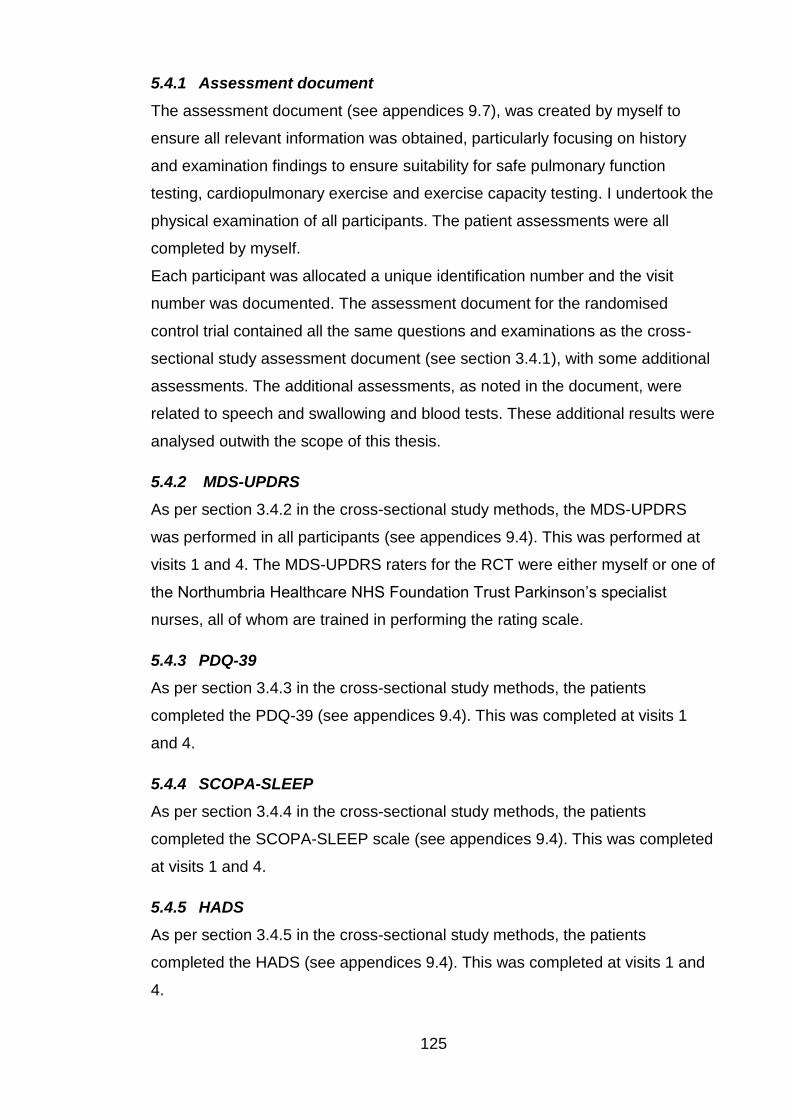
125
5.4.1 Assessment document
The assessment document (see appendices 9.7), was created by myself to
ensure all relevant information was obtained, particularly focusing on history
and examination findings to ensure suitability for safe pulmonary function
testing, cardiopulmonary exercise and exercise capacity testing. I undertook the
physical examination of all participants. The patient assessments were all
completed by myself.
Each participant was allocated a unique identification number and the visit
number was documented. The assessment document for the randomised
control trial contained all the same questions and examinations as the cross-
sectional study assessment document (see section 3.4.1), with some additional
assessments. The additional assessments, as noted in the document, were
related to speech and swallowing and blood tests. These additional results were
analysed outwith the scope of this thesis.
5.4.2 MDS-UPDRS
As per section 3.4.2 in the cross-sectional study methods, the MDS-UPDRS
was performed in all participants (see appendices 9.4). This was performed at
visits 1 and 4. The MDS-UPDRS raters for the RCT were either myself or one of
the Northumbria Healthcare NHS Foundation Trust Parkinson’s specialist
nurses, all of whom are trained in performing the rating scale.
5.4.3 PDQ-39
As per section 3.4.3 in the cross-sectional study methods, the patients
completed the PDQ-39 (see appendices 9.4). This was completed at visits 1
and 4.
5.4.4 SCOPA-SLEEP
As per section 3.4.4 in the cross-sectional study methods, the patients
completed the SCOPA-SLEEP scale (see appendices 9.4). This was completed
at visits 1 and 4.
5.4.5 HADS
As per section 3.4.5 in the cross-sectional study methods, the patients
completed the HADS (see appendices 9.4). This was completed at visits 1 and
4.
126
5.4.6 ECG
A 12 lead ECG was performed at visits 1 and 4, firstly to look for any
abnormalities that would be a contraindication, or require review by a
cardiologist prior, to cardiopulmonary exercise testing (CPET) or an exercise
intervention. Abnormalities to prompt further investigation include; ST segment
changes (e.g. excessive ST depression, down sloping ST depression, abnormal
ST elevation), bradyarrhythmias (e.g. heartblocks, slow atrial fibrillation) and
tachyarrhythmias (e.g. ventricular tachycardia, supraventricular tachycardia).
A baseline ECG and ECG monitoring is vital during CPET to differentiate
normal and abnormal ECG responses to exercise. Certain ECG changes during
exercise are absolute indications to terminate a CPET.
During exercise, normal ECG responses include; minor insignificant changes in
P-wave morphology, increases in septal Q-wave amplitude, superimposition of
the P and T-waves of successive beats, slight decreases in R-wave amplitude,
increases in T-wave amplitude, depression of the J point, minimal shortening of
QRS duration and rate-related shortening of the QT interval (ACSM, 2010).
5.5 Pulmonary function measurement
At visits 2 and 5, full pulmonary function tests were performed as detailed in
sections 3.5, 3.5.1, 3.5.2, 3.5.3 and 3.6. All participants had spirometry, flow
volume curves, lung volumes (whole body plethysmography), diffusion and
respiratory muscle strength measurements.
5.6 Cardiorespiratory fitness measurement
For visits 3 and 6, participants attended the Clinical Research Facility at the
Royal Victoria Infirmary for CPET. Cardiopulmonary exercise testing was
completed in compliance with local standard operating procedures for exercise
testing within Newcastle University and Newcastle Hospitals NHS Trust.
Aerobic capacity was assessed using a maximal progressive exercise test
(ramp protocol) exercise test on an electro-magnetically controlled recumbent
bicycle ergometer (Corival, Lode, Groningen, Netherlands, see figure 20).
Expired gases were collected at rest for 5 minutes and continuously during the
CPET. Online gas analysis was conducted using a Metalyzer 3B (Cortex,
Leipzig, Germany, see figure 21). The Metalyzer works on the principle of a
mixing chamber and expired gases were recorded and analysed, then averaged
every 10 seconds. As per the manufacturer’s guidelines, the system was
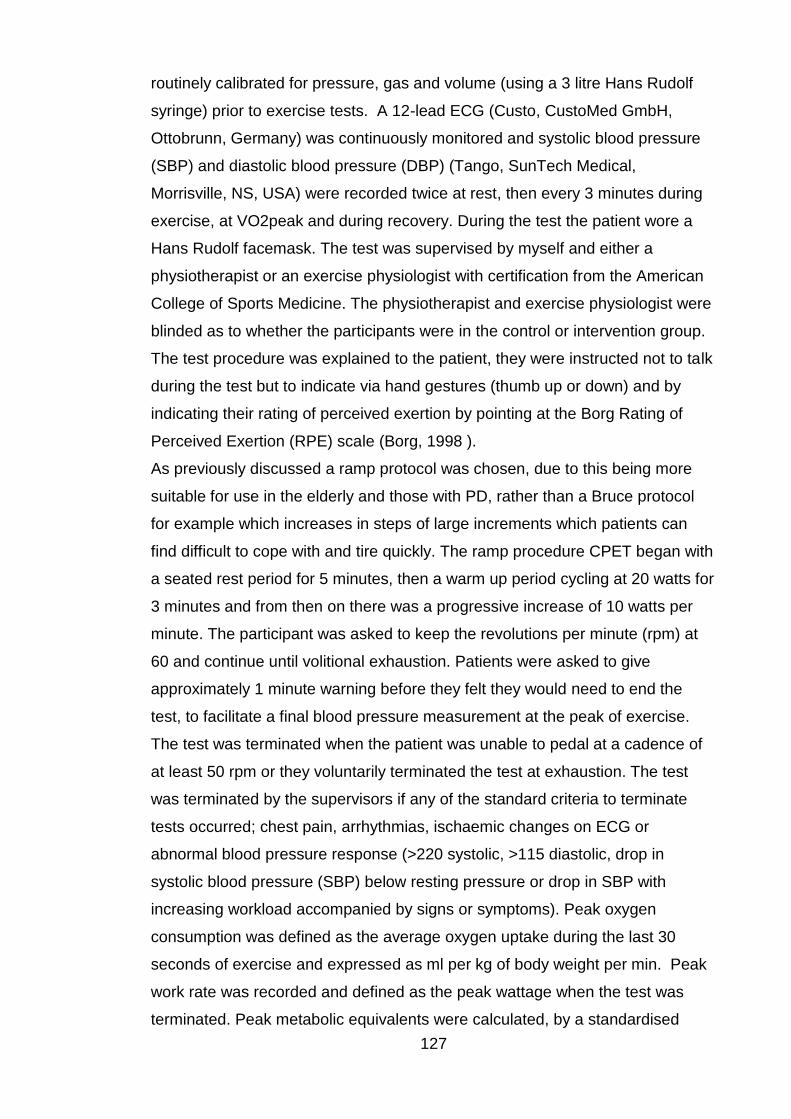
127
routinely calibrated for pressure, gas and volume (using a 3 litre Hans Rudolf
syringe) prior to exercise tests. A 12-lead ECG (Custo, CustoMed GmbH,
Ottobrunn, Germany) was continuously monitored and systolic blood pressure
(SBP) and diastolic blood pressure (DBP) (Tango, SunTech Medical,
Morrisville, NS, USA) were recorded twice at rest, then every 3 minutes during
exercise, at VO2peak and during recovery. During the test the patient wore a
Hans Rudolf facemask. The test was supervised by myself and either a
physiotherapist or an exercise physiologist with certification from the American
College of Sports Medicine. The physiotherapist and exercise physiologist were
blinded as to whether the participants were in the control or intervention group.
The test procedure was explained to the patient, they were instructed not to talk
during the test but to indicate via hand gestures (thumb up or down) and by
indicating their rating of perceived exertion by pointing at the Borg Rating of
Perceived Exertion (RPE) scale (Borg, 1998 ).
As previously discussed a ramp protocol was chosen, due to this being more
suitable for use in the elderly and those with PD, rather than a Bruce protocol
for example which increases in steps of large increments which patients can
find difficult to cope with and tire quickly. The ramp procedure CPET began with
a seated rest period for 5 minutes, then a warm up period cycling at 20 watts for
3 minutes and from then on there was a progressive increase of 10 watts per
minute. The participant was asked to keep the revolutions per minute (rpm) at
60 and continue until volitional exhaustion. Patients were asked to give
approximately 1 minute warning before they felt they would need to end the
test, to facilitate a final blood pressure measurement at the peak of exercise.
The test was terminated when the patient was unable to pedal at a cadence of
at least 50 rpm or they voluntarily terminated the test at exhaustion. The test
was terminated by the supervisors if any of the standard criteria to terminate
tests occurred; chest pain, arrhythmias, ischaemic changes on ECG or
abnormal blood pressure response (>220 systolic, >115 diastolic, drop in
systolic blood pressure (SBP) below resting pressure or drop in SBP with
increasing workload accompanied by signs or symptoms). Peak oxygen
consumption was defined as the average oxygen uptake during the last 30
seconds of exercise and expressed as ml per kg of body weight per min. Peak
work rate was recorded and defined as the peak wattage when the test was
terminated. Peak metabolic equivalents were calculated, by a standardised
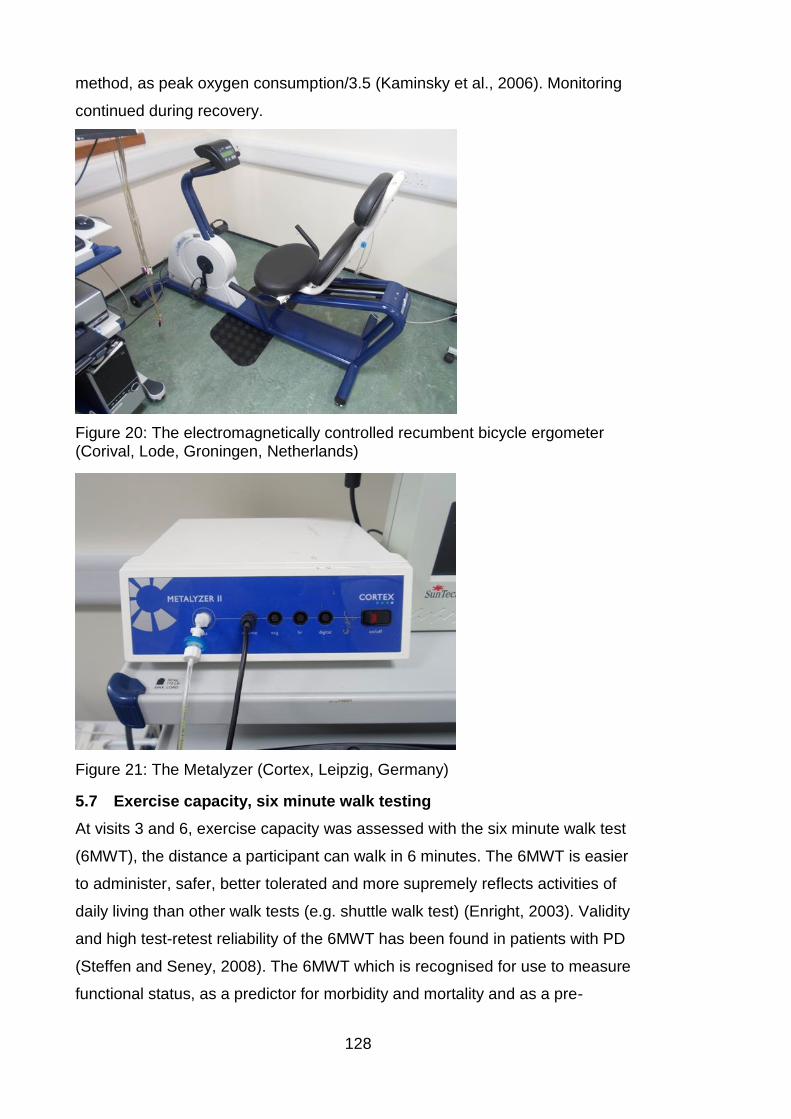
128
method, as peak oxygen consumption/3.5 (Kaminsky et al., 2006). Monitoring
continued during recovery.
Figure 20: The electromagnetically controlled recumbent bicycle ergometer (Corival, Lode, Groningen, Netherlands)
Figure 21: The Metalyzer (Cortex, Leipzig, Germany)
5.7 Exercise capacity, six minute walk testing
At visits 3 and 6, exercise capacity was assessed with the six minute walk test
(6MWT), the distance a participant can walk in 6 minutes. The 6MWT is easier
to administer, safer, better tolerated and more supremely reflects activities of
daily living than other walk tests (e.g. shuttle walk test) (Enright, 2003). Validity
and high test-retest reliability of the 6MWT has been found in patients with PD
(Steffen and Seney, 2008). The 6MWT which is recognised for use to measure
functional status, as a predictor for morbidity and mortality and as a pre-
129
treatment and post-treatment comparison, was performed in line with ATS
guidelines (ATS, 2002).
The 6MWT was performed in a quiet flat corridor, with 30 metres marked by a
tape measure and orange traffic cones. The participant was asked to walk
clockwise around the cones and to cover as greater distance as possible. The
participant was instructed not to jog or run and they were allowed to stop or take
breaks if needed. The participant was informed when they had 3 minutes, 1
minute and 10 seconds remaining. The total distance walked (six minute walk
distance (6MWD)) was recorded.
5.8 The structured exercise therapy intervention
The intervention group underwent a structured exercise programme designed to
improve cardiorespiratory fitness and exercise capacity. As reviewed in section
2.4.4, there is a distinct paucity of research looking at the effect of exercise
interventions on aerobic capacity or VO2peak in PD. Therefore a programme
was designed by myself, in conjunction with a physiotherapist. A patient
volunteer (Hoehn and Yahr III) was involved in the design and testing of the
programme to ensure the programme was suitable, manageable and enjoyable
for differing stages of PD including those with more advanced disease.
With aerobic capacity, or VO2max, being a function of, and thus limited by, the
ability of the cardiovascular system to supply (QT) and/or the skeletal muscles to
use (a-vO2 diff) oxygen, the programme was designed to include both aerobic
and resistance exercise. Despite exercise training being a cost effective,
clinically proven, primary intervention that can reduce mortality, and even delay
the onset of chronic diseases, there is no consensus of the type and dose of
exercise required to accrue the required benefit (Gibala et al., 2012). It was
traditionally acknowledged that within each level of exercise duration,
frequency, programme length or initial fitness level, the greatest improvements
in VO2max occurred when the participants exercised at higher intensities (e.g.
from 90 to 100% of V̇O2max) with maximal gains at a frequency of 4 times per
week and exercise duration of 35-45 minutes. Lower intensities still produced
effective changes and reduced injury risk. As fitness improved, the change in
VO2max decreased regardless of the intensity, frequency or duration of
exercise, or to put it another way, the more unfit had the most to gain (Wenger
and Bell, 1986). In recent years there has been a growing interest in high
130
intensity interval training (HIT) which is considered able to serve as an effective
alternative to traditional endurance-based training and although less well
studied, low-volume HIT is acknowledged to stimulate physiological remodelling
comparable to moderate intensity continuous training (Gibala et al., 2012). Thus
no consensus remains on exercise programmes in health and disease.
With the paucity of research in this area in PD, the exercise programme was
designed to improve cardiorespiratory fitness, be manageable and safe for
those with PD and use simple readily available equipment and thus make the
study reproducible. The 12 week, 3 times per week, exercise intervention took
place at Moor Park Healthy Living Centre (HLC), which is a gym with specially
trained staff and resuscitation equipment that accepts public and NHS referrals.
The HLC is a site for cardiac and pulmonary rehabilitation and all staff are
trained to British Association of Cardiac Rehabilitation level 4 and GP referral
qualification level 3. The participants were exercised in groups of 5, to facilitate
a circuit training approach and the appropriate level of supervision (at least 2
qualified staff per session). The HLC was closed to the public and other users
during the exercise intervention. Pulse and oxygen saturations were measured
before and after each session and heart rate monitors (RS400, Polar, Finland)
were worn throughout. All sessions were in the afternoons and participants
were exercised in the on state.
The participants started and finished each session with a gentle 10 minute
warm up and cool down respectively, including stretches. Each participant
commenced at an aerobic station and moved around the 12 stations in a circuit.
The stations alternated between aerobic and resistance. The aerobic stations
were 4 minutes in duration and the resistance stations were 2 minutes in
duration. Over the course of the 12 weeks the aerobic stations were increased
to 5 minutes in duration as tolerated and time was allowed within the protocol
for movement between equipment. To increase intensity over the 12 weeks, on
relevant stations and within individual capabilities, speed, level, incline, step
height and rating of perceived exertion were increased and weights and bands
were added. Thus at the start of the study, aerobic stations comprised 6 x 4
minutes (24 minutes) and resistance stations comprised 6 x 2 minutes (12
minutes) totalling 36 minutes, with the addition of the warm up and cool down.
This allowed for an increase on the aerobic stations of 1 minute per station later
in the programme thus a total of 42 minutes and to allow for moving between
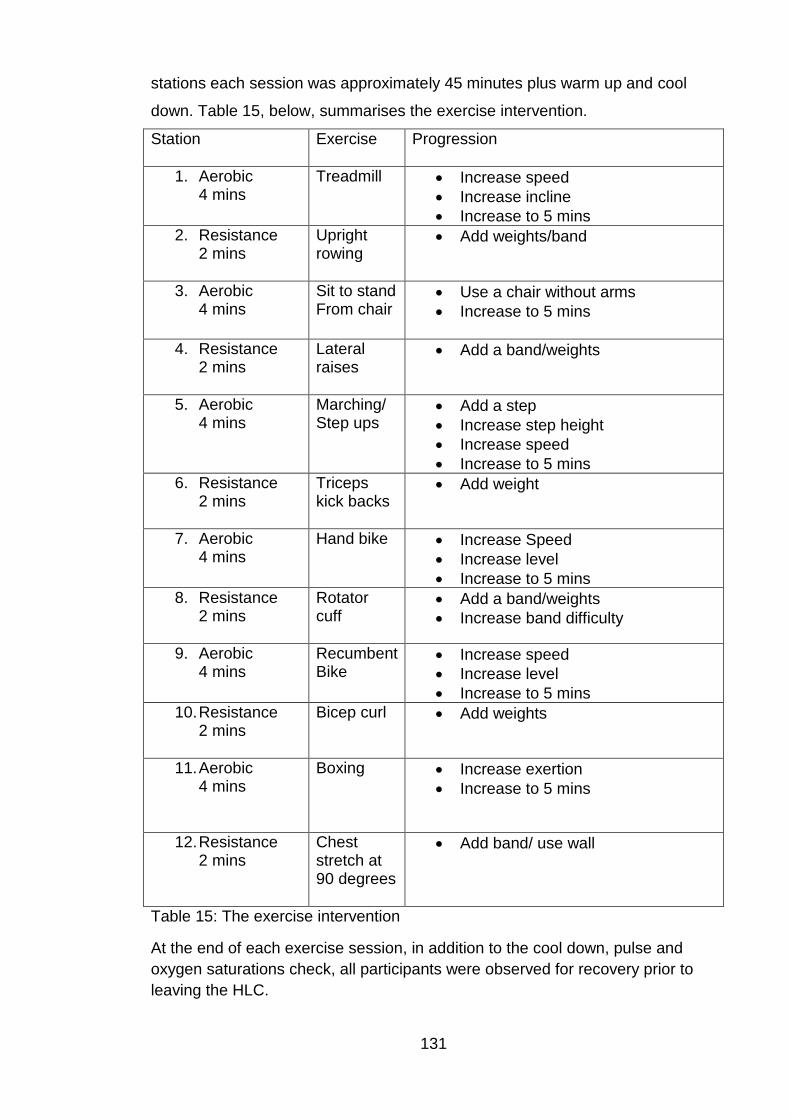
131
stations each session was approximately 45 minutes plus warm up and cool
down. Table 15, below, summarises the exercise intervention.
Station
Exercise Progression
1. Aerobic 4 mins
Treadmill Increase speed
Increase incline
Increase to 5 mins
2. Resistance 2 mins
Upright rowing
Add weights/band
3. Aerobic 4 mins
Sit to stand From chair
Use a chair without arms
Increase to 5 mins
4. Resistance 2 mins
Lateral raises
Add a band/weights
5. Aerobic 4 mins
Marching/ Step ups
Add a step
Increase step height
Increase speed
Increase to 5 mins
6. Resistance 2 mins
Triceps kick backs
Add weight
7. Aerobic 4 mins
Hand bike Increase Speed
Increase level
Increase to 5 mins
8. Resistance 2 mins
Rotator cuff
Add a band/weights
Increase band difficulty
9. Aerobic 4 mins
Recumbent Bike
Increase speed
Increase level
Increase to 5 mins
10. Resistance 2 mins
Bicep curl Add weights
11. Aerobic 4 mins
Boxing Increase exertion
Increase to 5 mins
12. Resistance 2 mins
Chest stretch at 90 degrees
Add band/ use wall
Table 15: The exercise intervention
At the end of each exercise session, in addition to the cool down, pulse and
oxygen saturations check, all participants were observed for recovery prior to
leaving the HLC.
132
5.9 Follow up 12 week assessments
All assessments were repeated at 12 weeks, for the control group after normal
care and for the intervention group after the exercise intervention. Visits 1, 2
and 3 corresponded to visits 4, 5 and 6 respectively for repeat testing. After visit
6, the control group were offered the opportunity to participate in a 12 week
exercise programme at Moor Park Healthy Living Centre (HLC), if they wished
to do so.
5.10 Sample size calculations
Based on previous stroke data (unpublished data and personal communication
from a study based at the Clinical Research Facility) and the reported
statistically significant improvement in VO2max in the Bergen et al 2002 study
of 5ml/kg/min or 26%, assuming a clinically significant improvement in VO2max
to be 5 and assuming the standard deviation for the change in scores from
baseline to post-intervention in VO2max to be no greater than 4 and setting
alpha =0.05 and power at 0.9 and using a t-test for 2 related samples gives
desired sample size of 6.7, rounding this up to 7 to achieve statistical
significance (Bergen et al., 2002).
Increase in 6MWT is likely to be the outcome of most relevance to the patients.
Based on the work of Koseoglu et al who observed a mean increase in 6MWT
distance of 108.1 (SD 31.954), setting alpha =0.05 and power at 80% and using
a t-test for 2 related samples gives a sample size of 5 to achieve statistical
significance (Koseoglu et al., 1997). Thus a RCT sample of 30 (15 intervention,
15 control) allows for significant dropout to still achieve statistical significance in
primary outcomes. A larger sample size was chosen to endeavour to have
enough participants to achieve statistical significance as the increase in 6MWT
observed in the Koseoglu study was large however their sample size was small
and it was the only prior study that focused on PD, lung function and 6MWT.
Quoted values for minimal clinically significant difference in 6MWT vary widely
between different chronic diseases, in older adults small meaningful change of
20 m and substantial change of 50 m for 6MWT has been quoted (Perera et al.,
2006).
133
Chapter 6. Results: Randomised control trial; The effect of an
exercise intervention on pulmonary function,
cardiorespiratory fitness and exercise capacity in idiopathic
Parkinson’s disease
With the distinction between the 2 sections of the study, this chapter concerns
the results, discussion and conclusion of the RCT. Having been approached by
the Northumbria PD team, 32 patients volunteered to take part in the RCT arm
of the study. These 32 were randomised 1:1 intervention to control thus 16 in
each group. A total of 27 participants completed the RCT. Two participants from
the control group failed to complete the study. The first due to inability to
perform the CPET, he was unable to pedal at a cadence of 50 rpm (this seemed
to be due to failure to understand the instructions despite repeated attempts),
thus the exercise test was abandoned. The second participant from the control
group who failed to complete the study was admitted to hospital during the 12
week normal care period, with an unrelated illness, but due to her ongoing
investigations she was excluded from follow up testing. Thus of the 2
participants who discontinued the study from the control group both had
participation terminated by the investigator. Thus 14 participants completed the
control group. In the intervention group 13 participants completed the study,
thus 3 failed to complete. The first participant to withdraw underwent all
baseline testing then subsequently declined the exercise intervention as she
was concerned she would struggle to complete. The second and third
withdrawals occurred during the intervention (1 participant’s relative became
unwell and he withdrew to assume a carer’s role and 1 participant had a viral
illness and decided to withdraw).Thus of the 3 who discontinued the study in the
intervention group all 3 were withdrawals by the participants. Figure 22, below
summarises the recruitment, drop out and completion.
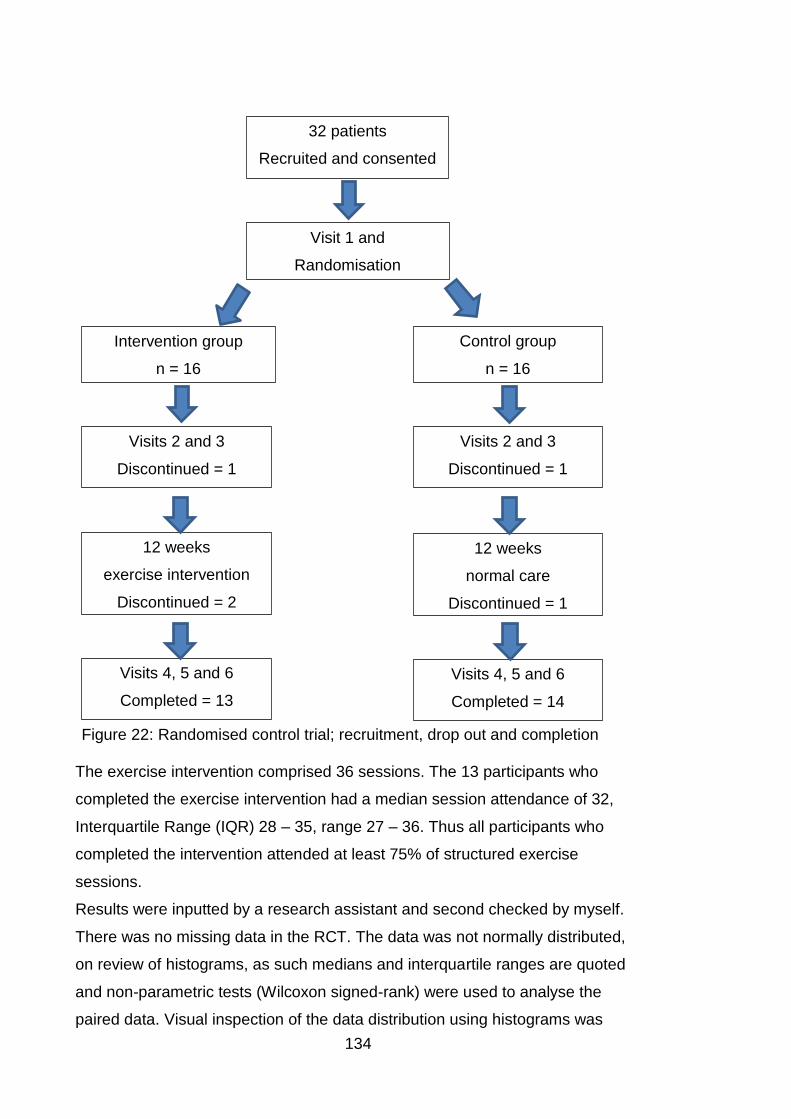
134
The exercise intervention comprised 36 sessions. The 13 participants who
completed the exercise intervention had a median session attendance of 32,
Interquartile Range (IQR) 28 – 35, range 27 – 36. Thus all participants who
completed the intervention attended at least 75% of structured exercise
sessions.
Results were inputted by a research assistant and second checked by myself.
There was no missing data in the RCT. The data was not normally distributed,
on review of histograms, as such medians and interquartile ranges are quoted
and non-parametric tests (Wilcoxon signed-rank) were used to analyse the
paired data. Visual inspection of the data distribution using histograms was
32 patients
Recruited and consented
Visit 1 and
Randomisation
Intervention group
n = 16
Control group
n = 16
Visits 2 and 3
Discontinued = 1
Visits 2 and 3
Discontinued = 1
12 weeks
exercise intervention
Discontinued = 2
12 weeks
normal care
Discontinued = 1
Visits 4, 5 and 6
Completed = 13
Visits 4, 5 and 6
Completed = 14
Figure 22: Randomised control trial; recruitment, drop out and completion
135
used for assessing normality, as in chapter 4 in cases where there was any
discrepancy in the distribution on visual inspection the statistical Kolmogorov-
Smirnov test of normality was used. Alpha was set at 0.05. The study produced
interesting results in two distinct ways; the effect of a 12 week exercise
intervention and the physiological response to an acute episode of maximal
exercise in PD. The following tables detail the group median and interquartile
ranges for the variables pre and post the exercise intervention in the control and
intervention groups. The final 2 columns of the tables detail the median change
from baseline scores, and interquartile ranges, in the individuals in the control
group and intervention group with the associated z scores and p scores from
the Wilcoxon signed-rank test results.
Table 16 below, details the demographics of the control and intervention groups
pre and post the exercise intervention. The median ages of the control and
intervention groups were comparable at 67.5 and 68 years respectively, while
the duration of disease since diagnosis was lower in the intervention group than
the control group. Both before and after the intervention, the group median BMI
and levodopa equivalent dose were lower in the intervention group than the
control group. In either group BMI was not significantly changed after the 12
week exercise intervention or 12 weeks of normal care. As described in section
4.1 of the cross-sectional study, levodopa equivalent dose (LED) was calculated
using the conversion formulae developed by Tomlinson et al (Tomlinson et al.,
2010).
The UPDRS section scores and Hoehn and Yahr scores pre and post the
intervention are reported in table 17. It was notable that both before and after,
the control group subjectively reported their parkinsonian symptoms, as
reported in UPDRS sections 1 and 2, to be worse than those of the intervention
group noting also that the control group had longer median disease duration
than the intervention group. At baseline the UPDRS 3 objective median score
was higher in the intervention group. Statistically significant changes from
baseline after the 12 weeks of exercise or normal care were only seen in the
intervention group as improvements in UPDRS 1 and 2 section scores.
Although UPDRS section 3 in the intervention group changed from baseline by
a median improvement of 2 points, this did not reach statistical significance.
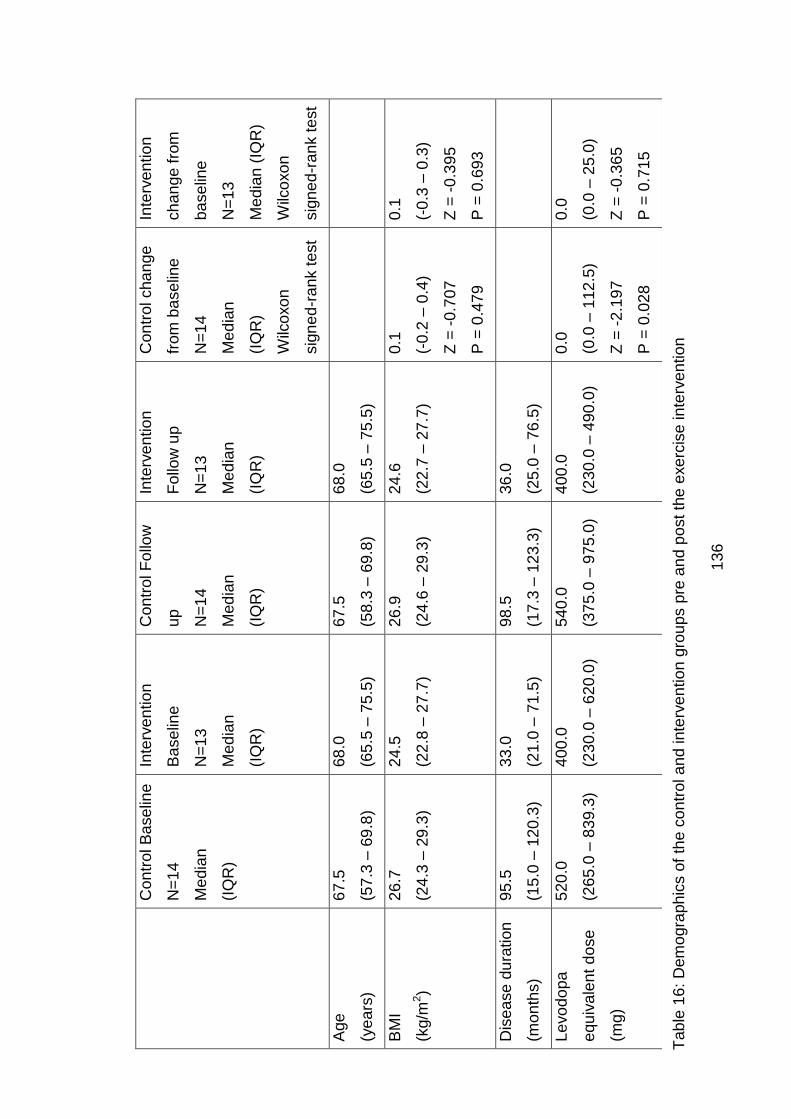
13
6
C
on
trol B
ase
line
N=
14
Me
dia
n
(IQ
R)
Inte
rve
ntio
n
Ba
se
line
N=
13
Me
dia
n
(IQ
R)
Con
trol F
ollo
w
up
N=
14
Me
dia
n
(IQ
R)
Inte
rve
ntio
n
Follo
w u
p
N=
13
Me
dia
n
(IQ
R)
Con
trol cha
nge
from
ba
se
line
N=
14
Me
dia
n
(IQ
R)
Wilc
oxo
n
sig
ne
d-r
an
k t
est
Inte
rve
ntio
n
ch
an
ge
fro
m
ba
se
line
N=
13
Me
dia
n (
IQR
)
Wilc
oxo
n
sig
ne
d-r
an
k t
est
Age
(ye
ars
)
67
.5
(57
.3 –
69
.8)
68
.0
(65
.5 –
75
.5)
67
.5
(58
.3 –
69
.8)
68
.0
(65
.5 –
75
.5)
BM
I
(kg/m
2)
26
.7
(24
.3 –
29
.3)
24
.5
(22
.8 –
27
.7)
26
.9
(24
.6 –
29
.3)
24
.6
(22
.7 –
27
.7)
0.1
(-0
.2 –
0.4
)
Z =
-0
.70
7
P =
0.4
79
0.1
(-0
.3 –
0.3
)
Z =
-0
.39
5
P =
0.6
93
Dis
ea
se
du
ration
(mo
nth
s)
95
.5
(15
.0 –
12
0.3
)
33
.0
(21
.0 –
71
.5)
98
.5
(17
.3 –
12
3.3
)
36
.0
(25
.0 –
76
.5)
Le
vo
do
pa
equ
iva
len
t d
ose
(mg)
52
0.0
(26
5.0
– 8
39.3
)
40
0.0
(23
0.0
– 6
20.0
)
54
0.0
(37
5.0
– 9
75.0
)
40
0.0
(23
0.0
– 4
90.0
)
0.0
(0.0
– 1
12
.5)
Z =
-2
.19
7
P =
0.0
28
0.0
(0.0
– 2
5.0
)
Z =
-0
.36
5
P =
0.7
15
Tab
le 1
6:
Dem
ogra
ph
ics o
f th
e c
on
trol a
nd inte
rve
ntio
n g
rou
ps p
re a
nd
po
st th
e e
xe
rcis
e in
terv
en
tio
n
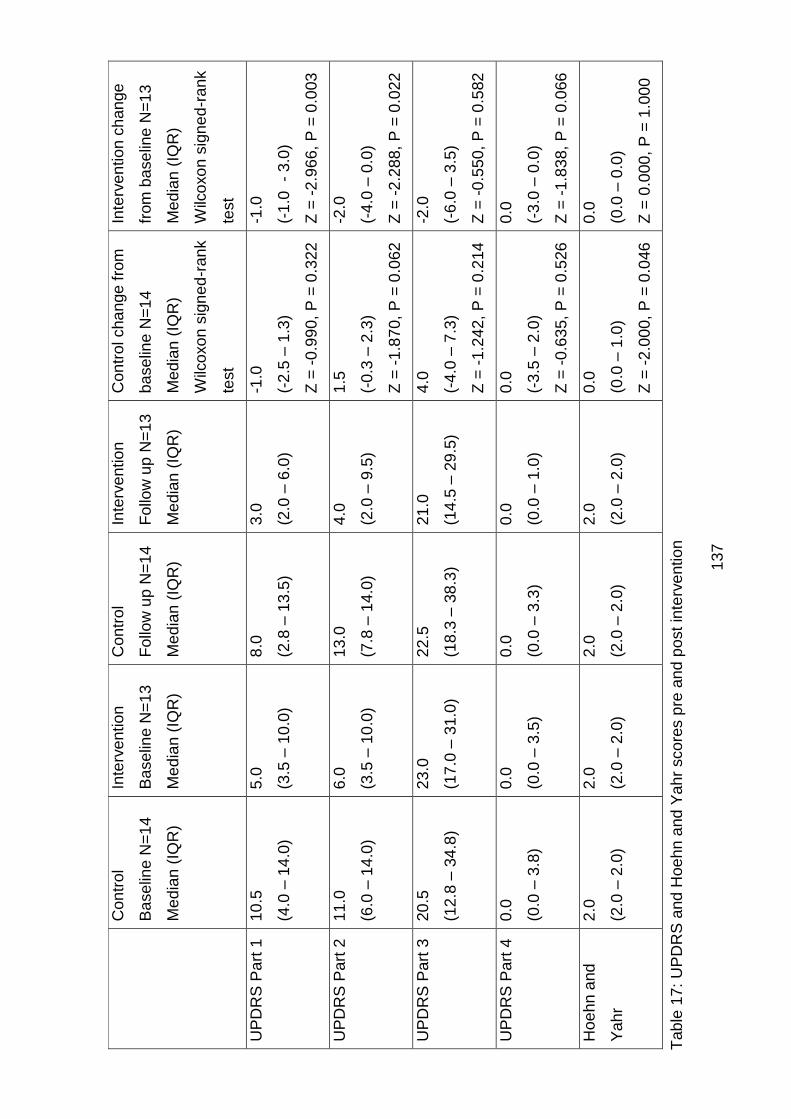
13
7
C
on
trol
Ba
se
line N
=1
4
Me
dia
n (
IQR
)
Inte
rve
ntio
n
Ba
se
line N
=1
3
Me
dia
n (
IQR
)
Con
trol
Follo
w u
p N
=1
4
Me
dia
n (
IQR
)
Inte
rve
ntio
n
Follo
w u
p N
=1
3
Me
dia
n (
IQR
)
Con
trol cha
nge
fro
m
ba
se
line
N=
14
Me
dia
n (
IQR
)
Wilc
oxo
n s
ign
ed
-ran
k
test
Inte
rve
ntio
n c
han
ge
from
ba
se
line
N=
13
Me
dia
n (
IQR
)
Wilc
oxo
n s
ign
ed
-ran
k
test
UP
DR
S P
art
1
10
.5
(4.0
– 1
4.0
)
5.0
(3.5
– 1
0.0
)
8.0
(2.8
– 1
3.5
)
3.0
(2.0
– 6
.0)
-1.0
(-2
.5 –
1.3
)
Z =
-0
.99
0,
P =
0.3
22
-1.0
(-1
.0
- 3
.0)
Z =
-2
.96
6,
P =
0.0
03
UP
DR
S P
art
2
11
.0
(6.0
– 1
4.0
)
6.0
(3.5
– 1
0.0
)
13
.0
(7.8
– 1
4.0
)
4.0
(2.0
– 9
.5)
1.5
(-0
.3 –
2.3
)
Z =
-1
.87
0,
P =
0.0
62
-2.0
(-4
.0 –
0.0
)
Z =
-2
.28
8,
P =
0.0
22
UP
DR
S P
art
3
20
.5
(12
.8 –
34
.8)
23
.0
(17
.0 –
31
.0)
22
.5
(18
.3 –
38
.3)
21
.0
(14
.5 –
29
.5)
4.0
(-4
.0 –
7.3
)
Z =
-1
.24
2,
P =
0.2
14
-2.0
(-6
.0 –
3.5
)
Z =
-0
.55
0,
P =
0.5
82
UP
DR
S P
art
4
0.0
(0.0
– 3
.8)
0.0
(0.0
– 3
.5)
0.0
(0.0
– 3
.3)
0.0
(0.0
– 1
.0)
0.0
(-3
.5 –
2.0
)
Z =
-0
.63
5,
P =
0.5
26
0.0
(-3
.0 –
0.0
)
Z =
-1
.83
8,
P =
0.0
66
Hoe
hn a
nd
Ya
hr
2.0
(2.0
– 2
.0)
2.0
(2.0
– 2
.0)
2.0
(2.0
– 2
.0)
2.0
(2.0
– 2
.0)
0.0
(0.0
– 1
.0)
Z =
-2
.00
0,
P =
0.0
46
0.0
(0.0
– 0
.0)
Z =
0.0
00
, P
= 1
.00
0
Tab
le 1
7:
UP
DR
S a
nd
Hoe
hn a
nd
Ya
hr
sco
res p
re a
nd
po
st
inte
rve
ntio
n
138
Resting cardiovascular parameters and peak heart rate pre and post the
intervention or normal care are reported in table 18. Cardiorespiratory fitness
and exercise capacity pre and post intervention or normal care are reported in
table 19. Both the control group and the intervention group had median normal
resting systolic and diastolic blood pressure at baseline and follow up, with no
statistically significant changes in these parameters. At follow up, resting heart
rate showed a statistically significant drop in both the control and the
intervention groups. At follow up, peak heart rate achieved during the maximal
cardiopulmonary exercise test also fell in both the control and intervention
groups.
The primary outcomes in the RCT were those of cardiorespiratory fitness
(aerobic capacity), as measured by VO2peak and exercise capacity, as
measured by six minute walk distance (6MWD). In the control group there were
no significant changes after 12 weeks in anaerobic threshold at percent of
VO2max predicted, VO2peak, peak metabolic equivalents, peak work rate and
6MWD. In contrast, in the intervention group after 12 weeks structured exercise
therapy statistically significant improvements were seen in all these outcomes.
In the intervention group the median individual change from baseline was 9.7%
for anaerobic threshold at percent of VO2max predicted, 2.0ml/kg/min for
VO2peak, 0.7METS for peak metabolic equivalents, 8.0watts for peak work rate
and 39.8m for 6MWD. The relevance of anaerobic threshold at percentage of
VO2max predicted is that the better an individual’s cardiorespiratory fitness is,
the closer the anaerobic threshold should be to the VO2max. In our study
population this anaerobic threshold at percent of VO2max predicted improved
by almost 10%. Figure 23 illustrates the effects of the exercise intervention or
normal care on median change from baseline for anaerobic threshold
percentage of VO2max predicted. Figure 24 illustrates the effects of the
exercise intervention or normal care on median change from baseline for
VO2peak, thus cardiorespiratory fitness.
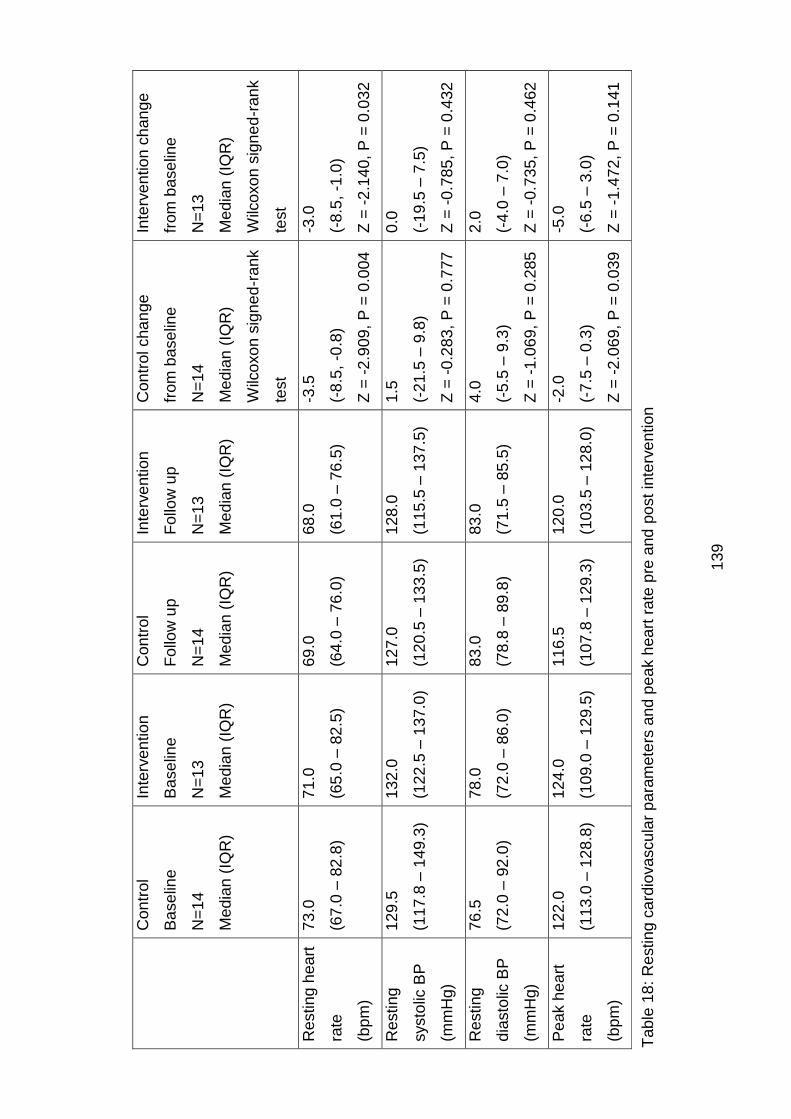
13
9
C
on
trol
Ba
se
line
N=
14
Me
dia
n (
IQR
)
Inte
rve
ntio
n
Ba
se
line
N=
13
Me
dia
n (
IQR
)
Con
trol
Follo
w u
p
N=
14
Me
dia
n (
IQR
)
Inte
rve
ntio
n
Follo
w u
p
N=
13
Me
dia
n (
IQR
)
Con
trol cha
nge
from
ba
se
line
N=
14
Me
dia
n (
IQR
)
Wilc
oxo
n s
ign
ed
-ran
k
test
Inte
rve
ntio
n c
han
ge
from
ba
se
line
N=
13
Me
dia
n (
IQR
)
Wilc
oxo
n s
ign
ed
-ran
k
test
Resting h
ea
rt
rate
(bp
m)
73
.0
(67
.0 –
82
.8)
71
.0
(65
.0 –
82
.5)
69
.0
(64
.0 –
76
.0)
68
.0
(61
.0 –
76
.5)
-3.5
(-8
.5,
-0.8
)
Z =
-2
.90
9,
P =
0.0
04
-3.0
(-8
.5,
-1.0
)
Z =
-2
.14
0,
P =
0.0
32
Resting
systo
lic B
P
(mm
Hg)
12
9.5
(11
7.8
– 1
49.3
)
13
2.0
(12
2.5
– 1
37.0
)
12
7.0
(12
0.5
– 1
33.5
)
12
8.0
(11
5.5
– 1
37.5
)
1.5
(-2
1.5
– 9
.8)
Z =
-0
.28
3,
P =
0.7
77
0.0
(-1
9.5
– 7
.5)
Z =
-0
.78
5,
P =
0.4
32
Resting
dia
sto
lic B
P
(mm
Hg)
76
.5
(72
.0 –
92
.0)
78
.0
(72
.0 –
86
.0)
83
.0
(78
.8 –
89
.8)
83
.0
(71
.5 –
85
.5)
4.0
(-5
.5 –
9.3
)
Z =
-1
.06
9,
P =
0.2
85
2.0
(-4
.0 –
7.0
)
Z =
-0
.73
5,
P =
0.4
62
Pe
ak h
ea
rt
rate
(bp
m)
12
2.0
(11
3.0
– 1
28.8
)
12
4.0
(10
9.0
– 1
29.5
)
11
6.5
(10
7.8
– 1
29.3
)
12
0.0
(10
3.5
– 1
28.0
)
-2.0
(-7
.5 –
0.3
)
Z =
-2
.06
9,
P =
0.0
39
-5.0
(-6
.5 –
3.0
)
Z =
-1
.47
2,
P =
0.1
41
Tab
le 1
8:
Restin
g c
ard
iova
scu
lar
pa
ram
ete
rs a
nd
pe
ak h
ea
rt r
ate
pre
and
po
st
inte
rve
ntio
n
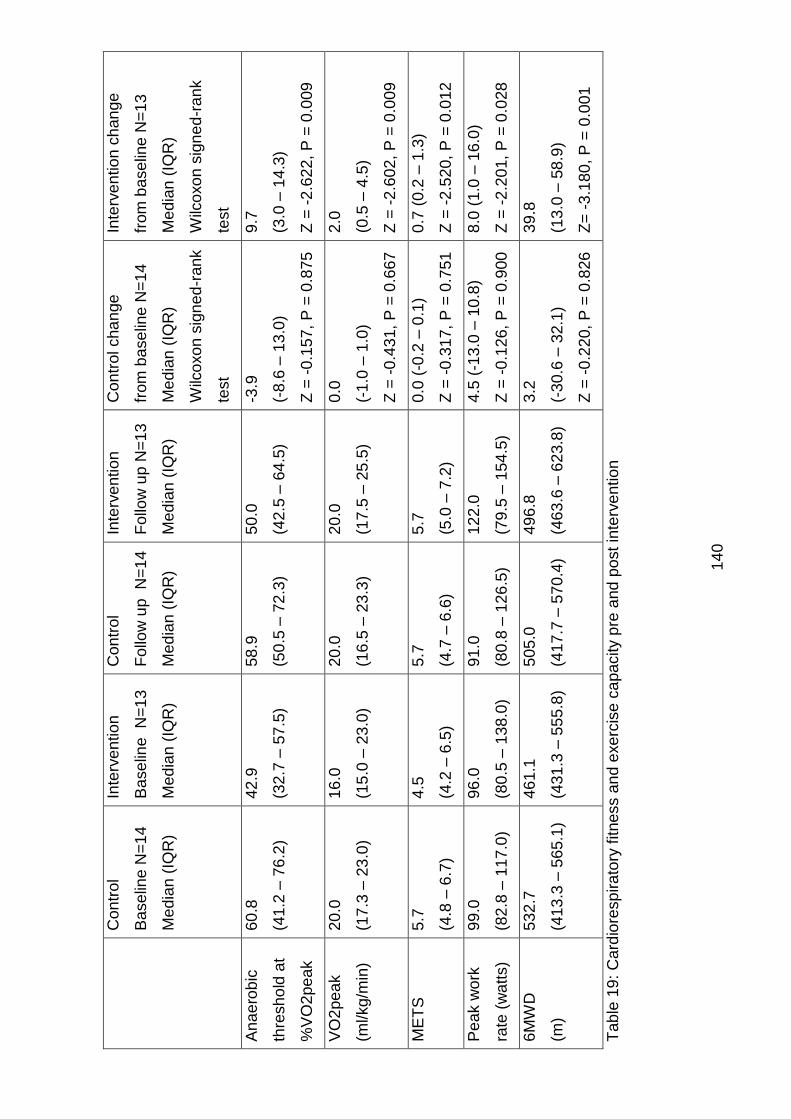
14
0
C
on
trol
Ba
se
line N
=1
4
Me
dia
n (
IQR
)
Inte
rve
ntio
n
Ba
se
line
N=
13
Me
dia
n (
IQR
)
Con
trol
Follo
w u
p
N=
14
Me
dia
n (
IQR
)
Inte
rve
ntio
n
Follo
w u
p N
=1
3
Me
dia
n (
IQR
)
Con
trol cha
nge
from
ba
se
line
N=
14
Me
dia
n (
IQR
)
Wilc
oxo
n s
ign
ed
-ran
k
test
Inte
rve
ntio
n c
han
ge
from
ba
se
line
N=
13
Me
dia
n (
IQR
)
Wilc
oxo
n s
ign
ed
-ra
nk
test
An
ae
rob
ic
thre
sh
old
at
%V
O2
pe
ak
60
.8
(41
.2 –
76
.2)
42
.9
(32
.7 –
57
.5)
58
.9
(50
.5 –
72
.3)
50
.0
(42
.5 –
64
.5)
-3.9
(-8
.6 –
13
.0)
Z =
-0
.15
7,
P =
0.8
75
9.7
(3.0
– 1
4.3
)
Z =
-2
.62
2,
P =
0.0
09
VO
2pe
ak
(ml/kg/m
in)
20
.0
(17
.3 –
23
.0)
16
.0
(15
.0 –
23
.0)
20
.0
(16
.5 –
23
.3)
20
.0
(17
.5 –
25
.5)
0.0
(-1
.0 –
1.0
)
Z =
-0
.43
1,
P =
0.6
67
2.0
(0.5
– 4
.5)
Z =
-2
.60
2,
P =
0.0
09
ME
TS
5
.7
(4.8
– 6
.7)
4.5
(4.2
– 6
.5)
5.7
(4.7
– 6
.6)
5.7
(5.0
– 7
.2)
0.0
(-0
.2 –
0.1
)
Z =
-0
.31
7,
P =
0.7
51
0.7
(0.2
– 1
.3)
Z =
-2
.52
0,
P =
0.0
12
Pe
ak w
ork
rate
(w
att
s)
99
.0
(82
.8 –
11
7.0
)
96
.0
(80
.5 –
13
8.0
)
91
.0
(80
.8 –
12
6.5
)
12
2.0
(79
.5 –
15
4.5
)
4.5
(-1
3.0
– 1
0.8
)
Z =
-0
.12
6,
P =
0.9
00
8.0
(1.0
– 1
6.0
)
Z =
-2
.20
1,
P =
0.0
28
6M
WD
(m)
53
2.7
(41
3.3
– 5
65.1
)
46
1.1
(43
1.3
– 5
55.8
)
50
5.0
(41
7.7
– 5
70.4
)
49
6.8
(46
3.6
– 6
23.8
)
3.2
(-3
0.6
– 3
2.1
)
Z =
-0
.22
0,
P =
0.8
26
39
.8
(13
.0 –
58
.9)
Z=
-3
.18
0, P
= 0
.001
Tab
le 1
9:
Card
iore
sp
ira
tory
fitne
ss a
nd
exe
rcis
e c
apa
city p
re a
nd
po
st
inte
rve
ntio
n
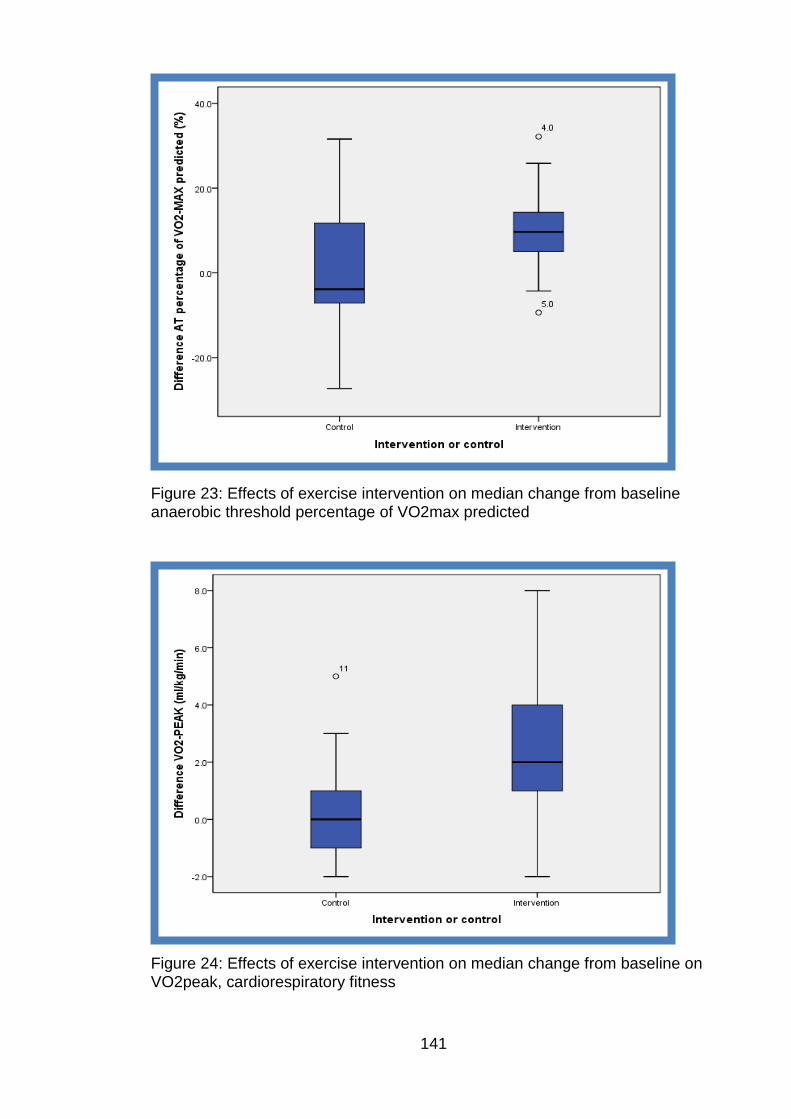
141
Figure 23: Effects of exercise intervention on median change from baseline anaerobic threshold percentage of VO2max predicted
Figure 24: Effects of exercise intervention on median change from baseline on VO2peak, cardiorespiratory fitness
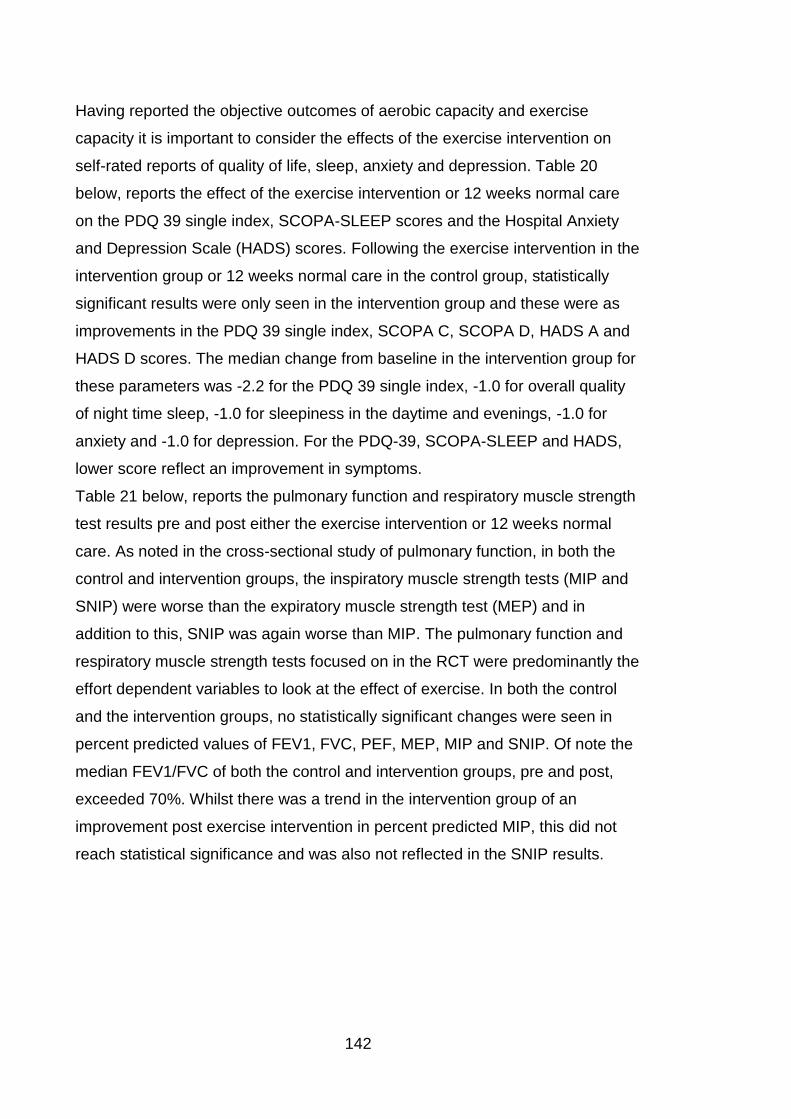
142
Having reported the objective outcomes of aerobic capacity and exercise
capacity it is important to consider the effects of the exercise intervention on
self-rated reports of quality of life, sleep, anxiety and depression. Table 20
below, reports the effect of the exercise intervention or 12 weeks normal care
on the PDQ 39 single index, SCOPA-SLEEP scores and the Hospital Anxiety
and Depression Scale (HADS) scores. Following the exercise intervention in the
intervention group or 12 weeks normal care in the control group, statistically
significant results were only seen in the intervention group and these were as
improvements in the PDQ 39 single index, SCOPA C, SCOPA D, HADS A and
HADS D scores. The median change from baseline in the intervention group for
these parameters was -2.2 for the PDQ 39 single index, -1.0 for overall quality
of night time sleep, -1.0 for sleepiness in the daytime and evenings, -1.0 for
anxiety and -1.0 for depression. For the PDQ-39, SCOPA-SLEEP and HADS,
lower score reflect an improvement in symptoms.
Table 21 below, reports the pulmonary function and respiratory muscle strength
test results pre and post either the exercise intervention or 12 weeks normal
care. As noted in the cross-sectional study of pulmonary function, in both the
control and intervention groups, the inspiratory muscle strength tests (MIP and
SNIP) were worse than the expiratory muscle strength test (MEP) and in
addition to this, SNIP was again worse than MIP. The pulmonary function and
respiratory muscle strength tests focused on in the RCT were predominantly the
effort dependent variables to look at the effect of exercise. In both the control
and the intervention groups, no statistically significant changes were seen in
percent predicted values of FEV1, FVC, PEF, MEP, MIP and SNIP. Of note the
median FEV1/FVC of both the control and intervention groups, pre and post,
exceeded 70%. Whilst there was a trend in the intervention group of an
improvement post exercise intervention in percent predicted MIP, this did not
reach statistical significance and was also not reflected in the SNIP results.
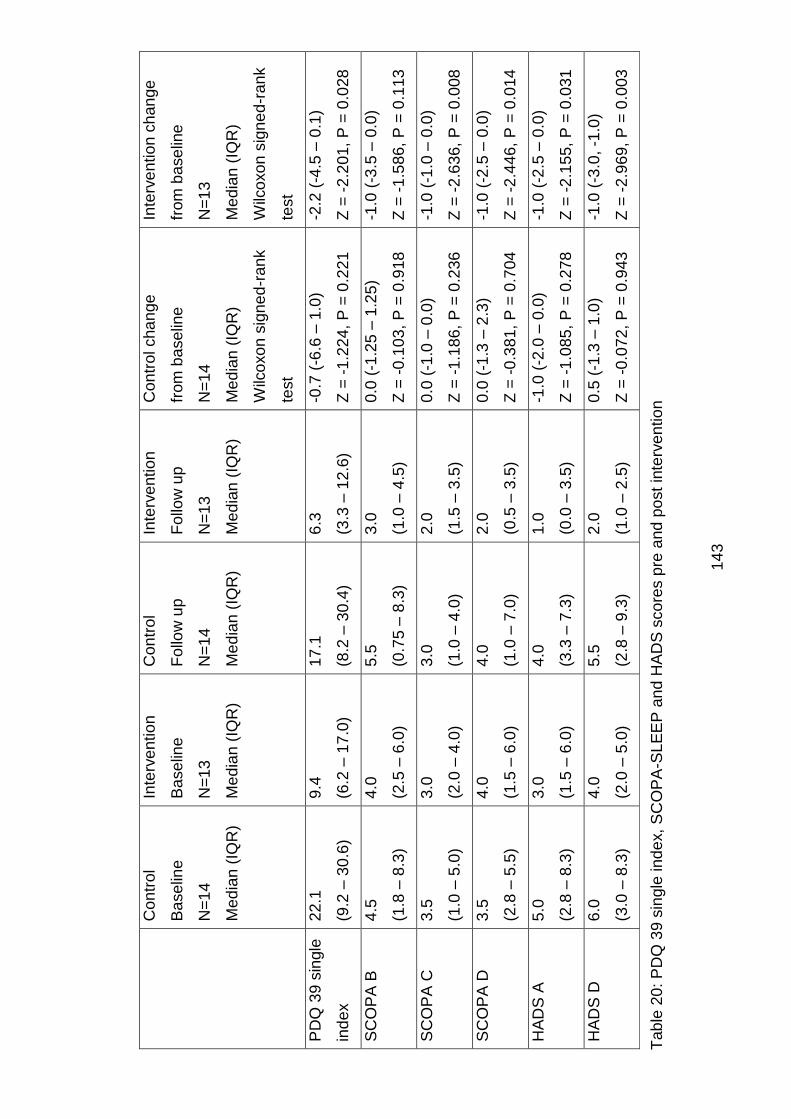
14
3
C
on
trol
Ba
se
line
N=
14
Me
dia
n (
IQR
)
Inte
rve
ntio
n
Ba
se
line
N=
13
Me
dia
n (
IQR
)
Con
trol
Follo
w u
p
N=
14
Me
dia
n (
IQR
)
Inte
rve
ntio
n
Follo
w u
p
N=
13
Me
dia
n (
IQR
)
Con
trol cha
nge
from
ba
se
line
N=
14
Me
dia
n (
IQR
)
Wilc
oxo
n s
ign
ed
-ran
k
test
Inte
rve
ntio
n c
han
ge
from
ba
se
line
N=
13
Me
dia
n (
IQR
)
Wilc
oxo
n s
ign
ed
-ran
k
test
PD
Q 3
9 s
ingle
ind
ex
22
.1
(9.2
– 3
0.6
)
9.4
(6.2
– 1
7.0
)
17
.1
(8.2
– 3
0.4
)
6.3
(3.3
– 1
2.6
)
-0.7
(-6
.6 –
1.0
)
Z =
-1
.22
4,
P =
0.2
21
-2.2
(-4
.5 –
0.1
)
Z =
-2
.20
1,
P =
0.0
28
SC
OP
A B
4
.5
(1.8
– 8
.3)
4.0
(2.5
– 6
.0)
5.5
(0.7
5 –
8.3
)
3.0
(1.0
– 4
.5)
0.0
(-1
.25
– 1
.25
)
Z =
-0
.10
3,
P =
0.9
18
-1.0
(-3
.5 –
0.0
)
Z =
-1
.58
6,
P =
0.1
13
SC
OP
A C
3.5
(1.0
– 5
.0)
3.0
(2.0
– 4
.0)
3.0
(1.0
– 4
.0)
2.0
(1.5
– 3
.5)
0.0
(-1
.0 –
0.0
)
Z =
-1
.18
6,
P =
0.2
36
-1.0
(-1
.0 –
0.0
)
Z =
-2
.63
6,
P =
0.0
08
SC
OP
A D
3.5
(2.8
– 5
.5)
4.0
(1.5
– 6
.0)
4.0
(1.0
– 7
.0)
2.0
(0.5
– 3
.5)
0.0
(-1
.3 –
2.3
)
Z =
-0
.38
1,
P =
0.7
04
-1.0
(-2
.5 –
0.0
)
Z =
-2
.44
6,
P =
0.0
14
HA
DS
A
5.0
(2.8
– 8
.3)
3.0
(1.5
– 6
.0)
4.0
(3.3
– 7
.3)
1.0
(0.0
– 3
.5)
-1.0
(-2
.0 –
0.0
)
Z =
-1
.08
5,
P =
0.2
78
-1.0
(-2
.5 –
0.0
)
Z =
-2
.15
5,
P =
0.0
31
HA
DS
D
6.0
(3.0
– 8
.3)
4.0
(2.0
– 5
.0)
5.5
(2.8
– 9
.3)
2.0
(1.0
– 2
.5)
0.5
(-1
.3 –
1.0
)
Z =
-0
.07
2,
P =
0.9
43
-1.0
(-3
.0, -1
.0)
Z =
-2
.96
9,
P =
0.0
03
Tab
le 2
0: P
DQ
39 s
ingle
ind
ex,
SC
OP
A-S
LE
EP
an
d H
AD
S s
co
res p
re a
nd
po
st
inte
rve
ntio
n
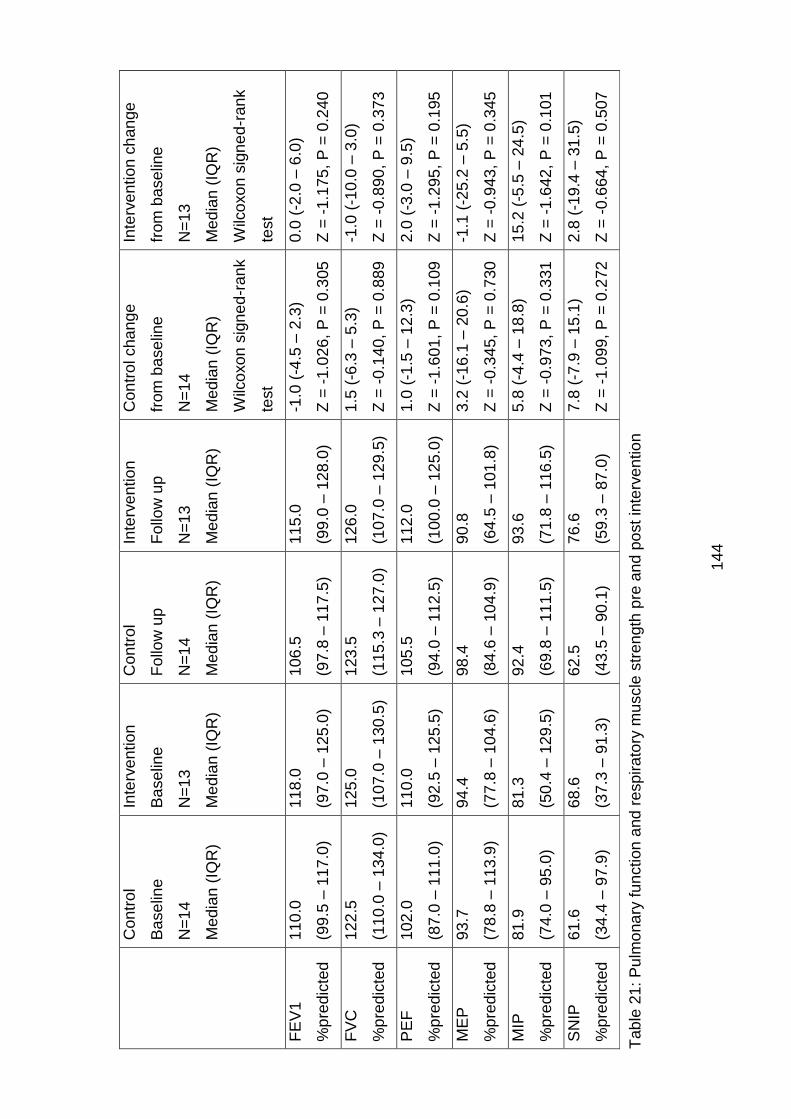
14
4
C
on
trol
Ba
se
line
N=
14
Me
dia
n (
IQR
)
Inte
rve
ntio
n
Ba
se
line
N=
13
Me
dia
n (
IQR
)
Con
trol
Follo
w u
p
N=
14
Me
dia
n (
IQR
)
Inte
rve
ntio
n
Follo
w u
p
N=
13
Me
dia
n (
IQR
)
Con
trol cha
nge
from
ba
se
line
N=
14
Me
dia
n (
IQR
)
Wilc
oxo
n s
ign
ed
-ran
k
test
Inte
rve
ntio
n c
han
ge
from
ba
se
line
N=
13
Me
dia
n (
IQR
)
Wilc
oxo
n s
ign
ed
-ran
k
test
FE
V1
%p
red
icte
d
11
0.0
(99
.5 –
11
7.0
)
11
8.0
(97
.0 –
12
5.0
)
10
6.5
(97
.8 –
11
7.5
)
11
5.0
(99
.0 –
12
8.0
)
-1.0
(-4
.5 –
2.3
)
Z =
-1
.02
6,
P =
0.3
05
0.0
(-2
.0 –
6.0
)
Z =
-1
.17
5,
P =
0.2
40
FV
C
%p
red
icte
d
12
2.5
(11
0.0
– 1
34.0
)
12
5.0
(10
7.0
– 1
30.5
)
12
3.5
(11
5.3
– 1
27.0
)
12
6.0
(10
7.0
– 1
29.5
)
1.5
(-6
.3 –
5.3
)
Z =
-0
.14
0,
P =
0.8
89
-1.0
(-1
0.0
– 3
.0)
Z =
-0
.89
0,
P =
0.3
73
PE
F
%p
red
icte
d
10
2.0
(87
.0 –
11
1.0
)
11
0.0
(92
.5 –
12
5.5
)
10
5.5
(94
.0 –
11
2.5
)
11
2.0
(10
0.0
– 1
25.0
)
1.0
(-1
.5 –
12
.3)
Z =
-1
.60
1,
P =
0.1
09
2.0
(-3
.0 –
9.5
)
Z =
-1
.29
5,
P =
0.1
95
ME
P
%p
red
icte
d
93
.7
(78
.8 –
11
3.9
)
94
.4
(77
.8 –
10
4.6
)
98
.4
(84
.6 –
10
4.9
)
90
.8
(64
.5 –
10
1.8
)
3.2
(-1
6.1
– 2
0.6
)
Z =
-0
.34
5,
P =
0.7
30
-1.1
(-2
5.2
– 5
.5)
Z =
-0
.94
3,
P =
0.3
45
MIP
%p
red
icte
d
81
.9
(74
.0 –
95
.0)
81
.3
(50
.4 –
12
9.5
)
92
.4
(69
.8 –
11
1.5
)
93
.6
(71
.8 –
11
6.5
)
5.8
(-4
.4 –
18
.8)
Z =
-0
.97
3,
P =
0.3
31
15
.2 (
-5.5
– 2
4.5
)
Z =
-1
.64
2,
P =
0.1
01
SN
IP
%p
red
icte
d
61
.6
(34
.4 –
97
.9)
68
.6
(37
.3 –
91
.3)
62
.5
(43
.5 –
90
.1)
76
.6
(59
.3 –
87
.0)
7.8
(-7
.9 –
15
.1)
Z =
-1
.09
9,
P =
0.2
72
2.8
(-1
9.4
– 3
1.5
)
Z =
-0
.66
4,
P =
0.5
07
Tab
le 2
1: P
ulm
ona
ry f
un
ction
and
resp
ira
tory
mu
scle
str
en
gth
pre
an
d p
ost
inte
rve
ntio
n
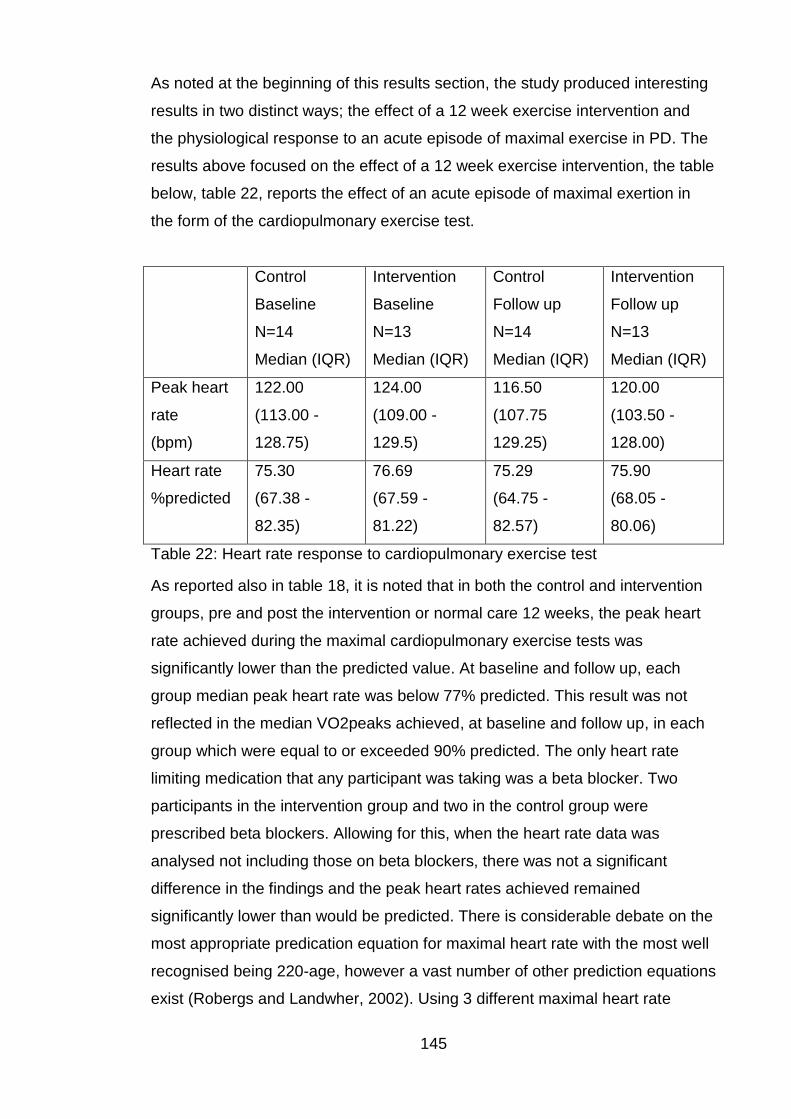
145
As noted at the beginning of this results section, the study produced interesting
results in two distinct ways; the effect of a 12 week exercise intervention and
the physiological response to an acute episode of maximal exercise in PD. The
results above focused on the effect of a 12 week exercise intervention, the table
below, table 22, reports the effect of an acute episode of maximal exertion in
the form of the cardiopulmonary exercise test.
Control
Baseline
N=14
Median (IQR)
Intervention
Baseline
N=13
Median (IQR)
Control
Follow up
N=14
Median (IQR)
Intervention
Follow up
N=13
Median (IQR)
Peak heart
rate
(bpm)
122.00
(113.00 -
128.75)
124.00
(109.00 -
129.5)
116.50
(107.75
129.25)
120.00
(103.50 -
128.00)
Heart rate
%predicted
75.30
(67.38 -
82.35)
76.69
(67.59 -
81.22)
75.29
(64.75 -
82.57)
75.90
(68.05 -
80.06)
Table 22: Heart rate response to cardiopulmonary exercise test
As reported also in table 18, it is noted that in both the control and intervention
groups, pre and post the intervention or normal care 12 weeks, the peak heart
rate achieved during the maximal cardiopulmonary exercise tests was
significantly lower than the predicted value. At baseline and follow up, each
group median peak heart rate was below 77% predicted. This result was not
reflected in the median VO2peaks achieved, at baseline and follow up, in each
group which were equal to or exceeded 90% predicted. The only heart rate
limiting medication that any participant was taking was a beta blocker. Two
participants in the intervention group and two in the control group were
prescribed beta blockers. Allowing for this, when the heart rate data was
analysed not including those on beta blockers, there was not a significant
difference in the findings and the peak heart rates achieved remained
significantly lower than would be predicted. There is considerable debate on the
most appropriate predication equation for maximal heart rate with the most well
recognised being 220-age, however a vast number of other prediction equations
exist (Robergs and Landwher, 2002). Using 3 different maximal heart rate
146
prediction equations continued to show the peak heart rate achieved in our
population remained well below the expected value.
The effect of a structured exercise intervention and the physiological response
to an acute episode of maximal exercise in PD warrant further detailed
discussion.
6.1.1 Discussion
The RCT primarily looked at the effect of a structured exercise intervention on
cardiorespiratory fitness as defined by VO2peak, but also looked at the effect of
an exercise intervention on markers of cardiovascular health, exercise capacity
(6MWD), pulmonary function, respiratory muscle strength, parkinsonian
symptoms, Parkinson’s disease stage, quality of life, sleep, anxiety and
depression. The above looked at the effect of a period of training on these
outcomes, and the study also had the benefit of assessing a cardiorespiratory
response to an acute episode of maximal exercise. With scope of the study
covering all these areas, the discussion will be divided accordingly.
Before discussing the effect of the exercise intervention, the differences
between the control group and intervention group at baseline warrant further
discussion. The median age between the groups was comparable at 67.5 years
in the control group and 68.0 years in the intervention group however the
control group had a longer disease duration (95.5 months versus 33.0 months)
and higher levodopa equivalent dose (520.0mg versus 400.0mg) than the
intervention group. With PD being a progressive disease it is unsurprising that
those with a longer disease duration required higher doses of medication. In the
patient scored subjective rating scales of UPDRS part 1, UPDRS part 2, PDQ-
39 single index and HADS A and HADS D the control group rated themselves
worse than the intervention group (UPDRS part 1 10.5 versus 5.0, UPDRS part
2 11.0 versus 6.0, PDQ-39 single index 22.1 versus 9.4, HADS A 5.0 versus 3.0
and HADS D 6.0 versus 4.0). Again this may be expected that those with the
longer disease duration have a greater impact of their PD on their physical
abilities, quality of life, anxiety and depression. Interestingly on the objective
ratings of disease stage (Hoehn and Yahr), UPDRS 3, cardiorespiratory fitness
(VO2peak) and exercise capacity (6MWD) this trend was not continued. Both
groups had the same median Hoehn and Yahr score of 2.0 and across the other
outcome measures the control group performed better than the intervention
147
group (UPDRS 3 20.5 versus 23.0, VO2peak 20.0ml/kg/min versus
16.0ml/kg/min and 6MWD 532.7m versus 461.1m). This was a very interesting
finding as it may be expected that those with longer disease duration would
have more advanced disease stage, worse UPDRS motor scores, worse
cardiorespiratory fitness and worse exercise capacity however this was not the
case. A possible reason for this difference in objective and subjective findings
may be the effect of having a progressive neurodegenerative disorder for a
longer period of time affects psychology and perceptions of health faster and
more profoundly than it affects ability.
6.1.2 Discussion: Effect of an exercise intervention on cardiorespiratory
fitness and exercise capacity
In the intervention group only, there were significant changes after 12 weeks in
anaerobic threshold at percent of VO2max predicted, VO2peak, peak metabolic
equivalents, peak work rate and 6MWD. In the intervention group the median
individual change from baseline was 9.7% for anaerobic threshold at percent of
VO2max predicted, 2.0ml/kg/min for VO2peak, 0.7METS for peak metabolic
equivalents, 8.0watts for peak work rate and 39.8m for 6MWD. The
improvement seen in aerobic capacity as measured by VO2peak was
comparable to that reported in healthy sedentary adults following a period of
structured exercise of 10 – 30% improvement (Samitz and Bachl, 1991). Thus it
would appear that individuals with PD can enjoy the same level of benefits in
terms of aerobic capacity with a period of exercise training as normal, healthy
individuals. As would be expected with an increase in aerobic capacity, and as
such fitness, the anaerobic threshold moved closer to the VO2peak, the peak
metabolic equivalent improved, the peak work rate improved and the 6MWD
distance improved. With the associated improvement in 6MWD distance,
considering the availability of equipment for cardiopulmonary exercise testing
and the skills of the technicians required to undertake CPET tests, 6MWD could
be considered for use as a surrogate marker for aerobic capacity if the gold
standard is not available. While predominantly discussing VO2peak, it is
important to mention the concept of metabolic equivalents or METS. The MET
concept provides a simple technique to describe functional capacity and with
known energy expenditure values, in METS and watt units, for household task
and recreational activities allows simple visual imagery of energy expenditure
148
(Jette et al., 1990). The increase in METS observed in the intervention group
could represent the increased ability of an individual to be able to perform heavy
household chores rather than light household chores.
As discussed in section 2.4, after endurance training, SV is increased at rest
and during submaximal and maximal exercise, whilst HR is decreased at rest
and during submaximal exercise and unchanged at maximal work rates.
Training increases plasma volume and end diastolic volume and results in more
elastic recoil. Long term responses also include hypertrophy of cardiac muscle
fibres and reduction in blood pressure. Interestingly both the control and the
intervention group showed a statistically significant reduction in resting heart
rate after the 12 week period of normal care or the exercise intervention
respectively, thus this effect cannot be concluded to be in response to training.
In both groups there was no statistically significant change in resting systolic or
diastolic blood pressure in either group. There are potential reasons why these
abnormal cardiovascular responses to a period of training have occurred,
despite the observed increase in aerobic capacity, VO2peak. It is reported that
the dysautonomia in Parkinson’s disease involves neurocardiological
abnormalities with postganglionic sympathetic noradrenergic lesions which may
be responsible for this abnormal cardiac response to training (Goldstein, 2003).
As previously discussed Cardiac output (QT) is the volume of blood the heart
pumps out in one minute and is the product of the stroke volume (SV) ,which is
the amount of blood pumped out per beat, and the number of heart beats per
minute (heart rate (HR)) (Vincent, 2008). The arterial-venous oxygen difference
(a-vO2 diff) is the difference between the oxygen concentration of the arterial
and mixed venous blood (Manley, 1996). An individual’s aerobic capacity or
maximum oxygen uptake (VO2max) is a function of, and thus limited by, the
ability of the cardiovascular system to supply (QT) and/or the skeletal muscles
to use (a-vO2 diff) oxygen (Manley, 1996, Jakovljevic et al., 2012a). Thus after
a period of training, an observed improvement in VO2peak is contributed to by
improvement in QT and a-vO2diff to varying degrees. Dependent on training
modality, skeletal muscles undergo fiber hypertrophy and hyperplasia and
increased recruitment (Manley, 1996). Endurance training also facilitates a
greater capacity for blood flow in skeletal muscles by increasing the numbers of
capillaries (Prior et al., 2004). Thus it could be postulated that in our population
the improvements seen in VO2peak, without significant associated cardiac
149
changes could be due to a greater contribution of improvement in a-vO2diff
rather than QT. This could be due to the type of exercise training used or the
physiological response in individuals with PD.
6.1.3 Discussion: Effect of an exercise intervention on pulmonary
function and respiratory muscle strength
Very little research had been done previously looking at the effect of exercise
on pulmonary function in PD. A small study by Koseoglu et al, looked at the
effect of pulmonary rehabilitation in PD on pulmonary function test results and
whilst trends of improvement existed, the results failed to reach statistical
significance which may have been due to the small number of participants and
the intervention length of 5 weeks only (Koseoglu et al., 1997). A further small
study measured respiratory muscle strength and endurance, perception of
dyspnoea and quality of life in 20 PD patients, Hoehn and Yahr stages II-III. The
patients were then divided into 2 groups of 10, 1 group received 12 weeks of ½
hour, 6 times per week specific inspiratory muscle training and the other group
received sham training. Significant improvements in inspiratory muscle strength,
endurance and perception of dyspnoea were seen only in the intervention group
(Inzelberg et al., 2005).
As highlighted in table 21, in both the control and intervention groups, the
inspiratory muscle strength tests (MIP and SNIP) were worse than the
expiratory muscle strength test (MEP) and in addition to this, SNIP was again
worse than MIP. In both the control and the intervention groups, no statistically
significant changes were seen in percent predicted values of FEV1, FVC, PEF,
MEP, MIP and SNIP. Whilst there was a trend in the intervention group of an
improvement post exercise intervention in percent predicted MIP, this
unfortunately did not reach statistical significance and was also not reflected in
the SNIP results.
While exercise produces short term responses to meet immediate demand,
exercise training produces long term adaptations. These adaptations include
cardiovascular, respiratory, skeletal muscles, bone, metabolic and hormonal
adaptations. The magnitude of these adaptations depends on a number of
factors including pre-exercise fitness level, type of exercise programme,
intensity and duration. Respiratory adaptations with training are predominantly
an increase in pulmonary ventilation and an increase in pulmonary diffusion
150
during maximal exertion. With this in mind, this study may have failed to reach
statistical significance in changes in lung function and respiratory muscle
strength for a number of reasons. The effort dependent indices selected to
review as outcome measures may not best reflect pulmonary ventilation and
would not reflect pulmonary diffusion where the most benefit is likely to occur.
The modest numbers in the RCT section of study may have impacted on the
results. The type of exercise intervention and programme designed was not
specifically targeting respiratory muscles and thus significant improvements in
MEP, MIP and SNIP were not seen. Noting the trend in the increase in MIP in
this study in the intervention group, and the significant improvements in
inspiratory muscle strength, endurance and perception of dyspnoea in response
to inspiratory muscle training observed by Inzelberg et al, raises the question
about the potential role of inspiratory muscle training in this group. Further to
this, potential exists for a role for expiratory muscle training, upper extremity
exercise and pulmonary rehabilitation style training to assess if these improve
pulmonary function and respiratory muscle strength in PD.
6.1.4 Discussion: Effect of an exercise intervention on parkinsonian
symptoms, Parkinson’s disease stage, quality of life, sleep, anxiety
and depression
While Parkinson’s disease stage, as defined by Hoehn and Yahr, remained the
same after the 12 week exercise intervention, statistically significant changes
from baseline after the 12 weeks of exercise or normal care were only seen in
the intervention group as improvements in UPDRS 1 and 2 section scores. The
intervention group change from baseline UPDRS part 1 score improved by -1.0
point and the UPDRS part 2 score improved by -2.0 points. Although not
reaching statistical significance, the UPDRS section 3 in the intervention group
changed from baseline by a median improvement of -2.0 points. Following the
exercise intervention in the intervention group or 12 weeks normal care in the
control group, statistically significant results were only seen in the intervention
group and these were as improvements in the PDQ 39 single index, SCOPA C,
SCOPA D, HADS A and HADS D scores. The median change from baseline in
the intervention group for these parameters was -2.2 for the PDQ 39 single
index, -1.0 for overall quality of night time sleep, -1.0 for sleepiness in the
daytime and evenings, -1.0 for anxiety and -1.0 for depression. Thus structured
151
exercise therapy in PD improves parkinsonian symptoms, quality of life, sleep,
anxiety and depression and is an important therapy to improve wellbeing and
health.
The mechanism for how exercise in healthy individuals and in those with
diseases, including PD, improves these symptoms is complex and still not fully
understood with a number of potential philosophies. Neurotrophins most likely
play a significant role and research interest in them has increased over recent
years. To date no pharmacological treatments have been shown to be
unequivocally neuroprotective in PD (Ahlskog, 2011). Exercise is known to
provoke a surge of molecular and cellular processes that support brain
plasticity. Activity dependent neuroplasticity is supported by neurotrophins,
which have the ability to signal neurons to survive, differentiate and grow
(Hennigan et al., 2007, Johnston, 2009, Neeper et al., 1995, Neeper et al.,
1996, Vaynman and Gomez-Pinilla, 2005). Brain derived neurotrophic factor
(BDNF) seems to be the most susceptible neurotrophin to regulation by
exercise (Johnston, 2009, Neeper et al., 1995, Vaynman and Gomez-Pinilla,
2005) Studies have shown decreased BDNF expression within the substantia
nigra of PD brains as compared to controls (Howells et al., 2000, Parain et al.,
1999). A common single nucleotide polymorphism (SNP) in the BDNF gene,
G196A, results in a methionine- valine substitution at codon 66 (Val66Met). The
presence of this minor allele leads to reduced depolarisation induced secretion
of BDNF from neuronal cells (Egan et al., 2003, Chen et al., 2004). With this
neural plasticity in mind Fox et al, succinctly summarised philosophies of how
exercise enhances neuroplasticity in PD; intense activities maximise synaptic
plasticity, complex activities encourage greater structural adaptation, rewarding
activities increase dopamine levels, dopaminergic neurons are highly
responsive to exercise and notably that exercise in addition to improving
symptoms when the disease is already present can also retard the onset of PD
(Fox et al., 2006, Archer et al., 2011).
It must also be remembered that the effects may be “knock on” effects, for
example poor sleep and early morning waking can be associated depression,
thus improving depression may also improve sleep. Similarly if parkinsonian
symptoms are disturbing individual’s sleep, if exercise improves the
parkinsonian symptoms the sleep may also improve. Previous studies, as
highlighted in a meta-analysis, indicate that regular exercise increases total
152
sleep time and self-reports epidemiological data support that acute and chronic
exercise promotes sleep (Kubitz et al., 1996, Driver and Taylor, 2000). The
exact mechanisms of how exercise improves sleep are not fully understood and
most studies reporting the effects of exercise on sleep have predominantly
included young sleepers without problematic sleep. As described and discussed
the pathophysiology of how exercise improves outcomes such as sleep, anxiety
and depression is not fully understood and remains complex with a significant
amount of overlap.
6.1.5 Discussion: Heart rate response to exercise
The RCT was primarily designed to look at the long term adaptations to
exercise training, however had the benefit of also being able to assess the short
term response to exercise to meet immediate demand during a maximal
cardiopulmonary exercise test. In both the control and intervention groups, pre
and post the intervention or normal care 12 weeks, the peak heart rate achieved
during the maximal cardiopulmonary exercise tests was significantly lower than
the predicted value. At baseline and follow up, each group median peak heart
rate was below 77% predicted. This result was not reflected in the median
VO2peaks achieved, at baseline and follow up, in each group which were equal
to or exceeded 90% predicted. This result was not significantly affected when
individuals on rate limiting medication were excluded.
As discussed in section 2.4, An individual’s aerobic capacity or maximum
oxygen uptake (VO2max) is a function of, and thus limited by, the ability of the
cardiovascular system to supply (QT) and/or the skeletal muscles to use (a-vO2
diff) oxygen (Manley, 1996, Jakovljevic et al., 2012a). As work increases the QT
increases in an almost linear pattern up to a maximum, this occurs due to
increases in heart rate (HR) and stroke volume (SV) (Manley, 1996). Although
both HR and SV increase with exertion, the contribution to the increase QT is
much greater from the increase in HR particularly at high exertion
(Higginbotham et al., 1986). Maximal achievable heart rate (HRmax) is
considered to be related to age and although there a numerous prediction
equations, HRmax = 220-age is commonly accepted and used (Robergs and
Landwher, 2002).
Given that all participants achieved anaerobic threshold and the median VO2
peaks achieved exceeded 90% predicted, it is very unlikely that the poor heart
153
rate response to exercise seen was related to effort or the choice of CPET
modality with the bicycle causing leg fatigue and early termination of an
exercise test. As such it must be considered that there are other potential
causes for a poor heart rate response to exercise in PD patients. It is likely that
chronotropic incompetence, the inability of the heart to increase its rate with
increased activity or demand is the cause. Chronotropic incompetence,
common in cardiovascular disease, causes exercise intolerance, deterioration in
quality-of-life and very importantly is an independent predictor of adverse
cardiovascular events and overall mortality (Brubaker and Kitzman, 2011). With
the dysautonomia in PD known to involve the cardiovascular system, involving
postganglionic sympathetic noradrenergic lesions, norepinephrine loss in the
sympathetic nervous system of the heart and parasympathetic over activity it
seems very plausible that this is the cause of chronotropic incompetence in PD
and the resultant poor heart rate response to exercise.
These findings need to be explored further to examine the stability of heart rate
during exercise and the recovery response of the heart rate to stopping exercise
in PD. This is a notably interesting finding as it raises questions about the heart
rate response of those with PD in other situations and as clinicians our
assessment of them. Given these findings it would be important to consider
implications such as heart rate in response to sepsis, and if blunted we may be
underestimating the severity of illness in this population with resultant effects on
morbidity and mortality. This is an area which warrants significant further
research.
6.2 Strengths and limitations
There were limitations to the study; although exceeding or comparable number
to previous studies, increasing the number of participants in future studies
would improve power. It would have been beneficial to assess heart rate
response during the exercise intervention, this was attempted however the
equipment used proved complex for the participants to use and unreliable, thus
produced no interpretable data. As described in section 4.5 the capillary blood
gas sampling was unsuccessful. The patient information sheet detailed the use
of a swallow assessment device and a device that measures oxygen levels
(sats) during sleep, unfortunately the swallow assessment devices were not
available on commencement of the study and the sats devices did not provide
154
meaningful results. The sats devices were patient operated and could not be
pre-programmed, unfortunately the participants struggled with setting the
devices to monitor oxygen levels only overnight resulting in devices recording
no data or continuous data for days making the results uninterpretable. Given
the broad ranging nature of the variables studied it was decided not to apply
corrections for multiple comparisons. On balance it was felt that each variable
considered was sufficiently unique and so no two variables were from the same
family, to make correction for multiple comparisons unnecessary. A blanket
adjustment would be too conservative an approach and likely wrongly show lack
of significance. This is however acknowledged as a limitation as it is important
to recognise that in some cases significance may have been over estimated for
this reason.
In research when discussing results we refer to statistically significant changes,
however this is different to clinically significant changes in outcome scores and
this has to be taken into account as in some cases statistically significant
change has little clinical significance. Minimal clinically important differences
(MCID) are patient derived scores, that generally involve patient perception, that
reflect changes that are meaningful for the patient. There is considerable
confusion in the literature with terminology used interchangeably which is
actually quite different for example MCID, the minimally important difference
(MID), the minimal clinical difference (MCD) or the minimal clinically significant
difference (MCSD). There is little consensus about defining MCID across the
majority of outcome tools for a variety of reasons. There are a number of
different methods to formulate a MCID due to different influencing factors.
Baseline severity of symptoms can influence MCID of an outcome tool as can
the use of the same tool in different study populations (Cook, 2008). As
highlighted in section 5.10 when discussing 6MWT, with the same applying to
VO2peak, SCOPA SLEEP and HADS, when outcome measures are used in
different populations the MCID will vary for example the MCID for HADS
following an exercise intervention in chronic heart failure will be different to that
following an exercise intervention in PD. While the UPDRS and PDQ-39 are
specific for use in PD, MCID estimates have not been fully established with
papers quoting different estimates. More recent studies suggest for the UPDRS
part 3 MCID for improvement was -3.25 and worsening 4.63, the UPDRS part 1
MCID for improvement was -2.64 and worsening 2.45 and the UPDRS part 2
155
MCID for improvement was -3.05 and worsening 2.51 (Horvath et al., 2015,
Shulman et al., 2010). A recent large study quoted estimates for MCID
thresholds for PDQ-39-SI were -4.72 and +4.22 for minimal clinically important
improvement and worsening respectively however acknowledged MICD
estimates varied across PD severity. This all has to be taken into account when
interpreting results (Horvath et al., 2017).
The RCT benefitted from a number of strengths including gold standard
pulmonary function and cardiorespiratory fitness testing, the exercise
intervention was supervised and the study provided the means to assess short
term and long term responses to exercise. Perhaps most importantly the
exercise intervention received markedly positive feedback from the participants,
with a number continuing voluntarily at the same healthy living centre for a
further 12 weeks and then subsequently joining fitness centres. I feel one quote
from a patient from the intervention group sums up the most important strength
of the study “taking part in this has changed my life”.
6.3 Conclusion
Reflecting back to the hypothesis, aims and objectives, the RCT has shown that
a structured exercise intervention in PD improves cardiorespiratory fitness,
exercise capacity, parkinsonian symptoms, quality of life, sleep, anxiety and
depression. Further research needs to be done to establish the optimum
“exercise prescription” to maximise these benefits and also provide benefits in
pulmonary function and respiratory muscle strength.
Secondly the fascinating observation on poor heart rate response to exercise
warrants significant further research.
156
Chapter 7. Conclusion and future studies
7.1 Overall conclusions
The cross-sectional study and the RCT both provided fascinating results and
provoked questions for further research. Both sections of the study fulfilled the
aims and objectives set out. The results of the cross-sectional study have
shown a notable prevalence of obstructive spirometry, upper airways
obstruction and inspiratory muscle weakness in this population. This pattern
was observed in both non-smokers and smokers or those with known
obstructive lung disease. This pattern of dysfunction of the respiratory system
could lead to increased morbidity and mortality. The RCT has shown that a
structured exercise intervention in PD improves cardiorespiratory fitness,
exercise capacity, parkinsonian symptoms, quality of life, sleep, anxiety and
depression. This study provides evidence in support of structured exercise as a
treatment for PD. A secondary interesting finding in the RCT was the
observation of poor heart rate response to exercise, this raises questions about
heart rate response in PD to other stimuli such as sepsis. These significant
findings warrant further research.
7.2 Future studies
The results from both the cross-sectional study and the RCT have proved very
thought provoking with ideas for future studies. Further research is indicated to
look at any association between pulmonary dysfunction in IPD and a number of
issues including; bulbar problems, speech, swallowing, drooling, night time
sleep, daytime somnolence and sleep disorders. Rehabilitation of pulmonary
dysfunction warrants further assessment by pulmonary rehabilitation, specific
respiratory muscle training and alternative exercise interventions. In addition to
these non-pharmacological therapies, the effect of dopaminergic therapy on
pulmonary function should be further studied.
Considering exercise therapy, further research needs to be done to establish
the optimum “exercise prescription” to maximise benefits and also provide
benefits in pulmonary function and respiratory muscle strength. Interventions
such as high-intensity interval training could be considered for research in this
population as the short bursts of exertion may suit this population who may
fatigue easily. Finally, the observation on poor heart rate response to exercise
warrants significant further research.
157
Appendix A. Cross-sectional study; participant information
sheet, consent form and assessment document
Professor Richard Walker
North Tyneside General Hospital Rake Lane
North Shields NE29 8NH
Tel: 0191 293 2709
PARTICIPANT INFORMATION SHEET
EXERCISE AND PULMONARY FUNCTION IN IDIOPATHIC PARKINSON’S DISEASE BASELINE PULMONARY FUNCTION GROUP
We would like to invite you to take part in this research study. Please take time to read the following information carefully, it explains why the research is being done and what it involves. If you have any questions about the information or if there is anything you do not understand, you are very welcome to ask for further explanation.
Part 1 tells you the purpose of the study and what will happen if you decide to take part.
Part 2 gives you more detailed information about the conduct of the study. Thank you for reading this.
PART 1 What is the purpose of the research study? Parkinson’s disease (PD) is the second most common neurodegenerative condition in the UK. Many people with PD suffer from respiratory symptoms including shortness of breath on exertion, cough and sputum production. Respiratory complications with PD are a common reason for hospital admission. Previous research studies looking at lung function in PD have produced some conflicting results. We plan to undertake a large study to look at the lung function and breathing muscle strength in PD. By defining the pattern of any lung problems we hope our results can be used to improve management, potentially non pharmacologically and pharmacologically, and reduce breathing complications and hospital admissions.
158
Why have I been invited to participate? You have been invited to participate as you are a patient with Idiopathic Parkinson’s Disease (IPD) currently under the care of the Northumbria PD service, the team organising this study. Do I have to take part? No, your participation is purely voluntary. If you do decide to take part, you are still free to withdraw at any time without giving reasons. A decision not to take part or to withdraw will not affect the standard of care you receive. If you do decide to take part, you will be given this information sheet to keep and then be asked to sign a consent form. What will the research study involve? You will be asked to attend North Tyneside General Hospital (NTGH) twice and we aim to recruit 100 participants. VISIT 1 – NTGH, JUBILEE DAY HOSPITAL This visit will involve taking a medical history and brief examination, questionnaires about your Parkinson’s Disease, exercise and breathing. You will have an ECG (heart tracing). You will have a blood test. Total visit time: 120 minutes VISIT 2 – NTGH, PULMONARY FUNCTION This visit will involve measurements of how your lungs work, their volume and the strength of the breathing muscles. These are painless assessments involving breathing in and out of a tube attached to machines that record the measurements. Total visit time: 35 minutes BLOOD TEST At visit 1 you will have a blood test. This blood test is a simple pin prick test called a Capillary Blood gas that measures the levels of oxygen and carbon dioxide in the blood. After full completion of the study, all participants will be invited to a formal feedback event to share the overall results of the study. Expenses and payments Travel costs will be reimbursed by mileage, public transport or taxi as appropriate. What are the possible risks/ disadvantages of taking part? Giving up time to participate has to be considered.

159
What are the possible benefits of taking part? You will be contributing valuable information about how the lungs work in PD. Appropriate action will be taken for abnormal results if necessary. Contact details: Dr Ailish O’Callaghan or Professor Richard Walker, Department of Medicine, North Tyneside General Hospital, Rake Lane, North Shields. NE29 8NH. Tel: 0191 293 2709 This completes Part 1 of the information sheet. Thank you for reading Part 1 and if you are interested in participating in the study please continue to Part 2 before making a decision.
PART 2 What will happen if I don’t want to carry on with the study? You can withdraw from the study at any time. The data already collected could still be used if you were agreeable to this. What if there is a problem? a) Concerns or complaints – If you have a concern or complaint about any aspect of this study you should contact Dr O’Callaghan or Professor Walker by phone on 0191 293 2709 or in writing at the address above. The NHS operated Patient Advice and Liaison Service (PALS) can also provide guidance with any complaints or concerns by phone on 0800 032 0202, Text/SMS: 01670511098 or by email [email protected] b) In the unlikely event that something does go wrong and you suffer in any way the arrangements are as follows. If negligence of staff led to harm, this would be covered by the Northumbria Healthcare NHS Foundation Trust clinical negligence scheme. You may have to meet legal costs. Will my taking part in the study be kept confidential? All information obtained during the course of the study will be kept strictly confidential. It is our duty by law to protect your personal information and all of our procedures for handling, processing, storing and destroying data are compliant with the Data Protection Act (1998). Data collected during the study and your medical records may be looked at by regulatory authorities, who check that research is being carried out correctly, and the NHS Trust where it is relevant to your participation in the research. Results will be presented at scientific meetings, published in scientific journals and presented to participants at a feedback event without any personal identification.

160
Will my General Practitioner (GP) be involved? Your GP will be informed of your help with this study. This is standard practice. What will happen to blood samples? The blood sample will be tested for Capillary Blood Gas analysis (measures the gases in the blood). Samples will be disposed of once analysed. What will happen to the results of the research? The results will be published in scientific journals and presented at scientific meetings. All participants will be invited to a formal feedback event at which the results will be presented. Who is organising and funding the research? The study is being undertaken as part of Dr Ailish O’Callaghan’s MD degree at Newcastle University. The funding is from Northumbria Healthcare NHS Foundation Trust and via grants from Parkinson’s UK and The British Geriatrics Society. Who has reviewed the study? Ethical review of this study has been conducted by the Newcastle North Tyneside 1 Research Ethics Committee. Further information and contact details You can get further information on this study by contacting Dr Ailish O’Callaghan or Professor Richard Walker, Department of Medicine, North Tyneside General Hospital, Rake Lane, North Shields, NE29 8NH. Tel: 0191 293 2709. For further independent information about being involved in a research study
please contact the Patient Advice and Liaison Service (PALS). Freephone 0800
0320202, email: [email protected] Text/SMS: 01670511098
THANK YOU VERY MUCH FOR YOUR TIME AND INTEREST

161
Patient Identification number for this trial: CONSENT FORM
Title of project: Exercise and pulmonary function in Idiopathic Parkinson’s disease Baseline pulmonary function group Name of researcher: Professor Richard Walker, North Tyneside General Hospital, Tel: 0191 293 2709
Please initial box
1. I confirm that I have read and understand the information sheet dated 21st May 2012(V1.2) for the above study and have had the opportunity to ask questions. 2. I understand that my participation is voluntary and that I am free to withdraw at any time, without giving any reason, without my medical care or legal rights being affected. 3. If I choose to withdraw from the study or do not continue in the study for other reasons, I consent to the use of the data already collected. 4. I agree to my GP being informed of my participation in the study. 5. I understand that data collected during this study and my medical records may be looked at by individuals from regulatory authorities or from the NHS Trust where it is relevant to my participation in this research. I give permission for those individuals to access my data. 6. I agree to being contacted on the following telephone number: ………………………………………………………………………………………………………………………………… 7. I agree to take part in the above study. ........................................ ………………………… …………………………………… Name of participant Date Signature …………………………………….. ………………………… …………………………………… Name of person taking consent Date Signature (if different from researcher) …………………………………….. …………………………. …………………………………... Researcher Date Signature
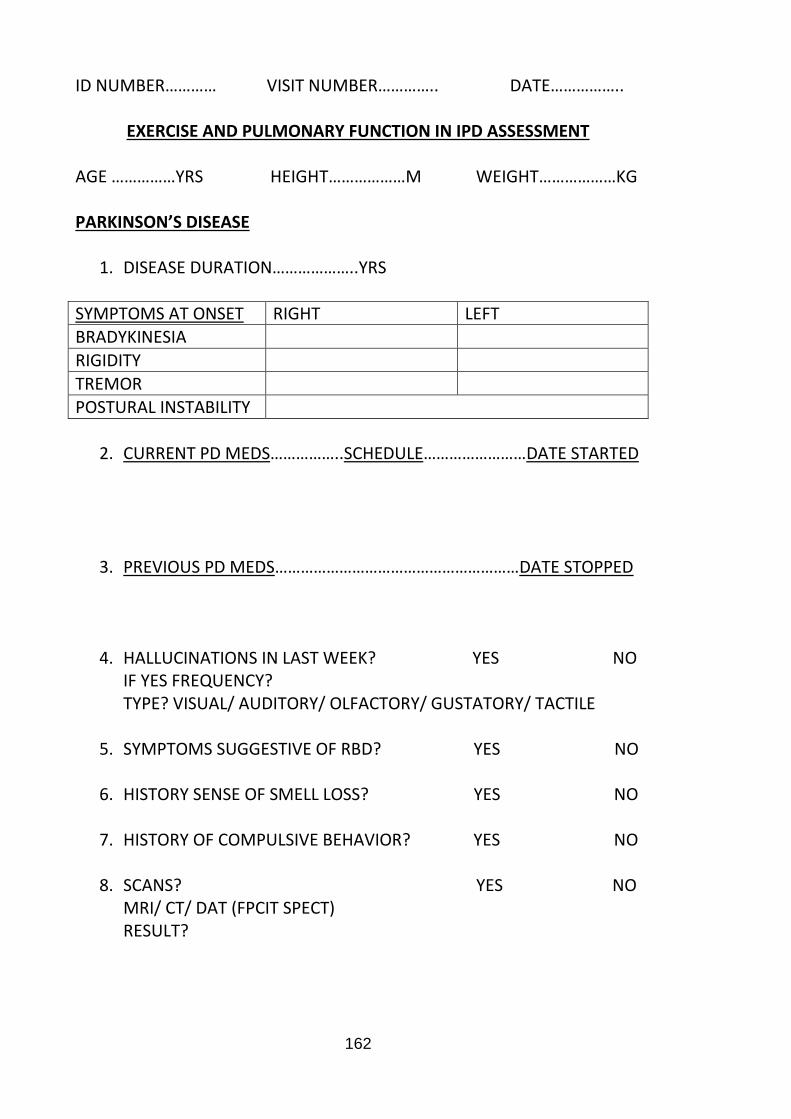
162
ID NUMBER………… VISIT NUMBER………….. DATE……………..
EXERCISE AND PULMONARY FUNCTION IN IPD ASSESSMENT AGE ……………YRS HEIGHT………………M WEIGHT………………KG PARKINSON’S DISEASE
1. DISEASE DURATION………………..YRS
SYMPTOMS AT ONSET RIGHT LEFT
BRADYKINESIA
RIGIDITY
TREMOR POSTURAL INSTABILITY
2. CURRENT PD MEDS……………..SCHEDULE……………………DATE STARTED
3. PREVIOUS PD MEDS…………………………………………………DATE STOPPED
4. HALLUCINATIONS IN LAST WEEK? YES NO IF YES FREQUENCY? TYPE? VISUAL/ AUDITORY/ OLFACTORY/ GUSTATORY/ TACTILE
5. SYMPTOMS SUGGESTIVE OF RBD? YES NO 6. HISTORY SENSE OF SMELL LOSS? YES NO
7. HISTORY OF COMPULSIVE BEHAVIOR? YES NO
8. SCANS? YES NO
MRI/ CT/ DAT (FPCIT SPECT) RESULT?
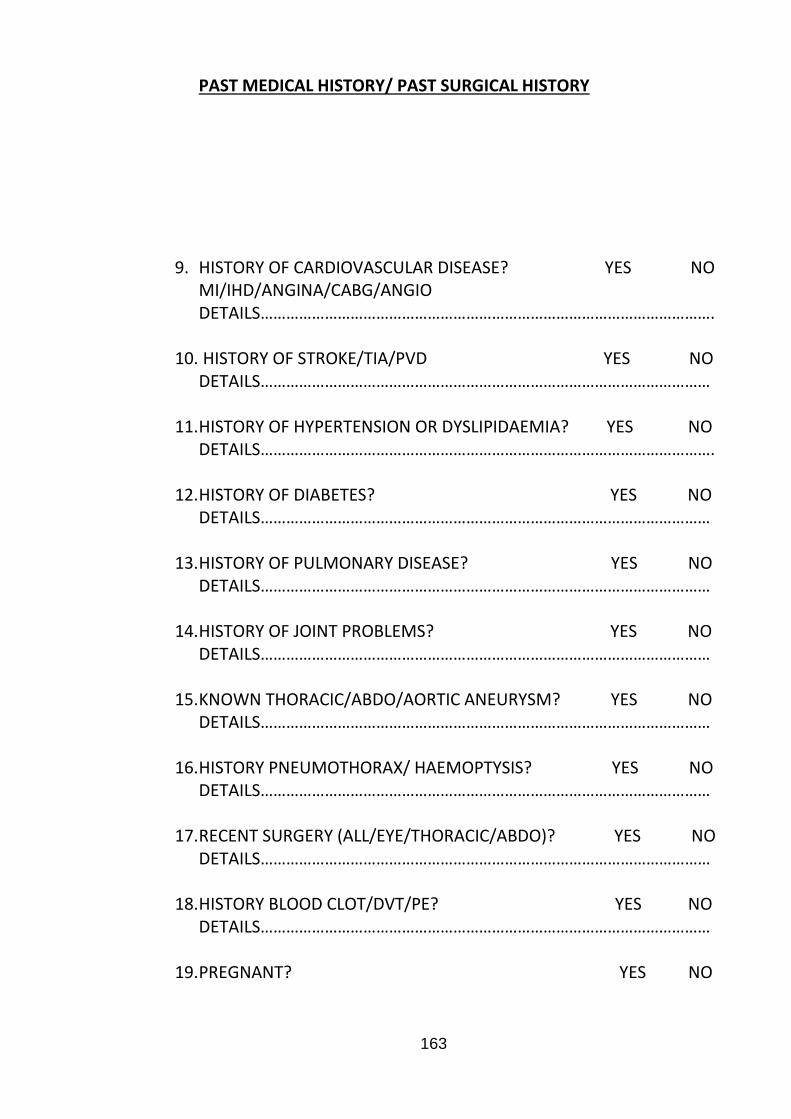
163
PAST MEDICAL HISTORY/ PAST SURGICAL HISTORY
9. HISTORY OF CARDIOVASCULAR DISEASE? YES NO MI/IHD/ANGINA/CABG/ANGIO DETAILS…………………………………………………………………………………………….
10. HISTORY OF STROKE/TIA/PVD YES NO
DETAILS……………………………………………………………………………………………
11. HISTORY OF HYPERTENSION OR DYSLIPIDAEMIA? YES NO DETAILS…………………………………………………………………………………………….
12. HISTORY OF DIABETES? YES NO
DETAILS……………………………………………………………………………………………
13. HISTORY OF PULMONARY DISEASE? YES NO DETAILS……………………………………………………………………………………………
14. HISTORY OF JOINT PROBLEMS? YES NO
DETAILS……………………………………………………………………………………………
15. KNOWN THORACIC/ABDO/AORTIC ANEURYSM? YES NO DETAILS……………………………………………………………………………………………
16. HISTORY PNEUMOTHORAX/ HAEMOPTYSIS? YES NO
DETAILS……………………………………………………………………………………………
17. RECENT SURGERY (ALL/EYE/THORACIC/ABDO)? YES NO DETAILS……………………………………………………………………………………………
18. HISTORY BLOOD CLOT/DVT/PE? YES NO
DETAILS……………………………………………………………………………………………
19. PREGNANT? YES NO
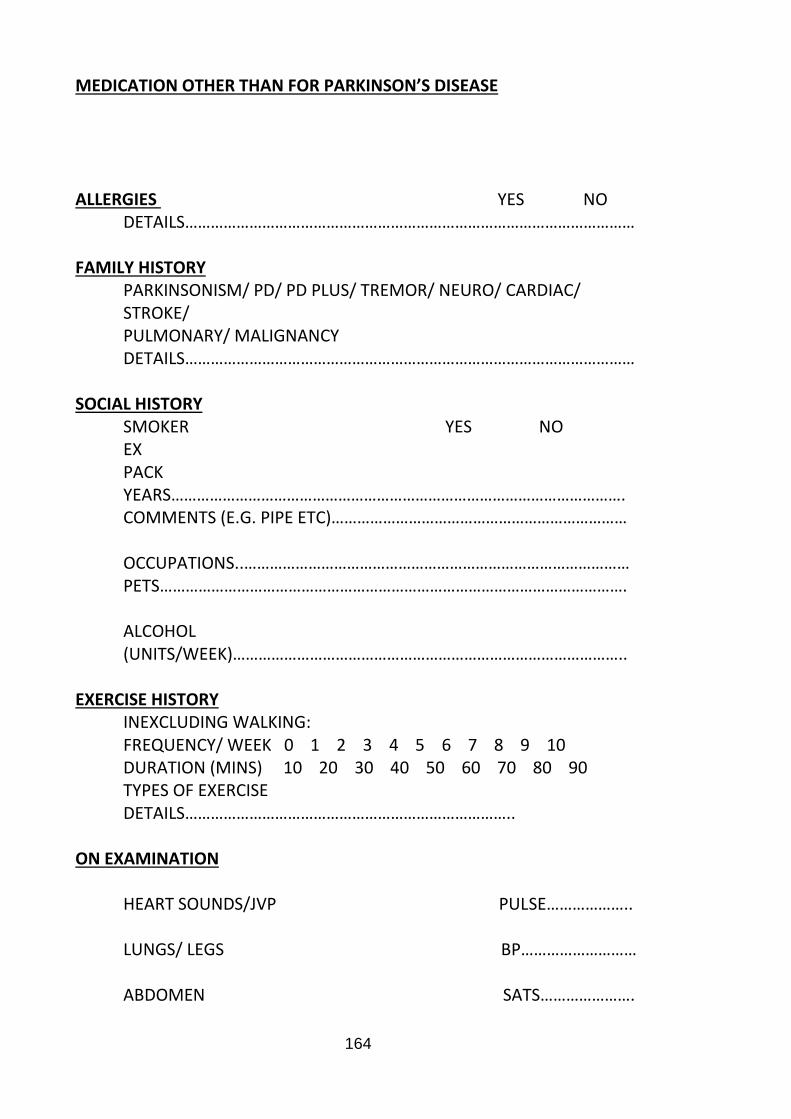
164
MEDICATION OTHER THAN FOR PARKINSON’S DISEASE
ALLERGIES YES NO DETAILS……………………………………………………………………………………………
FAMILY HISTORY PARKINSONISM/ PD/ PD PLUS/ TREMOR/ NEURO/ CARDIAC/ STROKE/ PULMONARY/ MALIGNANCY DETAILS……………………………………………………………………………………………
SOCIAL HISTORY SMOKER YES NO EX PACK YEARS……………………………………………………………………………………………. COMMENTS (E.G. PIPE ETC)…………………………………………………………… OCCUPATIONS..……………………………………………………………………………… PETS………………………………………………………………………………………………. ALCOHOL (UNITS/WEEK)………………………………………………………………………………..
EXERCISE HISTORY INEXCLUDING WALKING: FREQUENCY/ WEEK 0 1 2 3 4 5 6 7 8 9 10 DURATION (MINS) 10 20 30 40 50 60 70 80 90 TYPES OF EXERCISE DETAILS…………………………………………………………………..
ON EXAMINATION HEART SOUNDS/JVP PULSE……………….. LUNGS/ LEGS BP……………………… ABDOMEN SATS………………….

165
Appendix B. Rating scales
Due to copyright and reproduction prohibitions, copies of rating scales cannot
be reproduced.
The MDS-UPDRS can be accessed via this URL:
http://www.movementdisorders.org/MDS-Files1/PDFs/Rating-Scales/MDS-
UPDRS_Vol23_Issue15_2008.pdf
The PDQ-39 can be accessed via this URL:
https://innovation.ox.ac.uk/wp-content/uploads/2014/07/Final_PDQ-
39_English_UK_SAMPLE.pdf
The SCOPA-SLEEP can be accessed via this URL:
https://www.lumc.nl/sub/7020/att/1288981/SCOPA-SLEEP-EN
The HADS can be accessed via this URL:
http://www.scalesandmeasures.net/files/files/HADS.pdf
166
Appendix C. Randomised control trial; participant
information sheet, consent form and assessment document
Professor Richard Walker North Tyneside General Hospital
Rake Lane North Shields
NE29 8NH Tel: 0191 293 2709
PARTICIPANT INFORMATION SHEET
EXERCISE AND PULMONARY FUNCTION IN IDIOPATHIC PARKINSON’S DISEASE
RANDOMISED CONTROL TRIAL GROUP
We would like to invite you to take part in this research study. Please take time to read the following information carefully, it explains why the research is being done and what it involves. If you have any questions about the information or if there is anything you do not understand, you are very welcome to ask for further explanation.
Part 1 tells you the purpose of the study and what will happen if you decide to take part.
Part 2 gives you more detailed information about the conduct of the study.
Thank you for reading this.
PART 1 What is the purpose of the research study? Parkinson’s disease (PD) is the second most common neurodegenerative condition in the UK. Many people with PD suffer from respiratory symptoms including shortness of breath on exertion, cough and sputum production. Respiratory complications with PD are a common reason for hospital admission. Previous research studies looking at lung function in PD have produced some conflicting results. We plan to undertake a large study to look at the lung function and breathing muscle strength in PD and to assess the effect of a 12 week exercise programme on the above measurements. By defining the pattern of any lung problems in PD and demonstrating the effect of exercise on the heart and lung’s function and on quality of life measures, we hope our results can be used to improve management and reduce breathing complications and hospital admissions.
167
Why have I been invited to participate? You have been invited to participate as you are a patient with Idiopathic Parkinson’s Disease (IPD) currently under the care of the Northumbria PD service, the team organising this study. Do I have to take part? No, your participation is purely voluntary. If you do decide to take part, you are still free to withdraw at any time without giving reasons. A decision not to take part or to withdraw will not affect the standard of care you receive. If you do decide to take part, you will be given this information sheet to keep and then be asked to sign a consent form. What will the research study involve? You will be asked to attend North Tyneside General Hospital (NTGH) twice and the Clinical Research Facility at the Royal Victoria Infirmary (RVI) once at the beginning of the study and then NTGH twice and the RVI once again after 12 weeks. If you are allocated to the exercise group, during that 12 week period you will also be asked to attend 45 minute supervised exercise sessions 3 times per week at Moor Park Healthy Living Centre (HLC), approximately 1.5 miles from NTGH. We aim to recruit 30 participants and you will be divided at random into 2 equal groups, 1 group that will receive the 12 week exercise programme and 1 group that will continue to receive normal care. If you are placed in the group which does not attend the exercise sessions, at the end of the study you will be offered the opportunity to participate in a 12 week exercise programme if you would like to. VISIT 1 – NTGH, JUBILEE DAY HOSPITAL This visit will involve taking a medical history and examination, questionnaires about your Parkinson’s disease, exercise, breathing, quality of life, sleep, memory, anxiety and depression. You will have a speech assessment, involving measuring the maximum volume of your voice and recording you reading 5 sentences and a swallow assessment involving drinking a glass of water. You will have a 6 minute walking assessment. You will have an ECG (heart tracing). The normal care group will have 2 blood tests and the exercise group will have 1 blood test. The exercise group will go home wearing an accelerometry sensor (wristwatch type device) that measures movement and a small earpiece device that measures swallow. These devices can be dropped back at NTGH or collected by a member of the research team the following day. Total visit time: 210 minutes VISIT 2 – NTGH, PULMONARY FUNCTION This visit will involve measurement of how your lungs work, their volume and the strength of the breathing muscles. These are painless assessments involving breathing in and out of a tube attached to machines that record the measurements. Total visit time: 35 minutes

168
VISIT 3 – RVI This visit will involve checks of your pulse, blood pressure and strength, a memory test and a cycling test. The cycling test will be done on a recliner bike. During this test you will cycle at the same pace but how hard you are cycling will steadily increase. You will keep on cycling until you decide to stop or pedalling becomes too difficult. Whilst you are cycling you will be asked to wear a breathing mask and heart monitor. The exercise test will last 10 – 15 minutes. Total visit time: 75 minutes 12 WEEK EXERCISE INTERVENTION – HLC If you are allocated to the exercise group we will ask you to attend the Moor Park HLC for 45 minute sessions 3 times per week for 12 weeks. You will be in groups of 5 and the HLCs will be closed to the general public during your sessions. The sessions are individually tailored and supervised by the HLC staff who have extensive experience and qualifications in exercise in those with medical problems. Each 45 minute session will comprise 30 minutes of aerobic exercise, for example including cycling, and 15 minutes of resistance exercise, for example including arm weights. Before and after your first and last sessions you will have a blood test. During the first and last weeks you will go home from one of the sessions with a wristwatch type device that measures your oxygen level while you sleep. Each visit time: 45 minutes VISIT 4 – NTGH The same as visit 1. Total visit time: 210 minutes VISIT 5 – NTGH The same as visit 2. Total visit time: 35 minutes VISIT 6 – RVI The same as visit 3. Total visit time: 75 minutes BLOOD TESTS At visits 1 and 4 the normal care group will have 2 blood tests; 1 a simple pin prick test to measure the levels of the different gases in the blood and 1 to measure the blood count and the level and genotype (the genetic makeup) of a protein released in response to exercise into the blood. At visit 1 and 4 the exercise group will have 1 blood test, a simple pin prick test to measure the levels of the gases in the blood. In the exercise group only, before and after your first and last exercise sessions you will have a simple blood test for the blood count and the level and genotype (genetic makeup) of a protein in the blood that is affected by exercise. After full completion of the study, all participants will be invited to a formal feedback event to share the overall results of the study. Expenses and payments Travel costs will be reimbursed by mileage, public transport or taxi as appropriate.
169
What are the possible risks/ disadvantages of taking part? Giving up time to participate has to be considered. What are the possible benefits of taking part? It is hoped that participants may feel the benefits of becoming physically fitter during the study. You will have supervised exercise sessions, like a personal trainer, which will teach you about your body and show you how to exercise and use the equipment correctly. Contact details: Dr Ailish O’Callaghan or Professor Richard Walker, Department of Medicine, North Tyneside General Hospital, Rake Lane, North Shields. NE29 8NH Tel: 0191 293 2709 This completes Part 1 of the information sheet. Thank you for reading Part 1 and if you are interested in participating in the study please continue to read Part 2 before making any decision.
PART 2 What will happen if I don’t want to carry on with the study? You can withdraw from the study at any time. The data already collected could still be used if you were agreeable to this. What if there is a problem? a) Concerns or complaints – If you have a concern or complaint about any aspect of this study you should contact Dr O’Callaghan or Professor Walker by phone on 0191 293 2709 or in writing at the address above. The NHS operated Patient Advice and Liaison Service (PALS) can also provide guidance with any complaints or concerns by phone on 0800 032 0202, Text/SMS: 01670511098 or by email [email protected] b) In the unlikely event that something does go wrong and you suffer in any way the arrangements are as follows. If negligence of staff led to harm, then dependent on hospital site this would be covered by either the Northumbria Healthcare NHS Foundation Trust clinical negligence scheme or the Newcastle upon Tyne Hospitals NHS Foundation Trust clinical negligence scheme. You may have to meet legal costs. Will my taking part in the study be kept confidential? All information obtained during the course of the study will be kept strictly confidential. It is our duty by law to protect your personal information and all of our procedures for handling, processing, storing and destroying data are compliant with the Data Protection Act (1998). Data collected during the study and your medical

170
records may be looked at by regulatory authorities, who check that research is being carried out correctly, and the NHS Trust where it is relevant to your participation in the research. As part of your speech assessment you will be recorded reading 5 sentences. We will give each recording a code to make it as anonymous as possible. These recordings will be analysed by a speech and language therapist and destroyed after analysis. Results will be presented at scientific meetings, published in scientific journals and presented to participants at a feedback event without any personal identification. Will my General Practitioner (GP) be involved? Your GP will be informed of your help with this study. This is standard practice. What will happen to blood samples? The blood samples will be tested for Full Blood Count (counts the cells in the blood), Brain Derived Neurotrophic Factor (a protein released in response to exercise that may improve the ability of the brain’s neurons to survive and grow) level and genotype and Capillary Blood Gas analysis (measures the gases in the blood). Samples for Full Blood Count and Brain Derived Neurotrophic Factor will be stored until it is certain that the test results are accurate and then they will be disposed of. Samples for Capillary Blood Gas are disposed of after analysis. What will happen to the results of the research? The results will be published in scientific journals and presented at scientific meetings. All participants will be invited to a formal feedback event at which the results will be presented. Who is organising and funding the research? The study is being undertaken as part of Dr Ailish O’Callaghan’s MD degree at Newcastle University. The funding is via Northumbria Healthcare NHS Foundation Trust and grants from Parkinson’s UK and The British Geriatrics Society. Who has reviewed the study? Ethical review of this study has been conducted by the Newcastle North Tyneside 1 Research Ethics Committee. Further information and contact details You can get further information on this study by contacting Dr Ailish O’Callaghan or Professor Richard Walker, Department of Medicine, North Tyneside General Hospital, Rake Lane, North Shields, NE29 8NH. Tel: 0191 293 2709.

171
For further independent information about being involved in a research study please
contact the Patient Advice and Liaison Service (PALS). Freephone 0800 0320202, email:
[email protected] Text/SMS: 01670511098
THANK YOU VERY MUCH FOR YOUR TIME AND INTEREST
172
Patient Identification number for this trial:
CONSENT FORM
Title of project: Exercise and pulmonary function in Idiopathic Parkinson’s disease Randomised control trial group Name of researcher: Professor Richard Walker, North Tyneside General Hospital, Tel: 0191 293 2709
Please initial box
1. I confirm that I have read and understand the information sheet dated 21st May 2012(V1.2) for the above study and have had the opportunity to ask questions. 2. I understand that my participation is voluntary and that I am free to withdraw at any time, without giving any reason, without my medical care or legal rights being affected. 3. If I choose to withdraw from the study or do not continue in the study for other reasons, I consent to the use of the data already collected. 4. I agree to my GP being informed of my participation in the study. 5. I understand that data collected during this study and my medical records may be looked at by individuals from regulatory authorities or from the NHS Trust where it is relevant to my participation in this research. I give permission for those individuals to access my data. 6. I agree to being contacted on the following telephone number: ………………………………………………………………………………………………………………………………… 7. I agree to take part in the above study. ........................................ ………………………… …………………………………… Name of participant Date Signature …………………………………….. ………………………… …………………………………… Name of person taking consent Date Signature (if different from researcher) …………………………………….. …………………………. …………………………………... Researcher Date Signature

173
ID NUMBER……………… VISIT NUMBER……………….. DATE……………………….
EXERCISE AND PULMONARY FUNCTION IN IPD ASSESSMENT AGE ……………YRS HEIGHT………………M WEIGHT………………KG PARKINSON’S DISEASE
1. DISEASE DURATION………………..YRS
SYMPTOMS AT ONSET RIGHT LEFT
BRADYKINESIA
RIGIDITY
TREMOR POSTURAL INSTABILITY
2. CURRENT PD MEDS……………………SCHEDULE…………………...DATE
STARTED
3. PREVIOUS PD MEDS…………………………………………………………DATE STOPPED
4. HALLUCINATIONS IN LAST WEEK? YES NO IF YES FREQUENCY? TYPE? VISUAL/ AUDITORY/ OLFACTORY/ GUSTATORY/ TACTILE
5. SYMPTOMS SUGGESTIVE OF RBD? YES NO 6. HISTORY SENSE OF SMELL LOSS? YES NO
7. HISTORY OF COMPULSIVE BEHAVIOR? YES NO
8. SCANS? YES NO
MRI/ CT/ DAT (FPCIT SPECT) RESULT?
174
PAST MEDICAL HISTORY/ PAST SURGICAL HISTORY
9. HISTORY OF CARDIOVASCULAR DISEASE? YES NO MI/IHD/ANGINA/CABG/ANGIO DETAILS……………………………………………………………………………………………
10. HISTORY OF STROKE/TIA/PVD YES NO
DETAILS……………………………………………………………………………………………
11. HISTORY OF HYPERTENSION OR DYSLIPIDAEMIA? YES NO DETAILS……………………………………………………………………………………………
12. HISTORY OF DIABETES? YES NO
DETAILS……………………………………………………………………………………………
13. HISTORY OF PULMONARY DISEASE? YES NO DETAILS……………………………………………………………………………………………
14. HISTORY OF JOINT PROBLEMS? YES NO
DETAILS……………………………………………………………………………………………
15. KNOWN THORACIC/ABDO/AORTIC ANEURYSM? YES NO DETAILS……………………………………………………………………………………………
16. HISTORY PNEUMOTHORAX/ HAEMOPTYSIS? YES NO
DETAILS……………………………………………………………………………………………
17. RECENT SURGERY (ALL/EYE/THORACIC/ABDO)? YES NO DETAILS……………………………………………………………………………………………
18. HISTORY BLOOD CLOT/DVT/PE? YES NO
DETAILS……………………………………………………………………………………………
19. PREGNANT? YES NO
175
MEDICATION OTHER THAN FOR PARKINSON’S DISEASE
ALLERGIES YES NO DETAILS……………………………………………………………………………………………
FAMILY HISTORY PARKINSONISM/ PD/ PD PLUS/ TREMOR/ NEURO/ CARDIAC/ STROKE/ PULMONARY/ MALIGNANCY DETAILS……………………………………………………………………………………………
SOCIAL HISTORY SMOKER YES NO EX PACK YEARS……………………………………………………………………………………………. COMMENTS (E.G. PIPE ETC)…………………………………………………………… OCCUPATIONS..…………………………………………………………………………….. PETS………………………………………………………………………………………………. ALCOHOL (UNITS/WEEK)………………………………………………………………………………..
EXERCISE HISTORY INEXCLUDING WALKING: FREQUENCY/ WEEK 0 1 2 3 4 5 6 7 8 9 10 DURATION (MINS) 10 20 30 40 50 60 70 80 90 TYPES OF EXERCISE DETAILS………………………………………………………………………………………..
ON EXAMINATION HEART SOUNDS/JVP PULSE……………….. LUNGS/ LEGS BP………………………
ABDOMEN SATS…………………

176
SPEECH AND SWALLOW ASSESSMENTS
UNPREDICTABLE SENTENCES RECORDED YES NO
Practice: Do many magazines these days have long stories Insert unique 5 McHenry Parle unpredictable sentences Will you leave the ravioli in the oven. SUSTAINED VOWEL MAXIMUM……………………………..DECIBELS DURATION………………………………SECONDS 150ML WATER SWALLOW COMPLETED YES NO DURATION………………………………SECONDS SWALLOWS…………………………….NUMBER PAUSES…………………………………..NUMBER ACCELEROMETER ON YES NO NUMBER SWALLOW DETECTION ON YES NO

177
BLOODS BLOOD TEST DATE TAKEN/ N/A
CBG
FBC BDNF GENOTYPE
BASELINE BDNF LEVEL BDNF PRE EXERCISE 1
BDNF POST EXERCISE 1
BDNF PRE EXERCISE 2
BDNF PRE EXERCISE 2
GROUP 1 – VISIT 1 CBG/FBC/GENOTYPE/BDNF LEVEL GROUP 2 – VISIT 1 CBG HLC – FBC/BDNFX2 CBG RESULT
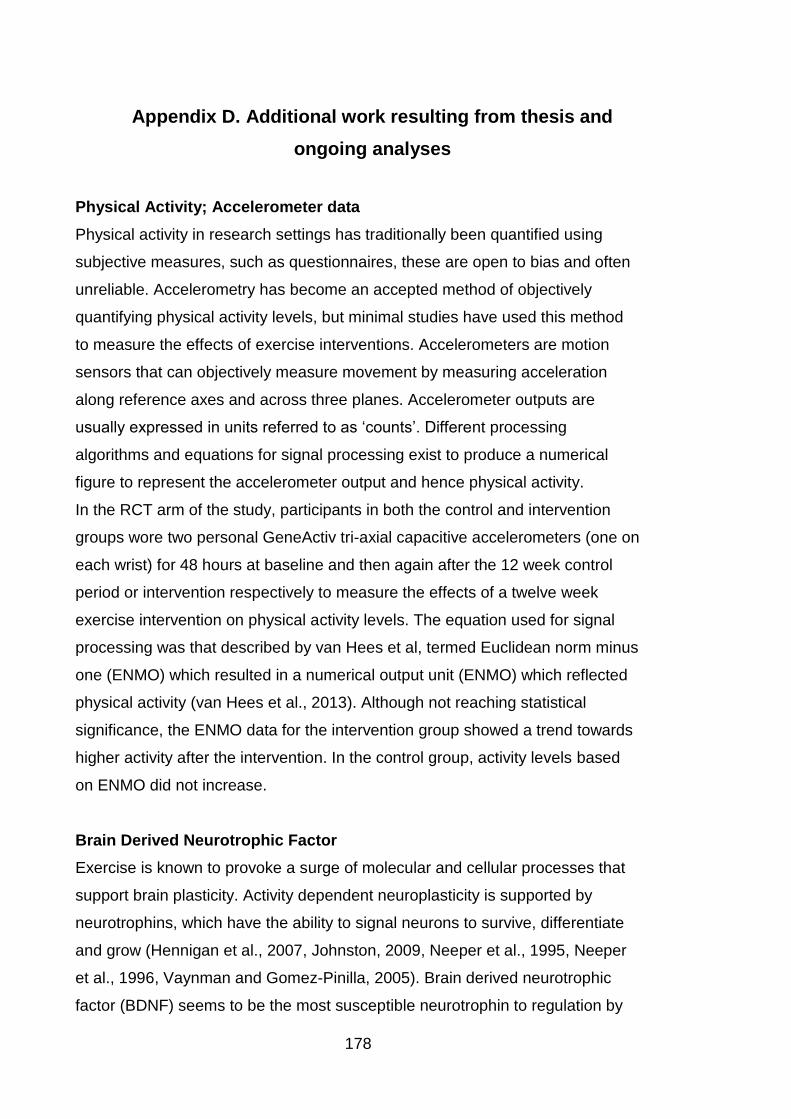
178
Appendix D. Additional work resulting from thesis and
ongoing analyses
Physical Activity; Accelerometer data
Physical activity in research settings has traditionally been quantified using
subjective measures, such as questionnaires, these are open to bias and often
unreliable. Accelerometry has become an accepted method of objectively
quantifying physical activity levels, but minimal studies have used this method
to measure the effects of exercise interventions. Accelerometers are motion
sensors that can objectively measure movement by measuring acceleration
along reference axes and across three planes. Accelerometer outputs are
usually expressed in units referred to as ‘counts’. Different processing
algorithms and equations for signal processing exist to produce a numerical
figure to represent the accelerometer output and hence physical activity.
In the RCT arm of the study, participants in both the control and intervention
groups wore two personal GeneActiv tri-axial capacitive accelerometers (one on
each wrist) for 48 hours at baseline and then again after the 12 week control
period or intervention respectively to measure the effects of a twelve week
exercise intervention on physical activity levels. The equation used for signal
processing was that described by van Hees et al, termed Euclidean norm minus
one (ENMO) which resulted in a numerical output unit (ENMO) which reflected
physical activity (van Hees et al., 2013). Although not reaching statistical
significance, the ENMO data for the intervention group showed a trend towards
higher activity after the intervention. In the control group, activity levels based
on ENMO did not increase.
Brain Derived Neurotrophic Factor
Exercise is known to provoke a surge of molecular and cellular processes that
support brain plasticity. Activity dependent neuroplasticity is supported by
neurotrophins, which have the ability to signal neurons to survive, differentiate
and grow (Hennigan et al., 2007, Johnston, 2009, Neeper et al., 1995, Neeper
et al., 1996, Vaynman and Gomez-Pinilla, 2005). Brain derived neurotrophic
factor (BDNF) seems to be the most susceptible neurotrophin to regulation by
179
exercise (Johnston, 2009, Neeper et al., 1995, Vaynman and Gomez-Pinilla,
2005). Studies have shown decreased BDNF expression within the substantia
nigra of PD brains as compared to controls (Howells et al., 2000, Parain et al.,
1999).
Part of this study aimed to evaluate the impact of an acute episode of exercise
on BDNF levels and the effect of 12 weeks of exercise training on BDNF levels
in PD. In the RCT arm of the study, blood was taken for BDNF levels in the
control group at baseline and after 12 weeks and in the intervention group
immediately before and after the 1st exercise intervention in week 1 and
immediately before and after the final exercise intervention in week 12. Plasma
samples were assayed for BDNF levels using a commercially available
sandwich ELISA kit from Promega (Sweden) according to the manufacturer’s
instructions.
While analysis of BDNF results is ongoing, the BDNF levels appear to vary
notably from one analysis to the next and provisional results indicate there was
no difference in the control group from start to finish. In the intervention group
there was no significant difference from the start to the end of the 1st or 12th
session or when comparing the start of session samples at week 1 and week 12
or the end of session samples at week 1 and week 12.
180
References
AARON, S. D., DALES, R. E. & CARDINAL, P. 1999. How accurate is
spirometry at predicting restrictive pulmonary impairment? Chest, 115,
869-73.
AARSLAND, D., ANDERSEN, K., LARSEN, J. P., LOLK, A. & KRAGH-
SORENSEN, P. 2003. Prevalence and characteristics of dementia in
Parkinson disease: an 8-year prospective study. Arch Neurol, 60, 387-
92.
AARSLAND, D., ANDERSEN, K., LARSEN, J. P., PERRY, R., WENTZEL-
LARSEN, T., LOLK, A. & KRAGH-SORENSEN, P. 2004. The rate of
cognitive decline in Parkinson disease. Arch Neurol, 61, 1906-11.
ABOUSSOUAN, L. S. 2005. Respiratory disorders in neurologic diseases.
Cleve Clin J Med, 72, 511-20.
ACRES, J. C. & KRYGER, M. H. 1981. Clinical significance of pulmonary
function tests: upper airway obstruction. Chest, 80, 207-11.
ACSM 2010. ACSM's Guidelines for Exercise Testing and Prescription,
Philadelphia, Lippincott, William, Wilkins.
AHLSKOG, J. E. 2011. Does vigorous exercise have a neuroprotective effect in
Parkinson disease? Neurology, 77, 288-94.
ALLEN, S. M., HUNT, B. & GREEN, M. 1985. Fall in vital capacity with posture.
Br J Dis Chest, 79, 267-71.
ARCHER, T., FREDRIKSSON, A. & JOHANSSON, B. 2011. Exercise alleviates
Parkinsonism: clinical and laboratory evidence. Acta Neurol Scand, 123,
73-84.
ARCHIBALD, N. & BURN, D. 2008. Parkinson’s disease. Medicine, 36, 630-
635.
ARTP 2003. Practical Handbook of Respiratory Function Testing: Part One,
Association for Respiratory Technology and Physiology.
ARTP. 2017. About the ARTP [Online]. Available:
http://www.artp.org.uk/en/about-artp/index.cfm.
ARTP/BTS 1994. Guidelines for the measurement of respiratory function.
Recommendations of the British Thoracic Society and the Association of
Respiratory Technicians and Physiologists. Respir Med, 88, 165-94.
ATS 2002. ATS statement: guidelines for the six-minute walk test. Am J Respir
Crit Care Med, 166, 111-7.
181
ATS/ACCP 2003. ATS/ACCP Statement on cardiopulmonary exercise testing.
Am J Respir Crit Care Med, 167, 211-77.
AUYEUNG, M., TSOI, T. H., MOK, V., CHEUNG, C. M., LEE, C. N., LI, R. &
YEUNG, E. 2012. Ten year survival and outcomes in a prospective
cohort of new onset Chinese Parkinson's disease patients. J Neurol
Neurosurg Psychiatry, 83, 607-11.
BARREIRO, T. J. & PERILLO, I. 2004. An approach to interpreting spirometry.
Am Fam Physician, 69, 1107-14.
BAUMANN, R. J., JAMESON, H. D., MCKEAN, H. E., HAACK, D. G. &
WEISBERG, L. M. 1980. Cigarette smoking and Parkinson disease: 1.
Comparison of cases with matched neighbors. Neurology, 30, 839-43.
BEISKE, A. G., LOGE, J. H., RONNINGEN, A. & SVENSSON, E. 2009. Pain in
Parkinson's disease: Prevalence and characteristics. Pain, 141, 173-7.
BELLIA, V., PISTELLI, F., GIANNINI, D., SCICHILONE, N., CATALANO, F.,
SPATAFORA, M., HOPPS, R., CARROZZI, L., BALDACCI, S., DI PEDE,
F., PAGGIARO, P. & VIEGI, G. 2003. Questionnaires, spirometry and
PEF monitoring in epidemiological studies on elderly respiratory patients.
Eur Respir J Suppl, 40, 21s-27s.
BENDITT, J. O. & BOITANO, L. J. 2013. Pulmonary issues in patients with
chronic neuromuscular disease. Am J Respir Crit Care Med, 187, 1046-
55.
BERARDELLI, A., ROTHWELL, J. C., THOMPSON, P. D. & HALLETT, M.
2001. Pathophysiology of bradykinesia in Parkinson's disease. Brain,
124, 2131-2146.
BERARDELLI, A., SABRA, A. F. & HALLETT, M. 1983. Physiological
mechanisms of rigidity in Parkinson's disease. J Neurol Neurosurg
Psychiatry, 46, 45-53.
BERGEN, J. L., TOOLE, T., ELLIOTT, R. G., 3RD, WALLACE, B., ROBINSON,
K. & MAITLAND, C. G. 2002. Aerobic exercise intervention improves
aerobic capacity and movement initiation in Parkinson's disease patients.
NeuroRehabilitation, 17, 161-8.
BETIK, A. C. & HEPPLE, R. T. 2008. Determinants of VO2 max decline with
aging: an integrated perspective. Appl Physiol Nutr Metab, 33, 130-40.
BEYER, K., DOMINGO-SABAT, M. & ARIZA, A. 2009. Molecular pathology of
Lewy body diseases. Int J Mol Sci, 10, 724-45.
182
BEYER, M. K., HERLOFSON, K., ARSLAND, D. & LARSEN, J. P. 2001.
Causes of death in a community-based study of Parkinson's disease.
Acta Neurol Scand, 103, 7-11.
BHATT, S. P., SIEREN, J. C., DRANSFIELD, M. T., WASHKO, G. R.,
NEWELL, J. D., JR., STINSON, D. S., ZAMBA, G. K. & HOFFMAN, E. A.
2014. Comparison of spirometric thresholds in diagnosing smoking-
related airflow obstruction. Thorax, 69, 409-14.
BHIDAYASIRI, R. 2005. Differential diagnosis of common tremor syndromes.
Postgrad Med J, 81, 756-62.
BJELLAND, I., DAHL, A. A., HAUG, T. T. & NECKELMANN, D. 2002. The
validity of the Hospital Anxiety and Depression Scale. An updated
literature review. J Psychosom Res, 52, 69-77.
BLAIR, G. K., COHEN, R. & FILLER, R. M. 1986. Treatment of tracheomalacia:
eight years' experience. J Pediatr Surg, 21, 781-5.
BLOEM, B. R. 1992. Postural instability in Parkinson's disease. Clin Neurol
Neurosurg, 94 Suppl, S41-5.
BODEN, J. M., FERGUSSON, D. M. & HORWOOD, L. J. 2010. Cigarette
smoking and depression: tests of causal linkages using a longitudinal
birth cohort. Br J Psychiatry, 196, 440-6.
BOGAARD, J. M., HOVESTADT, A., MEERWALDT, J., VD MECHE, F. G. &
STIGT, J. 1989. Maximal expiratory and inspiratory flow-volume curves
in Parkinson's disease. Am Rev Respir Dis, 139, 610-4.
BONIFATI, V., RIZZU, P., VAN BAREN, M. J., SCHAAP, O., BREEDVELD, G.
J., KRIEGER, E., DEKKER, M. C., SQUITIERI, F., IBANEZ, P.,
JOOSSE, M., VAN DONGEN, J. W., VANACORE, N., VAN SWIETEN, J.
C., BRICE, A., MECO, G., VAN DUIJN, C. M., OOSTRA, B. A. &
HEUTINK, P. 2003. Mutations in the DJ-1 gene associated with
autosomal recessive early-onset parkinsonism. Science, 299, 256-9.
BORG, G. 1998 Borg's perceived exertion and pain scales, Champaign, Human
Kinetics.
BOURKE, S. C. 2014. Respiratory involvement in neuromuscular disease. Clin
Med (Lond), 14, 72-5.
BOURKE, S. C. & GIBSON, G. J. 2002. Sleep and breathing in neuromuscular
disease. Eur Respir J, 19, 1194-201.
183
BOURKE, S. C., TOMLINSON, M., WILLIAMS, T. L., BULLOCK, R. E., SHAW,
P. J. & GIBSON, G. J. 2006. Effects of non-invasive ventilation on
survival and quality of life in patients with amyotrophic lateral sclerosis: a
randomised controlled trial. Lancet Neurol, 5, 140-7.
BRAAK, H., GHEBREMEDHIN, E., RUB, U., BRATZKE, H. & DEL TREDICI, K.
2004. Stages in the development of Parkinson's disease-related
pathology. Cell Tissue Res, 318, 121-34.
BRAAK, H., RUB, U., GAI, W. P. & DEL TREDICI, K. 2003. Idiopathic
Parkinson's disease: possible routes by which vulnerable neuronal types
may be subject to neuroinvasion by an unknown pathogen. J Neural
Transm, 110, 517-36.
BRITTON, T. C. & CHAUDHURI, K. R. 2009. REM sleep behavior disorder and
the risk of developing Parkinson disease or dementia. Neurology, 72,
1294-5.
BRUBAKER, P. H. & KITZMAN, D. W. 2011. Chronotropic incompetence:
causes, consequences, and management. Circulation, 123, 1010-20.
BRUNDIN, P., LI, J. Y., HOLTON, J. L., LINDVALL, O. & REVESZ, T. 2008.
Research in motion: the enigma of Parkinson's disease pathology
spread. Nat Rev Neurosci, 9, 741-5.
BUCHMAN, A. S., LEURGANS, S. E., NAG, S., BENNETT, D. A. &
SCHNEIDER, J. A. 2011. Cerebrovascular disease pathology and
parkinsonian signs in old age. Stroke, 42, 3183-9.
BURKE, R. E., DAUER, W. T. & VONSATTEL, J. P. 2008. A critical evaluation
of the Braak staging scheme for Parkinson's disease. Ann Neurol, 64,
485-91.
BURN, D. J., ROWAN, E. N., ALLAN, L. M., MOLLOY, S., O'BRIEN, J. T. &
MCKEITH, I. G. 2006. Motor subtype and cognitive decline in Parkinson's
disease, Parkinson's disease with dementia, and dementia with Lewy
bodies. J Neurol Neurosurg Psychiatry, 77, 585-9.
BURROWS, B., LEBOWITZ, M. D., CAMILLI, A. E. & KNUDSON, R. J. 1986.
Longitudinal changes in forced expiratory volume in one second in
adults. Methodologic considerations and findings in healthy nonsmokers.
Am Rev Respir Dis, 133, 974-80.
184
BUTLER, C., 2ND & KLEINERMAN, J. 1970. Capillary density: alveolar
diameter, a morphometric approach to ventilation and perfusion. Am Rev
Respir Dis, 102, 886-94.
CAHALIN, L. P., SEMIGRAN, M. J. & DEC, G. W. 1997. Inspiratory muscle
training in patients with chronic heart failure awaiting cardiac
transplantation: results of a pilot clinical trial. Phys Ther, 77, 830-8.
CANNING, C. G., ALISON, J. A., ALLEN, N. E. & GROELLER, H. 1997.
Parkinson's disease: an investigation of exercise capacity, respiratory
function, and gait. Arch Phys Med Rehabil, 78, 199-207.
CARDOSO, S. R. & PEREIRA, J. S. 2002. [Analysis of breathing function in
Parkinson's disease]. Arq Neuropsiquiatr, 60, 91-5.
CASABURI, R. 2008. A brief history of pulmonary rehabilitation. Respir Care,
53, 1185-9.
CELLI, B. R. 1994. The clinical use of upper extremity exercise. Clin Chest
Med, 15, 339-49.
CERVERI, I., CORSICO, A. G., ACCORDINI, S., NINIANO, R., ANSALDO, E.,
ANTO, J. M., KUNZLI, N., JANSON, C., SUNYER, J., JARVIS, D.,
SVANES, C., GISLASON, T., HEINRICH, J., SCHOUTEN, J. P., WJST,
M., BURNEY, P. & DE MARCO, R. 2008. Underestimation of airflow
obstruction among young adults using FEV1/FVC <70% as a fixed cut-
off: a longitudinal evaluation of clinical and functional outcomes. Thorax,
63, 1040-5.
CHAUDHURI, K. R., HEALY, D. G. & SCHAPIRA, A. H. 2006. Non-motor
symptoms of Parkinson's disease: diagnosis and management. Lancet
Neurol, 5, 235-45.
CHAUDHURI, K. R., PRIETO-JURCYNSKA, C., NAIDU, Y., MITRA, T.,
FRADES-PAYO, B., TLUK, S., RUESSMANN, A., ODIN, P., MACPHEE,
G., STOCCHI, F., ONDO, W., SETHI, K., SCHAPIRA, A. H., MARTINEZ
CASTRILLO, J. C. & MARTINEZ-MARTIN, P. 2010. The nondeclaration
of nonmotor symptoms of Parkinson's disease to health care
professionals: an international study using the nonmotor symptoms
questionnaire. Mov Disord, 25, 704-9.
CHAUDHURI, K. R. & SCHAPIRA, A. H. 2009. Non-motor symptoms of
Parkinson's disease: dopaminergic pathophysiology and treatment.
Lancet Neurol, 8, 464-74.
185
CHECKOWAY, H., POWERS, K., SMITH-WELLER, T., FRANKLIN, G. M.,
LONGSTRETH, W. T., JR. & SWANSON, P. D. 2002. Parkinson's
disease risks associated with cigarette smoking, alcohol consumption,
and caffeine intake. Am J Epidemiol, 155, 732-8.
CHEN, H., HUANG, X., GUO, X., MAILMAN, R. B., PARK, Y., KAMEL, F.,
UMBACH, D. M., XU, Q., HOLLENBECK, A., SCHATZKIN, A. & BLAIR,
A. 2010. Smoking duration, intensity, and risk of Parkinson disease.
Neurology, 74, 878-84.
CHEN, Z. Y., PATEL, P. D., SANT, G., MENG, C. X., TENG, K. K.,
HEMPSTEAD, B. L. & LEE, F. S. 2004. Variant brain-derived
neurotrophic factor (BDNF) (Met66) alters the intracellular trafficking and
activity-dependent secretion of wild-type BDNF in neurosecretory cells
and cortical neurons. J Neurosci, 24, 4401-11.
CHHABRA, S. K. 1998. Forced vital capacity, slow vital capacity, or inspiratory
vital capacity: which is the best measure of vital capacity? J Asthma, 35,
361-5.
CHOTINAIWATTARAKUL, W., DAYALU, P., CHERVIN, R. D. & ALBIN, R. L.
2011. Risk of sleep-disordered breathing in Parkinson's disease. Sleep
Breath, 15, 471-8.
CHRISCHILLES, E. A., RUBENSTEIN, L. M., VOELKER, M. D., WALLACE, R.
B. & RODNITZKY, R. L. 2002. Linking clinical variables to health-related
quality of life in Parkinson's disease. Parkinsonism Relat Disord, 8, 199-
209.
COATES, A. L., PESLIN, R., RODENSTEIN, D. & STOCKS, J. 1997.
Measurement of lung volumes by plethysmography. Eur Respir J, 10,
1415-27.
COOK, C. E. 2008. Clinimetrics Corner: The Minimal Clinically Important
Change Score (MCID): A Necessary Pretense. J Man Manip Ther, 16,
E82-3.
COOKSON, M. R. 2009. alpha-Synuclein and neuronal cell death. Mol
Neurodegener, 4, 9.
CRIEE, C. P., SORICHTER, S., SMITH, H. J., KARDOS, P., MERGET, R.,
HEISE, D., BERDEL, D., KOHLER, D., MAGNUSSEN, H., MAREK, W.,
MITFESSEL, H., RASCHE, K., ROLKE, M., WORTH, H. & JORRES, R.
186
A. 2011. Body plethysmography--its principles and clinical use. Respir
Med, 105, 959-71.
CUMMINGS, J. L., HENCHCLIFFE, C., SCHAIER, S., SIMUNI, T., WAXMAN,
A. & KEMP, P. 2011. The role of dopaminergic imaging in patients with
symptoms of dopaminergic system neurodegeneration. Brain, 134, 3146-
66.
D'AMELIO, M., RAGONESE, P., MORGANTE, L., REGGIO, A., CALLARI, G.,
SALEMI, G. & SAVETTIERI, G. 2006. Long-term survival of Parkinson's
disease: a population-based study. J Neurol, 253, 33-7.
DE BRUIN, P. F., DE BRUIN, V. M., LEES, A. J. & PRIDE, N. B. 1993. Effects
of treatment on airway dynamics and respiratory muscle strength in
Parkinson's disease. Am Rev Respir Dis, 148, 1576-80.
DE PANDIS, M. F., STARACE, A., STEFANELLI, F., MARRUZZO, P., MEOLI,
I., DE SIMONE, G., PRATI, R. & STOCCHI, F. 2002. Modification of
respiratory function parameters in patients with severe Parkinson's
disease. Neurol Sci, 23 Suppl 2, S69-70.
DE TROYER, A. & ESTENNE, M. 1984. Coordination between rib cage
muscles and diaphragm during quiet breathing in humans. J Appl Physiol
Respir Environ Exerc Physiol, 57, 899-906.
DEXTER, D. T. & JENNER, P. 2013. Parkinson disease: from pathology to
molecular disease mechanisms. Free Radic Biol Med, 62, 132-44.
DICKSON, D. W., BRAAK, H., DUDA, J. E., DUYCKAERTS, C., GASSER, T.,
HALLIDAY, G. M., HARDY, J., LEVERENZ, J. B., DEL TREDICI, K.,
WSZOLEK, Z. K. & LITVAN, I. 2009. Neuropathological assessment of
Parkinson's disease: refining the diagnostic criteria. Lancet Neurol, 8,
1150-7.
DIJKSTRA, A. A., VOORN, P., BERENDSE, H. W., GROENEWEGEN, H. J.,
ROZEMULLER, A. J. & VAN DE BERG, W. D. 2014. Stage-dependent
nigral neuronal loss in incidental Lewy body and Parkinson's disease.
Mov Disord.
DOCKERY, D. W., WARE, J. H., FERRIS, B. G., JR., GLICKSBERG, D. S.,
FAY, M. E., SPIRO, A., 3RD & SPEIZER, F. E. 1985. Distribution of
forced expiratory volume in one second and forced vital capacity in
healthy, white, adult never-smokers in six U.S. cities. Am Rev Respir Dis,
131, 511-20.
187
DRIVER, H. S. & TAYLOR, S. R. 2000. Exercise and sleep. Sleep Med Rev, 4,
387-402.
DUBOIS, A. B., BOTELHO, S. Y., BEDELL, G. N., MARSHALL, R. & COMROE,
J. H., JR. 1956. A rapid plethysmographic method for measuring thoracic
gas volume: a comparison with a nitrogen washout method for
measuring functional residual capacity in normal subjects. J Clin Invest,
35, 322-6.
DUNCAN, G. W., KHOO, T. K., COLEMAN, S. Y., BRAYNE, C., YARNALL, A.
J., O'BRIEN, J. T., BARKER, R. A. & BURN, D. J. 2014. The incidence of
Parkinson's disease in the North-East of England. Age Ageing, 43, 257-
63.
DUNGO, R. & DEEKS, E. D. 2013. Istradefylline: first global approval. Drugs,
73, 875-82.
EDGE, J. R., MILLARD, F. J., REID, L. & SIMON, G. 1964. The Radiographic
Appearances of the Chest in Persons of Advanced Age. Br J Radiol, 37,
769-74.
EGAN, M. F., KOJIMA, M., CALLICOTT, J. H., GOLDBERG, T. E.,
KOLACHANA, B. S., BERTOLINO, A., ZAITSEV, E., GOLD, B.,
GOLDMAN, D., DEAN, M., LU, B. & WEINBERGER, D. R. 2003. The
BDNF val66met polymorphism affects activity-dependent secretion of
BDNF and human memory and hippocampal function. Cell, 112, 257-69.
ENRIGHT, P. L. 2003. The six-minute walk test. Respir Care, 48, 783-5.
ENRIGHT, P. L., ADAMS, A. B., BOYLE, P. J. & SHERRILL, D. L. 1995.
Spirometry and maximal respiratory pressure references from healthy
Minnesota 65- to 85-year-old women and men. Chest, 108, 663-9.
ENRIGHT, P. L., KRONMAL, R. A., MANOLIO, T. A., SCHENKER, M. B. &
HYATT, R. E. 1994. Respiratory muscle strength in the elderly.
Correlates and reference values. Cardiovascular Health Study Research
Group. Am J Respir Crit Care Med, 149, 430-8.
ENRIGHT, P. L., MCCLELLAND, R. L., BUIST, A. S. & LEBOWITZ, M. D. 2001.
Correlates of peak expiratory flow lability in elderly persons. Chest, 120,
1861-8.
ENRIGHT, S., CHATHAM, K., BALDWIN, J. & GRIFFITHS, H. The effect of
fixed load incremental inspiratory muscle training in the elite athlete: a
pilot study. Physical Therapy in Sport, 1, 1-5.
188
ESTENNE, M., HUBERT, M. & DE TROYER, A. 1984. Respiratory-muscle
involvement in Parkinson's disease. N Engl J Med, 311, 1516-7.
ESTENNE, M., YERNAULT, J. C. & DE TROYER, A. 1985. Rib cage and
diaphragm-abdomen compliance in humans: effects of age and posture.
J Appl Physiol (1985), 59, 1842-8.
EVANS, A. H., LAWRENCE, A. D., POTTS, J., MACGREGOR, L.,
KATZENSCHLAGER, R., SHAW, K., ZIJLMANS, J. & LEES, A. J. 2006.
Relationship between impulsive sensation seeking traits, smoking,
alcohol and caffeine intake, and Parkinson's disease. J Neurol Neurosurg
Psychiatry, 77, 317-21.
FALL, P. A., SALEH, A., FREDRICKSON, M., OLSSON, J. E. & GRANERUS,
A. K. 2003. Survival time, mortality, and cause of death in elderly patients
with Parkinson's disease: a 9-year follow-up. Mov Disord, 18, 1312-6.
FEARNLEY, J. M. & LEES, A. J. 1991. Ageing and Parkinson's disease:
substantia nigra regional selectivity. Brain, 114 ( Pt 5), 2283-301.
FERRER, I. 2011. Neuropathology and neurochemistry of nonmotor symptoms
in Parkinson's disease. Parkinsons Dis, 2011, 708404.
FITTING, J. W. 2006. Sniff nasal inspiratory pressure: simple or too simple? Eur
Respir J, 27, 881-3.
FITTING, J. W., PAILLEX, R., HIRT, L., AEBISCHER, P. & SCHLUEP, M. 1999.
Sniff nasal pressure: a sensitive respiratory test to assess progression of
amyotrophic lateral sclerosis. Ann Neurol, 46, 887-93.
FOLTYNIE, T., BRAYNE, C. & BARKER, R. A. 2002. The heterogeneity of
idiopathic Parkinson's disease. J Neurol, 249, 138-45.
FOX, C. M., RAMIG, L. O., CIUCCI, M. R., SAPIR, S., MCFARLAND, D. H. &
FARLEY, B. G. 2006. The science and practice of LSVT/LOUD: neural
plasticity-principled approach to treating individuals with Parkinson
disease and other neurological disorders. Semin Speech Lang, 27, 283-
99.
FREIRE, C. & KOIFMAN, S. 2012. Pesticide exposure and Parkinson's disease:
epidemiological evidence of association. Neurotoxicology, 33, 947-71.
GERLACH, O. H., WINOGRODZKA, A. & WEBER, W. E. 2011. Clinical
problems in the hospitalized Parkinson's disease patient: systematic
review. Mov Disord, 26, 197-208.
189
GHASEMI, A. & ZAHEDIASL, S. 2012. Normality tests for statistical analysis: a
guide for non-statisticians. Int J Endocrinol Metab, 10, 486-9.
GIBALA, M. J., LITTLE, J. P., MACDONALD, M. J. & HAWLEY, J. A. 2012.
Physiological adaptations to low-volume, high-intensity interval training in
health and disease. J Physiol, 590, 1077-84.
GLADY, C. A., AARON, S. D., LUNAU, M., CLINCH, J. & DALES, R. E. 2003. A
spirometry-based algorithm to direct lung function testing in the
pulmonary function laboratory. Chest, 123, 1939-46.
GOLD, G. I. F. C. O. L. D. 2010. Spirometry for health care providers.
GOLDENBERG, M., DANOVITCH, I. & ISHAK, W. W. 2014. Quality of life and
smoking. Am J Addict, 23, 540-62.
GOLDSTEIN, D. S. 2003. Dysautonomia in Parkinson's disease:
neurocardiological abnormalities. Lancet Neurol, 2, 669-76.
GOLDSTEIN, D. S. 2014. Dysautonomia in Parkinson disease. Compr Physiol,
4, 805-26.
GONZALEZ-BARCALA, F. J., DE LA FUENTE-CID, R., TAFALLA, M., NUEVO,
J. & CAAMANO-ISORNA, F. 2012. Factors associated with health-
related quality of life in adults with asthma. A cross-sectional study.
Multidiscip Respir Med, 7, 32.
GORELL, J. M., JOHNSON, C. C., RYBICKI, B. A., PETERSON, E. L. &
RICHARDSON, R. J. 1998. The risk of Parkinson's disease with
exposure to pesticides, farming, well water, and rural living. Neurology,
50, 1346-50.
GUEDES, L. U., RODRIGUES, J. M., FERNANDES, A. A., CARDOSO, F. E. &
PARREIRA, V. F. 2012. Respiratory changes in Parkinson's disease may
be unrelated to dopaminergic dysfunction. Arq Neuropsiquiatr, 70, 847-
51.
GUENARD, H. & MARTHAN, R. 1996. Pulmonary gas exchange in elderly
subjects. Eur Respir J, 9, 2573-7.
GUNEYSEL, O., ONULTAN, O. & ONUR, O. 2008. Parkinson's disease and the
frequent reasons for emergency admission. Neuropsychiatr Dis Treat, 4,
711-4.
GUPTA, D. & KURUVILLA, A. 2011. Vascular parkinsonism: what makes it
different? Postgrad Med J, 87, 829-36.
190
GUTTMAN, M., SLAUGHTER, P. M., THERIAULT, M. E., DEBOER, D. P. &
NAYLOR, C. D. 2004. Parkinsonism in Ontario: comorbidity associated
with hospitalization in a large cohort. Mov Disord, 19, 49-53.
GUYTON, A. & HALL, J. E. 2011. Textbook of Medical Physiology.
HAAS, B. M., TREW, M. & CASTLE, P. C. 2004. Effects of respiratory muscle
weakness on daily living function, quality of life, activity levels, and
exercise capacity in mild to moderate Parkinson's disease. Am J Phys
Med Rehabil, 83, 601-7.
HALLIDAY, G., LEES, A. & STERN, M. 2011. Milestones in Parkinson's
disease--clinical and pathologic features. Mov Disord, 26, 1015-21.
HALLIDAY, G. M. & MCCANN, H. 2010. The progression of pathology in
Parkinson's disease. Ann N Y Acad Sci, 1184, 188-95.
HALLIWILL, J. R., BUCK, T. M., LACEWELL, A. N. & ROMERO, S. A. 2013.
Postexercise hypotension and sustained postexercise vasodilatation:
what happens after we exercise? Exp Physiol, 98, 7-18.
HAMBRECHT, R. P., SCHULER, G. C., MUTH, T., GRUNZE, M. F.,
MARBURGER, C. T., NIEBAUER, J., METHFESSEL, S. M. & KUBLER,
W. 1992. Greater diagnostic sensitivity of treadmill versus cycle exercise
testing of asymptomatic men with coronary artery disease. Am J Cardiol,
70, 141-6.
HANKINSON, J. L., ODENCRANTZ, J. R. & FEDAN, K. B. 1999. Spirometric
reference values from a sample of the general U.S. population. Am J
Respir Crit Care Med, 159, 179-87.
HART, N., CRAMER, D., WARD, S. P., NICKOL, A. H., MOXHAM, J., POLKEY,
M. I. & PRIDE, N. B. 2002. Effect of pattern and severity of respiratory
muscle weakness on carbon monoxide gas transfer and lung volumes.
Eur Respir J, 20, 996-1002.
HAWKES, C. H., DEL TREDICI, K. & BRAAK, H. 2007. Parkinson's disease: a
dual-hit hypothesis. Neuropathol Appl Neurobiol, 33, 599-614.
HEALY, D. G., FALCHI, M., O'SULLIVAN, S. S., BONIFATI, V., DURR, A.,
BRESSMAN, S., BRICE, A., AASLY, J., ZABETIAN, C. P.,
GOLDWURM, S., FERREIRA, J. J., TOLOSA, E., KAY, D. M., KLEIN,
C., WILLIAMS, D. R., MARRAS, C., LANG, A. E., WSZOLEK, Z. K.,
BERCIANO, J., SCHAPIRA, A. H., LYNCH, T., BHATIA, K. P., GASSER,
T., LEES, A. J. & WOOD, N. W. 2008. Phenotype, genotype, and
191
worldwide genetic penetrance of LRRK2-associated Parkinson's disease:
a case-control study. Lancet Neurol, 7, 583-90.
HELY, M. A., MORRIS, J. G., REID, W. G. & TRAFFICANTE, R. 2005. Sydney
Multicenter Study of Parkinson's disease: non-L-dopa-responsive
problems dominate at 15 years. Mov Disord, 20, 190-9.
HENNIGAN, A., O'CALLAGHAN, R. M. & KELLY, A. M. 2007. Neurotrophins
and their receptors: roles in plasticity, neurodegeneration and
neuroprotection. Biochem Soc Trans, 35, 424-7.
HERER, B., ARNULF, I. & HOUSSET, B. 2001. Effects of levodopa on
pulmonary function in Parkinson's disease. Chest, 119, 387-93.
HERITIER, F., RAHM, F., PASCHE, P. & FITTING, J. W. 1994. Sniff nasal
inspiratory pressure. A noninvasive assessment of inspiratory muscle
strength. Am J Respir Crit Care Med, 150, 1678-83.
HIGGINBOTHAM, M. B., MORRIS, K. G., WILLIAMS, R. S., MCHALE, P. A.,
COLEMAN, R. E. & COBB, F. R. 1986. Regulation of stroke volume
during submaximal and maximal upright exercise in normal man. Circ
Res, 58, 281-91.
HOEHN, M. M. & YAHR, M. D. 1967. Parkinsonism: onset, progression and
mortality. Neurology, 17, 427-42.
HORVATH, K., ASCHERMANN, Z., ACS, P., DELI, G., JANSZKY, J.,
KOMOLY, S., BALAZS, E., TAKACS, K., KARADI, K. & KOVACS, N.
2015. Minimal clinically important difference on the Motor Examination
part of MDS-UPDRS. Parkinsonism Relat Disord, 21, 1421-6.
HORVATH, K., ASCHERMANN, Z., KOVACS, M., MAKKOS, A., HARMAT, M.,
JANSZKY, J., KOMOLY, S., KARADI, K. & KOVACS, N. 2017. Changes
in Quality of Life in Parkinson's Disease: How Large Must They Be to Be
Relevant? Neuroepidemiology, 48, 1-8.
HOVESTADT, A., BOGAARD, J. M., MEERWALDT, J. D., VAN DER MECHE,
F. G. & STIGT, J. 1989. Pulmonary function in Parkinson's disease. J
Neurol Neurosurg Psychiatry, 52, 329-33.
HOWELLS, D. W., PORRITT, M. J., WONG, J. Y., BATCHELOR, P. E.,
KALNINS, R., HUGHES, A. J. & DONNAN, G. A. 2000. Reduced BDNF
mRNA expression in the Parkinson's disease substantia nigra. Exp
Neurol, 166, 127-35.
192
HUANG, G., GIBSON, C. A., TRAN, Z. V. & OSNESS, W. H. 2005. Controlled
endurance exercise training and VO2max changes in older adults: a
meta-analysis. Prev Cardiol, 8, 217-25.
HUGHES, J. M. & PRIDE, N. B. 2012. Examination of the carbon monoxide
diffusing capacity (DL(CO)) in relation to its KCO and VA components.
Am J Respir Crit Care Med, 186, 132-9.
INZELBERG, R., PELEG, N., NISIPEANU, P., MAGADLE, R., CARASSO, R. L.
& WEINER, P. 2005. Inspiratory muscle training and the perception of
dyspnea in Parkinson's disease. Can J Neurol Sci, 32, 213-7.
ISHIHARA, L. & BRAYNE, C. 2006. A systematic review of depression and
mental illness preceding Parkinson's disease. Acta Neurol Scand, 113,
211-20.
IZQUIERDO-ALONSO, J. L., JIMENEZ-JIMENEZ, F. J., CABRERA-VALDIVIA,
F. & MANSILLA-LESMES, M. 1994. Airway dysfunction in patients with
Parkinson's disease. Lung, 172, 47-55.
JAKOVLJEVIC, D. G., MOORE, S., HALLSWORTH, K., FATTAKHOVA, G.,
THOMA, C. & TRENELL, M. I. 2012a. Comparison of cardiac output
determined by bioimpedance and bioreactance methods at rest and
during exercise. J Clin Monit Comput, 26, 63-8.
JAKOVLJEVIC, D. G., MOORE, S. A., TAN, L. B., ROCHESTER, L., FORD, G.
A. & TRENELL, M. I. 2012b. Discrepancy between cardiac and physical
functional reserves in stroke. Stroke, 43, 1422-5.
JANKOVIC, J. 2008. Parkinson’s disease: clinical features and diagnosis.
Journal of Neurology, Neurosurgery & Psychiatry, 79, 368-376.
JANKOVIC, J., MCDERMOTT, M., CARTER, J., GAUTHIER, S., GOETZ, C.,
GOLBE, L., HUBER, S., KOLLER, W., OLANOW, C., SHOULSON, I. &
ET AL. 1990. Variable expression of Parkinson's disease: a base-line
analysis of the DATATOP cohort. The Parkinson Study Group.
Neurology, 40, 1529-34.
JANSSENS, J. P. 2005. Aging of the respiratory system: impact on pulmonary
function tests and adaptation to exertion. Clin Chest Med, 26, 469-84, vi-
vii.
JENKINSON, C., FITZPATRICK, R., PETO, V., GREENHALL, R. & HYMAN, N.
1997. The PDQ-8: development and validation of a short-form
Parkinson's disease questionnaire. Psychol Health 12, 805-814.
193
JETTE, M., SIDNEY, K. & BLUMCHEN, G. 1990. Metabolic equivalents (METS)
in exercise testing, exercise prescription, and evaluation of functional
capacity. Clin Cardiol, 13, 555-65.
JIMENEZ-JIMENEZ, F. J., MATEO, D. & GIMENEZ-ROLDAN, S. 1992.
Premorbid smoking, alcohol consumption, and coffee drinking habits in
Parkinson's disease: a case-control study. Mov Disord, 7, 339-44.
JOHNSON, J. D. & THEURER, W. M. 2014. A stepwise approach to the
interpretation of pulmonary function tests. Am Fam Physician, 89, 359-
66.
JOHNSTON, M. V. 2009. Plasticity in the developing brain: implications for
rehabilitation. Dev Disabil Res Rev, 15, 94-101.
KAMINSKY, D. A., WHITMAN, T. & CALLAS, P. W. 2007. DLCO versus
DLCO/VA as predictors of pulmonary gas exchange. Respir Med, 101,
989-94.
KAMINSKY, L., BONZHEIM, K., GARBER, C., GLASS, S., HAMM, L., KOHL,
H. & MIKESKY, A. 2006. ACSM's Resource Manual for Guidelines for
Exercise Testing and Prescription, Philadelphia, Lippincott Wiliams and
Wilkins.
KAMINSKY, L. A. & WHALEY, M. H. 1998. Evaluation of a new standardized
ramp protocol: the BSU/Bruce Ramp protocol. J Cardiopulm Rehabil, 18,
438-44.
KARAJGI, B., RIFKIN, A., DODDI, S. & KOLLI, R. 1990. The prevalence of
anxiety disorders in patients with chronic obstructive pulmonary disease.
Am J Psychiatry, 147, 200-1.
KARLSEN, K., LARSEN, J. P., TANDBERG, E. & JORGENSEN, K. 1999.
Fatigue in patients with Parkinson's disease. Mov Disord, 14, 237-41.
KATZEL, L. I., SORKIN, J. D., MACKO, R. F., SMITH, B., IVEY, F. M. &
SHULMAN, L. M. 2011. Repeatability of aerobic capacity measurements
in Parkinson disease. Med Sci Sports Exerc, 43, 2381-7.
KIM, C. H., WHEATLEY, C. M., BEHNIA, M. & JOHNSON, B. D. 2016. The
Effect of Aging on Relationships between Lean Body Mass and VO2max
in Rowers. PLoS One, 11, e0160275.
KITADA, T., ASAKAWA, S., HATTORI, N., MATSUMINE, H., YAMAMURA, Y.,
MINOSHIMA, S., YOKOCHI, M., MIZUNO, Y. & SHIMIZU, N. 1998.
194
Mutations in the parkin gene cause autosomal recessive juvenile
parkinsonism. Nature, 392, 605-8.
KLEIN, C. & WESTENBERGER, A. 2012. Genetics of Parkinson's disease.
Cold Spring Harb Perspect Med, 2, a008888.
KOESSLER, W., WANKE, T., WINKLER, G., NADER, A., TOIFL, K., KURZ, H.
& ZWICK, H. 2001. 2 Years' experience with inspiratory muscle training
in patients with neuromuscular disorders. Chest, 120, 765-9.
KOSEOGLU, F., INAN, L., OZEL, S., DEVIREN, S. D., KARABIYIKOGLU, G.,
YORGANCIOGLU, R., ATASOY, T. & OZTURK, A. 1997. The effects of
a pulmonary rehabilitation program on pulmonary function tests and
exercise tolerance in patients with Parkinson's disease. Funct Neurol, 12,
319-25.
KOULOURIS, N., MULVEY, D. A., LAROCHE, C. M., GREEN, M. & MOXHAM,
J. 1988. Comparison of two different mouthpieces for the measurement
of Pimax and Pemax in normal and weak subjects. Eur Respir J, 1, 863-
7.
KRIEGER, J., WEITZENBLUM, E., VANDEVENNE, A., STIERLE, J. L. &
KURTZ, D. 1985. Flow-volume curve abnormalities and obstructive sleep
apnea syndrome. Chest, 87, 163-7.
KUBITZ, K. A., LANDERS, D. M., PETRUZZELLO, S. J. & HAN, M. 1996. The
effects of acute and chronic exercise on sleep. A meta-analytic review.
Sports Med, 21, 277-91.
KUMAR, S., BHATIA, M. & BEHARI, M. 2002. Sleep disorders in Parkinson's
disease. Mov Disord, 17, 775-81.
KUROZUMI, M., MATSUSHITA, T., HOSOKAWA, M. & TAKEDA, T. 1994. Age-
related changes in lung structure and function in the senescence-
accelerated mouse (SAM): SAM-P/1 as a new murine model of senile
hyperinflation of lung. Am J Respir Crit Care Med, 149, 776-82.
LANGSTON, J. W. 1996. The etiology of Parkinson's disease with emphasis on
the MPTP story. Neurology, 47, S153-60.
LANGSTON, J. W., BALLARD, P., TETRUD, J. W. & IRWIN, I. 1983. Chronic
Parkinsonism in humans due to a product of meperidine-analog
synthesis. Science, 219, 979-80.
LEBOUVIER, T., NEUNLIST, M., BRULEY DES VARANNES, S., CORON, E.,
DROUARD, A., N'GUYEN, J. M., CHAUMETTE, T., TASSELLI, M.,
195
PAILLUSSON, S., FLAMAND, M., GALMICHE, J. P., DAMIER, P. &
DERKINDEREN, P. 2010. Colonic biopsies to assess the
neuropathology of Parkinson's disease and its relationship with
symptoms. PLoS One, 5, e12728.
LEE, M. A., PRENTICE, W. M., HILDRETH, A. J. & WALKER, R. W. 2007.
Measuring symptom load in Idiopathic Parkinson's disease.
Parkinsonism Relat Disord, 13, 284-9.
LEES, A. J. 2007. Unresolved issues relating to the shaking palsy on the
celebration of James Parkinson's 250th birthday. Mov Disord, 22 Suppl
17, S327-34.
LEES, A. J., HARDY, J. & REVESZ, T. 2009. Parkinson's disease. Lancet, 373,
2055-66.
LEIBNER, J., RAMJIT, A., SEDIG, L., DAI, Y., WU, S. S., JACOBSON, C. T.,
OKUN, M. S., RODRIGUEZ, R. L., MALATY, I. A. & FERNANDEZ, H. H.
2010. The impact of and the factors associated with drooling in
Parkinson's disease. Parkinsonism Relat Disord, 16, 475-7.
LENOIR, T., GUEDJ, N., BOULU, P., GUIGUI, P. & BENOIST, M. 2010.
Camptocormia: the bent spine syndrome, an update. Eur Spine J, 19,
1229-37.
LESAGE, S. & BRICE, A. 2009. Parkinson's disease: from monogenic forms to
genetic susceptibility factors. Hum Mol Genet, 18, R48-59.
LIESS, B. D., DOST, J. S., TEMPLER, J. W. & TOBIAS, J. D. 2008. Congenital
central alveolar hypoventilation syndrome (Ondine's curse) with survival
into adulthood. Clin Pediatr (Phila), 47, 941-6.
LIGHT, R. W., MERRILL, E. J., DESPARS, J. A., GORDON, G. H. &
MUTALIPASSI, L. R. 1985. Prevalence of depression and anxiety in
patients with COPD. Relationship to functional capacity. Chest, 87, 35-8.
LITVAN, I., BHATIA, K. P., BURN, D. J., GOETZ, C. G., LANG, A. E.,
MCKEITH, I., QUINN, N., SETHI, K. D., SHULTS, C. & WENNING, G. K.
2003. Movement Disorders Society Scientific Issues Committee report:
SIC Task Force appraisal of clinical diagnostic criteria for Parkinsonian
disorders. Mov Disord, 18, 467-86.
LYALL, R. A., DONALDSON, N., FLEMING, T., WOOD, C., NEWSOM-DAVIS,
I., POLKEY, M. I., LEIGH, P. N. & MOXHAM, J. 2001a. A prospective
196
study of quality of life in ALS patients treated with noninvasive ventilation.
Neurology, 57, 153-6.
LYALL, R. A., DONALDSON, N., POLKEY, M. I., LEIGH, P. N. & MOXHAM, J.
2001b. Respiratory muscle strength and ventilatory failure in amyotrophic
lateral sclerosis. Brain, 124, 2000-13.
MACINTYRE, N., CRAPO, R. O., VIEGI, G., JOHNSON, D. C., VAN DER
GRINTEN, C. P., BRUSASCO, V., BURGOS, F., CASABURI, R.,
COATES, A., ENRIGHT, P., GUSTAFSSON, P., HANKINSON, J.,
JENSEN, R., MCKAY, R., MILLER, M. R., NAVAJAS, D., PEDERSEN,
O. F., PELLEGRINO, R. & WANGER, J. 2005. Standardisation of the
single-breath determination of carbon monoxide uptake in the lung. Eur
Respir J, 26, 720-35.
MAGNENAT, J. L. & JUNOD, A. F. 1991. [Episodic laryngeal dyskinesia: a
functional cause of stridor]. Rev Mal Respir, 8, 95-9.
MALEK, N., LAWTON, M. A., SWALLOW, D. M., GROSSET, K. A.,
MARRINAN, S. L., BAJAJ, N., BARKER, R. A., BURN, D. J., HARDY, J.,
MORRIS, H. R., WILLIAMS, N. M., WOOD, N., BEN-SHLOMO, Y. &
GROSSET, D. G. 2016. Vascular disease and vascular risk factors in
relation to motor features and cognition in early Parkinson's disease. Mov
Disord, 31, 1518-1526.
MANLEY, A. F. 1996. Physical Activity and Health: A Report of the Surgeon
General. Health and Human Services Dept., Centers for Disease Control
and Prevention, National Center for Chronic Disease Prevention and
Health Promotion, President's Council on Physical Fitness and Sports.
MARIA, B., SOPHIA, S., MICHALIS, M., CHARALAMPOS, L., ANDREAS, P.,
JOHN, M. E. & NIKOLAOS, S. M. 2003. Sleep breathing disorders in
patients with idiopathic Parkinson's disease. Respir Med, 97, 1151-1157.
MARINUS, J., VISSER, M., VAN HILTEN, J. J., LAMMERS, G. J. &
STIGGELBOUT, A. M. 2003. Assessment of sleep and sleepiness in
Parkinson disease. Sleep, 26, 1049-54.
MARQUES, O. & OUTEIRO, T. F. 2012. Alpha-synuclein: from secretion to
dysfunction and death. Cell Death Dis, 3, e350.
MARRAS, C., LOHMANN, K., LANG, A. & KLEIN, C. 2012. Fixing the broken
system of genetic locus symbols: Parkinson disease and dystonia as
examples. Neurology, 78, 1016-24.
197
MARTINEZ-MARTIN, P., SCHAPIRA, A. H., STOCCHI, F., SETHI, K., ODIN,
P., MACPHEE, G., BROWN, R. G., NAIDU, Y., CLAYTON, L., ABE, K.,
TSUBOI, Y., MACMAHON, D., BARONE, P., RABEY, M., BONUCCELLI,
U., FORBES, A., BREEN, K., TLUK, S., OLANOW, C. W., THOMAS, S.,
RYE, D., HAND, A., WILLIAMS, A. J., ONDO, W. & CHAUDHURI, K. R.
2007. Prevalence of nonmotor symptoms in Parkinson's disease in an
international setting; study using nonmotor symptoms questionnaire in
545 patients. Mov Disord, 22, 1623-9.
MARTINEZ-MARTIN, P., VISSER, M., RODRIGUEZ-BLAZQUEZ, C.,
MARINUS, J., CHAUDHURI, K. R. & VAN HILTEN, J. J. 2008. SCOPA-
sleep and PDSS: two scales for assessment of sleep disorder in
Parkinson's disease. Mov Disord, 23, 1681-8.
MARTTILA, R. J. & RINNE, U. K. 1980. Smoking and Parkinson's disease. Acta
Neurol Scand, 62, 322-5.
MCCOOL, F. D. & TZELEPIS, G. E. 1995. Inspiratory muscle training in the
patient with neuromuscular disease. Phys Ther, 75, 1006-14.
MEGARI, K. 2013. Quality of Life in Chronic Disease Patients. Health Psychol
Res, 1, e27.
MELLISANT, C. F., VAN NOORD, J. A., VAN DE WOESTIJNE, K. P. &
DEMEDTS, M. 1990. Comparison of dynamic lung function indices
during forced and quiet breathing in upper airway obstruction, asthma,
and emphysema. Chest, 98, 77-83.
MENA, M. A. & DE YEBENES, J. G. 2006. Drug-induced parkinsonism. Expert
Opin Drug Saf, 5, 759-71.
MEYER, F. J., BORST, M. M., ZUGCK, C., KIRSCHKE, A., SCHELLBERG, D.,
KUBLER, W. & HAASS, M. 2001. Respiratory muscle dysfunction in
congestive heart failure: clinical correlation and prognostic significance.
Circulation, 103, 2153-8.
MEZZANI, A., PISANO, F., CAVALLI, A., TOMMASI, M. A., CORRA, U.,
COLOMBO, S., GRASSI, B., MARZORATI, M., PORCELLI, S.,
MORANDI, L. & GIANNUZZI, P. 2012. Reduced exercise capacity in
early-stage amyotrophic lateral sclerosis: Role of skeletal muscle.
Amyotroph Lateral Scler, 13, 87-94.
198
MIKAELEE, H., YAZDCHI, M., ANSARIN, K. & ARAMI, M. 2006. Pulmonary
Function Test Abnormalities in Parkinson Disease. The Internet Journal
of Pulmonary Medicine, 8.
MILLER, J. M., MOXHAM, J. & GREEN, M. 1985. The maximal sniff in the
assessment of diaphragm function in man. Clin Sci (Lond), 69, 91-6.
MILLER, M. R., CRAPO, R., HANKINSON, J., BRUSASCO, V., BURGOS, F.,
CASABURI, R., COATES, A., ENRIGHT, P., VAN DER GRINTEN, C. P.,
GUSTAFSSON, P., JENSEN, R., JOHNSON, D. C., MACINTYRE, N.,
MCKAY, R., NAVAJAS, D., PEDERSEN, O. F., PELLEGRINO, R.,
VIEGI, G. & WANGER, J. 2005a. General considerations for lung
function testing. Eur Respir J, 26, 153-61.
MILLER, M. R., HANKINSON, J., BRUSASCO, V., BURGOS, F., CASABURI,
R., COATES, A., CRAPO, R., ENRIGHT, P., VAN DER GRINTEN, C. P.,
GUSTAFSSON, P., JENSEN, R., JOHNSON, D. C., MACINTYRE, N.,
MCKAY, R., NAVAJAS, D., PEDERSEN, O. F., PELLEGRINO, R.,
VIEGI, G. & WANGER, J. 2005b. Standardisation of spirometry. Eur
Respir J, 26, 319-38.
MORGAN, R. K., MCNALLY, S., ALEXANDER, M., CONROY, R., HARDIMAN,
O. & COSTELLO, R. W. 2005. Use of Sniff nasal-inspiratory force to
predict survival in amyotrophic lateral sclerosis. Am J Respir Crit Care
Med, 171, 269-74.
MORIMOTO, T., SHIMBO, T., ORAV, J. E., MATSUI, K., GOTO, M.,
TAKEMURA, M., HIRA, K. & FUKUI, T. 2003. Impact of social
functioning and vitality on preference for life in patients with Parkinson's
disease. Mov Disord, 18, 171-5.
MORRISH, P. K., SAWLE, G. V. & BROOKS, D. J. 1996. An [18F]dopa-PET
and clinical study of the rate of progression in Parkinson's disease. Brain,
119 ( Pt 2), 585-91.
MOUSSAS, G., TSELEBIS, A., KARKANIAS, A., STAMOULI, D., ILIAS, I.,
BRATIS, D. & VASSILA-DEMI, K. 2008. A comparative study of anxiety
and depression in patients with bronchial asthma, chronic obstructive
pulmonary disease and tuberculosis in a general hospital of chest
diseases. Ann Gen Psychiatry, 7, 7.
199
MOUSSAVI, S., CHATTERJI, S., VERDES, E., TANDON, A., PATEL, V. &
USTUN, B. 2007. Depression, chronic diseases, and decrements in
health: results from the World Health Surveys. Lancet, 370, 851-8.
MOUSTAFA, A. A. & POLETTI, M. 2013. Neural and behavioral substrates of
subtypes of Parkinson's disease. Front Syst Neurosci, 7, 117.
MUNAFO, M. R. & ARAYA, R. 2010. Cigarette smoking and depression: a
question of causation. Br J Psychiatry, 196, 425-6.
MURPHY, P., LYALL, R., HART, N. & POLKEY, M. I. 2010. Assessment of
respiratory muscle strength in motor neurone disease: is asking enough?
Eur Respir J, 35, 245-6.
MUSTFA, N., WALSH, E., BRYANT, V., LYALL, R. A., ADDINGTON-HALL, J.,
GOLDSTEIN, L. H., DONALDSON, N., POLKEY, M. I., MOXHAM, J. &
LEIGH, P. N. 2006. The effect of noninvasive ventilation on ALS patients
and their caregivers. Neurology, 66, 1211-7.
MYERS, J., BUCHANAN, N., SMITH, D., NEUTEL, J., BOWES, E., WALSH, D.
& FROELICHER, V. F. 1992. Individualized ramp treadmill. Observations
on a new protocol. Chest, 101, 236S-241S.
MYERS, J., BUCHANAN, N., WALSH, D., KRAEMER, M., MCAULEY, P.,
HAMILTON-WESSLER, M. & FROELICHER, V. F. 1991. Comparison of
the ramp versus standard exercise protocols. J Am Coll Cardiol, 17,
1334-42.
NEEPER, S. A., GOMEZ-PINILLA, F., CHOI, J. & COTMAN, C. 1995. Exercise
and brain neurotrophins. Nature, 373, 109.
NEEPER, S. A., GOMEZ-PINILLA, F., CHOI, J. & COTMAN, C. W. 1996.
Physical activity increases mRNA for brain-derived neurotrophic factor
and nerve growth factor in rat brain. Brain Res, 726, 49-56.
NEU, H. C., CONNOLLY, J. J., JR., SCHWERTLEY, F. W., LADWIG, H. A. &
BRODY, A. W. 1967. Obstructive respiratory dysfunction in parkinsonian
patients. Am Rev Respir Dis, 95, 33-47.
NICE, N. I. F. H. A. C. E. 2006. Parkinson's disease: Diagnosis and
management in primary and secondary care [Online]. Available:
http://www.nice.org.uk/guidance/cg35/IFP/chapter/About-this-information
2014].
NICE, N. I. F. H. A. C. E. 2010. Chronic obstructive pulmonary disease in
200
over 16s: diagnosis and management, National Institute for Health and Care
Excellence
NICE, N. I. F. H. A. C. E. 2016. Motor neurone disease: assessment and
management.
NIEUWBOER, A. 2008. Cueing for freezing of gait in patients with Parkinson's
disease: a rehabilitation perspective. Mov Disord, 23 Suppl 2, S475-81.
O'SULLIVAN, S. S., EVANS, A. H. & LEES, A. J. 2009. Dopamine dysregulation
syndrome: an overview of its epidemiology, mechanisms and
management. CNS Drugs, 23, 157-70.
OBENOUR, W. H., STEVENS, P. M., COHEN, A. A. & MCCUTCHEN, J. J.
1972. The causes of abnormal pulmonary function in Parkinson's
disease. Am Rev Respir Dis, 105, 382-7.
OLANOW, C. W. & BRUNDIN, P. 2013. Parkinson's disease and alpha
synuclein: is Parkinson's disease a prion-like disorder? Mov Disord, 28,
31-40.
PAL, P. K., SATHYAPRABHA, T. N., TUHINA, P. & THENNARASU, K. 2007.
Pattern of subclinical pulmonary dysfunctions in Parkinson's disease and
the effect of levodopa. Mov Disord, 22, 420-4.
PALMA, J. A., CARMONA-ABELLAN, M. M., BARRIOBERO, N., TREVINO-
PEINADO, C., GARCIA-LOPEZ, M., FERNANDEZ-JARNE, E. &
LUQUIN, M. R. 2013. Is cardiac function impaired in premotor
Parkinson's disease? A retrospective cohort study. Mov Disord, 28, 591-
6.
PALMA, J. A. & KAUFMANN, H. 2014. Autonomic disorders predicting
Parkinson's disease. Parkinsonism Relat Disord, 20 Suppl 1, S94-8.
PARAIN, K., MURER, M. G., YAN, Q., FAUCHEUX, B., AGID, Y., HIRSCH, E.
& RAISMAN-VOZARI, R. 1999. Reduced expression of brain-derived
neurotrophic factor protein in Parkinson's disease substantia nigra.
Neuroreport, 10, 557-61.
PARKINSON'S UK 2009. Parkinson's prevalence in the United Kingdom (2009).
PARKINSON'SUK 2017. The incidence and prevalence of Parkinson's in the
UK, Results from the Clinical Practice Research Datalink
Reference Report. Parkinson's UK.
PARKINSON, J. 1817. An essay on the shaking palsy, London, Sherwood,
Neely and Jones.
201
PARKINSON, J. 2002. An essay on the shaking palsy. 1817. J Neuropsychiatry
Clin Neurosci, 14, 223-36; discussion 222.
PAULSON, G. D. & TAFRATE, R. H. 1970. Some "minor" aspects of
parkinsonism, especially pulmonary function. Neurology, 20, 14-7.
PAYAMI, H., LARSEN, K., BERNARD, S. & NUTT, J. 1994. Increased risk of
Parkinson's disease in parents and siblings of patients. Ann Neurol, 36,
659-61.
PELLEGRINO, R., VIEGI, G., BRUSASCO, V., CRAPO, R. O., BURGOS, F.,
CASABURI, R., COATES, A., VAN DER GRINTEN, C. P.,
GUSTAFSSON, P., HANKINSON, J., JENSEN, R., JOHNSON, D. C.,
MACINTYRE, N., MCKAY, R., MILLER, M. R., NAVAJAS, D.,
PEDERSEN, O. F. & WANGER, J. 2005. Interpretative strategies for
lung function tests. Eur Respir J, 26, 948-68.
PENNINGTON, S., SNELL, K., LEE, M. & WALKER, R. 2010. The cause of
death in idiopathic Parkinson's disease. Parkinsonism Relat Disord, 16,
434-7.
PERERA, S., MODY, S. H., WOODMAN, R. C. & STUDENSKI, S. A. 2006.
Meaningful change and responsiveness in common physical
performance measures in older adults. J Am Geriatr Soc, 54, 743-9.
PETERSON, D. D., PACK, A. I., SILAGE, D. A. & FISHMAN, A. P. 1981.
Effects of aging on ventilatory and occlusion pressure responses to
hypoxia and hypercapnia. Am Rev Respir Dis, 124, 387-91.
PETIT, J. M. & DELHEZ, L. 1961. [Electrical activity of the diaphragm in
Parkinson's disease]. Arch Int Physiol Biochim, 69, 413-7.
PETO, V., JENKINSON, C., FITZPATRICK, R. & GREENHALL, R. 1995. The
development and validation of a short measure of functioning and well
being for individuals with Parkinson's disease. Qual Life Res, 4, 241-8.
POEWE, W. & WENNING, G. 2002. The differential diagnosis of Parkinson's
disease. Eur J Neurol, 9 Suppl 3, 23-30.
POLATLI, M., AKYOL, A., CILDAG, O. & BAYULKEM, K. 2001. Pulmonary
function tests in Parkinson's disease. Eur J Neurol, 8, 341-5.
POLETTI, M., DE ROSA, A. & BONUCCELLI, U. 2012. Affective symptoms and
cognitive functions in Parkinson's disease. J Neurol Sci, 317, 97-102.
POLKEY, M. I., GREEN, M. & MOXHAM, J. 1995. Measurement of respiratory
muscle strength. Thorax, 50, 1131-5.
202
POLKEY, M. I., LYALL, R. A., YANG, K., JOHNSON, E., LEIGH, P. N. &
MOXHAM, J. 2016. Respiratory Muscle Strength as Predictive Biomarker
for Survival in Amyotrophic Lateral Sclerosis. Am J Respir Crit Care Med.
POLYMEROPOULOS, M. H., LAVEDAN, C., LEROY, E., IDE, S. E., DEHEJIA,
A., DUTRA, A., PIKE, B., ROOT, H., RUBENSTEIN, J., BOYER, R.,
STENROOS, E. S., CHANDRASEKHARAPPA, S., ATHANASSIADOU,
A., PAPAPETROPOULOS, T., JOHNSON, W. G., LAZZARINI, A. M.,
DUVOISIN, R. C., DI IORIO, G., GOLBE, L. I. & NUSSBAUM, R. L.
1997. Mutation in the alpha-synuclein gene identified in families with
Parkinson's disease. Science, 276, 2045-7.
PONSEN, M. M., STOFFERS, D., BOOIJ, J., VAN ECK-SMIT, B. L.,
WOLTERS, E. & BERENDSE, H. W. 2004. Idiopathic hyposmia as a
preclinical sign of Parkinson's disease. Ann Neurol, 56, 173-81.
PONTONE, G. M., WILLIAMS, J. R., ANDERSON, K. E., CHASE, G.,
GOLDSTEIN, S. A., GRILL, S., HIRSCH, E. S., LEHMANN, S., LITTLE,
J. T., MARGOLIS, R. L., RABINS, P. V., WEISS, H. D. & MARSH, L.
2009. Prevalence of anxiety disorders and anxiety subtypes in patients
with Parkinson's disease. Mov Disord, 24, 1333-8.
PORTER, B., MACFARLANE, R., UNWIN, N. & WALKER, R. 2006. The
prevalence of Parkinson's disease in an area of North Tyneside in the
North-East of England. Neuroepidemiology, 26, 156-61.
POST, B., MERKUS, M. P., DE HAAN, R. J. & SPEELMAN, J. D. 2007.
Prognostic factors for the progression of Parkinson's disease: a
systematic review. Mov Disord, 22, 1839-51; quiz 1988.
POWERS, S. K. & CRISWELL, D. 1996. Adaptive strategies of respiratory
muscles in response to endurance exercise. Med Sci Sports Exerc, 28,
1115-22.
PREDIGER, R. D. 2010. Effects of caffeine in Parkinson's disease: from
neuroprotection to the management of motor and non-motor symptoms.
J Alzheimers Dis, 20 Suppl 1, S205-20.
PRIOR, B. M., YANG, H. T. & TERJUNG, R. L. 2004. What makes vessels
grow with exercise training? Journal of Applied Physiology, 97, 1119-
1128.
203
PRIYADARSHI, A., KHUDER, S. A., SCHAUB, E. A. & PRIYADARSHI, S. S.
2001. Environmental risk factors and Parkinson's disease: a
metaanalysis. Environ Res, 86, 122-7.
PROTAS, E. J., STANLEY, R. K., JANKOVIC, J. & MACNEILL, B. 1996.
Cardiovascular and metabolic responses to upper- and lower-extremity
exercise in men with idiopathic Parkinson's disease. Phys Ther, 76, 34-
40.
QUANJER, P. H., TAMMELING, G. J., COTES, J. E., PEDERSEN, O. F.,
PESLIN, R. & YERNAULT, J. C. 1993. Lung volumes and forced
ventilatory flows. Report Working Party Standardization of Lung Function
Tests, European Community for Steel and Coal. Official Statement of the
European Respiratory Society. Eur Respir J Suppl, 16, 5-40.
RAMIREZ, A., HEIMBACH, A., GRUNDEMANN, J., STILLER, B., HAMPSHIRE,
D., CID, L. P., GOEBEL, I., MUBAIDIN, A. F., WRIEKAT, A. L.,
ROEPER, J., AL-DIN, A., HILLMER, A. M., KARSAK, M., LISS, B.,
WOODS, C. G., BEHRENS, M. I. & KUBISCH, C. 2006. Hereditary
parkinsonism with dementia is caused by mutations in ATP13A2,
encoding a lysosomal type 5 P-type ATPase. Nat Genet, 38, 1184-91.
RAMIREZ, J., LEON, I. & RIVERA, L. M. 1986. Episodic laryngeal dyskinesia.
Clinical and psychiatric characterization. Chest, 90, 716-21.
RANU, H., WILDE, M. & MADDEN, B. 2011. Pulmonary function tests. Ulster
Med J, 80, 84-90.
REIJNDERS, J. S., EHRT, U., LOUSBERG, R., AARSLAND, D. &
LEENTJENS, A. F. 2009. The association between motor subtypes and
psychopathology in Parkinson's disease. Parkinsonism Relat Disord, 15,
379-82.
REIJNDERS, J. S., EHRT, U., WEBER, W. E., AARSLAND, D. & LEENTJENS,
A. F. 2008. A systematic review of prevalence studies of depression in
Parkinson's disease. Mov Disord, 23, 183-9; quiz 313.
RICHARDSON, L. P., LOZANO, P., RUSSO, J., MCCAULEY, E., BUSH, T. &
KATON, W. 2006. Asthma symptom burden: relationship to asthma
severity and anxiety and depression symptoms. Pediatrics, 118, 1042-
51.
RIES, A. L. 1994. The importance of exercise in pulmonary rehabilitation. Clin
Chest Med, 15, 327-37.
204
RIMMER, K. P., FORD, G. T. & WHITELAW, W. A. 1995. Interaction between
postural and respiratory control of human intercostal muscles. J Appl
Physiol (1985), 79, 1556-61.
ROBERGS, R. A. & LANDWHER, R. 2002. The Surprising History of the
"HRmax=220-age" equation. Journal of Exercise Physiologyonline, 5, 1-
10.
ROSE, R. J., HODGSON, D. R., KELSO, T. B., MCCUTCHEON, L. J., REID, T.
A., BAYLY, W. M. & GOLLNICK, P. D. 1988. Maximum O2 uptake, O2
debt and deficit, and muscle metabolites in Thoroughbred horses.
Journal of Applied Physiology, 64, 781-788.
ROTMAN, H. H., LISS, H. P. & WEG, J. G. 1975. Diagnosis of upper airway
obstruction by pulmonary function testing. Chest, 68, 796-9.
RUBIO, M. C., RODRIGUEZ HERMOSA, J. L. & NEBREDA, M. J. 2009.
[Anxiety and COPD]. Arch Bronconeumol, 45 Suppl 4, 51-3.
RUTCHIK, A., WEISSMAN, A. R., ALMENOFF, P. L., SPUNGEN, A. M.,
BAUMAN, W. A. & GRIMM, D. R. 1998. Resistive inspiratory muscle
training in subjects with chronic cervical spinal cord injury. Arch Phys
Med Rehabil, 79, 293-7.
SABATE, M., GONZALEZ, I., RUPEREZ, F. & RODRIGUEZ, M. 1996a.
Obstructive and restrictive pulmonary dysfunctions in Parkinson's
disease. J Neurol Sci, 138, 114-9.
SABATE, M., RODRIGUEZ, M., MENDEZ, E., ENRIQUEZ, E. & GONZALEZ, I.
1996b. Obstructive and restrictive pulmonary dysfunction increases
disability in Parkinson disease. Arch Phys Med Rehabil, 77, 29-34.
SACHELI, M. A., SILVEIRA, C. R. A. & ALMEIDA, Q. J. 2013. Motor symptoms
predict aerobic capacity in Parkinson's disease [abstract]. . Movement
Disorders, 28, 885.
SALTIN, B. & LANDIN, S. 1975. Work capacity, muscle strength and SDH
activity in both legs of hemiparetic patients and patients with Parkinson's
disease. Scand J Clin Lab Invest, 35, 531-8.
SAMITZ, G. & BACHL, N. 1991. Physical training programs and their effects on
aerobic capacity and coronary risk profile in sedentary individuals.
Design of a long-term exercise training program. J Sports Med Phys
Fitness, 31, 283-93.
205
SÁNCHEZ RIERA, H., MONTEMAYOR RUBIO, T., ORTEGA RUIZ, F.,
CEJUDO RAMOS, P., DEL CASTILLO OTERO, D., ELIAS
HERNANDEZ, T. & CASTILLO GOMEZ, J. 2001. Inspiratory Muscle
Training in Patients With COPD: Effect on Dyspnea, Exercise
Performance, and Quality of Life. Chest, 120, 748-756.
SANTPERE, G. & FERRER, I. 2009. LRRK2 and neurodegeneration. Acta
Neuropathol, 117, 227-46.
SATHYAPRABHA, T. N., KAPAVARAPU, P. K., PALL, P. K., THENNARASU,
K. & RAJU, T. R. 2005. Pulmonary functions in Parkinson's disease.
Indian J Chest Dis Allied Sci, 47, 251-7.
SAYDAIN, G., BECK, K. C., DECKER, P. A., COWL, C. T. & SCANLON, P. D.
2004. Clinical significance of elevated diffusing capacity. Chest, 125,
446-52.
SCARMEAS, N., LUCHSINGER, J. A., BRICKMAN, A. M., COSENTINO, S.,
SCHUPF, N., XIN-TANG, M., GU, Y. & STERN, Y. 2011. Physical
activity and Alzheimer disease course. Am J Geriatr Psychiatry, 19, 471-
81.
SCHAPIRA, A. H. 2006. Etiology of Parkinson's disease. Neurology, 66, S10-
23.
SCHENKMAN, M., WEI ZHU, C., CUTSON, T. M. & WHETTEN-GOLDSTEIN,
K. 2001. Longitudinal evaluation of economic and physical impact of
Parkinson's disease. Parkinsonism Relat Disord, 8, 41-50.
SCHILLACI, O., CHIARAVALLOTI, A., PIERANTOZZI, M., DI PIETRO, B.,
KOCH, G., BRUNI, C., STANZIONE, P. & STEFANI, A. 2011. Different
patterns of nigrostriatal degeneration in tremor type versus the akinetic-
rigid and mixed types of Parkinson's disease at the early stages:
molecular imaging with 123I-FP-CIT SPECT. Int J Mol Med, 28, 881-6.
SCHJOLBERG, A. & SUNNERHAGEN, K. S. 2012. Unlocking the locked in; a
need for team approach in rehabilitation of survivors with locked-in
syndrome. Acta Neurol Scand, 125, 192-8.
SCHRAG, A., JAHANSHAHI, M. & QUINN, N. 2000. What contributes to quality
of life in patients with Parkinson's disease? J Neurol Neurosurg
Psychiatry, 69, 308-12.
SECCOMBE, L. M., GIDDINGS, H. L., ROGERS, P. G., CORBETT, A. J.,
HAYES, M. W., PETERS, M. J. & VEITCH, E. M. 2011. Abnormal
206
ventilatory control in Parkinson's disease--further evidence for non-motor
dysfunction. Respir Physiol Neurobiol, 179, 300-4.
SEMCHUK, K. M., LOVE, E. J. & LEE, R. G. 1992. Parkinson's disease and
exposure to agricultural work and pesticide chemicals. Neurology, 42,
1328-35.
SHAHEEN H.A., A. M. A., ABD ELZAHER M.A., 2009. Parkinson's Disease and
Pulmonary Dysfunction. Egypt J. Neurol. Psychiat. Neurosurg., 46, 129-
140
SHARMA, G. & GOODWIN, J. 2006. Effect of aging on respiratory system
physiology and immunology. Clin Interv Aging, 1, 253-60.
SHULMAN, L. M., GRUBER-BALDINI, A. L., ANDERSON, K. E., FISHMAN, P.
S., REICH, S. G. & WEINER, W. J. 2010. The clinically important
difference on the unified Parkinson's disease rating scale. Arch Neurol,
67, 64-70.
SHULMAN, L. M., KATZEL, L. I., IVEY, F. M., SORKIN, J. D., FAVORS, K.,
ANDERSON, K. E., SMITH, B. A., REICH, S. G., WEINER, W. J. &
MACKO, R. F. 2013. Randomized clinical trial of 3 types of physical
exercise for patients with Parkinson disease. JAMA Neurol, 70, 183-90.
SHULMAN, L. M., SINGER, C., BEAN, J. A. & WEINER, W. J. 1996. Internal
tremor in patients with Parkinson's disease. Mov Disord, 11, 3-7.
SIEGLER, D. & ZORAB, P. A. 1982. The influence of lung volume on gas
transfer in scoliosis. Br J Dis Chest, 76, 44-50.
SILVERMAN, E. P., SAPIENZA, C. M., SALEEM, A., CARMICHAEL, C.,
DAVENPORT, P. W., HOFFMAN-RUDDY, B. & OKUN, M. S. 2006.
Tutorial on maximum inspiratory and expiratory mouth pressures in
individuals with idiopathic Parkinson disease (IPD) and the preliminary
results of an expiratory muscle strength training program.
NeuroRehabilitation, 21, 71-9.
SKIDMORE, F. M., PATTERSON, S. L., SHULMAN, L. M., SORKIN, J. D. &
MACKO, R. F. 2008. Pilot safety and feasibility study of treadmill aerobic
exercise in Parkinson disease with gait impairment. J Rehabil Res Dev,
45, 117-24.
SMITH, P. E., CALVERLEY, P. M. & EDWARDS, R. H. 1988. Hypoxemia
during sleep in Duchenne muscular dystrophy. Am Rev Respir Dis, 137,
884-8.
207
SNAITH, R. P. & ZIGMOND, A. S. 2000. Hospital Anxiety and Depression Scale
(HADS). In: RUSH, A. J. (ed.) Handbook of Psychiatric Measures.
Washington DC: American Psychiatric Association.
SPILLANTINI, M. G., SCHMIDT, M. L., LEE, V. M., TROJANOWSKI, J. Q.,
JAKES, R. & GOEDERT, M. 1997. Alpha-synuclein in Lewy bodies.
Nature, 388, 839-40.
SPRANGERS, M. A. 2002. Quality-of-life assessment in oncology.
Achievements and challenges. Acta Oncol, 41, 229-37.
STAHL, E., LINDBERG, A., JANSSON, S. A., RONMARK, E., SVENSSON, K.,
ANDERSSON, F., LOFDAHL, C. G. & LUNDBACK, B. 2005. Health-
related quality of life is related to COPD disease severity. Health Qual
Life Outcomes, 3, 56.
STANLEY, R. K., PROTAS, E. J. & JANKOVIC, J. 1999. Exercise performance
in those having Parkinson's disease and healthy normals. Med Sci
Sports Exerc, 31, 761-6.
STANOJEVIC, S., WADE, A. & STOCKS, J. 2010. Reference values for lung
function: past, present and future. Eur Respir J, 36, 12-9.
STEBBINS, G. T., GOETZ, C. G., BURN, D. J., JANKOVIC, J., KHOO, T. K. &
TILLEY, B. C. 2013. How to identify tremor dominant and postural
instability/gait difficulty groups with the movement disorder society unified
Parkinson's disease rating scale: comparison with the unified Parkinson's
disease rating scale. Mov Disord, 28, 668-70.
STEFANUTTI, D., BENOIST, M. R., SCHEINMANN, P., CHAUSSAIN, M. &
FITTING, J. W. 2000. Usefulness of sniff nasal pressure in patients with
neuromuscular or skeletal disorders. Am J Respir Crit Care Med, 162,
1507-11.
STEFFEN, T. & SENEY, M. 2008. Test-retest reliability and minimal detectable
change on balance and ambulation tests, the 36-item short-form health
survey, and the unified Parkinson disease rating scale in people with
parkinsonism. Phys Ther, 88, 733-46.
STERN, G. 1989. Did parkinsonism occur before 1817? J Neurol Neurosurg
Psychiatry, Suppl, 11-2.
STERNER, J. B., MORRIS, M. J., SILL, J. M. & HAYES, J. A. 2009. Inspiratory
flow-volume curve evaluation for detecting upper airway disease. Respir
Care, 54, 461-6.
208
SWANNEY, M. P., RUPPEL, G., ENRIGHT, P. L., PEDERSEN, O. F., CRAPO,
R. O., MILLER, M. R., JENSEN, R. L., FALASCHETTI, E., SCHOUTEN,
J. P., HANKINSON, J. L., STOCKS, J. & QUANJER, P. H. 2008. Using
the lower limit of normal for the FEV1/FVC ratio reduces the
misclassification of airway obstruction. Thorax, 63, 1046-51.
TAN, L. C., TAN, A. K. & TJIA, H. T. 1998. The profile of hospitalised patients
with Parkinson's disease. Ann Acad Med Singapore, 27, 808-12.
TANJI, K., MORI, F., IMAIZUMI, T., YOSHIDA, H., MATSUMIYA, T., TAMO,
W., YOSHIMOTO, M., ODAGIRI, H., SASAKI, M., TAKAHASHI, H.,
SATOH, K. & WAKABAYASHI, K. 2002. Upregulation of alpha-synuclein
by lipopolysaccharide and interleukin-1 in human macrophages. Pathol
Int, 52, 572-7.
TAYLOR, K. S., COUNSELL, C. E., GORDON, J. C. & HARRIS, C. E. 2005.
Screening for undiagnosed parkinsonism among older people in general
practice. Age Ageing, 34, 501-4.
TEMLETT, J. A. & THOMPSON, P. D. 2006. Reasons for admission to hospital
for Parkinson's disease. Intern Med J, 36, 524-6.
TILLIE-LEBLOND, I., WALLAERT, B., LEBLOND, D., SALEZ, F., PEREZ, T.,
REMY-JARDIN, M., VANHILLE, P., BROUILLARD, M., MARQUETTE, C.
& TONNEL, A. B. 1998. Respiratory involvement in relapsing
polychondritis. Clinical, functional, endoscopic, and radiographic
evaluations. Medicine (Baltimore), 77, 168-76.
TIPLE, D., FABBRINI, G., COLOSIMO, C., OTTAVIANI, D., CAMEROTA, F.,
DEFAZIO, G. & BERARDELLI, A. 2009. Camptocormia in Parkinson
disease: an epidemiological and clinical study. J Neurol Neurosurg
Psychiatry, 80, 145-8.
TOMLINSON, C. L., STOWE, R., PATEL, S., RICK, C., GRAY, R. & CLARKE,
C. E. 2010. Systematic review of levodopa dose equivalency reporting in
Parkinson's disease. Mov Disord, 25, 2649-53.
TROOSTERS, T., GOSSELINK, R. & DECRAMER, M. 2005. Respiratory
muscle assessment. European Respiratory Society Monograph, 31, 57-
71.
TWELVES, D., PERKINS, K. S. & COUNSELL, C. 2003. Systematic review of
incidence studies of Parkinson's disease. Mov Disord, 18, 19-31.
209
TZELEPIS, G. E., MCCOOL, F. D., FRIEDMAN, J. H. & HOPPIN, F. G., JR.
1988. Respiratory muscle dysfunction in Parkinson's disease. Am Rev
Respir Dis, 138, 266-71.
VALENTE, E. M., ABOU-SLEIMAN, P. M., CAPUTO, V., MUQIT, M. M.,
HARVEY, K., GISPERT, S., ALI, Z., DEL TURCO, D., BENTIVOGLIO, A.
R., HEALY, D. G., ALBANESE, A., NUSSBAUM, R., GONZALEZ-
MALDONADO, R., DELLER, T., SALVI, S., CORTELLI, P., GILKS, W.
P., LATCHMAN, D. S., HARVEY, R. J., DALLAPICCOLA, B.,
AUBURGER, G. & WOOD, N. W. 2004a. Hereditary early-onset
Parkinson's disease caused by mutations in PINK1. Science, 304, 1158-
60.
VALENTE, E. M., SALVI, S., IALONGO, T., MARONGIU, R., ELIA, A. E.,
CAPUTO, V., ROMITO, L., ALBANESE, A., DALLAPICCOLA, B. &
BENTIVOGLIO, A. R. 2004b. PINK1 mutations are associated with
sporadic early-onset parkinsonism. Ann Neurol, 56, 336-41.
VAN HEES, V. T., GORZELNIAK, L., DEAN LEON, E. C., EDER, M., PIAS, M.,
TAHERIAN, S., EKELUND, U., RENSTROM, F., FRANKS, P. W.,
HORSCH, A. & BRAGE, S. 2013. Separating movement and gravity
components in an acceleration signal and implications for the
assessment of human daily physical activity. PLoS One, 8, e61691.
VAYNMAN, S. & GOMEZ-PINILLA, F. 2005. License to run: exercise impacts
functional plasticity in the intact and injured central nervous system by
using neurotrophins. Neurorehabil Neural Repair, 19, 283-95.
VERBEKEN, E. K., CAUBERGHS, M., MERTENS, I., CLEMENT, J.,
LAUWERYNS, J. M. & VAN DE WOESTIJNE, K. P. 1992. The senile
lung. Comparison with normal and emphysematous lungs. 1. Structural
aspects. Chest, 101, 793-9.
VERCUEIL, L., LINARD, J. P., WUYAM, B., POLLAK, P. & BENCHETRIT, G.
1999. Breathing pattern in patients with Parkinson's disease. Respir
Physiol, 118, 163-72.
VERIN, E., DELAFOSSE, C., STRAUS, C., MORELOT-PANZINI, C., AVDEEV,
S., DERENNE, J. P. & SIMILOWSKI, T. 2001. Effects of muscle group
recruitment on sniff transdiaphragmatic pressure and its components.
Eur J Appl Physiol, 85, 593-8.
210
VIDONI, E. D., HONEA, R. A., BILLINGER, S. A., SWERDLOW, R. H. &
BURNS, J. M. 2012. Cardiorespiratory fitness is associated with atrophy
in Alzheimer's and aging over 2 years. Neurobiol Aging, 33, 1624-32.
VINCENT, J.-L. 2008. Understanding cardiac output. Critical Care, 12, 174-174.
VINCKEN, W. G., GAUTHIER, S. G., DOLLFUSS, R. E., HANSON, R. E.,
DARAUAY, C. M. & COSIO, M. G. 1984. Involvement of upper-airway
muscles in extrapyramidal disorders. A cause of airflow limitation. N Engl
J Med, 311, 438-42.
VINGERHOETS, F. J., SNOW, B. J., LEE, C. S., SCHULZER, M., MAK, E. &
CALNE, D. B. 1994. Longitudinal fluorodopa positron emission
tomographic studies of the evolution of idiopathic parkinsonism. Ann
Neurol, 36, 759-64.
VON CAMPENHAUSEN, S., BORNSCHEIN, B., WICK, R., BOTZEL, K.,
SAMPAIO, C., POEWE, W., OERTEL, W., SIEBERT, U., BERGER, K. &
DODEL, R. 2005. Prevalence and incidence of Parkinson's disease in
Europe. Eur Neuropsychopharmacol, 15, 473-90.
VOSSIUS, C., NILSEN, O. B. & LARSEN, J. P. 2010. Parkinson's disease and
hospital admissions: frequencies, diagnoses and costs. Acta Neurol
Scand, 121, 38-43.
VU, T. C., NUTT, J. G. & HOLFORD, N. H. 2012. Progression of motor and
nonmotor features of Parkinson's disease and their response to
treatment. Br J Clin Pharmacol, 74, 267-83.
WAKABAYASHI, K., TANJI, K., MORI, F. & TAKAHASHI, H. 2007. The Lewy
body in Parkinson's disease: molecules implicated in the formation and
degradation of alpha-synuclein aggregates. Neuropathology, 27, 494-
506.
WANG, Y., SHAO, W. B., GAO, L., LU, J., GU, H., SUN, L. H., TAN, Y. &
ZHANG, Y. D. 2014. Abnormal pulmonary function and respiratory
muscle strength findings in Chinese patients with Parkinson's disease
and multiple system atrophy--comparison with normal elderly. PLoS One,
9, e116123.
WANGER, J., CLAUSEN, J. L., COATES, A., PEDERSEN, O. F., BRUSASCO,
V., BURGOS, F., CASABURI, R., CRAPO, R., ENRIGHT, P., VAN DER
GRINTEN, C. P., GUSTAFSSON, P., HANKINSON, J., JENSEN, R.,
JOHNSON, D., MACINTYRE, N., MCKAY, R., MILLER, M. R.,
211
NAVAJAS, D., PELLEGRINO, R. & VIEGI, G. 2005. Standardisation of
the measurement of lung volumes. Eur Respir J, 26, 511-22.
WEINER, P., INZELBERG, R., DAVIDOVICH, A., NISIPEANU, P., MAGADLE,
R., BERAR-YANAY, N. & CARASSO, R. L. 2002. Respiratory muscle
performance and the Perception of dyspnea in Parkinson's disease. Can
J Neurol Sci, 29, 68-72.
WENGER, H. A. & BELL, G. J. 1986. The interactions of intensity, frequency
and duration of exercise training in altering cardiorespiratory fitness.
Sports Med, 3, 346-56.
WHETTEN-GOLDSTEIN, K., SLOAN, F., KULAS, E., CUTSON, T. &
SCHENKMAN, M. 1997. The burden of Parkinson's disease on society,
family, and the individual. J Am Geriatr Soc, 45, 844-9.
WHOQOLGROUP 1993. Study protocol for the World Health Organization
project to develop a Quality of Life assessment instrument (WHOQOL).
Quality of Life Research, 2, 153-159.
WIKIPEDIA. 2004. Flow Volume Loop [Online]. Available:
https://en.wikipedia.org/wiki/File:Flow-volume-loop.png 2015].
WOLTERS, E. & BAUMANN, C. 2014. Parkinson Disease and Other Movement
Disorders, Motor Behavioural Disorders and Behavioural Motor
Disorders, The Netherlands, V U University Press.
WOODFORD, H. & WALKER, R. 2005. Emergency hospital admissions in
idiopathic Parkinson's disease. Mov Disord, 20, 1104-8.
YELLOWLEES, P. M., ALPERS, J. H., BOWDEN, J. J., BRYANT, G. D. &
RUFFIN, R. E. 1987. Psychiatric morbidity in patients with chronic airflow
obstruction. Med J Aust, 146, 305-7.
YOHANNES, A. M., BALDWIN, R. C. & CONNOLLY, M. J. 2000. Depression
and anxiety in elderly outpatients with chronic obstructive pulmonary
disease: prevalence, and validation of the BASDEC screening
questionnaire. Int J Geriatr Psychiatry, 15, 1090-6.
ZAIDEL, A., ARKADIR, D., ISRAEL, Z. & BERGMAN, H. 2009. Akineto-rigid vs.
tremor syndromes in Parkinsonism. Curr Opin Neurol, 22, 387-93.
ZIMPRICH, A., MULLER-MYHSOK, B., FARRER, M., LEITNER, P., SHARMA,
M., HULIHAN, M., LOCKHART, P., STRONGOSKY, A., KACHERGUS,
J., CALNE, D. B., STOESSL, J., UITTI, R. J., PFEIFFER, R. F.,
TRENKWALDER, C., HOMANN, N., OTT, E., WENZEL, K., ASMUS, F.,

212
HARDY, J., WSZOLEK, Z. & GASSER, T. 2004. The PARK8 locus in
autosomal dominant parkinsonism: confirmation of linkage and further
delineation of the disease-containing interval. Am J Hum Genet, 74, 11-
9.