puf annual report for fiscal year 1996-97 - utimco
TRANSCRIPT
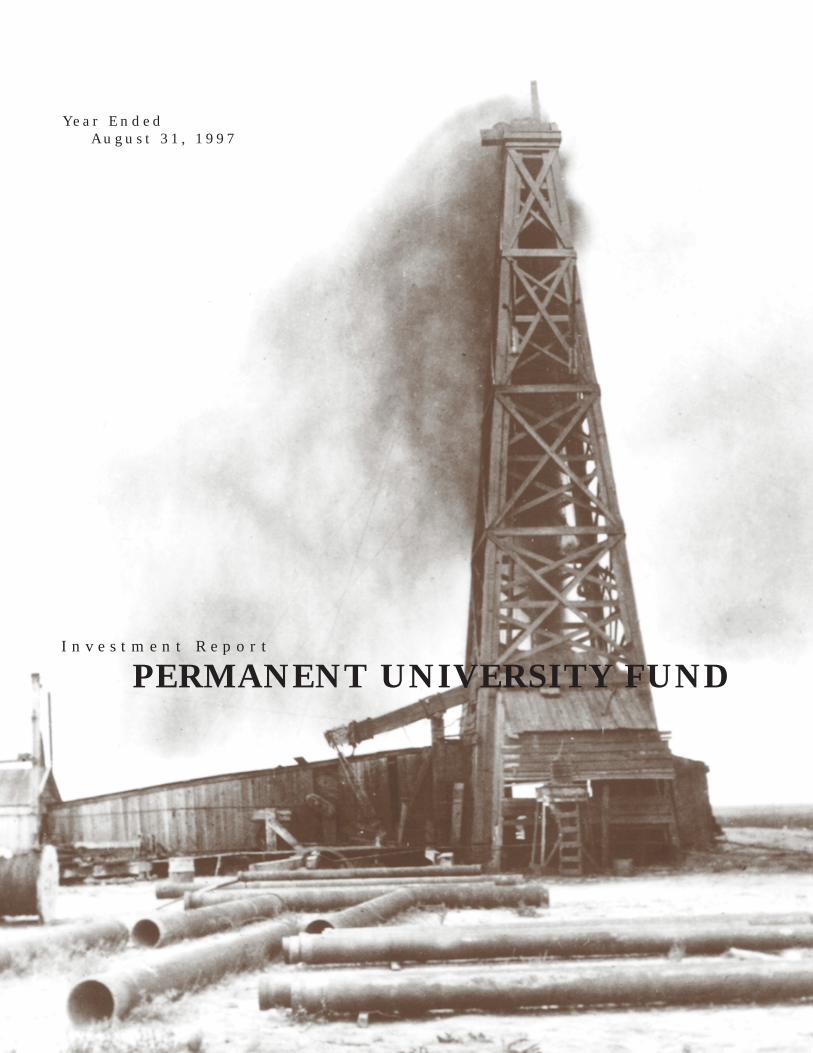
Y e a r E n d e d A u g u s t 3 1 , 1 9 9 7
I n v e s t m e n t R e p o r t
PERMANENT UNIVERSITY FUND
rg
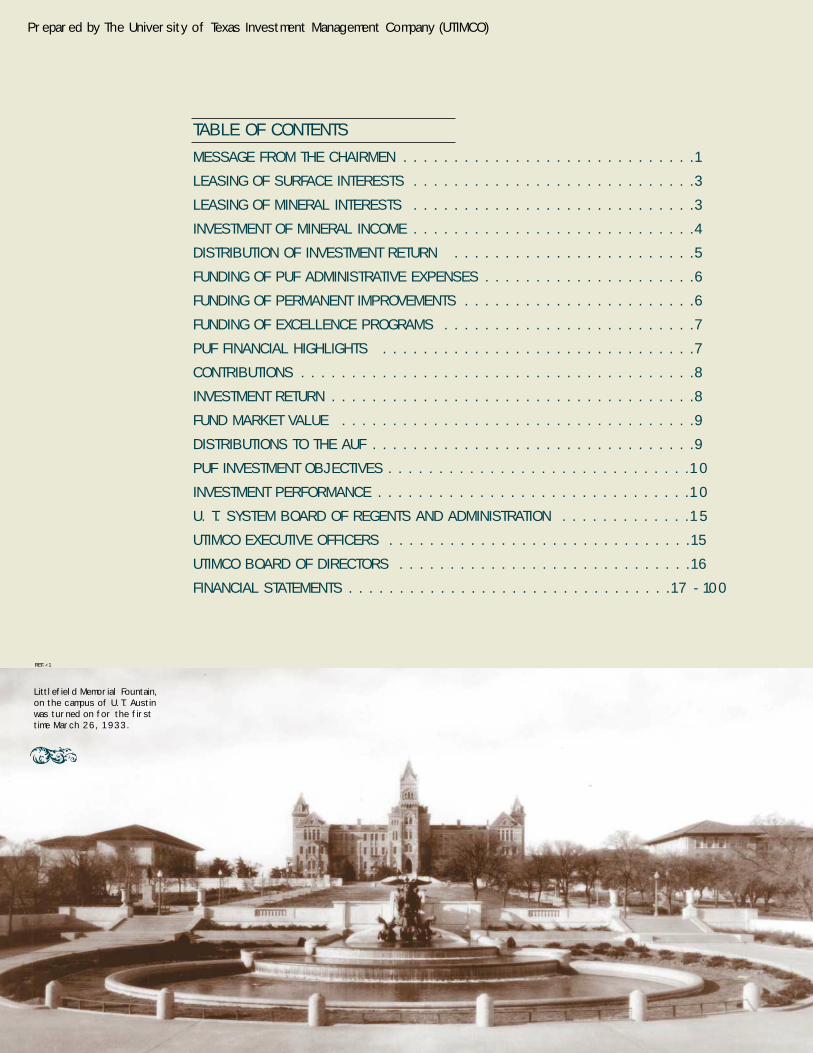
TABLE OF CONTENTS
Littlefield Memorial Fountain,on the campus of U. T. Austinwas turned on for the firsttime March 26, 1933.
Prepared by The University of Texas Investment Management Company (UTIMCO)
Y
MESSAGE FROM THE CHAIRMEN . . . . . . . . . . . . . . . . . . . . . . . . . . . . .1
LEASING OF SURFACE INTERESTS . . . . . . . . . . . . . . . . . . . . . . . . . . . .3
LEASING OF MINERAL INTERESTS . . . . . . . . . . . . . . . . . . . . . . . . . . . .3
INVESTMENT OF MINERAL INCOME . . . . . . . . . . . . . . . . . . . . . . . . . . . .4
DISTRIBUTION OF INVESTMENT RETURN . . . . . . . . . . . . . . . . . . . . . . . .5
FUNDING OF PUF ADMINISTRATIVE EXPENSES . . . . . . . . . . . . . . . . . . . . .6
FUNDING OF PERMANENT IMPROVEMENTS . . . . . . . . . . . . . . . . . . . . . . .6
FUNDING OF EXCELLENCE PROGRAMS . . . . . . . . . . . . . . . . . . . . . . . . .7
PUF FINANCIAL HIGHLIGHTS . . . . . . . . . . . . . . . . . . . . . . . . . . . . . . .7
CONTRIBUTIONS . . . . . . . . . . . . . . . . . . . . . . . . . . . . . . . . . . . . . . .8
INVESTMENT RETURN . . . . . . . . . . . . . . . . . . . . . . . . . . . . . . . . . . . .8
FUND MARKET VALUE . . . . . . . . . . . . . . . . . . . . . . . . . . . . . . . . . . .9
DISTRIBUTIONS TO THE AUF . . . . . . . . . . . . . . . . . . . . . . . . . . . . . . . .9
PUF INVESTMENT OBJECTIVES . . . . . . . . . . . . . . . . . . . . . . . . . . . . . .10
INVESTMENT PERFORMANCE . . . . . . . . . . . . . . . . . . . . . . . . . . . . . . .10
U. T. SYSTEM BOARD OF REGENTS AND ADMINISTRATION . . . . . . . . . . . . .15
UTIMCO EXECUTIVE OFFICERS . . . . . . . . . . . . . . . . . . . . . . . . . . . . . .15
UTIMCO BOARD OF DIRECTORS . . . . . . . . . . . . . . . . . . . . . . . . . . . . .16
FINANCIAL STATEMENTS . . . . . . . . . . . . . . . . . . . . . . . . . . . . . . . .17 - 100
REF. #1
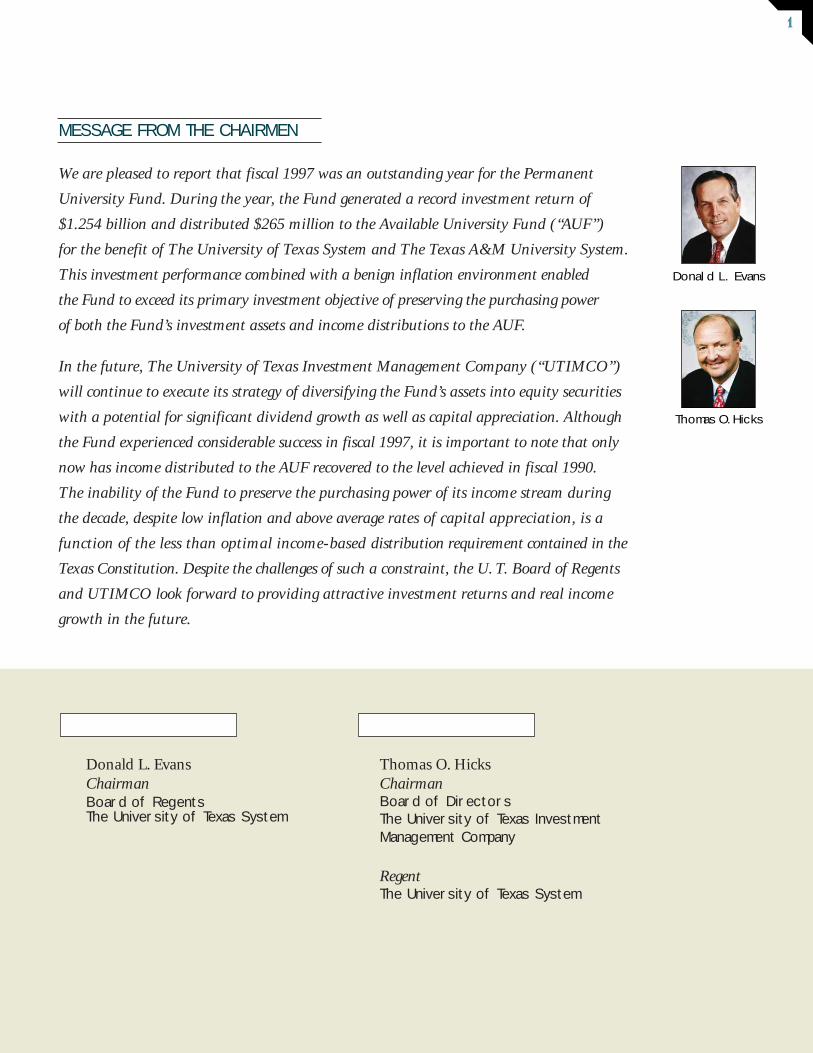
MESSAGE FROM THE CHAIRMEN
We are pleased to report that fiscal 1997 was an outstanding year for the Permanent
University Fund. During the year, the Fund generated a record investment return of
$1.254 billion and distributed $265 million to the Available University Fund (“AUF”)
for the benefit of The University of Texas System and The Texas A&M University System.
This investment performance combined with a benign inflation environment enabled
the Fund to exceed its primary investment objective of preserving the purchasing power
of both the Fund’s investment assets and income distributions to the AUF.
In the future, The University of Texas Investment Management Company (“UTIMCO”)
will continue to execute its strategy of diversifying the Fund’s assets into equity securities
with a potential for significant dividend growth as well as capital appreciation. Although
the Fund experienced considerable success in fiscal 1997, it is important to note that only
now has income distributed to the AUF recovered to the level achieved in fiscal 1990.
The inability of the Fund to preserve the purchasing power of its income stream during
the decade, despite low inflation and above average rates of capital appreciation, is a
function of the less than optimal income-based distribution requirement contained in the
Texas Constitution. Despite the challenges of such a constraint, the U. T. Board of Regents
and UTIMCO look forward to providing attractive investment returns and real income
growth in the future.
Donald L. EvansChairmanBoard of RegentsThe University of Texas System
Thomas O. HicksChairmanBoard of DirectorsThe University of Texas InvestmentManagement Company
RegentThe University of Texas System
Thomas O.Hicks
Donald L. Evans
1
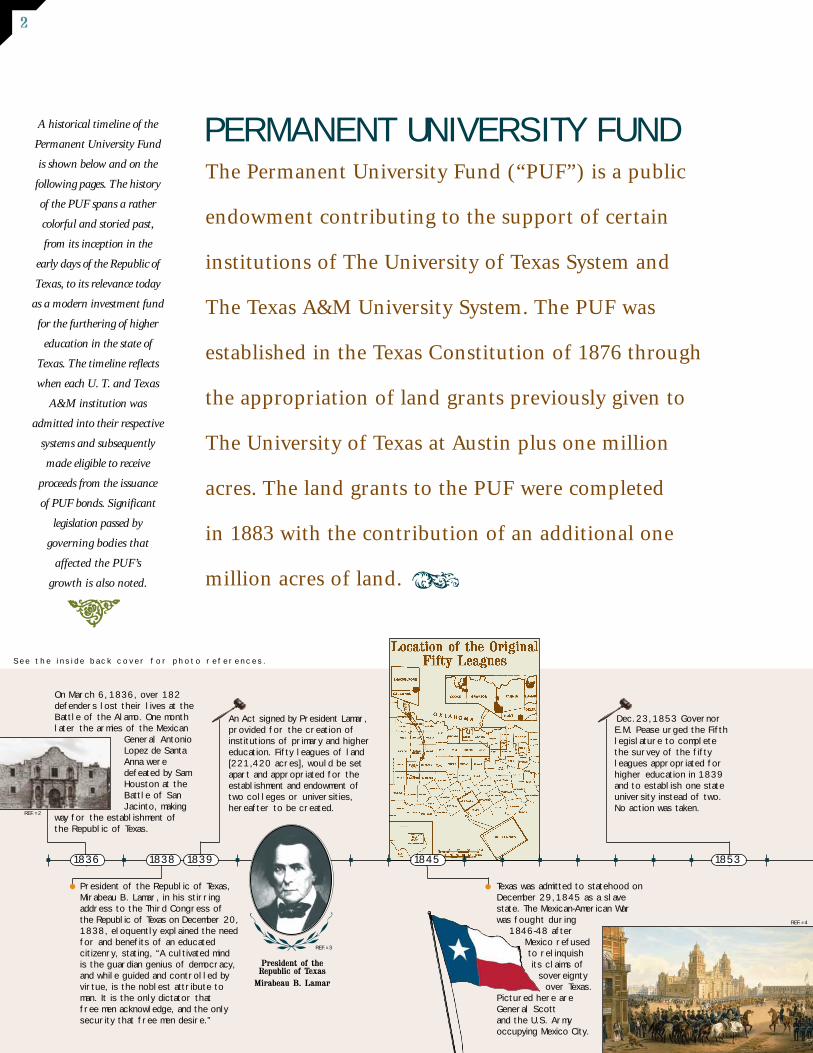
An Act signed by President Lamar,provided for the creation ofinstitutions of primary and highereducation. Fifty leagues of land[221,420 acres], would be setapart and appropriated for theestablishment and endowment oftwo colleges or universities,hereafter to be created.
Texas was admitted to statehood onDecember 29,1845 as a slavestate. The Mexican-American Warwas fought during
1846-48 afterMexico refusedto relinquishits claims of
sovereigntyover Texas.
Pictured here areGeneral Scott and the U.S. Armyoccupying Mexico City.
Dec.23,1853 GovernorE.M. Pease urged the Fifthlegislature to completethe survey of the fiftyleagues appropriated forhigher education in 1839and to establish one stateuniversity instead of two.No action was taken.
On March 6, 1836, over 182defenders lost their lives at theBattle of the Alamo. One monthlater the armies of the Mexican
General AntonioLopez de SantaAnna weredefeated by SamHouston at theBattle of SanJacinto, making
way for the establishment of the Republic of Texas.
S e e t h e i n s i d e b a c k c o v e r f o r p h o t o r e f e r e n c e s .
President of the Republic of Texas,Mirabeau B. Lamar, in his stirringaddress to the Third Congress of the Republic of Texas on December 20,1838, eloquently explained the needfor and benefits of an educated citizenry, stating, “A cultivated mind is the guardian genius of democracy,and while guided and controlled byvirtue, is the noblest attribute toman. It is the only dictator that free men acknowledge, and the onlysecurity that free men desire.”
The Permanent University Fund (“PUF”) is a public
endowment contributing to the support of certain
institutions of The University of Texas System and
The Texas A&M University System. The PUF was
established in the Texas Constitution of 1876 through
the appropriation of land grants previously given to
The University of Texas at Austin plus one million
acres. The land grants to the PUF were completed
in 1883 with the contribution of an additional one
million acres of land.
PERMANENT UNIVERSITY FUND
President of the Republic of Texas
Mirabeau B. Lamar
1836 1838 1839 1845 1853
Y
A historical timeline of the
Permanent University Fund
is shown below and on the
following pages. The history
of the PUF spans a rather
colorful and storied past,
from its inception in the
early days of the Republic of
Texas, to its relevance today
as a modern investment fund
for the furthering of higher
education in the state of
Texas. The timeline reflects
when each U. T. and Texas
A&M institution was
admitted into their respective
systems and subsequently
made eligible to receive
proceeds from the issuance
of PUF bonds. Significant
legislation passed by
governing bodies that
affected the PUF’s
growth is also noted.
I
S
2
REF. #2
REF. #3
REF. #4
LEASING OF SURFACE INTERESTS
Surface acreage of the sparsely-populated PUF
Lands has been leased primarily for grazing and
easements for power lines and pipelines.
During the period 1970-1990, surface income
grew rapidly to reach $5 million per year by
1987. Since then, surface income has leveled off
and fluctuates in the $4-5 million range per year.
As mandated by the Constitution, all surface
income from the PUF Lands is distributed to
the Available University Fund (“AUF”) and
expended in the year in which it is earned.
LEASING OF MINERAL INTERESTS
Mineral income generated by the PUF Lands
consists primarily of bonuses and rentals from
the periodic sale of mineral leases and royalties
on gross revenues from oil, gas, and sulfur
production. Additional mineral income is
generated through royalties and rentals of
water and other miscellaneous income.
As interpreted by the Texas Supreme Court
and the Texas Attorney General, constitutional
provisions governing the PUF require that all
proceeds from the sale of lands and leasing of
minerals be invested in securities. Furthermore,
all net realized gains from the sale of securities
must be reinvested as corpus and may not be
distributed to the AUF and expended.
Texas Governor E.M. Pease signed the bill for the establishment of theUniversity of Texas on February 11,1858. The Act granted the Universityof Texas $100,000 in U.S. bonds, aswell as the original Fifty Leagues. In addition, the Act granted to theUniversity 10% of the land reservedfor the State under the RailroadGrant Act of 1854.
America–and the world–was entering the IndustrialRevolution. Whale oil wasrapidly diminishing as industryrequired more and differenttypes of fuel. In 1859 thefirst oil well in America wasdrilled near Titusville, Pa.The oil boom in Texas wasseveral years off, but the world stage for mass consumption of petroleum products was set.
Texas seceded from theUnion effective March 2,1861 and remained partof the Confederacy untilthe Civil War ended onApril 9, 1865.
On April 17,1871 the Texas Legislature established the Agricultural and MechanicalCollege of Texas and declared that it be abranch of The University of Texas. A 9-memberBoard of Directors for A&M had their firstmeeting on June 1, 1875 in Bryan, Texas.
Old Main and the “new” woodenbarracks at A&MCollege of Texasstood in 1878.
Governor E.M. Pease
18611858 1859 1871
University of Texas SystemPUF Beneficiaries
U. T. at Arlington
U. T. at Austin
U. T. at Dallas
U. T. at El Paso
U. T. Health Science Centerat Houston
U. T. Health Science Centerat San Antonio
U. T. M.D. Anderson Cancer Center
U. T. Medical Branch atGalveston
U. T. of the Permian Basin
U. T. at San Antonio
U. T. Southwestern MedicalCenter at Dallas
U. T. at Tyler
U. T. Health Center at Tyler
Texas A&M UniversitySystem PUF Beneficiaries
Texas A&M University
Texas A&M at Galveston
Texas A&M at Prairie View
Texas A&M at Tarleton State
The University of Texas System Board of Regents (“U. T.
System Board”) has maintained an active program for
leasing of mineral interests since 1923.Y
AVAILABLE UNIVERSITY FUND
PERMANENT UNIVERSITY FUND
mineralincome
surface income investment income
PUF Lands PUFInvestments
S
3
REF. #5
REF. #6
REF. #7
REF. #8
Texa
s A&M
TX
A&M
at
Pra
irie
Vie
w
U.
T. M
edic
al B
ranc
h a
t Gal
vest
on
U.
T. a
t Aust
in
The Constitution of 1876 established a“Permanent University Fund” and called forthe creation of The University of Texas, whichhad yet to be organized, and mandated thatthe A&M College of Texas was to be a branchof The University of Texas. The Constitution
took away the prime landsbordering the railroads(one section for everyten) and granted in itsplace 1,000,000 acresin West Texas.
Classes beganat Texas A&MOctober 4,1876, with an
enrollment of 6students. Thomas S.
Gathright served asfirst president. By thetime the first year endedthere were 106 students enrolled.
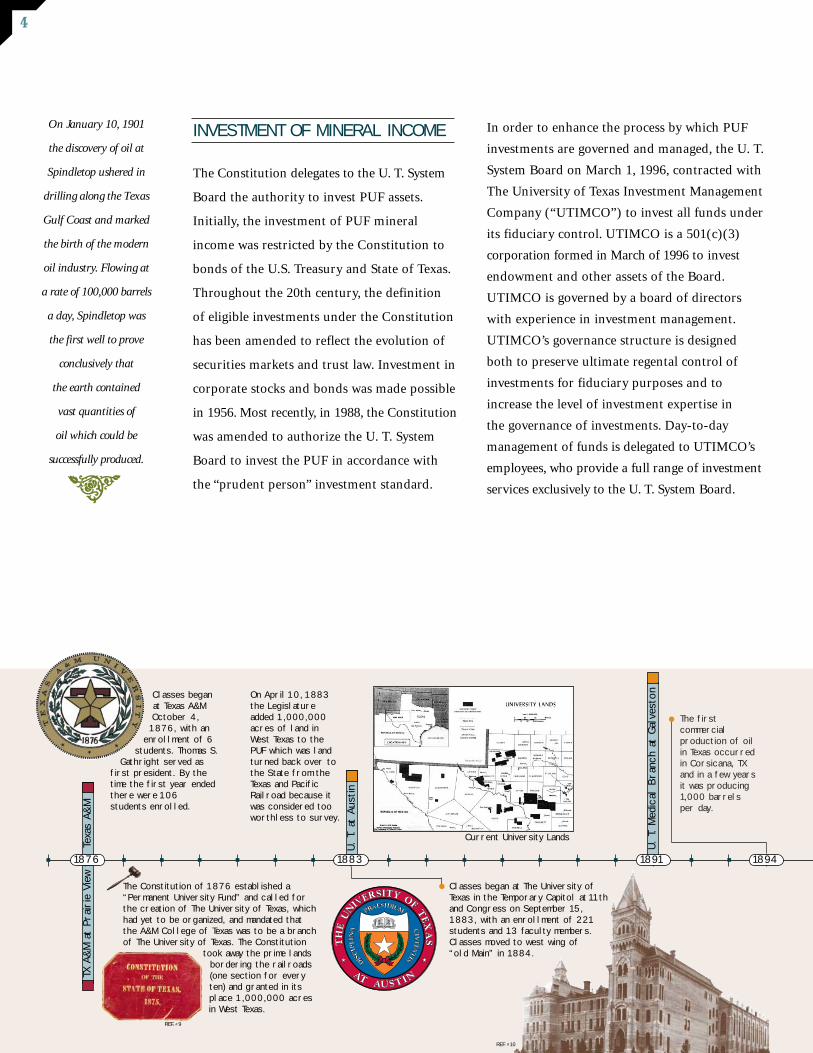
On April 10, 1883the Legislatureadded 1,000,000acres of land inWest Texas to thePUF which was landturned back over tothe State from theTexas and PacificRailroad because itwas considered tooworthless to survey.
Current University Lands
INVESTMENT OF MINERAL INCOME
The Constitution delegates to the U. T. System
Board the authority to invest PUF assets.
Initially, the investment of PUF mineral
income was restricted by the Constitution to
bonds of the U.S. Treasury and State of Texas.
Throughout the 20th century, the definition
of eligible investments under the Constitution
has been amended to reflect the evolution of
securities markets and trust law. Investment in
corporate stocks and bonds was made possible
in 1956. Most recently, in 1988, the Constitution
was amended to authorize the U. T. System
Board to invest the PUF in accordance with
the “prudent person” investment standard.
In order to enhance the process by which PUF
investments are governed and managed, the U. T.
System Board on March 1, 1996, contracted with
The University of Texas Investment Management
Company (“UTIMCO”) to invest all funds under
its fiduciary control. UTIMCO is a 501(c)(3)
corporation formed in March of 1996 to invest
endowment and other assets of the Board.
UTIMCO is governed by a board of directors
with experience in investment management.
UTIMCO’s governance structure is designed
both to preserve ultimate regental control of
investments for fiduciary purposes and to
increase the level of investment expertise in
the governance of investments. Day-to-day
management of funds is delegated to UTIMCO’s
employees, who provide a full range of investment
services exclusively to the U. T. System Board.
On January 10, 1901
the discovery of oil at
Spindletop ushered in
drilling along the Texas
Gulf Coast and marked
the birth of the modern
oil industry. Flowing at
a rate of 100,000 barrels
a day, Spindletop was
the first well to prove
conclusively that
the earth contained
vast quantities of
oil which could be
successfully produced.
I
1876 1883 1891 1894
Classes began at The University ofTexas in the Temporary Capitol at 11thand Congress on September 15,1883, with an enrollment of 221students and 13 faculty members.Classes moved to west wing of “old Main” in 1884.
The first commercial production of oilin Texas occurredin Corsicana, TXand in a few yearsit was producing 1,000 barrels per day.
4
REF. #9
REF. #10
In 1911, U. T. officialsbegan to constructwooden shacks forclassrooms and labora-tories. Two dozen ofthese unsightly one-story buildings wereconstructed, and it isclaimed that they wereleft unpainted, unpapered and unheated by order ofPresident S.E. Mezes so that Texans would be ashamedand embarrassed by their appearance and so demandmore suitable accommodations from the legislature.
On December 17,1903the Wright Brothersmade the first poweredairplane flight in historyat Kitty Hawk, N.C.
In 1899, after seven years of trying unsuccess-fully to find backers for a well on Spindletop Hill, U.T. geology professorWilliam Battle Phillips, helped provide the means for substantial investment and qualified personnel to direct the work.
And on January10, 1901 thediscovery of oil at Spindletopushered in drilling along theTexas Gulf Coast and markedthe birth of the modern oilindustry, including Gulf Oil.Flowing at a rate of100,000 barrels a day,Spindletop was the first wellto prove conclusively that theearth contained vast quantitiesof oil which could be success-fully harvested.
On June 28, 1914, all ofEurope, and eventually 32nations were involved inWorld War I. The U.S.delayed entry untilApril 7, 1917. Raw materials ofevery kind, includingoil, were rationedfor the war effort.
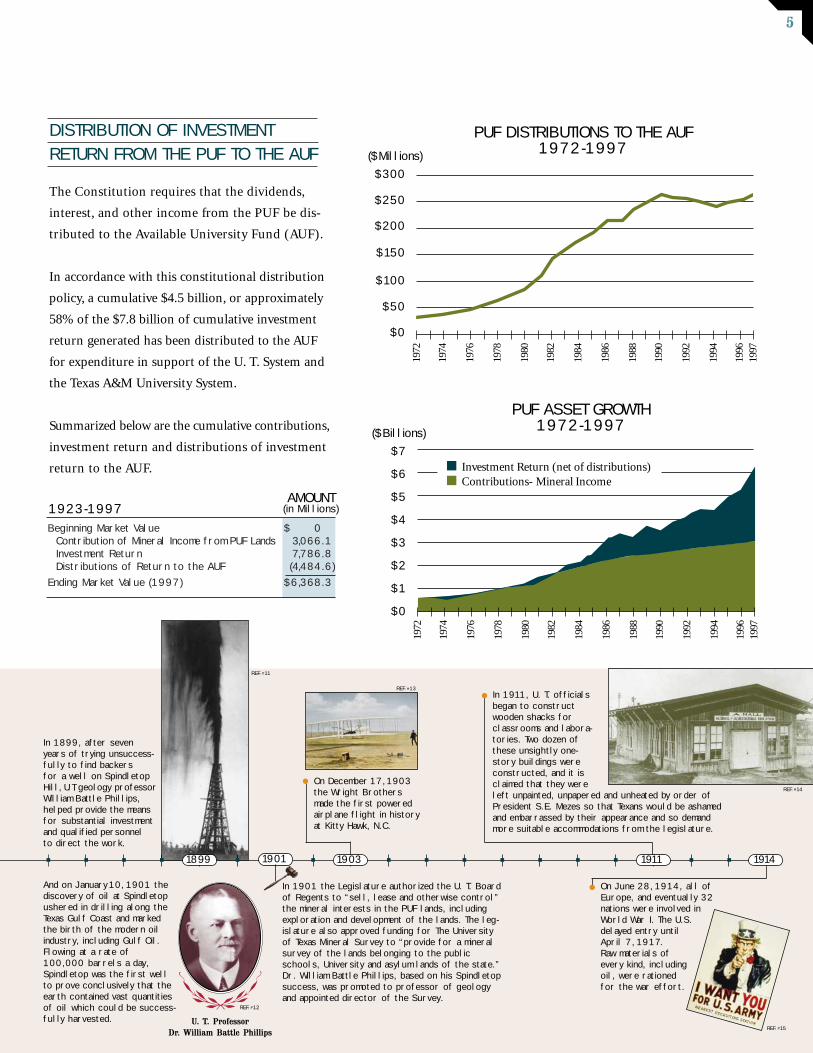
DISTRIBUTION OF INVESTMENT
RETURN FROM THE PUF TO THE AUF
The Constitution requires that the dividends,
interest, and other income from the PUF be dis-
tributed to the Available University Fund (AUF).
In accordance with this constitutional distribution
policy, a cumulative $4.5 billion, or approximately
58% of the $7.8 billion of cumulative investment
return generated has been distributed to the AUF
for expenditure in support of the U. T. System and
the Texas A&M University System.
Summarized below are the cumulative contributions,
investment return and distributions of investment
return to the AUF.
1972
$0
$50
$100
$150
$200
$250
$300
($Millions)
PUF DISTRIBUTIONS TO THE AUF1972-1997
1974
1976
1978
1980
1982
1984
1986
1988
1990
1992
1994
1996
1997
1972
$7
$6
$5
$4
$3
$2
$1
$0
($Billions)
PUF ASSET GROWTH1972-1997
1974
1976
1978
1980
1982
1984
1986
1988
1990
1992
1994
1996
1997
Investment Return (net of distributions)Contributions- Mineral Income
Beginning Market Value $ 0Contribution of Mineral Income from PUF Lands 3,066.1Investment Return 7,786.8Distributions of Return to the AUF (4,484.6)
Ending Market Value (1997) $6,368.3
19141899 1903 19111901
In 1901 the Legislature authorized the U. T. Boardof Regents to “sell, lease and otherwise control”the mineral interests in the PUF lands, includingexploration and development of the lands. The leg-islature also approved funding for The Universityof Texas Mineral Survey to “provide for a mineralsurvey of the lands belonging to the publicschools, University and asylum lands of the state.”Dr. William Battle Phillips, based on his Spindletopsuccess, was promoted to professor of geologyand appointed director of the Survey.
U. T. Professor Dr. William Battle Phillips
1923-1997AMOUNT
(in Millions)
S
5
REF. #11
REF. #12
REF. #13
REF. #14
REF. #15
On June 10,1923, the OrientExpress made aspecial run to the Santa Rita well site. Severalthousand peoplegathered to wit-ness the sight of oil gushing in West Texas.
The Santa Rita No. 1 (on University Lands)was spudded August 17, 1921 and eruptedon May 28, 1923 at a depth of 3,055feet. This name was provided by a group ofCatholic Nuns who invested in Texan Oil Co.The Nuns requested that the oilmen sprin-kle a handful of specially-blessed rosepedals from the top of the derrick beforedrilling started and proclaim,”I christenthee Santa Rita No. 1”. The name wasderived from Saint Rita, the patron saint of the impossible.
TX A
&M
at
Tarle
ton
Sta
te
Santa Rita No. 1
U.T. a
t El
Paso
On March 10, 1926 the TexasSupreme Court ruled in State v.Hatcher that proceeds from thesale of oil from the PUF landsshould be considered proceedsfrom the sale of part of the “corpus of the estate” and couldnot be regarded as income.
In 1928 AttorneyGeneral ClaudePollard issued anopinion stating thatthe U. T. Board ofRegents could issuebonds against theannual income fromthe PUF (the AUF).
On October 24, 1929 the stock market crashed andushered in the Great
Depression.
In 1933 ninebuildings werededicated on thecampus of theUniversity of Texasas part of its50th anniversarycelebration.During this sameperiod Texas A&Mwas also in a rapidbuilding phase.
On April 8, 1931 legislation waspassed which provided in addition toother amendments, that the interestand dividends of the PUF would bedivided 2/3 (U. T.) 1/3 (Texas A&M).PUF income was allowed to be spent on building construction andequipment purchases.
FUNDING OF PUF ADMINISTRATIVE
EXPENSES
The U. T. System Board, as trustee for the PUF,
incurs costs in the management of PUF Lands
and investments. Texas statutes require that all
administrative expenses be paid from the AUF.
This constraint means that investment expenses
incurred to produce both income return and
price return must be paid from the income
portion of investment return only.
FUNDING OF PERMANENT
IMPROVEMENTS
Under the Constitution, PUF income return
and surface income distributed from the PUF
to the AUF–rather than State general revenue
appropriations–are used by the U. T. System and
the Texas A&M System as a major source of
funding for capital expenditures at eligible
component institutions. The Constitution
authorizes the U. T. System Board and the Texas
A&M System Board to issue bonds payable from
their respective interests in annual distributions to
the AUF to finance construction and renovation
projects, major library acquisitions, and educational
and research equipment at the 17 eligible campuses
of their systems. The U. T. System Board and the
Texas A&M System Board are authorized to issue
bonds secured by each System’s interest in PUF
distributions in an amount not to exceed 20% and
10%, respectively, of the book value of the PUF at
the time of issuance.
Since bond issuance was first authorized in 1932,
the U. T. System and the Texas A&M System
have issued a combined total of $1.68 billion
of bonds to fund the acquisition of permanent
improvements. To date, $1.39 billion of
distributions from the PUF to the AUF has
been expended by the two systems to fund debt
service on PUF bonds.
The University of Texas
began receiving a standard
one-eighth oil royalty
from the wells drilled
on University lands.
Within a decade both
universities were able to
expand their campuses
to accommodate
increased enrollment
because of this new
source of funds.
1917 1919 1923 1926 1928 1929 1931 19331916 1921
I
Texas A&M
U. T.
6
REF. #16
REF. #17
REF. #18
REF. #19
On June 12, 1916, Dr. J.A. Udden submitted to theLand Committee of the U. T. Board of Regents aphotograph of a map he had constructed indicatingthe possible location of mineral deposits on theUniversity lands in West Texas, along with a reporton the potential mineral resources of theUniversity lands. Later that year the Board approved a policy expressly forbidding the sale of any of the University lands.

PUF Mineral Contributions $ 69.4 $ 59.6 $ 57.1 $ 65.7 $ 85.2
Investment Return 506.9 105.1 724.4 522.1 1,254.0
Investment Assets (Market Value) 4,468.7 4,428.0 4,958.5 5,292.1 6,368.3
Distributions to the AUFInvestment Income 250.3 242.3 249.5 253.6 265.2
Surface and Other Income 5.0 5.1 4.3 5.3 5.7
Administrative Expenses $ 10.3 $ 9.6 $ 9.5 $ 9.0 $ 10.8
FUNDING OF EXCELLENCE
PROGRAMS
The residual annual distributions from the PUF
to the AUF, after administrative expenses and
debt service on PUF bonds, are constitutionally
dedicated to the funding of excellence programs
at The University of Texas at Austin and
Texas A&M University at College Station
and system administration. Expenditures
for excellence programs encompass library
enhancements, specialized science and
engineering equipment, student counseling
services, graduate student fellowships, and
National Merit and minority scholarships.
U.T. S
W M
edic
al C
ente
rat
Dal
las
September 1, 1939 World War II beganwith the invasion of Poland by Germanyand Russia. On December 7, 1941 theJapanese bombing of Pearl Harborlaunched the UnitedStates into World War II.The war ended onSeptember 1,1945 withthe surrender of Japan,and the beginning of thenuclear age.
A constitutional amendment to the PUFwas passed to accommodate rapidlyincreasing enrollments. The amend-ment authorized a bond issue backedby the AUF of $10 million for TheUniversity of Texas, $2 million ofwhich was allotted to the U. T.Medical Branch at Galveston and $5 million for Texas A&M.
On June 25, 1950, the Korean War begins.
U.T. M
.D.And
erso
nCan
cer
Cen
ter
194919471939 1941
Texas A&M
U. T. Medical Branchat Galveston
U. T.
1950
PUF FINANCIAL HIGHLIGHTS (in Millions)
FOR THE YEAR ENDED AUGUST 31, 1993 1994 1995 1996 1997
With the ushering in of theNuclear Age and the end of WWII, an explosion of adifferent kind was born, the post-war Baby Boom.Thousands of new studentssponsored by the G.I. Billwould soon cause an
increase in college attendance ofunprecedented proportions and whoseeffect would be evident on institutionsof higher education for years to come.
7
REF. #20
REF. #21
CONTRIBUTIONS
Contributions of mineral income to PUF
corpus increased by 29.7% from $65.7 million to
$85.2 million. Of this total, 54.1% was contributed
by royalties on the production of crude oil,
which increased by 16.5% to $46.1 million.
Average oil prices during the year increased
by $2.62 per barrel to $20.46 per barrel.
Production for the year increased by 258,859
barrels, or by 1.7% to 15,526,443 barrels.
Royalties on the production of gas accounted
for approximately 27.9% of fiscal year mineral
income. Gas royalties increased by 39.3% from
$17.0 million to $23.7 million. This increase was
largely a result of increases in both wellhead gas
prices and gas and casinghead production.
Wellhead gas prices for the fiscal year averaged
$2.46 per mmbtu while production increased
2,903,075 mcf to 72,893,893 mcf. Renewal of oil
and gas leases and miscellaneous royalties
accounted for the remaining 1.8% of the mineral
income for 1997. Finally, roughly 16.2% of
fiscal year contributions of mineral income was
generated by bonuses paid on the sale of oil and
gas leases. Bonuses contributed $13.8 million to
the PUF, representing an increase of 88% over
bonuses paid during the prior year.
INVESTMENT RETURN
During the year, the PUF produced income,
net realized gains, and net unrealized gains of
$1,254.0 million. This represented a 140.2%
increase from the prior year’s return of $522.1
million, and the highest investment return
since the PUF’s inception. Of the $1,254.0
million return, $263.0 million was income
return and $991.0 million was price return.
In accordance with statutory requirements,
the cash income return of $265.2 million was
distributed to the AUF and the price return of
$991.0 million was retained as PUF corpus.U.T
. Hea
lth
Sci
ence
Cen
ter
at S
anAnt
oni
o
U.T. o
f th
e Per
mian
Bas
in
U.T. a
t Dal
las
U.T. H
ealt
h S
cie
nce
Cen
ter a
t Houst
on
U.T. a
t San
Ant
oni
o
U.T. a
t Arling
ton
November 5, 1968Section IIa of Article7 was amended toinclude additionaltypes of corporatebond and equity investments for thePUF and correspondingguidelines for theirselection.
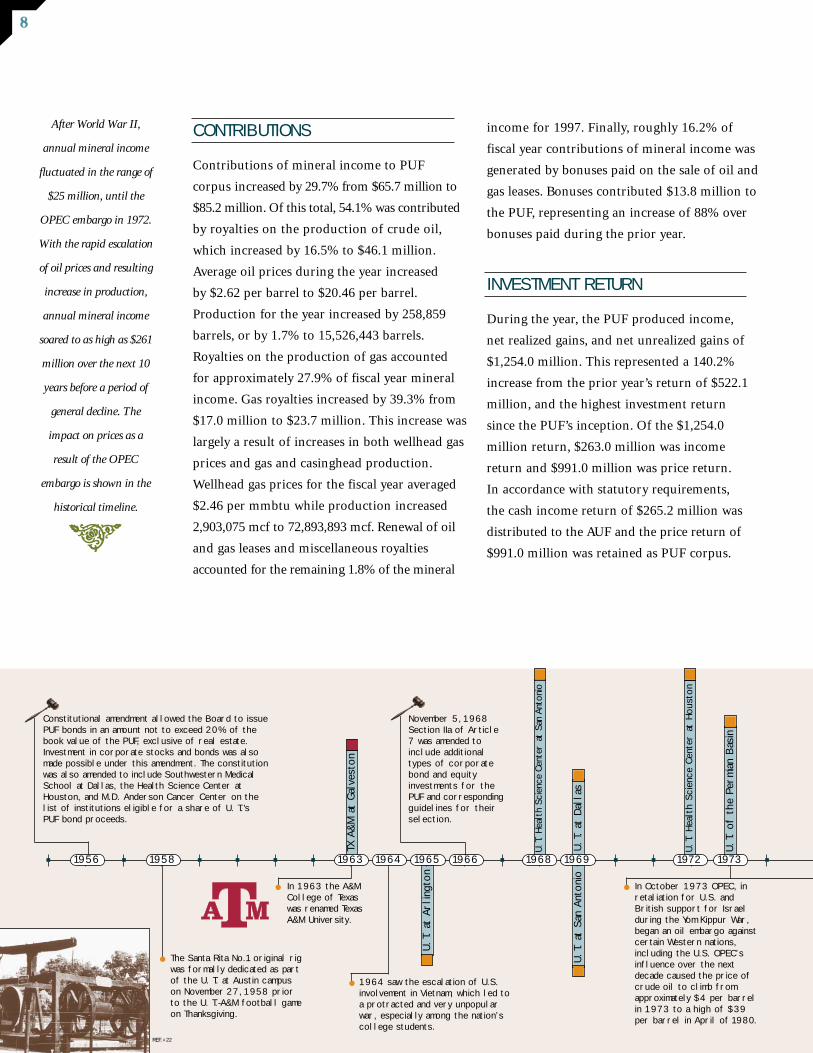
In October 1973 OPEC, inretaliation for U.S. andBritish support for Israelduring the Yom Kippur War,began an oil embargo against certain Western nations,including the U.S. OPEC’sinfluence over the nextdecade caused the price ofcrude oil to climb fromapproximately $4 per barrelin 1973 to a high of $39per barrel in April of 1980.
The Santa Rita No.1original rigwas formally dedicated as partof the U. T. at Austin campuson November 27, 1958 priorto the U. T.-A&M football gameon Thanksgiving.
In 1963 the A&MCollege of Texaswas renamed TexasA&M University.
Constitutional amendment allowed the Board to issuePUF bonds in an amount not to exceed 20% of thebook value of the PUF, exclusive of real estate.Investment in corporate stocks and bonds was alsomade possible under this amendment. The constitutionwas also amended to include Southwestern MedicalSchool at Dallas, the Health Science Center atHouston, and M.D. Anderson Cancer Center on thelist of institutions eligible for a share of U. T.'s PUF bond proceeds.
1956 1958 1964 1965 1968 1969 1972 1973
8
1964 saw the escalation of U.S.involvement in Vietnam, which led toa protracted and very unpopularwar, especially among the nation’scollege students.
1966
After World War II,
annual mineral income
fluctuated in the range of
$25 million, until the
OPEC embargo in 1972.
With the rapid escalation
of oil prices and resulting
increase in production,
annual mineral income
soared to as high as $261
million over the next 10
years before a period of
general decline. The
impact on prices as a
result of the OPEC
embargo is shown in the
historical timeline.
I
REF. #22
TX A
&M
at
Gal
vest
on
1963

U.T. a
t Ty
ler
U.T. H
ealt
h C
ente
r a
t Ty
ler
In 1978 an Attorney Generalopinion advised that interestaccruing from the PUF underSections17 and 18 of Article 7must be used to retire outstandingbond obligations and to financepermanent improvements.
Also in 1984, voters ratified a proposal to create a constitutionally-dedicated Higher Education AssistanceFund (HEAF) similar to the PUF for 26senior institutions of higher educationwhich do not benefit from the PUF.
Constitutional amendmentadopted the “prudentperson” investment standard for the U. T.Board of Regents andeliminated all otherinvestment restrictionsfor the PUF.
Today the PUF serves more than180,000 students at 17 institutions inThe University of Texas and Texas A&MUniversity Systems. As of August 31,1997, the PUF market value was $6.4billion. However, PUF royalties from oiland gas operations have declined steadilyin recent years—from $261.9 million in1981 to $85 million in 1997—and thePUF has changed from a mineral basedfund to an investment based fund.
In 1984, a constitutionalamendment to Section 18enlarged the overall bondingcapacity of the U. T. and TexasA&M Systems to 30% of thePUF’s cost value and made all existing U. T. and Texas A&Mcomponent institutions eligibleto benefit from PUF bond proceeds.
The 1890 U.S. Census
indicated that Texas had a
population of 2.2 million.
The 1990 Census indicated
that the state’s population grew
by an additional 14.8 million
people over the ensuing 100
years. This seven-fold increase
was also reflected in increased
enrollment at U. T. and Texas
A&M System institutions.
Nationally, college attendance
jumped from 14% of the cohort
(college-age population) to
50% after World War II.
1990 1991 Today1978 1984 1988
I
U.S. and coalitionforces defeatthe Iraqi army andliberate Kuwait,thus preservingthe balance ofpower in, andensuring the freeflow of oil fromthe Persian Gulf.
FUND MARKET VALUE
The market value of the PUF’s investment (net
of distributions) grew by 20.3% during the year
to $6,368.3 million. The components of the
$1,076.2 million growth in value were contribu-
tions of $85.2 million, net realized gains of $251.0
million, and net unrealized gains of $740.0 million.
DISTRIBUTIONS TO THE AUF
As stated previously, the Constitution requires
that the dividends, interest, and other income
from PUF investments be distributed to the AUF.
During the year, cash investment income of
$265.2 million was distributed to the AUF,
representing an increase of 4.6% over the prior
year’s income distributions of $253.6 million.
When added to surface income of $5.3 million
and miscellaneous income on AUF balances,
total gross divisible AUF receipts increased by
4.6% to $270.9 million. PUF administrative
expenses during the year increased by 20% to
$10.8 million. Expenses associated with the
management of PUF Lands increased by 14.3%
from $3.5 million to $4.0 million. Investment
expenses increased by 23.6% from $5.5 million
to $6.8 million, but represented 0.12% average
PUF market value. After deducting PUF
administrative expenses, net divisible cash
basis income available for expenditure by the
U. T. System and the Texas A&M System increased
by 4.1% to $260.1 million.
9
1977
$40.00$35.00$30.00$25.00$20.00$15.00$10.00$5.00$0.00
Oct'73
Oct'74
Oct'75
Oct'76
Oct'77
Oct'78
Oct'79
April'80
Crude Oil Prices$ PER
1979
PUF INVESTMENT OBJECTIVES
The primary investment objective of the PUF is
to preserve the purchasing power of Fund assets
and annual distributions by earning an average
annual total return after inflation of 5.5% over
rolling ten-year periods or longer. The Fund’s
success in meeting its objectives depends upon
its ability to generate high returns in periods
of low inflation that will offset lower returns
generated in years when the capital markets
underperform the rate of inflation.
The secondary fund objective is to generate a
fund return in excess of the policy portfolio
benchmark over rolling five-year periods or
longer. The policy portfolio benchmark is
established by UTIMCO and is comprised of a
blend of asset class indices weighted to reflect
the asset allocation policy of a traditional
endowment fund.
INVESTMENT PERFORMANCE
Investment Per formance Against Inf lat ion Benchmarks
There are three inflation based investment
objectives for the PUF:
1) Provide the U. T. and Texas A&MSystems with a stable and predictablestream of distributions to the AUF.
2) Maintain the purchasing power ofthis distribution stream.
3) Maintain the purchasing power of the PUF’s investment assets after distributions to the AUF.
It is important to note that these objectives are
contradictory in that they require the balancing
of current distributions with growth in future
distributions. Higher rates of annual distribu-
tions require larger annual withdrawals from the
PUF, thus reducing the PUF’s ability to maintain
or grow purchasing power over time. The key to
preservation of endowment purchasing power
over the long term is to control the distribution
stream by employing a neutral distribution rate.
Control of the PUF’s distribution rate, however,
is difficult because of the legal restraints
imposed by the Texas constitution. The PUF’s
distribution stream is the PUF’s income return.
Income return is heavily influenced by market-
driven variables such as interest rates which
determine the levels of distributable interest
and dividend income.
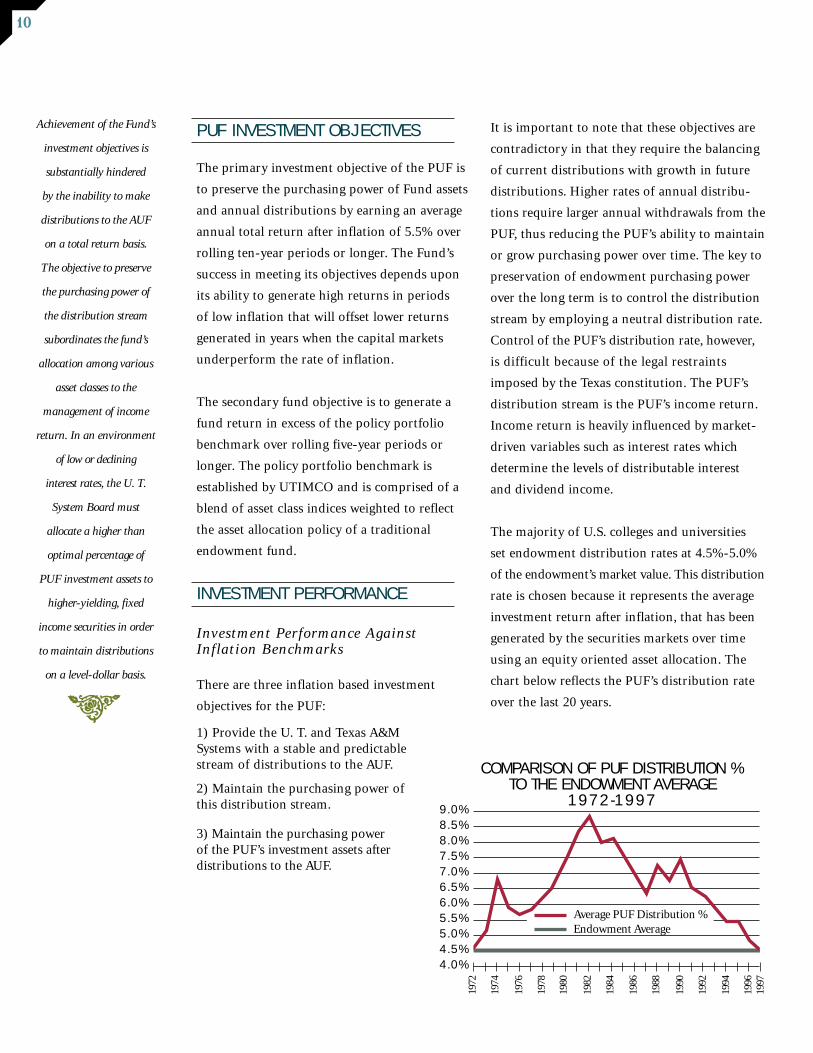
The majority of U.S. colleges and universities
set endowment distribution rates at 4.5%-5.0%
of the endowment’s market value. This distribution
rate is chosen because it represents the average
investment return after inflation, that has been
generated by the securities markets over time
using an equity oriented asset allocation. The
chart below reflects the PUF’s distribution rate
over the last 20 years.
Achievement of the Fund’s
investment objectives is
substantially hindered
by the inability to make
distributions to the AUF
on a total return basis.
The objective to preserve
the purchasing power of
the distribution stream
subordinates the fund’s
allocation among various
asset classes to the
management of income
return. In an environment
of low or declining
interest rates, the U. T.
System Board must
allocate a higher than
optimal percentage of
PUF investment assets to
higher-yielding, fixed
income securities in order
to maintain distributions
on a level-dollar basis.
1972
4.0%4.5%5.0%5.5%6.0%6.5%7.0%7.5%8.0%8.5%9.0%
COMPARISON OF PUF DISTRIBUTION % TO THE ENDOWMENT AVERAGE
1972-1997
1974
1976
1978
1980
1982
1984
1986
1988
1990
1992
1994
1996
1997
Average PUF Distribution %Endowment Average
I
10
The PUF’s investment per formanceagainst i t s inf lat ion benchmarks are as fo l lows:
PROVIDE THE U. T. AND TEXAS A&M
SYSTEMS WITH A STABLE AND PRE-
DICTABLE STREAM OF DISTRIBUTIONS
TO THE AUF
Distributions to the AUF for the fiscal year
increased by 4.6% versus distributions for the
prior fiscal year. For the preceding five-year
period, starting with the fiscal year ended
August, 1993, the rate of increase(decrease) in
annual distributions to the AUF was (2.5%),
(3.2%), 3.0%, 1.6% and 4.6%.
MAINTAIN PURCHASING POWER OF
THIS DISTRIBUTION STREAM OVER THE
LONG TERM
Distributions to the AUF of $265.2 million
for the year increased by a nominal rate of 4.6%
and increased by an inflation adjusted rate of
2.4%. The gain in purchasing power was primarily
attributable to the growth of dividends over the
prior year.
Distributable interest income from fixed income
securities, which represented approximately 70%
of total distributable income generated, declined
by 0.3% to $185.6 million. Replacement of existing
coupon rates on maturing bonds during this phase
of the interest rate cycle continues to represent
a major impediment to the preservation of the
purchasing power of annual distributions.
Dividend income from equities, on the other
hand, despite a substantially lower book yield
than fixed income investments, continued to
grow, increasing by 10.6% to $65.8 million.
Finally, distributable income from alternative
equities increased by 81.8% to $12.0 million.
During the preceding five years, annual distribu-
tions increased from $256.6 million in fiscal year
1992 to $265.2 million in fiscal year 1997, or by
3.4% in nominal terms. The cumulative rate of
inflation during this period was 14.1%, resulting
in a cumulative loss in purchasing power over
this period of 10.7%. Again, this loss in purchasing
power of annual distributions to the AUF was
attributable to the inability to replace yields on
the fixed income portfolio. Since fiscal year end
1990, the distributable (book) yield on the fixed
income portfolio has declined by approximately
18%, from 9.9% to 8.1%.
MAINTAIN THE PURCHASING POWER
OF PUF’S INVESTMENT ASSETS AFTER
DISTRIBUTIONS TO THE AUF
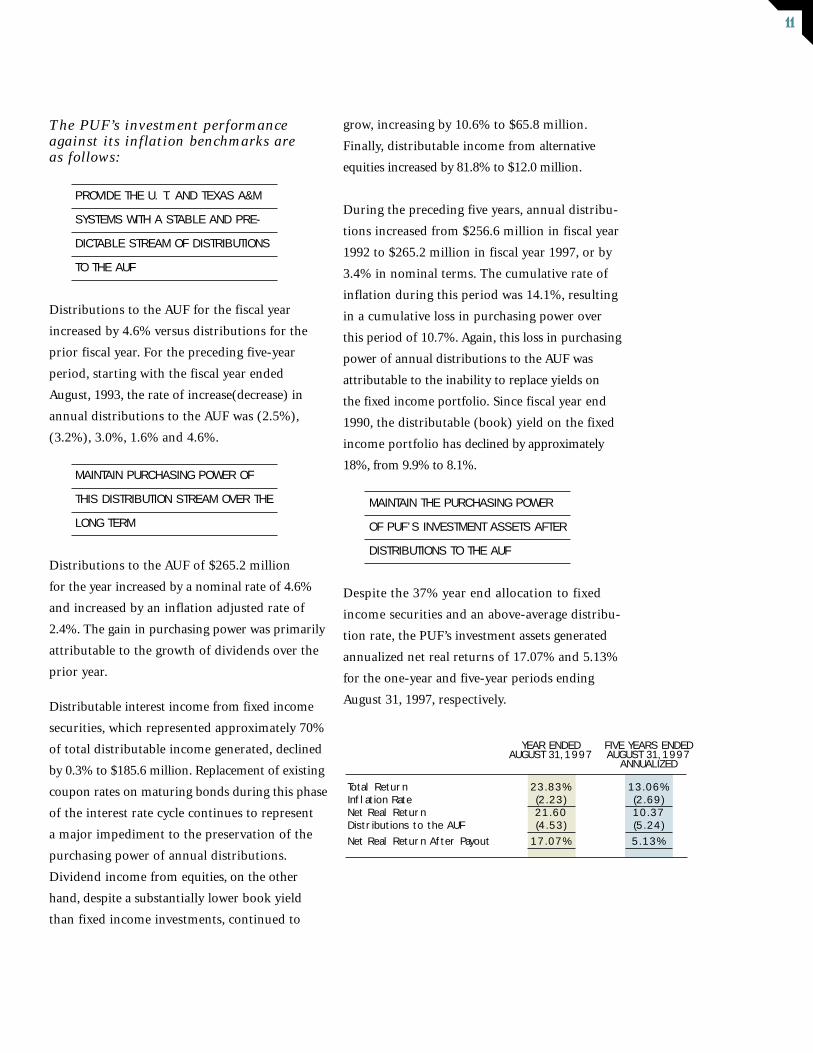
Despite the 37% year end allocation to fixed
income securities and an above-average distribu-
tion rate, the PUF’s investment assets generated
annualized net real returns of 17.07% and 5.13%
for the one-year and five-year periods ending
August 31, 1997, respectively.
YEAR ENDED FIVE YEARS ENDED AUGUST 31,1997 AUGUST 31,1997
ANNUALIZED
Total Return 23.83% 13.06%Inflation Rate (2.23) (2.69)Net Real Return 21.60 10.37Distributions to the AUF (4.53) (5.24)
Net Real Return After Payout 17.07% 5.13%
11
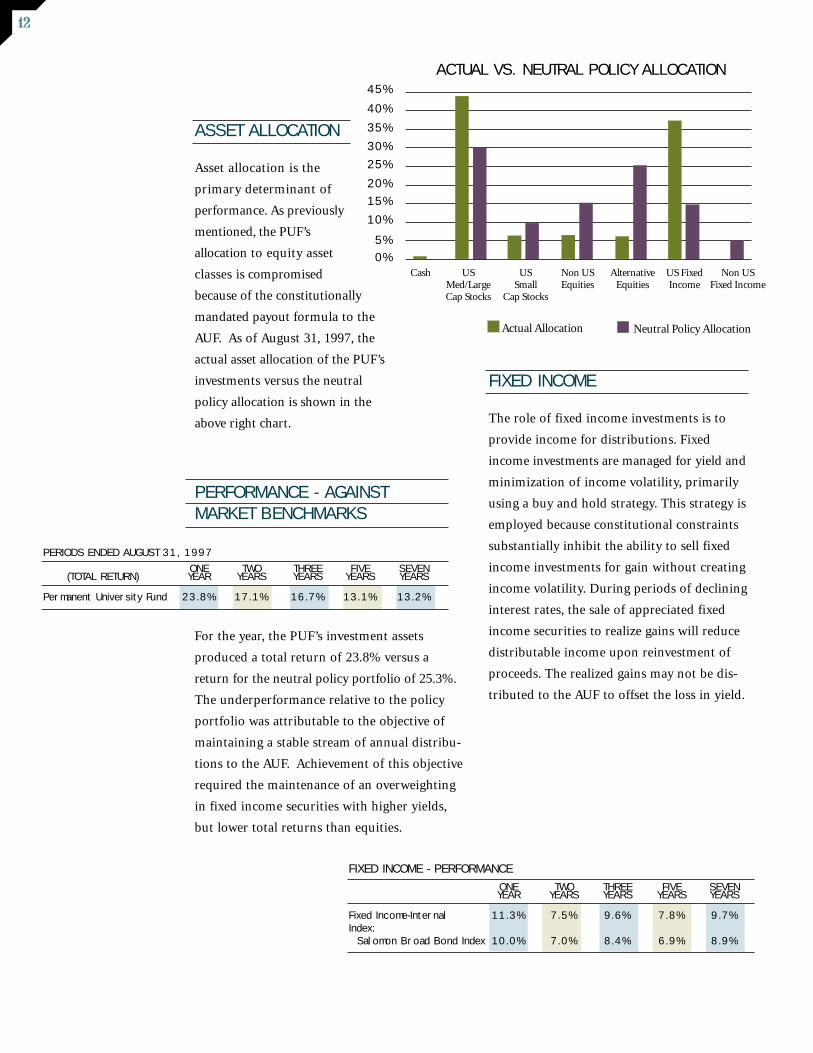
ASSET ALLOCATION
Asset allocation is the
primary determinant of
performance. As previously
mentioned, the PUF’s
allocation to equity asset
classes is compromised
because of the constitutionally
mandated payout formula to the
AUF. As of August 31, 1997, the
actual asset allocation of the PUF’s
investments versus the neutral
policy allocation is shown in the
above right chart.
PERFORMANCE - AGAINST MARKET BENCHMARKS
For the year, the PUF’s investment assets
produced a total return of 23.8% versus a
return for the neutral policy portfolio of 25.3%.
The underperformance relative to the policy
portfolio was attributable to the objective of
maintaining a stable stream of annual distribu-
tions to the AUF. Achievement of this objective
required the maintenance of an overweighting
in fixed income securities with higher yields,
but lower total returns than equities.
FIXED INCOME
The role of fixed income investments is to
provide income for distributions. Fixed
income investments are managed for yield and
minimization of income volatility, primarily
using a buy and hold strategy. This strategy is
employed because constitutional constraints
substantially inhibit the ability to sell fixed
income investments for gain without creating
income volatility. During periods of declining
interest rates, the sale of appreciated fixed
income securities to realize gains will reduce
distributable income upon reinvestment of
proceeds. The realized gains may not be dis-
tributed to the AUF to offset the loss in yield.
PERIODS ENDED AUGUST 31, 1997
ONE TWO THREE FIVE SEVEN(TOTAL RETURN) YEAR YEARS YEARS YEARS YEARS
Permanent University Fund 23.8% 17.1% 16.7% 13.1% 13.2%
FIXED INCOME - PERFORMANCE
ONE TWO THREE FIVE SEVENYEAR YEARS YEARS YEARS YEARS
Fixed Income-Internal 11.3% 7.5% 9.6% 7.8% 9.7%Index:
Salomon Broad Bond Index 10.0% 7.0% 8.4% 6.9% 8.9%
USMed/LargeCap Stocks
Cash US Small
Cap Stocks
Non USEquities
AlternativeEquities
US FixedIncome
Non US Fixed Income
0%
5%
10%
15%
20%
25%
30%
35%
ACTUAL VS. NEUTRAL POLICY ALLOCATION
Actual Allocation Neutral Policy Allocation
40%
45%
12
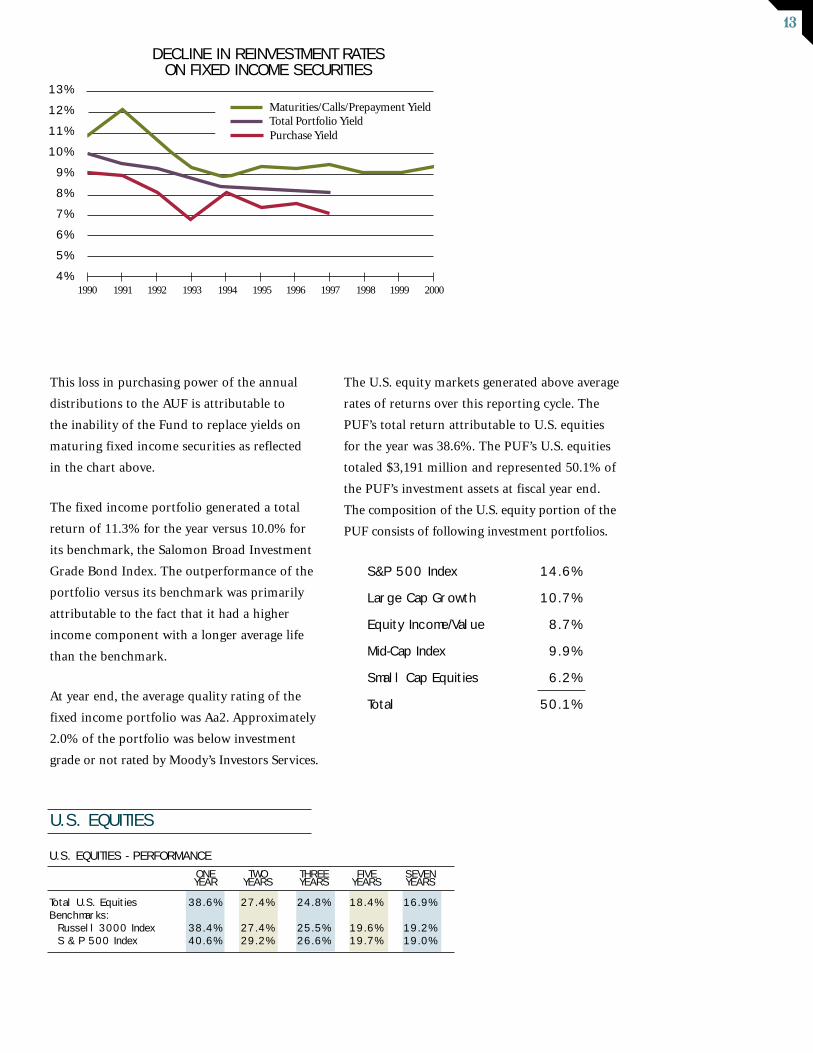
This loss in purchasing power of the annual
distributions to the AUF is attributable to
the inability of the Fund to replace yields on
maturing fixed income securities as reflected
in the chart above.
The fixed income portfolio generated a total
return of 11.3% for the year versus 10.0% for
its benchmark, the Salomon Broad Investment
Grade Bond Index. The outperformance of the
portfolio versus its benchmark was primarily
attributable to the fact that it had a higher
income component with a longer average life
than the benchmark.
At year end, the average quality rating of the
fixed income portfolio was Aa2. Approximately
2.0% of the portfolio was below investment
grade or not rated by Moody’s Investors Services.
U.S. EQUITIES
The U.S. equity markets generated above average
rates of returns over this reporting cycle. The
PUF’s total return attributable to U.S. equities
for the year was 38.6%. The PUF’s U.S. equities
totaled $3,191 million and represented 50.1% of
the PUF’s investment assets at fiscal year end.
The composition of the U.S. equity portion of the
PUF consists of following investment portfolios.
1990 1991 19931992 1994 1995 1996
13%
12%
11%
10%
9%
8%
7%
6%
5%
4%
DECLINE IN REINVESTMENT RATES ON FIXED INCOME SECURITIES
1997 1998 1999 2000
Total Portfolio YieldMaturities/Calls/Prepayment Yield
Purchase Yield
S&P 500 Index 14.6%
Large Cap Growth 10.7%
Equity Income/Value 8.7%
Mid-Cap Index 9.9%
Small Cap Equities 6.2%
Total 50.1%
U.S. EQUITIES - PERFORMANCE
ONE TWO THREE FIVE SEVENYEAR YEARS YEARS YEARS YEARS
Total U.S. Equities 38.6% 27.4% 24.8% 18.4% 16.9%Benchmarks:
Russell 3000 Index 38.4% 27.4% 25.5% 19.6% 19.2%S & P 500 Index 40.6% 29.2% 26.6% 19.7% 19.0%
13

14
NON-U.S.EQUITIES - PERFORMANCE
Non-U.S. equities also performed well over
this reporting cycle. The PUF’s total return
attributable to non-U.S. equities for the year
was 12.6%. The PUF’s non-U.S. equities totaled
$413.6 million and represented 6.5% of the
PUF’s investment assets at fiscal year end.
ALTERNATIVE EQUITIES -
PERFORMANCE
The alternative equities portfolio return reflects
the large amount of capital invested in this asset
class during the year. As explained in the following
paragraph it takes several years before the alter-
native equity portfolio will realize returns from
new investments. The PUF’s alternative equities
totaled $386.7 million and represented 6.1% of
the PUF’s investment assets at fiscal year end.
Alternative equities consist of illiquid investments
held directly or through limited partnerships.
They include private equity, leveraged and
buy-out mezzanine debt, oil and gas, and
venture capital investments that are privately
held and not traded on public exchanges.
These investments require a commitment of
capital for extended periods of time with no
liquidity. The advantage of alternative assets is
that they offer higher long term returns
through investment in inefficient and complex
markets. They also offer lower correlation of
returns with traditional equities and reduced
volatility of PUF’s investment market values.
The disadvantage of this asset class is that it
is illiquid, requires higher and more complex
fees and is dependent upon the quality of
external managers.Y
NON-U.S. EQUITIES - PERFORMANCE
ONE TWO THREE FIVE SEVENYEAR YEARS YEARS YEARS YEARS
Non-U.S. Equities 12.6% 11.1% 7.4% N/A N/ABenchmark:
Financial Times Actuaries 9.1% 8.7% 5.7% 10.7% 7.6%World Index (excluding U.S.)
ALTERNATIVE EQUITIES - PERFORMANCE
ONE TWO THREE FIVE SEVENYEAR YEARS YEARS YEARS YEARS
Total Alternative Equities 17.2% 21.5% 22.2% 23.9% 16.1%S&P 500 Index +5% 45.6% 34.2% 31.6% 24.7% 24.0%
15
BOARD OF REGENTS
O F F I C E R S
Donald L. Evans, Chairman
Tom Loeffler, Vice-Chairman
Rita C. Clements, Vice-Chairman
Arthur H. Dilly, Executive Secretary
M E M B E R S
Te r m s E x p i r e F e b r u a r y 1 , 1 9 9 9
Thomas O. Hicks Dallas
Lowell H. Lebermann, Jr. Austin
Martha E. Smiley Austin
Te r m s E x p i r e F e b r u a r y 1 , 2 0 0 1
Rita C. Clements Dallas
Donald L. Evans Midland
Tom Loeffler San Antonio
Te r m s E x p i r e F e b r u a r y 1 , 2 0 0 3
Patrick C. Oxford Houston
A. W. “Dub” Riter, Jr. Tyler
A. R. (Tony) Sanchez, Jr. Laredo
SYSTEM ADMINISTRATION
William H. Cunningham, Chancellor
James P. Duncan, Executive Vice Chancellor
for Academic Affairs
Charles B. Mullins, M.D., Executive Vice Chancellor for Health Affairs
R. D. (Dan) Burck, Executive Vice Chancellor for Business Affairs
Ray Farabee, Vice Chancellor and General Counsel
Michael D. Millsap, Vice Chancellor forGovernmental Relations
Shirley Bird Perry, Vice Chancellor forDevelopment and External Relations
Mario J. Gonzalez, Vice Chancellor forTelecommunications and Information Technology
UNIVERSITY LANDS –
WEST TEXAS OPERATIONS
Stephen Hartmann, Executive Director
Bryce C. Bales, Manager, University Lands Accounting Office
James L. Benson, Manager of Surface Interests
Wallace V. Gravitt, Manager of University Lands-Oil, Gas and Mineral Interests
T h e U n i v e r s i t y o f T e x a s S y s t e m
EXECUTIVE OFFICERS
Thomas O. Hicks, Chairman
Thomas G. Ricks, President and Chief Executive Officer
Austin M. Long, III, Managing Director-Private Markets
David H. Russ, Managing Director-Public Markets
Robert W. Holland, Vice President
Cathy A. Iberg, Vice President
Jerry E. Turner, Secretary
LEGAL COUNSEL
Vinson & Elkins, LLP, Austin, Texas
INDEPENDENT AUDITORS
Deloitte & Touche, LLP, Houston, Texas
T h e U n i v e r s i t y o f T e x a s I n v e s t m e n t M a n a g e m e n t C o m p a n y
16
BOARD OF DIRECTORS
THOMAS O. HICKSChairman of the Board and Chief Executive Officer,
Hicks, Muse, Tate & Furst Incorporated
Chairman of the Board, The University ofTexas Investment Management Company
Regent, The University of Texas System
Chairman of the Board and Owner,Dallas Stars Hockey Club
Chairman of the Board, Chancellor Media Corporation
Director, Berg Electronics, Inc.
Director, Olympus Real Estate Corporation
Director, Stratford Capital Partners
Director, Sybron International Corporation
Director, Capstar Broadcasting Corporation
Director, International Home Foods
Director, MVS Corporation
Director, CorpGroup Limited
Director, CCI Holdings
ROBERT H. ALLENRegent, The Texas A&M University System
Managing Partner, Challenge Investment Partners
Director, Federal Express Corporation
Director, GeoQuest International Holdings, Inc.
Director, Nuevo Energy Company
Director, Gulf Canada Resources, Ltd.
Trustee, Baylor College of Medicine
Director, Gulf Indonesia Resources, Ltd.
SUSAN M. BYRNEFounder, President and Chief Executive Officer,
Westwood Management Corporation
President, Westwood Funds
Director, Southwest Securities Group
Director, Dallas Forum
Director, Dallas Theater Center
Director, International Theatrical Arts Society
Director, The Dallas Institute
WILLIAM H. CUNNINGHAMChancellor, The University of Texas System
Director, La Quinta Motor Inns
Director, John Hancock Funds
Director, Jefferson-Pilot Corporation
RICHARD W. FISHERManaging Partner, Fisher Capital
Management and Fisher Ewing Partners
Chairman, FS3, Incorporated
Director, The U.S. Russia Investment Fund
Director, Kennedy School of Government,Harvard University
Adjunct Professor, LBJ School of Public Policy,University of Texas at Austin
J. LUTHER KING, JR.Principal, Luther King Capital Management
Owner and Director, 4K Land and Cattle Company
Co-Owner, Reyrosa Ranch
Trustee, Texas Christian University
Director, Texas and Southwestern Cattle Raisers Foundation
Director, Nature Conservancy of Texas
Director, Cross Timbers Oil Company
Director, several privately held companies
Member, Advisory Committee to Trustees of the Employees Retirement System of Texas
Member, Board of Governors, Investment Counsel Association of America
TOM LOEFFLERVice-Chairman, Regent, The University of Texas System
Partner, Arter and Hadden
Director, Billing Information Concepts Corporation
Director, Boone and Crockett Club
Director, Introgen Therapeutics, Inc.
HOMER L. LUTHER, JR.Principal, Homer Luther Interests
Member, College of Business Administration Foundation Advisory Council at The University of Texas
Director, Mesa Verde Foundation
Director, The Yellowstone Park Foundation
Trustee Emeritus, National Park Foundation
Chairman Emeritus, Board of Trustees ofThe National Outdoor Leadership School
A. W. “DUB” RITER, JR.Regent, The University of Texas System
Director, TCA Cable TV, Inc.
Managing Partner, Pinstripe Investments
Director, Texas Taxpayers and Research Association
Member, Governor’s Business Council
Member, Executive Committee of the Chancellor’s Council for The University of Texas System
Chairman, The University of Texas Health Center at Tyler Development Board
President, The University of Texas at Tyler Educational Foundation, Inc.
Chairman & President, Texas Chest Foundation
T h e U n i v e r s i t y o f T e x a s I n v e s t m e n t M a n a g e m e n t C o m p a n y
PERMANENT UNIVERSITY FUND
F i n a n c i a l S t a t e m e n t s Y e a r E n d e d A u g u s t 3 1 , 1 9 9 7
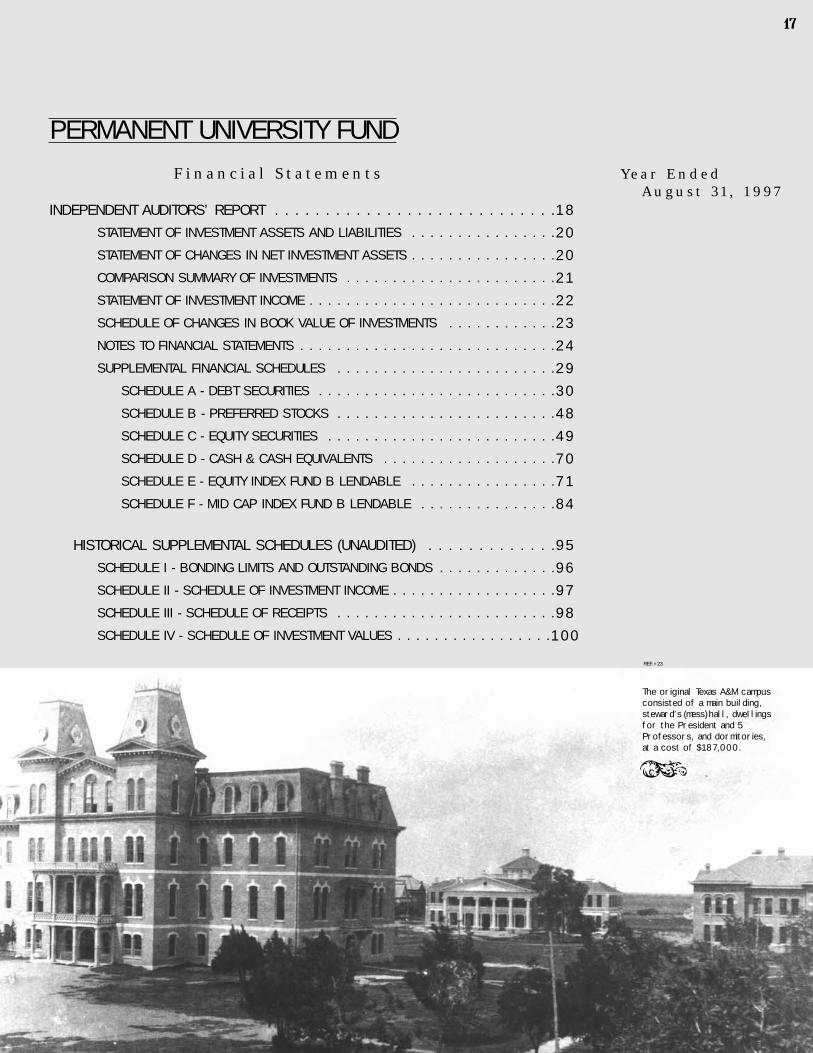
The original Texas A&M campusconsisted of a main building,steward’s (mess)hall, dwellingsfor the President and 5Professors, and dormitories, at a cost of $187,000.
Y
INDEPENDENT AUDITORS’ REPORT . . . . . . . . . . . . . . . . . . . . . . . . . . . .18
STATEMENT OF INVESTMENT ASSETS AND LIABILITIES . . . . . . . . . . . . . . . .20
STATEMENT OF CHANGES IN NET INVESTMENT ASSETS . . . . . . . . . . . . . . . .20
COMPARISON SUMMARY OF INVESTMENTS . . . . . . . . . . . . . . . . . . . . . . .21
STATEMENT OF INVESTMENT INCOME . . . . . . . . . . . . . . . . . . . . . . . . . . .22
SCHEDULE OF CHANGES IN BOOK VALUE OF INVESTMENTS . . . . . . . . . . . .23
NOTES TO FINANCIAL STATEMENTS . . . . . . . . . . . . . . . . . . . . . . . . . . . .24
SUPPLEMENTAL FINANCIAL SCHEDULES . . . . . . . . . . . . . . . . . . . . . . . .29
SCHEDULE A - DEBT SECURITIES . . . . . . . . . . . . . . . . . . . . . . . . . .30
SCHEDULE B - PREFERRED STOCKS . . . . . . . . . . . . . . . . . . . . . . . .48
SCHEDULE C - EQUITY SECURITIES . . . . . . . . . . . . . . . . . . . . . . . . .49
SCHEDULE D - CASH & CASH EQUIVALENTS . . . . . . . . . . . . . . . . . . .70
SCHEDULE E - EQUITY INDEX FUND B LENDABLE . . . . . . . . . . . . . . . .71
SCHEDULE F - MID CAP INDEX FUND B LENDABLE . . . . . . . . . . . . . . .84
HISTORICAL SUPPLEMENTAL SCHEDULES (UNAUDITED) . . . . . . . . . . . . .95
SCHEDULE I - BONDING LIMITS AND OUTSTANDING BONDS . . . . . . . . . . . . .96
SCHEDULE II - SCHEDULE OF INVESTMENT INCOME . . . . . . . . . . . . . . . . . .97
SCHEDULE III - SCHEDULE OF RECEIPTS . . . . . . . . . . . . . . . . . . . . . . . .98
SCHEDULE IV - SCHEDULE OF INVESTMENT VALUES . . . . . . . . . . . . . . . . .100
17
REF. #23

INDEPENDENT AUDITORS’ REPORT
The Board of DirectorsThe University of Texas Investment Management CompanyAustin, Texas
We have audited the accompanying statement of investment assets and liabilities of the PermanentUniversity Fund (the “Fund”) as of August 31, 1997, the comparison summary of investments as of August 31, 1997 and 1996, and the related statement of investment income (accrual basis and cashbasis), the statement of changes in net investment assets and the schedule of changes in book value ofinvestments for the year ended August 31, 1997. These financial statements are the responsibility of theFund’s management. Our responsibility is to express an opinion on these financial statements based on our audit.
We conducted our audits in accordance with generally accepted auditing standards. Those standardsrequire that we plan and perform the audit to obtain reasonable assurance about whether the financialstatements are free of material misstatement. An audit includes examining, on a test basis, evidence supporting the amounts and disclosures in the financial statements. Our procedures included confirmation of securities owned as of August 31, 1997, by correspondence with the custodian. An auditalso includes assessing the accounting principles used and significant estimates made by management, aswell as evaluating the overall financial statement presentation. We believe that our audits provide a reasonable basis for our opinion.
As described in Note 1 to the financial statements, the statement of investment income (cash basis) was prepared on the cash basis of accounting, which is a comprehensive basis of accounting other thangenerally accepted accounting principles. This financial statement has been prepared for the purpose ofpresenting the amount of investment income distributed to the Available University Fund (AUF) duringthe year. Cash basis income is required to be distributed to the AUF in compliance with Section 66.02 ofthe Texas Education Code. This statement is not intended to be a complete presentation of the Fund’sresults of operations.
In our opinion, the statement of investment assets and liabilities, the comparison summary of invest-ments, the statement of investment income (accrual basis), the statement of changes in net investmentassets and the schedule of changes in book value of investments referred to above present fairly, in allmaterial respects, the financial position of the Fund as of August 31, 1997, the comparative investmentsas of August 31, 1997 and 1996, and the results of its operations, the changes in its net investment assets,and the changes in book value of its investments for the year ended August 31, 1997, in conformity withgenerally accepted accounting principles.
Suite 2300333 Clay StreetHouston, Texas 77002-4196
Telephone: (713) 756-2000Facsimile: (713) 756-2001
Deloitte ToucheTohmatsuInternational
18
Also, in our opinion, the statement of investment income (cash basis) referred to above presents fairly, inall material respects, the investment income of the Fund for the year ended August 31, 1997, on the cashbasis of accounting.
The financial statements referred to above include only the investment balances and investment incomerelated to the investments of the Fund which are managed by The University of Texas InvestmentManagement Company. The Fund’s asset balances related to the Fund’s 2.1 million acres of West Texasland are not included in this report.
Our audit of the financial statements was conducted for the purpose of forming an opinion on such statements taken as a whole. The supplemental financial schedules listed in the table of contents are presented for purposes of additional analysis and are not a required part of the financial statements of theFund. These schedules are also the responsibility of the Fund’s management. Such additional scheduleshave been subjected to the accounting procedures applied in our audit of the financial statements and,in our opinion, are fairly stated, in all material respects, when considered in relation to the financial statements taken as a whole.
October 31, 1997
19
20
The accompanying notes are an integral part of these financial statements.
PERMANENT UNIVERSITY FUND
Financial Statements
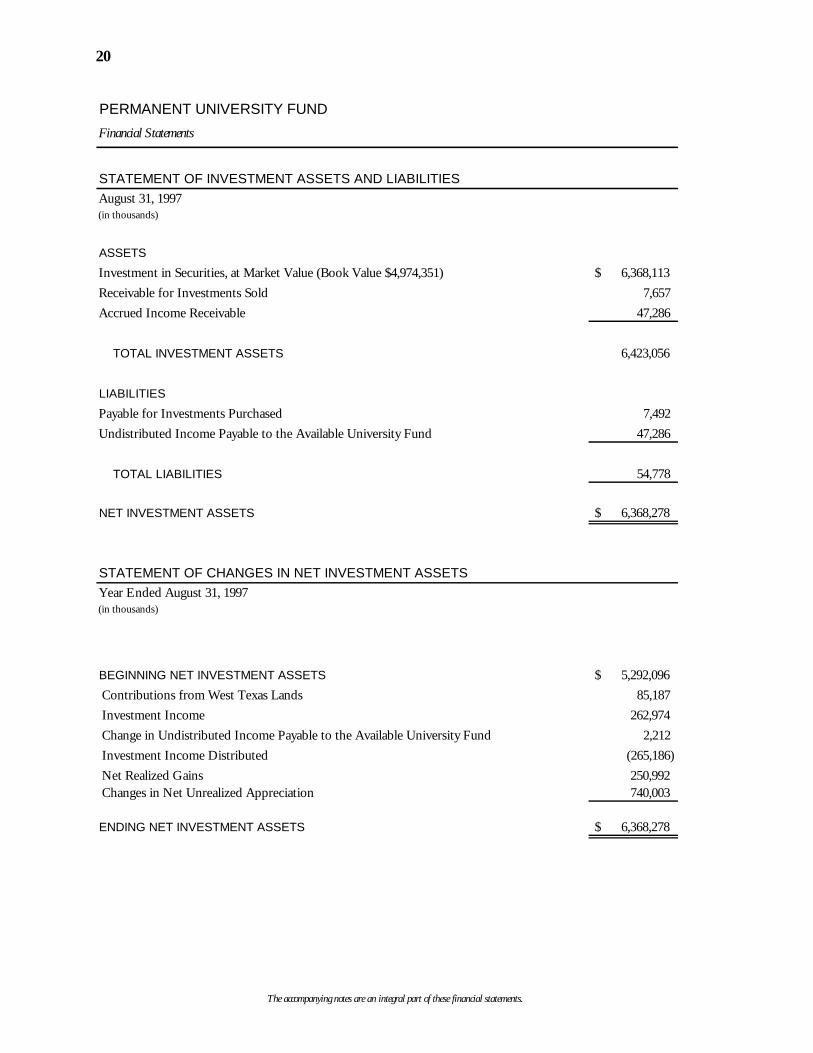
STATEMENT OF INVESTMENT ASSETS AND LIABILITIESAugust 31, 1997(in thousands)
ASSETS
Investment in Securities, at Market Value (Book Value $4,974,351) 6,368,113$ Receivable for Investments Sold 7,657 Accrued Income Receivable 47,286
TOTAL INVESTMENT ASSETS 6,423,056
LIABILITIES
Payable for Investments Purchased 7,492 Undistributed Income Payable to the Available University Fund 47,286
TOTAL LIABILITIES 54,778
NET INVESTMENT ASSETS 6,368,278$
STATEMENT OF CHANGES IN NET INVESTMENT ASSETSYear Ended August 31, 1997(in thousands)
BEGINNING NET INVESTMENT ASSETS 5,292,096$ Contributions from West Texas Lands 85,187 Investment Income 262,974 Change in Undistributed Income Payable to the Available University Fund 2,212 Investment Income Distributed (265,186) Net Realized Gains 250,992 Changes in Net Unrealized Appreciation 740,003
ENDING NET INVESTMENT ASSETS 6,368,278$
21
The accompanying notes are an integral part of these financial statements.
PERMANENT UNIVERSITY FUNDFinancial Statements
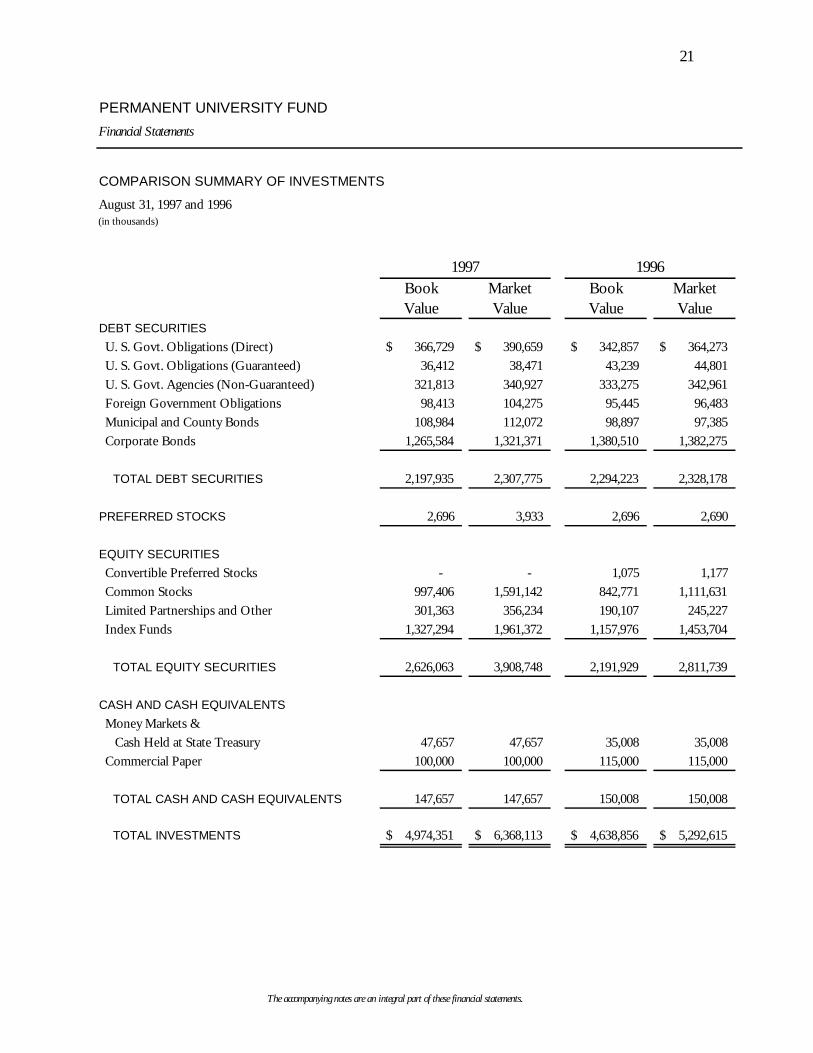
COMPARISON SUMMARY OF INVESTMENTS
August 31, 1997 and 1996(in thousands)
1997 1996Book Market Book MarketValue Value Value Value
DEBT SECURITIES U. S. Govt. Obligations (Direct) 366,729$ 390,659$ 342,857$ 364,273$ U. S. Govt. Obligations (Guaranteed) 36,412 38,471 43,239 44,801 U. S. Govt. Agencies (Non-Guaranteed) 321,813 340,927 333,275 342,961 Foreign Government Obligations 98,413 104,275 95,445 96,483 Municipal and County Bonds 108,984 112,072 98,897 97,385 Corporate Bonds 1,265,584 1,321,371 1,380,510 1,382,275
TOTAL DEBT SECURITIES 2,197,935 2,307,775 2,294,223 2,328,178
PREFERRED STOCKS 2,696 3,933 2,696 2,690
EQUITY SECURITIES Convertible Preferred Stocks - - 1,075 1,177 Common Stocks 997,406 1,591,142 842,771 1,111,631 Limited Partnerships and Other 301,363 356,234 190,107 245,227 Index Funds 1,327,294 1,961,372 1,157,976 1,453,704
TOTAL EQUITY SECURITIES 2,626,063 3,908,748 2,191,929 2,811,739
CASH AND CASH EQUIVALENTS Money Markets & Cash Held at State Treasury 47,657 47,657 35,008 35,008 Commercial Paper 100,000 100,000 115,000 115,000
TOTAL CASH AND CASH EQUIVALENTS 147,657 147,657 150,008 150,008
TOTAL INVESTMENTS 4,974,351$ 6,368,113$ 4,638,856$ 5,292,615$
22
The accompanying notes are an integral part of these financial statements.
PERMANENT UNIVERSITY FUNDFinancial Statements
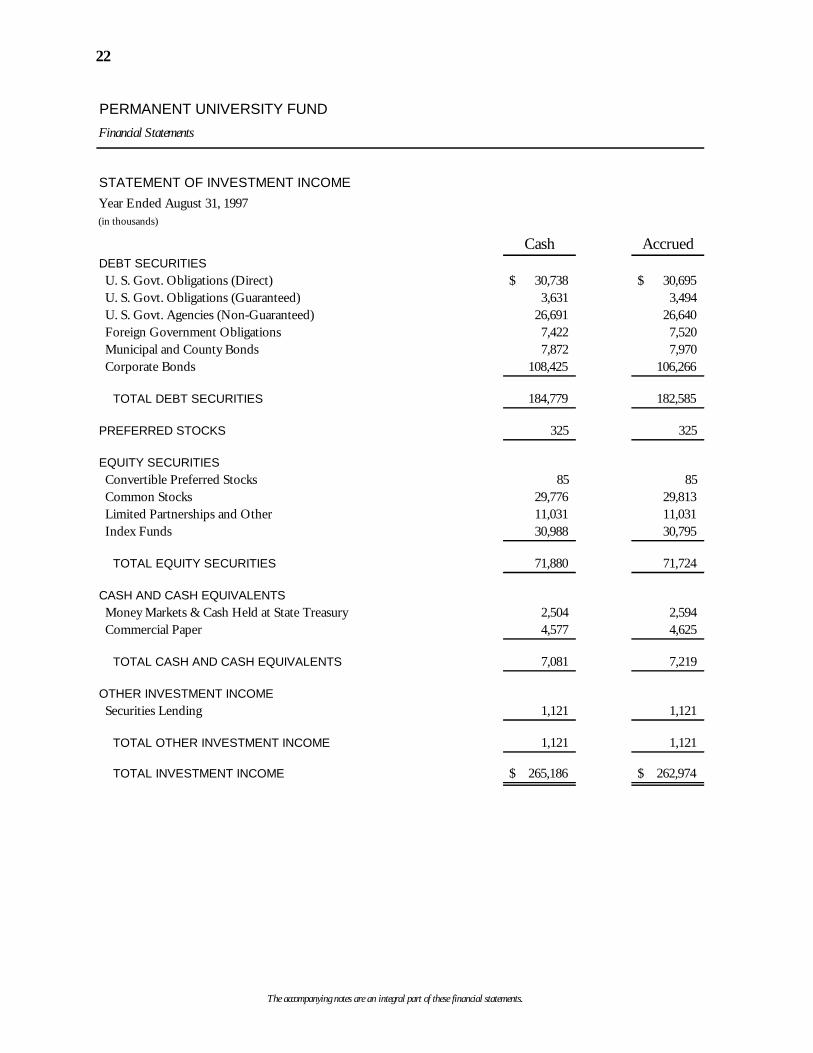
STATEMENT OF INVESTMENT INCOMEYear Ended August 31, 1997(in thousands)
Cash AccruedDEBT SECURITIES U. S. Govt. Obligations (Direct) 30,738$ 30,695$ U. S. Govt. Obligations (Guaranteed) 3,631 3,494 U. S. Govt. Agencies (Non-Guaranteed) 26,691 26,640 Foreign Government Obligations 7,422 7,520 Municipal and County Bonds 7,872 7,970 Corporate Bonds 108,425 106,266
TOTAL DEBT SECURITIES 184,779 182,585
PREFERRED STOCKS 325 325
EQUITY SECURITIES Convertible Preferred Stocks 85 85 Common Stocks 29,776 29,813 Limited Partnerships and Other 11,031 11,031 Index Funds 30,988 30,795
TOTAL EQUITY SECURITIES 71,880 71,724
CASH AND CASH EQUIVALENTS Money Markets & Cash Held at State Treasury 2,504 2,594 Commercial Paper 4,577 4,625
TOTAL CASH AND CASH EQUIVALENTS 7,081 7,219
OTHER INVESTMENT INCOME Securities Lending 1,121 1,121
TOTAL OTHER INVESTMENT INCOME 1,121 1,121
TOTAL INVESTMENT INCOME 265,186$ 262,974$
23
The accompanying notes are an integral part of these financial statements.
PERMANENT UNIVERSITY FUNDFinancial Statements
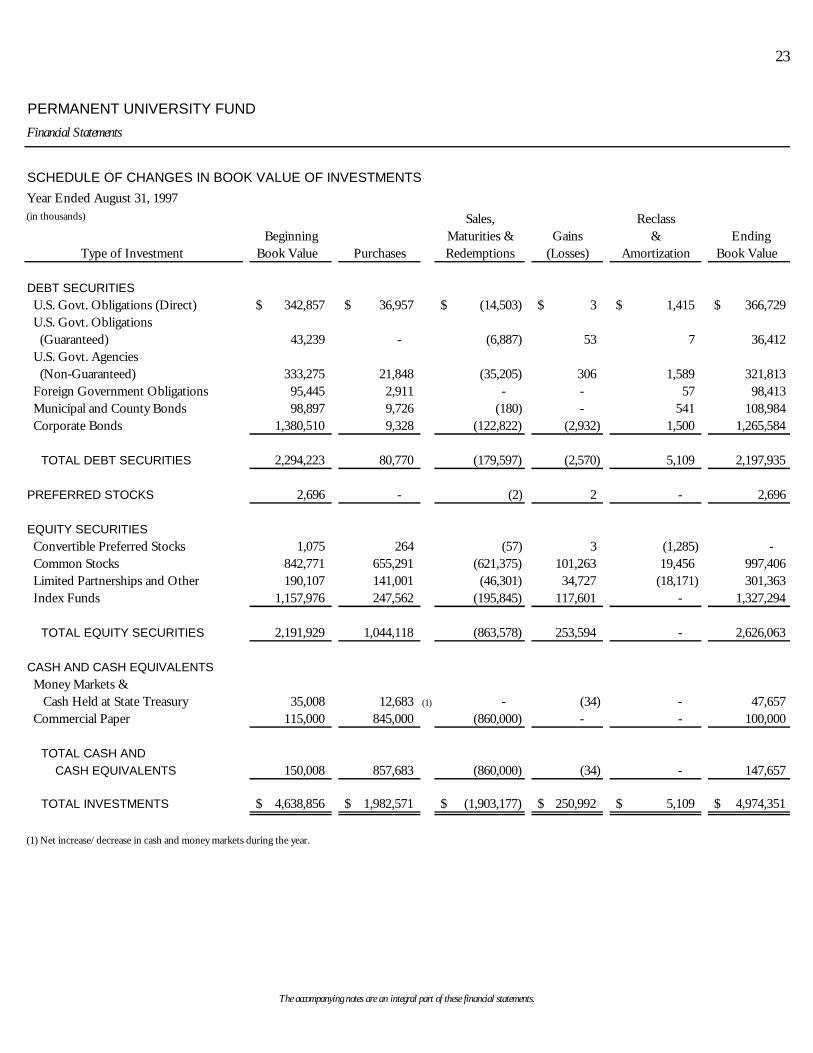
SCHEDULE OF CHANGES IN BOOK VALUE OF INVESTMENTSYear Ended August 31, 1997(in thousands) Sales, Reclass
Beginning Maturities & Gains & EndingType of Investment Book Value Purchases Redemptions (Losses) Amortization Book Value
DEBT SECURITIES U.S. Govt. Obligations (Direct) 342,857$ 36,957$ (14,503)$ 3$ 1,415$ 366,729$ U.S. Govt. Obligations (Guaranteed) 43,239 - (6,887) 53 7 36,412 U.S. Govt. Agencies (Non-Guaranteed) 333,275 21,848 (35,205) 306 1,589 321,813 Foreign Government Obligations 95,445 2,911 - - 57 98,413 Municipal and County Bonds 98,897 9,726 (180) - 541 108,984 Corporate Bonds 1,380,510 9,328 (122,822) (2,932) 1,500 1,265,584
TOTAL DEBT SECURITIES 2,294,223 80,770 (179,597) (2,570) 5,109 2,197,935
PREFERRED STOCKS 2,696 - (2) 2 - 2,696
EQUITY SECURITIES Convertible Preferred Stocks 1,075 264 (57) 3 (1,285) - Common Stocks 842,771 655,291 (621,375) 101,263 19,456 997,406 Limited Partnerships and Other 190,107 141,001 (46,301) 34,727 (18,171) 301,363 Index Funds 1,157,976 247,562 (195,845) 117,601 - 1,327,294
TOTAL EQUITY SECURITIES 2,191,929 1,044,118 (863,578) 253,594 - 2,626,063
CASH AND CASH EQUIVALENTS Money Markets & Cash Held at State Treasury 35,008 12,683 (1) - (34) - 47,657 Commercial Paper 115,000 845,000 (860,000) - - 100,000
TOTAL CASH AND CASH EQUIVALENTS 150,008 857,683 (860,000) (34) - 147,657
TOTAL INVESTMENTS 4,638,856$ 1,982,571$ (1,903,177)$ 250,992$ 5,109$ 4,974,351$
(1) Net increase/decrease in cash and money markets during the year.
24PERMANENT UNIVERSITY FUNDNotes to Financial Statements (cont.)
NOTE 1 - ORGANIZATION
(A) The Permanent University Fund (“PUF”) is a public endowment contributing to the support ofeligible institutions of The University of Texas System (“U. T. System”) and the Texas A&M UniversitySystem (“TAMU System”). The PUF was established in the Texas Constitution of 1876 through theappropriation of land grants previously given to the University of Texas plus one million acres. Additional land grants to the PUF were completed in 1883 with the contribution of another one millionacres. Today the PUF contains 2,109,190 acres located in 24 counties primarily in West Texas.
The PUF’s 2.1 million acres of West Texas land produce two streams of income: mineral and surface. Mineral income is retained forever as part of the PUF; however, surface income is distributed to theAvailable University Fund (“AUF”). Funds held in the PUF are invested primarily in corporate andgovernment securities.
The investments of the PUF are managed by The University of Texas Investment Management Company(“UTIMCO”), the successor as of March 1, 1996 to The University of Texas System Office of AssetManagement. Investment management fees are charged directly to the AUF.
The accompanying financial statements and schedules include only the investment balances andinvestment income related to the investments of the PUF which are managed by UTIMCO. The PUF’sasset balances related to the PUF’s 2.1 million acres of West Texas land are not included in this report.
(B) The constitutional provisions governing the PUF prohibits the expenditure of corpus andconsequently gains and losses on sales of securities remain in the PUF. Conversely, the Constitution ofTexas mandates that all dividend and interest income be distributed to the AUF to meet the extensiverequirements of the students in the TAMU and UT Systems.
(C) The audited financial statements and schedules have been prepared for the purpose of complyingwith the reporting requirements of Section 66.05 and 66.08(f) of the Texas Education Code and for thepurpose of presenting the statement of investment income (cash basis). Cash basis income is required tobe distributed to the AUF in compliance with Section 66.02 of the Texas Education Code. Section 66.02of the Texas Education Code was amended to require the distribution of earnings to the AUF on anaccrual basis of accounting effective for fiscal year beginning September 1, 1997.
NOTE 2 - SIGNIFICANT ACCOUNTING POLICIES
(A) Cash and Cash Equivalents - Cash and cash equivalents consist of cash held at the State Treasury,commercial paper and money market instruments.
25PERMANENT UNIVERSITY FUNDNotes to Financial Statements (cont.)
(B) Security Valuation - Investments are primarily valued on the basis of market valuations provided byindependent pricing services.
Fixed income securities directly held are valued based upon prices supplied by Merrill Lynch SecuritiesPricing Service and other major fixed income pricing services, external broker quotes and internalmatrices.
Equity investment market values are based on the New York Stock Exchange Composite closing prices, ifavailable. If not available, the market value is based on the closing price on the primary exchange onwhich the security is traded (if a closing price is not available, the average of the last reported bid and askprice is used).
Limited partnerships and other are valued based on a fair valuation determined as specified by policiesestablished by the UTIMCO Board of Directors.
Securities held in index funds are generally valued as follows:
Stocks traded on security exchanges are valued at closing market prices on thevaluation date.Stocks traded on the over-the-counter market are valued at the last reported bid price,except for National Market System OTC stocks which are valued at their closingmarket prices.Fixed income securities are valued based upon bid quotations obtained from majormarket makers or security exchanges.
(C) Foreign Currency Translation - The accounting records of the PUF are maintained in U.S. dollars.Purchases and sales of securities of foreign entities and the related income receipts are translated into U.S.dollars at the exchange rate on the dates of the transactions.
Investment income includes net realized and unrealized currency gains and losses recognized betweenaccrual and payment dates.
(D) Investment Income - Interest income is accrued as earned. Dividend income is recorded on the ex-dividend date. Dividend and interest income is recorded net of foreign taxes where recovery of suchtaxes is not assured. Bonds are amortized over the life of the security using the interest method, which isa method of amortizing discounts or premiums that result in constant rates of interest. Distributions ofincome to the AUF are on a cash basis as provided by state statute. Distributions of income to the AUFwill be based on an accrual basis of acounting as provided by a statutory amendment effective September1, 1997.
(E) Security Transactions - Security transactions are accounted for on a trade date basis for mostsecurities. Index fund transactions are recorded on a settle date basis due to trading practices whichimpose restrictions in acquiring per unit information on trade date. Gains and losses on securities sold
27PERMANENT UNIVERSITY FUNDNotes to Financial Statements (cont.)
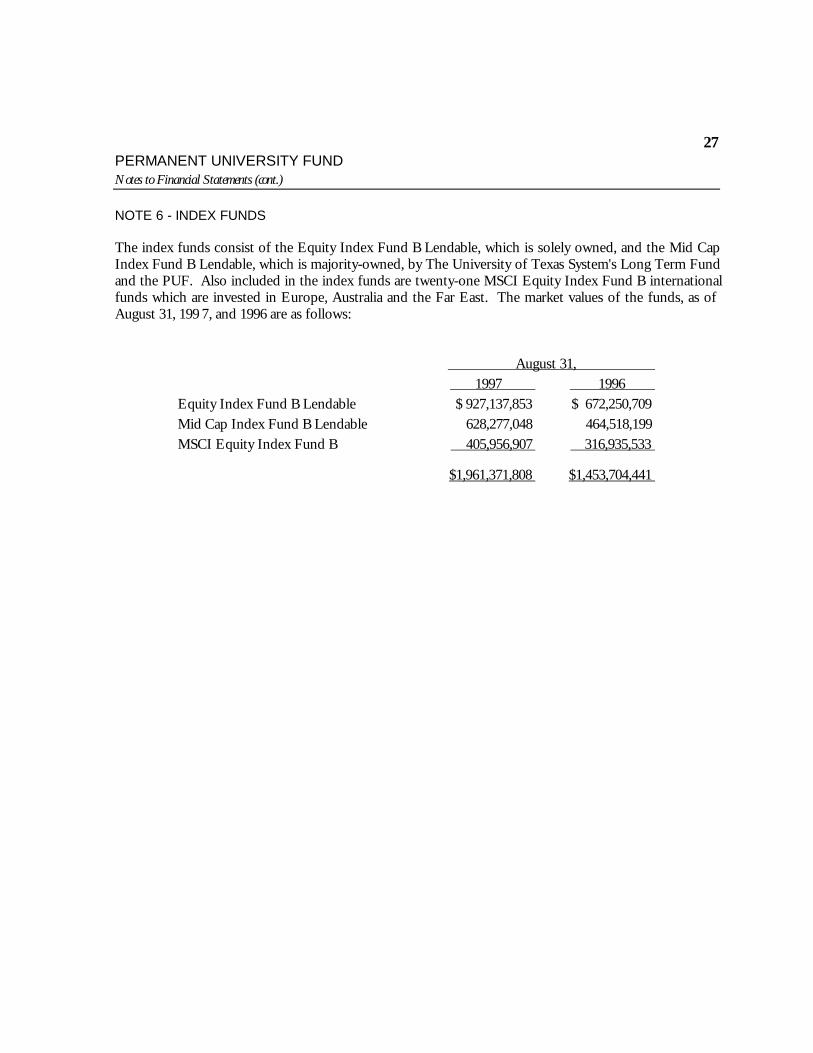
NOTE 6 - INDEX FUNDS
The index funds consist of the Equity Index Fund B Lendable, which is solely owned, and the Mid CapIndex Fund B Lendable, which is majority-owned, by The University of Texas System's Long Term Fundand the PUF. Also included in the index funds are twenty-one MSCI Equity Index Fund B internationalfunds which are invested in Europe, Australia and the Far East. The market values of the funds, as ofAugust 31, 199 7, and 1996 are as follows:
August 31, 1997 1996
Equity Index Fund B Lendable $ 927,137,853 $ 672,250,709Mid Cap Index Fund B Lendable 628,277,048 464,518,199MSCI Equity Index Fund B 405,956,907
316,935,533
$1,961,371,808 $1,453,704,441
26PERMANENT UNIVERSITY FUNDNotes to Financial Statements (cont.)
are determined on the basis of average cost. A loss is recognized if there is an impairment in the value ofthe security that is determined to be other than temporary.
(F) Use of Estimates - The preparation of financial statements in conformity with generally acceptedaccounting principles requires management to make estimates and assumptions that affect the reportedamounts of assets and liabilities and disclosure of contingent assets and liabilities at the date of thefinancial statements and the reported amounts of revenues and expenses during the reporting period. Actual results could differ from these estimates.
NOTE 3 - INVESTMENT ACTIVITY
During the year ended August 31, 199 7, the cost of purchases and proceeds from sales and maturities ofinvestments (excluding cash and cash equivalents) were $1,124,888,097 and $1,043,177,288 , respectively. Such transactions were made at current market prices on the dates of the transactions.
NOTE 4 - SECURITIES LENDING
The PUF loaned securities to certain brokers who paid the PUF negotiated lenders' fees. These fees areincluded in investment income. PUF receives qualified securities and/or cash as collateral against theloaned securities. The collateral when received will have a market value of 102% of loaned securities ofUnited States issuers and a market value of 105% for loaned securities of non-United States issuers. Ifthe market value of the collateral held in connection with loans of securities of United States issuers isless than 100% at the close of trading on any business day, the borrower is required to deliver additionalcollateral by the close of the next business day to equal 102% of the market value. For non-United Statesissuers, the collateral should remain 105% of the market value of the loaned securities at the close of anybusiness day. If it falls below the 105%, the borrower must deliver additional collateral by the close ofthe following business day. At year end, the value of securities loaned of United States issuers and thevalue of collateral held amounted to $318,133,658 and $321,270,201, respectively. There were no non-United States issuers loaned during the years ended August 31, 1997 and 1996.
NOTE 5 - INVESTMENT COMMITMENTS
Unfunded contractual commitments for limited partnerships and other assets were $.506,892,175 atAugust 31, 199 7.

28
(This page has been left blank intentionally)

PERMANENT UNIVERSITY FUND
S u p p l e m e n t a l F i n a n c i a l S c h e d u l e s
29
30
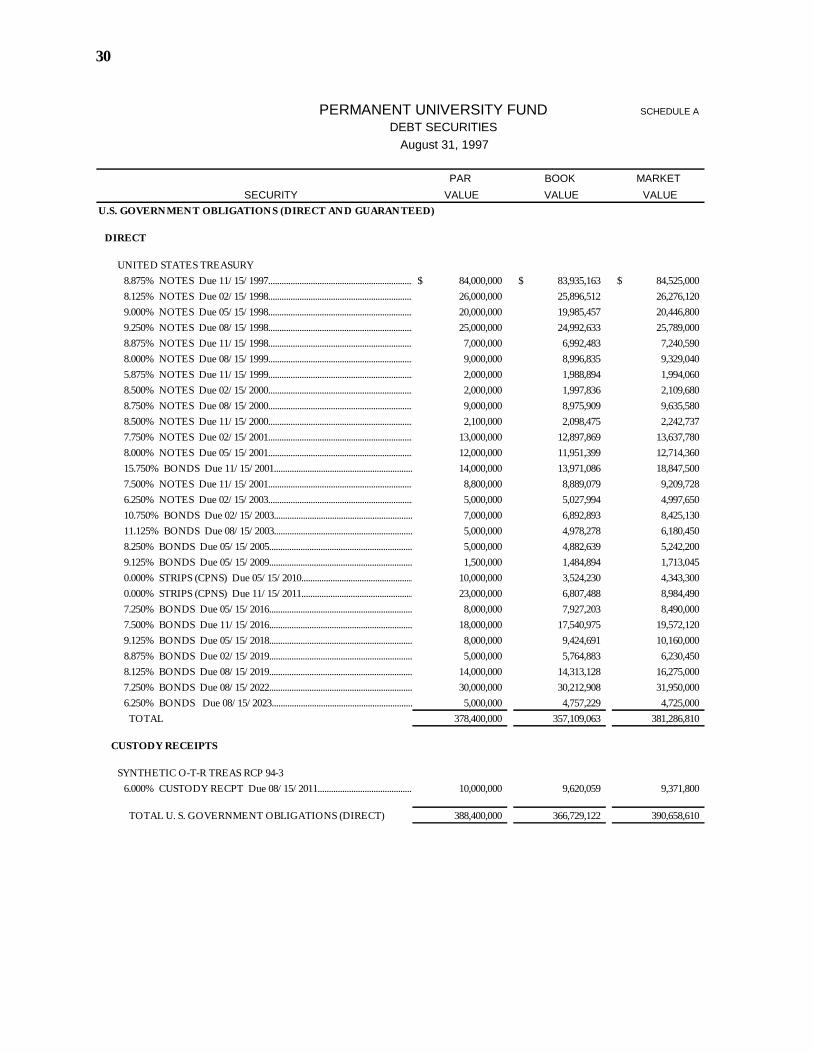
PERMANENT UNIVERSITY FUND SCHEDULE A
DEBT SECURITIES August 31, 1997
PAR BOOK MARKETSECURITY VALUE VALUE VALUE
U.S. GOVERNMENT OBLIGATIONS (DIRECT AND GUARANTEED)
DIRECT
UNITED STATES TREASURY 8.875% NOTES Due 11/15/1997...........................................................................................84,000,000$ 83,935,163$ 84,525,000$ 8.125% NOTES Due 02/15/1998...........................................................................................26,000,000 25,896,512 26,276,120 9.000% NOTES Due 05/15/1998...........................................................................................20,000,000 19,985,457 20,446,800 9.250% NOTES Due 08/15/1998...........................................................................................25,000,000 24,992,633 25,789,000 8.875% NOTES Due 11/15/1998...........................................................................................7,000,000 6,992,483 7,240,590 8.000% NOTES Due 08/15/1999...........................................................................................9,000,000 8,996,835 9,329,040 5.875% NOTES Due 11/15/1999...........................................................................................2,000,000 1,988,894 1,994,060 8.500% NOTES Due 02/15/2000...........................................................................................2,000,000 1,997,836 2,109,680 8.750% NOTES Due 08/15/2000...........................................................................................9,000,000 8,975,909 9,635,580 8.500% NOTES Due 11/15/2000...........................................................................................2,100,000 2,098,475 2,242,737 7.750% NOTES Due 02/15/2001...........................................................................................13,000,000 12,897,869 13,637,780 8.000% NOTES Due 05/15/2001...........................................................................................12,000,000 11,951,399 12,714,360 15.750% BONDS Due 11/15/2001...........................................................................................14,000,000 13,971,086 18,847,500 7.500% NOTES Due 11/15/2001...........................................................................................8,800,000 8,889,079 9,209,728 6.250% NOTES Due 02/15/2003...........................................................................................5,000,000 5,027,994 4,997,650 10.750% BONDS Due 02/15/2003...........................................................................................7,000,000 6,892,893 8,425,130 11.125% BONDS Due 08/15/2003...........................................................................................5,000,000 4,978,278 6,180,450 8.250% BONDS Due 05/15/2005...........................................................................................5,000,000 4,882,639 5,242,200 9.125% BONDS Due 05/15/2009...........................................................................................1,500,000 1,484,894 1,713,045 0.000% STRIPS (CPNS) Due 05/15/2010...........................................................................................10,000,000 3,524,230 4,343,300 0.000% STRIPS (CPNS) Due 11/15/2011...........................................................................................23,000,000 6,807,488 8,984,490 7.250% BONDS Due 05/15/2016...........................................................................................8,000,000 7,927,203 8,490,000 7.500% BONDS Due 11/15/2016...........................................................................................18,000,000 17,540,975 19,572,120 9.125% BONDS Due 05/15/2018...........................................................................................8,000,000 9,424,691 10,160,000 8.875% BONDS Due 02/15/2019...........................................................................................5,000,000 5,764,883 6,230,450 8.125% BONDS Due 08/15/2019...........................................................................................14,000,000 14,313,128 16,275,000 7.250% BONDS Due 08/15/2022...........................................................................................30,000,000 30,212,908 31,950,000 6.250% BONDS Due 08/15/2023...........................................................................................5,000,000 4,757,229 4,725,000 TOTAL 378,400,000 357,109,063 381,286,810
CUSTODY RECEIPTS
SYNTHETIC O-T-R TREAS RCP 94-3 6.000% CUSTODY RECPT Due 08/15/2011...........................................................................................10,000,000 9,620,059 9,371,800
TOTAL U. S. GOVERNMENT OBLIGATIONS (DIRECT) 388,400,000 366,729,122 390,658,610
31
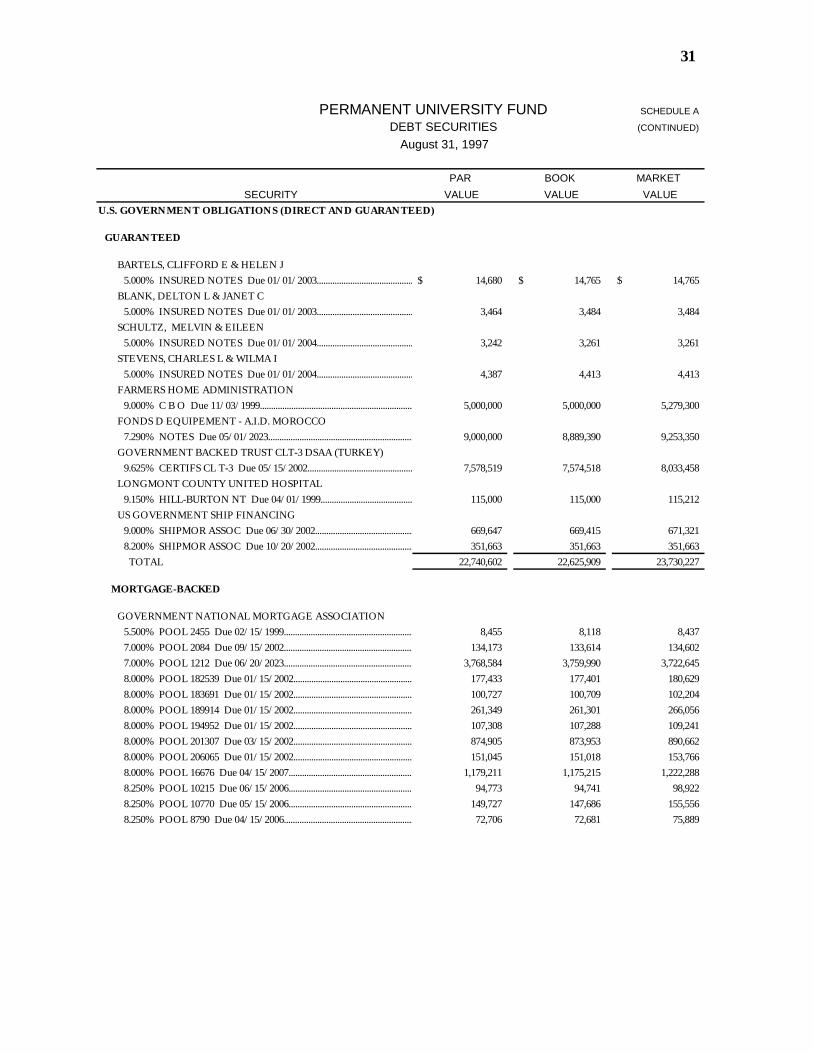
PERMANENT UNIVERSITY FUND SCHEDULE A
DEBT SECURITIES (CONTINUED)
August 31, 1997
PAR BOOK MARKETSECURITY VALUE VALUE VALUE
U.S. GOVERNMENT OBLIGATIONS (DIRECT AND GUARANTEED)
GUARANTEED
BARTELS, CLIFFORD E & HELEN J 5.000% INSURED NOTES Due 01/01/2003...........................................................................................14,680$ 14,765$ 14,765$
BLANK, DELTON L & JANET C 5.000% INSURED NOTES Due 01/01/2003...........................................................................................3,464 3,484 3,484
SCHULTZ, MELVIN & EILEEN 5.000% INSURED NOTES Due 01/01/2004...........................................................................................3,242 3,261 3,261
STEVENS, CHARLES L & WILMA I 5.000% INSURED NOTES Due 01/01/2004...........................................................................................4,387 4,413 4,413
FARMERS HOME ADMINISTRATION 9.000% C B O Due 11/03/1999...........................................................................................5,000,000 5,000,000 5,279,300
FONDS D EQUIPEMENT - A.I.D. MOROCCO 7.290% NOTES Due 05/01/2023...........................................................................................9,000,000 8,889,390 9,253,350
GOVERNMENT BACKED TRUST CLT-3 DSAA (TURKEY) 9.625% CERTIFS CL T-3 Due 05/15/2002...........................................................................................7,578,519 7,574,518 8,033,458
LONGMONT COUNTY UNITED HOSPITAL 9.150% HILL-BURTON NT Due 04/01/1999...........................................................................................115,000 115,000 115,212
US GOVERNMENT SHIP FINANCING 9.000% SHIPMOR ASSOC Due 06/30/2002...........................................................................................669,647 669,415 671,321 8.200% SHIPMOR ASSOC Due 10/20/2002...........................................................................................351,663 351,663 351,663 TOTAL 22,740,602 22,625,909 23,730,227
MORTGAGE-BACKED
GOVERNMENT NATIONAL MORTGAGE ASSOCIATION 5.500% POOL 2455 Due 02/15/1999...........................................................................................8,455 8,118 8,437 7.000% POOL 2084 Due 09/15/2002...........................................................................................134,173 133,614 134,602 7.000% POOL 1212 Due 06/20/2023...........................................................................................3,768,584 3,759,990 3,722,645 8.000% POOL 182539 Due 01/15/2002...........................................................................................177,433 177,401 180,629 8.000% POOL 183691 Due 01/15/2002...........................................................................................100,727 100,709 102,204 8.000% POOL 189914 Due 01/15/2002...........................................................................................261,349 261,301 266,056 8.000% POOL 194952 Due 01/15/2002...........................................................................................107,308 107,288 109,241 8.000% POOL 201307 Due 03/15/2002...........................................................................................874,905 873,953 890,662 8.000% POOL 206065 Due 01/15/2002...........................................................................................151,045 151,018 153,766 8.000% POOL 16676 Due 04/15/2007...........................................................................................1,179,211 1,175,215 1,222,288 8.250% POOL 10215 Due 06/15/2006...........................................................................................94,773 94,741 98,922 8.250% POOL 10770 Due 05/15/2006...........................................................................................149,727 147,686 155,556 8.250% POOL 8790 Due 04/15/2006...........................................................................................72,706 72,681 75,889
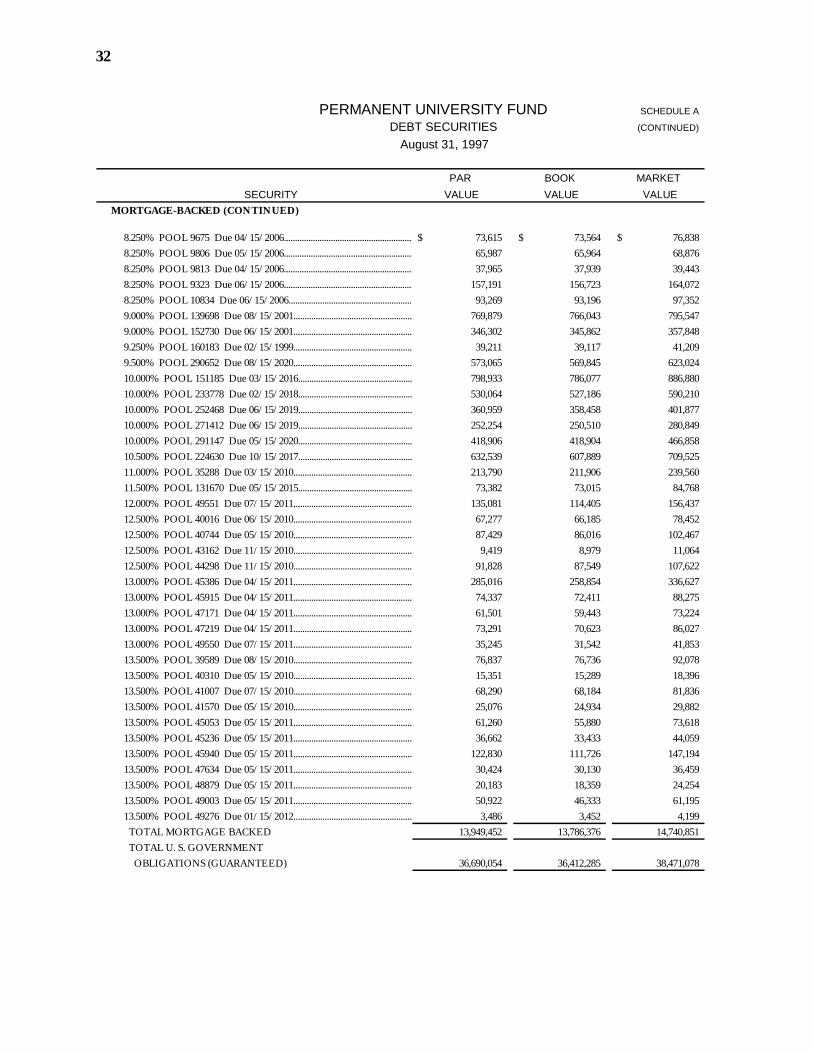
32
PERMANENT UNIVERSITY FUND SCHEDULE A
DEBT SECURITIES (CONTINUED)
August 31, 1997
PAR BOOK MARKETSECURITY VALUE VALUE VALUE
MORTGAGE-BACKED (CONTINUED)
8.250% POOL 9675 Due 04/15/2006...........................................................................................73,615$ 73,564$ 76,838$ 8.250% POOL 9806 Due 05/15/2006...........................................................................................65,987 65,964 68,876 8.250% POOL 9813 Due 04/15/2006...........................................................................................37,965 37,939 39,443 8.250% POOL 9323 Due 06/15/2006...........................................................................................157,191 156,723 164,072 8.250% POOL 10834 Due 06/15/2006...........................................................................................93,269 93,196 97,352 9.000% POOL 139698 Due 08/15/2001...........................................................................................769,879 766,043 795,547 9.000% POOL 152730 Due 06/15/2001...........................................................................................346,302 345,862 357,848 9.250% POOL 160183 Due 02/15/1999...........................................................................................39,211 39,117 41,209 9.500% POOL 290652 Due 08/15/2020...........................................................................................573,065 569,845 623,024 10.000% POOL 151185 Due 03/15/2016...........................................................................................798,933 786,077 886,880 10.000% POOL 233778 Due 02/15/2018...........................................................................................530,064 527,186 590,210 10.000% POOL 252468 Due 06/15/2019...........................................................................................360,959 358,458 401,877 10.000% POOL 271412 Due 06/15/2019...........................................................................................252,254 250,510 280,849 10.000% POOL 291147 Due 05/15/2020...........................................................................................418,906 418,904 466,858 10.500% POOL 224630 Due 10/15/2017...........................................................................................632,539 607,889 709,525 11.000% POOL 35288 Due 03/15/2010...........................................................................................213,790 211,906 239,560 11.500% POOL 131670 Due 05/15/2015...........................................................................................73,382 73,015 84,768 12.000% POOL 49551 Due 07/15/2011...........................................................................................135,081 114,405 156,437 12.500% POOL 40016 Due 06/15/2010...........................................................................................67,277 66,185 78,452 12.500% POOL 40744 Due 05/15/2010...........................................................................................87,429 86,016 102,467 12.500% POOL 43162 Due 11/15/2010...........................................................................................9,419 8,979 11,064 12.500% POOL 44298 Due 11/15/2010...........................................................................................91,828 87,549 107,622 13.000% POOL 45386 Due 04/15/2011...........................................................................................285,016 258,854 336,627 13.000% POOL 45915 Due 04/15/2011...........................................................................................74,337 72,411 88,275 13.000% POOL 47171 Due 04/15/2011...........................................................................................61,501 59,443 73,224 13.000% POOL 47219 Due 04/15/2011...........................................................................................73,291 70,623 86,027 13.000% POOL 49550 Due 07/15/2011...........................................................................................35,245 31,542 41,853 13.500% POOL 39589 Due 08/15/2010...........................................................................................76,837 76,736 92,078 13.500% POOL 40310 Due 05/15/2010...........................................................................................15,351 15,289 18,396 13.500% POOL 41007 Due 07/15/2010...........................................................................................68,290 68,184 81,836 13.500% POOL 41570 Due 05/15/2010...........................................................................................25,076 24,934 29,882 13.500% POOL 45053 Due 05/15/2011...........................................................................................61,260 55,880 73,618 13.500% POOL 45236 Due 05/15/2011...........................................................................................36,662 33,433 44,059 13.500% POOL 45940 Due 05/15/2011...........................................................................................122,830 111,726 147,194 13.500% POOL 47634 Due 05/15/2011...........................................................................................30,424 30,130 36,459 13.500% POOL 48879 Due 05/15/2011...........................................................................................20,183 18,359 24,254 13.500% POOL 49003 Due 05/15/2011...........................................................................................50,922 46,333 61,195 13.500% POOL 49276 Due 01/15/2012...........................................................................................3,486 3,452 4,199 TOTAL MORTGAGE BACKED 13,949,452 13,786,376 14,740,851 TOTAL U. S. GOVERNMENT OBLIGATIONS (GUARANTEED) 36,690,054 36,412,285 38,471,078
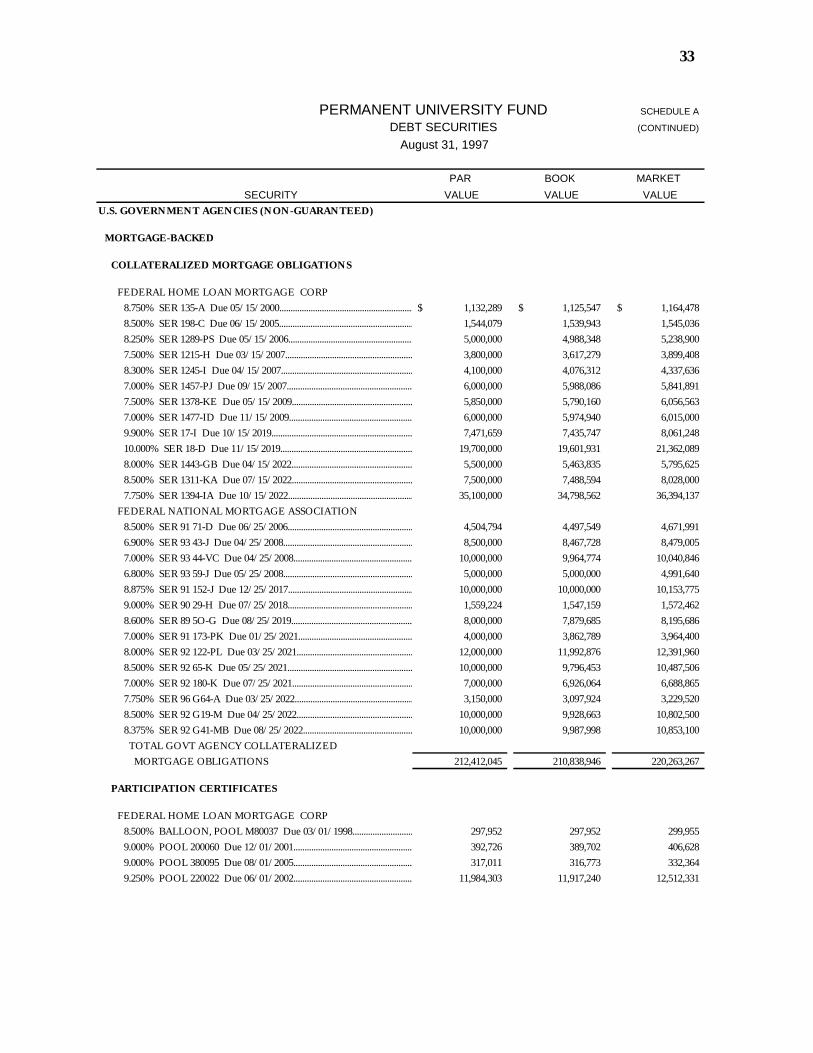
33
PERMANENT UNIVERSITY FUND SCHEDULE A
DEBT SECURITIES (CONTINUED)
August 31, 1997
PAR BOOK MARKETSECURITY VALUE VALUE VALUE
U.S. GOVERNMENT AGENCIES (NON-GUARANTEED)
MORTGAGE-BACKED
COLLATERALIZED MORTGAGE OBLIGATIONS
FEDERAL HOME LOAN MORTGAGE CORP 8.750% SER 135-A Due 05/15/2000...........................................................................................1,132,289$ 1,125,547$ 1,164,478$ 8.500% SER 198-C Due 06/15/2005...........................................................................................1,544,079 1,539,943 1,545,036 8.250% SER 1289-PS Due 05/15/2006...........................................................................................5,000,000 4,988,348 5,238,900 7.500% SER 1215-H Due 03/15/2007...........................................................................................3,800,000 3,617,279 3,899,408 8.300% SER 1245-I Due 04/15/2007...........................................................................................4,100,000 4,076,312 4,337,636 7.000% SER 1457-PJ Due 09/15/2007...........................................................................................6,000,000 5,988,086 5,841,891 7.500% SER 1378-KE Due 05/15/2009...........................................................................................5,850,000 5,790,160 6,056,563 7.000% SER 1477-ID Due 11/15/2009...........................................................................................6,000,000 5,974,940 6,015,000 9.900% SER 17-I Due 10/15/2019...........................................................................................7,471,659 7,435,747 8,061,248 10.000% SER 18-D Due 11/15/2019...........................................................................................19,700,000 19,601,931 21,362,089 8.000% SER 1443-GB Due 04/15/2022...........................................................................................5,500,000 5,463,835 5,795,625 8.500% SER 1311-KA Due 07/15/2022...........................................................................................7,500,000 7,488,594 8,028,000 7.750% SER 1394-IA Due 10/15/2022...........................................................................................35,100,000 34,798,562 36,394,137
FEDERAL NATIONAL MORTGAGE ASSOCIATION 8.500% SER 91 71-D Due 06/25/2006...........................................................................................4,504,794 4,497,549 4,671,991 6.900% SER 93 43-J Due 04/25/2008...........................................................................................8,500,000 8,467,728 8,479,005 7.000% SER 93 44-VC Due 04/25/2008...........................................................................................10,000,000 9,964,774 10,040,846 6.800% SER 93 59-J Due 05/25/2008...........................................................................................5,000,000 5,000,000 4,991,640 8.875% SER 91 152-J Due 12/25/2017...........................................................................................10,000,000 10,000,000 10,153,775 9.000% SER 90 29-H Due 07/25/2018...........................................................................................1,559,224 1,547,159 1,572,462 8.600% SER 89 5O-G Due 08/25/2019...........................................................................................8,000,000 7,879,685 8,195,686 7.000% SER 91 173-PK Due 01/25/2021...........................................................................................4,000,000 3,862,789 3,964,400 8.000% SER 92 122-PL Due 03/25/2021...........................................................................................12,000,000 11,992,876 12,391,960 8.500% SER 92 65-K Due 05/25/2021...........................................................................................10,000,000 9,796,453 10,487,506 7.000% SER 92 180-K Due 07/25/2021...........................................................................................7,000,000 6,926,064 6,688,865 7.750% SER 96 G64-A Due 03/25/2022...........................................................................................3,150,000 3,097,924 3,229,520 8.500% SER 92 G19-M Due 04/25/2022...........................................................................................10,000,000 9,928,663 10,802,500 8.375% SER 92 G41-MB Due 08/25/2022...........................................................................................10,000,000 9,987,998 10,853,100 TOTAL GOVT AGENCY COLLATERALIZED MORTGAGE OBLIGATIONS 212,412,045 210,838,946 220,263,267
PARTICIPATION CERTIFICATES
FEDERAL HOME LOAN MORTGAGE CORP 8.500% BALLOON, POOL M80037 Due 03/01/1998...........................................................................................297,952 297,952 299,955 9.000% POOL 200060 Due 12/01/2001...........................................................................................392,726 389,702 406,628 9.000% POOL 380095 Due 08/01/2005...........................................................................................317,011 316,773 332,364 9.250% POOL 220022 Due 06/01/2002...........................................................................................11,984,303 11,917,240 12,512,331
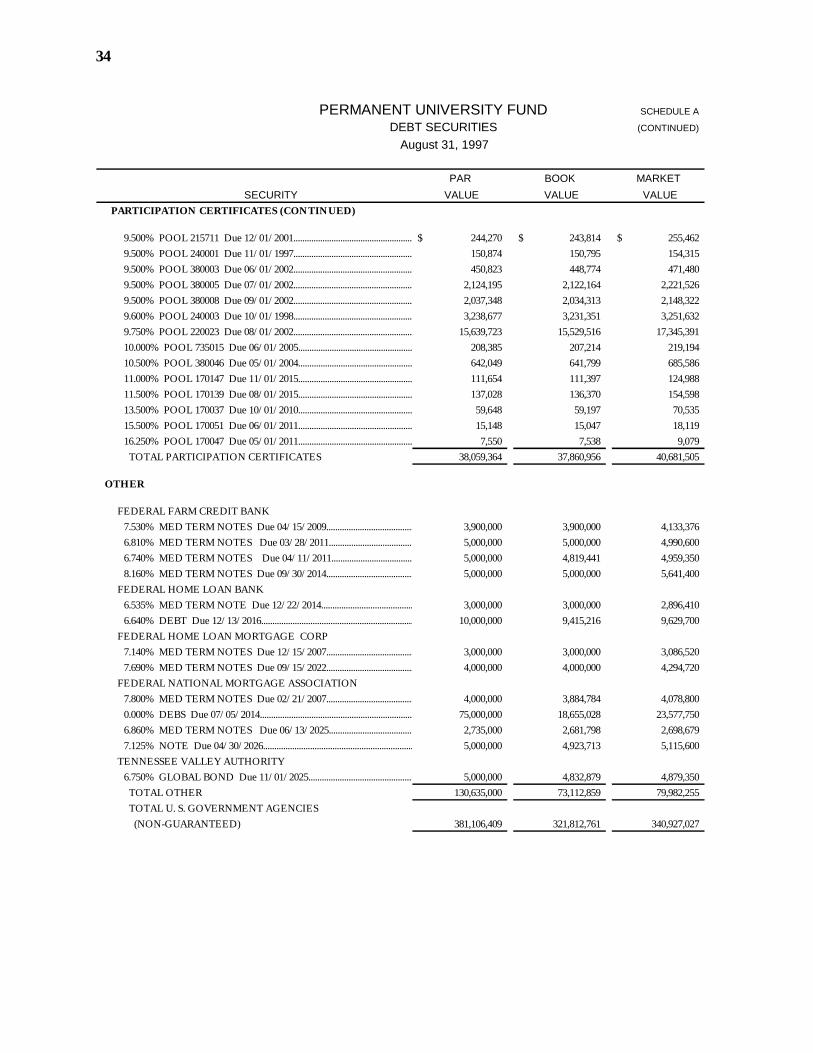
34
PERMANENT UNIVERSITY FUND SCHEDULE A
DEBT SECURITIES (CONTINUED)
August 31, 1997
PAR BOOK MARKETSECURITY VALUE VALUE VALUE
PARTICIPATION CERTIFICATES (CONTINUED)
9.500% POOL 215711 Due 12/01/2001...........................................................................................244,270$ 243,814$ 255,462$ 9.500% POOL 240001 Due 11/01/1997...........................................................................................150,874 150,795 154,315 9.500% POOL 380003 Due 06/01/2002...........................................................................................450,823 448,774 471,480 9.500% POOL 380005 Due 07/01/2002...........................................................................................2,124,195 2,122,164 2,221,526 9.500% POOL 380008 Due 09/01/2002...........................................................................................2,037,348 2,034,313 2,148,322 9.600% POOL 240003 Due 10/01/1998...........................................................................................3,238,677 3,231,351 3,251,632 9.750% POOL 220023 Due 08/01/2002...........................................................................................15,639,723 15,529,516 17,345,391 10.000% POOL 735015 Due 06/01/2005...........................................................................................208,385 207,214 219,194 10.500% POOL 380046 Due 05/01/2004...........................................................................................642,049 641,799 685,586 11.000% POOL 170147 Due 11/01/2015...........................................................................................111,654 111,397 124,988 11.500% POOL 170139 Due 08/01/2015...........................................................................................137,028 136,370 154,598 13.500% POOL 170037 Due 10/01/2010...........................................................................................59,648 59,197 70,535 15.500% POOL 170051 Due 06/01/2011...........................................................................................15,148 15,047 18,119 16.250% POOL 170047 Due 05/01/2011...........................................................................................7,550 7,538 9,079 TOTAL PARTICIPATION CERTIFICATES 38,059,364 37,860,956 40,681,505
OTHER
FEDERAL FARM CREDIT BANK
7.530% MED TERM NOTES Due 04/15/2009...........................................................................................3,900,000 3,900,000 4,133,376 6.810% MED TERM NOTES Due 03/28/2011...........................................................................................5,000,000 5,000,000 4,990,600 6.740% MED TERM NOTES Due 04/11/2011...........................................................................................5,000,000 4,819,441 4,959,350 8.160% MED TERM NOTES Due 09/30/2014...........................................................................................5,000,000 5,000,000 5,641,400
FEDERAL HOME LOAN BANK 6.535% MED TERM NOTE Due 12/22/2014...........................................................................................3,000,000 3,000,000 2,896,410 6.640% DEBT Due 12/13/2016...........................................................................................10,000,000 9,415,216 9,629,700
FEDERAL HOME LOAN MORTGAGE CORP 7.140% MED TERM NOTES Due 12/15/2007...........................................................................................3,000,000 3,000,000 3,086,520 7.690% MED TERM NOTES Due 09/15/2022...........................................................................................4,000,000 4,000,000 4,294,720
FEDERAL NATIONAL MORTGAGE ASSOCIATION 7.800% MED TERM NOTES Due 02/21/2007...........................................................................................4,000,000 3,884,784 4,078,800 0.000% DEBS Due 07/05/2014...........................................................................................75,000,000 18,655,028 23,577,750 6.860% MED TERM NOTES Due 06/13/2025...........................................................................................2,735,000 2,681,798 2,698,679 7.125% NOTE Due 04/30/2026...........................................................................................5,000,000 4,923,713 5,115,600
TENNESSEE VALLEY AUTHORITY 6.750% GLOBAL BOND Due 11/01/2025...........................................................................................5,000,000 4,832,879 4,879,350 TOTAL OTHER 130,635,000 73,112,859 79,982,255 TOTAL U. S. GOVERNMENT AGENCIES (NON-GUARANTEED) 381,106,409 321,812,761 340,927,027
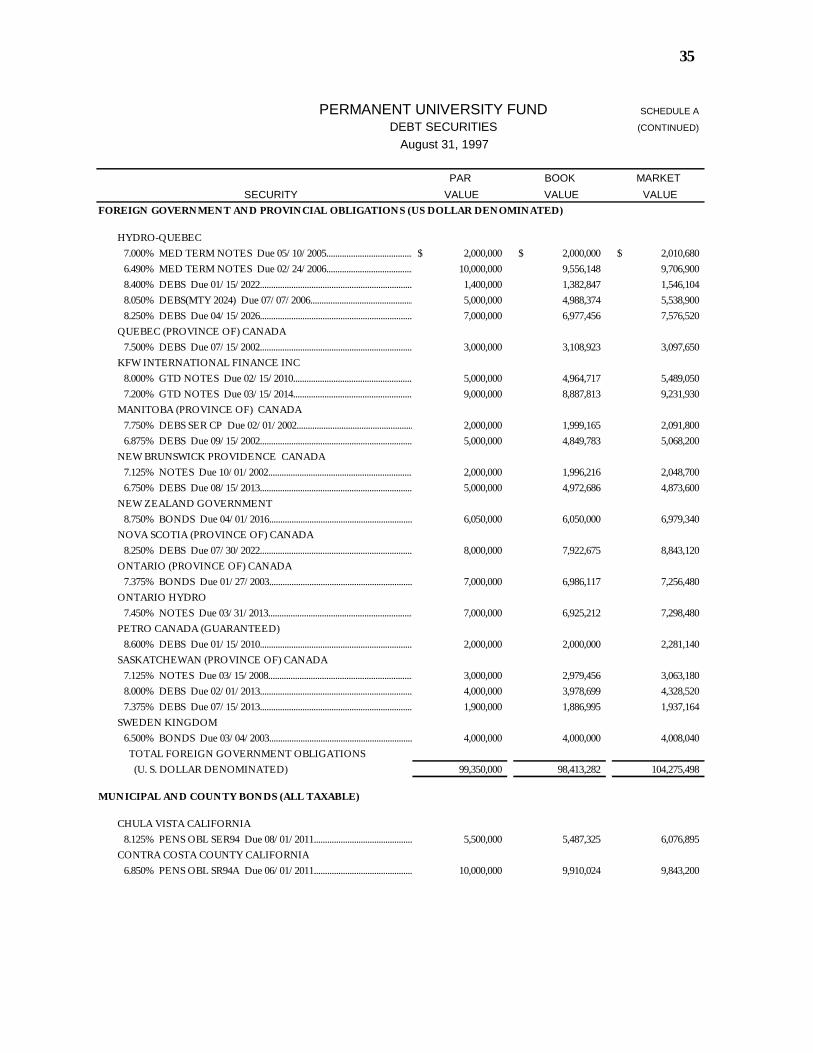
35
PERMANENT UNIVERSITY FUND SCHEDULE A
DEBT SECURITIES (CONTINUED)
August 31, 1997
PAR BOOK MARKETSECURITY VALUE VALUE VALUE
FOREIGN GOVERNMENT AND PROVINCIAL OBLIGATIONS (US DOLLAR DENOMINATED)
HYDRO-QUEBEC 7.000% MED TERM NOTES Due 05/10/2005...........................................................................................2,000,000$ 2,000,000$ 2,010,680$ 6.490% MED TERM NOTES Due 02/24/2006...........................................................................................10,000,000 9,556,148 9,706,900 8.400% DEBS Due 01/15/2022...........................................................................................1,400,000 1,382,847 1,546,104 8.050% DEBS(MTY 2024) Due 07/07/2006...........................................................................................5,000,000 4,988,374 5,538,900 8.250% DEBS Due 04/15/2026...........................................................................................7,000,000 6,977,456 7,576,520
QUEBEC (PROVINCE OF) CANADA 7.500% DEBS Due 07/15/2002...........................................................................................3,000,000 3,108,923 3,097,650
KFW INTERNATIONAL FINANCE INC 8.000% GTD NOTES Due 02/15/2010...........................................................................................5,000,000 4,964,717 5,489,050 7.200% GTD NOTES Due 03/15/2014...........................................................................................9,000,000 8,887,813 9,231,930
MANITOBA (PROVINCE OF) CANADA 7.750% DEBS SER CP Due 02/01/2002...........................................................................................2,000,000 1,999,165 2,091,800 6.875% DEBS Due 09/15/2002...........................................................................................5,000,000 4,849,783 5,068,200
NEW BRUNSWICK PROVIDENCE CANADA 7.125% NOTES Due 10/01/2002...........................................................................................2,000,000 1,996,216 2,048,700 6.750% DEBS Due 08/15/2013...........................................................................................5,000,000 4,972,686 4,873,600
NEW ZEALAND GOVERNMENT 8.750% BONDS Due 04/01/2016...........................................................................................6,050,000 6,050,000 6,979,340
NOVA SCOTIA (PROVINCE OF) CANADA 8.250% DEBS Due 07/30/2022...........................................................................................8,000,000 7,922,675 8,843,120
ONTARIO (PROVINCE OF) CANADA 7.375% BONDS Due 01/27/2003...........................................................................................7,000,000 6,986,117 7,256,480
ONTARIO HYDRO 7.450% NOTES Due 03/31/2013...........................................................................................7,000,000 6,925,212 7,298,480
PETRO CANADA (GUARANTEED) 8.600% DEBS Due 01/15/2010...........................................................................................2,000,000 2,000,000 2,281,140
SASKATCHEWAN (PROVINCE OF) CANADA 7.125% NOTES Due 03/15/2008...........................................................................................3,000,000 2,979,456 3,063,180 8.000% DEBS Due 02/01/2013...........................................................................................4,000,000 3,978,699 4,328,520 7.375% DEBS Due 07/15/2013...........................................................................................1,900,000 1,886,995 1,937,164
SWEDEN KINGDOM 6.500% BONDS Due 03/04/2003...........................................................................................4,000,000 4,000,000 4,008,040 TOTAL FOREIGN GOVERNMENT OBLIGATIONS (U. S. DOLLAR DENOMINATED) 99,350,000 98,413,282 104,275,498
MUNICIPAL AND COUNTY BONDS (ALL TAXABLE)
CHULA VISTA CALIFORNIA 8.125% PENS OBL SER94 Due 08/01/2011...........................................................................................5,500,000 5,487,325 6,076,895
CONTRA COSTA COUNTY CALIFORNIA 6.850% PENS OBL SR94A Due 06/01/2011...........................................................................................10,000,000 9,910,024 9,843,200
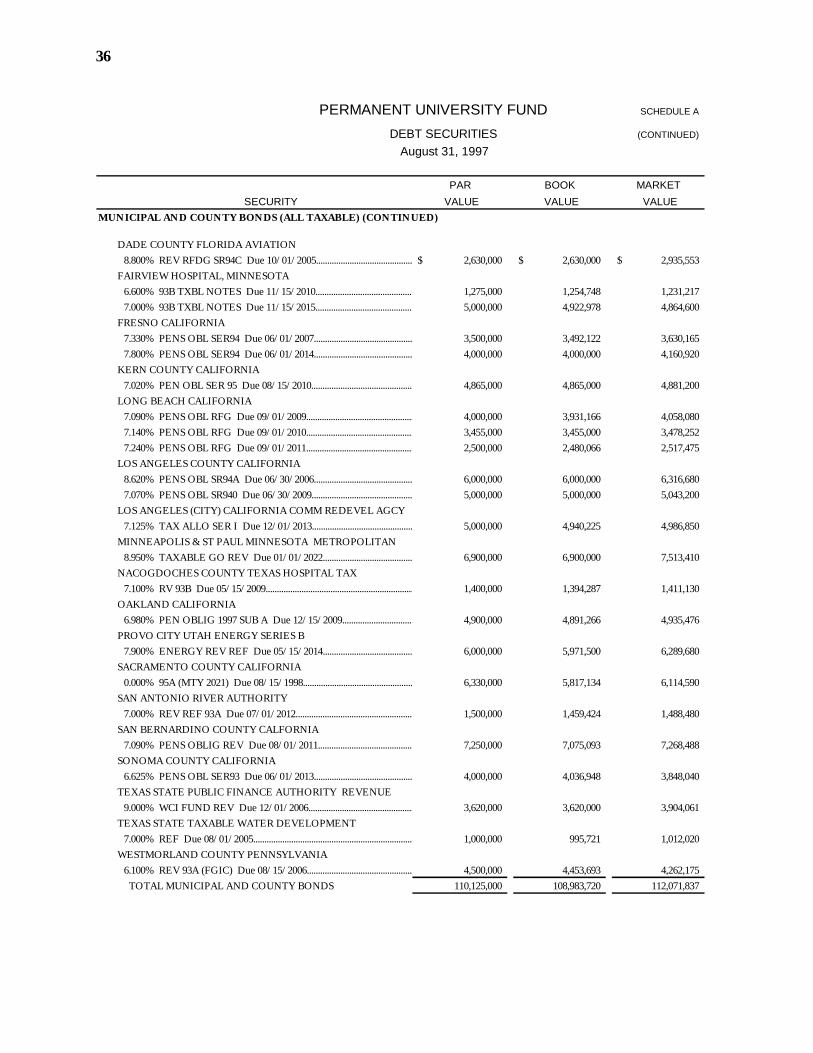
36
PERMANENT UNIVERSITY FUND SCHEDULE A
DEBT SECURITIES (CONTINUED)
August 31, 1997
PAR BOOK MARKETSECURITY VALUE VALUE VALUE
MUNICIPAL AND COUNTY BONDS (ALL TAXABLE) (CONTINUED)
DADE COUNTY FLORIDA AVIATION 8.800% REV RFDG SR94C Due 10/01/2005...........................................................................................2,630,000$ 2,630,000$ 2,935,553$
FAIRVIEW HOSPITAL, MINNESOTA 6.600% 93B TXBL NOTES Due 11/15/2010...........................................................................................1,275,000 1,254,748 1,231,217 7.000% 93B TXBL NOTES Due 11/15/2015...........................................................................................5,000,000 4,922,978 4,864,600
FRESNO CALIFORNIA 7.330% PENS OBL SER94 Due 06/01/2007...........................................................................................3,500,000 3,492,122 3,630,165 7.800% PENS OBL SER94 Due 06/01/2014...........................................................................................4,000,000 4,000,000 4,160,920
KERN COUNTY CALIFORNIA 7.020% PEN OBL SER 95 Due 08/15/2010...........................................................................................4,865,000 4,865,000 4,881,200
LONG BEACH CALIFORNIA 7.090% PENS OBL RFG Due 09/01/2009...........................................................................................4,000,000 3,931,166 4,058,080 7.140% PENS OBL RFG Due 09/01/2010...........................................................................................3,455,000 3,455,000 3,478,252 7.240% PENS OBL RFG Due 09/01/2011...........................................................................................2,500,000 2,480,066 2,517,475
LOS ANGELES COUNTY CALIFORNIA 8.620% PENS OBL SR94A Due 06/30/2006...........................................................................................6,000,000 6,000,000 6,316,680 7.070% PENS OBL SR940 Due 06/30/2009...........................................................................................5,000,000 5,000,000 5,043,200
LOS ANGELES (CITY) CALIFORNIA COMM REDEVEL AGCY 7.125% TAX ALLO SER I Due 12/01/2013...........................................................................................5,000,000 4,940,225 4,986,850
MINNEAPOLIS & ST PAUL MINNESOTA METROPOLITAN 8.950% TAXABLE GO REV Due 01/01/2022...........................................................................................6,900,000 6,900,000 7,513,410
NACOGDOCHES COUNTY TEXAS HOSPITAL TAX 7.100% RV 93B Due 05/15/2009...........................................................................................1,400,000 1,394,287 1,411,130
OAKLAND CALIFORNIA 6.980% PEN OBLIG 1997 SUB A Due 12/15/2009...........................................................................................4,900,000 4,891,266 4,935,476
PROVO CITY UTAH ENERGY SERIES B 7.900% ENERGY REV REF Due 05/15/2014...........................................................................................6,000,000 5,971,500 6,289,680
SACRAMENTO COUNTY CALIFORNIA 0.000% 95A (MTY 2021) Due 08/15/1998...........................................................................................6,330,000 5,817,134 6,114,590
SAN ANTONIO RIVER AUTHORITY 7.000% REV REF 93A Due 07/01/2012...........................................................................................1,500,000 1,459,424 1,488,480
SAN BERNARDINO COUNTY CALFORNIA 7.090% PENS OBLIG REV Due 08/01/2011...........................................................................................7,250,000 7,075,093 7,268,488
SONOMA COUNTY CALIFORNIA 6.625% PENS OBL SER93 Due 06/01/2013...........................................................................................4,000,000 4,036,948 3,848,040
TEXAS STATE PUBLIC FINANCE AUTHORITY REVENUE 9.000% WCI FUND REV Due 12/01/2006...........................................................................................3,620,000 3,620,000 3,904,061
TEXAS STATE TAXABLE WATER DEVELOPMENT 7.000% REF Due 08/01/2005........................................................................................... 1,000,000 995,721 1,012,020
WESTMORLAND COUNTY PENNSYLVANIA 6.100% REV 93A (FGIC) Due 08/15/2006...........................................................................................4,500,000 4,453,693 4,262,175 TOTAL MUNICIPAL AND COUNTY BONDS 110,125,000 108,983,720 112,071,837
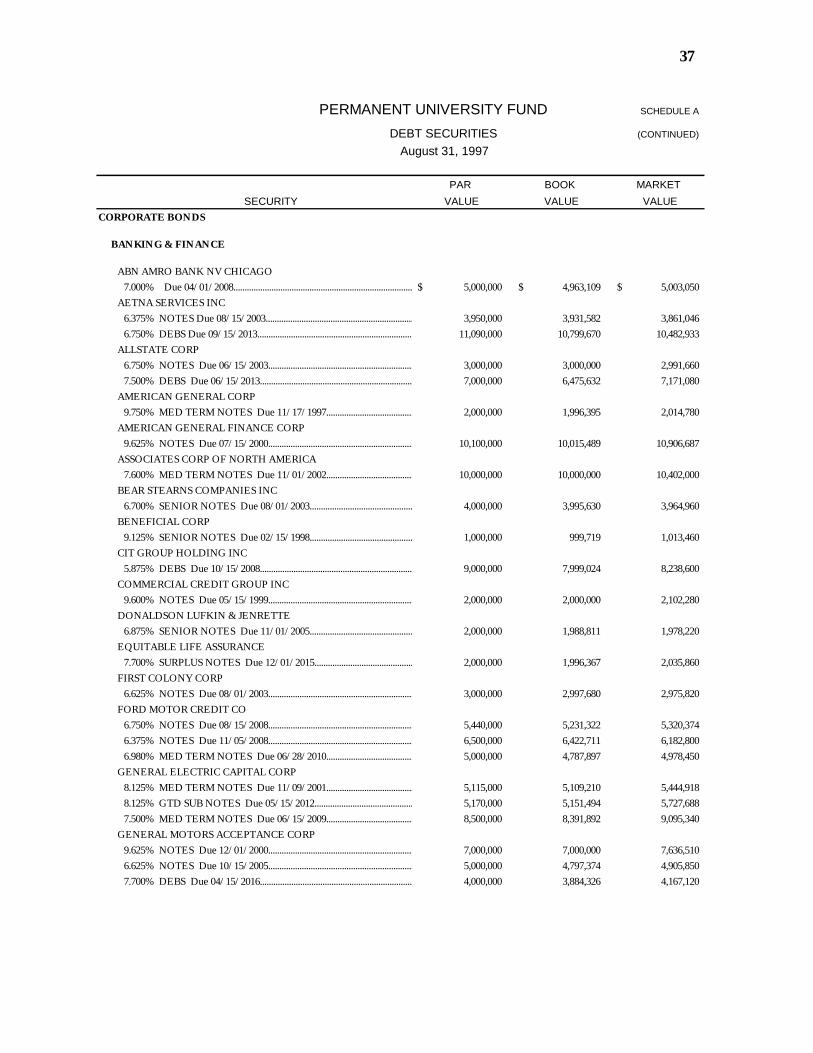
37
PERMANENT UNIVERSITY FUND SCHEDULE A
DEBT SECURITIES (CONTINUED)
August 31, 1997
PAR BOOK MARKETSECURITY VALUE VALUE VALUE
CORPORATE BONDS
BANKING & FINANCE
ABN AMRO BANK NV CHICAGO 7.000% Due 04/01/2008........................................................................................... 5,000,000$ 4,963,109$ 5,003,050$
AETNA SERVICES INC 6.375% NOTES Due 08/15/2003...........................................................................................3,950,000 3,931,582 3,861,046 6.750% DEBS Due 09/15/2013...........................................................................................11,090,000 10,799,670 10,482,933
ALLSTATE CORP 6.750% NOTES Due 06/15/2003...........................................................................................3,000,000 3,000,000 2,991,660 7.500% DEBS Due 06/15/2013...........................................................................................7,000,000 6,475,632 7,171,080
AMERICAN GENERAL CORP 9.750% MED TERM NOTES Due 11/17/1997...........................................................................................2,000,000 1,996,395 2,014,780
AMERICAN GENERAL FINANCE CORP 9.625% NOTES Due 07/15/2000...........................................................................................10,100,000 10,015,489 10,906,687
ASSOCIATES CORP OF NORTH AMERICA 7.600% MED TERM NOTES Due 11/01/2002...........................................................................................10,000,000 10,000,000 10,402,000
BEAR STEARNS COMPANIES INC 6.700% SENIOR NOTES Due 08/01/2003...........................................................................................4,000,000 3,995,630 3,964,960
BENEFICIAL CORP 9.125% SENIOR NOTES Due 02/15/1998...........................................................................................1,000,000 999,719 1,013,460
CIT GROUP HOLDING INC 5.875% DEBS Due 10/15/2008...........................................................................................9,000,000 7,999,024 8,238,600
COMMERCIAL CREDIT GROUP INC 9.600% NOTES Due 05/15/1999...........................................................................................2,000,000 2,000,000 2,102,280
DONALDSON LUFKIN & JENRETTE 6.875% SENIOR NOTES Due 11/01/2005...........................................................................................2,000,000 1,988,811 1,978,220
EQUITABLE LIFE ASSURANCE 7.700% SURPLUS NOTES Due 12/01/2015...........................................................................................2,000,000 1,996,367 2,035,860
FIRST COLONY CORP 6.625% NOTES Due 08/01/2003...........................................................................................3,000,000 2,997,680 2,975,820
FORD MOTOR CREDIT CO 6.750% NOTES Due 08/15/2008...........................................................................................5,440,000 5,231,322 5,320,374 6.375% NOTES Due 11/05/2008...........................................................................................6,500,000 6,422,711 6,182,800 6.980% MED TERM NOTES Due 06/28/2010...........................................................................................5,000,000 4,787,897 4,978,450
GENERAL ELECTRIC CAPITAL CORP 8.125% MED TERM NOTES Due 11/09/2001...........................................................................................5,115,000 5,109,210 5,444,918 8.125% GTD SUB NOTES Due 05/15/2012...........................................................................................5,170,000 5,151,494 5,727,688 7.500% MED TERM NOTES Due 06/15/2009...........................................................................................8,500,000 8,391,892 9,095,340
GENERAL MOTORS ACCEPTANCE CORP 9.625% NOTES Due 12/01/2000...........................................................................................7,000,000 7,000,000 7,636,510 6.625% NOTES Due 10/15/2005...........................................................................................5,000,000 4,797,374 4,905,850 7.700% DEBS Due 04/15/2016...........................................................................................4,000,000 3,884,326 4,167,120
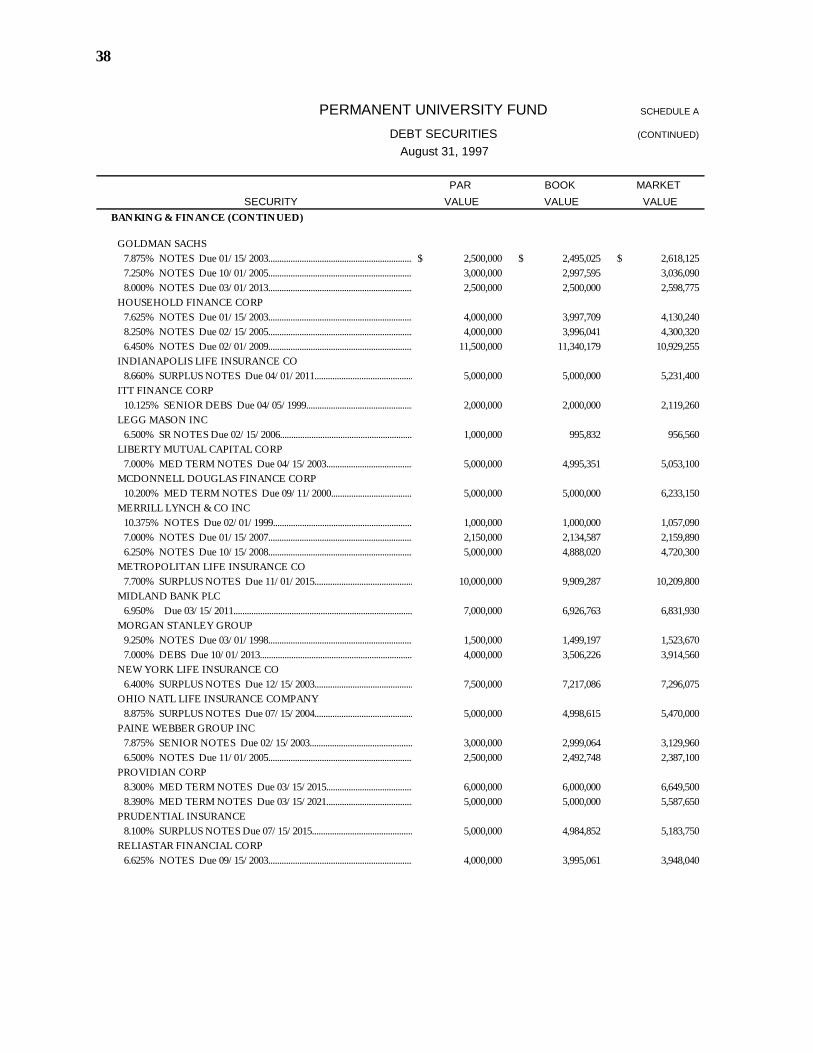
38
PERMANENT UNIVERSITY FUND SCHEDULE A
DEBT SECURITIES (CONTINUED)
August 31, 1997
PAR BOOK MARKETSECURITY VALUE VALUE VALUE
BANKING & FINANCE (CONTINUED)
GOLDMAN SACHS 7.875% NOTES Due 01/15/2003...........................................................................................2,500,000$ 2,495,025$ 2,618,125$ 7.250% NOTES Due 10/01/2005...........................................................................................3,000,000 2,997,595 3,036,090 8.000% NOTES Due 03/01/2013...........................................................................................2,500,000 2,500,000 2,598,775
HOUSEHOLD FINANCE CORP 7.625% NOTES Due 01/15/2003...........................................................................................4,000,000 3,997,709 4,130,240 8.250% NOTES Due 02/15/2005...........................................................................................4,000,000 3,996,041 4,300,320 6.450% NOTES Due 02/01/2009...........................................................................................11,500,000 11,340,179 10,929,255
INDIANAPOLIS LIFE INSURANCE CO 8.660% SURPLUS NOTES Due 04/01/2011...........................................................................................5,000,000 5,000,000 5,231,400
ITT FINANCE CORP 10.125% SENIOR DEBS Due 04/05/1999...........................................................................................2,000,000 2,000,000 2,119,260
LEGG MASON INC 6.500% SR NOTES Due 02/15/2006...........................................................................................1,000,000 995,832 956,560
LIBERTY MUTUAL CAPITAL CORP 7.000% MED TERM NOTES Due 04/15/2003...........................................................................................5,000,000 4,995,351 5,053,100
MCDONNELL DOUGLAS FINANCE CORP 10.200% MED TERM NOTES Due 09/11/2000...........................................................................................5,000,000 5,000,000 6,233,150
MERRILL LYNCH & CO INC 10.375% NOTES Due 02/01/1999...........................................................................................1,000,000 1,000,000 1,057,090 7.000% NOTES Due 01/15/2007...........................................................................................2,150,000 2,134,587 2,159,890 6.250% NOTES Due 10/15/2008...........................................................................................5,000,000 4,888,020 4,720,300
METROPOLITAN LIFE INSURANCE CO 7.700% SURPLUS NOTES Due 11/01/2015...........................................................................................10,000,000 9,909,287 10,209,800
MIDLAND BANK PLC 6.950% Due 03/15/2011........................................................................................... 7,000,000 6,926,763 6,831,930
MORGAN STANLEY GROUP 9.250% NOTES Due 03/01/1998...........................................................................................1,500,000 1,499,197 1,523,670 7.000% DEBS Due 10/01/2013...........................................................................................4,000,000 3,506,226 3,914,560
NEW YORK LIFE INSURANCE CO 6.400% SURPLUS NOTES Due 12/15/2003...........................................................................................7,500,000 7,217,086 7,296,075
OHIO NATL LIFE INSURANCE COMPANY 8.875% SURPLUS NOTES Due 07/15/2004...........................................................................................5,000,000 4,998,615 5,470,000
PAINE WEBBER GROUP INC 7.875% SENIOR NOTES Due 02/15/2003...........................................................................................3,000,000 2,999,064 3,129,960 6.500% NOTES Due 11/01/2005...........................................................................................2,500,000 2,492,748 2,387,100
PROVIDIAN CORP 8.300% MED TERM NOTES Due 03/15/2015...........................................................................................6,000,000 6,000,000 6,649,500 8.390% MED TERM NOTES Due 03/15/2021...........................................................................................5,000,000 5,000,000 5,587,650
PRUDENTIAL INSURANCE 8.100% SURPLUS NOTES Due 07/15/2015...........................................................................................5,000,000 4,984,852 5,183,750
RELIASTAR FINANCIAL CORP 6.625% NOTES Due 09/15/2003...........................................................................................4,000,000 3,995,061 3,948,040
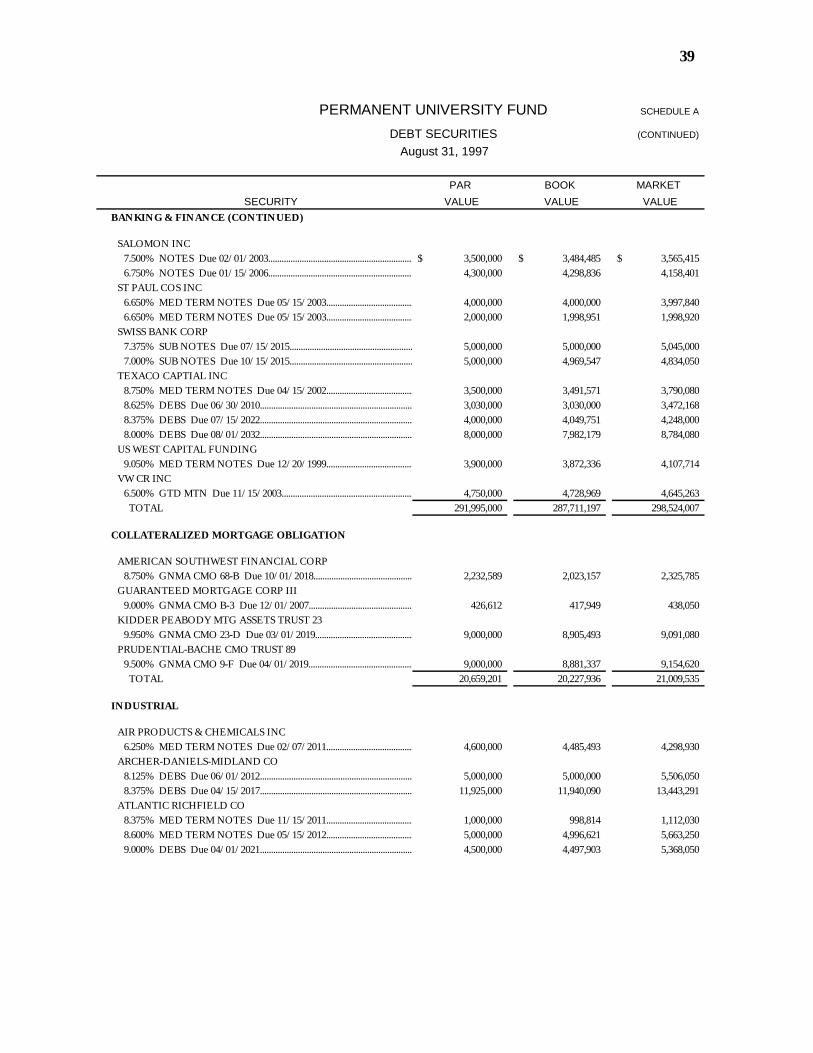
39
PERMANENT UNIVERSITY FUND SCHEDULE A
DEBT SECURITIES (CONTINUED)
August 31, 1997
PAR BOOK MARKETSECURITY VALUE VALUE VALUE
BANKING & FINANCE (CONTINUED)
SALOMON INC 7.500% NOTES Due 02/01/2003...........................................................................................3,500,000$ 3,484,485$ 3,565,415$ 6.750% NOTES Due 01/15/2006...........................................................................................4,300,000 4,298,836 4,158,401
ST PAUL COS INC 6.650% MED TERM NOTES Due 05/15/2003...........................................................................................4,000,000 4,000,000 3,997,840 6.650% MED TERM NOTES Due 05/15/2003...........................................................................................2,000,000 1,998,951 1,998,920
SWISS BANK CORP 7.375% SUB NOTES Due 07/15/2015...........................................................................................5,000,000 5,000,000 5,045,000 7.000% SUB NOTES Due 10/15/2015...........................................................................................5,000,000 4,969,547 4,834,050
TEXACO CAPTIAL INC 8.750% MED TERM NOTES Due 04/15/2002...........................................................................................3,500,000 3,491,571 3,790,080 8.625% DEBS Due 06/30/2010...........................................................................................3,030,000 3,030,000 3,472,168 8.375% DEBS Due 07/15/2022...........................................................................................4,000,000 4,049,751 4,248,000 8.000% DEBS Due 08/01/2032...........................................................................................8,000,000 7,982,179 8,784,080
US WEST CAPITAL FUNDING 9.050% MED TERM NOTES Due 12/20/1999...........................................................................................3,900,000 3,872,336 4,107,714
VW CR INC 6.500% GTD MTN Due 11/15/2003...........................................................................................4,750,000 4,728,969 4,645,263 TOTAL 291,995,000 287,711,197 298,524,007
COLLATERALIZED MORTGAGE OBLIGATION
AMERICAN SOUTHWEST FINANCIAL CORP 8.750% GNMA CMO 68-B Due 10/01/2018...........................................................................................2,232,589 2,023,157 2,325,785
GUARANTEED MORTGAGE CORP III 9.000% GNMA CMO B-3 Due 12/01/2007...........................................................................................426,612 417,949 438,050
KIDDER PEABODY MTG ASSETS TRUST 23 9.950% GNMA CMO 23-D Due 03/01/2019...........................................................................................9,000,000 8,905,493 9,091,080
PRUDENTIAL-BACHE CMO TRUST 89 9.500% GNMA CMO 9-F Due 04/01/2019...........................................................................................9,000,000 8,881,337 9,154,620 TOTAL 20,659,201 20,227,936 21,009,535
INDUSTRIAL
AIR PRODUCTS & CHEMICALS INC 6.250% MED TERM NOTES Due 02/07/2011...........................................................................................4,600,000 4,485,493 4,298,930
ARCHER-DANIELS-MIDLAND CO 8.125% DEBS Due 06/01/2012...........................................................................................5,000,000 5,000,000 5,506,050 8.375% DEBS Due 04/15/2017...........................................................................................11,925,000 11,940,090 13,443,291
ATLANTIC RICHFIELD CO 8.375% MED TERM NOTES Due 11/15/2011...........................................................................................1,000,000 998,814 1,112,030 8.600% MED TERM NOTES Due 05/15/2012...........................................................................................5,000,000 4,996,621 5,663,250 9.000% DEBS Due 04/01/2021...........................................................................................4,500,000 4,497,903 5,368,050
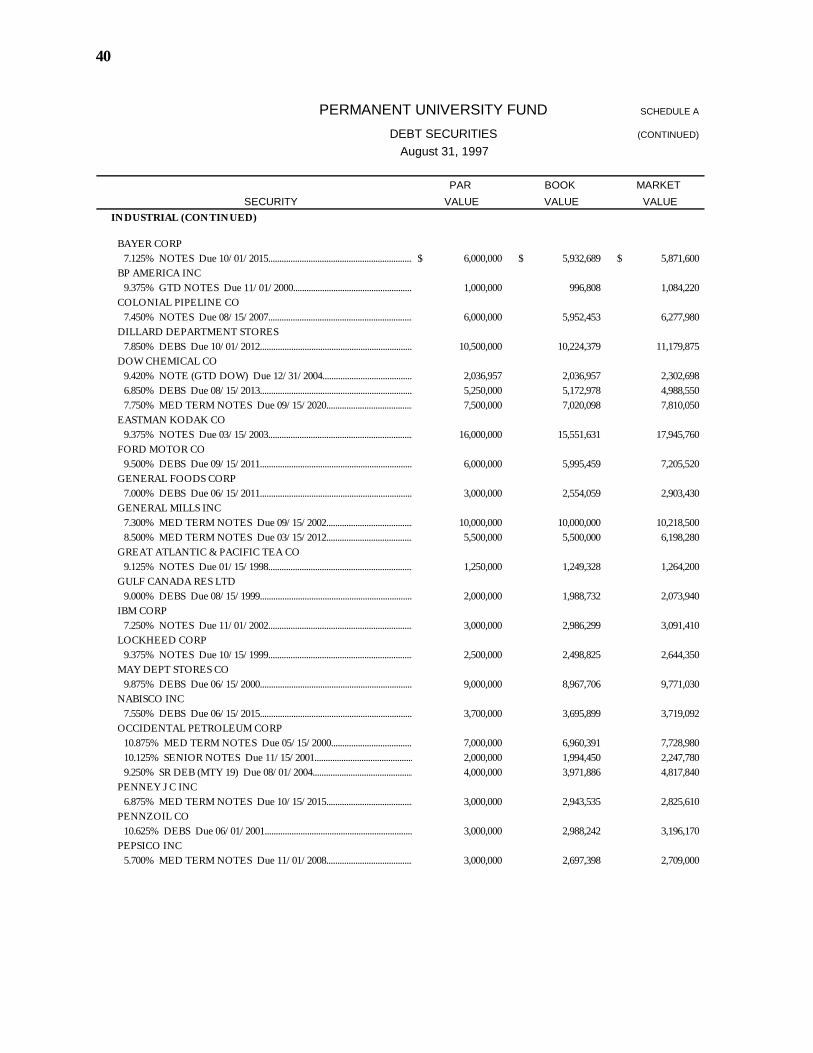
40
PERMANENT UNIVERSITY FUND SCHEDULE A
DEBT SECURITIES (CONTINUED)
August 31, 1997
PAR BOOK MARKETSECURITY VALUE VALUE VALUE
INDUSTRIAL (CONTINUED)
BAYER CORP 7.125% NOTES Due 10/01/2015...........................................................................................6,000,000$ 5,932,689$ 5,871,600$
BP AMERICA INC 9.375% GTD NOTES Due 11/01/2000...........................................................................................1,000,000 996,808 1,084,220
COLONIAL PIPELINE CO 7.450% NOTES Due 08/15/2007...........................................................................................6,000,000 5,952,453 6,277,980
DILLARD DEPARTMENT STORES 7.850% DEBS Due 10/01/2012...........................................................................................10,500,000 10,224,379 11,179,875
DOW CHEMICAL CO 9.420% NOTE (GTD DOW) Due 12/31/2004...........................................................................................2,036,957 2,036,957 2,302,698 6.850% DEBS Due 08/15/2013...........................................................................................5,250,000 5,172,978 4,988,550 7.750% MED TERM NOTES Due 09/15/2020...........................................................................................7,500,000 7,020,098 7,810,050
EASTMAN KODAK CO 9.375% NOTES Due 03/15/2003...........................................................................................16,000,000 15,551,631 17,945,760
FORD MOTOR CO 9.500% DEBS Due 09/15/2011...........................................................................................6,000,000 5,995,459 7,205,520
GENERAL FOODS CORP 7.000% DEBS Due 06/15/2011...........................................................................................3,000,000 2,554,059 2,903,430
GENERAL MILLS INC 7.300% MED TERM NOTES Due 09/15/2002...........................................................................................10,000,000 10,000,000 10,218,500 8.500% MED TERM NOTES Due 03/15/2012...........................................................................................5,500,000 5,500,000 6,198,280
GREAT ATLANTIC & PACIFIC TEA CO 9.125% NOTES Due 01/15/1998...........................................................................................1,250,000 1,249,328 1,264,200
GULF CANADA RES LTD 9.000% DEBS Due 08/15/1999...........................................................................................2,000,000 1,988,732 2,073,940
IBM CORP 7.250% NOTES Due 11/01/2002...........................................................................................3,000,000 2,986,299 3,091,410
LOCKHEED CORP 9.375% NOTES Due 10/15/1999...........................................................................................2,500,000 2,498,825 2,644,350
MAY DEPT STORES CO 9.875% DEBS Due 06/15/2000...........................................................................................9,000,000 8,967,706 9,771,030
NABISCO INC 7.550% DEBS Due 06/15/2015...........................................................................................3,700,000 3,695,899 3,719,092
OCCIDENTAL PETROLEUM CORP 10.875% MED TERM NOTES Due 05/15/2000...........................................................................................7,000,000 6,960,391 7,728,980 10.125% SENIOR NOTES Due 11/15/2001...........................................................................................2,000,000 1,994,450 2,247,780 9.250% SR DEB (MTY 19) Due 08/01/2004...........................................................................................4,000,000 3,971,886 4,817,840
PENNEY J C INC 6.875% MED TERM NOTES Due 10/15/2015...........................................................................................3,000,000 2,943,535 2,825,610
PENNZOIL CO 10.625% DEBS Due 06/01/2001...........................................................................................3,000,000 2,988,242 3,196,170
PEPSICO INC 5.700% MED TERM NOTES Due 11/01/2008...........................................................................................3,000,000 2,697,398 2,709,000
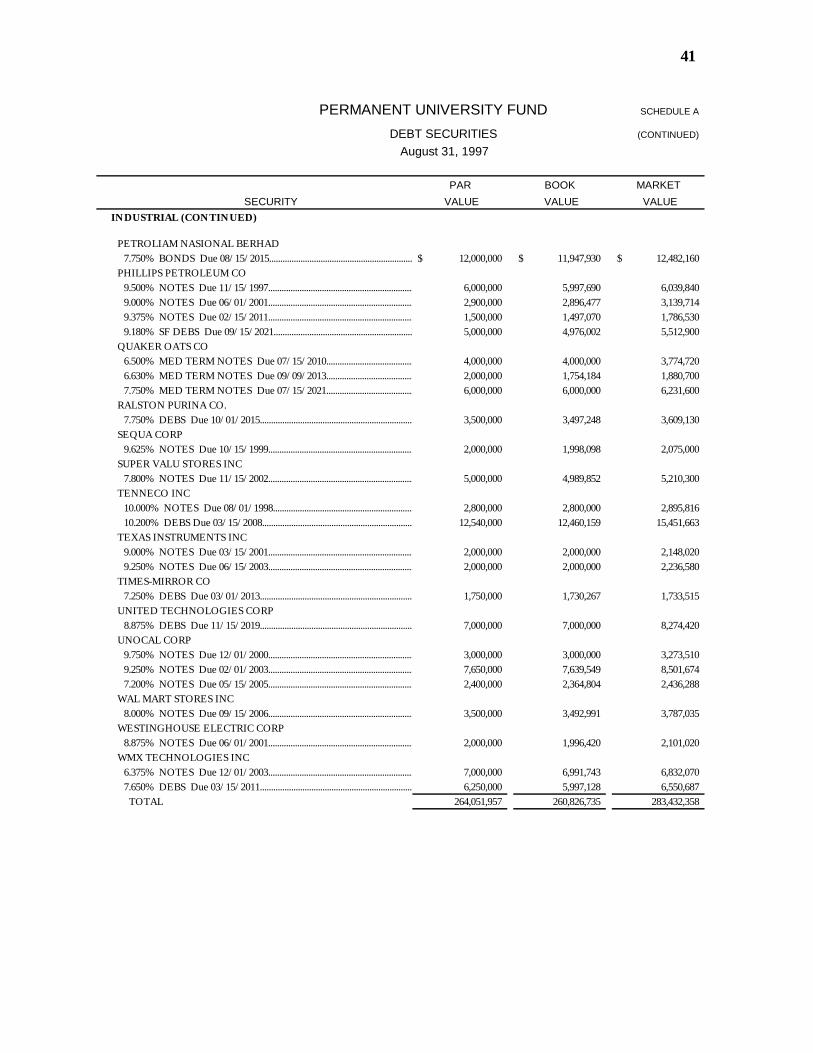
41
PERMANENT UNIVERSITY FUND SCHEDULE A
DEBT SECURITIES (CONTINUED)
August 31, 1997
PAR BOOK MARKETSECURITY VALUE VALUE VALUE
INDUSTRIAL (CONTINUED)
PETROLIAM NASIONAL BERHAD 7.750% BONDS Due 08/15/2015...........................................................................................12,000,000$ 11,947,930$ 12,482,160$
PHILLIPS PETROLEUM CO 9.500% NOTES Due 11/15/1997...........................................................................................6,000,000 5,997,690 6,039,840 9.000% NOTES Due 06/01/2001...........................................................................................2,900,000 2,896,477 3,139,714 9.375% NOTES Due 02/15/2011...........................................................................................1,500,000 1,497,070 1,786,530 9.180% SF DEBS Due 09/15/2021...........................................................................................5,000,000 4,976,002 5,512,900
QUAKER OATS CO 6.500% MED TERM NOTES Due 07/15/2010...........................................................................................4,000,000 4,000,000 3,774,720 6.630% MED TERM NOTES Due 09/09/2013...........................................................................................2,000,000 1,754,184 1,880,700 7.750% MED TERM NOTES Due 07/15/2021...........................................................................................6,000,000 6,000,000 6,231,600
RALSTON PURINA CO. 7.750% DEBS Due 10/01/2015...........................................................................................3,500,000 3,497,248 3,609,130
SEQUA CORP 9.625% NOTES Due 10/15/1999...........................................................................................2,000,000 1,998,098 2,075,000
SUPER VALU STORES INC 7.800% NOTES Due 11/15/2002...........................................................................................5,000,000 4,989,852 5,210,300
TENNECO INC 10.000% NOTES Due 08/01/1998...........................................................................................2,800,000 2,800,000 2,895,816 10.200% DEBS Due 03/15/2008...........................................................................................12,540,000 12,460,159 15,451,663
TEXAS INSTRUMENTS INC 9.000% NOTES Due 03/15/2001...........................................................................................2,000,000 2,000,000 2,148,020 9.250% NOTES Due 06/15/2003...........................................................................................2,000,000 2,000,000 2,236,580
TIMES-MIRROR CO 7.250% DEBS Due 03/01/2013...........................................................................................1,750,000 1,730,267 1,733,515
UNITED TECHNOLOGIES CORP 8.875% DEBS Due 11/15/2019...........................................................................................7,000,000 7,000,000 8,274,420
UNOCAL CORP 9.750% NOTES Due 12/01/2000...........................................................................................3,000,000 3,000,000 3,273,510 9.250% NOTES Due 02/01/2003...........................................................................................7,650,000 7,639,549 8,501,674 7.200% NOTES Due 05/15/2005...........................................................................................2,400,000 2,364,804 2,436,288
WAL MART STORES INC 8.000% NOTES Due 09/15/2006...........................................................................................3,500,000 3,492,991 3,787,035
WESTINGHOUSE ELECTRIC CORP 8.875% NOTES Due 06/01/2001...........................................................................................2,000,000 1,996,420 2,101,020
WMX TECHNOLOGIES INC 6.375% NOTES Due 12/01/2003...........................................................................................7,000,000 6,991,743 6,832,070 7.650% DEBS Due 03/15/2011...........................................................................................6,250,000 5,997,128 6,550,687 TOTAL 264,051,957 260,826,735 283,432,358
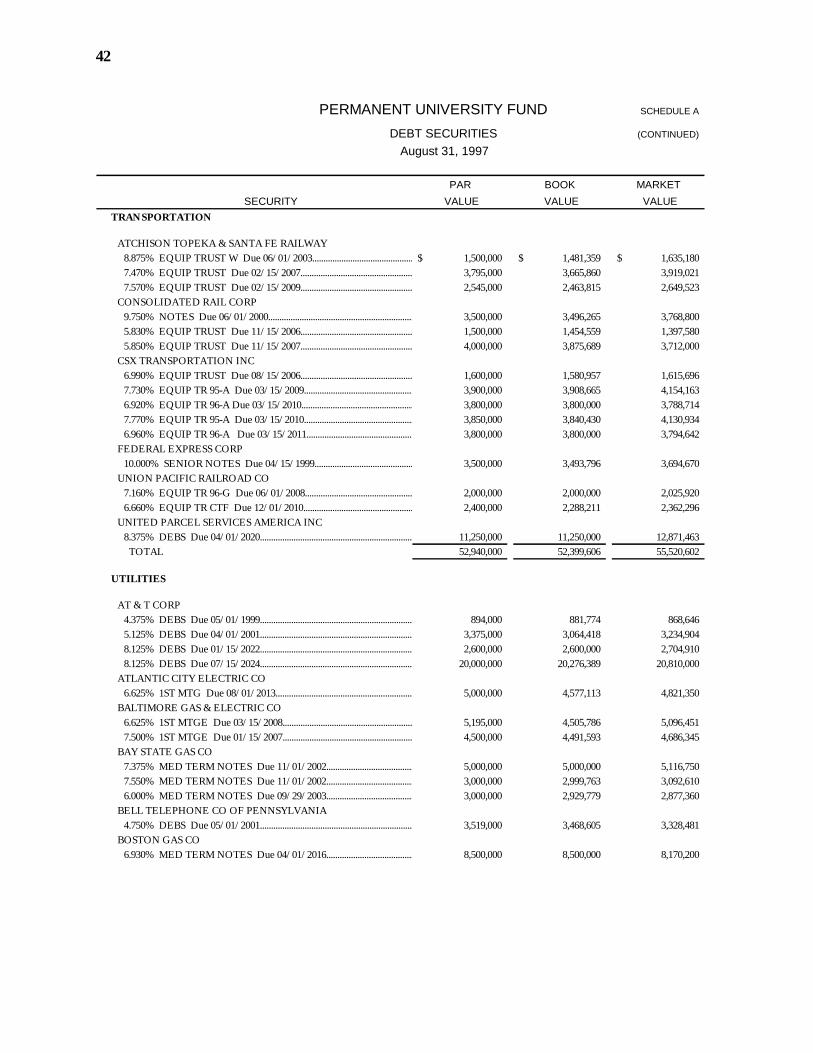
42
PERMANENT UNIVERSITY FUND SCHEDULE A
DEBT SECURITIES (CONTINUED)
August 31, 1997
PAR BOOK MARKETSECURITY VALUE VALUE VALUE
TRANSPORTATION
ATCHISON TOPEKA & SANTA FE RAILWAY 8.875% EQUIP TRUST W Due 06/01/2003...........................................................................................1,500,000$ 1,481,359$ 1,635,180$ 7.470% EQUIP TRUST Due 02/15/2007...........................................................................................3,795,000 3,665,860 3,919,021 7.570% EQUIP TRUST Due 02/15/2009...........................................................................................2,545,000 2,463,815 2,649,523
CONSOLIDATED RAIL CORP 9.750% NOTES Due 06/01/2000...........................................................................................3,500,000 3,496,265 3,768,800 5.830% EQUIP TRUST Due 11/15/2006...........................................................................................1,500,000 1,454,559 1,397,580 5.850% EQUIP TRUST Due 11/15/2007...........................................................................................4,000,000 3,875,689 3,712,000
CSX TRANSPORTATION INC 6.990% EQUIP TRUST Due 08/15/2006...........................................................................................1,600,000 1,580,957 1,615,696 7.730% EQUIP TR 95-A Due 03/15/2009...........................................................................................3,900,000 3,908,665 4,154,163 6.920% EQUIP TR 96-A Due 03/15/2010...........................................................................................3,800,000 3,800,000 3,788,714 7.770% EQUIP TR 95-A Due 03/15/2010...........................................................................................3,850,000 3,840,430 4,130,934 6.960% EQUIP TR 96-A Due 03/15/2011...........................................................................................3,800,000 3,800,000 3,794,642
FEDERAL EXPRESS CORP 10.000% SENIOR NOTES Due 04/15/1999...........................................................................................3,500,000 3,493,796 3,694,670
UNION PACIFIC RAILROAD CO 7.160% EQUIP TR 96-G Due 06/01/2008...........................................................................................2,000,000 2,000,000 2,025,920 6.660% EQUIP TR CTF Due 12/01/2010...........................................................................................2,400,000 2,288,211 2,362,296
UNITED PARCEL SERVICES AMERICA INC 8.375% DEBS Due 04/01/2020...........................................................................................11,250,000 11,250,000 12,871,463 TOTAL 52,940,000 52,399,606 55,520,602
UTILITIES
AT & T CORP 4.375% DEBS Due 05/01/1999........................................................................................... 894,000 881,774 868,646 5.125% DEBS Due 04/01/2001...........................................................................................3,375,000 3,064,418 3,234,904 8.125% DEBS Due 01/15/2022...........................................................................................2,600,000 2,600,000 2,704,910 8.125% DEBS Due 07/15/2024...........................................................................................20,000,000 20,276,389 20,810,000
ATLANTIC CITY ELECTRIC CO 6.625% 1ST MTG Due 08/01/2013...........................................................................................5,000,000 4,577,113 4,821,350
BALTIMORE GAS & ELECTRIC CO 6.625% 1ST MTGE Due 03/15/2008...........................................................................................5,195,000 4,505,786 5,096,451 7.500% 1ST MTGE Due 01/15/2007...........................................................................................4,500,000 4,491,593 4,686,345
BAY STATE GAS CO 7.375% MED TERM NOTES Due 11/01/2002...........................................................................................5,000,000 5,000,000 5,116,750 7.550% MED TERM NOTES Due 11/01/2002...........................................................................................3,000,000 2,999,763 3,092,610 6.000% MED TERM NOTES Due 09/29/2003...........................................................................................3,000,000 2,929,779 2,877,360
BELL TELEPHONE CO OF PENNSYLVANIA 4.750% DEBS Due 05/01/2001...........................................................................................3,519,000 3,468,605 3,328,481
BOSTON GAS CO 6.930% MED TERM NOTES Due 04/01/2016...........................................................................................8,500,000 8,500,000 8,170,200
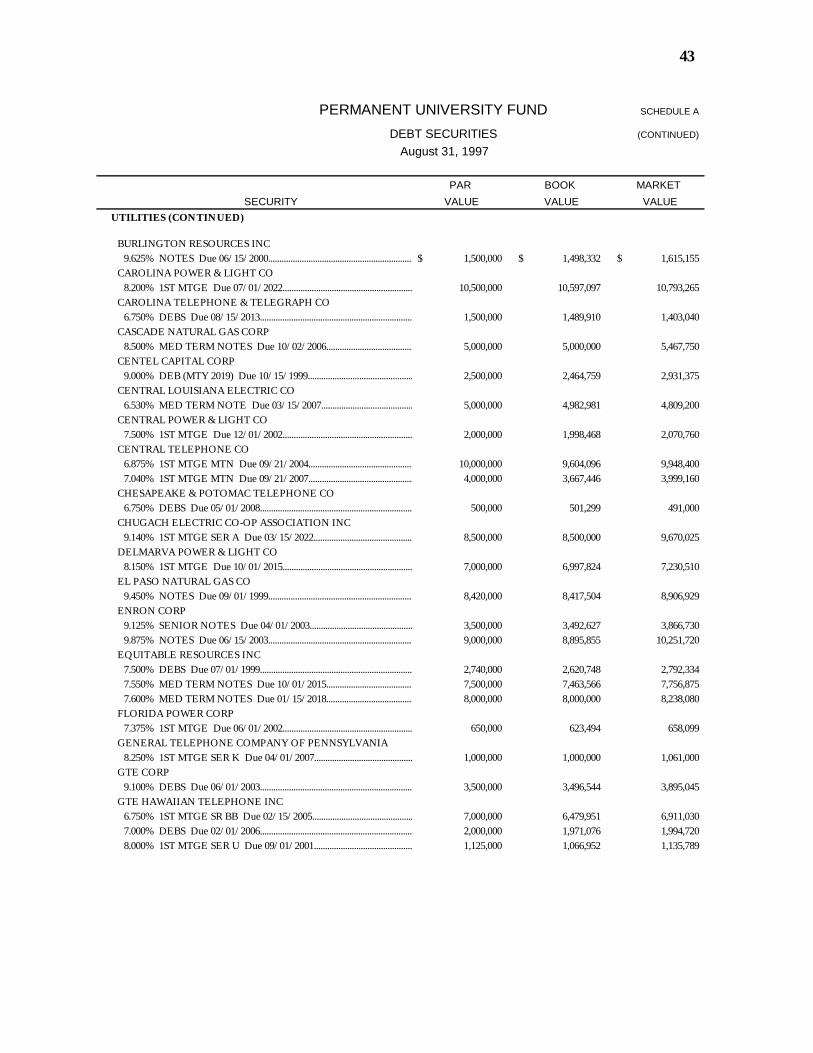
43
PERMANENT UNIVERSITY FUND SCHEDULE A
DEBT SECURITIES (CONTINUED)
August 31, 1997
PAR BOOK MARKETSECURITY VALUE VALUE VALUE
UTILITIES (CONTINUED)
BURLINGTON RESOURCES INC 9.625% NOTES Due 06/15/2000...........................................................................................1,500,000$ 1,498,332$ 1,615,155$
CAROLINA POWER & LIGHT CO 8.200% 1ST MTGE Due 07/01/2022...........................................................................................10,500,000 10,597,097 10,793,265
CAROLINA TELEPHONE & TELEGRAPH CO 6.750% DEBS Due 08/15/2013...........................................................................................1,500,000 1,489,910 1,403,040
CASCADE NATURAL GAS CORP 8.500% MED TERM NOTES Due 10/02/2006...........................................................................................5,000,000 5,000,000 5,467,750
CENTEL CAPITAL CORP 9.000% DEB (MTY 2019) Due 10/15/1999...........................................................................................2,500,000 2,464,759 2,931,375
CENTRAL LOUISIANA ELECTRIC CO 6.530% MED TERM NOTE Due 03/15/2007...........................................................................................5,000,000 4,982,981 4,809,200
CENTRAL POWER & LIGHT CO 7.500% 1ST MTGE Due 12/01/2002...........................................................................................2,000,000 1,998,468 2,070,760
CENTRAL TELEPHONE CO 6.875% 1ST MTGE MTN Due 09/21/2004...........................................................................................10,000,000 9,604,096 9,948,400 7.040% 1ST MTGE MTN Due 09/21/2007...........................................................................................4,000,000 3,667,446 3,999,160
CHESAPEAKE & POTOMAC TELEPHONE CO 6.750% DEBS Due 05/01/2008........................................................................................... 500,000 501,299 491,000
CHUGACH ELECTRIC CO-OP ASSOCIATION INC 9.140% 1ST MTGE SER A Due 03/15/2022...........................................................................................8,500,000 8,500,000 9,670,025
DELMARVA POWER & LIGHT CO 8.150% 1ST MTGE Due 10/01/2015...........................................................................................7,000,000 6,997,824 7,230,510
EL PASO NATURAL GAS CO 9.450% NOTES Due 09/01/1999...........................................................................................8,420,000 8,417,504 8,906,929
ENRON CORP 9.125% SENIOR NOTES Due 04/01/2003...........................................................................................3,500,000 3,492,627 3,866,730 9.875% NOTES Due 06/15/2003...........................................................................................9,000,000 8,895,855 10,251,720
EQUITABLE RESOURCES INC 7.500% DEBS Due 07/01/1999...........................................................................................2,740,000 2,620,748 2,792,334 7.550% MED TERM NOTES Due 10/01/2015...........................................................................................7,500,000 7,463,566 7,756,875 7.600% MED TERM NOTES Due 01/15/2018...........................................................................................8,000,000 8,000,000 8,238,080
FLORIDA POWER CORP 7.375% 1ST MTGE Due 06/01/2002...........................................................................................650,000 623,494 658,099
GENERAL TELEPHONE COMPANY OF PENNSYLVANIA 8.250% 1ST MTGE SER K Due 04/01/2007...........................................................................................1,000,000 1,000,000 1,061,000
GTE CORP 9.100% DEBS Due 06/01/2003...........................................................................................3,500,000 3,496,544 3,895,045
GTE HAWAIIAN TELEPHONE INC 6.750% 1ST MTGE SR BB Due 02/15/2005...........................................................................................7,000,000 6,479,951 6,911,030 7.000% DEBS Due 02/01/2006...........................................................................................2,000,000 1,971,076 1,994,720 8.000% 1ST MTGE SER U Due 09/01/2001...........................................................................................1,125,000 1,066,952 1,135,789
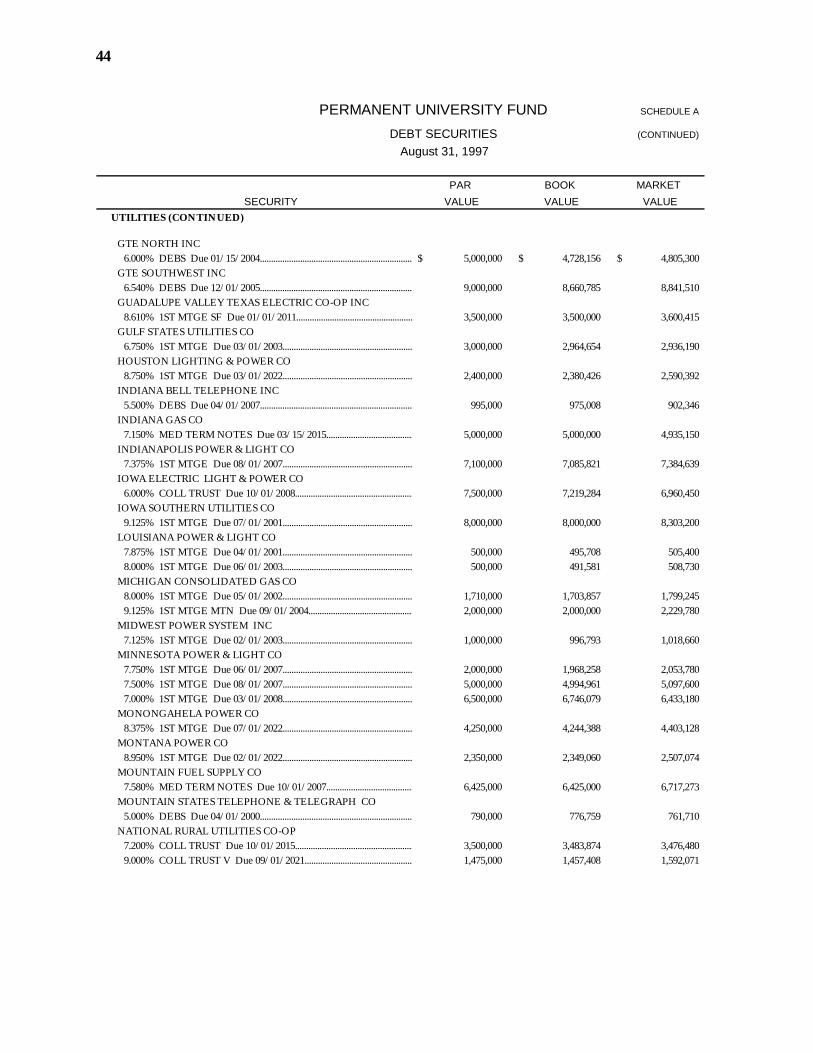
44
PERMANENT UNIVERSITY FUND SCHEDULE A
DEBT SECURITIES (CONTINUED)
August 31, 1997
PAR BOOK MARKETSECURITY VALUE VALUE VALUE
UTILITIES (CONTINUED)
GTE NORTH INC 6.000% DEBS Due 01/15/2004...........................................................................................5,000,000$ 4,728,156$ 4,805,300$
GTE SOUTHWEST INC 6.540% DEBS Due 12/01/2005...........................................................................................9,000,000 8,660,785 8,841,510
GUADALUPE VALLEY TEXAS ELECTRIC CO-OP INC 8.610% 1ST MTGE SF Due 01/01/2011...........................................................................................3,500,000 3,500,000 3,600,415
GULF STATES UTILITIES CO 6.750% 1ST MTGE Due 03/01/2003...........................................................................................3,000,000 2,964,654 2,936,190
HOUSTON LIGHTING & POWER CO 8.750% 1ST MTGE Due 03/01/2022...........................................................................................2,400,000 2,380,426 2,590,392
INDIANA BELL TELEPHONE INC 5.500% DEBS Due 04/01/2007........................................................................................... 995,000 975,008 902,346
INDIANA GAS CO 7.150% MED TERM NOTES Due 03/15/2015...........................................................................................5,000,000 5,000,000 4,935,150
INDIANAPOLIS POWER & LIGHT CO 7.375% 1ST MTGE Due 08/01/2007...........................................................................................7,100,000 7,085,821 7,384,639
IOWA ELECTRIC LIGHT & POWER CO 6.000% COLL TRUST Due 10/01/2008...........................................................................................7,500,000 7,219,284 6,960,450
IOWA SOUTHERN UTILITIES CO 9.125% 1ST MTGE Due 07/01/2001...........................................................................................8,000,000 8,000,000 8,303,200
LOUISIANA POWER & LIGHT CO 7.875% 1ST MTGE Due 04/01/2001...........................................................................................500,000 495,708 505,400 8.000% 1ST MTGE Due 06/01/2003...........................................................................................500,000 491,581 508,730
MICHIGAN CONSOLIDATED GAS CO 8.000% 1ST MTGE Due 05/01/2002...........................................................................................1,710,000 1,703,857 1,799,245 9.125% 1ST MTGE MTN Due 09/01/2004...........................................................................................2,000,000 2,000,000 2,229,780
MIDWEST POWER SYSTEM INC 7.125% 1ST MTGE Due 02/01/2003...........................................................................................1,000,000 996,793 1,018,660
MINNESOTA POWER & LIGHT CO 7.750% 1ST MTGE Due 06/01/2007...........................................................................................2,000,000 1,968,258 2,053,780 7.500% 1ST MTGE Due 08/01/2007...........................................................................................5,000,000 4,994,961 5,097,600 7.000% 1ST MTGE Due 03/01/2008...........................................................................................6,500,000 6,746,079 6,433,180
MONONGAHELA POWER CO 8.375% 1ST MTGE Due 07/01/2022...........................................................................................4,250,000 4,244,388 4,403,128
MONTANA POWER CO 8.950% 1ST MTGE Due 02/01/2022...........................................................................................2,350,000 2,349,060 2,507,074
MOUNTAIN FUEL SUPPLY CO 7.580% MED TERM NOTES Due 10/01/2007...........................................................................................6,425,000 6,425,000 6,717,273
MOUNTAIN STATES TELEPHONE & TELEGRAPH CO 5.000% DEBS Due 04/01/2000........................................................................................... 790,000 776,759 761,710
NATIONAL RURAL UTILITIES CO-OP 7.200% COLL TRUST Due 10/01/2015...........................................................................................3,500,000 3,483,874 3,476,480 9.000% COLL TRUST V Due 09/01/2021...........................................................................................1,475,000 1,457,408 1,592,071
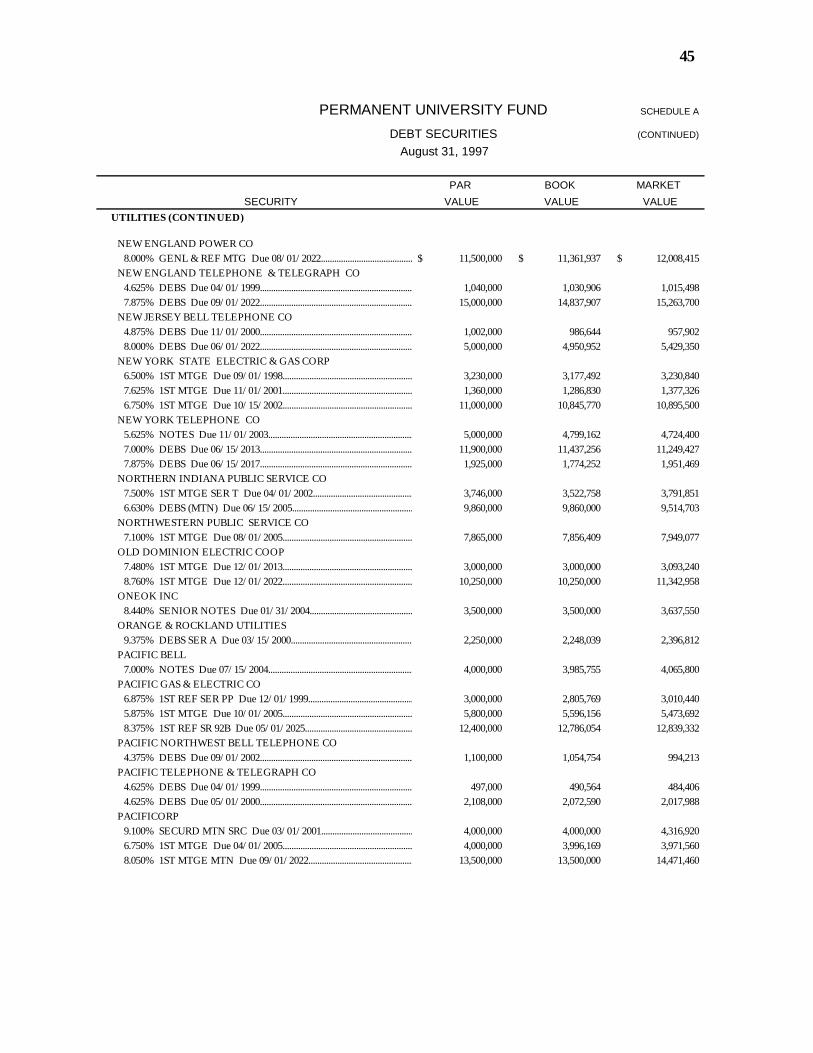
45
PERMANENT UNIVERSITY FUND SCHEDULE A
DEBT SECURITIES (CONTINUED)
August 31, 1997
PAR BOOK MARKETSECURITY VALUE VALUE VALUE
UTILITIES (CONTINUED)
NEW ENGLAND POWER CO 8.000% GENL & REF MTG Due 08/01/2022...........................................................................................11,500,000$ 11,361,937$ 12,008,415$
NEW ENGLAND TELEPHONE & TELEGRAPH CO 4.625% DEBS Due 04/01/1999...........................................................................................1,040,000 1,030,906 1,015,498 7.875% DEBS Due 09/01/2022...........................................................................................15,000,000 14,837,907 15,263,700
NEW JERSEY BELL TELEPHONE CO 4.875% DEBS Due 11/01/2000...........................................................................................1,002,000 986,644 957,902 8.000% DEBS Due 06/01/2022...........................................................................................5,000,000 4,950,952 5,429,350
NEW YORK STATE ELECTRIC & GAS CORP 6.500% 1ST MTGE Due 09/01/1998...........................................................................................3,230,000 3,177,492 3,230,840 7.625% 1ST MTGE Due 11/01/2001...........................................................................................1,360,000 1,286,830 1,377,326 6.750% 1ST MTGE Due 10/15/2002...........................................................................................11,000,000 10,845,770 10,895,500
NEW YORK TELEPHONE CO 5.625% NOTES Due 11/01/2003...........................................................................................5,000,000 4,799,162 4,724,400 7.000% DEBS Due 06/15/2013...........................................................................................11,900,000 11,437,256 11,249,427 7.875% DEBS Due 06/15/2017...........................................................................................1,925,000 1,774,252 1,951,469
NORTHERN INDIANA PUBLIC SERVICE CO 7.500% 1ST MTGE SER T Due 04/01/2002...........................................................................................3,746,000 3,522,758 3,791,851 6.630% DEBS (MTN) Due 06/15/2005...........................................................................................9,860,000 9,860,000 9,514,703
NORTHWESTERN PUBLIC SERVICE CO 7.100% 1ST MTGE Due 08/01/2005...........................................................................................7,865,000 7,856,409 7,949,077
OLD DOMINION ELECTRIC COOP 7.480% 1ST MTGE Due 12/01/2013...........................................................................................3,000,000 3,000,000 3,093,240 8.760% 1ST MTGE Due 12/01/2022...........................................................................................10,250,000 10,250,000 11,342,958
ONEOK INC 8.440% SENIOR NOTES Due 01/31/2004...........................................................................................3,500,000 3,500,000 3,637,550
ORANGE & ROCKLAND UTILITIES 9.375% DEBS SER A Due 03/15/2000...........................................................................................2,250,000 2,248,039 2,396,812
PACIFIC BELL 7.000% NOTES Due 07/15/2004...........................................................................................4,000,000 3,985,755 4,065,800
PACIFIC GAS & ELECTRIC CO 6.875% 1ST REF SER PP Due 12/01/1999...........................................................................................3,000,000 2,805,769 3,010,440 5.875% 1ST MTGE Due 10/01/2005...........................................................................................5,800,000 5,596,156 5,473,692 8.375% 1ST REF SR 92B Due 05/01/2025...........................................................................................12,400,000 12,786,054 12,839,332
PACIFIC NORTHWEST BELL TELEPHONE CO 4.375% DEBS Due 09/01/2002...........................................................................................1,100,000 1,054,754 994,213
PACIFIC TELEPHONE & TELEGRAPH CO 4.625% DEBS Due 04/01/1999........................................................................................... 497,000 490,564 484,406 4.625% DEBS Due 05/01/2000...........................................................................................2,108,000 2,072,590 2,017,988
PACIFICORP 9.100% SECURD MTN SRC Due 03/01/2001...........................................................................................4,000,000 4,000,000 4,316,920 6.750% 1ST MTGE Due 04/01/2005...........................................................................................4,000,000 3,996,169 3,971,560 8.050% 1ST MTGE MTN Due 09/01/2022...........................................................................................13,500,000 13,500,000 14,471,460

46
PERMANENT UNIVERSITY FUND SCHEDULE A
DEBT SECURITIES (CONTINUED)
August 31, 1997
PAR BOOK MARKETSECURITY VALUE VALUE VALUE
UTILITIES (CONTINUED)
PEDERNALES ELECTRIC CO-OP 7.550% 1ST MTGE Due 11/15/2015...........................................................................................6,935,600$ 6,935,600$ 7,107,603$
PENNSYLVANIA ELECTRIC CO 7.400% 1ST MTGE MTN Due 03/01/2003...........................................................................................8,000,000 8,000,000 8,226,000
PENNSYLVANIA POWER & LIGHT CO 6.500% 1ST MTGE Due 04/01/2005...........................................................................................3,000,000 2,978,031 2,922,900 7.375% 1ST MTGE Due 03/01/2014...........................................................................................2,000,000 1,859,226 2,018,820 8.500% 1ST MTGE Due 05/01/2022...........................................................................................5,500,000 5,491,629 5,805,140
PORTLAND GENERAL ELECTRIC CO 7.150% MED TERM NOTE Due 06/15/2007...........................................................................................5,000,000 4,971,487 5,003,600
POTOMAC ELECTRIC POWER 6.500% 1ST MTGE Due 03/15/2008...........................................................................................2,000,000 1,996,592 1,940,640 5.875% 1ST MTGE Due 10/15/2008...........................................................................................3,700,000 3,443,321 3,405,776
PSI ENERGY INC 6.380% 1ST MTGE MTN Due 08/15/2008...........................................................................................5,000,000 5,000,000 4,674,700
PUBLIC SERVICE COMPANY OF NEW MEXICO 7.250% 1ST MTGE Due 04/01/1999...........................................................................................292,000 286,863 292,663
PUBLIC SERVICE ELECTRIC & GAS CO 7.625% 1ST & REF MTGE Due 02/01/2000...........................................................................................1,850,000 1,834,670 1,892,901 6.500% 1ST & REF MTGE Due 05/01/2004...........................................................................................3,000,000 2,967,139 2,948,160
PUBLIC SERVICE COMPANY OF OKLAHOMA 7.375% 1ST MTGE Due 12/01/2004...........................................................................................5,000,000 4,994,815 5,167,000
PUGET SOUND POWER & LIGHT CO 7.750% 1ST MTGE MTN Due 02/01/2007...........................................................................................4,000,000 4,130,230 4,208,000
SOUTH CAROLINA ELECTRIC & GAS CO 7.125% 1ST MTGE Due 06/15/2013...........................................................................................10,710,000 10,577,150 10,699,183
SOUTHERN BELL TELEPHONE & TELEGRAPH 4.750% DEBS Due 09/01/2000...........................................................................................1,830,000 1,793,538 1,746,698 6.000% DEBS Due 10/01/2004........................................................................................... 425,000 424,130 406,695
SOUTHERN NEW ENGLAND TELEPHONE CO 6.125% MED TERM NOTES Due 12/15/2003...........................................................................................6,500,000 6,452,066 6,290,570 7.125% MED TERM NOTES Due 08/01/2007...........................................................................................2,000,000 1,980,612 2,043,740
SOUTHWESTERN BELL CORP 7.000% MED TERM NOTES Due 11/15/2002...........................................................................................5,000,000 5,000,000 5,078,750 7.300% MED TERM NOTES Due 03/01/2003...........................................................................................5,000,000 4,997,490 5,147,450 5.980% MED TERM NOTES Due 10/22/2007...........................................................................................2,000,000 1,995,467 1,854,900 6.030% MED TERM NOTES Due 11/15/2007...........................................................................................3,500,000 3,500,000 3,257,625 7.350% MED TERM NOTES Due 05/24/2010...........................................................................................15,000,000 14,995,350 15,448,950 7.000% DEBS Due 07/01/2015...........................................................................................7,500,000 7,141,737 7,402,725
SOUTHWESTERN PUBLIC SERVICE CO 7.250% 1ST MTGE Due 07/15/2004...........................................................................................3,000,000 2,983,323 3,066,030 6.500% 1ST MTGE Due 03/01/2006...........................................................................................5,000,000 4,997,318 4,885,350 8.250% 1ST MTGE Due 07/15/2022...........................................................................................5,000,000 4,947,385 5,281,750
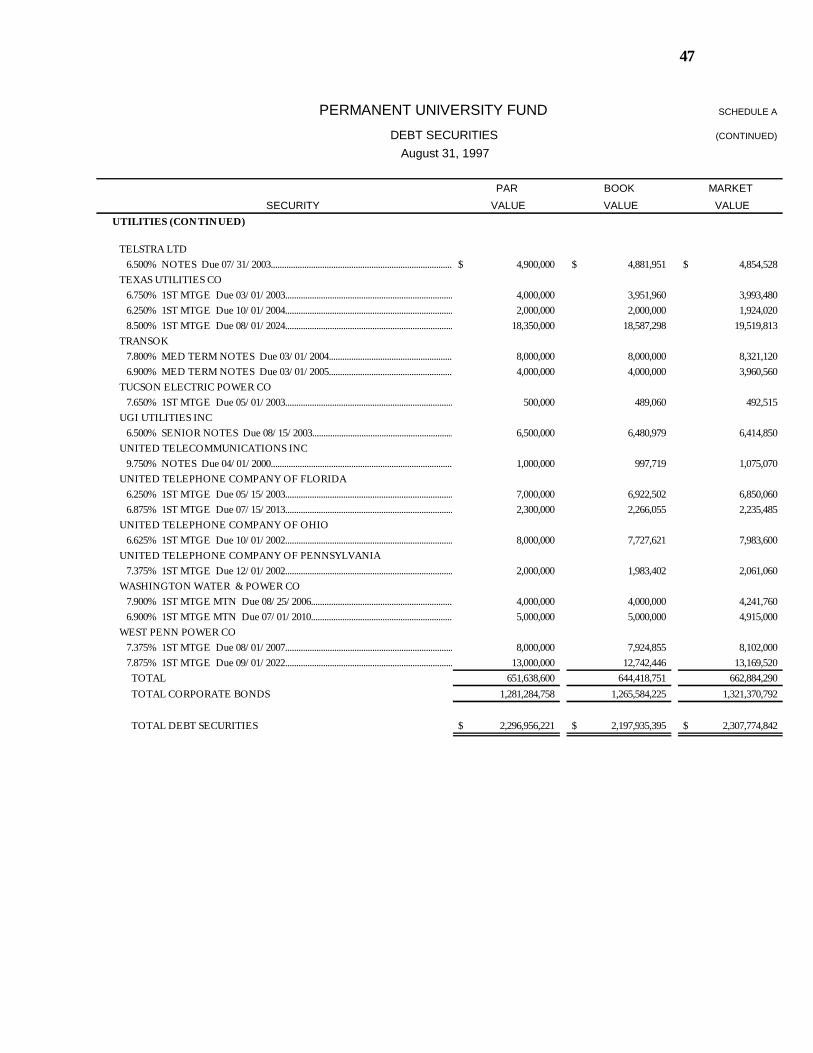
47
PERMANENT UNIVERSITY FUND SCHEDULE A
DEBT SECURITIES (CONTINUED)
August 31, 1997
PAR BOOK MARKET
SECURITY VALUE VALUE VALUEUTILITIES (CONTINUED)
TELSTRA LTD 6.500% NOTES Due 07/31/2003........................................................................................... 4,900,000$ 4,881,951$ 4,854,528$
TEXAS UTILITIES CO 6.750% 1ST MTGE Due 03/01/2003........................................................................................... 4,000,000 3,951,960 3,993,480 6.250% 1ST MTGE Due 10/01/2004........................................................................................... 2,000,000 2,000,000 1,924,020 8.500% 1ST MTGE Due 08/01/2024........................................................................................... 18,350,000 18,587,298 19,519,813
TRANSOK 7.800% MED TERM NOTES Due 03/01/2004...........................................................................................8,000,000 8,000,000 8,321,120 6.900% MED TERM NOTES Due 03/01/2005...........................................................................................4,000,000 4,000,000 3,960,560
TUCSON ELECTRIC POWER CO 7.650% 1ST MTGE Due 05/01/2003........................................................................................... 500,000 489,060 492,515
UGI UTILITIES INC 6.500% SENIOR NOTES Due 08/15/2003...........................................................................................6,500,000 6,480,979 6,414,850
UNITED TELECOMMUNICATIONS INC 9.750% NOTES Due 04/01/2000........................................................................................... 1,000,000 997,719 1,075,070
UNITED TELEPHONE COMPANY OF FLORIDA 6.250% 1ST MTGE Due 05/15/2003........................................................................................... 7,000,000 6,922,502 6,850,060 6.875% 1ST MTGE Due 07/15/2013........................................................................................... 2,300,000 2,266,055 2,235,485
UNITED TELEPHONE COMPANY OF OHIO 6.625% 1ST MTGE Due 10/01/2002........................................................................................... 8,000,000 7,727,621 7,983,600
UNITED TELEPHONE COMPANY OF PENNSYLVANIA7.375% 1ST MTGE Due 12/01/2002........................................................................................... 2,000,000 1,983,402 2,061,060
WASHINGTON WATER & POWER CO 7.900% 1ST MTGE MTN Due 08/25/2006........................................................................................... 4,000,000 4,000,000 4,241,760 6.900% 1ST MTGE MTN Due 07/01/2010........................................................................................... 5,000,000 5,000,000 4,915,000
WEST PENN POWER CO 7.375% 1ST MTGE Due 08/01/2007........................................................................................... 8,000,000 7,924,855 8,102,000 7.875% 1ST MTGE Due 09/01/2022........................................................................................... 13,000,000 12,742,446 13,169,520 TOTAL 651,638,600 644,418,751 662,884,290 TOTAL CORPORATE BONDS 1,281,284,758 1,265,584,225 1,321,370,792
TOTAL DEBT SECURITIES 2,296,956,221$ 2,197,935,395$ 2,307,774,842$
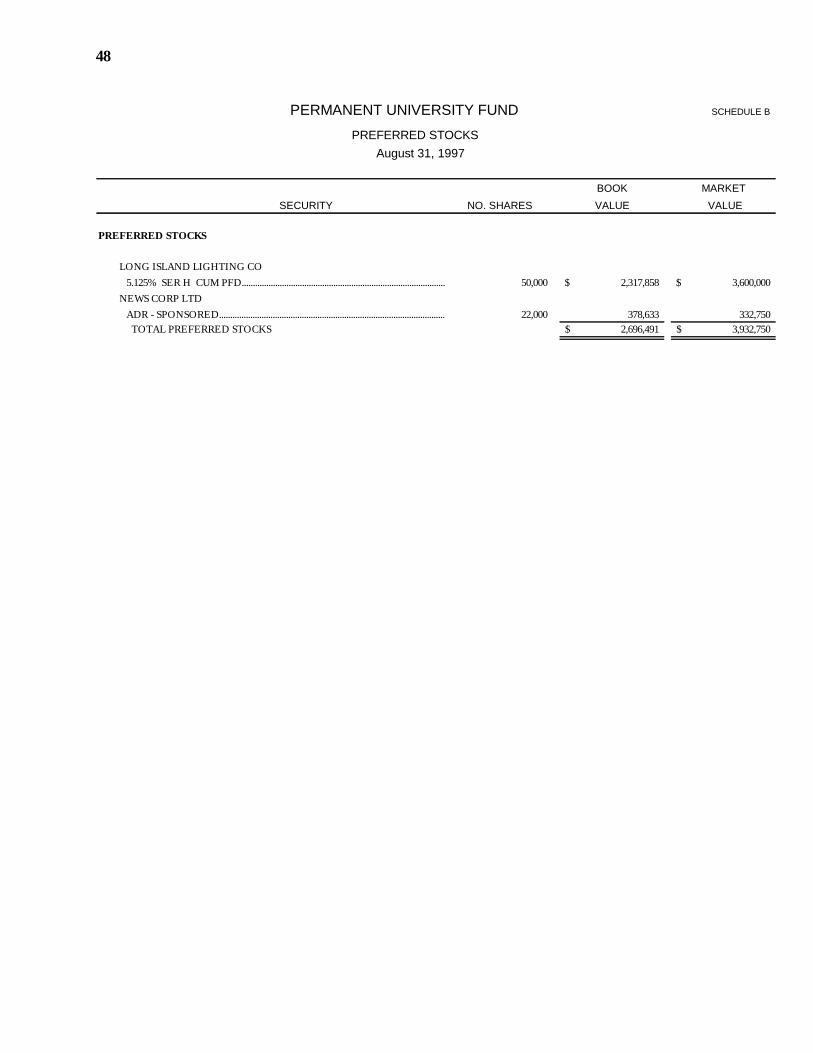
48
PERMANENT UNIVERSITY FUND SCHEDULE B
PREFERRED STOCKS August 31, 1997
BOOK MARKET
SECURITY NO. SHARES VALUE VALUE
PREFERRED STOCKS
LONG ISLAND LIGHTING CO5.125% SER H CUM PFD..................................................................................................................... 50,000 2,317,858$ 3,600,000$
NEWS CORP LTDADR - SPONSORED..................................................................................................................... 22,000 378,633 332,750 TOTAL PREFERRED STOCKS 2,696,491$ 3,932,750$
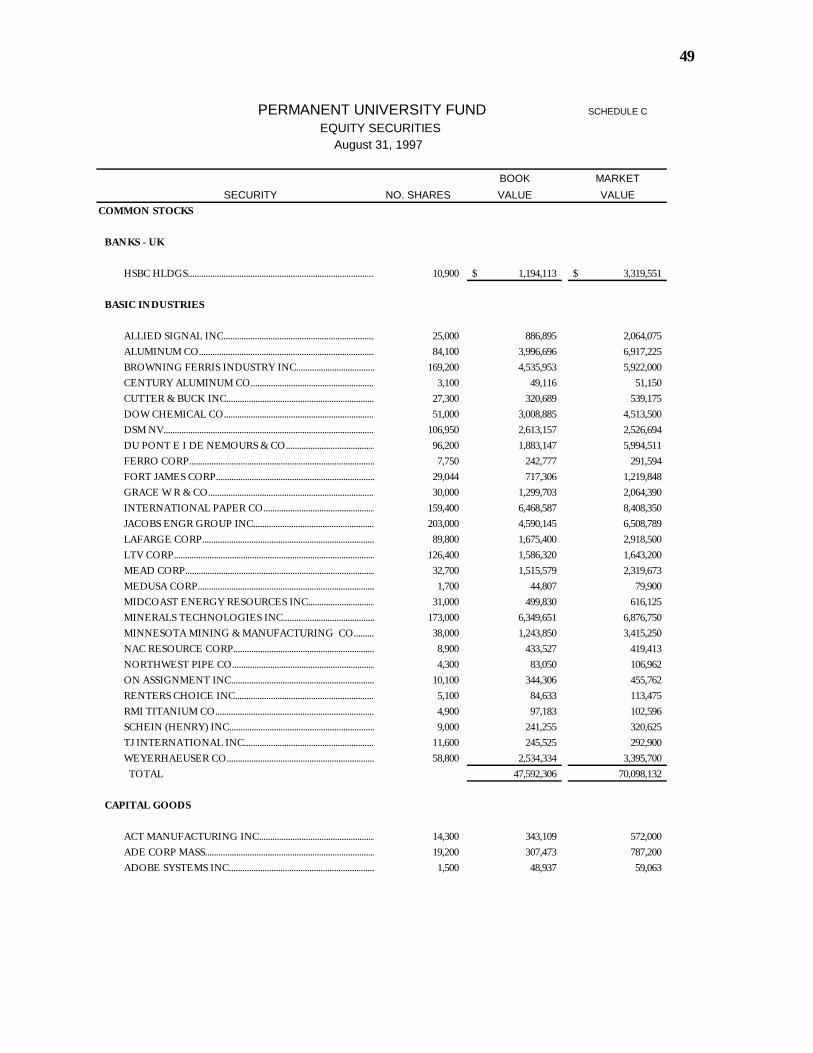
49
PERMANENT UNIVERSITY FUND SCHEDULE C
EQUITY SECURITIES August 31, 1997
BOOK MARKET SECURITY NO. SHARES VALUE VALUE
COMMON STOCKS
BANKS - UK
HSBC HLDGS.....................................................................................................................10,900 1,194,113$ 3,319,551$
BASIC INDUSTRIES
ALLIED SIGNAL INC.....................................................................................................................25,000 886,895 2,064,075 ALUMINUM CO.....................................................................................................................84,100 3,996,696 6,917,225 BROWNING FERRIS INDUSTRY INC.....................................................................................................................169,200 4,535,953 5,922,000 CENTURY ALUMINUM CO.....................................................................................................................3,100 49,116 51,150 CUTTER & BUCK INC.....................................................................................................................27,300 320,689 539,175 DOW CHEMICAL CO.....................................................................................................................51,000 3,008,885 4,513,500 DSM NV..................................................................................................................... 106,950 2,613,157 2,526,694 DU PONT E I DE NEMOURS & CO.....................................................................................................................96,200 1,883,147 5,994,511 FERRO CORP.....................................................................................................................7,750 242,777 291,594 FORT JAMES CORP.....................................................................................................................29,044 717,306 1,219,848 GRACE W R & CO.....................................................................................................................30,000 1,299,703 2,064,390 INTERNATIONAL PAPER CO.....................................................................................................................159,400 6,468,587 8,408,350 JACOBS ENGR GROUP INC.....................................................................................................................203,000 4,590,145 6,508,789 LAFARGE CORP.....................................................................................................................89,800 1,675,400 2,918,500 LTV CORP.....................................................................................................................126,400 1,586,320 1,643,200 MEAD CORP.....................................................................................................................32,700 1,515,579 2,319,673 MEDUSA CORP.....................................................................................................................1,700 44,807 79,900 MIDCOAST ENERGY RESOURCES INC.....................................................................................................................31,000 499,830 616,125 MINERALS TECHNOLOGIES INC.....................................................................................................................173,000 6,349,651 6,876,750 MINNESOTA MINING & MANUFACTURING CO.....................................................................................................................38,000 1,243,850 3,415,250 NAC RESOURCE CORP.....................................................................................................................8,900 433,527 419,413 NORTHWEST PIPE CO.....................................................................................................................4,300 83,050 106,962 ON ASSIGNMENT INC.....................................................................................................................10,100 344,306 455,762 RENTERS CHOICE INC.....................................................................................................................5,100 84,633 113,475 RMI TITANIUM CO.....................................................................................................................4,900 97,183 102,596 SCHEIN (HENRY) INC.....................................................................................................................9,000 241,255 320,625 TJ INTERNATIONAL INC.....................................................................................................................11,600 245,525 292,900 WEYERHAEUSER CO.....................................................................................................................58,800 2,534,334 3,395,700 TOTAL 47,592,306 70,098,132
CAPITAL GOODS
ACT MANUFACTURING INC.....................................................................................................................14,300 343,109 572,000 ADE CORP MASS.....................................................................................................................19,200 307,473 787,200 ADOBE SYSTEMS INC.....................................................................................................................1,500 48,937 59,063
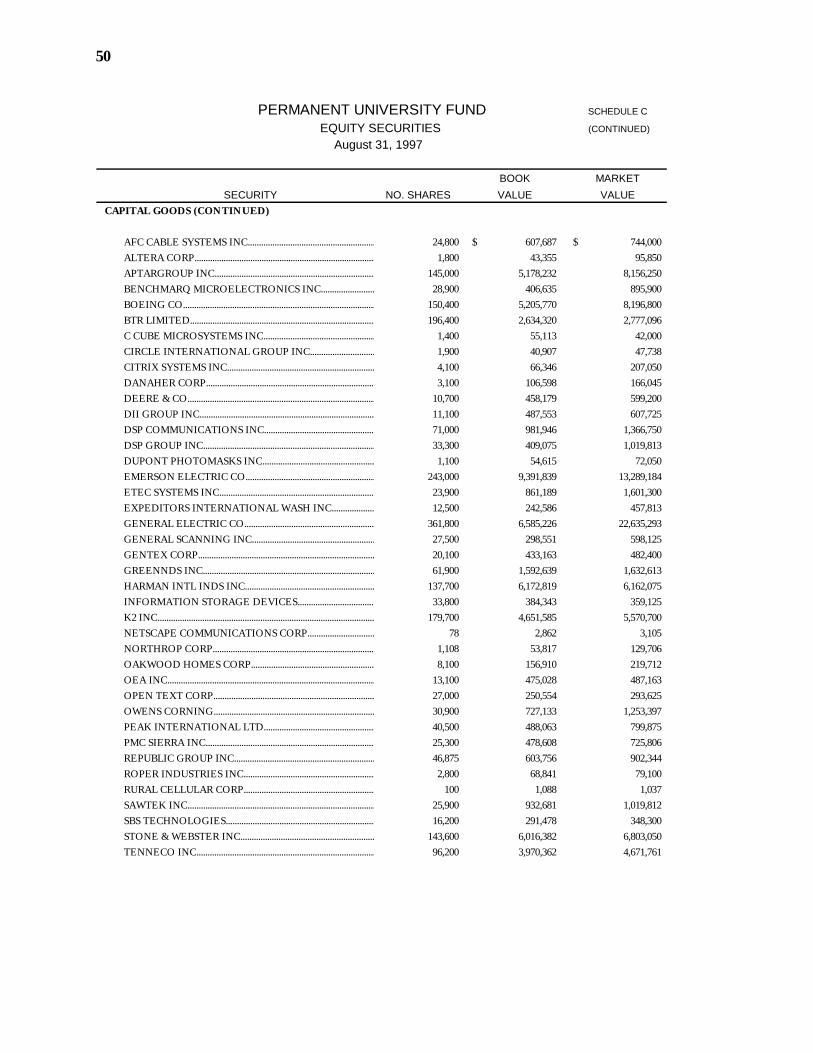
50
PERMANENT UNIVERSITY FUND SCHEDULE C
EQUITY SECURITIES (CONTINUED)
August 31, 1997
BOOK MARKET SECURITY NO. SHARES VALUE VALUE
CAPITAL GOODS (CONTINUED)
AFC CABLE SYSTEMS INC.....................................................................................................................24,800 607,687$ 744,000$ ALTERA CORP.....................................................................................................................1,800 43,355 95,850 APTARGROUP INC.....................................................................................................................145,000 5,178,232 8,156,250 BENCHMARQ MICROELECTRONICS INC.....................................................................................................................28,900 406,635 895,900 BOEING CO.....................................................................................................................150,400 5,205,770 8,196,800 BTR LIMITED.....................................................................................................................196,400 2,634,320 2,777,096 C CUBE MICROSYSTEMS INC.....................................................................................................................1,400 55,113 42,000 CIRCLE INTERNATIONAL GROUP INC.....................................................................................................................1,900 40,907 47,738 CITRIX SYSTEMS INC.....................................................................................................................4,100 66,346 207,050 DANAHER CORP.....................................................................................................................3,100 106,598 166,045 DEERE & CO.....................................................................................................................10,700 458,179 599,200 DII GROUP INC.....................................................................................................................11,100 487,553 607,725 DSP COMMUNICATIONS INC.....................................................................................................................71,000 981,946 1,366,750 DSP GROUP INC.....................................................................................................................33,300 409,075 1,019,813 DUPONT PHOTOMASKS INC.....................................................................................................................1,100 54,615 72,050 EMERSON ELECTRIC CO.....................................................................................................................243,000 9,391,839 13,289,184 ETEC SYSTEMS INC.....................................................................................................................23,900 861,189 1,601,300 EXPEDITORS INTERNATIONAL WASH INC.....................................................................................................................12,500 242,586 457,813 GENERAL ELECTRIC CO.....................................................................................................................361,800 6,585,226 22,635,293 GENERAL SCANNING INC.....................................................................................................................27,500 298,551 598,125 GENTEX CORP.....................................................................................................................20,100 433,163 482,400 GREENNDS INC.....................................................................................................................61,900 1,592,639 1,632,613 HARMAN INTL INDS INC.....................................................................................................................137,700 6,172,819 6,162,075 INFORMATION STORAGE DEVICES.....................................................................................................................33,800 384,343 359,125 K2 INC..................................................................................................................... 179,700 4,651,585 5,570,700 NETSCAPE COMMUNICATIONS CORP.....................................................................................................................78 2,862 3,105 NORTHROP CORP.....................................................................................................................1,108 53,817 129,706 OAKWOOD HOMES CORP.....................................................................................................................8,100 156,910 219,712 OEA INC..................................................................................................................... 13,100 475,028 487,163 OPEN TEXT CORP.....................................................................................................................27,000 250,554 293,625 OWENS CORNING.....................................................................................................................30,900 727,133 1,253,397 PEAK INTERNATIONAL LTD.....................................................................................................................40,500 488,063 799,875 PMC SIERRA INC.....................................................................................................................25,300 478,608 725,806 REPUBLIC GROUP INC.....................................................................................................................46,875 603,756 902,344 ROPER INDUSTRIES INC.....................................................................................................................2,800 68,841 79,100 RURAL CELLULAR CORP.....................................................................................................................100 1,088 1,037 SAWTEK INC.....................................................................................................................25,900 932,681 1,019,812 SBS TECHNOLOGIES.....................................................................................................................16,200 291,478 348,300 STONE & WEBSTER INC.....................................................................................................................143,600 6,016,382 6,803,050 TENNECO INC.....................................................................................................................96,200 3,970,362 4,671,761

51
PERMANENT UNIVERSITY FUND SCHEDULE C
EQUITY SECURITIES (CONTINUED)
August 31, 1997
BOOK MARKET SECURITY NO. SHARES VALUE VALUE
CAPITAL GOODS (CONTINUED)
THERMEDICS DETECTION INC.....................................................................................................................40,600 424,599$ 416,150$ THERMO ELECTRON CORP.....................................................................................................................15,000 465,486 603,750 THOMAS & BETTS CORP.....................................................................................................................111,200 4,947,289 6,227,200 THREE FIVE SYSTEMS INC.....................................................................................................................20,600 445,900 505,998 TRACOR INC.....................................................................................................................6,900 151,628 207,862 TRIQUINT SEMICONDUCTOR INC.....................................................................................................................6,400 203,076 236,800 U S HOME CORP.....................................................................................................................3,500 74,696 123,595 UNIPHASE CORP.....................................................................................................................18,500 175,481 1,262,625 VALMONT INDUSTRIES.....................................................................................................................143,800 2,915,368 3,019,800 VARLEN CORP.....................................................................................................................15,300 425,806 498,214 WATERS CORP.....................................................................................................................141,800 3,062,686 4,723,783 WYMAN GORDON CO.....................................................................................................................260,000 3,256,338 7,101,380 TOTAL 79,115,706 121,866,108
CONSUMER DURABLES
3D LABS INC.....................................................................................................................11,000 330,350 435,875 ALTRIS SOFTWARE INC.....................................................................................................................35,000 310,734 323,750 AXENT TECHNOLOGIES INC.....................................................................................................................24,700 429,322 447,688 BE AEROSPACE INC.....................................................................................................................17,000 426,092 603,500 CHOICEPOINT INC.....................................................................................................................9,460 338,917 335,830 CHRYSLER CORP.....................................................................................................................260,000 7,717,191 9,132,500 COACHMEN INDUSTRY INC.....................................................................................................................2,100 37,025 38,850 D R HORTON INC.....................................................................................................................4,300 61,840 66,650 FORD MOTOR CO.....................................................................................................................225,357 6,656,115 9,690,351 GOODYEAR TIRE & RUBBER CO.....................................................................................................................28,200 961,283 1,737,825 HARBINGER CORP.....................................................................................................................24,700 713,466 864,500 IMNET SYSTEM INC.....................................................................................................................28,100 515,003 927,300 INTEGRATED CIRCUIT SYSTEMS INC.....................................................................................................................33,800 527,867 1,166,100 INTERLINK COMPUTER SCIENCES INC.....................................................................................................................35,000 413,188 225,330 NICE SYSTEMS LTD.....................................................................................................................1,000 32,550 39,938 OSICOM TECHNOLOGIES INC.....................................................................................................................55,600 620,720 205,053 PEGASYSTEM INC.....................................................................................................................8,000 167,000 215,504 PORTUGAL TELECOMMUNICATIONS.....................................................................................................................22,600 425,086 830,550 PREMIERE TECHNOLOGIES INC.....................................................................................................................17,800 442,519 552,921 PREMISYS COMMUNICATIONS INC.....................................................................................................................121,136 2,180,448 2,506,062 ROGUE WAVE SOFTWARE INC.....................................................................................................................43,700 635,160 639,112 SIMULATION SCIENCES INC.....................................................................................................................33,300 554,022 470,363 SPECTRALINK CORP.....................................................................................................................6,300 27,966 29,138 STERLING COMMUNICATIONS INC.....................................................................................................................4,000 92,856 132,252 SYKES ENTERPRISES INC.....................................................................................................................14,350 334,774 383,862
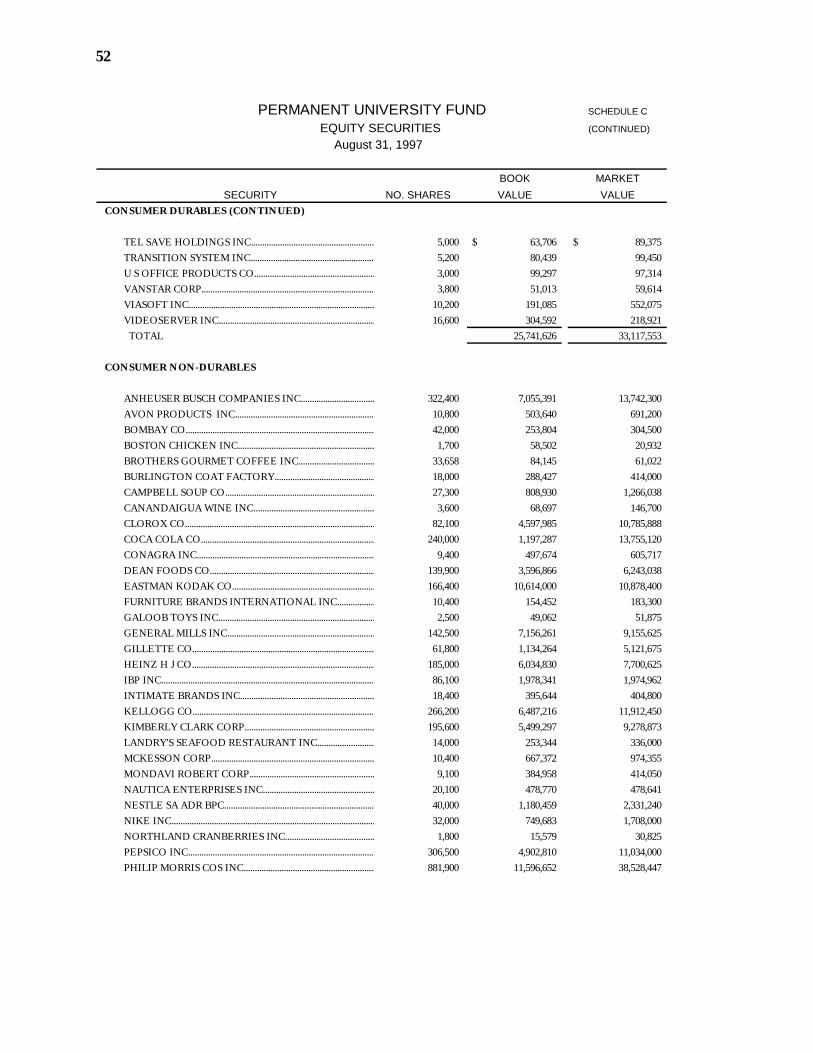
52
PERMANENT UNIVERSITY FUND SCHEDULE C
EQUITY SECURITIES (CONTINUED)
August 31, 1997
BOOK MARKET SECURITY NO. SHARES VALUE VALUE
CONSUMER DURABLES (CONTINUED)
TEL SAVE HOLDINGS INC.....................................................................................................................5,000 63,706$ 89,375$ TRANSITION SYSTEM INC.....................................................................................................................5,200 80,439 99,450 U S OFFICE PRODUCTS CO.....................................................................................................................3,000 99,297 97,314 VANSTAR CORP.....................................................................................................................3,800 51,013 59,614 VIASOFT INC.....................................................................................................................10,200 191,085 552,075 VIDEOSERVER INC.....................................................................................................................16,600 304,592 218,921 TOTAL 25,741,626 33,117,553
CONSUMER NON-DURABLES
ANHEUSER BUSCH COMPANIES INC.....................................................................................................................322,400 7,055,391 13,742,300 AVON PRODUCTS INC.....................................................................................................................10,800 503,640 691,200 BOMBAY CO.....................................................................................................................42,000 253,804 304,500 BOSTON CHICKEN INC.....................................................................................................................1,700 58,502 20,932 BROTHERS GOURMET COFFEE INC.....................................................................................................................33,658 84,145 61,022 BURLINGTON COAT FACTORY.....................................................................................................................18,000 288,427 414,000 CAMPBELL SOUP CO.....................................................................................................................27,300 808,930 1,266,038 CANANDAIGUA WINE INC.....................................................................................................................3,600 68,697 146,700 CLOROX CO.....................................................................................................................82,100 4,597,985 10,785,888 COCA COLA CO.....................................................................................................................240,000 1,197,287 13,755,120 CONAGRA INC.....................................................................................................................9,400 497,674 605,717 DEAN FOODS CO.....................................................................................................................139,900 3,596,866 6,243,038 EASTMAN KODAK CO.....................................................................................................................166,400 10,614,000 10,878,400 FURNITURE BRANDS INTERNATIONAL INC.....................................................................................................................10,400 154,452 183,300 GALOOB TOYS INC.....................................................................................................................2,500 49,062 51,875 GENERAL MILLS INC.....................................................................................................................142,500 7,156,261 9,155,625 GILLETTE CO.....................................................................................................................61,800 1,134,264 5,121,675 HEINZ H J CO.....................................................................................................................185,000 6,034,830 7,700,625 IBP INC..................................................................................................................... 86,100 1,978,341 1,974,962 INTIMATE BRANDS INC.....................................................................................................................18,400 395,644 404,800 KELLOGG CO.....................................................................................................................266,200 6,487,216 11,912,450 KIMBERLY CLARK CORP.....................................................................................................................195,600 5,499,297 9,278,873 LANDRY'S SEAFOOD RESTAURANT INC.....................................................................................................................14,000 253,344 336,000 MCKESSON CORP.....................................................................................................................10,400 667,372 974,355 MONDAVI ROBERT CORP.....................................................................................................................9,100 384,958 414,050 NAUTICA ENTERPRISES INC.....................................................................................................................20,100 478,770 478,641 NESTLE SA ADR BPC.....................................................................................................................40,000 1,180,459 2,331,240 NIKE INC.....................................................................................................................32,000 749,683 1,708,000 NORTHLAND CRANBERRIES INC.....................................................................................................................1,800 15,579 30,825 PEPSICO INC.....................................................................................................................306,500 4,902,810 11,034,000 PHILIP MORRIS COS INC.....................................................................................................................881,900 11,596,652 38,528,447
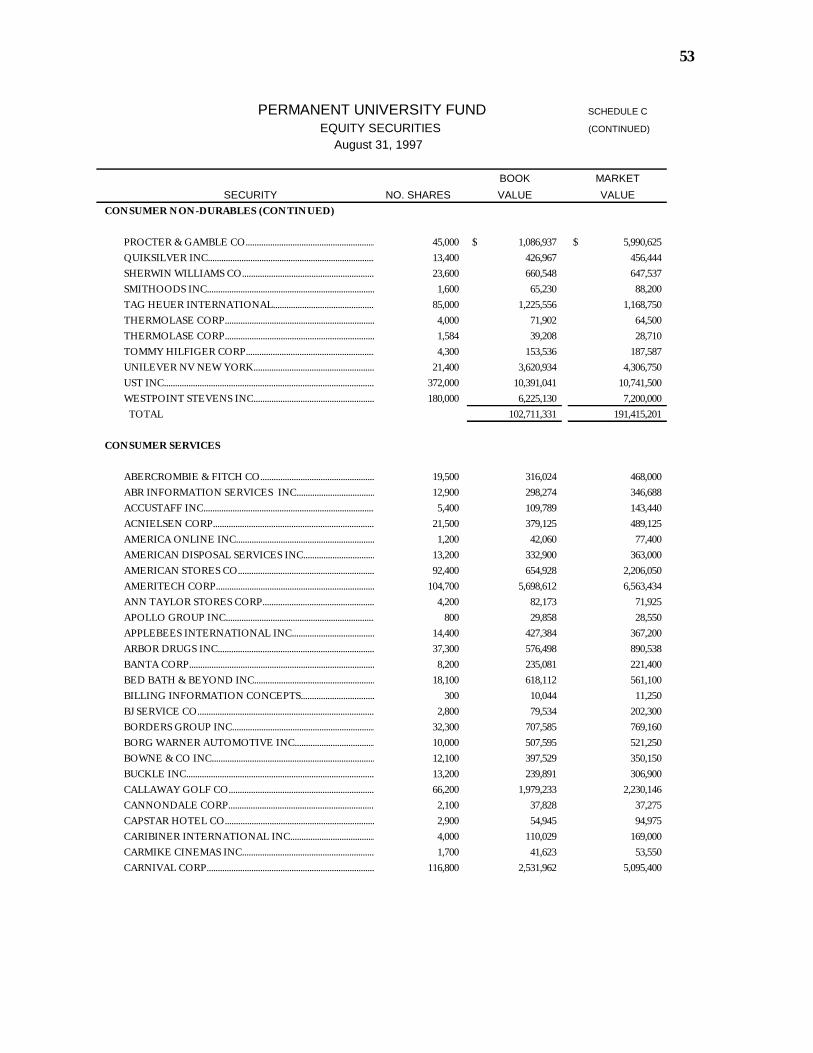
53
PERMANENT UNIVERSITY FUND SCHEDULE C
EQUITY SECURITIES (CONTINUED)
August 31, 1997
BOOK MARKET SECURITY NO. SHARES VALUE VALUE
CONSUMER NON-DURABLES (CONTINUED)
PROCTER & GAMBLE CO.....................................................................................................................45,000 1,086,937$ 5,990,625$ QUIKSILVER INC.....................................................................................................................13,400 426,967 456,444 SHERWIN WILLIAMS CO.....................................................................................................................23,600 660,548 647,537 SMITHOODS INC.....................................................................................................................1,600 65,230 88,200 TAG HEUER INTERNATIONAL.....................................................................................................................85,000 1,225,556 1,168,750 THERMOLASE CORP.....................................................................................................................4,000 71,902 64,500 THERMOLASE CORP.....................................................................................................................1,584 39,208 28,710 TOMMY HILFIGER CORP.....................................................................................................................4,300 153,536 187,587 UNILEVER NV NEW YORK.....................................................................................................................21,400 3,620,934 4,306,750 UST INC..................................................................................................................... 372,000 10,391,041 10,741,500 WESTPOINT STEVENS INC.....................................................................................................................180,000 6,225,130 7,200,000 TOTAL 102,711,331 191,415,201
CONSUMER SERVICES
ABERCROMBIE & FITCH CO.....................................................................................................................19,500 316,024 468,000 ABR INFORMATION SERVICES INC.....................................................................................................................12,900 298,274 346,688 ACCUSTAFF INC.....................................................................................................................5,400 109,789 143,440 ACNIELSEN CORP.....................................................................................................................21,500 379,125 489,125 AMERICA ONLINE INC.....................................................................................................................1,200 42,060 77,400 AMERICAN DISPOSAL SERVICES INC.....................................................................................................................13,200 332,900 363,000 AMERICAN STORES CO.....................................................................................................................92,400 654,928 2,206,050 AMERITECH CORP.....................................................................................................................104,700 5,698,612 6,563,434 ANN TAYLOR STORES CORP.....................................................................................................................4,200 82,173 71,925 APOLLO GROUP INC.....................................................................................................................800 29,858 28,550 APPLEBEES INTERNATIONAL INC.....................................................................................................................14,400 427,384 367,200 ARBOR DRUGS INC.....................................................................................................................37,300 576,498 890,538 BANTA CORP.....................................................................................................................8,200 235,081 221,400 BED BATH & BEYOND INC.....................................................................................................................18,100 618,112 561,100 BILLING INFORMATION CONCEPTS.....................................................................................................................300 10,044 11,250 BJ SERVICE CO.....................................................................................................................2,800 79,534 202,300 BORDERS GROUP INC.....................................................................................................................32,300 707,585 769,160 BORG WARNER AUTOMOTIVE INC.....................................................................................................................10,000 507,595 521,250 BOWNE & CO INC.....................................................................................................................12,100 397,529 350,150 BUCKLE INC.....................................................................................................................13,200 239,891 306,900 CALLAWAY GOLF CO.....................................................................................................................66,200 1,979,233 2,230,146 CANNONDALE CORP.....................................................................................................................2,100 37,828 37,275 CAPSTAR HOTEL CO.....................................................................................................................2,900 54,945 94,975 CARIBINER INTERNATIONAL INC.....................................................................................................................4,000 110,029 169,000 CARMIKE CINEMAS INC.....................................................................................................................1,700 41,623 53,550 CARNIVAL CORP.....................................................................................................................116,800 2,531,962 5,095,400
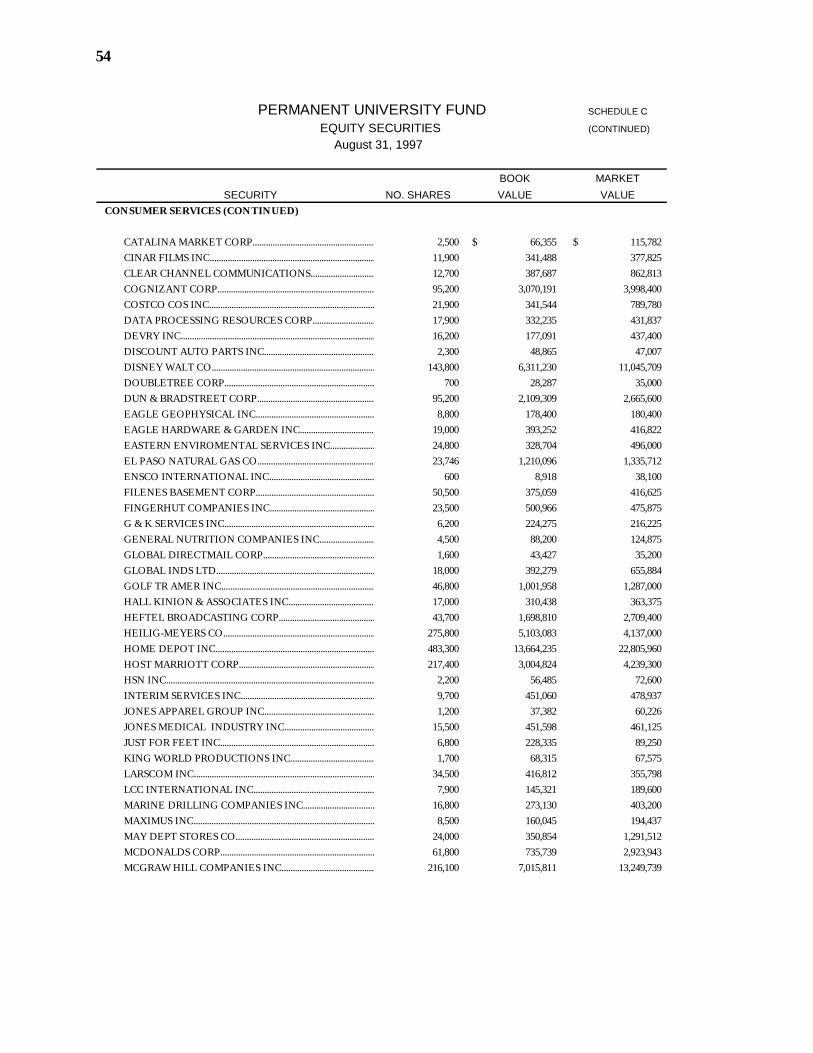
54
PERMANENT UNIVERSITY FUND SCHEDULE C
EQUITY SECURITIES (CONTINUED)
August 31, 1997
BOOK MARKET SECURITY NO. SHARES VALUE VALUE
CONSUMER SERVICES (CONTINUED)
CATALINA MARKET CORP.....................................................................................................................2,500 66,355$ 115,782$ CINAR FILMS INC.....................................................................................................................11,900 341,488 377,825 CLEAR CHANNEL COMMUNICATIONS.....................................................................................................................12,700 387,687 862,813 COGNIZANT CORP.....................................................................................................................95,200 3,070,191 3,998,400 COSTCO COS INC.....................................................................................................................21,900 341,544 789,780 DATA PROCESSING RESOURCES CORP.....................................................................................................................17,900 332,235 431,837 DEVRY INC.....................................................................................................................16,200 177,091 437,400 DISCOUNT AUTO PARTS INC.....................................................................................................................2,300 48,865 47,007 DISNEY WALT CO.....................................................................................................................143,800 6,311,230 11,045,709 DOUBLETREE CORP.....................................................................................................................700 28,287 35,000 DUN & BRADSTREET CORP.....................................................................................................................95,200 2,109,309 2,665,600 EAGLE GEOPHYSICAL INC.....................................................................................................................8,800 178,400 180,400 EAGLE HARDWARE & GARDEN INC.....................................................................................................................19,000 393,252 416,822 EASTERN ENVIROMENTAL SERVICES INC.....................................................................................................................24,800 328,704 496,000 EL PASO NATURAL GAS CO.....................................................................................................................23,746 1,210,096 1,335,712 ENSCO INTERNATIONAL INC.....................................................................................................................600 8,918 38,100 FILENES BASEMENT CORP.....................................................................................................................50,500 375,059 416,625 FINGERHUT COMPANIES INC.....................................................................................................................23,500 500,966 475,875 G & K SERVICES INC.....................................................................................................................6,200 224,275 216,225 GENERAL NUTRITION COMPANIES INC.....................................................................................................................4,500 88,200 124,875 GLOBAL DIRECTMAIL CORP.....................................................................................................................1,600 43,427 35,200 GLOBAL INDS LTD.....................................................................................................................18,000 392,279 655,884 GOLF TR AMER INC.....................................................................................................................46,800 1,001,958 1,287,000 HALL KINION & ASSOCIATES INC.....................................................................................................................17,000 310,438 363,375 HEFTEL BROADCASTING CORP.....................................................................................................................43,700 1,698,810 2,709,400 HEILIG-MEYERS CO.....................................................................................................................275,800 5,103,083 4,137,000 HOME DEPOT INC.....................................................................................................................483,300 13,664,235 22,805,960 HOST MARRIOTT CORP.....................................................................................................................217,400 3,004,824 4,239,300 HSN INC..................................................................................................................... 2,200 56,485 72,600 INTERIM SERVICES INC.....................................................................................................................9,700 451,060 478,937 JONES APPAREL GROUP INC.....................................................................................................................1,200 37,382 60,226 JONES MEDICAL INDUSTRY INC.....................................................................................................................15,500 451,598 461,125 JUST FOR FEET INC.....................................................................................................................6,800 228,335 89,250 KING WORLD PRODUCTIONS INC.....................................................................................................................1,700 68,315 67,575 LARSCOM INC.....................................................................................................................34,500 416,812 355,798 LCC INTERNATIONAL INC.....................................................................................................................7,900 145,321 189,600 MARINE DRILLING COMPANIES INC.....................................................................................................................16,800 273,130 403,200 MAXIMUS INC.....................................................................................................................8,500 160,045 194,437 MAY DEPT STORES CO.....................................................................................................................24,000 350,854 1,291,512 MCDONALDS CORP.....................................................................................................................61,800 735,739 2,923,943 MCGRAW HILL COMPANIES INC.....................................................................................................................216,100 7,015,811 13,249,739
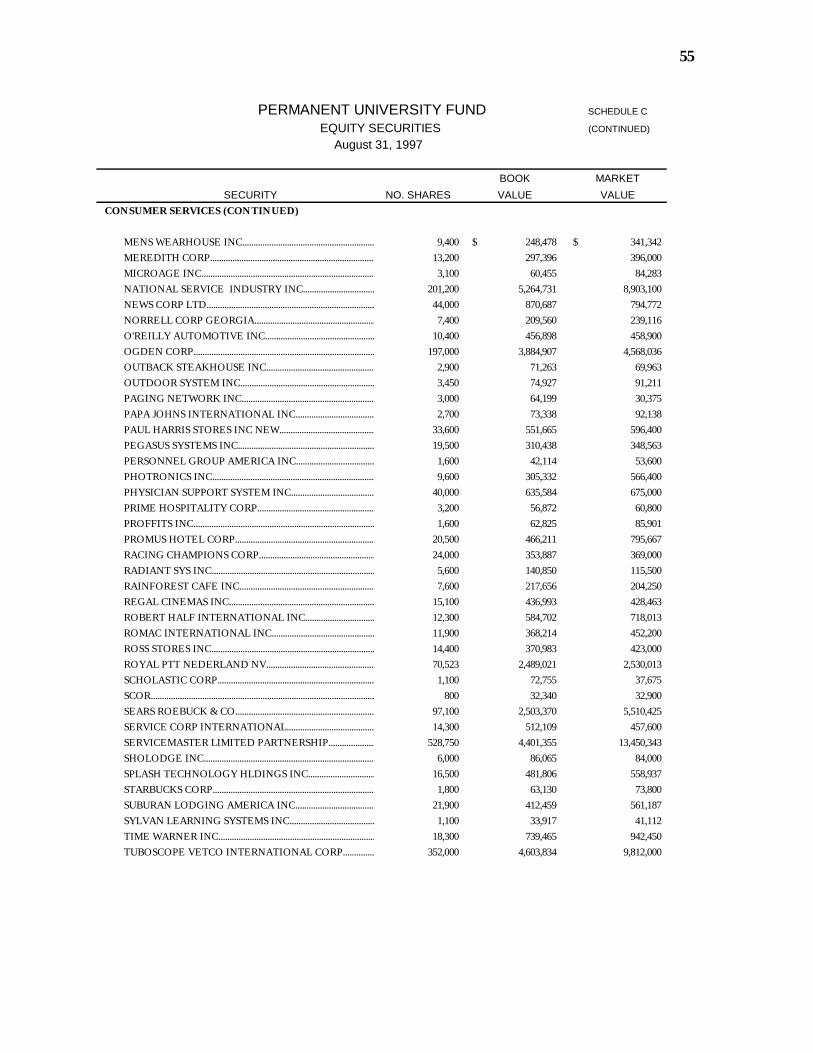
55
PERMANENT UNIVERSITY FUND SCHEDULE C
EQUITY SECURITIES (CONTINUED)
August 31, 1997
BOOK MARKET SECURITY NO. SHARES VALUE VALUE
CONSUMER SERVICES (CONTINUED)
MENS WEARHOUSE INC.....................................................................................................................9,400 248,478$ 341,342$ MEREDITH CORP.....................................................................................................................13,200 297,396 396,000 MICROAGE INC.....................................................................................................................3,100 60,455 84,283 NATIONAL SERVICE INDUSTRY INC.....................................................................................................................201,200 5,264,731 8,903,100 NEWS CORP LTD.....................................................................................................................44,000 870,687 794,772 NORRELL CORP GEORGIA.....................................................................................................................7,400 209,560 239,116 O'REILLY AUTOMOTIVE INC.....................................................................................................................10,400 456,898 458,900 OGDEN CORP.....................................................................................................................197,000 3,884,907 4,568,036 OUTBACK STEAKHOUSE INC.....................................................................................................................2,900 71,263 69,963 OUTDOOR SYSTEM INC.....................................................................................................................3,450 74,927 91,211 PAGING NETWORK INC.....................................................................................................................3,000 64,199 30,375 PAPA JOHNS INTERNATIONAL INC.....................................................................................................................2,700 73,338 92,138 PAUL HARRIS STORES INC NEW.....................................................................................................................33,600 551,665 596,400 PEGASUS SYSTEMS INC.....................................................................................................................19,500 310,438 348,563 PERSONNEL GROUP AMERICA INC.....................................................................................................................1,600 42,114 53,600 PHOTRONICS INC.....................................................................................................................9,600 305,332 566,400 PHYSICIAN SUPPORT SYSTEM INC.....................................................................................................................40,000 635,584 675,000 PRIME HOSPITALITY CORP.....................................................................................................................3,200 56,872 60,800 PROFFITS INC.....................................................................................................................1,600 62,825 85,901 PROMUS HOTEL CORP.....................................................................................................................20,500 466,211 795,667 RACING CHAMPIONS CORP.....................................................................................................................24,000 353,887 369,000 RADIANT SYS INC.....................................................................................................................5,600 140,850 115,500 RAINFOREST CAFE INC.....................................................................................................................7,600 217,656 204,250 REGAL CINEMAS INC.....................................................................................................................15,100 436,993 428,463 ROBERT HALF INTERNATIONAL INC.....................................................................................................................12,300 584,702 718,013 ROMAC INTERNATIONAL INC.....................................................................................................................11,900 368,214 452,200 ROSS STORES INC.....................................................................................................................14,400 370,983 423,000 ROYAL PTT NEDERLAND NV.....................................................................................................................70,523 2,489,021 2,530,013 SCHOLASTIC CORP.....................................................................................................................1,100 72,755 37,675 SCOR..................................................................................................................... 800 32,340 32,900 SEARS ROEBUCK & CO.....................................................................................................................97,100 2,503,370 5,510,425 SERVICE CORP INTERNATIONAL.....................................................................................................................14,300 512,109 457,600 SERVICEMASTER LIMITED PARTNERSHIP.....................................................................................................................528,750 4,401,355 13,450,343 SHOLODGE INC.....................................................................................................................6,000 86,065 84,000 SPLASH TECHNOLOGY HLDINGS INC.....................................................................................................................16,500 481,806 558,937 STARBUCKS CORP.....................................................................................................................1,800 63,130 73,800 SUBURAN LODGING AMERICA INC.....................................................................................................................21,900 412,459 561,187 SYLVAN LEARNING SYSTEMS INC.....................................................................................................................1,100 33,917 41,112 TIME WARNER INC.....................................................................................................................18,300 739,465 942,450 TUBOSCOPE VETCO INTERNATIONAL CORP.....................................................................................................................352,000 4,603,834 9,812,000
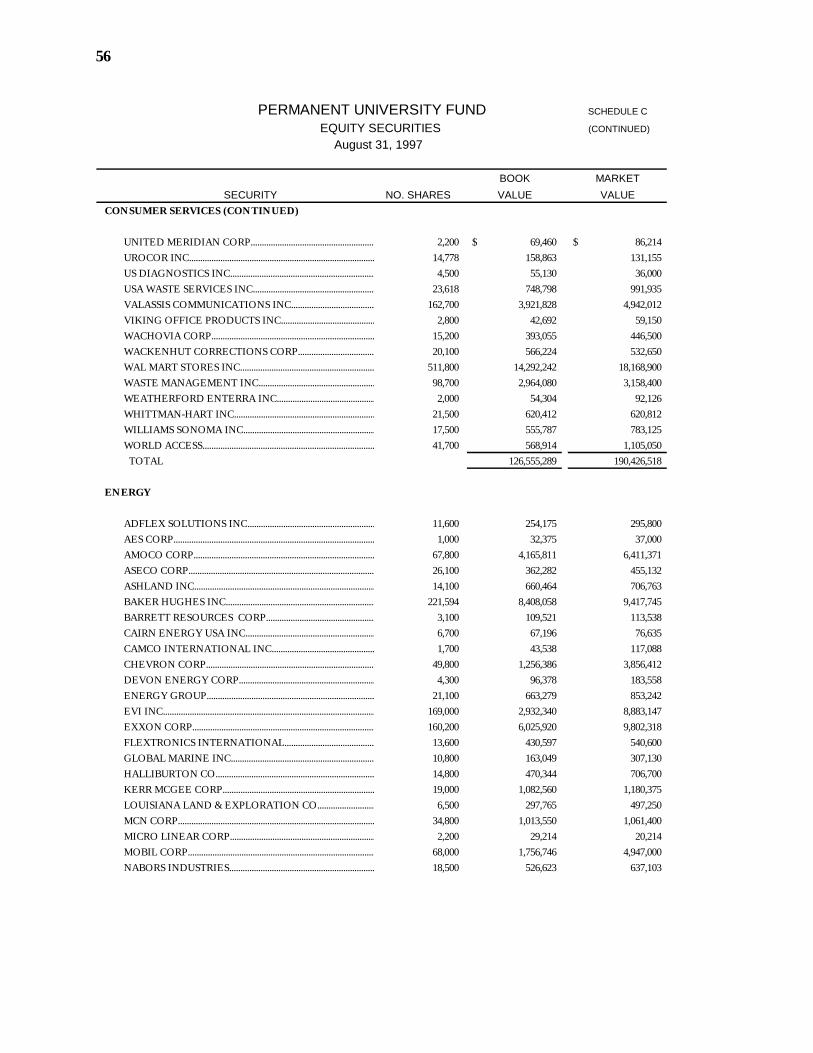
56
PERMANENT UNIVERSITY FUND SCHEDULE C
EQUITY SECURITIES (CONTINUED)
August 31, 1997
BOOK MARKET SECURITY NO. SHARES VALUE VALUE
CONSUMER SERVICES (CONTINUED)
UNITED MERIDIAN CORP.....................................................................................................................2,200 69,460$ 86,214$ UROCOR INC.....................................................................................................................14,778 158,863 131,155 US DIAGNOSTICS INC.....................................................................................................................4,500 55,130 36,000 USA WASTE SERVICES INC.....................................................................................................................23,618 748,798 991,935 VALASSIS COMMUNICATIONS INC.....................................................................................................................162,700 3,921,828 4,942,012 VIKING OFFICE PRODUCTS INC.....................................................................................................................2,800 42,692 59,150 WACHOVIA CORP.....................................................................................................................15,200 393,055 446,500 WACKENHUT CORRECTIONS CORP.....................................................................................................................20,100 566,224 532,650 WAL MART STORES INC.....................................................................................................................511,800 14,292,242 18,168,900 WASTE MANAGEMENT INC.....................................................................................................................98,700 2,964,080 3,158,400 WEATHERFORD ENTERRA INC.....................................................................................................................2,000 54,304 92,126 WHITTMAN-HART INC.....................................................................................................................21,500 620,412 620,812 WILLIAMS SONOMA INC.....................................................................................................................17,500 555,787 783,125 WORLD ACCESS.....................................................................................................................41,700 568,914 1,105,050 TOTAL 126,555,289 190,426,518
ENERGY
ADFLEX SOLUTIONS INC.....................................................................................................................11,600 254,175 295,800 AES CORP..................................................................................................................... 1,000 32,375 37,000 AMOCO CORP.....................................................................................................................67,800 4,165,811 6,411,371 ASECO CORP.....................................................................................................................26,100 362,282 455,132 ASHLAND INC.....................................................................................................................14,100 660,464 706,763 BAKER HUGHES INC.....................................................................................................................221,594 8,408,058 9,417,745 BARRETT RESOURCES CORP.....................................................................................................................3,100 109,521 113,538 CAIRN ENERGY USA INC.....................................................................................................................6,700 67,196 76,635 CAMCO INTERNATIONAL INC.....................................................................................................................1,700 43,538 117,088 CHEVRON CORP.....................................................................................................................49,800 1,256,386 3,856,412 DEVON ENERGY CORP.....................................................................................................................4,300 96,378 183,558 ENERGY GROUP.....................................................................................................................21,100 663,279 853,242 EVI INC..................................................................................................................... 169,000 2,932,340 8,883,147 EXXON CORP.....................................................................................................................160,200 6,025,920 9,802,318 FLEXTRONICS INTERNATIONAL.....................................................................................................................13,600 430,597 540,600 GLOBAL MARINE INC.....................................................................................................................10,800 163,049 307,130 HALLIBURTON CO.....................................................................................................................14,800 470,344 706,700 KERR MCGEE CORP.....................................................................................................................19,000 1,082,560 1,180,375 LOUISIANA LAND & EXPLORATION CO.....................................................................................................................6,500 297,765 497,250 MCN CORP......................................................................................................................34,800 1,013,550 1,061,400 MICRO LINEAR CORP.....................................................................................................................2,200 29,214 20,214 MOBIL CORP.....................................................................................................................68,000 1,756,746 4,947,000 NABORS INDUSTRIES.....................................................................................................................18,500 526,623 637,103
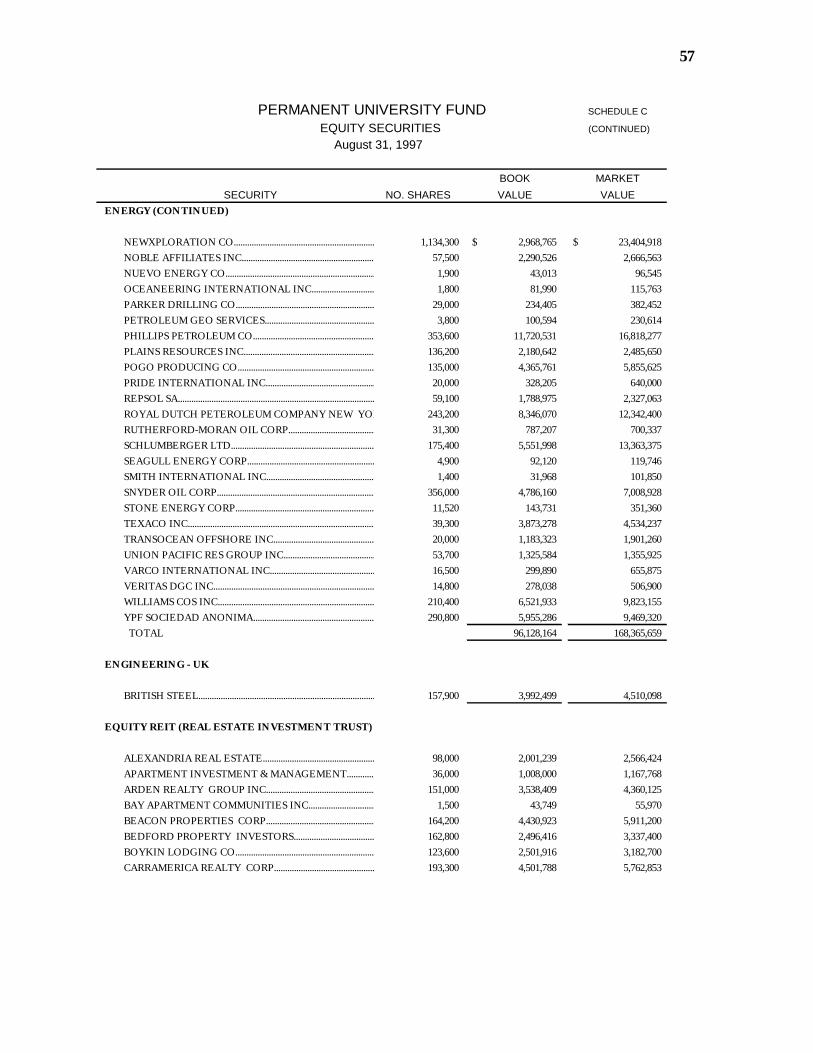
57
PERMANENT UNIVERSITY FUND SCHEDULE C
EQUITY SECURITIES (CONTINUED)
August 31, 1997
BOOK MARKET SECURITY NO. SHARES VALUE VALUE
ENERGY (CONTINUED)
NEWXPLORATION CO.....................................................................................................................1,134,300 2,968,765$ 23,404,918$ NOBLE AFFILIATES INC......................................................................................................................57,500 2,290,526 2,666,563 NUEVO ENERGY CO.....................................................................................................................1,900 43,013 96,545 OCEANEERING INTERNATIONAL INC.....................................................................................................................1,800 81,990 115,763 PARKER DRILLING CO.....................................................................................................................29,000 234,405 382,452 PETROLEUM GEO SERVICES.....................................................................................................................3,800 100,594 230,614 PHILLIPS PETROLEUM CO.....................................................................................................................353,600 11,720,531 16,818,277 PLAINS RESOURCES INC.....................................................................................................................136,200 2,180,642 2,485,650 POGO PRODUCING CO.....................................................................................................................135,000 4,365,761 5,855,625 PRIDE INTERNATIONAL INC.....................................................................................................................20,000 328,205 640,000 REPSOL SA.....................................................................................................................59,100 1,788,975 2,327,063 ROYAL DUTCH PETEROLEUM COMPANY NEW YORK.....................................................................................................................243,200 8,346,070 12,342,400 RUTHERFORD-MORAN OIL CORP.....................................................................................................................31,300 787,207 700,337 SCHLUMBERGER LTD.....................................................................................................................175,400 5,551,998 13,363,375 SEAGULL ENERGY CORP.....................................................................................................................4,900 92,120 119,746 SMITH INTERNATIONAL INC.....................................................................................................................1,400 31,968 101,850 SNYDER OIL CORP.....................................................................................................................356,000 4,786,160 7,008,928 STONE ENERGY CORP.....................................................................................................................11,520 143,731 351,360 TEXACO INC.....................................................................................................................39,300 3,873,278 4,534,237 TRANSOCEAN OFFSHORE INC.....................................................................................................................20,000 1,183,323 1,901,260 UNION PACIFIC RES GROUP INC.....................................................................................................................53,700 1,325,584 1,355,925 VARCO INTERNATIONAL INC.....................................................................................................................16,500 299,890 655,875 VERITAS DGC INC.....................................................................................................................14,800 278,038 506,900 WILLIAMS COS INC.....................................................................................................................210,400 6,521,933 9,823,155 YPF SOCIEDAD ANONIMA.....................................................................................................................290,800 5,955,286 9,469,320 TOTAL 96,128,164 168,365,659
ENGINEERING - UK
BRITISH STEEL.....................................................................................................................157,900 3,992,499 4,510,098
EQUITY REIT (REAL ESTATE INVESTMENT TRUST)
ALEXANDRIA REAL ESTATE.....................................................................................................................98,000 2,001,239 2,566,424 APARTMENT INVESTMENT & MANAGEMENT.....................................................................................................................36,000 1,008,000 1,167,768 ARDEN REALTY GROUP INC.....................................................................................................................151,000 3,538,409 4,360,125 BAY APARTMENT COMMUNITIES INC.....................................................................................................................1,500 43,749 55,970 BEACON PROPERTIES CORP.....................................................................................................................164,200 4,430,923 5,911,200 BEDFORD PROPERTY INVESTORS.....................................................................................................................162,800 2,496,416 3,337,400 BOYKIN LODGING CO.....................................................................................................................123,600 2,501,916 3,182,700 CARRAMERICA REALTY CORP.....................................................................................................................193,300 4,501,788 5,762,853
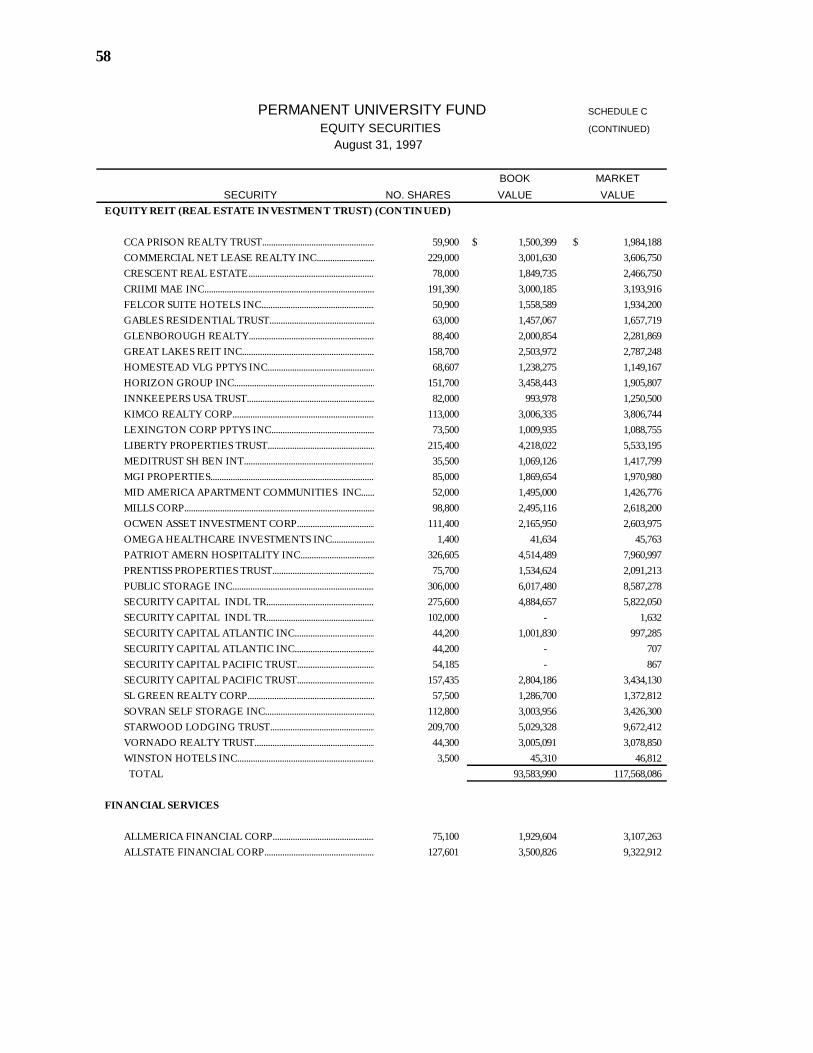
58
PERMANENT UNIVERSITY FUND SCHEDULE C
EQUITY SECURITIES (CONTINUED)
August 31, 1997
BOOK MARKET SECURITY NO. SHARES VALUE VALUE
EQUITY REIT (REAL ESTATE INVESTMENT TRUST) (CONTINUED)
CCA PRISON REALTY TRUST.....................................................................................................................59,900 1,500,399$ 1,984,188$ COMMERCIAL NET LEASE REALTY INC.....................................................................................................................229,000 3,001,630 3,606,750 CRESCENT REAL ESTATE.....................................................................................................................78,000 1,849,735 2,466,750 CRIIMI MAE INC.....................................................................................................................191,390 3,000,185 3,193,916 FELCOR SUITE HOTELS INC.....................................................................................................................50,900 1,558,589 1,934,200 GABLES RESIDENTIAL TRUST.....................................................................................................................63,000 1,457,067 1,657,719 GLENBOROUGH REALTY.....................................................................................................................88,400 2,000,854 2,281,869 GREAT LAKES REIT INC.....................................................................................................................158,700 2,503,972 2,787,248 HOMESTEAD VLG PPTYS INC.....................................................................................................................68,607 1,238,275 1,149,167 HORIZON GROUP INC.....................................................................................................................151,700 3,458,443 1,905,807 INNKEEPERS USA TRUST.....................................................................................................................82,000 993,978 1,250,500 KIMCO REALTY CORP.....................................................................................................................113,000 3,006,335 3,806,744 LEXINGTON CORP PPTYS INC.....................................................................................................................73,500 1,009,935 1,088,755 LIBERTY PROPERTIES TRUST.....................................................................................................................215,400 4,218,022 5,533,195 MEDITRUST SH BEN INT.....................................................................................................................35,500 1,069,126 1,417,799 MGI PROPERTIES.....................................................................................................................85,000 1,869,654 1,970,980 MID AMERICA APARTMENT COMMUNITIES INC.....................................................................................................................52,000 1,495,000 1,426,776 MILLS CORP.....................................................................................................................98,800 2,495,116 2,618,200 OCWEN ASSET INVESTMENT CORP.....................................................................................................................111,400 2,165,950 2,603,975 OMEGA HEALTHCARE INVESTMENTS INC.....................................................................................................................1,400 41,634 45,763 PATRIOT AMERN HOSPITALITY INC.....................................................................................................................326,605 4,514,489 7,960,997 PRENTISS PROPERTIES TRUST.....................................................................................................................75,700 1,534,624 2,091,213 PUBLIC STORAGE INC.....................................................................................................................306,000 6,017,480 8,587,278 SECURITY CAPITAL INDL TR.....................................................................................................................275,600 4,884,657 5,822,050 SECURITY CAPITAL INDL TR.....................................................................................................................102,000 - 1,632 SECURITY CAPITAL ATLANTIC INC.....................................................................................................................44,200 1,001,830 997,285 SECURITY CAPITAL ATLANTIC INC.....................................................................................................................44,200 - 707 SECURITY CAPITAL PACIFIC TRUST.....................................................................................................................54,185 - 867 SECURITY CAPITAL PACIFIC TRUST.....................................................................................................................157,435 2,804,186 3,434,130 SL GREEN REALTY CORP.....................................................................................................................57,500 1,286,700 1,372,812 SOVRAN SELF STORAGE INC.....................................................................................................................112,800 3,003,956 3,426,300 STARWOOD LODGING TRUST.....................................................................................................................209,700 5,029,328 9,672,412 VORNADO REALTY TRUST.....................................................................................................................44,300 3,005,091 3,078,850 WINSTON HOTELS INC.....................................................................................................................3,500 45,310 46,812 TOTAL 93,583,990 117,568,086
FINANCIAL SERVICES
ALLMERICA FINANCIAL CORP.....................................................................................................................75,100 1,929,604 3,107,263 ALLSTATE FINANCIAL CORP.....................................................................................................................127,601 3,500,826 9,322,912
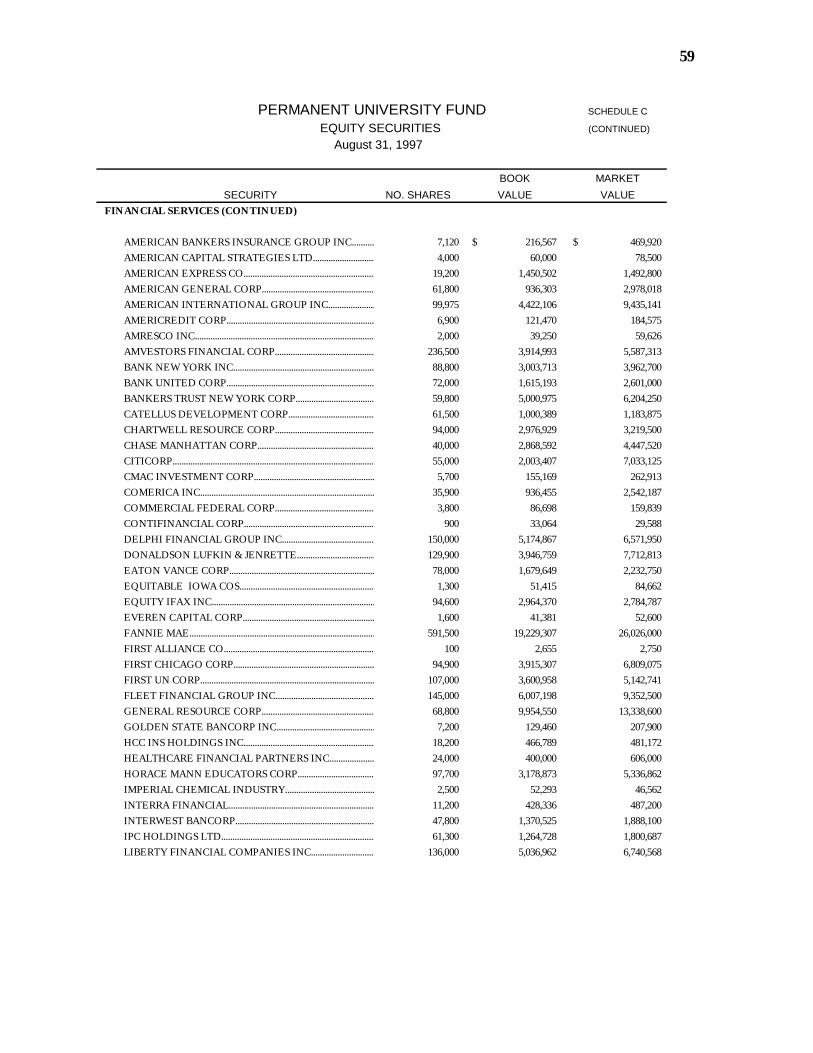
59
PERMANENT UNIVERSITY FUND SCHEDULE C
EQUITY SECURITIES (CONTINUED)
August 31, 1997
BOOK MARKET SECURITY NO. SHARES VALUE VALUE
FINANCIAL SERVICES (CONTINUED)
AMERICAN BANKERS INSURANCE GROUP INC.....................................................................................................................7,120 216,567$ 469,920$ AMERICAN CAPITAL STRATEGIES LTD.....................................................................................................................4,000 60,000 78,500 AMERICAN EXPRESS CO.....................................................................................................................19,200 1,450,502 1,492,800 AMERICAN GENERAL CORP.....................................................................................................................61,800 936,303 2,978,018 AMERICAN INTERNATIONAL GROUP INC.....................................................................................................................99,975 4,422,106 9,435,141 AMERICREDIT CORP.....................................................................................................................6,900 121,470 184,575 AMRESCO INC.....................................................................................................................2,000 39,250 59,626 AMVESTORS FINANCIAL CORP.....................................................................................................................236,500 3,914,993 5,587,313 BANK NEW YORK INC.....................................................................................................................88,800 3,003,713 3,962,700 BANK UNITED CORP.....................................................................................................................72,000 1,615,193 2,601,000 BANKERS TRUST NEW YORK CORP.....................................................................................................................59,800 5,000,975 6,204,250 CATELLUS DEVELOPMENT CORP.....................................................................................................................61,500 1,000,389 1,183,875 CHARTWELL RESOURCE CORP.....................................................................................................................94,000 2,976,929 3,219,500 CHASE MANHATTAN CORP.....................................................................................................................40,000 2,868,592 4,447,520 CITICORP.....................................................................................................................55,000 2,003,407 7,033,125 CMAC INVESTMENT CORP.....................................................................................................................5,700 155,169 262,913 COMERICA INC.....................................................................................................................35,900 936,455 2,542,187 COMMERCIAL FEDERAL CORP.....................................................................................................................3,800 86,698 159,839 CONTIFINANCIAL CORP.....................................................................................................................900 33,064 29,588 DELPHI FINANCIAL GROUP INC.....................................................................................................................150,000 5,174,867 6,571,950 DONALDSON LUFKIN & JENRETTE.....................................................................................................................129,900 3,946,759 7,712,813 EATON VANCE CORP.....................................................................................................................78,000 1,679,649 2,232,750 EQUITABLE IOWA COS.....................................................................................................................1,300 51,415 84,662 EQUITY IFAX INC......................................................................................................................94,600 2,964,370 2,784,787 EVEREN CAPITAL CORP.....................................................................................................................1,600 41,381 52,600 FANNIE MAE.....................................................................................................................591,500 19,229,307 26,026,000 FIRST ALLIANCE CO.....................................................................................................................100 2,655 2,750 FIRST CHICAGO CORP.....................................................................................................................94,900 3,915,307 6,809,075 FIRST UN CORP.....................................................................................................................107,000 3,600,958 5,142,741 FLEET FINANCIAL GROUP INC.....................................................................................................................145,000 6,007,198 9,352,500 GENERAL RESOURCE CORP.....................................................................................................................68,800 9,954,550 13,338,600 GOLDEN STATE BANCORP INC.....................................................................................................................7,200 129,460 207,900 HCC INS HOLDINGS INC.....................................................................................................................18,200 466,789 481,172 HEALTHCARE FINANCIAL PARTNERS INC.....................................................................................................................24,000 400,000 606,000 HORACE MANN EDUCATORS CORP.....................................................................................................................97,700 3,178,873 5,336,862 IMPERIAL CHEMICAL INDUSTRY.....................................................................................................................2,500 52,293 46,562 INTERRA FINANCIAL.....................................................................................................................11,200 428,336 487,200 INTERWEST BANCORP.....................................................................................................................47,800 1,370,525 1,888,100 IPC HOLDINGS LTD.....................................................................................................................61,300 1,264,728 1,800,687 LIBERTY FINANCIAL COMPANIES INC.....................................................................................................................136,000 5,036,962 6,740,568
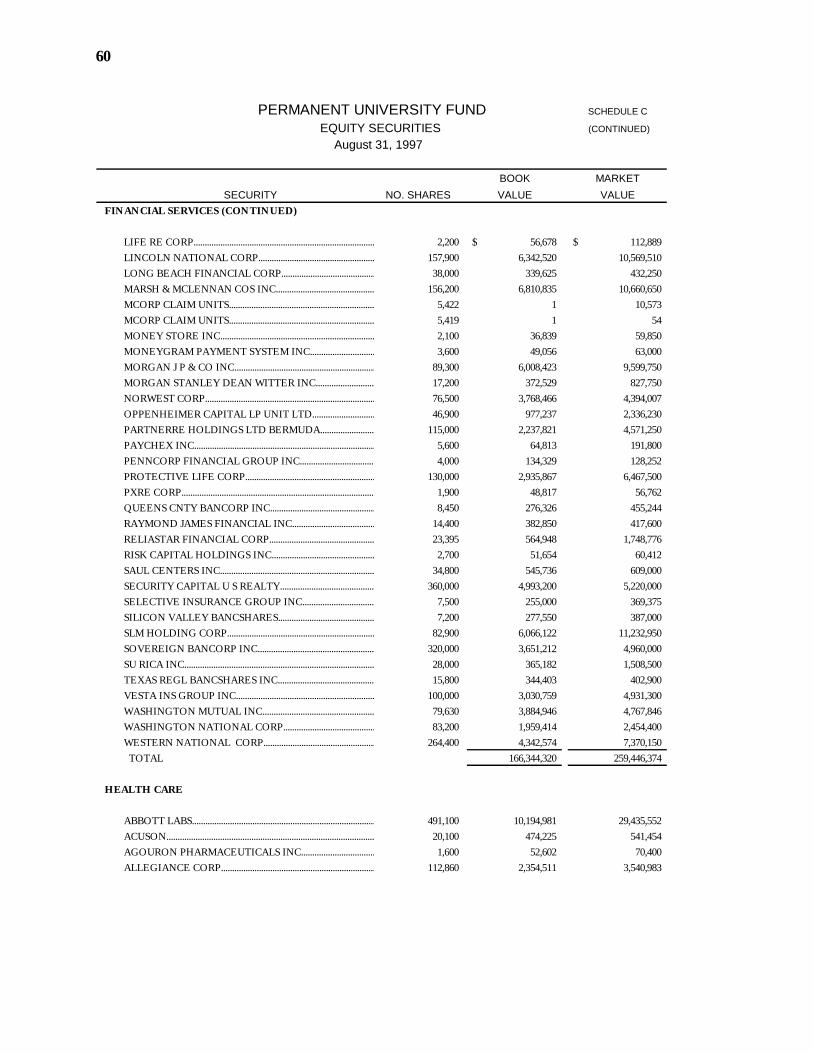
60
PERMANENT UNIVERSITY FUND SCHEDULE C
EQUITY SECURITIES (CONTINUED)
August 31, 1997
BOOK MARKET SECURITY NO. SHARES VALUE VALUE
FINANCIAL SERVICES (CONTINUED)
LIFE RE CORP.....................................................................................................................2,200 56,678$ 112,889$ LINCOLN NATIONAL CORP.....................................................................................................................157,900 6,342,520 10,569,510 LONG BEACH FINANCIAL CORP.....................................................................................................................38,000 339,625 432,250 MARSH & MCLENNAN COS INC.....................................................................................................................156,200 6,810,835 10,660,650 MCORP CLAIM UNITS.....................................................................................................................5,422 1 10,573 MCORP CLAIM UNITS.....................................................................................................................5,419 1 54 MONEY STORE INC.....................................................................................................................2,100 36,839 59,850 MONEYGRAM PAYMENT SYSTEM INC.....................................................................................................................3,600 49,056 63,000 MORGAN J P & CO INC.....................................................................................................................89,300 6,008,423 9,599,750 MORGAN STANLEY DEAN WITTER INC.....................................................................................................................17,200 372,529 827,750 NORWEST CORP.....................................................................................................................76,500 3,768,466 4,394,007 OPPENHEIMER CAPITAL LP UNIT LTD.....................................................................................................................46,900 977,237 2,336,230 PARTNERRE HOLDINGS LTD BERMUDA.....................................................................................................................115,000 2,237,821 4,571,250 PAYCHEX INC.....................................................................................................................5,600 64,813 191,800 PENNCORP FINANCIAL GROUP INC.....................................................................................................................4,000 134,329 128,252 PROTECTIVE LIFE CORP.....................................................................................................................130,000 2,935,867 6,467,500 PXRE CORP.....................................................................................................................1,900 48,817 56,762 QUEENS CNTY BANCORP INC.....................................................................................................................8,450 276,326 455,244 RAYMOND JAMES FINANCIAL INC.....................................................................................................................14,400 382,850 417,600 RELIASTAR FINANCIAL CORP.....................................................................................................................23,395 564,948 1,748,776 RISK CAPITAL HOLDINGS INC.....................................................................................................................2,700 51,654 60,412 SAUL CENTERS INC.....................................................................................................................34,800 545,736 609,000 SECURITY CAPITAL U S REALTY.....................................................................................................................360,000 4,993,200 5,220,000 SELECTIVE INSURANCE GROUP INC.....................................................................................................................7,500 255,000 369,375 SILICON VALLEY BANCSHARES.....................................................................................................................7,200 277,550 387,000 SLM HOLDING CORP.....................................................................................................................82,900 6,066,122 11,232,950 SOVEREIGN BANCORP INC.....................................................................................................................320,000 3,651,212 4,960,000 SU RICA INC.....................................................................................................................28,000 365,182 1,508,500 TEXAS REGL BANCSHARES INC.....................................................................................................................15,800 344,403 402,900 VESTA INS GROUP INC.....................................................................................................................100,000 3,030,759 4,931,300 WASHINGTON MUTUAL INC.....................................................................................................................79,630 3,884,946 4,767,846 WASHINGTON NATIONAL CORP.....................................................................................................................83,200 1,959,414 2,454,400 WESTERN NATIONAL CORP.....................................................................................................................264,400 4,342,574 7,370,150 TOTAL 166,344,320 259,446,374
HEALTH CARE
ABBOTT LABS.....................................................................................................................491,100 10,194,981 29,435,552 ACUSON..................................................................................................................... 20,100 474,225 541,454 AGOURON PHARMACEUTICALS INC.....................................................................................................................1,600 52,602 70,400 ALLEGIANCE CORP.....................................................................................................................112,860 2,354,511 3,540,983
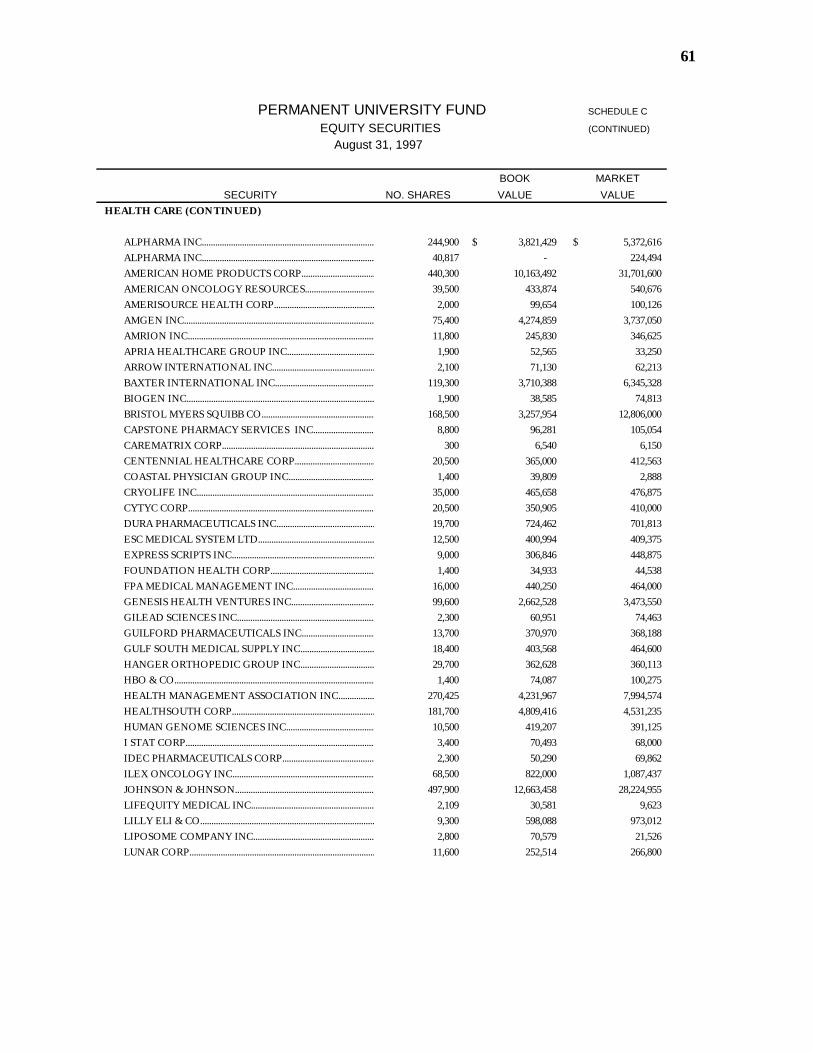
61
PERMANENT UNIVERSITY FUND SCHEDULE C
EQUITY SECURITIES (CONTINUED)
August 31, 1997
BOOK MARKET SECURITY NO. SHARES VALUE VALUE
HEALTH CARE (CONTINUED)
ALPHARMA INC.....................................................................................................................244,900 3,821,429$ 5,372,616$ ALPHARMA INC.....................................................................................................................40,817 - 224,494 AMERICAN HOME PRODUCTS CORP.....................................................................................................................440,300 10,163,492 31,701,600 AMERICAN ONCOLOGY RESOURCES.....................................................................................................................39,500 433,874 540,676 AMERISOURCE HEALTH CORP.....................................................................................................................2,000 99,654 100,126 AMGEN INC.....................................................................................................................75,400 4,274,859 3,737,050 AMRION INC.....................................................................................................................11,800 245,830 346,625 APRIA HEALTHCARE GROUP INC.....................................................................................................................1,900 52,565 33,250 ARROW INTERNATIONAL INC.....................................................................................................................2,100 71,130 62,213 BAXTER INTERNATIONAL INC.....................................................................................................................119,300 3,710,388 6,345,328 BIOGEN INC.....................................................................................................................1,900 38,585 74,813 BRISTOL MYERS SQUIBB CO.....................................................................................................................168,500 3,257,954 12,806,000 CAPSTONE PHARMACY SERVICES INC.....................................................................................................................8,800 96,281 105,054 CAREMATRIX CORP.....................................................................................................................300 6,540 6,150 CENTENNIAL HEALTHCARE CORP.....................................................................................................................20,500 365,000 412,563 COASTAL PHYSICIAN GROUP INC.....................................................................................................................1,400 39,809 2,888 CRYOLIFE INC.....................................................................................................................35,000 465,658 476,875 CYTYC CORP.....................................................................................................................20,500 350,905 410,000 DURA PHARMACEUTICALS INC.....................................................................................................................19,700 724,462 701,813 ESC MEDICAL SYSTEM LTD.....................................................................................................................12,500 400,994 409,375 EXPRESS SCRIPTS INC.....................................................................................................................9,000 306,846 448,875 FOUNDATION HEALTH CORP.....................................................................................................................1,400 34,933 44,538 FPA MEDICAL MANAGEMENT INC.....................................................................................................................16,000 440,250 464,000 GENESIS HEALTH VENTURES INC.....................................................................................................................99,600 2,662,528 3,473,550 GILEAD SCIENCES INC.....................................................................................................................2,300 60,951 74,463 GUILFORD PHARMACEUTICALS INC.....................................................................................................................13,700 370,970 368,188 GULF SOUTH MEDICAL SUPPLY INC.....................................................................................................................18,400 403,568 464,600 HANGER ORTHOPEDIC GROUP INC.....................................................................................................................29,700 362,628 360,113 HBO & CO..................................................................................................................... 1,400 74,087 100,275 HEALTH MANAGEMENT ASSOCIATION INC.....................................................................................................................270,425 4,231,967 7,994,574 HEALTHSOUTH CORP.....................................................................................................................181,700 4,809,416 4,531,235 HUMAN GENOME SCIENCES INC.....................................................................................................................10,500 419,207 391,125 I STAT CORP.....................................................................................................................3,400 70,493 68,000 IDEC PHARMACEUTICALS CORP.....................................................................................................................2,300 50,290 69,862 ILEX ONCOLOGY INC.....................................................................................................................68,500 822,000 1,087,437 JOHNSON & JOHNSON.....................................................................................................................497,900 12,663,458 28,224,955 LIFEQUITY MEDICAL INC.....................................................................................................................2,109 30,581 9,623 LILLY ELI & CO.....................................................................................................................9,300 598,088 973,012 LIPOSOME COMPANY INC.....................................................................................................................2,800 70,579 21,526 LUNAR CORP.....................................................................................................................11,600 252,514 266,800
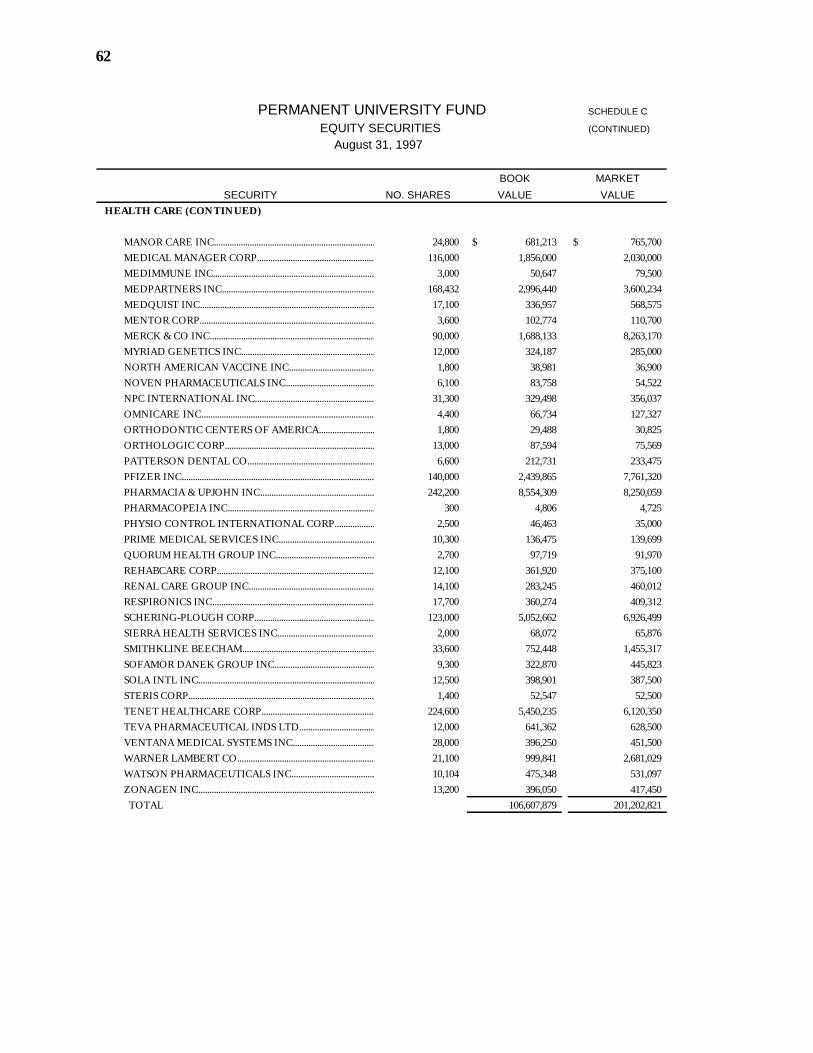
62
PERMANENT UNIVERSITY FUND SCHEDULE C
EQUITY SECURITIES (CONTINUED)
August 31, 1997
BOOK MARKET SECURITY NO. SHARES VALUE VALUE
HEALTH CARE (CONTINUED)
MANOR CARE INC.....................................................................................................................24,800 681,213$ 765,700$ MEDICAL MANAGER CORP.....................................................................................................................116,000 1,856,000 2,030,000 MEDIMMUNE INC.....................................................................................................................3,000 50,647 79,500 MEDPARTNERS INC.....................................................................................................................168,432 2,996,440 3,600,234 MEDQUIST INC.....................................................................................................................17,100 336,957 568,575 MENTOR CORP.....................................................................................................................3,600 102,774 110,700 MERCK & CO INC.....................................................................................................................90,000 1,688,133 8,263,170 MYRIAD GENETICS INC.....................................................................................................................12,000 324,187 285,000 NORTH AMERICAN VACCINE INC.....................................................................................................................1,800 38,981 36,900 NOVEN PHARMACEUTICALS INC.....................................................................................................................6,100 83,758 54,522 NPC INTERNATIONAL INC.....................................................................................................................31,300 329,498 356,037 OMNICARE INC.....................................................................................................................4,400 66,734 127,327 ORTHODONTIC CENTERS OF AMERICA.....................................................................................................................1,800 29,488 30,825 ORTHOLOGIC CORP.....................................................................................................................13,000 87,594 75,569 PATTERSON DENTAL CO.....................................................................................................................6,600 212,731 233,475 PFIZER INC.....................................................................................................................140,000 2,439,865 7,761,320 PHARMACIA & UPJOHN INC.....................................................................................................................242,200 8,554,309 8,250,059 PHARMACOPEIA INC.....................................................................................................................300 4,806 4,725 PHYSIO CONTROL INTERNATIONAL CORP.....................................................................................................................2,500 46,463 35,000 PRIME MEDICAL SERVICES INC.....................................................................................................................10,300 136,475 139,699 QUORUM HEALTH GROUP INC.....................................................................................................................2,700 97,719 91,970 REHABCARE CORP.....................................................................................................................12,100 361,920 375,100 RENAL CARE GROUP INC.....................................................................................................................14,100 283,245 460,012 RESPIRONICS INC.....................................................................................................................17,700 360,274 409,312 SCHERING-PLOUGH CORP.....................................................................................................................123,000 5,052,662 6,926,499 SIERRA HEALTH SERVICES INC.....................................................................................................................2,000 68,072 65,876 SMITHKLINE BEECHAM.....................................................................................................................33,600 752,448 1,455,317 SOFAMOR DANEK GROUP INC.....................................................................................................................9,300 322,870 445,823 SOLA INTL INC.....................................................................................................................12,500 398,901 387,500 STERIS CORP.....................................................................................................................1,400 52,547 52,500 TENET HEALTHCARE CORP.....................................................................................................................224,600 5,450,235 6,120,350 TEVA PHARMACEUTICAL INDS LTD.....................................................................................................................12,000 641,362 628,500 VENTANA MEDICAL SYSTEMS INC.....................................................................................................................28,000 396,250 451,500 WARNER LAMBERT CO.....................................................................................................................21,100 999,841 2,681,029 WATSON PHARMACEUTICALS INC.....................................................................................................................10,104 475,348 531,097 ZONAGEN INC.....................................................................................................................13,200 396,050 417,450 TOTAL 106,607,879 201,202,821
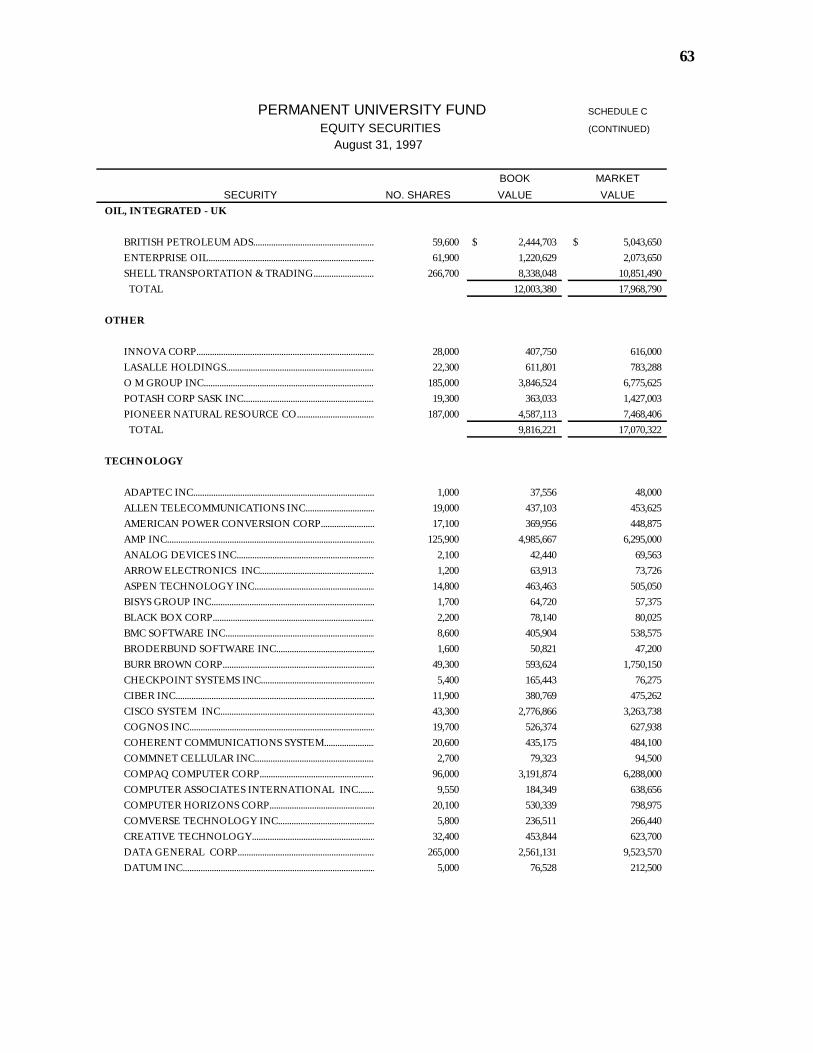
63
PERMANENT UNIVERSITY FUND SCHEDULE C
EQUITY SECURITIES (CONTINUED)
August 31, 1997
BOOK MARKET SECURITY NO. SHARES VALUE VALUE
OIL, INTEGRATED - UK
BRITISH PETROLEUM ADS.....................................................................................................................59,600 2,444,703$ 5,043,650$ ENTERPRISE OIL.....................................................................................................................61,900 1,220,629 2,073,650 SHELL TRANSPORTATION & TRADING.....................................................................................................................266,700 8,338,048 10,851,490 TOTAL 12,003,380 17,968,790
OTHER
INNOVA CORP.....................................................................................................................28,000 407,750 616,000 LASALLE HOLDINGS.....................................................................................................................22,300 611,801 783,288 O M GROUP INC.....................................................................................................................185,000 3,846,524 6,775,625 POTASH CORP SASK INC.....................................................................................................................19,300 363,033 1,427,003 PIONEER NATURAL RESOURCE CO.....................................................................................................................187,000 4,587,113 7,468,406 TOTAL 9,816,221 17,070,322
TECHNOLOGY
ADAPTEC INC.....................................................................................................................1,000 37,556 48,000 ALLEN TELECOMMUNICATIONS INC.....................................................................................................................19,000 437,103 453,625 AMERICAN POWER CONVERSION CORP.....................................................................................................................17,100 369,956 448,875 AMP INC.....................................................................................................................125,900 4,985,667 6,295,000 ANALOG DEVICES INC.....................................................................................................................2,100 42,440 69,563 ARROW ELECTRONICS INC.....................................................................................................................1,200 63,913 73,726 ASPEN TECHNOLOGY INC.....................................................................................................................14,800 463,463 505,050 BISYS GROUP INC.....................................................................................................................1,700 64,720 57,375 BLACK BOX CORP.....................................................................................................................2,200 78,140 80,025 BMC SOFTWARE INC.....................................................................................................................8,600 405,904 538,575 BRODERBUND SOFTWARE INC.....................................................................................................................1,600 50,821 47,200 BURR BROWN CORP.....................................................................................................................49,300 593,624 1,750,150 CHECKPOINT SYSTEMS INC.....................................................................................................................5,400 165,443 76,275 CIBER INC.....................................................................................................................11,900 380,769 475,262 CISCO SYSTEM INC.....................................................................................................................43,300 2,776,866 3,263,738 COGNOS INC.....................................................................................................................19,700 526,374 627,938 COHERENT COMMUNICATIONS SYSTEM.....................................................................................................................20,600 435,175 484,100 COMMNET CELLULAR INC.....................................................................................................................2,700 79,323 94,500 COMPAQ COMPUTER CORP.....................................................................................................................96,000 3,191,874 6,288,000 COMPUTER ASSOCIATES INTERNATIONAL INC.....................................................................................................................9,550 184,349 638,656 COMPUTER HORIZONS CORP.....................................................................................................................20,100 530,339 798,975 COMVERSE TECHNOLOGY INC.....................................................................................................................5,800 236,511 266,440 CREATIVE TECHNOLOGY.....................................................................................................................32,400 453,844 623,700 DATA GENERAL CORP.....................................................................................................................265,000 2,561,131 9,523,570 DATUM INC.....................................................................................................................5,000 76,528 212,500
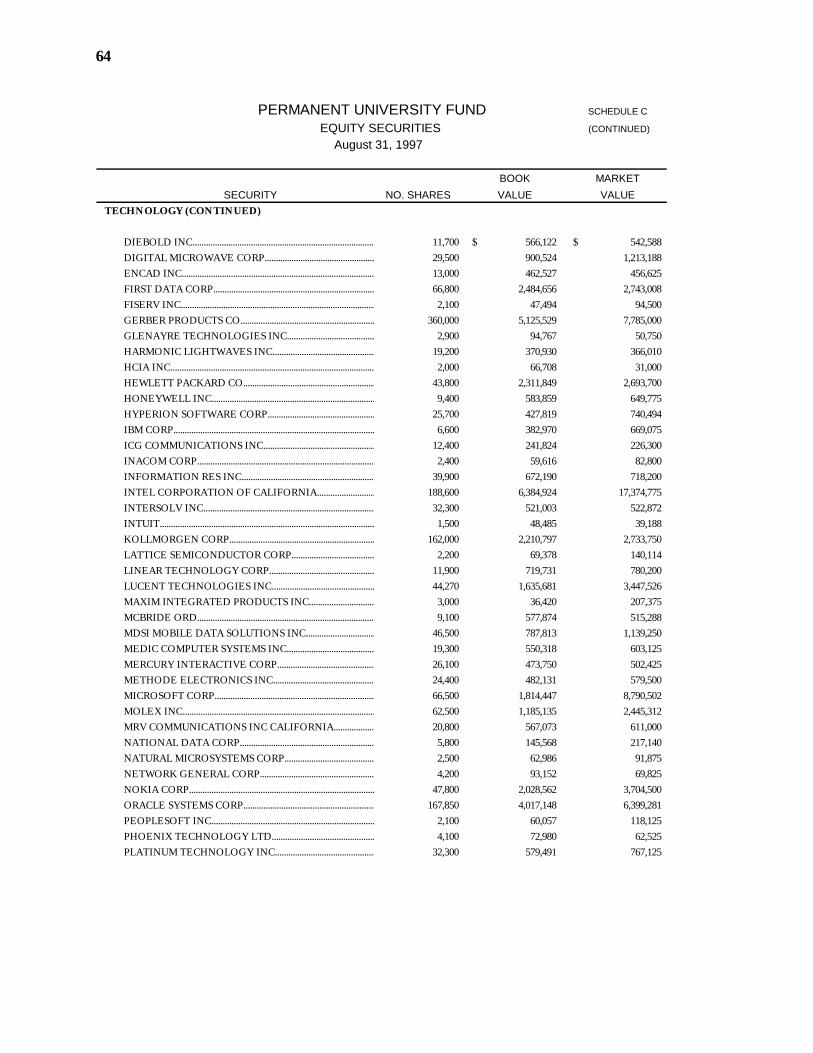
64
PERMANENT UNIVERSITY FUND SCHEDULE C
EQUITY SECURITIES (CONTINUED)
August 31, 1997
BOOK MARKET SECURITY NO. SHARES VALUE VALUE
TECHNOLOGY (CONTINUED)
DIEBOLD INC.....................................................................................................................11,700 566,122$ 542,588$ DIGITAL MICROWAVE CORP.....................................................................................................................29,500 900,524 1,213,188 ENCAD INC.....................................................................................................................13,000 462,527 456,625 FIRST DATA CORP.....................................................................................................................66,800 2,484,656 2,743,008 FISERV INC.....................................................................................................................2,100 47,494 94,500 GERBER PRODUCTS CO.....................................................................................................................360,000 5,125,529 7,785,000 GLENAYRE TECHNOLOGIES INC.....................................................................................................................2,900 94,767 50,750 HARMONIC LIGHTWAVES INC.....................................................................................................................19,200 370,930 366,010 HCIA INC..................................................................................................................... 2,000 66,708 31,000 HEWLETT PACKARD CO.....................................................................................................................43,800 2,311,849 2,693,700 HONEYWELL INC.....................................................................................................................9,400 583,859 649,775 HYPERION SOFTWARE CORP.....................................................................................................................25,700 427,819 740,494 IBM CORP..................................................................................................................... 6,600 382,970 669,075 ICG COMMUNICATIONS INC.....................................................................................................................12,400 241,824 226,300 INACOM CORP.....................................................................................................................2,400 59,616 82,800 INFORMATION RES INC.....................................................................................................................39,900 672,190 718,200 INTEL CORPORATION OF CALIFORNIA.....................................................................................................................188,600 6,384,924 17,374,775 INTERSOLV INC.....................................................................................................................32,300 521,003 522,872 INTUIT..................................................................................................................... 1,500 48,485 39,188 KOLLMORGEN CORP.....................................................................................................................162,000 2,210,797 2,733,750 LATTICE SEMICONDUCTOR CORP.....................................................................................................................2,200 69,378 140,114 LINEAR TECHNOLOGY CORP.....................................................................................................................11,900 719,731 780,200 LUCENT TECHNOLOGIES INC.....................................................................................................................44,270 1,635,681 3,447,526 MAXIM INTEGRATED PRODUCTS INC.....................................................................................................................3,000 36,420 207,375 MCBRIDE ORD.....................................................................................................................9,100 577,874 515,288 MDSI MOBILE DATA SOLUTIONS INC.....................................................................................................................46,500 787,813 1,139,250 MEDIC COMPUTER SYSTEMS INC.....................................................................................................................19,300 550,318 603,125 MERCURY INTERACTIVE CORP.....................................................................................................................26,100 473,750 502,425 METHODE ELECTRONICS INC.....................................................................................................................24,400 482,131 579,500 MICROSOFT CORP.....................................................................................................................66,500 1,814,447 8,790,502 MOLEX INC.....................................................................................................................62,500 1,185,135 2,445,312 MRV COMMUNICATIONS INC CALIFORNIA.....................................................................................................................20,800 567,073 611,000 NATIONAL DATA CORP.....................................................................................................................5,800 145,568 217,140 NATURAL MICROSYSTEMS CORP.....................................................................................................................2,500 62,986 91,875 NETWORK GENERAL CORP.....................................................................................................................4,200 93,152 69,825 NOKIA CORP.....................................................................................................................47,800 2,028,562 3,704,500 ORACLE SYSTEMS CORP.....................................................................................................................167,850 4,017,148 6,399,281 PEOPLESOFT INC.....................................................................................................................2,100 60,057 118,125 PHOENIX TECHNOLOGY LTD.....................................................................................................................4,100 72,980 62,525 PLATINUM TECHNOLOGY INC.....................................................................................................................32,300 579,491 767,125
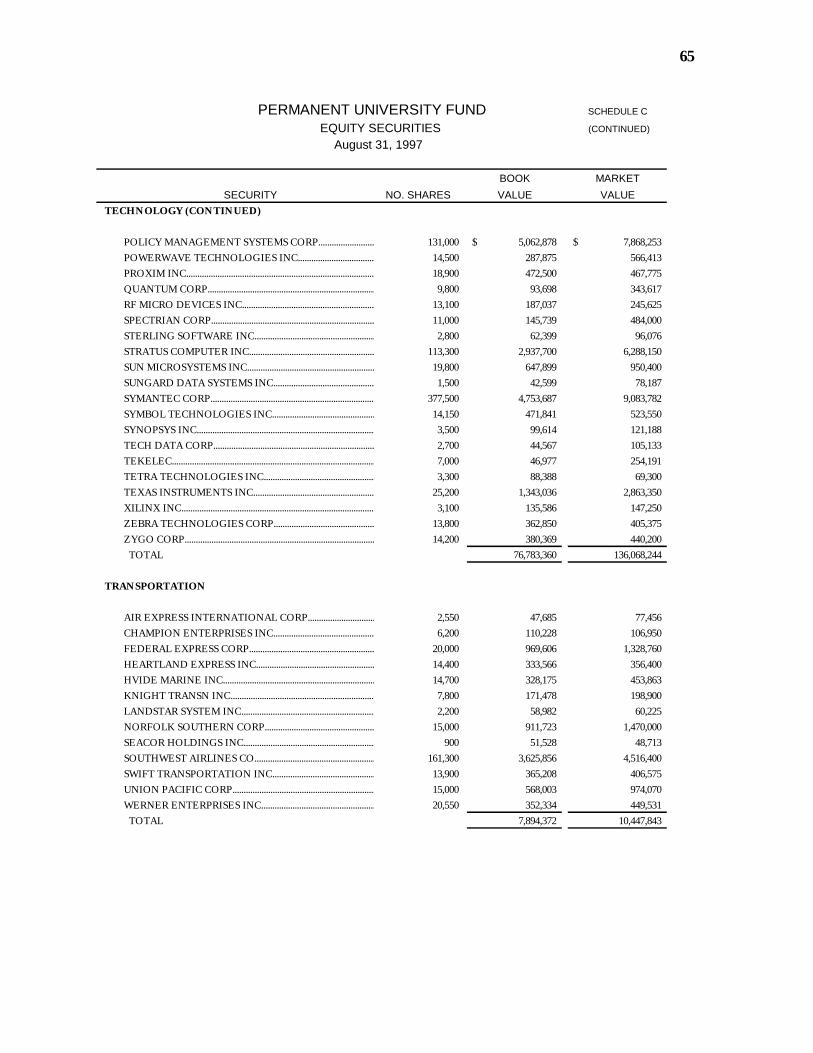
65
PERMANENT UNIVERSITY FUND SCHEDULE C
EQUITY SECURITIES (CONTINUED)
August 31, 1997
BOOK MARKET SECURITY NO. SHARES VALUE VALUE
TECHNOLOGY (CONTINUED)
POLICY MANAGEMENT SYSTEMS CORP.....................................................................................................................131,000 5,062,878$ 7,868,253$ POWERWAVE TECHNOLOGIES INC.....................................................................................................................14,500 287,875 566,413 PROXIM INC.....................................................................................................................18,900 472,500 467,775 QUANTUM CORP.....................................................................................................................9,800 93,698 343,617 RF MICRO DEVICES INC.....................................................................................................................13,100 187,037 245,625 SPECTRIAN CORP.....................................................................................................................11,000 145,739 484,000 STERLING SOFTWARE INC.....................................................................................................................2,800 62,399 96,076 STRATUS COMPUTER INC.....................................................................................................................113,300 2,937,700 6,288,150 SUN MICROSYSTEMS INC.....................................................................................................................19,800 647,899 950,400 SUNGARD DATA SYSTEMS INC.....................................................................................................................1,500 42,599 78,187 SYMANTEC CORP.....................................................................................................................377,500 4,753,687 9,083,782 SYMBOL TECHNOLOGIES INC.....................................................................................................................14,150 471,841 523,550 SYNOPSYS INC.....................................................................................................................3,500 99,614 121,188 TECH DATA CORP.....................................................................................................................2,700 44,567 105,133 TEKELEC..................................................................................................................... 7,000 46,977 254,191 TETRA TECHNOLOGIES INC.....................................................................................................................3,300 88,388 69,300 TEXAS INSTRUMENTS INC.....................................................................................................................25,200 1,343,036 2,863,350 XILINX INC.....................................................................................................................3,100 135,586 147,250 ZEBRA TECHNOLOGIES CORP.....................................................................................................................13,800 362,850 405,375 ZYGO CORP.....................................................................................................................14,200 380,369 440,200 TOTAL 76,783,360 136,068,244
TRANSPORTATION
AIR EXPRESS INTERNATIONAL CORP.....................................................................................................................2,550 47,685 77,456 CHAMPION ENTERPRISES INC.....................................................................................................................6,200 110,228 106,950 FEDERAL EXPRESS CORP.....................................................................................................................20,000 969,606 1,328,760 HEARTLAND EXPRESS INC.....................................................................................................................14,400 333,566 356,400 HVIDE MARINE INC.....................................................................................................................14,700 328,175 453,863 KNIGHT TRANSN INC.....................................................................................................................7,800 171,478 198,900 LANDSTAR SYSTEM INC.....................................................................................................................2,200 58,982 60,225 NORFOLK SOUTHERN CORP.....................................................................................................................15,000 911,723 1,470,000 SEACOR HOLDINGS INC.....................................................................................................................900 51,528 48,713 SOUTHWEST AIRLINES CO.....................................................................................................................161,300 3,625,856 4,516,400 SWIFT TRANSPORTATION INC.....................................................................................................................13,900 365,208 406,575 UNION PACIFIC CORP.....................................................................................................................15,000 568,003 974,070 WERNER ENTERPRISES INC.....................................................................................................................20,550 352,334 449,531 TOTAL 7,894,372 10,447,843
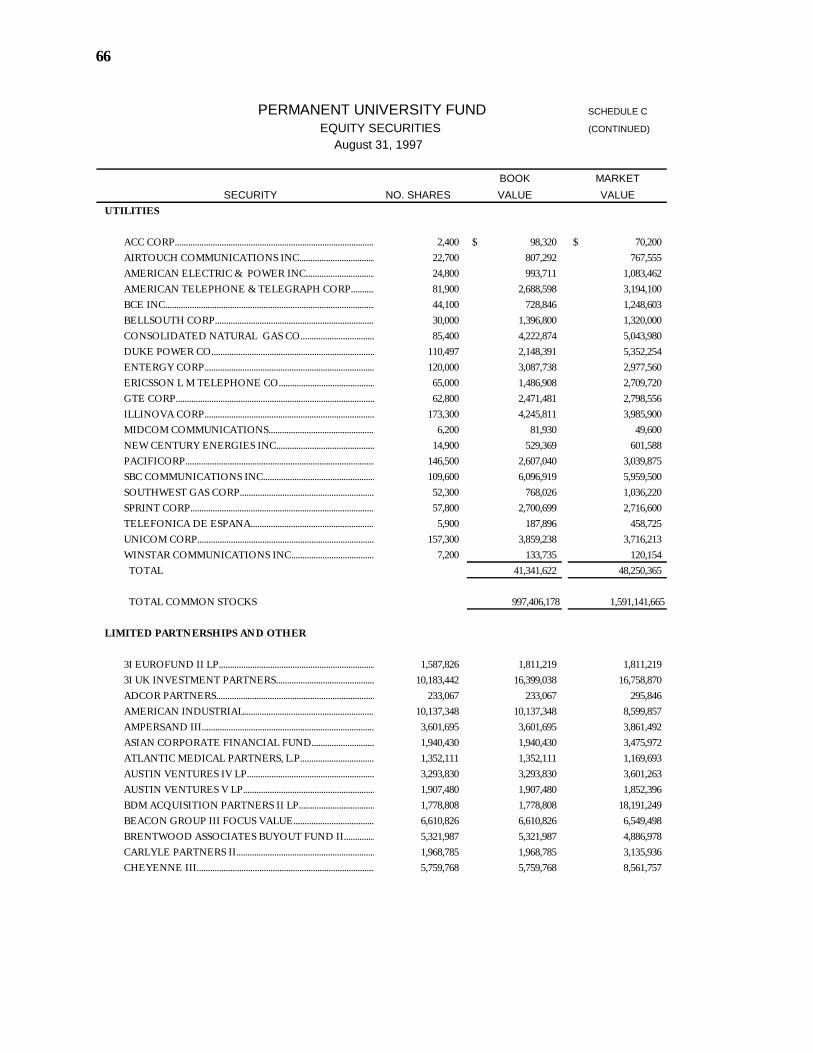
66
PERMANENT UNIVERSITY FUND SCHEDULE C
EQUITY SECURITIES (CONTINUED)
August 31, 1997
BOOK MARKET SECURITY NO. SHARES VALUE VALUE
UTILITIES
ACC CORP..................................................................................................................... 2,400 98,320$ 70,200$ AIRTOUCH COMMUNICATIONS INC.....................................................................................................................22,700 807,292 767,555 AMERICAN ELECTRIC & POWER INC.....................................................................................................................24,800 993,711 1,083,462 AMERICAN TELEPHONE & TELEGRAPH CORP.....................................................................................................................81,900 2,688,598 3,194,100 BCE INC..................................................................................................................... 44,100 728,846 1,248,603 BELLSOUTH CORP.....................................................................................................................30,000 1,396,800 1,320,000 CONSOLIDATED NATURAL GAS CO.....................................................................................................................85,400 4,222,874 5,043,980 DUKE POWER CO.....................................................................................................................110,497 2,148,391 5,352,254 ENTERGY CORP.....................................................................................................................120,000 3,087,738 2,977,560 ERICSSON L M TELEPHONE CO.....................................................................................................................65,000 1,486,908 2,709,720 GTE CORP.....................................................................................................................62,800 2,471,481 2,798,556 ILLINOVA CORP.....................................................................................................................173,300 4,245,811 3,985,900 MIDCOM COMMUNICATIONS.....................................................................................................................6,200 81,930 49,600 NEW CENTURY ENERGIES INC.....................................................................................................................14,900 529,369 601,588 PACIFICORP.....................................................................................................................146,500 2,607,040 3,039,875 SBC COMMUNICATIONS INC.....................................................................................................................109,600 6,096,919 5,959,500 SOUTHWEST GAS CORP.....................................................................................................................52,300 768,026 1,036,220 SPRINT CORP.....................................................................................................................57,800 2,700,699 2,716,600 TELEFONICA DE ESPANA.....................................................................................................................5,900 187,896 458,725 UNICOM CORP.....................................................................................................................157,300 3,859,238 3,716,213 WINSTAR COMMUNICATIONS INC.....................................................................................................................7,200 133,735 120,154 TOTAL 41,341,622 48,250,365
TOTAL COMMON STOCKS 997,406,178 1,591,141,665
LIMITED PARTNERSHIPS AND OTHER
3I EUROFUND II LP.....................................................................................................................1,587,826 1,811,219 1,811,219 3I UK INVESTMENT PARTNERS.....................................................................................................................10,183,442 16,399,038 16,758,870 ADCOR PARTNERS.....................................................................................................................233,067 233,067 295,846 AMERICAN INDUSTRIAL.....................................................................................................................10,137,348 10,137,348 8,599,857 AMPERSAND III.....................................................................................................................3,601,695 3,601,695 3,861,492 ASIAN CORPORATE FINANCIAL FUND.....................................................................................................................1,940,430 1,940,430 3,475,972 ATLANTIC MEDICAL PARTNERS, L.P......................................................................................................................1,352,111 1,352,111 1,169,693 AUSTIN VENTURES IV LP.....................................................................................................................3,293,830 3,293,830 3,601,263 AUSTIN VENTURES V LP.....................................................................................................................1,907,480 1,907,480 1,852,396 BDM ACQUISITION PARTNERS II LP.....................................................................................................................1,778,808 1,778,808 18,191,249 BEACON GROUP III FOCUS VALUE.....................................................................................................................6,610,826 6,610,826 6,549,498 BRENTWOOD ASSOCIATES BUYOUT FUND II.....................................................................................................................5,321,987 5,321,987 4,886,978 CARLYLE PARTNERS II.....................................................................................................................1,968,785 1,968,785 3,135,936 CHEYENNE III.....................................................................................................................5,759,768 5,759,768 8,561,757
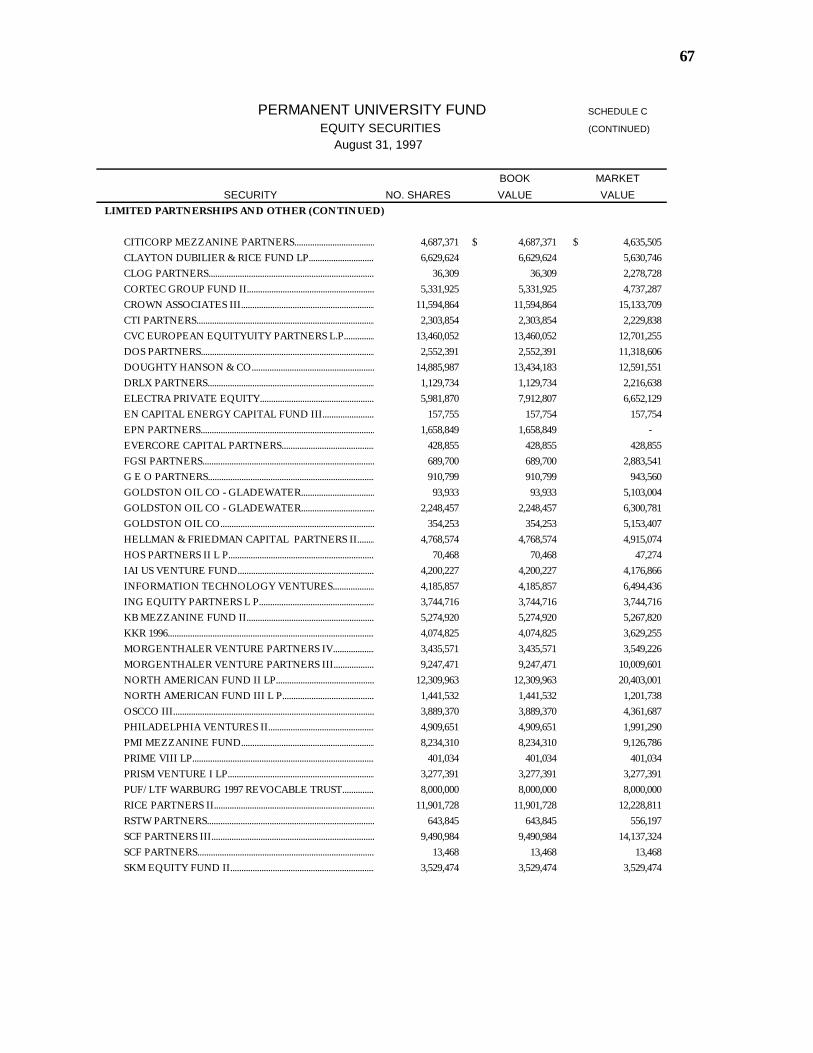
67
PERMANENT UNIVERSITY FUND SCHEDULE C
EQUITY SECURITIES (CONTINUED)
August 31, 1997
BOOK MARKET SECURITY NO. SHARES VALUE VALUE
LIMITED PARTNERSHIPS AND OTHER (CONTINUED)
CITICORP MEZZANINE PARTNERS.....................................................................................................................4,687,371 4,687,371$ 4,635,505$ CLAYTON DUBILIER & RICE FUND LP.....................................................................................................................6,629,624 6,629,624 5,630,746 CLOG PARTNERS.....................................................................................................................36,309 36,309 2,278,728 CORTEC GROUP FUND II.....................................................................................................................5,331,925 5,331,925 4,737,287 CROWN ASSOCIATES III.....................................................................................................................11,594,864 11,594,864 15,133,709 CTI PARTNERS.....................................................................................................................2,303,854 2,303,854 2,229,838 CVC EUROPEAN EQUITYUITY PARTNERS L.P......................................................................................................................13,460,052 13,460,052 12,701,255 DOS PARTNERS.....................................................................................................................2,552,391 2,552,391 11,318,606 DOUGHTY HANSON & CO.....................................................................................................................14,885,987 13,434,183 12,591,551 DRLX PARTNERS.....................................................................................................................1,129,734 1,129,734 2,216,638 ELECTRA PRIVATE EQUITY.....................................................................................................................5,981,870 7,912,807 6,652,129 EN CAPITAL ENERGY CAPITAL FUND III.....................................................................................................................157,755 157,754 157,754 EPN PARTNERS.....................................................................................................................1,658,849 1,658,849 - EVERCORE CAPITAL PARTNERS.....................................................................................................................428,855 428,855 428,855 FGSI PARTNERS.....................................................................................................................689,700 689,700 2,883,541 G E O PARTNERS.....................................................................................................................910,799 910,799 943,560 GOLDSTON OIL CO - GLADEWATER.....................................................................................................................93,933 93,933 5,103,004 GOLDSTON OIL CO - GLADEWATER.....................................................................................................................2,248,457 2,248,457 6,300,781 GOLDSTON OIL CO.....................................................................................................................354,253 354,253 5,153,407 HELLMAN & FRIEDMAN CAPITAL PARTNERS II.....................................................................................................................4,768,574 4,768,574 4,915,074 HOS PARTNERS II L P.....................................................................................................................70,468 70,468 47,274 IAI US VENTURE FUND.....................................................................................................................4,200,227 4,200,227 4,176,866 INFORMATION TECHNOLOGY VENTURES.....................................................................................................................4,185,857 4,185,857 6,494,436 ING EQUITY PARTNERS L P.....................................................................................................................3,744,716 3,744,716 3,744,716 KB MEZZANINE FUND II.....................................................................................................................5,274,920 5,274,920 5,267,820 KKR 1996.....................................................................................................................4,074,825 4,074,825 3,629,255 MORGENTHALER VENTURE PARTNERS IV.....................................................................................................................3,435,571 3,435,571 3,549,226 MORGENTHALER VENTURE PARTNERS III.....................................................................................................................9,247,471 9,247,471 10,009,601 NORTH AMERICAN FUND II LP.....................................................................................................................12,309,963 12,309,963 20,403,001 NORTH AMERICAN FUND III L P.....................................................................................................................1,441,532 1,441,532 1,201,738 OSCCO III.....................................................................................................................3,889,370 3,889,370 4,361,687 PHILADELPHIA VENTURES II.....................................................................................................................4,909,651 4,909,651 1,991,290 PMI MEZZANINE FUND.....................................................................................................................8,234,310 8,234,310 9,126,786 PRIME VIII LP.....................................................................................................................401,034 401,034 401,034 PRISM VENTURE I LP.....................................................................................................................3,277,391 3,277,391 3,277,391 PUF/LTF WARBURG 1997 REVOCABLE TRUST.....................................................................................................................8,000,000 8,000,000 8,000,000 RICE PARTNERS II.....................................................................................................................11,901,728 11,901,728 12,228,811 RSTW PARTNERS.....................................................................................................................643,845 643,845 556,197 SCF PARTNERS III.....................................................................................................................9,490,984 9,490,984 14,137,324 SCF PARTNERS.....................................................................................................................13,468 13,468 13,468 SKM EQUITY FUND II.....................................................................................................................3,529,474 3,529,474 3,529,474
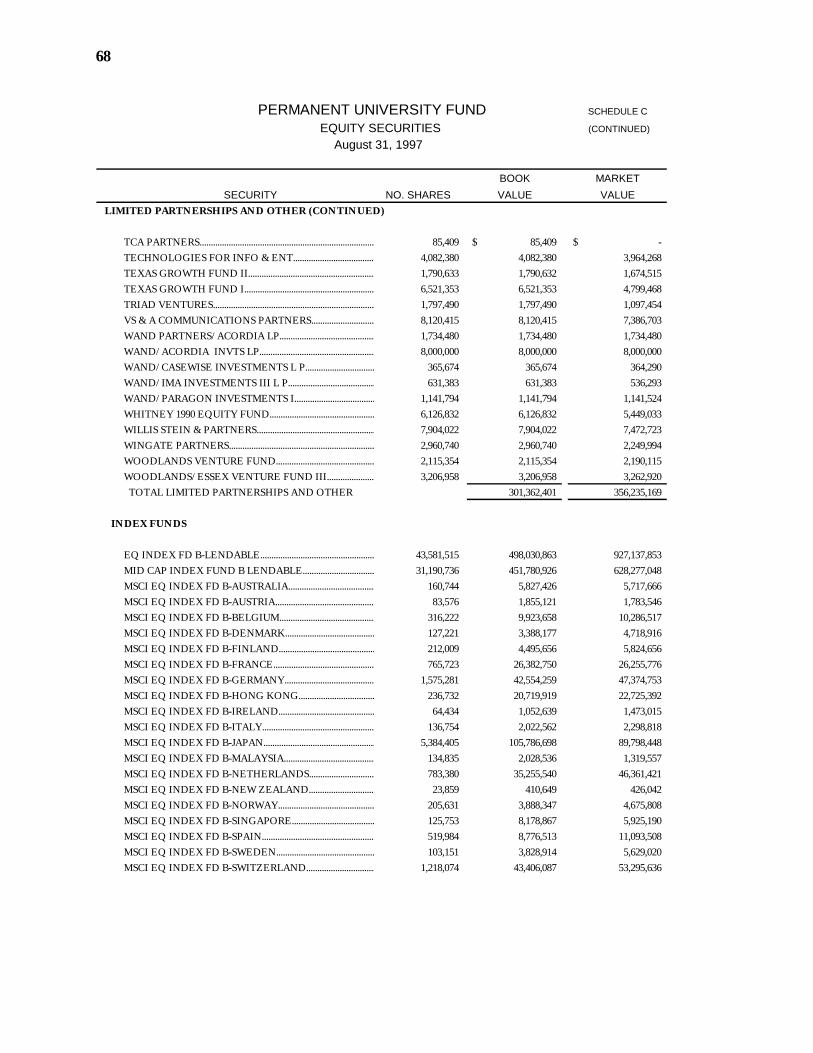
68
PERMANENT UNIVERSITY FUND SCHEDULE C
EQUITY SECURITIES (CONTINUED)
August 31, 1997
BOOK MARKET SECURITY NO. SHARES VALUE VALUE
LIMITED PARTNERSHIPS AND OTHER (CONTINUED)
TCA PARTNERS.....................................................................................................................85,409 85,409$ -$ TECHNOLOGIES FOR INFO & ENT.....................................................................................................................4,082,380 4,082,380 3,964,268 TEXAS GROWTH FUND II....................................................................................................................1,790,633 1,790,632 1,674,515 TEXAS GROWTH FUND I.....................................................................................................................6,521,353 6,521,353 4,799,468 TRIAD VENTURES.....................................................................................................................1,797,490 1,797,490 1,097,454 VS & A COMMUNICATIONS PARTNERS.....................................................................................................................8,120,415 8,120,415 7,386,703 WAND PARTNERS/ACORDIA LP.....................................................................................................................1,734,480 1,734,480 1,734,480 WAND/ACORDIA INVTS LP.....................................................................................................................8,000,000 8,000,000 8,000,000 WAND/CASEWISE INVESTMENTS L P.....................................................................................................................365,674 365,674 364,290 WAND/IMA INVESTMENTS III L P.....................................................................................................................631,383 631,383 536,293 WAND/PARAGON INVESTMENTS I.....................................................................................................................1,141,794 1,141,794 1,141,524 WHITNEY 1990 EQUITY FUND.....................................................................................................................6,126,832 6,126,832 5,449,033 WILLIS STEIN & PARTNERS.....................................................................................................................7,904,022 7,904,022 7,472,723 WINGATE PARTNERS.....................................................................................................................2,960,740 2,960,740 2,249,994 WOODLANDS VENTURE FUND.....................................................................................................................2,115,354 2,115,354 2,190,115 WOODLANDS/ESSEX VENTURE FUND III.....................................................................................................................3,206,958 3,206,958 3,262,920 TOTAL LIMITED PARTNERSHIPS AND OTHER 301,362,401 356,235,169
INDEX FUNDS
EQ INDEX FD B-LENDABLE.....................................................................................................................43,581,515 498,030,863 927,137,853 MID CAP INDEX FUND B LENDABLE.....................................................................................................................31,190,736 451,780,926 628,277,048 MSCI EQ INDEX FD B-AUSTRALIA.....................................................................................................................160,744 5,827,426 5,717,666 MSCI EQ INDEX FD B-AUSTRIA.....................................................................................................................83,576 1,855,121 1,783,546 MSCI EQ INDEX FD B-BELGIUM.....................................................................................................................316,222 9,923,658 10,286,517 MSCI EQ INDEX FD B-DENMARK.....................................................................................................................127,221 3,388,177 4,718,916 MSCI EQ INDEX FD B-FINLAND.....................................................................................................................212,009 4,495,656 5,824,656 MSCI EQ INDEX FD B-FRANCE.....................................................................................................................765,723 26,382,750 26,255,776 MSCI EQ INDEX FD B-GERMANY.....................................................................................................................1,575,281 42,554,259 47,374,753 MSCI EQ INDEX FD B-HONG KONG.....................................................................................................................236,732 20,719,919 22,725,392 MSCI EQ INDEX FD B-IRELAND.....................................................................................................................64,434 1,052,639 1,473,015 MSCI EQ INDEX FD B-ITALY.....................................................................................................................136,754 2,022,562 2,298,818 MSCI EQ INDEX FD B-JAPAN.....................................................................................................................5,384,405 105,786,698 89,798,448 MSCI EQ INDEX FD B-MALAYSIA.....................................................................................................................134,835 2,028,536 1,319,557 MSCI EQ INDEX FD B-NETHERLANDS.....................................................................................................................783,380 35,255,540 46,361,421 MSCI EQ INDEX FD B-NEW ZEALAND.....................................................................................................................23,859 410,649 426,042 MSCI EQ INDEX FD B-NORWAY.....................................................................................................................205,631 3,888,347 4,675,808 MSCI EQ INDEX FD B-SINGAPORE.....................................................................................................................125,753 8,178,867 5,925,190 MSCI EQ INDEX FD B-SPAIN.....................................................................................................................519,984 8,776,513 11,093,508 MSCI EQ INDEX FD B-SWEDEN.....................................................................................................................103,151 3,828,914 5,629,020 MSCI EQ INDEX FD B-SWITZERLAND.....................................................................................................................1,218,074 43,406,087 53,295,636
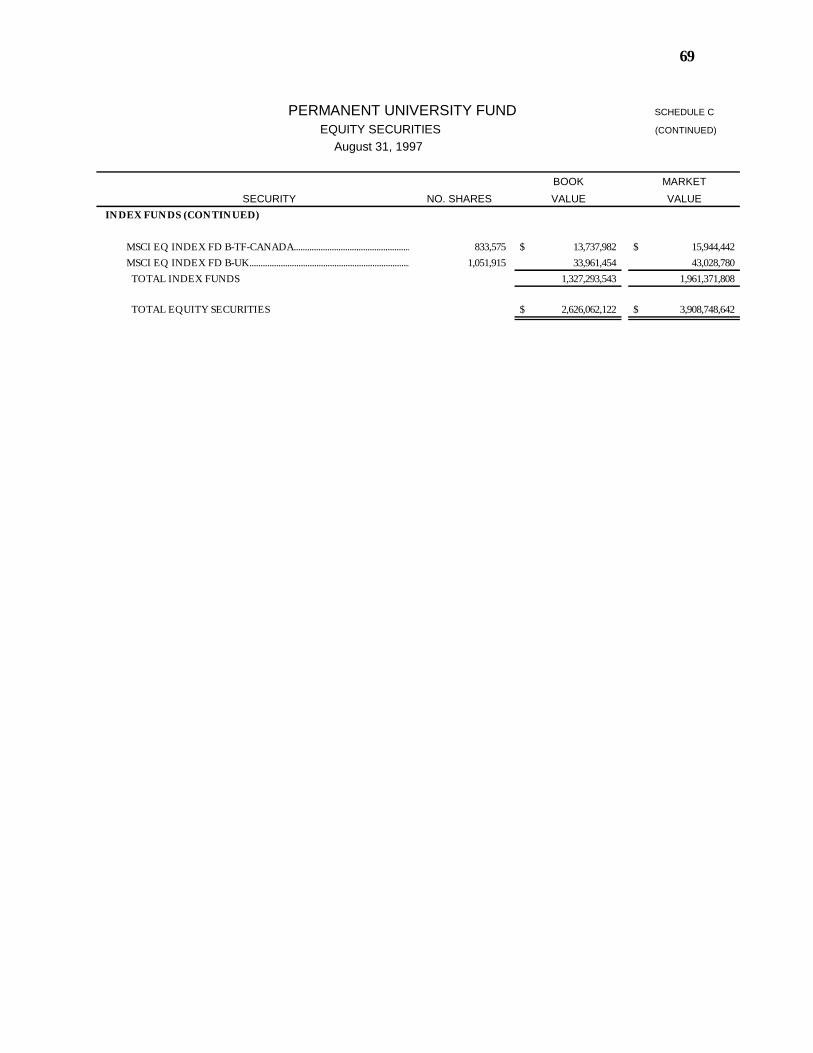
69
PERMANENT UNIVERSITY FUND SCHEDULE C
EQUITY SECURITIES (CONTINUED)
August 31, 1997
BOOK MARKET
SECURITY NO. SHARES VALUE VALUEINDEX FUNDS (CONTINUED)
MSCI EQ INDEX FD B-TF-CANADA.....................................................................................................................833,575 13,737,982$ 15,944,442$ MSCI EQ INDEX FD B-UK.....................................................................................................................1,051,915 33,961,454 43,028,780 TOTAL INDEX FUNDS 1,327,293,543 1,961,371,808
TOTAL EQUITY SECURITIES 2,626,062,122$ 3,908,748,642$
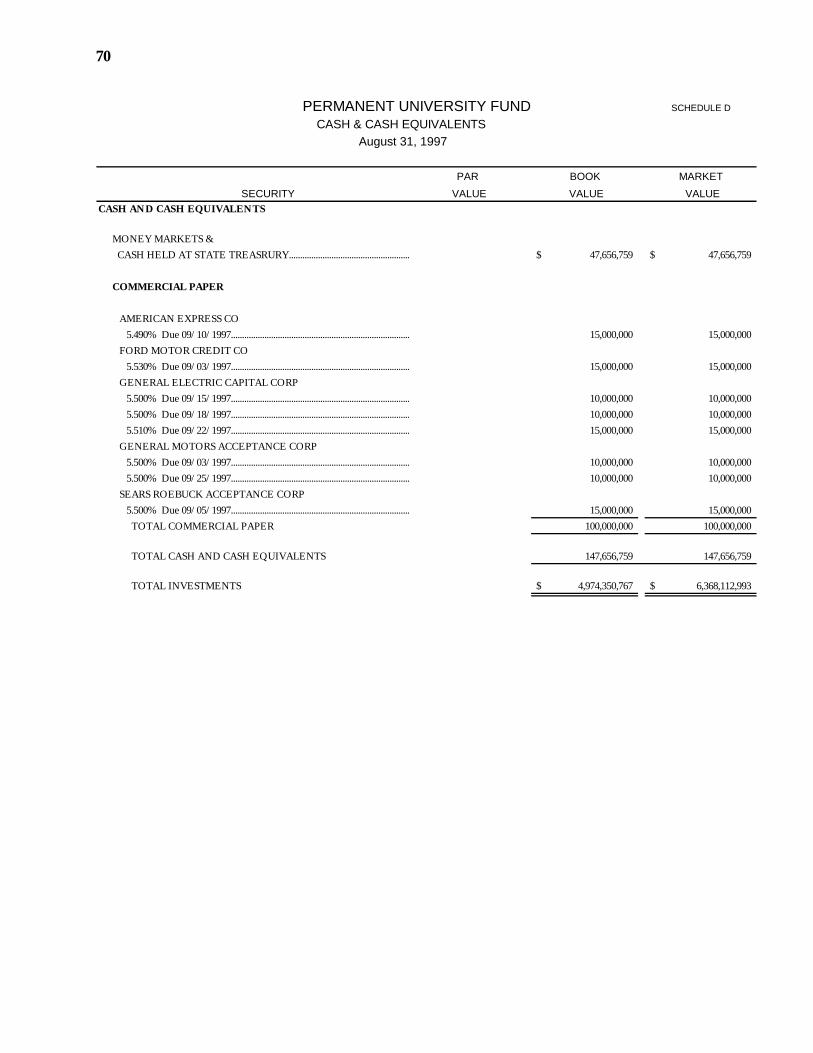
70
PERMANENT UNIVERSITY FUND SCHEDULE D
CASH & CASH EQUIVALENTS August 31, 1997
PAR BOOK MARKET
SECURITY VALUE VALUE VALUECASH AND CASH EQUIVALENTS
MONEY MARKETS & CASH HELD AT STATE TREASRURY..................................................................................................................... 47,656,759$ 47,656,759$
COMMERCIAL PAPER
AMERICAN EXPRESS CO5.490% Due 09/10/1997........................................................................................... 15,000,000 15,000,000
FORD MOTOR CREDIT CO5.530% Due 09/03/1997........................................................................................... 15,000,000 15,000,000
GENERAL ELECTRIC CAPITAL CORP5.500% Due 09/15/1997........................................................................................... 10,000,000 10,000,000 5.500% Due 09/18/1997........................................................................................... 10,000,000 10,000,000 5.510% Due 09/22/1997........................................................................................... 15,000,000 15,000,000
GENERAL MOTORS ACCEPTANCE CORP 5.500% Due 09/03/1997........................................................................................... 10,000,000 10,000,000 5.500% Due 09/25/1997........................................................................................... 10,000,000 10,000,000
SEARS ROEBUCK ACCEPTANCE CORP 5.500% Due 09/05/1997........................................................................................... 15,000,000 15,000,000 TOTAL COMMERCIAL PAPER 100,000,000 100,000,000
TOTAL CASH AND CASH EQUIVALENTS 147,656,759 147,656,759
TOTAL INVESTMENTS 4,974,350,767$ 6,368,112,993$
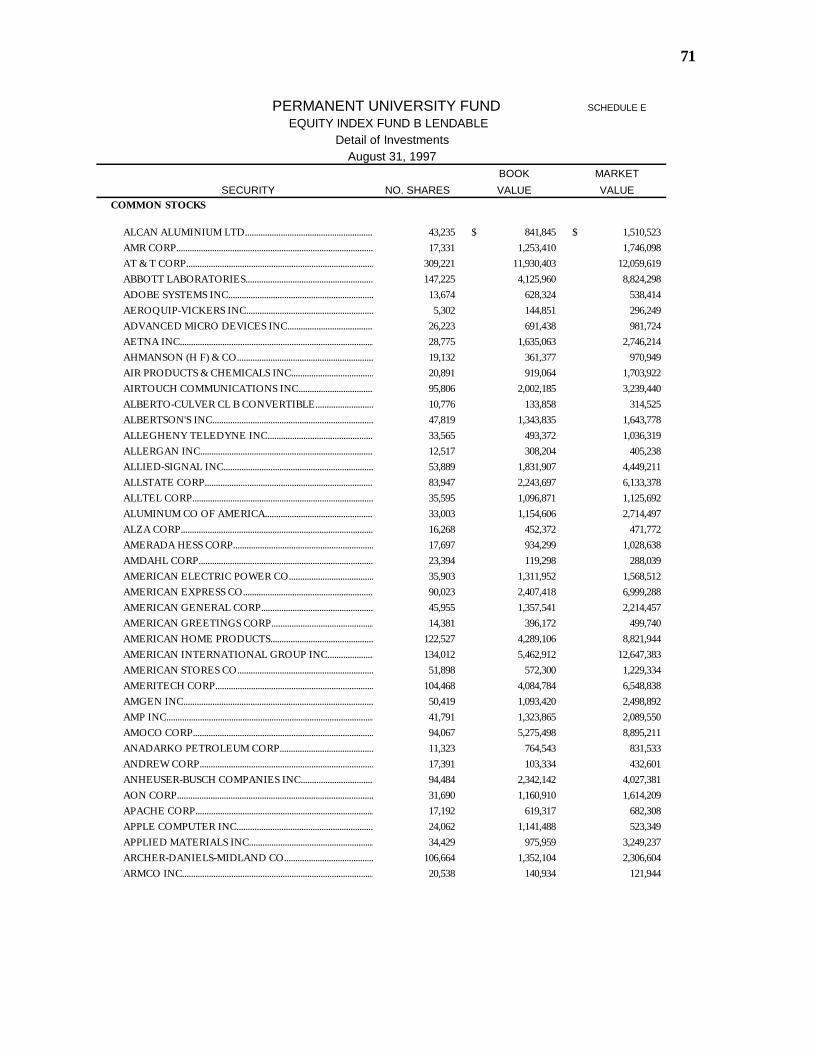
71
PERMANENT UNIVERSITY FUND SCHEDULE E
EQUITY INDEX FUND B LENDABLE Detail of Investments
August 31, 1997BOOK MARKET
SECURITY NO. SHARES VALUE VALUECOMMON STOCKS
ALCAN ALUMINIUM LTD.........................................................................................................................................................................................................43,235 841,845$ 1,510,523$ AMR CORP.........................................................................................................................................................................................................17,331 1,253,410 1,746,098 AT & T CORP.........................................................................................................................................................................................................309,221 11,930,403 12,059,619 ABBOTT LABORATORIES.........................................................................................................................................................................................................147,225 4,125,960 8,824,298 ADOBE SYSTEMS INC.........................................................................................................................................................................................................13,674 628,324 538,414 AEROQUIP-VICKERS INC.........................................................................................................................................................................................................5,302 144,851 296,249 ADVANCED MICRO DEVICES INC.........................................................................................................................................................................................................26,223 691,438 981,724 AETNA INC.........................................................................................................................................................................................................28,775 1,635,063 2,746,214 AHMANSON (H F) & CO.........................................................................................................................................................................................................19,132 361,377 970,949 AIR PRODUCTS & CHEMICALS INC.........................................................................................................................................................................................................20,891 919,064 1,703,922 AIRTOUCH COMMUNICATIONS INC.........................................................................................................................................................................................................95,806 2,002,185 3,239,440 ALBERTO-CULVER CL B CONVERTIBLE.........................................................................................................................................................................................................10,776 133,858 314,525 ALBERTSON'S INC.........................................................................................................................................................................................................47,819 1,343,835 1,643,778 ALLEGHENY TELEDYNE INC.........................................................................................................................................................................................................33,565 493,372 1,036,319 ALLERGAN INC.........................................................................................................................................................................................................12,517 308,204 405,238 ALLIED-SIGNAL INC.........................................................................................................................................................................................................53,889 1,831,907 4,449,211 ALLSTATE CORP.........................................................................................................................................................................................................83,947 2,243,697 6,133,378 ALLTEL CORP.........................................................................................................................................................................................................35,595 1,096,871 1,125,692 ALUMINUM CO OF AMERICA.........................................................................................................................................................................................................33,003 1,154,606 2,714,497 ALZA CORP.........................................................................................................................................................................................................16,268 452,372 471,772 AMERADA HESS CORP.........................................................................................................................................................................................................17,697 934,299 1,028,638 AMDAHL CORP.........................................................................................................................................................................................................23,394 119,298 288,039 AMERICAN ELECTRIC POWER CO.........................................................................................................................................................................................................35,903 1,311,952 1,568,512 AMERICAN EXPRESS CO.........................................................................................................................................................................................................90,023 2,407,418 6,999,288 AMERICAN GENERAL CORP.........................................................................................................................................................................................................45,955 1,357,541 2,214,457 AMERICAN GREETINGS CORP.........................................................................................................................................................................................................14,381 396,172 499,740 AMERICAN HOME PRODUCTS.........................................................................................................................................................................................................122,527 4,289,106 8,821,944 AMERICAN INTERNATIONAL GROUP INC.........................................................................................................................................................................................................134,012 5,462,912 12,647,383 AMERICAN STORES CO.........................................................................................................................................................................................................51,898 572,300 1,229,334 AMERITECH CORP.........................................................................................................................................................................................................104,468 4,084,784 6,548,838 AMGEN INC.........................................................................................................................................................................................................50,419 1,093,420 2,498,892 AMP INC.........................................................................................................................................................................................................41,791 1,323,865 2,089,550 AMOCO CORP.........................................................................................................................................................................................................94,067 5,275,498 8,895,211 ANADARKO PETROLEUM CORP.........................................................................................................................................................................................................11,323 764,543 831,533 ANDREW CORP.........................................................................................................................................................................................................17,391 103,334 432,601 ANHEUSER-BUSCH COMPANIES INC.........................................................................................................................................................................................................94,484 2,342,142 4,027,381 AON CORP.........................................................................................................................................................................................................31,690 1,160,910 1,614,209 APACHE CORP.........................................................................................................................................................................................................17,192 619,317 682,308 APPLE COMPUTER INC.........................................................................................................................................................................................................24,062 1,141,488 523,349 APPLIED MATERIALS INC.........................................................................................................................................................................................................34,429 975,959 3,249,237 ARCHER-DANIELS-MIDLAND CO.........................................................................................................................................................................................................106,664 1,352,104 2,306,604 ARMCO INC.........................................................................................................................................................................................................20,538 140,934 121,944
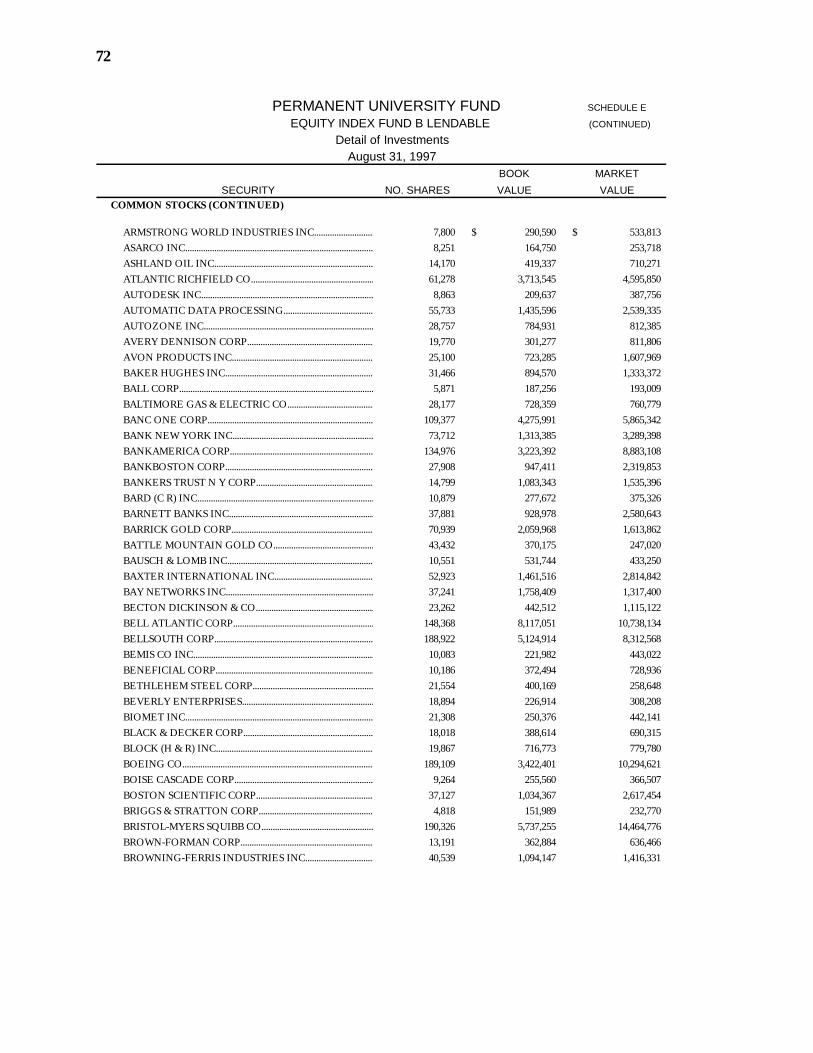
72
PERMANENT UNIVERSITY FUND SCHEDULE E
EQUITY INDEX FUND B LENDABLE (CONTINUED)
Detail of Investments August 31, 1997
BOOK MARKETSECURITY NO. SHARES VALUE VALUE
COMMON STOCKS (CONTINUED)
ARMSTRONG WORLD INDUSTRIES INC.........................................................................................................................................................................................................7,800 290,590$ 533,813$ ASARCO INC.........................................................................................................................................................................................................8,251 164,750 253,718 ASHLAND OIL INC.........................................................................................................................................................................................................14,170 419,337 710,271 ATLANTIC RICHFIELD CO.........................................................................................................................................................................................................61,278 3,713,545 4,595,850 AUTODESK INC.........................................................................................................................................................................................................8,863 209,637 387,756 AUTOMATIC DATA PROCESSING.........................................................................................................................................................................................................55,733 1,435,596 2,539,335 AUTOZONE INC.........................................................................................................................................................................................................28,757 784,931 812,385 AVERY DENNISON CORP.........................................................................................................................................................................................................19,770 301,277 811,806 AVON PRODUCTS INC.........................................................................................................................................................................................................25,100 723,285 1,607,969 BAKER HUGHES INC.........................................................................................................................................................................................................31,466 894,570 1,333,372 BALL CORP.........................................................................................................................................................................................................5,871 187,256 193,009 BALTIMORE GAS & ELECTRIC CO.........................................................................................................................................................................................................28,177 728,359 760,779 BANC ONE CORP.........................................................................................................................................................................................................109,377 4,275,991 5,865,342 BANK NEW YORK INC.........................................................................................................................................................................................................73,712 1,313,385 3,289,398 BANKAMERICA CORP.........................................................................................................................................................................................................134,976 3,223,392 8,883,108 BANKBOSTON CORP.........................................................................................................................................................................................................27,908 947,411 2,319,853 BANKERS TRUST N Y CORP.........................................................................................................................................................................................................14,799 1,083,343 1,535,396 BARD (C R) INC.........................................................................................................................................................................................................10,879 277,672 375,326 BARNETT BANKS INC.........................................................................................................................................................................................................37,881 928,978 2,580,643 BARRICK GOLD CORP.........................................................................................................................................................................................................70,939 2,059,968 1,613,862 BATTLE MOUNTAIN GOLD CO.........................................................................................................................................................................................................43,432 370,175 247,020 BAUSCH & LOMB INC.........................................................................................................................................................................................................10,551 531,744 433,250 BAXTER INTERNATIONAL INC.........................................................................................................................................................................................................52,923 1,461,516 2,814,842 BAY NETWORKS INC.........................................................................................................................................................................................................37,241 1,758,409 1,317,400 BECTON DICKINSON & CO.........................................................................................................................................................................................................23,262 442,512 1,115,122 BELL ATLANTIC CORP.........................................................................................................................................................................................................148,368 8,117,051 10,738,134 BELLSOUTH CORP.........................................................................................................................................................................................................188,922 5,124,914 8,312,568 BEMIS CO INC.........................................................................................................................................................................................................10,083 221,982 443,022 BENEFICIAL CORP.........................................................................................................................................................................................................10,186 372,494 728,936 BETHLEHEM STEEL CORP.........................................................................................................................................................................................................21,554 400,169 258,648 BEVERLY ENTERPRISES.........................................................................................................................................................................................................18,894 226,914 308,208 BIOMET INC.........................................................................................................................................................................................................21,308 250,376 442,141 BLACK & DECKER CORP.........................................................................................................................................................................................................18,018 388,614 690,315 BLOCK (H & R) INC.........................................................................................................................................................................................................19,867 716,773 779,780 BOEING CO.........................................................................................................................................................................................................189,109 3,422,401 10,294,621 BOISE CASCADE CORP.........................................................................................................................................................................................................9,264 255,560 366,507 BOSTON SCIENTIFIC CORP.........................................................................................................................................................................................................37,127 1,034,367 2,617,454 BRIGGS & STRATTON CORP.........................................................................................................................................................................................................4,818 151,989 232,770 BRISTOL-MYERS SQUIBB CO.........................................................................................................................................................................................................190,326 5,737,255 14,464,776 BROWN-FORMAN CORP.........................................................................................................................................................................................................13,191 362,884 636,466 BROWNING-FERRIS INDUSTRIES INC.........................................................................................................................................................................................................40,539 1,094,147 1,416,331
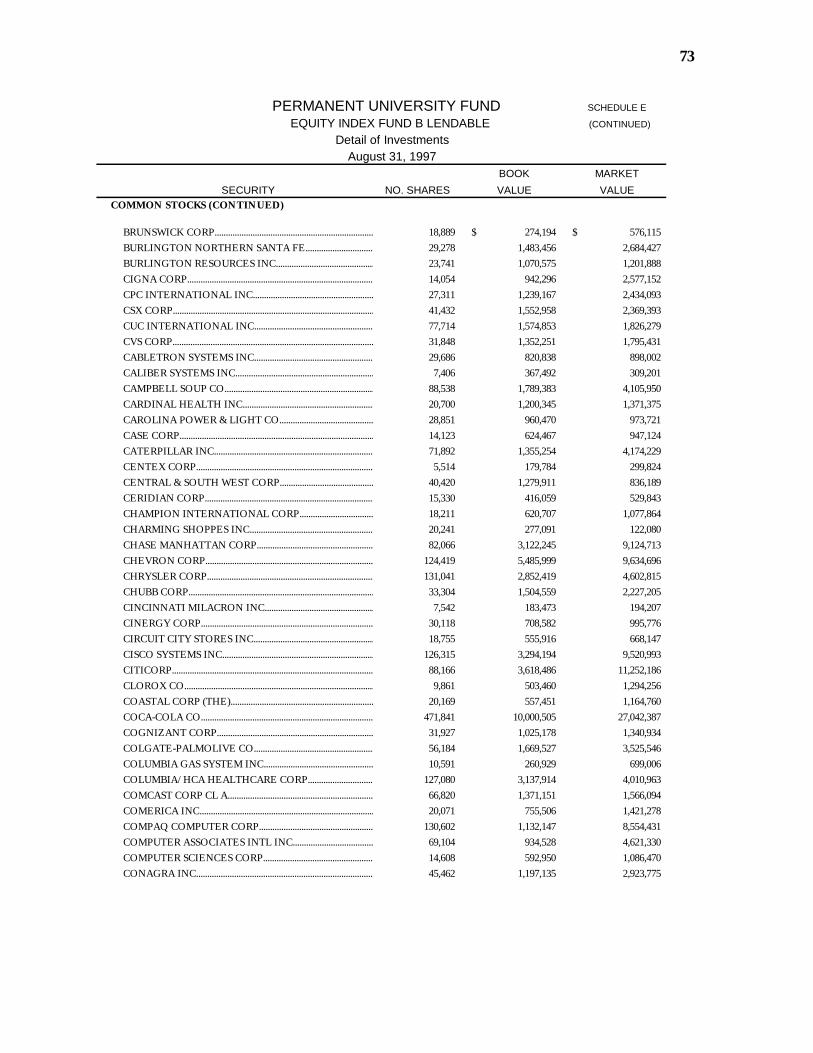
73
PERMANENT UNIVERSITY FUND SCHEDULE E
EQUITY INDEX FUND B LENDABLE (CONTINUED)
Detail of Investments August 31, 1997
BOOK MARKETSECURITY NO. SHARES VALUE VALUE
COMMON STOCKS (CONTINUED)
BRUNSWICK CORP.........................................................................................................................................................................................................18,889 274,194$ 576,115$ BURLINGTON NORTHERN SANTA FE.........................................................................................................................................................................................................29,278 1,483,456 2,684,427 BURLINGTON RESOURCES INC.........................................................................................................................................................................................................23,741 1,070,575 1,201,888 CIGNA CORP.........................................................................................................................................................................................................14,054 942,296 2,577,152 CPC INTERNATIONAL INC.........................................................................................................................................................................................................27,311 1,239,167 2,434,093 CSX CORP.........................................................................................................................................................................................................41,432 1,552,958 2,369,393 CUC INTERNATIONAL INC.........................................................................................................................................................................................................77,714 1,574,853 1,826,279 CVS CORP.........................................................................................................................................................................................................31,848 1,352,251 1,795,431 CABLETRON SYSTEMS INC.........................................................................................................................................................................................................29,686 820,838 898,002 CALIBER SYSTEMS INC.........................................................................................................................................................................................................7,406 367,492 309,201 CAMPBELL SOUP CO.........................................................................................................................................................................................................88,538 1,789,383 4,105,950 CARDINAL HEALTH INC.........................................................................................................................................................................................................20,700 1,200,345 1,371,375 CAROLINA POWER & LIGHT CO.........................................................................................................................................................................................................28,851 960,470 973,721 CASE CORP.........................................................................................................................................................................................................14,123 624,467 947,124 CATERPILLAR INC.........................................................................................................................................................................................................71,892 1,355,254 4,174,229 CENTEX CORP.........................................................................................................................................................................................................5,514 179,784 299,824 CENTRAL & SOUTH WEST CORP.........................................................................................................................................................................................................40,420 1,279,911 836,189 CERIDIAN CORP.........................................................................................................................................................................................................15,330 416,059 529,843 CHAMPION INTERNATIONAL CORP.........................................................................................................................................................................................................18,211 620,707 1,077,864 CHARMING SHOPPES INC.........................................................................................................................................................................................................20,241 277,091 122,080 CHASE MANHATTAN CORP.........................................................................................................................................................................................................82,066 3,122,245 9,124,713 CHEVRON CORP.........................................................................................................................................................................................................124,419 5,485,999 9,634,696 CHRYSLER CORP.........................................................................................................................................................................................................131,041 2,852,419 4,602,815 CHUBB CORP.........................................................................................................................................................................................................33,304 1,504,559 2,227,205 CINCINNATI MILACRON INC.........................................................................................................................................................................................................7,542 183,473 194,207 CINERGY CORP.........................................................................................................................................................................................................30,118 708,582 995,776 CIRCUIT CITY STORES INC.........................................................................................................................................................................................................18,755 555,916 668,147 CISCO SYSTEMS INC.........................................................................................................................................................................................................126,315 3,294,194 9,520,993 CITICORP.........................................................................................................................................................................................................88,166 3,618,486 11,252,186 CLOROX CO.........................................................................................................................................................................................................9,861 503,460 1,294,256 COASTAL CORP (THE).........................................................................................................................................................................................................20,169 557,451 1,164,760 COCA-COLA CO.........................................................................................................................................................................................................471,841 10,000,505 27,042,387 COGNIZANT CORP.........................................................................................................................................................................................................31,927 1,025,178 1,340,934 COLGATE-PALMOLIVE CO.........................................................................................................................................................................................................56,184 1,669,527 3,525,546 COLUMBIA GAS SYSTEM INC.........................................................................................................................................................................................................10,591 260,929 699,006 COLUMBIA/HCA HEALTHCARE CORP.........................................................................................................................................................................................................127,080 3,137,914 4,010,963 COMCAST CORP CL A.........................................................................................................................................................................................................66,820 1,371,151 1,566,094 COMERICA INC.........................................................................................................................................................................................................20,071 755,506 1,421,278 COMPAQ COMPUTER CORP.........................................................................................................................................................................................................130,602 1,132,147 8,554,431 COMPUTER ASSOCIATES INTL INC.........................................................................................................................................................................................................69,104 934,528 4,621,330 COMPUTER SCIENCES CORP.........................................................................................................................................................................................................14,608 592,950 1,086,470 CONAGRA INC.........................................................................................................................................................................................................45,462 1,197,135 2,923,775

74
PERMANENT UNIVERSITY FUND SCHEDULE E
EQUITY INDEX FUND B LENDABLE (CONTINUED)
Detail of Investments August 31, 1997
BOOK MARKETSECURITY NO. SHARES VALUE VALUE
COMMON STOCKS (CONTINUED)
CONSECO INC.........................................................................................................................................................................................................34,901 1,269,706$ 1,500,743$ CONSOLIDATED EDISON CO OF N Y.........................................................................................................................................................................................................44,790 1,590,720 1,371,694 CONSOLIDATED NATURAL GAS CO.........................................................................................................................................................................................................18,074 940,789 1,067,496 COOPER INDUSTRIES INC.........................................................................................................................................................................................................22,586 1,067,416 1,204,116 COOPER TIRE & RUBBER CO.........................................................................................................................................................................................................15,081 487,785 378,910 COORS (ADOLPH) CO.........................................................................................................................................................................................................7,190 135,434 265,131 CORESTATES FINANCIAL CORP.........................................................................................................................................................................................................39,313 1,322,569 2,417,750 CORNING INC.........................................................................................................................................................................................................43,663 1,230,999 2,308,681 COSTCO COMPANIES INC.........................................................................................................................................................................................................40,218 782,430 1,450,362 COUNTRYWIDE CREDIT INDUSTRIES INC.........................................................................................................................................................................................................19,920 665,186 671,055 CRANE CO.........................................................................................................................................................................................................8,707 157,134 384,196 CROWN CORK & SEAL CO.........................................................................................................................................................................................................24,482 994,052 1,245,522 CUMMINS ENGINE CO INC.........................................................................................................................................................................................................7,302 320,926 561,798 CYPRUS AMAX MINERALS.........................................................................................................................................................................................................17,812 419,754 449,753 DSC COMMUNICATIONS CORP.........................................................................................................................................................................................................22,381 524,260 651,847 DTE HOLDINGS INC.........................................................................................................................................................................................................27,696 967,172 820,494 DANA CORP.........................................................................................................................................................................................................19,606 504,010 903,101 DARDEN RESTAURANTS INC.........................................................................................................................................................................................................29,324 342,505 295,073 DATA GENERAL CORP.........................................................................................................................................................................................................7,434 70,944 267,159 DAYTON-HUDSON CORP.........................................................................................................................................................................................................41,284 963,211 2,353,188 DEERE & CO.........................................................................................................................................................................................................48,659 1,057,671 2,724,904 DELL COMPUTER CORP.........................................................................................................................................................................................................63,794 1,082,823 5,235,095 DELTA AIR LINES INC.........................................................................................................................................................................................................13,977 938,614 1,209,011 DELUXE CORP.........................................................................................................................................................................................................15,654 662,501 515,604 DIGITAL EQUIPMENT CORP.........................................................................................................................................................................................................29,172 1,302,382 1,254,396 DILLARDS INC.........................................................................................................................................................................................................21,699 826,077 867,960 DISNEY (WALT) CO (THE).........................................................................................................................................................................................................128,464 6,276,541 9,867,641 DOMINION RESOURCES INC.........................................................................................................................................................................................................34,655 1,534,667 1,247,580 DONNELLEY (R R) & SONS CO.........................................................................................................................................................................................................27,888 799,884 1,085,889 DOVER CORP.........................................................................................................................................................................................................21,319 519,043 1,472,343 DOW CHEMICAL CO.........................................................................................................................................................................................................44,452 2,533,423 3,934,002 DOW JONES & CO INC.........................................................................................................................................................................................................18,250 570,425 781,328 DRESSER INDUSTRIES INC.........................................................................................................................................................................................................33,609 733,427 1,403,176 DU PONT (E I) DE NEMOURS.........................................................................................................................................................................................................214,896 5,760,049 13,390,707 DUKE ENERGY CORP.........................................................................................................................................................................................................68,447 2,184,329 3,315,402 DUN & BRADSTREET CORP.........................................................................................................................................................................................................32,627 717,236 913,556 EG & G INC.........................................................................................................................................................................................................8,773 195,148 186,426 E M C CORP.........................................................................................................................................................................................................46,911 1,063,211 2,407,121 EASTERN ENTERPRISES.........................................................................................................................................................................................................3,892 105,226 138,896 EASTMAN CHEMICAL CO.........................................................................................................................................................................................................14,974 681,503 895,632 EASTMAN KODAK CO.........................................................................................................................................................................................................62,596 2,699,520 4,092,214 EATON CORP.........................................................................................................................................................................................................14,691 682,581 1,323,108
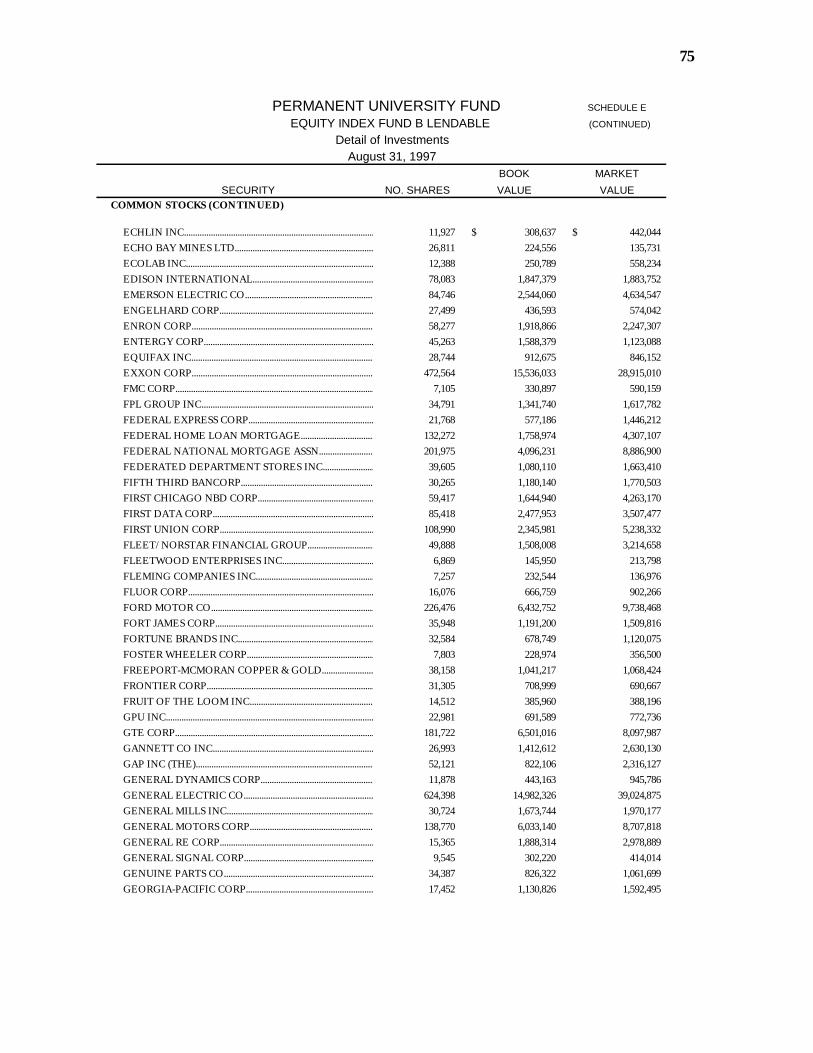
75
PERMANENT UNIVERSITY FUND SCHEDULE E
EQUITY INDEX FUND B LENDABLE (CONTINUED)
Detail of Investments August 31, 1997
BOOK MARKETSECURITY NO. SHARES VALUE VALUE
COMMON STOCKS (CONTINUED)
ECHLIN INC.........................................................................................................................................................................................................11,927 308,637$ 442,044$ ECHO BAY MINES LTD.........................................................................................................................................................................................................26,811 224,556 135,731 ECOLAB INC.........................................................................................................................................................................................................12,388 250,789 558,234 EDISON INTERNATIONAL.........................................................................................................................................................................................................78,083 1,847,379 1,883,752 EMERSON ELECTRIC CO.........................................................................................................................................................................................................84,746 2,544,060 4,634,547 ENGELHARD CORP.........................................................................................................................................................................................................27,499 436,593 574,042 ENRON CORP.........................................................................................................................................................................................................58,277 1,918,866 2,247,307 ENTERGY CORP.........................................................................................................................................................................................................45,263 1,588,379 1,123,088 EQUIFAX INC.........................................................................................................................................................................................................28,744 912,675 846,152 EXXON CORP.........................................................................................................................................................................................................472,564 15,536,033 28,915,010 FMC CORP.........................................................................................................................................................................................................7,105 330,897 590,159 FPL GROUP INC.........................................................................................................................................................................................................34,791 1,341,740 1,617,782 FEDERAL EXPRESS CORP.........................................................................................................................................................................................................21,768 577,186 1,446,212 FEDERAL HOME LOAN MORTGAGE.........................................................................................................................................................................................................132,272 1,758,974 4,307,107 FEDERAL NATIONAL MORTGAGE ASSN.........................................................................................................................................................................................................201,975 4,096,231 8,886,900 FEDERATED DEPARTMENT STORES INC.........................................................................................................................................................................................................39,605 1,080,110 1,663,410 FIFTH THIRD BANCORP.........................................................................................................................................................................................................30,265 1,180,140 1,770,503 FIRST CHICAGO NBD CORP.........................................................................................................................................................................................................59,417 1,644,940 4,263,170 FIRST DATA CORP.........................................................................................................................................................................................................85,418 2,477,953 3,507,477 FIRST UNION CORP.........................................................................................................................................................................................................108,990 2,345,981 5,238,332 FLEET/NORSTAR FINANCIAL GROUP.........................................................................................................................................................................................................49,888 1,508,008 3,214,658 FLEETWOOD ENTERPRISES INC.........................................................................................................................................................................................................6,869 145,950 213,798 FLEMING COMPANIES INC.........................................................................................................................................................................................................7,257 232,544 136,976 FLUOR CORP.........................................................................................................................................................................................................16,076 666,759 902,266 FORD MOTOR CO.........................................................................................................................................................................................................226,476 6,432,752 9,738,468 FORT JAMES CORP.........................................................................................................................................................................................................35,948 1,191,200 1,509,816 FORTUNE BRANDS INC.........................................................................................................................................................................................................32,584 678,749 1,120,075 FOSTER WHEELER CORP.........................................................................................................................................................................................................7,803 228,974 356,500 FREEPORT-MCMORAN COPPER & GOLD.........................................................................................................................................................................................................38,158 1,041,217 1,068,424 FRONTIER CORP.........................................................................................................................................................................................................31,305 708,999 690,667 FRUIT OF THE LOOM INC.........................................................................................................................................................................................................14,512 385,960 388,196 GPU INC.........................................................................................................................................................................................................22,981 691,589 772,736 GTE CORP.........................................................................................................................................................................................................181,722 6,501,016 8,097,987 GANNETT CO INC.........................................................................................................................................................................................................26,993 1,412,612 2,630,130 GAP INC (THE).........................................................................................................................................................................................................52,121 822,106 2,316,127 GENERAL DYNAMICS CORP.........................................................................................................................................................................................................11,878 443,163 945,786 GENERAL ELECTRIC CO.........................................................................................................................................................................................................624,398 14,982,326 39,024,875 GENERAL MILLS INC.........................................................................................................................................................................................................30,724 1,673,744 1,970,177 GENERAL MOTORS CORP.........................................................................................................................................................................................................138,770 6,033,140 8,707,818 GENERAL RE CORP.........................................................................................................................................................................................................15,365 1,888,314 2,978,889 GENERAL SIGNAL CORP.........................................................................................................................................................................................................9,545 302,220 414,014 GENUINE PARTS CO.........................................................................................................................................................................................................34,387 826,322 1,061,699 GEORGIA-PACIFIC CORP.........................................................................................................................................................................................................17,452 1,130,826 1,592,495
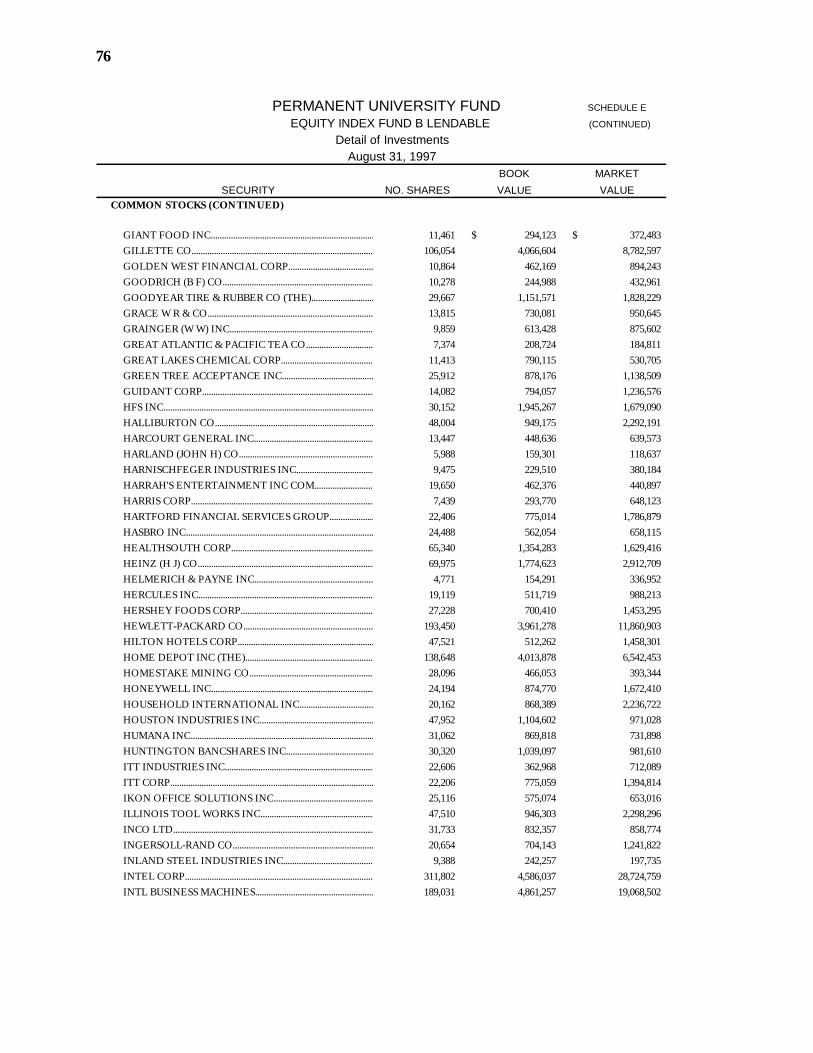
76
PERMANENT UNIVERSITY FUND SCHEDULE E
EQUITY INDEX FUND B LENDABLE (CONTINUED)
Detail of Investments August 31, 1997
BOOK MARKETSECURITY NO. SHARES VALUE VALUE
COMMON STOCKS (CONTINUED)
GIANT FOOD INC.........................................................................................................................................................................................................11,461 294,123$ 372,483$ GILLETTE CO.........................................................................................................................................................................................................106,054 4,066,604 8,782,597 GOLDEN WEST FINANCIAL CORP.........................................................................................................................................................................................................10,864 462,169 894,243 GOODRICH (B F) CO.........................................................................................................................................................................................................10,278 244,988 432,961 GOODYEAR TIRE & RUBBER CO (THE).........................................................................................................................................................................................................29,667 1,151,571 1,828,229 GRACE W R & CO.........................................................................................................................................................................................................13,815 730,081 950,645 GRAINGER (W W) INC.........................................................................................................................................................................................................9,859 613,428 875,602 GREAT ATLANTIC & PACIFIC TEA CO.........................................................................................................................................................................................................7,374 208,724 184,811 GREAT LAKES CHEMICAL CORP.........................................................................................................................................................................................................11,413 790,115 530,705 GREEN TREE ACCEPTANCE INC.........................................................................................................................................................................................................25,912 878,176 1,138,509 GUIDANT CORP.........................................................................................................................................................................................................14,082 794,057 1,236,576 HFS INC.........................................................................................................................................................................................................30,152 1,945,267 1,679,090 HALLIBURTON CO.........................................................................................................................................................................................................48,004 949,175 2,292,191 HARCOURT GENERAL INC.........................................................................................................................................................................................................13,447 448,636 639,573 HARLAND (JOHN H) CO.........................................................................................................................................................................................................5,988 159,301 118,637 HARNISCHFEGER INDUSTRIES INC.........................................................................................................................................................................................................9,475 229,510 380,184 HARRAH'S ENTERTAINMENT INC COM.........................................................................................................................................................................................................19,650 462,376 440,897 HARRIS CORP.........................................................................................................................................................................................................7,439 293,770 648,123 HARTFORD FINANCIAL SERVICES GROUP.........................................................................................................................................................................................................22,406 775,014 1,786,879 HASBRO INC.........................................................................................................................................................................................................24,488 562,054 658,115 HEALTHSOUTH CORP.........................................................................................................................................................................................................65,340 1,354,283 1,629,416 HEINZ (H J) CO.........................................................................................................................................................................................................69,975 1,774,623 2,912,709 HELMERICH & PAYNE INC.........................................................................................................................................................................................................4,771 154,291 336,952 HERCULES INC.........................................................................................................................................................................................................19,119 511,719 988,213 HERSHEY FOODS CORP.........................................................................................................................................................................................................27,228 700,410 1,453,295 HEWLETT-PACKARD CO.........................................................................................................................................................................................................193,450 3,961,278 11,860,903 HILTON HOTELS CORP.........................................................................................................................................................................................................47,521 512,262 1,458,301 HOME DEPOT INC (THE).........................................................................................................................................................................................................138,648 4,013,878 6,542,453 HOMESTAKE MINING CO.........................................................................................................................................................................................................28,096 466,053 393,344 HONEYWELL INC.........................................................................................................................................................................................................24,194 874,770 1,672,410 HOUSEHOLD INTERNATIONAL INC.........................................................................................................................................................................................................20,162 868,389 2,236,722 HOUSTON INDUSTRIES INC.........................................................................................................................................................................................................47,952 1,104,602 971,028 HUMANA INC.........................................................................................................................................................................................................31,062 869,818 731,898 HUNTINGTON BANCSHARES INC.........................................................................................................................................................................................................30,320 1,039,097 981,610 ITT INDUSTRIES INC.........................................................................................................................................................................................................22,606 362,968 712,089 ITT CORP.........................................................................................................................................................................................................22,206 775,059 1,394,814 IKON OFFICE SOLUTIONS INC.........................................................................................................................................................................................................25,116 575,074 653,016 ILLINOIS TOOL WORKS INC.........................................................................................................................................................................................................47,510 946,303 2,298,296 INCO LTD.........................................................................................................................................................................................................31,733 832,357 858,774 INGERSOLL-RAND CO.........................................................................................................................................................................................................20,654 704,143 1,241,822 INLAND STEEL INDUSTRIES INC.........................................................................................................................................................................................................9,388 242,257 197,735 INTEL CORP.........................................................................................................................................................................................................311,802 4,586,037 28,724,759 INTL BUSINESS MACHINES.........................................................................................................................................................................................................189,031 4,861,257 19,068,502
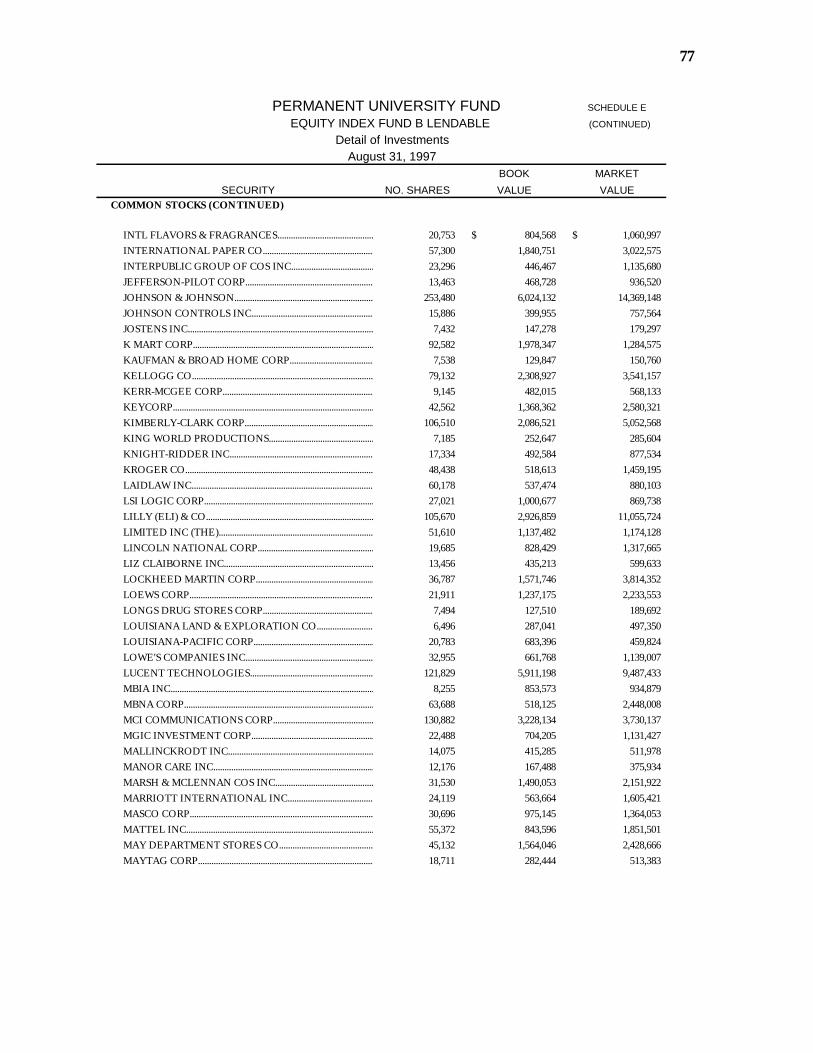
77
PERMANENT UNIVERSITY FUND SCHEDULE E
EQUITY INDEX FUND B LENDABLE (CONTINUED)
Detail of Investments August 31, 1997
BOOK MARKETSECURITY NO. SHARES VALUE VALUE
COMMON STOCKS (CONTINUED)
INTL FLAVORS & FRAGRANCES.........................................................................................................................................................................................................20,753 804,568$ 1,060,997$ INTERNATIONAL PAPER CO.........................................................................................................................................................................................................57,300 1,840,751 3,022,575 INTERPUBLIC GROUP OF COS INC.........................................................................................................................................................................................................23,296 446,467 1,135,680 JEFFERSON-PILOT CORP.........................................................................................................................................................................................................13,463 468,728 936,520 JOHNSON & JOHNSON.........................................................................................................................................................................................................253,480 6,024,132 14,369,148 JOHNSON CONTROLS INC.........................................................................................................................................................................................................15,886 399,955 757,564 JOSTENS INC.........................................................................................................................................................................................................7,432 147,278 179,297 K MART CORP.........................................................................................................................................................................................................92,582 1,978,347 1,284,575 KAUFMAN & BROAD HOME CORP.........................................................................................................................................................................................................7,538 129,847 150,760 KELLOGG CO.........................................................................................................................................................................................................79,132 2,308,927 3,541,157 KERR-MCGEE CORP.........................................................................................................................................................................................................9,145 482,015 568,133 KEYCORP.........................................................................................................................................................................................................42,562 1,368,362 2,580,321 KIMBERLY-CLARK CORP.........................................................................................................................................................................................................106,510 2,086,521 5,052,568 KING WORLD PRODUCTIONS.........................................................................................................................................................................................................7,185 252,647 285,604 KNIGHT-RIDDER INC.........................................................................................................................................................................................................17,334 492,584 877,534 KROGER CO.........................................................................................................................................................................................................48,438 518,613 1,459,195 LAIDLAW INC.........................................................................................................................................................................................................60,178 537,474 880,103 LSI LOGIC CORP.........................................................................................................................................................................................................27,021 1,000,677 869,738 LILLY (ELI) & CO.........................................................................................................................................................................................................105,670 2,926,859 11,055,724 LIMITED INC (THE).........................................................................................................................................................................................................51,610 1,137,482 1,174,128 LINCOLN NATIONAL CORP.........................................................................................................................................................................................................19,685 828,429 1,317,665 LIZ CLAIBORNE INC.........................................................................................................................................................................................................13,456 435,213 599,633 LOCKHEED MARTIN CORP.........................................................................................................................................................................................................36,787 1,571,746 3,814,352 LOEWS CORP.........................................................................................................................................................................................................21,911 1,237,175 2,233,553 LONGS DRUG STORES CORP.........................................................................................................................................................................................................7,494 127,510 189,692 LOUISIANA LAND & EXPLORATION CO.........................................................................................................................................................................................................6,496 287,041 497,350 LOUISIANA-PACIFIC CORP.........................................................................................................................................................................................................20,783 683,396 459,824 LOWE'S COMPANIES INC.........................................................................................................................................................................................................32,955 661,768 1,139,007 LUCENT TECHNOLOGIES.........................................................................................................................................................................................................121,829 5,911,198 9,487,433 MBIA INC.........................................................................................................................................................................................................8,255 853,573 934,879 MBNA CORP.........................................................................................................................................................................................................63,688 518,125 2,448,008 MCI COMMUNICATIONS CORP.........................................................................................................................................................................................................130,882 3,228,134 3,730,137 MGIC INVESTMENT CORP.........................................................................................................................................................................................................22,488 704,205 1,131,427 MALLINCKRODT INC.........................................................................................................................................................................................................14,075 415,285 511,978 MANOR CARE INC.........................................................................................................................................................................................................12,176 167,488 375,934 MARSH & MCLENNAN COS INC.........................................................................................................................................................................................................31,530 1,490,053 2,151,922 MARRIOTT INTERNATIONAL INC.........................................................................................................................................................................................................24,119 563,664 1,605,421 MASCO CORP.........................................................................................................................................................................................................30,696 975,145 1,364,053 MATTEL INC.........................................................................................................................................................................................................55,372 843,596 1,851,501 MAY DEPARTMENT STORES CO.........................................................................................................................................................................................................45,132 1,564,046 2,428,666 MAYTAG CORP.........................................................................................................................................................................................................18,711 282,444 513,383
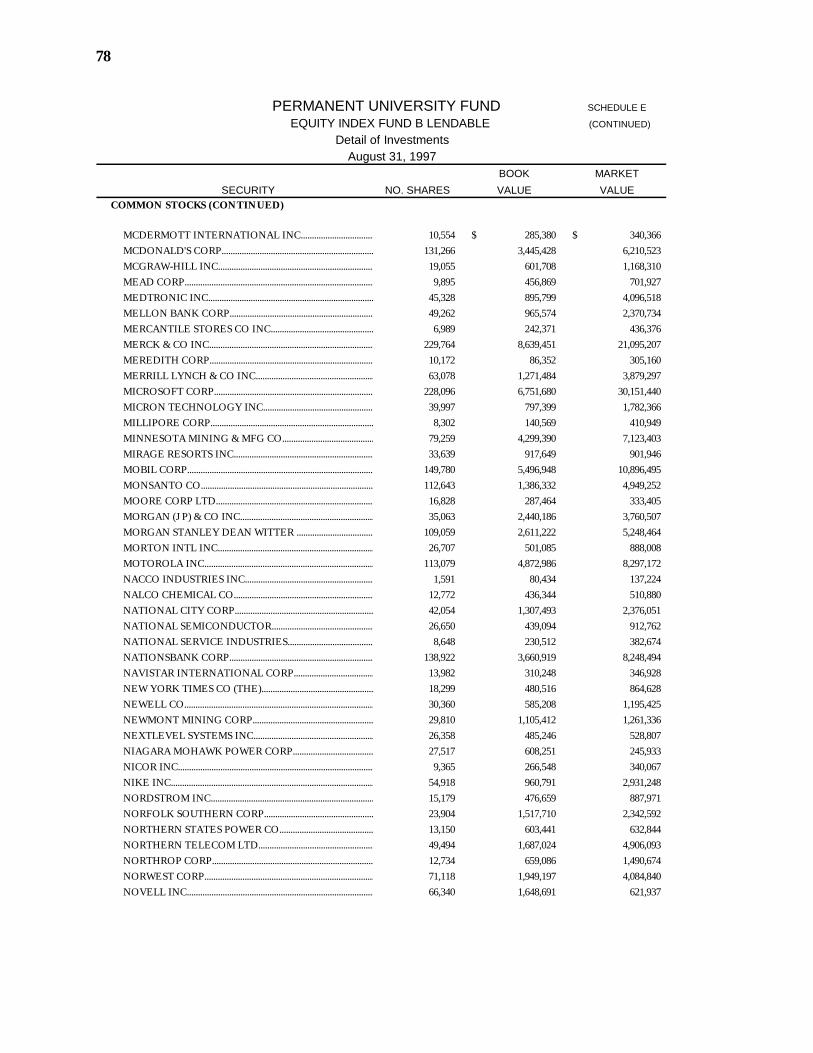
78
PERMANENT UNIVERSITY FUND SCHEDULE E
EQUITY INDEX FUND B LENDABLE (CONTINUED)
Detail of Investments August 31, 1997
BOOK MARKETSECURITY NO. SHARES VALUE VALUE
COMMON STOCKS (CONTINUED)
MCDERMOTT INTERNATIONAL INC.........................................................................................................................................................................................................10,554 285,380$ 340,366$ MCDONALD'S CORP.........................................................................................................................................................................................................131,266 3,445,428 6,210,523 MCGRAW-HILL INC.........................................................................................................................................................................................................19,055 601,708 1,168,310 MEAD CORP.........................................................................................................................................................................................................9,895 456,869 701,927 MEDTRONIC INC.........................................................................................................................................................................................................45,328 895,799 4,096,518 MELLON BANK CORP.........................................................................................................................................................................................................49,262 965,574 2,370,734 MERCANTILE STORES CO INC.........................................................................................................................................................................................................6,989 242,371 436,376 MERCK & CO INC.........................................................................................................................................................................................................229,764 8,639,451 21,095,207 MEREDITH CORP.........................................................................................................................................................................................................10,172 86,352 305,160 MERRILL LYNCH & CO INC.........................................................................................................................................................................................................63,078 1,271,484 3,879,297 MICROSOFT CORP.........................................................................................................................................................................................................228,096 6,751,680 30,151,440 MICRON TECHNOLOGY INC.........................................................................................................................................................................................................39,997 797,399 1,782,366 MILLIPORE CORP.........................................................................................................................................................................................................8,302 140,569 410,949 MINNESOTA MINING & MFG CO.........................................................................................................................................................................................................79,259 4,299,390 7,123,403 MIRAGE RESORTS INC.........................................................................................................................................................................................................33,639 917,649 901,946 MOBIL CORP.........................................................................................................................................................................................................149,780 5,496,948 10,896,495 MONSANTO CO.........................................................................................................................................................................................................112,643 1,386,332 4,949,252 MOORE CORP LTD.........................................................................................................................................................................................................16,828 287,464 333,405 MORGAN (J P) & CO INC.........................................................................................................................................................................................................35,063 2,440,186 3,760,507 MORGAN STANLEY DEAN WITTER .........................................................................................................................................................................................................109,059 2,611,222 5,248,464 MORTON INTL INC.........................................................................................................................................................................................................26,707 501,085 888,008 MOTOROLA INC.........................................................................................................................................................................................................113,079 4,872,986 8,297,172 NACCO INDUSTRIES INC.........................................................................................................................................................................................................1,591 80,434 137,224 NALCO CHEMICAL CO.........................................................................................................................................................................................................12,772 436,344 510,880 NATIONAL CITY CORP.........................................................................................................................................................................................................42,054 1,307,493 2,376,051 NATIONAL SEMICONDUCTOR.........................................................................................................................................................................................................26,650 439,094 912,762 NATIONAL SERVICE INDUSTRIES.........................................................................................................................................................................................................8,648 230,512 382,674 NATIONSBANK CORP.........................................................................................................................................................................................................138,922 3,660,919 8,248,494 NAVISTAR INTERNATIONAL CORP.........................................................................................................................................................................................................13,982 310,248 346,928 NEW YORK TIMES CO (THE).........................................................................................................................................................................................................18,299 480,516 864,628 NEWELL CO.........................................................................................................................................................................................................30,360 585,208 1,195,425 NEWMONT MINING CORP.........................................................................................................................................................................................................29,810 1,105,412 1,261,336 NEXTLEVEL SYSTEMS INC.........................................................................................................................................................................................................26,358 485,246 528,807 NIAGARA MOHAWK POWER CORP.........................................................................................................................................................................................................27,517 608,251 245,933 NICOR INC.........................................................................................................................................................................................................9,365 266,548 340,067 NIKE INC.........................................................................................................................................................................................................54,918 960,791 2,931,248 NORDSTROM INC.........................................................................................................................................................................................................15,179 476,659 887,971 NORFOLK SOUTHERN CORP.........................................................................................................................................................................................................23,904 1,517,710 2,342,592 NORTHERN STATES POWER CO.........................................................................................................................................................................................................13,150 603,441 632,844 NORTHERN TELECOM LTD.........................................................................................................................................................................................................49,494 1,687,024 4,906,093 NORTHROP CORP.........................................................................................................................................................................................................12,734 659,086 1,490,674 NORWEST CORP.........................................................................................................................................................................................................71,118 1,949,197 4,084,840 NOVELL INC.........................................................................................................................................................................................................66,340 1,648,691 621,937

79
PERMANENT UNIVERSITY FUND SCHEDULE E
EQUITY INDEX FUND B LENDABLE (CONTINUED)
Detail of Investments August 31, 1997
BOOK MARKETSECURITY NO. SHARES VALUE VALUE
COMMON STOCKS (CONTINUED)
NUCOR CORP.........................................................................................................................................................................................................16,688 749,651$ 946,001$ OCCIDENTAL PETROLEUM CORP.........................................................................................................................................................................................................62,921 1,380,386 1,474,711 OHIO EDISON CO.........................................................................................................................................................................................................29,110 720,514 640,420 ONEOK INC.........................................................................................................................................................................................................5,218 122,025 168,933 ORACLE SYSTEMS CORP.........................................................................................................................................................................................................186,625 1,498,857 7,115,078 ORYX ENERGY CO.........................................................................................................................................................................................................20,119 436,460 531,896 OWENS CORNING.........................................................................................................................................................................................................9,935 397,974 402,988 OWENS-ILLINOIS INC.........................................................................................................................................................................................................22,641 821,608 788,190 PECO ENERGY CO.........................................................................................................................................................................................................42,421 1,277,470 1,010,150 PG&E CORP.........................................................................................................................................................................................................82,815 2,698,417 1,920,273 PNC FINANCIAL CORP.........................................................................................................................................................................................................61,301 1,932,452 2,651,268 PP&L RESOURCES INC.........................................................................................................................................................................................................31,297 809,306 686,578 PPG INDUSTRIES INC.........................................................................................................................................................................................................34,302 1,253,965 2,161,026 PACCAR INC.........................................................................................................................................................................................................14,870 383,552 704,466 PACIFIC ENTERPRISES.........................................................................................................................................................................................................15,931 382,099 524,727 PACIFICORP.........................................................................................................................................................................................................56,298 1,028,264 1,168,183 PALL CORP.........................................................................................................................................................................................................24,158 481,708 572,243 PARAMETRIC TECHNOLOGY CORP.........................................................................................................................................................................................................24,309 997,161 1,128,849 PARKER-HANNIFIN CORP.........................................................................................................................................................................................................14,142 305,351 909,507 PENNEY (J C) CO INC.........................................................................................................................................................................................................47,073 2,104,124 2,824,380 PENNZOIL CO.........................................................................................................................................................................................................8,948 564,269 690,674 PEOPLES ENERGY CORP.........................................................................................................................................................................................................6,662 207,085 251,074 PEP BOYS-MANNY MOE & JACK.........................................................................................................................................................................................................11,586 259,879 307,029 PEPSICO INC.........................................................................................................................................................................................................291,620 5,650,963 10,498,320 PERKIN-ELMER CORP.........................................................................................................................................................................................................8,289 285,897 613,386 PFIZER INC.........................................................................................................................................................................................................245,730 4,441,915 13,607,299 PHARMACIA & UPJOHN INC.........................................................................................................................................................................................................96,598 2,796,588 3,290,369 PHELPS DODGE CORP.........................................................................................................................................................................................................11,744 552,078 944,658 PHILIP MORRIS COS.........................................................................................................................................................................................................462,250 7,939,765 20,165,656 PHILLIPS PETROLEUM CO.........................................................................................................................................................................................................50,247 1,506,799 2,389,873 PIONEER HI BRED INTL INC.........................................................................................................................................................................................................15,687 598,497 1,344,180 PITNEY BOWES INC.........................................................................................................................................................................................................27,786 1,159,446 2,122,156 PLACER DOME INC.........................................................................................................................................................................................................45,754 820,563 760,660 POLAROID CORP.........................................................................................................................................................................................................8,612 303,773 454,821 POTLATCH CORP.........................................................................................................................................................................................................5,544 248,802 258,835 PRAXAIR INC.........................................................................................................................................................................................................30,046 532,913 1,605,583 PROCTER & GAMBLE CO.........................................................................................................................................................................................................128,916 6,592,043 17,153,885 PROGRESSIVE CORP OHIO.........................................................................................................................................................................................................13,661 1,492,922 1,352,439 PROVIDIAN FINANCIAL CORP.........................................................................................................................................................................................................17,883 342,258 666,142 PUBLIC SVC ENTERPRISE GRP.........................................................................................................................................................................................................44,196 1,506,390 1,096,613 PULTE CORP.........................................................................................................................................................................................................4,017 128,528 147,122
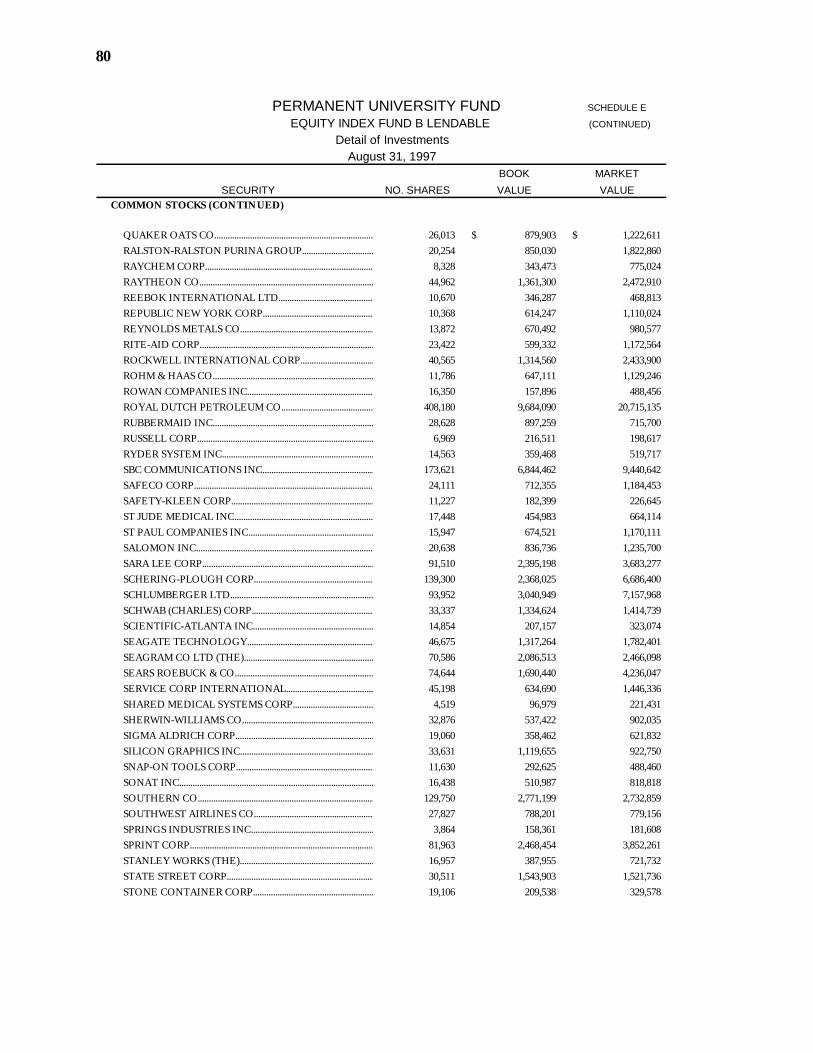
80
PERMANENT UNIVERSITY FUND SCHEDULE E
EQUITY INDEX FUND B LENDABLE (CONTINUED)
Detail of Investments August 31, 1997
BOOK MARKETSECURITY NO. SHARES VALUE VALUE
COMMON STOCKS (CONTINUED)
QUAKER OATS CO.........................................................................................................................................................................................................26,013 879,903$ 1,222,611$ RALSTON-RALSTON PURINA GROUP.........................................................................................................................................................................................................20,254 850,030 1,822,860 RAYCHEM CORP.........................................................................................................................................................................................................8,328 343,473 775,024 RAYTHEON CO.........................................................................................................................................................................................................44,962 1,361,300 2,472,910 REEBOK INTERNATIONAL LTD.........................................................................................................................................................................................................10,670 346,287 468,813 REPUBLIC NEW YORK CORP.........................................................................................................................................................................................................10,368 614,247 1,110,024 REYNOLDS METALS CO.........................................................................................................................................................................................................13,872 670,492 980,577 RITE-AID CORP.........................................................................................................................................................................................................23,422 599,332 1,172,564 ROCKWELL INTERNATIONAL CORP.........................................................................................................................................................................................................40,565 1,314,560 2,433,900 ROHM & HAAS CO.........................................................................................................................................................................................................11,786 647,111 1,129,246 ROWAN COMPANIES INC.........................................................................................................................................................................................................16,350 157,896 488,456 ROYAL DUTCH PETROLEUM CO.........................................................................................................................................................................................................408,180 9,684,090 20,715,135 RUBBERMAID INC.........................................................................................................................................................................................................28,628 897,259 715,700 RUSSELL CORP.........................................................................................................................................................................................................6,969 216,511 198,617 RYDER SYSTEM INC.........................................................................................................................................................................................................14,563 359,468 519,717 SBC COMMUNICATIONS INC.........................................................................................................................................................................................................173,621 6,844,462 9,440,642 SAFECO CORP.........................................................................................................................................................................................................24,111 712,355 1,184,453 SAFETY-KLEEN CORP.........................................................................................................................................................................................................11,227 182,399 226,645 ST JUDE MEDICAL INC.........................................................................................................................................................................................................17,448 454,983 664,114 ST PAUL COMPANIES INC.........................................................................................................................................................................................................15,947 674,521 1,170,111 SALOMON INC.........................................................................................................................................................................................................20,638 836,736 1,235,700 SARA LEE CORP.........................................................................................................................................................................................................91,510 2,395,198 3,683,277 SCHERING-PLOUGH CORP.........................................................................................................................................................................................................139,300 2,368,025 6,686,400 SCHLUMBERGER LTD.........................................................................................................................................................................................................93,952 3,040,949 7,157,968 SCHWAB (CHARLES) CORP.........................................................................................................................................................................................................33,337 1,334,624 1,414,739 SCIENTIFIC-ATLANTA INC.........................................................................................................................................................................................................14,854 207,157 323,074 SEAGATE TECHNOLOGY.........................................................................................................................................................................................................46,675 1,317,264 1,782,401 SEAGRAM CO LTD (THE).........................................................................................................................................................................................................70,586 2,086,513 2,466,098 SEARS ROEBUCK & CO.........................................................................................................................................................................................................74,644 1,690,440 4,236,047 SERVICE CORP INTERNATIONAL.........................................................................................................................................................................................................45,198 634,690 1,446,336 SHARED MEDICAL SYSTEMS CORP.........................................................................................................................................................................................................4,519 96,979 221,431 SHERWIN-WILLIAMS CO.........................................................................................................................................................................................................32,876 537,422 902,035 SIGMA ALDRICH CORP.........................................................................................................................................................................................................19,060 358,462 621,832 SILICON GRAPHICS INC.........................................................................................................................................................................................................33,631 1,119,655 922,750 SNAP-ON TOOLS CORP.........................................................................................................................................................................................................11,630 292,625 488,460 SONAT INC.........................................................................................................................................................................................................16,438 510,987 818,818 SOUTHERN CO.........................................................................................................................................................................................................129,750 2,771,199 2,732,859 SOUTHWEST AIRLINES CO.........................................................................................................................................................................................................27,827 788,201 779,156 SPRINGS INDUSTRIES INC.........................................................................................................................................................................................................3,864 158,361 181,608 SPRINT CORP.........................................................................................................................................................................................................81,963 2,468,454 3,852,261 STANLEY WORKS (THE).........................................................................................................................................................................................................16,957 387,955 721,732 STATE STREET CORP.........................................................................................................................................................................................................30,511 1,543,903 1,521,736 STONE CONTAINER CORP.........................................................................................................................................................................................................19,106 209,538 329,578
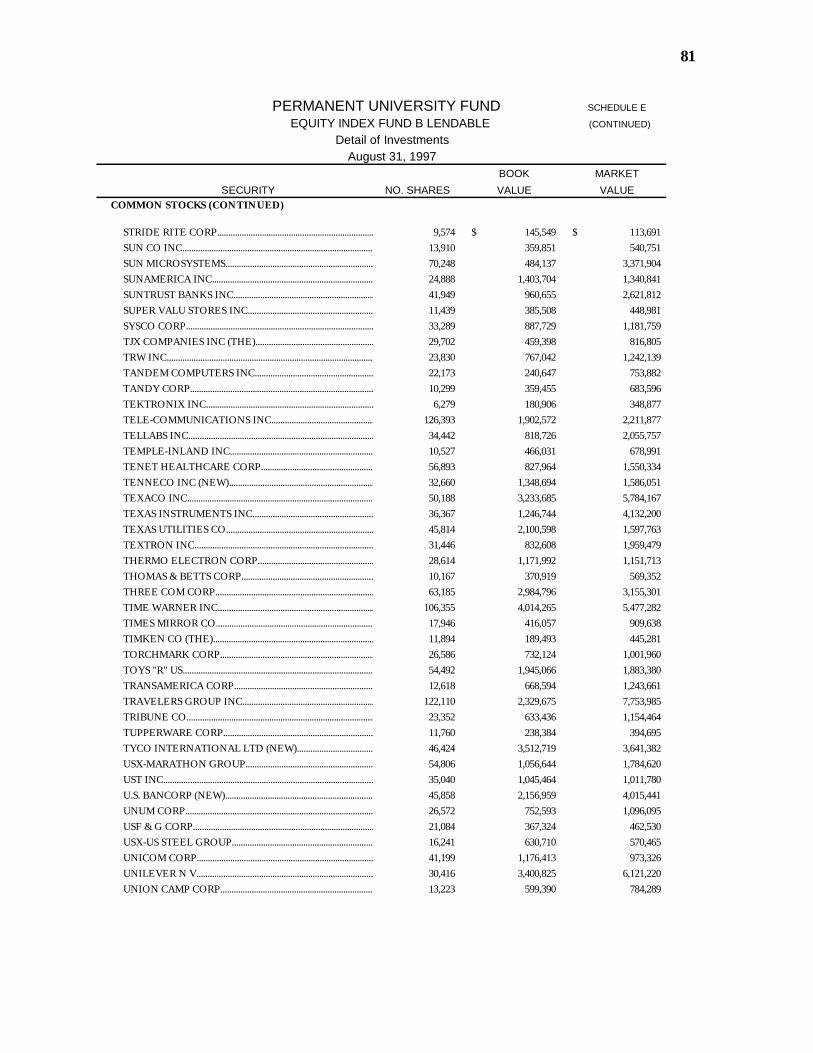
81
PERMANENT UNIVERSITY FUND SCHEDULE E
EQUITY INDEX FUND B LENDABLE (CONTINUED)
Detail of Investments August 31, 1997
BOOK MARKETSECURITY NO. SHARES VALUE VALUE
COMMON STOCKS (CONTINUED)
STRIDE RITE CORP.........................................................................................................................................................................................................9,574 145,549$ 113,691$ SUN CO INC.........................................................................................................................................................................................................13,910 359,851 540,751 SUN MICROSYSTEMS.........................................................................................................................................................................................................70,248 484,137 3,371,904 SUNAMERICA INC.........................................................................................................................................................................................................24,888 1,403,704 1,340,841 SUNTRUST BANKS INC.........................................................................................................................................................................................................41,949 960,655 2,621,812 SUPER VALU STORES INC.........................................................................................................................................................................................................11,439 385,508 448,981 SYSCO CORP.........................................................................................................................................................................................................33,289 887,729 1,181,759 TJX COMPANIES INC (THE).........................................................................................................................................................................................................29,702 459,398 816,805 TRW INC.........................................................................................................................................................................................................23,830 767,042 1,242,139 TANDEM COMPUTERS INC.........................................................................................................................................................................................................22,173 240,647 753,882 TANDY CORP.........................................................................................................................................................................................................10,299 359,455 683,596 TEKTRONIX INC.........................................................................................................................................................................................................6,279 180,906 348,877 TELE-COMMUNICATIONS INC.........................................................................................................................................................................................................126,393 1,902,572 2,211,877 TELLABS INC.........................................................................................................................................................................................................34,442 818,726 2,055,757 TEMPLE-INLAND INC.........................................................................................................................................................................................................10,527 466,031 678,991 TENET HEALTHCARE CORP.........................................................................................................................................................................................................56,893 827,964 1,550,334 TENNECO INC (NEW).........................................................................................................................................................................................................32,660 1,348,694 1,586,051 TEXACO INC.........................................................................................................................................................................................................50,188 3,233,685 5,784,167 TEXAS INSTRUMENTS INC.........................................................................................................................................................................................................36,367 1,246,744 4,132,200 TEXAS UTILITIES CO.........................................................................................................................................................................................................45,814 2,100,598 1,597,763 TEXTRON INC.........................................................................................................................................................................................................31,446 832,608 1,959,479 THERMO ELECTRON CORP.........................................................................................................................................................................................................28,614 1,171,992 1,151,713 THOMAS & BETTS CORP.........................................................................................................................................................................................................10,167 370,919 569,352 THREE COM CORP.........................................................................................................................................................................................................63,185 2,984,796 3,155,301 TIME WARNER INC.........................................................................................................................................................................................................106,355 4,014,265 5,477,282 TIMES MIRROR CO.........................................................................................................................................................................................................17,946 416,057 909,638 TIMKEN CO (THE).........................................................................................................................................................................................................11,894 189,493 445,281 TORCHMARK CORP.........................................................................................................................................................................................................26,586 732,124 1,001,960 TOYS "R" US.........................................................................................................................................................................................................54,492 1,945,066 1,883,380 TRANSAMERICA CORP.........................................................................................................................................................................................................12,618 668,594 1,243,661 TRAVELERS GROUP INC.........................................................................................................................................................................................................122,110 2,329,675 7,753,985 TRIBUNE CO.........................................................................................................................................................................................................23,352 633,436 1,154,464 TUPPERWARE CORP.........................................................................................................................................................................................................11,760 238,384 394,695 TYCO INTERNATIONAL LTD (NEW).........................................................................................................................................................................................................46,424 3,512,719 3,641,382 USX-MARATHON GROUP.........................................................................................................................................................................................................54,806 1,056,644 1,784,620 UST INC.........................................................................................................................................................................................................35,040 1,045,464 1,011,780 U.S. BANCORP (NEW).........................................................................................................................................................................................................45,858 2,156,959 4,015,441 UNUM CORP.........................................................................................................................................................................................................26,572 752,593 1,096,095 USF & G CORP.........................................................................................................................................................................................................21,084 367,324 462,530 USX-US STEEL GROUP.........................................................................................................................................................................................................16,241 630,710 570,465 UNICOM CORP.........................................................................................................................................................................................................41,199 1,176,413 973,326 UNILEVER N V.........................................................................................................................................................................................................30,416 3,400,825 6,121,220 UNION CAMP CORP.........................................................................................................................................................................................................13,223 599,390 784,289
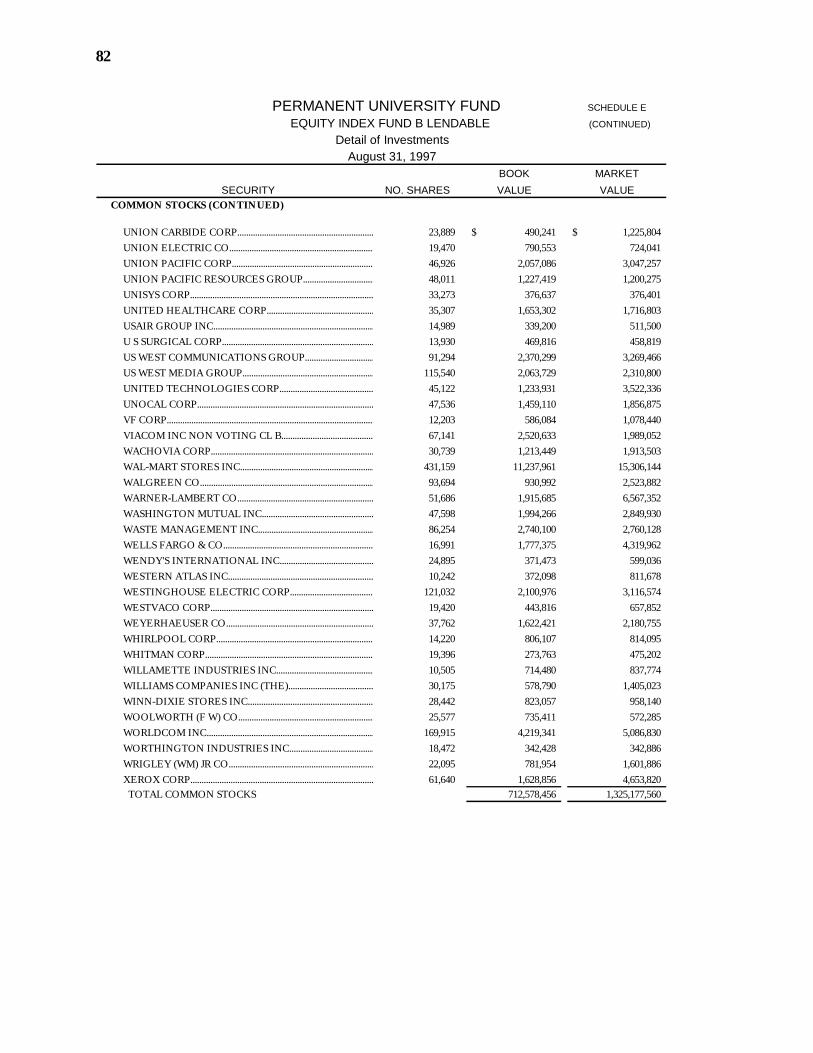
82
PERMANENT UNIVERSITY FUND SCHEDULE E
EQUITY INDEX FUND B LENDABLE (CONTINUED)
Detail of Investments August 31, 1997
BOOK MARKETSECURITY NO. SHARES VALUE VALUE
COMMON STOCKS (CONTINUED)
UNION CARBIDE CORP.........................................................................................................................................................................................................23,889 490,241$ 1,225,804$ UNION ELECTRIC CO.........................................................................................................................................................................................................19,470 790,553 724,041 UNION PACIFIC CORP.........................................................................................................................................................................................................46,926 2,057,086 3,047,257 UNION PACIFIC RESOURCES GROUP.........................................................................................................................................................................................................48,011 1,227,419 1,200,275 UNISYS CORP.........................................................................................................................................................................................................33,273 376,637 376,401 UNITED HEALTHCARE CORP.........................................................................................................................................................................................................35,307 1,653,302 1,716,803 USAIR GROUP INC.........................................................................................................................................................................................................14,989 339,200 511,500 U S SURGICAL CORP.........................................................................................................................................................................................................13,930 469,816 458,819 US WEST COMMUNICATIONS GROUP.........................................................................................................................................................................................................91,294 2,370,299 3,269,466 US WEST MEDIA GROUP.........................................................................................................................................................................................................115,540 2,063,729 2,310,800 UNITED TECHNOLOGIES CORP.........................................................................................................................................................................................................45,122 1,233,931 3,522,336 UNOCAL CORP.........................................................................................................................................................................................................47,536 1,459,110 1,856,875 VF CORP.........................................................................................................................................................................................................12,203 586,084 1,078,440 VIACOM INC NON VOTING CL B.........................................................................................................................................................................................................67,141 2,520,633 1,989,052 WACHOVIA CORP.........................................................................................................................................................................................................30,739 1,213,449 1,913,503 WAL-MART STORES INC.........................................................................................................................................................................................................431,159 11,237,961 15,306,144 WALGREEN CO.........................................................................................................................................................................................................93,694 930,992 2,523,882 WARNER-LAMBERT CO.........................................................................................................................................................................................................51,686 1,915,685 6,567,352 WASHINGTON MUTUAL INC.........................................................................................................................................................................................................47,598 1,994,266 2,849,930 WASTE MANAGEMENT INC.........................................................................................................................................................................................................86,254 2,740,100 2,760,128 WELLS FARGO & CO.........................................................................................................................................................................................................16,991 1,777,375 4,319,962 WENDY'S INTERNATIONAL INC.........................................................................................................................................................................................................24,895 371,473 599,036 WESTERN ATLAS INC.........................................................................................................................................................................................................10,242 372,098 811,678 WESTINGHOUSE ELECTRIC CORP.........................................................................................................................................................................................................121,032 2,100,976 3,116,574 WESTVACO CORP.........................................................................................................................................................................................................19,420 443,816 657,852 WEYERHAEUSER CO.........................................................................................................................................................................................................37,762 1,622,421 2,180,755 WHIRLPOOL CORP.........................................................................................................................................................................................................14,220 806,107 814,095 WHITMAN CORP.........................................................................................................................................................................................................19,396 273,763 475,202 WILLAMETTE INDUSTRIES INC.........................................................................................................................................................................................................10,505 714,480 837,774 WILLIAMS COMPANIES INC (THE).........................................................................................................................................................................................................30,175 578,790 1,405,023 WINN-DIXIE STORES INC.........................................................................................................................................................................................................28,442 823,057 958,140 WOOLWORTH (F W) CO.........................................................................................................................................................................................................25,577 735,411 572,285 WORLDCOM INC.........................................................................................................................................................................................................169,915 4,219,341 5,086,830 WORTHINGTON INDUSTRIES INC.........................................................................................................................................................................................................18,472 342,428 342,886 WRIGLEY (WM) JR CO.........................................................................................................................................................................................................22,095 781,954 1,601,886 XEROX CORP.........................................................................................................................................................................................................61,640 1,628,856 4,653,820 TOTAL COMMON STOCKS 712,578,456 1,325,177,560
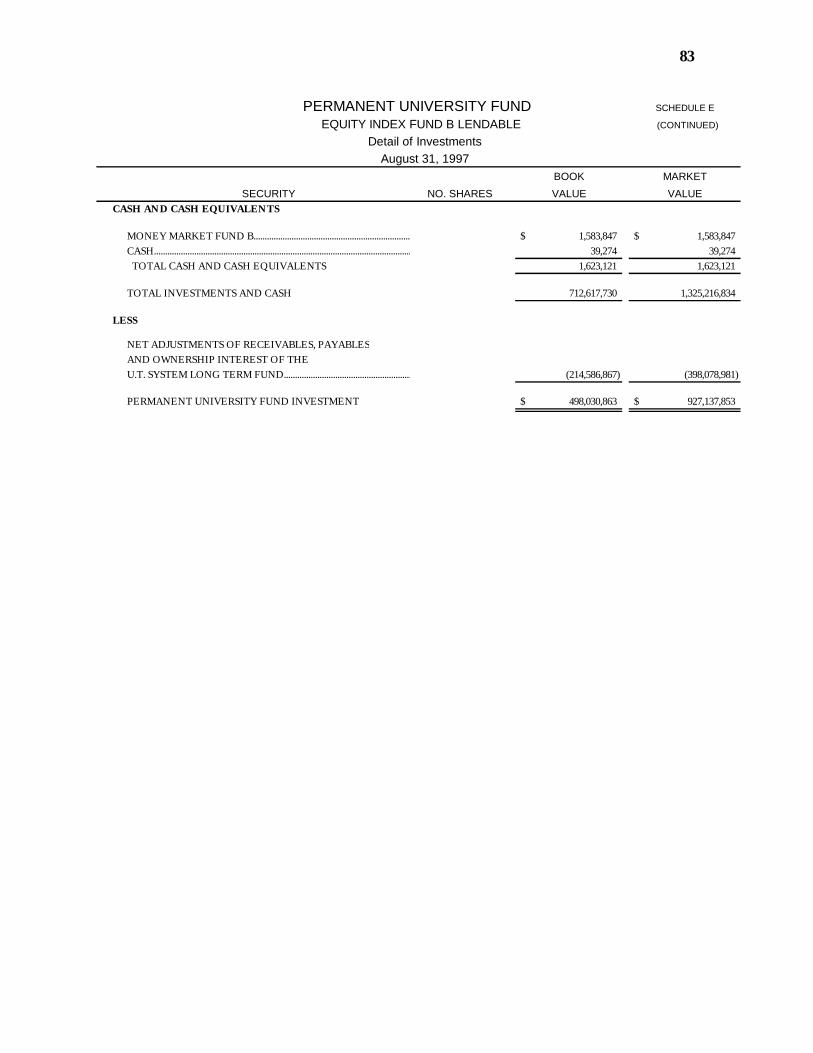
83
PERMANENT UNIVERSITY FUND SCHEDULE E
EQUITY INDEX FUND B LENDABLE (CONTINUED)
Detail of Investments August 31, 1997
BOOK MARKET
SECURITY NO. SHARES VALUE VALUECASH AND CASH EQUIVALENTS
MONEY MARKET FUND B......................................................................................................................................................................................................... 1,583,847$ 1,583,847$ CASH......................................................................................................................................................................................................... 39,274 39,274 TOTAL CASH AND CASH EQUIVALENTS 1,623,121 1,623,121
TOTAL INVESTMENTS AND CASH 712,617,730 1,325,216,834
LESS
NET ADJUSTMENTS OF RECEIVABLES, PAYABLESAND OWNERSHIP INTEREST OF THE U.T. SYSTEM LONG TERM FUND......................................................................................................................................................................................................... (214,586,867) (398,078,981)
PERMANENT UNIVERSITY FUND INVESTMENT 498,030,863$ 927,137,853$
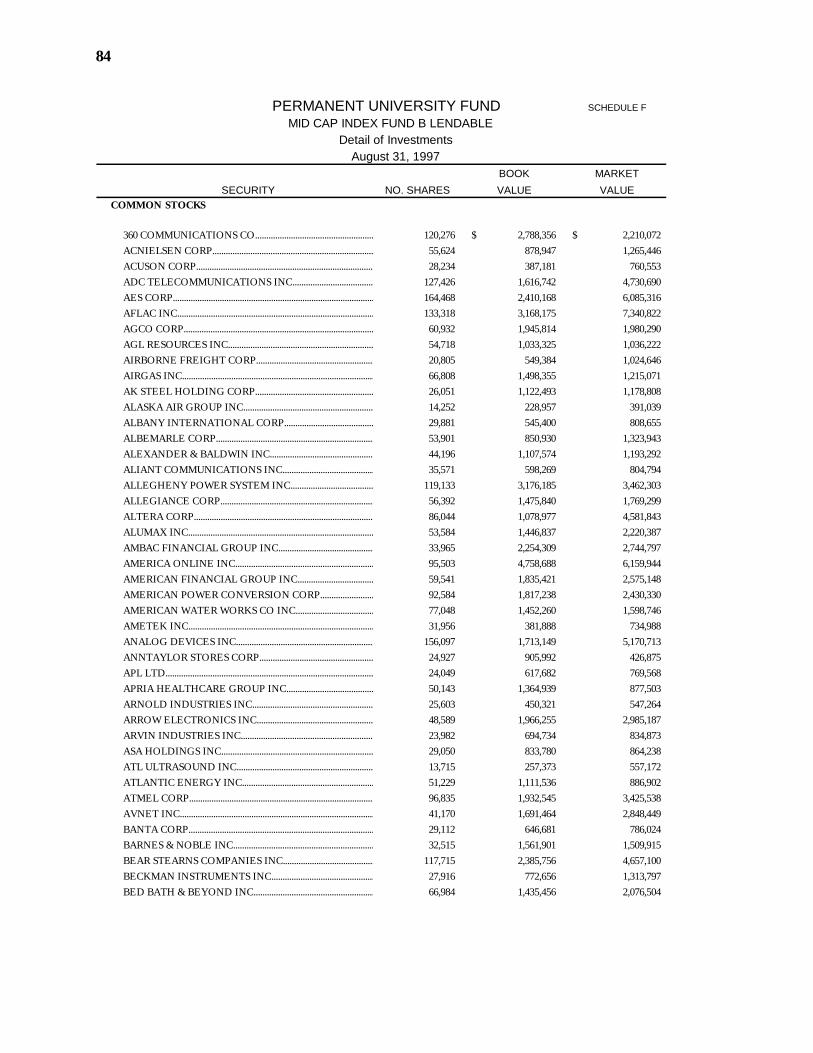
84
PERMANENT UNIVERSITY FUND SCHEDULE F
MID CAP INDEX FUND B LENDABLE Detail of Investments
August 31, 1997BOOK MARKET
SECURITY NO. SHARES VALUE VALUECOMMON STOCKS
360 COMMUNICATIONS CO.........................................................................................................................................................................................................120,276 2,788,356$ 2,210,072$ ACNIELSEN CORP.........................................................................................................................................................................................................55,624 878,947 1,265,446 ACUSON CORP.........................................................................................................................................................................................................28,234 387,181 760,553 ADC TELECOMMUNICATIONS INC.........................................................................................................................................................................................................127,426 1,616,742 4,730,690 AES CORP.........................................................................................................................................................................................................164,468 2,410,168 6,085,316 AFLAC INC.........................................................................................................................................................................................................133,318 3,168,175 7,340,822 AGCO CORP.........................................................................................................................................................................................................60,932 1,945,814 1,980,290 AGL RESOURCES INC.........................................................................................................................................................................................................54,718 1,033,325 1,036,222 AIRBORNE FREIGHT CORP.........................................................................................................................................................................................................20,805 549,384 1,024,646 AIRGAS INC.........................................................................................................................................................................................................66,808 1,498,355 1,215,071 AK STEEL HOLDING CORP.........................................................................................................................................................................................................26,051 1,122,493 1,178,808 ALASKA AIR GROUP INC.........................................................................................................................................................................................................14,252 228,957 391,039 ALBANY INTERNATIONAL CORP.........................................................................................................................................................................................................29,881 545,400 808,655 ALBEMARLE CORP.........................................................................................................................................................................................................53,901 850,930 1,323,943 ALEXANDER & BALDWIN INC.........................................................................................................................................................................................................44,196 1,107,574 1,193,292 ALIANT COMMUNICATIONS INC.........................................................................................................................................................................................................35,571 598,269 804,794 ALLEGHENY POWER SYSTEM INC.........................................................................................................................................................................................................119,133 3,176,185 3,462,303 ALLEGIANCE CORP.........................................................................................................................................................................................................56,392 1,475,840 1,769,299 ALTERA CORP.........................................................................................................................................................................................................86,044 1,078,977 4,581,843 ALUMAX INC.........................................................................................................................................................................................................53,584 1,446,837 2,220,387 AMBAC FINANCIAL GROUP INC.........................................................................................................................................................................................................33,965 2,254,309 2,744,797 AMERICA ONLINE INC.........................................................................................................................................................................................................95,503 4,758,688 6,159,944 AMERICAN FINANCIAL GROUP INC.........................................................................................................................................................................................................59,541 1,835,421 2,575,148 AMERICAN POWER CONVERSION CORP.........................................................................................................................................................................................................92,584 1,817,238 2,430,330 AMERICAN WATER WORKS CO INC.........................................................................................................................................................................................................77,048 1,452,260 1,598,746 AMETEK INC.........................................................................................................................................................................................................31,956 381,888 734,988 ANALOG DEVICES INC.........................................................................................................................................................................................................156,097 1,713,149 5,170,713 ANNTAYLOR STORES CORP.........................................................................................................................................................................................................24,927 905,992 426,875 APL LTD.........................................................................................................................................................................................................24,049 617,682 769,568 APRIA HEALTHCARE GROUP INC.........................................................................................................................................................................................................50,143 1,364,939 877,503 ARNOLD INDUSTRIES INC.........................................................................................................................................................................................................25,603 450,321 547,264 ARROW ELECTRONICS INC.........................................................................................................................................................................................................48,589 1,966,255 2,985,187 ARVIN INDUSTRIES INC.........................................................................................................................................................................................................23,982 694,734 834,873 ASA HOLDINGS INC.........................................................................................................................................................................................................29,050 833,780 864,238 ATL ULTRASOUND INC.........................................................................................................................................................................................................13,715 257,373 557,172 ATLANTIC ENERGY INC.........................................................................................................................................................................................................51,229 1,111,536 886,902 ATMEL CORP.........................................................................................................................................................................................................96,835 1,932,545 3,425,538 AVNET INC.........................................................................................................................................................................................................41,170 1,691,464 2,848,449 BANTA CORP.........................................................................................................................................................................................................29,112 646,681 786,024 BARNES & NOBLE INC.........................................................................................................................................................................................................32,515 1,561,901 1,509,915 BEAR STEARNS COMPANIES INC.........................................................................................................................................................................................................117,715 2,385,756 4,657,100 BECKMAN INSTRUMENTS INC.........................................................................................................................................................................................................27,916 772,656 1,313,797 BED BATH & BEYOND INC.........................................................................................................................................................................................................66,984 1,435,456 2,076,504
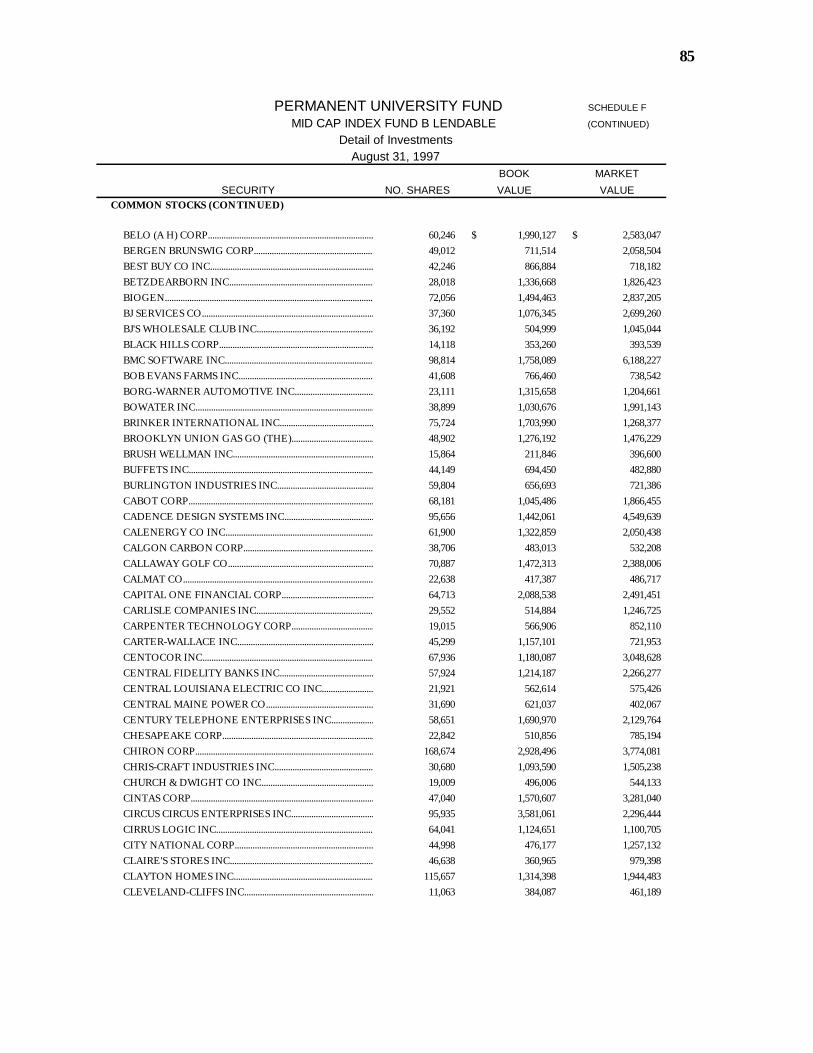
85
PERMANENT UNIVERSITY FUND SCHEDULE F
MID CAP INDEX FUND B LENDABLE (CONTINUED)
Detail of Investments August 31, 1997
BOOK MARKETSECURITY NO. SHARES VALUE VALUE
COMMON STOCKS (CONTINUED)
BELO (A H) CORP.........................................................................................................................................................................................................60,246 1,990,127$ 2,583,047$ BERGEN BRUNSWIG CORP.........................................................................................................................................................................................................49,012 711,514 2,058,504 BEST BUY CO INC.........................................................................................................................................................................................................42,246 866,884 718,182 BETZDEARBORN INC.........................................................................................................................................................................................................28,018 1,336,668 1,826,423 BIOGEN.........................................................................................................................................................................................................72,056 1,494,463 2,837,205 BJ SERVICES CO.........................................................................................................................................................................................................37,360 1,076,345 2,699,260 BJ'S WHOLESALE CLUB INC.........................................................................................................................................................................................................36,192 504,999 1,045,044 BLACK HILLS CORP.........................................................................................................................................................................................................14,118 353,260 393,539 BMC SOFTWARE INC.........................................................................................................................................................................................................98,814 1,758,089 6,188,227 BOB EVANS FARMS INC.........................................................................................................................................................................................................41,608 766,460 738,542 BORG-WARNER AUTOMOTIVE INC.........................................................................................................................................................................................................23,111 1,315,658 1,204,661 BOWATER INC.........................................................................................................................................................................................................38,899 1,030,676 1,991,143 BRINKER INTERNATIONAL INC.........................................................................................................................................................................................................75,724 1,703,990 1,268,377 BROOKLYN UNION GAS GO (THE).........................................................................................................................................................................................................48,902 1,276,192 1,476,229 BRUSH WELLMAN INC.........................................................................................................................................................................................................15,864 211,846 396,600 BUFFETS INC.........................................................................................................................................................................................................44,149 694,450 482,880 BURLINGTON INDUSTRIES INC.........................................................................................................................................................................................................59,804 656,693 721,386 CABOT CORP.........................................................................................................................................................................................................68,181 1,045,486 1,866,455 CADENCE DESIGN SYSTEMS INC.........................................................................................................................................................................................................95,656 1,442,061 4,549,639 CALENERGY CO INC.........................................................................................................................................................................................................61,900 1,322,859 2,050,438 CALGON CARBON CORP.........................................................................................................................................................................................................38,706 483,013 532,208 CALLAWAY GOLF CO.........................................................................................................................................................................................................70,887 1,472,313 2,388,006 CALMAT CO.........................................................................................................................................................................................................22,638 417,387 486,717 CAPITAL ONE FINANCIAL CORP.........................................................................................................................................................................................................64,713 2,088,538 2,491,451 CARLISLE COMPANIES INC.........................................................................................................................................................................................................29,552 514,884 1,246,725 CARPENTER TECHNOLOGY CORP.........................................................................................................................................................................................................19,015 566,906 852,110 CARTER-WALLACE INC.........................................................................................................................................................................................................45,299 1,157,101 721,953 CENTOCOR INC.........................................................................................................................................................................................................67,936 1,180,087 3,048,628 CENTRAL FIDELITY BANKS INC.........................................................................................................................................................................................................57,924 1,214,187 2,266,277 CENTRAL LOUISIANA ELECTRIC CO INC.........................................................................................................................................................................................................21,921 562,614 575,426 CENTRAL MAINE POWER CO.........................................................................................................................................................................................................31,690 621,037 402,067 CENTURY TELEPHONE ENTERPRISES INC.........................................................................................................................................................................................................58,651 1,690,970 2,129,764 CHESAPEAKE CORP.........................................................................................................................................................................................................22,842 510,856 785,194 CHIRON CORP.........................................................................................................................................................................................................168,674 2,928,496 3,774,081 CHRIS-CRAFT INDUSTRIES INC.........................................................................................................................................................................................................30,680 1,093,590 1,505,238 CHURCH & DWIGHT CO INC.........................................................................................................................................................................................................19,009 496,006 544,133 CINTAS CORP.........................................................................................................................................................................................................47,040 1,570,607 3,281,040 CIRCUS CIRCUS ENTERPRISES INC.........................................................................................................................................................................................................95,935 3,581,061 2,296,444 CIRRUS LOGIC INC.........................................................................................................................................................................................................64,041 1,124,651 1,100,705 CITY NATIONAL CORP.........................................................................................................................................................................................................44,998 476,177 1,257,132 CLAIRE'S STORES INC.........................................................................................................................................................................................................46,638 360,965 979,398 CLAYTON HOMES INC.........................................................................................................................................................................................................115,657 1,314,398 1,944,483 CLEVELAND-CLIFFS INC.........................................................................................................................................................................................................11,063 384,087 461,189
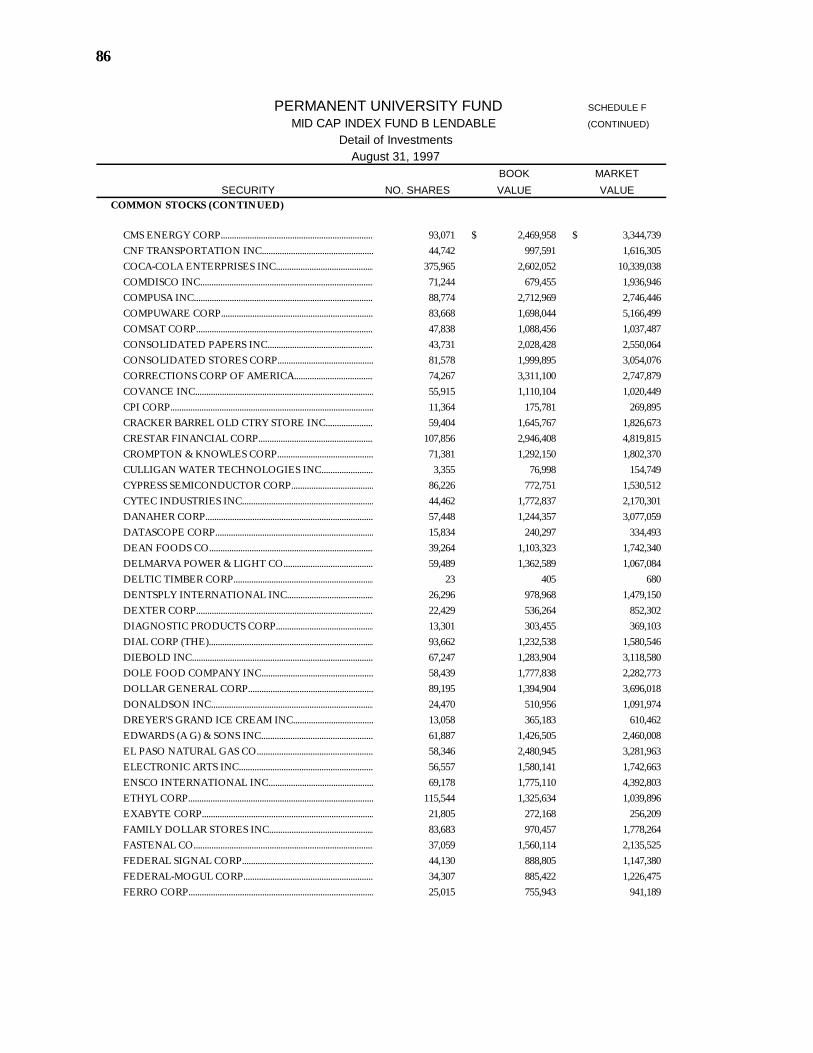
86
PERMANENT UNIVERSITY FUND SCHEDULE F
MID CAP INDEX FUND B LENDABLE (CONTINUED)
Detail of Investments August 31, 1997
BOOK MARKETSECURITY NO. SHARES VALUE VALUE
COMMON STOCKS (CONTINUED)
CMS ENERGY CORP.........................................................................................................................................................................................................93,071 2,469,958$ 3,344,739$ CNF TRANSPORTATION INC.........................................................................................................................................................................................................44,742 997,591 1,616,305 COCA-COLA ENTERPRISES INC.........................................................................................................................................................................................................375,965 2,602,052 10,339,038 COMDISCO INC.........................................................................................................................................................................................................71,244 679,455 1,936,946 COMPUSA INC.........................................................................................................................................................................................................88,774 2,712,969 2,746,446 COMPUWARE CORP.........................................................................................................................................................................................................83,668 1,698,044 5,166,499 COMSAT CORP.........................................................................................................................................................................................................47,838 1,088,456 1,037,487 CONSOLIDATED PAPERS INC.........................................................................................................................................................................................................43,731 2,028,428 2,550,064 CONSOLIDATED STORES CORP.........................................................................................................................................................................................................81,578 1,999,895 3,054,076 CORRECTIONS CORP OF AMERICA.........................................................................................................................................................................................................74,267 3,311,100 2,747,879 COVANCE INC.........................................................................................................................................................................................................55,915 1,110,104 1,020,449 CPI CORP.........................................................................................................................................................................................................11,364 175,781 269,895 CRACKER BARREL OLD CTRY STORE INC.........................................................................................................................................................................................................59,404 1,645,767 1,826,673 CRESTAR FINANCIAL CORP.........................................................................................................................................................................................................107,856 2,946,408 4,819,815 CROMPTON & KNOWLES CORP.........................................................................................................................................................................................................71,381 1,292,150 1,802,370 CULLIGAN WATER TECHNOLOGIES INC.........................................................................................................................................................................................................3,355 76,998 154,749 CYPRESS SEMICONDUCTOR CORP.........................................................................................................................................................................................................86,226 772,751 1,530,512 CYTEC INDUSTRIES INC.........................................................................................................................................................................................................44,462 1,772,837 2,170,301 DANAHER CORP.........................................................................................................................................................................................................57,448 1,244,357 3,077,059 DATASCOPE CORP.........................................................................................................................................................................................................15,834 240,297 334,493 DEAN FOODS CO.........................................................................................................................................................................................................39,264 1,103,323 1,742,340 DELMARVA POWER & LIGHT CO.........................................................................................................................................................................................................59,489 1,362,589 1,067,084 DELTIC TIMBER CORP.........................................................................................................................................................................................................23 405 680 DENTSPLY INTERNATIONAL INC.........................................................................................................................................................................................................26,296 978,968 1,479,150 DEXTER CORP.........................................................................................................................................................................................................22,429 536,264 852,302 DIAGNOSTIC PRODUCTS CORP.........................................................................................................................................................................................................13,301 303,455 369,103 DIAL CORP (THE).........................................................................................................................................................................................................93,662 1,232,538 1,580,546 DIEBOLD INC.........................................................................................................................................................................................................67,247 1,283,904 3,118,580 DOLE FOOD COMPANY INC.........................................................................................................................................................................................................58,439 1,777,838 2,282,773 DOLLAR GENERAL CORP.........................................................................................................................................................................................................89,195 1,394,904 3,696,018 DONALDSON INC.........................................................................................................................................................................................................24,470 510,956 1,091,974 DREYER'S GRAND ICE CREAM INC.........................................................................................................................................................................................................13,058 365,183 610,462 EDWARDS (A G) & SONS INC.........................................................................................................................................................................................................61,887 1,426,505 2,460,008 EL PASO NATURAL GAS CO.........................................................................................................................................................................................................58,346 2,480,945 3,281,963 ELECTRONIC ARTS INC.........................................................................................................................................................................................................56,557 1,580,141 1,742,663 ENSCO INTERNATIONAL INC.........................................................................................................................................................................................................69,178 1,775,110 4,392,803 ETHYL CORP.........................................................................................................................................................................................................115,544 1,325,634 1,039,896 EXABYTE CORP.........................................................................................................................................................................................................21,805 272,168 256,209 FAMILY DOLLAR STORES INC.........................................................................................................................................................................................................83,683 970,457 1,778,264 FASTENAL CO.........................................................................................................................................................................................................37,059 1,560,114 2,135,525 FEDERAL SIGNAL CORP.........................................................................................................................................................................................................44,130 888,805 1,147,380 FEDERAL-MOGUL CORP.........................................................................................................................................................................................................34,307 885,422 1,226,475 FERRO CORP.........................................................................................................................................................................................................25,015 755,943 941,189

87
PERMANENT UNIVERSITY FUND SCHEDULE F
MID CAP INDEX FUND B LENDABLE (CONTINUED)
Detail of Investments August 31, 1997
BOOK MARKETSECURITY NO. SHARES VALUE VALUE
COMMON STOCKS (CONTINUED)
FINGERHUT COMPANIES INC.........................................................................................................................................................................................................45,053 1,192,819$ 912,323$ FINOVA GROUP INC.........................................................................................................................................................................................................26,688 2,169,132 2,256,804 FIRST BRANDS CORP.........................................................................................................................................................................................................39,346 664,508 981,191 FIRST OF AMERICA BANK CORP.........................................................................................................................................................................................................87,622 2,437,096 4,512,533 FIRST SECURITY CORP.........................................................................................................................................................................................................109,711 1,467,889 3,099,336 FIRST TENNESSEE NATIONAL CORP.........................................................................................................................................................................................................62,386 1,423,757 3,322,055 FIRST VIRGINIA BANKS INC.........................................................................................................................................................................................................34,543 1,384,359 2,353,242 FIRSTAR CORP.........................................................................................................................................................................................................141,021 3,304,196 4,750,645 FISERV INC.........................................................................................................................................................................................................49,774 1,276,548 2,239,830 FLORIDA PROGRESS CORP.........................................................................................................................................................................................................94,698 3,067,535 3,048,092 FLOWERS INDUSTRIES INC.........................................................................................................................................................................................................85,992 761,024 1,590,852 FLOWSERVE CORP.........................................................................................................................................................................................................39,474 1,069,827 1,391,459 FOREST LABORATORIES INC.........................................................................................................................................................................................................40,137 1,598,665 1,648,126 FOUNDATION HEALTH SYSTEMS INC.........................................................................................................................................................................................................122,433 3,491,411 3,894,900 FRANKLIN RESOURCES INC.........................................................................................................................................................................................................123,060 4,043,279 9,521,768 FULLER (H B) CO.........................................................................................................................................................................................................13,714 513,838 756,841 GATX CORP.........................................................................................................................................................................................................23,632 1,026,613 1,478,477 GENCORP INC.........................................................................................................................................................................................................39,723 649,165 1,062,590 GENZYME CORP.........................................................................................................................................................................................................74,156 1,514,174 2,085,638 GEORGIA GULF CORP.........................................................................................................................................................................................................33,106 777,170 951,798 GIBSON GREETINGS INC.........................................................................................................................................................................................................15,853 294,276 356,693 GLATFELTER (P H) CO.........................................................................................................................................................................................................41,155 672,370 851,394 GLOBAL MARINE INC.........................................................................................................................................................................................................166,535 1,091,207 4,735,839 GOLDEN BOOKS FAMILY ENTERTAINMT IN.........................................................................................................................................................................................................25,808 360,162 256,467 GRANITE CONSTRUCTION INC.........................................................................................................................................................................................................17,795 239,236 373,695 GTECH HOLDINGS CORP.........................................................................................................................................................................................................41,608 1,309,429 1,250,841 HANCOCK FABRICS INC.........................................................................................................................................................................................................21,121 192,323 264,013 HANNA (M A) CO.........................................................................................................................................................................................................49,660 748,630 1,284,953 HANNAFORD BROTHERS CO.........................................................................................................................................................................................................41,261 1,006,298 1,402,874 HARLEY-DAVIDSON INC.........................................................................................................................................................................................................73,928 1,814,046 4,001,353 HARSCO CORP.........................................................................................................................................................................................................48,170 1,084,238 2,170,661 HAWAIIAN ELECTRIC INDUSTRIES INC.........................................................................................................................................................................................................30,085 1,089,679 1,088,701 HEALTH CARE & RETIREMENT CORP.........................................................................................................................................................................................................43,483 940,737 1,584,412 HEALTH MGMT ASSOCIATES INC CL A.........................................................................................................................................................................................................105,605 3,246,497 3,121,948 HEALTHCARE COMPARE CORP.........................................................................................................................................................................................................32,201 996,793 1,795,206 HEILIG-MEYERS CO.........................................................................................................................................................................................................55,584 1,407,455 833,760 HIBERNIA CORP.........................................................................................................................................................................................................125,752 1,273,688 1,909,859 HILLENBRAND INDUSTRIES INC.........................................................................................................................................................................................................67,091 3,129,765 2,947,811 HON INDUSTRIES INC.........................................................................................................................................................................................................28,998 859,650 1,696,383 HORIZON/CMS HEALTHCARE CORP.........................................................................................................................................................................................................50,396 928,568 1,036,268 HORMEL FOODS CORP.........................................................................................................................................................................................................75,152 2,070,824 2,235,772 HOUGHTON MIFFLIN CO.........................................................................................................................................................................................................29,220 658,768 1,013,569 HSB GROUP INC.........................................................................................................................................................................................................19,554 972,833 1,051,028
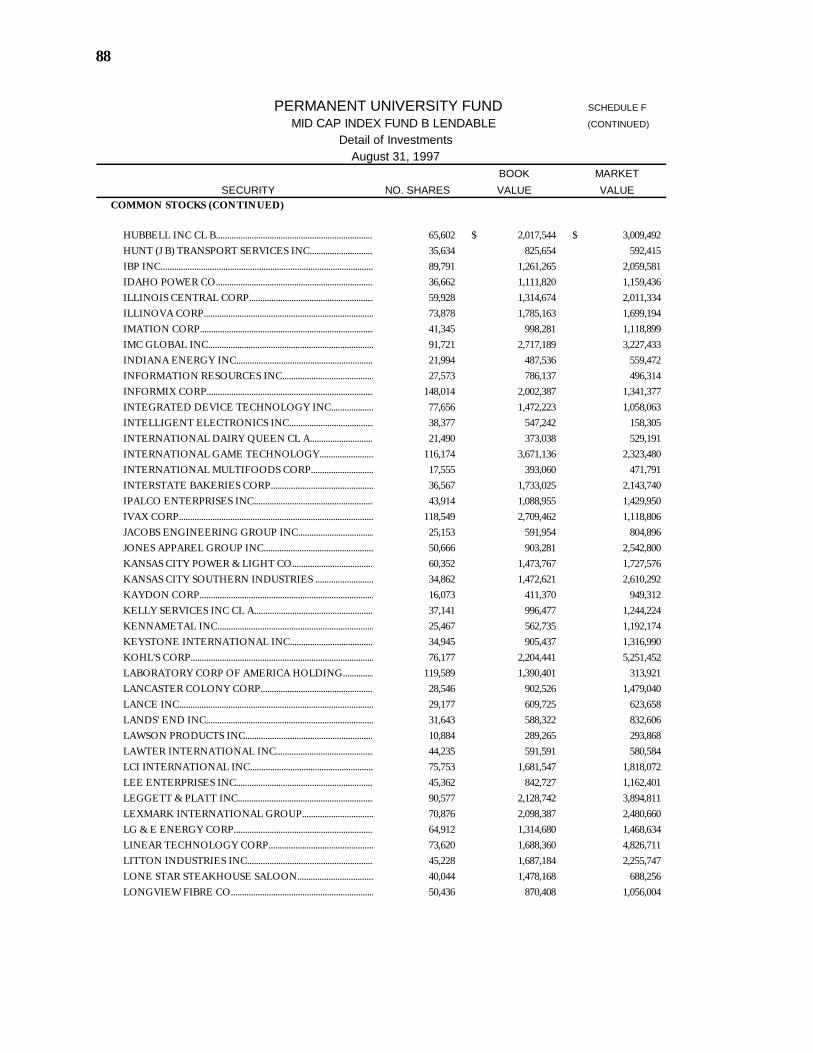
88
PERMANENT UNIVERSITY FUND SCHEDULE F
MID CAP INDEX FUND B LENDABLE (CONTINUED)
Detail of Investments August 31, 1997
BOOK MARKETSECURITY NO. SHARES VALUE VALUE
COMMON STOCKS (CONTINUED)
HUBBELL INC CL B.........................................................................................................................................................................................................65,602 2,017,544$ 3,009,492$ HUNT (J B) TRANSPORT SERVICES INC.........................................................................................................................................................................................................35,634 825,654 592,415 IBP INC.........................................................................................................................................................................................................89,791 1,261,265 2,059,581 IDAHO POWER CO.........................................................................................................................................................................................................36,662 1,111,820 1,159,436 ILLINOIS CENTRAL CORP.........................................................................................................................................................................................................59,928 1,314,674 2,011,334 ILLINOVA CORP.........................................................................................................................................................................................................73,878 1,785,163 1,699,194 IMATION CORP.........................................................................................................................................................................................................41,345 998,281 1,118,899 IMC GLOBAL INC.........................................................................................................................................................................................................91,721 2,717,189 3,227,433 INDIANA ENERGY INC.........................................................................................................................................................................................................21,994 487,536 559,472 INFORMATION RESOURCES INC.........................................................................................................................................................................................................27,573 786,137 496,314 INFORMIX CORP.........................................................................................................................................................................................................148,014 2,002,387 1,341,377 INTEGRATED DEVICE TECHNOLOGY INC.........................................................................................................................................................................................................77,656 1,472,223 1,058,063 INTELLIGENT ELECTRONICS INC.........................................................................................................................................................................................................38,377 547,242 158,305 INTERNATIONAL DAIRY QUEEN CL A.........................................................................................................................................................................................................21,490 373,038 529,191 INTERNATIONAL GAME TECHNOLOGY.........................................................................................................................................................................................................116,174 3,671,136 2,323,480 INTERNATIONAL MULTIFOODS CORP.........................................................................................................................................................................................................17,555 393,060 471,791 INTERSTATE BAKERIES CORP.........................................................................................................................................................................................................36,567 1,733,025 2,143,740 IPALCO ENTERPRISES INC.........................................................................................................................................................................................................43,914 1,088,955 1,429,950 IVAX CORP.........................................................................................................................................................................................................118,549 2,709,462 1,118,806 JACOBS ENGINEERING GROUP INC.........................................................................................................................................................................................................25,153 591,954 804,896 JONES APPAREL GROUP INC.........................................................................................................................................................................................................50,666 903,281 2,542,800 KANSAS CITY POWER & LIGHT CO.........................................................................................................................................................................................................60,352 1,473,767 1,727,576 KANSAS CITY SOUTHERN INDUSTRIES .........................................................................................................................................................................................................34,862 1,472,621 2,610,292 KAYDON CORP.........................................................................................................................................................................................................16,073 411,370 949,312 KELLY SERVICES INC CL A.........................................................................................................................................................................................................37,141 996,477 1,244,224 KENNAMETAL INC.........................................................................................................................................................................................................25,467 562,735 1,192,174 KEYSTONE INTERNATIONAL INC.........................................................................................................................................................................................................34,945 905,437 1,316,990 KOHL'S CORP.........................................................................................................................................................................................................76,177 2,204,441 5,251,452 LABORATORY CORP OF AMERICA HOLDING.........................................................................................................................................................................................................119,589 1,390,401 313,921 LANCASTER COLONY CORP.........................................................................................................................................................................................................28,546 902,526 1,479,040 LANCE INC.........................................................................................................................................................................................................29,177 609,725 623,658 LANDS' END INC.........................................................................................................................................................................................................31,643 588,322 832,606 LAWSON PRODUCTS INC.........................................................................................................................................................................................................10,884 289,265 293,868 LAWTER INTERNATIONAL INC.........................................................................................................................................................................................................44,235 591,591 580,584 LCI INTERNATIONAL INC.........................................................................................................................................................................................................75,753 1,681,547 1,818,072 LEE ENTERPRISES INC.........................................................................................................................................................................................................45,362 842,727 1,162,401 LEGGETT & PLATT INC.........................................................................................................................................................................................................90,577 2,128,742 3,894,811 LEXMARK INTERNATIONAL GROUP.........................................................................................................................................................................................................70,876 2,098,387 2,480,660 LG & E ENERGY CORP.........................................................................................................................................................................................................64,912 1,314,680 1,468,634 LINEAR TECHNOLOGY CORP.........................................................................................................................................................................................................73,620 1,688,360 4,826,711 LITTON INDUSTRIES INC.........................................................................................................................................................................................................45,228 1,687,184 2,255,747 LONE STAR STEAKHOUSE SALOON.........................................................................................................................................................................................................40,044 1,478,168 688,256 LONGVIEW FIBRE CO.........................................................................................................................................................................................................50,436 870,408 1,056,004
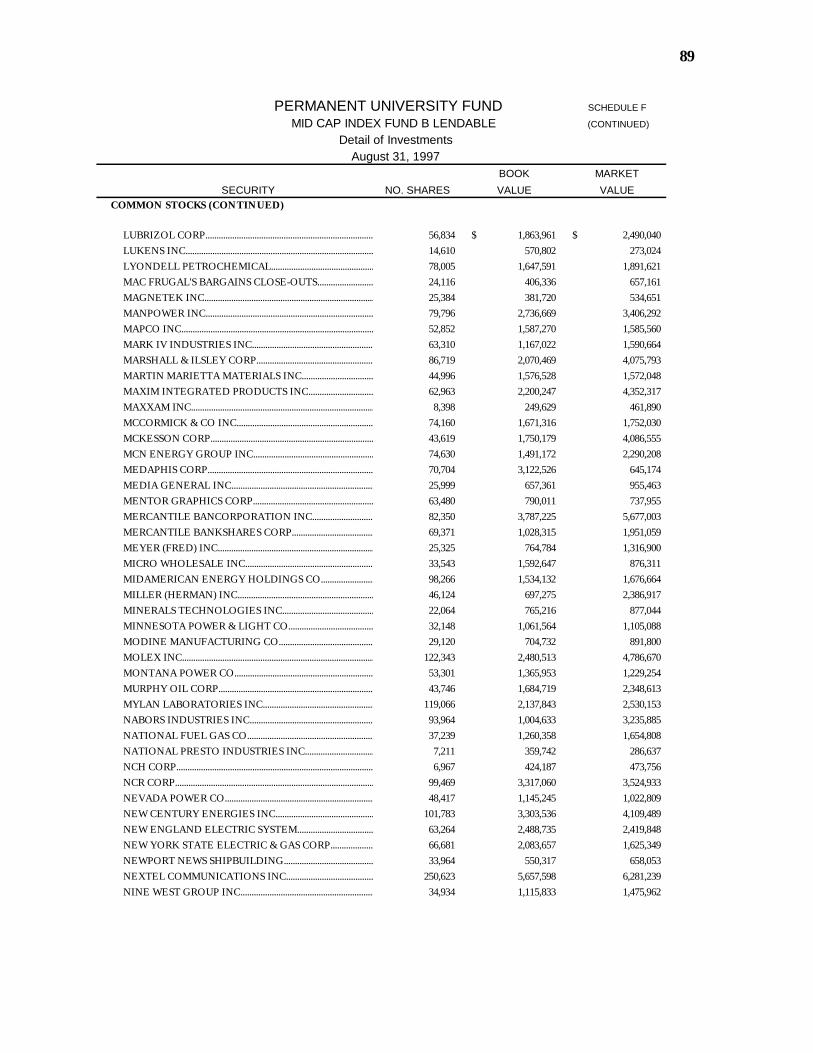
89
PERMANENT UNIVERSITY FUND SCHEDULE F
MID CAP INDEX FUND B LENDABLE (CONTINUED)
Detail of Investments August 31, 1997
BOOK MARKETSECURITY NO. SHARES VALUE VALUE
COMMON STOCKS (CONTINUED)
LUBRIZOL CORP.........................................................................................................................................................................................................56,834 1,863,961$ 2,490,040$ LUKENS INC.........................................................................................................................................................................................................14,610 570,802 273,024 LYONDELL PETROCHEMICAL.........................................................................................................................................................................................................78,005 1,647,591 1,891,621 MAC FRUGAL'S BARGAINS CLOSE-OUTS.........................................................................................................................................................................................................24,116 406,336 657,161 MAGNETEK INC.........................................................................................................................................................................................................25,384 381,720 534,651 MANPOWER INC.........................................................................................................................................................................................................79,796 2,736,669 3,406,292 MAPCO INC.........................................................................................................................................................................................................52,852 1,587,270 1,585,560 MARK IV INDUSTRIES INC.........................................................................................................................................................................................................63,310 1,167,022 1,590,664 MARSHALL & ILSLEY CORP.........................................................................................................................................................................................................86,719 2,070,469 4,075,793 MARTIN MARIETTA MATERIALS INC.........................................................................................................................................................................................................44,996 1,576,528 1,572,048 MAXIM INTEGRATED PRODUCTS INC.........................................................................................................................................................................................................62,963 2,200,247 4,352,317 MAXXAM INC.........................................................................................................................................................................................................8,398 249,629 461,890 MCCORMICK & CO INC.........................................................................................................................................................................................................74,160 1,671,316 1,752,030 MCKESSON CORP.........................................................................................................................................................................................................43,619 1,750,179 4,086,555 MCN ENERGY GROUP INC.........................................................................................................................................................................................................74,630 1,491,172 2,290,208 MEDAPHIS CORP.........................................................................................................................................................................................................70,704 3,122,526 645,174 MEDIA GENERAL INC.........................................................................................................................................................................................................25,999 657,361 955,463 MENTOR GRAPHICS CORP.........................................................................................................................................................................................................63,480 790,011 737,955 MERCANTILE BANCORPORATION INC.........................................................................................................................................................................................................82,350 3,787,225 5,677,003 MERCANTILE BANKSHARES CORP.........................................................................................................................................................................................................69,371 1,028,315 1,951,059 MEYER (FRED) INC.........................................................................................................................................................................................................25,325 764,784 1,316,900 MICRO WHOLESALE INC.........................................................................................................................................................................................................33,543 1,592,647 876,311 MIDAMERICAN ENERGY HOLDINGS CO.........................................................................................................................................................................................................98,266 1,534,132 1,676,664 MILLER (HERMAN) INC.........................................................................................................................................................................................................46,124 697,275 2,386,917 MINERALS TECHNOLOGIES INC.........................................................................................................................................................................................................22,064 765,216 877,044 MINNESOTA POWER & LIGHT CO.........................................................................................................................................................................................................32,148 1,061,564 1,105,088 MODINE MANUFACTURING CO.........................................................................................................................................................................................................29,120 704,732 891,800 MOLEX INC.........................................................................................................................................................................................................122,343 2,480,513 4,786,670 MONTANA POWER CO.........................................................................................................................................................................................................53,301 1,365,953 1,229,254 MURPHY OIL CORP.........................................................................................................................................................................................................43,746 1,684,719 2,348,613 MYLAN LABORATORIES INC.........................................................................................................................................................................................................119,066 2,137,843 2,530,153 NABORS INDUSTRIES INC.........................................................................................................................................................................................................93,964 1,004,633 3,235,885 NATIONAL FUEL GAS CO.........................................................................................................................................................................................................37,239 1,260,358 1,654,808 NATIONAL PRESTO INDUSTRIES INC.........................................................................................................................................................................................................7,211 359,742 286,637 NCH CORP.........................................................................................................................................................................................................6,967 424,187 473,756 NCR CORP.........................................................................................................................................................................................................99,469 3,317,060 3,524,933 NEVADA POWER CO.........................................................................................................................................................................................................48,417 1,145,245 1,022,809 NEW CENTURY ENERGIES INC.........................................................................................................................................................................................................101,783 3,303,536 4,109,489 NEW ENGLAND ELECTRIC SYSTEM.........................................................................................................................................................................................................63,264 2,488,735 2,419,848 NEW YORK STATE ELECTRIC & GAS CORP.........................................................................................................................................................................................................66,681 2,083,657 1,625,349 NEWPORT NEWS SHIPBUILDING.........................................................................................................................................................................................................33,964 550,317 658,053 NEXTEL COMMUNICATIONS INC.........................................................................................................................................................................................................250,623 5,657,598 6,281,239 NINE WEST GROUP INC.........................................................................................................................................................................................................34,934 1,115,833 1,475,962
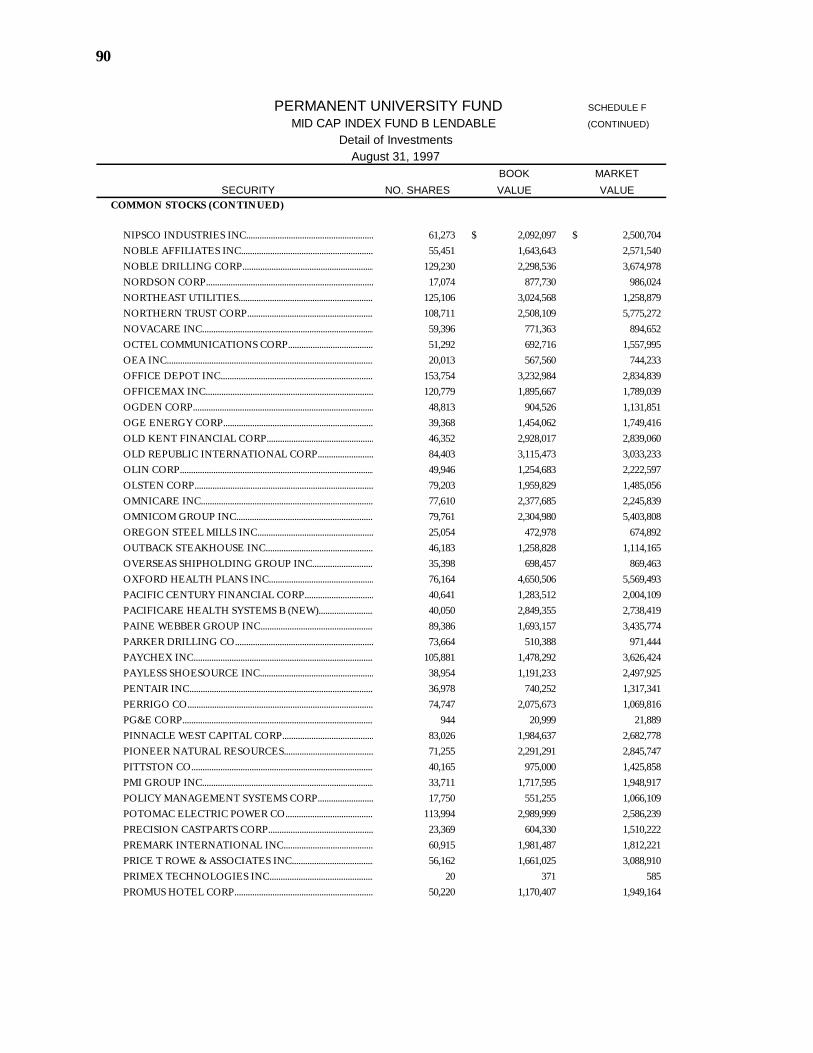
90
PERMANENT UNIVERSITY FUND SCHEDULE F
MID CAP INDEX FUND B LENDABLE (CONTINUED)
Detail of Investments August 31, 1997
BOOK MARKETSECURITY NO. SHARES VALUE VALUE
COMMON STOCKS (CONTINUED)
NIPSCO INDUSTRIES INC.........................................................................................................................................................................................................61,273 2,092,097$ 2,500,704$ NOBLE AFFILIATES INC.........................................................................................................................................................................................................55,451 1,643,643 2,571,540 NOBLE DRILLING CORP.........................................................................................................................................................................................................129,230 2,298,536 3,674,978 NORDSON CORP.........................................................................................................................................................................................................17,074 877,730 986,024 NORTHEAST UTILITIES.........................................................................................................................................................................................................125,106 3,024,568 1,258,879 NORTHERN TRUST CORP.........................................................................................................................................................................................................108,711 2,508,109 5,775,272 NOVACARE INC.........................................................................................................................................................................................................59,396 771,363 894,652 OCTEL COMMUNICATIONS CORP.........................................................................................................................................................................................................51,292 692,716 1,557,995 OEA INC.........................................................................................................................................................................................................20,013 567,560 744,233 OFFICE DEPOT INC.........................................................................................................................................................................................................153,754 3,232,984 2,834,839 OFFICEMAX INC.........................................................................................................................................................................................................120,779 1,895,667 1,789,039 OGDEN CORP.........................................................................................................................................................................................................48,813 904,526 1,131,851 OGE ENERGY CORP.........................................................................................................................................................................................................39,368 1,454,062 1,749,416 OLD KENT FINANCIAL CORP.........................................................................................................................................................................................................46,352 2,928,017 2,839,060 OLD REPUBLIC INTERNATIONAL CORP.........................................................................................................................................................................................................84,403 3,115,473 3,033,233 OLIN CORP.........................................................................................................................................................................................................49,946 1,254,683 2,222,597 OLSTEN CORP.........................................................................................................................................................................................................79,203 1,959,829 1,485,056 OMNICARE INC.........................................................................................................................................................................................................77,610 2,377,685 2,245,839 OMNICOM GROUP INC.........................................................................................................................................................................................................79,761 2,304,980 5,403,808 OREGON STEEL MILLS INC.........................................................................................................................................................................................................25,054 472,978 674,892 OUTBACK STEAKHOUSE INC.........................................................................................................................................................................................................46,183 1,258,828 1,114,165 OVERSEAS SHIPHOLDING GROUP INC.........................................................................................................................................................................................................35,398 698,457 869,463 OXFORD HEALTH PLANS INC.........................................................................................................................................................................................................76,164 4,650,506 5,569,493 PACIFIC CENTURY FINANCIAL CORP.........................................................................................................................................................................................................40,641 1,283,512 2,004,109 PACIFICARE HEALTH SYSTEMS B (NEW).........................................................................................................................................................................................................40,050 2,849,355 2,738,419 PAINE WEBBER GROUP INC.........................................................................................................................................................................................................89,386 1,693,157 3,435,774 PARKER DRILLING CO.........................................................................................................................................................................................................73,664 510,388 971,444 PAYCHEX INC.........................................................................................................................................................................................................105,881 1,478,292 3,626,424 PAYLESS SHOESOURCE INC.........................................................................................................................................................................................................38,954 1,191,233 2,497,925 PENTAIR INC.........................................................................................................................................................................................................36,978 740,252 1,317,341 PERRIGO CO.........................................................................................................................................................................................................74,747 2,075,673 1,069,816 PG&E CORP.........................................................................................................................................................................................................944 20,999 21,889 PINNACLE WEST CAPITAL CORP.........................................................................................................................................................................................................83,026 1,984,637 2,682,778 PIONEER NATURAL RESOURCES.........................................................................................................................................................................................................71,255 2,291,291 2,845,747 PITTSTON CO.........................................................................................................................................................................................................40,165 975,000 1,425,858 PMI GROUP INC.........................................................................................................................................................................................................33,711 1,717,595 1,948,917 POLICY MANAGEMENT SYSTEMS CORP.........................................................................................................................................................................................................17,750 551,255 1,066,109 POTOMAC ELECTRIC POWER CO.........................................................................................................................................................................................................113,994 2,989,999 2,586,239 PRECISION CASTPARTS CORP.........................................................................................................................................................................................................23,369 604,330 1,510,222 PREMARK INTERNATIONAL INC.........................................................................................................................................................................................................60,915 1,981,487 1,812,221 PRICE T ROWE & ASSOCIATES INC.........................................................................................................................................................................................................56,162 1,661,025 3,088,910 PRIMEX TECHNOLOGIES INC.........................................................................................................................................................................................................20 371 585 PROMUS HOTEL CORP.........................................................................................................................................................................................................50,220 1,170,407 1,949,164
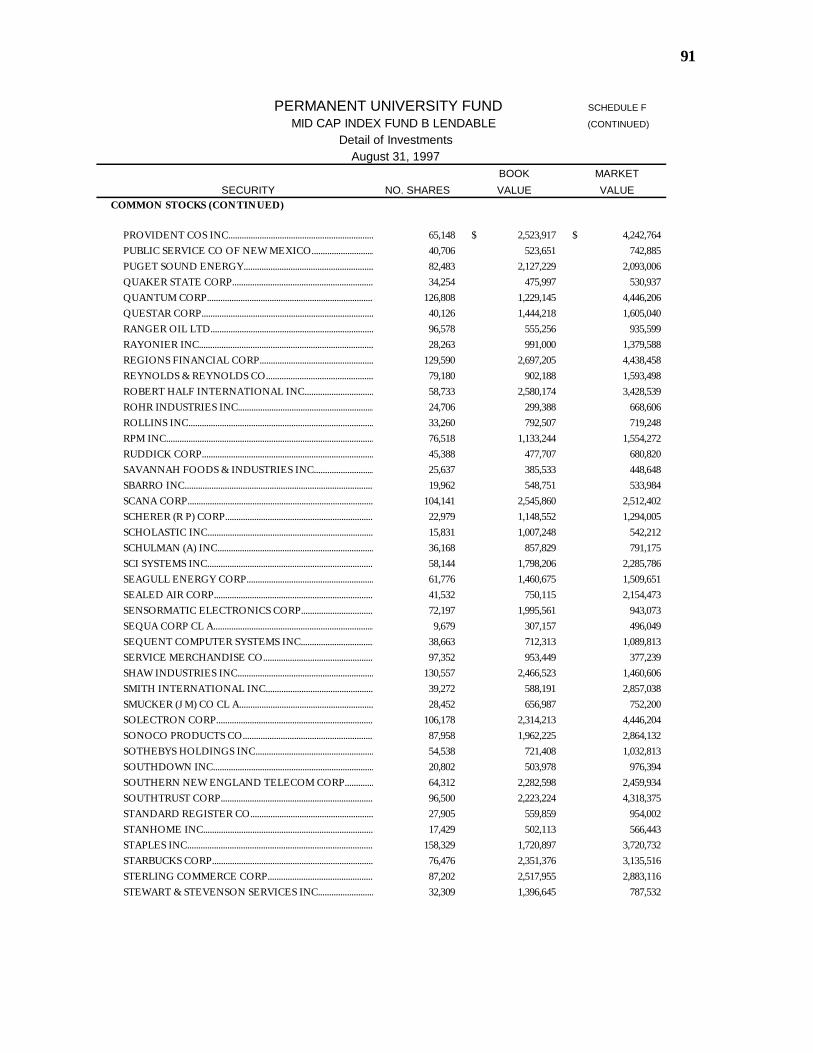
91
PERMANENT UNIVERSITY FUND SCHEDULE F
MID CAP INDEX FUND B LENDABLE (CONTINUED)
Detail of Investments August 31, 1997
BOOK MARKETSECURITY NO. SHARES VALUE VALUE
COMMON STOCKS (CONTINUED)
PROVIDENT COS INC.........................................................................................................................................................................................................65,148 2,523,917$ 4,242,764$ PUBLIC SERVICE CO OF NEW MEXICO.........................................................................................................................................................................................................40,706 523,651 742,885 PUGET SOUND ENERGY.........................................................................................................................................................................................................82,483 2,127,229 2,093,006 QUAKER STATE CORP.........................................................................................................................................................................................................34,254 475,997 530,937 QUANTUM CORP.........................................................................................................................................................................................................126,808 1,229,145 4,446,206 QUESTAR CORP.........................................................................................................................................................................................................40,126 1,444,218 1,605,040 RANGER OIL LTD.........................................................................................................................................................................................................96,578 555,256 935,599 RAYONIER INC.........................................................................................................................................................................................................28,263 991,000 1,379,588 REGIONS FINANCIAL CORP.........................................................................................................................................................................................................129,590 2,697,205 4,438,458 REYNOLDS & REYNOLDS CO.........................................................................................................................................................................................................79,180 902,188 1,593,498 ROBERT HALF INTERNATIONAL INC.........................................................................................................................................................................................................58,733 2,580,174 3,428,539 ROHR INDUSTRIES INC.........................................................................................................................................................................................................24,706 299,388 668,606 ROLLINS INC.........................................................................................................................................................................................................33,260 792,507 719,248 RPM INC.........................................................................................................................................................................................................76,518 1,133,244 1,554,272 RUDDICK CORP.........................................................................................................................................................................................................45,388 477,707 680,820 SAVANNAH FOODS & INDUSTRIES INC.........................................................................................................................................................................................................25,637 385,533 448,648 SBARRO INC.........................................................................................................................................................................................................19,962 548,751 533,984 SCANA CORP.........................................................................................................................................................................................................104,141 2,545,860 2,512,402 SCHERER (R P) CORP.........................................................................................................................................................................................................22,979 1,148,552 1,294,005 SCHOLASTIC INC.........................................................................................................................................................................................................15,831 1,007,248 542,212 SCHULMAN (A) INC.........................................................................................................................................................................................................36,168 857,829 791,175 SCI SYSTEMS INC.........................................................................................................................................................................................................58,144 1,798,206 2,285,786 SEAGULL ENERGY CORP.........................................................................................................................................................................................................61,776 1,460,675 1,509,651 SEALED AIR CORP.........................................................................................................................................................................................................41,532 750,115 2,154,473 SENSORMATIC ELECTRONICS CORP.........................................................................................................................................................................................................72,197 1,995,561 943,073 SEQUA CORP CL A.........................................................................................................................................................................................................9,679 307,157 496,049 SEQUENT COMPUTER SYSTEMS INC.........................................................................................................................................................................................................38,663 712,313 1,089,813 SERVICE MERCHANDISE CO.........................................................................................................................................................................................................97,352 953,449 377,239 SHAW INDUSTRIES INC.........................................................................................................................................................................................................130,557 2,466,523 1,460,606 SMITH INTERNATIONAL INC.........................................................................................................................................................................................................39,272 588,191 2,857,038 SMUCKER (J M) CO CL A.........................................................................................................................................................................................................28,452 656,987 752,200 SOLECTRON CORP.........................................................................................................................................................................................................106,178 2,314,213 4,446,204 SONOCO PRODUCTS CO.........................................................................................................................................................................................................87,958 1,962,225 2,864,132 SOTHEBYS HOLDINGS INC.........................................................................................................................................................................................................54,538 721,408 1,032,813 SOUTHDOWN INC.........................................................................................................................................................................................................20,802 503,978 976,394 SOUTHERN NEW ENGLAND TELECOM CORP.........................................................................................................................................................................................................64,312 2,282,598 2,459,934 SOUTHTRUST CORP.........................................................................................................................................................................................................96,500 2,223,224 4,318,375 STANDARD REGISTER CO.........................................................................................................................................................................................................27,905 559,859 954,002 STANHOME INC.........................................................................................................................................................................................................17,429 502,113 566,443 STAPLES INC.........................................................................................................................................................................................................158,329 1,720,897 3,720,732 STARBUCKS CORP.........................................................................................................................................................................................................76,476 2,351,376 3,135,516 STERLING COMMERCE CORP.........................................................................................................................................................................................................87,202 2,517,955 2,883,116 STEWART & STEVENSON SERVICES INC.........................................................................................................................................................................................................32,309 1,396,645 787,532
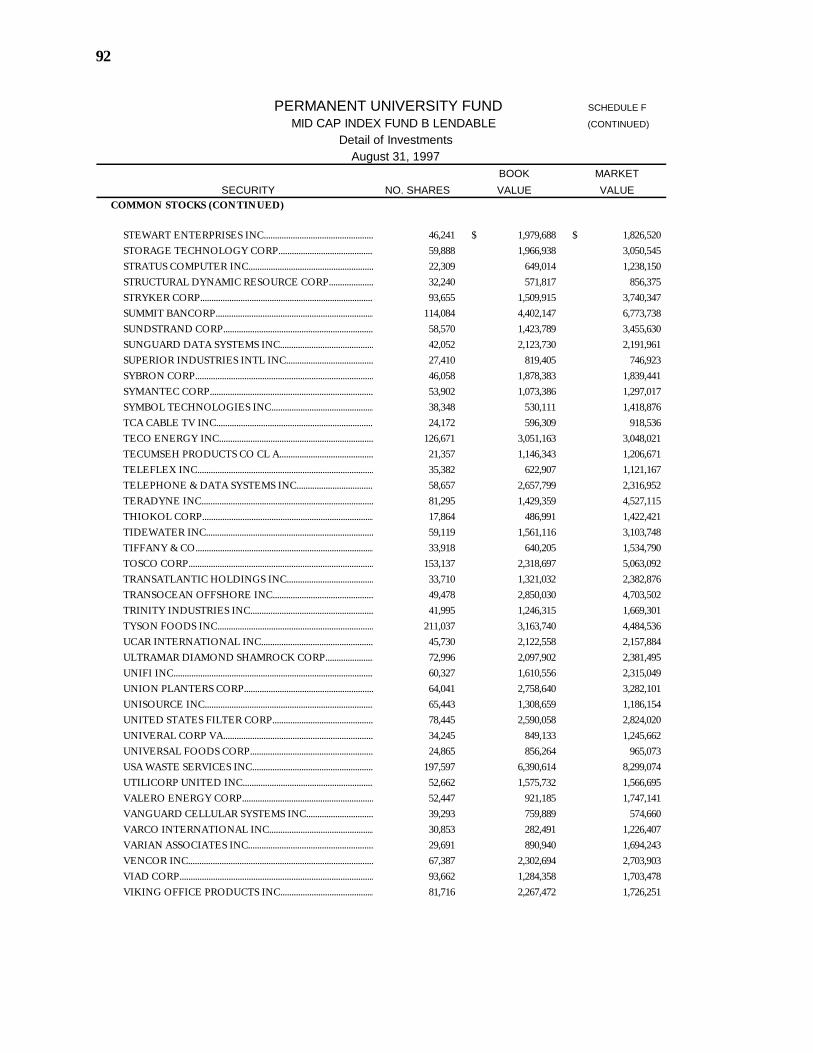
92
PERMANENT UNIVERSITY FUND SCHEDULE F
MID CAP INDEX FUND B LENDABLE (CONTINUED)
Detail of Investments August 31, 1997
BOOK MARKETSECURITY NO. SHARES VALUE VALUE
COMMON STOCKS (CONTINUED)
STEWART ENTERPRISES INC.........................................................................................................................................................................................................46,241 1,979,688$ 1,826,520$ STORAGE TECHNOLOGY CORP.........................................................................................................................................................................................................59,888 1,966,938 3,050,545 STRATUS COMPUTER INC.........................................................................................................................................................................................................22,309 649,014 1,238,150 STRUCTURAL DYNAMIC RESOURCE CORP.........................................................................................................................................................................................................32,240 571,817 856,375 STRYKER CORP.........................................................................................................................................................................................................93,655 1,509,915 3,740,347 SUMMIT BANCORP.........................................................................................................................................................................................................114,084 4,402,147 6,773,738 SUNDSTRAND CORP.........................................................................................................................................................................................................58,570 1,423,789 3,455,630 SUNGUARD DATA SYSTEMS INC.........................................................................................................................................................................................................42,052 2,123,730 2,191,961 SUPERIOR INDUSTRIES INTL INC.........................................................................................................................................................................................................27,410 819,405 746,923 SYBRON CORP.........................................................................................................................................................................................................46,058 1,878,383 1,839,441 SYMANTEC CORP.........................................................................................................................................................................................................53,902 1,073,386 1,297,017 SYMBOL TECHNOLOGIES INC.........................................................................................................................................................................................................38,348 530,111 1,418,876 TCA CABLE TV INC.........................................................................................................................................................................................................24,172 596,309 918,536 TECO ENERGY INC.........................................................................................................................................................................................................126,671 3,051,163 3,048,021 TECUMSEH PRODUCTS CO CL A.........................................................................................................................................................................................................21,357 1,146,343 1,206,671 TELEFLEX INC.........................................................................................................................................................................................................35,382 622,907 1,121,167 TELEPHONE & DATA SYSTEMS INC.........................................................................................................................................................................................................58,657 2,657,799 2,316,952 TERADYNE INC.........................................................................................................................................................................................................81,295 1,429,359 4,527,115 THIOKOL CORP.........................................................................................................................................................................................................17,864 486,991 1,422,421 TIDEWATER INC.........................................................................................................................................................................................................59,119 1,561,116 3,103,748 TIFFANY & CO.........................................................................................................................................................................................................33,918 640,205 1,534,790 TOSCO CORP.........................................................................................................................................................................................................153,137 2,318,697 5,063,092 TRANSATLANTIC HOLDINGS INC.........................................................................................................................................................................................................33,710 1,321,032 2,382,876 TRANSOCEAN OFFSHORE INC.........................................................................................................................................................................................................49,478 2,850,030 4,703,502 TRINITY INDUSTRIES INC.........................................................................................................................................................................................................41,995 1,246,315 1,669,301 TYSON FOODS INC.........................................................................................................................................................................................................211,037 3,163,740 4,484,536 UCAR INTERNATIONAL INC.........................................................................................................................................................................................................45,730 2,122,558 2,157,884 ULTRAMAR DIAMOND SHAMROCK CORP.........................................................................................................................................................................................................72,996 2,097,902 2,381,495 UNIFI INC.........................................................................................................................................................................................................60,327 1,610,556 2,315,049 UNION PLANTERS CORP.........................................................................................................................................................................................................64,041 2,758,640 3,282,101 UNISOURCE INC....................................................................................................................................................................................................65,443 1,308,659 1,186,154 UNITED STATES FILTER CORP.........................................................................................................................................................................................................78,445 2,590,058 2,824,020 UNIVERAL CORP VA.........................................................................................................................................................................................................34,245 849,133 1,245,662 UNIVERSAL FOODS CORP.........................................................................................................................................................................................................24,865 856,264 965,073 USA WASTE SERVICES INC.........................................................................................................................................................................................................197,597 6,390,614 8,299,074 UTILICORP UNITED INC.........................................................................................................................................................................................................52,662 1,575,732 1,566,695 VALERO ENERGY CORP.........................................................................................................................................................................................................52,447 921,185 1,747,141 VANGUARD CELLULAR SYSTEMS INC.........................................................................................................................................................................................................39,293 759,889 574,660 VARCO INTERNATIONAL INC.........................................................................................................................................................................................................30,853 282,491 1,226,407 VARIAN ASSOCIATES INC.........................................................................................................................................................................................................29,691 890,940 1,694,243 VENCOR INC.........................................................................................................................................................................................................67,387 2,302,694 2,703,903 VIAD CORP.........................................................................................................................................................................................................93,662 1,284,358 1,703,478 VIKING OFFICE PRODUCTS INC.........................................................................................................................................................................................................81,716 2,267,472 1,726,251
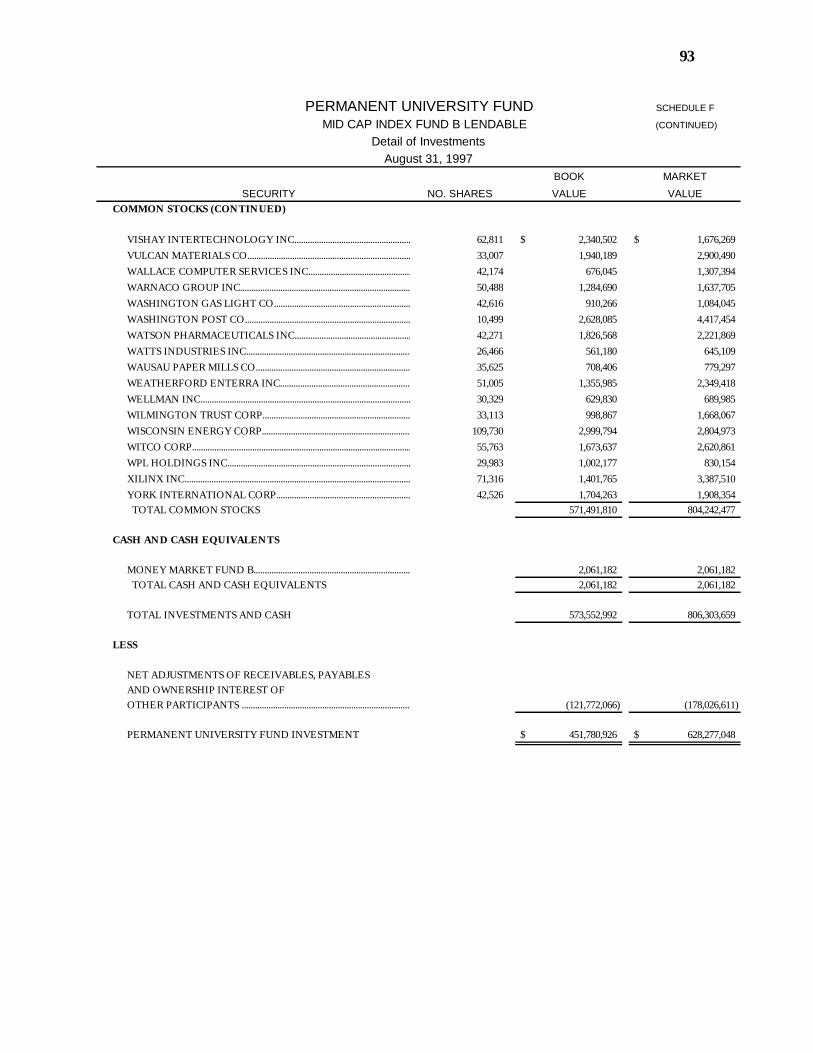
93
PERMANENT UNIVERSITY FUND SCHEDULE F
MID CAP INDEX FUND B LENDABLE (CONTINUED)
Detail of Investments August 31, 1997
BOOK MARKET
SECURITY NO. SHARES VALUE VALUECOMMON STOCKS (CONTINUED)
VISHAY INTERTECHNOLOGY INC.........................................................................................................................................................................................................62,811 2,340,502$ 1,676,269$ VULCAN MATERIALS CO.........................................................................................................................................................................................................33,007 1,940,189 2,900,490 WALLACE COMPUTER SERVICES INC.........................................................................................................................................................................................................42,174 676,045 1,307,394 WARNACO GROUP INC.........................................................................................................................................................................................................50,488 1,284,690 1,637,705 WASHINGTON GAS LIGHT CO.........................................................................................................................................................................................................42,616 910,266 1,084,045 WASHINGTON POST CO.........................................................................................................................................................................................................10,499 2,628,085 4,417,454 WATSON PHARMACEUTICALS INC.........................................................................................................................................................................................................42,271 1,826,568 2,221,869 WATTS INDUSTRIES INC.........................................................................................................................................................................................................26,466 561,180 645,109 WAUSAU PAPER MILLS CO.........................................................................................................................................................................................................35,625 708,406 779,297 WEATHERFORD ENTERRA INC.........................................................................................................................................................................................................51,005 1,355,985 2,349,418 WELLMAN INC.........................................................................................................................................................................................................30,329 629,830 689,985 WILMINGTON TRUST CORP.........................................................................................................................................................................................................33,113 998,867 1,668,067 WISCONSIN ENERGY CORP.........................................................................................................................................................................................................109,730 2,999,794 2,804,973 WITCO CORP.........................................................................................................................................................................................................55,763 1,673,637 2,620,861 WPL HOLDINGS INC.........................................................................................................................................................................................................29,983 1,002,177 830,154 XILINX INC.........................................................................................................................................................................................................71,316 1,401,765 3,387,510 YORK INTERNATIONAL CORP.........................................................................................................................................................................................................42,526 1,704,263 1,908,354 TOTAL COMMON STOCKS 571,491,810 804,242,477
CASH AND CASH EQUIVALENTS
MONEY MARKET FUND B......................................................................................................................................................................................................... 2,061,182 2,061,182 TOTAL CASH AND CASH EQUIVALENTS 2,061,182 2,061,182
TOTAL INVESTMENTS AND CASH 573,552,992 806,303,659
LESS
NET ADJUSTMENTS OF RECEIVABLES, PAYABLESAND OWNERSHIP INTEREST OF OTHER PARTICIPANTS ......................................................................................................................................................................................................... (121,772,066) (178,026,611)
PERMANENT UNIVERSITY FUND INVESTMENT 451,780,926$ 628,277,048$

94
(This page has been left blank intentionally)

PERMANENT UNIVERSITY FUND
H i s t o r i c a l S u p p l e m e n t a l S c h e d u l e s(unaudited)
95
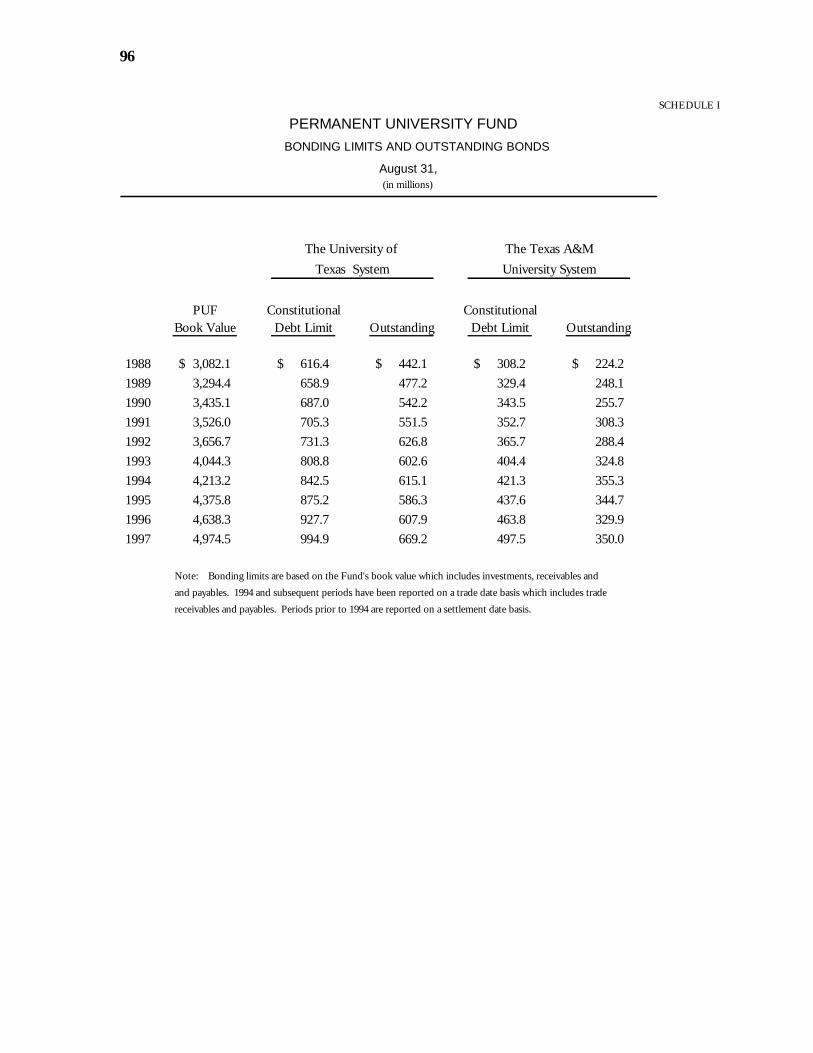
96
SCHEDULE I
PERMANENT UNIVERSITY FUND BONDING LIMITS AND OUTSTANDING BONDS
August 31, (in millions)
The University of The Texas A&M Texas System University System
PUF Constitutional ConstitutionalBook Value Debt Limit Outstanding Debt Limit Outstanding
1988 3,082.1$ 616.4$ 442.1$ 308.2$ 224.2$ 1989 3,294.4 658.9 477.2 329.4 248.1 1990 3,435.1 687.0 542.2 343.5 255.7 1991 3,526.0 705.3 551.5 352.7 308.3 1992 3,656.7 731.3 626.8 365.7 288.4 1993 4,044.3 808.8 602.6 404.4 324.8 1994 4,213.2 842.5 615.1 421.3 355.3 1995 4,375.8 875.2 586.3 437.6 344.7 1996 4,638.3 927.7 607.9 463.8 329.9 1997 4,974.5 994.9 669.2 497.5 350.0
Note: Bonding limits are based on the Fund's book value which includes investments, receivables and and payables. 1994 and subsequent periods have been reported on a trade date basis which includes tradereceivables and payables. Periods prior to 1994 are reported on a settlement date basis.
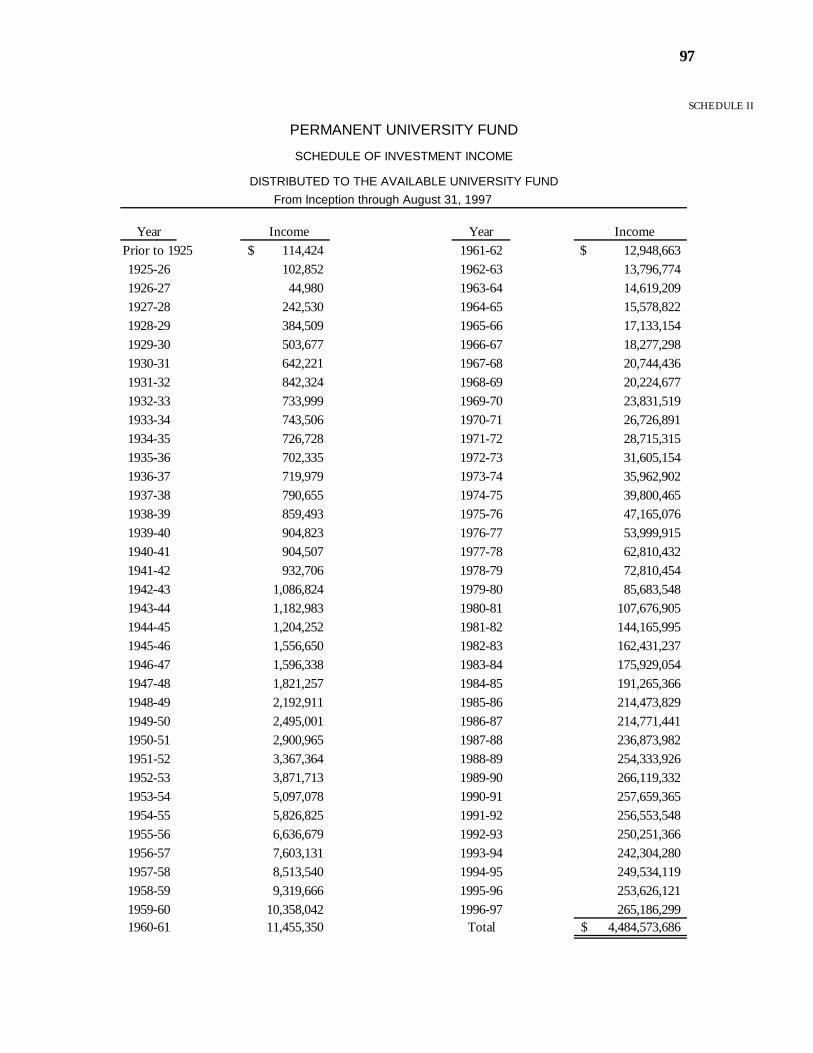
97
SCHEDULE II
From Inception through August 31, 1997
Year Income Year IncomePrior to 1925 114,424$ 1961-62 12,948,663$ 1925-26 102,852 1962-63 13,796,774 1926-27 44,980 1963-64 14,619,209 1927-28 242,530 1964-65 15,578,822 1928-29 384,509 1965-66 17,133,154 1929-30 503,677 1966-67 18,277,298 1930-31 642,221 1967-68 20,744,436 1931-32 842,324 1968-69 20,224,677 1932-33 733,999 1969-70 23,831,519 1933-34 743,506 1970-71 26,726,891 1934-35 726,728 1971-72 28,715,315 1935-36 702,335 1972-73 31,605,154 1936-37 719,979 1973-74 35,962,902 1937-38 790,655 1974-75 39,800,465 1938-39 859,493 1975-76 47,165,076 1939-40 904,823 1976-77 53,999,915 1940-41 904,507 1977-78 62,810,432 1941-42 932,706 1978-79 72,810,454 1942-43 1,086,824 1979-80 85,683,548 1943-44 1,182,983 1980-81 107,676,905 1944-45 1,204,252 1981-82 144,165,995 1945-46 1,556,650 1982-83 162,431,237 1946-47 1,596,338 1983-84 175,929,054 1947-48 1,821,257 1984-85 191,265,366 1948-49 2,192,911 1985-86 214,473,829 1949-50 2,495,001 1986-87 214,771,441 1950-51 2,900,965 1987-88 236,873,982 1951-52 3,367,364 1988-89 254,333,926 1952-53 3,871,713 1989-90 266,119,332 1953-54 5,097,078 1990-91 257,659,365 1954-55 5,826,825 1991-92 256,553,548 1955-56 6,636,679 1992-93 250,251,366 1956-57 7,603,131 1993-94 242,304,280 1957-58 8,513,540 1994-95 249,534,119 1958-59 9,319,666 1995-96 253,626,121 1959-60 10,358,042 1996-97 265,186,299 1960-61 11,455,350 Total 4,484,573,686$
PERMANENT UNIVERSITY FUND
SCHEDULE OF INVESTMENT INCOME
DISTRIBUTED TO THE AVAILABLE UNIVERSITY FUND
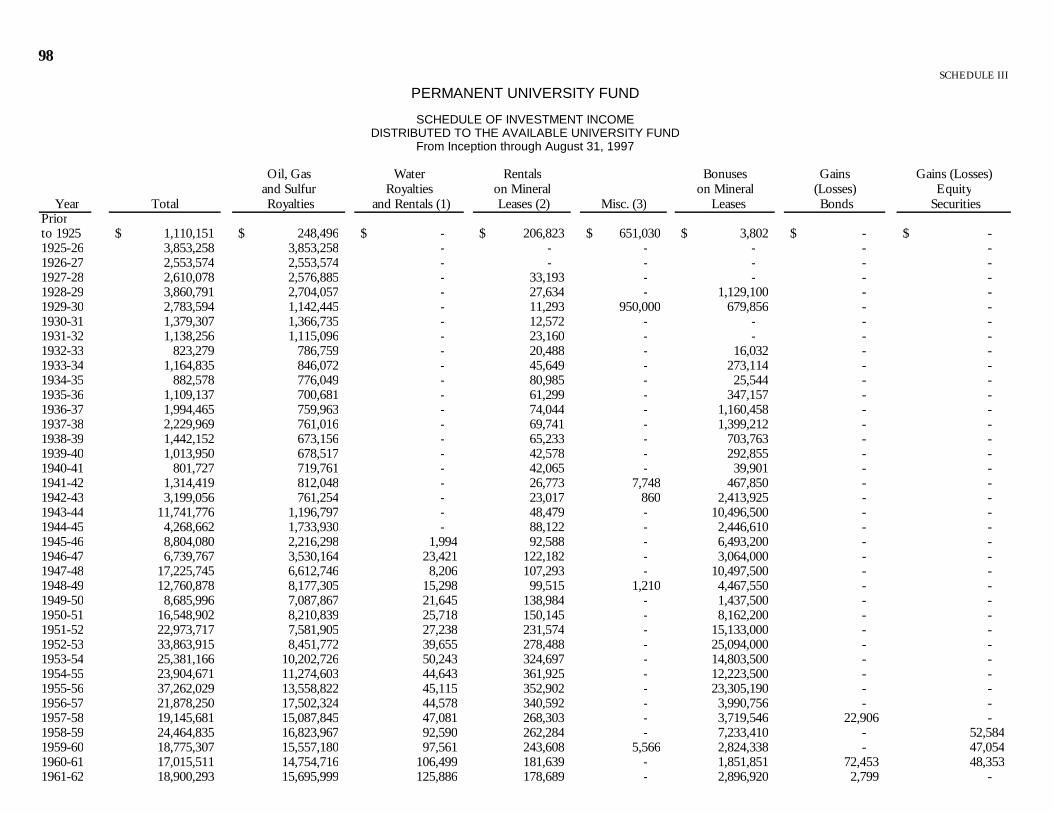
98SCHEDULE III
Oil, Gas Water Rentals Bonuses Gains Gains (Losses)and Sulfur Royalties on Mineral on Mineral (Losses) Equity
Year Total Royalties and Rentals (1) Leases (2) Misc. (3) Leases Bonds Securities Priorto 1925 1,110,151$ 248,496$ -$ 206,823$ 651,030$ 3,802$ -$ -$ 1925-26 3,853,258 3,853,258 - - - - - - 1926-27 2,553,574 2,553,574 - - - - - - 1927-28 2,610,078 2,576,885 - 33,193 - - - - 1928-29 3,860,791 2,704,057 - 27,634 - 1,129,100 - - 1929-30 2,783,594 1,142,445 - 11,293 950,000 679,856 - - 1930-31 1,379,307 1,366,735 - 12,572 - - - - 1931-32 1,138,256 1,115,096 - 23,160 - - - - 1932-33 823,279 786,759 - 20,488 - 16,032 - - 1933-34 1,164,835 846,072 - 45,649 - 273,114 - - 1934-35 882,578 776,049 - 80,985 - 25,544 - - 1935-36 1,109,137 700,681 - 61,299 - 347,157 - - 1936-37 1,994,465 759,963 - 74,044 - 1,160,458 - - 1937-38 2,229,969 761,016 - 69,741 - 1,399,212 - - 1938-39 1,442,152 673,156 - 65,233 - 703,763 - - 1939-40 1,013,950 678,517 - 42,578 - 292,855 - - 1940-41 801,727 719,761 - 42,065 - 39,901 - - 1941-42 1,314,419 812,048 - 26,773 7,748 467,850 - - 1942-43 3,199,056 761,254 - 23,017 860 2,413,925 - - 1943-44 11,741,776 1,196,797 - 48,479 - 10,496,500 - - 1944-45 4,268,662 1,733,930 - 88,122 - 2,446,610 - - 1945-46 8,804,080 2,216,298 1,994 92,588 - 6,493,200 - - 1946-47 6,739,767 3,530,164 23,421 122,182 - 3,064,000 - - 1947-48 17,225,745 6,612,746 8,206 107,293 - 10,497,500 - - 1948-49 12,760,878 8,177,305 15,298 99,515 1,210 4,467,550 - - 1949-50 8,685,996 7,087,867 21,645 138,984 - 1,437,500 - - 1950-51 16,548,902 8,210,839 25,718 150,145 - 8,162,200 - - 1951-52 22,973,717 7,581,905 27,238 231,574 - 15,133,000 - - 1952-53 33,863,915 8,451,772 39,655 278,488 - 25,094,000 - - 1953-54 25,381,166 10,202,726 50,243 324,697 - 14,803,500 - - 1954-55 23,904,671 11,274,603 44,643 361,925 - 12,223,500 - - 1955-56 37,262,029 13,558,822 45,115 352,902 - 23,305,190 - - 1956-57 21,878,250 17,502,324 44,578 340,592 - 3,990,756 - - 1957-58 19,145,681 15,087,845 47,081 268,303 - 3,719,546 22,906 - 1958-59 24,464,835 16,823,967 92,590 262,284 - 7,233,410 - 52,584 1959-60 18,775,307 15,557,180 97,561 243,608 5,566 2,824,338 - 47,054 1960-61 17,015,511 14,754,716 106,499 181,639 - 1,851,851 72,453 48,353 1961-62 18,900,293 15,695,999 125,886 178,689 - 2,896,920 2,799 -
PERMANENT UNIVERSITY FUND
SCHEDULE OF INVESTMENT INCOMEDISTRIBUTED TO THE AVAILABLE UNIVERSITY FUND
From Inception through August 31, 1997

99SCHEDULE III
CONTINUED
Oil, Gas Water Rentals Bonuses Gains Gains (Losses)and Sulfur Royalties on Mineral on Mineral (Losses) Equity
Year Total Royalties and Rentals (1) Leases (2) Misc. (3) Leases Bonds Securities 1962-63 17,555,883$ 14,776,924$ 114,126$ 172,564$ -$ 2,239,940$ 227,329$ 25,000$ 1963-64 19,604,162 14,573,732 120,977 188,552 - 4,709,007 11,894 - 1964-65 28,761,936 16,129,182 119,387 218,235 - 12,295,111 21 - 1965-66 27,359,222 15,277,898 113,895 257,859 427 11,709,055 88 - 1966-67 17,077,814 15,547,261 123,402 281,032 1,523 930,920 13,784 179,892 1967-68 22,700,589 16,513,545 124,983 231,846 - 5,409,497 5 420,713 1968-69 23,112,761 16,638,055 135,086 319,027 45,443 4,133,164 9,949 1,832,037 1969-70 26,398,948 16,410,890 156,467 305,394 4,616 1,966,392 7,454 7,547,735 1970-71 26,671,949 18,388,315 172,841 276,364 - 1,838,208 965,438 5,030,783 1971-72 35,726,044 19,518,332 154,055 342,591 57,630 5,055,031 (25,860) 10,624,265 1972-73 38,779,680 18,966,511 164,131 445,247 18,308 7,066,026 (8,168,562) 20,288,019 1973-74 44,929,035 31,541,165 296,926 446,989 - 12,542,069 27,324 74,562 1974-75 67,487,859 58,512,449 204,565 690,281 - 8,265,982 24,913 (210,331) 1975-76 72,826,764 70,123,016 242,133 599,275 - 15,379,248 (12,574,690) (942,218) 1976-77 91,472,199 76,597,813 251,655 1,116,030 78,484 13,862,279 7,589 (441,651) 1977-78 97,250,392 76,845,154 295,196 1,401,704 97,312 18,573,336 24,576 13,114 1978-79 90,497,385 76,636,939 280,463 2,343,378 26,639 10,817,523 62,420 330,023 1979-80 122,649,528 119,356,297 436,346 2,550,237 45,517 252,799 58,756 (50,424) 1980-81 262,882,837 160,284,566 393,453 2,954,156 42,656 98,282,136 (342,583) 1,268,453 1981-82 206,393,579 178,286,243 430,942 2,558,661 103,509 20,221,156 (1,037,956) 5,831,024 1982-83 176,874,953 154,701,532 483,778 1,997,907 27,637 742,382 1,834,081 17,087,636 1983-84 179,902,223 145,186,364 855,113 2,314,847 15,886 7,253,984 1,144,757 23,131,272 1984-85 234,353,208 135,421,797 612,810 1,736,478 23,795 244,093 (10,502) 96,324,737 1985-86 288,651,796 109,510,169 791,816 822,775 38,870 6,171,722 (13,846,383) 185,162,827 1986-87 314,013,997 73,147,583 635,417 497,731 5,920 6,984,753 4,570,190 228,172,403 1987-88 162,578,213 75,431,807 713,388 592,240 24,721 3,567,967 (15,049,889) 97,297,979 1988-89 212,273,613 67,236,036 1,126,927 869,198 35,330 2,554,808 (79,505) 140,530,819 1989-90 140,687,878 71,539,477 1,095,340 883,053 43,724 4,913,078 (719,879) 62,933,085 1990-91 91,400,742 85,049,436 1,078,680 772,629 24,361 2,383,108 (7,628,745) 9,721,273 1991-92 130,436,316 61,471,027 632,345 564,767 32,212 1,940,976 5,243,867 60,551,122 1992-93 387,367,098 64,953,037 1,011,129 615,118 23,989 2,740,202 13,143,299 304,880,324 1994-95 162,615,650 51,213,573 841,771 540,888 187,942 4,313,279 1,488,016 104,030,181 1995-96 262,512,757 56,625,850 879,033 680,851 183,324 7,318,671 6,531,264 190,293,764 1996-97 336,178,706 69,849,855 527,472 978,821 36,560 13,794,067 (2,568,613) 253,560,544 Total 4,974,515,767$ 2,514,268,494$ 17,628,585$ 36,892,466$ 2,887,799$ 494,446,638$ (17,313,491)$ 1,925,705,276$
(1) Consists of water royalties, lease rentals and brine royalties. Beginning 1989 includes brine lease rentals.(2) Consists of oil and gas rentals and sulfur lease rentals. Prior to 1989 includes brine lease rentals.
PERMANENT UNIVERSITY FUNDSCHEDULE OF INVESTMENT INCOME
DISTRIBUTED TO THE AVAILABLE UNIVERSITY FUNDFrom Inception through August 31, 1997
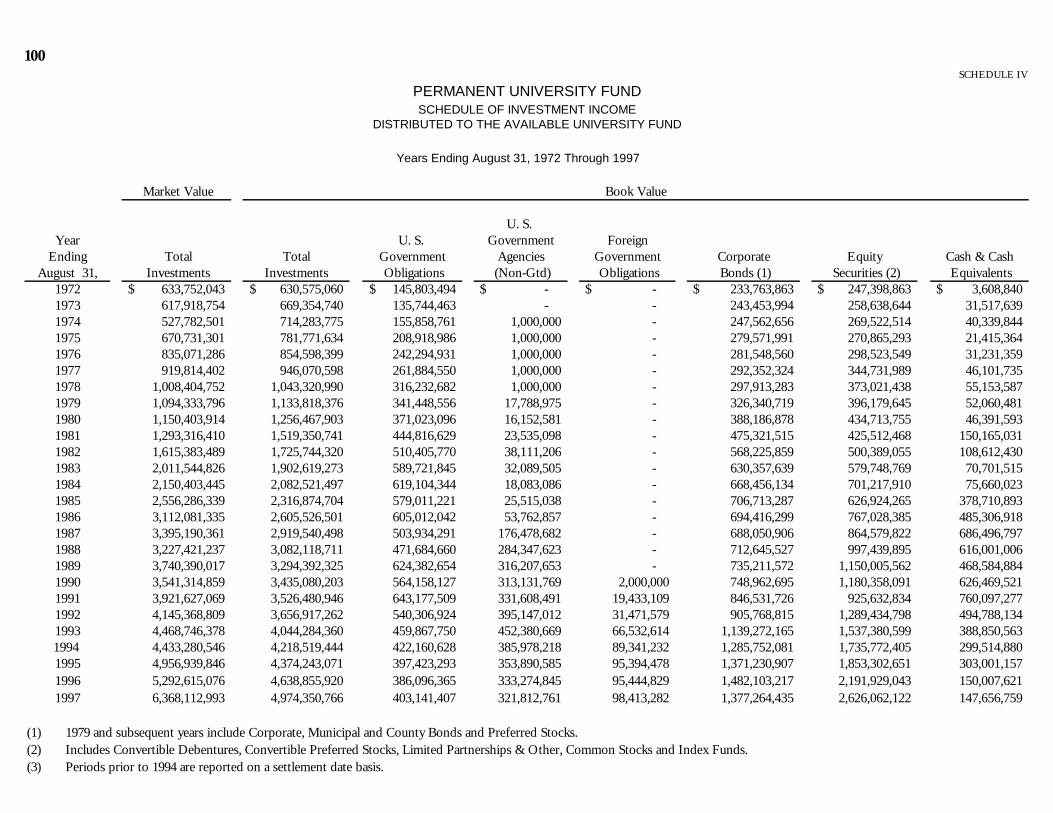
100SCHEDULE IV
Years Ending August 31, 1972 Through 1997
Market Value Book Value
U. S. Year U. S. Government Foreign
Ending Total Total Government Agencies Government Corporate Equity Cash & CashAugust 31, Investments Investments Obligations (Non-Gtd) Obligations Bonds (1) Securities (2) Equivalents
1972 633,752,043$ 630,575,060$ 145,803,494$ -$ -$ 233,763,863$ 247,398,863$ 3,608,840$ 1973 617,918,754 669,354,740 135,744,463 - - 243,453,994 258,638,644 31,517,639 1974 527,782,501 714,283,775 155,858,761 1,000,000 - 247,562,656 269,522,514 40,339,844 1975 670,731,301 781,771,634 208,918,986 1,000,000 - 279,571,991 270,865,293 21,415,364 1976 835,071,286 854,598,399 242,294,931 1,000,000 - 281,548,560 298,523,549 31,231,359 1977 919,814,402 946,070,598 261,884,550 1,000,000 - 292,352,324 344,731,989 46,101,735 1978 1,008,404,752 1,043,320,990 316,232,682 1,000,000 - 297,913,283 373,021,438 55,153,587 1979 1,094,333,796 1,133,818,376 341,448,556 17,788,975 - 326,340,719 396,179,645 52,060,481 1980 1,150,403,914 1,256,467,903 371,023,096 16,152,581 - 388,186,878 434,713,755 46,391,593 1981 1,293,316,410 1,519,350,741 444,816,629 23,535,098 - 475,321,515 425,512,468 150,165,031 1982 1,615,383,489 1,725,744,320 510,405,770 38,111,206 - 568,225,859 500,389,055 108,612,430 1983 2,011,544,826 1,902,619,273 589,721,845 32,089,505 - 630,357,639 579,748,769 70,701,515 1984 2,150,403,445 2,082,521,497 619,104,344 18,083,086 - 668,456,134 701,217,910 75,660,023 1985 2,556,286,339 2,316,874,704 579,011,221 25,515,038 - 706,713,287 626,924,265 378,710,893 1986 3,112,081,335 2,605,526,501 605,012,042 53,762,857 - 694,416,299 767,028,385 485,306,918 1987 3,395,190,361 2,919,540,498 503,934,291 176,478,682 - 688,050,906 864,579,822 686,496,797 1988 3,227,421,237 3,082,118,711 471,684,660 284,347,623 - 712,645,527 997,439,895 616,001,006 1989 3,740,390,017 3,294,392,325 624,382,654 316,207,653 - 735,211,572 1,150,005,562 468,584,884 1990 3,541,314,859 3,435,080,203 564,158,127 313,131,769 2,000,000 748,962,695 1,180,358,091 626,469,521 1991 3,921,627,069 3,526,480,946 643,177,509 331,608,491 19,433,109 846,531,726 925,632,834 760,097,277 1992 4,145,368,809 3,656,917,262 540,306,924 395,147,012 31,471,579 905,768,815 1,289,434,798 494,788,134 1993 4,468,746,378 4,044,284,360 459,867,750 452,380,669 66,532,614 1,139,272,165 1,537,380,599 388,850,563 1994 4,433,280,546 4,218,519,444 422,160,628 385,978,218 89,341,232 1,285,752,081 1,735,772,405 299,514,880 1995 4,956,939,846 4,374,243,071 397,423,293 353,890,585 95,394,478 1,371,230,907 1,853,302,651 303,001,157 1996 5,292,615,076 4,638,855,920 386,096,365 333,274,845 95,444,829 1,482,103,217 2,191,929,043 150,007,621 1997 6,368,112,993 4,974,350,766 403,141,407 321,812,761 98,413,282 1,377,264,435 2,626,062,122 147,656,759
(1) 1979 and subsequent years include Corporate, Municipal and County Bonds and Preferred Stocks.(2) Includes Convertible Debentures, Convertible Preferred Stocks, Limited Partnerships & Other, Common Stocks and Index Funds.(3) Periods prior to 1994 are reported on a settlement date basis.
PERMANENT UNIVERSITY FUNDSCHEDULE OF INVESTMENT INCOME
DISTRIBUTED TO THE AVAILABLE UNIVERSITY FUND
Reference Guide for Timeline Photos
1 Littlefield Memorial Fountain(Inside front cover)CN09203The Center for American HistoryPrints & photographs Coll.
2 The Alamo(Pg. 2)CN09203The Center for American HistoryPrints & photographs Coll.
3 Mirabeau B. Lamar(Pg. 2)CN00444The Center for American HistoryPrints & photographs Coll.
4 General Scott occupying Mexico City(Pg. 2)#1987/140-12Archives DivisionTexas State Library
5 Governor E.M. Pease(Pg. 3)#1981/57-36Archives DivisionTexas State Library
6 Industrial Revolution(Pg. 3)BPA2# 2528Corbis-Bettmann
7 Cannon(Pg. 3)CN09532The Center for American HistoryPrints & photographs Coll.
8 Texas A&M - Old Main with Shacks(Pg. 3)Archives DivisionTexas State Library
9 Constitution of the State of Texas(Pg. 4)#1997/1-39-1Archives & Information Services Div.Texas State Library
10 U. T. at Austin - Old Main(Pg. 4)CN009433The Center for American HistoryPrints & photographs Coll.
11 Spindletop(Pg. 5)CN01264The Center for American HistoryPrints & photographs Coll.
12 William Battle Phillips(Pg. 5)CN009429The Center for American HistoryU.T. Bureau of Economic Geology Papers
13 Wright Brothers(Pg. 5)BPA2# 5957Corbis-Bettmann
14 U. T. at Austin - Shacks(Pg. 5)CN09533The Center for American HistoryPrints & photographs Coll.
15 I Want You, WWI Poster(Pg. 5)05P E454Corbis-Bettmann
16 Udden Mineral Map(Pg. 6)The Petroleum MuseumThe Abell-Hanger Foundation CollectionSamuel D. Myres Papers
17 Santa Rita No.1(Pg. 6)CN09431The Center for American HistoryPrints & photographs Coll.
18 Orient Express Railway(Pg. 6)The Petroleum MuseumJune 10, 1923
19 Stock Market Crash News(Pg. 6)BPA2# 4814Underwood & Underwood/Corbis-Bettmann
20 U. T. at Austin Campus(Pg. 7)CN09435The Center for American HistoryPrints & photographs Coll.
21 Pearl Harbor(Pg. 7)BPA2# 5626UPI/Corbis-Bettmann
22 Santa Rita No.1on U. T. at Austin Campus(Pg. 8)CN04581The Center for American HistoryPrints & photographs Coll.
23 Texas A&M - Old Main(Pg.17)CN05317The Center for American HistoryPrints & photographs Coll.

210 West Sixth Street, Second Floor Austin, Texas 78701 Voice 512.499.4308 Fax 512.499.4365 Website http://www.utimco.org