ptxcoy catalysts degradation in pefc environments: mechanistic insights: ii. preparation and...
TRANSCRIPT

Journal of The Electrochemical Society, 157 �6� B943-B951 �2010� B943
D
PtxCoy Catalysts Degradation in PEFC Environments:Mechanistic InsightsII. Preparation and Characterization of Particles with HomogeneousCompositionPascal Fugier,a,z Sylvain Passot,a Christelle Anglade,a Laure Guétaz,b
Nicolas Guillet,b Eric De Vito,b Sophie Mailley,c and Alejandro A. Francoa,*,z
aLaboratoire des Technologies des Surfaces, Département des Technologies des Nanomatèriaux, bLaboratoiredes Composants pour Piles à Combustibles et de Modélisation, Département de l’Electricité et del’Hydrogène pour les Transports, and cLaboratoire des Batteries Avancées, Département de l’Electricité etde l’Hydrogène pour les Transports, Commissariat à l’Energie Atomique et aux Energies Alternatives/Centre de Grenoble LITEN, 38054 Grenoble Cedex 9, France
In this paper, we present experimental results on the preparation and the electrochemical characterization of PtxCoy electrocatalyticparticles with homogeneous composition, modeled by Franco et al. �J. Electrochem. Soc., 156, B410 �2009��. Preparation is madethrough the direct liquid injection metallorganic chemical vapor deposition technique previously developed at CEA, and electro-chemical analysis is carried out by using a rotating disk electrode and membrane-assembled gas diffusion electrode. Degradationstructural changes are characterized by using transmission electron microscopy, X-ray diffraction, and X-ray photoelectron spec-troscopy. Optimal Co compositions are identified for better oxygen reduction reaction activity and durability, validating themodeling studies.© 2010 The Electrochemical Society. �DOI: 10.1149/1.3385000� All rights reserved.
Manuscript submitted September 4, 2009; revised manuscript received March 15, 2010. Published May 3, 2010.
0013-4651/2010/157�6�/B943/9/$28.00 © The Electrochemical Society
The specific activity and stability of polymer electrolyte fuel cell�PEFC� electrodes can be improved by alloying Pt with some tran-sition metals �e.g., Co, Ni, and V�. These electrodes thereforeachieve lower overall Pt loadings compared to pure Pt-based elec-trodes. In our previous paper,1 we have proposed a multiscale ki-netic model describing the oxygen reduction reaction �ORR� activityand degradation of PtxCoy nanoparticles in PEFC environments.This model provides mechanistic insights on the impact of the nano-structure and operating conditions on the PtxCoy nanoparticles dura-bility. On the basis of ab initio data, we identify favorable pathwaysof the ORR on PtxCoy nanoparticles and of the competitive Pt–Codissolution in acidic media. The derived ab initio-based kinetics iscoupled to a description of the atomic reorganization at the nanopar-ticle level as a function of the cumulated Pt and Co mass losses.This nanoscale model is coupled with a transport microscale modelof charges and O2 through a PEFC cathode, and sensitivity simula-tions to several operation conditions and initial compositions/morphologies are performed. Two kinds of particles are simulated:
1. Annealed PtxCoy nanoparticles �representative of complete al-loys� by using the Monte Carlo method.
2. Homogeneous PtxCoy particles, i.e., with the surface compo-sition equal to the volume composition �representative of bulk-truncated structures or incomplete alloys�.
In this paper, we focus on the preparation and the electrochemi-cal characterization of the second kind of PtxCoy particles. The goalhere is not to prepare highly active and stable electrocatalytic sys-tems but to prepare model electrodes with structures/morphologiesthat can be compared with the PtxCoy homogeneous particles thatwe modeled in Ref. 1.
Preparation methods for pure Pt or Pt-based electrocatalysts aregenerally aqueous methods using various reducing agents. The con-ventional method consists in depositing Pt on carbon and then Co onPt/C.2-4 For example, Xiong and Manthiram synthesized Pt–M �M= Fe, Co, Ni, and Cu� catalysts by using a commercial Pt catalystsupported on carbon black.2 Two other synthesis methods are pre-sented in Ref. 5 and 6. Li et al. developed a method for the synthesis
* Electrochemical Society Active Member.z E-mail: [email protected]; [email protected]
ownloaded 02 Aug 2010 to 132.168.157.102. Redistribution subject to
of Pt–Co based on the preparation of a Co/C composite supportfollowed by removing the excess Co in a H2SO4 solution.5
Other methods based on surface technologies have also beenstudied such as the chemical vapor deposition �CVD� process.Chemical deposition processes used for the formation of thin filmsor supported nanoparticles are based on chemical reactions betweeninorganic or organic metal-containing species, leading to the forma-tion of a thin layer on an appropriate substrate. All these processesare one-step processes, in general, simpler and less expensive thanphysical deposition processes. They are commonly used for the pro-duction of various coatings �metals, oxides, and composites�, themain advantage being that they allow an easy scaling up to largesize systems and a conformal coverage of complex shapes. Thechemical reactions used in CVD are numerous and include thermaldecomposition �pyrolisis�, reduction, hydrolysis, and oxidation,which can be used either singly or in combination. These reactionscan be activated by several methods, the most important one beingthermal activation and plasma activation. Depending on the applica-tions and specifications, the reactants �precursors� have to be cor-rectly chosen from the following general groups: halides, carbonyls,metallorganics �MOs�, and hybrids.
In our group at CEA, a modified CVD method, the metallorganicchemical vapor deposition �MOCVD� process, has been developedto prepare PEFC electrodes directly on a gas diffusion layer �GDL�support.7-9 MOs are compounds in which the atom of a metallicelement is bound to one or more carbon atoms of an organic hydro-carbon group. Most of the elements used in MOCVD are from theIIa, IIb, IIIb, IVb, Vb, and VIb groups.
In an MOCVD process, thin films or nanoparticles are formed ona surface from the thermal decomposition of the gaseous precursormolecules. The total pressure used in the gas phase is generally alow pressure, in the range of a few Torrs.
Precursors for MOCVD should, in general, have an evaporationrate that is high enough, stable, and constant in time. The precursormolecule should be chemically and thermally stable during thetransport through the gas phase to the surface. The precursor shouldbe
1. Relatively easy to synthesize.2. Not be dangerous and should not produce dangerous products.3. Must be soluble and stable in a suitable solvent without for-
mation of precipitates �in a droplet-derived deposition process�.
ECS license or copyright; see http://www.ecsdl.org/terms_use.jsp

B944 Journal of The Electrochemical Society, 157 �6� B943-B951 �2010�B944
D
Classical MOCVD processes are based on the evaporation ofsolid MO precursors and meet the problem of irreproducibility ofvapor generation and transport, thus making the growth process andconsequently the film properties less reproducible. Due to these rea-sons, new liquid delivery systems have been introduced a few yearsago to overcome the problem of thermal stability of some complexessuch as the pulsed liquid injection metallorganic chemical vapordeposition �PLI-MOCVD� process or the direct liquid injection met-allorganic chemical vapor deposition �DLI-MOCVD� process.10-12
The main advantages of these liquid delivery systems are:
1. A single precursor mixture can be used for multi componentsystems.
2. Very high growth rates can be obtained.3. Precursors �solid or liquid� can be kept at low temperature
and atmospheric pressure.4. Only small amounts of materials �a few microliters� are
volatilized.
The evaporation of precursors with low vapor pressure even un-der atmospheric pressure is possible. In PLI-MOCVD, the solutionis injected directly by a microvalve. The injector injects microdoses�a few microliters� of an organic solution containing a dissolvedmixture or a pure MO liquid precursor. After flash evaporation, theresulting vapor mixture is transported by gas toward the heated sub-strate. The frequency, the opening time, and the solution concentra-tion are the main parameters controlling the growth rate. To date, onthe basis of this liquid delivery system, high quality noble metalnanoparticles or oxide films have been obtained in our institute.13
This method is very versatile and is thus suitable for in situ deposi-tion of thin films or complex systems such as metal/oxide compos-ites, carbon nanotube, nanoparticles, and multilayers.
In this paper, we discuss the structural and electrochemical prop-erties of model PtxCoy PEFC cathodes made using the DLI-MOCVD process depositing on a carbon support Pt and Co at thesame time. Results are reported for cathodes operated under differ-ent operating conditions and operating times. This compliments ourmodeling work on PtxCoy-based nanoparticles already published inRef. 1 and 14.
The paper is organized as follows. First, we present the experi-mental preparation of the cathodes and characterization setups. Sec-ond, we discuss the characterization results regarding the activityand stability properties according to the PtxCoy nanostructure, inconnection with our previously published modeling results. Finally,we conclude and indicate further directions in our research.
Experimental
Preparation of the PtxCoy electrocatalysts.— PtxCoy electro-catalysts were prepared using the DLI-MOCVD method developedat CEA. For the deposition of the bimetallic electrocatalysts in thereactor, dimethyl�1,5-cyclooctadiene� platinum�II� �PtII�Me2,cod�,Strem� and cobalt�III� acetylacetonate �CoIII�acac�3, Strem� wereused as precursors. All precursors are soluble in toluene �Aldrich�for the used concentrations ��0.03 M�. Simultaneous liquid injec-tion was done to obtain bulk-truncated or incomplete PtxCoy alloys.The PtxCoy ratio is controlled by the precursor concentration. Theprecursor solutions were pushed by nitrogen. The solvent was thenevaporated and cracked by thermal effect and oxidative atmosphere�O2 80%, N2 20%�. Both precursors were also decomposed by thetemperature and gas pressure inside the reactor �Fig. 1�. PtxCoy elec-trocatalysts were formed at 350°C on a GDL �ELAT LT1400W,E-Tek BASF� playing the role of microporous carbon catalyst
ownloaded 02 Aug 2010 to 132.168.157.102. Redistribution subject to
support.d No ionomer impregnation was applied after the catalystelaboration to avoid ionomer poisoning effects on the catalysts’ elec-trochemical behavior during the experimental tests.
Structural and chemical characterization methods.— The metalloadings in the fresh samples were measured by inductively coupledplasma atomic emission spectroscopy �ICPAES�. The morphologyand the particle size distribution were observed by electron micros-copy �transmission electron microscopy �TEM� and field-emissiongun scanning electron microscopy �FEGSEM��. Observations of theGDL support surface after deposition were performed using a LEO1530 FEGSEM coupled with an energy-dispersive X-ray spectrom-etry �EDXS� analysis. TEM images and EDXS analyses were alsorealized using a JEOL 2000 FX microscope. The particle structureswere observed by high resolution transmission electron microscopy�HRTEM� using a JEOL 4000 EX microscope. The X-ray diffraction�XRD� patterns were obtained from a Bruker D5000 diffractometer.The surface of the nanoparticles was characterized by X-ray photo-electron spectroscopy �XPS�. The XPS device used in this studyconsisted of an SSI S-Probe spectrometer equipped with a mono-chromatized Al K� source. The pass energy was chosen to be 50eV while the energy resolution was kept at 850 meV.
Chemical leaching was carried out �24 h, H2SO4 0.5 M, 50°C�on the pure Pt catalyst and on the three PtxCoy catalysts to distin-guish the dissolution induced by the acidic media from the oneinduced by the potential cycling. Then, platinum and cobalt werealso dosed by ICPAES.
Electrochemical characterization methods.— Our materials werecharacterized by two electrochemical methods. Rotating disk elec-trode �RDE� experiments were used first because of their easyimplementation and because they allowed us to characterize thecatalysts in the most severe conditions of stability. Half-cell experi-ments were used for fine testing the most interesting materials underconditions closer to the fuel cell environment. Both RDE experi-ments and half-cell experiments were carried out directly on gas
d The DLI-MOCVD reactor is a tool dedicated for preparing Pt–Co catalysts. In ourcatalysts preparation, we have implemented precursors with high purity level�99.9%� and high quality solvents typically used in microelectronics. Based on ICPcharacterizations, we have not observed any presence of impurities on the freshcatalysts and on the GDL support.
Injector
Evaporator
Reactor
Vacuum
N2
O2 + N2
Tube containingliquid precursors
System of gasflow repartition
Substrate
Figure 1. Schematic diagram of the DLI-MOCVD process reactor.
ECS license or copyright; see http://www.ecsdl.org/terms_use.jsp

B945Journal of The Electrochemical Society, 157 �6� B943-B951 �2010� B945
D
diffusion electrodes �GDEs� �GDE = GDL + catalysts deposit�. Allthe electrochemical experiments were carried out at room tempera-ture in a 0.5 M H2SO4 electrolyte.Ex situ characterizations: RDE performance experiments.— Thecell used for the RDE experiments is constituted by a classical three-electrode system with a working electrode consisting of a glassycarbon disk �Sigradur Grade G� supporting our substrate. Thecounter electrode is a reversible hydrogen electrode �RHE�. Beforethe tests, 1 �L of ethanol was put on the GDE and rinsed withdeionized water. The electrochemical three-electrode cell was con-nected to a digital potentiostat �Autolab PGSTAT30�, with an RHEas a reference electrode.
The linear sweep voltamperometry was used to allow the deter-mination of the “electroactive catalyst surface area” �ECSA� �or atleast, the H+ adsorption properties on the catalysts� �under nitrogenbubbling� and to quantify the properties of our catalysts regardingthe ORR �under oxygen bubbling�. The effective electroactivity ofthe PtxCoy regarding ORR was determined from voltammetry ex-periments �2 mV s−1� between 1 and 0.4 VRHE. Before each vol-tammetry, the electrode was kept for 1 min at a potential of 1 VRHEto ensure a reproducible electrocatalytic surface state. During all theexperiments, the N2 or O2 concentration was kept constant at itssaturation value by permanent gas bubbling. The RDE angular rota-tion rate � was varied in the 200–900 rpm range. Levich approach isused to calculate the current limited by the convective transport�voltammetry sigmoidal wave height or Levich current�
IL��� = 0.620 � n � F � Ag � D2/3 � v−1/6 � C0 � �−1/2
= B � C0 � �−1/2 �1�
where n is the number of electrons transferred in the ORR, F is theFaraday constant, Ag the is the geometric area of the RDE, D is theO2 diffusion coefficient, v is the kinematic viscosity of the electro-lyte, C0 is the O2 concentration in solution at the bulk level justoutside the nanoscopic diffusion layer developed on the catalystnanoparticle surface �see our atomistic-based nanoscale model inRef. 1, 14, and 15�, and B is the Levich coefficient. The electrodesteady-state current j�E,�� �A m−2 geometric� at a given electrodepotential E and angular rotation rate � is given by the followingequation
1
j�E,��=
1
jk+
1
jL���=
1
jk+
1
nB�1/2 �2�
where jk is the cathodic activation current density at a potential Eand jL��� is the transport-limited current density in the voltammo-gram �A m−2 geometric� derived from Eq. 1.
The RDE voltammogram results presented in this paper displaycurrent densities corrected � jcorrected� by the diffusion in solutionusing the classical Levich method �for high ORR Butler–Volmeroverpotentials, i.e., for E � 0.8 VRHE�
jcorrected =jL��� � j�E,��jL��� − j�E,��
�3�
Ex situ characterizations: RDE aging test.— Our RDE aging test isanalogous to Colón–Mercado and Popov’s accelerated durabilitytest16 where they used a three-electrode system with a Hg/Hg2SO4electrode as the reference electrode. Our aging experiments were
Table I. Compositions of the prepared PtxCoy model electrodes.
Pt ICPAES loadings��g/cm2�
Co ICPAES loadings��g/cm2�
Pt 61 0Pt3Co 79 9.3PtCo 68 17PtCo 29 42
3ownloaded 02 Aug 2010 to 132.168.157.102. Redistribution subject to
carried out at I = 0 A �open circuit� for 7 days �160 h� at 60°C inH2SO4/0.5 M saturated O2 electrolyte and using a saturated calomelelectrode as a reference electrode connected to an EGG Par 273digital potentiostat. The same electrochemical characterizations asdescribed above were done before and after aging.In situ characterizations: half cell performance experiments.— AGDE �14 mm diameter disk� and a Nafion NRE 212 CS membrane�DuPont� were directly bonded together by a hot-pressing process�10 MPa at 150°C for 2 min and 30 s�. The obtained membraneelectrode assembly �MEA� was inserted in the sample holder withthe GDL facing up17 �Fig. 2�. The membrane is then in contact withthe liquid electrolyte �0.50 cm2� while the same surface area of theGDL is fed with the reactive gas. A gold grid provides the electricalcontacts and a polytetrafluoroethylene �PTFE� gasket set on themembrane side ensured the tightness of the device.
A three-electrode, two-compartment setup containing 40 mL ofH2SO4 solution with continuous nitrogen bubbling was used. Aplatinum mesh was used as a counter electrode, and the referenceelectrode was in mercury sulfate �mercury sulfate electrodeHg/Hg2SO4/0.5 M H2SO4 radiometer�. Electrochemical experi-ments were conducted with a digital Bio-logic VMP2 potentiostat.Polarization curves were captured following this test scheme: Whilethe oxygen flow was set at 2 nL h−1, six voltammetry cycles from0.05 to 1.15 VRHE at 20 mV s−1 and one voltammetry cycle at5 mV s−1 were performed.
Results and Discussion
Microstructural characterization results on fresh electrodes andaged electrodes.— Atomic Pt/Co volumetric ratios were calculatedfrom ICPAES measurements and compared to EDXS results �TableI�. Our DLI-MOCVD process allowed us to obtain very low metalloadings ��100 �g/cm2�, making possible materials economiesand decreasing cost for possible technology commercialization.Microstructural characterizations.— Figure 3 shows the FEGSEMimages of the four fresh materials prepared by DLI-MOCVD.Atomic ratios were estimated by EDXS. On the pure Pt electrode,
CE(platinum)
REF(MSE)
W(GDE)
N2
bubbling
Gas inlet
Gas outlet
Sample
Figure 2. Representation of the three-electrode device for GDE testing �half-cell�.
Pt/Co ratio calculated from ICPAES values EDXS �PtL�1/CoK�1�
100/072/28 76/2455/45 61/3917/83 23/77
ECS license or copyright; see http://www.ecsdl.org/terms_use.jsp

B946 Journal of The Electrochemical Society, 157 �6� B943-B951 �2010�B946
D
nanoparticles are well-defined and the carbon support is still visiblebetween them. When cobalt is added to platinum, depending on thePt/Co ratio, the aspect is closer to pure platinum or to pure cobalt,the later growing with a “cauliflower” aspect, probably due to cobaltoxide.
Figure 4 reports the coupled microtome EDXS analysis of the Ptand Co contents inside the GDL. The deposit is present only in thefirst 5 �m in the GDL thickness with a nonhomogeneous distribu-tion. There is a “crust” at the GDL surface level with a compositionclose to the expected atomic Pt–Co ratio. However, in depth, the Ptloading appears to be higher.
Figure 3. FEGSEM images of the four PtxCoy materials prepared by DLI-MOCVD.
ownloaded 02 Aug 2010 to 132.168.157.102. Redistribution subject to
HRTEM images of Pt3Co �Fig. 5a� show particle size of around7–10 nm. The nanoparticles do not have any specific shape. Further-more, an amorphous oxide layer seems to be present on the nano-particles �Fig. 5b�.
Figure 6 presents the morphology change after the electrochemi-cal aging described in the Electrochemical operation and postagingresults section. Before aging, the catalyst particles present a homo-geneous distribution. After degradation, the electrode appears to bemore porous �higher roughness at the GDL surface�, in agreementwith our modeling results in Ref. 1 and 14 where the Pt dissolutionrate is predicted to be considerably lower than the Co dissolutionrate when the two materials coexist at the catalyst �the Pt dissolutionrate increases as the Co content at the particle level decreases� andthe homogeneous catalyst become more and more like a skeleton-structured particle �the transition element dissolves leaving “holes”in a Pt matrix, like a “French emmental cheese”�.
XRD structure characterization of the fresh materials.— XRDcharacterizations provide information about the catalyst crystallo-graphic structure. The diffractograms of all the fresh materials arepresented in Fig. 7. The first narrow peak corresponds to the PTFEand the second peak to graphitic carbon, both materials constitutesthe GDL. Pure Pt, Pt3Co, and PtCo diffractograms show the mainpeaks of the face-centered cubic �fcc� Pt structure. The diffracto-gram of Pt3Co also shows a slight shift to higher angles indicatingCo insertion inside the Pt crystal lattice. The cobalt atomic fractionalloyed with platinum is calculated from Vegard’s law for latticeparameters between a pure fcc platinum and a pure hexagonal close-packed �hcp� cobalt
xsampleCo = � asample − aPt,fcc
aCo,hcp�2 − aPt,fcc
� �4�
Where asample, aPt,fcc, and aCo,hcp are the lattice parameters of thesample �3.893 nm�, the pure fcc platinum �3.923 nm�, and the purehcp cobalt �2.506 nm�. We find that only about 8% of cobalt is
Figure 4. �Color online� ��a�, �b�, and �c��EDXS results on fresh Pt3Co catalystspresented with their associated TEM im-ages. The spectrum �d� corresponds to theimage �b�. The Cu element appears be-cause of the TEM grid.
ECS license or copyright; see http://www.ecsdl.org/terms_use.jsp
B947Journal of The Electrochemical Society, 157 �6� B943-B951 �2010� B947
D
alloyed with platinum in the fresh Pt3Co sample. The result is analo-gous for the fresh PtCo sample. The diffractogram of fresh PtCo3does not show the same main peaks. The peaks of the platinumpattern are lost within the GDL background signals.
These characterization results provide a signature of homoge-neous composition �bulk truncated or incomplete alloy� inside thesecatalysts.1,14
Figure 5. HRTEM images of Pt3Co nanoparticles elaborated by DLI-MOCVD on a GDL support.
Figure 6. FEGSEM images of the Pt3Co material elaborated by DLI-MOCVD before and after aging.
Figure 7. �Color online� XRD spectra of the PtxCoy materials deposited onthe GDL by DLI-MOCVD.
a b
ownloaded 02 Aug 2010 to 132.168.157.102. Redistribution subject to
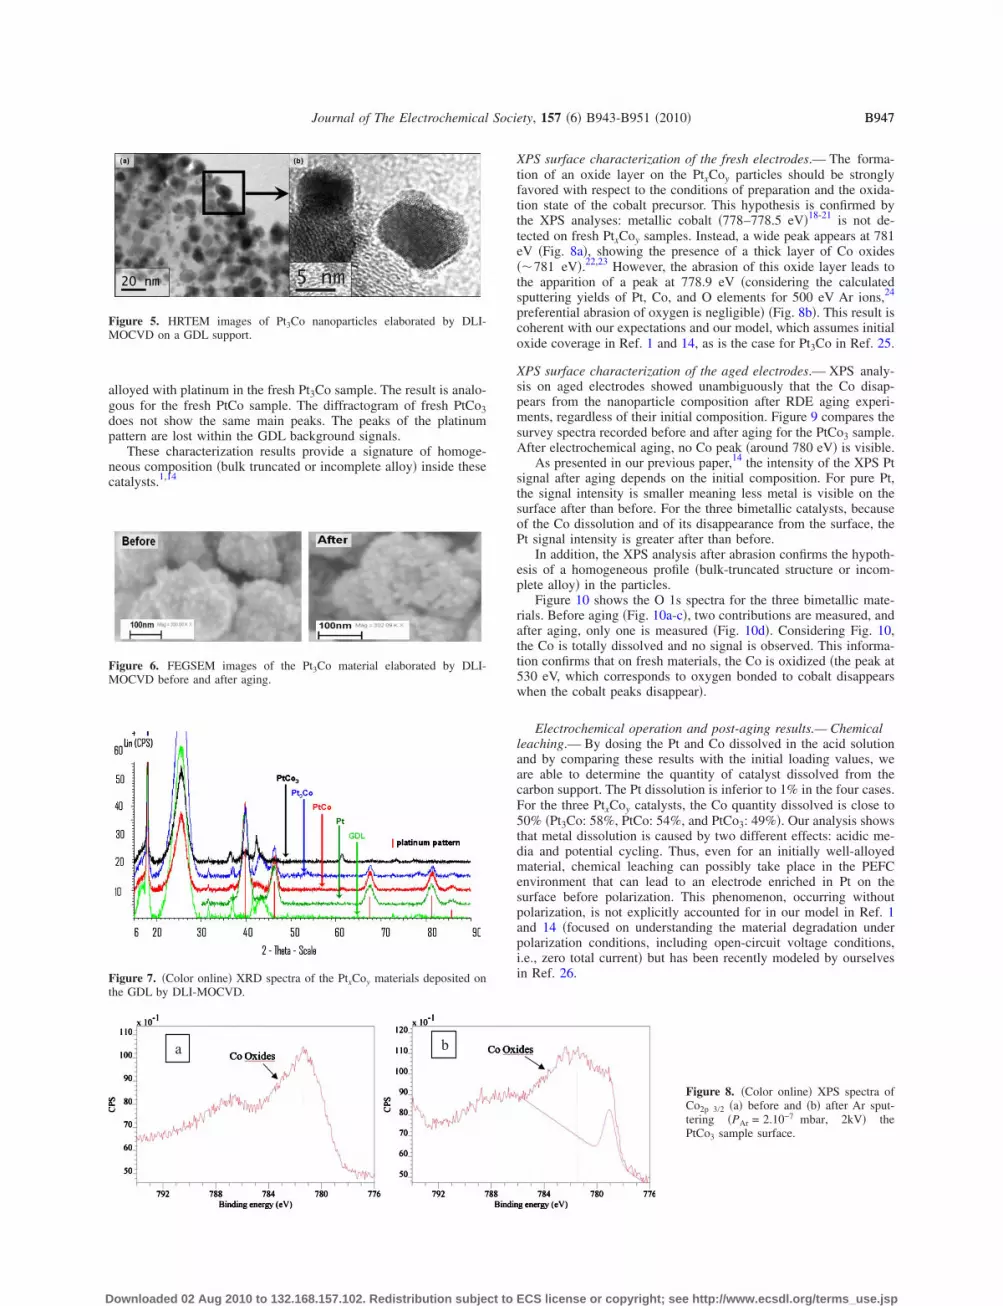
XPS surface characterization of the fresh electrodes.— The forma-tion of an oxide layer on the PtxCoy particles should be stronglyfavored with respect to the conditions of preparation and the oxida-tion state of the cobalt precursor. This hypothesis is confirmed bythe XPS analyses: metallic cobalt �778–778.5 eV�18-21 is not de-tected on fresh PtxCoy samples. Instead, a wide peak appears at 781eV �Fig. 8a�, showing the presence of a thick layer of Co oxides��781 eV�.22,23 However, the abrasion of this oxide layer leads tothe apparition of a peak at 778.9 eV �considering the calculatedsputtering yields of Pt, Co, and O elements for 500 eV Ar ions,24
preferential abrasion of oxygen is negligible� �Fig. 8b�. This result iscoherent with our expectations and our model, which assumes initialoxide coverage in Ref. 1 and 14, as is the case for Pt3Co in Ref. 25.
XPS surface characterization of the aged electrodes.— XPS analy-sis on aged electrodes showed unambiguously that the Co disap-pears from the nanoparticle composition after RDE aging experi-ments, regardless of their initial composition. Figure 9 compares thesurvey spectra recorded before and after aging for the PtCo3 sample.After electrochemical aging, no Co peak �around 780 eV� is visible.
As presented in our previous paper,14 the intensity of the XPS Ptsignal after aging depends on the initial composition. For pure Pt,the signal intensity is smaller meaning less metal is visible on thesurface after than before. For the three bimetallic catalysts, becauseof the Co dissolution and of its disappearance from the surface, thePt signal intensity is greater after than before.
In addition, the XPS analysis after abrasion confirms the hypoth-esis of a homogeneous profile �bulk-truncated structure or incom-plete alloy� in the particles.
Figure 10 shows the O 1s spectra for the three bimetallic mate-rials. Before aging �Fig. 10a-c�, two contributions are measured, andafter aging, only one is measured �Fig. 10d�. Considering Fig. 10,the Co is totally dissolved and no signal is observed. This informa-tion confirms that on fresh materials, the Co is oxidized �the peak at530 eV, which corresponds to oxygen bonded to cobalt disappearswhen the cobalt peaks disappear�.
Electrochemical operation and post-aging results.— Chemicalleaching.— By dosing the Pt and Co dissolved in the acid solutionand by comparing these results with the initial loading values, weare able to determine the quantity of catalyst dissolved from thecarbon support. The Pt dissolution is inferior to 1% in the four cases.For the three PtxCoy catalysts, the Co quantity dissolved is close to50% �Pt3Co: 58%, PtCo: 54%, and PtCo3: 49%�. Our analysis showsthat metal dissolution is caused by two different effects: acidic me-dia and potential cycling. Thus, even for an initially well-alloyedmaterial, chemical leaching can possibly take place in the PEFCenvironment that can lead to an electrode enriched in Pt on thesurface before polarization. This phenomenon, occurring withoutpolarization, is not explicitly accounted for in our model in Ref. 1and 14 �focused on understanding the material degradation underpolarization conditions, including open-circuit voltage conditions,i.e., zero total current� but has been recently modeled by ourselvesin Ref. 26.
Figure 8. �Color online� XPS spectra ofCo2p 3/2 �a� before and �b� after Ar sput-tering �PAr = 2.10−7 mbar, 2kV� thePtCo3 sample surface.
ECS license or copyright; see http://www.ecsdl.org/terms_use.jsp

B948 Journal of The Electrochemical Society, 157 �6� B943-B951 �2010�B948
D
Ex situ characterizations: RDE performance experiments.— Figure11 shows cyclic voltamperograms at the beginning of life �BoL� andafter the aging of the four tested electrocatalysts. At the BoL, thesePtxCoy materials exhibit very different effective ECSA lower to thepure Pt catalyst �Fig. 12a�.
The ECSA were calculated by measuring the peak area in thevoltammograms and using the following equation
ECSAHupd =QH
qR=
AH/�qR
�5�
where AH is the hydrogen peak desorption area �C V s−1�, � is thescan rate �mV s−1�, and qR is the adsorption charge per cm2 ofplatinum on a smooth Pt electrode �assumed to be 210 �C/cm2 fora hydrogen monolayer on Pt�111�27-29�.
We emphasize that this methodology to determine the ECSAbased on Eq. 5 only provides a relative comparison of the materials.
Figure 9. �Color online� XPS survey spectra of the PtCo3 sample, before�green� and after �red� aging.
ownloaded 02 Aug 2010 to 132.168.157.102. Redistribution subject to
Rigorously speaking, the “210” value in Eq. 5, derived from an“on-top’ adsorption on Pt atoms is unjustified with the PtxCoy cata-lysts �H+ can adsorb simultaneously on-top and in bridge between Ptand Co atoms at the PtxCoy catalyst surface and, thus, in a differentway compared to pure Pt surfaces�. Detailed density functionaltheory �DFT� studies on adsorption properties of H+ on PtxMy sur-faces are ongoing in our group and are the subject of an ongoingpublication.30
In the zone of adsorption/desorption, some hydrogen was situ-ated between 0.05 and 0.4 VRHE, three different peaks appeared forall of the considered bimetallic electrodes. These peaks are repre-sentative of the adsorption of H+ on the �110�, �111�, and �100�crystallographic faces of the platinum and they are very marked�according to Paulus et al.,31 the insertion of a transition metal leadsto poor definition of these peaks�. This can indicate that the surfaceof the particles is Pt-rich.
Figure 12b presents the current densities regarding the ORR asfunction of the Pt loading for the four tested materials. The currentdensities provided by the different systems can be ranked asPt3Co � PtCo � Pt � PtCo3. We emphasize here that the pure Ptcatalyst does not provide the highest current, in contrast to what itcould be expected from the ECSA measurement in Fig. 12a. Thisclearly illustrates that Hupd is not an appropriate technique to evalu-ate the ECSA of the PtxCoy catalysts, as only accounts for H+ ad-sorption on Pt sites and as ORR elementary mechanisms on PtxCoyinvolve both Pt and Co sites.1,14
Ex situ characterizations: RDE aging test.— Figure 11 also showsthe four cyclic voltamperometries after electrochemical aging of theDLI-MOCVD electrodes at a high fixed potential �low current con-ditions� in the presence of O2. The highest current density loss ismeasured for the pure Pt catalyst �Fig. 13�, and Pt3Co results to bethe most stable material, in agreement with our modeling predictionsin Ref. 1 and 14. Pt3Co and PtCo GDE are both still better than purePt GDE after aging, in agreement with our model results for shortelectrode operation time1 �for longer times, �12 days, according toour model, the Pt3Co and PtCo performances could become lowerthan pure Pt�.
The PtCo3 electrocatalyst has the lowest current density amongthe four materials, and it shows the higher degradation of the three
Figure 10. �Color online� ��a�, �b�, and�c�� XPS oxygen 1s spectra for the threebimetallic electrocatalysts and �d� super-position of the spectra of the PtCo mate-rial before and after electrochemical ag-ing.
ECS license or copyright; see http://www.ecsdl.org/terms_use.jsp

(
B949Journal of The Electrochemical Society, 157 �6� B943-B951 �2010� B949
D
bimetallic materials, in agreement with our modeling predictions inRef. 1 where we demonstrated, on the basis of ab initio-based el-ementary kinetics, that the Co dissolution rate is higher �more ther-modynamically favorable in acidic media� than the Pt dissolutionrate and that the Co dissolution rate is higher for higher Co volumecontents. This explains why the stability decreases as the Co volumecontent increases �i.e., Pt3Co � PtCo � PtCo3, ranking built hereon the basis of the “current loss” signature�.In situ characterizations: half cell performance experiments.— Asin RDE experiments, cyclic voltammetry was used here to evaluatethe ECSA of the catalysts. In this case, the ECSA are calculatedfrom the hydrogen desorption peak area and from the carbon oxide�CO� stripping peak area. The voltammograms recorded in 0.5 MH2SO4 at 298 K and 20 mV s−1 scan rate after CO adsorption onpure Pt and illustrate the charges corresponding to desorption ofHupd �QH� and CO �QCO�. The CO stripping ECSA is calculatedfrom Eq. 5 with qR = 420 �C/cm2 representing the charges re-quired to oxidize a monolayer of CO on a Pt electrode.28,32 As forthe Hupd methodology, we emphasize that this method only providesa relative comparison of the materials. Detailed DFT studies on theadsorption properties of CO �for the three compositions of PtCo�surfaces are ongoing in our group and are the subject of a futurepublication.30,33
From the calculated values reported in Table II, one can note thequite good agreement of the results obtained by the two methods. Italso appears that the values of the roughness factor Scat/Sgeo�cm2 Pt/cm2� are very low compared to typical values reported onMEAs �200–300 cm2 Pt/cm2�.34 However, the Pt specific surfacearea APt �m2/gPt� is of the same order of magnitude such as MEAs,typically 50–80 m2/gPt.34
Pt
PtCoPt3Co
PtCo3
0
2000
4000
6000
8000
10000
12000
0 20 40 60 80 100Platinum loading (µg/cm²)
ECSA
(µC.cm²)
0
2
4
6
8
10
12
0 20Pla
J(mA/cm² géo)
a) (b)
ownloaded 02 Aug 2010 to 132.168.157.102. Redistribution subject to
The relatively high Pt ECSA suggests that the catalyst layer isvery thin �in agreement with the microtome analysis discussed in theMicrostructural characterization results on fresh electrodes and agedelectrodes section� and that a great part of the particles are electro-chemically active.
Cyclic voltammetry experiments under O2 were performed oneach sample, prepared and tested in the same conditions to facilitatea direct comparison of the performance of the various catalysts.
Electrochemical impedance spectroscopy �EIS� measurementswere also performed on the samples at four current densities: 0.1, 2,10, and 20 mA cm−2, applying a 0.2 mA cm−2 amplitude sinussignal from 10 kHz to 0.2 Hz. Oxygen reduction current curves arepresented in Fig. 14. The potentials are corrected for the ohmic losswith the values of the electrolyte resistance, R� �cf. Fig. 16� previ-ously determined by EIS measurements. A semilogarithmic repre-sentation �Tafel plot� is given in Fig. 15 showing that the linearevolution of the potential is the same for the three bimetallic cata-lysts. The slopes are close to 130 mV dec−1 whereas it comes nearto 120 mV dec−1 for pure Pt.35
The reduction current of the different catalysts at 0.9 VRHE aregiven in Table III. Oxygen reduction current corrected with the Ptloading shows similar values for the three PtCo catalysts. Thesevalues are closely twice more than for the pure Pt catalyst, showingthe improvement on the ORR activity induced by the presence ofCo, as already demonstrated with our model.1,14 Evolutions of thetransfer resistance for oxygen reduction vs current density, deter-mined by impedance spectroscopy, are given in Fig. 16.
From these figures, it can be concluded that the best perfor-mances are given by the highest Pt-loaded bimetallic samples, inagreement with our modeled polarization curves in Ref. 1 and 14.
Figure 11. �Color online� Cyclic volta-mperograms for the four materials elabo-rated by DLI-MOCVD, before and afteraging at a potential of 0.85 VRHE during160 h. Nitrogen bubbling, H2SO4 0.5 M,100 mV/s, 900 rpm.
Pt
PtCo
Pt3Co
o3
0 60 80 100loading (µg/cm²)
Figure 12. �a� ECSA and �b� current den-sity measured at a potential of 0.85 VRHEplotted as function of Pt loadings for thefour prepared materials.
PtC4tinum
ECS license or copyright; see http://www.ecsdl.org/terms_use.jsp

B950 Journal of The Electrochemical Society, 157 �6� B943-B951 �2010�B950
D
Compared to these catalysts, pure Pt shows a 30–40 mV shift to-ward the anodic potential. Then, the low Pt loaded bimetallic samplecurve is still further shifted of approximately 40 mV. The followingactivity rank can be built, in excellent agreement with our previ-ously published modeling results: PtCo � Pt3Co � Pt � PtCo3.According to our model, the surface accumulation of HO2 species ishigher for PtCo3 compared to Pt3Co because of the higher Co sur-face composition; thus, PtCo3 has a lower overall ORR activity. Thenumber of possible surface transfers of ad-oxygenated species fromPt to Co is maximum at a surface composition of 50–50%, and thisexplains why homogeneous PtCo offers better ORR activity.1
Table II. ECSA and platinum surface area of the prepared cata-lysts calculated by hydrogen adsorption (Hupd) and CO strip-ping voltammograms.
Catalyst
ECAHupd ECACO
Scat/Sgeo
�cmPt2 /cm2�
APt�m2/gPt�
Scat/Sgeo
�cmPt2 /cm2�
APt�m2/gPt�
Pt 20 29 23 34Pt3Co 28 40 29 43PtCo 25 37 27 40PtCo3 15 22 16 24
0
2
4
6
8
10
12
Pt : 61µgPt/cm²
Pt3Co : 79µgPt/cm²
PtCo : 68µgPt/cm²
PtCo3 : 29µgPt/cm²
J(mA/cm² geo)
Fresh
Aged
- 47 %
- 30 %
- 34 %
- 42 %
Figure 13. �Color online� Experimental aging results �using Levich equa-tion� for PtxCoy and elaborated by DLI-MOCVD and aged at 0 A during 160h. The current densities presented here were measured at a potential of0.85 VRHE.
-300
-250
-200
-150
-100
-50
00.4 0.5 0.6 0.7 0.8 0.9 1 1.1
EiRcorr / V/ENH
j/mA.cm
-2
Pt 61µg/cm²
PtCo 79-9µg/cm²
PtCo 68-17µg/cm²
PtCo 29-42µg/cm²
Figure 14. �Color online� iR-corrected voltammograms �0.5 M H2SO4,25°C, sweep rate of 20 mV s−1�. Oxygen reduction current density vs ap-plied potential.
ownloaded 02 Aug 2010 to 132.168.157.102. Redistribution subject to
Conclusions
In this paper, we report the experimental results on the prepara-tion and the electrochemical characterization of PtxCoy electrocata-lytic particles with homogeneous composition, which we previouslymodeled in Ref. 1 and 14. We demonstrate that DLI-MOCVD elabo-rated PtxCoy catalysts supported on a GDL substrate are interestingmodel systems to understand the electroactivity and stability prop-erties of PtxCoy bulk-truncated or incomplete alloy structures. Elec-trochemical analysis of the samples has been carried out by usingRDE and half-cell experiments. Fresh catalysts and structuralchanges were characterized by using TEM, XRD, and XPS. An op-timal Co composition is identified for better ORR activity and cata-lyst durability, validating our previously published multiscale modelresults with kinetic parameters fully obtained by using ab initio DFTdata.
Table III. Reduction current of the different catalysts at0.9 VRHE.
Pt Pt3Co PtCo PtCo3
Jgeo at 0.9 V��A/cm2� 418 1057 1057 360Jm at 0.9 V�A/gPt� 6.8 13.4 15.5 12.4JS at 0.9 V��A/cmPt
2 � 19 37 41 23
0.7
0.75
0.8
0.85
0.9
0.95
1
1.05
1.1
0.001 0.01 0.1 1 10j / mA.cm-2
E iRcorr/V/ENH
Pt 61µg/cm²PtCo 79-9µg/cm²PtCo 68-17µg/cm²PtCo 29-42µg/cm²
b = -130mV.dec-1
b = -120mV.dec-1
Figure 15. �Color online� Semilogarithmic representation �Tafel plot� of theiR-corrected oxygen reduction current.
1
10
100
1000
0 5 10 15 20 25
Current Density / mA.cm-2
Rtc/ohm.cm²
Pt 61µg.cm-2
PtCo 79-9µg.cm-2
PtCo 68-17µg.cm-2
PtCo 29-42µg.cm-2
Figure 16. �Color online� Evolution of the transfer resistance for oxygenreduction obtained by impedance spectroscopy vs current density.
ECS license or copyright; see http://www.ecsdl.org/terms_use.jsp

B951Journal of The Electrochemical Society, 157 �6� B943-B951 �2010� B951
D
These results provide a first indication on the performance anddurability of catalysts elaborated by DLI-MOCVD in conditionsclose to a PEFC cathode. Even if we noted degradation of the PtxCoyunder the RDE aging experiments, the Co element apparently slowsdown the mobility of the Pt on the carbon support, therefore de-creasing the electrochemical ripening phenomena.1 Furthermore, thedegree of graphitization of the GDL support possibly plays a role onthe activity and stability properties of the prepared catalysts, and thiswill be the focus of further studies in our group.
Moreover, DLI-MOCVD method can reveal an interesting cata-lyst preparation technique to achieve ultralow catalyst loadings forPEFC cathodes. To prepare electrochemically stable PtxCoy cata-lysts, this technique could be combined with thermal annealing �T� 400°C� but other carbon supports than GDLs �not thermicallystable at T � 400°C� should be used. More generally, the prepara-tion of model electrodes and a combined experimentalelectrochemistry/modeling approach provide interesting insights onthe understanding of the PtxCoy electrocatalyst nanostructure impacton their activity and stability properties. Within this context, in anincoming paper36 we are reporting the preparation of particles with ananostructure similar to the Monte Carlo-based one modeled in Ref.1.
Acknowledgments
This work was funded by the ANR PAN-H �French NationalResearch Agency� within the context of the OPTICAT project.
Commissariat à l’Energie Atomique et aux Energies Alternatives assistedin meeting the publication costs of this article.
References1. A. A. Franco, S. Passot, C. Anglade, E. Billy, L. Guetaz, N. Guillet, E. De Vito, P.
Fugier, and S. Mailley, J. Electrochem. Soc., 156, B410 �2009�.2. L. Xiong and A. Manthiram, J. Electrochem. Soc., 152, A697 �2005�.3. P. Yu, M. Pemberton, and P. Plasse, J. Power Sources, 144, 11 �2005�.4. S. Koh, C. Yu, P. Ma, I. R. Srivastava, and P. Strasser, J. Power Sources, 172, 50
�2007�.5. X. Li, H. R. Colón-Mercado, G. Wu, J.-W. Lee, and B. N. Popov, Electrochem.
Solid-State Lett., 10, B201 �2007�.6. S. C. Zignani, E. Antolini, and E. R. Gonzalez, J. Power Sources, 182, 83 �2008�.7. S. Thollon, F. Sanchette, S. Valange, E. Guelou, J. Barrault, and H. Guillon, WO
Pat. 2002/070130 �2002�.
ownloaded 02 Aug 2010 to 132.168.157.102. Redistribution subject to
8. S. Mailley, P. Capron, S. Thollon, and T. Krebs, WO Pat. WO 2007/088292 A1�2007�.
9. S. Mailley, F. Sanchette, S. Thollon, and F. Emieux, WO Pat. 2007/088291 �2007�.10. J. P. Sénateur, R. Madar, F. Weiss, O. Thomas, and A. Abrutis, French Pat. 93/
08838 �1993� and extended: European Pat. FR94/0000858 �1994�.11. F. Felten, J. P. Senateur, F. Weiss, R. Madar, and A. Abrutis, J. Phys. IV, C5, 1079
�1995�.12. J. P. Senateur, F. Felten, S. Pignard, F. Weiss, A. Abrutis, V. Bigelyte, A. Teiserskis,
Z. Saltyte, and B. Vengalis, J. Alloys Compd., 251, 288 �1997�.13. S. Thollon, F. Sanchette, and J. Barrault, Abstract 87, The Electrochemical Society
Meeting Abstracts, Vol. 501, Quebec City, Canada, May 15–20, 2005.14. A. A. Franco, S. Passot, C. Anglade, E. Billy, L. Guetaz, N. Guillet, E. De Vito, P.
Fugier, and S. Mailley, ECS Trans., 13�17�, 29 �2008�.15. A. A. Franco, P. Schott, C. Jallut, and B. Maschke, J. Electrochem. Soc., 153,
A1053 �2006�.16. H. R. Colón-Mercado and B. N. Popov, J. Power Sources, 155, 253 �2006�.17. N. Guillet, L. Roué, S. Marcotte, D. Villers, J. P. Dodelet, N. Chhim, and S. Tré
Vin, J. Appl. Electrochem., 36, 863 �2006�.18. N. S. McIntyre and M. G. Cook, Anal. Chem., 47, 2208 �1975�.19. I. Alstrup, I. Chorkendorff, R. Candia, B. S. Clausen, and H. Topsøe, J. Catal., 77,
397 �1982�.20. S. L. T. Andersson and R. F. Howe, J. Phys. Chem., 93, 4913 �1989�.21. A. B. Mandale, S. Badrinarayanan, S. K. Date, and A. P. B. Sinha, J. Electron
Spectrosc. Relat. Phenom., 33, 61 �1984�.22. M. Oku and K. Hirokawa, J. Electron Spectrosc. Relat. Phenom., 8, 475 �1976�.23. B. J. Tan, K. J. Klabunde, and P. M. A. Sherwood, J. Am. Chem. Soc., 113, 855
�1991�.24. M. P. Seah, Thin Solid Films, 81, 279 �1981�.25. U. Bardi, B. C. Beard, and P. N. Ross, J. Catal., 124, 22 �1990�.26. A. A. Franco, Abstract 3016, The Electrochemical Society Meeting Abstracts, Vol.
902, Vienna, Austria, Oct 4–9, 2009.27. J. Wu, X. Z. Yuan, H. Wang, M. Blanco, J. J. Martin, and J. Zhang, Int. J. Hydro-
gen Energy, 33, 1735 �2008�.28. T. Vidakovic, M. Christov, and K. Sundmacher, Electrochim. Acta, 52, 5606
�2007�.29. A. Lasia, J. Electroanal. Chem., 562, 23 �2004�.30. R. Ferreira de Morais, D. Loffreda, P. Sautet, and A. A. Franco, ECS Trans.,
25�24�, 167 �2010�.31. U. A. Paulus, A. Wokaun, G. G. Scherer, T. J. Schmidt, V. Stamenkovic, N. M.
Markovic, and P. N. Ross, Electrochim. Acta, 47, 3787 �2002�.32. H. Gasteiger, N. Markovic, P. Ross, and E. Cairns, J. Phys. Chem., 98, 617 �1994�.33. S. K. Cheah, P. Gélin, O. Lemaire, and A. A. Franco, ECS Trans., 25�35�, 275
�2010�.34. H. A. Gasteiger, S. S. Kocha, B. Sompalli, and F. T. Wagner, Appl. Catal., B, 56,
9 �2005�.35. http://www.osti.gov/energycitations/servlets/purl/823267-aDW6iD/823267.PDF,
last accessed September 3, 2009.36. E. Quenel, P. Fugier, R. Bouchmila, A. A. Franco, E. Paulliac-Vaujour, L. Guetaz,
O. Sicardy, and V. Muffato, In preparation.
ECS license or copyright; see http://www.ecsdl.org/terms_use.jsp