psychopathy among prisoners in england and wales
TRANSCRIPT
International Journal of Law and Psychiatry 32 (2009) 134–141
Contents lists available at ScienceDirect
International Journal of Law and Psychiatry
Psychopathy among prisoners in England and Wales☆
Jeremy Coid a,⁎, Min Yang a, Simone Ullrich a, Amanda Roberts a, Paul Moran b, Paul Bebbington c,Traolach Brugha d, Rachel Jenkins e, Michael Farrell b, Glyn Lewis f, Nicola Singleton g, Robert Hare h
a Queen Mary University of London, UKb Institute of Psychiatry, London, UKc Royal Free and University College, UKd University of Leicester, UKe King's College London, UKf University of Bristol, UKg Drugs Analysis and Research Programme, London, UKh University of British Columbia, Canada
☆ Funding support: Department of Health, England an⁎ Corresponding author. Barts and the LondonMedical
of London, Forensic Psychiatry Research Unit, William HaClose, London EC1A 7BE, UK. Tel.: +44 20 7601 8138; fa
E-mail address: [email protected] (J. Coid).
0160-2527/$ – see front matter © 2009 Elsevier Ltd. Adoi:10.1016/j.ijlp.2009.02.008
a b s t r a c t
a r t i c l e i n f oKeywords:PsychopathyPrisonersEpidemiologySampling
Most research into psychopathy among prisoners is based on selected samples. It remains unclear whetherprevalences are lower among European populations. This study aimed to measure the prevalence ofpsychopathy, and the distribution and correlates of psychopathic traits in a representative national sample ofprisoners. Psychopathy was measured using the revised Psychopathy Checklist (PCL-R) in a second stage,cross-sectional survey of prisoners in England and Wales in 1997 (n=496). Poisson regression analysis wascarried out to examine independent associations between correlates and PCL-R total and factor scores. Theprevalence of categorically diagnosed psychopathy at a cut off of 30 was 7.7% (95%CI 5.2–10.9) in men and1.9% (95%CI 0.2–6.9) in women. Psychopathic traits were less prevalent among women. They were correlatedwith younger age, repeated imprisonment, detention in higher security, disciplinary infractions, antisocial,narcissistic, histrionic, and schizoid personality disorders, and substance misuse, but not neurotic disordersor schizophrenia. The study concluded that psychopathy and psychopathic traits are prevalent among maleprisoners in England and Wales but lower than in most previous studies using selected samples. However,most correlates with psychopathic traits were similar to other studies. Psychopathy identifies the extreme ofa spectrum of social and behavioral problems among prisoners.
© 2009 Elsevier Ltd. All rights reserved.
1. Introduction
Psychopathy is a personality disorder associated with multiplesocial and behavioral problems (Cornell et al., 1996; Hill, Neumann, &Rogers, 2004) and has an exceptionally poor prognosis among themental disorders (Andersen, Sestoft, Lillebaek, Mortensen, & Kramp,1999; Hare, 2003). Although not currently included as a separatediagnostic category in the ICD or DSM classifications, interest inpsychopathy has grown and its measurement has become increasinglyimportant in risk assessment. It is a rare condition affecting less than1% of the household population (Coid et al., 2009) but highlyprevalent among prisoners and associated with homelessness andpsychiatric hospitalization over the lifespan. However, there areremarkable differences in reported prevalence rates of psychopathy
d Wales.School, QueenMary Universityrvey House, 61 Bartholomew'sx: +44 20 7601 7969.
ll rights reserved.
among samples of prisoners in different countries within a range of 3%to 73%, (Assadi et al., 2006; Coid, 1998; Cooke, 1996; Hare, 2003;Moran, 1999; Ullrich, Paelecke, Kahle, & Marneros, 2003).
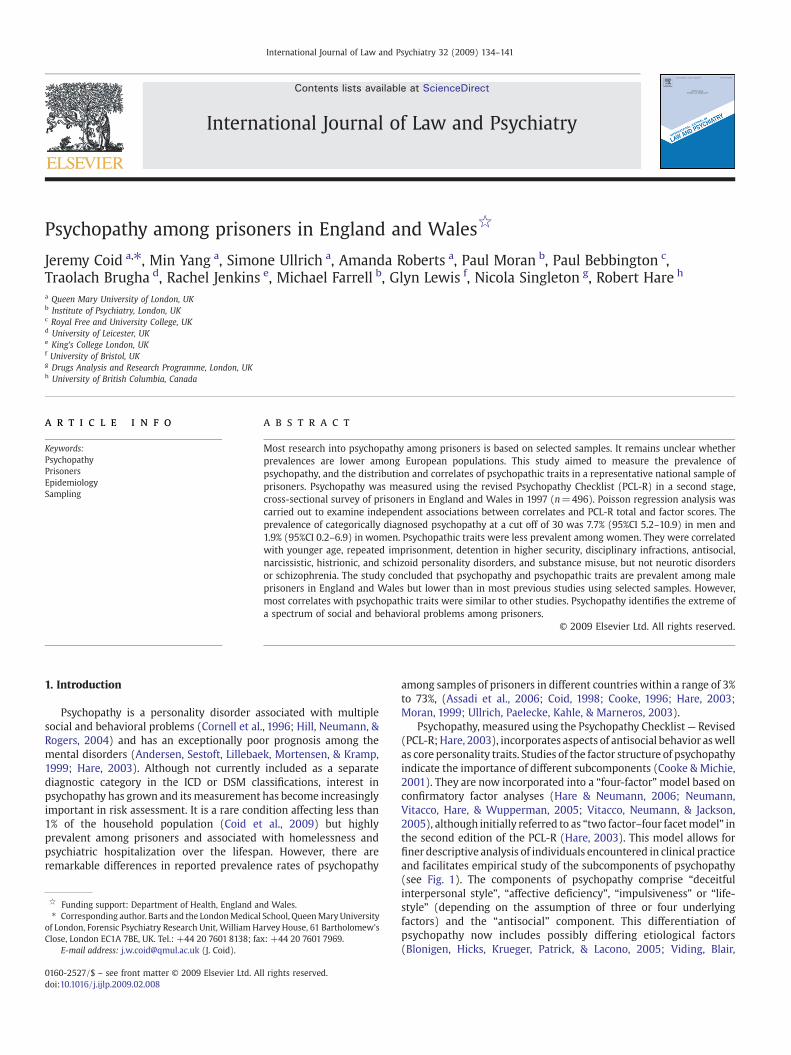
Psychopathy, measured using the Psychopathy Checklist— Revised(PCL-R;Hare, 2003), incorporates aspects of antisocial behavior aswellas core personality traits. Studies of the factor structure of psychopathyindicate the importance of different subcomponents (Cooke & Michie,2001). They are now incorporated into a “four-factor”model based onconfirmatory factor analyses (Hare & Neumann, 2006; Neumann,Vitacco, Hare, & Wupperman, 2005; Vitacco, Neumann, & Jackson,2005), although initially referred to as “two factor–four facetmodel” inthe second edition of the PCL-R (Hare, 2003). This model allows forfiner descriptive analysis of individuals encountered in clinical practiceand facilitates empirical study of the subcomponents of psychopathy(see Fig. 1). The components of psychopathy comprise “deceitfulinterpersonal style”, “affective deficiency”, “impulsiveness” or “life-style” (depending on the assumption of three or four underlyingfactors) and the “antisocial” component. This differentiation ofpsychopathy now includes possibly differing etiological factors(Blonigen, Hicks, Krueger, Patrick, & Lacono, 2005; Viding, Blair,
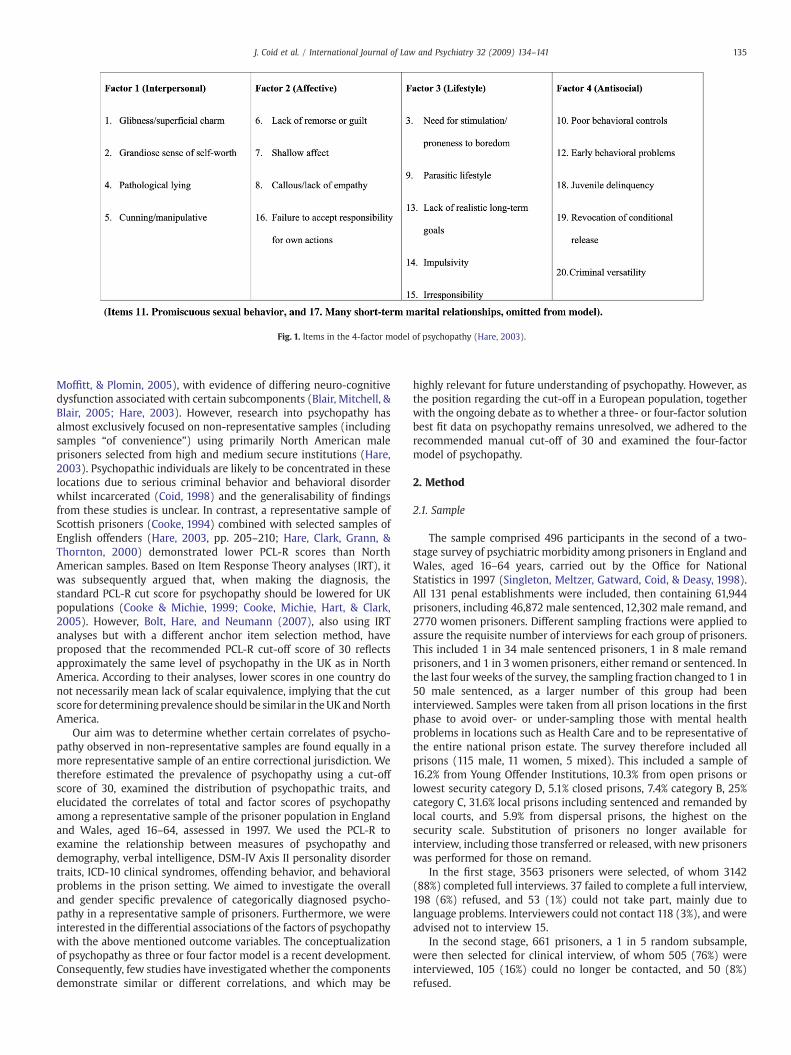
Fig. 1. Items in the 4-factor model of psychopathy (Hare, 2003).
135J. Coid et al. / International Journal of Law and Psychiatry 32 (2009) 134–141
Moffitt, & Plomin, 2005), with evidence of differing neuro-cognitivedysfunction associated with certain subcomponents (Blair, Mitchell, &Blair, 2005; Hare, 2003). However, research into psychopathy hasalmost exclusively focused on non-representative samples (includingsamples “of convenience”) using primarily North American maleprisoners selected from high and medium secure institutions (Hare,2003). Psychopathic individuals are likely to be concentrated in theselocations due to serious criminal behavior and behavioral disorderwhilst incarcerated (Coid, 1998) and the generalisability of findingsfrom these studies is unclear. In contrast, a representative sample ofScottish prisoners (Cooke, 1994) combined with selected samples ofEnglish offenders (Hare, 2003, pp. 205–210; Hare, Clark, Grann, &Thornton, 2000) demonstrated lower PCL-R scores than NorthAmerican samples. Based on Item Response Theory analyses (IRT), itwas subsequently argued that, when making the diagnosis, thestandard PCL-R cut score for psychopathy should be lowered for UKpopulations (Cooke & Michie, 1999; Cooke, Michie, Hart, & Clark,2005). However, Bolt, Hare, and Neumann (2007), also using IRTanalyses but with a different anchor item selection method, haveproposed that the recommended PCL-R cut-off score of 30 reflectsapproximately the same level of psychopathy in the UK as in NorthAmerica. According to their analyses, lower scores in one country donot necessarily mean lack of scalar equivalence, implying that the cutscore fordeterminingprevalence should be similar in theUKandNorthAmerica.
Our aim was to determine whether certain correlates of psycho-pathy observed in non-representative samples are found equally in amore representative sample of an entire correctional jurisdiction. Wetherefore estimated the prevalence of psychopathy using a cut-offscore of 30, examined the distribution of psychopathic traits, andelucidated the correlates of total and factor scores of psychopathyamong a representative sample of the prisoner population in Englandand Wales, aged 16–64, assessed in 1997. We used the PCL-R toexamine the relationship between measures of psychopathy anddemography, verbal intelligence, DSM-IV Axis II personality disordertraits, ICD-10 clinical syndromes, offending behavior, and behavioralproblems in the prison setting. We aimed to investigate the overalland gender specific prevalence of categorically diagnosed psycho-pathy in a representative sample of prisoners. Furthermore, we wereinterested in the differential associations of the factors of psychopathywith the above mentioned outcome variables. The conceptualizationof psychopathy as three or four factor model is a recent development.Consequently, few studies have investigated whether the componentsdemonstrate similar or different correlations, and which may be
highly relevant for future understanding of psychopathy. However, asthe position regarding the cut-off in a European population, togetherwith the ongoing debate as to whether a three- or four-factor solutionbest fit data on psychopathy remains unresolved, we adhered to therecommended manual cut-off of 30 and examined the four-factormodel of psychopathy.
2. Method
2.1. Sample
The sample comprised 496 participants in the second of a two-stage survey of psychiatric morbidity among prisoners in England andWales, aged 16–64 years, carried out by the Office for NationalStatistics in 1997 (Singleton, Meltzer, Gatward, Coid, & Deasy, 1998).All 131 penal establishments were included, then containing 61,944prisoners, including 46,872 male sentenced, 12,302 male remand, and2770 women prisoners. Different sampling fractions were applied toassure the requisite number of interviews for each group of prisoners.This included 1 in 34 male sentenced prisoners, 1 in 8 male remandprisoners, and 1 in 3 women prisoners, either remand or sentenced. Inthe last four weeks of the survey, the sampling fraction changed to 1 in50 male sentenced, as a larger number of this group had beeninterviewed. Samples were taken from all prison locations in the firstphase to avoid over- or under-sampling those with mental healthproblems in locations such as Health Care and to be representative ofthe entire national prison estate. The survey therefore included allprisons (115 male, 11 women, 5 mixed). This included a sample of16.2% from Young Offender Institutions, 10.3% from open prisons orlowest security category D, 5.1% closed prisons, 7.4% category B, 25%category C, 31.6% local prisons including sentenced and remanded bylocal courts, and 5.9% from dispersal prisons, the highest on thesecurity scale. Substitution of prisoners no longer available forinterview, including those transferred or released, with new prisonerswas performed for those on remand.
In the first stage, 3563 prisoners were selected, of whom 3142(88%) completed full interviews. 37 failed to complete a full interview,198 (6%) refused, and 53 (1%) could not take part, mainly due tolanguage problems. Interviewers could not contact 118 (3%), and wereadvised not to interview 15.
In the second stage, 661 prisoners, a 1 in 5 random subsample,were then selected for clinical interview, of whom 505 (76%) wereinterviewed, 105 (16%) could no longer be contacted, and 50 (8%)refused.
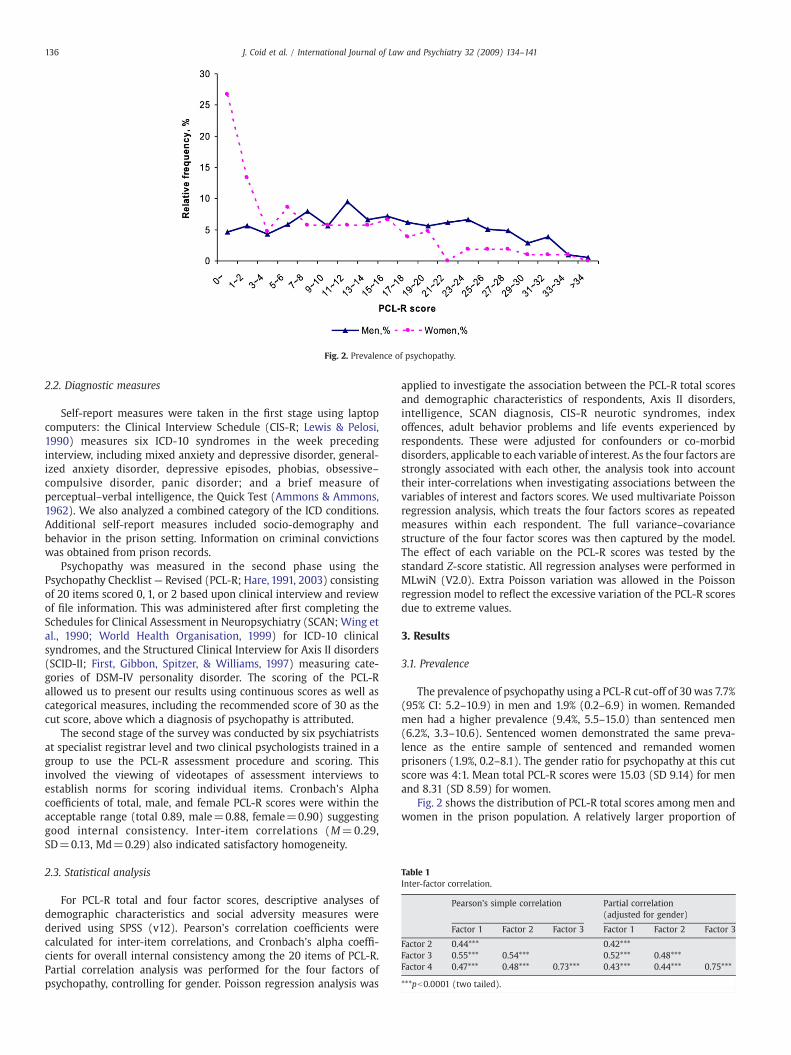
Fig. 2. Prevalence of psychopathy.
Table 1Inter-factor correlation.
Pearson's simple correlation Partial correlation(adjusted for gender)
Factor 1 Factor 2 Factor 3 Factor 1 Factor 2 Factor 3
Factor 2 0.44*** 0.42***Factor 3 0.55*** 0.54*** 0.52*** 0.48***Factor 4 0.47*** 0.48*** 0.73*** 0.43*** 0.44*** 0.75***
***pb0.0001 (two tailed).
136 J. Coid et al. / International Journal of Law and Psychiatry 32 (2009) 134–141
2.2. Diagnostic measures
Self-report measures were taken in the first stage using laptopcomputers: the Clinical Interview Schedule (CIS-R; Lewis & Pelosi,1990) measures six ICD-10 syndromes in the week precedinginterview, including mixed anxiety and depressive disorder, general-ized anxiety disorder, depressive episodes, phobias, obsessive–compulsive disorder, panic disorder; and a brief measure ofperceptual–verbal intelligence, the Quick Test (Ammons & Ammons,1962). We also analyzed a combined category of the ICD conditions.Additional self-report measures included socio-demography andbehavior in the prison setting. Information on criminal convictionswas obtained from prison records.
Psychopathy was measured in the second phase using thePsychopathy Checklist— Revised (PCL-R; Hare, 1991, 2003) consistingof 20 items scored 0, 1, or 2 based upon clinical interview and reviewof file information. This was administered after first completing theSchedules for Clinical Assessment in Neuropsychiatry (SCAN; Wing etal., 1990; World Health Organisation, 1999) for ICD-10 clinicalsyndromes, and the Structured Clinical Interview for Axis II disorders(SCID-II; First, Gibbon, Spitzer, & Williams, 1997) measuring cate-gories of DSM-IV personality disorder. The scoring of the PCL-Rallowed us to present our results using continuous scores as well ascategorical measures, including the recommended score of 30 as thecut score, above which a diagnosis of psychopathy is attributed.
The second stage of the survey was conducted by six psychiatristsat specialist registrar level and two clinical psychologists trained in agroup to use the PCL-R assessment procedure and scoring. Thisinvolved the viewing of videotapes of assessment interviews toestablish norms for scoring individual items. Cronbach's Alphacoefficients of total, male, and female PCL-R scores were within theacceptable range (total 0.89, male=0.88, female=0.90) suggestinggood internal consistency. Inter-item correlations (M=0.29,SD=0.13, Md=0.29) also indicated satisfactory homogeneity.
2.3. Statistical analysis
For PCL-R total and four factor scores, descriptive analyses ofdemographic characteristics and social adversity measures werederived using SPSS (v12). Pearson's correlation coefficients werecalculated for inter-item correlations, and Cronbach's alpha coeffi-cients for overall internal consistency among the 20 items of PCL-R.Partial correlation analysis was performed for the four factors ofpsychopathy, controlling for gender. Poisson regression analysis was
applied to investigate the association between the PCL-R total scoresand demographic characteristics of respondents, Axis II disorders,intelligence, SCAN diagnosis, CIS-R neurotic syndromes, indexoffences, adult behavior problems and life events experienced byrespondents. These were adjusted for confounders or co-morbiddisorders, applicable to each variable of interest. As the four factors arestrongly associated with each other, the analysis took into accounttheir inter-correlations when investigating associations between thevariables of interest and factors scores. We used multivariate Poissonregression analysis, which treats the four factors scores as repeatedmeasures within each respondent. The full variance–covariancestructure of the four factor scores was then captured by the model.The effect of each variable on the PCL-R scores was tested by thestandard Z-score statistic. All regression analyses were performed inMLwiN (V2.0). Extra Poisson variation was allowed in the Poissonregression model to reflect the excessive variation of the PCL-R scoresdue to extreme values.
3. Results
3.1. Prevalence
The prevalence of psychopathy using a PCL-R cut-off of 30 was 7.7%(95% CI: 5.2–10.9) in men and 1.9% (0.2–6.9) in women. Remandedmen had a higher prevalence (9.4%, 5.5–15.0) than sentenced men(6.2%, 3.3–10.6). Sentenced women demonstrated the same preva-lence as the entire sample of sentenced and remanded womenprisoners (1.9%, 0.2–8.1). The gender ratio for psychopathy at this cutscore was 4:1. Mean total PCL-R scores were 15.03 (SD 9.14) for menand 8.31 (SD 8.59) for women.
Fig. 2 shows the distribution of PCL-R total scores among men andwomen in the prison population. A relatively larger proportion of
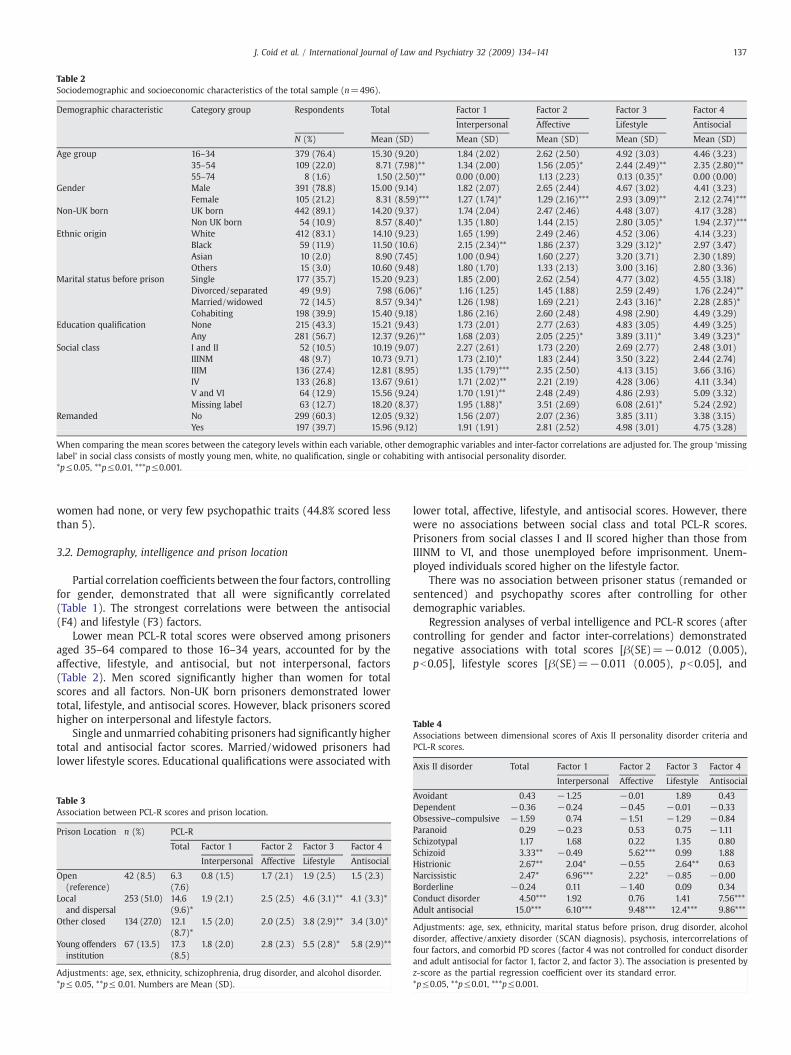
Table 2Sociodemographic and socioeconomic characteristics of the total sample (n=496).
Demographic characteristic Category group Respondents Total Factor 1 Factor 2 Factor 3 Factor 4
Interpersonal Affective Lifestyle Antisocial
N (%) Mean (SD) Mean (SD) Mean (SD) Mean (SD) Mean (SD)
Age group 16–34 379 (76.4) 15.30 (9.20) 1.84 (2.02) 2.62 (2.50) 4.92 (3.03) 4.46 (3.23)35–54 109 (22.0) 8.71 (7.98)** 1.34 (2.00) 1.56 (2.05)* 2.44 (2.49)** 2.35 (2.80)**55–74 8 (1.6) 1.50 (2.50)** 0.00 (0.00) 1.13 (2.23) 0.13 (0.35)* 0.00 (0.00)
Gender Male 391 (78.8) 15.00 (9.14) 1.82 (2.07) 2.65 (2.44) 4.67 (3.02) 4.41 (3.23)Female 105 (21.2) 8.31 (8.59)*** 1.27 (1.74)* 1.29 (2.16)*** 2.93 (3.09)** 2.12 (2.74)***
Non-UK born UK born 442 (89.1) 14.20 (9.37) 1.74 (2.04) 2.47 (2.46) 4.48 (3.07) 4.17 (3.28)Non UK born 54 (10.9) 8.57 (8.40)* 1.35 (1.80) 1.44 (2.15) 2.80 (3.05)* 1.94 (2.37)***
Ethnic origin White 412 (83.1) 14.10 (9.23) 1.65 (1.99) 2.49 (2.46) 4.52 (3.06) 4.14 (3.23)Black 59 (11.9) 11.50 (10.6) 2.15 (2.34)** 1.86 (2.37) 3.29 (3.12)* 2.97 (3.47)Asian 10 (2.0) 8.90 (7.45) 1.00 (0.94) 1.60 (2.27) 3.20 (3.71) 2.30 (1.89)Others 15 (3.0) 10.60 (9.48) 1.80 (1.70) 1.33 (2.13) 3.00 (3.16) 2.80 (3.36)
Marital status before prison Single 177 (35.7) 15.20 (9.23) 1.85 (2.00) 2.62 (2.54) 4.77 (3.02) 4.55 (3.18)Divorced/separated 49 (9.9) 7.98 (6.06)* 1.16 (1.25) 1.45 (1.88) 2.59 (2.49) 1.76 (2.24)**Married/widowed 72 (14.5) 8.57 (9.34)* 1.26 (1.98) 1.69 (2.21) 2.43 (3.16)* 2.28 (2.85)*Cohabiting 198 (39.9) 15.40 (9.18) 1.86 (2.16) 2.60 (2.48) 4.98 (2.90) 4.49 (3.29)
Education qualification None 215 (43.3) 15.21 (9.43) 1.73 (2.01) 2.77 (2.63) 4.83 (3.05) 4.49 (3.25)Any 281 (56.7) 12.37 (9.26)** 1.68 (2.03) 2.05 (2.25)* 3.89 (3.11)* 3.49 (3.23)*
Social class I and II 52 (10.5) 10.19 (9.07) 2.27 (2.61) 1.73 (2.20) 2.69 (2.77) 2.48 (3.01)IIINM 48 (9.7) 10.73 (9.71) 1.73 (2.10)* 1.83 (2.44) 3.50 (3.22) 2.44 (2.74)IIIM 136 (27.4) 12.81 (8.95) 1.35 (1.79)*** 2.35 (2.50) 4.13 (3.15) 3.66 (3.16)IV 133 (26.8) 13.67 (9.61) 1.71 (2.02)** 2.21 (2.19) 4.28 (3.06) 4.11 (3.34)V and VI 64 (12.9) 15.56 (9.24) 1.70 (1.91)** 2.48 (2.49) 4.86 (2.93) 5.09 (3.32)Missing label 63 (12.7) 18.20 (8.37) 1.95 (1.88)* 3.51 (2.69) 6.08 (2.61)* 5.24 (2.92)
Remanded No 299 (60.3) 12.05 (9.32) 1.56 (2.07) 2.07 (2.36) 3.85 (3.11) 3.38 (3.15)Yes 197 (39.7) 15.96 (9.12) 1.91 (1.91) 2.81 (2.52) 4.98 (3.01) 4.75 (3.28)
When comparing the mean scores between the category levels within each variable, other demographic variables and inter-factor correlations are adjusted for. The group ‘missinglabel’ in social class consists of mostly young men, white, no qualification, single or cohabiting with antisocial personality disorder.*p≤0.05, **p≤0.01, ***p≤0.001.
Table 4Associations between dimensional scores of Axis II personality disorder criteria andPCL-R scores.
Axis II disorder Total Factor 1 Factor 2 Factor 3 Factor 4
137J. Coid et al. / International Journal of Law and Psychiatry 32 (2009) 134–141
women had none, or very few psychopathic traits (44.8% scored lessthan 5).
3.2. Demography, intelligence and prison location
Partial correlation coefficients between the four factors, controllingfor gender, demonstrated that all were significantly correlated(Table 1). The strongest correlations were between the antisocial(F4) and lifestyle (F3) factors.
Lower mean PCL-R total scores were observed among prisonersaged 35–64 compared to those 16–34 years, accounted for by theaffective, lifestyle, and antisocial, but not interpersonal, factors(Table 2). Men scored significantly higher than women for totalscores and all factors. Non-UK born prisoners demonstrated lowertotal, lifestyle, and antisocial scores. However, black prisoners scoredhigher on interpersonal and lifestyle factors.
Single and unmarried cohabiting prisoners had significantly highertotal and antisocial factor scores. Married/widowed prisoners hadlower lifestyle scores. Educational qualifications were associated with
Table 3Association between PCL-R scores and prison location.
Prison Location n (%) PCL-R
Total Factor 1 Factor 2 Factor 3 Factor 4
Interpersonal Affective Lifestyle Antisocial
Open(reference)
42 (8.5) 6.3(7.6)
0.8 (1.5) 1.7 (2.1) 1.9 (2.5) 1.5 (2.3)
Localand dispersal
253 (51.0) 14.6(9.6)*
1.9 (2.1) 2.5 (2.5) 4.6 (3.1)** 4.1 (3.3)*
Other closed 134 (27.0) 12.1(8.7)*
1.5 (2.0) 2.0 (2.5) 3.8 (2.9)** 3.4 (3.0)*
Young offendersinstitution
67 (13.5) 17.3(8.5)
1.8 (2.0) 2.8 (2.3) 5.5 (2.8)* 5.8 (2.9)**
Adjustments: age, sex, ethnicity, schizophrenia, drug disorder, and alcohol disorder.*p≤ 0.05, **p≤ 0.01. Numbers are Mean (SD).
lower total, affective, lifestyle, and antisocial scores. However, therewere no associations between social class and total PCL-R scores.Prisoners from social classes I and II scored higher than those fromIIINM to VI, and those unemployed before imprisonment. Unem-ployed individuals scored higher on the lifestyle factor.
There was no association between prisoner status (remanded orsentenced) and psychopathy scores after controlling for otherdemographic variables.
Regression analyses of verbal intelligence and PCL-R scores (aftercontrolling for gender and factor inter-correlations) demonstratednegative associations with total scores [β(SE)=−0.012 (0.005),pb0.05], lifestyle scores [β(SE)=−0.011 (0.005), pb0.05], and
Interpersonal Affective Lifestyle Antisocial
Avoidant 0.43 −1.25 −0.01 1.89 0.43Dependent −0.36 −0.24 −0.45 −0.01 −0.33Obsessive–compulsive −1.59 0.74 −1.51 −1.29 −0.84Paranoid 0.29 −0.23 0.53 0.75 −1.11Schizotypal 1.17 1.68 0.22 1.35 0.80Schizoid 3.33** −0.49 5.62*** 0.99 1.88Histrionic 2.67** 2.04* −0.55 2.64** 0.63Narcissistic 2.47* 6.96*** 2.22* −0.85 −0.00Borderline −0.24 0.11 −1.40 0.09 0.34Conduct disorder 4.50*** 1.92 0.76 1.41 7.56***Adult antisocial 15.0*** 6.10*** 9.48*** 12.4*** 9.86***
Adjustments: age, sex, ethnicity, marital status before prison, drug disorder, alcoholdisorder, affective/anxiety disorder (SCAN diagnosis), psychosis, intercorrelations offour factors, and comorbid PD scores (factor 4 was not controlled for conduct disorderand adult antisocial for factor 1, factor 2, and factor 3). The association is presented byz-score as the partial regression coefficient over its standard error.*p≤0.05, **p≤0.01, ***p≤0.001.
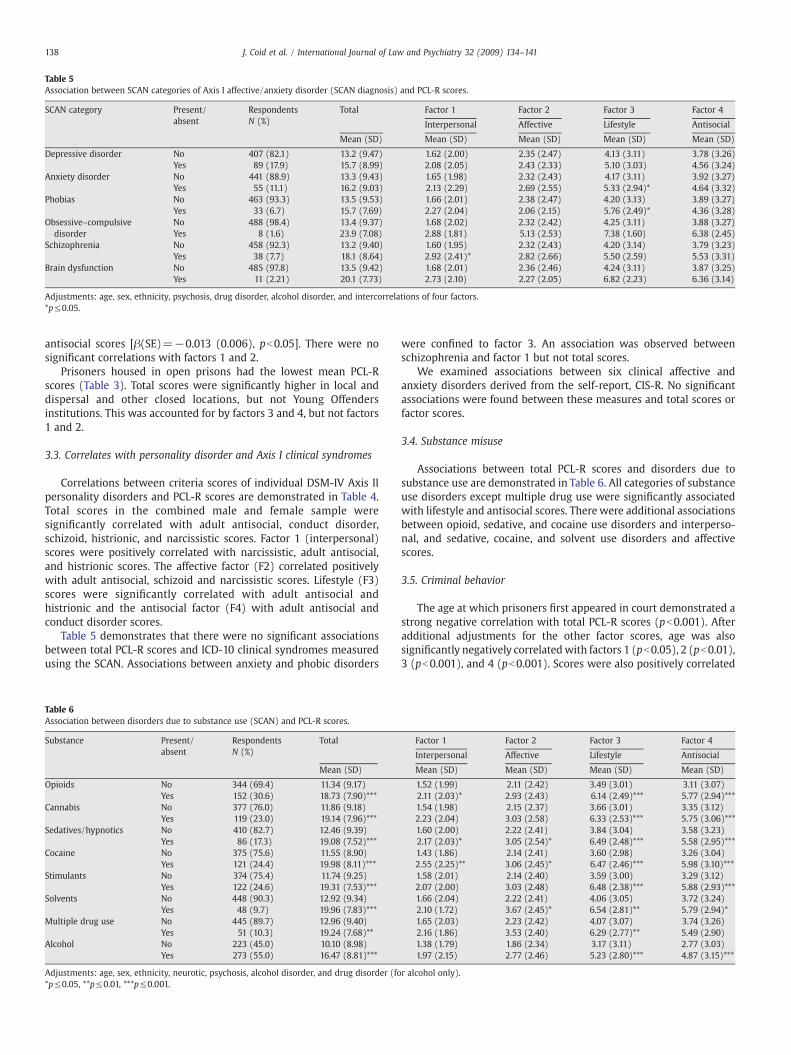
Table 5Association between SCAN categories of Axis I affective/anxiety disorder (SCAN diagnosis) and PCL-R scores.
SCAN category Present/absent
RespondentsN (%)
Total Factor 1 Factor 2 Factor 3 Factor 4
Interpersonal Affective Lifestyle Antisocial
Mean (SD) Mean (SD) Mean (SD) Mean (SD) Mean (SD)
Depressive disorder No 407 (82.1) 13.2 (9.47) 1.62 (2.00) 2.35 (2.47) 4.13 (3.11) 3.78 (3.26)Yes 89 (17.9) 15.7 (8.99) 2.08 (2.05) 2.43 (2.33) 5.10 (3.03) 4.56 (3.24)
Anxiety disorder No 441 (88.9) 13.3 (9.43) 1.65 (1.98) 2.32 (2.43) 4.17 (3.11) 3.92 (3.27)Yes 55 (11.1) 16.2 (9.03) 2.13 (2.29) 2.69 (2.55) 5.33 (2.94)* 4.64 (3.32)
Phobias No 463 (93.3) 13.5 (9.53) 1.66 (2.01) 2.38 (2.47) 4.20 (3.13) 3.89 (3.27)Yes 33 (6.7) 15.7 (7.69) 2.27 (2.04) 2.06 (2.15) 5.76 (2.49)* 4.36 (3.28)
Obsessive–compulsivedisorder
No 488 (98.4) 13.4 (9.37) 1.68 (2.02) 2.32 (2.42) 4.25 (3.11) 3.88 (3.27)Yes 8 (1.6) 23.9 (7.08) 2.88 (1.81) 5.13 (2.53) 7.38 (1.60) 6.38 (2.45)
Schizophrenia No 458 (92.3) 13.2 (9.40) 1.60 (1.95) 2.32 (2.43) 4.20 (3.14) 3.79 (3.23)Yes 38 (7.7) 18.1 (8.64) 2.92 (2.41)* 2.82 (2.66) 5.50 (2.59) 5.53 (3.31)
Brain dysfunction No 485 (97.8) 13.5 (9.42) 1.68 (2.01) 2.36 (2.46) 4.24 (3.11) 3.87 (3.25)Yes 11 (2.21) 20.1 (7.73) 2.73 (2.10) 2.27 (2.05) 6.82 (2.23) 6.36 (3.14)
Adjustments: age, sex, ethnicity, psychosis, drug disorder, alcohol disorder, and intercorrelations of four factors.*p≤0.05.
138 J. Coid et al. / International Journal of Law and Psychiatry 32 (2009) 134–141
antisocial scores [β(SE)=−0.013 (0.006), pb0.05]. There were nosignificant correlations with factors 1 and 2.
Prisoners housed in open prisons had the lowest mean PCL-Rscores (Table 3). Total scores were significantly higher in local anddispersal and other closed locations, but not Young Offendersinstitutions. This was accounted for by factors 3 and 4, but not factors1 and 2.
3.3. Correlates with personality disorder and Axis I clinical syndromes
Correlations between criteria scores of individual DSM-IV Axis IIpersonality disorders and PCL-R scores are demonstrated in Table 4.Total scores in the combined male and female sample weresignificantly correlated with adult antisocial, conduct disorder,schizoid, histrionic, and narcissistic scores. Factor 1 (interpersonal)scores were positively correlated with narcissistic, adult antisocial,and histrionic scores. The affective factor (F2) correlated positivelywith adult antisocial, schizoid and narcissistic scores. Lifestyle (F3)scores were significantly correlated with adult antisocial andhistrionic and the antisocial factor (F4) with adult antisocial andconduct disorder scores.
Table 5 demonstrates that there were no significant associationsbetween total PCL-R scores and ICD-10 clinical syndromes measuredusing the SCAN. Associations between anxiety and phobic disorders
Table 6Association between disorders due to substance use (SCAN) and PCL-R scores.
Substance Present/absent
RespondentsN (%)
Total
Mean (SD)
Opioids No 344 (69.4) 11.34 (9.17)Yes 152 (30.6) 18.73 (7.90)***
Cannabis No 377 (76.0) 11.86 (9.18)Yes 119 (23.0) 19.14 (7.96)***
Sedatives/hypnotics No 410 (82.7) 12.46 (9.39)Yes 86 (17.3) 19.08 (7.52)***
Cocaine No 375 (75.6) 11.55 (8.90)Yes 121 (24.4) 19.98 (8.11)***
Stimulants No 374 (75.4) 11.74 (9.25)Yes 122 (24.6) 19.31 (7.53)***
Solvents No 448 (90.3) 12.92 (9.34)Yes 48 (9.7) 19.96 (7.83)***
Multiple drug use No 445 (89.7) 12.96 (9.40)Yes 51 (10.3) 19.24 (7.68)**
Alcohol No 223 (45.0) 10.10 (8.98)Yes 273 (55.0) 16.47 (8.81)***
Adjustments: age, sex, ethnicity, neurotic, psychosis, alcohol disorder, and drug disorder (fo*p≤0.05, **p≤0.01, ***p≤0.001.
were confined to factor 3. An association was observed betweenschizophrenia and factor 1 but not total scores.
We examined associations between six clinical affective andanxiety disorders derived from the self-report, CIS-R. No significantassociations were found between these measures and total scores orfactor scores.
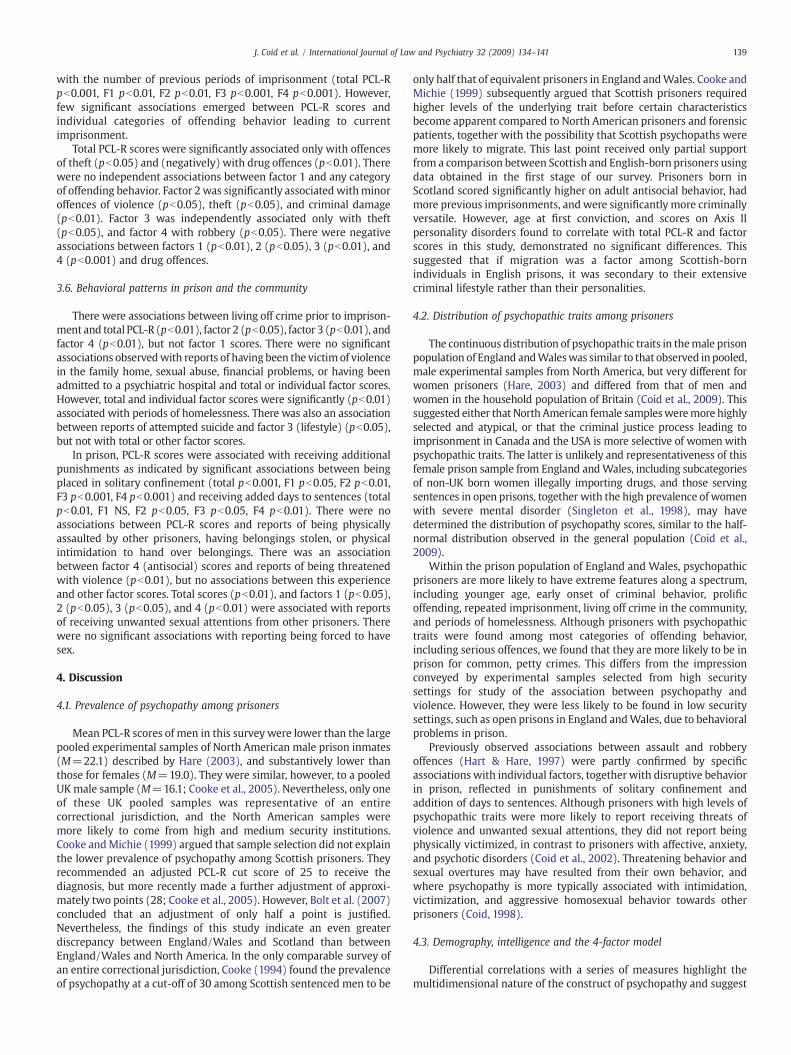
3.4. Substance misuse
Associations between total PCL-R scores and disorders due tosubstance use are demonstrated in Table 6. All categories of substanceuse disorders except multiple drug use were significantly associatedwith lifestyle and antisocial scores. Therewere additional associationsbetween opioid, sedative, and cocaine use disorders and interperso-nal, and sedative, cocaine, and solvent use disorders and affectivescores.
3.5. Criminal behavior
The age at which prisoners first appeared in court demonstrated astrong negative correlation with total PCL-R scores (pb0.001). Afteradditional adjustments for the other factor scores, age was alsosignificantly negatively correlatedwith factors 1 (pb0.05), 2 (pb0.01),3 (pb0.001), and 4 (pb0.001). Scores were also positively correlated
Factor 1 Factor 2 Factor 3 Factor 4
Interpersonal Affective Lifestyle Antisocial
Mean (SD) Mean (SD) Mean (SD) Mean (SD)
1.52 (1.99) 2.11 (2.42) 3.49 (3.01) 3.11 (3.07)2.11 (2.03)* 2.93 (2.43) 6.14 (2.49)*** 5.77 (2.94)***1.54 (1.98) 2.15 (2.37) 3.66 (3.01) 3.35 (3.12)2.23 (2.04) 3.03 (2.58) 6.33 (2.53)*** 5.75 (3.06)***1.60 (2.00) 2.22 (2.41) 3.84 (3.04) 3.58 (3.23)2.17 (2.03)* 3.05 (2.54)* 6.49 (2.48)*** 5.58 (2.95)***1.43 (1.86) 2.14 (2.41) 3.60 (2.98) 3.26 (3.04)2.55 (2.25)** 3.06 (2.45)* 6.47 (2.46)*** 5.98 (3.10)***1.58 (2.01) 2.14 (2.40) 3.59 (3.00) 3.29 (3.12)2.07 (2.00) 3.03 (2.48) 6.48 (2.38)*** 5.88 (2.93)***1.66 (2.04) 2.22 (2.41) 4.06 (3.05) 3.72 (3.24)2.10 (1.72) 3.67 (2.45)* 6.54 (2.81)** 5.79 (2.94)*1.65 (2.03) 2.23 (2.42) 4.07 (3.07) 3.74 (3.26)2.16 (1.86) 3.53 (2.40) 6.29 (2.77)** 5.49 (2.90)1.38 (1.79) 1.86 (2.34) 3.17 (3.11) 2.77 (3.03)1.97 (2.15) 2.77 (2.46) 5.23 (2.80)*** 4.87 (3.15)***
r alcohol only).
139J. Coid et al. / International Journal of Law and Psychiatry 32 (2009) 134–141
with the number of previous periods of imprisonment (total PCL-Rpb0.001, F1 pb0.01, F2 pb0.01, F3 pb0.001, F4 pb0.001). However,few significant associations emerged between PCL-R scores andindividual categories of offending behavior leading to currentimprisonment.
Total PCL-R scores were significantly associated only with offencesof theft (pb0.05) and (negatively) with drug offences (pb0.01). Therewere no independent associations between factor 1 and any categoryof offending behavior. Factor 2 was significantly associated withminoroffences of violence (pb0.05), theft (pb0.05), and criminal damage(pb0.01). Factor 3 was independently associated only with theft(pb0.05), and factor 4 with robbery (pb0.05). There were negativeassociations between factors 1 (pb0.01), 2 (pb0.05), 3 (pb0.01), and4 (pb0.001) and drug offences.
3.6. Behavioral patterns in prison and the community
There were associations between living off crime prior to imprison-ment and total PCL-R (pb0.01), factor 2 (pb0.05), factor 3 (pb0.01), andfactor 4 (pb0.01), but not factor 1 scores. There were no significantassociations observedwith reports of having been the victim of violencein the family home, sexual abuse, financial problems, or having beenadmitted to a psychiatric hospital and total or individual factor scores.However, total and individual factor scores were significantly (pb0.01)associated with periods of homelessness. There was also an associationbetween reports of attempted suicide and factor 3 (lifestyle) (pb0.05),but not with total or other factor scores.
In prison, PCL-R scores were associated with receiving additionalpunishments as indicated by significant associations between beingplaced in solitary confinement (total pb0.001, F1 pb0.05, F2 pb0.01,F3 pb0.001, F4 pb0.001) and receiving added days to sentences (totalpb0.01, F1 NS, F2 pb0.05, F3 pb0.05, F4 pb0.01). There were noassociations between PCL-R scores and reports of being physicallyassaulted by other prisoners, having belongings stolen, or physicalintimidation to hand over belongings. There was an associationbetween factor 4 (antisocial) scores and reports of being threatenedwith violence (pb0.01), but no associations between this experienceand other factor scores. Total scores (pb0.01), and factors 1 (pb0.05),2 (pb0.05), 3 (pb0.05), and 4 (pb0.01) were associated with reportsof receiving unwanted sexual attentions from other prisoners. Therewere no significant associations with reporting being forced to havesex.
4. Discussion
4.1. Prevalence of psychopathy among prisoners
Mean PCL-R scores of men in this survey were lower than the largepooled experimental samples of North American male prison inmates(M=22.1) described by Hare (2003), and substantively lower thanthose for females (M=19.0). They were similar, however, to a pooledUKmale sample (M=16.1; Cooke et al., 2005). Nevertheless, only oneof these UK pooled samples was representative of an entirecorrectional jurisdiction, and the North American samples weremore likely to come from high and medium security institutions.Cooke andMichie (1999) argued that sample selection did not explainthe lower prevalence of psychopathy among Scottish prisoners. Theyrecommended an adjusted PCL-R cut score of 25 to receive thediagnosis, but more recently made a further adjustment of approxi-mately two points (28; Cooke et al., 2005). However, Bolt et al. (2007)concluded that an adjustment of only half a point is justified.Nevertheless, the findings of this study indicate an even greaterdiscrepancy between England/Wales and Scotland than betweenEngland/Wales and North America. In the only comparable survey ofan entire correctional jurisdiction, Cooke (1994) found the prevalenceof psychopathy at a cut-off of 30 among Scottish sentenced men to be
only half that of equivalent prisoners in England andWales. Cooke andMichie (1999) subsequently argued that Scottish prisoners requiredhigher levels of the underlying trait before certain characteristicsbecome apparent compared to North American prisoners and forensicpatients, together with the possibility that Scottish psychopaths weremore likely to migrate. This last point received only partial supportfrom a comparison between Scottish and English-born prisoners usingdata obtained in the first stage of our survey. Prisoners born inScotland scored significantly higher on adult antisocial behavior, hadmore previous imprisonments, and were significantly more criminallyversatile. However, age at first conviction, and scores on Axis IIpersonality disorders found to correlate with total PCL-R and factorscores in this study, demonstrated no significant differences. Thissuggested that if migration was a factor among Scottish-bornindividuals in English prisons, it was secondary to their extensivecriminal lifestyle rather than their personalities.
4.2. Distribution of psychopathic traits among prisoners
The continuous distribution of psychopathic traits in themale prisonpopulation of England andWaleswas similar to that observed inpooled,male experimental samples from North America, but very different forwomen prisoners (Hare, 2003) and differed from that of men andwomen in the household population of Britain (Coid et al., 2009). Thissuggested either that North American female samplesweremore highlyselected and atypical, or that the criminal justice process leading toimprisonment in Canada and the USA is more selective of womenwithpsychopathic traits. The latter is unlikely and representativeness of thisfemale prison sample from England andWales, including subcategoriesof non-UK born women illegally importing drugs, and those servingsentences in open prisons, together with the high prevalence of womenwith severe mental disorder (Singleton et al., 1998), may havedetermined the distribution of psychopathy scores, similar to the half-normal distribution observed in the general population (Coid et al.,2009).
Within the prison population of England and Wales, psychopathicprisoners are more likely to have extreme features along a spectrum,including younger age, early onset of criminal behavior, prolificoffending, repeated imprisonment, living off crime in the community,and periods of homelessness. Although prisoners with psychopathictraits were found among most categories of offending behavior,including serious offences, we found that they are more likely to be inprison for common, petty crimes. This differs from the impressionconveyed by experimental samples selected from high securitysettings for study of the association between psychopathy andviolence. However, they were less likely to be found in low securitysettings, such as open prisons in England andWales, due to behavioralproblems in prison.
Previously observed associations between assault and robberyoffences (Hart & Hare, 1997) were partly confirmed by specificassociations with individual factors, together with disruptive behaviorin prison, reflected in punishments of solitary confinement andaddition of days to sentences. Although prisoners with high levels ofpsychopathic traits were more likely to report receiving threats ofviolence and unwanted sexual attentions, they did not report beingphysically victimized, in contrast to prisoners with affective, anxiety,and psychotic disorders (Coid et al., 2002). Threatening behavior andsexual overtures may have resulted from their own behavior, andwhere psychopathy is more typically associated with intimidation,victimization, and aggressive homosexual behavior towards otherprisoners (Coid, 1998).
4.3. Demography, intelligence and the 4-factor model
Differential correlations with a series of measures highlight themultidimensional nature of the construct of psychopathy and suggest
140 J. Coid et al. / International Journal of Law and Psychiatry 32 (2009) 134–141
the likelihood of multiple etiological determinants. However, theselected nature of prison populations means that firm conclusionscannot be drawn regarding the apparent decline in psychopathy withage in the general population. Nevertheless, we did not observe adecline in facet 1 in the household survey (Coid et al., 2009), similar toour observations among prisoners. Older prisoners included moreserving life sentences, including domestic homicides, and more sexoffenders against children. However, our findings are in accordancewith previous studies investigating the effects of ageing on psycho-pathy scores using a cross-sectional design. In a study of Harpur andHare (1994), it was demonstrated that the traditional factor 2 of thePCL-R (social deviance) declined with age, whereas the “psychopathictraits” including the interpersonal style and affective deficiency(factor 1) remained stable across various age groups. This wasconfirmed by Ullrich et al. (2003) who applied the three-factormodel of psychopathy in a sample of German prisoners and found anage related decline only for factor 3 (impulsivity). These findings werenot unexpected against the background of the assumption of“psychopathic traits” (interpersonal and affective) representing thecore personality traits (which are supposed to demonstrate stability),whereas traits constituting “social deviance” (impulsiveness andantisocial) are more strongly behavior-related.
Non-UK born prisoners showed no increased tendency to psycho-pathy, perhaps because a proportion had become involved in illegalimportation of drugs for economic reasons rather than as part of acriminal lifestyle. Associations between interpersonal and lifestylefactors and black ethnicity were of interest and correlated with certaindifferences in specific Axis-II personality disorder categories betweenwhite and black prisoners previously observed (Coid et al., 2002). Ingeneral, psychopathic traits did not show strong associations withsocial class, although interpersonal factor 1 scores were significantlyhigher among prisoners of higher social class. Finally, there was noassociation between psychopathy and being a remanded prisonerafter adjusting for age.
Low intelligence is an important predictor of offending in thegeneral population (Farrington, 1997), corresponding to our finding ofassociations between low verbal intelligence and an antisocial andimpulsive/irresponsible lifestyle, but not with the interpersonal oraffective factors. Previous research in an adolescent forensic sampledemonstrated a positive association between verbal intelligence andfactor 1, and an inverse correlation with factor 2 (Salekin, Neumann,Leistico, & Zalot, 2004). Similarly, a positive correlation with verbalintelligence was found with factor 1 and an inverse correlation withaffective (factor 2) and lifestyle items (factor 3) in a study ofpsychiatric patients (Vitacco et al., 2005).
4.4. Correlates with personality disorder and clinical syndromes
Consistent with research on the factor structure of the PCL-R (Hare,2003; Neumann et al., 2005), we found that the four factors are highlyinter-correlated. We used partial correlations to adjust for potentialconfounding which revealed their independent associations. Wetherefore found fewer associations with Axis II personality scoresthan in previous forensic samples (Hare, 2003; Hart, Cox, & Hare,1995). However, our findings were generally similar, in that adultantisocial disorder, conduct disorder, narcissistic and histrionic scoresderived from diagnostic instruments correlated most strongly withpsychopathy (Hare, 2003; Hart et al., 1995). Schizoid personalitydisorder was also associated. The glibness and superficial charmcharacterizing factor 1 was, as expected, strongly associated withnarcissistic and histrionic personality disorder. The finding of anassociation between factor 2 and schizoid personality disorder wouldbe explained by affective dysfunction characterizing this factor.Impulsive and irresponsible lifestyle characteristics of factor 3correlated with histrionic personality disorder in this prison sample.Conduct disorder was associated only with factor 4 and total scores,
suggesting the importance of an early onset of behavioral disturbancecorrelating with the antisocial factor.
In this sample, all factors were highly correlated with antisocialbehavior in adulthood as measured by antisocial personality disorderscores after age 15. However, lack of a correlation with borderlinepersonality disorder was unexpected, particularly as it had previouslybeen found in the British household population (Coid et al., 2009).Among prisoners, this association was confounded by adult antisocialbehavior.
According to Cleckley's (1941) original observations, psychopathicindividuals show neither psychoneurotic nor psychotic symptoms.Our findings only partly support this. There were relatively weakassociations observed between schizophrenia and factor 1, andbetween phobic and anxiety disorders and factor 3. In contrast to ahousehold survey using the CIS-R (Coid et al., 2009), no associationswere found with obsessive–compulsive disorder. This suggests that atlower levels of psychopathic traits there may be weak associationswith OCD at the general population level, but among populations withhigher trait levels and more individuals with psychopathy, theseassociations are absent.
On the other hand, the observation of an association betweenanxiety and phobic disorders is of some interest. The relationshipwith psychopathy has been controversial. It is probable that theassociations we found were robust because the overall prevalence ofall anxiety disorders in this prison samplewas very high (Singleton etal., 1998), imprisonment, and especially remand, being a highlystressful situational experience formost prisoners. It has been arguedthat low anxiousness should itself be included as a criterion forpsychopathy. But also that there should be a distinction between“primary” (with low anxiety) and “secondary” (with high anxiety)psychopaths (see Widiger, 2006). It may also be important todistinguish between fearfulness and anxiousness. Persons high infearlessness engage in substantial risk taking, but then mayexperience anxiety in relation to their producing and encounteringhighly stressful events (Frick, Lilienfeld, Ellis, Loney, & Silverthorn,1999; Lilienfeld,1994). However, it is not clearwhether thrill-seekingbehavior is best understood as reflecting fearlessness, as animpulsive disposition, or both. The association with anxiety andphobic disorders with factor 3 in this study suggests that this may beassociated through impulsiveness.
All previous studies examining substance misuse and psychopathyhave demonstrated associations (Hare, 2003; Schubert, Wolf, Patter-son, Grande, & Pendleton, 1988). Psychopathic individuals in forensicsamples are also relativelymore likely to have problems due to alcoholmisuse than other offenders, but in the British household populationthe association was weak (Coid et al., 2009).
Few specific associations were found between substance misuseand either factor 1 or 2, suggesting that the effects of these factors onchoice of substances were weak. Overwhelmingly, substance misusewas part of an antisocial and irresponsible lifestyle.
4.5. Methodological limitations
Although this sample was representative of the prison populationof England and Wales, it is important to consider the highly selectednature of any prison population when examining correlates ofpsychopathy; most prisoners in any country are young, male, of lowsocial class or previously unemployed. A disproportionate number inthe UK are black (Coid et al., 2002), and characterized by very highlevels of psychiatric morbidity (Singleton et al., 1998). These factorsmust be taken into account when comparing findings with those inthe general population (Coid et al., 2009) and in making comparisonswith findings from studies using experimental samples, often selectedfrom unrepresentative prison locations deliberately chosen in antici-pation that there will be a raised prevalence of psychopathicindividuals for study.
141J. Coid et al. / International Journal of Law and Psychiatry 32 (2009) 134–141
The sampling frame ensured that the survey was highly repre-sentative and attrition rate at both stages was low. Few prisonersrefused to participate, attrition being largely accounted for by rapidmovement of some prisoners between institutions or unexpectedrelease. However, this study examined correlates with psychopathictraits in the prison population and not with psychopathy ascategorically defined. Furthermore, collateral information on previousbehavior was relatively limited and previous psychological andpsychiatric reports were rarely available to interviewers. This mayhave biased PCL-R scores so that the true prevalence was higher thanwe have recorded. The clinically trained raters had information aboutprevious criminal behavior, together with measures from the firststage of the survey. However, PCL-R ratings were taken in the contextof an interview that gave primacy to the diagnosis of ICD-10 clinicalsyndromes. In the context of recommendations for administration ofthe instrument (Hare, 2003), they must be considered limited.
5. Summary and conclusion
Our study demonstrated that the prevalence of psychopathy isremarkably higher in male than in female prisoners. The same heldtrue for observations of dimensional scores of the interpersonal,affective, impulsive and antisocial components. Although the pre-valences and scores are higher than in a representative non-forensicand non-psychiatric community sample, the pattern of genderdifferences was identical (Coid et al., 2009). These findings suggestthat psychopathy measured with the PCL-R and PCL: SV does notreflect a different construct depending on the population under studybut a more severe condition among individuals detained in prison.
The differentiation of psychopathy into its sub-componentsrevealed important associations about the differential associations ofthe interpersonal, affective, lifestyle and antisocial factors and variousoutcome measures. Every factor demonstrated a specific pattern ofrelationship with co-morbid psychopathology and social and beha-vioral problems relevant for a better understanding of the construct.
References
Ammons, R. B., & Ammons, C. H. (1962). The Quick Test: Provisional manual. Psycho-logical Reports, 11, 111−161.
Andersen, H. S., Sestoft, D., Lillebaek, T., Mortensen, E. L., & Kramp, P. (1999). Psychopathyand psychopathological profiles in prisoners on remand. Acta Psychiatrica Scandina-vica, 99(1), 33−39.
Assadi, S.M., Noroozian,M., Pakravannejad,M., Yahyazadeh,O., Aghayan, S., Shariat, S. V., et al.(2006). Psychiatric morbidity among sentences prisoners: Prevalence study in Iran.British Journal of Psychiatry, 188, 159−164.
Blair, J., Mitchell, D., & Blair, K. (2005). The psychopath, emotion, and the brain. Malden,MA: Blackwell Publishing.
Blonigen, D. M., Hicks, B. M., Krueger, R. F., Patrick, C. K., & Lacono, W. G. (2005).Psychopathic personality traits: Heritability and genetic overlap with internalizingand externalizing psychopathology. Psychological Medicine, 35, 637−648.
Bolt, D., Hare, R. D., & Neumann, C. S. (2007). Score metric equivalence of the PCL-Racross North American and UK criminal offenders: A critique of Cooke et al. (2005)and new analysis. Assessment, 14(1), 44−56.
Cleckley, H. (1941). The mask of sanity. St Louis, MO: Mosby.Coid, J. W. (1998). The management of dangerous psychopathy in prison. In T. Millon, E.
Simonsen, M. Birket-Smith, & R. D. Davis (Eds.), Psychopathy, Antisocial, Criminaland Violent Behaviour (pp. 431−457). New York: Guilford Press.
Coid, J., Petruckevitch, A., Bebbington, P., Brugha, T., Bhugra, D., Jenkins, R., et al. (2002).Ethnic differences in prisoners. I: Criminality and psychiatric morbidity. BritishJournal of Psychiatry, 181, 473−480.
Coid, J., Ullrich, S., Yang, M., Ullrich, S., Roberts, A., & Hare, R. (2009). Prevalence andcorrelates of psychopathic traits in a household population. International Journal ofLaw and Psychiatry, 32, 65−73.
Cooke, D. J. (1994). Psychological disturbance in the Scottish prison system: Prevalence,precipitants, and policy. Edinburgh: Scottish Home and Health Department.
Cooke, D. J. (1996). Psychopathic personality in different cultures. What do we know?What do we need to find out? Journal of Personality Disorders, 10, 23−40.
Cooke, D. J., & Michie, C. (1999). Psychopathy across cultures: Scotland and NorthAmerica compared. Journal of Abnormal Psychology, 108, 58−68.
Cooke, D. J., & Michie, C. (2001). Refining the construct of psychopathy: Towards ahierarchical model. Psychological Assessment, 13, 171−188.
Cooke, D. J., Michie, C., Hart, D., & Clark, D. (2005). Assessing psychopathy in the UK:Concerns about cross-sectional generalisability. British Journal of Psychiatry, 186,335−341.
Cornell, D. J., Warren, J., Hawk, G., Stafford, E., Oram, G., & Pine, D. (1996). Psychopathyin instrumental and reactive violent offenders. Journal of Consulting and ClinicalPsychology, 64, 783−790.
Farrington, D. (1997). Human development and criminal careers. In N. Maguire, R.Morgan, & R. Reiner (Eds.), The Oxford Handbook of Criminology (pp. 361−408).,2nd edition Oxford: Oxford University Press.
First, M. B., Gibbon, M., Spitzer, R. L., & Williams, J. B. W. (1997). Structured clinicalinterviews for DSM-IV Axis-II personality disorders. Washington: American Psychia-tric Press.
Frick, P. J., Lilienfeld, S. O., Ellis, M., Loney, B., & Silverthorn, P. (1999). The associationbetween anxiety and psychopathy dimensions in children. Journal of AbnormalChild Psychology, 27, 383−392.
Hare, R. D. (1991). The Hare Psychopathy Checklist — Revised. Toronto, Ontario: Multi-Health Systems.
Hare, R. D. (2003). Manual for the Revised Psychopathy Checklist, (2nd edition) Toronto,ON, Canada: Multi-Health Systems.
Hare, R. D., & Neumann, C. N. (2006). The PCL-R assessment of psychopathy:Development,structural properties, and new directions. In C. Patrick (Ed.), Handbook of Psychopathy(pp. 58−88). New York: Guilford.
Hare, R. D., Clark, D., Grann, M., & Thornton, D. (2000). Psychopathy and the predictivevalidity of the PCL-R: An international perspective. Behavioral Sciences and the Law,18, 623−645.
Harpur, T. J., & Hare, R. D. (1994). The assessment of psychopathy as a function of age.Journal of Abnormal Psychology, 103, 604−609.
Hart, S. D., Cox, D. N., & Hare, R. D. (1995). The Hare Psychopathy Checklist: ScreeningVersion. New York: Multi-Health Systems Inc.
Hart, S. D., & Hare, R. D. (1997). Psychopathy: Assessment and association with criminalconduct. In D. Stoff, J. Breiling, & J. Maser (Eds.), Handbook of Antisocial Behavior(pp. 22−35). New York, NY: Wiley & Sons.
Hill, C. D., Neumann, C. S., & Rogers, R. (2004). Confirmatory factor analysis of thepsychopathy checklist: Screening version in offenders with Axis I disorders. Psy-chological Assessment, 16, 90−95.
Lewis, G., & Pelosi, A. J. (1990). Manual of the Revised Clinical Interview Schedule (CIS-R).London: Institute of Psychiatry.
Lilienfeld, S. O. (1994). Conceptual problems in the assessment of psychopathy. ClinicalPsychology Review, 14, 17−38.
Moran, P., (1999). Antisocial personality disorder. An epidemiological perspective. London.Royal College of Psychiatrists. Gaskell.
Neumann, C. S., Vitacco, M. J., Hare, R. D., & Wupperman, P. (2005). Deconstructing the“reconstruction” of psychopathy: A comment on Cooke, Michie, Hart, & Clark.Journal of Personality Disorders, 19, 624−640.
Salekin, R. T., Neumann, C. S., Leistico, A. -M. R., & Zalot, A. A. (2004). Psychopathy inyouth and intelligence: An investigation of Cleckley's hypothesis. Journal of ClinicalChild and Adolescent Psychology, 333, 731−742.
Schubert, D. S., Wolf, A. W., Patterson, M. B., Grande, T. P., & Pendleton, L. (1988). Astatistical evaluation of the literature regarding the associations among alcoholism,drug abuse, and antisocial personality disorder. International Journal of Addiction,23, 797−808.
Singleton, N., Meltzer, H., Gatward, R., Coid, J., & Deasy, D. (1998). Psychiatric Morbidityamong prisoners in England and Wales. London: The Stationery Office.
Ullrich, S., Paelecke, M., Kahle, I., & Marneros, A. (2003). Categorical and dimensionalassessment of psychopathy in German offenders. Prevalence, gender differencesand aging. Der Nervenarzt, 74, 1002−1008.
Viding, E., Blair, R. J. R., Moffitt, T. E., & Plomin, R. (2005). Evidence for substantialgenetic risk for psychopathy in 7-year-olds. Journal of Child Psychology andPsychiatry, 46, 592−597.
Vitacco, M. J., Neumann, C. S., & Jackson, R. L. (2005). Testing a four-factor model ofpsychopathy and its association with ethnicity, gender, intelligence, and violence.Journal of Consulting and Clinical Psychology, 73, 466−476.
Widiger, T. A. (2006). Psychopathy and DSM-IV psychopathology. In C. J. Patrick (Ed.),Handbook of Psychopathy (pp. 156−171). New York: Guilford Press.
Wing, J. K., Babor, T., Brugha, T., Burke, J., Cooper, J. E., Giel, R., et al. (1990). SCAN:Schedules for Clinical Assessment in Neuropsychiatry. Archives of General Psychiatry,47(6), 586−593.
World Health Organisation Division of Mental Health (1999). SCAN: Schedules forClinical Assessment in Neuropsychiatry, Version 2.1. Geneva: World HealthOrganisation.