psychometric society officers - the education university of
TRANSCRIPT
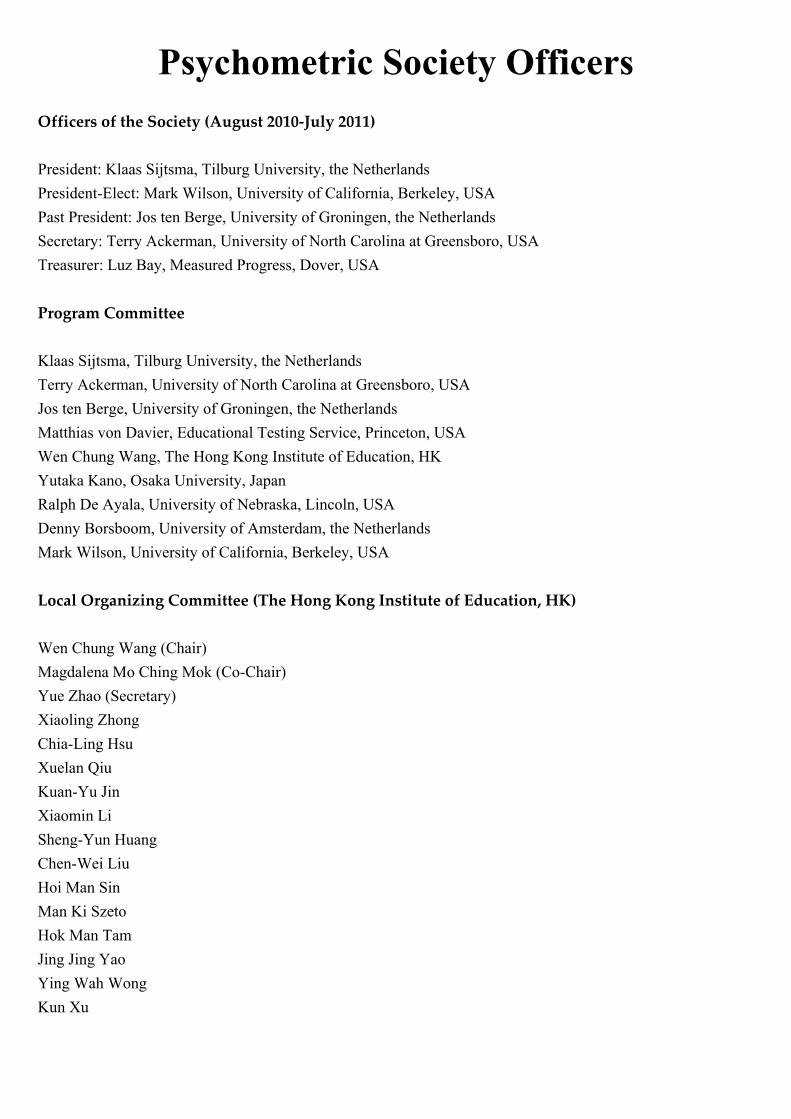
Psychometric Society Officers
Officers of the Society (August 2010‐July 2011)
President: Klaas Sijtsma, Tilburg University, the Netherlands
President-Elect: Mark Wilson, University of California, Berkeley, USA
Past President: Jos ten Berge, University of Groningen, the Netherlands
Secretary: Terry Ackerman, University of North Carolina at Greensboro, USA
Treasurer: Luz Bay, Measured Progress, Dover, USA
Program Committee
Klaas Sijtsma, Tilburg University, the Netherlands
Terry Ackerman, University of North Carolina at Greensboro, USA
Jos ten Berge, University of Groningen, the Netherlands
Matthias von Davier, Educational Testing Service, Princeton, USA
Wen Chung Wang, The Hong Kong Institute of Education, HK
Yutaka Kano, Osaka University, Japan
Ralph De Ayala, University of Nebraska, Lincoln, USA
Denny Borsboom, University of Amsterdam, the Netherlands
Mark Wilson, University of California, Berkeley, USA
Local Organizing Committee (The Hong Kong Institute of Education, HK)
Wen Chung Wang (Chair)
Magdalena Mo Ching Mok (Co-Chair)
Yue Zhao (Secretary)
Xiaoling Zhong
Chia-Ling Hsu
Xuelan Qiu
Kuan-Yu Jin
Xiaomin Li
Sheng-Yun Huang
Chen-Wei Liu
Hoi Man Sin
Man Ki Szeto
Hok Man Tam
Jing Jing Yao
Ying Wah Wong
Kun Xu

Sponsors
The Psychometric Society is very grateful to the above organizations for their generous financial support of our
2011 Annual Meeting.
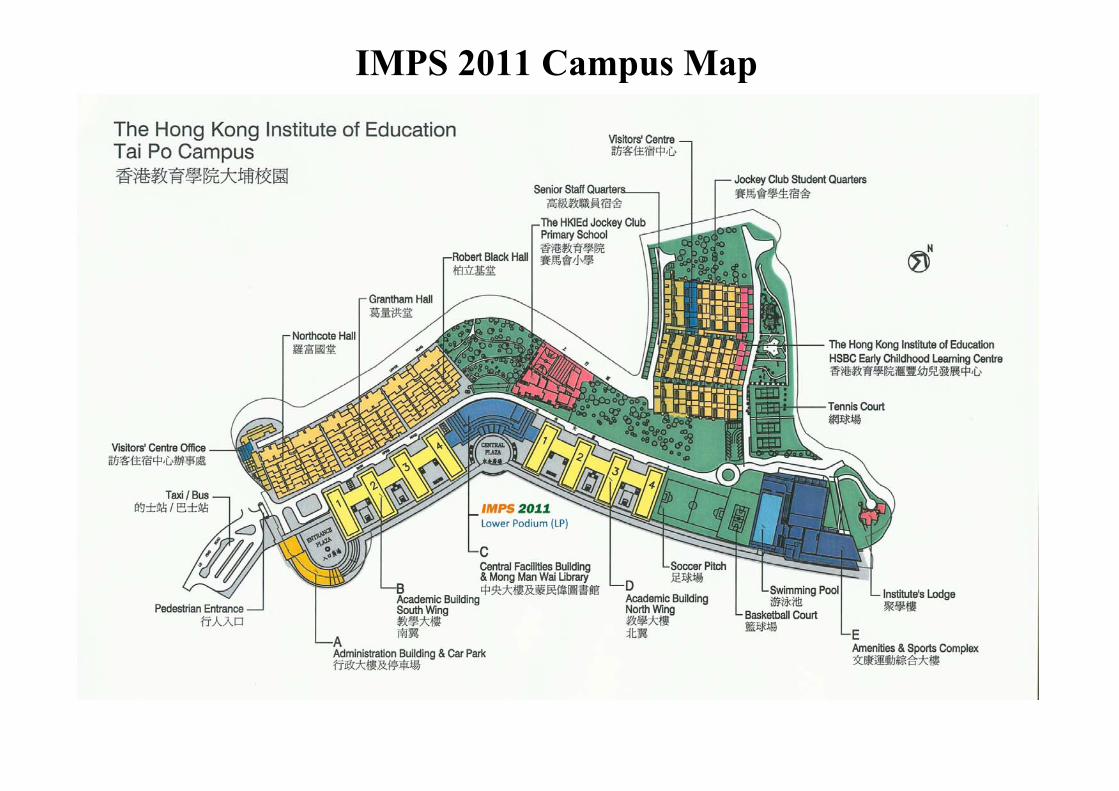
IMPS 2011 Campus Map
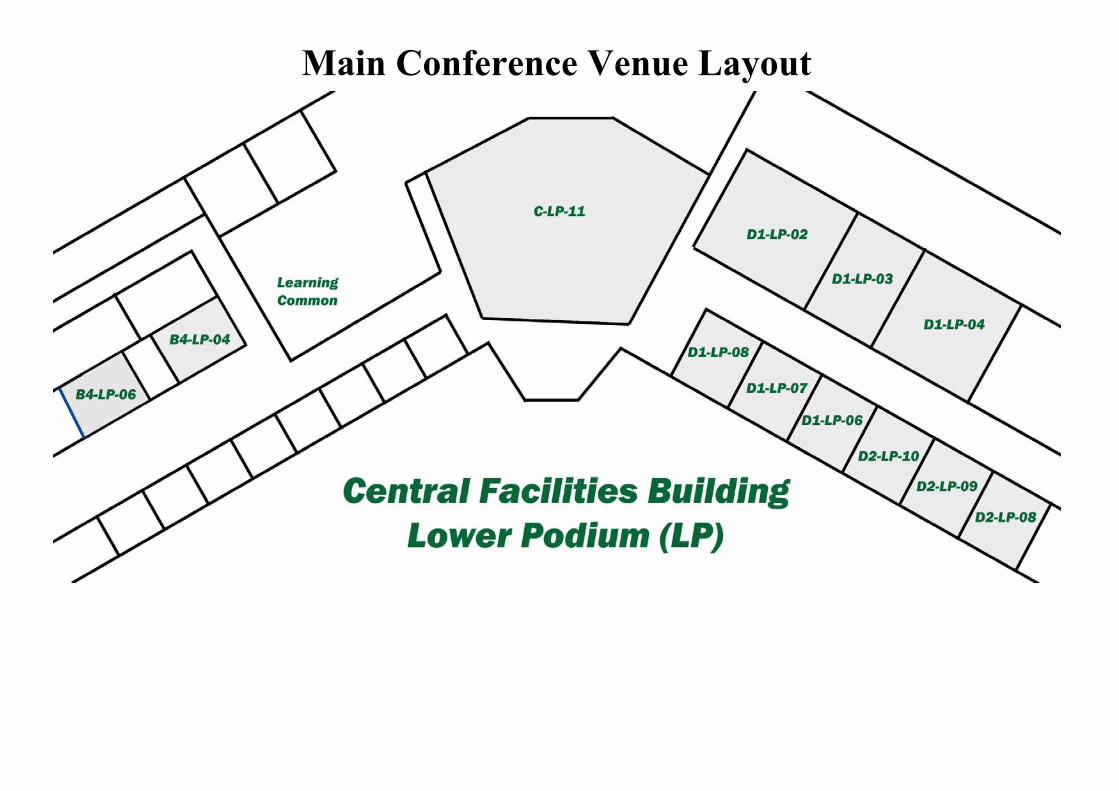
Main Conference Venue Layout

The 76th Annual and the 17th International Meeting of the Psychometric Society Page I
Schedule at a Glance
Pre-conference Workshops, Monday 18 July, 2011
9:00am - 9:30am Registration
Room C-1F-01A B2-LP-01 Bl-LP-02 B4-P-03 A-4/F-02 A-4/F-02
9:30am
-
12:00 pm
2:00 pm
-
5:00pm
Workshop:
(p. 1)
Cognitive Diagnosis
(de la Torre)
Workshop:
(p. 2)
Bayesian Evaluation
(Hoijtink, Klugkist)
Workshop:
(p. 4)
Psychometrics in R
(Rusch, Mair)
Workshop:
(p. 7)
EQSIRT
(Wu, He,
Bentler, Mair)
Editorial Council
Meeting
12:00pm
- 13:30pm
Board of
Trustees
Meeting
2:00pm
- 3:30pm
The 76th Annual and the 17th International Meeting of the Psychometric Society Page II
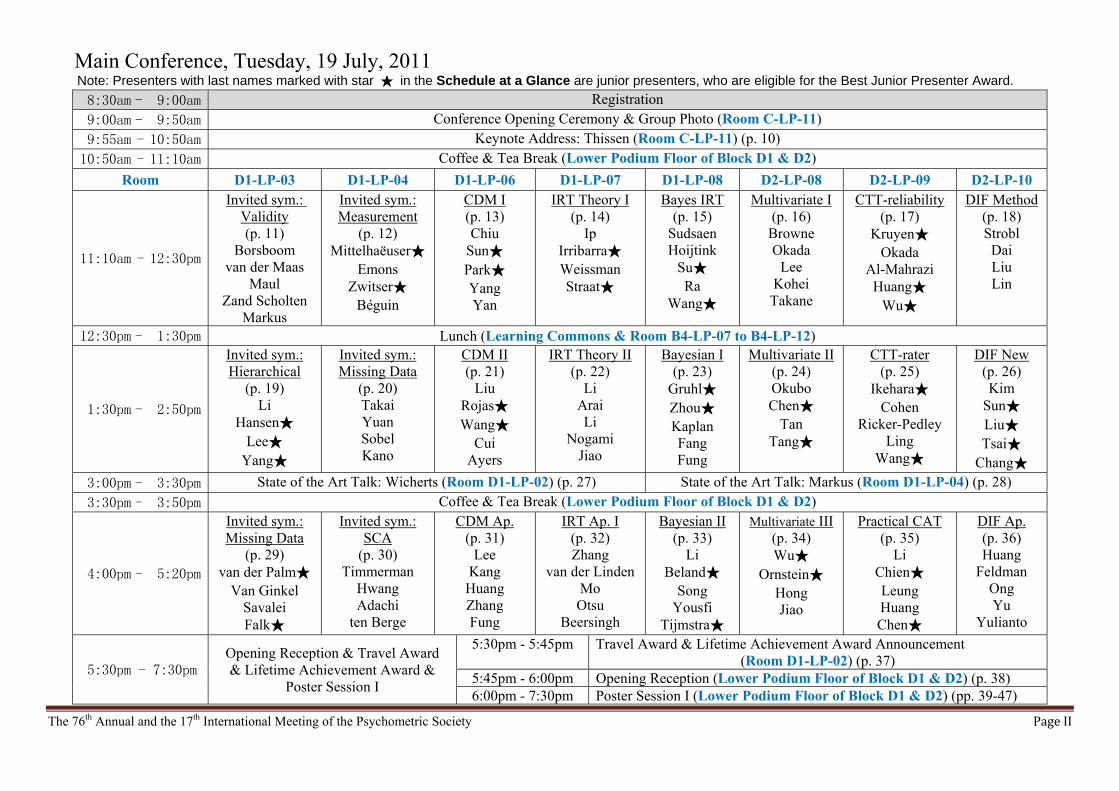
Main Conference, Tuesday, 19 July, 2011 Note: Presenters with last names marked with star ★ in the Schedule at a Glance are junior presenters, who are eligible for the Best Junior Presenter Award. 8:30am - 9:00am Registration
9:00am - 9:50am Conference Opening Ceremony & Group Photo (Room C-LP-11)
9:55am - 10:50am Keynote Address: Thissen (Room C-LP-11) (p. 10)
10:50am - 11:10am Coffee & Tea Break (Lower Podium Floor of Block D1 & D2)
Room D1-LP-03 D1-LP-04 D1-LP-06 D1-LP-07 D1-LP-08 D2-LP-08 D2-LP-09 D2-LP-10
11:10am - 12:30pm
Invited sym.: Validity (p. 11)
Borsboom van der Maas
Maul Zand Scholten
Markus
Invited sym.: Measurement
(p. 12) Mittelhaëuser★
Emons Zwitser★
Béguin
CDM I (p. 13) Chiu
Sun★ Park★ Yang Yan
IRT Theory I (p. 14)
Ip Irribarra★ Weissman Straat★
Bayes IRT (p. 15)
Sudsaen Hoijtink
Su★ Ra
Wang★
Multivariate I(p. 16)
Browne Okada
Lee Kohei Takane
CTT-reliability(p. 17)
Kruyen★ Okada
Al-Mahrazi Huang★
Wu★
DIF Method (p. 18) Strobl
Dai Liu Lin
12:30pm - 1:30pm Lunch (Learning Commons & Room B4-LP-07 to B4-LP-12)
1:30pm - 2:50pm
Invited sym.: Hierarchical
(p. 19) Li
Hansen★ Lee★
Yang★
Invited sym.: Missing Data
(p. 20) Takai Yuan Sobel Kano
CDM II (p. 21)
Liu Rojas★ Wang★
Cui Ayers
IRT Theory II (p. 22)
Li Arai Li
Nogami Jiao
Bayesian I (p. 23)
Gruhl★ Zhou★ Kaplan Fang Fung
Multivariate II(p. 24) Okubo Chen★
Tan Tang★
CTT-rater (p. 25)
Ikehara★ Cohen
Ricker-Pedley Ling
Wang★
DIF New (p. 26) Kim
Sun★ Liu★ Tsai★
Chang★
3:00pm - 3:30pm State of the Art Talk: Wicherts (Room D1-LP-02) (p. 27) State of the Art Talk: Markus (Room D1-LP-04) (p. 28)
3:30pm - 3:50pm Coffee & Tea Break (Lower Podium Floor of Block D1 & D2)
4:00pm - 5:20pm
Invited sym.: Missing Data
(p. 29) van der Palm★
Van Ginkel Savalei Falk★
Invited sym.: SCA
(p. 30) Timmerman
Hwang Adachi
ten Berge
CDM Ap. (p. 31)
Lee Kang
Huang Zhang Fung
IRT Ap. I (p. 32) Zhang
van der Linden Mo Otsu
Beersingh
Bayesian II (p. 33)
Li Beland★
Song Yousfi
Tijmstra★
Multivariate III(p. 34) Wu★
Ornstein★ Hong Jiao
Practical CAT (p. 35)
Li Chien★ Leung Huang Chen★
DIF Ap. (p. 36) Huang
Feldman Ong Yu
Yulianto
5:30pm - 7:30pmOpening Reception & Travel Award & Lifetime Achievement Award &
Poster Session I
5:30pm - 5:45pm Travel Award & Lifetime Achievement Award Announcement (Room D1-LP-02) (p. 37)
5:45pm - 6:00pm Opening Reception (Lower Podium Floor of Block D1 & D2) (p. 38) 6:00pm - 7:30pm Poster Session I (Lower Podium Floor of Block D1 & D2) (pp. 39-47)
The 76th Annual and the 17th International Meeting of the Psychometric Society Page III
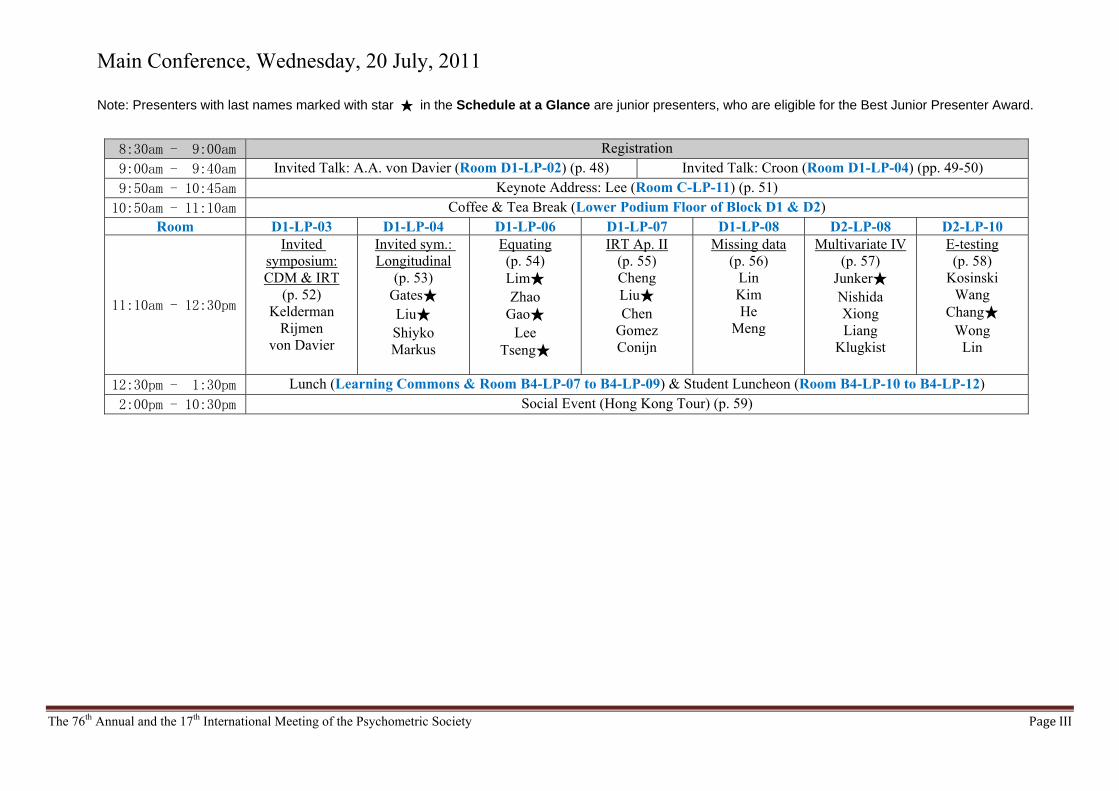
Main Conference, Wednesday, 20 July, 2011
Note: Presenters with last names marked with star ★ in the Schedule at a Glance are junior presenters, who are eligible for the Best Junior Presenter Award.
8:30am - 9:00am Registration
9:00am - 9:40am Invited Talk: A.A. von Davier (Room D1-LP-02) (p. 48) Invited Talk: Croon (Room D1-LP-04) (pp. 49-50)
9:50am - 10:45am Keynote Address: Lee (Room C-LP-11) (p. 51)
10:50am - 11:10am Coffee & Tea Break (Lower Podium Floor of Block D1 & D2) Room D1-LP-03 D1-LP-04 D1-LP-06 D1-LP-07 D1-LP-08 D2-LP-08 D2-LP-10
11:10am - 12:30pm
Invited symposium: CDM & IRT
(p. 52) Kelderman
Rijmen von Davier
Invited sym.: Longitudinal
(p. 53) Gates★ Liu★ Shiyko Markus
Equating (p. 54) Lim★ Zhao
Gao★ Lee
Tseng★
IRT Ap. II (p. 55) Cheng Liu★ Chen
Gomez Conijn
Missing data (p. 56)
Lin Kim He
Meng
Multivariate IV(p. 57)
Junker★ Nishida Xiong Liang
Klugkist
E-testing (p. 58)
Kosinski Wang
Chang★ Wong
Lin
12:30pm - 1:30pm Lunch (Learning Commons & Room B4-LP-07 to B4-LP-09) & Student Luncheon (Room B4-LP-10 to B4-LP-12)
2:00pm - 10:30pm Social Event (Hong Kong Tour) (p. 59)
The 76th Annual and the 17th International Meeting of the Psychometric Society Page IV
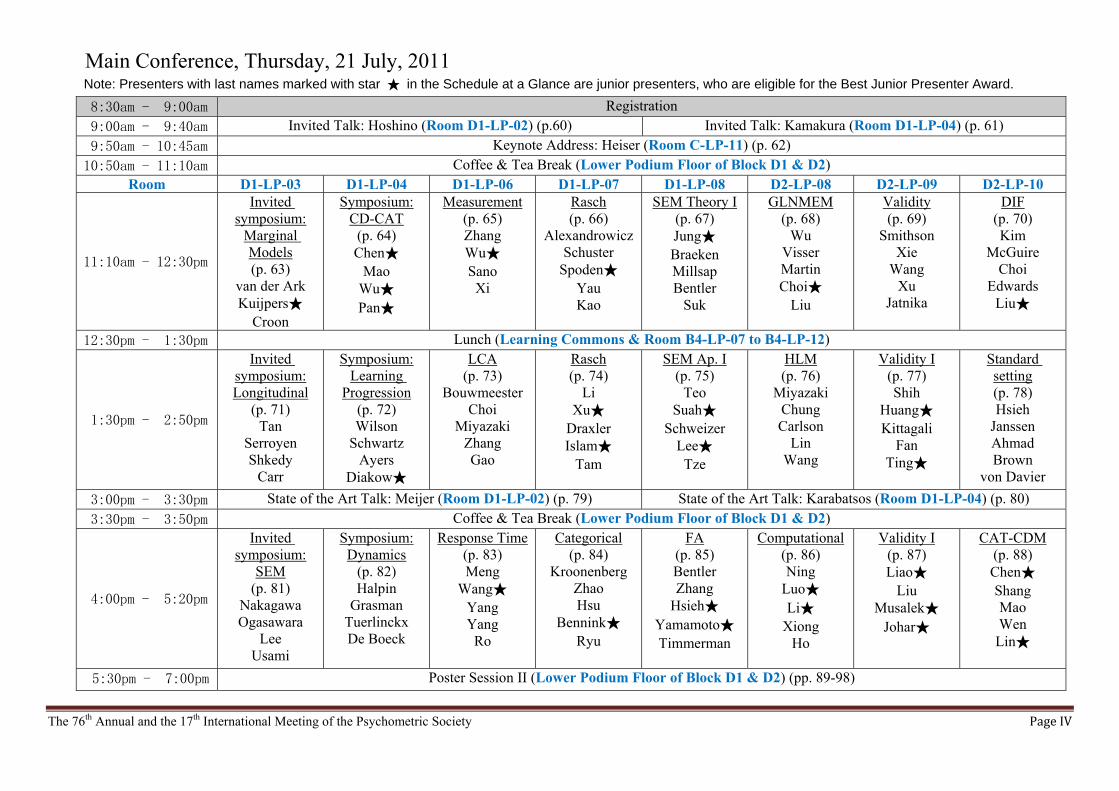
Main Conference, Thursday, 21 July, 2011 Note: Presenters with last names marked with star ★ in the Schedule at a Glance are junior presenters, who are eligible for the Best Junior Presenter Award.
8:30am - 9:00am Registration
9:00am - 9:40am Invited Talk: Hoshino (Room D1-LP-02) (p.60) Invited Talk: Kamakura (Room D1-LP-04) (p. 61)
9:50am - 10:45am Keynote Address: Heiser (Room C-LP-11) (p. 62)
10:50am - 11:10am Coffee & Tea Break (Lower Podium Floor of Block D1 & D2) Room D1-LP-03 D1-LP-04 D1-LP-06 D1-LP-07 D1-LP-08 D2-LP-08 D2-LP-09 D2-LP-10
11:10am - 12:30pm
Invited symposium:
Marginal Models (p. 63)
van der Ark Kuijpers★
Croon
Symposium: CD-CAT
(p. 64) Chen★
Mao Wu★ Pan★
Measurement (p. 65) Zhang Wu★ Sano
Xi
Rasch (p. 66)
Alexandrowicz Schuster
Spoden★ Yau Kao
SEM Theory I(p. 67) Jung★ Braeken Millsap Bentler
Suk
GLNMEM (p. 68)
Wu Visser Martin Choi★
Liu
Validity (p. 69)
Smithson Xie
Wang Xu
Jatnika
DIF (p. 70) Kim
McGuire Choi
Edwards Liu★
12:30pm - 1:30pm Lunch (Learning Commons & Room B4-LP-07 to B4-LP-12)
1:30pm - 2:50pm
Invited symposium: Longitudinal
(p. 71) Tan
Serroyen Shkedy
Carr
Symposium: Learning
Progression (p. 72) Wilson
Schwartz Ayers
Diakow★
LCA (p. 73)
Bouwmeester Choi
Miyazaki Zhang Gao
Rasch (p. 74)
Li Xu★
Draxler Islam★
Tam
SEM Ap. I (p. 75)
Teo Suah★
Schweizer Lee★
Tze
HLM (p. 76)
Miyazaki Chung Carlson
Lin Wang
Validity I (p. 77) Shih
Huang★ Kittagali
Fan Ting★
Standard setting (p. 78) Hsieh
Janssen Ahmad Brown
von Davier
3:00pm - 3:30pm State of the Art Talk: Meijer (Room D1-LP-02) (p. 79) State of the Art Talk: Karabatsos (Room D1-LP-04) (p. 80)
3:30pm - 3:50pm Coffee & Tea Break (Lower Podium Floor of Block D1 & D2)
4:00pm - 5:20pm
Invited symposium:
SEM (p. 81)
Nakagawa Ogasawara
Lee Usami
Symposium: Dynamics
(p. 82) Halpin
Grasman Tuerlinckx De Boeck
Response Time(p. 83) Meng
Wang★ Yang Yang
Ro
Categorical (p. 84)
Kroonenberg Zhao Hsu
Bennink★ Ryu
FA (p. 85) Bentler Zhang
Hsieh★ Yamamoto★ Timmerman
Computational(p. 86) Ning
Luo★ Li★
Xiong Ho
Validity I (p. 87) Liao★
Liu Musalek★
Johar★
CAT-CDM (p. 88) Chen★ Shang Mao Wen
Lin★
5:30pm - 7:00pm Poster Session II (Lower Podium Floor of Block D1 & D2) (pp. 89-98)
The 76th Annual and the 17th International Meeting of the Psychometric Society Page V
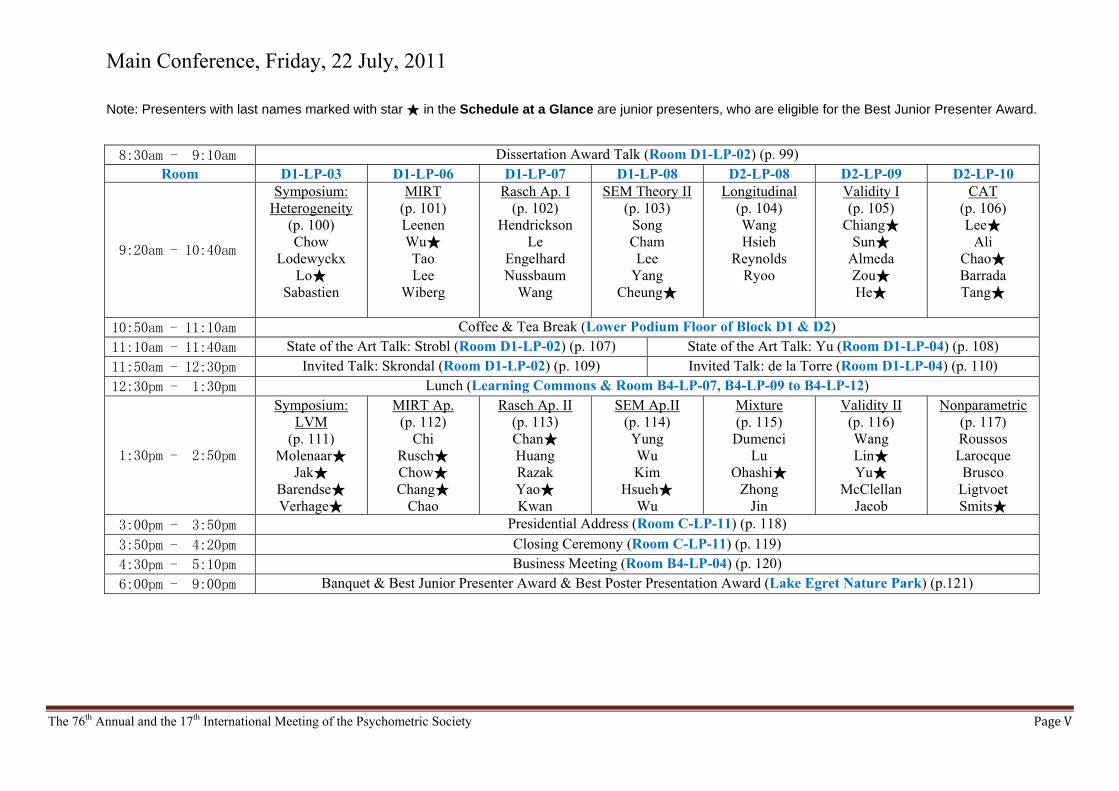
Main Conference, Friday, 22 July, 2011
Note: Presenters with last names marked with star ★ in the Schedule at a Glance are junior presenters, who are eligible for the Best Junior Presenter Award.
8:30am - 9:10am Dissertation Award Talk (Room D1-LP-02) (p. 99) Room D1-LP-03 D1-LP-06 D1-LP-07 D1-LP-08 D2-LP-08 D2-LP-09 D2-LP-10
9:20am - 10:40am
Symposium: Heterogeneity
(p. 100) Chow
Lodewyckx Lo★
Sabastien
MIRT (p. 101) Leenen Wu★ Tao Lee
Wiberg
Rasch Ap. I (p. 102)
Hendrickson Le
Engelhard Nussbaum
Wang
SEM Theory II(p. 103)
Song Cham Lee
Yang Cheung★
Longitudinal (p. 104) Wang Hsieh
Reynolds Ryoo
Validity I (p. 105)
Chiang★ Sun★
Almeda Zou★ He★
CAT (p. 106) Lee★
Ali Chao★ Barrada Tang★
10:50am - 11:10am Coffee & Tea Break (Lower Podium Floor of Block D1 & D2)
11:10am - 11:40am State of the Art Talk: Strobl (Room D1-LP-02) (p. 107) State of the Art Talk: Yu (Room D1-LP-04) (p. 108)
11:50am - 12:30pm Invited Talk: Skrondal (Room D1-LP-02) (p. 109) Invited Talk: de la Torre (Room D1-LP-04) (p. 110)
12:30pm - 1:30pm Lunch (Learning Commons & Room B4-LP-07, B4-LP-09 to B4-LP-12)
1:30pm - 2:50pm
Symposium: LVM
(p. 111) Molenaar★
Jak★ Barendse★ Verhage★
MIRT Ap. (p. 112)
Chi Rusch★ Chow★ Chang★
Chao
Rasch Ap. II (p. 113) Chan★ Huang Razak Yao★ Kwan
SEM Ap.II (p. 114) Yung Wu Kim
Hsueh★ Wu
Mixture (p. 115)
Dumenci Lu
Ohashi★ Zhong
Jin
Validity II (p. 116) Wang Lin★ Yu★
McClellan Jacob
Nonparametric (p. 117) Roussos Larocque Brusco
Ligtvoet Smits★
3:00pm - 3:50pm Presidential Address (Room C-LP-11) (p. 118)
3:50pm - 4:20pm Closing Ceremony (Room C-LP-11) (p. 119)
4:30pm - 5:10pm Business Meeting (Room B4-LP-04) (p. 120)
6:00pm - 9:00pm Banquet & Best Junior Presenter Award & Best Poster Presentation Award (Lake Egret Nature Park) (p.121)

The 76th Annual and the 17th International Meeting of the Psychometric Society Page VI
Workshop Registration Includes (18 July 2011)
Admission to the workshop registered.
Note: Lunch and coffee & tea break are not included in the workshop registration.
Main Conference Registration Includes (19 - 22 July 2011)
● Admission to all events during the conference
● Participant bag containing IMPS 2011 Final Program
● Snacks, coffee and tea in the coffee & tea breaks
● Lunches on 19 through 22 July
● Conference banquet on 22 July (Alcoholic drink is not included)
Guest Registration Includes (19 - 22 July 2011)
● Snacks, coffee and tea in the coffee & tea breaks
● Lunches on 19 through 22 July
● Conference banquet on 22 July (Alcoholic drinks is not included)
(Participant bag containing IMPS 2011 Final Program and the admission to all events during
the conference are not included.)
The 76th Annual and the 17th International Meeting of the Psychometric Society Page VII
TABLE OF CONTENT
SCHEDULE AT A GLANCE ................................................................................................... I
PRE-CONFERENCE WORKSHOPS, MONDAY 18 JULY, 2011 ......................................... 1
MAIN CONFERENCE, TUESDAY, 19 JULY, 2011 .............................................................. 9
MAIN CONFERENCE, WEDNESDAY, 20 JULY, 2011...................................................... 48
MAIN CONFERENCE, THURSDAY, 21 JULY, 2011 ......................................................... 60
MAIN CONFERENCE, FRIDAY, 22 JULY, 2011 ................................................................ 99
AUTHOR INDEX ................................................................................................................. 122
GENERAL INFORMATION ................................................................................................ 133
The 76th Annual and the 17th International Meeting of the Psychometric Society Page 1
Pre-conference Workshops, Monday 18 July, 2011 Cognitive Diagnosis Modeling: A General Framework Approach
Monday, 18 July, 9:30 a.m. -- 5:00 p.m., C-1F-01A (Library eLeaning Studio) Jimmy de la Torre, Rutgers, The State University of New Jersey, USA
Abstract
The primary aim of skills or cognitive diagnosis is to develop and analyze tests in ways that
reveal information with more diagnostic value, when compared with traditional approaches.
In the methods for cognitive diagnosis that we consider mastery of a finite set of skills can be
represented by a list of binary latent variables. The main objective of cognitive diagnosis is to
classify examinees according to this list of skills. This workshop aims to provide both the
theoretical underpinnings and practical experience necessary for participants to use cognitive
diagnosis modeling in applied settings.
The theoretical component of the workshop will provide a comprehensive overview of
cognitive diagnosis modeling, and will include the following topics: what is the cognitive
diagnosis modeling paradigm and how it differs from the traditional unidimensional
framework, what steps are involved in attribute identification and validation, what is the
Q-matrix and what role does it play in cognitive diagnosis modeling, what are some of the
commonly used cognitive diagnosis models and how are they related to each other, how are
model parameters estimated and how is model-data fit evaluated, how are cognitive diagnosis
models compared and selected, and what procedures are involved in constructing an
optimally diagnostic assessment.
The practical component of the workshop will provide participants with a hands-on
experience on the different aspects of cognitive diagnosis modeling through various exercises.
Participants will learn how to identify attributes, construct appropriate tasks given some
attribute specifications, validate attributes and tasks, run computer codes to estimates
different cognitive diagnosis models, compare fits of competing models at the item and test
level, empirically evaluate the appropriateness of a Q-matrix, and construct a test based on a
specific set of constraints and given a pool of calibrated items.
The 76th Annual and the 17th International Meeting of the Psychometric Society Page 2
Bayesian Evaluation of Informative Hypotheses
Monday, 18 July, 9:30 a.m. -- 5:00 p.m., B2-LP-01 Herbert Hoijtink and Irene Klugkist, University Utrecht, the Netherlands
Abstract
Are you happier if a p-value is .049 rather than .051? Did you ever have trouble finding a
meaningful interpretation upon finding one or more significant test results? Did you ever
worry about the interpretation of p-values when testing more than one hypothesis? Do you
like large sample sizes because more tests will be significant? Did you ever quit a research
project because none of the tests were significant? If you answer “yes” to one or more of
these questions, and if you have one or more theories with respect to the state of affairs in
you research domain, this course may be useful because it will temper your happiness, reduce
your trouble, address your worries, discuss your liking, and provide an alternative for quitting
by teaching you a new way to analyze your data: Bayesian evaluation of informative
hypotheses.
Null-hypothesis testing is an important tool in social scientific research. It can be used to
make inferences with respect to the unknown state of affairs in a population of interest. The
null-hypothesis is usually of the type “nothing is going on” and the alternative hypothesis
usually states “something is going on but I don’t know what”, to give an example: H0:
m1=m2=m3=m4, that is, the four means are equal, versus H1: m1,m2,m3,m4, that is, the four
means are not all equal. First of all it is questionable whether a population where “nothing is
going on” is a serious option (“something which is irrelevant is going on” is probably a better
option). Secondly, if a test indicates that H0 should be rejected, we have to conclude that
“something is going on but I don’t know what”, which is not very informative.
In this course Bayesian evaluation of informative hypotheses will be introduced as an
alternative for null-hypothesis testing. An informative hypothesis contains a researcher’s
expectation with respect to the state of affairs in the population of interest. If he expects four
means to be ordered the hypothesis might be H2a: m1>m2>m3>m4, where > denotes larger
than. If another scientist has other expectations, a competing hypothesis can be formulated
e.g. H2b: m1<m2>m3=m4. It will be shown that Bayesian model selection can be used to
evaluate H2a, H2b and, if desired, in addition H0 and H1, without suffering from the
drawbacks of hypothesis testing using p-values sketched in the introduction.
Further information about informative hypotheses (applications, publications, dissertations
and software) can be found at http://tinyurl.com/informativehypotheses. The slides to be used
during the workshop and an accessible paper worthwhile reading before attending the
The 76th Annual and the 17th International Meeting of the Psychometric Society Page 3
workshop can be found at http://tinyurl.com/hoijtink under “Side line activities” at the bottom
of the page, in the first week of June 2011.
References (go to http://tinyurl.com/informativehypotheses for more information)
Hoijtink, H., Klugkist, I. and Boelen, P.A. (2008). Bayesian evaluation of informative
hypotheses. New York: Springer.
Klugkist, I., Laudy, O. and Hoijtink, H. (2005). Inequality Constrained Analysis Of Variance:
A Bayesian Approach. Psychological Methods, 10 (4), 477-493
Klugkist, I. and Hoijtink, H. (2007). The Bayes Factor for Inequality and About Equality
Constrained Models. Computational Statistics and Data Analysis, 51, 6367-6379.
Kuiper, R. M., Klugkist, I. & Hoijtink, H. (2010). A Fortran 90 Program for Confirmatory
Analysis of Variance. Journal of Statistical Software, 34, 1-31.
Kuiper, R. M. and Hoijtink, H. (2010). Comparisons of Means Using Exploratory and
Confirmatory Approaches. Psychological Methods, 15, 69-86.
Mulder, J., Klugkist, I., van de Schoot, R., Meeus, W., Selfhout, M. and Hoijtink, H. (2009).
Bayesian model selection of informative hypotheses for repeated measurements. Journal of
Mathematical Psychology, 53, 530-546.
Mulder, J., Hoijtink, H. and Klugkist, I. (2010). Equality and inequality constrained
multivariate linear models: objective model selection using constrained posterior priors.
Journal of Statistical Planning and Inference, 140, 887-906.

The 76th Annual and the 17th International Meeting of the Psychometric Society Page 4
Psychometrics in R
Monday, 18 July, 9:30 a.m. -- 5:00 p.m., B1-LP-02 Thomas Rusch and Patrick Mair, Vienna University of Economics and Business, Austria
Abstract
Over the last few years the R Open Source environment for statistical computing has become
one of the most popular analysis tool in the field of computational statistics. Recently,
numerous packages in the area of Psychometrics have been implemented.
The striking features of R are the following: R is Open Source which means that it is freely
available and the user has full insight into the source code. R consists of a base distribution
that includes the vector and matrix oriented R language and contains basic statistical
techniques. In addition to this base distribution more than 2700 add-on packages are available
freely for download via the Comprehensive R Archive Network (CRAN). These packages are
implemented in a standardized manner which means that once the user has gained
understanding of basic R concepts, he or she can use all of these packages in the same way.
Another striking feature is that everything in R is stored as an object. Thus, results are not
static text output but can be post-processed by means of additional data manipulation or used
for subsequent analysis. Finally, it has to be mentioned that R has a powerful plot engine.
Graphical outputs are highly customizable and can be plotted on a level suitable for journal
publication.
The aim of this workshop is to teach participants the basic concepts of the R language and the
R environment, respectively, and show them how to use R for basic statistical and advanced
psychometric modeling. No prior R experience is needed in order to follow the workshop.
The workshop consists of three modules: The first module, “R Introduction and R
programming” deals with basic concepts and the organization of R. It introduces the R
language by means of psychometric examples. We start with a “tour” of the CRAN
(Comprehensive R Archive Network) repository, show important on-line resources such as
manuals, the R-help repository, and subject-specific task views. We explain how to import
external datasets and how to install and load packages. Furthermore, we examine which data
types exist in R and how to sub-select or extract elements from these data types. A core
emphasis of this module is the use of R functions which we introduce in a conceptual way
(help files, arguments, values). Finally, since R is matrix oriented, we show some basic
matrix computations which should help the participants to implement their newly developed
methods in R. Throughout the modules we will also show possibilities for plotting data and
corresponding results using the R plot engine.
The second module introduces basic statistical modeling where we focus on linear and
generalized linear models. The corresponding “glm” function is very powerful and versatile
The 76th Annual and the 17th International Meeting of the Psychometric Society Page 5
and works with a simple formula syntax for model specification which will be explained in
detail. As a slightly advanced topic the computation of (generalized) linear mixed-effects
models (e.g., multilevel models) using the “lme4” package will be demonstrated. The
corresponding “lmer” function can be used in a similar fashion as the “glm” function.
The third module is all about psychometric methods in R. We start with some descriptive
multivariate techniques for categorical data such as correspondence analysis and Gifi
methods (“homals”). As an additional exploratory approach we will demonstrate the
“smacof” package for multidimensional scaling. Briefly, it will be shown how classical test
theory can be performed in R. A strong emphasis of this module is on item response models.
We will focus on the “eRm” package for extended Rasch models and the “ltm" package for
higher parameterized IRT models. Within this context we will also point out the computation
of non-parametric IRT (“mokken” package) and multidimensional IRT models using
“MCMCpack”. Finally, we will demonstrate the computation of classical latent variable
methods such as simple factor analysis and structural equation models using the newly
developed package “lavaan”.
Throughout the workshop we use real-life datasets from the psychometric area. All datasets,
the full R code file and additional materials will be available at
http://statmath.wu.ac.at/~mair/IMPS2011/
prior to the workshop such that the participants can fully reproduce our demonstrations. At
the end of the workshop the participants will have a conceptual and technical understanding
of R such that they can use this environment for their own analyses and hopefully have a
starting point for implementing their own methods.
Links:
Main R website: http://R-project.org
CRAN download repository: http://CRAN.R-project.org
Psychometrics task view: http://cran.r-project.org/web/views/Psychometrics.html
Suggested code editors:
Tinn-R under Windows OS: http://www.sciviews.org/Tinn-R/
Aquamacs for Mac OS: http://aquamacs.org/
Emacs including ESS for Linux: http://ess.r-project.org/
The 76th Annual and the 17th International Meeting of the Psychometric Society Page 6
Selected Books:
Venables, W. N., & Smith, D. M. (2002). An Introduction to R. Bristol, UK: Network Theory.
Freely available at http://cran.r-project.org/doc/manuals/R-intro.pdf.
Dalgaard, P. (2008). Introductory Statistics with R. New York: Springer.
Chambers, J. (2008). Software for Data Analysis: Programming with R. New York: Springer.
Adler, J. (2010). R in a Nutshell. Sebastopol, CA: O'Reilly.
Crawley, M. J. (2008). The R Book. Chichester, UK: Wiley.
Selected Articles: (freely available at http://www.jstatsoft.org)
Mair, P., & Hatzinger, R. (2007). Extended Rasch modeling: The eRm package for the
application of IRT models in R. Journal of Statistical Software, 20(9), 1-20.
de Leeuw, J., & Mair, P. (2009b). Multidimensional scaling using majorization: SMACOF in
R. Journal of Statistical Software, 31(3), 1-30.
de Leeuw, J., & Mair, P. (2009a). Gifi methods for optimal scaling in R: The package homals.
Journal of Statistical Software, 31(4), 1-21.
Rizopoulos, D. (2006). ltm: An R Package for Latent Variable Modeling and Item Response
Analysis, Journal of Statistical Software, 17(5), 1-25.
van der Ark, L. A. (2007). Mokken Scale Analysis in R. Journal of Statistical Software,
20(11), 1-19.
The 76th Annual and the 17th International Meeting of the Psychometric Society Page 7
EQSIRT: A New Software for IRT Modeling
Monday, 18 July, 9:30 a.m. -- 5:00 p.m., B4-P-03 Eric Wu, Sam He, Peter M. Bentler, and Patrick Mair, University of California, Los Angeles,
and Multivariate Software, Inc., USA
Abstract
In this workshop we present a new, comprehensive and user-friendly IRT software by
Multivariate Software, Inc., who have been developing the EQS software for Structural
Equation Modeling.
The target group of the workshop are applied researchers who are interested in a easy-to-use
software for their IRT computations. This workshop will introduce the software and will
show the capabilities of the program with respect to many different IRT models using
real-life use-cases. At the end of the day the participants will have a detailed overview of the
software and the corresponding models such that they can do their own IRT computations
using EQSIRT.
The first of the three modules starts with a general introduction into the software including
the graphical user interface and the EQS-like syntax. We explain basic options for data
handling and manipulation as well as descriptive analysis. Then, we move on with binary IRT
models such as the Rasch model, 2-PL, and 3-PL. An interesting option offered by the
software is the possibility to put restrictions on the item parameters (equality restrictions as
well as fixing parameters onto a certain value).
With respect to classical polytomous models we are going to present the rating scale model,
the partial credit model, the graded response models, and the nominal response model.
In general, the basic estimation setting is a MML approach which also allows for spline
approximation of the latent trait. Optionally, item parameters can also be estimated in a
MCMC way. Similarly, for the person parameters we provide ML as well as Bayesian
routines. In this module we are also going to discuss relevant goodness-of-fit measures and
various IRT plots.
Module 2 addresses the highly relevant issue of dimensionality assessment. We present the
implementation for categorical factor analysis (FIML, MCEM, tetrachoric/polychoric
correlations). Within this context multidimensional IRT extensions of the basic models
addressed above are explained in detail. In the program we use MCMC to estimate the
parameters.
The 76th Annual and the 17th International Meeting of the Psychometric Society Page 8
In the afternoon, module 3 is about IRT models with covariates. We start with DIF and
multiple-group computations. The core aspect of this model is a non-linear mixed-effects IRT
model framework that allows for the inclusion of covariates; either as fixed-effects or random
effects. This extends the framework proposed in the book by de Boeck and Wilson (2002).
Links:
Main R website: http://www.mvsoft.com/
Selected Books:
Baker, F. B., & Kim, S. H. (2004). Item Response Theory: Parameter Estimation Techniques.
New York: Dekker.
Embretson, S. E., & Reise, S. (2000). Item Response Theory for Psychologists. Mahwah, NJ:
Lawrence Erlbaum Associates.
De Ayala, R. J. (2009). The Theory and Practice of Item Response Theory. New York:
Guilford Press.
De Boeck, P. and Wilson, M. (2004). Explanatory Item Response Models: A Generalized
Linear and Nonlinear Approach. New York: Springer.
Reckase, M. (2009). Multidimensional Item Response Theory. New York: Springer.
Selected Articles:
Woods, C. M., & Thissen, D. (2006). Item response theory with estimation of the latent
population distribution using spline-based densities. Psychometrika, 71, 281-301.
Sheng, Y. (2010). Bayesian estimation of MIRT models with general and specific latent traits
in MATLAB. Journal of Statistical Software, 34(3), 1-27.
Bentler, Jennrich (2011). He, S., Mair, P., Wu, E., & Bentler, P. M. (2011). A nonlinear mixed model approach to item response theory.
The 76th Annual and the 17th International Meeting of the Psychometric Society Page 9
Main Conference, Tuesday, 19 July, 2011
Conference Opening Ceremony & Group Photo
Tuesday, 19 July, 9:00 a.m. -- 9:50 a.m., C-LP-11
All participants are warmly invited to attend the Conference Opening Ceremony.
Rundown:
Welcome Speech by Professor Anthony B. L. Cheung, President of The Hong Kong
Institute of Education
Welcome Speech by Professor Klaas Sijtsma, President of Psychometric Society
Welcome Speech by Professor Wen Chung Wang, Chair of Local Organizing
Committee.
Music Performance
Information Session and Announcement
Group Photo
The 76th Annual and the 17th International Meeting of the Psychometric Society Page 10
Keynote Address: Psychometric Engineering Redux: Making a PROMIS○R
Tuesday, 19 July, 9:55 a.m. -- 10:50 a.m., C-LP-11
Presenter:
David Thissen, University of North Carolina at Chapel Hill, USA
Over the past century, a relatively small number of applied government-related projects in the
United States have had enormous subsequent impact on psychometrics in its narrow
definition: psychological measurement or test theory. Early examples include the
development of Army Alpha and Beta in 1917-18 (and the Woodworth Personal Data Sheet
in 1919), the Aviation Psychology Program to use psychological tests for flight-crew
selection, a project to select agents for the Office of Strategic Services subsequently reported
as The Assessment of Men, and The American Soldier studies in the 1940s. In the second half
of the twentieth century, support from the U.S. Office of Naval Research and the Air Force
Office of Scientific Research funded a great deal of development of item response theory
(IRT) in the 1960s, 70s, and 80s, with the goal of making the Armed Services Vocational
Aptitude Battery (ASVAB) a computerized adaptive test. The “new design” of the National
Assessment of Educational Progress (NAEP) by the Educational Testing Service for the
National Center of Education Statistics involved further development of IRT. In the first
decade of the 21st century, the Patient Reported Outcomes Measurement Information System
(PROMIS®) initiative, funded by the National Institutes of Health (NIH), has been a stimulus
to take the theoretical development of IRT to new levels. This presentation includes a brief
review of some contributions from the earlier projects, and descriptions of some of the
psychometric advances attributable (in part) to PROMIS. The metamessage remains that
applied problems inspire basic psychometric research.
Chair:
Terry Ackerman, University of North Carolina at Greensboro, USA
The 76th Annual and the 17th International Meeting of the Psychometric Society Page 11
Invited Symposium : Validity Theory
Tuesday, 19 July, 11:10 a.m. -- 12:30 a.m., D1-LP-03
Organizer:
Denny Borsboom, University of Amsterdam, the Netherlands
Presenters (marked with asterisks):
How to Think About the Relation Between Constructs and Observations
Denny Borsboom*, University of Amsterdam, the Netherlands
The Relation Between Process Models for Decision Making and Latent Variable
Models for Individual Differences
Han van der Maas*, University of Amsterdam, the Netherlands
Method Effects: Concepts and Models
Andrew Maul*, University of Oslo, Norway
The Guttman-Rasch Paradox: Why The Interval Level Of Measurement
Unparadoxically Goes Poof When Precision Increases
Annemarie Zand Scholten*, University of Amsterdam, the Netherlands
Score Interpretation: The Goldilocks Model
Keith A. Markus*, The City University of New York, USA
The 76th Annual and the 17th International Meeting of the Psychometric Society Page 12
Invited Symposium : Issues in Educational Measurement and Examinations
Tuesday, 19 July, 11:10 a.m. – 12:30 a.m., D1-LP-04
Organizer:
Anton Béguin, Cito Institute of Educational Measurement, The Netherlands
Presenters (marked with asterisks):
Using Mixed IRT Models to Compare the Effectiveness of Different Linking Designs:
The Internal Anchor versus the External Anchor and Pre-Test Data
Marie-Anne Mittelhaëuser*, Cito Institute of Educational Measurement/Tilburg University,
The Netherlands
Anton Béguin, Cito Institute of Educational Measurement, The Netherlands
Klaas Sijtsma, Tilburg University, The Netherlands
On the Usefulness of Latent Variable Hybrid Models for Detecting Unobserved Person
Heterogeneity and Person Misfit in Educational Testing
Wilco Emons*, Tilburg University, The Netherlands
Complex Decision Rules and Misclassification: Who Should Take a Retest?
Robert Zwitser*, Cito Institute of Educational Measurement, The Netherlands
Vertical Comparison Using Reference Sets
Anton Béguin*, Cito Institute of Educational Measurement, The Netherlands
Saskia Wools, Cito Institute of Educational Measurement, The Netherlands
The 76th Annual and the 17th International Meeting of the Psychometric Society Page 13
Parallel Session: Cognitive Diagnosis Modeling - Theory I
Tuesday, 19 July, 11:10 a.m. -- 12:30 p.m., D1-LP-06
Presenters (marked with asterisks):
A Model-Free Approach to Cognitive Diagnosis: Robustness Under Misspecification
and Implications for Latent Structure Identification
Chia-Yi Chiu*, Rutgers, The State University of New Jersey, US
A Cognitive Diagnosis Method Based on Q-Matrix and Generalized Distance
Jianan Sun*, Beijing Normal University, China
Shumei Zhang, Beijing Normal University,China
Tao Xin, Beijing Normal University,China
Yu Bao, Beijing Normal University,China
Mixture Higher-Order DINA Model for Differential Attribute Functioning
Yoon Soo Park*, Columbia University, USA
Young-Sun Lee, Columbia University, USA
A Hybrid Model of HO-IRT and HO-DINA Models
Chih-Wei Yang*, National Taichung University of Education, Taiwan
Bor-Chen Kuo, National Taichung University of Education, Taiwan
Research on Factors Influencing Diagnostic Accuracy in AHM and DINA
Yuanhai Yan*,Jiangxi Normal University, China
Shuliang Ding, Jiangxi Normal University, China
Moderator:
Mark Wilson, University of California, Berkeley, USA
The 76th Annual and the 17th International Meeting of the Psychometric Society Page 14
Parallel Session: Item Response Theory - Methodology I
Tuesday, 19 July, 11:10 a.m. -- 12:30 p.m., D1-LP-07
Presenters (marked with asterisks):
Projective IRT for Purified Constructs
Edward Ip*, Wake Forest University, USA
Model Selection for Tenable Assessment: Selecting a Latent Variable Model by Testing
the Assumed Latent Structure
David Torres Irribarra*, University of California at Berkeley, USA
Ronli Diakow, University of California at Berkeley, USA
Optimum Information Bounds for IRT Models
Alexander Weissman*, Law School Admission Council, USA
A New Scaling Procedure Based on Conditional Association for Assessing IRT Model
Fit
Hendrik Straat*, Tilburg University, Netherlands
Andries van der Ark, Tilburg University, Netherlands
Klaas Sijtsma, Tilburg University, Netherlands
Moderator:
Paul De Boeck, University of Amsterdam & K.U.Leuven, The Netherlands/ Belgium
The 76th Annual and the 17th International Meeting of the Psychometric Society Page 15
Parallel Session: Bayesian Methods in Item Response Theory
Tuesday, 19 July, 11:10 a.m. -- 12:30 p.m., D1-LP-08
Presenters (marked with asterisks):
Variational Bayesian Approximation Method for Inference in Item Response Models
Pattarasuda Sudsaen*, The University of New South Wales, Australia
Bayesian Person Fit Evaluation: A Non-Parametric Approach
Herbert Hoijtink*, Methods and Statistics/University Utrecht, Netherlands
Sebastien Beland, Universite Du Quebec a Montreal, Netherlands
Extensions and Applications of Higher-Order Item Response Theory Models
Chi-Ming Su*, National Chung Cheng University, Taiwan
Wen Chung Wang, The Hong Kong Institute of Education, Hong Kong
Impacts of Prior Distributions in Testlet IRT model
Jongmin Ra*, The University of Georiga, USA
Seock-Ho Kim, The University of Georgia, USA
The Exploration and Comparison of the Ability Estimation Methods for
Multidimensional Test
Yue Wang*, Beijing Normal University, China
Hongyun Liu, Beijing Normal University, China
Moderator:
Brian Junker, Carnegie Mellon University, USA
The 76th Annual and the 17th International Meeting of the Psychometric Society Page 16
Parallel Session: Multivariate Data Analysis I
Tuesday, 19 July, 11:10 a.m. -- 12:30 p.m., D2-LP-08
Presenters (marked with asterisks):
Rotation to Higher Order Invariance In Dynamic Factor Analysis
Michael Browne*, The Ohio State University, USA
Guangjian Zhang, The University of Notre Dame, USA
Analysis of Brand Switching Among Sliced Cheese by Asymmetric Multidimensional
Scaling
Akinori Okada*, Tama University, Japan
Tsurumi Hiroyuki, Yokohama National University, Japan
Maximum Entropy Procedure, A Univariate Discrete and Continuous Distributions
Simulating Procedure with the Parameter Constraints
Yen Lee*, National Cheng Kung University, Taiwan
Chung-Ping Cheng, National Cheng Kung University, Taiwan
Nonsingular Transformation of Tucker2 Solutions for Representing Stimulus-Response
Relationships by Sparse Networks
Adachi Kohei*, Osaka University, Japan
On the Extended Wedderburn-Guttman Decomposition
Yoshio Takane*, McGill University, Canada
Moderator:
Pieter M. Kroonenberg, Leiden University, Netherlands
The 76th Annual and the 17th International Meeting of the Psychometric Society Page 17
Parallel Session: Classical Test Theory - Reliability Issue
Tuesday, 19 July, 11:10 a.m. -- 12:30 p.m., D2-LP-09
Presenters (marked with asterisks):
Test Length and Decision Making in Psychology: When Is Short Too Short?
Peter Kruyen*, Tilburg University, Netherlands
Wilco Emons, Tilburg University, Netherlands
Klaas Sijtsma, Tilburg University, Netherlands
An Empirical Comparison of Methods for Estimating Reliability
Kensuke Okada*, Senshu University, Japan
Cronbach's Coefficient Alpha Reliability for Scale Scores of Dichotomous Items Test
Rashid Al-Mahrazi*, Sultan Qaboos University, Oman
Estimating the Reliability of Aggregated and Within-Person Centered Scores in
Ecological Momentary Assessment
Po-Hsien Huang*,National Taiwan University, Taiwan
Li-Jen Weng, National Taiwan University, Taiwan
Generalizability Analysis of Constructed-Response and Hands-On Performance Tasks
in Home Economics
Chiao-Ying Wu*, National University of Tainan, Taiwan
Hueying Tzou, National University of Tainan, Taiwan
Moderator:
Won-Chan Lee, University of Iowa, USA
The 76th Annual and the 17th International Meeting of the Psychometric Society Page 18
Parallel Session: Differential Item Functioning - Advanced Method
Tuesday, 19 July, 11:10 a.m. -- 12:30 p.m., D2-LP-10
Presenters (marked with asterisks):
Rasch Trees: A New Method to Detect Differential Item Functioning in the Rasch
Model
Carolin Strobl*,LMU Munich, Germany
Julia Kopf, LMU Munich, Germany
Achim Zeileis, Universität Innsbruck, Austria
Applying the Mixture Rasch Model with Covariate to Explore Potentially
Differentiating Functioning Items
Yunyun Dai*, University of California at Los Angeles, USA
Detection of Differential Item Functioning Based on Multilevel Rasch Model
Hui Liu*, South China Normal University, China
Ming-Qiang Zhang, South China Normal University, China
Xiao-Zhu Jian, Jinggangshan University, China
Muhui Huang, South China Normal University, China
Integrating Bootstrap technique with Hierarchical Generalized Linear Model to
Perform DIF Detection for Small Size Sample
Jing-Jiun Lin*, National Chung Cheng University, Taiwan
Ya-Hui Su, National Chung Cheng University, Taiwan
Moderator:
Shu-Ying Chen, National Chung Cheng University, Taiwan
The 76th Annual and the 17th International Meeting of the Psychometric Society Page 19
Invited Symposium: Special Models with Special Solutions: Statistical Issues in
Hierarchical Item Factor Models
Tuesday, 19 July, 1:30 p.m. -- 2:50 p.m., D1-LP-03
Organizer:
David Thissen, University of North Carolina at Chapel Hill, USA
Presenters (marked with asterisks):
The Lord-Wingersky Algorithm After 25+ Years: Version 2.0 for Hierarchical Item
Factor Models
Li Cai*, University of California at Los Angeles, USA
Limited-Information Goodness-of-fit Testing of Hierarchical Item Factor Models
Mark Hansen*, University of California at Los Angeles, USA
Li Cai*, University of California at Los Angeles, USA
Calibration, Scaling, DIF, and Projection: A Common Framework Using
Multidimensional IRT
Moonsoo Lee*, University of California at Los Angeles, USA
Mark Hansen, University of California at Los Angeles, USA
Li Cai*, University of California at Los Angeles, USA
A Multilevel Item Bifactor Model
Ji Seung Yang*, University of California at Los Angeles, USA
Scott Monroe, University of California at Los Angeles, USA
Li Cai*, University of California at Los Angeles, USA

The 76th Annual and the 17th International Meeting of the Psychometric Society Page 20
Invited Symposium : Analysis of Missing Data and Causal Inferenc
Tuesday, 19 July, 1:30 p.m. -- 2:50 p.m., D1-LP-04
Organizer:
Yutaka Kano, Osaka University, Japan
Presenters (marked with asterisks):
Estimation and Use of Mean and (Co)Variance with Monotonic Missing Data
Keiji Takai*, Kansai University, Japan
Missing not at Random versus Misspecified Distributions: Bias and the Role of
Auxiliary Variables
Ke-Hai Yuan*, University of Notre Dame, USA
Mixture Modelling of Treatment Effects with Multiple Compliance Classes and Missing
Data.
Michael E. Sobel*, Columbia University, USA
Bengt Muthén, Muthen & Muthen, USA
Bias of the Direct MLE for NMAR Missingness: Theoretical Approach
Yutaka Kano*, Osaka University, Japan
The 76th Annual and the 17th International Meeting of the Psychometric Society Page 21
Parallel Session: Cognitive Diagnosis Modeling - Theory II
Tuesday, 19 July, 1:30 p.m. -- 2:50 p.m., D1-LP-06
Presenters (marked with asterisks):
Statistical Inference of the Q-matrix in Diagnostic Classification Models
Jingchen Liu*, Columbia University, USA
Gongjun Xu, Columbia University, USA
Zhiliang Ying, Columbia University, USA
Examining Attribute Classification Accuracy with General and Specific CDMs When
Sample Size Is Small
Guaner Rojas*, Autónoma University of Madrid, Spain
Julio Olea, Autónoma University of Madrid, Spain
A Simulation Study of FCA for Identifying Attributes in Cognitive Diagnostic
Assessment
Wenyi Wang*, Jiangxi Normal University, China
Shuliang Ding, Jiangxi Normal University, China
Lihong Song, Jiangxi Normal University, China
Estimating Classification Consistency and Accuracy for Cognitive Diagnostic
Assessment
Ying Cui*, University of Alberta, Canada
Cognitive Diagnosis Models with Longitudinal Growth Curves for Skill Knowledge
Elizabeth Ayers*, University of California, Berkeley, USA
Sophia Rabe-Hesketh, University of California, Berkeley, USA
Moderator:
Brian Junker, Carnegie Mellon University, USA
The 76th Annual and the 17th International Meeting of the Psychometric Society Page 22
Parallel Session: Item Response Theory - Methodology II
Tuesday, 19 July, 1:30 p.m. -- 2:50 p.m., D1-LP-07
Presenters (marked with asterisks):
A Comparison of Estimation Methods for Decision Consistency Indexes
Zhen Li*, Beijing Normal University, China
Tao Xin, Beijing Normal University, China
Estimation of Abilities Using the Globally Optimal Scoring Weights under Polytomous
IRT Models
Sayaka Arai*, The National Center for University Entrance Examinations, Japan
Shin-ichi Mayekawa, Tokyo Institute of Technology , Japan
Log-linear Item Response Models for Polytomous Data
Zhushan Li*, Boston College, USA
Effects of Using The Reciprocal of the Number of Choices as Lower Asymptote
Parameters of the 3PL Model
Yasuko Nogami*, The Japan Institute for Educational Measurement, Inc., Japan
Natsuko Kobayashi, The Japan Institute for Educational Measurement, Inc., Japan
Norio Hayashi, The Japan Institute for Educational Measurement, Inc., Japan
A Three Parameter Item Response Theory Model with Varying Upper Asymptote
Effects
Hong Jiao*, University of Maryland, USA
George Macready, University of Maryland, USA
Jianjun Zhu, Pearson Educational Measurement, USA
Weitian An, University of Maryland, USA
Moderator:
Alexander Weissman, Law School Admission Council, USA
The 76th Annual and the 17th International Meeting of the Psychometric Society Page 23
Parallel Session: Bayesian Methods and Applications I
Tuesday, 19 July, 1:30 p.m. -- 2:50 p.m., D1-LP-08
Presenters (marked with asterisks):
A Semiparametric Bayesian Latent Trait Model for Multivariate Mixed Type Data
Jonathan Gruhl*, University of Washington, USA
Elena Erosheva, University of Washington, USA
Paul K. Crane, University of Washington, USA
Bayesian Estimation in Ideal Point Discriminant Analysis
Lixing Zhou*, McGill University, Canada
Yoshio Takane, McGill University, Canada
A Two-Step Approach for Bayesian Propensity Score Analysis
David Kaplan*, University of Wisconsin-Madison, USA
Jianshen Chen, University of Wisconsin-Madison, USA
Comparison of Simple Mediation Analysis: Distribution of the Product, Bootstrap and
MCMC Method
Jie Fang*, South China Normal University, China
Min-Qiang Zhang , South China Normal University, China
Simulation Study on the Use of Hierarchical Bayesian Modeling in Expert Judgment for
School Based Assessment (SBA) Moderation
Tze-ho Fung*, Hong Kong Examinations and Assessment Authority, Hong Kong
Moderator:
Herbert Hoijtink, Methods and Statistics/University Utrecht, Netherlands
The 76th Annual and the 17th International Meeting of the Psychometric Society Page 24
Parallel Session: Multivariate Data Analysis II
Tuesday, 19 July, 1:30 p.m. -- 2:50 p.m., D2-LP-08
Presenters (marked with asterisks):
Fitting Mixed Multi-Dimensional Beta Distribution To Scored Data
Tomoya Okubo*, The National Center for University Entrance Examinations, Japan
Shin-ichi Mayekawa, Tokyo Institute of Technology, Japan
Simple Slops are Not as Simple as You Think
Xidan Chen*, University of North Carolina at Greensboro, USA
Douglas Levine, University of North Carolina at Greensboro, USA
Estimates of Sparse Data Variance Components in the Generalizability Theory
Framework
Xiaolan Tan*, South China Normal University, China
Min-Qiang Zhang, South China Normal University, China
Comparing Methods to Evaluate Predictor Importance in Lexicographical Models
Razia Azen, University of Wisconsin - Milwaukee, USA
Shuwen Tang*, University of Wisconsin - Milwaukee, USA
David Budescu, Fordham University, USA
Moderator:
Wei-ming Luh, National Cheng Kung University, Taiwan
The 76th Annual and the 17th International Meeting of the Psychometric Society Page 25
Parallel Session: Classical Test Theory - Rater Effects Issue
Tuesday, 19 July, 1:30 p.m. -- 2:50 p.m., D2-LP-09
Presenters (marked with asterisks):
Proposal of Evaluation Model of Teaching, Integrating Difference in Importance of
Criteria and Various Student Ratings
Kazuya Ikehara*, Waseda University, Japan
Hideki Toyoda, Waseda University, Japan
The Effect of the Rater Replacement Procedure on the Measurement Error of Ratings
Yoav Cohen*, National Institute for Testing & Evaluation, Israel
Should first impressions count? Examining Scoring Performance of Raters Who
Initially Failed Certification
Kathryn Ricker-Pedley*, Educational Testing Service, USA
Investigating the Agreement Among Statistical Measures of Inter-Rater Agreement:
Simulations and Some Empirical Applications
Guangming Ling*, Educational Testing Service, USA
The Formation and Control of Neutralization in Subjective Rating
Bo Wang*, the Chinese University of Hong Kong, Hong Kong
Moderator:
Anders Skrondal, Norwegian Institute of Public Health, Norway
The 76th Annual and the 17th International Meeting of the Psychometric Society Page 26
Parallel Session: Differential Item Functioning - New Strategies
Tuesday, 19 July, 1:30 p.m. -- 2:50 p.m., D2-LP-10
Presenters (marked with asterisks):
A Method for Detecting Differential Item Functioning Using the Bayes Factor
YoungKoung Kim*, The College Board, USA
Matthew Johnson, Columbia University, USA
Iterative MIMIC for DIF detection in Polytomous Items with Small Samples and Many
DIF Items
Shuyan Sun*, University of Cincinnati, USA
Differential Item Functioning Detection Using Logistic Regression with SIBTEST
Correction and DIF-free-then-DIF strategy
Tien-Hsiang Liu*, National Chung Cheng University, Taiwan
Yeh-Tai Chou, National Chung Cheng University, Taiwan
Ching-Lin Shih, National Sun Yat-Sen University, Taiwan
The Performance of DIF-Free-Then-DIF Strategy in MIMIC method
Chu-Chu Tsai*, National Sun Yat-sen University, Taiwan
Wen Chung Wang, The Hong Kong Institute of Education, Hong Kong
Ching-Lin Shih, National Sun Yat-sen University, Taiwan
How Many Anchor Items Should be Selected in DIF-Free-Then-DIF Strategy?
Hsuan-Chih Chang*, National Sun Yat-sen University, Taiwan
Wen Chung Wang, The Hong Kong Institute of Education, Hong Kong
Ching-Lin Shih, National Sun Yat-sen University, Taiwan
Moderator:
Seock-Ho Kim, The University of Georgia, USA
The 76th Annual and the 17th International Meeting of the Psychometric Society Page 27
State of Art Talk: It’s Alive! A review and Prospect of Measurement Invariance
Research
Tuesday, 19 July, 3:00 p.m. – 3:30 p.m., D1-LP-02
Presenter:
Jelte Wicherts, University of Amsterdam, Netherlands
In 1980 Arthur Jensen concluded that cognitive ability tests showed no appreciable bias
against minorities and in 2000 Hunter and Schmidt even declared the issue of test bias
scientifically dead. However, the over 550 papers that refer to Meredith’s (1993)
Psychometrika article show that the topic of measurement invariance is more alive than ever.
In this talk I review the literature on measurement invariance in the realm of cognitive ability
testing. After introducing the general framework, I shortly criticize the case against
measurement bias as expressed by Jensen, Hunter, and Schmidt. I then present the major
psychometric approaches to the study of measurement invariance at the item and subtest level.
I discuss the links between these approaches, their (dis)advantages, and the findings they
typically produce. I argue that failures of measurement invariance should not be dismissed as
nuisances but rather as good starting points for more research. Substantively driven research
of measurement invariance is illustrated by data from experiments of the effects of stereotype
threat on test performance.
Chair:
Roger Millsap, Arizona State University, USA
The 76th Annual and the 17th International Meeting of the Psychometric Society Page 28
State of Art Talk: Test Validity: Looking Back and Looking Forward
Tuesday, 19 July, 3:00 p.m. – 3:30 p.m., D1-LP-04
Presenter:
Keith Markus, The City University of New York, USA
The theory of test validity has become more sophisticated over the decades, but invites
further development. Looking back, one can discern three distinct change processes that have
helped shape test validity theory over the decades: expansion, synthesis, and partition.
Looking at the four validity/validation chapters in Educational Measurement one finds
dramatic shifts in the underlying philosophical orientation. One also finds a consistent
narrowing and deepening of the content coverage and emphasis of the chapters. Looking
forward, a more fine-grained focus on the interpretation of psychometric models offers a
means of making the idea of a construct theory more concrete and also encourages greater
emphasis on experimental and quasi-experimental validation research. Alignment of test
score interpretation, test use, and validation evidence helps to demarcate the scope of
validation, but also leads to a dynamic cyclical model relating these three elements. Finally,
the argument based approach to validation has procedural implications for the relationship
between validation efforts and test stakeholders. These implications also lead to a more
dynamic, cyclical view of test validation.
Chair:
Denny Borsboom, University of Amsterdam, the Netherlands
The 76th Annual and the 17th International Meeting of the Psychometric Society Page 29
Invited Symposium : Multiple Imputation and Missing Data
Tuesday, 19 July, 4:00 p.m. -- 5:20 p.m., D1-LP-03
Organizer:
Joost R. van Ginkel*, Leiden University, The Netherlands
Presenters (marked with asterisks):
A Comparison of Two Multiple Imputation Methods for Categorical Data: Multivariate
Imputation by Chained Equations and Latent Class Imputation
Daniël van der Palm*, Tilburg University, The Netherlands
L. Andries van der Ark, Tilburg University, Netherlands
Jeroen K. Vermunt, Tilburg University, Netherlands
Multiple Imputation and (Repeated Measures) Analysis of Variance
Joost R. van Ginkel*, Leiden University, The Netherlands
Pieter M. Kroonenberg, Institute of Education and Child Studies, Netherlands
Some Explorations of the Local and Global Measures of Missing Information
Victoria Savalei*, University of British Columbia, Canada
Robust Two-Stage Approach Outperforms Robust Full Information Maximum
Likelihood with Incomplete Nonnormal Data
Carl Falk*, University of British Columbia, Canada
Victoria Savalei, University of British Columbia, Netherlands
The 76th Annual and the 17th International Meeting of the Psychometric Society Page 30
Invited Symposium : Structured Component Analysis
Tuesday, 19 July, 4:00 p.m. -- 5:20 p.m., D1-LP-04
Organizer:
Kohei Adachi, Osaka University, Japan
Presenters (marked with asterisks):
The Generic Subspace Clustering Model
Marieke E immerman*, University of Groningen, Netherlands
Eva Ceulemans, Katholieke Universiteit Leuven, Belgium
Kim De Roover, Katholieke Universiteit Leuven, Belgium
Functional Multiple-set Canonical Correlation Analysis
Heungsun Hwang*, McGill University, Canada
Kwanghee Jung, McGill University, Canada
Yoshio Takane, McGill University, Canada
Todd S. Woodward, McGill University, Canada
Three Kinds of Hierarchical Relations among PCA, Nonmetric PCA, and Multiple
Correspondence Analysis
Kohei Adachi*, Osaka University, Japan
Takashi Murakami, Osaka University, Japan
An Equal Components Result for Indscal with Orthogonal Components
Jos M.F. ten Berge*, University of Groningen, Netherlands
Mohammed Bennani, University of Groningen, Netherlands
Jorge N. Tendeiro, University of Groningen, Netherlands
The 76th Annual and the 17th International Meeting of the Psychometric Society Page 31
Parallel Session: Cognitive Diagnosis Modeling – Applications
Tuesday, 19 July, 4:00 p.m. -- 5:20 p.m., D1-LP-06
Presenters (marked with asterisks):
Application of Mixture IRT to Multiple Strategy CDM Analysis
Young-Sun Lee*, Columbia University, USA
Yoon Soo Park, Columbia University, USA
Cognitive Diagnostic Assessment on Primary School Students’ Mathematics Word
Problem Solving
Chunhua Kang*, Beijing Normal University Zhejiang normal university, China
Tao Xin, Beijing Normal University, China
An Innovative Class-Based Cognitive Diagnostic BW Model and Its Applications
Tsai-Wei Huang*, National Chiayi University, Taiwan
Application of Rule Space Model in Intelligence Tests
Min-Qiang Zhang*, South China Normal University, China
Xiao-Zhu Jian, South China Normal University Jinggangshan University, China
Evaluating the Quality of A Cognitive Model in Mathematics Using the Hierarchical
Attribute Method
Cecilia, B. Alves, University of Alberta, Canada
Mark, J. Gierl, University of Alberta, Canada
Hollis Lai, University of Alberta, Canada
Karen Fung*, University of Alberta, Canada
Moderator:
Levent Dumenci, Virginia Commonwealth University, USA
The 76th Annual and the 17th International Meeting of the Psychometric Society Page 32
Parallel Session: Item Response Theory - Applications in Ability Measures
Tuesday, 19 July, 4:00 p.m. -- 5:20 p.m., D1-LP-07
Presenters (marked with asterisks):
Towards Cognitive Response Theory for Today's CAT Practice
Quan Zhang*, Jiaxing University, China
A Paradox in the Study of the Benefits of Test-Item Review
Wim J. van der Linden*, CTB/McGraw-Hill, USA
Minjeong Jeon, University of California, Berkeley, USA
Steve Ferrara, CTB/McGraw-Hill, USA
Comparing IRT and CCT by Examining Their Estimates for Competency
Lun Mo*, FWISD and The University of Memphis, USA
Xiangen Hu, The University of Memphis, USA
Comparing Test Difficulties of NCT English Examiations using Non-linear Factor
Analysis
Tatsuo Otsu*, The NCUEE and JST CREST, Japan
Takamitsu Hashimoto, The NCUEE and JST CREST, Japan
Examining Gender Differences in Mathematics Performance Across Grades, Subscales,
Racial/Ethnic Groups and Achievement Spectrum
Yvette Beersingh*, Morgan State University, USA
Moderator:
Quan Zhang, Jiaxing University, China
The 76th Annual and the 17th International Meeting of the Psychometric Society Page 33
Parallel Session: Bayesian Methods and Applications II
Tuesday, 19 July, 4:00 p.m. -- 5:20 p.m., D1-LP-08
Presenters (marked with asterisks):
The Effect of Informative Priors on Estimating the Variability of Estimated Variance
Components for MCMC procedure
Guangming Li *, South China Normal University, China
Min-Qiang Zhang , South China Normal University, China
A Bayesian Person-Fit Evaluation For Polytomous Response Data
Sebastien Beland*, Universite du Quebec a Montreal, Canada
Herbert Hoijtink, Utrecht University, Netherlands
Gilles Raiche, Universite du Quebec a Montreal, Canada
David Magis, Université de Liège, Belgium
Bayesian Analysis of Random Coefficient Dynamic Factor Models
Hairong Song*, University of Oklahoma, USA
Integrating Concepets of Profile Analysis and Person fit: An application to the
Computerized Test System of the German Federal Employment Agency
Safir Yousfi*, German Federal Employment Agency, Germany
Evaluating Latent Monotonicity Using Bayes Factors
Jesper Tijmstra*, Utrecht University, Netherlands
David J. Hessen, Utrecht University, Netherlands
Herbert Hoijtink, Utrecht University, Netherlands
Peter G. M. van der Heijden, Utrecht University, Netherlands
Klaas Sijtsma, Tilburg University, Netherlands
Moderator:
Iwin Leenen, Investigación y Evaluación, Mexico
The 76th Annual and the 17th International Meeting of the Psychometric Society Page 34
Parallel Session: Multivariate Data Analysis III
Tuesday, 19 July, 4:00 p.m. -- 5:20 p.m., D2-LP-08
Presenters (marked with asterisks):
Assessing Win-or-Loss Team Performance in Playoff Competitions by Diffusion
Algorithm of Network Analysis
Nan-Yi Wu*,National Taichung University, Taiwan
Chih-Chien Yang, National Taichung University, Taiwan
Rank Based Polychoric Correlation
Johan Lyhagen, Uppsala University, Sweden
Petra Ornstein*, Uppsala University, Sweden
Modeling Group-Mean Differences of Emotion Factors by Parafac2
Sungjin Hong*, University of Illinois at Urbana-Champaign, USA
Sampling Distribution's Effect on the Significance Result and Effect Size
Can Jiao*, Shenzhen University, China
Min-Qiang Zhang, South China Normal University, China
Moderator:
Ralph Carlson, The University of Texas Pan American, USA
The 76th Annual and the 17th International Meeting of the Psychometric Society Page 35
Parallel Session: Practical Considerations of Computerized Adaptive Testing
Tuesday, 19 July, 4:00 p.m. -- 5:20 p.m., D2-LP-09
Presenters (marked with asterisks):
A Comparison of Item Exposure Methods in Computerized Adaptive Testing
Ming-Yong Li*, South China Normal University, China
Min-Qiang Zhang, South China Normal University, China
Xiao-Zhu Jian, South China Normal University, China
Using the Information-Stratified Method to Control Item Exposure in Computerized
Adaptive Testing
Yung-Tsai Chien*, National Taichung University, Taiwan
Bor-Chen Kuo, National Taichung University, Taiwan
Hsiao-Chu Chen, National Taichung University, Taiwan
How would Mixed Item Selection Approach Work with Weighted Deviation Model and
Shadow Test Assembly for Constrained Adaptive Testing?
Chi Keung Eddie Leung*, The Hong Kong Institute of Education, Hong Kong
Integrating the Stocking and Lewis Conditional on Ability Procedure with the
Maximum Priority Index in Computerized Adaptive Testing
Ya-Hui Su*, National Chung Cheng University, Taiwan
Yan-Lin Huang, National Chung Cheng University, Taiwan
Improving the Efficiency of Stratification Procedures in Computerized Adaptive
Testing
Jyun-Hong Chen*,National Chung Cheng University, Taiwan
Shu-Ying Chen, National Chung Cheng University, Taiwan
Moderator:
Alexander Weissman, Law School Admission Council, USA
The 76th Annual and the 17th International Meeting of the Psychometric Society Page 36
Parallel Session: Differential Item Functioning - Applications
Tuesday, 19 July, 4:00 p.m. -- 5:20 p.m., D2-LP-10
Presenters (marked with asterisks):
The Functional Equivalence of the PISA 2006 Science Assessment between Hong Kong
and Mainland Chinese Students
Xiaoting Huang*, Peking University, China
A Comparison of Methods for Investigating Longitudinal Measurement Invariance in
the Study of Growth over Time
Betsy J. Feldman*, University of Washington, USA
Katherine E. Masyn, Harvard University, USA
Shubhabrata Mukherjee, University of Washington, USA
Paul K. Crane, University of Washington, USA
Investigating Socially Desirable Responses Using DIF
Priyalatha Govindasamy, University Science Malaysia, Malaysia
Saw Lan Ong*, University Science Malaysia, Malaysia
A DIF and Facets Analysis of a Chinese as Second Language Course Test
Keling Yu*, The Hong Kong Institute of Education, Hong Kong
Are Tes Analogi Verbal (TANAVA) Free from Gender Bias?
Aries Yulianto*, University of Indonesia, Indonesia
Moderator:
Terry Ackerman, University of North Carolina at Greensboro, USA
The 76th Annual and the 17th International Meeting of the Psychometric Society Page 37
Travel Award & Lifetime Achievement Award Announcement
Tuesday, 19 July, 5:30 p.m. -- 5:45 p.m., D1-LP-02
Psychometric Society Travel Award Winners:
Shuyan Sun, University of Cincinnati, USA
"Iterative MIMIC for DIF detection in Polytomous Items with Small Samples and Many DIF
Items"
In-Hee Choi, University of California, Berkeley, USA
"Mixture Extensions of the Linear Logistic Test Model (LLTM) using Markov Chain Monte
Carlo (MCMC) Estimation"
Younyoung Choi, University of Maryland, USA
"Dynamic Bayesian Inference Network for Modeling Learning Progressions over Multiple
Time Points"
ETS Travel Award Winner:
Josine Verhagen, University of Twente, The Netherlands
“Analyzing Longitudinal Survey Data: A Bayesian IRT Model with Occasion-Specific Item
Parameters”
Host:
Terry Ackerman, University of North Carolina at Greensboro, USA
Psychometric Society Lifetime Achievement Award Winner:
Bengt Muthén, University of California, Los Angeles, USA
Host:
Klaas Sijtsma, Tilburg University, Netherlands

The 76th Annual and the 17th International Meeting of the Psychometric Society Page 38
Opening Reception
Tuesday, 19 July, 5:45 p.m. -- 6:00 p.m., Lower Podium Floor of Block D1 & D2
All participants are warmly invited to attend the opening reception. Snacks and drinks will be
served.
The 76th Annual and the 17th International Meeting of the Psychometric Society Page 39
Poster Session I
Tuesday, 19 July, 6:00 p.m. -- 7:30 p.m., Lower Podium Floor of Block D1 & D2
Poster Presenters (marked with asterisks):
Organizational Work Passion for Workers’ Behavior and Attitude—The Moderating
Role of Organizational Commitment
Xiaopeng Li*,South China Normal University, China
Min-Qiang Zhang, South China Normal University, China
Empirical Study of Organizational Commitment about Victoria, Chinese Bilingual
Teachers
Guixiong Liu*,Xinjiang Normal University, China
Min-Qiang Zhang, South China Normal University, China
Research on the Relationship Between Personality and Social Network Positions of High
School Students
Shao qi Ma*,South China Normal University, China
Min-Qiang Zhang, South China Normal University, China
Nan nan Zhang, South China Normal University, China
Can Jiao, Shenzhen University, China
The Influence of Test Development on the Accuracy of KS - P Model
Yuna Han*, South China Normal University, China
Min-Qiang Zhang, South China Normal University, China
Xiao-Zhu Jian, South China Normal University, China
Psychometric Assessment of the Patient Activation Measure Short Form (PAM-13) in
Rural Settings
Man Hung*, University of Utah, USA
Matthew Samore, University of Utah, USA
Marjorie Carter, University of Utah, USA
College Students' Perception of a Gender Course in Taiwan: Test of Gender and Age
Variables
Su-Fen Liu*, National Pingtung Institute of Commerce, Taiwan
The 76th Annual and the 17th International Meeting of the Psychometric Society Page 40
Analysis of a Mediated (Indirect) Moderation Model
Geert van Kollenburg*, Tilburg University, Netherlands
Marcel A. Croon, Tilburg University, Netherlands
Bayesian Analysis of Change in Educational Testing Using Generalized Linear Mixed
Model with Dirichlet Process
Keng-Min Lin*, National Taiwan Normal University, Taiwan
Rung-Ching Tsai, National Taiwan Normal University, Taiwan
Evaluation of Mean and Covariance Structure Analysis Model in Detecting Differential
Item Functioning of Polytomous Items
Rung-Ching Tsai*, National Taiwan Normal University, Taiwan
Ming-Jin Ke, National Taiwan Normal University, Taiwan
The Impact of Brand Equity on Cost of Borrowing
Byron Y. Song, Concordia University, Canada
Jooseop Lim*, Concordia University, Canada
Jeong Bon Kim, City University of Hong Kong, Hong Kong
Using Structural Equation Modeling to Estimate Composite Reliability in Hierarchical
Modeling
Jinlu Tu*, Shanxi Normal University , China
Xuqun You, Shanxi Normal University , China
A Comparison of the Different Developmental Trajectories of the Perception of Mental
Health Problems in Taiwanese Adolescents
Sieh-Hwa Lin*,National Taiwan Normal University, Taiwan
Pei-Jung Hsieh, National Academy for Educational Research, Taiwan
Undergraduate Students‘ Attitudes Toward Statistic
Fitri Ariyanti *, Padjadjaran University, Indonesia
Ratna Jatnika, Padjadjaran University, Indonesia
A Bayesian Parameter Simulation Approach to Estimating Mediation Effects with
Missing Data
Fairchild Amanda*, University of South Carolina, USA
Enders Craig, Arizona State University, USA
The 76th Annual and the 17th International Meeting of the Psychometric Society Page 41
A study of the Factors Related to Mathematics Achievement and Literacy on
Large-Scale Assessment
Shin-Huei Lin*, National University of Tainan, Taiwan
Su-Wei Lin, National University of Tainan, Taiwan
A Study of the Relationship between Mathematics Learning Disposition and
Achievement of Sixth Grade Students
Yi-Chun Cheng*, National University of Tainan, Taiwan
Su-Wei Lin, National University of Tainan, Taiwan
The Longitudinal Study of the Relationships between the Goal Orientations and
Mathematics Achievements
Chang-Sheng Wang*, National University of Tainan, Taiwan
Su-Wei Lin, National University of Tainan, Taiwan
The Effect of Exposure Control in Testlet-Based CAT
Wen-Shin Lin*, The University of Tainan, Taiwan
Chiou-Yueh Shyu, The University of Tainan, Taiwan
The Predictive Effects of Cognitive Components for Item Difficulty Variance of
ASAP-ENG
Pei-Ju Sung*, National University of Tainan, Taiwan
Pi-Hsia Hung, National University of Tainan, Taiwan
Su-Wei Lin, National University of Tainan, Taiwan
The Contribution of Dynamic Assessment to Screen Mathematics Learning Disabilities
Li Jin Zhang*, Ningxia University, China
Zhen Feng Zhang, Ningxia University, China
The Development of the Statistical Literacy Assessment and the Scale of Statistical
Attitudes for College Students in Taiwan
Yu-Ning Chao*, National University of Tainan, Taiwan
Hueying Tzou, National University of Tainan, Taiwan
Su-Wei Lin, National University of Tainan, Taiwan
The 76th Annual and the 17th International Meeting of the Psychometric Society Page 42
A Model of Cognitively Diagnostic Base on Q Matrix——Classifying Model of the
Probability of Attributes' Mastery
Jinxin Zhu*, Fuyong Secondary School, China
Shumei Zhang, Beijing Normal University, China
Tao Xin, Beijing Normal University, China
A Study of Identifying Response Fake Using Person Fit Indexes
Sunghoon Kim*, Yonsei university, South Korea
Hee-Won Yang, Yonsei university, South Korea
Guemin Lee, Yonsei university, South Korea
Applying Cognitive Diagnosis Modeling to Psychological Diagnostic Test for More
Information
Yoon Jung Kwon*,Sungkyunkwan University, South Korea
Principal Instructional Leadership Framework in China
Qian Zhao*, Beijing Normal University, China
Gang Li, Beijing Normal University, China
The Development and Implementation of The Assessment of Hierarchical Intrinsic and
Extrinsic Motivation for Mathematics
Li-Yu Lin*, National University of Tainan, Taiwan
Su-Wei Lin, National University of Tainan, Taiwan
Effectiveness of CATSIB on Computer Adaptive Sequential Tests
Hollis Lai*, University of Alberta, Canada
Johnson Ching Hong Li, University of Alberta, Canada
Mark, J. Gierl, University of Alberta, Canada
Perceived Family Support Moderates The Association Between Affiliate Stigma and
Depression Among Caregivers of Children With Developmental Delay
Chia-Wei Hsiao*, National University of Tainan, Taiwan
Chien-ho Lin, Chimei Medical Hospital National University of Tainan, Taiwan
Pi-Hsia Hung, National University of Tainan, Taiwan
The 76th Annual and the 17th International Meeting of the Psychometric Society Page 43
Rater Subjectivity in the Development of Imagination Test for University Student
Chi-Chan Chen*, National Taichung University of Education, Taiwan
Cheng-Te Chen, National Tsing Hua University, Taiwan
Ching-Lin Shih, National Sun Yat-sen University, Taiwan
Internet Addiction Disorder: Categories or Dimensions?
Wenchao Ma*, Beijing Normal University, China
Yufang Bian, Beijing Normal University, China
Fang Luo, Beijing Normal University, China
Dimensionality and Item-Wording Effect of the Chinese Rosenberg Self-Esteem Scale
Yi-Chang Cheng*,National Cheng Kung University, Taiwan
Wei-ming Luh, National Cheng Kung University, Taiwan
The Study of the New Immigrant Children’s Academic Achievement, Learning Belief
and Learning Interests in Taiwan
Pei-Ching Chao*, National Chengchi University, Taiwan
Min-Ning Yu, National Chengchi University, Taiwan
Jia-Jia Syu, National Chengchi University, Taiwan
Po-Lin Chen, National Chengchi University, Taiwan
Pei-Chun Chung, National Chengchi University, Taiwan
Analysis on Characteristics of Diagnostic Test for Depression in Koreans
Seowoo Lee*, Pusan National University, South Korea
Daeyong Lee, Pusan National University, South Korea
Dahee Shim, Pusan National University, South Korea
Sukwoo Kim, Pusan National University, South Korea
Seock-Ho Kim, The University of Georgia, USA
Study on the Immigrant Student Mathematics Achievement Impacted Factors:
Taiwan’s Grade 8 in TIMSS 2007
Fang-chung Chang*, National Taipei University, Taiwan
The 76th Annual and the 17th International Meeting of the Psychometric Society Page 44
Gender Differential Item Functioning Across Taiwan, Shanghai, Hong Kong & Macao
for PISA 2009 Reading Assessment
Song-Wei Ma*, National University of Tainan, Taiwan
Pei-Ming Chiang, National University of Tainan, Taiwan
Hueying Tzou, National University of Tainan, Taiwan
Asian Students’ Achievement Motivation: Orientations and Characteristics
Shanshan Zhang*, Ministry of Education of China, China
Hongyun Liu, Beijing Normal University, China
Kit-Tai Hau, The Chinese University of Hong Kong, Hong Kong
The Rater Effect and Differential Item Functioning of Cognitive Tests In International
Civic and Citizenship Education Study
Chun-Hao Tao*, National Taiwan Normal University, Taiwan
Po-Hsi Chen, National Taiwan Normal University, Taiwan
Mei-Hui Liu, National Taiwan Normal University, Taiwan
Yao-Ting Sung, National Taiwan Normal University, Taiwan
Modification of The Hierarchy Consistency Index
Shuliang Ding*, Jiangxi Normal University, China
Mengmeng Mao, Jiangxi Normal University, China
Growth After Trauma: Validating Post Trauma Thriving Scale in the Philippines
Imelu Mordeno*, Universidade de Sao Jose, Macau
A Study on the Accuracy of Score Report in Computerized Adaptive Testing
Chiou-Yueh Shyu*, The National University of Tainan, Taiwan
Development of Learning Motivation Test for Pupils based on the forms of self-report
and semi-projective
Guang Li*, Hunan Normal University, China
Lu Jiang, Hunan Normal University, China
Miewen Yan, Hunan Normal University, China
Yangming Zhou, Hunan Normal University, China
Xiang Li, Hunan Normal University, China
The 76th Annual and the 17th International Meeting of the Psychometric Society Page 45
Development of Learning Preference Scale for Pupils Based on GGUM and CTT
Yongbo Li*, Hunan Normal University, China
Danghui Shi, Hunan Normal University, China
Ying Long, Hunan Normal University, China
Dai Zheng, Hunan Normal University, China
Jiuyuan Tang, Hunan Normal University, China
Development of Self-confidence Questionnaire for Pupils Based on CTT and IRT
Unfolding Model
Danghui Shi*, Hunan Normal University, China
Xingjie Qu, Hunan Normal University, China
Fusheng Xie, YueLu Teachers’ College for Vocational Studies, Changsha, China
fanmei Zeng, Hunan Normal University, China
Zi Zhao, Hunan Normal University, China
Dynamic and Comprehensive Item Selection Strategies for Computerized Adaptive
Testing Based on Graded Response Model
Fen Luo*, Jiangxi Normal University, China
Shuliang Ding, Jiangxi Normal University, China
Xiaoqing Wang, Jiangxi Normal University, China
Construction of Learning Attitude Test for Pupils Based on IRT Unfolding Model
Xingjie Qu*, Hunan Normal University, China
Fusheng Xie, Yuelu Teachers’ College for Vocational Studies , China
Wen Tan, Hunan Normal University, China
Yan Mao, Hunan Normal University, China
Xiyou Cheng, Hunan Normal University, China
The Effect of Student's Self-Confidence, Positve Affect and Teachers' Expectations on
Science Achievement
Fu-An Chi*, National Chung Hsing University, Taiwan
Jen Jang Sheu, National Chung Hsing University, Taiwan
Classification Consistency for Test Scores Composed of Testlets under IRT and
non-IRT Approaches
So Yoon Park*, Yonsei University, South Korea
Guemin Lee, Yonsei University, South Korea
The 76th Annual and the 17th International Meeting of the Psychometric Society Page 46
Teachers' Expectations on Students Science Achievements:Evidence From Timss 2007
Cindy Wu*, National Chung Hsing University, Taiwan
Jen Jang Sheu, National Chung Hsing University, Taiwan
The Development of Computerized Bodily-Kinesthetic Test
Yung Chih Ou*,National Taiwan Normal University, Taiwan
Po-Hsi Chen, National Taiwan Normal University, Taiwan
Sensation Seeking and Tobacco and Alcohol Use Among Adolescents: A Mediated
Moderation Model
Baojuan Ye*, South China Normal University, China
Dongping Li, South China Normal University, China
Qishan Chen, South China Normal University, China
Yanhui Wang , Jiaying University, China
Scoring Thresholds Setting for Open-Ended Items on Double-Marking Online System
Lina Wang*, Beijing Normal University, China
Bo Wang, The Chinese University of Hong Kong , China
Hong-Sheng Che, Beijing Normal University, China
Meng Chen, Beijing Normal University, China
Ran Bian, Beijing Normal University, China
Devising a Moral Judgment Test for The Measurement of Care: A Lost Dimension
From A Psychometric Perspective
Huan-Wen Chen*,National University of Tainan, Taiwan
The Effects of Music Learning in Elementary School Through The Dalcroze
Eurhythmics
Mei-lin Chen*, National Taiwan University of Art, Taiwan
Solving Complex Optimization Problems With Many Parameters By Means of
Optimally Designed Block-Relaxation Algorithms
Tom F. Wilderjans*,Katholieke Universiteit Leuven, Belgium
Iven Van Mechelen, Katholieke Universiteit Leuven, Belgium
Dirk Depril, Katholieke Universiteit Leuven, Belgium
The 76th Annual and the 17th International Meeting of the Psychometric Society Page 47
Using the Rasch Testlet Model To Detect Testlet DIF In Chinese Passage-Based
Reading Testing
Congying Guo*, Beijing Normal University, China
Yufang Bian, Beijing Normal University, China
The Development of the Chinese Janusian Thinking Test for College Students
Wei-Chun Li*, National Taitung University, Taiwan
Fixed Parameter Calibration Methods and Its Application to DIF Analysis in Online
Calibration Designs
Fabiola Gonzalez-Betanzos, Autonoma University of Madrid, Spain
Francisco J. Abad*, Autonoma University of Madrid, Spain
Juan Ramon Barrada, Autonomous University of Barcelona, Spain
Evaluating the Consistency of Verbal Reports and the Use of Cognitive Models in
Educational Measurement
Xian Wang*, University of Alberta, Canada .
Jacqueline P. Leighton, University of Alberta, Canada
Assessing fit of the DINA models
Jung Yeon Park*, Columbia University, USA
Teacher’s Beliefs, Attitudes, and Professional Development: A Cross-Country Analysis
Using Multilevel Modeling
Chi Chang*, Michigan State University, USA
A New Cognitive Diagnosis Model for Analyzing Multiple-Choice Options
Koken Ozaki*, The Institute of Statistical Mathematics, Japan
The 76th Annual and the 17th International Meeting of the Psychometric Society Page 48
Main Conference, Wednesday, 20 July, 2011
Invited Talk: Observed-Score Test Equating--Science or Art?
Wednesday, 20 July, 9:00 a.m. – 9:40 a.m., D1-LP-02
Presenter:
Alina A. von Davier, Educational Testing Service, USA
This presentation will provide an overview of the observed-score equating (OSE) process in
the historical context of standardized educational assessments. The overview will be
presented from the perspective of a unified equating framework that covers all the existing
OSE methods (von Davier, 2011), including IRT observed-score equating and local equating
(van der Linden, 2000; Wiberg, van der Linden, von Davier, in progress). The presentation
will also discuss challenges to the equating process and approaches to equating evaluation.
The application of quality control tools to monitor the scores over time will be briefly
described. The policy around the use of test scores, the constraints on the of the scale scores,
the shifts in demographics, and their implications for the choice of specific equating
methodologies will be analyzed.
Chair:
Rob Meijer, University of Groningen, the Netherlands
The 76th Annual and the 17th International Meeting of the Psychometric Society Page 49
Invited Talk: Separating Between- and Within- Group Associations for Categorical
Variables?
Wednesday, 20 July, 9:00 a.m. – 9:40 a.m., D1-LP-04
Presenter:
Marcel A. Croon, Tilburg University, Netherlands
In social and behavioural research data are often collected by means of surveys in samples of
respondents or subjects (Level 1 units) which are nested within groups, teams, or
organization (Level 2 units). Variables observed in such studies may be either measured at
the lower individual level or at the higher group level. Analysis of such data is often carried
by first aggregating the individual data to the group level, and then analyzing the association
among the variables at the group level. However, results of analyses on aggregated data may
be misleading since the association among the variables at the group level after aggregation
not only reflects between-group variation, but also within-group variation. Moreover, in the
interpretation of the results the risk of succumbing to the ecological fallacy is real: it is often
forgotten that the conclusions only apply at the group level, and cannot be generalized to the
individual level.
The data from such two-level studies require techniques which neatly separate the between-
and within-group association among the variables. For continuous variables measured at the
level of an interval scale, such techniques have been developed during the last two decades.
Two-level factor analysis, two-level path analysis, and, in general, two-level structural
equation models can be almost routinely carried out by the available software programs like
LISREL, EQS, and Mplus.
For categorical data it is less clear how between- and within-group associations can be
estimated separately. Two different proposals to achieve this results will be discussed and
compared. Both approaches start from basic log-linear models for describing the association
among the variables. The first approach uses the persons-as-indicators perspective and treats
the scores of the individuals on the variables measured at the lower level as exchangeable
indicators for a latent variable defined at the group level. The second approach also treats the
groups as the units of analysis, but considers the individuals as repeated measures of a
variable defined on the group level.. Both approaches yield maximum likelihood estimates of
the model parameters.
Although both approaches have much in common, they differ with respect to the way in
which they treat variables measured at the higher level. In this lecture both approaches will be
compared. An important criterion to compare both approaches is the ease with which they
allow the analysis according to complex measurement and path models. Comparison of both

The 76th Annual and the 17th International Meeting of the Psychometric Society Page 50
models will be illustrated by analyses on simulated and real data, all carried out by means of
LatentGold™.
Chair:
Matthias von Davier, Educational Testing Service, USA
The 76th Annual and the 17th International Meeting of the Psychometric Society Page 51
Keynote Address: Bayesian Structural Equation Modeling: An Overview and Some
Recent Developments
Wednesday, 20 July, 9:50 a.m. – 10:45 a.m., C-LP-11
Presenter:
Sik-Yum Lee, The Chinese University of Hong Kong, Hong Kong
In this talk, we first give an over view of a Bayesian approach which is effective in handling
subtle structural equation models with complex data structures. Then, we illustrate the
flexibility of this approach through applications in analyzing two models. One is a
two-level longitudinal structural equation model for assessing various dynamic characteristics;
while the other is a model with a general non-parametric structural equation defined by
Bayesian P-splines. Some empirical results are provided.
Chair:
Wen Chung Wang, The Hong Kong Institue of Education, Hong Kong
The 76th Annual and the 17th International Meeting of the Psychometric Society Page 52
Invited Symposium : Cognitive Diagnosis Modes, Item Response Theory, Mixture IRT,
Latent Transitions Models, The Many Faces of Latent Class Analysis
Wednesday, 20 July, 11:10 a.m. – 12:30 a.m., D1-LP-03
Organizer:
Matthias von Davier, Educational Testing Service, USA
Presenters (marked with asterisks):
Extended LogLinear Rasch Models
Henk Kelderman*, VU University Amsterdam, The Netherlands
A Variational Approximation Estimation Method for the Item Response Theory Model
with Random Item Effects across Groups
Frank Rijmen*, Educational Testing Service, USA
Why Latent Class Models Are Cognitive Diagnosis Models – Or The Other Way
Around…
Matthias von Davier*, Educational Testing Service, USA
Xueli Xu, Educational Testing Service, USA
Kentaro Yamamoto, Educational Testing Service, USA
The 76th Annual and the 17th International Meeting of the Psychometric Society Page 53
Invited Symposium : New Directions with Intensive Longitudinal Data
Wednesday, 20 July, 11:10 a.m. – 12:30 a.m., D1-LP-04
Organizer:
Kathleen M. Gates, The Pennsylvania State University, USA
Presenters (marked with asterisks):
Parallelism, Ergodicity, and Psychological Explanations
Keith A. Markus*, The City University of New York, USA
Accommodating Nonergodicity Across Individual Processes Using an Alternative to
Granger Causality
Kathleen M. Gates*, The Pennsylvania State University, USA
Peter C. M. Molenaar, The Pennsylvania State University, USA
Michael J. Rovine, The Pennsylvania State University, USA
Nilam Ram, The Pennsylvania State University, USA
Modeling the Dynamics in Physiological Arousal between Children with Sensory
Processing Disorder and Therapists during Psychotherapy
Siwei Liu*, The Pennsylvania State University, USA
Peter C. M. Molenaar, The Pennsylvania State University, USA
Michael J. Rovine, The Pennsylvania State University, USA
Matthew Goodwin, The Pennsylvania State University, USA
Time-Varying Effect Model of Intensive Longitudinal Data: An Application to Smoking
Cessation Behavior
Mariya Shiyko*, The Pennsylvania State University, USA
Xianming Tan, The Pennsylvania State University, USA
Runze Li, The Pennsylvania State University, USA
Saul Shiffman, The University of Pittsburgh, USA
The 76th Annual and the 17th International Meeting of the Psychometric Society Page 54
Parallel Session: Equating and Linking
Wednesday, 20 July, 11:10 a.m. -- 12:30 p.m. , D1-LP-06
Presenters (marked with asterisks):
Comparison of Small-Sample Equating Methods for Mixed-Format Tests in a NEAT
Design
Euijin Lim*, Yonsei University, South Korea
Hwangkyu Lim, Yonsei University, South Korea
Guemin Lee, Yonsei University, South Korea
Considerations to Evaluate Equating Results Based on IRT Calibration and Equating
Yue Zhao*, The Hong Kong Institute of Education, Hong Kong
The Comparison of IRT Equating Methods and Link Plans in Large Scale Assessment
Yan Gao*,Beijing Normal Univeersity, China
Tingting Yang, Beijing Normal Univeersity, China
Tao Yang, Beijing Normal Univeersity, China
Mengjie He, Beijing Normal Univeersity, China
Comparison of Multiple-Group and Single-Group Calibration Methods for Linking
Won-Chan Lee*, University of Iowa, USA
Ja Young Kim, University of Iowa, USA
Performance Evaluation of Plausible Value Method in the Equated Tests
Shiau-Chian Tseng*, National Taichung University, Taiwan
Huey-Min Wu, National Academy for Educational Research, Taiwan
Bor-Chen Kuo, National Taichung University, Taiwan
Kai-Chih Pai, National Taichung University, Taiwan
Moderator:
Han-Dau Yau, National Taiwan Sport University, Taiwan
The 76th Annual and the 17th International Meeting of the Psychometric Society Page 55
Parallel Session: Item Response Theory - Applications
Wednesday, 20 July, 11:10 a.m. -- 12:30 p.m. , D1-LP-07
Presenters (marked with asterisks):
Estimation of Classification Accuracy and Consistency under Item Response Theory
Models
Ying Cheng*, University of Notre Dame, USA
Cheng Liu, University of Notre Dame, USA
Development and Validation of Learning Progression for the Oxidation-Reduction: A
Rasch Measurement Approach
Kun-Shia Liu*, National Sun Yat-sen University, Taiwan
Ying-Yao Cheng, National Sun Yat-sen University, Taiwan
Wen Chung Wang, The Hong Kong Institute of Education, Hong Kong
A Rasch Approach to Measure Undergraduates’ Key Competence
Li-Ming Chen*, National Sun Yat-sen University, Taiwan
Ching-Lin Shih, National Sun Yat-sen University, Taiwan
Paichi Pat Shein, National Sun Yat-sen University, Taiwan
Kun-Shia Liu, National Sun Yat-sen University, Taiwan
Ying-Yao Cheng, National Sun Yat-sen University, Taiwan
Item Response Theory Analyses of Adult Self-Ratings of the ADHD Symptoms in the
Current Symptoms Scale
Rapson Gomez*, University of Tasmania, Australia
Explanatory Person-Fit Analysis in Clinical Practice
Judith Conijn*, Tilburg University, Netherlands
Wilco Emons, Tilburg University, Netherlands
Marcel van Assen, Tilburg University, Netherlands
Klaas Sijtsma, Tilburg University, Netherlands
Moderator:
Catherine McClellan, Educational Testing Service, USA
The 76th Annual and the 17th International Meeting of the Psychometric Society Page 56
Parallel Session: Missing Data
Wednesday, 20 July, 11:10 a.m. -- 12:30 p.m. , D1-LP-08
Presenters (marked with asterisks):
Comparing Imputaion Using Differnt Partitions of Data for Latent Class Models
Ting Hsiang Lin*, National Taipei University, Taiwan
Cheng Ken Wu, , Taiwan
Differential Item Functioning (DIF) Analysis under Missing-Data Imputation
Framework (MI-DIF)
Gee Hune Kim*, Columbia University, USA
Treatment of Missing Data in the Test Adopting both Basal and Ceiling Rules
Wei He*, Northwest Evaluation Association (NWEA), USA
An Estimation Method for Parameters of Two Multinomial Populations under the
Stochastic Ordering with Sparse or Missing Data
Lixin Meng*,Northeast Normal University, China
Jian Tao, Northeast Normal University, China
Xiang Bin Meng, Northeast Normal University, China
Moderator:
Rob R. Meijer, University of Groningen, Netherlands
The 76th Annual and the 17th International Meeting of the Psychometric Society Page 57
Parallel Session: Multivariate Data Analysis IV
Wednesday, 20 July, 11:10 a.m. -- 12:30 p.m. , D2-LP-08
Presenters (marked with asterisks):
Social Network Models for Educational Interventions
Brian Junker*, Carnegie Mellon University, USA
Tracy Sweet, Carnegie Mellon University, USA
Regularized K-means Clustering with Variable Weighting
Yutaka Nishida*, Osaka University, Japan
The Different Choice of Basis Functions in Functional Data Conversion
Minping Xiong*, South China Normal University, China
Min-Qiang Zhang, South China Normal University, China
Functional Analysis of Variance for Data from ERPs
Shuyi Liang*, South China Normal University, China
Min-Qiang Zhang, South China Normal University, China
Minping Xiong, South China Normal University, China
Evaluating Order Constrained Hypotheses for Circular Data using Permutation Tests
Irene Klugkist*, Utrecht University, Netherlands
Jessie Bullens, Utrecht University, Netherlands
Albert Postma, Utrecht University, Netherlands
Moderator:
Frans E.S. Tan, Maastricht University, The Netherlands

The 76th Annual and the 17th International Meeting of the Psychometric Society Page 58
Parallel Session: E-testing
Wednesday, 20 July, 11:10 a.m. -- 12:30 p.m. , D2-LP-10
Presenters (marked with asterisks):
The Development of Concerto : An Open Source Online Adaptive Testing Platform
Michal S. Kosinski*, University of Cambridge, UK
John N. Rust, University of Cambridge, UK
The Development of Computer-based Case Simulations for Psychological Counseling
Peng Wang*,Jiangxi Normal University & Shandong Normal University, China
Haiqi Dai, Jiangxi Normal University, China
Building Affordable CD-CAT Systems for Schools To Address Today's Challenges In
Assessment
Hua-Hua Chang*, University of Illinois at Urbana-Champaign, USA
Developing an e-Assessment System for English and Putonghua Learning
Kenneth Wong*, Caritas Institute of Higher Education, Hong Kong
Reggie Kwan, Caritas Institute of Higher Education, Hong Kong
Kat Leung, Caritas Institute of Higher Education, Hong Kong
Philip Tsang, Caritas Institute of Higher Education, Hong Kong
Developing a Computerized Performance Assessment Tool for Sensory Integration
Chin-Kai Lin*, National Taichung University of Education, Taiwan
Huey-Min Wu, National Academy for Educational Research, Taiwan
Bor-Chen Kuo, National Taichung University of Education, Taiwan
Moderator:
Bor-Chen Kuo, , National Taichung University, Taiwan

The 76th Annual and the 17th International Meeting of the Psychometric Society Page 59
Social Event: Hong Kong Tour
The city tour is scheduled from 14:00 p.m. to 22:30 p.m. on 20 July 2011, when there are no
other sessions and events scheduled at the same time.
Note:
City tour participants please bring along your registration confirmation e-mail printout and
gather at the registraion area of the conference on 13:45 p.m. of 20 July, 2011.

The 76th Annual and the 17th International Meeting of the Psychometric Society Page 60
Main Conference, Thursday, 21 July, 2011
Invited Talk: Causal Inference Framework for Latent Variable Modeling: Application
to Test-Equating and Causal Effect Estimation in Latent Variables
Thursday, 21 July, 9:00 a.m. – 9:40 a.m., D1-LP-02
Presenter:
Takahiro Hoshino, Nagoya University, Japan
In the social and behavioral sciences, the treatments or factors that the researchers are
interested in are usually difficult to manipulate/assign randomly.
In such cases, simple multiple group comparisons assuming random assignment can yield
severely biased results due to nonrandom assignment.
Rubin causal model incorporating potential outcomes and the assignment mechanism has
recently been used as a general framework for dealing with nonrandom assignment or
nonrandom sampling, and several estimation methods have been developed based on this
approach in order to avoid bias due to nonrandom assignment.
In this talk I will review some recent developments in causal modeling approach and show
that this approach is very useful in various psychometric models. For example, potential
outcome modeling for nonequivalent group equating design reveals that this design requires
stronger assumption than Missing-at-random. Moreover, multiple group item response
modeling of potential outcome can incorporate nonrandom selection of test forms based on
examinees’ abilities or potential outcomes that are not dealt with adequately in previously
proposed models.
Various causal effect estimation methods in structural equation modeling and hierarchical
modeling will be also addressed in this talk.
Chair:
Yutaka Kano, Osaka University, Japan
The 76th Annual and the 17th International Meeting of the Psychometric Society Page 61
Invited Talk: Menu Choice Modeling Thursday, 21 July, 9:00 a.m. – 9:40 a.m., D1-LP-04
Presenter:
Wagner A. Kamakura*, Duke University, USA
Kyuseop Kwak, University of Technology Sydney, Australia
This study focuses on the menus typically found in the marketplace (e.g., restaurants and
Internet vendors), where the consumer may choose one or more from dozens of options or
menu items, each at a posted price or fee. We show that modeling choices out of the typical
menu leads to the “curse of dimensionality,” which transpires in two ways. First, the number
of interactions among menu items grows disproportionately to the number of items in the
menu. Second, because of these interactions, the choice set (all possible menu selections)
grows geometrically with the number of items in the menu. We propose a menu choice model
that circumvents these two problems in a feasible and flexible, but parsimonious way. We
then apply and test the proposed model on data from both Monte-Carlo simulations and an
actual choice experiment where a sample of consumers was asked to make choices from eight
menus combining a base system and a subset among 25 optional features.
Chair:
Herbert Hoijtink, University Utrecht, the Netherlands
The 76th Annual and the 17th International Meeting of the Psychometric Society Page 62
Keynote Address: Using Explanatory Unfolding Models in Prediction of Sensory
Judgment and Choice
Thursday, 21 July, 9:50 a.m. – 10:45 a.m., C-LP-11
Presenter:
Willem J. Heiser, Leiden University, Netherlands
Unfolding models account for proximity data by single-peaked response functions. Two
paradigms can be distinguished under which these models have been developed. In the Judge
Response (JR) paradigm, unfolding provides scale values for the stimulus objects under study;
the response functions describe differences between judges. In the Item Response (IR)
paradigm, unfolding provides scale values for the persons under study (scores); here, the
response functions describe differences between items.
Explanatory unfolding models reparametrize the scale values in terms of independent
stimulus characteristics (in the JR paradigm) or person characteristics (in the IR paradigm).
They may also reparametrize the single-peaked response functions in terms of independent
judge characteristics (JR) or item characteristics (IR).
Introduction of the independent characteristics—or explanatory variables—into the problem
has the advantage that it turns a measurement model into a prediction model. Explanatory
unfolding has been more developed in the JR paradigm than in the IR paradigm. Therefore,
two recent techniques are illustrated with judgment and choice data from the sensory domain.
Chair:
Mark Wilson, University of California at Berkeley, USA

The 76th Annual and the 17th International Meeting of the Psychometric Society Page 63
Invited Symposium : Categorical Marginal Models
Thursday, 21 July, 11:10 a.m. – 12:30 a.m., D1-LP-03
Organizer:
L. Andries van der Ark , Tilburg University, The Netherlands
Presenters (marked with asterisks):
Marginal Models for Dependent, Clustered, and Longitudinal Categorical Data.
Wicher P. Bergsma*, London School of Economics, UK
Marcel A. Croon, Tilburg University, The Netherlands
Jacques A. Hagenaars, Tilburg University, The Netherlands
Estimating Categorical Marginal Models for Large Sparse Contingency Tables
L. Andries van der Ark*, Tilburg University, The Netherlands
Wicher P. Bergsma, London School of Economics, UK
Marcel A. Croon, Tilburg University, The Netherlands
Testing Cronbach's Alpha Using Feldt's Approach and a New Marginal Modeling
Approach
Renske E. Kuijpers*, Tilburg University, The Netherlands
L. Andries van der Ark , Tilburg University, The Netherlands
Marcel A. Croon, Tilburg University, The Netherlands
Marginal Models for Longitudinal Categorical Data from a Complex Rotating Design
Marcel A. Croon*, Tilburg University, The Netherlands
Wicher P. Bergsma, London School of Economics, UK
Jacques A. Hagenaars, Tilburg University, The Netherlands
Francesca Bassi, University of Padova, Italy
The 76th Annual and the 17th International Meeting of the Psychometric Society Page 64
Symposium : Cognitive Diagnostic Computerized Adaptive Testing: Key Issues on Item
Selection Algorithm
Thursday, 21 July, 11:10 a.m. -- 12:30 a.m., D1-LP-04
Organizer:
Hua-Hua Chang, University of Illinois at Urbana-Champaign, USA
Presenters (marked with asterisks):
A Comparative Study of Item Exposure Control Methods in Cognitive Diagnostic
Computerized Adaptive Testing
Ping Chen*, Beijing Normal University, China
Tao Xin, Beijing Normal University
Generalized Monte Carlo Approach in Cognitive Diagnostic Computerized Adaptive
Testing with Content Constraints
Xiuzhen Mao*, Beijing Normal University, China
Tao Xin, Beijing Normal University
Research on Item-Selection Strategy of Computerized Adaptive Cognitive Diagnostic
Testing
Zhihui Wu*, Jiangxi Normal University, China
Shuliang Ding, Jiangxi Normal University, China
Gan Dengwen, Jiangxi Normal University, China
The Improved Maximum Priority Index Method and its Application in Cognitive
Diagnostic Computerized Adaptive Testing
Yirao Pan*, Jiangxi Normal University, China
Shuliang Ding, Jiangxi Normal University, China
The 76th Annual and the 17th International Meeting of the Psychometric Society Page 65
Parallel Session: Measurement Issues
Thursday , 21 July, 11:10 a.m. -- 12:30 p.m., D1-LP-06
Presenters (marked with asterisks):
The Review of Two Methods of Questionnaire and Dimension - Traditional Methods
and Facet Theory
Li Zhang*, South China Normal University, China
Min-Qiang Zhang, South China Normal University, China
Does Increasing Number of Points in Likert Scale Better Approaches Normality?
Huiping Wu*, Central China Normal University, China
Shing On Leung, University of Macau, Macau
Exploring Added Value Subscores with Item Topic Modeling
Makoto Sano*, Prometric Japan Co., Ltd., Japan
A Random Sampling Inspection Model for Performance Measurement: An Alternative
to IRT
Zhong'en Xi*, Chongqing University of Post and Telecommunications, China
Moderator:
Mark Wilson, University of California, Berkeley, USA

The 76th Annual and the 17th International Meeting of the Psychometric Society Page 66
Parallel Session: Rasch Models - Methodology
Thursday, 21 July, 11:10 a.m. -- 12:30 p.m., D1-LP-07
Presenters (marked with asterisks):
Traps of the Bootstrap
Rainer Alexandrowicz*, Alps-Adria-University Klagenfurt, Austria
Clemens Draxler, Ludwig-Maximilians-University Munich, Germany
Reducing Item Difficulty Estimation Bias in the Rasch Model Caused by Guessing: A
Weighted Conditional Likelihood Approach
Christof Schuster*, Univeristy of Giessen, Germany
Ke-Hai Yuan, University of Notre Dame, USA
Applying the Rasch Sampler to Identify Aberrant Responding by Person Fit Statistics
under Fixed α-level
Christian Spoden*, University of Duisburg-Essen, Germany
Jens Fleischer, University of Duisburg-Essen, Germany
Detlev Leutner, University of Duisburg-Essen, Germany
Optimizing Distribution of Rating Scale Category in Rasch Model
Han-Dau Yau*, National Taiwan Sport University, Taiwan
Wei-Che Yao, National Taiwan Sport University, Taiwan
Monitoring Compromised Items on Live Exams
Shu-Chuan Kao*, Pearson, USA
John Stahl, Pearson, USA
Moderator:
Anders Skrondal, Norwegian Institute of Public Health, Norway
The 76th Annual and the 17th International Meeting of the Psychometric Society Page 67
Parallel Session: Structural Equation Modeling - Methodology I
Thursday, 21 July, 11:10 a.m. -- 12:30 p.m., D1-LP-08
Presenters (marked with asterisks):
Dynamic Generalized Structured Component Analysis: A Structural Equation Model
for Analyzing Effective Connectivity in Functional Neuroimaging
Kwanghee Jung*, McGill University, Canada
Yoshio Takane, McGill University, Canada
Heungsun Hwang, McGill University, Canada
A Copula Approach to Dyadic Data: Negative Affect in Couples
Johan Braeken*, Tilburg University, Netherlands
Emilio Ferrer, University of California Davis, USA
Replacing Moderated Multiple Regression with Multiple-Group Path Analysis under
Invariance Constraints in Predictive Studies
Roger Millsap*, Arizona State University, USA
Margarita Olivares-Aguilar, Arizona State University, USA
SEM and Regression Estimation in the Absolute Simplex (Bentler-Guttman Scale)
Peter Bentler*, University of California at Los Angeles, USA
Functional Extended Redundancy Analysis
Heungsun Hwang, McGill University, Canada
Hye Won Suk*, McGill University, Canada
Jang-Han Lee, Chung-Ang University, South Korea
Debbie S. Moskowitz, McGill University, Canada
Moderator:
Adachi Kohei, Osaka University, Japan
The 76th Annual and the 17th International Meeting of the Psychometric Society Page 68
Parallel Session: Generalized Linear and Nonlinear Mixed Effects Models
Thursday, 21 July, 11:10 a.m. -- 12:30 p.m., D2-LP-08
Presenters (marked with asterisks):
On the Likelihood Ratio Test for Bivariate ACE Models
Hao Wu*, Virginia Commonwealth University, USA
Michael, C. Neale, Virginia Commonwealth University, USA
Measuring Implicit Learning with Random Effects: An Application of The Linear
Ballistic Accumulator Model
Ingmar Visser*, University of Amsterdam, Netherlands
Thomas Marshall, University of Amsterdam, Netherlands
On the Statistical Meaning of the Identified Parameters in a Semiparametric Rasch
Model
Ernesto San Martin*, Pontificia Universidad Catolica de Chile, Chile
Combining Generalizability Theory and Item Response Theory using the GLLAMM
Framework
Jinnie Choi*, University of California at Berkeley, USA
Mark Wilson, University of California at Berkeley, USA
Sophia Rabe-Hesketh, University of California at Berkeley, USA
The Multilevel Generalized Graded Unfolding Model
Chen-Wei Liu*, The Hong Kong Institute of Education, Hong Kong
Wen Chung Wang, The Hong Kong Institute of Education, Hong Kong
Moderator:
Wagner A. Kamakura, Duke University, USA
The 76th Annual and the 17th International Meeting of the Psychometric Society Page 69
Parallel Session: Test Development and Validation
Thursday, 21 July, 11:10 a.m. -- 12:30 p.m., D2-LP-09
Presenters (marked with asterisks):
Never Say “Not:” Impact of Negative Wording in Probability Phrases on Imprecise
Probability Judgments
Michael Smithson*, The Australian National University, Australia
David Budescu, Fordham University, USA
Stephen Broomell, Pennsylvania State University, USA
Han-Hui Por, Fordham University, USA
Is Test Taker Perception Of Assessment Related to Construct Validity?
Qin Xie*, The Hong Kong Institute of Education, Hong Kong
The Effects of Individual Characteristics, Family Backgrounds, and School Region
Factors on Students' Bullying: A Multilevel Analysis of Public Middle Schools in China
Li-Jun Wang*, Zhejiang Normal University, China
Hai-Gen Gu, Shanghai Normal University, China
Xian-Liang Zheng, Gannan Normal University, China
Wen Chung Wang, The Hong Kong Institute of Education, Hong Kong
Magdalena Mo Ching Mok, The Hong Kong Institute of Education, Hong Kong
Factor Structure and Psychometric Properties of Two Shortened Scales for Measuring
Competency for Universities Students in the 21st Century
Nicole Ruihui Xu*, University of Macau, Macau
Shing On Leung, University of Macau, Macau
Magdalena Mo Ching Mok, The Hong Kong Institute of Education, Hong Kong
The Psychometric Properties of Survey of Attitudes Toward Statistics (SATs)
Ratna Jatnika*, University of Padjadjaran, Indonesia
Fitri Ariyanti, University of Padjadjaran, Indonesia
Moderator:
Matthias von Davier, Educational Testing Service, USA
The 76th Annual and the 17th International Meeting of the Psychometric Society Page 70
Parallel Session: Differential Item Functioning & Local Independence
Thursday, 21 July, 11:10 a.m. -- 12:30 p.m., D2-LP-10
Presenters (marked with asterisks):
Detection of Differential Item Functioning in Multiple Groups Using Item Response
Theory Methods
Seock-Ho Kim*, The University of Georgia, USA
Allan S. Cohen, The University of Georgia, USA
Youn-Jeng Choi, The University of Georgia, USA
Sun-Joo Cho, Vanderbilt University, USA
Sukwoo Kim, Pusan National University, South Korea
Incorporating Differential Item Function into Longitudinal Item Response Models
Leah McGuire*, University of Minnesota, USA
Detection of Differential Item Functioning in MULTILOG and IRTLRDIF
Youn-Jeng Choi*, University of Georgia, USA
Allan S. Cohen, University of Georgia, USA
Seock-Ho Kim, University of Georgia, USA
A New Procedure for Detecting Departures from Local Independence in Item Response
Models
Michael Edwards*, The Ohio State University, USA
Carrie Houts, The Ohio State University, USA
Li Cai*, University of California at Los Angeles, USA
Identifying Local Dependence with a Score Test Statistic Based on the Bifactor
2-Parameter Logistic Model
Yang Liu*, The University of North Carolina, USA
David Thissen, The University of North Carolina, USA
Moderator:
Terry Ackerman, University of North Carolina at Greensboro, USA
The 76th Annual and the 17th International Meeting of the Psychometric Society Page 71
Invited Symposium : Some Aspects of Design and Analysis in Longitudinal Studies
Thursday, 21 July, 1:30 p.m. – 2:50 p.m., D1-LP-03
Organizer:
Frans E.S. Tan, Maastricht University, The Netherlands
Presenters (marked with asterisks):
Maximin Marginal Designs for Longitudinal Studies
Frans E.S. Tan*, Maastricht University, The Netherlands
Modeling HIV Viral Rebound using Differential Equations
Jan Serroyen*, Maastricht University, The Netherlands
Geert Molenberghs, Hasselt University and K.U. Leuven, Belgium
Model Based Estimates of Long-Term Persistence of Induced HPV Antibodies:
Hierarchical Bayesian Approach
Ziv Shkedy*, Hasselt University and K.U. Leuven, Belgium
Mehreteab Fantahun, Hasselt University and K.U. Leuven, Belgium
Geert Molenberghs, Hasselt University and K.U. Leuven, Belgium
Modelling the Impact of Hypertensive Treatments on Longitudinal Blood Pressure
Measurements and Cardiovascular Events
M Carr*, University of Manchester, UK
R McNamee, University of Manchester, UK
J Pan, University of Manchester, UK
K Cruickshank, University of Manchester, UK
G Dunn, University of Manchester, UK
The 76th Annual and the 17th International Meeting of the Psychometric Society Page 72
Symposium : Measuring a Learning Progression for Data Modeling: Alternative
Psychometric Modeling Approaches
Thursday, 21 July, 1:30 p.m. -- 2:50 p.m., D1-LP-04
Organizer:
Elizabeth Ayers, University of California, Berkeley, USA
Presenters (marked with asterisks):
Developing Assessments of Data Modeling and Mapping a Learning Progression
Mark Wilson*, University of California, Berkeley, USA
Elizabeth Ayers, University of California, Berkeley, USA
Rich Lehrer, University of California, Berkeley, USA
Mapping a Learning Progression Using Unidimensional and Multidimensional Item
Response Models
Robert Schwartz*, University of California, Berkeley, USA
Elizabeth Ayers, University of California, Berkeley, USA
Mark Wilson, University of California, Berkeley, USA
Modeling Links Between Dimensions of a Learning Progression Using SEM
Elizabeth Ayers*, University of California, Berkeley, USA
David Torres Irribarra, University of California, Berkeley, USA
Mark Wilson, University of California, Berkeley, USA
Developing Assessments of Data Modeling and Mapping a Learning Progression using a
Structured Constructs Model
Ronli Diakow*, University of California, Berkeley, USA
David Torres Irribarra, University of California, Berkeley, USA
The 76th Annual and the 17th International Meeting of the Psychometric Society Page 73
Parallel Session: Latent Class Analysis
Thursday, 21 July, 1:30 p.m. -- 2:50 p.m. , D1-LP-06
Presenters (marked with asterisks):
Assessing Eye Movement Transitions using Multilevel Markov Models
Samantha Bouwmeester*, Erasmus University Rotterdam, Netherlands
Lisa VandeBerg, Erasmus University Rotterdam, Netherlands
Rolf A. Zwaan, Erasmus University Rotterdam, Netherlands
Dynamic Bayesian Inference Network for Modeling Learning Progressions over
Multiple Time Points
Younyoung Choi*, University of Maryland, USA
Robert Mislevy, Univsersity of Maryland, USA
Hierarchical Bayes Granger Causality Analysis for Understanding Purchase Behaviors
of Multiple Product Categories
Kei Miyazaki*, Nagoya University, Japan
Takahiro Hoshino, Nagoya University, Japan
Multilevel Latent Class Model Used in Group-level Classification: Appropriate
Application of Model Criteria
Jie-Ting Zhang*, South China Normal University, China
Min-Qiang Zhang, South China Normal University, China
Can Jiao, Shenzhen University, China
Work-Family Conflict : A Latent Prolife Analysis
Yanhong Gao*, South China Normal University, China
Min-Qiang Zhang, South China Normal University, China
Moderator:
Michael E. Sobel, Columbia University, USA
The 76th Annual and the 17th International Meeting of the Psychometric Society Page 74
Parallel Session: Rasch Models - Theory and Practice
Thursday, 21 July, 1:30 p.m. -- 2:50 p.m. , D1-LP-07
Presenters (marked with asterisks):
Validation of Hortwitz’s (1987) Beliefs about Language Learning Inventory with
Chinese Mainland Sample – Traditional Factor Analysis Versus Rasch Modeling
Lijuan Li*, The Hong Kong Institute of Education, China
Assessing Dimensionality Using Rasch Rating Scale Model
Kun Jacob Xu*, The Hong Kong Institute of Education, Hong Kong
Magdalena Mo Ching Mok, The Hong Kong Institute of Education, Hong Kong
Sample Size Determination for Rasch Model Tests
Clemens Draxler*, Ludwig-Maximilians-Universität München, Germany
Modeling of Students’ Satisfaction of an Online Database: An Empirical Study
Atiquil Islam A.Y.M. *, International Islamic University Malaysia, Malaysia
Analyzing Two-Tier Items with the Steps Model
Hak Ping Tam*, National Taiwan Normal University, Taiwan
Margaret Wu, University of Melbourne, Australia
Moderator:
Han-Dau Yau, National Taiwan Sport University, Taiwan
The 76th Annual and the 17th International Meeting of the Psychometric Society Page 75
Parallel Session: Structural Equation Modeling - Applications I
Thursday, 21 July, 1:30 p.m. -- 2:50 p.m. , D1-LP-08
Presenters (marked with asterisks):
Measurement Invariance of Survey Data: A Cross-Cultural Analysis
Timothy Teo*, Nanyang Technological University, Singapore
Investigating Factorial Invariance of Teacher Assessment Literacy Inventory between
Primary and Secondary School Teachers
See Ling Suah*, Universiti Sains Malaysia, Malaysia
Saw Lan Ong, Universiti Sains Malaysia, Malaysia
Confirmatory Factor Models for Representing Processing Strategies Associated with a
Cognitive Measure
Karl Schweizer*, Goethe University Frankfurt, Germany
The Development of Leisure Satisfaction Scale for Gifted Students
Wei-Ching Lee*, Taipei Municipal University of Education, Taiwan
Chin-Fei Cheng, Taipei Municipal University of Education, Taiwan
Exploring the Validity of Learning-Related Boredom Scale in Canada and China
Virginia Man Chung Tze*, University of Alberta, Canada
Robert Klassen, University of Alberta, Canada
Lia Daniels, University of Alberta, Canada
Johnson Ching Hong Li, University of Alberta, Canada
Moderator:
Mike W.-L. Cheung, National University of Singapore, Singapore
The 76th Annual and the 17th International Meeting of the Psychometric Society Page 76
Parallel Session: Hierarchical & Multilevel Models
Thursday, 21 July, 1:30 p.m. -- 2:50 p.m. , D2-LP-08
Presenters (marked with asterisks):
Factor Analyzing Regression Slopes in Multilevel Model
Yasuo Miyazaki*, Virgnia Tech, USA
Avoiding Boundary Estimates in Hierarchical Linear Models Through Weakly
Informative Priors
Yeojin Chung*, University of California, Berkeley, USA
Sophia Rabe-Hesketh, University of California, Berkeley, USA
Andrew Gelman, Columbia University, USA
Jingchen Liu, Columbia University, USA
Vincent Dorie, Columbia University, USA
Comparison of Aggregated Scores Adjusted and Non-Adjusted for Nested Effects in
Nested/Hierarchical Measures
Ralph Carlson*, The University of Texas Pan American, USA
Hilda Medrano, The University of Texas Pan American, USA
Carlo Flores, McAllen Independent School District, USA
A Hierarchical Testlet Response Theory Model
Chia-Hua Lin*, National Taichung University of Education, Taiwan
Bor-Chen Kuo, National Taichung University of Education, Taiwan
Tien-Yu Hsieh, National Taichung University of Education, Taiwan
Yan-Ru Wu, National Taichung University of Education, Taiwan
Multilevel Item Response Models for Hierarchal Latent Traits
Wen Chung Wang*,The Hong Kong Institute of Education, Hong Kong
Kuan-Yu Jin, The Hong Kong Institute of Education, Hong Kong
Joseph Kui-Foon Chow, The Hong Kong Institute of Education, Hong Kong
Moderator:
Oi-Man Kwok, Texas A&M University, USA

The 76th Annual and the 17th International Meeting of the Psychometric Society Page 77
Parallel Session: Test Development and Validation - Ability Measures I
Thursday, 21 July, 1:30 p.m. -- 2:50 p.m. , D2-LP-09
Presenters (marked with asterisks):
A Two-Tier Testing and Bayesian Network Based Adaptive Remedial Instruction
System in Dilation of a Graph
Shu-Chuan Shih*,National Taichung University of Education, Taiwan
Bor-Chen Kuo, National Taichung University of Education, Taiwan
Chih-Wei Yang, National Taichung University of Education, Taiwan
Neural Cognitive Assessments in Recognizing Pictographic and Phonemic Abilities
Pei-Tzu Huang*,National Taichung University, Taiwan
Chih-Chien Yang, National Taichung University, Taiwan
Kittagali Scale – a Scale to Measure Productivity under the Influence of Music, Motor
and Logical Analogy
Anilkumar Kittagali*, Acharya's Bangalore B-School, India
Cognitive Diagnosis Research Based on RSM for Chinese Children’ Rapid Naming and
Working Memory Defects
Xiaoling Fan*, Hunan Normal University, China
Fang Liu, Hunan Normal University, China
Jun Wang, Hunan Normal University, China
The Case Study of University Teacher’ Course- Arrangement in Learning Calculus
Bor-Chen Kuo, National Taichung University , Taiwan
Mu-Yu Ting*, National Formosa University, Taiwan
Moderator:
Anton Béguin, Cito Institute of Educational Measurement, The Netherlands
The 76th Annual and the 17th International Meeting of the Psychometric Society Page 78
Parallel Session: Standard Setting and Score Use
Thursday, 21 July, 1:30 p.m. -- 2:50 p.m. , D2-LP-10
Presenters (marked with asterisks):
An Application of Many-Facet Rasch Measurement in the Yes/No Angoff Standard
Setting Procedure
Mingchuan Hsieh*, National Academy for Educational Research, Taiwan
Item-Centered Procedures for Standard Setting in the Rasch Poisson Counts Model
Jorge González, Pontificia Universidad Católica de Chile, Chile
Rianne Janssen*, Katholieke Universiteit Leuven, Belgium
Ernesto San Martin, Pontificia Universidad Católica de Chile, Chile
Setting Cutscores with the Bookmark Method: Internal and External Validation
Zamri khairani Ahmad*, Universiti sains malaysia, Malaysia
Nordin Abd. Razak, Universiti sains malaysia, Malaysia
Communicating Test Scores to Teachers: Moving from Statistics to Use
Gavin T L Brown*, The Hong Kong Institute of Education, Hong Kong
John Hattie, The University of Melbourne, Australia
Statistical Quality Control Tools and Models in Monitoring Test Scores
Alina A. von Davier*, Educational Testing Service, USA
Moderator:
Matthias von Davier, Educational Testing Service, USA
The 76th Annual and the 17th International Meeting of the Psychometric Society Page 79
State of Art Talk: Item Response Theory and Non-Cognitive Measurement
Thursday, 21 July, 3:00 p.m. – 3:30 p.m., D1-LP-02
Presenter:
Rob R. Meijer, University of Groningen, Netherlands
Applications of item response theory (IRT) to non-cognitive measures have been numerous in
recent years. Historically, IRT has been developed to solve practical problems in
large-scale multiple-choice achievement and aptitude testing. In this presentation I discuss the
trends and findings in the non-cognitive measurement field. Many non-cognitive instruments
are constructed as unpretentious workaday instruments with little understanding of
psychological theory and psychometric theory and this has impact on the application of IRT
to these types of data. Emigration of IRT methodology from cognitive to non-cognitive
measures raises new and interesting challenges. Topics that will be addressed are (1) What
did we learn from the application of IRT models to non-cognitive data as compared to
cognitive data? (2) which models are most suited to model non-cognitive measures? (3)
Should we use unidimensional or multidimensional models?
Chair:
Denny Borsboom, University of Amsterdam, the Netherlands
The 76th Annual and the 17th International Meeting of the Psychometric Society Page 80
State of Art Talk: Bayesian Unimodal Density Regression
Thursday, 21 July, 3:00 p.m. – 3:30 p.m., D1-LP-04 Presenter:
George Karabatsos, University of Illinois-Chicago, USA
Stephen G. Walker, University of Kent, Canterbury, UK
I introduce a new Bayesian nonparametric regression model, an infinite-mixture model that
allows the entire probability density of the response variable to depend on the covariate
vector, x. The model consists of covariate-dependent mixture weights defined by an
ordered-probit regression, having an infinite sequence of random probit variances, and having
systematic component defined by a random process, such as a Gaussian process. Each kernel
of the infinite mixture is a possibly-distinct and general unimodal density, specifically, a
scale-mixture of uniforms flexibly modeled by a nonparametric, stick-breaking prior, e.g., a
Dirichlet process (DP) or a Pitman-Yor process. Discrete responses (e.g., binary 0/1) are
modeled by a nonparametric scale mixture of uniforms link. The Bayesian nonparametric
regression model is completed by assigning a prior distribution to all parameters and
hyper-parameters of the model. A feature of the new model is that, for any given x value, the
response density is unimodal when the x value is informative about the response, and is
multimodal when x is not very informative. The new model is illustrated through the analysis
of a real educational data, simulated data, and medical data involving binary responses. In
terms of cross-validated predictive utility, the new model outperforms other regression
models, including Bayesian additive regression trees, additive and generalized additive
models, the LASSO, ANOVA/linear dependent DP, linear regression with Pólya tree prior on
the error distribution, binary regression with DP-mixture link, normal- and DP-mixed random
effects models, the single index model, and linear and generalized linear models.
Chair:
Matt Grady, University of Nebraska–Lincoln, USA

The 76th Annual and the 17th International Meeting of the Psychometric Society Page 81
Invited Symposium : Aspects of Structural Equation Modeling
Thursday, 21 July, 4:00 p.m. -- 5:20 p.m., D1-LP-03
Organizer:
Haruhiko Ogasawara, Otaru University of Commerce, Japan
Presenters (marked with asterisks):
A Measure of Skewness of Testing For Normality
Shigekazu Nakagawa*, Kurashiki University of Science and the Arts, Japan
Hiroki Hashiguchi, Saitama University, Japan
Naoto Niki, Tokyo University, Japan
Applications of Asymptotic Expansion In Structural Equation Modeling
Haruhiko Ogasawara*, Otaru University of Commerce, Japan
Interaction Between Strategies and Invariance/Noninvariance Conditions in Testing for
Partial Invariance in Structural Equation Modeling
Soonmook Lee*, Sungkyunkwan University, Korea
Hanjoe Kim, Tennessee State University, USA
Joint Bayesian Model Selection and Parameter Estimation for Latent Growth Curve
Mixture Model
Satoshi Usami*, University of Tokyo, Japan
The 76th Annual and the 17th International Meeting of the Psychometric Society Page 82
Symposium : Process models for behavioral dynamics
Thursday, 21 July, 4:00 p.m. -- 5:20 p.m., D1-LP-04
Organizer:
Peter F. Halpin, University of Amsterdam, The Netherlands
Presenters (marked with asterisks):
Models of Dyadic Dependence for Event Sampling Data
Peter F. Halpin*, University of Amsterdam, The Netherlands
Raoul P. P. P. Grasman, University of Amsterdam, The Netherlands
Paul De Boeck, University of Amsterdam & K.U.Leuven, The Netherlands/ Belgium
Structural Relations Underlying Multivariate Event Sequences
Raoul P. P. P. Grasman*, University of Amsterdam, The Netherlands
Peter F. Halpin, University of Amsterdam, Netherlands
Hierarchical Diffusion Models for Intensive Longitudinal Data Analysis
Francis Tuerlinckx*, K.U. Leuven, Belgium
Zita Oravecz, K. U. Leuven, Belgium
Joachim Vandekerckhove, K. U. Leuven, Belgium
Sequential Order Based GLMMs for Random Person and Item Effects
Paul De Boeck*, University of Amsterdam & K.U.Leuven, The Netherlands/ Belgium
The 76th Annual and the 17th International Meeting of the Psychometric Society Page 83
Parallel Session: Response Time and Equating
Thursday, 21 July, 4:00 p.m. -- 5:20 p.m. , D1-LP-06
Presenters (marked with asterisks):
A Joint Model for Item Response and Response Times Based on the Relationship
Between Accuracy and Speed of Test Takers
Xiang Bin Meng*, Northeast Normal University, China
Jian Tao, Northeast Normal University, China
Ning-Zhong Shi, Northeast Normal University, China
Modeling Response Time in Computerized Testing Using Semi-parametric Linear
Transformation Model
Chun Wang*, University of Illinois at Urbana-Champaign, USA
Hua-Hua Chang, University of Illinois at Urbana-Champaign, USA
Jeffrey Douglas, University of Illinois at Urbana-Champaign, USA
The Impact of Different Settings of Missing Value Options in WINSTEPS and
PARSCALE on IRT Equating or Linking
Zhiming Yang*, Educational Testing Service, USA
Maolin Ye, Management School of Jinan University, China
Ming Xiao, Partory School of Business, China
A Bayesian Approach to Concurrent Calibration Analysis for Non-equivalent Groups
with Anchor Test Design
Lin-shan Yang*, ShenZhen Seaskyland Educational Evaluation Co.,Ltd
Yan Liu, ShenZhen Seaskyland Educational Evaluation Co.,Ltd
Chen Yang, ShenZhen Seaskyland Educational Evaluation
Small N and Utility of An Extended Circle-Arc Equating Method
Jaehoon Seol, Prometric, USA
Shungwon Ro*, Kenexa, USA
Sarah Hagge, National Council of State Boards of Nursing, USA
Seonho Shin, Prometric, USA
Moderator:
Wim J. van der Linden, CTB/McGraw-Hill, USA
The 76th Annual and the 17th International Meeting of the Psychometric Society Page 84
Parallel Session: Categorical Data Analysis
Thursday, 21 July, 4:00 p.m. -- 5:20 p.m. , D1-LP-07
Presenters (marked with asterisks):
The Wellbeing of Creepies and Crawlies on The Sea Bed: A Three-Way
Correspondence Analysis
Pieter M. Kroonenberg*, Leiden University, Netherlands
An Extension of Proportional Odds Models: Using Generalized Ordinal Logistic
Regression Models for Educational Data
Xing Liu, Eastern Connecticut State University, USA
Jiarong Zhao*, Nanjing Normal University, China
Wei Xia, University of Connecticut, USA
Maximum Likelihood and Weighted Least Square Estimators in Estimating
Nature-Nurture Models
I-Hau Hsu *, National Taichung University, Taiwan
Chih-Chien Yang, National Taichung University, Taiwan
Predicting Discrete Macro-Level Outcome Variables with Micro-Level Explanatory
Variables: A Latent Class Approach
Margot Bennink*, Tilburg University, Netherlands
Marcel A. Croon, Tilburg University, Netherlands
Jeroen K. Vermunt, Tilburg University, Netherlands
Within-Subject Analysis of Variance and Generalized Linear Mixed Models for Binary
Outcome
Ehri Ryu*, Boston College, USA
Moderator:
Jos M.F. ten Berge, University of Groningen, The Netherlands
The 76th Annual and the 17th International Meeting of the Psychometric Society Page 85
Parallel Session: Factor Analysis
Thursday, 21 July, 4:00 p.m. -- 5:20 p.m. , D1-LP-08
Presenters (marked with asterisks):
Exploratory Bi-Factor Analysis
Robert I. Jennrich, University of California at Los Angeles, USA
Peter Bentler*, University of California at Los Angeles, USA
The Infinitesimal Jackknife with Exploratory Factor Analysis
Guangjian Zhang*, University of Notre Dame, USA
Kristopher J. Preacher, University of Kansas, USA
Robert I. Jennrich, University of California at Los Angeles, USA
One-Stage Rotation Method for Second-Order Factor Analysis
Hsing-Chuan Hsieh*, National Chung Cheng University, Taiwan
Chung-Ping Chen , National Cheng Kung University,Taiwan
Oblique Rotation Techniques with Clustering Of Variables
Michio Yamamoto*, Osaka University, Japan
Dimensionality Assessment of Ordered Polytomous Items with Parallel Analysis
Marieke E immerman*, University of Groningen, Netherlands
Urbano Lorenzo-Seva, Rovira i Virgili University, Spain
Moderator:
Michael Browne, The Ohio State University, USA
The 76th Annual and the 17th International Meeting of the Psychometric Society Page 86
Parallel Session: Computational Methods
Thursday, 21 July, 4:00 p.m. -- 5:20 p.m. , D2-LP-08
Presenters (marked with asterisks):
Comparisons between the Universal Sampler and the Slice Sampler
Jianhui Ning*, Central China Normal University, China
Yuchung Wang, Rutgers University, USA
An Evaluation of Algorithms on Generating Multivariate Non-Normal Data
Hao Luo*, Uppsala University, Sweden
Fan Yang-Wallentin, Norwegian School of Management, Sweden
Bootstrap Confidence Intervals for the Meta-analysis of Correlations Corrected for
Indirect Range Restriction
Johnson Ching Hong Li*, University of Alberta, Canada
Ying Cui, University of Alberta, Canada
Mark J. Gierl, University of Alberta, Canada
Wai Chan, The Chinese University of Hong Kong, Hong Kong
Application of Bootstrap Methods In Psychological Research
Qingqing Xiong*,South China Normal University, China
Min-Qiang Zhang, South China Normal University, China
Lord's Paradox and the Use of Growth and Value-Added Models for School
Accountability
Andrew Ho*, Harvard Graduate School of Education, USA
Moderator:
Johan Lyhagen, Uppsala University, Sweden
The 76th Annual and the 17th International Meeting of the Psychometric Society Page 87
Parallel Session: Test Development and Validation - Ability Measures II
Thursday, 21 July, 4:00 p.m. -- 5:20 p.m. , D2-LP-09
Presenters (marked with asterisks):
Quantitative Neurocognitive Measurements of Procedural and Conceptual Knowledge
of Spatial Ability
Ting-Yao Liao*,National Taichung University, Taiwan
Chih-Chien Yang, National Taichung University, Taiwan
Establish an Adaptive Diagnostic Test System for “Calculus” Using “Finding Area By
Integral” Unit as an Example
Bor-Chen Kuo, National Taichung University , Taiwan
Mu-Yu Ting, National Formosa University, Taiwan
Hsiang-Chuan Liu, Asia University, Taiwan
Yu-Lung Liu*, Asia University, Taiwan
Standardization of Test Battery for Diagnostics of Motor Laterality Manifestation
Martin Musalek*, Charles University, Czech Republic
Expert Judgment for Content Validity: A Study of a Malaysian University Listening
Skill Entrance Test
Elia Md Johar*, MARA University of Technology (UiTM), Malaysia
Ainol Madziah Zubairi, International Islamic University Malaysia (IIUM), Malaysia
Mohamad Sahari Nordin, International Islamic Malaysia (IIUM), Malaysia
Moderator:
Han-Dau Yau, National Taiwan Sport University, Taiwan
The 76th Annual and the 17th International Meeting of the Psychometric Society Page 88
Parallel Session: Computerized Adaptive Testing and Cognitive Diagnosis Modeling
Thursday, 21 July, 4:00 p.m. -- 5:20 p.m. , D2-LP-10
Presenters (marked with asterisks):
A Simulation Study of Qmatrix Design to CAT Strategies for Cognitive Diagnosis
Chun-Hua Chen*, National Taichung University, Taiwan
Bor-Chen Kuo, National Taichung University, Taiwan
Chih-Wei Yang, National Taichung University, Taiwan
The Exploration of Item Selection Strategy for Cognitive Diagnosis_Computerized
Adaptive Test
Zhiyong Shang*, Jiangxi Normal University, China
Shuliang Ding, Jiangxi Normal University, China
Controlling Item Exposure in Cognitive Diagnostic Computerized Adaptive Testing
Xiuzhen Mao*, Beijing Normal University, China
Tao Xin, Beijing Normal University, China
The Comparison of Item Selection Methods in Diagnostic Computerized Adaptive Tests
using Rule Space Model
Jian-Bing Wen*, East China Normal University, China
Computerized Classification Testing Under the DINA Model
Jyun-Ji Lin*, National Chung Cheng University, Taiwan
Wen Chung Wang, The Hong Kong Institute of Education, Hong Kong
Shu-Ying Chen, National Chung Cheng University, Taiwan
Moderator:
David Thissen, University of North Carolina at Chapel Hill, USA

The 76th Annual and the 17th International Meeting of the Psychometric Society Page 89
Poster Session II
Thursday, 21 July, 5:30 p.m. – 7:00 p.m., Lower Podium Floor of Block D1 & D2 Poster Presenters (marked with asterisks):
The Application Exploration of Survival Analysis Method in Psychological research
Chuan Chen*, South China Normal University, China
Min-Qiang Zhang, South China Normal University, China
Applying MCMC Algorithm in Estimating Variance Components for Generalizability
Theory
Kaiyin Guo*, South China Normal University, China
Min-Qiang Zhang, South China Normal University, China
Guangming Li, South China Normal University, China
The Criteria and Analysis of Subjective Assessments in Testing
Rui Xiang*, Teachers College Columbia University, USA
The properness about dimension of achievement goal and role of the autonomy in
learning process
Chia-Cheng Chen*,National Taiwan University of Arts, Taiwan
Students how to use self-regulated learning strategies in a web-based learning
environment
Chun-Yuan Chang*, National Taipei University of Education, Taiwan
The Effect of Different Compensatory Relationships in the Variance-Covariance
Structure on the Test of Fixed Effects in a Multilevel Linear Growth Curve Model
Yuan-Hsuan Lee*, National Chiao Tung University, Taiwan
Oi-Man Kwok, Texas A&M University, USA
Jiun-Yu Wu, National Chiao Tung University, Taiwan
Comparing Design-based and Model-based Latent Growth Models on Analyzing
longitudinal data: A Monte Carlo Study
Oi-Man Kwok*, Texas A&M University, USA
Jiun-Yu Wu, National Chiao Tung University, Taiwan
The 76th Annual and the 17th International Meeting of the Psychometric Society Page 90
The Recovery of Item and Person Parameters Estimated by the SCORIGHT
Bor-Yaun Twu*, National University of Tainan, Taiwan
Jui-Chiao Tseng, Min-Hwei College of Health Care Management, Taiwan
Yen-Wen Yang, Min-Hwei College of Health Care Management, Taiwan
Sample Size Determination in SEM with Nonnormal Data
Hsin-Yun Liu*, National Taiwan University, Taiwan
Li-Jen Weng, National Taiwan University, Taiwan
A Multi-dimensional Continuous Item Response Model for Probability Testing
Yiping Zhang*, Center for Research on Educational Testing, Japan
Hiroshi Watanabe, Center for Research on Educational Testing, Japan
Using Survival Analysis to Estimate Mediated Effects with Discrete-Time and Censored
Data
Jenn-Yun Tein*, Arizona State University, USA
David P. MacKinnon, Arizona State University, USA
Sample Size Planning with AIPE on RMSEA Revisited: Width? Or Values?
Tzu-Yao Lin*, National Taiwan University, Taiwan
Li-Jen Weng, National Taiwan University, Taiwan
A Study of Standard Setting Method Using the Cluster Analysis
Yeonbok Park*, Korea Institute for Curriculum and Evaluation, South Korea
Jiyoung Jung, Yonsei University, South Korea
Hee-Won Yang, Yonsei University, South Korea
Guemin Lee, Yonsei University, South Korea
The Longitudinal Analysis of Gifted Students’ Science Self-Concept and Science
Achievement: A Multivariate Multilevel Latent Growth Model
Yaling Hou*, National Pingtung University of Education, Taiwan
The 76th Annual and the 17th International Meeting of the Psychometric Society Page 91
The Development of Statistical Thinking Assessment
Chien-Yi Huang*, National University of Tainan, Taiwan
Su-Wei Lin, National University of Tainan, Taiwan
A Preliminary Validity Study for the On-line Literary Reading Assessment
Lan-fang Chou*, National university of tainan, Taiwan
Pi-Hsia Hung, National University of Tainan, Taiwan
The Validity Issues of an Affective Scale Embedded in an Algebra Dynamic Assessment
System
Hui Ju Sun*, National University of Tainan, Taiwan
Pi Hsia Hung, National University of Tainan, Taiwan,
A Study of the Effects of Non-equivalency of Equating Groups on Equating for
Mixed-Format Tests
Jiwon Choi*, Yonsei University, South Korea
Jeonghwa Oh, Yonsei University, South Korea
Guemin Lee, Yonsei University, South Korea
A Speeded Item Response Model: Leave the Harder Till Later
Yu-Wei Chang*, National Tsing-Hua University, Taiwan
Rung-Ching Tsai, National Taiwan Normal University, Taiwan
Nan-Jung Hsu, National Tsing-Hua University, Taiwan
A Simulation Study to Evaluate IRT Scale Transformation Methods with Fixed
c-parameters of Anchor Items
Junbum Lim*, Yonsei University, South Korea
Hwangkyu Lim, Yonsei University, South Korea
Guemin Lee, Yonsei University, South Korea
The Criterion-Related Validity Coefficients of A Situational Interview (si) And A
Behavior Description Interview (bdi) in Railway Policeman Selection Field in China
Yingwu Li*, Tsinghua University, China
Yongda Yu, Tsinghua University, China
The 76th Annual and the 17th International Meeting of the Psychometric Society Page 92
A Multilevel Multidimensional Rasch Model with an Application to DIF by
Hierarchical Generalized Linear Model
Hsin-Ying Huang*, National Chengchi University, Taiwan
Fur-Hsing Wen, Soochow University , Taiwan
Min-Ning Yu, National Chengchi University, Taiwan
Sufficient Conditions of Equivalence in Measurement Model
Wei-Sheng Lin*, National Chung Cheng University, Taiwan
Chung-Ping Chen , National Chung Cheng University, Taiwan
Influence of Pre-Test Design on The Precision of The Parameters Estimation in The
Multidimensional Items Bank
Po-Hsi Chen*, National Taiwan Normal University, Taiwan
Jar-Wen Kuo, National Taiwan Normal University, Taiwan
Yao-Ting Sung, National Taiwan Normal University, Taiwan
The Relationships between Health Responsibility, Emotional Well-being and Depression
in Taiwan
Po-Lin Chen*, National Chengchi University, Taiwan
Min-Ning Yu, National Chengchi University, Taiwan
Pei-Ching Chao, National Chengchi University, Taiwan
Jia-Jia Syu, National Chengchi University, Taiwan
Pei-Chun Chung, National Chengchi University, Taiwan
A Mathematical Model for Trans-Cortical Gamma Synchronizations Under Different
Perceptual Conditions
Chien-Fu Lin*, National Chung Cheng University, Taiwan
Jay-Shake Li, National Chung Cheng University, Taiwan
Model Specification for Latent Nonlinear Effects based on the Mean-Centering and
Double-Mean-Centering Strategies
Shu-Ping Chen*, National Chengchi University, Taiwan
Chung-Ping Chen , National Cheng Kung University , Taiwan
The 76th Annual and the 17th International Meeting of the Psychometric Society Page 93
The Development of The Computerized Imagination Test
Po-Hsi Chen, National Taiwan Normal University, Taiwan
Pei-Yu Lee, National Taiwan Normal University, Tanzania
Chun-Yu Hsu*, National Taiwan Normal University, Taiwan
Su-Ping Hung, National Taiwan Normal University, Taiwan
Jar-Wen Kuo, National Taiwan Normal University, Taiwan
Impact of Optimal Item Bank Design on Parallel-Form Tests for Making Pass-Fail
Decisions
Ting-Ting Yang*,Beijing Normal University, China
Yan Gao, Beijing Normal University, China
Mengjie He, Beijing Normal University, China
Tao Yang, Beijing Normal University, China
Confirmatory Factor Analysis of the 100-item IPIP measure on a large Facebook
dataset
Luning Sun, University of Cambridge, UK
Iva Cek*, University of Cambridge, UK
Sabine A. K. Spindler, University of Cambridge, UK
Michal S. Kosinski, University of Cambridge, UK
David J. Stillwell, University of Nottingham, UK
John N. Rust, University of Cambridge, UK
A Tutorial on Structural Equation Modeling with Incomplete Observations: Multiple
Imputation and FIML Methods Using SAS
Wei Zhang*, SAS Institute Inc, USA
Yiu-Fai Yung, SAS Institute Inc, USA
Mixture Extensions of the Linear Logistic Test Model (LLTM) using Markov Chain
Monte Carlo (MCMC) Estimation
In-Hee Choi*, University of California, Berkeley, USA
Mark Wilson, University of California, Berkeley, USA
Using Bifactor Model To Detect Testlet Effect
Szu-Cheng Lu*, National University of Tainan, Taiwan
Bor-Yaun Twu, National University of Tainan, Taiwan
The 76th Annual and the 17th International Meeting of the Psychometric Society Page 94
Establishing a Confirmatory Factor Analysis Model for the Self-Efficacy for Writing
Scale
Yi-Fang Wu, University of Iowa, USA
Chia-Ling Tu*, National University of Tainan, Taiwan
Utility of Local Linear Approximation in Quantifying Emotional Trajectories Of
Romantic Partners
Amy Schmid*, Columbia University Teachers College, USA
Noelle Leonard, New York University College of Nursing, USA
Amanda Ritchie, New York University College of Nursing, USA
Marya Viorst-Gwadz, New York University College of Nursing, USA
Incorporating Response Time To Model Test Behavior In A Structural Equation
Modeling Framework
Shu-Chen Chan*, National Taiwan Normal University, Taiwan
Rung-Ching Tsai, National Taiwan Normal University, Taiwan
Effects of the Open Recruiting System for Principal Employment on the School
Performance in Korea
Hyejin Kim*, Pusan National University, South Korea
Chang-nam Hong, Pusan National University, South Korea
Gyeong-ryeon Gwak, Pusan National University, South Korea
Jiyoung Nam, Pusan National University, South Korea
The Relationship between Perceived School Support and Teacher's Commitment
Jiyoung Nam**, Pusan National University, South Korea
Chang-nam Hong, Pusan National University, South Korea
Hyejin Kim, Pusan National University, South Korea
The Longitudinal Structure of the Chinese version of Beck Depression Inventory II
using a Latent State-Trait Model
Pei-Chen Wu*, National PingTung University of Education, Taiwan, Taiwan
The 76th Annual and the 17th International Meeting of the Psychometric Society Page 95
Setting a Target Test Information Fuinction for Assembly of IRT-Based Classification
Tests
Kentaro Kato*, Center for Research on Educational Testing, Japan
A Comparison of Item Response Models for A Test Consisting of Testlets
Naoya Toudou*, The University of Tokyo, Japan
Test of Independence by Asymptotic Lambda for Nominal Data using Bootstrap
Yu Hin Ray Cheung*, The Chinese University of Hong Kong, Hong Kong
Lok Yin Joyce Kwan, The Chinese University of Hong Kong, Hong Kong
Wai Chan, The Chinese University of Hong Kong, Hong Kong
A Structural Equation Modeling Approach for The Analysis of Conditional Indirect
Effects
Lok Yin Joyce Kwan*, The Chinese University of Hong Kong, Hong Kong
Wai Chan, The Chinese University of Hong Kong, Hong Kong
Sampling Discrete m x n Matrices with Fixed Margins
Kathrin Gruber*,Vienna University of Economics and Business, Austria
Reinhold Hatzinger, Vienna University of Economics and Business, Austria
The Impacts of the Cognitive Components on the Variance of the Item Difficulties for
the Quantities Compare Test
Wen Chun Tai*, National University of Tainan, Taiwan
Examination of Reliability, Convergent Validity and Discriminant Validity By Using
Multitrait-Multimethod Matrix: Under The Constraint That Sum of The Method
Factors Equal Zero in Correlated Trait Correlated Method Model
Saori Kubo*, Waseda University, Japan
Hideki Toyoda, Waseda University, Japan
The 76th Annual and the 17th International Meeting of the Psychometric Society Page 96
Scheffe-type Paired Comparison Models To Examine Correlations Between Preferences
for Alternatives
Norikazu Iwama*, Waseda University, Japan
Hideki Toyoda, Waseda University, Japan
The Relationship between Parenting Styles and Emotional Intelligence of the Gifted
Students and Ordinary Students at Elementary Schools
Chieh-Ju Tsao*,National Taichung University, Taiwan
Bor-Chen Kuo, National Taichung University, Taiwan
Yu-Ting Chang, National Taichung University, Taiwan
Sequential and Nonsequential Specification Searches in Testing Factorial Invariance
Myeongsun Yoon*, Texas A&M University, USA
EunSook Kim, Texas A&M University, USA
Practicality of Person Fit Statistics as A Diagnostic Tool in A Computerized Adaptive
Testing Setting
Shungwon Ro*, Kenexa, USA
Ji Eun Lee, University of Minnesota, USA
Predictive Data Mining as An Alternative To Standard Regression Modeling in Very
Large Data Sets
Hongwei Yang, The University of Kentucky, USA
Ning Liu*, The University of Kentucky, USA
A Procedure To Derive The Response Model For A Polytomous Item
Wenjiu Du*, Southwest University, China
Hanmin Xiao, Southwest University, China
Issues in Testing Scalar Invariance in Structural Equation Modeling
Chansoon Lee*, Sungkyunkwan University, South Korea
Soonmook Lee, Sungkyunkwan University, South Korea
Testing for Measurement Invariance Using Linear and Nonlinear Confirmatory Factor
Analysis
Dexin Shi*, University of Oklahoma, USA
Hairong Song, University of Oklahoma, USA
A. Robert Terry, University of Oklahoma, USA
The 76th Annual and the 17th International Meeting of the Psychometric Society Page 97
Multilevel Analysis Reveals Increased Proactive Interference Among Low Working
Memory Span Individuals
Ye Wang*, University of Florida, USA
David Therriault, University of Florida, USA
James Algina, University of Florida, USA
Long-term Change of Relational Aggression among Mexican American Youth
Xiaolan Liao*, University of Oklahoma, USA
Rand Conger, University of California, Davis, USA
Gary Stockdale, University of California, Davis, USA
The Validation of Measurement Invariance across Gender in Volitional Questionnaire
Chinese-version.
Ming-Shan Yang*, National University of Tainan / National Chia-Yi Special Education
School , Taiwan
Siou-Ying Wu, National Chia-Yi Special Education School, Taiwan
Yen-Chao Chung, National Chia-Yi Special Education School, Taiwan
Szu-En Pan, National Chia-Yi Special Education School, Taiwan
Chia-Wei Hsiao, National University of Tainan, Taiwan
Psychometric Evaluation of The Italian Version of the QUALID scale: a Contribution
to Cross-National Implementation of a Test for QoL in Late-Stage Dementia
Tiziano Gomiero*, ANFFAS Trentino Onlus, Italy
Luc Pieter De Vreese, Health District of Modena, Italy
Ulrico Mantesso, ANFFAS Trentino Onlus, Italy
Elisa De Bastiani, ANFFAS Trentino Onlus, Italy
Elisabeth Weger, ANFFAS Trentino Onlus, Italy
Invariance of Equating Functions Across Gender Groups of the Taiwan Assessment of
Student Achievement
Hsuan-Po Wang*,National Taichung University of Education, Taiwan
Yu-Ju Lu, National Taichung University of Education, Taiwan
Bor-Chen Kuo, National Taichung University of Education, Taiwan
Chien-Ming Cheng, National Taichung University of Education, Taiwan
The 76th Annual and the 17th International Meeting of the Psychometric Society Page 98
Self-Esteem and Individual Adaptability
Huajian Cai*, Chinese Academy of Science, China
Hairong Song, University of Oklahoma, USA
The DFTD Strategy with Likelihood Ratio Test method in Assessing DIF for
polytomous items
Guo-Wei Sun*, National Sun Yat-sen University, Taiwan
Hui-Ching Chen, National Taichung University of Education, Taiwan
Ching-Lin Shih, National Sun Yat-sen University, Taiwan
Development of Creative Life Style Check List
Wan-Ying Lin*, National Sun Yat-sen University, Taiwan
Ying-Yao Cheng, National Sun Yat-sen University, Taiwan
Li-Ming Chen, National Sun Yat-sen University, Taiwan
Ya-Hsueh Wang, National Sun Yat-sen University, Taiwan
Test for the Number of Factors in Exploratory Factor Analysis: A Nonparametric
Goodness-of-Fit Approach
Kentaro Hayashi*, University of Hawaii at Manoa, USA
The 76th Annual and the 17th International Meeting of the Psychometric Society Page 99
Main Conference, Friday, 22 July, 2011
Dissertation Award Talk
Friday, 22 July, 8:30 a.m. -- 9:10 a.m., D1-LP-02 Presenter:
Anna Brown, University of Barcelona, Spain
Chair:
Henk Kelderman, VU University Amsterdam, The Netherlands
The 76th Annual and the 17th International Meeting of the Psychometric Society Page 100
Symposium: Modeling Heterogeneity in Dynamical Structures and Processes
Friday, 22 July, 9:20 a.m. -- 10:40 a.m., D1-LP-03
Organizer:
Francis Tuerlinckx, K.U. Leuven, Belgium
Presenters (marked with asterisks):
Fitting Nonlinear Differential Equation Models with Random Effects Using the
Stochastic Approximation Expectation-Maximization Algorithm
Sy-Miin Chow*, University of North Carolina at Chapel Hill, USA
Hongtu Zhu, University of North Carolina at Chapel Hill, USA
Andrew Sherwood, Duke University, USA
Modeling Physiological Emotion Specificity with Regime Switching State Space Models
Tom Lodewyckx*, University of Leuven, Belgium
Francis Tuerlinckx, University of Leuven, Belgium
Peter Kuppens, University of Leuven, Belgium
Nicholas Allen, University of Melboune, Australia
Lisa Sheeber, Oregon Research Institute, USA
Exploratory Analysis of Heterogeneous Dynamic Models Using a Multi-sample SEM
Algorithm
Lawrence L. Lo*, Pennsylvania State University, USA
Peter C. M. Molenaar, The Pennsylvania State University, USA
Michael J. Rovine, Pennsylvania State University, USA
The Modelling and Efficient Estimation of Locally Stationary Time Series
Sebastien Van Bellegem*, University of Toulouse I & University of Louvain, France
The 76th Annual and the 17th International Meeting of the Psychometric Society Page 101
Parallel Session: Multidimensional Item Response Theory - Methodology
Friday, 22 July, 9:20 a.m. -- 10:40 a.m. , D1-LP-06
Presenters (marked with asterisks):
Optimal Item Design in Multidimensional Two-Alternative Forced Choice Tests
Iwin Leenen*, Investigación y Evaluación, Mexico
Jimmy de la Torre, Rutgers University, USA
Vicente Ponsoda, Universidad Autónoma de Madrid, Spain
Pedro Hontangas, Universidad de Valencia, Spain
The Confirmatory Multidimensional Generalized Graded Unfolding Model
Shiu-Lien Wu*, National Chung Cheng University, Taiwan
Wen Chung Wang, The Hong Kong Institute of Education, Hong Kong
Pairwise Modeling Method for Longitudinal Item Response Data
Jian Tao*, Northeast Normal University, China
Zhi-Hui Fu, Shenyang Normal University, China
Ning-Zhong Shi, Northeast Normal University, China
Nan Lin, Washington University in Saint Louis, USA
Random Item MIRID Modeling and its Application
Yongsang Lee*, UC Berkeley, USA
Mark Wilson, University of California at Berkeley, USA
Are there any Consequences of using Unidimensional IRT on a Multidimensional Test?
Marie Wiberg*, Umeå University, Sweden
Moderator:
David Thissen, University of North Carolina at Chapel Hill, USA
The 76th Annual and the 17th International Meeting of the Psychometric Society Page 102
Parallel Session: Rasch Models - Applications in Ability Measures
Friday, 22 July, 9:20 a.m. -- 10:40 a.m. , D1-LP-07
Presenters (marked with asterisks):
Evaluating the Quality of Rater-Mediated Assessments with a Multi-Method Approach
Amy Hendrickson*, The College Board, USA
George Engelhard, Jr., Emory University, USA
Investigating Item Difficulty Change by Item Positions under the Rasch Model
Luc T Le*, Australian Council for Educational Research, Australia
Van Nguyen, Australian Council for Educational Research, Australia
A Mixed-Methods Approach for Exploring the Accuracy of Writing Self-Efficacy
Judgments
George Engelhard*, Emory University, USA
Nadia Behizadeh, Emory University, USA
Implementing a New Selection Model across 27 European Countries
Markus Nussbaum*, European Personnel Selection Office, Belgium
Gilles Guillard, European Personnel Selection Office, Belgium
Rasch Modeling of a Mindful Learning Scale
Zhenlin Wang*, The Hong Kong Institute of Education, Hong Kong
Christine, X. Wang, University at Buffalo, USA
Moderator:
Anton Béguin, Cito Institute of Educational Measurement, The Netherlands
The 76th Annual and the 17th International Meeting of the Psychometric Society Page 103
Parallel Session: Structural Equation Modeling - Methodology II
Friday, 22 July, 9:20 a.m. -- 10:40 a.m. , D1-LP-08
Presenters (marked with asterisks):
Transformation Structural Equation Models for Analyzing Highly Non-normal Data
Xinyuan Song*, The Chinese University of Hong Kong, Hong Kong
Zhaohua Lu, The Chinese Univesity of Hong Kong, Hong Kong
Examination of Robustness of Heterogeneity of Residual Variance in Mediation Effect
with Categorical Exogenous Variable
Heining Cham*, Arizona State University, USA
Jenn-Yun Tein, Arizona State University, USA
A Poor Person's Posterior Predictive Checking of Structural Equation Models
Taehun Lee*, University of California at Los Angeles, USA
Li Cai*, University of California at Los Angeles, USA
A New Family of Model Fit Indices in Confirmatory Factor Analysis: Information
Complexity (ICOMP) Criteria
Hongwei Yang*, The University of Kentucky, USA
Eylem Deniz, Mimar Sinan Fine Arts University, Turkey
Hamparsum Bozdogan, The University of Tennessee, USA
MetaSEM: An R package to Conducting Meta-Analysis using Structural Equation
Modeling
Mike W.-L. Cheung*, National University of Singapore, Singapore
Moderator:
David Kaplan, University of Wisconsin-Madison, USA
The 76th Annual and the 17th International Meeting of the Psychometric Society Page 104
Parallel Session: Longitudinal Data Analysis
Friday, 22 July, 9:20 a.m. -- 10:40 a.m. , D2-LP-08
Presenters (marked with asterisks):
Power and Robustness Analysis of Multilevel Modeling of Longitudinal Growth
Lihshing Wang*, University of Cincinnati, USA
A Joint Model for Selection Bias and Measurement Error
Chueh-An Hsieh*, National Sun Yat-sen University, Taiwan
Fitting the Linear Mixed Models into the CLS Data with both Static and Dynamic
Predictors
Ji Hoon Ryoo, University of Nebraska, USA
Arthur J. Reynolds*, University of Minnesota, USA
Measurement Invariance in Longitudinal Data with a Developmental Latent Trait over
Time
Ji Hoon Ryoo*, University of Nebraska, USA
Moderator:
Haruhiko Ogasawara, Otaru University of Commerce, Japan
The 76th Annual and the 17th International Meeting of the Psychometric Society Page 105
Parallel Session: Test Development and Validation - Nonability Measures I
Friday, 22 July, 9:20 a.m. -- 10:40 a.m. , D2-LP-09
Presenters (marked with asterisks):
Investigation and Validation of College Student Well-Being Property Scale
Wei-Hao Chiang*, National Sun-Yat-sen University, Taiwan
Zuway-R Hong, National Sun-Yat-sen University, Taiwan
On the Test-Retest Reliability of the 100-item IPIP Scales: Differential Temporal
Stability of the Big Five Personality Traits
Luning Sun*, University of Cambridge, UK
Michal S. Kosinski, University of Cambridge, UK
David J. Stillwell, University of Nottingham, UK
John N. Rust, University of Cambridge, UK
Mathematics Anxiety Scale for Filipino Students (MAS-FS): Reliability, Validity, and
Bias Detection
Josefina Almeda*, University of the Philippines, Philippines
Development and Validation of College Students Perception toward Parenting Practice
Scale
Dong-Ting Zou*, National Sun Yat-sen University, Taiwan
Zuway-R Hong, National Sun Yat-sen University, Taiwan
Text Classification Frameworks for PTSD Screening Using N-Grams
Qiwei He*, University of Twente, Netherlands
Bernard Veldkamp, University of Twente, Netherlands
Moderator:
Keith A. Markus, The City University of New York, USA
The 76th Annual and the 17th International Meeting of the Psychometric Society Page 106
Parallel Session: Computerized Adaptive Testing
Friday, 22 July, 9:20 a.m. -- 10:40 a.m. , D2-LP-10
Presenters (marked with asterisks):
Computerized Classification Testing under the Higher-Order Polytomous IRT Model
Kung-Hsien Lee*, National Chung Cheng University, Taiwan
Wen Chung Wang, The Hong Kong Institute of Education, Hong Kong
On-line Calibration Design for Pretesting Items in Adaptive Testing
Usama Ali*, Universsity of Illinois at Urbana-Champaign, USA
Hua-Hua Chang, Universsity of Illinois at Urbana-Champaign, USA
Applying Kullback-Leibler Divergence to Detect Examinees with Item Pre-Knowledge
in Computerized Adaptive Testing
Hsiu-Yi Chao*, National Chung Cheng University, Taiwan
Jyun-Hong Chen, National Chung Cheng University, Taiwan
Shu-Ying Chen, National Chung Cheng University, Taiwan
Overestimation of Fisher information in Variable Length CATs due to Capitalization
on Chance
Juan Ramon Barrada*, Universidad Autonoma de Barcelona, Spain
Julio Olea, Universidad Autonoma de Madrid, Spain
Francisco J. Abad, Universidad Autonoma de Barcelona, Spain
Computerized Adaptive Testing and Adaptive Experimental Design
Yun Tang*, Ohio State University, USA
Jay Myung, Ohio State University, USA
Michael Edwards, Ohio State University, USA
Mark Pitt, Ohio State University, USA
Moderator:
Shu-Ying Chen, National Chung Cheng University, Taiwan
The 76th Annual and the 17th International Meeting of the Psychometric Society Page 107
State of Art Talk: The Potential of Recursive Partitioning Methods for Psychological
Research
Friday 22 July, 11:10 a.m. – 11:40 a.m., D1-LP-02
Presenter:
Carolin Strobl, Ludwig-Maximilians-Universität München, Germany
Recursive partitioning methods have become popular and widely used tools for
nonparametric regression and classification in many scientific fields. Especially random
forests, which can deal with large numbers of predictor variables even in the presence of
complex interactions, have been applied successfully in genetics, clinical medicine, and
bioinformatics within the past few years. However, high-dimensional problems are common
not only in genetics, but also in some areas of psychological research, such as in
neuropsychology, where only few subjects can be measured because of time or cost
constraints, yet a large amount of data is generated for each subject. Random forests have
been shown to achieve a high prediction accuracy in such applications. Moreover, they
provide descriptive variable importance measures reflecting the impact of each variable in
both main effects and interactions. The aim of this talk is to illustrate the potential of
recursive partitioning methods for psychological research and outline their rationale as well
as potential pitfalls in their practical application.
Chair:
Yue Zhao, The Hong Kong Institute of Education, Hong Kong
The 76th Annual and the 17th International Meeting of the Psychometric Society Page 108
State of Art Talk: Modeling Discrete Latent Constructs: Review and Beyond Friday 22 July, 11:10 a.m. – 11:40 a.m., D1-LP-04
Presenter:
Hsiu-Ting Yu, McGill University, Canada
This talk provides a review of modeling discrete latent constructs in psychological and
educational research. The discussion will cover theoretical concepts and methodological
techniques of modeling discrete latent constructs as well as the links and relationships to
classical continuous latent constructs. With contrasting different conceptual approaches of
modeling latent constructs, the cautions and new potentials of discrete latent assumptions are
to be addressed. In addition, this talk will also discuss topics on (a) the scenarios and possible
solutions of the structural indeterminacy on layers of discrete latent constructs when
extending to multilevel structure and (b) different approaches of applying to longitudinal data
with discrete latent constructs.
Chair:
Matthew Johnson , Columbia University, USA
The 76th Annual and the 17th International Meeting of the Psychometric Society Page 109
Invited Talk: Missing Data and Consistency for a Latent Variable Model Widely Used
in IRT and Longitudinal Data Analysis
Friday, 22 July, 11:50 a.m. – 12:30 p.m., D1-LP-02
Presenter:
Anders Skrondal, Norwegian Institute of Public Health, Norway
We consider the impact of missing data mechanisms on the consistency of estimators for a
latent variable model that is widely used in IRT and longitudinal data analysis.
Rubin (1976, Biometrika) proposed a classification of mechanisms producing missing data
and clarified the conditions for consistent estimation based on maximum likelihood or
Bayesian inference. An important extension of Rubin's work was provided by Little (1995,
JASA) who explicitly considered the role of covariates and latent variables (random
coefficients).
The conditions provided by Rubin and Little apply if the latent variable model is estimated by
marginal maximum likelihood (MML). Fortunately, conditional maximum likelihood (CML)
turns out to be consistent under considerably more lenient conditions.
Chair:
David Kaplan, University of Wisconsin-Madison, USA
The 76th Annual and the 17th International Meeting of the Psychometric Society Page 110
Invited Talk: The G-DINA Model Framework and Some Recent Developments
Friday, 22 July, 11:50 a.m. – 12:30 p.m., D1-LP-04
Presenter:
Jimmy de la Torre, Rutgers, The State University of New Jersey, USA
The first part of the presentation focuses on the development and characteristics of the
generalized deterministic inputs, noisy “and” gate (G-DINA) model as a general cognitive
diagnosis model (CDM) framework. As a model, it is shown that the G-DINA model is
equivalent to other general CDMs based on alternative link functions, and subsumes several
commonly encountered constrained CDMs; as a framework, the G-DINA model allows
procedures such as constrained CDM estimation, general and constrained model comparison,
and empirical Q-matrix validation to be carried out more efficiently at the item, rather than
test level. The second part of the presentation focuses on some recent developments
pertaining to the procedures within the G-DINA model framework. It compares the proposed
two-step approach for estimating parameters of constrained models with the traditional
one-step procedure, documents the Type I error rate and power of the Wald test for
comparing general and constrained CDMs, and lays out the basis for implementing a
sequential procedure for Q-matrix validation based on a generalized discrimination index.
The presentation concludes with a discussion of the implications of these developments in the
practice of cognitive diagnosis modeling.
Chair:
Magdalena Mo Ching Mok, The Hong Kong Institute of Education, Hong Kong
The 76th Annual and the 17th International Meeting of the Psychometric Society Page 111
Symposium : Heterogeneity in latent variable models
Friday, 22 July, 1:30 p.m. -- 2:50 p.m., D1-LP-03
Organizer:
Dylan Molenaar, University of Amsterdam, The Netherlands
Presenters (marked with asterisks):
Testing Statistical and Substantive Hypotheses on the Distribution of the Observed Data
Within the Generalized Linear Item Response Model
Dylan Molenaar*, University of Amsterdam, The Netherlands
Conor Dolan, University of Amsterdam, Netherlands
A test for cluster bias: Detecting Violations of Measurement Invariance Across Clusters
in Multilevel Data.
Suzanne Jak*, University of Amsterdam, The Netherlands
Frans Oort, University of Utrecht, Netherlands
Conor Dolan, University of Amsterdam, Netherlands
Using Factor Analysis to Assess the Number of Factors in Measurements
Mariska Barendse*, University of Groningen, The Netherlands
Marieke Timmerman, University of Groningen, Netherlands
Frans Oort, University of Utrecht, Netherlands
Analyzing Longitudinal Survey Data: A Bayesian IRT Model with Occasion-Specific
Item Parameters
Josine Verhagen*, University of Twente, The Netherlands
Jean-Paul Fox, University of Twente, Netherlands
The 76th Annual and the 17th International Meeting of the Psychometric Society Page 112
Parallel Session: Multidimensional Item Response Theory - Applications
Friday, 22 July, 1:30 p.m. -- 2:50 p.m. , D1-LP-06
Presenters (marked with asterisks):
Assessing the Response of Sports Training Items Using Within-Item Multidimensional
Modeling
Shyh-ching Chi*,National Taiwan Sport University., Taiwan
Measuring Change and Response Format Effects in Large Scale Educational Testing
with LLRA
Thomas Rusch*, Vienna University of Economics and Business, Austria
Ingrid Dobrovits, Vienna University of Economics and Business, Austria
Birgit Gatterer, Vienna University of Economics and Business, Austria
Reinhold Hatzinger, Vienna University of Economics and Business, Austria
The Measurement of Civic Knowledge and the Response Process Behind: A
Multidimensional Mixture IRT Modeling Approach
Joseph Kui-Foon Chow*, The Hong Kong Institute of Education, Hong Kong
Kuan-Yu, Jin, The Hong Kong Institute of Education, Hong Kong
Modeling the PISA 2006 Science Data by Using Additive MIRT Model
Mingchiu Chang*, National University of Tainan, Taiwan
Hueying Tzou, National University of Tainan, Taiwan
The Measurement of Chinese Language Proficiency based on Higher Order IRT Model
Rih-CHang Chao*, National Taichung University, Taiwan
Yahsun Tsai, National Taiwan Normal University, Taiwan
Bor-Chen Kuo, , National Taichung University, Taiwan
Moderator:
Mike W.-L. Cheung, National University of Singapore, Singapore
The 76th Annual and the 17th International Meeting of the Psychometric Society Page 113
Parallel Session: Rasch Models - Applications in Nonability Measures
Friday, 22 July, 1:30 p.m. -- 2:50 p.m. , D1-LP-07
Presenters (marked with asterisks):
Psychometric Validation of the Health-related Child Body Questionnaire (HRCBQ) to
Assess Chinese Caregiver Body Perception
Christine MS Chan*, The Hong Kong Institute of Education, Hong Kong
Wen Chung Wang, The Hong Kong Institue of Education, Hong Kong
Item Banks of Quality of Life Measures on Young Adult Survivors of Childhood Cancer
I-Chan Huang*, University of Florida, USA
Gwendolyn Quinn, Moffitt Cancer Center, USA
Zhushan Li, Boston College, USA
Elizabeth Shenkman, University of Florida, USA
Teacher Quality of Work Life in Primary School Comparison of Psychometric
Properties Using Rasch Model
Nordin Abd. Razak*, Universiti Sains Malaysia, Malaysia
Ahmad Zamri Khairani, Universiti Sains Malaysia, Malaysia
Mahaya Salleh, Teacher Training Institute, Malaysia
A Rasch Analysis of Positive Academic Affect Scale
Jingjing Yao*, The Hong Kong Institute of Education, Hong Kong
Validating an Instrument for Measuring Leadership Responsibilities of Hong Kong
Vice-Principals – A Rasch Analysis
Paula Kwan*, The Hong Kong Institute of Education, Hong Kong
Joseph Kui-Foon Chow, The Hong Kong Institute of Education, Hong Kong
Moderator:
Christof Schuster, Univeristy of Giessen, Germany
The 76th Annual and the 17th International Meeting of the Psychometric Society Page 114
Parallel Session: Structural Equation Modeling - Applications II
Friday, 22 July, 1:30 p.m. -- 2:50 p.m. , D1-LP-08
Presenters (marked with asterisks):
Fitting Direct Covariance Structures by the MSTRUCT Modeling Language of the
CALIS Procedure
Yiu-Fai Yung*, SAS Institute Inc., USA
Testing the Effectiveness of Three Multilevel Modeling Approaches in Addressing Data
Dependency with Empirical Data under Structural Equation Modeling Framework
Jiun-Yu Wu*, National Chiao Tung University, Taiwan
Yuan-Hsuan Lee, National Chiao Tung University, Taiwan
Measuring the Effects of School Reading Curriculum on Students Achievements by
Using Multilevel Structuring Equation Modeling
Daeseok Kim*, The University of Gerogia, USA
Jongmin Ra, The University of Gerogia, USA
Self-Esteem, Depression and Rebellion in Adolescence: Application of Latent
Moderated Structural Equation Model
Jen-Hua Hsueh*, National Taiwan Normal University, Taiwan
Domain-Specific Risk Taking Scale: A Factor-Analytic Study with Chinese University
Students
Joseph Wu*, City University of Hong Kong, Hong Kong
Hoi Yan Cheung, City University of Hong Kong, Hong Kong
Moderator:
Tze-ho Fung, Hong Kong Examinations and Assessment Authority, Hong Kong
The 76th Annual and the 17th International Meeting of the Psychometric Society Page 115
Parallel Session: Mixture Modeling
Friday, 22 July, 1:30 p.m. -- 2:50 p.m. , D2-LP-08
Presenters (marked with asterisks):
Distinguishing the Signal from Noise with the Binary Latent Type Variable
Levent Dumenci*, Virginia Commonwealth University, USA
Bayesian Inference for Growth Mixture Models with Latent Class Dependent Missing
Data
Zhenqiu Lu*, University of Notre Dame, USA
Zhiyong Zhang, University of Notre Dame, USA
Gitta Lubke, University of Notre Dame, USA
How to Find Hopeful Customer using Zero-Inflated Poisson Model with Latent Class
Kotaro Ohashi*, Waseda University, Japan
Hideki Toyoda, Waseda University, Japan
Model Selection and Evaluation in Factor Mixture Modeling using A Two-Stage ML
Approach
Xiaoling Zhong*, The Hong Kong Institute of Education, Hong Kong
Ke-Hai Yuan, University of Notre Dame, USA
The Mixture Item Response Model for Ability Decline during Testing
Kuan-Yu Jin*, The Hong Kong Institute of Education, Hong Kong
Wen Chung Wang, The Hong Kong Institute of Education, Hong Kong
Moderator:
Roger Millsap, Arizona State University, USA
The 76th Annual and the 17th International Meeting of the Psychometric Society Page 116
Parallel Session: Test Development and Validation - Nonability Measures II
Friday, 22 July, 1:30 p.m. -- 2:50 p.m. , D2-LP-09
Presenters (marked with asterisks):
Development and Validation of Students’ Attitude toward Math Scale
Hsiang- Chun Wang*,National Sun Yat- sen University, Taiwan
Zuway-R Hong, National Sun Yat- sen University, Taiwan
An Investigation and Validation of Elementary School Students’ Positive Thinking
Scale
Chia-Jung Lin*, National Sun Yat- sen University, Taiwan
Zuway-R Hong, National Sun Yat- sen University, Taiwan
A Investigation and Validation of College Students Reading Motivation Scale
Tien-Chi Yu*, National Sun Yat-sen University, Taiwan
Zuway-R Hong, National Sun Yat-sen University, Taiwan
Patterns of Evidence in Teacher Observations: The View through Five Lenses
Catherine McClellan*, Educational Testing Service, USA
Steven Holtzman, Educational Testing Service, USA
Ubuntu Game: An Educational Mechanism for Fostering Trust in a Divergent World
Sunday Jacob*, Federal College of Education, Nigeria
Moderator:
Terry Ackerman, University of North Carolina at Greensboro, USA
The 76th Annual and the 17th International Meeting of the Psychometric Society Page 117
Parallel Session: Nonparametric Statistics
Friday, 22 July, 1:30 p.m. -- 2:50 p.m. , D2-LP-10
Presenters (marked with asterisks):
Nonparametric Method for Estimating Conditional Standard Error of Measurement
for Test Scores
Louis Roussos*, Measured Progress, USA
Zhushan Li, Boston College, USA
Multivariate Nonparametric Two-Sample Tests for Mixed Outcomes
Denis Larocque*, HEC Montreal, Canada
Jaakko Nevalainen , University of Turku, Finland
Hannu Oja, University of Tampere, Finland
A Branch-and-Bound Max-Cardinality Algorithm for Exploratory Mokken Scale
Analysis
Michael J. Brusco*, Florida State University, USA
Hans-Friedrich Koehn, University of Illinois at Champaign-Urbana, USA
Douglas Steinley, University of Missouri-Columbia, USA
2 and 2 Equals 4 !
Rudy Ligtvoet*, University of Amsterdam, Netherlands
Assessing Dimensionality through Mokken Scale Analysis: What Happens When
Questionnaires Do Not Have Simple Structures?
Iris A.M. Smits*, University of Groningen, Netherlands
Marieke E Timmerman, University of Groningen, Netherlands
Rob R. Meijer, University of Groningen, Netherlands
Moderator:
Yasuo Miyazaki, Virgnia Tech, USA
The 76th Annual and the 17th International Meeting of the Psychometric Society Page 118
Presidential Address: Future of Psychometrics: Ask What Psychometrics Can Do for
Psychology
Friday, 22 July, 3:00 p.m. -- 3:50 p.m. , C-LP-11
Presenter:
Klaas Sijtsma, Tilburg University, The Netherlands
Modern psychometrics suffers from the gap with psychological researchers and their
psychological research problems. The gap is due to the increased complexity of modern
psychometric methods. This requires knowledge from psychological researchers that they
do not have. As it is unlikely that psychologists will soon develop to become better
statisticians, I argue that psychometrics should take up problems that psychological
researchers struggle with and solve these problems. It appears there are a large number of
important psychometric issues that nowadays fall between psychometrics and psychology
and largely remain unaddressed, and I discuss a few: Influence of test length on decision
quality in personnel selection and quality of difference scores in therapy assessment, and
theory development in test construction and validity research.
Chair:
Jos ten Berge, University of Groningen, the Netherlands

The 76th Annual and the 17th International Meeting of the Psychometric Society Page 119
Conference Closing Ceremony
Friday, 22 July, 3:50 p.m. -- 4:20 p.m. , C-LP-11 All participants are warmly invited to attend the Conference Closing Ceremony.
Rundown:
Speech by Professor Klaas Sijtsma, President of Psychometric Society
Speech by Professor Mark Wilson, President-Elect of Psychometric Society
Speech by the 2012 International Meeting of Psychometric Society Local Organizing
Committee

The 76th Annual and the 17th International Meeting of the Psychometric Society Page 120
Business Meeting
Friday, 22 July, 4:30 p.m. -- 5:10 p.m. , B4-LP-04
This meeting is open to all members of the Psychometric Society. All members are
welcome to attend.
The 76th Annual and the 17th International Meeting of the Psychometric Society Page 121
Banquet & Best Junior Presenter Award & Best Poster Presentation Award
Friday, 22 July, 6:00 p.m. -- 9:00 p.m. Lake Egret Nature Park
All participants are warmly invited to attend the banquet. Junior Presentation Award and
Best Poster Presentation Award will be announced during the banquet.
Coaches are arranged to bring banquet participants to the banquet venue, Lake Egret Nature
Park, with address indicated below. Please bring along your banquet ticket.
For the Best Junior Presenter Award and Best Poster Presentation Award, ballots are placed
in participates’ conference bags which are available for picking up at the conference
registration area.
Address:
Lake Egret Nature Park
No. 2 Hung Lam Drive,Tai Po Kau, N.T., Hong Kong.
Phone: (852) 2657 6657
E-mail: [email protected]
Website: http://www.taipokau.org
The 76th Annual and the 17th International Meeting of the Psychometric Society Page 122
Abstract Tuesday, 19 July, 2011
Validity Theory
Invited Symposium : Tuesday, 19 July, 11:10 a.m. -- 12:30 a.m., D1-LP-03
How to Think About the Relation Between Constructs and Observations
Denny Borsboom, University of Amsterdam, The Netherlands
The relation between constructs and observables is a crucial element in thinking about test
validity. In the past century, several ways of thinking about this relation have been entertained.
These include causal relations (where observables are caused by a construct or vice versa),
sampling relations (where observables are considered samples from a population of potential
observations), and mereological relations (where observables are considered part of a
construct). These different conceptualizations result in distinct requirements when thinking
about the evidential backup for test-related claims. I will lay out these consequences and
introduce some metaphors that are helpful in thinking through the question of whether and how
one should address validity.
The Relation between Process Models for Decision Making and Latent Variable
Models for Individual Differences
Han van der Maas, University of Amsterdam, The Netherlands
It has been argued that the primary locus for validity evidence lies in investigations that focus
on the question how a testing procedure works, i.e., which processes transmit variation among
individuals into variation in the item responses (Borsboom, Mellenbergh, & Van Heerden,
2004; Borsboom & Mellenbergh, 2007). It is evident that, in answering such questions, the
presence of a theory that links IRT models to information processing
theories is essential. Here we present such a theory. We derive IRT models from the famous
diffusion model for two-choice response processes. This leads to a new item response model
for accuracy and speed based on the idea that ability has a natural zero point. The model
implies fundamentally new ways to think about guessing, response speed and person fit in item
response theory.
Method Effects: Concepts and Models
Andrew Maul, University of Oslo, Norway
The 76th Annual and the 17th International Meeting of the Psychometric Society Page 123
Valid measurement of an attribute requires that variation in the outcomes of a measurement
procedure be produced by variation in that attribute, and not by idiosyncrasies of the
particular methods or conditions associated with the procedure. The terms "method effect"
and “methods variance” have sometimes been used in reference to the latter source of
variation, and various models, including many based on the now- famous
multitrait-multimethod matrix, have been proposed to help with detecting, understanding,
and/or controlling such variance. Meanwhile, techniques have been developed in the item
response theory (IRT) tradition for modeling what is often called local item dependence,
(LID), although LID has largely been cast as an issue affecting estimation of measurement
precision rather than as a larger validity issue. In this talk, I will attempt to present a
conceptual overview of the challenge of differentiating variation in observations that can be
interpreted as causally resulting from variation in the attribute of measurement from variation
produced by solely by idiosyncratic structural or circumstantial features of the specific choice
of measurement procedure. I will briefly discuss how some latent variable models can be
used and interpreted as models for method effects, depending on the nature of the
psychological theory available. If time permits, I will comment on how the interpretation of
a “method effect” changes depending on one’s philosophical stance on the meaning of
measurement (realist, representationalist, metaphorical).
The Guttman-Rasch Paradox: Why the Interval Level of Measurement Unparadoxically
Goes Poof When Precision Increases
Annemarie Zand Scholten, University of Amsterdam, The Netherlands
Recently, claims of quantitative measurement associated with the Rasch model were
questioned due to the paradoxical relation between error and precision in this model (Michell,
2008). If precision increases in Rasch items, they become Guttman items, losing their
quantitative properties. Removing error decreases precision. To address this paradox we
consider to what extent both models meet the requirements for interval level measurement.
This leads us to conclude that the Guttman model cannot simply be considered an error-free
version of the Rasch model. Furthermore, we argue that an increase in precision by adding
error is not paradoxical per se, by discussing the well-known phenomenon of stochastic
resonance. These arguments together lead us to conclude that the paradox disappears when the
crucial aspects continuity and measurement level, and not error and precision, are considered.
Score Interpretation: The Goldilocks Model
Keith A. Markus, The City University of New York, USA
The 76th Annual and the 17th International Meeting of the Psychometric Society Page 124
The concept of score interpretation figures prominently in test validity theory. Even a
thermometer reading can have different interpretations in different testing contexts. The
Goldilocks Model comprises six claims about the nature of test score interpretations. The
model provides a general method of modeling test score interpretations and individuating
distinct interpretations. The model offers guidance in the application to the process of test
validation of accepted principles for choosing research questions. The model can help test
developers formulate alternative interpretations as rival hypotheses and isolate observations
that distinguish between them. While acknowledging the continuity between validation
research and basic scientific research into the construct measured by the tests, the model also
helps to demarcate boundaries between validation research and basic research. Research that
supports premises of Kane's (2006) interpretive argument constitutes validation research.
Research that supports or tests further inferences drawn from the conclusions of Kane's
interpretive argument constitutes basic research into the construct measured by the test. The
latter informs test validity, but only the former directly bears on test validation. Finally, the
model offers guidance with respect to the question of how much validity evidence is sufficient.
The Goldilocks Model discourages interpretations that are too weak to support the intended test
use and also discourages interpretations that are too strong to receive support from the
available evidence. Instead, the model encourages bringing the proposed interpretation into
alignment with both the intended use and the available evidence. Validation requires sufficient
evidence to support such a minimal interpretation.
Issues in Educational Measurement and Examinations
Invited Symposium : Tuesday, 19 July, 11:10 a.m. – 12:30 a.m., D1-LP-04
Using Mixed IRT Models to Compare the Effectiveness of Different Linking Designs:
the Internal Anchor Versus the External Anchor and Pre-Test Data
Marie-Anne Mittelhaëuser*, Cito Institute of Educational Measurement/Tilburg University,
The Netherlands
Anton Béguin, Cito Institute of Educational Measurement, The Netherlands
Klaas Sijtsma, Tilburg University, The Netherlands
The goal of the current study was to compare a linking procedure for two high-stakes test
forms using three different linking designs. The three different linking designs vary in the
administration condition of the common items. First, an internal anchor design was used,
where the common items are administered in a high-stakes condition. Second, an external
anchor design and a pre-test design were used, where the common items are administered in a
low-stakes condition. It was hypothesized that the test-taking condition of the common items
influences the linking procedure. The results support the hypothesis. A mixed Rasch model
The 76th Annual and the 17th International Meeting of the Psychometric Society Page 125
(Rost, 1997) was used to model some examinees as being more motivated than others to
solve the items. Next to the application of mixed IRT, aberrant item-score vectors were
identified using the zl person-fit statistic, which attempts to assess the fit of the IRT model
at the individual level (Drasgow, Levine, & Williams, 1985). Removal of aberrant item-score
vectors or items displaying differential item functioning did not improve the linking
procedure.
On the Usefulness of Latent Variable Hybrid Models for Detecting Unobserved Person
Heterogeneity and Person Misfit in Educational Testing
Wilco Emons*, Tilburg University, The Netherlands
In this presentation, we discuss the usefulness of latent variable hybrid models, including
latent class IRT and IRT mixture models, to detect unobserved qualitative differences in
examinee’s response patterns and person misfit. Educational researchers may use this
information to distinguish substantive individual differences in response behavior from
idiosyncratic person-response behavior. Different latent variable hybrid approaches will be
discussed for both dichotomous and polytomous exam data. Results from empirical data
analysis and simulation studies will be presented and limitations and implications for future
research will be discussed.
Complex Decision Rules and Misclassification: Who Should Take A Retest?
Robert Zwitser*, Cito Institute of Educational Measurement, The Netherlands
Decision making based on test scores always holds the risk of misclassification. A
well-known intervention for reducing misclassification is increasing the test length. In this
study we investigate the role that optional retests can play in the reduction of
misclassification. The main question is: which students have to take a retest? In a single
examination with a single cut-score it is clear that those students that have a score close to the
cut-score have the largest probability of being misclassified. However, in cases with complex
decision rules based on multiple scores it is less straightforward to determine which
students have to take extra tests. In this study we focus on this selection problem. We take
data from a national examination system with multiple courses. We assume a
multidimensional item response model and propose an MCMC algorithm for estimating the
posterior distributions of the latent variables. Then two different approaches are considered.
First, we assume cut-off points on the latent scales and use this posterior distribution in order
to study for each score pattern the magnitude of the multivariate density region for “pass” and
“fail”. Second, we assume a scoring rule and use the posterior distribution to simulate
The 76th Annual and the 17th International Meeting of the Psychometric Society Page 126
response patterns and then investigate the observed proportions “pass” and “fail”. Both cases
will be illustrated with examples.
Vertical Comparison Using Reference Sets
Anton Béguin*, Cito Institute of Educational Measurement, The Netherlands
Saskia Wools, Cito Institute of Educational Measurement, The Netherlands
In educational assessment often comparisons are made between students with a different
educational background. For example if performance levels are defined across students from
different grades or across students following a different track of education. To be able to link
the assessments vertical equating procedures are defined. These procedures will take into
account that for some items the item characteristics differ between groups of students (DIF).
In situations where the proportion of items with differences is large the validity of the vertical
linking is challenged. This will especially be the case if designated tests are constructed for
the different groups of students. In this paper an alternative procedure is introduced and
compared with vertical equating. In this procedure a set of items is constructed that will serve
as a basis for comparison between the different groups of students. This set of items consist
of samples of items from the test for each of the groups of students and is called a reference
set. The content of the reference set represents all aspects of the intended construct and is
composed in such a way that none of the groups of students is advantaged. For the total
reference set data are collected in each of the groups of students. Subsequently, tests for each
of the groups of students can be linked to the reference set separately. For each test all score
points are linked to scores on the reference set and as a consequence to a common metric.
A Model-Free Approach to Cognitive Diagnosis: Robustness Under Misspecification
and Implications for Latent Structure Identification
Parallel Session: Cognitive Diagnosis Modeling - Theory I; Tuesday, 19 July, 11:10 a.m.
-- 12:30 p.m.; D1-LP-06
Chia-Yi Chiu*, Rutgers, The State University of New Jersey, US
A trend in educational testing is to go beyond unidimensional scoring and provide
information on a complete profile of mastered and non-mastered skills. To achieve this,
cognitive diagnosis models have been developed and the diagnosis of class membership is the
statistical objective of these models. Cognitive diagnosis models are derived under
assumptions on which attributes are needed for which items and how the attributes are
utilized to construct responses. They recognize that data usually do not correspond to the
ideal response pattern, the specific item response pattern that each element indicates whether
the examinee possesses all attributes required for answering the particular item. Nevertheless,
The 76th Annual and the 17th International Meeting of the Psychometric Society Page 127
the ideal response patterns may well be the most likely response, and classification based on
deviations from the ideal responses can be effective, without making any assumption about
the parametric form of the model. The aim of this study is to examine the effectiveness of the
model-free classification by utilizing appropriate distance measures between observed and
ideal response patterns, under a wide variety of possibilities for underlying cognitive
diagnosis model responsible for generating the data. The robustness of the model-free method
is investigated by comparing with model-based methods given a misspecified
item-by-attribute matrix or a misspecified parametric model. The rapid speed at which
classifications are obtained using the model-free approach allows for millions of different
specifications of the latent structure specified by the item-by-attribute matrix to be compared.
This implies that exploratory procedures for identifying the latent structure can be
implemented, given a reasonable starting value.
A Cognitive Diagnosis Method Based on Q-Matrix and Generalized Distance
Parallel Session: Cognitive Diagnosis Modeling - Theory I; Tuesday, 19 July, 11:10 a.m.
-- 12:30 p.m.; D1-LP-06
Jianan Sun*, Beijing Normal University, China
Shumei Zhang, Beijing Normal University,China
Tao Xin, Beijing Normal University,China
Yu Bao, Beijing Normal University,China
In recent years, cognitive diagnosis research has become a hot issue in psychometric
measurement and educational assessment. Researchers are always concerning about
developing a Cognitive Diagnosis Method (CDM) which can precisely indentify every
examinee’s knowledge state. This study introduces a new approach called Generalized
Distance Discrimination (GDD) for dichotomous IRT models, and it is based on the
compliment of Q-matrix theory (Tatsuoka, 1991) by Leighton et al. (2004) and Ding et al.
(2009, 2010). In simulation, we compare the classification accuracy for respondents of GDD
with that of the two methods: RSM and AHM. Pattern match ratio and averaging attribute
match ratio are used as two criterions to evaluate classification accuracy of these approaches.
Specifically, the simulated examinees’ response data with a sample size of 1000 are
generated from DINA model, which is treated as a comparison baseline to check the
classification performance of GDD, RSM and AHM. The structure of simulated cognitive
tests are designed under 16 different conditions: four Q-matrix from four attribute
hierarchical structures used in AHM of Leighton et al. (2004) and four kinds of combination
of slip and guess parameters in DINA model. The result shows that GDD and DINA model
perform almost equally, and the other two methods perform significantly worse than DINA
The 76th Annual and the 17th International Meeting of the Psychometric Society Page 128
model. Besides, the method of GDD can also be developed to treat the data with missing
responses and generalized to the cognitive tests with polytomous items.
Mixture Higher-Order DINA Model for Differential Attribute Functioning
Parallel Session: Cognitive Diagnosis Modeling - Theory I; Tuesday, 19 July, 11:10 a.m.
-- 12:30 p.m.; D1-LP-06
Yoon Soo Park*, Columbia University, USA
Young-Sun Lee, Columbia University, USA
The use of cognitive diagnostic models (CDMs) to classify students into attribute mastery
profiles have received increased interest in educational measurement. Among various CDMs
developed, the higher-order deterministic, inputs, noisy, “and” gate model (HO-DINA; de la
Torre & Douglas, 2004; DeCarlo, 2011) provides diagnostic information about student’s
attribute mastery. The attractive aspect of the HO-DINA model is that it also provides
information about the attribute in terms of attribute difficulty and discrimination as a
higher-order factor in addition to information about the guess and slip provided by item
parameters. This study extends the framework of the HO-DINA model to incorporate a finite
mixture distribution to explore differential attribute functioning among latent subgroups in
the data. This study proposes a mixture Higher-Order DINA model (MixHO-DINA), which
creates separate item and attribute parameters for latent subgroups of examinees. An analysis
using the subtraction-fraction data (Tatsuoka, 1987) showed that the MixHO-DINA model
using two latent classes fits better than the HO-DINA model based on information criteria
statistics. Furthermore, high prevalence of attribute mastery was mitigated in the
MixHO-DINA model. Higher-order attribute parameters resulting from the mixture
framework also showed notable differences in attribute discrimination estimates for 4 out of
the 8 attributes between latent classes. These results support the use of a mixture finite
distribution within the HO-DINA model framework to better understand differences between
latent subgroups.
A Hybrid Model of HO-IRT and HO-DINA Models
Parallel Session: Cognitive Diagnosis Modeling - Theory I; Tuesday, 19 July, 11:10 a.m.
-- 12:30 p.m.; D1-LP-06
Chih-Wei Yang*, National Taichung University of Education, Taiwan
Bor-Chen Kuo, National Taichung University of Education, Taiwan
In recent years, some higher-order item response theory (HO-IRT) models and higher-order
DINA (HO-DINA) models were proposed. HO-IRT models can provide the overall ability
and domain abilities estimators simultaneously. HO-DINA can provide the overall ability and
cognitive diagnosis information in the same model.

The 76th Annual and the 17th International Meeting of the Psychometric Society Page 129
The purpose of this study is to develop a 3-level DINA model which is a hybrid model of
HO-IRT and HO-DINA models. The first level is overall ability and the second level is
domain abilities. The third level is cognitive attributes based on DINA model. Using a
Markov chain Monte Carlo method in a hierarchical Bayesian framework, the overall ability,
domain abilities, and cognitive attributes and abilities’ correlations, are estimated
simultaneously in this model. The feasibility of the proposed model is investigated by a
simulation study and illustrated using actual assessment data.
Research on Factors Influencing Diagnostic Accuracy in AHM and DINA
Parallel Session: Cognitive Diagnosis Modeling - Theory I; Tuesday, 19 July, 11:10 a.m.
-- 12:30 p.m.; D1-LP-06
Yuanhai Yan*,Jiangxi Normal University, China
Shuliang Ding, Jiangxi Normal University, China
Cognitive diagnosis is a product of combining cognitive psychology with modern
psychological and educational measurement and it is a core of the new theoretical generation.
Various factors, such as test construction (TC) and test-length(TL), type of attribute
hierarchy(TOAH), cognitive diagnosis model (CDM), quality of item (QOI), and so on,
will affect the accuracy of diagnosis to some extent. Based on two diagnosis models AHM
and DINA, affecting degree of different factors to accuracy index is explored in the paper.
The results show different factors having varying degree of influence on the accuracy of
diagnosis. TL is not the longer the better when TOAH is linear. Different TC has varying
degree of influence on the classification accuracy rate (CAR) of models. A cognitive test that
contains reachability matrix has a high CAR than that of did not contain. The higher the slip,
the lower the pattern and the marginal CAR. And attribute construction with higher degree of
loose often has the lower CAR. AHM is more sensitive to attribute construction and
sometimes performs much reasonablely than DINA . But, generally speaking, the CAR based
on DINA is higher than that based on AHM.
Projective IRT for Purified Constructs
Parallel Session: Item Response Theory - Methodology I; Tuesday, 19 July, 11:10 a.m. --
12:30 p.m.; D1-LP-07
Edward Ip*, Wake Forest University, USA
The problem of fitting unidimensional item-response models to potentially multidimensional
data has been extensively studied. The focus of the presentation is on response data that
contains a major dimension of interest but that may also contain minor nuisance dimensions.
Because fitting a unidimensional model to multidimensional data results in ability estimates
The 76th Annual and the 17th International Meeting of the Psychometric Society Page 130
that represent a combination of the major and minor dimensions, such a procedure tends to
produce ability estimates that cannot be compared across different tests targeting the same
construct, or even across different test forms from the same test bank. This work is built upon
previous theoretical results in Ip(2010) on the empirical indistinguishability between a
multidimensional IRT model and a locally dependent unidimensional IRT model. Here I
propose a projective IRT framework that allows the projection of multiple dimensions onto a
targeted single dimension that is of substantive interest. Two robust versions of standard error
estimate for ability score are also evaluated. An important appeal of the projective IRT
procedure is that it allows the direct measurement of a targeted construct and valid inference
for test-independent ability scores. In other words, “contaminated” constructs can be
“purified” through the projective IRT mechanism. Through simulation studies, I show that
the proposed projective IRT procedure effectively recovers ability scores in the targeted
dimension. The procedure involves only a small amount of additional computation over
conventional IRT and could have potential applications in areas such as computerized
adaptive testing.
Model Selection for Tenable Assessment: Selecting a Latent Variable Model by Testing
the Assumed Latent Structure
Parallel Session: Item Response Theory - Methodology I; Tuesday, 19 July, 11:10 a.m. --
12:30 p.m.; D1-LP-07
David Torres Irribarra*, University of California at Berkeley, USA
Ronli Diakow, University of California at Berkeley, USA
Inferences about a construct of interest are often based on statistical models. These models
define a priori the kind of differences that exist between the persons who are being assessed.
These differences can be in quality, in order, or in quantity. The nature of these differences is
a fundamental theoretical assumption about the structure of the variable that is being studied
that often goes unexamined.
This study addresses this issue by proposing a framework for selecting statistical models that
imply different assumptions about the structure of the variables.
Specifically, we arrange a set of latent variable models, including latent class models
(Lazarasfeld & Henry, 1968), ordered latent class models (Croon, 1990), latent class Rasch
models (Formann, 1985) and Rasch models (Rasch, 1960), according to their assumed latent
structure such that progressively more stringent monotonicity and scale assumptions are
placed on the latent variable.
We illustrate the proposed framework for model selection via a ‘blind’ simulation study
where the data were generated and analyzed by separate people, so that the analyst had no
knowledge about the latent structure that generated the data.

The 76th Annual and the 17th International Meeting of the Psychometric Society Page 131
The results of the study provide preliminary evidence that model comparison within this
framework is able to recover the generating latent structure. The overall error rate was 10%
for model identification and 5% for interval scale identification. These general results
indicate that the method shows promise and warrants further review.
Optimum Information Bounds for IRT Models
Parallel Session: Item Response Theory - Methodology I; Tuesday, 19 July, 11:10 a.m. --
12:30 p.m.; D1-LP-07
Alexander Weissman*, Law School Admission Council, USA
From the perspective of information theory, marginal maximum likelihood estimation of IRT
models by the expectation-maximization (EM) algorithm is equivalent to an alternating
minimization of the Kullback-Leibler (KL) divergence, or relative entropy, between two
functions: the posterior density of the latent variables given the observed variables, and the
joint likelihood of latent and observed variables. A key advantage of the EM algorithm is
that it guarantees convergence to a local maximum of the log likelihood function, or
equivalently, a local minimum of the KL divergence. However, if parametric constraints on
the likelihood function are relaxed while simultaneously preserving the assumptions common
to most IRT models (e.g., local independence), convergence to a global optimum is also
achievable. Such relaxation leads to an optimal information bound, a fixed point of
reference against which other models may be tested. A likelihood ratio test is provided as a
means for testing models against this bound, with empirical examples demonstrating the
approach.
A New Scaling Procedure Based on Conditional Association for Assessing IRT Model
Fit
Parallel Session: Item Response Theory - Methodology I; Tuesday, 19 July, 11:10 a.m. --
12:30 p.m.; D1-LP-07
Hendrik Straat*, Tilburg University, Netherlands
Andries van der Ark, Tilburg University, Netherlands
Klaas Sijtsma, Tilburg University, Netherlands
The ordinal, unidimensional latent variable model assumes unidimensionality, local
independence, and monotonicity, and implies the general property of conditional association
between sets of items. We specialized conditional association into three observable
consequences useful for practical scaling. In a previous stage of this project, we investigated
whether these observable consequences were negative or nonnegative under violations of IRT
The 76th Annual and the 17th International Meeting of the Psychometric Society Page 132
model assumptions. In this presentation, we introduce new results by implementing the three
observable consequences in a new scaling procedure that we coined CA scaling. CA scaling
aims at identifying items that are inconsistent with the unidimensional latent variable model,
removing those items from the initial item set, and producing a subset of items that is
consistent with the unidimensional latent variable model. We compared CA scaling with the
scaling procedures DETECT and Mokken scale analysis, and found that CA scaling produced
longer scales consistent with the unidimensional latent variable model.
Variational Bayesian Approximation Method for Inference in Item Response Model
Parallel Session: Bayesian Methods in Item Response Theory; Tuesday, 19 July, 11:10
a.m. -- 12:30 p.m.; D1-LP-08
Pattarasuda Sudsaen*, The University of New South Wales, Australia
Parameter estimation has drawn attention in IRT for a long time. In likelihood approach, the
Marginal maximum likelihood (MMLE) can resolve the inconsistency problem of other
estimation techniques but still has some limitations such as failure to compute the ability
estimate in extreme response patterns. Moreover, MMLE relies on highly accurate integration
which is not always feasible in high-dimensional problems. In Bayesian setting, full Bayesian
estimation overcomes the inconsistency problem. However, in its MCMC implementation, it
is computationally intensive, often lacks reliable convergence criteria and requires
appropriate choice of the priors. To overcome these difficulties, we focus on the Variational
Bayes (VB) approximation. It approximates the posterior by using simpler tractable density,
to reduce the computational intensity of MCMC and yet delivers reasonable accuracy of
estimation. The advantages of VB include less computational time, availability of a lower
bound on the marginal likelihood to check convergence and a reasonable accuracy of the
estimates of item parameters. We outline the VB method for inference in the two-parameter
IRT model. We also discuss multifactor extensions of the method. We demonstrate its good
convergence by monotonically increasing the value of the lower bound during the iteration
process which makes the convergence check very easy. VB’s item parameter estimators
perform well and even better than Bayesian estimators in smaller sample sizes and when
non-informative prior on the item parameters is applied. For informative priors, VB and
Bayesian estimation are comparable when small to moderate samples are used but VB uses
much less computing time.
Bayesian Person Fit Evaluation: A Non-Parametric Approach
Parallel Session: Bayesian Methods in Item Response Theory; Tuesday, 19 July, 11:10
a.m. -- 12:30 p.m.; D1-LP-08
Herbert Hoijtink*, Methods and Statistics/University Utrecht, Netherlands

The 76th Annual and the 17th International Meeting of the Psychometric Society Page 133
Sebastien Beland, Universite Du Quebec a Montreal, Netherlands
This paper introduces Bayesian person fit evaluation in the context of double monotonous
IRT models for dichotomous item response data. It will be shown that the approach proposed
allows
a flexible specification of hypotheses with respect to the response process. It will also be
shown how the Bayes factor can be used to evaluate the hypotheses of interest. The
performance of
the approach proposed will be evaluated, and avenues for further research will be sketched.
Extensions and Applications of Higher-Order Item Response Theory Models
Parallel Session: Bayesian Methods in Item Response Theory; Tuesday, 19 July, 11:10
a.m. -- 12:30 p.m.; D1-LP-08
Chi-Ming Su*, National Chung Cheng University, Taiwan
Wen Chung Wang, The Hong Kong Institute of Education, Hong Kong
The study generalized unidimensional second-order IRT models to multidimensional
higher-order IRT models and developed CAT algorithms. Due to high dimensionality of the
new models, we proposed to use Bayesian MCMC methods for parameter estimation. The
results of simulations show that the parameters can be recovered fairly well using the
computer WinBUGS. Furthermore, both the PsBF and the DIC were sensitive in model
comparison across a variety of conditions. The CAT algorithms of the new models were
successfully developed. The simulation results indicate that the progressive method and the
alpha-stratified method, although increasing bank usage, did not always maintain item
exposure rates at a prespecified level, whereas the Sympson and Hetter online freeze method
did. In practice, it is recommended that both the progressive method and the Sympson and
Hetter online freeze method are implemented to maintain both item exposure and bank usage.
Impacts of Prior Distributions in Testlet IRT model
Parallel Session: Bayesian Methods in Item Response Theory; Tuesday, 19 July, 11:10
a.m. -- 12:30 p.m.; D1-LP-08
Jongmin Ra*, The University of Georiga, USA
Seock-Ho Kim, The University of Georgia, USA
The purpose of this paper is to examine impacts of different prior distributions in the Testlet
IRT models. Once Bradlow, Wainer, and Wang (1999) suggested a two parameter normal
testlet model so as to include the testlet effect in the model, subsequent studies (Bradlow et
al., 1999; Wainer, Bradlow, & Du, 2000;Wang, Bradlow, &Wainer, 2002) showed that testlet
The 76th Annual and the 17th International Meeting of the Psychometric Society Page 134
models effectively account for local dependence existing among items sharing the same
stimulus and also yield accurate model parameter recovery. Then, a large volumes of
following research regarding testlet effects mainly focuses on ability and item parameter
estimation, estimation accuracy, and test reliability. Nonetheless, impacts of prior and
hyper-prior distributions on testlet IRT models have not been paid enough attention.
The focus is on investigating various prior and hyper-prior distributions and comparing them
with respect to practical sense. The impacts of prior distributions will be evaluated using both
real and a simulated data.
The Exploration and Comparison of the Ability Estimation Methods for
Multidimensional Test
Parallel Session: Bayesian Methods in Item Response Theory; Tuesday, 19 July, 11:10
a.m. -- 12:30 p.m.; D1-LP-08
Yue Wang*, Beijing Normal University, China
Hongyun Liu, Beijing Normal University, China
Several approaches to estimate multidimensional ability parameter can be found in the
literature. This research explores the recovery of different multidimensional ability estimation
approaches: NCCTT based on CTT, Bayesian estimation based on MIRT, NCMIRT, NCH,
NCMIRTa and NCHa based on both MIRT and CTT. A Monte Carlo simulation study is
conducted to compare the different estimation methods under varies of conditions of test
length, sample size, test structure and correlations between dimensions. Results indicate that:
(1)MCMC methodology is the most accurate method with the smallest RMSE, followed by
NCHa. But NCHa is much easier and faster than MCMC. (2)The precision of the ability
estimators for all these methods is increased as the length of the test increases, but it is not
influenced by sample size, although some other researches indicated. (3)The differences of
ability estimators between different methods are moderated by test structures. They are much
bigger in within-item multidimensionality tests than that of in between-item
multidimensionality tests. (4)In within-item multidimensionality tests, the higher the
correlations between dimensions are, the smaller the difference of estimation accuracy
between different methods is. When the correlations between dimensions reach 0.8, similar
results can be found from all these methods. However, in between-item multidimensionality
tests, as the correlations between dimensions increasing, the difference of estimation
accuracy between different methods slightly increases. When the dimensions are highly
correlated, those simple methods estimate a little poorly. The authors conclude with
considerations for choosing appropriate estimation methods and give some advice for applied
researchers.
The 76th Annual and the 17th International Meeting of the Psychometric Society Page 135
Rotation to Higher Order Invariance In Dynamic Factor Analysis
Parallel Session: Multivariate Data Analysis I; Tuesday, 19 July, 11:10 a.m. -- 12:30
p.m.; D2-LP-08
Michael Browne*, The Ohio State University, USA
Guangjian Zhang, The University of Notre Dame, USA
The theory of higher order factorial invariance in dynamic factor analysis has been
introduced by John Nesselroade. According to this theory differences between persons occur
at the measurement level so that differences in factor loadings from one person to another are
to be expected. On the other hand, intra-personal processes, possibly rooted in physiology,
should vary little from one person to another. This would be reflected in similarities between
persons in their latent time series and consequently in their latent factor autocorrelation
matrices at lags 0, 1, 2,…
In the initial exploratory stages of research it is appropriate to rely on exploratory factor
analysis with rotation. After realistic hypotheses have been suggested at the exploratory stage
they may be tested by confirmatory analyses on new data. This presentation will be
concerned with the exploratory stage of higher order factorial invariance. It will provide an
oblique factor rotation procedure in dynamic factor analysis so as to yield similar latent
autocorrelation matrices for different persons without requiring any similarity between factor
matrices. Examples of the use of the rotation procedure will be provided.
Analysis of Brand Switching Among Sliced Cheese by Asymmetric Multidimensional
Scaling
Parallel Session: Multivariate Data Analysis I; Tuesday, 19 July, 11:10 a.m. -- 12:30
p.m.; D2-LP-08
Akinori Okada*, Tama University, Japan
Tsurumi Hiroyuki, Yokohama National University, Japan
The brand switching matrix among nine sliced cheese brands was analyzed by asymmetric
multidimensional scaling based on singular value decomposition. The asymmetric
multidimensional scaling provides us the outward tendency and the inward tendency along
each dimension. The outward tendency of a brand shows the degree of the switching from
that brand to the other brands. The inward tendency of a brand shows the degree of the
switching to that brand from the other brands. The singular value decomposition of the brand
switching matrix represents left and right singular vectors and the singular values. The left
and singular vectors give the outward and inward tendencies respectively. One set of the
outward tendency and one set of the inward tendency are obtained along each dimension. The
two-dimensional result was chosen as the solution, because that Dimension 3 shows only
The 76th Annual and the 17th International Meeting of the Psychometric Society Page 136
small amount of information from the standpoint of the marketing of sliced cheese brands,
and that the scree criterion of the ratio of the accumulated sum of squared singular values to
the sum of all nine squared singular values or sum of all squared elements of the brand
switching matrix. The result is shown by a plane spanned by the left and right singular
vectors along each dimension. Dimension 1 shows brands made by three makers severely
compete each other. Dimension 2 shows there are two groups of brands. The brand switching
within a group is large, while that between group is small.
Maximum Entropy Procedure, A Univariate Discrete and Continuous Distributions
Simulating Procedure with the Parameter Constraints
Parallel Session: Multivariate Data Analysis I; Tuesday, 19 July, 11:10 a.m. -- 12:30
p.m.; D2-LP-08
Yen Lee*, National Cheng Kung University, Taiwan
Chung-Ping Cheng, National Cheng Kung University, Taiwan
When conducting the robustness researches about normality assumption with Monte Carlo
method, a procedure for simulating non-normal distributions is needed. Some procedures for
simulating continuous distributions have been proposed, but there isn’t any procedure for
simulating discrete distributions of ordered categorized variables (e.g., Likert-Type scale)
which we met mostly in practice. Therefore, a procedure called Maximum Entropy Procedure
(MEP) which could simulate discrete and continuous distributions with 2 parameters
constraints of skewness and kurtosis or 4 parameters constraints of added mean and variance
is purposed in this research. With the constraints satisfying, the probability distributions
chosen by MEP would be the one with the greatest number of ways to achieve and hence a
reasonable choice. The procedure has been programmed in R and demonstrated excellent
agreement (smaller than 10-10) between specified and generated parameters.
Nonsingular Transformation of Tucker2 Solutions for Representing Stimulus-Response
Relationships by Sparse Networks
Parallel Session: Multivariate Data Analysis I; Tuesday, 19 July, 11:10 a.m. -- 12:30
p.m.; D2-LP-08
Adachi Kohei*, Osaka University, Japan
Three-way component analysis solutions for data arrays of stimuli by responses by
individuals are represented by the networks linking stimuli to responses by way of the two
layers of components. In this paper, I propose a method for transforming initial Tucker2
solutions so that transformed solutions are represented by sparse networks. This method
simultaneously attains the three purposes; [1] matching component matrices to known simple
The 76th Annual and the 17th International Meeting of the Psychometric Society Page 137
targets, [2] matching the extended core arrays associated with individuals to a partially
unknown target core array, and [3] allowing this target array to summarize individuals’ core
arrays. One feature of the method is that transformation matrices to be obtained are
unconstrained except for their non-singularity, which differs from those in orthogonal and
oblique rotation. The proposed method is illustrated with a data array of semantic differential
ratings.
On the Extended Wedderburn-Guttman Decomposition
Parallel Session: Multivariate Data Analysis I; Tuesday, 19 July, 11:10 a.m. -- 12:30
p.m.; D2-LP-08
Yoshio Takane*, McGill University, Canada
Let X denote an n by p (data) matrix, and let M and N be matrices such that M'XN can be
formed. Takane and Yanai discussed the necessary and sufficient condition under which
rank(X - XN(M'XN)-M'X) = rank(X) - rank(XN(M'XN)-M'X) to hold. This condition along
with the rank formula is called the extended WG theorem. The theorem implies a
decomposition of X of the form X = XN(M'XN)-M'X + (X - XN(M'XN)-M'X ), which we
call the extended Wedderburn-Guttman decomposition. In this talk, we discuss several
important properties of the decomposition, including an expression of the second term as a
single matrix (rather than a difference between two matrices).
Test Length and Decision Making in Psychology: When Is Short Too Short?
Parallel Session: Classical Test Theory - Reliability Issue; Tuesday, 19 July, 11:10 a.m.
-- 12:30 p.m.; D2-LP-09
Peter Kruyen*, Tilburg University, Netherlands
Wilco Emons, Tilburg University, Netherlands
Klaas Sijtsma, Tilburg University, Netherlands
To efficiently assess multiple psychological attributes and to minimize the burden on patients,
psychologists increasingly use shortened versions of existing tests. Meanwhile, the
importance of psychological testing has increased. For example, patients are routinely
measured to monitor their progress in the course of a therapy and to evaluate treatment
programs. These measurements are not only used to evaluate changes in the individual patient,
but they are also used by insurance companies to make financial decisions on whether or not
to reimburse certain treatment programs. However, the shortened tests are less reliable
compared to long tests and may therefore substantially impair reliable decision-making.
In this study, we reviewed recent trends in the use of short tests and examined the impact of
test length reduction on individual decision-making. First, we present the results of a
The 76th Annual and the 17th International Meeting of the Psychometric Society Page 138
literature review on the use and validation of abbreviated tests in psychology. Second, we
present the results of simulation studies comparing the risks of making incorrect decisions for
the long and abbreviated tests. These simulations showed that the number of items needed to
take decisions about patients depends on various factors including the application envisaged.
For some applications five to ten items are sufficient, whereas in other applications one needs
at least twenty items.
An Empirical Comparison of Methods for Estimating Reliability
Parallel Session: Classical Test Theory - Reliability Issue; Tuesday, 19 July, 11:10 a.m.
-- 12:30 p.m.; D2-LP-09
Kensuke Okada*, Senshu University, Japan
Many former studies have reported the tendency of Cronbach's alpha to underestimate the
true reliability. Recently, separate studies have reported the better performance of
McDonald's omega (omega_h and/or omega_t), or of reliability estimation using structural
equation modeling (SEM) technique. However, to the best of the authors’ knowledge, these
two approaches have not been directly compared. Therefore, in this study, we compared the
performance of these two methods to estimate reliability by a Monte Carlo study. The
following factors are manipulated: generation model structures (tau-equivalent, congeneric
and bifactor), path coefficient values, number of observations, and number of items. Artificial
data are generated from the model, and then analyzed to estimate reliability. The quality of a
reliability estimate is evaluated by computing relative biases and efficiencies. The results can
be summarized as follows. (1) While basically no estimation problems are found in
calculating omega, SEM estimation encounters a few problems. (2) Small sample sizes result
in larger biases. (3) Omega_t with three specific factors sometimes result in biased estimates.
(4) While SEM estimates from the true model structure give satisfactory performance, they
result in larger biases if the model structure is misspecified. (5) On the whole, SEM
estimation with tau-equivalent and congeneric models and omega (total) with one specific
factor reveals good performance.
Cronbach's Coefficient Alpha Reliability for Scale Scores of Dichotomous Items Test
Parallel Session: Classical Test Theory - Reliability Issue; Tuesday, 19 July, 11:10 a.m.
-- 12:30 p.m.; D2-LP-09
Rashid Al-Mahrazi*, Sultan Qaboos University, Oman
Cronbach's coefficient alpha (or Kuder-Richardson formula-20) is the commonly-used
coefficient for estimating internal consistency reliability of raw scores of dichotomous items
test under tau-equivalent forms assumption. However, most test users prefer transforming
The 76th Annual and the 17th International Meeting of the Psychometric Society Page 139
total raw scores to scale scores with either linear or nonlinear transformation for better test
score interpretation. Although the estimate of reliability for test raw score is equal to estimate
of reliability for linearly transformed scale scores by definition, this estimate is not
necessarily equal to estimate of reliability for nonlinearly transformed test scale scores.
However, there is no existing method to estimate Cronbach's coefficient alpha reliability for
test nonlinear scale scores. There is an approximation method to get an estimate of internal
consistency reliability of test scale scores through estimating the individual conditional error
variance. There are number of methods to estimate individual conditional error variance such
as Feldt and Qualls (1998), Kolen, Hanson, & Brennan (1992). This approximation method
of estimating reliability for scale scores defines the error variance as the average of individual
error variance assuming random responses with binomial distribution or any true score
distribution. However, Conbach's coefficient alpha defines error variance differently as error
variance of examinees across tau-equivalent forms.
The paper will demonstrate the proposed method to give exact estimation of Cronbach's
coefficient alpha for any transformed scale scores of dichotomous items test. Then this
estimate of reliability for test scale scores will be compared with other existing approximated
methods with different types of commonly-used scale scores using real data set.
Estimating the Reliability of Aggregated and Within-Person Centered Scores in
Ecological Momentary Assessment
Parallel Session: Classical Test Theory - Reliability Issue; Tuesday, 19 July, 11:10 a.m.
-- 12:30 p.m.; D2-LP-09
Po-Hsien Huang*,National Taiwan University, Taiwan
Li-Jen Weng, National Taiwan University, Taiwan
A procedure for estimating the reliability of test scores in ecological momentary assessment
(EMA) is proposed. The proposed procedure considers several characteristics of EMA
measurements. The momentary response in EMA is treated as the sum of the typical response
and the deviation from the typical response. Two types of test scores are identified for further
reliability analysis. The aggregated score (AGGS) is the arithmetic average of the composite
score for a given person. The within person centered score (WPCS) is the deviation score
from the AGGS for a given person at some time. The AGGS and the WPCS are the test
scores that can be used for representing the typical response and the deviation from the
typical response respectively. Under the framework of multilevel factor model with serial
correlation structure, the reliability coefficients for AGGS and WPCS are derived. The point
estimates and confidence intervals for these coefficients can be obtained by using the
software Mx (Neale, Boker, Xie, & Maes, 2003). A simulation study shows that the empirical
The 76th Annual and the 17th International Meeting of the Psychometric Society Page 140
performance of the proposed procedure is acceptable. Strengths and limitations of the
proposed procedure are discussed.
Generalizability Analysis of Constructed-Response and Hands-On Performance Tasks
in Home Economics
Parallel Session: Classical Test Theory - Reliability Issue; Tuesday, 19 July, 11:10 a.m.
-- 12:30 p.m.; D2-LP-09
Chiao-Ying Wu*, National University of Tainan, Taiwan
Hueying Tzou, National University of Tainan, Taiwan
In Taiwan, the new educational program makes students and their parents not only care about
traditional paper-and-pencil tests but also the scores of these performance assessments. Given
this trend, the current study investigates score generalizability of the performance assessment
including paper-and-pencil tasks and manual tasks. For this purpose, a univariate
generalizability analysis and a multivariate generalizability analysis are used to investigate
the effect of both the task and rater facets on score reliability. In addition, a comparison of
three different rating conditions is presented—all raters scoring each task without rubrics,
with rubrics, and after receiving rater training.
The researcher collected 384 samples from 96 students who from four different classes taught
by the four different raters completed two paper-and-pencil and two manual tasks. Under
each rating condition, let the four raters score the four tasks of eight students of each class
individually. GENOVA 2.1(Brennan, 1983) and mGENOVA 2.1 (Brennan, 2001) were used
to analyze the study data.
The results of G-study are expected to answer these questions: 1) What’s the differences
between the effect of rater and task facet on score reliability under the three rating conditions?
2) Which type of the tasks score or the composite score generalizability is better? 3) Dose the
score reliability of the performance assessment changed if the raters are not professional?
Furthermore, we expect the results of D-study find out what’s the composite of the number of
tasks and raters under which rating condition will work most efficiently.
Rasch Trees: A New Method to Detect Differential Item Functioning in the Rasch
Model
Parallel Session: Differential Item Functioning - Advanced Method; Tuesday, 19 July,
11:10 a.m. -- 12:30 p.m.; D2-LP-10
Carolin Strobl*,LMU Munich, Germany
Julia Kopf, LMU Munich, Germany
Achim Zeileis, Universität Innsbruck, Austria

The 76th Annual and the 17th International Meeting of the Psychometric Society Page 141
Differential item functioning (DIF) can lead to an unfair advantage or disadvantage for
certain subgroups in educational and psychological testing. A variety of statistical methods
has been suggested for detecting DIF in the Rasch model. Most of these methods are
designed for the comparison of pre-specified focal and reference groups, such as males and
females. Latent class approaches, on the other hand, allow to detect previously unknown
groups exhibiting DIF. However, this approach provides no straightforward interpretation of
the groups with respect to person characteristics. In this talk we propose a new method for
DIF detection based on model-based recursive partitioning that can be considered as a
compromise between those two extremes. With this approach it is possible to detect groups of
subjects exhibiting DIF, which are not pre- specified, but result from combinations of
observed covariates in a data-driven way. These groups are directly interpretable and can thus
help understand the psychological sources of DIF. The talk outlines the statistical
methodology behind the new approach as well as its practical application by means of an
illustrative example.
Applying the Mixture Rasch Model with Covariate to Explore Potentially
Differentiating Functioning Items
Parallel Session: Differential Item Functioning - Advanced Method; Tuesday, 19 July,
11:10 a.m. -- 12:30 p.m.; D2-LP-10
Yunyun Dai*, University of California at Los Angeles, USA
Starting from the early 1990’s, Mixtures of item response theory models have been proposed
as a technique to explore response patterns in test data related to cognitive strategies,
instructional sensitivity, and differential item functioning (DIF) . More recently, Mixture
Rasch Model with Covariate (MRMC) was recommended (Cohen and Bolt 2005, Samuelsen
2008) and was systematically investigated by simulation studies (Smit et al 1999, Dai 2009).
The estimation of MRMC proved challenging due to difficulties in model identification and
questions of effect size needed to recover underlying structures. As such, researchers
recommended that application of this model to empirical data should be regarded as
exploratory in nature rather than confirmatory. Meanwhile, the literature lack application of
MRMC on empirical data.
In this research study, we apply the MRMC model to study assessment items. Students’
background variable is incorporated to explore the potential DIF items. We expect the
addition of auxiliary information will help locate the plausible cause of DIF and obtain more
accurate parameter estimates. The modeling of MRMC is under Bayesian estimation using
Markov Chain Monte Carlo (MCMC) method.
In our analysis, we use student’s gender as covariate in MRMC and selected a random sample
of 1000 students with complete data. The source of data is a large-scale formative assessment
The 76th Annual and the 17th International Meeting of the Psychometric Society Page 142
project, called POWERSOURCE. It was developed and implemented by the National Center
for Research on Evaluation, Standards, and Student Testing (CRESST) at UCLA.
In our two latent class specification in MRMC, about 30% of the 1000 students are classified
into one latent class while the rest of the 70% were classified into the other latent class. The
average latent ability with the smaller group is lower than that for the larger group with the
difference equivalent to one standard deviation. Subsets of items are easier for one group of
student versus the other. This calls for experts’ reviews of certain items. In addition, MRMC
with other student background variable (e.g., parents’ education) as covariate will be further
investigated.
Detection of Differential Item Functioning Based on Multilevel Rasch Model
Parallel Session: Differential Item Functioning - Advanced Method; Tuesday, 19 July,
11:10 a.m. -- 12:30 p.m.; D2-LP-10
Hui Liu*, South China Normal University, China
Ming-Qiang Zhang, South China Normal University, China
Xiao-Zhu Jian, Jinggangshan University, China
Muhui Huang, South China Normal University, China
Most techniques to detect differential item functioning (DIF) before are based on classical
test theory and item response theory. Multilevel item response theory can not only detect the
items with DIF, but also identify the causes of DIF. In this paper, multilevel Rasch model is
used to detect DIF with a comparison of Rasch model. The results from both methods show
very close agreement on the exact items with DIF, and the results from multilevel Rasch
model also indicate the student and school causes of DIF.
Integrating Bootstrap technique with Hierarchical Generalized Linear Model to
Perform DIF Detection for Small Size Sample
Parallel Session: Differential Item Functioning - Advanced Method; Tuesday, 19 July,
11:10 a.m. -- 12:30 p.m.; D2-LP-10
Jing-Jiun Lin*, National Chung Cheng University, Taiwan
Ya-Hui Su, National Chung Cheng University, Taiwan
In the past, limited researches on differential item function (DIF) have done for the small size
sample, and they found the power was very low (Fidalgo, Ferreres, & Muniz, 2004). Hence,
they adjusted the Alpha value for hypothesis testing to improve power, and this led to high
type I error rate. In recent years, the Bootstrap technique (Efron, 1979) is widely integrated
with many different fields (Davison & Hinkley, 1997;Tsai, 2006; Victor, Nam, and Raphael,
2009) to provide a better approximate estimate by using re-sampling method when small

The 76th Annual and the 17th International Meeting of the Psychometric Society Page 143
sample size is encountered and distribution is unknown. This study integrated the bootstrap
technique with hierarchical generalized linear model (HGLM, Kamata, 2001) and
Mantel-Haenszel (MH; Holland & Thayer, 1988) procedure for small size sample to
detection DIF. Four independent variables were manipulated in this study: (a) DIF detection
method (2 levels; HGLM and MH), (b) sample size (3 levels; 50,250, and 500), (c) item
length (2 levels; 30 and 60), and (d) DIF percentage (6 levels; 0%, 10%, 20%, 30%, 40%, and
50%). The results showed that this new approach performed better than the ones without
bootstrapping on the DIF detection while sample size is small.
Special Models with Special Solutions: Statistical Issues in Hierarchical Item Factor
Models
Invited Symposium: Tuesday, 19 July, 1:30 p.m. -- 2:50 p.m., D1-LP-03
The Lord-Wingersky Algorithm After 25+ Years: Version 2.0 for Hierarchical Item
Factor Models
Li Cai*, University of California at Los Angeles, USA
Lord and Wingersky’s (1984) recursive algorithm for creating summed score based
likelihoods or posteriors has proven to be a useful tool in unidimensional item response
theory (IRT) applications. Variations of the basic algorithm can handle polytomous responses,
produce (weighted) summed score to IRT scale score translation tables, item level
goodness-of-fit indices, and summed score based tables for test linking. Extending the
recursive algorithm to handle multidimensionality is relatively simple, especially with fixed
quadrature because the recursions can be defined on the grid of direct products of quadrature
points. However, the increase in computational burden remains exponential in the number of
dimensions of integration, making the implementation of the recursive algorithm far less
straightforward for truly high dimensional models. In this paper, a dimension reduction
method that is specific to the Lord-Wingersky recursions is developed. This method can
take advantage of the restrictions implied by hierarchical item factor models, e.g., the bifactor
model (Gibbons & Hedeker, 1992) or the two-tier model (Cai, 2010), so that a generalized
version of the Lord-Wingersky recursive algorithm can operate on a dramatically reduced set
of quadrature points. For instance, in a bifactor model, the dimension of integration is always
equal to 2, regardless the number of factors. The new algorithm is illustrated with real data
based examples on IRT scoring, testing item fit, and linking.
Limited-information Goodness-of-fit Testing of Hierarchical Item Factor Models
Mark Hansen*, University of California at Los Angeles, USA
Li Cai*, University of California at Los Angeles, USA
The 76th Annual and the 17th International Meeting of the Psychometric Society Page 144
In applications of item response theory (IRT), it is critical to ascertain the fit of the IRT
model. Recently limited-information goodness-of-fit testing has received increased
attention in the psychometrics literature. In contrast to full-information test statistics such as
Pearson’s X^2 or the Likelihood Ratio G^2, these limited-information tests utilize
lower-order marginal tables rather than the full contingency table. A notable example is
Maydeu-Olivares and colleagues’ M_2 family of statistics based on univariate and bivariate
margins. When the contingency table is sparse, tests based on M_2 retain better Type I error
rate control than the full-information tests and can be more powerful. While in principle the
M_2 statistic can be extended to test hierarchical multidimensional item factor models (e.g.,
bifactor or two-tier models), the computational and implementation burden is non-trivial. To
obtain M_2, a researcher has to compute (thousands of) marginal probabilities, derivatives,
and weights. Each piece must be approximated with high-dimensional numerical integration.
We propose a new dimension reduction method that can take advantage of the hierarchical
factor structure so that the integrals can be approximated far more efficiently. We also
propose a new statistic for ordinal items that can be substantially better calibrated and more
powerful than the original M_2 statistic for realistic test lengths. We use simulations to
demonstrate the performance of our new methods and illustrate their effectiveness with
applications to large-scale assessment data.
Calibration, Scaling, DIF, and Projection: A Common Framework Using
Multidimensional IRT
Moonsoo Lee*, University of California at Los Angeles, USA
Mark Hansen, University of California at Los Angeles, USA
Li Cai*, University of California at Los Angeles, USA
We develop a common statistical framework for concurrent calibration, vertical scaling,
differential item functioning analysis, and calibrated projection (see Thissen et al., in press,
for details on calibrated projection). It is shown that the underlying model is a confirmatory
multidimensional item response theory (IRT) model, potentially with a two-tier structure to
allow for residual dependence among items. Instead of pursuing the various disparate
methods using multiple-group analysis, we show that additional groups can be equivalently
represented using extra latent variables. We analytically and empirically explicate the
identification conditions and restrictions that lead to each known special case, and we explore
their ramifications on data collection designs. We connect the different methods to highlight
that with flexible multidimensional IRT modeling, the traditional boundaries among
calibration, scaling, and projection have become blurred. We conclude with a discussion of
some potential extensions.
The 76th Annual and the 17th International Meeting of the Psychometric Society Page 145
A Multilevel Item Bifactor Model
Ji Seung Yang*, University of California at Los Angeles, USA
Scott Monroe, University of California at Los Angeles, USA
Li Cai*, University of California at Los Angeles, US
Data sets from large scale educational surveys have become increasingly important in
educational research, providing rich information on trends, benchmarks, and comparisons.
The design of these assessments, however, can be quite complex. Take the Program for
International Student Assessment (PISA) for example. Within a country, a two-stage
stratified sampling is typically used. As such, students are naturally nested within schools,
which are sampled first. On the other hand, the student surveys usually consist of a large
number of clusters of items organized into testlets. The items are then assembled into forms
based on randomized blocks designs. Cai, Yang, and Hansen (in press) have recently
proposed the use of item bifactor models to scale student outcomes for such data sets. On
the other hand, there is a line of work on multilevel models in the IRT literature, mostly using
Bayesian techniques. However, few have attempted to address the multilevel nature of the
data within an item bifactor analysis framework. The key benefit of such a multilevel item
bifactor model lies in the efficiency of dimension reduction. We show that maximum
marginal likelihood estimation of this model can be accomplished efficiently with
3-dimensional integration regardless of the number of latent variables at the student level.
Both simulated and real data examples will be used to illustrate our new model.
Analysis of Missing Data and Causal Inference
Invited Symposium : Tuesday, 19 July, 1:30 p.m. -- 2:50 p.m., D1-LP-04
Estimation and Use of Mean and (Co)Variance with Monotonic Missing Data
Keiji Takai*, Kansai University, Japan
In analysis of data, mean and (co)variance are basic and important statistics. However,
estimation of them can be difficult when the data contain missing values. In this talk,
we give a method to estimate and use the mean and (co)variance of multivariate data in a
monotonic missing pattern with a regression model. First, we show that under the MAR
assumption the mean of the variable can be consistently estimated by use of the regression
model. It is presented that more than one estimator can be constructed. We show that
consistent estimators for covariance are constructed with the mean estimators. The variance
of the variable can also be consistently estimated. Second, we propose a test method to
examine the assumption of MAR. The test uses the mean estimators that are consistent under
The 76th Annual and the 17th International Meeting of the Psychometric Society Page 146
the MAR assumption. Two tests are constructed for the respective cases where the linear and
nonlinear regression models are considered. Third, we consider the case where the proposed
test rejects the null hypothesis that the data are MAR. In such
a case, the estimators are generally inconsistent. A conventional but practically difficult
method to produce a consistent estimator is modeling the missing-data mechanism. We
propose a method to avoid such a difficulty by using auxiliary variables. We show that
adding the auxiliary variables satisfying some conditions reduces the bias of the estimators
derived under the assumption of MAR in the sense of the absolute value.
Missing not at Random versus Misspecified Distributions: Bias and the Role of
Auxiliary Variables
Ke-Hai Yuan*, University of Notre Dame, USA
Normal-distribution-based maximum likelihood (NML) is the most widely used procedure
for missing data analysis although real data seldom follow a normal distribution. Recent
results indicate that NML estimates (NMLEs) are still consistent for nonnormally distributed
populations as long as the variables are linearly related. However, NMLEs are generally not
consistent when the nonnormality in the population is created by nonlinear relationships
among some underlying latent variables. Similarly, NMLEs are generally not consistent when
data are missing not at random (MNAR). It is well-known that including proper auxiliary
variables mitigates the biases in MLEs caused by MNAR mechanism. In this talk we show
that the biases in NMLEs due to nonnormality created by nonlinear relationships are also
mitigated by including auxiliary variables. In particular, our analytical results indicate that the
NMLEs of the substantive variables are still consistent when proper auxiliary variables are
included. Our empirical results indicate that proper auxiliary variables also mitigate the
biases in NMLEs at small sample sizes even when they are consistent. Our results also imply
that the biases due to nonnormally distributed populations can be a lot greater than those due
to MNAR mechanism. How to choose auxiliary variables in practice is also discussed.
Mixture Modelling of Treatment Effects with Multiple Compliance Classes and Missing
Data.
Michael E. Sobel*, Columbia University, USA
Bengt Muthén, Muthen & Muthen, USA
Randomized experiments are the gold standard for drawing causal inferences. A fundamental
parameter of interest is the intent to treat estimand (ITT), which measures the impact of
offering the treatment. Researchers design the treatments to affect mediators lying along
presumed pathways to the outcome, and they typically also want to know the effect of the

The 76th Annual and the 17th International Meeting of the Psychometric Society Page 147
treatment itself. The ITT does not measure this because some subjects (always takers and
never takers) treatment status does not depend on treatment assignment. Per-protocol and
as-treated analyses do not solve this problem. More recently, statisticians have focused
attention on estimating effects for the latent subpopulation of subjects (compliers) who will
comply with their treatment assignment. In many experiments, there may be little reason to
believe that the mediators targeted by the treatment produce
effects for all such subjects. We assume the compliers are composed of an effect class, in
which treatment affects the outcome, and a zero effect class. Of interest are the average effect
in the effect class and the proportions of compliers in each of these two classes. Missing data
further complicate estimation of both the ITT and the average effect in the complier effect
class. We consider and present estimates for these parameters under a variety of assumptions,
including the assumption that the missing outcome data are missing at random and the
assumption that outcomes are independent of missingness, given observed covariates and
subject's latent compliance status.
Bias of the Direct MLE for NMAR Missingness: Theoretical Approach
Yutaka Kano*, Osaka University, Japan
The method of direct maximum likelihood (DML), without use of missing-data mechanism,
can produce consistent estimators for parameters of interest if the missing-data mechanism is
MAR. The DML generally causes biased estimators for NMAR missingness. The model
specification and the MAR assumption may not be correct in practice. Yuan (2007, JMVA)
studied unbiasedness of the MLE when the model is misspecified but the MAR holds. In this
talk, we are concerned with sensitivity analysis of the DLM when the MAR assumption is
violated. More spesifically, we shall develop a new method which can theoretically evaluate
magnitude of the bias of the DMLE caused by NMAR missingness. The method is used to
evaluate whether addition of auxiliary variables can reduce the bias of the DMLE when a
missing-data mechanism is NMAR.
The MAR is a set of equality conditions among conditional probabilities of missing
indicators given observed variables. The NMAR is negation of the set of these equality
conditions. There has been no approach to evaluation of NMARness, i.e., degree of NMAR.
We shall propose to define the NMARness as magnitude of the bias of the DMLE.
Statistical Inference of the Q-matrix in Diagnostic Classification Models
Parallel Session: Cognitive Diagnosis Modeling - Theory II; Tuesday, 19 July, 1:30 p.m.
-- 2:50 p.m.; D1-LP-06
Jingchen Liu*, Columbia University, USA
Gongjun Xu, Columbia University, USA

The 76th Annual and the 17th International Meeting of the Psychometric Society Page 148
Zhiliang Ying, Columbia University, USA
The Q-matrix, which specifies the item-attribute relationship, is a key quantity of the
diagnostic classification models, which become popular for cognitive assessment in recent
years. Suppose that there are m items that are potentially associated with k attributes. The
Q-matrix is an m by k matrix with binary entries indicating if a certain item requires a certain
attribute. In this talk, we present the estimation problem of the Q-matrix. We setup a
framework under which the theoretical properties may be discussed. Due to the potential
non-identifiability issues, we need to first provide a sensible definition of the learnability of a
Q-matrix. Then, we establish a set of sufficient conditions to ensure that the Q-matrix is
learnable based on the data. In particular, we present one consistent estimator and develop its
statistical properties. The estimator is represented in the form of the minimizer of an
objective function, which can be evaluated efficiently. The discussion further proceeds to a
more general situation when the number of necessary attributes k is unknown. For this
problem, we include an additive penalty function (on the number of attributes) to the original
objective function. Similar consistency results can be obtained.
Examining Attribute Classification Accuracy with General and Specific CDMs When
Sample Size Is Small
Parallel Session: Cognitive Diagnosis Modeling - Theory II; Tuesday, 19 July, 1:30 p.m.
-- 2:50 p.m.; D1-LP-06
Guaner Rojas*, Autónoma University of Madrid, Spain
Julio Olea, Autónoma University of Madrid, Spain
In this work, the attribute classification accuracy (ACA) in cognitive diagnosis models (CDM)
is investigated. We propose a study in order to demonstrate that general CDM can produce
higher ACA compared to specific models when the true model is unknown and the sample
size is small. It is acknowledged that when the sample size is small, estimates of the item
parameters can be inaccurate particularly when the involved model is quite general. However,
even if parameter estimates are unstable, general CDM such as the G-DINA (de la Torre,
2011) model can produce better ACA than specific CDMs when the underlying CDM is not
known and particularly when the test is long. In the current work, a simulation study has been
carried out in order to compare the ACA of the general and specific CDMs. The ACA and
attribute vector levels were computed. The findings show that, when the true model is
unknown and the test is long, the G-DINA model produces higher ACA. Furthermore, the
G-DINA model produced similar results in terms of attribute vector levels.
The 76th Annual and the 17th International Meeting of the Psychometric Society Page 149
A Simulation Study of FCA for Identifying Attributes in Cognitive Diagnostic
Assessment
Parallel Session: Cognitive Diagnosis Modeling - Theory II; Tuesday, 19 July, 1:30 p.m.
-- 2:50 p.m.; D1-LP-06
Wenyi Wang*, Jiangxi Normal University, China
Shuliang Ding, Jiangxi Normal University, China
Lihong Song, Jiangxi Normal University, China
Correct attribute specification is a fundamental step for cognitive diagnostic assessment.
Attributes are usually identified by analyzing think-aloud verbal protocols and performing
statistical test and item analyses. The processes cannot guarantee that the attributes associated
with test items be all correctly specified. So de la Torre (2008) proposed an
empirically based method of validating a Q matrix. In this paper the formal concept analysis
(FCA) is introduced to aid attributes identifying on an existing test. To address this concern,
firstly, the study explains the reason why FCA can be used to identify attributes from the data
of existing test and gives the method to indentify attributes, and secondly a simulation study
was conducted to verify the accuracy of the method of attributes identifying. In the
simulation study, the deterministic-input, noisy “and” gate (DINA) model is used to generate
the response data. The four hierarchical structures using six attributes, such as linear,
convergent, divergent and unstructured hierarchy (Leighton, Gierl, & Hunka, 2007), three
sample sizes and two levels of guessing and slip parameters are in our consideration. Results
and implications of this study will be addressed.
Estimating Classification Consistency and Accuracy for Cognitive Diagnostic
Assessment
Parallel Session: Cognitive Diagnosis Modeling - Theory II; Tuesday, 19 July, 1:30 p.m.
-- 2:50 p.m.; D1-LP-06
Ying Cui*, University of Alberta, Canada
Cognitive diagnostic assessments (CDAs) are designed to classify test takers into a set of
partially ordered latent classes or states, often called attribute patterns, which are defined in
term of the mastery or non-mastery of a set of binary attributes (e.g., knowledge and skills)
being measured by the test. This paper introduces procedures for the computation and
asymptotic statistical inference for classification consistency and accuracy indexes
specifically designed for CDAs. The new classification indexes can be used as important
indicators of the reliability and validity of classification results produced by CDAs. For tests
with known or previously calibrated item parameters, the sampling distributions of the two
new indexes are shown to be asymptotically normal. We use hypothetical tests and simulated
The 76th Annual and the 17th International Meeting of the Psychometric Society Page 150
data to illustrate the computation and statistical properties of these indexes and to evaluate
their performances. Four factors were manipulated, including the quality of test items, total
number of attributes measured by the test, dependency among the attributes, and sample size.
Results indicate that two new indexes perform well with simulated diagnostic tests in that
higher values of the two indexes are found from tests with higher discriminating items,
smaller number of attributes and more dependencies among the attributes. Furthermore, the
findings from the simulation study also suggest that the asymptotic normal theory of the new
classification indexes may be safely applied even when sample size is small or moderate (e.g.,
100 to 500).
Cognitive Diagnosis Models with Longitudinal Growth Curves for Skill Knowledge
Parallel Session: Cognitive Diagnosis Modeling - Theory II; Tuesday, 19 July, 1:30 p.m.
-- 2:50 p.m.; D1-LP-06
Elizabeth Ayers*, University of California, Berkeley, USA
Sophia Rabe-Hesketh, University of California, Berkeley, USA
In recent years, a number of cognitive diagnosis models have become a popular means of
estimating student skill knowledge. However these models treat responses as though they
are from a single time point. When data is collected throughout a school year, we expect
student skill knowledge at different times to be dependent within students and the probability
of skill mastery to increase over time as students learn. We have developed longitudinal
cognitive growth curve models to account for the within-student dependence, as well as
understand the variability in learning and how this depends on explanatory variables. The
relationship between the latent binary skill knowledge indicators and the item responses is
modeled as a DINA model (Junker and Sijtsma, 1997; Rupp, Templin, and Henson, 2010).
A logistic regression model is specified for the latent skill knowledge indicators with student
characteristics and time as covariates and with a student-level random intercept and random
slope of time. In addition, we explore the use of a fixed effect of number of previous
exposures of the same skill. When incorporating time there are several possibilities, one can
use each observation of a skill as a unique time, or count all observations in a day or week as
coming from the same time. The model is estimated using Markov chain Monte Carlo in
WinBUGS. Simulation studies show good parameter recovery. The model is also being
applied to data from the ASSISTment tutor, an online mathematics tutor used by eighth
graders in Massachusetts.
A Comparison of Estimation Methods for Decision Consistency Indexes
Parallel Session: Item Response Theory - Methodology II; Tuesday, 19 July, 1:30 p.m. --
2:50 p.m.; D1-LP-07
The 76th Annual and the 17th International Meeting of the Psychometric Society Page 151
Zhen Li*, Beijing Normal University, China
Tao Xin, Beijing Normal University, China
Decision consistency is an important index for measuring the quality of criterion-based test.
So far, researchers have proposed dozens of estimating methods based on classical test theory
or item response theory. The purpose of this study is to compare the accuracy and robustness
of IRT-based estimating methods for decision consistency, a new one developed recently, to
those of traditional CTT-based methods, LL method and compound multinomial methods.
Both simulation study and empirical study are employed. The results of simulation study
show that those new IRT-based methods can provide more accurate estimates for decision
consistency indexes, p and Kappa coefficient, while the CTT-based methods provide more
stable estimates, with much lower standard deviations. Moreover, the test length and the
location of cut scores also have a significant influence on decision consistency estimation.
The estimates of decision consistency get larger as the test length gets longer. The same trend
is found when the cut score gets further away from the mean of students’ score distribution.
Meanwhile, the accuracy gets higher as the test length increases. Empirical data shows that
all these models are well fit with test results, and IRT-based model provides higher estimates
for decision consistency indexes.
Estimation of Abilities Using the Globally Optimal Scoring Weights under Polytomous
IRT Models
Parallel Session: Item Response Theory - Methodology II; Tuesday, 19 July, 1:30 p.m. --
2:50 p.m.; D1-LP-07
Sayaka Arai*, The National Center for University Entrance Examinations, Japan
Shin-ichi Mayekawa, Tokyo Institute of Technology , Japan
Under item response theory (IRT), the ability parameter for each individual is estimated, in
most cases, using either the MLE or EAP method from the response patterns to the test items.
However, because these estimation methods are complicated, it is almost impossible for a
layman to comprehend how the scores are calculated.
On the other hand, it is possible to estimate the IRT abilities on the basis of the observed
weighted total score (e.g., Thissen (2001)). The weighted total score is easy to calculate,
although statistical properties of the score depend on the weights.
Mayekawa (2008) developed the globally optimal scoring weights, which maximize the
expected test information, and showed that the globally optimal weights reduced the posterior
variance when evaluating the posterior distribution of the ability given the weighted total
score under three-parameter logistic model and graded response model.

The 76th Annual and the 17th International Meeting of the Psychometric Society Page 152
In this study, we extend globally optimal scoring weights to more general IRT models: partial
credit model and generalized partial credit model. We also apply these weights to a quick
scoring method, which provide IRT ability estimates based on the weighted total scores, and
compare the efficiencies.
Log-linear Item Response Models for Polytomous Data
Parallel Session: Item Response Theory - Methodology II; Tuesday, 19 July, 1:30 p.m. --
2:50 p.m.; D1-LP-07
Zhushan Li*, Boston College, USA
Item response data can be treated as multi-way cross tables where each cell is a response
pattern. Log-linear models are standard methods to deal with cross tables, and it has been
shown that certain families of log-linear models are equivalent to item response theory (IRT)
models for dichotomous data and thus can be used to obtain IRT solutions.
In this paper I will present log-linear models for polytomous item response data, and show
that the models are equivalent to polytomous IRT models such as the partial credit model and
models with covariates. These polytomous IRT models are unified under the framework of
log-linear models and can be fit by fitting the proposed log-linear models. Historically, a
significant barrier to the application of log-linear models in analyzing item responses has
been the high computational cost of maximum likelihood estimation when the number of
items is large. To solve this problem, Pseudo-likelihood estimation is used and it dramatically
reduces the computational cost. The effectiveness of the developed models and the
pseudo-likelihood estimation method is demonstrated by a series of simulation studies and
application to real datasets.
Effects of Using The Reciprocal of the Number of Choices as Lower Asymptote
Parameters of the 3PL Model
Parallel Session: Item Response Theory - Methodology II; Tuesday, 19 July, 1:30 p.m. --
2:50 p.m.; D1-LP-07
Yasuko Nogami*, The Japan Institute for Educational Measurement, Inc., Japan
Natsuko Kobayashi, The Japan Institute for Educational Measurement, Inc., Japan
Norio Hayashi, The Japan Institute for Educational Measurement, Inc., Japan
Since Birnbaum (1968) introduced the three parameter logistic (3PL) model, it has been one
of the most popular models to be applied to a test consisting of multiple choice items.
However, since the number of examinees required for item calibration under the 3PL model
is considerably larger than that for the simpler 2PL and 1PL models, practitioners sometimes
have to choose those simpler models instead. In order to solve this sample size problem on
The 76th Annual and the 17th International Meeting of the Psychometric Society Page 153
item calibration under the 3PL model, this study examines the effects of using the reciprocal
of the number of choices as the lower asymptote parameters of the 3PL model. Using real and
simulated data with several sample size conditions, the 3PL model with fixed lower
asymptote parameters and the 2PL model are compared in terms of item calibration stability
and closeness of the test properties under the ordinal 3PL model with estimated lower
asymptote parameters. The results suggest that fixing lower asymptote parameters to the
reciprocal of the number of choices could be an effective solution for sample size reduction;
however, several problems with using the reciprocal of the number of choices were also
found.
A Three Parameter Item Response Theory Model with Varying Upper Asymptote
Effects
Parallel Session: Item Response Theory - Methodology II; Tuesday, 19 July, 1:30 p.m. --
2:50 p.m.; D1-LP-07
Hong Jiao*, University of Maryland, USA
George Macready, University of Maryland, USA
Jianjun Zhu, Pearson Educational Measurement, USA
Weitian An, University of Maryland, USA
This paper proposes a three-parameter item response theory (IRT) model with an upper
asymptote effect, a simplified version of the four-parameter IRT model proposed by Barton
and Lord (1981). The utility of the proposed new model is demonstrated by comparing the
proposed model with three standard unidimensional item response theory models including
the one-parameter, two-parameter, three-parameter, and four-parameter models on several
dichotomous item response data sets from real testing programs. The impact of choosing a
standard item response model vs. the proposed model on ability estimation and examinee
classification is demonstrated using both real data and simulation data. The study
demonstrates the limitations of the standard item response theory models. The results
generally support the exploration of models with upper asymptote effects.
A Semiparametric Bayesian Latent Trait Model for Multivariate Mixed Type Data
Parallel Session: Bayesian Methods and Applications I; Tuesday, 19 July, 1:30 p.m. --
2:50 p.m.; D1-LP-08
Jonathan Gruhl*, University of Washington, USA
Elena Erosheva, University of Washington, USA
Paul K. Crane, University of Washington, USA
The 76th Annual and the 17th International Meeting of the Psychometric Society Page 154
Parametric latent trait models provide one method for the analysis of multivariate mixed type
outcomes that may combine binary, categorical, count and continuous data. These models
require the specification of a conditional distribution for each outcome given the latent trait.
In cases where the focus is on estimation of the relationship between a unidimensional latent
trait and a scientifically important covariate, the specification of this conditional distribution
is of little interest by itself, may be time-consuming, and is susceptible to misspecification.
We propose a semiparametric Bayesian latent trait model for multivariate mixed type data
that does not require specification of a conditional distribution for each outcome. We draw on
the extended rank likelihood method by Hoff (2007) and estimate the semiparametric latent
trait model using Markov chain Monte Carlo methods. We illustrate the semiparametric
Bayesian latent trait model on data from a study of subcortical ischemic vascular dementia.
We investigate the association between cognitive outcomes and MRI-measured regional brain
volumes and compare results from the semiparametric analysis to those obtained from a
parametric latent trait approach for mixed type data.
Bayesian Estimation in Ideal Point Discriminant Analysis
Parallel Session: Bayesian Methods and Applications I; Tuesday, 19 July, 1:30 p.m. --
2:50 p.m.; D1-LP-08
Lixing Zhou*, McGill University, Canada
Yoshio Takane, McGill University, Canada
Ideal Point Discriminant Analysis (IPDA) proposed by Takane et al. is a method for
discriminant analysis based on the idea of unfolding analysis. As such, it is also useful for the
analysis of contingency tables. In this method, cases (subjects) and criterion groups are both
represented as points in a multidimensional Euclidean space. The subject points are assumed
to be linear combinations of predictor variables. The probabilities of subjects belonging to
particular criterion groups are stated as decreasing functions of the distances between them.
The method allows detailed model evaluations as well as spatial representations of subjects
and criterion groups. In this talk, we discuss Bayesian estimation of parameters in IPDA by
the MCMC methods. Examples offered illustrate the usefulness of the Bayesian estimation
and provide test cases for comparison with more traditional estimation methods.
A Two-Step Approach for Bayesian Propensity Score Analysis
Parallel Session: Bayesian Methods and Applications I; Tuesday, 19 July, 1:30 p.m. --
2:50 p.m.; D1-LP-08
David Kaplan*, University of Wisconsin-Madison, USA
Jianshen Chen, University of Wisconsin-Madison, USA

The 76th Annual and the 17th International Meeting of the Psychometric Society Page 155
This paper presents a review and comparison of traditional and Bayesian approaches
to propensity score analysis as a means of estimating causal effects in observational
studies. Traditional approaches examined in this paper include propensity score
weighting, optimal matching, and subclassification. The Bayesian approach can
explicitly encode prior knowledge through the specification of the prior distribution,
and thus naturally incorporates uncertainty in the propensity score equation. Two
simulation studies are presented to elaborate the proposed two-step Bayesian propensity score
approach. Results of the simulation studies reveal that greater precision in the propensity
score equation yields better recovery of the frequentist-based causal effect. A small
advantage is shown for the Bayesian approach in small samples. Results also reveal that
greater precision around the wrong causal effect can lead to seriously distorted results.
However, greater precision around the correct causal parameter yields quite good results,
with slight improvement seen with greater precision in the propensity score equation.
Consistent with Bayesian theory, the case study reveals that credible intervals are wider than
the frequentist con fidence intervals when priors are non-informative.
Comparison of Simple Mediation Analysis: Distribution of the Product, Bootstrap and
MCMC Method
Parallel Session: Bayesian Methods and Applications I; Tuesday, 19 July, 1:30 p.m. --
2:50 p.m.; D1-LP-08
Jie Fang*, South China Normal University, China
Min-Qiang Zhang , South China Normal University, China
Recent researches on test mediation effect reveal that distribution of product method (M
method) and bootstrap outperform the traditional Z test. Yuan and Mackinnon (2009)
proposed Bayesian method (Markov chain Monte Carlo, MCMC) to analyze mediation effect,
and then they evaluated the performance of MCMC and M method by simulation study. The
purpose of this study is to compare the performance of M method, percentile bootstrap,
bias-corrected percentile bootstrap, MCMC with normal prior (MCMC NOR), and MCMC
with noninformative prior (MCMC NIN) respectively. The results indicate that (1) the mean
square error of MCMC NOR is smaller than other methods; (2) MCMC NOR method has
greater power than others; (3) all these methods have minimal bias. Only when small sample
(N=25) is taken, the bias of MCMC NOR is minimum; (4) Compared to other methods, the
95% confidence interval coverage rate of MCMC NOR, which is larger than 95%, achieves
the maximum. The MCMC NOR method has greater biased confidence interval than other
methods; The 95% confidence interval coverage rate of zero mediation effect is larger than
that of nonzero; (5) MCMC NOR has the lowest rate of type 1 error, which is much less than

The 76th Annual and the 17th International Meeting of the Psychometric Society Page 156
the nominal values of 0.05 except in large sample (N=1000); (6) The performance of MCMC
NIN is very close to that of M method and bootstrap in all aspects.
Simulation Study on the Use of Hierarchical Bayesian Modeling in Expert Judgment for
School Based Assessment (SBA) Moderation
Parallel Session: Bayesian Methods and Applications I; Tuesday, 19 July, 1:30 p.m. --
2:50 p.m.; D1-LP-08
Tze-ho Fung*, Hong Kong Examinations and Assessment Authority, Hong Kong
Expert judgment is one of the common methods that could be employed for SBA moderation
of a subject. A representative sample of student works is obtained from each school, which
will then be re-assessed by experienced independent assessors. The average score of the
re-assessed student works could be used to reflect the school performance level on SBA. Due
to a number of reasons, only few samples could be obtained from a school for re-assessment;
while each school may have many candidates. On the other hand, a large number of schools
could be involved. To improve the assessment accuracy on SBA performance level of schools,
one of the common statistical techniques is to share information across different schools by
establishing a hierarchical Bayesian model.
In 1955, Charles Stein shocked the statistical world with his proofs that MLE (i.e., simple
averages) was no good under a setting, where k different groups’ means are to be estimated
using values sampled respectively from each of them. An estimator, known as James–Stein
estimator can be shown to outperform the MLE by borrowing information across different
groups. Following the same line of thought, estimates based on hierarchical Bayesian
modeling are fully developed later.
In this paper, we conduct a simulation study according to the empirical summary statistics on
SBA performance of schools in order to gauge the actual benefits (in terms of error reduction)
by using hierarchical Bayesian modeling. The findings of the simulation study are
encouraging that the total squared error, on average, is reduced by 30% when comparing the
Bayesian estimates with the direct use of simple averages of re-assessed scores.
Fitting Mixed Multi-Dimensional Beta Distribution To Scored Data
Parallel Session: Multivariate Data Analysis II; Tuesday, 19 July, 1:30 p.m. -- 2:50 p.m.;
D2-LP-08
Tomoya Okubo*, The National Center for University Entrance Examinations, Japan
Shin-ichi Mayekawa, Tokyo Institute of Technology, Japan
In this presentation, we will describe the development of a distribution named mixed
multi-dimensional beta distribution. In addition, we will present a maximum-likelihood

The 76th Annual and the 17th International Meeting of the Psychometric Society Page 157
solution that can be used to fit the distribution to scored data, and will apply it to actual data.
In classical test theory, the scores of test takers are distributed from 0 to full score. When we
analyze the distribution of the scores to identify its features, we often fit a probability
function to the scores to understand the distribution of the scores well. Generally, beta
distribution is employed for such a fitting because beta distribution ranges from 0 to 1. It is
suitable to apply beta distribution to scored data because such data are usually distributed
from 0 to full score. The Dirichlet distribution is considered as a form of multi-dimensional
beta distribution; however, it cannot calculate the correlation coefficient between two
variables because it has an open standard (K−1)-simplex structure. Therefore, we will
introduce a multi-dimensional extension of the beta distribution that is different from the
Dirichlet distribution; the domain of the proposed distribution is 0 =< x =< 1 and 0 =< y =< 1,
whereas that of the Dirichlet distribution is 0 =< x + y =< 1. In addition, we will extend the
distribution to a finite mixture model. Then, we will present a maximum likelihood solution
that can be used to fit the distribution to scored data.
Simple Slops are Not as Simple as You Think
Parallel Session: Multivariate Data Analysis II; Tuesday, 19 July, 1:30 p.m. -- 2:50 p.m.;
D2-LP-08
Xidan Chen*, University of North Carolina at Greensboro, USA
Douglas Levine, University of North Carolina at Greensboro, USA
Thousands of studies have used the simple slope methodology to evaluate moderator or
interaction effects in multiple linear regression models but there is a serious problem with the
methodology as described in the quantitative literature and as used by researchers. Typically
simple slope analysis proceeds by testing the slope of the predictor on the outcome at
different values of the moderator (usually one standard deviation below and one SD above its
mean). In usual practice, the derivation of the variance of the simple slopes {v(ss)} assumes,
that the conditional value of moderator is fixed. However, adopting the convention of
choosing the conditional value of moderator at one SD below and one SD above its mean,
indicates the moderator is actually a random variable. Consequently the usual equation for
v(ss) is technically inappropriate when z is a random variable. Because psychologists
routinely use this variance estimator, we ask the question, “Is the bias associated with this
estimator small?” In other words, does the inappropriate use of usual v(ss) result in variances
that are much smaller than would be obtained had the appropriate estimator been applied?
Using Monte Carlo simulations we evaluated the variance of the simple slope under a variety
of conditions. We show that the usual standard error used in post hoc probing for interaction
effect is a biased estimator of the population standard deviation when moderator is a random
The 76th Annual and the 17th International Meeting of the Psychometric Society Page 158
variable. We also demonstrate under what circumstances the usual practice yields an “almost”
unbiased estimator.
Estimates of Sparse Data Variance Components in the Generalizability Theory
Framework
Parallel Session: Multivariate Data Analysis II; Tuesday, 19 July, 1:30 p.m. -- 2:50 p.m.;
D2-LP-08
Xiaolan Tan*, South China Normal University, China
Min-Qiang Zhang, South China Normal University, China
Missing data are easily find in psychological surveys and experiments. For example, in
performance assessment, a certain group of raters rated a certain group of examinees. By this
token, the data from performance assessment compose a sparse data matrix. Researchers are
always concerned about how to make good use of the observed data. Brennan(2001) provided
the estimating formulas of p×i design of sparse data. But in practice, there are always more
than one factor which effect the experiment. This article provided the estimating formulas of
p×i×r design of sparse data, which are on the basis of the estimating formulas of p×i design
of sparse data provided by Brennan(2001). This article also used matlab7.0 to simulate data
which were usually encountered in examination, then used GT theory to estimate variance
componence. We found that: These formulas could provided a good estimation of variance
components. The estimated variance compoences approach to set values. The accury rates of
item and rater were highest. The accury rates of interaction of student and item was low. The
maximum bias of interaction could reach 1.5. The number of items had the most important
effect on the estimation. The number of item incresed only a littlle, the accuracy rate would
increased by a big margin. These formulas could provided a good estimation when the
amount of item was moderate. We also found that these formulas could used in either small
or large amount of data.
Comparing Methods to Evaluate Predictor Importance in Lexicographical Models
Parallel Session: Multivariate Data Analysis II; Tuesday, 19 July, 1:30 p.m. -- 2:50 p.m.;
D2-LP-08
Razia Azen, University of Wisconsin - Milwaukee, USA
Shuwen Tang*, University of Wisconsin - Milwaukee, USA
David Budescu, Fordham University, USA
Lexicographical models are a class of non-compensatory models that are often invoked in
multi-attribute decision problems. The decision maker's choice or rating (Y) is based on the
sequential processing of a series of ordered predictors (X1 > X2 > ... > Xp) and a set of
The 76th Annual and the 17th International Meeting of the Psychometric Society Page 159
corresponding thresholds. For example, if a case is above the threshold on the most salient
criterion (X1), Y is assigned the highest possible value without considering all other
predictors. If the case is below the threshold on X1 the process moves on to X2, and if the
case is above the threshold on X2 then Y is assigned its second highest value. In general, the
decision process continues until a predictor is encountered for which a case achieves the
threshold, and if no predictor reaches the threshold then Y is assigned its lowest value. We
simulate a lexicographical model with a known ordering of predictor variables (manipulating
the values of the variances of, and correlations among, these variables), analyze the results
using multiple regression, and compare the ability of several measures of predictor
importance to recover the original rank ordering of the predictors. Preliminary results suggest
that in some circumstances dominance analysis (Azen & Budescu, 2003) or relative weights
measures (Johnson, 2000) may be superior to more traditional measures (e.g., the bivariate
correlation, the regression coefficient, or the product of these two) in recovering the order of
importance. Results will provide some guidelines on the utility of various relative importance
measures under different conditions.

The 76th Annual and the 17th International Meeting of the Psychometric Society Page 160
Proposal of Evaluation Model of Teaching, Integrating Difference in Importance of
Criteria and Various Student Ratings
Parallel Session: Classical Test Theory - Rater Effects Issue; Tuesday, 19 July, 1:30
p.m. -- 2:50 p.m.; D2-LP-09
Kazuya Ikehara*, Waseda University, Japan
Hideki Toyoda, Waseda University, Japan
Student rating is widely administered as one of useful ways to improve teaching. However
there have been some negative comments from teacher, we need to consider the student’
and teacher’ opinion in order to evaluate the teacher’ performances from several points of
view. In addition, we should take into account the fact that rating scale method widely used
in student rating is susceptible to the effect of response bias. Furthermore we should
consider each student evaluates different courses.
We propose student evaluation model which integrate student’ and teacher’ opinion, by
extending Group AHP method which is insusceptible to the effect of response bias. Using
AHP method, we could consider difference in importance of criteria between student and
teacher. We also develop an improved model which can be applied in situation where each
student evaluates different courses. Results of our analysis showed that there was difference
in importance of criteria between student and teacher, but there was a little difference in
comprehensive evaluation.
The Effect of the Rater Replacement Procedure on the Measurement Error of Ratings
Parallel Session: Classical Test Theory - Rater Effects Issue; Tuesday, 19 July, 1:30
p.m. -- 2:50 p.m.; D2-LP-09
Yoav Cohen*, National Institute for Testing & Evaluation, Israel
It is a common practice in large assessment programs to score work samples by employing
two independent raters. It is known that under the assumptions of classical test theory, by
averaging the ratings given by two independent raters, the variance of the error of
measurement is markedly reduced. In addition to using double-rating, some testing
programs, especially in the context of high stakes testing, employ additional quality control
measures to ensure the reliability of the scores.
One of the quality assurance measures is Rater Replacement Procedure, by which the two
ratings which are given to each work sample (essays) are compared, and if they differ by
more than a given criterion, a third reader is asked to rate the essay. The third rating is then
combined with one of the original ratings, most typically the one which is closest to it. This
procedure ensures that the overall inter-rater correlation, which is a common index for
inter-rater agreement, is kept above a set criterion; however, contrary to common beliefs, it

The 76th Annual and the 17th International Meeting of the Psychometric Society Page 161
is shown in this work that the measurement error of the average ratings is not necessarily
reduced by the replacement procedure, and in some cases it is even increased by a
substantial amount.
In this paper the replacement procedure is investigated and shown to be robust under
different assumption about the shape of the error distribution. Alternative replacement
procedures are suggested and the implications for practical application are discussed.
Should first impressions count? Examining Scoring Performance of Raters Who
Initially Failed Certification
Parallel Session: Classical Test Theory - Rater Effects Issue; Tuesday, 19 July, 1:30
p.m. -- 2:50 p.m.; D2-LP-09
Kathryn Ricker-Pedley*, Educational Testing Service, USA
Certification is a test prospective raters take to qualify to be scheduled to score performance
assessments (essays, speech, artwork, teaching performance, etc.). This initial procedure
generally involves self-training on a typical prompt and scoring guide, then scoring a set of
20-50 responses. The rater’s assigned score is compared to the pre-determined correct score
for each prompt to gauge their scoring accuracy. Usually, the pass/fail criterion is a
minimum exact/maximum discrepant agreement. Raters are often allowed two attempts at
certification to pass and be included in the rater pool.
Anecdotally, raters who require two certification attempts are weaker raters, are more likely
to fail daily calibration (therefore not allowed to score) (Ricker-Pedley, 2011), and require
more monitoring/support during scoring than raters who certify on the first try. From a
logistical and financial prospective, these factors make scoring less efficient and more
expensive (as raters are paid for any time spent training/calibrating, or scoring).
Are raters who take two attempts to certify generally weaker raters? Data from a large,
high-stakes testing program (n=160 new raters) will be examined to see if there are
differences between raters who certified on a first attempt versus a second attempt at
certification with respect to calibration and validity scoring accuracy, inter-rater agreement,
as well as measures of productivity. The implication for large-scale testing programs,
particularly those who must recruit and retain a large pool of certified raters, is potentially
significant cost-savings, or reassurance that the initial investment in allowing a second
attempt at certification is worthwhile.
Investigating the Agreement Among Statistical Measures of Inter-Rater Agreement:
Simulations and Some Empirical Applications
Parallel Session: Classical Test Theory - Rater Effects Issue; Tuesday, 19 July, 1:30
p.m. -- 2:50 p.m.; D2-LP-09
The 76th Annual and the 17th International Meeting of the Psychometric Society Page 162
Guangming Ling *, Educational Testing Service, USA
Inter-rater agreement is a measurement property that is highly desirable but difficult to
realize in psychological and educational assessment with constructed response items. Many
statistical measures are used to quantify the rating agreement between two sets of human
raters (double-score design), including the proportion of exact agreement or joint
probability of agreement (Fleiss, et al, 2003), Cohen’s Kappa and weighted Kappa (Cohen,
1960, 1968; Fleiss, et al., 1969; Shoukri , 2010), intraclass correlation (Shrout & Fleiss,
1979), root mean square deviation or RMSD (Ling, et al., 2009), and the Pearson
product-moment correlation or polychoric correlation. However, the inferences that could
be made from these measures don’t always agree with each other (Gwet, 2002; Ling, et al.,
2009; Von Eye & Mun, 2004), which could lead to inconsistent or sometimes contradictory
interpretations.
This study is aimed to compare these five categories of statistics using both simulated and
empirical scoring data of construct responses. Dirichlet distribution (Broemeling, 2009) will
used to simulate rating data (two-way contingency table) with two to seven score levels
separately. To make the simulation more realistic, a set of conditions with fixed proportions
of exact agreement and adjacent agreement will be manipulated. The five measures will be
computed and compared based on each of these simulated data sets and the real data sets.
Preliminary results suggest that the common practical interpretations of the Cohen’s Kappa,
correlation, and the joint probability of agreement could be misleading, while the RMSD
measure is more objective and more stable.
The Formation and Control of Neutralization in Subjective Rating
Parallel Session: Classical Test Theory - Rater Effects Issue; Tuesday, 19 July, 1:30
p.m. -- 2:50 p.m.; D2-LP-09
Bo Wang*, the Chinese University of Hong Kong, Hong Kong
In recent years, the widely used online scoring system provided an easy control over the
errors occurring in the subjective rating procedure. However, the results of an analysis of
one large-scale personnel selection writing test shows that the score distribution of
examinees presents an obvious trend of neutralization. The multivariate generalizability
analysis of the random sample data testifies the fact that the raters give too conservative
scores in the course of maintaining the scoring consistency. It is also found that the
conservative scoring is an ‘acquisition’ process. Because the consistency is generated from
the conservativeness, the consistency among raters is overrated.
The reason for this neutralization lies in the scoring method, raters’ cognitive process, the
irrational error threshold settings for controlling the scoring consistency, and the
The 76th Annual and the 17th International Meeting of the Psychometric Society Page 163
inappropriate monitoring indices. In order to regulate this neutralization, (1) the benchmark
scoring paper can be inserted to monitor the rating processes and errors, or (2) a multistage
rating augmentation pattern can be used to control the process, which can decrease the trend
of neutralization to some extent, and on condition that the consistency of scoring is
guaranteed, the accuracy of scoring is further improved. Both methods are proved effective
by empirical studies. More monitoring indices are developed and the optimized
combinations of those indices are proposed.
A Method for Detecting Differential Item Functioning Using the Bayes Factor
Parallel Session: Differential Item Functioning - New Strategies; Tuesday, 19 July,
1:30 p.m. -- 2:50 p.m.; D2-LP-10
YoungKoung Kim*, The College Board, USA
Matthew Johnson, Columbia University, USA
In the absence of a single gold standard procedure, many studies suggest the use of multiple
methods to investigate differential item functioning (DIF). The Bayesian approach has
become popular as the complement of traditional DIF detection techniques. The major
drawbacks of the Bayesian approach are either too computationally intensive to detect DIF
for all test items in one model, or involve multiple steps. As an alternative method of
assessing DIF, which can resolve these drawbacks, the present study provides a simple, yet,
comprehensive method to assess DIF within a Bayesian framework that can easily be used
with other traditional methods. The study proposes a method of assessing DIF by using the
Bayes Factor (BF), which has been used as a Bayesian model selection technique on the
basis of the posterior probability of the model given the data. In particular, a model
indicator variable that represents the BF is included as a model parameter in the Markov
Chain Monte Carlo sampling. Using simulations, the proposed method is compared with
traditional DIF detection methods. In addition, the proposed method is applied to data from
a large-scale assessment.
Iterative MIMIC for DIF detection in Polytomous Items with Small Samples and
Many DIF Items
Parallel Session: Differential Item Functioning - New Strategies; Tuesday, 19 July,
1:30 p.m. -- 2:50 p.m.; D2-LP-10
Shuyan Sun*, University of Cincinnati, USA
Multiple indicators multiple causes (MIMIC) confirmatory factor analysis has been used to
detect uniform differential item functioning (DIF) in dichotomous items (e.g., Finch, 2005;
Shih & Wang. 2009; Wang, Shih & Yang, 2009). Recently Wang and Shih (2010) adapted
The 76th Annual and the 17th International Meeting of the Psychometric Society Page 164
MIMIC to detect DIF in polytomous items and proposed an iterative MIMIC method using
DIF-free-then-DIF strategy. The iterative MIMIC first selects a set of DIF-free items as a
pure anchor then assesses DIF in unselected items using the pure anchor. It is a potentially
useful tool for DIF assessment. Wang and Shih (2010) demonstrated its application with
only one replication because the implementation is complicated and no stand-alone software
is available.
This study extended Wang and Shin (2010) by investigating the accuracy of iterative
MIMIC for detecting DIF in polytomous items, especially when sample sizes are small,
unbalanced and the test contains many DIF items. A SAS program that automates SAS/IML
and Mplus was successfully developed to implement iterative MIMIC. It allows easy
application in both real data analysis and Monte Carlo simulation by plugging in data or
simulation parameters. A Monte Carlo simulation with manipulated factors total sample size
(300, 600, 1000), ratio of reference group size and focal group size (1:1, 4:1), percentage of
DIF items (10%, 20%, 40%), examinee ability (both N(0,1), reference N(1,1) vs. focal
N(0,1)), amount of DIF (0.2, 0.6) and test length (10, 30 and 50 items) will be conducted to
assess power and Type I error rate with 500 replications in each condition.
Differential Item Functioning Detection Using Logistic Regression with SIBTEST
Correction and DIF-free-then-DIF strategy
Parallel Session: Differential Item Functioning - New Strategies; Tuesday, 19 July,
1:30 p.m. -- 2:50 p.m.; D2-LP-10
Tien-Hsiang Liu*, National Chung Cheng University, Taiwan
Yeh-Tai Chou, National Chung Cheng University, Taiwan
Ching-Lin Shih, National Sun Yat-Sen University, Taiwan
Logistic Regression (LR) uses raw score as matching variable to match people with similar
ability between groups when detecting differential item functioning (DIF). However, when
there are group differences in ability, people from different groups match on the raw score
are unlikely to match on true ability, which lead to inflated Type I error rates. Simultaneous
item bias test (SIBTEST) procedure implemented a so-called linear regression to adjust
matching true score on matching raw score and found successfully controlled Type I error
inflation due to group ability differences. In this study, adjusted SIBTEST true score was
substituted for raw score in LR procedure to diminish the influence of impact on DIF
detection. Afterward, an iterative LR procedure with SIBTEST correction is proposed to
select a small set of DIF-free items to serve as anchor and its performance was assessed.
It was found the LR and LR-SIB performed almost identically when there were no group
ability differences. Nevertheless, when there was one standard deviation between mean
ability of groups, LR and LR-SIB began to yield an inflated Type I error rate when the test
The 76th Annual and the 17th International Meeting of the Psychometric Society Page 165
contained 30% and 40% DIF items, respectively. The differences of Type I error rate
between these two procedures were increased as the percentage of DIF item increased. In
general, the LR-SIBPA procedure outperformed other two procedures in maintaining
expected Type I error rates around .05 in all conditions.
The Performance of DIF-Free-Then-DIF Strategy in MIMIC method
Parallel Session: Differential Item Functioning - New Strategies; Tuesday, 19 July,
1:30 p.m. -- 2:50 p.m.; D2-LP-10
Chu-Chu Tsai*, National Sun Yat-sen University, Taiwan
Wen Chung Wang, The Hong Kong Institute of Education, Hong Kong
Ching-Lin Shih, National Sun Yat-sen University, Taiwan
To control Type I error rates in assessing differential item functioning, constant item (CI)
method was proposed in literature. The performance of CI method was found highly
correlated to the anchor items. The strategy to select several items as anchor first and then
assessing DIF for other items in the test was called DIF-free-then-DIF strategy (DFTD;
Wang, 2008). It was found the more DIF-free items in the anchor test, the better
performance of DFTD strategy. However, in Wang and Shih (2010), the anchor items were
DIF-free by design. To implement the DFTD strategy into practice, the anchor should be
selected and the performance of DFTD strategy can be better assessed with the selected
anchor.
In this study, the performance of DFTD strategy was assessed in the MIMIC method
through simulation study. Four independent variables were included in this study: sample
size, percentage of DIF items in the test, DIF assessment method, and anchor item selection
method. Our findings and conclusions will be given in details in the presentation.
How Many Anchor Items Should be Selected in DIF-Free-Then-DIF Strategy?
Parallel Session: Differential Item Functioning - New Strategies; Tuesday, 19 July,
1:30 p.m. -- 2:50 p.m.; D2-LP-10
Hsuan-Chih Chang*, National Sun Yat-sen University, Taiwan
Wen Chung Wang, The Hong Kong Institute of Education, Hong Kong
Ching-Lin Shih, National Sun Yat-sen University, Taiwan
To control Type I error rates in assessing differential item functioning, constant item (CI)
method was proposed in literature. The performance of CI method was found highly
correlated to the number of anchor items, and several studies suggested four anchor items
should be used when assessing DIF (Shih & Wang, 2009; Wang & Yeh, 2003). The strategy
The 76th Annual and the 17th International Meeting of the Psychometric Society Page 166
to select several items as anchor first and then assessing DIF for other items in the test was
called DIF-free-then-DIF strategy (Wang, 2008).
However, for short test, especially usually the case for the test with polytomous items, four
anchor items might not be all DIF-free, and therefore the performance of DFTD strategy
method could be fluctuated. In this study, “how many anchor items should be selected in
DFTD strategy for polytomous items” was investigated within MIMIC method through
simulation study. Four independent variables were included in this study: sample size,
percentage of DIF items in the test, anchor item selection method, and number of anchor
items. Our findings and conclusions will be given in details in the presentation.
Multiple imputation and Missing Data
Invited Symposium : Tuesday, 19 July, 4:00 p.m. -- 5:20 p.m., D1-LP-03
A Comparison of Two Multiple Imputation Methods for Categorical Data:
Multivariate Imputation by Chained Equations and Latent Class Imputation
Daniël van der Palm*, Tilburg University, The Netherlands
L. Andries van der Ark, Tilburg University, Netherlands
Jeroen K. Vermunt, Tilburg University, Netherlands
We studied four methods for handling incomplete categorical data in statistical modeling: (1)
maximum likelihood estimation of the statistical model with incomplete data (MLID), (2)
multiple imputation using a loglinear model (LLMI), (3) multiple imputation using a latent
class model (LCMI), (4) and multivariate imputation by chained equations (MICE). Each
method has advantages and disadvantages, and it is unknown which method should be
recommended to practitioners. We reviewed the merits of each method and investigated
their effect on the bias and accuracy of parameter estimates in logistic regression. We found
that LCMI using a latent class model with many latent classes and MICE using predictive
mean matching were the most promising methods for handling incomplete categorical data.
Multiple imputation and (repeated measures) analysis of variance
Joost R. van Ginkel*, Leiden University, The Netherlands
Pieter M. Kroonenberg, Institute of Education and Child Studies, Netherlands
Multiple imputation has become a well-established method for handling missing data. By
estimating the data multiple times several complete versions of the incomplete data set are
created, which are all analyzed by a standard statistical procedure. After analyzing the data
sets, the results of these analyses are pooled into one analysis, taking into account the extra
uncertainty due to the missing data. Strangely enough, no explicit rules for pooling the
The 76th Annual and the 17th International Meeting of the Psychometric Society Page 167
results of (repeated measures) analysis of variance have been defined. However, pooling
rules for analysis of variance may directly be derived from existing rules by using effect
coding of the predictors. The proposed procedure will be explained and illustrated using
empirical data examples.
Some explorations of the local and global measures of missing information
Victoria Savalei*, University of British Columbia, Canada
Fraction of missing information (FMI) is considered useful measure of the impact of
missing data on the quality of estimation. This measure can be global (computed on the
entire model) or local (computed for individual parameters). Mathematically, the local
measures of FMI are one minus the ratio of the asymptotic variances of the parameter under
complete vs. incomplete data, and reflect the relative loss of efficiency. While it has been
recommended that FMI estimates be routinely reported, FMI measures have been studied
very little. Global measures of FMI based on the comparison of the entire information
matrices under complete vs. incomplete data, e.g., the largest fraction of missing
information {Rubin, 1987 #548}, remain almost completely unexplored. This work studies
both the local and the global measures of missing information under a variety of conditions.
Many interesting properties are discovered and summarized. It was found that the local
measures of FMI are extremely model-dependent, even when all models fit to data are
saturated, changing in some cases from 10% to 45% under different parameterizations.
Their usefulness may thus be limited. In contrast, it is shown that the global measures have
the advantage of being invariant to model parameterization. A surprising property of global
measures, however, is their lack of dependence on the covariance structure of the data; they
are primarily functions of the structure of the missing data patterns. Other findings and a
discussion of whether global FMI measures can be useful in describing missing data
concludes the presentation.
Robust Two-Stage Approach Outperforms Robust Full Information Maximum
Likelihood with Incomplete Nonnormal Data
Carl Falk*, University of British Columbia, Canada
Victoria Savalei, University of British Columbia, Netherlands
This talk will report on the research that evaluated a statistically justified two-stage (TS)
approach for fitting SEMs with incomplete nonnormal data. The TS approach first obtains
saturated maximum likelihood (ML) estimates of the population means and covariance
matrix and then uses these saturated estimates in the complete data ML fitting function.
Standard errors and test statistic are then adjusted to reflect uncertainty due to missing data.
The 76th Annual and the 17th International Meeting of the Psychometric Society Page 168
The present work presents an extension of the TS methodology to nonnormal incomplete
data (robust TS) and conducts an empirical evaluation of its performance relative to the
FIML approach with robust standard errors and a scaled chi-square statistic. The results
indicate that the TS and FIML parameter estimates are equal in efficiency, but the TS
approach performs better than FIML when it comes to coverage rates and the performance
of the scaled chi-square across a wide variety of conditions, including different missing data
mechanisms, degrees of nonnormality, number of missing data patterns, percent missing
data, and sample sizes. Its wide implementation and further study are encouraged.
Structured Component Analysis
Invited Symposium : Tuesday, 19 July, 4:00 p.m. -- 5:20 p.m., D1-LP-04
The Generic Subspace Clustering Model
Marieke E immerman*, University of Groningen, Netherlands
Eva Ceulemans, Katholieke Universiteit Leuven, Belgium
Kim De Roover, Katholieke Universiteit Leuven, Belgium
In the case of high-dimensional data, a subspace clustering model can be used to achieve a
proper recovery of the clusters and to obtain an insight into the structure of the variables
relevant to the clustering. In such a model the objects are assigned to mutually exclusive
classes in low dimensional spaces. In this paper, we present the Generic Subspace
Clustering Model. As will be shown, this model encompasses a range of existing (subspace)
clustering techniques as special cases. The specific properties of the model variants will be
discussed. An algorithm for fitting the Generic Subspace Clustering Model is presented and
its performance is evaluated by means of a simulation study. The value of the model for
empirical research is illustrated with data from psychiatric diagnosis research.
Functional Multiple-set Canonical Correlation Analysis
Heungsun Hwang*, McGill University, Canada
Kwanghee Jung, McGill University, Canada
Yoshio Takane, McGill University, Canada
Todd S. Woodward, McGill University, Canada
We propose functional multiple-set canonical correlation analysis for exploring associations
among multiple sets of functions. The proposed method includes functional canonical
correlation analysis as a special case when only two sets of functions are considered. As in
classical multiple-set canonical correlation analysis, computationally, the method solves a
matrix eigen-analysis problem through the adoption of a basis expansion approach to
The 76th Annual and the 17th International Meeting of the Psychometric Society Page 169
approximating data and weight functions. We apply the proposed method to functional
magnetic resonance imaging (fMRI) data to identify networks of neural activity that are
commonly activated across subjects while carrying out a working memory task.
Three Kinds of Hierarchical Relations among PCA, Nonmetric PCA, and Multiple
Correspondence Analysis
Kohei Adachi*, Osaka University, Japan
Takashi Murakami, Osaka University, Japan
A purpose of this paper is to present a three-methods by three-formulations matrix (table)
containing least squares loss functions, where the three methods (i.e., row entities) are PCA
(principal component analysis), NCA (nonmetric PCA), and MCA (multiple
correspondence analysis), whereas the three formulations (column ones) are [1] minimizing
the loss of homogeneity, [2] approximating quantified data by the products of scores and
loadings, and [3] performing correspondence analysis for the data regarded as contingency
tables. The hierarchy PCA < NCA < MCA in Formulation [1] and that of PCA < NCA in [2]
have already been known, where X < Y expresses a method X being a constrained version
of Y, though it has not yet been known that MCA can be formulated as [2]. We thus prove
this and show the hierarchy PCA < NCA < MCA in Formulation [2]. Further, to complete
the above 3 x 3 matrix, we formulate PCA and NCA as [3], though it may not be useful for
applications. It is also discussed that properties of minimum loss function values of MCA
are different among Formulations [1], [2], and [3].
An Equal Components Result for Indscal with Orthogonal Components
Jos M.F. ten Berge*, University of Groningen, Netherlands
Mohammed Bennani, University of Groningen, Netherlands
Jorge N. Tendeiro, University of Groningen, Netherlands
The use of Candecomp on scalar product matrices in the context of Indscal is based on the
assumption that, due to the symmetry of the matrices involved, two components matrices
will become equal when Candecomp converges. This paper considers Indort, which is
Candecomp applied to symmetric matrices with an orthonormality constraint on the
component matrices. When the data matrices are positive semidefinite, or have become
positive semidefinite due to double centering, and the saliences are nonnegative -by chance
or by constraint-, the component matrices resulting from Indort are shown to be equal under
weak nonsingularity assumptions. Because Indort is free from so-called degeneracy
problems, it is a highly attractive alternative to Candecomp in the Indscal context.
The 76th Annual and the 17th International Meeting of the Psychometric Society Page 170
Application of Mixture IRT to Multiple Strategy CDM Analysis
Parallel Session: Cognitive Diagnosis Modeling – Applications; Tuesday, 19 July, 4:00
p.m. -- 5:20 p.m.; D1-LP-06
Young-Sun Lee*, Columbia University, USA
Yoon Soo Park, Columbia University, USA
When solving mathematics problems, students may select among several competing
strategies (Mislevy, 1996; de la Torre & Douglas, 2008). Although it would be favorable to
know which strategy students applied, researchers often only see students’ item responses
and not their strategies (von Davier, 2010). If instructors can identify which strategy a
student used, it can be used to provide better diagnostic information to help students
improve. This study aims to classify students according to their strategy usage and to
identify whether a student classified to strategy group was able to master specific skills
required to solve the problems, thereby providing strategy-specific diagnostic information.
This study combines the approach taken in both mixture item response theory (IRT) and
cognitive diagnostic models (CDMs). The fraction subtraction data (Tatsuoka, 1987) was
used to group examinees into two latent subgroups using a two class mixture 3PL IRT
model; this was done to divide the students by the strategy or approach they used to solve
the problems. Subsequently, based on different strategies, the DINA model was applied to
identify which strategy was preferred among the two latent subgroups and examined to
determine skill masteries of students. This study demonstrates a method to link mixture IRT
and CDM that are grounded in separate applications. Further studies on this subject can lead
to a greater understanding of how students apply multiple strategies and the type of
feedback that can be more tailored to their strategy usage.
Cognitive Diagnostic Assessment on Primary School Students’ Mathematics Word
Problem Solving
Parallel Session: Cognitive Diagnosis Modeling – Applications; Tuesday, 19 July, 4:00
p.m. -- 5:20 p.m.; D1-LP-06
Chunhua Kang*, Beijing Normal University Zhejiang normal university, China
Tao Xin, Beijing Normal University, China
In the study of cognitive diagnostic assessment. cognitive model should be based on the
Priori analysis of cognitive theory, and the cognitive diagnostic test should be a top-down
design based on the attribute hierarchy. However, the primary limitations of most cognitive
diagnostic assessment is that the cognitive model and the Q matrix is post-hoc, that is, A
post-hoc approach is limited because the attributes must be associated with existing test
items procducing an item-based hierarchy rather than an attribute-based hierarchy. In this
The 76th Annual and the 17th International Meeting of the Psychometric Society Page 171
study, we took primary school mathematics word problems as an example, first, we
identified the attributes and their hierarchy through cognitive analysis , then the cognitive
model was validated by having a sample of students think aloud as they solved each item.
Second, Based on the cognitive model, we developed a cognitive diagnostic test of primary
school mathematics word problems, then applied Grade Rule Space model to a sample of
1240 fifth-grade students to assess their cognitive structure. The results suggested that the
cognitive attribute and model were property. The adequacy of the Q matrix was assessed by
predicting the item difficulty by the Q matrix, The squared multiple correlation is .811, The
path analysis of the attribute probabilities showed that the GFI and AGFI were .986
and .974. Cognitive diagnostic assessment also had a good internal validity, the overall
classification rate was 99.6%, IM statistics also showed that the difference between the
master and non-master on the average score of all items have achieved a significant level.
An Innovative Class-Based Cognitive Diagnostic BW Model and Its Applications
Parallel Session: Cognitive Diagnosis Modeling – Applications; Tuesday, 19 July, 4:00
p.m. -- 5:20 p.m.; D1-LP-06
Tsai-Wei Huang*, National Chiayi University, Taiwan
Recently teacher-made tests have been paid more attentions because of their function of
formative assessment on students’ learning. However, due to reasons of complex estimation
processes or big sample size requirements, most of teachers are not acquainted with or fear
to use modern cognitive diagnostic models. Based on the S-P chart rationales, a class-based
cognitive diagnostic BW model can easily be understood by teachers in classroom. Four
kinds of response indices provided by the BW model are the capable index (CW), the
inefficient index (MB), the guessing index (B), and the careless index (W). Integrating
indices from ITEM and PERSON aspects, a person-item probability model, in which the
probability of a student answered an item correctly, can be estimated. Moreover, based on a
Q matrix proposed by teachers, a person-concept mastery probability matrix can be made.
In this study, a teacher-made test on the unit of fraction and decimal that contained 22 items
on five concepts was taken by 32 students in an elementary mathematics class. Results
showed the probabilities of students answering items correctly might decline along with
person capability decreased and along with item difficulty increased. All ICCs plotted by
the differences between students’ abilities and item difficulty could reflect the levels of item
discrimination. The concept of equivalent fraction was most mastered by students, but the
concept of unit transformation least. Through a line-bar plot of the four indices, teachers can
also diagnose students’ performances and response habits, especially for guess and
carelessness.
The 76th Annual and the 17th International Meeting of the Psychometric Society Page 172
Application of Rule Space Model in Intelligence Tests
Parallel Session: Cognitive Diagnosis Modeling – Applications; Tuesday, 19 July, 4:00
p.m. -- 5:20 p.m.; D1-LP-06
Min-Qiang Zhang*, South China Normal University, China
Xiao-Zhu Jian, South China Normal University Jinggangshan University, China
The cognitive diagnosis theory diagnoses the cognitive structure and cognitive processes of
test-takers. Nowadays cognitive diagnosis models have been developed. Rule Space Model
(RSM) proposed by Tatsuoka, is the important one of the models. With statistical pattern
recognition and classification techniques, RSM infers test-takers’ response rules according
to their actual response patterns,and classifies them into different attribute-mastery
patterns, which describe the knowledge structure respectively. Raven’s Standard
Progressive Matrices is one of the excellent intelligence tests. Basing on the attributes of
R.SPM, this study puts forward a hypothesis that R.SPM included a total of 10 attributes,
and those belong to the same series are conjunctive relations. The author uses RSM to
diagnosis more than 800 test-takers, ultimately get 76 ideal response patterns, which
category these test-takers into 76 typical response patterns. It showed that 78.54 percent
test-takers’ cognitive status were mainly concentrated in the seven attributes master model.
Test-takers were poor at combination of transitions, combination of Latin square,
combination of addition and subtraction. 24.70% of the subjects mastered the first 9
properties, except the combination of addition and subtraction, so the subjects are lack in
the ability for abstract though. 23.86% subjects mastered 8 property, except the combination
of Latin square and addition and combination of addition and subtraction, so the subjects
are bad at thinking in images. Diagnosis with the rules-space model can obtain qualitative
differences of subjects refer to Cognitive status objectively. Educators can make
quantitative evaluation more objectively, and also take appropriate remedial measures.
Evaluating the Quality of A Cognitive Model in Mathematics Using the Hierarchical
Attribute Method
Parallel Session: Cognitive Diagnosis Modeling – Applications; Tuesday, 19 July, 4:00
p.m. -- 5:20 p.m.; D1-LP-06
Cecilia, B. Alves*, University of Alberta, Canada
Mark, J. Gierl, University of Alberta, Canada
Hollis Lai, University of Alberta, Canada
Cognitive diagnostic assessment (CDA) has been recognized as an important way to
improve the quality and the validity of score interpretation, and it is also one of the great
challenges for the field of measurement and evaluation (Pellegrino, Chudosky, & Glaser,
The 76th Annual and the 17th International Meeting of the Psychometric Society Page 173
2001). CDA is an approach where the psychology of learning and statistical models are
gathered together for the purpose of making inferences about students’ specific knowledge
structures and processing skills. By establishing a profile of students’ cognitive strengths
and weaknesses, the instructor has the means to remediate students’ unique needs. This
study proposes the investigation of the quality of a cognitive model on a diagnostic
assessment program in mathematics. Our study is among the first applications of a cognitive
diagnostic model to non-retrofitted data from an operational testing program. Using the
Hierarchy Consistency Index (HCI), the fit of the cognitive models were evaluated using
students’ response data collected over the past two years. The HCI assesses the degree to
which an observed examinee response pattern is consistent with the attribute hierarchy.
Attribute reliabilities were also used to evaluate the consistency of the decisions about the
examinees’ attribute mastery. Results suggest that these procedures provide useful
information about the quality of the cognitive model. The key findings and the implications
from the present study, as well as the directions for further research will be presented in the
paper.
Towards Cognitive Response Theory for Today's CAT Practice
Parallel Session: Item Response Theory - Applications in Ability Measures; Tuesday,
19 July, 4:00 p.m. -- 5:20 p.m.; D1-LP-07
Quan Zhang*, Jiaxing University, China
This paper, based on the author’s decades’ research, puts forward proposals incorporated
with principles regarding cognitive science with CAT. In the author’s opinion, today’s
technology of computer programming as well as multiple media making are highly
advanced. This makes it feasible for the current practice of CAT to be reshaped under
Cognitive Response Theory. What characterizes such a cognitive-based CAT practice is
inherent in two aspects: the first is that jumbled word (JW) test form, based on the
declarative knowledge and procedural knowledge, is used as a promising alternative for
multiple choice (MC) question format; the second is that ‘adaptive’ is achieved not by
changing test item difficulties but by providing hints (if required by test takers). The
significance here is that language point being tested keeps consistent, while in the case of
changing item difficulty, the language point to be tested becomes inconsistent, because the
next item to be presented is randomly displayed. Once this is done, it will bring
computer-based language testing into an innovative change which will dramatically alter the
face of the ongoing practice of computer-based language testing. The research presented
here calls for feedback from a larger community of experts of language testing and
psychometricians and is held as a good basis for further research improvement towards
computerized cognitive testing. The author believes that cognitive-based CAT can achieve
The 76th Annual and the 17th International Meeting of the Psychometric Society Page 174
and monitor reliability of diagnostic inferences and the relevant diagnostic feedback can
also be communicated to language learners significantly better than the on-going practice of
CAT.
A Paradox in the Study of the Benefits of Test-Item Review
Parallel Session: Item Response Theory - Applications in Ability Measures; Tuesday,
19 July, 4:00 p.m. -- 5:20 p.m.; D1-LP-07
Wim J. van der Linden*, CTB/McGraw-Hill, USA
Minjeong Jeon, University of California, Berkeley, USA
Steve Ferrara, CTB/McGraw-Hill, USA
According to a popular belief, test takers should trust their initial instinct and retain their
initial responses when they have the opportunity to review test items. More than 80 years of
empirical research on item review, however, has contradicted this belief and shown minor
but consistently positive score gains for test takers who changed answers they found to be
incorrect during review. This study reanalyzed the problem of the benefits of answer
changes using IRT modeling of the probability of an answer change as a function of the test
taker's ability level and the properties of items. Our empirical results support the popular
belief and reveal substantial losses due to changing initial responses for all ability levels.
Both the contradiction of the earlier research and support of the popular belief are explained
as a manifestation of Simpson's paradox in statistics.
Comparing IRT and CCT by Examining Their Estimates for Competency
Parallel Session: Item Response Theory - Applications in Ability Measures; Tuesday,
19 July, 4:00 p.m. -- 5:20 p.m.; D1-LP-07
Lun Mo*, FWISD and The University of Memphis, USA
Xiangen Hu, The University of Memphis, USA
Individuals’ competency and item’s characteristics (difficulty and discrimination) can be
estimated in Item Response Theory (IRT). Comparatively, individuals’ competency and
items’ consensus answers can be estimated in Cultural Consensus Theory (CCT). The CCT
is particularly useful when there is no answer key for the question and a constraint on
sample size. Another concern is that data structure in these two models is different: IRT
aggregates responses across items, and CCT aggregates responses across people. To
demonstrate how CCT can be developed as a new measurement tool in educational and
psychological measurement practices, a school climate survey is used to compare the
estimates for individual competency between these two models.
The 76th Annual and the 17th International Meeting of the Psychometric Society Page 175
Comparing Test Difficulties of NCT English Examiations using Non-linear Factor
Analysis
Parallel Session: Item Response Theory - Applications in Ability Measures; Tuesday,
19 July, 4:00 p.m. -- 5:20 p.m.; D1-LP-07
Tatsuo Otsu*, The NCUEE and JST CREST, Japan
Takamitsu Hashimoto, The NCUEE and JST CREST, Japan
The authors compared difficulties of English examinations of the NCT, a nationwide
university entrance examinations conducted by the NCUEE in Japan, in consecutive two
years. They used a nonlinear-factor analysis (NLFA) model, which was adapted to missing
values under MAR (Missing At Random) condition, for an analysis of the ``monitor
experiments'' of the NCT. The participants of the experiment were freshmen of national
universities in Tokyo Metropolis. The authors designed an English supplemental
examination of NCT to be an anchor variable. And they compared two usual examinations
of English. Participants of the experiments achieved rather higher scores than participants of
the NCT on average. Although the marginal distributions were different from each other,
the proposed method generated good estimations on relative difficulties of the examinations,
where information of common participant was not available. Although NLFA generated
rather good estimates, it could not surpass estimates based on 2PL IRT, where responses of
test items were used for estimation. Biases of NLFA estimates were larger in upper and
lower bounds of scores compared to IRT estimates.
Examining Gender Differences in Mathematics Performance Across Grades,
Subscales, Racial/Ethnic Groups and Achievement Spectrum
Parallel Session: Item Response Theory - Applications in Ability Measures; Tuesday,
19 July, 4:00 p.m. -- 5:20 p.m.; D1-LP-07
Yvette Beersingh*, Morgan State University, USA
The purpose of this research was to evaluate the presence and magnitude of gender
differences in mathematics performance on the National Assessment of Educational
Progress (NAEP). Researcher suggests that girls’ performance continues to be lower than
that of boys even though the gap is closing. Boys are more likely to select advanced
placement (AP) mathematics courses than girls. These disparities can have implications for
the continued underrepresentation of women in careers related to science, technology,
engineering and mathematics (STEM). The current study compared gender difference in
mathematics performance on the 2005 and 2009 Restricted Use National Assessment of
Educational Progress (NAEP). Subjects were 168,000 students in grade four, 161,000 in
grade eight and 21,000 in grade 12. Males and females were disaggregated by grade, NAEP
The 76th Annual and the 17th International Meeting of the Psychometric Society Page 176
subscales and race/ethnicity. Four analytic approaches were applied at each grade level and
across subscales: significance test, effect size, comparison of percentile ranks to the national
public school score distribution, and comparison of mean scores across the achievement
spectrum. Results indicate that gender gaps favored males in four of the five subscales in
grades four and eight. When disaggregated, gender gaps were reversed for Blacks in two
subscales in grade four and three subscales in grade eight. The findings from this study
indicate that gender gaps are small. Further investigation of the gaps and contributing
factors is warranted.
The Effect of Informative Priors on Estimating the Variability of Estimated Variance
Components for MCMC procedure
Parallel Session: Bayesian Methods and Applications II; Tuesday, 19 July, 4:00 p.m. --
5:20 p.m.; D1-LP-08
Guangming Li *, South China Normal University, China
Min-Qiang Zhang , South China Normal University, China
MCMC procedure is a mobile Monte Carlo method and can be used to estimate variance
components which are constrained by sampling. However, these estimates are, like any
statistic, subject to sampling variability. They are likely to vary from one sample to another.
Therefore, estimating the variability of estimated variance components needs to be further
explored in order to ensure the dependability of estimated variance components. The study
adopts Monte Carlo data simulation technique to explore the effect of informative priors on
estimating the variability of estimated variance components for MCMC procedure based on
normal distribution data. This study shows that MCMC with informative priors(MCMC inf)
is more precise than MCMC with non-informative priors(MCMC non-inf) for standare error
of estimated variance components, but when item sample is bigger, the trend decrease. This
study also shows that MCMC inf is equivalent to MCMC non-inf for confidence interval of
estimated variance components, but when item sample is bigger, the trend is still same.
A Bayesian Person-Fit Evaluation For Polytomous Response Data
Parallel Session: Bayesian Methods and Applications II; Tuesday, 19 July, 4:00 p.m. --
5:20 p.m.; D1-LP-08
Sebastien Beland*, Universite du Quebec a Montreal, Canada
Herbert Hoijtink, Utrecht University, Netherlands
Gilles Raiche, Universite du Quebec a Montreal, Canada
David Magis, Université de Liège, Belgium
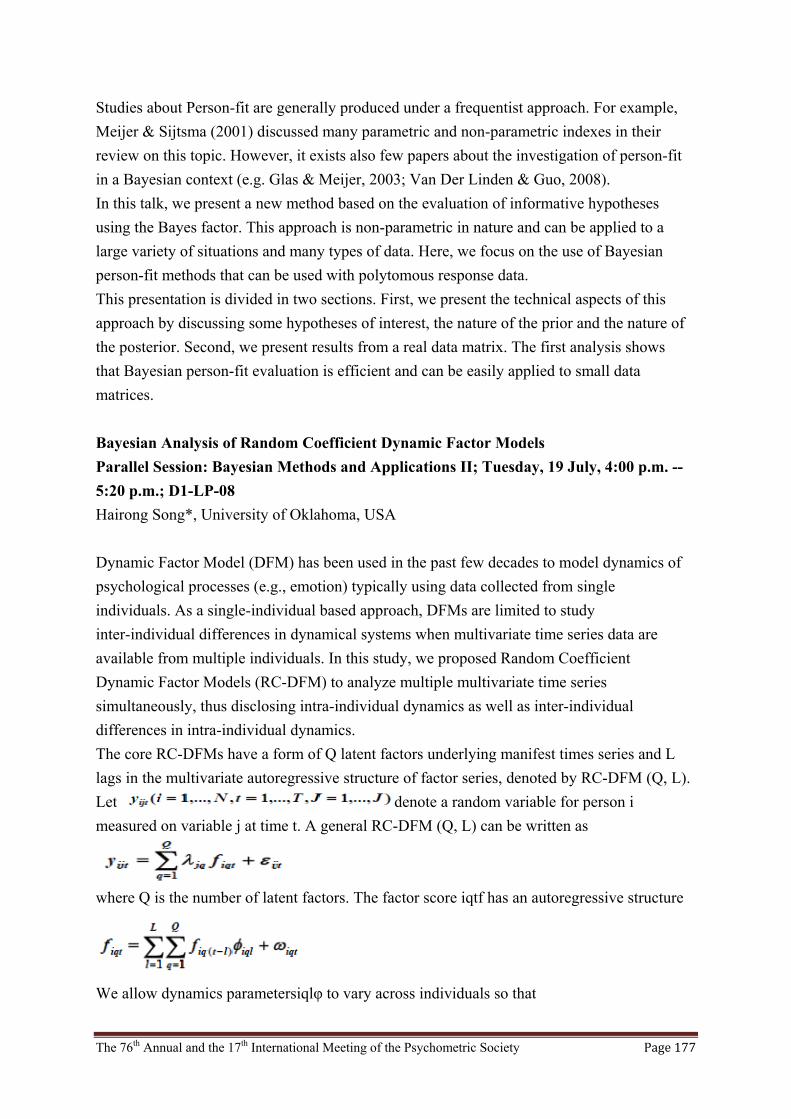
The 76th Annual and the 17th International Meeting of the Psychometric Society Page 177
Studies about Person-fit are generally produced under a frequentist approach. For example,
Meijer & Sijtsma (2001) discussed many parametric and non-parametric indexes in their
review on this topic. However, it exists also few papers about the investigation of person-fit
in a Bayesian context (e.g. Glas & Meijer, 2003; Van Der Linden & Guo, 2008).
In this talk, we present a new method based on the evaluation of informative hypotheses
using the Bayes factor. This approach is non-parametric in nature and can be applied to a
large variety of situations and many types of data. Here, we focus on the use of Bayesian
person-fit methods that can be used with polytomous response data.
This presentation is divided in two sections. First, we present the technical aspects of this
approach by discussing some hypotheses of interest, the nature of the prior and the nature of
the posterior. Second, we present results from a real data matrix. The first analysis shows
that Bayesian person-fit evaluation is efficient and can be easily applied to small data
matrices.
Bayesian Analysis of Random Coefficient Dynamic Factor Models
Parallel Session: Bayesian Methods and Applications II; Tuesday, 19 July, 4:00 p.m. --
5:20 p.m.; D1-LP-08
Hairong Song*, University of Oklahoma, USA
Dynamic Factor Model (DFM) has been used in the past few decades to model dynamics of
psychological processes (e.g., emotion) typically using data collected from single
individuals. As a single-individual based approach, DFMs are limited to study
inter-individual differences in dynamical systems when multivariate time series data are
available from multiple individuals. In this study, we proposed Random Coefficient
Dynamic Factor Models (RC-DFM) to analyze multiple multivariate time series
simultaneously, thus disclosing intra-individual dynamics as well as inter-individual
differences in intra-individual dynamics.
The core RC-DFMs have a form of Q latent factors underlying manifest times series and L
lags in the multivariate autoregressive structure of factor series, denoted by RC-DFM (Q, L).
Let denote a random variable for person i
measured on variable j at time t. A general RC-DFM (Q, L) can be written as
where Q is the number of latent factors. The factor score iqtf has an autoregressive structure
We allow dynamics parametersiqlφ to vary across individuals so that
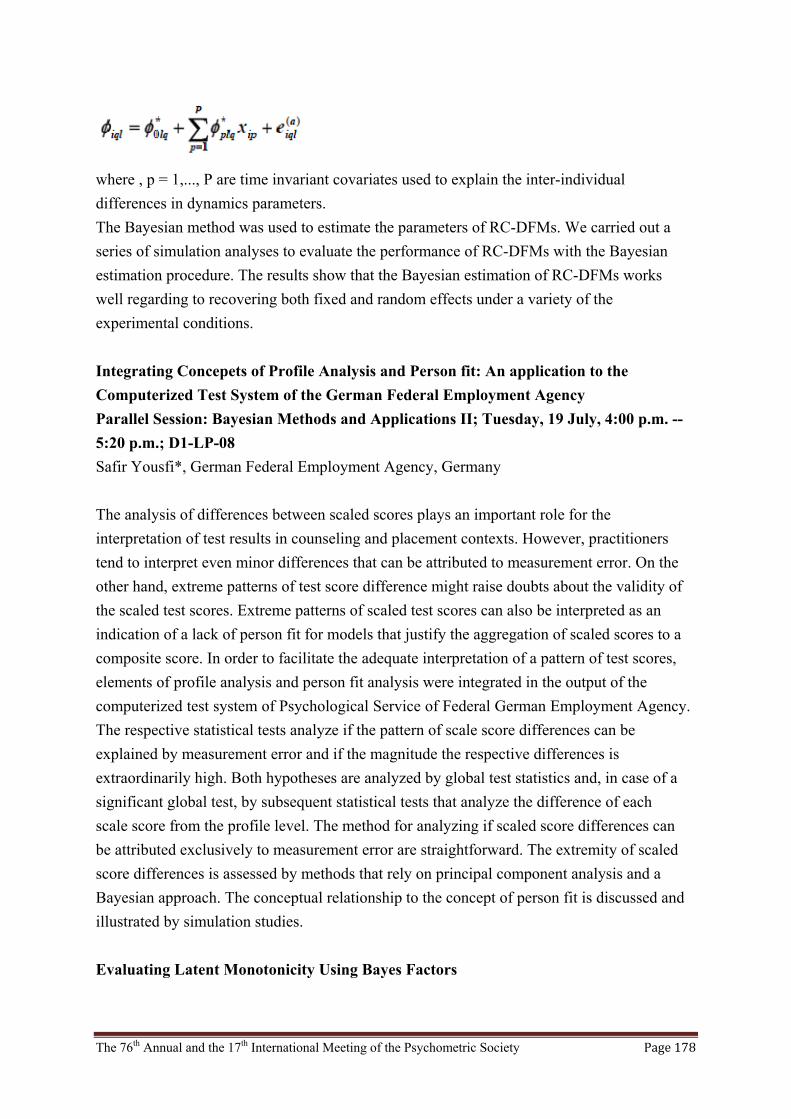
The 76th Annual and the 17th International Meeting of the Psychometric Society Page 178
where , p = 1,..., P are time invariant covariates used to explain the inter-individual
differences in dynamics parameters.
The Bayesian method was used to estimate the parameters of RC-DFMs. We carried out a
series of simulation analyses to evaluate the performance of RC-DFMs with the Bayesian
estimation procedure. The results show that the Bayesian estimation of RC-DFMs works
well regarding to recovering both fixed and random effects under a variety of the
experimental conditions.
Integrating Concepets of Profile Analysis and Person fit: An application to the
Computerized Test System of the German Federal Employment Agency
Parallel Session: Bayesian Methods and Applications II; Tuesday, 19 July, 4:00 p.m. --
5:20 p.m.; D1-LP-08
Safir Yousfi*, German Federal Employment Agency, Germany
The analysis of differences between scaled scores plays an important role for the
interpretation of test results in counseling and placement contexts. However, practitioners
tend to interpret even minor differences that can be attributed to measurement error. On the
other hand, extreme patterns of test score difference might raise doubts about the validity of
the scaled test scores. Extreme patterns of scaled test scores can also be interpreted as an
indication of a lack of person fit for models that justify the aggregation of scaled scores to a
composite score. In order to facilitate the adequate interpretation of a pattern of test scores,
elements of profile analysis and person fit analysis were integrated in the output of the
computerized test system of Psychological Service of Federal German Employment Agency.
The respective statistical tests analyze if the pattern of scale score differences can be
explained by measurement error and if the magnitude the respective differences is
extraordinarily high. Both hypotheses are analyzed by global test statistics and, in case of a
significant global test, by subsequent statistical tests that analyze the difference of each
scale score from the profile level. The method for analyzing if scaled score differences can
be attributed exclusively to measurement error are straightforward. The extremity of scaled
score differences is assessed by methods that rely on principal component analysis and a
Bayesian approach. The conceptual relationship to the concept of person fit is discussed and
illustrated by simulation studies.
Evaluating Latent Monotonicity Using Bayes Factors
The 76th Annual and the 17th International Meeting of the Psychometric Society Page 179
Parallel Session: Bayesian Methods and Applications II; Tuesday, 19 July, 4:00 p.m. --
5:20 p.m.; D1-LP-08
Jesper Tijmstra*, Utrecht University, Netherlands
David J. Hessen, Utrecht University, Netherlands
Herbert Hoijtink, Utrecht University, Netherlands
Peter G. M. van der Heijden, Utrecht University, Netherlands
Klaas Sijtsma, Tilburg University, Netherlands
Both parametric and nonparametric item response theory models for dichotomous data are
typically characterized by the assumption of latent monotonicity for all items on a test,
stating that the probability of observing a positive response to an item is non-decreasing
over the latent variable. This assumption is crucial in obtaining the monotone likelihood
ratio property, which ensures that respondents can be stochastically ordered based on their
responses. Since virtually all applications of item response theory aim to obtain at least an
ordinal level of measurement, determining whether the assumption of latent monotonicity
can be maintained is highly relevant.
A Bayesian approach to evaluating latent monotonicity is proposed, which makes use of
Bayes factors to determine the amount of support that competing hypotheses concerning
monotonicity receive. With this procedure, previous null hypothesis testing approaches to
evaluating latent monotonicity can be extended with informed alternative hypotheses, since
Bayes factors can be used to compare a wide variety of hypotheses and are not limited to
comparing the null hypothesis versus its complement. The usage of informed alternative
hypotheses would enable researchers to investigate the extent and nature of possible
violations of monotonicity, as well as potentially improving the power to detect violations
of this important assumption. The application of the procedure will be illustrated using
empirical data.
Assessing Win-or-Loss Team Performance in Playoff Competitions by Diffusion
Algorithm of Network Analysis
Parallel Session: Multivariate Data Analysis III; Tuesday, 19 July, 4:00 p.m. -- 5:20
p.m.; D2-LP-08
Nan-Yi Wu*,National Taichung University, Taiwan
Chih-Chien Yang, National Taichung University, Taiwan
The paper proposes a diffusion algorithm of network analysis in assessing win-or-loss team
performance in playoff sports competitions. The win-or-loss systems in all competitive
sports tournaments severely violate the critical i.i.d. (identically independent distributed)
statistical assumptions. The study employs a diffusion algorithm using a directed and
The 76th Annual and the 17th International Meeting of the Psychometric Society Page 180
weighted network (Radicchi, 2011) to assessing and evaluating overall team performance
without the iid assumptions. The proposed network analysis is to be evaluated by Monte
Carlo experiments to establish feasibility and reliability. In addition, empirical illustrations
analyze playoffs matches of National Basketball Association (NBA) in the United States
from years of 1950 to 2010. The most elite NBA playoff team in these years will be
assessed and ranked by the network analysis. Results of the newly proposed ranking and
evaluating method will also be compared with historical score books. The study is
concluded by providing guidelines for analyzing the class of mutual exclusive and
intercorrelated datasets often seen in the sports science.
Rank Based Polychoric Correlation
Parallel Session: Multivariate Data Analysis III; Tuesday, 19 July, 4:00 p.m. -- 5:20
p.m.; D2-LP-08
Johan Lyhagen, Uppsala University, Sweden
Petra Ornstein*, Uppsala University, Sweden
The purpose of this paper is to propose a version of the polychoric correlation which is
robust against nonnormality. The standard polychoric correlation has been developed to
derive Pearson’s product moment correlation between two hypothesized underlying
continuous
variables, when all that is observed is a contingency table. The weakness of the method is
that it depends on the assumption that the underlying variables follow a bivariate normal
distribution, an assumption which is often violated. We propose fitting the polychoric
correlation using the theoretical relationship between the Spearman rank correlation and the
Pearson product moment correlation. Performing a Monte Carlo simulation study, we find
that our statistic performs almost identically well to the polychoric correlation when the
assumptions hold, and well outperforms it in the case of skewness. Deriving its properties
from the Spearman rank correlation for discrete variables with finite support, we show that
our version of the polychoric correlation is consistent and asymptotically normal.
Modeling Group-Mean Differences of Emotion Factors by Parafac2
Parallel Session: Multivariate Data Analysis III; Tuesday, 19 July, 4:00 p.m. -- 5:20
p.m.; D2-LP-08
Sungjin Hong*, University of Illinois at Urbana-Champaign, USA
Parallel factor analysis (Parafac) can provide a unique solution for a parsimonious
description of a three-way (or n-way) data. As a relaxed variant of the Parafac model,
Parafac2 allows one of the data modes to be incomparable across levels of another mode.
The 76th Annual and the 17th International Meeting of the Psychometric Society Page 181
One example that Parafac2 can be useful for is multiple-group data where subjects are
nested in groups. With this relaxed model condition, Parafac2 can provide a uniquely
interpretable solution for an invariant factor structure across distinctive groups. In the
multiple-group Parafac2 analysis, however, there may be alternative grouping variables
(e.g., ethnicity, age, etc.) with no particular grouping preferable than others. In such cases, it
will be misleading to choose one grouping as the best only based on the model fit, since a
suboptimal grouping would fit not only the intended Parafac2 variance but also nested
groups’ mean differences of factor scores. Alternatively, a bootstrap test has been developed
to find the grouping that provides the most reliable factor loadings. An application will be
presented, using self-reported emotion data which can be grouped by nationality, age,
gender, or household wealth. With the cross-nationally grouped data, Parafac2 produced the
most reliable solution. This finding is particularly interesting in that there has been a long
debate on the orientation of emotion factors: valence and activation axes vs. positive- and
negative-affect axes. The most reliable Parafac2 factors were oriented in-between these two
systems and slightly closer to the former than latter. For cases when no grouping variable is
available, an alternative model to Parafac2 is Hidden Parafac2, which finds model-implied
unknown membership for grouping and fits Parafac2 to the accordingly grouped data in an
alternating and iterative manner. It will be also shown using the same data whether the
grouping that provided the most reliable factor structure can be found without knowing any
grouping information.
Sampling Distribution's Effect on the Significance Result and Effect Size
Parallel Session: Multivariate Data Analysis III; Tuesday, 19 July, 4:00 p.m. -- 5:20
p.m.; D2-LP-08
Can Jiao*, Shenzhen University, China
Min-Qiang Zhang, South China Normal University, China
Effect size is the significance result supplement in psychological ststistics.Effect size
provide the size of the differences and experimental effect. Researchers consider that the
invariance is a crucial property of effect size, since it is unaffected by the sample size,but no
literature suggested the effect of sample distribution or the combination of sample size and
distribution. In this study ,we identified it by simulation study in the frame of one-sample t
test and independent t test.The simulation condition of sample distribution
include:(1)standard normal distribution;(2)skewness coefficients is zero;(3)kurtosis
coefficients is zero.Each condition consist of 6 kinds of sample
size:10,20,30,50,100,200.And d and g are treated as the index of effect size. These samples
come from a normal distribution population,so we suppose that the significance result is
p->1 and the effect size is d or g->0 .The simulation results demonstrate that significance
The 76th Annual and the 17th International Meeting of the Psychometric Society Page 182
result and effect size are all sensitive indicators,that is,when sample distribution slightly
deviate from the normal distribution,we can easily obtain significance and big effect
size.Hence we must check the normality of the sample before subsequent analyse in order to
get correct research results.
A Comparison of Item Exposure Methods in Computerized Adaptive Testing
Parallel Session: Practical Considerations of Computerized Adaptive Testing; Friday,
22 July, 1:30 p.m. -- 2:50 p.m.; D2-LP-10
Ming-Yong Li*, South China Normal University, China
Min-Qiang Zhang, South China Normal University, China
Xiao-Zhu Jian, South China Normal University, China
This study uses Monte Carlo simulation approach to compare properties of four item
exposure algorithms in computerized adaptive testing. The four algorithms are:
Sympson-Hetter method, restricted method, item-eligibility method and multiple maximum
exposure rate method. In this study, the authors try to compare their performance in three
aspects, these are different test lengths, different item bank sizes, and different maximum
exposure rates. This paper will discuss the advantages and disadvantages of each method
focusing on MSE and bias, test overlap rate, utilization rate of item bank and test
information and so on. The results of no control group are regarded as the base line of
comparison. Our results show that there is a clear trade-off in all these methods. In other
words, the greater emphasize on exposure control, the greater costs of the measurement
accuracy. Considering various indexes, multiple maximum exposure rate method performs
the best.
Using the Information-Stratified Method to Control Item Exposure in Computerized
Adaptive Testing
Parallel Session: Practical Considerations of Computerized Adaptive Testing; Friday,
22 July, 1:30 p.m. -- 2:50 p.m.; D2-LP-10
Yung-Tsai Chien*, National Taichung University, Taiwan
Bor-Chen Kuo, National Taichung University, Taiwan
Hsiao-Chu Chen, National Taichung University, Taiwan
Item exposure control is a critical issue for ensuring test fairness. Without controlling the
exposure of items, the security and fairness of the test might not be maintained. When the
item bank was used by examinees with similar ability, the problem of over-exposure of
items can be expected.
The 76th Annual and the 17th International Meeting of the Psychometric Society Page 183
A new item exposure control method, named information-stratified method, is proposed in
this study. In the early stage of the ability estimation with examinees is instable, and the
large test information is not applicable except the test becomes more accurate and stable.
The information-stratified method is to make the item selection information when the
amount of phases expected to increase gradually.
For evaluating the performance of proposed method, four item exposure control methods,
maximum information, information-stratified, Nearest-Neighbor and A_stratified with b
blocking, were compared in a simulation study.
It was found when the distribution of item difficulty was matched to the distribution of
student ability, information-stratified method and Nearest-Neighbor method performed
quite similarly, and the highest exposure rate under information-stratified method was lower
than that under Nearest-Neighbor method.
When the distribution of item difficulty compares with the ability distribution is unmatched,
the information-stratified method resulted in lower RMSE of ability estimates, and given
well-controlled on the item exposure.
How would Mixed Item Selection Approach Work with Weighted Deviation Model
and Shadow Test Assembly for Constrained Adaptive Testing?
Parallel Session: Practical Considerations of Computerized Adaptive Testing; Friday,
22 July, 1:30 p.m. -- 2:50 p.m.; D2-LP-10
Chi Keung Eddie Leung*, The Hong Kong Institute of Education, Hong Kong
This study aims to investigate how a recently developed mixed item selection approach
would work with two advanced models in tackling complex non-statistical constraints in
computerized adaptive testing. The mixed item selection approach (MX) is developed to
capitalize on the strengths of two conventional item selection methods, namely the maximum
information method (MI) and the b-matching method (BM). The MI method is good at
providing efficient estimation of ability but poor at item security and pool utilization, whereas
the BM method is less efficient in ability estimation but good at item security and pool
utilization. The mixed approach has demonstrated to be efficient at ability estimation and
item pool utilization for computerized adaptive testing by allowing first half of the test items
to be selected by BM and then the next half by MI at later stages when ability estimate is close
to its true value.
In this study, the performance of mixed selection approach is further examined under
complex constraints on several factors including content area, cognitive level, answer key
position, enemy items and testlet. Two prevalent models, namely the weighted deviation
model (WDM) and shadow test assembly (STA), are integrated with the mixed selection
approach to tackle complex constraints. Performances of the integrated methods are
evaluated on estimation efficiency, item security and item pool utilization. Preliminary
The 76th Annual and the 17th International Meeting of the Psychometric Society Page 184
results indicate that (a) MX is a better choice than MI and BM for long test (40-item) and
(b)MX-STA outperforms MX-WDM in terms of test validity (satisfying constraints) and
estimation efficiency.
(This study is supported by the General Research Fund of Hong Kong; Project Number:
HKIEd841909.)
Integrating the Stocking and Lewis Conditional on Ability Procedure with the
Maximum Priority Index in Computerized Adaptive Testing
Parallel Session: Practical Considerations of Computerized Adaptive Testing; Friday,
22 July, 1:30 p.m. -- 2:50 p.m.; D2-LP-10
Yan-Lin Huang*, National Chung Cheng University, Taiwan
Ya-Hui Su, National Chung Cheng University, Taiwan
The maximum priority index (MPI; Cheng & Chang, 2009) method was proposed to
consider several non-statistical constraints simultaneously, such as item exposure and
content balancing during item selection in computerized adaptive testing (CAT). It was
found the MPI method successfully kept all items from being overexposed; however, it left
almost half of the items in the pool unused. Cheng, Chang, Douglas, and Guo (2009)
implemented the MPI with a stratified method to increase the item pool usage. In the first
study, the MPI with a stratified method had high item exposure and test overlap rates while
examinees were at extreme ability levels. In the second study, an adaption of the MPI with
Stocking and Lewis conditional on ability (SLC; Stocking & Lewis, 1998) method was
proposed to monitor item exposure rates at each ability level. Three independent variables
were manipulated: (a) item exposure control method (3 levels; MPI, MPI with a
stratification, and MPI with SLC), (b) ability distribution (2 levels; standard normal
distribution and uniform distribution), (c) item exposure rate (3 levels; 0.1, 0.2, and 0.3),
and (d) ability estimate method (3 levels; MLE, EAP, and MAP). Through a serial of
simulations, the proposed method performed better than the MPI or the MPI with a
stratified method in terms of item exposure rates for examinees at extreme ability levels.
Improving the Efficiency of Stratification Procedures in Computerized Adaptive
Testing
Parallel Session: Practical Considerations of Computerized Adaptive Testing; Friday,
22 July, 1:30 p.m. -- 2:50 p.m.; D2-LP-10
Jyun-Hong Chen*,National Chung Cheng University, Taiwan
Shu-Ying Chen, National Chung Cheng University, Taiwan
To improve test security in computerized adaptive testing (CAT), items are stratified into
several strata according to their properties before item selection is conducted. Given the

The 76th Annual and the 17th International Meeting of the Psychometric Society Page 185
item-pool stratification, the efficiency of CAT can be improved by administering high
quality items at later stages, where trait estimates are precise. Accordingly, Chang and Ying
(1999) proposed the a-stratified method to stratify an item pool based on item
discrimination parameters. Even though more item properties (e.g., item difficulty and
contents) were taken into account in pool stratification to meet practical needs, determining
the number of strata for a given item pool is crucial in the stratification procedures.
This study provided four guidelines for pool stratification. First, the number of strata should
be equal to test length. Second, items from previous strata should be reconsidered for the
rest of item selection. Third, item properties considered for pool stratification should be
agreed with the employed item response model (e.g., item discrimination and item difficulty
should be considered when two-parameter logistic model is employed). Lastly, each stratum
should be capable of being adjusted on the fly to improve item usage. Based on these four
guidelines, a stratification procedure based on dominance curves (MDC) was proposed and
thoroughly investigated in this study. Results indicated that the MDC procedure performed
better than the other methods considered in this study in trait estimation while maintained
required level of test security.
The Functional Equivalence of the PISA 2006 Science Assessment between Hong Kong
and Mainland Chinese Students
Parallel Session: Differential Item Functioning – Applications; Tuesday, 19 July, 4:00
p.m. -- 5:20 p.m.; D2-LP-10
Xiaoting Huang*, Peking University, China
In recent decades, the use of large-scale international assessments has increased drastically
as a way to compare the quality of education across countries and areas. In 2006, mainland
Chinese students took part in PISA for the first time, providing valuable basis for
comparison with their peers around the world. In order to make valid comparisons, it is
critical to ensure the measurement equivalence between different versions of the
assessments. In this study, we investigated the validity equivalence of the PISA 2006
Science assessment between Hong Kong and mainland Chinese students using both
unidimensional and multidimensional differential item functioning (DIF) detection methods.
Furthermore, potential causes of DIF were explored via detailed content analysis to bring up
possibilities to eliminate item bias in the future. Our results showed that a large proportion
of items displayed DIF. The number of DIF items reduced significantly when we changed
from a unidimensional to a multidimensional approach. Even though items had good fit,
unidimensional model can cause “false positives”. It was more suitable to apply
multidimensional methods as the Science assessment was intrinsically and empirically
The 76th Annual and the 17th International Meeting of the Psychometric Society Page 186
multidimensional. The substantive analysis revealed that differential curriculum coverage
may be the most important cause of the remaining DIF.
A Comparison of Methods for Investigating Longitudinal Measurement Invariance in
the Study of Growth over Time
Parallel Session: Differential Item Functioning – Applications; Tuesday, 19 July, 4:00
p.m. -- 5:20 p.m.; D2-LP-10
Betsy J. Feldman*, University of Washington, USA
Katherine E. Masyn, Harvard University, USA
Shubhabrata Mukherjee, University of Washington, USA
Paul K. Crane, University of Washington, USA
Many researchers in social sciences and medicine study change over time in latent
constructs. A critical assumption of these models is that the relationship between the items
and the construct they measure are invariant across time, and when groups are involved,
across groups as well. We use simulated categorical item-level data, based on a study of
medication adherence in patients with HIV, to test several proposed methods for
investigating longitudinal measurement invariance.
IRT methods are well developed for assessing differential item functioning (DIF) between
two groups. These methods have been adapted for longitudinal data by randomly selecting a
single timepoint for each individual and investigating DIF across pairs of adjacent waves of
data (or across age groups). We test two such approaches: iterative ordinal logistic
regression and likelihood-ratio models.
Continuous-data longitudinal invariance-testing approaches in structural equation modeling
have been adapted for use with categorical data. These methods allow simultaneous testing
of item parameters across groups and multiple timepoints, but questions remain about the
order in which parameters are tested and the best placement of the identifying constraints
required by the models for testing.
Finally, multilevel models can be estimated with Bayesian methods, permitting item
parameters to be random across individuals. Both time (at Level 1) and covariates (at Level
2) can be tested to assess their effects on item parameters, controlling for theta.
We compare these approaches on the basis of their success in finding and correcting
non-invariance, bias in parameter estimates (especially growth parameters), and
standard-error bias.
Investigating Socially Desirable Responses Using DIF
Parallel Session: Differential Item Functioning – Applications; Tuesday, 19 July, 4:00
p.m. -- 5:20 p.m.; D2-LP-10
The 76th Annual and the 17th International Meeting of the Psychometric Society Page 187
Priyalatha Govindasamy, University Science Malaysia, Malaysia
Saw Lan Ong*, University Science Malaysia, Malaysia
The purpose of this study is to examine the differential response pattern of those who
answer in socially desirable manner and to identify items and constructs that are more
susceptible to respond in socially desirable manner. An experimental design is adopted
where the respondents answer the same International Personality Item Pool twice.
Altogether, 521 Form 4 students from two secondary schools took part in the study.
During the first administration, the respondents were asked to respond honestly. Three
weeks later, they were given the same inventory but were told to answer in such a manner to
enable them to secure a scholarship for further education opportunity. The response
patterns for the two situations were compared by analyzing differential item functioning
(DIF) at item level using item parameters based on Rasch’s Model and Liu Agresti
Cumulative Common Log Odds Ratio. Six items flagged as exhibiting DIF from both
methods were further investigated for Differential Step Functioning (DSF). Two of the
items demonstrated convergent pervasive DSF while the other four were non-pervasive
DSF with higher steps for DIF. Three of the items exhibited DIF are from the construct
“Openess” while two from “Neurotism” and one item from “Conscientiousness”.
A DIF and Facets Analysis of a Chinese as Second Language Course Test
Parallel Session: Differential Item Functioning – Applications; Tuesday, 19 July, 4:00
p.m. -- 5:20 p.m.; D2-LP-10
Keling Yu*, The Hong Kong Institute of Education, Hong Kong
Studies of Teaching Chinese as Second Language (TCSL) remain focus on Chinese
Language, teaching approaches, and Chinese Proficiency Test (HSK). Few literature about
course test, particularly for the DIF and Facets analysis, was found. 149 students with a
diversity of nationality, language and culture backgrounds in Beijing Language and Culture
University took the final examination of the course "Intensive Chinese Reading". Two
experienced specialists in TCSL were assigned to rate the writing items in the test.
This study uses IRTLRDIF v.2, which is based on the likelihood ratio test, for detecting
Gender Differential Item Functioning(DIF) and Chinese language background DIF. The
Facets computer software was used to conduct Facets analysis.
The analysis shows that there are a few DIF items favor the students with Chinese
backgrounds and the female students. The results of Facets analysis shows that the two
raters’ severity are almost same.
Are Tes Analogi Verbal (TANAVA) Free from Gender Bias?
The 76th Annual and the 17th International Meeting of the Psychometric Society Page 188
Parallel Session: Differential Item Functioning – Applications; Tuesday, 19 July, 4:00
p.m. -- 5:20 p.m.; D2-LP-10
Aries Yulianto*, University of Indonesia, Indonesia
Verbal analogy tests often use for selection in Indonesia, for example, in selecting high
school students or government staffs. Tes Analogi Verbal (TANAVA) or test of verbal
analogy, which consisting of 30 multiple choice items, was developed to become one of
alternative verbal analogy tests in Indonesia. Before we use it for selection, it is important to
check whether TANAVA free from bias. Purpose of this study to is investigate Differential
Item Functioning or DIF (based on gender) on TANAVA. DIF is an internal method for
identifying item bias (Camilli & Shepard, 1994). Assessment of DIF is essential to the
maintenance of test fairness and validity (Wang, W.-C., Shih, C.-L., & Yang, C.-C., 2009).
DIF occurs when two groups of examinees with equal ability show a differential probability
of a correct response (Camilli & Shepard, 1994). Data were collected from 250 students in
some Faculty of Psychology, in Jakarta, Indonesia. Mantel-Haenszel and Logistic
Regression were used as DIF detection methods. Some interesting results were found in this
study.

The 76th Annual and the 17th International Meeting of the Psychometric Society Page 189
Organizational work passion for workers’ behavior and attitude—the moderating role
of organizational commitment
Poster Session : Tuesday, 19 July, 6:00 p.m. -- 7:30 p.m.
Xiaopeng Li*,South China Normal University, China
Min-Qiang Zhang, South China Normal University, China
There is different work passion for different organizations for the diverse deposit and
professional persons. This article researched organizational work passion for worker’s
behavior and attitude to work. We invested the worker’s passion and then aggregate to the
organizational level. Workers’ performance, employee voice behavior, organizational
citizenship behavior and workers’ satisfaction were chosen as the dependent variables. We
selected organizational commitment as the moderator of the relationship between passion
and workers’ behavior and attitude. Organizational commitment was selected as moderator
by large amount of other researchers. The result shows, different work passion on different
organizations; Passion remarkably impacted workers’ behavior and attitude; Organizational
commitment played moderator role, when the workers’ commitment higher, work passion
affected dependent variables more significantly. In contrast, there is no important influence.
On those grounds, we suggest that, organizations should increase workers’ commitment to
improve their satisfaction and behavior when they try to enhance the organizational work
passion. If not, work passion didn’t work well.
Empirical Study of Organizational Commitment about Victoria, Chinese bilingual
teachers
Poster Session : Tuesday, 19 July, 6:00 p.m. -- 7:30 p.m.
Guixiong Liu*,Xinjiang Normal University, China
Min-Qiang Zhang, South China Normal University, China
Among Victoria, Chinese bilingual teacher's organizational commitment ㄛ the primary
dimension is normative commitment,not emotional commitment. Higher and lower rank and
title, its organizational commitment is higher, middle level teachers, its organizational
commitment is lower. The Higher education, the lower the level of organizational
commitment. Higher levels of organizational commitment in urban schools, but rural
schools is lower.
Research on the Relationship between Personality and Social Network Positions of
high school students
Poster Session : Tuesday, 19 July, 6:00 p.m. -- 7:30 p.m.
Shao qi Ma*,South China Normal University, China
The 76th Annual and the 17th International Meeting of the Psychometric Society Page 190
Min-Qiang Zhang, South China Normal University, China
Nan nan Zhang, South China Normal University, China
Can Jiao, Shenzhen University, China
To explore the relationship of students’ personality traits to their social network positions ,
we plan to make a survey on several high school classes in Guangzhou City by using simple
version of Big Five Personality Inventory (NEO-FFI) and practical whole social network
questionnaire. Based on the existing research, the class social network of students can be
divided into emotional relation network, academic consultation network, information
exchange network and hostile relation network. We use standardized in-degree and
out-degree centrality as the position indicator of emotional relation network, academic
consultation network and hostile relation network. Standardized betweenness centrality is
considered as the position indicator of information exchange network. Expected result is
that different personality traits have different relations with positions on the four social
networks.
The Influence of Test Development on the Accuracy of KS - P Model
Poster Session : Tuesday, 19 July, 6:00 p.m. -- 7:30 p.m.
Yuna Han*, South China Normal University, China
Min-Qiang Zhang, South China Normal University, China
Xiao-Zhu Jian, South China Normal University, China
Based on probability theory and knowledge space theory, KS-P cognitive diagnostic model
considers not only the precondition cognitive relationship between the items also considers
guessing and mistakes. KS-P cognitive diagnostic model can not only get the level of
competence of participants, also can give the knowledge structure of the subjects, so it is
better than conventional scored methods which give only a score. This research verifies the
influence of test development on the accuracy of KS - P Model, and explores how to
develop a test in order to get higher accuracy. The results showed that: The accuracy of
KS-P cognitive diagnostic model is influenced by cognitive structure of items, number of
items, guess parameter of items and slip parameter of items. (1) If every key knowledge
point has its alone corresponding item, the diagnostic accuracy of the test based on KS-P
model is higher; if not, lower. (2) The number of items increases, the accuracy of KS - P
model becomes higher. (3) The guess parameter of items decreases, the higher accuracy of
KS - P model becomes. (4) The lower slip parameter of items, the higher accuracy of KS - P
model becomes.
The 76th Annual and the 17th International Meeting of the Psychometric Society Page 191
Psychometric assessment of the Patient Activation Measure Short Form (PAM-13) in
rural settings
Poster Session : Tuesday, 19 July, 6:00 p.m. -- 7:30 p.m.
Man Hung*, University of Utah, USA
Matthew Samore, University of Utah, USA
Marjorie Carter, University of Utah, USA
The Patient Activation Measure Short Form (PAM-13) is a 13-item survey instrument
designed to measure patients' knowledge, skills and confidence in managing their personal
health (Hibbard et al., 2004, 2005). It has been previously validated on subgroups of the US
general population using a Rasch measurement model. However, there lacks study to
examine its validity and reliability amongst patients in the rural areas. As such, our current
research aims to investigate the performance of PAM-13 in rural settings.
A computer assisted telephone survey was administered to 812 patients in four US primary
care rural clinics during the year 2010. The sample consisted of 62% female; 36% were
under the age 45; and 63% had at least some college experiences. We applied a Rasch
model to examine the survey's reliabilities and validities. Items seemed to have adequate
infit and outfit statistics. There were slight deviations from unidimensionality, however.
Given the multifacet nature of the items, such deviations were inevitable. In general,
PAM-13 performs well among rural patients.
College Students' Perception of a Gender Course in Taiwan: Test of Gender and Age
Variables
Poster Session : Tuesday, 19 July, 6:00 p.m. -- 7:30 p.m.
Su-Fen Liu*, National Pingtung Institute of Commerce, Taiwan
The purpose of this study was to identify students’ perception of class atmosphere and
assessment criteria in a general education gender course in Taiwan with focus on the
analysis of gender and age variables. A total of 312 college students completed
questionnaires and data were merged for statistical analyses. Results showed that students
measured by a semantic differential scale felt relaxed, interested, willing to talk,
encouraging, happy, and cheerful during the class. Gender is a significant factor (p<.05)
impacting how students felt on four of the six measures with males less positive than
females. Age is also a significant factor (p<.05) on five of the six measures with freshmen
and sophomores less positive than juniors and seniors. Since the instructor is a female,
students were asked if the instructor was a male, how differently they would perceive the
course. Chi-square analyses revealed that male and female students agreed to three of the
ten statements differently, although age was not a significant variable. As for students’
The 76th Annual and the 17th International Meeting of the Psychometric Society Page 192
assessment criteria, the instructor assigned 20% for attendance and discussion participation;
30% for film reflection report; 20% for mid-term examination, and 30% for final report.
More students preferred to increase the weight for “attendance and discussion participation”
and reduce the weight for “final report”. When asked whether gender attitudes should be a
part of students’ performance assessment, gender and age made no difference. The
discussion speculation was on why and how gender and age impacted students’ perception
of a gender course.
Analysis of a Mediated (Indirect) Moderation Model
Poster Session : Tuesday, 19 July, 6:00 p.m. -- 7:30 p.m.
Geert van Kollenburg*, Tilburg University, Netherlands
Marcel A. Croon, Tilburg University, Netherlands
The main purpose of the research reported here is to investigate the integration of mediation
and moderation. When the effect of X on Y is moderated by Z, one can ask
whether this moderating effect still exists if one includes another moderator M, which is
related to Z. In the model considered here the moderating effect of Z itself is actually
mediated by M. Checking whether this is the case requires a sequential procedure in which
it is shown that Z is a moderator when M is not included in the analysis, but fails to remain
a moderator when M is included. A four-step decision tree is proposed for guiding the user
through the steps of the regression analyses in order to infer or refute mediated moderation.
To investigate the statistical performance of this decision strategy, data were simulated and
analyzed using ‘R’, manipulating parameters which were expected to be relevant.
Implications of the results of this simulation study for practical applications in the
behavioural sciences will be discussed.
Bayesian Analysis of Change in Educational Testing using Generalized Linear Mixed
Model with Dirichlet Process
Poster Session : Tuesday, 19 July, 6:00 p.m. -- 7:30 p.m.
Keng-Min Lin*, National Taiwan Normal University, Taiwan
Rung-Ching Tsai, National Taiwan Normal University, Taiwan
We proposed a nonparametric Bayesian approach to model change in educational testing.
The linear logistic test model within Rasch family was regarded as generalized linear mixed
model and Dirichlet process was used to account for heterogeneity in the ability distribution.
Simulations were conducted to investigate the performance of the proposed method and
empirical data were analyzed for illustration.
The 76th Annual and the 17th International Meeting of the Psychometric Society Page 193
Evaluation of Mean and Covariance Structure Analysis Model in Detecting
Differential Item Functioning of Polytomous Items
Poster Session : Tuesday, 19 July, 6:00 p.m. -- 7:30 p.m.
Rung-Ching Tsai*, National Taiwan Normal University, Taiwan
Ming-Jin Ke, National Taiwan Normal University, Taiwan
In this study, we evaluated the efficacy of using the multiple-group mean and covariance
structure analysis (MG-MACS) model, in comparison with two nonparametric DIF indices,
Poly-SIBTEST and Generalized Mantel-Haenzel (GMH) methods, in detecting differential
item functioning (DIF) for polytomous items. Five-category items were generated from
MG-MACS models where threshold parameters of DIF items were specified to differ
between the focal and reference groups. Five factors were manipulated: test length (10, and
20), sample size (500, 1000, and 3000), equality/inequality of latent trait distributions, size
ratio of the focal and reference groups (80/20, 70/30, 60/40, and 50/50), and percentage of
DIF items. Each condition was replicated one hundred times to facilitate Type I error and
Power calculations. Our results suggested that the scaled chi-square difference approach
(DIFFTEST) under MG-MACS had the smallest overall Type I error and comparable or
higher Power than GMH and Poly-SIBTEST in all conditions for DIF detection. When
polytomous data were generated under the MG-MACS model, the DIFFTEST procedure
was viable for DIF detection even for tests with as few as ten items.
The Impact of Brand Equity on Cost of Borrowing
Poster Session : Tuesday, 19 July, 6:00 p.m. -- 7:30 p.m.
Byron Y. Song, Concordia University, Canada
Jooseop Lim*, Concordia University, Canada
Jeong Bon Kim, City University of Hong Kong, Hong Kong
Debt financing through bank loans is the most important source of external financing for
most firms. Financial institutions impose different interest rates, determine different
maturity periods, and allow different amounts of loans based on borrowers’ financial or
non-financial characteristics. One of the ways of improving non-financial characteristics is
to increase visibility and familiarity through branding. Marketing researchers believe that
higher visibility and familiarity among consumers can lead to an important strategic tool
that will improve long-term performance. In this context, marketing academics paid
particular attention to the impact of brand equity on financial measures to investigate how
marketing strategies can impact financial performances. To our knowledge, however, no
previous research has investigated the spill-over effect of brand equity nurtured through
product market strategies on consequences in the debt capital market. The focus of this

The 76th Annual and the 17th International Meeting of the Psychometric Society Page 194
paper is on the multi-periods lagged relation between the cost of borrowing from
institutional lenders and brand equity that was built through product market strategies.
Based on OLS, Probit, and Poisson regressions, we found that higher brand equity (1)
lowers the all-in spread, (2) leads to longer maturity periods, (3) leads to relaxation on the
requirement of collateral, (4) associates with a lower number of financial and general
covenants included in a loan contract, and (5) leads to more lenders in a loan syndicate.
Also, the interaction effects between the brand value and the level of competition within an
industry are examined.
Using Structural Equation Modeling to Estimate Composite Reliability in Hierarchical
Modeling
Poster Session : Tuesday, 19 July, 6:00 p.m. -- 7:30 p.m.
Jinlu Tu*, Shanxi Normal University , China
Xuqun You, Shanxi Normal University , China
In the psychology measurement, Coefficient alpha is usually used to estimate composite
reliability. But it equals composite reliability only in the τ-equivalent or parallel tests. Using
structural equation modeling methodology, the limitation can be broken through. In the
Former studies, Forner and Larcker’s congeneric measures composite reliability formulation
and Raykov’s noncongeneric measures composite reliability formulation can be found. But
those don’t solve the hierarchical modeling composite reliability. In this article, we used the
second-order modeling, and tried to deduce the high-order factor’s composite reliability
formulation and extended it to the level of first order correlative factors. We think that the
method can be used to provide more information about the hierarchical modeling composite
reliability.
A Comparison of the Different Developmental Trajectories of the Perception of
Mental Health Problems in Taiwanese Adolescents
Poster Session : Tuesday, 19 July, 6:00 p.m. -- 7:30 p.m.
Sieh-Hwa Lin*,National Taiwan Normal University, Taiwan
Pei-Jung Hsieh, National Academy for Educational Research, Taiwan
Previous studies have shown that depression and academic achievement were significantly
correlated. Therefore, the present study aimed to compare the different developmental
trajectories of adolescents’ perceptions of their own mental health problems in terms of
different Basic Competence Test (BCTEST) scores. The sample was drawn from a
five-wave longitudinal data set of 1,137 adolescents ranging from grade 7 to 11 of the
Taiwan Youth Project (TYP), a panel study conducted at the Institute of Sociology,
The 76th Annual and the 17th International Meeting of the Psychometric Society Page 195
Academia Sinica. These samples were assigned into a low score group (N = 822) and a high
score group (N = 315) according to the overall sample mean of the BCTEST scale score (M
= 214.07). The data analysis proceeded in two steps. First, a proposed piecewise growth
model with one intercept growth factor and two slope growth factors was applied to
represent different phases of development and to capture nonlinear growth during junior and
senior high school. Second, multiple-sample latent growth modeling analysis was employed
to estimate the developmental trajectories of the two groups from the proposed model. The
results provided supporting evidence for the proposed piecewise growth model. In addition,
there were significant group differences when the intercept growth factor and the two slope
growth factors were simultaneously viewed. These results recommend that researchers
consider differences in academic achievement while studying the development of mental
health problems among adolescents.
Undergraduate Students‘ Attitudes Toward Statistic
Poster Session : Tuesday, 19 July, 6:00 p.m. -- 7:30 p.m.
Fitri Ariyanti *, Padjadjaran University, Indonesia
Ratna Jatnika, Padjadjaran University, Indonesia
Statistic is one of the subject given in undergraduate program of psychology. Statistic is
given in three semesters. In the first semester and the second semester, the student will learn
about descriptive inferensial statistic including parametric and non parametric statistic, and
in the third semester they were tought subject in the first and the second semester, but using
statistical software, SPSS. Although most of the student in Psychology comes from science
program in their high school, but most of the students didn’t like statistic and they were
nervous when facing the examination. This paper investigates the attitude toward statistic in
the undergraduate student who are learning statistics. The aim of this research is to gather
accurate assessment about students attitude toward statistic, so teacher can improve learning
approach and method when teaching statistic. Using survey method, 81 undergraduate
psychology students in the third semester were given the (Survey of Attitudes Toward
Statistic), developed by Schau (2003). consist of six aspects; affect (students’ feelings
concerning statistics), cognitive competence (students’ attitudes about their intellectual
knowledge and skills when applied to statistics), value (students’ attitudes about the
usefulness, relevance, and worth of statistics in personal and professional life), difficulty
(students’ attitudes about the difficulty of statistics as a subject), interest (students’ level of
individual interest in statistics) and effort (amount of work the student expends to learn
statistics). The result showed the mean of each sub aspect as follow: affect (x=4.6),
cognitive(x=4.84), value (x=5.03), difficulty (x=3.08), interest =(x=4.84) and effort
(x=6.25).

The 76th Annual and the 17th International Meeting of the Psychometric Society Page 196
A Bayesian Parameter Simulation Approach to Estimating Mediation Effects with
Missing Data
Poster Session : Tuesday, 19 July, 6:00 p.m. -- 7:30 p.m.
Fairchild Amanda*, University of South Carolina, USA
Enders Craig, Arizona State University, USA
The evaluation of mediating mechanisms has become a critical element of behavioral
science research, not only to assess how and why interventions achieve their effects, but
also to understand the etiological roots of behavioral change more broadly. As the wide
appeal of mediation analysis continues to drive its use, methodologists can facilitate
appropriate application of the models by refining and developing methods to investigate
mediation hypotheses with varying data types familiar to substantive researchers.
Methodologists have explored mediation analysis in a variety of situations with broad
ranging data types, including logistic and longitudinal outcomes. However, methods for
estimating mediating mechanisms with missing data have been understudied. This study
extends Yuan and MacKinnon’s (2009) work on Bayesian mediation analyses to the
missing data context. Specifically, we outline a Bayesian parameter simulation approach for
assessing mediation effects with missing data using a Markov chain Monte Carlo algorithm
known as data augmentation to generate an empirical distribution of the mediation effect.
Our presentation provides a brief review of both the single mediator model and Bayes’
theorem. In particular, we describe the application of Bayesian estimation to a covariance
matrix, as our proposed procedure uses the elements in Σ to define the mediation effect.
Following this review, we present results of a computer simulation study that evaluates
statistical efficacy of the new method and apply the technique to a substantive data example.
The parameter simulation approach that we demonstrate is straightforward to implement in
popular statistical packages such as the MI procedure in SAS.
A study of the factors related to mathematics achievement and literacy on Large-Scale
Assessment
Poster Session : Tuesday, 19 July, 6:00 p.m. -- 7:30 p.m.
Shin-Huei Lin*, National University of Tainan, Taiwan
Su-Wei Lin, National University of Tainan, Taiwan
The purpose of this study is to investigate the relationships between the learning strategies,
mathematics anxiety, self-concept, mathematics achievement and mathematical literacy. In
this study, mathematics achievement is defined as the Taiwan students’ mathematical
performance on the Taiwan Assessment of Student Achievement (TASA), and the
The 76th Annual and the 17th International Meeting of the Psychometric Society Page 197
mathematical literacy is defined as the students’ performance on the Programme for
International Student Assessment (PISA). The learning strategies, mathematics anxiety,
self-concept, are defined as the students’ reported on the PISA 2003 Student Questionnaire.
The learning strategies consist of the rehearsal strategies, the elaboration strategies and the
control strategies. Multiple regression analysis showed that the control strategies have the
most explanation for both of the mathematics achievement on the TASA and literacy in
PISA 2006, and the three learning strategies are all the validity predictors.
Otherwise, we still analyzed the relationship between the academic achievement data using
multi-level regressions of Rasch-estimated test scores and other multiple predictors. The
results will be discussed, and expected to be the relative resources for the future educational
practice and studies.
A Study of the Relationship between Mathematics Learning Disposition and
Achievement of Sixth Grade Students
Poster Session : Tuesday, 19 July, 6:00 p.m. -- 7:30 p.m.
Yi-Chun Cheng*, National University of Tainan, Taiwan
Su-Wei Lin, National University of Tainan, Taiwan
The goals of Taiwan Grade 1-9 mathematics curriculum expect that students can learn core
competences of mathematics to prepare for the future life and math-related curriculum after
completing basic mathematics learning. In order to function within a complex society,
individuals must possess a disposition toward mathematics that enables them, when
necessary, to make decisions based on different information (Wilkins, 2000). Therefore,
how to improve the endurance of students’ mathematics learning should be one of the
important issues of mathematics education. The purpose of this study was to investigate the
relationship between mathematics achievement and learning disposition. The data of the
sixth graders’ mathematics achievement and mathematics learning dispositions were
collected simultaneously. Students’ mathematics learning disposition means one unique
habits of mind or thinking type, including the characteristics of dispositions, the
performance of cognitive, and the learning action in situation (Chen, 1996). Through
responses of the investigating problems such as “preparing for the future test”,” hope to
perform much better on mathematics”, and “if I had to face the test again, the
self-expectation of mine…” and so on to be the indicator of students’ mathematics learning
dispositions. Based on the characteristics of two kinds of tests, we adopted difference
calibration models to analyze the data. The achievement metric was developed with
concurrent calibration under Three-Parameter-Logistic Item Response Theory, and the
disposition metric was developed based on Rasch Model. The results and the implications
were also discussed in this study.
The 76th Annual and the 17th International Meeting of the Psychometric Society Page 198
The Longitudinal Study of the Relationships between the Goal Orientations and
Mathematics Achievements
Poster Session : Tuesday, 19 July, 6:00 p.m. -- 7:30 p.m.
Chang-Sheng Wang*, National University of Tainan, Taiwan
Su-Wei Lin, National University of Tainan, Taiwan
Although many studies have focused on the students’ motivation to learn mathematics,
there are many reasons to investigate: first, the results that show the gender differences on
the changes of mathematical motivation remain inconsistent because certain authors obtain
results which favor boys, while others maintain that the distinctions between the students of
both genders tend to become negligible (Roch & Normand , 2008). Second, it is still unclear
whether the mathematical motivation declines, stabilizes, or increases while students
transfer from elementary to junior high school. These questions need to be answered by
longitudinal studies. Therefore, this study investigates the relationship between the learning
achievements of students and the changes of mathematics motivation from elementary to
junior high school.
In the aspect of motivation, the researcher developed a questionnaire to measure goal
orientation in mathematics in a longitudinal cohort-sequential research design. On the other
hand, the researcher also collected the mathematics achievements of students from grade 6
to grade 7. There were 1000 participants in this study. The IRT software, BILOG, was
adopted to perform concurrent calibration to obtain the abilities of students. In order to
measure the relationships between mathematics achievements and motivations across two
years, the study used hierarchical linear modeling (HLM) to analyze the data.
The effect of exposure control in testlet-based CAT
Poster Session : Tuesday, 19 July, 6:00 p.m. -- 7:30 p.m.
Wen-Shin Lin*, The University of Tainan, Taiwan
Chiou-Yueh Shyu, The University of Tainan, Taiwan
The computerized adaptive testing (CAT) is one of the popular topics in psychometrics.
CAT estimates examinee’s ability based on item response theory (IRT). With the
improvement of computer techniques, CAT is more efficient in estimating an examinee’s
ability. However, CAT still has disadvantages. For example, test construction and security
issues are the main concerns to the CAT researchers. Item exposure was explored with
single item in the past, but testlet based CAT has been frequent used recently. Using testlet
would face the violation of local independence, a fundamental assumptions of IRT. It is
more reasonable to estimate an examinee’s ability with Testlet response theory (TRT). TRT

The 76th Annual and the 17th International Meeting of the Psychometric Society Page 199
is developed as a relatively new measurement model designed to measure testlet-based tests.
Testlet exposure controlling still need to be considered. However, few researches
investigated this issue. The purpose of this research is to modify some item exposure
controlling methods in constructing testlet-based CAT.
Five testlets selecting strategies are used (FI. FII. FIP. KLI. KLP.), and two item exposure
controlling methods are considered (SHO. MLV.) in this research. The results will be
compared under different combination of item exposure controlling methods and testlet
selecting strategies.
The Predictive Effects of Cognitive Components for Item Difficulty Variance of
ASAP-ENG
Poster Session : Tuesday, 19 July, 6:00 p.m. -- 7:30 p.m.
Pei-Ju Sung*, National University of Tainan, Taiwan
Pi-Hsia Hung, National University of Tainan, Taiwan
Su-Wei Lin, National University of Tainan, Taiwan
Education equality is the target which countries all over the world devote to. The practical
way to realize education equality is to shrink achievement gap –the huge difference in
academic performance between students from different economic circumstances and racial
backgrounds. In Taiwan, the government implements a program- After School Alternative
Program (ASAP) to remedy academic achievement of elementary school and junior high
school students with low economic status and low academic achievement. To translate the
statistic information into teaching practice adjustment, teachers usually need some
professional supports. In this study, an analysis framework of cognitive components,
including task type, plausibility of distractors, steps for inference and novelty on English
listening comprehension items was proposed and implemented. The data used in this study
was derived from the norm of the ASAP English test item pool (ASAP-ENG) of the fifth-
and sixth-grade students, totally 1459 participants. We develop a common metric with
concurrent calibration under Three-Parameter-Logistic Item Response Theory. There were
three raters to rated the cognitive components for each item. The results indicate that the
four cognitive components are significantly relates to item difficulty. The framework can
predict around 46% of the difficulty variance. The results could provide reference for
teachers who participate in English listening test proposition and remedial instruction for
ASAP students. The implications of these results for the English teachers will also be
discussed.
The Contribution of Dynamic Assessment to Screen Mathematics Learning
Disabilities
The 76th Annual and the 17th International Meeting of the Psychometric Society Page 200
Poster Session : Tuesday, 19 July, 6:00 p.m. -- 7:30 p.m.
Li Jin Zhang*, Ningxia University, China
Zhen Feng Zhang, Ningxia University, China
This study aimed to use dynamic assessment to explore whether dynamic indictors could
distinguish “backward children” from “deficit children” in mathematics on the basis of
traditional identification of mathematics learning disabilities. Sixty children (30
mathematics learning disabilities selected by traditional measurement and 30 intellectual
matched children) were participated in this experiment in order to explore and compare
information processing capacity of two types of children. Four sub-tests from Swanson
Cognitive Processing Test (S-CPT) were used by dynamic paradigm of
“pretest–intervention–posttest–delayed posttest”. The pretest tapped auditory and visual
cognitive processing capacity without help, the assists based on serial position effect were
provided in intervention phase, the posttest was the highest level, and the delayed posttest
meant internalization. Three important findings were as follows: (a) In addition to
traditional measurement, “capacity earned” of dynamic indictors could account for
additional 18.1% uniquely; (b) Dynamic indictors could distinguish backward children
(53%) from deficit children (37%) in mathematics. Furthermore, the “capacity earned”
scores of deficit children’s were significantly lower than the control group (t = -7.874, p <
0.01), whereas there was no difference between “backward children” and the control group
(t = -0.479, p > 0.05); (c) The “backward children” got higher improvement scores than
“deficit children” in same school term.
The Development of the Statistical Literacy Assessment and the Scale of Statistical
Attitudes for College Students in Taiwan
Poster Session : Tuesday, 19 July, 6:00 p.m. -- 7:30 p.m.
Yu-Ning Chao*, National University of Tainan, Taiwan
Hueying Tzou, National University of Tainan, Taiwan
Su-Wei Lin, National University of Tainan, Taiwan
Statistical literacy is a key competency expected of citizens in information-laden societies,
and it is often viewed as a necessary component of adults’ numeracy and literacy. College
students should be prepared with statistical literacy to make reasonable judgments and form
balanced opinions in their future lives.
Student attitudes and beliefs toward statistics affect the ways which students develop
statistical thinking skills, whether they will apply what they have learned to outside of the
classroom, and whether students will choose to enroll in further statistics courses (Gal,
Ginsburg, & Schau, 1997).
The 76th Annual and the 17th International Meeting of the Psychometric Society Page 201
The purpose of the study is to develop a statistical literacy assessment (SLA) and a scale of
attitudes toward statistics (SAS). Given the purpose, the testing materials in SLA are
derived from various media information, including online news, market survey, newspapers,
TV and radio, which reflect accessible information in daily lives. The item format of SLA is
composed of multiple choice and constructed-response items which are divided into three
aspects: understanding, communication, and critical skill. The items in SAS are adopted
four-point response scale and are divided into three aspects: affect, cognitive competence,
and value. The Rasch model is applied to the testing results of SLA.
The study examines Taiwan college students’ statistical literacy, attitude toward statistics,
as well as the relationship between statistical literacy and attitude. Finally, the findings are
expected to be indications for the future studies.
A Model of Cognitively Diagnostic Base on Q Matrix——Classifying Model of the
Probability of Attributes' Mastery
Poster Session : Tuesday, 19 July, 6:00 p.m. -- 7:30 p.m.
Jinxin Zhu*, Fuyong Secondary School, China
Shumei Zhang, Beijing Normal University, China
Tao Xin, Beijing Normal University, China
My study proposes a method of estimating the attributes mastery probabilities and a model
of cognitive diagnosis based on Q-matrix.
Through experiments upon the responses on the items and the previously specified Q-matrix,
one’s proportion of correct response on each attribute can be obtained. The proportion is
regarded as the temporary attribute mastery probability. It is assumes that, in the study, an
item can be answered correctly if and only if all the attributes involved in the item have
been mastered. Then responses on different items more or less show the mastery of the
attributes. Regarding the correct response probability of each item as its contribution rate,
the study amends the proportion and gets the final estimation.
The ideal attributes mastery patterns can be determined as soon as the Q-matrix is fixed.
Then the final estimation can be classified into one of the patterns with the method of
closeness degree, which is lead from the Fuzzy Pattern Recognition Theory and can
describe the similarity of the patterns. The classification is what we finally want to get from
the cognitive diagnosis model.
Lastly, simulations with Matlab and an example are provided and show the application
scope and feasibility of the method and model.
A study of identifying response fake using person fit indexes
Poster Session : Tuesday, 19 July, 6:00 p.m. -- 7:30 p.m.
The 76th Annual and the 17th International Meeting of the Psychometric Society Page 202
Sunghoon Kim*, Yonsei university, South Korea
Hee-Won Yang, Yonsei university, South Korea
Guemin Lee, Yonsei university, South Korea
In many cases of psychological testing, the examinees showed socially desirable attitude in
responding to test items. Precious studies focused on this problem and developed the social
desirability scales (SDS) or person-fit indexes to identify examinees who have excessive
social desirability. This study was designed to investigate the performance of several
person-fit indexes for this purpose.
Ferrando and Chico (2001) argued that the parametric person-fit were not powerful enough
to detect dissimulation, whereas the SDS performed much better. Unlike parametric
person-fit indexes, nonparametric person-fit indexes do not require a parametric
assumptions about the data.
In this study, both the nonparametric and parametric person-fit indexes are investigated and
evaluated in identifying person with abnormal response patterns
Three nonparametric person-fit methods (number of guttman errors, normed number of
guttman errors, generalized u3 person-fit statistic) and one parametric person-fit method
(the parametric standardized log-likelihood statistic) are examined with polytomous items
of the Korean Inventory of Character Strength (Kwon, 2010). It was composed of 240 items
to measure 24 character strengths and 10 items to measure social desibility.
The MSP (Molenaar & Sijtsma, 2000) computer application program and R package are
used for computing nonparametric and parametric person fit indexes. Analyses are being
conducted and the results will be available by the end of April.
Applying Cognitive Diagnosis Modeling (CDM) To Psychological Diagnostic Test; For
More Information.
Poster Session : Tuesday, 19 July, 6:00 p.m. -- 7:30 p.m.
Yoon Jung Kwon*,Sungkyunkwan University, South Korea
Cognitive Diagnosis Modeling is a measurement model which can provide latent variable
profile of respondents along with diagnostic information of items and suited for dealing
with complex multidimensionality in items. Adult Pathological Internet Use Inventory (S.
Lee et al., 2005) is a psychological diagnostic test in Korean which is divided into two
scales: A-Scale (Adult Scale) and B-Scale (Behavior Scale). “A-Scale” is a self-report scale
consisting of items for measuring four factors representing pathological internet use, while
“B-scale” is an observer rating scale consisting of items about various behavioral symptoms
caused by internet addiction (e.g. “He/She skips to take meals, rest, and even bathroom
breaks for continually using internet.”) and evaluated by an observer such as a therapist, a

The 76th Annual and the 17th International Meeting of the Psychometric Society Page 203
family member, a friend, and an acquaintance of an internet addict. “B-scale” is a very
useful tool when a potential addict can't realize his/her own problem and resists taking an
evaluation. Since the reason mentioned right before, if “B-scale” could provide more
specific and customized profiles of latent variables underneath the behavioral symptoms of
the respondent (in this case, the one who reported by the observer) then it would be a great
resource of information for therapeutic intervention. Therefore, in this study, I would like to
make Q-matrix of the items and analyze the data gathered while developing the inventory
with C-RUM (Hartz, 2002; Templin, 2006).
Principal Instructional Leadership Framework in China
Poster Session : Tuesday, 19 July, 6:00 p.m. -- 7:30 p.m.
Qian Zhao*, Beijing Normal University, China
Gang Li, Beijing Normal University, China
Although Principal Instructional Leadership has been research for 30 years in the world,
research in china just begin with policy focusing on education quality recently. What is
Chinese Principal’s Instructional Leadership hasn’t explained in research area. This paper
will explore the definition, structure and influencing factor of Chinese Principal’s
Instructional Leadership.
Method: This paper used individual interview and focus group interview , analysised
quantitative data to definition behavior and cognition of Chinese Principal’s Instructional
Leadership. We interviewed 154 principals, other managers in school and government.
According to the result of interview , tentative scale was developed, 93 themes included.
The scale was administrated to 743 subjects including all principals and managers in
primary and secondary school of Zhongshan China. Influencing factor questionnaire was
also developed. The scale and questionnaire was modified and then will be sent out to more
principals, managers and teachers all over China. Factor analysis and regression analysis
will be used then.
We suppose that Chinese Principal’s Instructional Leadership include four dimensions: to
guide the organizing of teaching and learning, to plan the instructional activities, to provide
the instructional conditions and to supervise the process of teaching and learning. This
paper will be proved it.
The development and implementation of the assessment of hierarchical intrinsic and
extrinsic motivation for mathematics
Poster Session : Tuesday, 19 July, 6:00 p.m. -- 7:30 p.m.
Li-Yu Lin*, National University of Tainan, Taiwan
Su-Wei Lin, National University of Tainan, Taiwan
The 76th Annual and the 17th International Meeting of the Psychometric Society Page 204
According to the PISA 2006, 2009 research reports, the students in Taiwan have a good
performance in the mathematics. Rather than the most other top countries, the standard
deviation of the students in Taiwan is the largest, showing that the individual differences in
Taiwan are important issues. In addition, in the TIMSS 2003, 2007 results also showed the
same phenomenon and also remind us the fact. In the various studies of explore the
variation of learning, learning motivation has been one of the possible causes. In order to
have much deeper understanding of the role that motivation plays in the process of students’
mathematics learning, and to help students to be more active and independent learners, this
study adopted Vallerand’s(2007) hierarchical model of intrinsic and extrinsic motivation to
develop an assessment for students’ mathematical intrinsic and extrinsic motivation. There
were three aspects of motivational information to be collected: processes, contents, and
situations. This study was targeted at sixth- graders’ mathematics learning motivation and
achievement. The IRT software, Conquest, was adopted to calibrate the students’
motivation. The results did not only show the relationship between the students’
mathematical motivation and achievement, but the influences of different background
factors were also the further discussing issues. The results of this study would be a stimulus
and reference resource to attract more attention and engagement of the researchers and
educators who have ever concerned about this kind of important issues.
Effectiveness of CATSIB on Computer Adaptive Sequential Tests
Poster Session : Tuesday, 19 July, 6:00 p.m. -- 7:30 p.m.
Hollis Lai*, University of Alberta, Canada
Johnson Ching Hong Li, University of Alberta, Canada
Mark, J. Gierl, University of Alberta, Canada
A test item with Differential Item Functioning (DIF) may reveal bias in the item responses
for members of a specific group of examinees. Many procedures are currently available to
detect DIF. However, the majority of these procedures are designed for pencil-and-paper
tests. Recently, computer-adaptive sequential tests (CAST) have become a popular
computer adaptive testing (CAT) approach for licensure exams. With many large-scale
exams migrating to a computer-based platform, few studies have explored ways to detect
DIF on different types of CAT. The difficulty with identifying DIF in CAT is twofold. First,
as each student receives a different set of items based on their ability, comparing DIF
between groups is a complicated process. Second, as item banks are much larger in CAT,
DIF detection needs to be accurate to avoid large, and potentially unnecessary, item reviews.
The purpose of this study is to evaluate the effectiveness of CATSIB, a modification of
SIBTEST, for identifying DIF items on testlets in a CAST environment. A CAST

The 76th Annual and the 17th International Meeting of the Psychometric Society Page 205
simulation was created to provide student responses to determine the effectiveness of
CATSIB. Three factors affecting DIF detection were manipulated: 1) group sample sizes (n
= 100, 200, 400), 2) group differences in sample size, and 3) three item difficulty levels.
Our results suggest a set of minimum sample sizes for using CATSIB with CAST, and
found no significant difference in detection across item difficulty levels. We also highlight
the complexities of, and future directions to, analyzing DIF in adaptive testing
environments.
Perceived family support moderates the association between affiliate stigma and
depression among caregivers of children with developmental delay
Poster Session : Tuesday, 19 July, 6:00 p.m. -- 7:30 p.m.
Chia-Wei Hsiao*, National University of Tainan, Taiwan
Chien-ho Lin, Chimei Medical Hospital National University of Tainan, Taiwan
Pi-Hsia Hung, National University of Tainan, Taiwan
Caregivers of children with developmental delay pay lots of efforts to help their
children. They may experience huge mental impact, which could increase the risk of
depression, during help seeking. One of the psychological effects during help seeking
is affiliate stigma, which refers to the extent of self-stigmatization among associates
of the targeted minorities. Previous studies have revealed that caregiver stigma were
highly associated with depression. However, the moderating psychosocial mechanism
remains unclear.
One hundred and twenty-four caregivers of children with development delay were
recruited. The affiliate stigma (affiliate stigma scale), family support (APGAR
Family Function Questionnaire), depression and other psychiatric diagnosis (Mini-
International Neuropsychiatric Interview) were measured.
Majority of caregivers were women (85%). Mean score for affiliate stigma was 35.74
(min = 22, max = 68). The mean of APGAR score was 6.9. Sixteen caregivers ever
experienced depression. Caregivers with depression had higher scores of affiliate
stigma, and lower family support. There was marginal evidence of interaction
between the family support and affiliate stigma. For those caregivers with better
family support, the affiliate stigma had more impact to depression.
Although affiliate stigma experienced by caregivers is highly correlated with
depression, the empirical evidence of present study may imply that the impact
of affiliate stigma to depression was moderated by family support It would be
important for clinician to assess and enhance the family support of caregivers with
developmental delay children.
The 76th Annual and the 17th International Meeting of the Psychometric Society Page 206
Rater Subjectivity in the Development of Imagination Test for University Student
Poster Session : Tuesday, 19 July, 6:00 p.m. -- 7:30 p.m.
Chi-Chan Chen*, National Taichung University of Education, Taiwan
Cheng-Te Chen, National Tsing Hua University, Taiwan
Ching-Lin Shih, National Sun Yat-sen University, Taiwan
This study develops a test of imagination for university student based on Torrance’s (1966)
and Vygotsky’s (1978) theory, which Torrance (1966) developed the test of creative
thinking (i.e. TTCT) based on the divergent thinking proposed by Guilford, and Vygotsky
(1978) proposed that the imagination is the ability of linking to the fact instead of
innovation. The measure for imagination used in this study is the “judgment of products”,
which has been adapted for a long time but also known for its serious drawback of
subjectivity. In order to exclude the difference between rater’s subjectivity from this
measure and explore for possible interactions, item response theory (IRT) is introduced to
analyze our data. Our preliminary result shows that difference between rater’s subjectivity
is non-ignorable, and raters tend to acquire their own criterion. We suggest that rater
subjectivity should be treated with more attention in the development of imagination test.
Internet Addiction Disorder: Categories or Dimensions?
Poster Session : Tuesday, 19 July, 6:00 p.m. -- 7:30 p.m.
Wenchao Ma*, Beijing Normal University, China
Yufang Bian, Beijing Normal University, China
Fang Luo, Beijing Normal University, China
Internet Addiction Disorder (IAD) is getting increasing concerns because it brings about
many negative influences from both physical and mental aspects. However, an important
but open question is whether the internal structure of IAD is dimensional or categorical. A
false assumption of nature of latent variable is likely to cause biased results (Vermunt &
Magidson, 2004).
This paper focuses on the latent structure of IAD—categories, dimension or combination.
We analyzed 2511 Chinese middle school students’ responses in Internet Addiction Test
(Young, 1996) using the Rasch Model, Latent Class Model (LCM) and Mixed Rasch Model
(MRM). To determine the appropriate number of latent classes, LCM and MRM with
different numbers of classes were fitted to the data. The results show that MRM with two
latent classes (MRM-2L) can fit data in terms of Q index (Rost & von Davier, 1994) and is
the best-fitting model according to information criteria (BIC and CAIC). Thus, the data of
IAD should be described by MRM-2L allowing for qualitative differences between two
groups (difference in kind) as well as quantitative differences in each group (difference in

The 76th Annual and the 17th International Meeting of the Psychometric Society Page 207
degree). Furthermore, the features of classification using MRM are discussed and
comparisons are made with existing classification using cut-off raw scores. Finally, based
on the new classification method, we provide some practical recommendations for
assessment and treatment of IAD.
Dimensionality and item-wording effect of the Chinese Rosenberg Self-Esteem Scale
Poster Session : Tuesday, 19 July, 6:00 p.m. -- 7:30 p.m.
Yi-Chang Cheng*,National Cheng Kung University, Taiwan
Wei-ming Luh, National Cheng Kung University, Taiwan
In this paper, we investigated the dimensionality and analyzed the wording effect of the
Chinese version of Rosenberg’s Self-Esteem scale (RSES-C). Although Rosenberg reported
his scale is one-dimensional, some empirical evidences on factor analysis found that the
global self-esteem might have two factors of positive and negative or self-competence and
self-liking. Moreover, recent studies argued that the two dimensions merely resulted from
the method effect. To further examine the mixed results and consider the appropriateness of
the Chinese translation, we revised the RSES-C and administered the instrument to 692
junior high school students in Taiwan. One- and two-dimensional models were tested by
confirmatory factor analysis. We also tested the model having relation between method
effect associated with positively and negatively worded items. A series of confirmatory
factor analysis including correlated trait-correlated uniqueness (CTCU) and correlated
trait-correlated method (CTCM) were used and the results revealed that the inclusion of
method effect was required to have the best fit among the competing models. Moreover, the
two-dimensional model has better fit than the one-dimensional model. Finally, the item 8
has very low internal consistency because of the subjunctive statement, and the revision is
needed in the future.
The Study of the New Immigrant Children’s Academic Achievement, Learning Belief
and Learning Interests in Taiwan
Poster Session : Tuesday, 19 July, 6:00 p.m. -- 7:30 p.m.
Pei-Ching Chao*, National Chengchi University, Taiwan
Min-Ning Yu, National Chengchi University, Taiwan
Jia-Jia Syu, National Chengchi University, Taiwan
Po-Lin Chen, National Chengchi University, Taiwan
Pei-Chun Chung, National Chengchi University, Taiwan
Purpose: New immigrant children whose mothers come from abroad are rising and they are
the large proportion of primary school students in Taiwan. This is an important and novel
The 76th Annual and the 17th International Meeting of the Psychometric Society Page 208
topic of study, because their family structure and language development might affect their
academic achievement, learning belief and learning interests.
Methods: This study uses the test equating to acquire ability scores with the BILOG-MG
program. Taiwan Assessment of Student Achievement (TASA) database provided ten
parallel test forms of multiple-choice items including anchor-items were administered to
equivalent four-grade samples of about 8500 examinees drawn from the same population.
Then the new immigrant children’s ability scores, learning belief scores and learning
interest scores from the TASA database were analyzed by t-test and latent-regression
methods to compare with non-immigrant children.
Results: The results were as follows: (1) Non-immigrant children’s achievement scores of
Nature Science, Math, English, and Chinese were significantly higher than new immigrant
children’s. (2) Non-immigrant children’s learning belief scores of Math and English were
higher than new immigrant children’s, except Nature Science and Chinese. (3)
Non-immigrant children’s learning interests scores of Nature Science, Math, English, and
Chinese were not significantly higher than new immigrant children’s.
Conclusions: Although new immigrant children’s achievement scores were lower than
non-immigrant children’s, their learning interests were about the same as non-immigrant
children’s. School educators shouldn’t give up giving assistance, especially for Math and
English.
Analysis on Characteristics of Diagnostic Test for Depression in Koreans
Poster Session : Tuesday, 19 July, 6:00 p.m. -- 7:30 p.m.
Seowoo Lee*, Pusan National University, South Korea
Daeyong Lee, Pusan National University, South Korea
Dahee Shim, Pusan National University, South Korea
Sukwoo Kim, Pusan National University, South Korea
Seock-Ho Kim, The University of Georgia, USA
The purpose of this study was to investigate the characteristics of diagnostic test for
depression(DSM-IV) in Koreans. The subjects for this study were 1183 Korean patients
who visited one of 18 nationwide depression clinical research centers from January 2006 to
August 2008, diagnosed with MDD, Depression disorder NOS, or dysthymia. In this study,
only the main depressive disorder diagnosis parts based on DSM-IV were extracted and
analyzed from K-CIDI's entire data. The analysis of depression diagnosis categories are 1)
depression mood, 2) loss of interest, 3) appetite change, 4) sleep disturbance, 5)
psychomotor change, 6) fatigue, 7) guilty/worthlessness, 8) concentration difficulty, and 9)
suicide. In order to identify the characteristics of depression of individual diagnostic
category, the classical test theory and item response theory were used. It is more useful to
The 76th Annual and the 17th International Meeting of the Psychometric Society Page 209
use IRT(item response theory) than the classical test theory or factor analysis which is used
to evaluate the suitability of psychometric scaling with in most of the mental disorder
assessment tools. For this purpose, we used SPSS 15.0 and BILOG-MG in this study. The
results of this study found that there were no bias for diagnostic test for depression in
Koreans, but the threshold of diagnostic level was high.
Study on the Immigrant Student Mathematics Achievement Impacted Factors:
Taiwan’s Grade 8 in TIMSS 2007
Poster Session : Tuesday, 19 July, 6:00 p.m. -- 7:30 p.m.
Fang-chung Chang*, National Taipei University, Taiwan
Purpose: There have been some research works that identified the immigrant students’
achievement in Taiwan. However, previous researchers merely collected data from local
communities, and they did not use the database to analyze. The purposes of this study were
to understand the current conditions of grade 8. We would understand the impacted factors
on immigrant students.
Methods: Data from the Trend International Mathematics and Science Survey of 2007
(TIMSS 2007) were used to investigate variables that analyzed the impacted factors on
mathematics achievement in grade 8 in Taiwan. There were 93 immigrant children in the
study. It regarded the parents’ education degree, the cultural capital, students’
self-aspiration, interesting in mathematics as independent variables, and students’
mathematics achievement as dependent variable. It used structural equation modeling (SEM)
to test model by some SEM index, and found that the constructed model was fitted better.
Results: The meaning of model were as followings: the students’ father education degree,
computers and books in home( it meant they had more the cultural capital), self-aspiration,
students’ interesting and their perception of mathematics value were most significant
positively factors, that is immigrant students had more self-aspiration and students’
interesting, their mathematics achievement were higher.
Conclusions: Basing on the results, the study put forward suggestions for the educational
guidance organizations, school teachers, parents and future studies.
Gender Differential Item Functioning Across Taiwan, Shanghai, Hong Kong & Macao
for PISA 2009 Reading Assessment
Poster Session : Tuesday, 19 July, 6:00 p.m. -- 7:30 p.m.
Song-Wei Ma*, National University of Tainan, Taiwan
Pei-Ming Chiang, National University of Tainan, Taiwan
Hueying Tzou, National University of Tainan, Taiwan
The 76th Annual and the 17th International Meeting of the Psychometric Society Page 210
Differential gender performance in standardized assessment has long been a heated topic.
The Programme for International Student Assessment (PISA) in 2009 focuses on reading.
According to the PISA 2009 report, female students’ performance is superior to male
students’ for about one academic year. It is noted that Taiwan, Shanghai, Hong Kong and
Macao are administered in Chinese version in PISA 2009. This study uses PISA 2009
released data to investigate the gender DIF across Taiwan, Shanghai, Hong Kong and
Macao for PISA 2009 reading assessment and its text formats and the three aspects (access
& retrieve, integrate & interpret, reflect & evaluate) defined in the PISA 2009 framework.
The Mantel-Haenszel method is employed to detect gender uniform DIF across the four
countries/areas. Findings from this study are expected to provide useful information to the
test development and potential users.
Asian Students’ Achievement Motivation: Orientations and Characteristics
Poster Session : Tuesday, 19 July, 6:00 p.m. -- 7:30 p.m.
Shanshan Zhang*, Ministry of Education of China, China
Hongyun Liu, Beijing Normal University, China
Kit-Tai Hau, The Chinese University of Hong Kong, Hong Kong
In a lot of cross-cultural academic achievement comparison studies, Chinese and other
Asian students outperformed western counterparts and drew researchers’ attention.
Different academic motivation and related theories have been proposed to explain the
outstanding performance. The present article compares and examines evidences for these
theories and highlights recent viewpoints. Research show that Asian’s families, irrespective
of their economic and educational background, they try their best to support their children’s
education. Asian students, however, do not necessarily attribute more to effort and have
higher interest in study than their Western counterparts. More recent studies emphasize
cultural differences in the perception of different constructs (e.g., ability, effort). Western
students feel proud of their success, and feel disappointed and lose their esteem when fail.
In contrast, Chinese students see effort and study as virtue and social responsibility. When
succeed, they still humbly look for perfection. When fail, they feel ashamed and guilty.
Chinese may be collectivistic in human-relations and familial affairs, but Chinese students
can be quite individualistic and emphasize personal success in academic achievement.
The rater effect and differential item functioning of cognitive tests in International
Civic and Citizenship Education Study
Poster Session : Tuesday, 19 July, 6:00 p.m. -- 7:30 p.m.
Chun-Hao Tao*, National Taiwan Normal University, Taiwan
Po-Hsi Chen, National Taiwan Normal University, Taiwan
The 76th Annual and the 17th International Meeting of the Psychometric Society Page 211
Mei-Hui Liu, National Taiwan Normal University, Taiwan
Yao-Ting Sung, National Taiwan Normal University, Taiwan
This research aims to investigate the rater effect of the constructed response item of
cognitive tests in International Civic and Citizenship Education Study(ICCS,2009)and
whether constructed response have different item function influenced by the degree of
urbanization of school or not. We use Multifaceted Model(Linacre,1989) to analyze the
responses of 743 senior high school students which were scored by two different raters. The
severity of the raters and the degree of urbanization of schools were included in the facet
model in order to know their influences on the item parameter. Results indicated that: 1) the
rater's effect were from -0.64 to +0.29 logit, 2) two items were more difficult to get high
score, 3) the steps of an item were unreasonable shows there are problems in rating score or
standard of rating, and 4) the items parameters were not influenced by the degree of
urbanization of school. The suggestion of applying the multifaceted model on ICCS data
analysis were discussed in this research.
Modification of the hierarchy consistency index
Poster Session : Tuesday, 19 July, 6:00 p.m. -- 7:30 p.m.
Shuliang Ding*, Jiangxi Normal University, China
Mengmeng Mao, Jiangxi Normal University, China
Cui and Leighton (2009) proposed the hierarchy consistency index (HCI) to detect the
fitness of an examinee’s observed response pattern (ORP) to an expected response pattern
(ERP) as a person fit index.
HCI is not defined well in the sense that when an examinee masters an attribute only and
there is an item with the same attribute in the test, and the examinee responses correctly to
the item only. The original HCI could not be computed because the number of comparisons
being zero, which means the denominator being zero.
Unlike the person fit indices in the item response theory, HCI is not heavily dependent on
the cognitive diagnostic model (CDM) provided that the CDM is the non-compensable, but
the HCI is heavily dependent on the test specification, the Q matrix. In the paper there is an
example (Sinharay and Almond, 2007) to demonstrate the conclusion. It is very important
to detect whether a test specification coincides with the cognitive model before
administering the test. An algorithm to judge matrix Qt being the sufficient and necessary is
proposed in the paper. And an index named theoretic validity is proposed to describe how
good the Qt matrix is.
Growth After Trauma: Validating Post Trauma Thriving Scale in the Philippines

The 76th Annual and the 17th International Meeting of the Psychometric Society Page 212
Poster Session : Tuesday, 19 July, 6:00 p.m. -- 7:30 p.m.
Imelu Mordeno*, Universidade de Sao Jose, Macau
Researches pertaining to growth after trauma have increased significantly. A complete
understanding of a person with trauma requires clinical practitioners, counselors and other
experts in the field to look not only on one’s vulnerabilities or symptoms of traumatic
distress but also of his or her capability to rise up and achieve psychological growth despite
the emotional wounds suffered. This study then corresponds to an effort in assessing and
quantifying thriving through looking at its factor structure and how it relates to other growth
measures. Post Trauma Thriving Scale (PTTS) was developed purposively to measure
Filipinos’ growth dynamics after experiencing traumatic events. PTTS was translated into
five Philippine dialects through a modified multiple forward-backward translation
procedure. To account well the factor structure of the scale, Confirmatory Factor Analysis
was done to determine if the previous model fits well with the present data. Subsequently,
Exploratory Factor Analysis (EFA) was also performed for model comparison purposes.
The results yielded similarities in both item and factor structures from the two factor
analyses. Further, PTTS factors seem to indicate moderate relationships with other growth
measures.
A study on the accuracy of score report in computerized adaptive testing
Poster Session : Tuesday, 19 July, 6:00 p.m. -- 7:30 p.m.
Chiou-Yueh Shyu*, The National University of Tainan, Taiwan
Computerized adaptive testing (CAT) has become popular in recent years due to the
modern computer technology. Like conventional paper and pencil (P&P) testing, the
primary goal of computerized adaptive tests (CATs) is to make inferences about the
proficiency of examinees that a test seeks to measure. In CAT, test
items are adapted to the proficiency level of the individual examinees. One of the
conditions in item selection is to choose items with the maximum test information
function, that is, with the minimum standard error of measurement (SEM) or with the
shortest confidence interval (CI) for proficiency. Thus, accurate SEMs and CIs for
proficiency are required for obtaining an appropriate set of items and to report scores in
CAT. In CAT research, many studies (e.g., Wang & Vispoel, 1998; Yi, Wang, & Ban,
1999)
have examined the characteristics of different proficiency estimation methods. The research
on procedures for constructing CIs is limited. Furthermore, no research on item selection
based on the shortest CI has been found. Via simulation studies under unit-dimension and
multi-dimension environments, the current study intended to investigate these procedures
The 76th Annual and the 17th International Meeting of the Psychometric Society Page 213
under various CAT conditions. The proposed methods for constructing CIs for proficiency
will be applied to the item selection procedure in a simulated CAT. This study intends to
provide users with most accurate CIs for proficiency, thus items are appropriately selected
and the accuracy of the score report in CATs is improved.
Development of Learning Motivation Test for Pupils based on the forms of self-report
and semi-projective
Poster Session : Tuesday, 19 July, 6:00 p.m. -- 7:30 p.m.
Guang Li*, Hunan Normal University, China
Lu Jiang, Hunan Normal University, China
Miewen Yan, Hunan Normal University, China
Yangming Zhou, Hunan Normal University, China
Xiang Li, Hunan Normal University, China
Objective: Adopting two forms of test, that is, the self-report type(SRT) and
semi-projective type(SPT), construct the Learning Motivation Test for Pupils based on the
CTT. And compare their advantages in constructing test.
Method: Research participants consisted of 1132 second- to sixth-graders (611 boys, 521
girls). The framework and content of tests were established by drawing forefathers’
researches, interviewing with the experts and surveying students with open-end
questionnaires. SRT and SPT are compared in reliability and validity.
Result: The two tests consist of 25 items and two subtests, but in terms of items, they are
not exactly the same. For the two tests, the correlations between items and subscales are
within 0.52-0.73. Extreme group studies show that scores of each item in high-score group
are significantly higher than those of low-score group. The two tests have no significantly
difference in the results of item analyses, but SPT can improve the utilization of items.
Cronbach’ s coefficients of SRT and SPT are 0.71 and 0.62, respectively, but the measuring
ranges of SPT are larger than that of SRT. According to the results of EFA, we know the
values of the two tests’ factor loadings range from 0.49~0.78.CFI and TLI of CFA are
higher than 0.92, /df is lower than 1.34,and RMSEA is lower than 0.04; SPT is much better
than SRT on the criterion-related validity.
Conclusion: The structures of the two tests are reasonable, reaching the psychometric
standards. The validity of SPT and the reliability of SRT are good.
Development of Learning Preference Scale for Pupils Based on GGUM and CTT
Poster Session : Tuesday, 19 July, 6:00 p.m. -- 7:30 p.m.
Yongbo Li*, Hunan Normal University, China
Danghui Shi, Hunan Normal University, China
The 76th Annual and the 17th International Meeting of the Psychometric Society Page 214
Ying Long, Hunan Normal University, China
Dai Zheng, Hunan Normal University, China
Jiuyuan Tang, Hunan Normal University, China
Objective:We tried to develop the learning preference scale of student in primary school
based on the traditional classical test theory and IRT. Discuss the theoretical construct of
the learning preference scale, in order to deepen research on Theory of Learning Preference.
Method:According to the review of current literature and take account of existing studies
and literature,the Learning Preference Scale for Pupils was constructed. In this paper,
1446 pupils completed the questionnaire and comprised the response rate as 92.81%.
Result: The learning preference scale of Pupils contract structure was accordant with
four-dimension model, the Scale composed of 20 items, and each dimension includes 7,5,4
and 4 items.The scale and items are meeting the psychometrics which based on the GGUM
(2004) ; the item locations θ are range from -3.26 to -1.65, item discrimination
parameters are from 0.72 to 1.74, and better fitting prediction result with the scale
construction which based on the CFA. The value of NFI、 GFI、AGFI、IFI、TLI and
CFI in the CFA are all greater than 0.90, /df is 1.325, the RMSEA is lower than0.03 and
the RMR is lower than 0.007.By using the scale can be assess the learning preference of
Schoolchildren in effect, there are differences among school, grade and age for learning
preference of pupils.
Conclusion: The results show that indexes reached requirement of the metrology, and the
scale can well be used in the learning behavior and its related areas.
Development of Self-confidence Questionnaire for Pupils Based on CTT and IRT
Unfolding Model
Poster Session : Tuesday, 19 July, 6:00 p.m. -- 7:30 p.m.
Danghui Shi*, Hunan Normal University, China
Xingjie Qu, Hunan Normal University, China
Fusheng Xie, YueLu Teachers’ College for Vocational Studies, Changsha, China
fanmei Zeng, Hunan Normal University, China
Zi Zhao, Hunan Normal University, China
Objective: Construct the self-confidence questionnaire(SCQ) for pupils with the
generalized graded unfolding model (GGUM) of IRT. Analyze construction of the
questionnaire and test the level of pupils’ self-confidence.
Method: The questionnaire is proposed by studying the literature review. After then, do
pre-test and re-write the item of the questionnaire. The samples are consisted of 1130 pupils
The 76th Annual and the 17th International Meeting of the Psychometric Society Page 215
(573 boys, 557 girls) from grade 4 to grade 6. The structure of the questionnaire is
confirmed. The construct validity and the criterion-related validity are tested.
Result:SCQ consists of 31 items and 8 factors. The item locations theta values range from
-3.51 to -1.47, item discrimination parameters are from 0.57 to 1.85. Cronbach'
coefficient is 0.86. GFI、AGFI、IFI、TLI and CFI of CFA are all greater than 0.9 and the
criterion related validity is 0.62. In self-denial, moral self-confidence and appearance
self-confidence schoolgirls have more score ,but in sport self-confidence schoolboys have
more score(p<0.01). City pupils have higher scores than country pupils in self-confidence
(p<0.01).
Conclusion: It is feasible to develop the self-confidence questionnaire for pupils with
GGUM. The structure of the test is reasonable.Some factors of the self-confidence
questionnaire for pupils have significant differences in gender. There are significant
differences between city pupils and country pupils in self-confidence.
Dynamic and comprehensive item selection strategies for computerized adaptive
testing based on graded response model
Poster Session : Tuesday, 19 July, 6:00 p.m. -- 7:30 p.m.
Fen Luo*, Jiangxi Normal University, China
Shuliang Ding, Jiangxi Normal University, China
Xiaoqing Wang, Jiangxi Normal University, China
Item selection is a core component in Computerized Adaptive Testing (CAT). More
information can be provided by polytomous items. Based on graded response model(GRM),
a technique of the reduction dimensionality of difficulty(or step) parameters was employed
to construct some item selection strategies (ISSs) proposed recently. And some
corresponding modifications on each of the ISSs proposed recently are made. In order to
improve maximum Fisher information criterion (MFI), two new types of ISSs are proposed
based on GRM inspired by integration of interval estimation , dynamic a-Stratified and
dynamic b-Stratified usually used when scoring 0-1. The results of Monte Carlo simulation
study show that the new types of item selection method achieved a shorter test length and a
lower average exposure rate than other methods involved in the paper, ensured accuracy of
the original item selection methods. In more details, every new ISS applied the idea of the
interval estimate was better than the correspondent ISS in the sense of obvious
improvement of the Chi-square value. And the same effect appeared when comparing the
dynamic a-Stratified ISS with MFI. This fact demonstrates that the new ISSs benefit
improvement of the utility of the item pool .
Construction of Learning Attitude test for pupils Based on IRT Unfolding Model
The 76th Annual and the 17th International Meeting of the Psychometric Society Page 216
Poster Session : Tuesday, 19 July, 6:00 p.m. -- 7:30 p.m.
Xingjie Qu*, Hunan Normal University, China
Fusheng Xie, Yuelu Teachers’ College for Vocational Studies , China
Wen Tan, Hunan Normal University, China
Yan Mao, Hunan Normal University, China
Xiyou Cheng, Hunan Normal University, China
Objective: Construct the self-confidence questionnaire(SCQ) for pupils with the
generalized graded unfolding model (GGUM) of IRT. Analyze construction of the
questionnaire and test the level of pupils’ self-confidence.
Method: The questionnaire is proposed by studying the literature review. After then, do
pre-test and re-write the item of the questionnaire. The samples are consisted of 1130 pupils
(573 boys, 557 girls) from grade 4 to grade 6. The structure of the questionnaire is
confirmed. The construct validity and the criterion-related validity are tested.
Result:SCQ consists of 31 items and 8 factors. The item locations theta values range from
-3.51 to -1.47, item discrimination parameters are from 0.57 to 1.85. Cronbach'a coefficient
is 0.86. GFI、AGFI、IFI、TLI and CFI of CFA are all greater than 0.9 and the criterion
related validity is 0.62. In self-denial, moral self-confidence and appearance self-confidence
schoolgirls have more score ,but in sport self-confidence schoolboys have more score(p<
0.01). City pupils have higher scores than country pupils in self-confidence(p<0.01).
Conclusion: It is feasible to develop the self-confidence questionnaire for pupils with
GGUM. The structure of the test is reasonable.Some factors of the self-confidence
questionnaire for pupils have significant differences in gender. There are significant
differences between city pupils and country pupils in self-confidence.
The Effect of Student's Self-Confidence, Positve Affect and Teachers' Expectations On
Science Achievement
Poster Session : Tuesday, 19 July, 6:00 p.m. -- 7:30 p.m.
Fu-An Chi*, National Chung Hsing University, Taiwan
Jen Jang Sheu, National Chung Hsing University, Taiwan
This study explored the effects of students’ positive affect toward science, students’
self-confidence in learning science and science teachers’ expectations on science
achievement of 5041 fourth-grade students and 174 science teachers from 150 schools
across Taiwan. A hierarchical linear modeling was used to analysis the data the Trends in
International Mathematics and Science Study (TIMSS) 2007 fourth grade dataset; a
significance level of 0.05 was used. There were significant differences between students’
gender and SES on the achievements. While controlling for student-level demographic
The 76th Annual and the 17th International Meeting of the Psychometric Society Page 217
characteristics, revealed the substantial predictive effects in level-1 predictors of students’
positive affect toward science, students’ self-confidence in learning science and also
significant effect of science teachers’ expectations ,the level 2 predictor, on science
achievement on of fourth-grade students. About 10% of the variation in achievement was
found among the Taiwanese schools. Cross-gender teacher expectations effects between
students and teachers were also discussed. Some implications for researchers, policy-makers
and school personnel are offered to improve science achievement in Taiwan.
Classification Consistency for Test Scores Composed of Testlets under IRT and
non-IRT Approaches
Poster Session : Tuesday, 19 July, 6:00 p.m. -- 7:30 p.m.
So Yoon Park*, Yonsei University, South Korea
Guemin Lee, Yonsei University, South Korea
This article investigates how statistical procedures can be applied to estimate the
classification consistency for test scores composed of testlets under IRT and non-IRT
approaches.
The main purpose of this article is comparison of estimating classification consistency by
two methods; item-based and testlet-score method. Another purpose is to investigate the
classification consistency estimates according to IRT and non-IRT methods.
For the analysis two different IRT models are considered. Dichotomous model uses
three-parameter model and polytomous model uses graded response model. In non-IRT
models, Hanson and Brennan (1990) and compound multinomial (Lee et al., 2009)
procedures are used.
All computations for the classification consistency in IRT models are carried out using the
computer program IRT-CLASS (Lee & Kolen, 2008). Results for the Hanson and Brennan
procedure are computed using BB-CLASS (Brennan, 2004) and results for the compound
multinomial model are computed using MULT-CLASS(Lee, 2008). These all methods are
applied to both real and simulated data.
The result of this study is that the testlet format has an impact on the estimating
classification consistency. Item-based method is the highest estimate(κ) in both IRT and
non-IRT method, and non-IRT method estimate(κ) is bigger than IRT method. Last,
testlet-score method result under IRT approach is the smallest in all measurement methods.
Table 1 displays the results of the real data.
Table 1
Item-based Method Testlet-score Method
Ρ κ Ρc Ρ κ Ρc
non-IRT 0.97336 0.84123 0.83224 0.97524 0.83675 0.84834
The 76th Annual and the 17th International Meeting of the Psychometric Society Page 218
IRT 0.97555 0.83781 0.84924 0.96990 0.83424 0.81841
To improve generalization, simulation study is in progress.
Teachers' expectations on students science achievements:evidence from TIMSS 2007
Poster Session : Tuesday, 19 July, 6:00 p.m. -- 7:30 p.m.
Cindy Wu*, National Chung Hsing University, Taiwan
Jen Jang Sheu, National Chung Hsing University, Taiwan
This study examined the effects of students’ positive affect toward science, students’
valuing science, students’ self-confidence in learning science and science teachers’
expectations on science achievement of 3870 eighth-grade students and 150 science
teachers from 150 schools across Taiwan. A hierarchical linear modeling was used to
analysis the data from the Trends in International Mathematics and Science Study
(TIMSS)2007 eighth grade dataset; a significance level of 0.05 was used. There were
significant differences between students’ gender on the achievements. While controlling for
student-level demographic characteristics, revealed the substantial predictive effects in
level-1 predictors of students’ positive affect toward science, students’ valuing science,
students’ self-confidence in learning science and also significant effect of science teachers’
expectations ,the level 2 predictor, on science achievement on of eighth-grade students.
About 36% of the variation in achievement was found among the Taiwanese schools.
Cross-gender teacher expectations effects between students and teachers were also found.
The Development of Computerized Bodily-Kinesthetic Test
Poster Session : Tuesday, 19 July, 6:00 p.m. -- 7:30 p.m.
Yung Chih Ou*,National Taiwan Normal University, Taiwan
Po-Hsi Chen, National Taiwan Normal University, Taiwan
The purpose of the study is to assess the bodily-kinesthetic intelligence of multiple
intelligence theory (Gardner, 1983) efficiently and objectively. According to Gardner’s
definition, the bodily-kinesthetic intelligence includes two major components:
Bodily-Dancer Abilities and Kinesthetic Athlete. The former is to control one’s body, such
as the way gymnasts control their bodies to perform perfectly; the latter is to handle objects
skillfully, such as the ways in which tennis players interact with their partners or
competitors. We used three indexes to assess: 1) balance refers to self-control ability, 2)
reaction time refers to skillful interaction, and 3) hand-eye coordination refers to a
combination of both. We developed a computerized test that contains subtests of the three
indexes. Ninety undergraduate students were asked to perform in front of the screen, and
then the webcam records examinees’ performance and codes their responses. Partial credit
The 76th Annual and the 17th International Meeting of the Psychometric Society Page 219
model (Masters, 1982) were used to analyze the data. The results reveal that most items
were stable but tended to be easy. In addition, we used latent regression analysis to examine
the gender differences. The results indicated that the female performed better than the male
students. The items and samples of this computerized bodily-kinesthetic test will be
increased in future research.
Sensation Seeking and Tobacco and Alcohol Use Among Adolescents: A Mediated
Moderation Model
Poster Session : Tuesday, 19 July, 6:00 p.m. -- 7:30 p.m.
Baojuan Ye*, South China Normal University, China
Dongping Li, South China Normal University, China
Qishan Chen, South China Normal University, China
Yanhui Wang , Jiaying University, China
Based on ecological systems theory and social learning theory, this study constructed a
mediated moderation model in which stressful life events moderated the relationship
between sensation seeking and tobacco and alcohol use, and this moderation effect was
mediated by affiliation with deviant peers. Participants were 660 adolescents, and they
completed the sensation seeking scale, stressful life events scale, affiliation with deviant
peers questionnaire, and tobacco and alcohol use questionnaire. The results indicated that:
(1) adolescents’ sensation seeking was a risk factor of tobacco and alcohol use; (2) stressful
life events moderated the effect of sensation seeking on tobacco and alcohol use; (3)
affiliation with deviant peers mediated this effect.
Scoring Thresholds Setting for open-ended items on double-marking online system
Poster Session : Tuesday, 19 July, 6:00 p.m. -- 7:30 p.m.
Lina Wang*, Beijing Normal University, China
Bo Wang, The Chinese University of Hong Kong , China
Hong-Sheng Che, Beijing Normal University, China
Meng Chen, Beijing Normal University, China
Ran Bian, Beijing Normal University, China
The paper aims to attract the researchers’ interest in Scoring Thresholds Setting for
open-ended items on double-marking online system. Now, open-ended items are being
wildly used in various areas. The double-marking online system is used to improve the
reliability of the rating. One examinee’ response is distributed to two raters randomly, if the
two raters score the same examinee’ response within the scoring thresholds, the final score
is the average of the two raters’ scores; if not within it, the examinee’ response will be sent
The 76th Annual and the 17th International Meeting of the Psychometric Society Page 220
to the third rater. And if the third score of the examinee’ response is within the scoring
threshold with one of the two former scores, the final score is the average of the two scores
within scoring threshold. If the third score is not within scoring threshold with either, the
examinee’ response will be sent to the fourth rater, who are often experts, to determine the
final score.
How large should the scoring threshold be? The usual scoring threshold is 1/6 or 1/5 of the
full score. In one large-scale examination, 245,890 attended it in 2009. The full score of the
essay writing was 40. The scoring threshold was 8. When deleting the zero-score examinees,
the average score of the item was 20.73, with standard deviation 3.72. The scoring threshold
8 is two times more than the standard deviation, which might be too large to control the
rating quality. Therefore, how to set the scoring threshold dynamically should be researched
by future research.
Measured Subgroup Mean Differences in Cognitive Ability Tests: Do Scoring Methods
Matter?
Poster Session : Tuesday, 19 July, 6:00 p.m. -- 7:30 p.m.
Li Tony*, Kenexa, UK;
Keeley Sean, Kenexa, UK
Cognitive ability tests are widely used in employment selection, education admission, and
other high-stakes situations due to their proven validity in predicting performance. In
assessing human talent, a dilemma is that these tests show substantial differences between
ethnic groups. Using the test often leads to adverse impact by disproportionally selecting
members from certain racial groups, resulting in social, legal, and scientific debates.
Various strategies have been proposed to minimize adverse impact whilst maintaining the
validity of selection tools.
The presentation aims to demonstrate the impact of scoring methods in passage-based
cognitive tests on observed group mean score differences. Four scoring procedures are
compared: (1) classical test theory scoring, (2) unidimensional IRT scoring, (3) polytomous
IRT scoring, and (4) testlet IRT scoring. Significant mean score differences are evident in
CTT and unidimensional IRT scoring methods. The group differences are found to be
insignificant after applying polytomous IRT and particularly testlet IRT model. Practical
implications will be discussed in the context of adverse impact. Further debate is called for
to evaluate the magnitude of group mean score differences in cognitive ability tests.
Devising a moral judgment test for the measurement of care: A lost dimension from a
psychometric perspective
Poster Session : Tuesday, 19 July, 6:00 p.m. -- 7:30 p.m.

The 76th Annual and the 17th International Meeting of the Psychometric Society Page 221
Huan-Wen Chen*,National University of Tainan, Taiwan
The purpose of this study is to develop a moral judgment test for the measurement of the
‘care’ dimension long neglected in the tradition of cognitive-developmental moral
framework such as Piagetian or Kohlbergian ones. Literature review is widely researched
from various fields to provide a rationale to construct such a test. The items in the test are
real-context and daily-life based and cover a wide range of spheres. One of the focuses of
this research is to apply psychometric models such as polytomous IRT models to the
analysis of the response patterns obtained from the moral judgment test. With some of the
basic assumptions of IRT models met, the advantages of the application of IRT models will
facilitate the interpretation of the test results.
The effects of music learning in elementary school through the Dalcroze Eurhythmics
Poster Session : Tuesday, 19 July, 6:00 p.m. -- 7:30 p.m.
Mei-lin Chen*, National Taiwan University of Art, Taiwan
In order to enhance the quality of education, the Ministry of Education has carried out lots
of policies about art education since 1993. However, the research about “Arts and
Humanities Domain” is still quite less. In addition, there are many discussions about
teaching method of music education. The information talked about Dalcroze Eurhythmics,
nevertheless, is so poor.The teaching method of Dalcroze Eurhythmics is the first
revolutionary experiment about music. Dalcroze, what’s more, affected deeply Orff and
Kodaly. The purpose of this study is to understand how to use Dalcroze Eurhythmics in
“Arts and Humanities Domain” and to explore the effects after lessons. The study adopts
the design of instructional experiment. The subjects are two 3rd-grade classes from an
elementary school in Taipei County. One class is experimental group and the other one is
control group. The classes take 40 minutes per week for 10 weeks. Besides, the researcher
makes a pre-test before class and a post test after whole lessons. The questionnaire is a
support for study.
The research found expectedly it is possible to use Dalcroze Eurhythmics in “Arts and
Humanities Domain”. Furthermore, using method of Dalcroze Eurhythmics enhanced
effects obviously in learning music. However, there’s teaching limit. Especially, the main
problem is lack of qualify to teach.
Solving complex optimization problems with many parameters by means of optimally
designed block-relaxation algorithms
Poster Session : Tuesday, 19 July, 6:00 p.m. -- 7:30 p.m.
Tom F. Wilderjans*,Katholieke Universiteit Leuven, Belgium
The 76th Annual and the 17th International Meeting of the Psychometric Society Page 222
Iven Van Mechelen, Katholieke Universiteit Leuven, Belgium
Dirk Depril, Katholieke Universiteit Leuven, Belgium
Many data analysis problems involve the optimization of a criterion that is a function of
many parameters, with these parameters being continuous, discrete, or a combination of
both. To deal with such optimization problems, the class of block-relaxation algorithms
(e.g., alternating least-squares algorithms) may be most useful. Characteristic of the
algorithms that belong to this class is that the set of parameters is divided into a number of
subsets, and that for each subset in turn the parameters that belong to it are updated until
there is no further improvement in the loss function value. The parameter subsets are
constructed in such a way that the optimal values for the parameters in each subset
(conditional on the current estimates of the parameters in all other subsets) can be
determined easily (e.g., in terms of closed-form expressions). When designing a
block-relaxation algorithm, two choices need to be made, which may influence the
performance of the algorithm: (1) the way in which the parameters are divided in subsets,
and (2) the order in which the parameter subsets are updated.
In this presentation, based on theoretical and empirical arguments, guidelines for optimally
designing block-relaxation algorithms will be derived. As an illustration, these guidelines
will be applied to the estimation of the INDCLUS model (i.e., a mixed discrete-continuous
optimization problem). Different alternating least-squares algorithms for fitting the
INDCLUS model will be proposed and compared to each other in an extensive simulation
study.
Using the Rasch Testlet Model to Detect Testlet DIF in Chinese Passage-based
Reading Testing
Poster Session : Tuesday, 19 July, 6:00 p.m. -- 7:30 p.m.
Congying Guo*, Beijing Normal University, China
Yufang Bian, Beijing Normal University, China
Detecting Differential Item Functioning is to ensure a fair test. With the development of test
forms, testlet form test enjoys more and more popularity in Education and Psychological
Testing. Passage-based form is a typical example of testlets, so the DIF procedures that are
adopted must be able to handle the testlet effect properly. Current methods to deal with
testlet effect fall into two categories: the alternative/indirect approach and the testlet
model-based approach. The latter is more methodically sound, it provides the DIF effect of
each item rather than the whole testlet.
This study pursues the second path and solve the testlet DIF issue in passage-based reading
tests by using the Rasch Testlet Model, which is derived from the testlet model-based
The 76th Annual and the 17th International Meeting of the Psychometric Society Page 223
approach. DIF is taken into account by adding DIF parameters into the Rasch testlet model.
The first part employed the Rasch Testlet Model to detect DIF through a reading
achievement test. The bootstrap method is conducted to approximate the standard errors of
the estimators for the DIF parameters so that the Wald statistic can be computed to test the
null hypothesis of no DIF.
The second part was a comparison study between the Rasch Testlet Model and traditional
Rasch Model and the result displays the necessity and advantage of the testlet model-based
approach.
The results indicated that the testlet model-based approach were more technically sound
than the non-testlet DIF procedures for passage-based testing.
The Development of the Chinese Janusian Thinking Test for college Students
Poster Session : Tuesday, 19 July, 6:00 p.m. -- 7:30 p.m.
Wei-Chun Li*, National Taitung University, Taiwan
The purpose of this research is to design a standardized Chinese janusian thinking test for
college students to enrich the tool resource of research application. The related researches
on “janusian thinking” were reviewed first, and then a scientific and systematic sample of
janusian thinking was selected to construct the test. After the pilot-test, there were 20 items
to be selected for the formal test which were categorized into two categories in each age
group. There were eight to twelve items in each category. 304 college students were
sampled as the norm. The Cronbach α coefficient was 0.836 to 0.882. The correlation
coefficients between the two subtests were 0.871.
The performance of different background college students was also analyzed. The result
showed that the better the college students’ Chinese achievement was, the better their
Chinese janusian thinking ability was. Besides that, the gender difference only found for the
fourth graders was found for all age groups. Moreover, this study also investigated other
factors about janusian thinking test, such as common item and the way item presented. The
results suggested the higher graders performed better in common items. Overall, this test
functions effectively for the preliminary screening purpose.
Fixed parameter calibration methods and its application to DIF analysis in online
calibration designs
Poster Session : Tuesday, 19 July, 6:00 p.m. -- 7:30 p.m.
Fabiola Gonzalez-Betanzos, Autonoma University of Madrid, Spain
Francisco J. Abad*, Autonoma University of Madrid, Spain
Juan Ramon Barrada, Autonomous University of Barcelona, Spain
The 76th Annual and the 17th International Meeting of the Psychometric Society Page 224
In large-scale application of computerized adaptive testing programs it is common the
periodic need to renew item bank. For this purpose, pretest items are presented in
conjunction with operational items. Pretest items are calibrated with an IRT model and
possible DIF is analyzed. In the present study we compare the free parameter calibration
method with imputed responses with three fixed parameter calibration methods, which
differ in the number of updates of the previous distribution and the number of EM cycles.
The manipulated factors are: (a) test length; (b) kind of DIF; (c) DIF size; (d) difficulty and
discrimination of the pretest item; (e) sample size; and (f) ability distribution of the focal
group. Overall, no differences were found between methods with regard to Type I error and
power in detecting DIF. The free parameter calibration method with imputation of missing
responses underestimated the variance of the focal group, which leads to an overestimation
of the size of DIF. The fixed parameter calibration method with multiple prior updates and
multiple EM cycles was the most efficient in the recovery of the item parameters and the
ability distribution of the groups.
Evaluating the Consistency of Verbal Reports and the Use of Cognitive Models in
Educational Measurement
Poster Session : Tuesday, 19 July, 6:00 p.m. -- 7:30 p.m.
Xian Wang*, University of Alberta, Canada .
Jacqueline P. Leighton, University of Alberta, Canada
In the field of psychology, verbal reports are commonly used as a data source to explain
human information processing. To date, few studies have investigated the accuracy of
verbal reports for providing information on students’cognitive models during problem
solving on educational tasks. The purpose of this study is to evaluate the consistency of
concurrent and retrospective verbal reports, as well as the effects of student achievement,
interviewer knowledge level, and item difficulty on the consistency of verbal reports. There
were seventy-one Grade 12 students from two high schools involved in the study, which
included 39 girls and 32 boys enrolled in Grade 12 university-tracked pure mathematics
course. All students participated in a think-aloud interview and provided verbal responses to
15 multiple choice test items from the Alberta Pure Mathematics Diploma Examination.
Interviewer knowledge level was manipulated as between-subject variable and item
difficulty was manipulated as within-subject variable. The descriptive analyses indicated
that students were generally consistent in using the same cognitive models during
problem-solving. Independent t-tests showed significant effect of student achievement on
the consistency, namely, higher-achieving students demonstrate greater consistencies in
verbal reports than moderate achieving students. The one-way ANOVAs indicated that
there is no significant effect of interviewer knowledge level and item difficulty on the
The 76th Annual and the 17th International Meeting of the Psychometric Society Page 225
consistency of verbal reports. Overall, the study indicated that eliciting verbal reports from
both concurrent and retrospective generally leads to consistent information about
students’cognitive models in the domain of educational measurement.
Assessing fit of the DINA models
Poster Session : Tuesday, 19 July, 6:00 p.m. -- 7:30 p.m.
Jung Yeon Park*, Columbia University, USA
Cognitive diagnosis model is an advanced psychometric model that evaluates student
strengths and weakness for problem solving in which specific skills are required in that this
model classifies examinees into latent classes determined by vectors of binary skill
indicators, and in the language of more general latent class modeling, models for doing this
are called multiple classification latent class models (Maris,1999). DINA(The deterministic
inputs, noisy “and” gate ) model is one of the most well-known CDM because it is tractable
and easily interpretable.However one of the weaknesses noted by previous researches is its
expensiveness in terms of parameter estimation in saturated model assumption of skill
vectors.
For a decade there have been active researches for DINA model fit within fully Bayesian
framework with MCMC algorithms. Based on Junker and Sijstma(2001). The higher-order
DINA(HO-DINA) suggested De la Torre and Douglas(2004) significantly reduced the
computational complexity from the saturated model. Also Henson et al (2009) applied
log-linear cognitive diagnosis model to DINA model. Recently G-DINA model has been
introduced with more relaxed model assumption(de la Torre,2011).
Thus purpose of this study is to review and estimate all those models and examine which
model is better fit. The data analysis with Tasuoka(1990) and simulation studies will be
done with MCMC implementation. As a model selection criteria, the Bayes factor of
Carlin-Chib (Carlin & Chib, 1995) which fine-tune pseudopriors that works well with the
posterior distribution, Posterior predictive model checking (PPMC), DIC,AIC, and BIC will
be used to examine performance of each criteria.
Teacher’s beliefs, attitudes, and professional development: A cross-country analysis
using multilevel modeling
Poster Session : Tuesday, 19 July, 6:00 p.m. -- 7:30 p.m.
Chi Chang*, Michigan State University, USA
The purpose of this study is based on two questions: whether there are significant
differences among countries with regard to teacher’s professional development willingness,
and how teacher’s background, their teaching beliefs, and attitude explain it. 46,061
The 76th Annual and the 17th International Meeting of the Psychometric Society Page 226
teachers in 14 countries in Organizational for Economic, Cooperation and Development
(OECD) 2008 Teaching and Learning International Survey dataset (TALIS) were
investigated. In the meantime, national-level specific variables of these countries from
OECD database were linked with TALIS for examining whether education investments of
countries make teacher’s perception of professional development different. The blockwise
multilevel logistic regression were performed using HLM software. The findings reveal
significant cross-country differences in teacher’s professional development willingness.
They are not only driven by teaching constructivism beliefs, but also significantly
influenced by nation-specific characteristic. In addition, the finding also brings out the
importance of latent class analysis in the application of multilevel modeling for future
analyses.
A new cognitive diagnosis model for analyzing multiple-choice options
Poster Session : Tuesday, 19 July, 6:00 p.m. -- 7:30 p.m.
Koken Ozaki*, The Institute of Statistical Mathematics, Japan
A new cognitive diagnosis model (based on DINA model) for analyzing multiple-choice
options is developed. The method has the same purpose as de la Torre (2009). The
difference is that the deloped method has the much smaller number of parameters than his
method but can elaborately expresses response behaviors of examinees. The results of a
simulation study will be shown.

The 76th Annual and the 17th International Meeting of the Psychometric Society Page 227
Wednesday, 20 July, 2011
Cognitive Diagnosis Modes, Item Response Theory, Mixture IRT, Latent Transitions
Models, The Many Faces of Latent Class Analysis
Invited Symposium : Wednesday, 20 July, 11:10 a.m. – 12:30 a.m., D1-LP-03
Extended LogLinear Rasch Models
Henk Kelderman*, VU University Amsterdam, The Netherlands
Rasch models are equivalent to loglinear models with latent class variables. Within the
larger framework of loglinear models, various extensions of the Rasch model can be
formulated. We discuss log-linear Rasch models for polytomous items, log-linear
multidimensional Rasch models, Rasch models violating measurement invariance, mixture
distribution Rasch models, mixture measurement Rasch models, Rasch models where item
responses are conditionally dependent, and Rasch models with latent responses. We also
give some software scripts.
A Variational Approximation Estimation Method for the Item Response Theory
Model with Random Item Effects across Groups
Frank Rijmen*, Educational Testing Service, USA
Item response theory is the dominant approach to analyze the data stemming from
international educational assessments conducted in many countries. The assumption that all
items behave the same in all countries is often not tenable. The variability of item
parameters across populations can be taken into account by assuming that the item
parameters are random effects with a distribution that is defined over populations. However,
the complex latent structure of such a model, with latent variables both at the item and the
person level, renders maximum likelihood estimation computationally challenging. This
inherent complexity of the model can be easily shown when adopting a graphical model
framework. There is a need for the development of estimation methods that offer good
approximations to maximum likelihood estimation but are computationally feasible. A
variational estimation technique is presented that consists of approximating the likelihood
function by a computationally tractable lower bound. An advantage of the variational
method is that it can be used regardless of the distributional assumptions of the random
effects. The method is evaluated in a simulation study and applied to the Progress in
International Reading Study of 2006. The results of the simulation study indicate that all
model parameters are recovered well. In the application, a high positive relation was found
between the magnitudes of the model-based variances of the item parameters and the sizes
The 76th Annual and the 17th International Meeting of the Psychometric Society Page 228
of the likelihood ratio statistics testing for differential item functioning under a logistic
regression approach.
Why latent class models are cognitive diagnosis models – or the other way around…
Matthias von Davier*, Educational Testing Service, USA
Xueli Xu, Educational Testing Service, USA
Kentaro Yamamoto, Educational Testing Service, USA
The equivalency of certain types of ordered latent class models and the Rasch model is a
well established fact (DeLeeuw & Verhelst; 1986; Formann, 1985; Lindsay, Clogg & Grego,
1991; Heinen, 1991). Kelderman (1984) showed that Rasch models are equivalent to
log-linear models with latent class variables. Many free and commercially available
software programs for item response theory (IRT) analyses utilize the EM algorithm and
estimate the latent ability distribution as a unidimensional array of ordered latent classes.
Together with constraints on class specific response probabilities, latent class analysis (LCA)
can be used to ‘emulate’ a large variety of models, including IRT, multidimensional IRT
models, and diagnostic models. For example: Haberman, von Davier & Lee (2008) have
shown that a surprisingly small number of ordered levels per dimension can be used in a
latent class model that is essentially indistinguishable from a multidimensional IRT model
with normally distributed latent variables. In a recent commentary on a survey of diagnostic
models, von Davier (2008) has argued that diagnostic classification models can be re-cast as
latent class models. To be sure, even when recasting a diagnostic model in terms of a
constrained LCA, there is still the threat of multiple, equivalent representations (Maris &
Bechger, 2008).
The presentation delivers some new results on this equivalency of well-known
psychometric models and constrained latent class models and discusses implications for
model selection.
New Directions with Intensive Longitudinal Data
Invited Symposium : Wednesday, 20 July, 11:10 a.m. – 12:30 a.m., D1-LP-04
Accommodating Nonergodicity Across Individual Processes Using an Alternative to
Granger Causality
Kathleen M. Gates*, The Pennsylvania State University, USA
Peter C. M. Molenaar, The Pennsylvania State University, USA
Michael J. Rovine, The Pennsylvania State University, USA
Nilam Ram, The Pennsylvania State University, USA
The 76th Annual and the 17th International Meeting of the Psychometric Society Page 229
Process-oriented researchers often wish to identify the lead-lag relationships among
variables and the influence of specific events on those relationships. Unfortunately, the
current standards in the social sciences for arriving at group inferences from time series data
sometimes produce results which fail to describe the individuals comprising the group. This
greatly diminishes the utility of the findings. Such results occur because the processes are
nonergodic across individuals. In this paper we offer a practical solution that provides
unbiased group-level estimates while acknowledging individual-level nuances in relations
among variables across time. To demonstrate the problem and solution, we utilize a
state-space modeling approach recently introduced to the neuroscience community, the
extended unified SEM (euSEM). The euSEM estimates the direct and bilinear influence of
external events in addition to lagged and contemporaneous relations among variables. First,
using Monte Carlo simulations we demonstrate the biases that may result when using
standard methods of analysis on time series data. Second, we present a technique which
utilizes an entirely automatic search procedure, implemented via an in-house Matlab
program that utilizes Lisrel, which makes use of selection criteria akin to Granger causality
for arriving at a group model which accounts for individual differences and yields valid
group inferences. Third, we demonstrate the utility of the alternative approaches using
empirical data from daily diary and functional MRI studies. The generalizability of our free
program for identifying optimal group-level models offers the potential for improving the
practical utility of group inference across multiple domains in the social sciences.
Modeling the Dynamics in Physiological Arousal between Children with Sensory
Processing Disorder and Therapists during Psychotherapy
Siwei Liu*, The Pennsylvania State University, USA
Peter C. M. Molenaar, The Pennsylvania State University, USA
Michael J. Rovine, The Pennsylvania State University, USA
Matthew Goodwin, The Pennsylvania State University, USA
Physiological arousal is an important aspect in psychotherapy for children with Sensory
Processing Disorder (SPD). Synchrony in physiological arousal between children and
therapists reflects the social-emotional process during psychotherapy and is likely to affect
therapy outcomes. We obtained multivariate time series of electrodermal activity (EDA)
from 22 pairs of children with SPD and their therapists. EDA was measured by two wireless
sensors worn on the right and left ankles of both the child and the therapist during
individual therapy sessions that last approximately 1 hour. Values were recorded from the
sensors every 500 millisesconds. We applied time-frequency analysis to each therapy
session. Specifically, a moving-window vector autoregressive model is fitted to obtain the
power spectrum, coherency, and partial-directed coherence (PDC) estimates for the
The 76th Annual and the 17th International Meeting of the Psychometric Society Page 230
multivariate time series. The PDC estimates allow for Granger causality testing in the
frequency domain. Our preliminary analysis of one therapy session indicates that low
frequency components explain most of the variation in EDA for both the child and the
therapist. The synchrony in EDA is high at the beginning of the therapy session, low at the
middle of the session, and increases slightly towards the end. More importantly, a
unidirectional influence was found from the therapist to the child, but not from the child to
the therapist. These results provide insight to child-therapist interaction during therapy and
can be used to identify activities or strategies that are most influential to the child. The
method developed can be used to study interpersonal physiological dynamics in other
settings.
Time-Varying Effect Model of Intensive Longitudinal Data: An Application to
Smoking Cessation Behavior
Mariya Shiyko*, The Pennsylvania State University, USA
Xianming Tan, The Pennsylvania State University, USA
Runze Li, The Pennsylvania State University, USA
Saul Shiffman, The University of Pittsburgh, USA
Study designs that employ ecological momentary, ambulatory, or other types of
intensive-longitudinal-data (ILD) assessments are frequently interested in the relationship
between covariates (time-varying or time-invariant) and intensively-sampled processes (e.g.
smoking urges, pain intensity). Current models for analyzing these data (e.g. mixed-effects
models) make an assumption of the constant effect of a covariate on an outcome. In this
study, we build on richness of analytical approaches for functional data and present a
time-varying effects model (TVEM). TVEM is a non-parametric approach to estimating
functional forms of model parameters. Incorporating the P-spline approach, added to PROC
MIXED, we are able to extend the mixed-effects model such that intercept and slope
parameters are represented by functions varying with time. In our empirical example, we
examine ecological momentary assessment data from a smoking-cessation study of 304
participants. The model is applied to explore the dynamic association between self-efficacy
(confidence) for quitting and intensity of smoking urges after the quit attempt. We
demonstrate how the magnitude of the relationship changes as a function of days post-quit.
Implications of the model are discussed.
Parallelism, Ergodicity, and Psychological Explanations
Keith A. Markus*, The City University of New York, USA

The 76th Annual and the 17th International Meeting of the Psychometric Society Page 231
Discussions of the impact of non-ergodicity on inferences from psychological data often
frame the issue in terms of a binary contrast between variation between people and variation
within people (Molenaar, 2004; 2007). The Principle of Parallelism suggests that one can
frame these issues in terms of a broader range of research design features (Reichardt, 2006).
Rubin's Causal Model (Rubin, 1974; Holland, 1986) provides an approach to analyzing
inferences from comparative data to causal effects. The effect of circling verbs on reading
comprehension provides a concrete example for exploring the conceptual relationships
between these three ideas. One characterization of these relationships focuses on a common
causal effect and attributes differences in observed effects to various biases. This approach
fails to capture the value of explanations in terms of stable noncausal patterns. An
alternative characterization embraces back-tracking counterfactuals (Lewis, 1986) as a
useful tool in psychological explanation. Such counterfactuals link two effects of the same
cause. This characterization offers a more constructive understanding of various practices of
psychological explanation. This characterization suggests parallel strengths and weaknesses
in studying various types of variation. It also suggests that such explanations rely on the
idea of conditional non-governing psychological laws (Beebee, 2000). Non-governing laws
have greater counter-factual fragility than governing laws and thus support a narrower range
of inferences. Explanations based on such laws generalize less than purely causal
explanations. The analysis of non-ergodicity across a range of design elements using
Rubin's Causal Model helps illustrate the value and limitations of this type of explanation.
Comparison of Small-Sample Equating Methods for Mixed-Format Tests in a NEAT
Design
Parallel Session: Equating and Linking; Wednesday, 20 July, 11:10 a.m. -- 12:30 p.m.;
D1-LP-06
Euijin Lim*, Yonsei University, South Korea
Hwangkyu Lim, Yonsei University, South Korea
Guemin Lee, Yonsei University, South Korea
Traditionally, it was generally agreed that identity equating is better than any other equating
method when sample sizes per test form are under 100 (Hanson, Zeng, & Colton, 1994;
Kolen & Brennan, 2004). However, recently published studies proposed that applying
circle-arc equating method leads to more accurate equating results than does identity
equating even when sample sizes are very small (Kim & Livingston, 2010; Livingston &
Kim, 2008, 2009, 2010). The purpose of this study was to compare the accuracy of
small-sample equating methods for mixed-format tests in a NEAT design. Several
simulation studies were conducted to examine which method would be preferable under
certain conditions including sample size, composition of anchor items, and test difficulty.
The 76th Annual and the 17th International Meeting of the Psychometric Society Page 232
Levine mean, Levine linear, Levine simplified circle-arc equating methods and Identity
equating were implemented for simulated data.
It was found that RMSD sharply increased when sample size was reduced from 25 to 10 for
a new form and 75 to 30 for an old form, respectively. When sample size was extremely
small in case of 10 for a new form and 30 for an old form, an anchor test composed of
constructed response items leaded to smaller RMSD than did anchor tests containing
multiple-choice items. Also, when the test difficulties between old and new forms were
similar, identity equating appeared a better way to decrease RMSD. On the other hand,
when the test difficulties were different, equating methods such as Levine mean and
circle-arc equating methods reduced RMSD than did identity equating.
Considerations to Evaluate Equating Results Based on IRT Calibration and Equating
Parallel Session: Equating and Linking; Wednesday, 20 July, 11:10 a.m. -- 12:30 p.m.;
D1-LP-06
Yue Zhao*, The Hong Kong Institute of Education, Hong Kong
Item Response Theory (IRT) is commonly used to calibrate and equate the state assessment
test programs. Equating is one of the crucial steps to generate score conversion table which
is used for producing scale score and proficiency level for each individual student. Whether
or not the equating is conducted properly considering its practical consequences? Whether
or not the anchor set is appropriately applied for the use of equating? Are there any outlier
anchor items to be removed from the anchor set? This presentation highlights some
considerations to evaluate equating results, including IRT model fit, Test Characteristic
Curves (TCCs), score distributions, the score and proficiency profile from the reference
year, and property of the anchor set. Also, the consideration and alternative to remove
outlier anchor items is discussed. Examples are illustrated as well to address the practical
consequences of equating.
The Comparison of IRT Equating Methods and Link Plans in Large Scale Assessment
Parallel Session: Equating and Linking; Wednesday, 20 July, 11:10 a.m. -- 12:30 p.m.;
D1-LP-06
Yan Gao*,Beijing Normal Univeersity, China
Tingting Yang, Beijing Normal Univeersity, China
Tao Yang, Beijing Normal Univeersity, China
Mengjie He, Beijing Normal Univeersity, China
Equating is an important step in the process of developing a test. Through various
researches have been done on different equating methods, it is rare to see studies on the
The 76th Annual and the 17th International Meeting of the Psychometric Society Page 233
effect of various equating plans, especially on the precision of different equating methods in
the context of various equating plans. This paper focuses on comparing the accuracy of
different equating methods and equating plans in the common-item nonequivalent groups
design study. Three equating methods were compared: Stocking & Lord approach,
mean-mean approach, and concurrent calibration method. And two linking plans were
studied: the focus equating plan and the chain equating plan. The research used the real test
data with large sample criteria as equating criteria and RMSE as precision indicator.
The results showed that the precision of Stocking & Lord approach, mean-mean approach
was better than that of concurrent calibration. Generally speaking, mean-mean approach
resulted in a smaller RMSE than that of Stocking & Lord approach in the process of
estimating slope parameters, and Stocking & Lord approach resulted in a smaller RMSE
than that of mean-mean approach in the process of estimating threshold parameters.
Comparison of Multiple-Group and Single-Group Calibration Methods for Linking
Parallel Session: Equating and Linking; Wednesday, 20 July, 11:10 a.m. -- 12:30 p.m.;
D1-LP-06
Won-Chan Lee*, University of Iowa, USA
Ja Young Kim, University of Iowa, USA
In a common-item nonequivalent group equating design, two forms of a test (new and old
forms) have a set of items in common, and two groups from different populations are
administered the two forms. IRT parameter estimates for the two test forms, if calibrated
separately, will not be on the same ability scale because the two groups are from different
populations. The goal of IRT linking is to place the two sets of parameter estimates from the
two different groups on the common scale through the common items. This study compares
two linking methods, the multiple-group calibration (MGC) and single-group calibration
(SGC) methods. The MGC calibrates the data from both forms together and one of the
groups is specified as a reference group so that the resultant parameter estimates for the
other group will be on the scale of the reference group. By contrast, the SGC uses the same
combined data as for the MGC, but it treats the data as if they are from the same single
population. Consequently, the parameter estimates for the two forms will be on the scale
that can be referred to as a combined population. The primary purpose of this study is to
evaluate and compare the performance of the two linking methods using a simulation study.
Performance Evaluation of Plausible Value Method in the Equated Tests
Parallel Session: Equating and Linking; Wednesday, 20 July, 11:10 a.m. -- 12:30 p.m.;
D1-LP-06
Shiau-Chian Tseng*, National Taichung University, Taiwan

The 76th Annual and the 17th International Meeting of the Psychometric Society Page 234
Huey-Min Wu, National Academy for Educational Research, Taiwan
Bor-Chen Kuo, National Taichung University, Taiwan
Kai-Chih Pai, National Taichung University, Taiwan
For large-scale assessments, the spectrum of subject matter is usually wide and the
simultaneous sampling of items and students is a practical way to obtain representative
indications of students’ performance. Balanced incomplete block design (BIB) and
non-equivalent groups with anchor test design (NEAT) are two popular test equating
methods for this condition. In addition, the purpose of the large-scale assessment is to
monitor population progress, such as NAEP, TIMSS and PISA and the plausible value
method is usually used to estimate the population characteristics.
The goal of this study is to explore the performance of plausible values method under BIB,
NEAT and complete designs for horizontal equating based on simulated and real data.
Unlike BIB or NEAT designs with missing data, the complete design means that all items
are administrated to the same examinees. The data from Taiwan Assessment of Student
Achievement (TASA) is applied in the real data experiment. The experimental results show
that two linking designs (BIB and NEAT) can lead to more precision estimates by using
plausible value method. Adding background variables can make two linking designs have
better performance and close to complete designs.
Estimation of Classification Accuracy and Consistency under Item Response Theory
Models
Parallel Session: Item Response Theory – Applications; Wednesday, 20 July, 11:10
a.m. -- 12:30 p.m.; D1-LP-07
Ying Cheng*, University of Notre Dame, USA
Cheng Liu, University of Notre Dame, USA
Educational and psychological testing is often used to make classification decisions. For
example, the test scores maybe used to categorize examinees into passing or failure groups,
or different proficiency groups such as high, medium and low. One central issue is how
accurately and consistently these classification decisions are made. Researchers have
developed many methods to estimate classification accuracy and consistency rates based on
one single test administration (e.g. Huynh, 1976a, 1976b; Lee, Hanson & Brennan, 2002;
Livingston & Lewis, 1995; Subkoviak, 1976). These papers mainly focus on the case where
the classifications are made based on number-correct score. It is a well-known fact that the
number-correct score is not a sufficient statistic for the underlying latent trait θ when 2PL or
3PL models are used. Many testing programs, in fact, report scores on the basis of these two
IRT models, and it is therefore interesting and necessary to define and explore classification
The 76th Annual and the 17th International Meeting of the Psychometric Society Page 235
accuracy and consistency under the IRT framework based directly on θ estimates. This
paper discusses exactly the procedure to do that, and how the procedure can be used with
tests with dichotomous or polytomous items, and how the procedure can be easily extended
to more complex decision rules.
Development and Validation of Learning Progression for the Oxidation-Reduction: A
Rasch Measurement Approach
Parallel Session: Item Response Theory – Applications; Wednesday, 20 July, 11:10
a.m. -- 12:30 p.m.; D1-LP-07
Kun-Shia Liu*, National Sun Yat-sen University, Taiwan
Ying-Yao Cheng, National Sun Yat-sen University, Taiwan
Wen Chung Wang, The Hong Kong Institute of Education, Hong Kong
The oxidation-reduction (redox) plays a crucial role in knowledge revolution of chemistry.
However, little research focused on the development of a learning progression for this
concept. This study aims to develop learning progressions and assessment for grades 7-9
students in acquiring the concept of redox. Six experts and three high school chemistry
teachers were recruited into the research team. Through 15 panel discussions, five big ideas
of redox including combustion, oxidation, reduction, oxidation reactivity, and
oxidation-reduction were selected to form the concept map, propositional statements, and
ordered multiple-choice items. Two samples of Taiwanese middle-school students
participated in the test development: one for item revision and the other for validation.
Sample 1 and 2 consisted of 626 and 903 students, respectively. Rasch partial credit model
was applied to assess model-data fit, to examine the differential item functioning between
genders, and to validate student progressions for learning redox reaction. In addition, this
study presented abundant feedback information for learning diagnosis and provided a
mechanism for aligning instruction and assessment.
A Rasch Approach to Measure Undergraduates’ Key Competence
Parallel Session: Item Response Theory – Applications; Wednesday, 20 July, 11:10
a.m. -- 12:30 p.m.; D1-LP-07
Li-Ming Chen*, National Sun Yat-sen University, Taiwan
Ching-Lin Shih, National Sun Yat-sen University, Taiwan
Paichi Pat Shein, National Sun Yat-sen University, Taiwan
Kun-Shia Liu, National Sun Yat-sen University, Taiwan
Ying-Yao Cheng, National Sun Yat-sen University, Taiwan
The 76th Annual and the 17th International Meeting of the Psychometric Society Page 236
This study aims to develop a self-reported instrument to measure undergraduates’ sense of
competence around nine dimensions: lifelong learning, social responsibility, critical
thinking, creativity, communication, leadership, aesthetic understanding, appreciation for
nature, and global perspective. The definitions and test items of these nine subscales were
constructed based on literature review and consultation with international experts. Two
samples of Taiwanese undergraduates participated in the study, one for a pilot test of the
instrument (n=1110) and the other for validation (n=1343). Multidimensional Partial Credit
Model was applied to analyze the data and assess the model–data fit of the instrument. The
results showed that the data fit the MPCM model well and no differential item functioning
(DIF) was found between genders. The person separation reliabilities of the measures from
nine subscales ranged from .88 to .96. The correlations between nine subscales ranged
from .59 to .93. The orderings of item difficulties of the nine subscales were also validated
across the two samples. This study provided evidence to support validity arguments during
the instrument development process. Future research and the application of this scale in
higher education were also discussed.
Item Response Theory Analyses of Adult Self-Ratings of the ADHD Symptoms in the
Current Symptoms Scale
Parallel Session: Item Response Theory – Applications; Wednesday, 20 July, 11:10
a.m. -- 12:30 p.m.; D1-LP-07
Rapson Gomez*, University of Tasmania, Australia
The graded response model (GRM), which is based on item response theory (IRT), was
used to evaluate the psychometric properties of adult self-ratings (N = 852) of the ADHD
inattention, hyperactivity, and impulsivity symptoms presented in the Current Symptoms
Scale (CSS; Barkley & Murphy, 1998). This scale has four ordered response categories. The
results for the discrimination parameters showed that all symptoms were generally good for
discriminating their respective latent traits. For virtually all symptoms, their threshold
values showed that they were especially good at representing the appropriate traits from
around the mean trait level onwards. The item information function values for most
symptoms indicated reasonable reliability from approximately the mean trait level onwards.
All these findings are new, and extend existing psychometric information for adult
self-ratings of the ADHD symptoms in the CSS.
Explanatory Person-Fit Analysis in Clinical Practice
Parallel Session: Item Response Theory – Applications; Wednesday, 20 July, 11:10
a.m. -- 12:30 p.m.; D1-LP-07
Judith Conijn*, Tilburg University, Netherlands
The 76th Annual and the 17th International Meeting of the Psychometric Society Page 237
Wilco Emons, Tilburg University, Netherlands
Marcel van Assen, Tilburg University, Netherlands
Klaas Sijtsma, Tilburg University, Netherlands
Clinicians increasingly use self-report measures in their practice and one of the primary
reasons for doing so is to make important treatment decisions for individual patients.
However, concentration and motivation problems may result in responses that are
inconsistent with the respondent’s latent trait value and impair the validity of these
individual self-reports. Person-fit methods are tools to detect inconsistent response patterns
and they may warn clinicians that prudence is called for when interpreting the individual’s
test score. Existing person-fit methods, however, have limited utility in the clinical practice.
Main disadvantages of existing person-fit methods include the absence of information to
diagnose possible causes underlying the inconsistency and limited power. In the present
study, we propose new explanatory person-fit methods to detect and diagnose response
inconsistency. Using simulated data and empirical data on anxiety measurements in a
clinical population, we demonstrate how these methods can be used to explain variation in
response consistency by mood state, personality, diagnosis, and demographic variables.
Comparing Imputaion Using Differnt Partitions of Data for Latent Class Models
Parallel Session: Missing Data; Wednesday, 20 July, 11:10 a.m. -- 12:30 p.m.;
D1-LP-08
Ting Hsiang Lin*, National Taipei University, Taiwan
Cheng Ken Wu, , Taiwan
Survey is a popular research tool, but often causes missing values for some reasons. When
the proportion of the missing value is high, it can seriously affect the conclusion. Imputation
is an alternative is to handle missing data. For categorical missing data, both model-based
and non- model based imputation methods have been proposed, for example, hot deck
imputation and log-linear models. However, there are still some problems for these
methods.
Latent class analysis (LCA) is a popularly used method for categorical variable. LCA
identifies the optimal number of latent classes based on observed variables, and estimate
class membership probability and conditional probabilities within each class.
Many studies have already used LCA for missing data imputation. We can partition the
missing data as “vertical information”, “horizontal information, and “overlapping
information”. Conventional approach to impute LCA is to use vertical information. We
proposed some algorithms for imputation based on different partitions of the data, i.e.,
“vertical information”, “horizontal information, or “overlapping information”. We are
The 76th Annual and the 17th International Meeting of the Psychometric Society Page 238
particularly interested in studying if there exists difference when using different partition of
the data for imputation.
The imputation methods were evaluated in terms of accuracy rates. The result shows the
significant factors are conditional probability, latent class proportions, number of manifest
variables, imputation method, sample size, missing data mechanism.
Differential Item Functioning (DIF) Analysis under Missing-Data Imputation
Framework (MI-DIF)
Parallel Session: Missing Data; Wednesday, 20 July, 11:10 a.m. -- 12:30 p.m.;
D1-LP-08
Gee Hune Kim*, Columbia University, USA
DIF is defined as differential group performance on test items, conditional on the latent
examinees’ ability variables (Angoff, 1993). Despite its well-established statistical
properties and robust performance, the popular Mantel-Haenszel (MH) test has the issue of
sparse-data asymptotics and decreased power for extreme difficulty items (Sinharay &
Dorans, 2010). In addition, MH-test does not theoretically address non-uniform DIF, and
the issue of possible non-ignorable missing data, e.g., missing data in speeded-test
environment. Another approach, IRT model-based methods, can deal with both uniform and
non-uniform DIF, by considering all item parameters simultaneously, albeit much greater
computational demand to estimate additional item parameters and potential group ability
difference.
Combining both approaches, this study proposes to incorporate missing-data imputation
method for multi-step DIF detection method, MI-DIF. Assuming responses to potential
DIF item(s) in focal group as missing, MI-DIF imputes the missing values utilizing all the
other items in the test. Then, 2x4 contingency table is constructed by comparing the actual
and imputed item responses: 2 groups being focal and reference group, and 4 categories
being hit (both actual and imputed as correct), correct-rejection (both as incorrect),
false-alarm (only imputed as correct), and miss (only imputed as incorrect). Finally, the
null independence hypothesis of this 2x4 contingency table (i.e., non-DIF) is tested under
multinomial distribution assumption. Simulation outcomes for type I error rate and power
for MI-DIF will be presented, and practical implications for available software and actual
testing data will be discussed.
Treatment of Missing Data in the Test Adopting both Basal and Ceiling Rules
Parallel Session: Missing Data; Wednesday, 20 July, 11:10 a.m. -- 12:30 p.m.;
D1-LP-08
Wei He*, Northwest Evaluation Association (NWEA), USA
The 76th Annual and the 17th International Meeting of the Psychometric Society Page 239
In many cognitive or achievement assessments, items are commonly presented in a
sequence of increasing difficulty. To avoid examinee frustration and minimize the cost and
time of testing, not only a basal but also a ceiling rule is adopted, meaning that examinees
may start the test at different items based on their ages, grades, or estimated level of
developmental functioning and end the test at different items as well based on the
termination rule. This practice produces stochastically censored data, a form of
nonignorable missing data; and these missing responses tend to occur at both lower and
higher ends of the test. The purpose of this study is to investigate how accurately examinees'
abilities are recovered in a test adopting both basal and ceiling rules under the framework of
Item Response Theory (IRT). Using simulation approach, this study will explore the effects
of five factors that may potentially affect ability recovery accuracy: 1) treatment of missing
responses caused by both basal and ceiling rules; 2) item densities, i.e., the average
distances between difficulties of consecutive items across the scale; 3) basal rule, i.e.,
starting rule; 4) ceiling rule, i.e., termination rule; and 5) ability estimation method. Both
descriptive and inferential statistical analysis will be used to address research questions.
An Estimation Method for Parameters of Two Multinomial Populations under the
Stochastic Ordering with Sparse or Missing Data
Parallel Session: Computational Methods; Thursday, 21 July, 4:00 p.m. -- 5:20 p.m.;
D2-LP-08
Lixin Meng*,Northeast Normal University, China
Jian Tao, Northeast Normal University, China
Xiang Bin Meng, Northeast Normal University, China
Categorical questionnaire data are often collected from sociological surveys and
psychological tests. Multi-way contingency tables are very useful as a general tool for
summarizing such data. In this paper, when some cells in a multi-way contingency table are
sparse or missing, a parameter estimation method under stochastic ordering is proposed by
amalgamating the sparse or missing cells with their neighboring cells. Compared with
traditional EM algorithm, the new estimation method doesn’t depend on the choice of initial
values of parameters and can guarantee the uniqueness of the maximum of likelihood
function. In addition, a simulation study is conducted to show the performance of the new
method, and an empirical example is used to illustrate its feasibility and applicability.
Social Network Models for Educational Interventions
Parallel Session: Multivariate Data Analysis IV; Wednesday, 20 July, 11:10 a.m. --
12:30 p.m.; D2-LP-08
The 76th Annual and the 17th International Meeting of the Psychometric Society Page 240
Brian Junker*, Carnegie Mellon University, USA
Tracy Sweet, Carnegie Mellon University, USA
Intervention studies in school systems are sometimes aimed not at changing curriculum or
classroom technique, but rather at changing the way that teachers, teaching coaches and
administrators in schools work with one another--in short, changing the professional social
networks of educators. In one such ongoing study, 80 schools in an urban school district are
being randomized into treatment and comparison groups. While longitudinal versions (e.g.
Hanneke, Fu & Xing, 2010; Snijders, Steglich & Schweinberger, 2005) of descriptive and
generative models for a single social network (principally exponential random graph models,
latent space models, and mixed membership block models; e.g. Goldenberg, Zheng,
Fienberg & Airoldi, 2009) have been developed, current approaches are ill-suited to
modeling multiple replications of a social network, or defining or detecting the effect of an
intervention on the social network itself. In this talk I will outline an approach (Sweet, 2011)
that accommodates both multiple social networks as well as intervention effects on social
networks. This approach will be illustrated with real and simulated data.
Regularized K-means Clustering with Variable Weighting
Parallel Session: Multivariate Data Analysis IV; Wednesday, 20 July, 11:10 a.m. --
12:30 p.m.; D2-LP-08
Yutaka Nishida*, Osaka University, Japan
In this study, a new method of k-means clustering is proposed to calculate the weight for
variables. The k-means algorithm is a one of the most popular clustering method, but there
are some problems.
One of them is about variable weighting. Though the k-means algorithm equally treats all
variables when the distance between cluster centers and data points is calculated, there is a
case that a certain variable might be more important than other variables.
The proposed method achieves the purpose of calculating variable weights using an entropy
regularization method (Miyamoto, Ichihashi & Honda, 2008) which is developed to obtain
fuzzy memberships in fuzzy clustering. The proposed method allows us to identify the
important variable for clustering. The usefulness of the proposed method is demonstrated
with synthetic and real data.
In this study, a new method of k-means clustering is proposed to calculate the weight for
variables. The k-means algorithm is a one of the most popular clustering method, but there
are some problems.
The 76th Annual and the 17th International Meeting of the Psychometric Society Page 241
One of them is about variable weighting. Though the k-means algorithm equally treats all
variables when the distance between cluster centers and data points is calculated, there is a
case that a certain variable might be more important than other variables.
The proposed method achieves the purpose of calculating variable weights using an entropy
regularization method (Miyamoto, Ichihashi & Honda, 2008) which is developed to obtain
fuzzy memberships in fuzzy clustering.The proposed method allows us to identify the
important variable for clustering. The usefulness of the proposed method is demonstrated
with synthetic and real data.
The Different Choice of Basis Functions in Functional Data Conversion
Parallel Session: Multivariate Data Analysis IV; Wednesday, 20 July, 11:10 a.m. --
12:30 p.m.; D2-LP-08
Minping Xiong*, South China Normal University, China
Min-Qiang Zhang, South China Normal University, China
In psychological study, psychologists and behavioral scientists are increasingly collecting
data that are drawn from continuous underlying processes, such as longitudinal data from
ERP、fMRI and developmental psychology experiments, these studies produce millions of
data points every few seconds, and the points are correlated both in space and in time.
However, conventional statistical approaches cannot take advantage of the additional
information implied by the smoothness of the underlying functions. The functional data
analysis methods that we describe here can often extract additional information contained in
the functions and their derivatives, not normally available through traditional methods. The
first step of functional data analysis is to convert the raw data into functional objects. A
common procedure representing discrete data as a smooth function is the use of a basis
expansion. There are many different types of basis function systems, such as powers of t or
monomials, Fourier series, B-spline functions, Bernstein functions and so on. The present
study summarized the different basis functions and suggested that researchers should
choose different basis functions on the basis of their research aims or data that they wanted
to analyze.
Functional Analysis of Variance for Data from ERPs
Parallel Session: Multivariate Data Analysis IV; Wednesday, 20 July, 11:10 a.m. --
12:30 p.m.; D2-LP-08
Shuyi Liang*, South China Normal University, China
Min-Qiang Zhang, South China Normal University, China
Minping Xiong, South China Normal University, China
The 76th Annual and the 17th International Meeting of the Psychometric Society Page 242
In many psychological researches, it’s usually necessary to test whether there is any
statistically significant difference between experiment and control groups to demonstrate
the effect of the independent variables. ANOVA is one of the most common techniques.
With the rapid development of psychology in China, psychologists and behavioral scientists
are increasingly collecting data that are drawn from continuous underlying processes.
Although these data are in the form of discrete points, they reflect continuous and
underlying variability of the processes. Consequently, traditional ANOVA, which could
only be used for discrete observations, isn’t the best way to analyze such type of data,
because it ignores their entirety and continuity. As a result, a new technique, functional
analysis of variance, can be used to extend the capabilities of classical ANOVA. Functional
analysis of variance is under the frame of functional data analysis, so its first step is to
convert the raw data into continuous ones, such as in the form of curves or images. Then the
estimated curves, instead of the original data, are used for the rest of the analysis. Evoked
Response Potentials (ERPs) are collected by placing electrodes on the surface of the scalp
and electrical activity is measured in response to various stimuli or tasks. The process
generating the ERPs is continuous. Obviously, much more information can be got if we
analyze them with functional analysis of variance. The aim of this article is to show how we
handle ERPs data with functional analysis of variance appropriately.
Evaluating Order Constrained Hypotheses for Circular Data using Permutation Tests
Parallel Session: Multivariate Data Analysis IV; Wednesday, 20 July, 11:10 a.m. --
12:30 p.m.; D2-LP-08
Irene Klugkist*, Utrecht University, Netherlands
Jessie Bullens, Utrecht University, Netherlands
Albert Postma, Utrecht University, Netherlands
Psychological researchers in different fields sometimes encounter circular or directional
data. Circular data are data measured in the form of angles or two-dimensional orientations.
As an example, an experiment investigating the development of spatial memory and an
experiment investigating the influence of visual experience on haptic orientation perception
are presented. Three permutation tests are proposed for the evaluation of ordered
hypotheses. The quality of the permutation tests is investigated by means of several
simulation studies. The results of these studies show the expected increase in power when
the permutation tests for ordered hypotheses are compared to a common non-directional test
for circular data. The differences in power between the three tests for ordered alternatives
are small.
The Development of Concerto : An Open Source Online Adaptive Testing Platform

The 76th Annual and the 17th International Meeting of the Psychometric Society Page 243
Parallel Session: E-testing; Wednesday, 20 July, 11:10 a.m. -- 12:30 p.m.; D2-LP-10
Michal S. Kosinski*, University of Cambridge, UK
John N. Rust, University of Cambridge, UK
Online and computer adaptive testing systems have long been the jewels in the crown
among the IT resources of the large test publishers who compete with each other to acquire
the necessary knowhow and staff. At the same time there has been a dearth of practical
experience in this field among the academic community, which has seriously handicapped
the development of new skills outside the big company firewalls. At the University of
Cambridge Psychometric Centre we are developing Concerto, an open source adaptive IRT
platform that utilises our combined experience in adaptive algorithms in R, and also in
web-based and social network programming in PHP and HTML. We will present some
results from the trialling of this system on our huge (>6,000,000 users) database of
personality and IQ test data from the Facebook applications myPersonality and myIQ.
The Development of Computer-based Case Simulations for Psychological Counseling
Parallel Session: E-testing; Wednesday, 20 July, 11:10 a.m. -- 12:30 p.m.; D2-LP-10
Peng Wang*,Jiangxi Normal University & Shandong Normal University, China
Haiqi Dai, Jiangxi Normal University, China
Computer-based Case Simulations (CCS) is the world-class medical clinical simulation
system. Computer-based Case Simulations for Psychological Counseling (CCSPC) is
developed in this study in order to measure the subjects’ practical skills and
decision-making styles during the psychological counseling progress, as well as the related
knowledge of concepts, principles and methods, to get a whole assessment of the subjects’
counseling skills.
A case with compulsive neurosis is chosen as the script for computer program. CCSPC is
also developed on the basis of psychological counselors’ competency model. The subjects
interact with the case through four modules, i.e. the beginning of counseling, psychological
testing, diagnoses and differential diagnoses, counseling plan and practice. Large size
sample check proves the stability, security and accessibility of CCSPC. The percent of
stability is 97.34%.
978 subjects take part in the exam of CCSPC. The data is analyzed by the methods of both
Classical Test Theory (CTT) and Item Response Theory (IRT). The analyses by CTT show
the distribution of difficulty is acceptable. The test information of CCSPC is considerably
high. The results from CTT and Bifactor show that the structure of CCSPC data can prove
the competency model to some extent. The two scoring methods (CTT & MIRT) both get

The 76th Annual and the 17th International Meeting of the Psychometric Society Page 244
good evidence of predictive validity. Based on the results of this study and the past studies,
IRT is more suitable for the data analysis of CCSPC.
Building Affordable CD-CAT Systems for Schools To Address Today's Challenges In
Assessment
Parallel Session: E-testing; Wednesday, 20 July, 11:10 a.m. -- 12:30 p.m.; D2-LP-10
Hua-Hua Chang*, University of Illinois at Urbana-Champaign, USA
Most current Computerized Adaptive Testing (CAT) systems are proprietary and can be
operated and managed only by testing companies or commercial testing sites. Schools
usually have no access to resources and activities such as system management and item
bank maintenance. The rapid developments of hardware and network technology have made
CAT applications really affordable to schools. In the presentation a CAT design based on
the cutting-edge Browser/Server Architecture will be introduced. A new, feasible in-school
CAT system should have a turnkey server application that can be installed easily on an
existing laptop or desktop machine, and should provide test administration through a
common, web-based, Internet browser application. The B/S architecture uses commonly
available web-browsing software on the client side and a simple server that can be fitted
onto a regular PC or laptop connected to the school’s existing network of PCs and Macs.
In the presentation we will show that CAT can be used effectively not only to estimate an
examinee’s latent trait, but also to classify the examinee’s mastery levels of the skills the
test is designed to measure. CAT is revolutionarily changing the way we address challenges
in assessment and learning. CAT research has created many exciting transformative
perspectives. For example, the CAT technology originally developed in education is being
used innovatively in health-related quality-of-life (HQOL) measures. Finally, various issues
in current CAT research will be addressed.
Developing an e-Assessment System for English and Putonghua Learning
Parallel Session: E-testing; Wednesday, 20 July, 11:10 a.m. -- 12:30 p.m.; D2-LP-10
Kenneth Wong*, Caritas Institute of Higher Education, Hong Kong
Reggie Kwan, Caritas Institute of Higher Education, Hong Kong
Kat Leung, Caritas Institute of Higher Education, Hong Kong
Philip Tsang, Caritas Institute of Higher Education, Hong Kong
Language learning is always challenging for all students. This paper presents the design of a
self-regulating and diagnostic online learning system in the areas of English and Putonghua
focusing on the concept of “Assessment for Learning”. The e-Assessment system aims to
diversify students’ learning experience and customize the approaches to learn languages
The 76th Annual and the 17th International Meeting of the Psychometric Society Page 245
through self-directed, self-controlled, and to some extent, individually packaged
“assessment” opportunities. The test theory behind the system is based on “Computerized
Adaptive Testing” and “Item Response Theory” implying that the test items will be
tailor-made for students. Students will receive questions in accordance with their ability
levels in English and Putonghua. The item to be selected next fully depends on the student’s
performance on the previous question. If a student gets a correct answer to a given item, the
next question generated will be slightly more difficult and/or subtly different from the
current one. If the answer is wrong, a slightly easier item in terms of linguistic and
conceptual structure will be selected next. By using the e-Assessment system, students can
follow their own pace in learning English and Putonghua in a challenging and unique way.
With the new online assessment system, it is hoped that undergraduate and sub-degree
students’ self-directed learning abilities and motivation in language acquisition will be
significantly improved. This paper delineates the details of developing the prototype of such
an e-Assessment system while a pilot study will be conducted to establish the validity and
reliability of the system in the coming academic year.
Developing a Computerized Performance Assessment Tool for Sensory Integration
Parallel Session: E-testing; Wednesday, 20 July, 11:10 a.m. -- 12:30 p.m.; D2-LP-10
Chin-Kai Lin*, National Taichung University of Education, Taiwan
Huey-Min Wu, National Academy for Educational Research, Taiwan
Bor-Chen Kuo, National Taichung University of Education, Taiwan
The purpose of this study is to develop a computerized performance assessment tool for
bilateral integration and motor sequencing. The bilateral integration and motor sequencing
(BIS), a motor skill, is one of important indicators of diagnosing the dysfunction of sensory
integration in children. Based on the view of performance assessments, the pattern
recognition is combined with the visual surveillance procedures to analyze the bilateral
integration and motor sequencing (the coordination of two hands) and to diagnose the BIS
dysfunction of subjects with a mean age of 5 years 2 months. The participants are selected
from kindergartens in Taiwan, comprising 132 boys and 107 girls. The accuracy of the
computerized performance assessment tool is evaluated by comparison with the judgments
of an expert, an occupational therapist with more than 20 years of pediatric experience, as
the criterion standard. The computerized performance assessment tool for bilateral
integration and motor sequencing assesses children with poor outcomes with an accuracy of
0.85. The computerized performance assessment tool for bilateral integration and motor
sequencing has potential for use in clinical settings to screen children with poor sensory
integration.
The 76th Annual and the 17th International Meeting of the Psychometric Society Page 246
Thursday, 21 July, 2011
Categorical Marginal Models
Invited Symposium : Thursday, 21 July, 11:10 a.m. – 12:30 a.m., D1-LP-03
Marginal Models for Dependent, Clustered, and Longitudinal Categorical Data.
Wicher P. Bergsma*, London School of Economics, UK
Marcel A. Croon, Tilburg University, The Netherlands
Jacques A. Hagenaars, Tilburg University, The Netherlands
In the social, behavioural, educational, economic, and biomedical sciences, data are often
collected in ways that introduce dependencies in the observations to be compared. For
example, the same respondents are interviewed at several occasions, several members of
networks or groups are interviewed within the same survey, or, within families, both
children and parents are investigated. Statistical methods that take the dependencies in the
data into account must then be used, e.g., when observations at time one and time two are
compared in longitudinal studies. At present, researchers almost automatically turn to
multi-level models or to GEE estimation to deal with these dependencies. Despite the
enormous potential and applicability of these recent developments, they require restrictive
assumptions on the nature of the dependencies in the data. The marginal models of this talk
provide another way of dealing with these dependencies, without the need for such
assumptions, and can be used to answer research questions directly at the intended marginal
level. The maximum likelihood method, with its attractive statistical properties, is used for
fitting the models. This talk is based on a recent book by the authors in the Springer series
Statistics for the Social Sciences, see www.cmm.st.
Estimating Categorical Marginal Models for Large Sparse Contingency Tables
L. Andries van der Ark*, Tilburg University, The Netherlands
Wicher P. Bergsma, London School of Economics, UK
Marcel A. Croon, Tilburg University, The Netherlands
Categorical marginal models (CMMs) are flexible tools to model location, spread, and
association in categorical data that have some dependence structure. The categorical data
are collected in a contingency table; location, spread, or association is modeled by
restricting certain marginals of the contingency table. If contingency tables are large,
maximum likelihood estimation of the CMMs is no longer feasible due to computer
memory problems. We propose maximum empirical likelihood estimation (MEL) procedure
for estimating CMMs for large contingency tables, and discuss three related problems: The
The 76th Annual and the 17th International Meeting of the Psychometric Society Page 247
problem of finding the correct design matrices and the so-called empty set problem can be
solved satisfactorily; the problem of obtaining good starting values remains unsolved. A
simulation study shows that for small data contingency tables ML and MEL yield
comparable estimates. For large tables, when ML does not work, MEL has a good
sensitivity and specificity if good starting values are available.
Testing Cronbach's Alpha Using Feldt's Approach and a New Marginal Modeling
Approach
Renske E. Kuijpers*, Tilburg University, The Netherlands
L. Andries van der Ark , Tilburg University, The Netherlands
Marcel A. Croon, Tilburg University, The Netherlands
Feldt developed an approach for testing three relevant hypotheses involving Cronbach's
alpha: (1) Alpha equals a particular criterion; (2) two alpha coefficients computed on two
independent samples are equal; and (3) two alpha coefficients computed on the same
sample are equal. The assumptions of Feldt's approach are unrealistic for many test and
questionnaire data, and little is known about the robustness of the approach against
violations of the assumptions. We propose a new approach to testing the three hypotheses.
The new approach uses marginal modeling and is based on weaker assumptions. The Type I
error rate and the power of both approaches were compared in a simulation study using
realistic conditions. In general, the two approaches showed similar results showing that
Feldt's approach is robust against violations of the assumptions. In some cases, however, the
marginal modeling approach was more accurate: For computing Type I error rates for very
high values of alpha, for computing Type I error rates for hypothesis (3), and for computing
the power of hypothesis (3) using a small sample size.
Marginal Models for Longitudinal Categorical Data from a Complex Rotating Design
Marcel A. Croon*, Tilburg University, The Netherlands
Wicher P. Bergsma, London School of Economics, UK
Jacques A. Hagenaars, Tilburg University, The Netherlands
Francesca Bassi, University of Padova, Italy
In their book Marginal Models for Dependent, Clustered, and Longitudinal Categorical
Data (2009), Bergsma, Croon & Hagenaars discuss several applications of marginal models
for categorical data observed in longitudinal studies. They distinguish between the analysis
of trend data, when different random samples from the same population are drawn at
different time points, and panel data, when the same random sample from a population is
The 76th Annual and the 17th International Meeting of the Psychometric Society Page 248
observed at different time points. For both types of data, they discuss how various
hypotheses about gross and net changes over time can be tested by marginal modeling.
These methods can be extended to the case the data are collected in a more complex way, for
instance, by means of a rotating design in which different random cross-sectional samples are
followed over time at different measurement occasions. The data which will be analyzed
come from the Italian Continuous Quarterly Labour Force Survey, which is cross-sectional
with a 2-2-2 rotating design. The questionnaire yields multiple indicators of labour force
participation for each quarter: (i) each respondent is classified as employed, unemployed or
out of the labour market according to the definition of the International Labour Office on the
bases of answers given to a group of questions (ii) each respondent is asked to classify
himself as employed, unemployed or out of the labour market, the so-called self-perceived
condition; and (iii) a retrospective question asks about condition in the labour market one
year before the interview.
In the analysis of the data from this survey, the emphasis is on the study how changes in
labour status are reflected by each of the three indicators, and how differences and similarities
among them change over time.
Cognitive Diagnostic Computerized Adaptive Testing: Key Issues on Item Selection
Algorithm
Symposium : Thursday, 21 July, 11:10 a.m. -- 12:30 a.m., D1-LP-04
A Comparative Study of Item Exposure Control Methods in Cognitive Diagnostic
Computerized Adaptive Testing
Ping Chen*, Beijing Normal University, China
Tao Xin, Beijing Normal University
Like regular Computerized Adaptive Testing (CAT), the questions of item overexposure,
item underexposure and unevenness of item exposure in high-stakes Cognitive Diagnostic
CAT (CD-CAT) not only will affect the test security, but also will lead to a waste of costs
used in item maintenance and development. And discussions of item exposure control in
CD-CAT have been largely absent from the current literature. In addition, according to a
preliminary study which compared different CD-CAT item selection strategies, the Shannon
Entropy (SHE) method always produced the highest pattern classification correct rate and
was inclined to select the items which have small sum values of the guessing and slipping
parameters. Thus, this study proposed three item exposure control schemes and incorporate
them into the SHE method under the DINA model: (1) stratify the item bank according to
the sum value of the guessing and slipping parameters in descending order (denoted as
SHE(Stra)) as the a-stratified method of Chang and Ying (1999); (2) modified Maximum
The 76th Annual and the 17th International Meeting of the Psychometric Society Page 249
Priority Index (Cheng, 2008) method (denoted as SHE(MMPI)) and (3) the method
combined SHE(Stra) with SHE(MMPI) (denoted as SHE(Stra_MMPI)). Simulation results
showed that the three exposure control methods were able to improve the uniformity of item
pool usage and decrease the test overlap rate. Specially, the SHE(MMPI) and
SHE(Stra_MMPI) methods could largely reduce the maximum item exposure rate and
increase the minimum item exposure rate. However, all these methods improved the quality
of item bank usage at the expense of slightly decreasing the estimation accuracy of the
knowledge states.
Generalized Monte Carlo Approach in Cognitive Diagnostic Computerized Adaptive
Testing with Content Constraints
Xiuzhen Mao*, Beijing Normal University, China
Tao Xin, Beijing Normal University
Cognitive diagnostic computerized adaptive testing (CD-CAT) which combines the
advantages of both cognitive diagnosis and adaptive testing can provides detailed
information about the advantages and disadvantages of the examinees’ knowledge states
just through testing a few items.Test validity is an essential consideration in CD-CAT,
because it is one of the most important factors which affect measurement accuracy. Unlike
traditional paper and pencil test, items for CD-CAT are not assigned before the test starts.
Therefore, it is worthwhile to probe the item selection method for CD-CAT with content
constraints in order to improve the test validity.
With content constraints, the Monte Carlo approach in traditional computerized adaptive
testing (CAT) is generalized to the cognitive diagnostic CAT. When the number of items
measuring each attribute is the only content constraints, this study compares the generalized
Monte Carlo (GMC) method with the modified maximum global discrimination index
(MMGDI) method. Results of the simulation experiments show that: (a) the GMC method
can not only fulfill the requirements of test content, but also produces satisfying results of
measurement accuracy and item exposure; (b) the GMC method outperforms the MMGDI
method when the former one uses posterior-weighted Kullback-Leibler algorithm or hybrid
Kullback-Leibler information as item selection index. In other words, the recovery rates of
knowledge state, the distribution of item exposure and utilization rates of the item bank all
get much better.
Research on item-selection strategy of computerized adaptive cognitive diagnostic
testing
Zhihui Wu*, Jiangxi Normal University, China
Shuliang Ding, Jiangxi Normal University, China
The 76th Annual and the 17th International Meeting of the Psychometric Society Page 250
Gan Dengwen, Jiangxi Normal University, China
How to choose items to be administered is an important component in computerized
adaptive testing with cognitive diagnosis (CD-CAT).Meanwhile, a cognitive diagnostic test
blueprint will not bring mismatch of examinees’ knowledge states when the reachability
matrix (RM) is included in a blueprint in the case of expected response patterns being
considered. On the basis of Shannon’s Entropy item-selection strategy, in this paper four
different test blueprints are adopted to examine effect on diagnostic accuracy in the process
of applying RM. The results of Monte Carlo simulation show that choosing all the
corresponding items of RM plays an important role to improve the diagnostic accuracy in
CD-CAT, and it is also important reference to formulate item-selection strategy in CD-CAT.
In the process of CD-CAT choosing more corresponding items of RM can obviously
increase the pattern match rate (PMR), items quality has little effect on the results, and
when item pool does not contain or have less items of RM, item quality has great influence
on PMR. Using RM is benefit to construct test and item-selection strategy for cognitive
diagnosis purpose.
The improved Maximum Priority Index method and its application in Cognitive
Diagnostic Computerized Adaptive Testing
Yirao Pan*, Jiangxi Normal University, China
Shuliang Ding, Jiangxi Normal University, China
Maximum Priority Index method,advanced by Cheng Ying , sometimes violates
constraints and tends to choose those items with less constraints because the index of the
gap from attaining the lower (upper) bound is not great than one. To overcome the above
disadvantages, the improved Maximum Priority Index method (improved MPI) is proposed
in this study. Considering of combining balancing attribute coverage with the similarity of
any two attribute patterns, the improved MPI turns to another item selection method,
namely, MGCDI, for cognitive diagnostic computerized adaptive testing (CD-CAT).
MGCDI benefits an item in two aspects: the recovering of attributes and well performance
in similar attribute patterns. Results of Monte Carlo simulation indicate that the improved
MPI not only controls constraints successfully but also makes estimates of examinees'
abilities more precise. Compared with MMGDI and CDI, MGCDI performs as well as
MMGDI in balancing attribute coverage and CDI in discriminating similar attribute patterns,
furthermore, MGCDI is of higher pattern match ratio and marginal match rate.
The Review of Two Methods of Questionnaire and Dimension——Traditional
Methods and Facet Theory

The 76th Annual and the 17th International Meeting of the Psychometric Society Page 251
Parallel Session: Measurement Issues; Thursday , 21 July, 11:10 a.m. -- 12:30 p.m.;
D1-LP-06
Li Zhang*, South China Normal University, China
Min-Qiang Zhang, South China Normal University, China
Compared to the traditional method of questionnaire, mapping sentence can provide a
holistic framework for questionnaire. At the same time, it can promote exchange and
communication between researchers, and is beneficial for the comparison between
researches. It also provides the basis for the division of the dimension, which can unify the
questionnaire and dimension. We can see that smallest space analysis is more stable and
reliable in small sample size by simulation. Compared with factor analysis, smallest space
analysis owns other advantages, for example, less requirements of data, no require of a
linear assumption, easy understood results etc.
Does Increasing Number of Points in Likert Scale Better Approaches Normality?
Parallel Session: Measurement Issues; Thursday , 21 July, 11:10 a.m. -- 12:30 p.m.;
D1-LP-06
Huiping Wu*, Central China Normal University, China
Shing On Leung, University of Macau, Macau
Likert Scale is widely used in many psychological and educational studies. It is commonly
constructed with 4 to 7 points though the uses of 11 points provide a natural scale ranged
from 0 to 10. We simulate data from standard normal distribution, and cut the distribution
into 4 to 11 categories, corresponding to number of points in Likert Scale. For each
simulated distribution, three scoring systems are used: (a) the Raw scores x which are
neutral numbers starting 1, 2, … etc; (b) the Categorical score which is defined as the
mid-point of the categories from the underlying distribution; and (c) the Snell scores which
use the Snell transformation trying to approximate a normal distribution as much as possible.
Tests of normality are conducted via SW test statistics, skewness and kurtosis. The whole
process is repeated with skewed Gamma distribution replacing symmetric normal. Results
show that as number of point increases, scales better approach to normal. When the
underlying is normal, all three scores are linearly correlated so that it is indifferent in using
any of them in scaling. However, when the underlying is skewed Gamma, the Raw and
Snell scores correlate linearly with each other but neither of them is linearly correlated with
the Categorical scores. Results may imply that ordinal scale data can be approximated by
interval scale data only if the underlying distribution is normal.
Exploring Added Value Subscores with Item Topic Modeling
The 76th Annual and the 17th International Meeting of the Psychometric Society Page 252
Parallel Session: Measurement Issues; Thursday , 21 July, 11:10 a.m. -- 12:30 p.m.;
D1-LP-06
Makoto Sano*, Prometric Japan Co., Ltd., Japan
There is an increasing interest in reporting subscores. Sinharay (2010) provided a collection
of results regarding when subscores had added value over total scores for several
educational testing data sets with applying PRMSE (Haberman, 2008). If initial subscores
of a particular exam do not have added value and suggested new subscores have, it might be
worth revising groups of items and reporting the new subscores. Applying MIRT to
exploring possible item groups and evaluate new subscores with PRMSE is one of the
possible paradigms as Sinharay (2010) suggested. But Sano (2009) illustrated a limitation
just using item response data for quantifying item content similarity. Also some previous
studies detecting item cluster (possible subscore groups) with item response data and/or
item similarity deterministic rating data (e.g. Sireci and Geisinger, 1992) have limitations
especially for non-cognitively-based licensing/certification exams in terms of cost-effective
rating data aggregation. This study introduces an R add-in package called “RMeCab”
(Ishida, 2008) with Japanese morphological analyzer (tokenizer) of “MeCab” (Kudo, 2005)
for quantifying item content similarity from item text data. And a topic modeling technique
with Latent Dirichlet Allocation (Blei et al., 2003) on the items * tokens matrix are applied
to explore possible item groups expected to have added value subscores. The real data study
shows a possible topic modeling application to explore added value subscores.
A Random Sampling Inspection Model for Performance Measurement: An
Alternative to IRT
Parallel Session: Measurement Issues; Thursday , 21 July, 11:10 a.m. -- 12:30 p.m.;
D1-LP-06
Zhong'en Xi*, Chongqing University of Post and Telecommunications, China
As a derivative of the two laws of measurement, item hardness is redefined as the inverse of
the average degree of correctness of response to the item in question by all the members of
the standard test-taker group. This hardness is measured in the unit of the average
performance of the standard test-taker group. On the basis of this, definitions of item
performance are given for both the group and the individual. Equating the group average
performance as a random-chosen individual's performance, I have proved that the model
thus designed met the criteria of specific objectivity, namely, performance independent of
the hardness of items, and item hardness independent of the test-taker population. The
associated model for the evaluation of the uncertainty of performance is also given. Besides,
one set of real test data is used to illustrate the measurement model; another set is used to
The 76th Annual and the 17th International Meeting of the Psychometric Society Page 253
illustrate the uncertainty model. It is suggested that this model can replace IRT models for
computerized adaptive performance testing.
Traps of the Bootstrap
Parallel Session: Rasch Models – Methodology; Thursday, 21 July, 11:10 a.m. -- 12:30
p.m.; D1-LP-07
Rainer Alexandrowicz*, Alps-Adria-University Klagenfurt, Austria
Clemens Draxler, Ludwig-Maximilians-University Munich, Germany
The Andersen (1973) Likelihood Ratio Test (LRT) allows for the assessment of the equal
item discrimination assumption or Differential Item Functioning in the Rasch Model (RM).
However, if samples are small or items are few, the approximation to the theoretical
chi-square distribution is questionable. The present contribution presents a clear guideline
when the theoretic approximation can be considered sufficient. In cases, in which this
requirement is not fulfilled, the bootstrap may be applied instead. Three pertinent methods
of generating the bootstrap samples are analyzed with respect to their aptness of providing
the adequate distribution of the test statistic. We show that there are severe pitfalls when it
is applied in the LRT/RM-context, causing highly misleading or even artificial results. Only
a sequential probability sampling scheme allows for correct results under both the null and a
fixed alternative hypothesis.
Reducing Item Difficulty Estimation Bias in the Rasch Model Caused by Guessing: A
Weighted Conditional Likelihood Approach
Parallel Session: Rasch Models – Methodology; Thursday, 21 July, 11:10 a.m. -- 12:30
p.m.; D1-LP-07
Christof Schuster*, Univeristy of Giessen, Germany
Ke-Hai Yuan, University of Notre Dame, USA
According to the random sampling interpretation of the item characteristic curve in item
response theory, the Rasch model’s item characteristic curve gives the proportion of
individuals knowing the correct answer to an item as a function of ability. According to the
model, this proportion tends to zero as ability decreases. If individuals can answer items
correctly by random guessing, the model’s item characteristic curve will miss-specify the
proportion of low-ability individuals solving the items correctly. As a consequence, item
difficulty parameter estimates will be biased. A weighted likelihood approach is developed
in which the responses of individuals whose person-fit statistics indicate low fit will be
down-weighted, thereby reducing the influence of these individuals on the item difficulty
estimation. Because person-fit statistics based on a miss-specified model are expected to be
The 76th Annual and the 17th International Meeting of the Psychometric Society Page 254
biased also, the procedure iterates between weighted likelihood estimation of the item
difficulties and the estimation of person-fit until convergence. Simulation studies show that
this approach leads to reduced bias and mean squared error of the item difficulty estimates.
Applying the Rasch Sampler to Identify Aberrant Responding by Person Fit Statistics
under Fixed α-level
Parallel Session: Rasch Models – Methodology; Thursday, 21 July, 11:10 a.m. -- 12:30
p.m.; D1-LP-07
Christian Spoden*, University of Duisburg-Essen, Germany
Jens Fleischer, University of Duisburg-Essen, Germany
Detlev Leutner, University of Duisburg-Essen, Germany
Normalization formulas often fail to approximate the distribution of person fit statistics in
item response theory correctly when estimated instead of true parameters are used (Emons,
Meijer & Sijtsma, 2002; Nering, 1995; van Krimpen-Stoop & Meijer, 1999). As a
consequence, the variance of the statistic is inaccurately estimated and type I error rates for
these statistics are either in- or deflated. Parametric monte carlo simulations of the statistics’
distribution sample the latent ability from a normal distribution and are only appropriate
when the item sample is sufficiently large (Rizopoulos, 2010). For the dichotomous Rasch
model, the Rasch Sampler (Verhelst, 2008) generates new data matrices with the same
marginals as the original data and thereby offers another opportunity to simulate the
distribution of person fit statistics for any response vector in the original data matrix. Two
simulation studies are conducted to evaluate type I error and power of prominent person fit
statistics; P-values are obtained by the simulation of equally likely data matrices in the
Rasch Sampler for small item samples (10, 20 and 30 items). These rates are compared to
traditional approximations of the p-values by normalization formulas and a conventional
parametric monte carlo procedure. First results indicate that the empirical type I error rates
match the expected error rates adequately with the new approach while noticeable
differences were found for the normalization formulas and the conventional monte carlo
approach. Detection rates for the new approach are about as high as for the normalization
formulas.
Optimizing distribution of Rating Scale Category in Rasch Model
Parallel Session: Rasch Models – Methodology; Thursday, 21 July, 11:10 a.m. -- 12:30
p.m.; D1-LP-07
Han-Dau Yau*, National Taiwan Sport University, Taiwan
Wei-Che Yao, National Taiwan Sport University, Taiwan

The 76th Annual and the 17th International Meeting of the Psychometric Society Page 255
In tradition, testing of sports skills used to set categories by subjective method. Yau (2010)
developed a new objective method of category setting, but did not point out what kind of
distribution theory was used accurately. The purpose of the study was to optimize
distribution of rating scale category in Rasch model. The studied objects are normal
distribution, logistic distribution, binomial distribution, and uniform distribution. The
method was to use SAS and Minitab to produce random data, and then use Winsteps to
estimate data categories. Experiment design was two-way design(sample size × test
length),and we simulated them five times for each cell. The results were: 1. Normal
distribution was the ideal distribution when sample size was over 3000 in response data. 2.
Logistic distribution was the better distribution when sample size was less than 1500 in
response data. The conclusion of the study was that optimizing distribution of rating scale
category in Rasch model was related to sample size.
Monitoring Compromised Items on Live Exams
Parallel Session: Rasch Models – Methodology; Thursday, 21 July, 11:10 a.m. -- 12:30
p.m.; D1-LP-07
Shu-Chuan Kao*, Pearson, USA
John Stahl, Pearson, USA
The purpose of this study is to propose criteria for applying item drift indices to detect
compromised items in live pools on computer adaptive tests (CATs). By assessing the
violation of parameter invariance, a better way to monitor the quality of live CAT pools is
possible.
A simulation study is proposed to evaluate the statistical power of parameter drift indices on
identifying live items that become significantly easier than their pretest calibrations and to
suggest the cut-off points for flagging compromised, live items. Item parameters are
selected to mirror current CAT pools using the Rasch model. The results in which 0% of
examinees having preknowledge of items will serve as the baseline for comparison. The
research design varies sample size, item difficulty, percentage of examinees having
preknowledge of exam items, and the pattern of compromised items (linear vs. non-linear).
Along with examining the effect of research factors, residual analysis will be conducted to
provide supplemental information. Decision accuracy for different levels of cut-off points
of the parameter drift indices will also be provided.
If compromised items can be identified and suspended in time, test security can be better
guarded and test validity better assured. The results of the proposed study can be used to
evaluate the statistical sensitivity of the parameter drift indices under different testing
scenarios to help determine the minimum sample size required for reliable results and to
recommend general criteria for flagging compromised items.
The 76th Annual and the 17th International Meeting of the Psychometric Society Page 256
Dynamic Generalized Structured Component Analysis: A Structural Equation Model
for Analyzing Effective Connectivity in Functional Neuroimaging
Parallel Session: Structural Equation Modeling - Methodology I; Thursday, 21 July,
11:10 a.m. -- 12:30 p.m.; D1-LP-08
Kwanghee Jung*, McGill University, Canada
Yoshio Takane, McGill University, Canada
Heungsun Hwang, McGill University, Canada
Modeling effective connectivity in functional neuroimaging refers to an approach whereby
a number of specific neural regions are selected for analysis, based on a hypothesis about
their importance in certain cognitive tasks. This method allows stronger inferences related
to questions about causal connectivity (e.g., region A exerts influence on region B).
Structural equation modeling (SEM) for analyzing effective connectivity in functional
neuroimaging focuses on the representations of intra-individual dynamics of state space
(e.g., ROIs or regions of interest). The current SEMs (e.g., the extended unified SEM of
Gates et al in press) for multivariate time series data, due perhaps to computational
difficulties, amount to path analytic models without measurement models. In this paper, we
propose a component-based SEM, named Dynamic GSCA (Generalized Structured
Component Analysis) that overcomes this limitation in analyzing effective connectivity. To
illustrate the use of the proposed method, results of empirical studies based on simulated
and real data are reported.
A Copula Approach to Dyadic Data: Negative Affect in Couples
Parallel Session: Structural Equation Modeling - Methodology I; Thursday, 21 July,
11:10 a.m. -- 12:30 p.m.; D1-LP-08
Johan Braeken*, Tilburg University, Netherlands
Emilio Ferrer, University of California Davis, USA
A dyad is an observational unit consisting of two interacting entities; A typical example
given is a male-female couple. Conventional statistical methods consider the observational
unit to be a single entity and for statistical inference they rely on the assumption of
independent observations.
The latter assumption clearly does not hold for dyadic data, as members within a dyad
structurally depend on eachother. The main challenge in statistical models is then to
properly account for this dyadic dependence.
The 76th Annual and the 17th International Meeting of the Psychometric Society Page 257
We will incorporate copula functions into traditional structural equation models (SEM) with
exactly this purpose. The approach has the advantage of broadening the model specification
on two levels:
1. A larger range of parametric models can be used for the sub model of each dyad member;
2. A larger range of parametric dependence structures can be used (e.g., lower-tail
dependence instead of mere linear gaussian dependence).
This should benefit the formulation of more realistic dyadic equation models and improve
model fit. Furthermore, it allows the statistical testing of the default multivariate normal
setup in SEM for dyadic data:
1. Simulations for statistical sensitivity studies on model specification can be set up;
2. The empirical robustness of conclusions in substantive research studies can be assessed.
The proposed copula approach will be illustrated with an application towards characterizing
the interplay of negative affect within couples.
Replacing Moderated Multiple Regression with Multiple-Group Path Analysis under
Invariance Constraints in Predictive Studies
Parallel Session: Structural Equation Modeling - Methodology I; Thursday, 21 July,
11:10 a.m. -- 12:30 p.m.; D1-LP-08
Roger Millsap*, Arizona State University, USA
Margarita Olivares-Aguilar, Arizona State University, USA
In multiple-group studies of predictive invariance for a test in the prediction of some
criterion measure, a common method of analysis is moderated multiple regression (MMR).
An assumption in such analyses is that the residual variance in the regression is
homogeneous across groups. Violations of that assumption can adversely affect the
outcome of tests of significance in the MMR. An alternative method of analysis in such
data is multiple-group path analysis, with tests of invariance constraints being used to
evaluate the relevant hypotheses. In such tests, there has traditionally been no assumption
of homogeneity of residual variance. Is such an assumption necessary in the path analytic
approach? We conducted simulations to examine the Type I error rates under both MMR
and the path analytic approach when homogeneity of residual variance was violated.
Overall, the path analytic approach has better Type I error performance when sample sizes
are unequal, and comparable performance under the equal sample size case.
SEM and Regression Estimation in the Absolute Simplex (Bentler-Guttman Scale)
Parallel Session: Structural Equation Modeling - Methodology I; Thursday, 21 July,
11:10 a.m. -- 12:30 p.m.; D1-LP-08
Peter Bentler*, University of California at Los Angeles, USA

The 76th Annual and the 17th International Meeting of the Psychometric Society Page 258
This paper summarizes some technical details for an absolute simplex theory (AST) that has
been 40 years in the making. An absolute simplex is a parameterized Guttman scale in
which an N p data matrix can be generated completely from p item parameters. Bentler
(1971) introduced AST, developed a parameterization related to coefficients of variation,
developed pre-SEM estimators, showed how to extend the model with additional parameters
to handle model violations, and provided person parameters that permit distribution-free
determination of the associated cumulative distribution function. Bentler (2009, SMEP)
showed how the model and its extensions can be tested with modern structural equation
modeling (SEM) methods and proposed a methodology for recovering an associated
interval scale when this is justified. He also provided a new mean and moment matrix based
parameterization for AST and showed how the parameters could be estimated and the
model tested with SEM. Bentler (2011, WPA) developed a new item-weighting
parameterization, showed that a weighted linear combination of item responses characterize
the person distribution function, and showed how SEM and regression can be used to
estimate the parameters, recover an interval scale, provide meaningful indices of model
adequacy, and select items.
Functional Extended Redundancy Analysis
Parallel Session: Structural Equation Modeling - Methodology I; Thursday, 21 July,
11:10 a.m. -- 12:30 p.m.; D1-LP-08
Heungsun Hwang*, McGill University, Canada
Hye Won Suk, McGill University, Canada
Jang-Han Lee, Chung-Ang University, South Korea
Debbie S. Moskowitz, McGill University, Canada
We propose a functional version of extended redundancy analysis that examines directional
relationships among several sets of multivariate variables. As in extended redundancy
analysis, the proposed method posits that a weighed composite of each set of exogenous
variables influences a set of endogenous variables. It further considers endogenous and/or
exogenous variables functional, varying over time, space, or other continua. This method
accommodates three different models, accounting for which set of variables is functional.
Computationally, the method reduces to solving a penalized least squares problem through
the adoption of a basis expansion approach to approximating functions. We illustrate the
empirical usefulness of the proposed method by fitting the proposed models to real data.
On the Likelihood Ratio Test for Bivariate ACE Models
The 76th Annual and the 17th International Meeting of the Psychometric Society Page 259
Parallel Session: Generalized Linear and Nonlinear Mixed Effects Models; Thursday,
21 July, 11:10 a.m. -- 12:30 p.m.; D2-LP-08
Hao Wu*, Virginia Commonwealth University, USA
Michael, C. Neale, Virginia Commonwealth University, USA
The ACE and ADE models are variance component models heavily exploited in twin
studies. However, the validity of the likelihood ratio test (LRT) of the existence of a
variance component, a key step in the use of such models, has been doubted because the
true value of the parameters lie on the boundary of the parameter space of the alternative
model for such tests, violating a regularity condition required for a LRT. Our current work
as
presented in this paper resolves the issue of LRTs in bivariate ACDE models by exploiting
the theoretical frameworks of inequality constrained LRTs based on conic approximations.
Our derivation shows that the asymptotic sampling distribution of the test statistic for
testing a single component in the ACE or ADE model is a mixture of chi square
distributions of degrees of freedom (dfs) ranging from 0 to 3, and that for testing both the A
and C (or D) components is one of dfs ranging from 0 to 6. These correct distributions are
stochastically smaller than the chi square distributions in traditional LRTs and therefore
LRTs based on these distributions are more powerful than those used naively. Methods for
calculating the weights are proposed and the derived sampling distribution is confirmed by
simulation studies. These results can be easily generalized to testing bivariate variance
components in general random coefficient models as well as other testing problems with
similar boundary constraints.
Measuring Implicit Learning with Random Effects: An Application of The Linear
Ballistic Accumulator Model
Parallel Session: Generalized Linear and Nonlinear Mixed Effects Models; Thursday,
21 July, 11:10 a.m. -- 12:30 p.m.; D2-LP-08
Ingmar Visser*, University of Amsterdam, Netherlands
Thomas Marshall, University of Amsterdam, Netherlands
Implicit learning is a basic learning process underlying many forms of skilled behavior such
as causal inference and learning language. Typical measures of implicit learning are
response time difference scores, which are notoriously unreliable. In the current research we
propose to use a particular diffusion model, the linear ballistic accumulator (LBA; Brown &
Heathcote, 2008). The goal is to characterize implicit learning and at the same time
characterize individual differences and relate them to other person characteristics. The LBA
can be viewed as a random effects model with random effects at the trial levels, which can
The 76th Annual and the 17th International Meeting of the Psychometric Society Page 260
be further related to person and item characteristics. The LBA very well captures implicit
learning data.
On the Statistical Meaning of the Identified Parameters in a Semiparametric Rasch
Model
Parallel Session: Generalized Linear and Nonlinear Mixed Effects Models; Thursday,
21 July, 11:10 a.m. -- 12:30 p.m.; D2-LP-08
Ernesto San Martin*, Pontificia Universidad Catolica de Chile, Chile
Recently, San Martin, Jara, Rolin & Mouchart (2011) have shown that, in a Rasch model,
the distribution generating the individual abilities, G, is not identified by the observations,
although a functional of those distribution as well as the item parameters are identified.
How can these identified parameters be statistically interpreted? In this talk, we show an
explicit interpretation of them. It is thus shown that the item parameters does not
correspond to the odd ratios of an item with respect to a standard item. Regarding the
identified functionals of G, it is shown that they correspond to ratios of marginal
probabilities of specific pattern responses. By so doing, it is not only possible to propose
simple estimators of those parameters, but also to understand why a semi-parametric
version of the Rasch model is unfeasible.
Combining Generalizability Theory and Item Response Theory using the GLLAMM
Framework
Parallel Session: Generalized Linear and Nonlinear Mixed Effects Models; Thursday,
21 July, 11:10 a.m. -- 12:30 p.m.; D2-LP-08
Jinnie Choi*, University of California at Berkeley, USA
Mark Wilson, University of California at Berkeley, USA
Sophia Rabe-Hesketh, University of California at Berkeley, USA
Briggs & Wilson (2007) combined generalizability theory (GT) and item response theory
(IRT) for dichotomous responses with a simple pxi design using the Markov chain Monte
Carlo (MCMC, Karim and Zeger, 1992) method with the Gibbs sampler. The procedure
involved construction of an expected item response matrix requiring multiple sets of
assumptions for the true parameters. A multidimensional extension (Choi et al., 2009) to a
between-item multidimensional model with a multivariate p●xi○ design produced a
downward bias in the estimated variance components for item side and residual error. This
study applies a generalized linear latent and mixed model (GLLAMM; Skrondal &
Rabe-Hesketh, 2004) approach in which flexible one-stage modeling for a combination of
crossed random-effects IRT models and GT variance components models is
The 76th Annual and the 17th International Meeting of the Psychometric Society Page 261
straight-forward to formulate and easily expandable to more complex measurement
situations. The model specifies a latent threshold parameter as a function of cross-classified
person and item random-effects and the variance components for each facet. The random
person and item parameters are estimated using Laplace approximation implemented in the
xtmelogit command in Stata and the lmer function in R. The method is applied to classroom
assessment data from the 2008-2009 Carbon Cycle project which includes 1,958 students’
responses to 19 items, and to a large-scale educational assessment data, the PISA 2009
Science dataset, which includes 3,617 students from the United States who responded to 53
science it
The Multilevel Generalized Graded Unfolding Model
Parallel Session: Generalized Linear and Nonlinear Mixed Effects Models; Thursday,
21 July, 11:10 a.m. -- 12:30 p.m.; D2-LP-08
Chen-Wei Liu*, The Hong Kong Institute of Education, Hong Kong
Wen Chung Wang, The Hong Kong Institute of Education, Hong Kong
The generalized graded unfolding model (GGUM; Roberts, Donoghue, & Laughlin, 2000)
has been applied to attitude data to unfold persons’ and items’ locations. It assumes that all
persons are sampled randomly from the same distribution (i.e., simple random sampling). In
practice, sampled data may have a multilevel structure, for example, repeated measures
nested within a person, persons nested within a family, or students nested within a school. It
is likely that data sampled from the same cluster (e.g., students from the same school) are
more homogenous than data sampled from different clusters (e.g., students from different
schools). To account for such a multilevel structure, we developed the multilevel
generalized graded unfolding model (MGGUM). We proposed to use Markov chain Monte
Carlo Bayesian methods that were implemented in WinBUGS (Lunn, 2000) for parameter
estimation of the MGGUM. A series of simulations were conducted. The results showed
that the parameters can be recovered fairly well; and statistics of model comparison could
correctly select the MGGUM over the GGUM. An empirical example of political attitude
was given.
Never Say “Not:” Impact of Negative Wording in Probability Phrases on Imprecise
Probability Judgments
Parallel Session: Test Development and Validation; Thursday, 21 July, 11:10 a.m. --
12:30 p.m.; D2-LP-09
Michael Smithson*, The Australian National University, Australia
David Budescu, Fordham University, USA
Stephen Broomell, Pennsylvania State University, USA
The 76th Annual and the 17th International Meeting of the Psychometric Society Page 262
Han-Hui Por, Fordham University, USA
A reanalysis of Budescu et al.’s (2009) data on numerical interpretations of the
Intergovernmental Panel on Climate Change (IPCC 2007) fourth report’s verbal probability
expressions (PE’s) revealed that negative wording has deleterious effects on lay judgments.
Budescu et al. asked participants to interpret PE’s in IPCC report sentences, by asking them
to provide lower, “best” and upper estimates of the probabilities that they thought the
authors intended. There were four experimental conditions, determining whether
participants were given any numerical guidelines for translating the PE’s into numbers. The
first analysis presented here focuses on six sentences in Budescu et al. that used the PE
“very likely” or “very unlikely”. A mixed beta regression (Verkuilen & Smithson, in press)
modeling the three numerical estimates simultaneously revealed a less regressive mean and
less dispersion for positive than for negative wording in all three estimates. Negative
wording therefore resulted in more regressive estimates and less consensus regardless of
experimental condition. The second analysis focuses on two statements that were
positive-negative duals. Appropriate pairs of responses were assessed for conjugacy and
additivity. A mixed beta regression model of these three variables revealed that the lower
P(A) and upper P(Ac) pairs adhered most closely to conjugacy. Also, the greatest dispersion
occurred for lower P(A) + upper P(Ac), followed by upper P(A) + lower P(Ac). These
results were driven by the dispersion in the estimates for the negatively-worded statement.
This paper also describes the effects of the experimental conditions on conjugacy and
dispersion.
Is Test Taker Perception Of Assessment Related to Construct Validity?
Parallel Session: Test Development and Validation; Thursday, 21 July, 11:10 a.m. --
12:30 p.m.; D2-LP-09
Qin Xie*, The Hong Kong Institute of Education, Hong Kong
This study examined test takers’ perception of assessment demand and its impact on the
measurement of intended constructs. Over 800 test takers took a pre- and a post-test of
College English Test Band 4 and filled in a perception questionnaire to report the skills they
perceive as necessary for answering the test. The study found test takers perceived language
skills and test-taking skills as equally necessary. Perception of reading skills negatively
affected performance on the reading test, while perceptions of test-taking skills positively
affected performance on the reading test. Test takers’ perception of assessment seemed to
affect the measurement of the intended construct, though the effects are small and limited.
The study also found instrumentally oriented test takers and test takers with higher starting
The 76th Annual and the 17th International Meeting of the Psychometric Society Page 263
English ability perceived the test as more demanding, such perception, in turn, contributed
to better test performance.
The Effects of Individual Characteristics, Family Backgrounds, and School Region
Factors on Students' Bullying: A Multilevel Analysis of Public Middle Schools in
China
Parallel Session: Test Development and Validation; Thursday, 21 July, 11:10 a.m. --
12:30 p.m.; D2-LP-09
Li-Jun Wang*, Zhejiang Normal University, China
Hai-Gen Gu, Shanghai Normal University, China
Xian-Liang Zheng, Gannan Normal University, China
Wen Chung Wang, The Hong Kong Institute of Education, Hong Kong
Magdalena Mo Ching Mok, The Hong Kong Institute of Education, Hong Kong
This study investigated the effects of individual characteristics (gender, performance,
critical thinking and rates of absenteeism), communicating effectively, solving the conflict,
school experiences (positive and frustrating), and school region factors (rural, county, city
and province-wide information) on adolescents' verbal, physical, psychological bullying
behaviors and bullying behaviors through Internet. A random sample of 7194 7th–12th
grade students from 36 public middle schools in Shanghai, Zhejiang and Jiangxi Province,
China was selected for this study. A self-report questionnaire survey was administered. The
results showed that during the previous semester, 8.3% of the students had ever bullied
other students physically while 17% had verbally bullied others, 10.5% of the students had
ever bullied other students psychological while 11.4% had bullying behaviors through
Internet, 10.6% of the students had ever been bullied by other students physically while
31.4% had verbally been bullied, 22.8% of the students had ever been bullied by other
students psychological while 12.8% had been bullied through Internet. Hierarchical linear
modeling was employed to conduct a two-level analysis. Individual characteristics
including Grade level, gender, rates of absenteeism, peer conflict resolution, positive school
experiences were found to significantly contribute to bullying. Family background
characteristics, including father's educational level and child rearing patterns, were also
associated with bullying. School region, different provinces, different regions of China
significantly were found to significantly contribute to bullying behaviors. Weak economies
in the region were positively associated with bullying. Implications were discussed.
Factor Structure and Psychometric Properties of Two Shortened Scales for Measuring
Competency for Universities Students in the 21st Century

The 76th Annual and the 17th International Meeting of the Psychometric Society Page 264
Parallel Session: Test Development and Validation; Thursday, 21 July, 11:10 a.m. --
12:30 p.m.; D2-LP-09
Nicole Ruihui Xu*, University of Macau, Macau
Shing On Leung, University of Macau, Macau
Magdalena Mo Ching Mok, The Hong Kong Institute of Education, Hong Kong
A scale was established to measure competency for universities students in the 21st Century.
It has 6 domains (Basic, creativity, communication, moral & civic, international perspective
and self directed learning), 40 items with each having 3 aspects (importance, self-rated and
universities provision). Factor structure for each domain clearly identifies 3 aspects; and
for each aspect clearly identifies 6 domains. Each scale is shortened by factor analysis
where items are chosen according to absolute magnitude of factor loadings; and also by
using the BI-method (Bhargava and Ishizuka 1981). The first four moments (mean, SD,
skewness and kurtosis), reliabilities, factor structures and other basic psychometric
properties are compared among two shortened scales and the original. Correlations among
two shortened scales and the original are also compared. Implications of these findings are
discussed. Technically, there are 120 items (40 items for 6 domains x 3 aspects). Factor
analysis of all of them is messy and hence prohibits shortening the overall scale, but the
BI-method does not have this limitation.
The Psychometric Properties of Survey of Attitudes Toward Statistics (SATs)
Parallel Session: Test Development and Validation; Thursday, 21 July, 11:10 a.m. --
12:30 p.m.; D2-LP-09
Ratna Jatnika*, University of Padjadjaran, Indonesia
Fitri Ariyanti, University of Padjadjaran, Indonesia
Many of us who teach statistics work hard to improve our instruction, especially in social
science faculty. Part of that effort needs to be directed toward developing and using good
assessments. Theory, research, and the experiences of both teachers and students of
statistics indicate that attitudes toward statistics are important in the teaching-learning
process. The Survey of Attitudes Toward Statistics (SATS) is developed by Schau (2003)
help us to understand these attitudes and how they impact in teaching and learning. SATS
consists of six aspects: affect (student’s feeling concerning statistics), cognitive competence
(student’s attitudes about their intellectual knowledge and skill when applied statistics),
value (student’s attitudes about their usefulness, relevance, and worth of statistics in
personal and professional life), difficulty (student’s attitudes about the difficulty of statistics
as a subject), interest (student’s level of individual interest in statistics) and effort (amount
of work the student expends to learn statistics). The aim of this research is to know the
The 76th Annual and the 17th International Meeting of the Psychometric Society Page 265
psychometric properties of SATS, the reliability and validity of SATS. The data is collected
from 81 undergraduate students in Psychology Faculty in University of Padjadjaran. The
result shows that SATS is reliable (cronbach alpha = 0.907). Using confirmatory factor
analysis, SATS can be measured using six manifest variables (affect, cognitive competence,
value, difficulty, interest and effort). Confirmatory factor analysis shows Goodness of Fit
Index = 0.89. This result after that is compared to psychometric properties of SATS
developed by Schau (2003) and Carnell (2008).
Detection of Differential Item Functioning in Multiple Groups Using Item Response
Theory Methods
Parallel Session: Differential Item Functioning & Local Independence; Thursday, 21
July, 11:10 a.m. -- 12:30 p.m.; D2-LP-10
Seock-Ho Kim*, The University of Georgia, USA
Allan S. Cohen, The University of Georgia, USA
Youn-Jeng Choi, The University of Georgia, USA
Sun-Joo Cho, Vanderbilt University, USA
Sukwoo Kim, Pusan National University, South Korea
Analysis of differential item functioning (DIF) is often done by comparing two groups of
examinees, and item response theory (IRT) DIF detection methods are often used. It is
sometimes important, however, to determine whether DIF is present in three or more groups.
This paper presents a review of IRT methods for detection of DIF in multiple groups. The
methods include the likelihood ratio test using MULTILOG (e.g., Thissen, Steinberg, &
Wainer, 1988), the standardized DIF method using BILOG-MG (e.g., Muraki, 1999), the
use of the quadratic term based on the parameter estimates and the estimated variance and
covariance matrices (Kim, Cohen, & Park, 1995), and the MANOVA method (Kim &
Cohen, 2007). Relationships among the methods and other existing methods for two groups
are discussed. Illustrations with real data are provided.
Incorporating Differential Item Function into Longitudinal Item Response Models
Parallel Session: Differential Item Functioning & Local Independence; Thursday, 21
July, 11:10 a.m. -- 12:30 p.m.; D2-LP-10
Leah McGuire*, University of Minnesota, USA
It is a commonly held belief that curriculum affects learning, however the mechanisms
behind the differences in learning due to curriculum are not widely understood (Schmidt et
al., 2001). In order to begin to understand these mechanisms, it is important to study how
learning and curriculum interact. One way to examine how achievement and curriculum
The 76th Annual and the 17th International Meeting of the Psychometric Society Page 266
interact is to examine interactions between curriculum group membership and item
difficulty by adding curriculum differential item function (DIF) terms to the item response
model. The DIF term would illustrate whether items were more or less difficult for students
who took a certain course, when controlling for ability. This study demonstrates how DIF
can be added to a longitudinal item response model to explore how learning and curriculum
interact using longitudinal data. Longitudinal curriculum DIF models were estimated using
data from the Longitudinal Study of American Youth (Miller et. al., 1992). Items with
significant DIF were found for students who took certain mathematics and science courses,
even when controlling for ability. These DIF terms showed how mathematics and science
curriculum can interact with ability and learning.
Detection of Differential Item Functioning in MULTILOG and IRTLRDIF
Parallel Session: Differential Item Functioning & Local Independence; Thursday, 21
July, 11:10 a.m. -- 12:30 p.m.; D2-LP-10
Youn-Jeng Choi*, University of Georgia, USA
Allan S. Cohen, University of Georgia, USA
Seock-Ho Kim, University of Georgia, USA
Thissen, Steinberg, and Gerrard (1986) and Thissen, Steinberg, and Wainer (1988, 1993)
described the likelihood ratio test for differential item functioning (DIF), which compares
two different models; a compact model in which no DIF is assumed and an augmented
model in which DIF is assumed to be possible in the studied item. To analyze likelihood
ratio test, MULTILOG and IRTLRDIF computer program will be used in this study.
IRTLRDIF manual (Thissen, 2001) reports that the results of IRTLRDIF are similar, but not
identical to MULTILOG with different conditions (e.g., starting values for the item
parameters, convergence criteria, default for the location and scale of ability, and quadrature
for the numerical integrations and so on). However, IRTLRDIF tended to detect more DIF
items than MULTILOG using empirical data (Choi, Cohen, & Kim, 2011). Relationships
among the two methods are discussed. Illustrations with real and simulated data are
provided.
A New Procedure for Detecting Departures from Local Independence in Item
Response Models
Parallel Session: Differential Item Functioning & Local Independence; Thursday, 21
July, 11:10 a.m. -- 12:30 p.m.; D2-LP-10
Michael Edwards*, The Ohio State University, USA
Carrie Houts, The Ohio State University, USA
Li Cai*, University of California at Los Angeles, USA
The 76th Annual and the 17th International Meeting of the Psychometric Society Page 267
Item response models are widely used psychometric models which gain their strength (in
part) through a series of assumptions. The focus of this talk is on one of the most common
assumptions of item response models, local independence. We will briefly explore the
different kinds of local independence (strong vs. weak) before reviewing the potential
impact of violating this assumption in practice. A new method, called the Jackknife Slope
Index (JSI), will be proposed to detect departures from local independence. The method
works by serially removing each item in a set of items and observing the impact on the
remaining items’ slopes. We demonstrate via simulations that the method has promise for
detecting underlying and surface local dependence (Chen & Thissen, 1997) and show an
empirical example to illustrate the flexibility of the JSI.
Identifying Local Dependence with a Score Test Statistic Based on the Bifactor
2-Parameter Logistic Model
Parallel Session: Differential Item Functioning & Local Independence; Thursday, 21
July, 11:10 a.m. -- 12:30 p.m.; D2-LP-10
Yang Liu*, The University of North Carolina, USA
David Thissen, The University of North Carolina, USA
Local dependence (LD) refers to the violation of the local independence assumption of most
item response models. Statistics that indicate LD between a pair of items on a test or
questionnaire that is being fitted with an item response model can play a useful diagnostic
role in applications of item response theory. In this presentation a new score test statistic,
S_b, for underlying LD (ULD) is proposed based on the bifactor 2-parameter logistic model.
To compare the performance of S_b with the score test statistic (S_t) based on a threshold
shift model for surface LD (SLD) (Glas & Suarez Falcon, 2003), and the LD X^2 statistic
(Chen & Thissen, 1997), we simulated data under null, ULD, and SLD conditions, and
evaluated the null distribution and power of each of these test statistics. The results
summarize the null distributions of all three diagnostic statistics, and their power for
approximately matched degrees of ULD and SLD. Future research directions are discussed,
including the straightforward generalization of S_b for polytomous item response models,
and the challenges involved in the corresponding generalizations of S_t and the LD X^2
statistic.
Some aspects of design and analysis in longitudinal studies
Invited Symposium : Thursday, 21 July, 1:30 p.m. – 2:50 p.m., D1-LP-03
Maximin marginal designs for longitudinal studies
The 76th Annual and the 17th International Meeting of the Psychometric Society Page 268
Frans E.S. Tan*, Maastricht University, The Netherlands
In general optimal design problems lead to local optimal designs that depend on the choice
of the model as well as on the unknown value of the model parameters. This is in particular
unattractive because the choice of a design should be made before data collection.
Additional problems come into the picture if covariates (prior-uncontrolled variables) are
involved for which the design cannot be (easily) determined before data collection. For
example, in a cluster randomized intervention study where pupils of different schools were
measured repeatedly, a comparison between treated and untreated schools might be of
interest for different socio-economic classes (SEC) or for different other level-one
covariates. The distribution of the baseline measurements and the variable SEC are usually
determined after data collection. In order to determine the optimal (marginal) design of a
subset of the prior-controlled variables, one needs to have additional information about the
values of the regression parameters and the distribution of the prior-uncontrolled variables.
The maximin procedure is an approach that can be used to overcome the dependency of an
optimal design on unknown parameter values and distribution. The distribution of the
maximin designs, however, is often not uniformly distributed, which is very unattractive for
practical purposes. Moreover, in most cases the optimal distribution can only be determined
numerically. In this presentation, the conditions will be discussed under which the maximin
design for GLMM models is uniformly distributed. Robustness when some of the
conditions are not met will also be considered.
Modeling HIV Viral Rebound using Differential Equations
Jan Serroyen*, Maastricht University, The Netherlands
Geert Molenberghs, Hasselt University and K.U. Leuven, Belgium
Viral dynamics is a relatively new field of study that relies on mathematical models to
describe the temporal evolution of virus levels in the blood plasma, the so-called viral load.
Our scientific aim is to find a flexible, yet parsimonious mechanistic model based on
ordinary differential equations (ODE) for the so-called rebounders, a special subgroup of
patients who, after an initial decrease in viral load levels, show a sudden rise in viral load
levels during treatment. This rebound is generally caused by the emergence of a
drug-resistant virus strain. The data of rebounders analyzed come from pooling three
clinical trials on Prezista, a new protease inhibitor. In conclusion, the issue of parameter
identifiability is briefly discussed and practical recommendations are formulated for
researchers designing studies in the field of HIV dynamics.
The 76th Annual and the 17th International Meeting of the Psychometric Society Page 269
Model Based Estimates of Long-Term Persistence of Induced HPV Antibodies:
Hierarchical Bayesian Approach
Ziv Shkedy*, Hasselt University and K.U. Leuven, Belgium
Mehreteab Fantahun, Hasselt University and K.U. Leuven, Belgium
Geert Molenberghs, Hasselt University and K.U. Leuven, Belgium
Prediction of long-term persistence of vaccine-induced antibody is of primary interest in
vaccination clinical trials. In this study hierarchical Bayesian models are used in order to
predict the long-term persistence of vaccine-induced antibody of HPV-16/18 and to obtain
the estimated time points where the individual titers are below the threshold value for
protection. Linear and non linear subject-specific hierarchical models are used in order to
model the change anti-HPV-16/18 levels and to estimate the rate of the change. Using the
posterior predictive distribution we can obtained a subject-specific model based estimates
for long-term persistence. Moreover, we can derive, for each subject in the study the
posterior probability to be protected, i.e. the probability that the subject titers are above the
threshold value for protection. In addition, linear mixed models are used to model both the
population and the subject-specific evolution of the antibody over time. Empirical based
estimates for the subject-specific random effects are used to in order predict the antibody
level for each subject and to evaluate the proportion individuals remain protected over time.
The two modeling approached are implemented and compared using longitudinal data from
vaccination trails of HPV 16/18.
Modelling the Impact of Hypertensive Treatments on Longitudinal Blood Pressure
Measurements and Cardiovascular Events
M Carr*, University of Manchester, UK
R McNamee, University of Manchester, UK
J Pan, University of Manchester, UK
K Cruickshank, University of Manchester, UK
G Dunn, University of Manchester, UK
Modelling the impact of longitudinal blood pressure measurements on cardiovascular event
risk is problematic. This is particularly true in a trial context where hypertensive treatment
options are designed to reduce event rates via the reduction and control of blood pressure
itself. Blood pressure measures are only available at discrete observation points and the
measurement process is notoriously error-prone. The resulting measurement error,
combined with natural biological fluctuations, can induce regression attenuation if readings
are used directly as covariate information in survival models. One means of addressing the
problem is a two-stage approach where estimates of ‘error-free’ blood pressure obtained

The 76th Annual and the 17th International Meeting of the Psychometric Society Page 270
from a random effects model act with other covariates in a second stage survival model.
However, blood pressure is a time-dependent covariate and standard survival models for
risk assessment require time-dependent covariates to be external to the event process. Blood
pressure is the output of an internal process and is directly related to the cardiovascular
event mechanism. The solution is joint optimisation of the two processes. We are
principally concerned with the nature of the relationship between blood pressure and the
event process and whether treatment options have an additional ‘direct’ effect on risk that is
not manifested through blood pressure reduction. Further concerns include the potential for
confounding by additional variables including seasonality and blood pressure variability and
we also entertain the possibility that, in the presence of treatment changes, blood pressure
itself may function as a time-dependent confounder for the treatment-event relationship.
Measuring a Learning Progression for Data Modeling: Alternative Psychometric
Modeling Approaches
Symposium : Thursday, 21 July, 1:30 p.m. -- 2:50 p.m., D1-LP-04
Developing Assessments of Data Modeling and Mapping a Learning Progression
Mark Wilson*, University of California, Berkeley, USA
Elizabeth Ayers, University of California, Berkeley, USA
Rich Lehrer, University of California, Berkeley, USA
The Assessing Data Modeling and Statistical Reasoning (ADMSR) project is a
collaborative effort between measurement and learning specialists to develop a curricular
and embedded assessment system in the domain of statistical reasoning and data modeling
(Lehrer et al., 2007). The ADMSR project has developed seven related but distinct
constructs pertaining to statistical reasoning and data modeling. For each construct,
curriculum and supporting teacher materials have been developed. In addition, items have
been designed to measure student ability and understanding on each construct. This
symposium presents several different measurement modeling approaches that we see as
being relevant for this learning progression. In this paper, we introduce the project and
describe the learning progression. We begin by discussing our theoretical connections
between the constructs. We believe that, with appropriate instruction, students will move to
higher levels along a single construct, but also in a coordinated way across several
constructs (i.e. a student operating at a given level in one of the constructs will likely be
operating at a specific level on one or more of the other constructs in the learning
progression). We then summarize results from a pre-post analysis from a school in
Wisconsin that indicate gains are statistically significant, as well as educationally
significant.
The 76th Annual and the 17th International Meeting of the Psychometric Society Page 271
Mapping a Learning Progression Using Unidimensional and Multidimensional Item
Response Models
Robert Schwartz*, University of California, Berkeley, USA
Elizabeth Ayers, University of California, Berkeley, USA
Mark Wilson, University of California, Berkeley, USA
We begin by individually analyzing the seven constructs using Masters’ Partial Credit
Model (Masters, 1982). These unidimensional results were examined to aid in item and
construct development. As a result, refinements were made to the constructs, scoring guides,
and items. In addition, new items were developed to elicit responses at construct levels on
which we had insufficient data. Our theory behind the ADMSR learning progression,
however, does not assume that the constructs are completely independent of one another.
Thus, the seven constructs were then analyzed together using the Multidimensional Random
Coefficients Multinomial Logit (MRCML) Model (Adams, Wilson & Wang, 1997). This
allowed examination into the correlations and covariances between the constructs. The
multidimensional results were estimated using the Delta Dimensional Adjustment method, a
procedure which adjusts the metrics of the dimensions so that comparisons of student
proficiencies and item difficulties can be interpreted across dimensions. These analyses
have been carried out using ConQuest (Wu et al, 1998). Results show (as expected) the
reliability of the estimated student proficiencies increase in the multidimensional analysis.
When looking at empirical support for the theoretical connections, some are supported
while others are not. For the unsupported connections, we hesitate to dismiss them after the
results of only one sample. It might be the case that while no support for the connections
between construct levels was present here, there could be evidence of the existence of the
connection when we analyze additional samples. These analyses have been completed, and
we are currently finishing the write-up.
Modeling Links Between Dimensions of a Learning Progression Using SEM
Elizabeth Ayers*, University of California, Berkeley, USA
David Torres Irribarra, University of California, Berkeley, USA
Mark Wilson, University of California, Berkeley, USA
The previous paper modeled the learning progression as a profile of progress along multiple
dimensions. However, the data modeling perspective suggests that learning involves links
among these dimensions of knowledge and skill. The research literature and early data
analyses led us to hypothesize the links among the seven constructs, as described in the first
paper. In this paper, we will model these links using Structural Equation Modeling (SEM;
The 76th Annual and the 17th International Meeting of the Psychometric Society Page 272
Bollen, 1989). We will report on the empirical evidence for this structure provided by these
analyses, including comparison to simpler and more complex structures within SEM. An
obvious simpler model would be one with no links (such as the standard multidimensional
analysis in the previous paper), and the most complex model would be the one with all the
hypothesized links. We have the data ready for these analyses, and plan to complete them in
the next month or so using M-Plus (Muthén & Muthén, 1998-2007).
Developing Assessments of Data Modeling and Mapping a Learning Progression using
a Structured Constructs Model
Ronli Diakow*, University of California, Berkeley, USA
David Torres Irribarra, University of California, Berkeley, USA
One of the benefits of developing a detailed learning progression for a given domain is the
ability to generate hypotheses about the relations among the constructs that constitute the
learning progression. However, if such hypotheses are generated, we need to be able to
validate them empirically. Structured construct models (SCMs; Wilson, 2009) are proposed
in this paper for that purpose. The SCMs described in this paper represent each construct as
a set of ordered latent classes (Croon, 1990) and model links among the constructs as
restrictions on the joint probabilities of class membership. Using these models, different
hypothesized links can be tested by comparing models with different probability constraints.
However, the validity of SCM relies heavily on statistical and conceptual assumptions,
requiring confirmation that the latent class model is correctly specified and that the
'meaning' of the classes is consistent with the levels of proficiency described in the theory.
In this presentation, we will address these issues and discuss the analysis that is needed to
justify statistical and substantive interpretation of the SCMs. We will then illustrate how the
models can be implemented to test and explore the conceptual pathways that students would
follow as a result of instruction among two constructs of the ADMSR project. We will
discuss how the results of the models can be reported and interpreted. Our current analysis
was conducted using Latent GOLD (Vermunt & Magidson, 2005) and the graphical
summaries of the results were made using R (R Development Core Team, 2010).
Assessing Eye Movement Transitions using Multilevel Markov Models
Parallel Session: Latent Class Analysis; Thursday, 21 July, 1:30 p.m. -- 2:50 p.m.;
D1-LP-06
Samantha Bouwmeester*, Erasmus University Rotterdam, Netherlands
Lisa VandeBerg, Erasmus University Rotterdam, Netherlands
Rolf A. Zwaan, Erasmus University Rotterdam, Netherlands
The 76th Annual and the 17th International Meeting of the Psychometric Society Page 273
Many eye tracking studies are designed to reveal cognitive processes that occur within
individuals. However, traditional analyses mostly reflect the viewing tendency of a group of
people over trials, rather than a realistic fixation pattern that occurs within individuals and
trials. We argue that assessing shifts in attention between regions of interest (i.e., eye
fixation transitions to relevant referents) by means of multilevel markov modeling can
provide vital information about viewing patterns within trials. We will demonstrate how the
multilevel markov modeling technique can be used on eye tracking data based on a relevant
example (assessing lexical co-activation in a visual world paradigm), and discuss the
practical applications and theoretical implications when applying transition analyses to any
type of eye tracking data.
Dynamic Bayesian Inference Network for Modeling Learning Progressions over
Multiple Time Points
Parallel Session: Latent Class Analysis; Thursday, 21 July, 1:30 p.m. -- 2:50 p.m.;
D1-LP-06
Younyoung Choi*, University of Maryland, USA
Robert Mislevy, Univsersity of Maryland, USA
Dynamic Bayesian Inference Network (Murphy, 2002) is a probability-based framework in
which specific models can be constructed using elements from Bayesian Inference
Networks in accordance with substantive theory. Recently, Learning Progressions have
captured attention in mathematics and science education (National Research Council, 2007;
Shin, Stevens, Short & Krajcik, 2009; Learning Progressions in Science Conference, 2009).
Substantive, psychological, instructional, and task development aspects of Learning
Progressions have received much attention, but less research has addressed the assessment
design framework and psychometric models for longitudinal designs. The work is based on
used the Evidence Centered Design framework (Mislevy, et al, 2003) to link the theory
embodied in a Learning Progression, task design to provide evidence about students’ levels,
and psychometric models. The focus here is on the psychometric model. DBINs are
introduced to characterize the relationship between student performances and levels on
Learning Progressions in a longitudinal design. The fundamental concepts of graph theory
and probability theory for constructing a DBIN are presented. The approach is shown to be
equivalent to a Hidden Markov model. Two simulation studies are conducted for evaluating
the performances of estimation for the DBINs. The studied conditions are different numbers
of tasks, sample sizes, types of transition probability matrices, types of conditional
probabilities of observables given levels on learning progressions, and distributions of
students on learning progressions. The studies consider a simple DBIN model and an
extended DBIN model with a covariate.
The 76th Annual and the 17th International Meeting of the Psychometric Society Page 274
Hierarchical Bayes Granger Causality Analysis for Understanding Purchase
Behaviors of Multiple Product Categories
Parallel Session: Latent Class Analysis; Thursday, 21 July, 1:30 p.m. -- 2:50 p.m.;
D1-LP-06
Kei Miyazaki*, Nagoya University, Japan
Takahiro Hoshino, Nagoya University, Japan
This study proposes a model that can explore time series variation of purchase quantities of
multiple product categories or brands for each consumer segment. In economic time series
analysis, Granger causality analysis is used frequently for understanding the interrelated
influences among several times series. In this study, by introducing latent classes I
developed the model that could search the interaction of time series variations of several
products’ purchase quantities. The proposed model makes it possible to infer appropriate
promotional activities for each segment that differs in consumer demographics and to
understand latent switching of purchase behavior or loyalty in case that any promotional
activities are not conducted. In parameter estimation, I used a Bayesian estimation method
using Markov Chain Monte Carlo algorithm. I applied the proposed method to scanner
panel data and meaningful results were obtained.
Multilevel Latent Class Model Used in Group-level Classification: Appropriate
Application of Model Criteria
Parallel Session: Latent Class Analysis; Thursday, 21 July, 1:30 p.m. -- 2:50 p.m.;
D1-LP-06
Jie-Ting Zhang*, South China Normal University, China
Min-Qiang Zhang, South China Normal University, China
Can Jiao, Shenzhen University, China
Multilevel latent class model is good at estimating group level effect on test and helping to
realize local independence in traditional latent class model, which makes the sample
classification more accurate and reasonable. Moreover, it is appropriate to cross-regional
and cross-culture researches, according to which measure could be taken specific to
different kinds of group. Apparently, it is of great significance to Chinese Mainland with
great demographic diversity.
However, all these advantages are based on the accuracy of models, which is determined by
the model criterion we choose. The problem will be even more complex in multilevel model,
because more factors should be considered about. Certain researchers have discovered that
The 76th Annual and the 17th International Meeting of the Psychometric Society Page 275
criteria such as BIC, AIC have different advantages in different contexts of sample size in
both individual and group level.
The present simulation study, on basis of some conclusions made in the previous ones, is to
investigate how sample size in both levels influence the accuracy of model selection using
criteria AIC, AIC3, BIC and adjusted BIC, when latent class number in group level is
comparatively high. The result is compared with those in the previous studies. Then a
conclusion is made about how to properly apply the criteria for multilevel model under
different kinds of condition.
Finally, multilevel latent class analysis is conducted on an empirical dataset, in order to
verify the simulation result and illustrate the application of the method.
Work-Family Conflict : A Latent Prolife Analysis
Parallel Session: Latent Class Analysis; Thursday, 21 July, 1:30 p.m. -- 2:50 p.m.;
D1-LP-06
Yanhong Gao*, South China Normal University, China
Min-Qiang Zhang, South China Normal University, China
The present study introduced some methods on the basis of latent class model to analyze a
binominal test. Index indicates whether the item can reflect the examinee’s ability
definitely; index and the difference of conditional probability among various latent classes
shows how well the item discriminates a certain class from others; while the test-specific
index assesses the discrimination of a certain response vector among various classes.
Comparison between the traditional analysis methods and the new ones is conducted
according to an empirical research, which demonstrates that methods base on latent class
model precedes the traditional index such as reliability coefficient. The new methods
evaluate the test quality specific to various ability level of examinees, which is more
sensible to the actual sample distribution with multi-modal rather than unimodal.
Additionally, item-specific index offer more objective foundations in cutting or modifying
items.
Validation of Hortwitz’s (1987) Beliefs about Language Learning Inventory with
Chinese Mainland Sample – Traditional Factor Analysis Versus Rasch Modeling
Parallel Session: Rasch Models - Theory and Practice; Thursday, 21 July, 1:30 p.m. --
2:50 p.m.; D1-LP-07
Lijuan Li*, The Hong Kong Institute of Education, China
This study aimed at establishing, within the classical test theory and Rasch framework,
respectively, construct validity of the translated version of Horwitz’s (1987) beliefs about
The 76th Annual and the 17th International Meeting of the Psychometric Society Page 276
language learning inventory to be used with Chinese mainland college ESL students. Based
on a convenience sample of 362 tertiary-level college students, from the original 34-item
conceptually-composed 5-factor inventory the exploratory and subsequent confirmatory
factor analyses generated a 15-item four-factor solution. Of the four factors, only two
demonstrated marginally acceptable internal consistency. Alternatively the Rasch scaling
method was utilized in a parallel manner. Psychometric properties, e.g., the item and model
fit, category functioning of the items, and dimensionality of the inventory, were empirically
put under close scrutiny. After the removal of 10 items with poor item fit or persistently
disordered categories, it ended up with a refined inventory, of which no absolute evidence
of unidimensionality had been captured. The purification exercise continued with
identification of items that displayed differential item functioning (DIF) values till the
remaining 21 items, as evidenced, measured a single underlying construct. Consequently
deprived from the Rasch measurement model was a short version of the inventory with
clinically appropriate length and proved construct validity, though the present study did not
attempt to tell which approach was superior to the other. It’s hoped that the robust
validation techniques would optimize the final factor solution, thereby ensuring the
legitimacy of the inventory to be used for the investigation on the patterns of Chinese
Mainland college students’ beliefs about learning English as a second language.
Assessing Dimensionality Using Rasch Rating Scale Model
Parallel Session: Rasch Models - Theory and Practice; Thursday, 21 July, 1:30 p.m. --
2:50 p.m.; D1-LP-07
Kun Jacob Xu*, The Hong Kong Institute of Education, Hong Kong
Magdalena Mo Ching Mok, The Hong Kong Institute of Education, Hong Kong
In practice, many educational and psychological tests are multidimensional. Ackerman
(2003) highlighted Multidimensional Item Response Theory (MIRT) models for
polytomous data and higher dimensional space as one of the key directions for future
research. Many methods have been proposed for assessing dimensionality in IRT models,
including the use of Principal Components Analysis on standardized residuals and others
(see e.g., Hattie, 1985; Karabatsos, 2000; Linacre, 1998; Smith, 2002). Nevertheless, the
literature is still equivocal regarding such issues as cut-point of the first eigenvalue used in
PCA of standardized residuals, and its relation to sample size, test length, the number of
dimensions, and the degree of dimensionality (Chou & Wang, 2010). This study aims to
verify methods of assessing dimensionality using a series of Monte Carlo simulation with
data generated in the context of Rating Scale Rasch model under systematic combination of
conditions of test length (5 or 10 items), difference in test length between dimensions (nil,
small, large), sample size (500 or 1000 students), strength of correlation (0.0, 0.3, 0.7, 0.9),
The 76th Annual and the 17th International Meeting of the Psychometric Society Page 277
number of dimensions (2 or 3 dimensions), and status of dimensionality (between or within
items). Combinations of these conditions were manipulated in this study in order to find out
their impacts on rate of Type I error and Power of multidimensional detection.
Sample Size Determination for Rasch Model Tests
Parallel Session: Rasch Models - Theory and Practice; Thursday, 21 July, 1:30 p.m. --
2:50 p.m.; D1-LP-07
Clemens Draxler*, Ludwig-Maximilians-Universität München, Germany
This paper is concerned with supplementing statistical tests for the Rasch model so that
additionally to the probability of the error of the first kind (Type I probability) the
probability of the error of the second kind (Type II probability) can be controlled at
predetermined level by basing the test on the appropriate number of observations. An
approach to determining practically meaningful model deviations is proposed and the
approximate distributions of the Score (or Lagrange multiplier), Wald and likelihood ratio
test are derived under the extent of model deviation of interest. Numerical examples show
the optimal sample sizes for the 3 tests needed for various extents of model deviation and
different scenarios regarding error probabilities.
Modeling of Students’ Satisfaction of an Online Database: An Empirical Study
Parallel Session: Rasch Models - Theory and Practice; Thursday, 21 July, 1:30 p.m. --
2:50 p.m.; D1-LP-07
Atiquil Islam A.Y.M. *, International Islamic University Malaysia, Malaysia
In its effort to foster a stimulating research environment, the IIUM has provided an online
database facility. The database comprises volumes of research articles published in journals
and conference proceedings. However, despite a decade of existence, the database was
discovered to be underutilized, especially by students. Determinants such as perceived ease
of use, perceived benefits, computer self-efficacy, and end-user satisfaction were postulated
to be major barriers. To assess the influence of these determinants on postgraduate students’
satisfaction of the online database, an adoption questionnaire based on an extended
Technology Acceptance Model (TAM) was administered to 180 postgraduate students from
four faculties (Education, Economics, Engineering and Human sciences). The
questionnaires’ reliability and validity were performed through a RASCH analysis; the data
were analysed using the Structural Equation Modeling. The results demonstrated significant
influences of perceived ease of use, perceived usefulness and computer self-efficacy on
postgraduate students’ satisfaction in using the online database. In addition, the results also
revealed significant positive interrelationships among the three exogenous constructs of an
The 76th Annual and the 17th International Meeting of the Psychometric Society Page 278
extended TAM. The findings contributed to a better understanding of the two intrinsic
motivation components, namely computer self-efficacy and satisfaction, were incorporated
in the original framework of the TAM and technology satisfaction among postgraduate
students.
Analyzing Two-Tier Items with the Steps Model
Parallel Session: Rasch Models - Theory and Practice; Thursday, 21 July, 1:30 p.m. --
2:50 p.m.; D1-LP-07
Hak Ping Tam*, National Taiwan Normal University, Taiwan
Margaret Wu, University of Melbourne, Australia
The two-tier item is a relatively new item format that is quite popular among a circle of
researchers in science education. Typically, a phenomenon related to science was given
about which the respondents have to answer a factual item followed by an item that
solicited the reason behind their answer to the first item. Unfortunately, the methodology
regarding how this type of items can be analyzed is quite rudimentary and is typically
handled by means of comparison of percentages. Recently, there have been attempts to use
Rasch type modeling approach together with user-defined fit statistics to analyze this kind
of data. This study suggests that a better idea of the relationship between responses to the
factual item and the reason item can be attained if one could regard a two-tiered item as a
2-part process. First, a student is presented with a factual item. Once he/she provides a
correct or incorrect response, the student is then presented with the reason item to support
his/her response to the factual item. If we hypothesize that students who provide a correct
response to the factual item may answer the reason item in a different way from those who
provide an incorrect response to the factual item, then we may consider splitting the reason
item into two items: one for students who provide the correct answer to the factual item, and
one for those who provide an incorrect answer. Interpretation from this approach will be
illustrated with an example followed by discussion.
Measurement Invariance of Survey Data: A Cross-Cultural Analysis
Parallel Session: Structural Equation Modeling - Applications I; Thursday, 21 July,
1:30 p.m. -- 2:50 p.m.; D1-LP-08
Timothy Teo*, Nanyang Technological University, Singapore
Cross-cultural surveys are important in enhancing the validity of an instrument, among
other things. However, when respondents react to an instrument, they bring many
characteristics along with them. Of these, culture is one of many subtle traits that impact on
the survey data. This is especially so when an instrument is translated into different

The 76th Annual and the 17th International Meeting of the Psychometric Society Page 279
languages for a survey. This aim of this study is to examine the impact cultural differences
among the responses of participants from different countries. The instrument in question
comprised items designed to measure users’ acceptance of technology. Data collected from
Singapore and Turkey will be compared for configural, metric and scalar invariance. Finally,
issues relating to cross-cultural survey will be discussed.
Investigating Factorial Invariance of Teacher Assessment Literacy Inventory between
Primary and Secondary School Teachers
Parallel Session: Structural Equation Modeling - Applications I; Thursday, 21 July,
1:30 p.m. -- 2:50 p.m.; D1-LP-08
See Ling Suah*, Universiti Sains Malaysia, Malaysia
Saw Lan Ong, Universiti Sains Malaysia, Malaysia
The main objectives of this study were to confirm the factorial structure of the Teacher
Assessment Literacy Inventory (TALI) and examine the invariance of the factorial structure
of TALI between primary and secondary school teachers. TALI is an instrument developed
to determine the level of assessment literacy of school teachers in northern Malaysia. The
inventory consists of 41 items with high overall internal consistency using Cronbach’s
Alpha coefficient. The same is true for the five subscales of Methods of Assessments,
Developing Tests, Test Usage, Scoring & Grading and Providing Feedbacks. A
confirmatory factor analysis using structural equation modeling (SEM) was conducted to
examine the factorial structure and the invariance of the factorial structure between primary
and secondary school teachers. A five-factor model was postulated and tested.
Modifications of the initial hypothesized five-factor structure were necessary to adequately
fit the data. The results pointed out several aberrant items that were specific to a particular
group. The inventory appeared to be factorially invariant for primary and secondary
school teachers.
Confirmatory Factor Models for Representing Processing Strategies Associated with a
Cognitive Measure
Parallel Session: Structural Equation Modeling - Applications I; Thursday, 21 July,
1:30 p.m. -- 2:50 p.m.; D1-LP-08
Karl Schweizer*, Goethe University Frankfurt, Germany
Confirmatory models with fixed factor loadings enable the identification and investigation
of processing strategies that may be selected by participants in completing the items of a
cognitive measure. In such models sets of factor loadings represent processing strategies as
loading vectors. Since the model of the covariance matrix (Jöreskog, 1970) provides the

The 76th Annual and the 17th International Meeting of the Psychometric Society Page 280
framework for such representations, the focus is on the account of variance by processing
strategies. It is demonstrated that three types of representation are possible: (1) the first type
concentrates on sources of individual differences since such sources generate true variance.
The second type is characterized by the consideration of the probabilities of outcomes since
probabilities of outcomes can be transformed into variances. Finally, there is the possibility
of considering discrepancies between expectations.
In the application to a measure of working memory capacity three processing strategies are
considered: compliance strategy, non-compliance strategy and probability-based strategy.
Using the data of 345 individuals it was investigated whether these processing strategies
contributes to a good model fit. Furthermore, combinations of strategies were considered
since the various members of the sample could be expected to prefer different strategies or
to change from one strategy to another strategy. It turned out that in lab data the
combination of compliance and probability-based strategies did best whereas in internet
data the best model fit was observed for the combination of compliance and
non-compliance strategies. As could be expected for a measure of working memory, only
the processing strategy associated with instruction led to a considerable correlation with
fluid intelligence.
The Development of Leisure Satisfaction Scale for Gifted Students
Parallel Session: Structural Equation Modeling - Applications I; Thursday, 21 July,
1:30 p.m. -- 2:50 p.m.; D1-LP-08
Wei-Ching Lee*, Taipei Municipal University of Education, Taiwan
Chin-Fei Cheng, Taipei Municipal University of Education, Taiwan
The purposes of this study were to construct a reliable and valid leisure satisfaction scale for
gifted students and to compare whether there were groups invariance for the different
background gifted students in this scale.
Based on theories, a self-designed scale for gifted students was used to survey gifted
students of the junior high and elementary schools. 1,059 valid samples were collected by
the stratified random sampling and cluster sampling. The samples were divided into three
sets by a random procedure. First, the first sample set was analyzed by item analysis and
exploratory factor analysis. Moreover, the second sample set was analyzed by confirmatory
factor analysis of structure equation modeling and the cross-validation was tested by the
third sample set. Finally, the different levels of strictness multi-groups analysis were
proceeded.
The results showed that the factors had great structures and there were construction
validities in this scale. The reliabilities of the data were satisfactory, too. The collected data
fitted to the theoretical model and this stability of model passed the statistical tests from
The 76th Annual and the 17th International Meeting of the Psychometric Society Page 281
loose to tight replication strategies. In this study, measurement invariance was confirmed
for gifted students with different background, too.
Exploring the Validity of Learning-Related Boredom Scale in Canada and China
Parallel Session: Structural Equation Modeling - Applications I; Thursday, 21 July,
1:30 p.m. -- 2:50 p.m.; D1-LP-08
Virginia Man Chung Tze*, University of Alberta, Canada
Robert Klassen, University of Alberta, Canada
Lia Daniels, University of Alberta, Canada
Johnson Ching Hong Li, University of Alberta, Canada
Recent research has shown that boredom has an adverse impact on students’ achievement
(Mann & Robinson, 2009). In particular, Pekrun, Goetz, Daniels, Stupnisky, and Perry
(2010) found that boredom in learning negatively predicted students’ academic achievement
even after controlling for their prior achievement. Given the importance of boredom in
student learning, a scale that measures learning-related boredom—if proven to be valid and
reliable—could be a useful tool to assess and evaluate student’s boredom levels in academic
learning. The goal of this study, therefore, was to examine the validity of the
Learning-Related Boredom Scale (LRBS; Pekrun, Goetz, & Perry, 2005), in two culturally
different settings – Canada and China.
Samples were comprised of university students from Canada (n = 151) and China (n = 254).
Multi-group confirmatory factor analysis was used to test the factor structure and
measurement invariance across settings, after which we examined the relationships between
the LRBS, frequency of reported boredom in class, self-efficacy for self-regulated learning
(SESRL), and intrinsic motivation. The LRBS showed convincing evidence of reliability
and measurement invariance across the two countries, and the relationships between the
boredom scale, SESRL, and intrinsic motivation were similar across settings.
The study provides general evidence that learning-related boredom is a valid construct
across culturally diverse settings and specific evidence that boredom in learning showed a
similar relationship with both SESRL and intrinsic motivation in two settings. Results from
the study provide evidence about the usefulness of the measure in its current form for use in
cross-national studies.
Factor Analyzing Regression Slopes in Multilevel Model
Parallel Session: Hierarchical & Multilevel Models; Thursday, 21 July, 1:30 p.m. --
2:50 p.m.; D2-LP-08
Yasuo Miyazaki*, Virgnia Tech, USA
The 76th Annual and the 17th International Meeting of the Psychometric Society Page 282
A model that factor analyzes regression slopes at level 1 in two level hierarchical linear
models is presented. Multilevel factor analysis developed by Longford and Muthén
(1992) factor analyzes the group means, i.e., random intercepts, to extract the factors
operating at the macro level, but the proposed model, works on the random slopes. It is
often the case that the focuses of researchers of substantive interests in behavioral and social
sciences lie at regression slopes that indicate the impact of the independent variables on the
dependent variable or the strength of association between those, instead of only means.
When we have multiple independent variables at level 1, these sets of regression slopes as
well as the intercepts, which possibly vary from group to group (level 2), can be regarded as
indexes that characterize the unique nature of each group. When these level-1 regression
coefficients randomly vary, there are many cases that these regression coefficients covary
each other with substantial correlations. In such cases, it is possible to consider factors
operating at the macro level that generated the correlations. The factorization of regression
coefficients would facilitate a better interpretation of the results by reducing the number of
parameters in the model. The worked-out examples from education are presented to
illustrate the techniques and possible interpretations of the results.
Avoiding Boundary Estimates in Hierarchical Linear Models Through Weakly
Informative Priors
Parallel Session: Hierarchical & Multilevel Models; Thursday, 21 July, 1:30 p.m. --
2:50 p.m.; D2-LP-08
Yeojin Chung*, University of California, Berkeley, USA
Sophia Rabe-Hesketh, University of California, Berkeley, USA
Andrew Gelman, Columbia University, USA
Jingchen Liu, Columbia University, USA
Vincent Dorie, Columbia University, USA
When fitting a hierarchical linear model by (restricted) maximum likelihood, a problem
frequently encountered is that the estimates of the variance-covariance matrix of the random
effects are on the boundary of parameter space, or that convergence fails. To avoid this
problem, we propose specifying appropriate Bayesian prior distributions for variance (and
covariance) parameters, and maximizing the marginal posterior distribution, integrated over
the random effects. For random-intercept models, we suggest a prior distribution that
prevents boundary estimates but increases the variance estimate by only about one standard
error, and hence has little influence when the data are informative about the variance. We
compared our Bayes modal estimation approach with maximum likelihood and restricted
maximum likelihood estimation in simulations across a wide range of conditions. Bayes
The 76th Annual and the 17th International Meeting of the Psychometric Society Page 283
modal estimation performed well, not only in terms of parameter recovery but also by
providing better estimates of standard errors of regression coefficients in many situations.
Our approach has been implemented in gllamm and lmer, running in Stata and R,
respectively.
Comparison of Aggregated Scores Adjusted and Non-Adjusted for Nested Effects in
Nested/Hierarchical Measures
Parallel Session: Hierarchical & Multilevel Models; Thursday, 21 July, 1:30 p.m. --
2:50 p.m.; D2-LP-08
Ralph Carlson*, The University of Texas Pan American, USA
Hilda Medrano, The University of Texas Pan American, USA
Carlo Flores, McAllen Independent School District, USA
Psychological and educational measures are often organized by subtests, scales, or factors
into nested/hierarchical structures. Measures are nested within a hierarchical structure if
each level of one measure is within one and only one level of another measure. For example,
within the Wechsler Scales a significant discrepancy among subtests, first level of hierarchy,
within Verbal Type or Performance Type Scales would yield an aggregated Verbal Scale
score or Performance Scale score, second level of hierarchy, that are not interpretable due to
a lack of "cohesion." When there are significant discrepanies/differences within a lower
level of a nested hierarchical measure, all successive levels are not interpretable due to a
lack of "cohesion'; therefore, there is a problem with loss of information. Nested variance is
transitive and flows from bottom of a nested/hierarchical structure to the apex; therefore,
adjustment and interpretation of nested effects must be from bottom-up. The study presents
a model that adjusts for nested effects in nested/hierarchical measures and thus provides a
solution by alleviating the loss of information due to a lack of "cohesion" across successive
levels of a nested/hierarchical measure. The current study presents an example that
compares aggregated scores in a hierarchy that are adjusted and non-adjusted for nested
effects in a nested/hierarchical measure. These data were obtained on the Wechsler
Intelligince Scale for Children from random a sample of 6 year old bilingual Hispanic
children. This study presents a refinement in thinking, analysis, and interpretation of
nested/hierarchical measures.
A Hierarchical Testlet Response Theory Model
Parallel Session: Hierarchical & Multilevel Models; Thursday, 21 July, 1:30 p.m. --
2:50 p.m.; D2-LP-08
Chia-Hua Lin*, National Taichung University of Education, Taiwan
Bor-Chen Kuo, National Taichung University of Education, Taiwan
The 76th Annual and the 17th International Meeting of the Psychometric Society Page 284
Tien-Yu Hsieh, National Taichung University of Education, Taiwan
Yan-Ru Wu, National Taichung University of Education, Taiwan
Testlet items are widely used in large-scale standardized tests to evaluate the learning
achievements of the students. The assessment framework of the many large-scale
standardized tests is the hierarchical assessment framework. Many studies showed that
hierarchical item response theory (HIRT) model is a better way to model data when the
assessment framework is hierarchical.
In this study, a hierarchical testlet response theory (HTRT) model is proposed to model the
testlet items with a hierarchical assessment structure. The performances of the original
testlet response theory (TRT) model and the proposed HTRT model are evaluated in a
simulation study. The results show that the performance (root mean square errors, RMSEs)
of HTRT is better than that of TRT.
Multilevel Item Response Models for Hierarchal Latent Traits
Parallel Session: Hierarchical & Multilevel Models; Thursday, 21 July, 1:30 p.m. --
2:50 p.m.; D2-LP-08
Wen Chung Wang*,The Hong Kong Institute of Education, Hong Kong
Kuan-Yu Jin, The Hong Kong Institute of Education, Hong Kong
Joseph Kui-Foon Chow, The Hong Kong Institute of Education, Hong Kong
In the human sciences, sampled data may have a multilevel structure. For example, repeated
measures are nested within persons; and students are nested within schools. In addition to a
multilevel structure in sampled data, the latent traits of interest may have a hierarchal
structure. For instance, a language proficiency test may measure four kinds of proficiency:
listing, speaking, reading and writing. Not only the “overall” language proficiency but also
the four “domain” proficiencies are of great interest and should be reported. Likewise, a test
of quality of life may contain multiple domains, such as physical, mental, social, and
environmental, so that not only the overall quality of life measure but also the four domain
quality of life measures are of interest. It is likely that not only sampled data have a
multilevel structure but also latent traits have a hierarchical structure. Existing IRT models
can accommodate either multilevel structure in sampled data or hierarchical structure in
latent traits. In this study, we developed a series of item response models that can
accommodate both multilevel structure and hierarchical structure simultaneously, and
conducted a series of simulations to evaluate parameter recovery. It was found that the
parameters of the new models can be recovered very well by using WinBUGS. Two
empirical examples of the Civic Education Study were analyzed for demonstration of the
new model.
The 76th Annual and the 17th International Meeting of the Psychometric Society Page 285
A Two-Tier Testing and Bayesian Network Based Adaptive Remedial Instruction
System in Dilation of a Graph
Parallel Session: Test Development and Validation - Ability Measures I; Thursday, 21
July, 1:30 p.m. -- 2:50 p.m.; D2-LP-09
Shu-Chuan Shih*,National Taichung University of Education, Taiwan
Bor-Chen Kuo, National Taichung University of Education, Taiwan
Chih-Wei Yang, National Taichung University of Education, Taiwan
The main purposes of this study are to construct an adaptive remedial instruction system in
the “dilation of a graph” unit and explore its effect in practical instruction. The system
proposed in this study including the two-tier diagnostic tests based on Bayesian networks,
and remedial instruction media designed according to the diagnostic results. Five steps are
involved in this study: developing the cognitive diagnostic model based on Bayesian
network that can describe the relations between two-tier items and bugs; constructing
two-tier items that students can be provided an opportunity to reveal their bugs in dilation of
a graph; using cognitive conflict strategy to design remedial instruction media for each bug
in the cognitive diagnostic model; integrating the two-tier diagnostic tests and online
remedial instruction to complete the adaptive remedial instruction system; and assessing the
effectiveness of the system by experimental teaching.
The research takes a quasi-experimental approach using pretest-posttest, nonequivalent
group design. The subjects are 154 sixth grade students from an elementary school in
Taichung (64 students in the experimental group and 90 students in the control group). The
experimental group is diagnosed and taught using “the adaptive remedial instruction
system”, while the control group learned using “the traditional remedial instruction activity”
The pretest and posttest using the system are conducted on two groups to understand the
effects of the system. Experimental results indicated that the proposed system can provide
individual bug diagnosis immediately and enhance the effect of remedial instruction
(F=4.993 and p=.027<.05).
Neural Cognitive Assessments in Recognizing Pictographic and Phonemic Abilities
Parallel Session: Test Development and Validation - Ability Measures I; Thursday, 21
July, 1:30 p.m. -- 2:50 p.m.; D2-LP-09
Pei-Tzu Huang*,National Taichung University, Taiwan
Chih-Chien Yang, National Taichung University, Taiwan
The study proposes novel neural cognitive assessments for evaluating pictographic and
phonemic abilities that are critical factors in predicting word recognition developments. The

The 76th Annual and the 17th International Meeting of the Psychometric Society Page 286
proposed neural cognitive assessments include a series of pictographic Chinese characters,
modern Chinese characters, mandarin phonetic symbols and pictures of real objects. The
series represents varied degrees of pictographic and phonemic stimuli that require
participants to use corresponding levels of neurocognitive abilities to answer the questions
timely and properly. The participants were recruited based on two levels of word
recognition skills, the mastered- and learner-levels. Various ages, cognitive levels, and
both genders are included in the study. All the participants were evaluated by behavioral
and neurocognitive assessments with their performance in event related potentials (ERP)
records. The study also provides a novel quantitative model in analyzing the datasets. In
addition, neurocognitive variations can be found among different levels of literates.
Participants were shown having gender effects in ERP recordings when they answered the
questions of modern Chinese characters. Interestingly, male learners show considerable
activations in the auditory area of cortical regions when mandarin phonetic symbols were
presented. In conclusions, the study shows the quantitative validities of the novel
neurocognitive assessments and it also address the empirical values of the quantitative
models.
Kittagali Scale – a Scale to Measure Productivity under the Influence of Music, Motor
and Logical Analogy
Parallel Session: Test Development and Validation - Ability Measures I; Thursday, 21
July, 1:30 p.m. -- 2:50 p.m.; D2-LP-09
Anilkumar Kittagali*, Acharya's Bangalore B-School, India
The Scale can be used to measure the performance of person on the influence of logical,
kinesthetic and musical intelligence by using Kittagali Scale, a self developed scale.
The test involved in analyzing the psycho-motor ability of a person influenced with musical
intelligence and mathematical or logical reasoning. The test involves the use of treadmill
attached with monitor display to choose the questions of choice run under the select musical
choice on select choice of treadmill speed.
The scale should read the best cognitive ability to answer under the influence of music and
psycho-motor agility. The test is conducted on 200 persons measured on same and different
levels of intelligences. The output of measurement is proportional to the productivity of the
person on the performance index according the “Kittagali Scale”.
Cognitive Diagnosis Research Based on RSM for Chinese Children’ Rapid Naming
and Working Memory Defects
Parallel Session: Test Development and Validation - Ability Measures I; Thursday, 21
July, 1:30 p.m. -- 2:50 p.m.; D2-LP-09
The 76th Annual and the 17th International Meeting of the Psychometric Society Page 287
Xiaoling Fan*, Hunan Normal University, China
Fang Liu, Hunan Normal University, China
Jun Wang, Hunan Normal University, China
Objective: Through cognitive diagnostic test of the children in Rapid Naming and Working
Memory , discuss the attribute-master model, to provide theoretical and practical basis for
its diagnostic.
Methods: The framework and projects were established by drawing forefathers’ researchs
and interviewing with experts. Three times forecast analyses, formed two parallel formal
tests, which contained 2 subtests and 7 items. Using individual testing, 314 subjects were
adopted, including 35 RD subuects in test A and 44 in test B.
Results: The CFA showed that the attributes hierarchy model of the tests were reasonable.
The difficulty parameters of test A and B were 0.96-2.83 and 0.80-2.74. The discrimination
parameters were-2.53~-0.22 and -3.13~0.03. The result based RSM showed that the ability
parameters of were -2.40~-0.04 和-3.11~0.98. The classified rate of the 79 pupils with RD
was 95%. .The result showed that more than 83% pupils with RD were classified to typical
attribute-mastery patterns 1, 4, 5, and 7. For four basic attributes, respectively the mastery
rates was 37.14%-94.28% and 3.36%-97.72%, in which Rapid Naming was the highest, the
Sentence Comprehension was the lowest. Subjects existing defects in Naming Rapid with
RD were 23.4%, Working Memory were 64.4%, and two defects was 4%. The parallel
reliability was 0.85. The retest reliability were 0.97 and 0.96. Hit rates were 87% and 93%.
Conclusion: CDT psychometric were fine, which could provide information to identify the
children with RD in Rapid Naming and Working Memory defects.
The Case Study of University Teacher’ Course- Arrangement in Learning Calculus
Parallel Session: Test Development and Validation - Ability Measures I; Thursday, 21
July, 1:30 p.m. -- 2:50 p.m.; D2-LP-09
Bor-Chen Kuo, National Taichung University , Taiwan
Mu-Yu Ting*, National Formosa University, Taiwan
Course arrangement is not easy to carry on. Teachers have no efficient time to edit or
produce related teaching resources. Teacher’ course- arrangement influences the
achievement of students learning Calculus. We want to improve the success rates in several
of our calculus courses. Details of the process to our calculus courses are described in the
following. Some University’ freshmen, when matriculation before the mathematics, had not
the significant difference in the Calculus pretest. On the first semester, one class has
continuously 2 day - 3 hour Calculus curriculums each week, but curriculum arrangements
of another class are more reasonable, 1day- 2 hour curriculums, to the 4th day have 1 hour

The 76th Annual and the 17th International Meeting of the Psychometric Society Page 288
curriculum again, let the students have the sufficient time to review the new curriculum.
However, while we had a positive anecdotal response, there was no study conducted on the
effectiveness of the four-day versus the two-day schedule, and some still felt that more
needed to be done to improve students’ success rates. There were 103 first grade students of
some University, including 99 boys and 4 girls, who participated in this study. The author
started teaching Calculus under the new schedule. Next semester the curriculum schedules
of two classes exchange. Regular examination results were used to evaluate and dissect the
effects of this method. The experiment lasted 27 weeks, during which six assessments, two
midterms and a final exam were given. After each examination, the course instructor
attempts to assess the results.
An Application of Many-Facet Rasch Measurement in the Yes/No Angoff Standard
Setting Procedure
Parallel Session: Standard Setting and Score Use; Thursday, 21 July, 1:30 p.m. -- 2:50
p.m. ; D2-LP-10
Mingchuan Hsieh*, National Academy for Educational Research, Taiwan
Most standard setting procedures commonly utilize scatter plots or descriptive information
such as means and standard deviations as feedback for panelists so they can understand how
far their decisions deviate from others. Such descriptive feedback is certainly useful;
however, when there are many items to be reviewed in a short timeframe, this information
may not be efficient enough for the panelists to quickly identify the most problematic items
which should be reviewed first.
When implementing the Yes/no Angoff method, each panelist must determine whether the
minimally competent examinees can answer the items correctly based on performance level
descriptions. After receiving the feedback, it is difficult for the panelists to review each item
again given the limited amount of time. Panelists might want to know which item
judgments seem to be aberrant from their other item judgments, and make appropriate
corrections. In addition, the standard setting coordinator may desire to know which
panelist’s judgment seems to be away from other judges and whose judgments seem to have
many internal conflicts in order to ascertain which judges require re-training or removal.
The purpose of this article is to use Multifaceted Rasch model to quantify the uncertainties
of the judges in a criterion references test that is designed as an English assessment test for
elementary students. This study also shows how to use the information from Multi-facet
Rasch model as feedback for panelists. The Yes/No Angoff procedure was implemented to
facilitate the illustration.
Item-Centered Procedures for Standard Setting in the Rasch Poisson Counts Model

The 76th Annual and the 17th International Meeting of the Psychometric Society Page 289
Parallel Session: Standard Setting and Score Use; Thursday, 21 July, 1:30 p.m. -- 2:50
p.m. ; D2-LP-10
Jorge González, Pontificia Universidad Católica de Chile, Chile
Rianne Janssen*, Katholieke Universiteit Leuven, Belgium
Ernesto San Martin, Pontificia Universidad Católica de Chile, Chile
In some cases of licensure or certification, a standard may be needed for counts data. The
present paper proposes two new item-centered procedures for setting a cutoff. Both
procedures are based on the Rasch Poisson Counts model (RPCM) developed by Rasch
(1980; see also Jansen, 1986, 1995; Jansen & van Duijn, 1992; van Duijn & Jansen, 1995).
Judges are asked to give the number of errors that are still admissible for the minimally
competent student to make either on each subtest, or on the domain in general. The last
judgment is processed by a hierarchical extension of the RPCM on the item side. Both
procedures are illustrated with a standard-setting study on spelling.
Setting Cutscores with the Bookmark Method: Internal and External Validation
Parallel Session: Standard Setting and Score Use; Thursday, 21 July, 1:30 p.m. -- 2:50
p.m. ; D2-LP-10
Zamri khairani Ahmad*, Universiti sains malaysia, Malaysia
Nordin Abd. Razak, Universiti sains malaysia, Malaysia
The purpose of this study is to establish empirical evidence on both internal and external
validity evidence for Basic, Proficient, and Advanced cutscores established from the
Bookmark standard setting procedure. The criteria for internal evidence of validity includes
consistency within method as well as intra-judge and inter-judge consistency Consistency
within method is examined through calculation of the standard error of the cutsores (SEcut)
based on cluster sample. Intra-judge consistency was examined through calculation of
reliability coefficients for cutscores across rounds. Inter-judge consistency, meanwhile, was
examined through investigation of standard deviation of judges?cutscores. This study
examined external validity in terms of whether the cutscores were clearly and meaningfully
differentiated. The external validity is also examines with regards to the appropriateness of
the classification by comparing the mean ability estimates of students in each performance
level. Even though the present study provided strong evidence of external validity, mixed
results with regards to internal validity especially the lack of agreement among them about
the recommended cutscores provided evidence of credibility to the standard setting session,
since it may indicate a desired diversity of views provided by the judges. Lesson learned
from the study as well as implication from future research will also be discussed.
The 76th Annual and the 17th International Meeting of the Psychometric Society Page 290
Communicating Test Scores to Teachers: Moving from Statistics to Use
Parallel Session: Standard Setting and Score Use; Thursday, 21 July, 1:30 p.m. -- 2:50
p.m. ; D2-LP-10
Gavin T L Brown*, The Hong Kong Institute of Education, Hong Kong
John Hattie, The University of Melbourne, Australia
Psychometric research focuses on the development of statistically robust scores that
accurately reflect an object of interest (e.g., performance, ability, knowledge, or attitude)
and the various sources of variance affecting the accuracy of the scores. In contrast,
education professionals need to be concerned with the inferences and actions that arise once
a statistically-derived score is found. Consequently, just as there is a disjuncture between
Psychometrika and Clinicia (Cronbach, 1954), there is a similar disjuncture between
Psychometrika and Educa (the world of educational practice). While much is made in the
professional Standards for Educational and Psychological Testing (AERA, APA, & NCME,
1999) concerning the dependability of scores, little is said about the nature of reporting
scores to educational users (e.g., teachers, administrators, students, or parents). The ultimate
validity of a psychometrically-derived score is that the reader of the report makes the
correct and appropriate inference and takes appropriate actions based on the assessed scores.
Hence, if tests are to contribute to improved education, test developers need to know they
have successfully communicated test scores to users.
This paper will report a series of studies conducted in New Zealand with school users of
standardised test reports. We will illustrate the importance of communicating, not so much
the right score, as the scores in the right way for teaching professionals. This ability
depends on understanding the informational needs and professional goals of teachers, the
prior knowledge of such test users, and principles of effective communication as
touchstones in developing appropriate reports.
Statistical Quality Control Tools and Models in Monitoring Test Scores
Parallel Session: Standard Setting and Score Use; Thursday, 21 July, 1:30 p.m. -- 2:50
p.m. ; D2-LP-10
Alina A. von Davier*, Educational Testing Service, USA
For testing programs that provide a large number of administrations each year, the challenge
of maintaining comparability of test scores is influenced by the potential rapid accumulation
of errors and by the lack of time between administrations to apply the usual techniques for
detecting and addressing scale drift. The traditional quality control techniques have been
developed for tests with only a small number of administrations per year, and therefore,
while very valuable and necessary, they are not sufficient for catching changes in a complex

The 76th Annual and the 17th International Meeting of the Psychometric Society Page 291
and rapid flow of scores. Model-based techniques that can be updated at each administration
could be used to flag any unusual pattern. The basis for the paper is recent research
conducted at Educational Testing Service. I will provide an application of traditional quality
control charts, such as Shewhart and CUSUM charts on testing data, time series models,
change point models, and hidden Markov models to the means of scale scores to detect
abrupt changes. Some preliminary data mining approaches and results also will be discussed.
This type of data analysis of scale scores is relatively new and any application of the
aforementioned tools is subject to the typical pitfalls: Are the appropriate variables included?
Are the identified patterns meaningful? Are time series models or hidden Markov models
suitable for only a particular set of data used in the study or can they be generalized to data
from other tests?
Aspects of structural equation modeling
Invited Symposium : Thursday, 21 July, 4:00 p.m. -- 5:20 p.m., D1-LP-03
A Measure of Skewness of Testing for Normality
Shigekazu Nakagawa*, Kurashiki University of Science and the Arts, Japan
Hiroki Hashiguchi, Saitama University, Japan
Naoto Niki, Tokyo University, Japan
The focus of this paper is related to the problem of testing whether an underlying population
is normally distributed. As a test statistic under the null hypothesis of normality, we propose
a new test statistic based on the Pearson measure of skewness. Pearson measure of
skewness is initiated by Karl Pearson and is one of measure of skewness defined by a
standardized difference between population mean and mode. Considering Pearson system
which includes normal distributions, Pearson measure of skewness becomes a rational
function of population skewness and kurtosis. Our proposal statistic is an estimator of this
function and is called sample Pearson measure of skewness. We give the asymptotic first
four moments of the null distribution for sample Pearson measure of skewness by using a
computer algebra system and give its normalizing transformation based on a Johnson
system. Power comparisons against some asymmetric alternative distributions are also
illustrated.
Applications of asymptotic expansion in structural equation modeling
Haruhiko Ogasawara*, Otaru University of Commerce, Japan
As applications of asymptotic expansion in structural equation modeling, the distributions
of parameter estimators in mean and covariance structures are dealt with. The parameters
The 76th Annual and the 17th International Meeting of the Psychometric Society Page 292
may be common to or specific in means and covariances of observable variables. The
means are possibly structured by the common/specific parameters. First, the distributions of
the parameter estimators standardized by the population asymptotic standard errors are
expanded using the single- and the two-term Edgeworth expansions. In practice, the pivotal
statistic or the Studentized estimator with the asymptotically distribution-free standard error
is of interest. An asymptotic distribution of the pivotal statistic is also derived by the
Cornish-Fisher expansion. Simulations are performed for a factor analysis model with
nonzero factor means to see the accuracy of the asymptotic expansions in finite samples.
Interaction between strategies and invariance/noninvariance conditions in testing for
partial invariance in structural equation modeling
Soonmook Lee*, Sungkyunkwan University, Korea
Hanjoe Kim, Tennessee State University, USA
In testing for partial invariance in multi-group analysis of structural equation modeling,
there are two contrasting strategies. Once a baseline model (e.g., configural invariance) is
established, one may test more restricted models by adopting two alternatives. Strategy 1
is constraining all parameters to be equal across groups and freeing the flagged parameters,
one at a time. Strategy 2 is forming models by constraining only one parameter at a time, in
addition to the referent parameter, and comparing with the baseline model. In a context of
detecting metric noninvariance Strategy 1 worked well when invariance held across groups
in majority and worked poorly when noninvariance was in majority (Yoon & Millsap, 2007).
In a context of detecting differential functioning items, Strategy 2 was more effective than
Strategy 1 (Stark, Chernyshenko, & Drasgow, 2006). Strategies 1 and 2 may interact with
invariance/noninvariance observed in majority. A Monte Carlo study was conducted to
examine the interaction and to provide practical suggestions for a choice of proper strategy.
Joint Bayesian model selection and parameter estimation for latent growth curve
mixture model
Satoshi Usami*, University of Tokyo, Japan
Latent variable models using categorical latent variables can be used to estimate unobserved
components (or populations) stratification and clustering. Especially, latent growth curve
mixture modeling (LGCMM) enables us to assess the different mean growth trajectories
among components, and it has attracted increasing interest in behavioral and psychological
science. In the present research, we discuss the issues of joint Bayesian model selection and
parameter estimation for LGCMM. As for some of LGCMM that include a proportional
parameter and/or a cross-lag parameter (e.g., dynamic latent change score models), not only
The 76th Annual and the 17th International Meeting of the Psychometric Society Page 293
estimating the number of unknown components but evaluating equivalence of these
parameters among components and/or variables are sometimes a major aim of research,
since model misspecification may lead incorrect interpretation for dynamic changes and
causal relation among variables. In the simulation study, we compare the accuracy of model
selection (i.e., the number of unknown components and the equivalence of proportional and
cross-lag parameters) for latent change score models based on various indices and
estimation methods such as Bayesian Information Criterion (BIC), Deviance Information
Criterion (DIC), posterior predictive P-value and Reversible Jump Markov Chain Monte
Carlo (RJMCMC) algorithm. Additionally, the issue of needed sample size to obtain the
“meaningful components” (in the sense that researchers are free from obtaining some
nonsense artifacts through LGCMM) and real data examples of LGCMM are also addressed
in the presentation.
Process models for behavioral dynamics
Symposium : Thursday, 21 July, 4:00 p.m. -- 5:20 p.m., D1-LP-04
Models of dyadic dependence for event sampling data.
Peter F. Halpin*, University of Amsterdam, The Netherlands
Raoul P. P. P. Grasman, University of Amsterdam, The Netherlands
Paul De Boeck, University of Amsterdam & K.U.Leuven, The Netherlands/ Belgium
This paper concerns event sampling data collected on dyads. The events of interest are
defined in terms of the individual members of the dyad, for example an observed behaviour
or self-reported experience. For each individual and each event of interest, the times at
which the event occurs are recorded. These data are represented as chains of time-shifted
unit impulses and we refer to each such chain as a temporal pattern. We consider
non-stationary point process models in which the probabilities of a target temporal pattern
are predicted by specific sub-sequences of other temporal patterns. These sub-sequences are
referred to as either self-stimulus sequences or other-stimulus sequences, depending on
which member of the dyad they are drawn from. We focus on the identification of
other-stimulus sequences that regularly precede or co-occur with the events in a target
temporal pattern. The absence of such sequences would indicate independence between
members of a dyad, for the events of interest. Both symmetrical and asymmetrical relations
are possible and can be useful in describing and summarising interpersonal dynamics.
Estimation and assessment of model fit are detailed for the case where a single dyad is
observed. Extensions are suggested.
Structural relations underlying multivariate event sequences
The 76th Annual and the 17th International Meeting of the Psychometric Society Page 294
Raoul P. P. P. Grasman*, University of Amsterdam, The Netherlands
Peter F. Halpin, University of Amsterdam, Netherlands
Research on dynamics in psychological processes is gaining more and more attention in
psychology. Most time series models in use fall in the category of auto-regression and/or
moving average models (formulated as such or in the state-space framework), and come
with or without nonlinear components (e.g., by introducing thresholds or switching between
multiple states). Some sequences however, consist of measurement of times (response times,
event scoring, etc.) instead of measures that vary orthogonally to the time axis. While not
always recognized (e.g., in analyzing oscillatory components in response time sequences),
the most natural class of stochastic models for these series are point processes. We will
consider linear structural relations between point processes for analyzing multivariate event
data and the advantages and disadvantages of time- and frequency domain approaches.
Hierarchical diffusion models for intensive longitudinal data analysis
Francis Tuerlinckx*, K.U. Leuven, Belgium
Zita Oravecz, K. U. Leuven, Belgium
Joachim Vandekerckhove, K. U. Leuven, Belgium
Multivariate intensive longitudinal panel data often arise in psychology through experience
sampling studies in which subjects are measured in their daily life. Or more technically, a
sample of subjects is examined on several variables at a relatively large number of
unequally spaced time points. In this talk we discuss hierarchical diffusion models that can
be used to analyze such data (see Oravecz, et al., 2011). The basic aspects of the model will
be explained (interpretation, the inclusion of time-invariant and time-varying covariates). In
addition, we will discuss further aspects such as a new variance decomposition identity
based on this model, possible problems with random effects extensions and the relation to
existing models. Finally, a newly developed software tool is introduced.
Sequential order based GLMMs for random person and item effects
Paul De Boeck*, University of Amsterdam & K.U.Leuven, The Netherlands/ Belgium
The multiple item response profile (MIRP) model is a model with two or more random
person variables and two or more random item variables. When applied to item response
data from time 1 to time T, T random person variables and also T random item variables can
be defined, so that two covariance structures result, one for the persons and one for the
items. A multivariate normal distribution is assumed for both. Based on Generalized Linear
Mixed Model (GLMM) versions of the MIRP model, various constraints stemming from the
The 76th Annual and the 17th International Meeting of the Psychometric Society Page 295
sequential order can be imposed on the model. The approach will be applied to a short time
series of data from the Outcome Questionnaire (OQ, Lambert et al., 2003) with 45 items
presented in a psychotherapy context to assess improvements in mental health. It will be
explained how the model can be estimated with the lmer function of the lme4 package in R.
Extensions to a multidimensional model for panel data will be considered.
A Joint Model for Item Response and Response Times Based on the Relationship
Between Accuracy and Speed of Test Takers
Parallel Session: Response Time and Equating; Thursday, 21 July, 4:00 p.m. -- 5:20
p.m.; D1-LP-06
Xiang Bin Meng*, Northeast Normal University, China
Jian Tao, Northeast Normal University, China
Ning-Zhong Shi, Northeast Normal University, China
With the introduction of computerized test, the record of response times has become quite
common. In order to model the relationship between speed and accuracy appropriately, the
concepts of speed and relative speed were defined explicitly in this article. Then, we
proposed a model framework for responses and response times on test items which
incorporates a covariance structure to explain the dependency between speed and accuracy
within items. It is shown how all parameters in this model can be estimated by a Markov
chain Monte Carlo (MCMC) method. The Congdon's version of AIC and BIC and deviance
information criterion (DIC) were developed for comparing model fit among models with
different covariance parameters, which are easily calculated as byproducts of the MCMC
computation. The posterior predictive model checking (PPMC) methods were used to
evaluate the fit of the model. Finally, the performance of our approach is illustrated by
means of a simulation study and an empirical example.
Modeling Response Time in Computerized Testing Using Semi-parametric Linear
Transformation Model
Parallel Session: Response Time and Equating; Thursday, 21 July, 4:00 p.m. -- 5:20
p.m.; D1-LP-06
Chun Wang*, University of Illinois at Urbana-Champaign, USA
Hua-Hua Chang, University of Illinois at Urbana-Champaign, USA
Jeffrey Douglas, University of Illinois at Urbana-Champaign, USA
The item response times (RTs) collected from computerized testing represent an
underutilized type of information about items and examinees. In addition to knowing the
examinees' responses to each item, we can investigate the amount of time examinees spend

The 76th Annual and the 17th International Meeting of the Psychometric Society Page 296
on each item. Current models for response times are focused on parametric models, which
have the advantage of conciseness, but may suffer from a reduced flexibility to fit real data.
We propose a semi-parametric approach, i.e., the linear transformation model with a latent
speed covariate, which combines the flexibility of nonparametric modeling and the brevity
as well as interpretability of the parametric modeling. In this new modeling approach, the
RTs, after some non-parametric monotone increasing transformation, become a linear
model with latent speed as covariate plus an error term. The distribution of the error term
implicitly defines the relationship between the RT and examinees’ latent speeds; whereas
the non-parametric transformation is able to describe various shapes of RT distributions. In
fact, the linear transformation model represents a rich family of models that include the Cox
proportional hazard model, Box-Cox normal model, and many other models as special cases.
A Markov chain Monte Carlo method for parameter estimation is given, and may be used
with sparse data obtained by computerized adaptive testing. In addition, the stepwise
estimation for the non-parametric transformation is provided.
The Impact of Different Settings of Missing Value Options in WINSTEPS and
PARSCALE on IRT Equating or Linking
Parallel Session: Response Time and Equating; Thursday, 21 July, 4:00 p.m. -- 5:20
p.m.; D1-LP-06
Zhiming Yang*, Educational Testing Service, USA
Maolin Ye, Management School of Jinan University, China
Ming Xiao, Partory School of Business, China
WINSTEPS® and PARSCALE® are often used for estimating parameters, scaling, and
equating or linking. The impact of different settings of missing value options in WINSTEPS
and PARSCALE upon the accuracy of the parameter estimates and the resulting equating or
linking is examined through simulation studies. Several findings are established or
confirmed. Recommendations, as well as some caveats regarding the settings of missing
values in WINSTEPS and PARSCALE, are given in the conclusion.
A Bayesian Approach to Concurrent Calibration Analysis for Non-equivalent Groups
with Anchor Test Design
Parallel Session: Response Time and Equating; Thursday, 21 July, 4:00 p.m. -- 5:20
p.m.; D1-LP-06
Lin-shan Yang*, ShenZhen Seaskyland Educational Evaluation Co.,Ltd
Yan Liu, ShenZhen Seaskyland Educational Evaluation Co.,Ltd
Chen Yang, ShenZhen Seaskyland Educational Evaluation
The 76th Annual and the 17th International Meeting of the Psychometric Society Page 297
The primary purpose of this study was to explore the performance of bayesian approach to
IRT concurrent calibration methods for NEAT (non-equivalent groups with anchor test)
design. For a real data, six bayesian methods with different parameter priors of 2-parameter
logistic model (2PL) and different missing data techniques (MDTs) were be used to obtain
IRT parameters simultaneously. Comparelly, the real data was run by BILOG-MG to get a
common merit. For method 1, the item difficulty had a standard normal distribution prior
(the mean and standard deviation was zero and one, respectively), the responses not taken
by particular group were regarded as not reached and noted ‘NA’ in WinBUGS. Similar to
method 1, the item difficulty of method 2 had the same distribution prior, but missing
responses were not conducted. For method 3, the subject ability had a standard normal
distribution prior, and the missing responses were noted ‘NA’. Compared to method 3,
missing responses of method 4 were not conducted. For the last 2 methods, method 5 and
method 6, both of item difficulty and subject ability had standard normal distribution priors,
but missing responses were noted as ‘NA’ and not conducted , respectively. For each
method, the item difficulty and subject ability parameters of each group were compared.
The results showed method 1 and method 2 performed exactly and differed from another
methods. It also suggested that method 3, method 4, method 5 and method 6 obtained the
same parameters estimation. It should be recommended that method 7 (run in BILOG-MG)
distinguished significantly from all methods above. So It was known that the parameter
estimations of the all methods were affected by ability parameter prior, while the effect of
missing data techniques was relatively small and could be ingnored .
Small N and Utility of An Extended Circle-Arc Equating Method
Parallel Session: Response Time and Equating; Thursday, 21 July, 4:00 p.m. -- 5:20
p.m.; D1-LP-06
Jaehoon Seol, Prometric, USA
Shungwon Ro*, Kenexa, USA
Sarah Hagge, National Council of State Boards of Nursing, USA
Seonho Shin, Prometric, USA
There has been increasing demand for equating multiple test forms with small sample size
in the certification and licensure testing settings. A circle-arc method by Livingston and
Kim (2009) seems to provide a good solution addressing the small sample size issue. Based
on a resampling study, they recommend the circle-arc equating method over 1) conventional
mean equating for small N cases, 2) linear equating for situations with test forms in
different difficulty and 3) equipercentile equating for small N and scarcity of data at the
extremes of the score distribution.
The 76th Annual and the 17th International Meeting of the Psychometric Society Page 298
There is also growing interest of preserving pass rates in many certification/licensure testing
programs, in particular those small-scale programs with candidate volume of 20 – 250 per
administration/testing window. This study introduces a new method, an extended circle-arc
equating, to address the issue of preserving pass rates. With an introduction of a control
parameter h, a resampling study with small N confirms Livingston and Kim’s results –
better performance over mean, linear and equipercentile equating. This study also proves
utility of the new, extended circle-arc equating method for credentialing programs,
requiring two conditions: 1) preserving the pass rates over time and forms and 2) small N,
mainly for concerns over public relations.
The Wellbeing of Creepies and Crawlies on The Sea Bed: A Three-Way
Correspondence Analysis
Parallel Session: Categorical Data Analysis; Thursday, 21 July, 4:00 p.m. -- 5:20 p.m.;
D1-LP-07
Pieter M. Kroonenberg*, Leiden University, Netherlands
In ecology large contingency tables are produced in experiments to investigate the influence
of man on animal life. Widdicombe & Austin subjected 98 buckets with homogenized
sediment from the Oslofjord to a 7x7 design of organic enrichment and physical disturbance
The effect on the biodiversity of the factors and their interaction was examined via
three-way correspondence analysis using 3WayPack (Kroonenberg, 2008; Kroonenberg &
De Roo, 2010).
An Extension of Proportional Odds Models: Using Generalized Ordinal Logistic
Regression Models for Educational Data
Parallel Session: Categorical Data Analysis; Thursday, 21 July, 4:00 p.m. -- 5:20 p.m.;
D1-LP-07
Xing Liu, Eastern Connecticut State University, USA
Jiarong Zhao*, Nanjing Normal University, China
Wei Xia, University of Connecticut, USA
The most well-known model for estimating the ordinal dependent variable might be the
proportional odds (PO) model (Agresti, 1996, 2002, 2007; Armstrong & Sloan, 1989; Long,
1997, Long & Freese, 2006; McCullagh, 1980; McCullagh & Nelder, 1989; O’Connell,
2000, 2006; Powers & Xie, 2000). In this model, the effect of each predictor is assumed to
be the same across the categories of the ordinal dependent variable. However, the
assumption of proportional odds is often violated, since it is strongly affected by sample
size and the number of covariate patterns (e.g., including continuous covariates as the
The 76th Annual and the 17th International Meeting of the Psychometric Society Page 299
predictors) (Allison, 1999; Brant, 1990; Clogg & Shihadeh, 1994). It is misleading and
invalid to continue to interpret results if this assumption is not tenable.
To deal with this issue, the partial proportional odds (PPO) model (Anath & Kleinbaum,
1997; Peterson & Harrell, 1990; O’Connell, 2006) and the generalized ordinal logit model
(Fu, 1998; William, 2006) were developed. In educational research, the PO model is widely
used. However, the use of the generalized ordinal logit model seems to be overlooked.
Therefore, it is imperative to help education researchers better understand this model and
utilize it in practice. The purpose of this paper is to illustrate the use of generalized ordinal
logistic regression models, which allow the effect of each explanatory variable to vary
across different cut points, to predict mathematics proficiency levels using Stata, and
compare the results of fitting the PO models and the generalized ordinal logistic regression
models.
Maximum Likelihood and Weighted Least Square Estimators in Estimating
Nature-Nurture Models
Parallel Session: Categorical Data Analysis; Thursday, 21 July, 4:00 p.m. -- 5:20 p.m.;
D1-LP-07
I-Hau Hsu *, National Taichung University, Taiwan
Chih-Chien Yang, National Taichung University, Taiwan
The study is to examine performance of an adjusted Weight Least Square method and a
Maximum Likelihood Estimator for estimating Nature-or-Nurture models. The “nature or
nurture” model (Galton, 1875) can quantitatively evaluate the genetic behavioral effects and
can be critical in many psychometrical applications also. The Weighted Least Square
method to be employed is the Weight Least Square with Mean and Variance adjustment
(WLSMV, Muthen, do Toit, & Spisic, 1997) that was shown to have robustness in
estimating categorical data (Muthen et al., 1997). Meanwhile, the Maximum Likelihood
estimator, multinomial threshold ML (MLT), is shown in Neal and Martin (1989) for
estimating categorical variables. Less was studied in examining the two new methods in
estimating the Nature-or-Nurture models. The current study conducts Monte Carlo
experiments in evaluating performance of the two estimators in analyzing simulated
Nature-Nurture models under various sample sizes (e.g., 100, 200, …) and model
parameters (e.g., λ1:0.8 ,λ2:0.3, λ3:0.52). Using RMSEA (Browne & Cudeck, 1993) as
model fit index and performance criteria, results show the two estimators differ in some
experimental conditions and provide interesting and practical guidelines. Conclusions and
suggestions will be outlined in the conference presentation and final research reports.
The 76th Annual and the 17th International Meeting of the Psychometric Society Page 300
Predicting Discrete Macro-Level Outcome Variables with Micro-Level Explanatory
Variables: A Latent Class Approach
Parallel Session: Categorical Data Analysis; Thursday, 21 July, 4:00 p.m. -- 5:20 p.m.;
D1-LP-07
Margot Bennink*, Tilburg University, Netherlands
Marcel A. Croon, Tilburg University, Netherlands
Jeroen K. Vermunt, Tilburg University, Netherlands
Croon and van Veldhoven proposed a statistical model to predict outcomes at the
macro-level (e.g. team performance) from explanatory variables at the micro-level (e.g.
employee’s motivation and skills). A factor analytic structure is used in which the scores of
the lower-level units are seen as indicators of latent factors at the group level. The outcome
variable is not regressed on the aggregated group mean(s) of the micro-level predictor(s) but
on the latent macro-level variable(s). The main limitation of the approach is that the
outcome variables should be continuous and normally distributed and that the relationships
should be linear. When the outcome variables are discrete, these assumptions are obviously
violated and in this case a latent class model can be used instead of a factor analytic model.
Two basic models with discrete outcomes and two ways to obtain maximum likelihood
estimates of these models are presented. Maximum likelihood estimators can be obtained
with the “persons as variables” approach or by treating the models as two-level regression
models with multivariate responses. In a simulation study the latent class approach is
compared to more traditional approaches namely disaggregation of the macro-level outcome
to the micro-level and aggregating the micro-level variable to the macro-level.
Within-Subject Analysis of Variance and Generalized Linear Mixed Models for
Binary Outcome
Parallel Session: Categorical Data Analysis; Thursday, 21 July, 4:00 p.m. -- 5:20 p.m.;
D1-LP-07
Ehri Ryu*, Boston College, USA
Within-subject experimental design is popular in psychological experiments. Often the
experiments involve binary outcome (e.g., recognition task). Many researchers still adopt
analysis of variance (ANOVA) technique for analyzing such data. Binary outcome variables
do not satisfy underlying assumptions of ANOVA. Generalized linear models provide more
flexibility to handle alternative forms of outcomes. Within-subject design adds an additional
complexity because the assumption of independent observations is violated. In order to
appropriately handle binary outcome from within-subject design, multilevel extension of
generalized linear models are required. I will conduct a simulation study to compare the

The 76th Annual and the 17th International Meeting of the Psychometric Society Page 301
performances of the conventional within-subject ANOVA and two SAS procedures –
GLIMMIX and NLMIXED – for generalized linear mixed models under various conditions.
The purpose of the study is to examine how robust within-subject ANOVA is when applied
to binary outcome, and to identify conditions in which within-subject ANOVA is robust and
those in which applying ANOVA becomes problematic.
Exploratory Bi-Factor Analysis
Parallel Session: Factor Analysis; Thursday, 21 July, 4:00 p.m. -- 5:20 p.m.; D1-LP-08
Robert I. Jennrich, University of California at Los Angeles, USA
Peter Bentler*, University of California at Los Angeles, USA
Bi-factor analysis is a form of confirmatory factor analysis originally introduced by
Holzinger. The bi-factor model has a general factor and a number of group factors. The
purpose of this paper is to introduce an exploratory form of bi-factor analysis. An advantage
of using exploratory bi-factor analysis is that one need not provide a specific bi-factor
model a priori. The result of an exploratory bi-factor analysis, however, can be used as an
aid in defining a specific bi-factor model. Our exploratory bi-factor analysis is simply
exploratory factor analysis using a bi-factor rotation criterion. This is a criterion designed to
produce perfect cluster structure in all but the first column of a rotated loading matrix.
Examples are given to show how exploratory bi-factor analysis can be used with ideal and
real data. The relation of exploratory bi-factor analysis to the Schmid-Leiman method is
discussed.
The Infinitesimal Jackknife with Exploratory Factor Analysis
Parallel Session: Factor Analysis; Thursday, 21 July, 4:00 p.m. -- 5:20 p.m.; D1-LP-08
Guangjian Zhang*, University of Notre Dame, USA
Kristopher J. Preacher, University of Kansas, USA
Robert I. Jennrich, University of California at Los Angeles, USA
The infinitesimal jackknife (IJK), a nonparametric method for estimating standard errors,
has been used to obtain standard error estimates in covariance structure modeling. The IJK
automatically accommodates non-Gaussian data and model mis-specification. In this paper,
we adapt it for standard errors of rotated factor loadings and factor correlations of
exploratory factor analysis with sample correlation matrices. Both maximum Wishart
likelihood estimation and ordinary least squares estimation are considered.
One-Stage Rotation Method for Second-Order Factor Analysis
Parallel Session: Factor Analysis; Thursday, 21 July, 4:00 p.m. -- 5:20 p.m.; D1-LP-08
The 76th Annual and the 17th International Meeting of the Psychometric Society Page 302
Hsing-Chuan Hsieh*, National Chung Cheng University, Taiwan
Chung-Ping Chen , National Cheng Kung University,Taiwan
Traditionally, when dealing with second-order factor analysis, analysts first extract the
first-order factors after the oblique rotation and then regard them as the new observed
variables in order to extract the higher-order factors. This conventional procedure will cause
problems, however, when in practice the analysts only focus on the second-order factors
whose number is clear but didn’t know the exact number of the first-order ones. Since the
higher-order factors are determined by the first-order ones, if the selection for the first-order
factors is inappropriate, then the selection for the second-order ones might not be expected
suitable either. As a result, in order to extract the most suitable second-order factors,
analysits might have to analyze the data for many times, each time with different possible
number of first-order factors. This thus leads to my following research whose purpose is to
extract all factors of both orders at a time for the sake of efficiency for the procedures.
Speaking technically, I’d like to redefine a criterion for the simultaneous rotations for the
two-order factors. We also demonstrate the efficiency of the renewed criterion by analyzing
both the artificial as well as the real data.
Oblique Rotation Techniques with Clustering Of Variables
Parallel Session: Factor Analysis; Thursday, 21 July, 4:00 p.m. -- 5:20 p.m.; D1-LP-08
Michio Yamamoto*, Osaka University, Japan
Two new oblique factor rotation methods are proposed. The first one is a method which
intends to find a simple structure in a factor loading matrix using prior information about
the cluster structure of variables, and the second is a method which aims to find a simple
structure and classify variables into optimal clusters simultaneously. A criterion consisting
of the complexity of a factor loading matrix and the between-cluster dissimilarity is
optimized using the GP algorithm and the k-means algorithm. Artificial and real data
analyses demonstrate that the proposed methods can give a better simple structure and
produce more interpretable results compared with those of widely known rotation
techniques.
Dimensionality Assessment of Ordered Polytomous Items with Parallel Analysis
Parallel Session: Factor Analysis; Thursday, 21 July, 4:00 p.m. -- 5:20 p.m.; D1-LP-08
Marieke E immerman*, University of Groningen, Netherlands
Urbano Lorenzo-Seva, Rovira i Virgili University, Spain
The 76th Annual and the 17th International Meeting of the Psychometric Society Page 303
Parallel analysis (PA) is an often recommended approach to assess the dimensionality of a
variable set. PA is known in different variants, which may yield different dimensionality
indications. We consider the most appropriate PA procedure to assess the number of
common factors underlying ordered polytomously scored variables. As extraction method,
the authors propose minimum rank factor analysis (MRFA), rather than the currently
applied principal component analysis (PCA) and principal axes factoring (PAFA). A
simulation study, based on data with major and minor factors, shows that all procedures
consistently point at the number of major common factors. A polychoric based PA slightly
outperformed a Pearson based PA, but convergence problems may hamper its empirical
application. In empirical practice, PA-MRFA with mean threshold based on Polychoric
correlations, or in case of non-convergence Pearson correlations with 95% threshold,
appears to be a good choice to identify the number of common factors. PA-MRFA is a
common factor based method, and performed best in our simulation experiment. PA based
on PCA with 95% threshold is a second best, as this method showed good performances in
the empirically relevant conditions.
Comparisons between the Universal Sampler and the Slice Sampler
Parallel Session: Computational Methods; Thursday, 21 July, 4:00 p.m. -- 5:20 p.m.;
D2-LP-08
Jianhui Ning*, Central China Normal University, China
Yuchung Wang, Rutgers University, USA
We devise a simple algorithm to generate independent and identically distributed samples
from the kernel of a probability density function without the normalizing constant. This
approach generates samples from the exact, not approximate, target distribution, and it is
applicable to both univariate and multivariate distributions. Thus, we name it the universal
sampler. In the talk, we will explain (a) how the samples are generated; (b) its accuracy in
sampling some of the commonly used distributions, such as normal, chi-square, and
exponential; (c) its performance to sample some custom-made distributions. Because the
slice sampler is also designed to draw (Markov-dependent) observations from any density
function, we make comparisons between the two methods. The three examples from the
book of Robert and Casella (2004, P.326-333) are used to illustrate the performance of the
universal sampler. The comparisons are restricted to one-dimensional distributions.
Multivariate generalization will be briefly mentioned.
An Evaluation of Algorithms on Generating Multivariate Non-Normal Data
Parallel Session: Computational Methods; Thursday, 21 July, 4:00 p.m. -- 5:20 p.m.;
D2-LP-08
The 76th Annual and the 17th International Meeting of the Psychometric Society Page 304
Hao Luo*, Uppsala University, Sweden
Fan Yang-Wallentin, Norwegian School of Management, Sweden
Non-normal variables are common in many empirical investigations in the social and
behavioral sciences. Monte Carlo simulations requiring correlated data from non-normal
populations are frequently used to investigate the small sample properties of competing
statistics or the robustness of estimation methods. However, generating multivariate
non-normal data with specified correlation matrices and marginal skewness and kurtosis is
difficult. In this study, the following four algorithms are evaluated regarding their ability to
generate multivariate non-normal distributions: Vale & Maurelli's multivariate extension of
the Fleishman method, Headrick & Sawilowsky's (1999) refinement for calculating the
intermediate correlations based on Vale & Maurelli (1983), Headrick's (2002) fifth-order
polynomial transformation and Ruscio & Kaczetow's (2008) iterative algorithm. We
empirically test the applicability of these algorithms in a Monte Carlo simulation.
Algorithms are compared in terms of simplicity, generality, and reliability of the technique.
The empirical size and power of some recently proposed tests for multivariate normality are
also studied using generated non-normal samples. Based on the simulation results,
recommendations regarding the application schemes of these algorithms are provided for
applied researchers.
Bootstrap Confidence Intervals for the Meta-analysis of Correlations Corrected for
Indirect Range Restriction
Parallel Session: Computational Methods; Thursday, 21 July, 4:00 p.m. -- 5:20 p.m.;
D2-LP-08
Johnson Ching Hong Li*, University of Alberta, Canada
Ying Cui, University of Alberta, Canada
Mark J. Gierl, University of Alberta, Canada
Wai Chan, The Chinese University of Hong Kong, Hong Kong
The meta-analysis of Pearson correlations between two quantitative variables is commonly
used to synthesize results published in a collection of primary studies conducted by
independent researchers. These correlations, however, are typically subjected to indirect
range restriction (IRR), thus resulting in biased estimators of their true population values.
To correct for the bias, Hunter and Schmidt (2004) proposed a meta-analytic correlation
corrected for IRR (i.e., HSir) and the associated confidence interval (i.e., HSirCI). In this
paper, we evaluate the performance of the HSir and HSirCI, using two Monte Carlo
simulation studies. The first generated data based on the fixed-effects model in which the
population correlations across studies were set to be identical. The second generated data
The 76th Annual and the 17th International Meeting of the Psychometric Society Page 305
based on the random-effects model in which the population correlations across studies were
randomly selected from a “superpopulation”. The manipulated factors include the number
of primary studies, magnitude of population correlations, selection ratio, and variability of
restricted sample sizes in primary studies. Results showed that the HSir was accurate but
not the associated HSirCI. Hence, we propose a unified bootstrap procedure to construct the
confidence intervals of the HSir in a meta-analysis study, as this procedure is found to be
desirable for the correlation corrected for IRR in a single study (Li, Chan, & Cui, 2010).
Results show that the proposed bootstrap confidence intervals improve the accuracy of the
HSirCI in terms of their coverage probabilities. Implications of the proposed bootstrap
procedure are also discussed.
Application of Bootstrap Methods In Psychological Research
Parallel Session: Computational Methods; Thursday, 21 July, 4:00 p.m. -- 5:20 p.m.;
D2-LP-08
Qingqing Xiong*,South China Normal University, China
Min-Qiang Zhang, South China Normal University, China
In educational and psychological research and measurement,the traditional overreliance on
statistical significance testing has been challenged on several grounds,including the sample
size issue,the meaningfulness of the traditional null hypothesis,and questions involving the
validity of theoretical assumptions underlying parametric statistical inferences.Instead of
traditional method that rely on theoretical assumptions derived the sampling distribution of
statistics , bootstrap selects experience distribution to estimate the distribution, and uses the
observation data sampling sample information to estimate the statistical model.So the
method avoids some of pitfalls of the traditional statistical significance testing. This
analysis method is mainly used in social studies parameters and the standard error
estimation, interval estimation, psychological measurement of the reliability analysis,
mediation effect, describe sample results stability and reliability, and psychological
statistics of correlation analysis and regression analysis, factor analysis. This paper reviews
the application of the method in domestic and foreign psychology research, which indicates
that, Bootstrap analysis,both as a tool for nonparametric statistical inference and as a tool
for describing sample results stability and replicability.In respect of future development in
the psychometric application, the method will be combined with other theoretical
frameworks of measurement.
Quantitative Neurocognitive Measurements of Procedural and Conceptual Knowledge
of Spatial Ability
The 76th Annual and the 17th International Meeting of the Psychometric Society Page 306
Parallel Session: Test Development and Validation - Ability Measures II; Thursday, 21
July, 4:00 p.m. -- 5:20 p.m.; D2-LP-09
Ting-Yao Liao*,National Taichung University, Taiwan
Chih-Chien Yang, National Taichung University, Taiwan
To explore the connection between procedural and conceptual knowledge of spatial abilities
in elementary levels, this research create a spatial ability task to measure the neurocognitive
developments. Wai, Lubinski, and Benbow (2009) proposed that spatial ability is a critical
ability in STEM (science, technology, engineering, and mathematics). They also
concluded that spatial ability could be influential in student selection, curriculum design and
in additional educational applications. The current study extends Wai et al.'s (2009) research
to examine spatial abilities by using quantitative neurocognitive assessment instruments.The
proposed instruments are created by modifying Feng’s (2005) behavioral assessments of
spatial ability for elementary students. Thirty-two 4th grade elementary students were
recruited to join the neurocognitive assessments. Using E-prime to collect the quantitative
neurocognitive datasets.This research discovered the positive connection between
procedural and conceptual knowledge by analyzing the datasets. Interestingly, differences in
student educational background are found as well as gender effects. Conclusions,
interpretations and empirical suggestions for assessing spatial abilities in STEM as supports
to Wai, Lubinski, and Benbow (2009) will be provided at the end of the study.
Establish an Adaptive Diagnostic Test System for “Calculus” Using “Finding Area By
Integral” Unit as an Example
Parallel Session: Test Development and Validation - Ability Measures II; Thursday, 21
July, 4:00 p.m. -- 5:20 p.m.; D2-LP-09
Bor-Chen Kuo, National Taichung University , Taiwan
Mu-Yu Ting, National Formosa University, Taiwan
Hsiang-Chuan Liu, Asia University, Taiwan
Yu-Lung Liu*, Asia University, Taiwan
The purpose of this study is to develop a polytomous assessment model of adaptive
diagnostic test system based on the Order Theory. In this study, we establish a diagnostic
test system in the topic of “finding area by integral” and analyze its functional efficiency.
Most diagnostic tests are shown in multiple choices. However, our system is designed for
added constructed-response items in Calculus and adaptive propose. We will expect their
misconceptions can be more precisely diagnosed.
The 76th Annual and the 17th International Meeting of the Psychometric Society Page 307
A paper-and-pencil test was conducted on 159 university freshmen. Moreover, we can not
only analyze the misconceptions, but also structure students’ knowledge structure from the
data. The diagnostic test system can provide the learning status of students.
This study uses the real data to simulate the computerized adaptive testing procedure. The
system can save 70% of number of questions when the accuracy is 0.95, and can save 80%
when accuracy is 0.9.
The experimental results show that the proposed methods improve the effect of saving time
and remedial instruction. The system can diagnose misconceptions and offer remedial
instruction to increase the effect of learning.
Standardization of Test Battery for Diagnostics of Motor Laterality Manifestation
Parallel Session: Test Development and Validation - Ability Measures II; Thursday, 21
July, 4:00 p.m. -- 5:20 p.m.; D2-LP-09
Martin Musalek*, Charles University, Czech Republic
The aim of this study was validation of new test battery for diagnostics of motor laterality
manifestation for mentally well adult population. Diagnostics tool was administered to a
sample of 400 designed selection high school students in the age of 17-19 (176 men and 224
women) from capital city of Czech republic, Prague. Whole test battery contains
questionnaire part for hand and foot preference; task part for hand, foot preference and eye
dominance; and proficiency part for diagnostics of fine motor of upper and lower limbs and
accuracy of eye. Confirmatory factor analysis demonstrated that the structure of motor
laterality manifestation with two general factors (preference and proficiency) led to a more
refined measurement of the latent constructs of handedness, footedness and eye dominance.
Reliability measured as Cronbach`s coefficient alpha and McDonald`s coefficient omega
was between .84 and .95 for all sub constructs.
Expert Judgment for Content Validity: A Study of a Malaysian University Listening
Skill Entrance Test
Parallel Session: Test Development and Validation - Ability Measures II; Thursday, 21
July, 4:00 p.m. -- 5:20 p.m.; D2-LP-09
Elia Md Johar*, MARA University of Technology (UiTM), Malaysia
Ainol Madziah Zubairi, International Islamic University Malaysia (IIUM), Malaysia
Mohamad Sahari Nordin, International Islamic Malaysia (IIUM), Malaysia
This paper presents the findings of a study of content-related evidence of a listening skill
test that is used as part of a university entrance requirement. Coined on Bloom’s theoretical
cognitive complexity, a national level listening comprehension test is developed to gauge
The 76th Annual and the 17th International Meeting of the Psychometric Society Page 308
the candidates’ mastery of listening comprehension ability upon entering degree programs.
The study employed the item rating procedures involving four content experts in the
teaching and testing of English as a second language. The expert raters were subjected to
rate the relevance and representativeness of the listening content domain of each of the 20
items in the listening test. Spearman’s rho values were averaged and exhibited low interrater
reliability. The traditional item-objective congruence method (Hambleton, 1984) was
applied to determine whether each item had one valid listening objective. However, items
were found to be measuring multiple objectives and therefore adjusted item-congruence
equation (Turner & Carlson, 2002) was conducted. The analyses indicated that of the 20
items, 9 items were rated as multiple objectives and there was a perfect agreement that these
items were basically testing the lowest cognitive level, i.e. knowledge. It was also found
that 8 of the items should be considered for revision while one should be eliminated for lack
of clarity of the objectives that they were supposed to measure. This paper discusses the
findings of this study in relation to the utility of the Bloom’s taxonomy for curriculum and
test development.
A Simulation Study of Qmatrix Design to CAT Strategies for Cognitive Diagnosis
Parallel Session: Computerized Adaptive Testing and Cognitive Diagnosis Modeling;
Thursday, 21 July, 4:00 p.m. -- 5:20 p.m.; D2-LP-10
Chun-Hua Chen*, National Taichung University, Taiwan
Bor-Chen Kuo, National Taichung University, Taiwan
Chih-Wei Yang, National Taichung University, Taiwan
In recent years, cognitive diagnostic models (CDMs) has been growing rapidly, which can
diagnose examinees’ mastery status of ability or specific areas. Many researchers also work
on developing models and doing researches in practical application. Combining CAT with
CDMs (called CD-CAT) that can diagnose latent classes of examinees is the important
research topic in the literature. The Q matrix for test construction of cognitive diagnostic
assessment is important. If each item measures more attributes, it may affects the estimation.
Therefore, the purpose of this study is to investigate the effectiveness of estimation of
DINA-based CD-CAT using Q matrices with different item parameters and expected
number of attributes measured per item. We compare four item selection methods including
the Random selected KL algorithm based on Kullback–Leibler information、SHE
algorithm based on Shannon entropy and posterior-weighted KL(PWKL).
The experimental results as follow :
(1) The accuracy of estimation is better when the slipping and guessing parameters are
lower.
The 76th Annual and the 17th International Meeting of the Psychometric Society Page 309
(2) The accuracy of estimation is better when the expected number of attributes measured
per item is smaller.
(3) The accuracy of the SHE item selection method is better when the slipping and
guessing parameters are set at 0.05 or 0.25; The accuracy of the PWKL item selection
method is better when the slipping and guessing parameters are generated from a
Uniform(0.05, 0.25) distribution.
The Exploration of Item Selection Strategy for Cognitive Diagnosis_Computerized
Adaptive Test
Parallel Session: Computerized Adaptive Testing and Cognitive Diagnosis Modeling;
Thursday, 21 July, 4:00 p.m. -- 5:20 p.m.; D2-LP-10
Zhiyong Shang*, Jiangxi Normal University, China
Shuliang Ding, Jiangxi Normal University, China
A new item selection strategy in computerized adaptive testing with cognitive
diagnosis(CD_CAT) is proposed in this paper to solve the problem that the size of item
bank restricts the speed of item selection during the course of testing . The new method
which calculate the expected pattern match rate (PMR) directly. Compared with Shannon’s
Entropy method or Kullbak_Leiber method,the experimental results show that this new
method not only improves the measurement accuracy, but also increases the speed of item
selection a lot .he new item selection strategy is achieved as follow: Firstly the item pool is
partitioned to some sTub-pools according to the attribute pattern contained in the items ,
and the sub-pool parameters calculated as the mean of the items in the sub-pool before
testing. Secondly, the "best" item set which based on the expected PMR is seached ; lastly ,
a item randomly or a item which has the highest rate of Shannon’s Entropy from “best” item
set for test in next step is selected .It increases the speed of item selection and keeps or
improves the PMR by using the new strategy.
Controlling Item Exposure in Cognitive Diagnostic Computerized Adaptive Testing
Parallel Session: Computerized Adaptive Testing and Cognitive Diagnosis Modeling;
Thursday, 21 July, 4:00 p.m. -- 5:20 p.m.; D2-LP-10
Xiuzhen Mao*, Beijing Normal University, China
Tao Xin, Beijing Normal University, China
Cognitive diagnostic computerized adaptive testing (CD-CAT) is based on the cognitive
diagnostic theory. It provides the advantages and disadvantages of each student’s
knowledge state immediately after it administers a few items to the examinees. So, it is
important to study and put CD-CAT into practice.

The 76th Annual and the 17th International Meeting of the Psychometric Society Page 310
It is an important issue in computerized adaptive testing (CAT) that how to control item
exposure, because item-exposure rates have a strong effect on test security and construction
of item bank. Until now, researches on item selection rules in CD-CAT are primarily focus
on putting forward and comparing item selection indexes. However, there are few research
reports about controlling item exposure.
This study applies two item selection methods to control item exposure in CD-CAT. One is
the stratified multistage item selection rule. In this approach, based on values of item
selection index, the items in the item bank are stratified into a number of levels before it
selects each item. The other is the generalized Monte Carlo method. Compared with some
maximum item selection index (MISI) methods, the computer simulations experiments
show that: (a) the stratified multistage method increases the exposure rates of most items
and produces widely distributed item exposure; (b) the generalized Monte Carlo method
greatly diminishes the maximum exposure rate and results in narrow distribution of item
exposure. In a word, the two methods control item exposure well and raise the utilization
rates of item pool considerably, but do not lower the correct classification rates of
knowledge state obviously.
The Comparison of Item Selection Methods in Diagnostic Computerized Adaptive
Tests using Rule Space Model
Parallel Session: Computerized Adaptive Testing and Cognitive Diagnosis Modeling;
Thursday, 21 July, 4:00 p.m. -- 5:20 p.m.; D2-LP-10
Jian-Bing Wen*, East China Normal University, China
The computerized adaptive testing (CAT) has been moved from research to implementation
during the early 1990s accompanied advances in computer technology and psychometrics
(Weiss & Schleisman, 1999). In computerized adaptive tests, items were adaptively selected
by computer according to examinees’ responses to previously administered items.
Computerized adaptive tests can estimate test takes’ ability more accurately and efficiently
than paper and pencil tests do. But most CATs are doing no more than giving grade or rank
to students. Diagnostic testing was on the other end of testing. They can provide students
more useful information by describe the presence or the absence of his skills. In this study
we try to incorporating rule space model into CAT to set up a diagnostic computerized
adaptive test.
Item selection methods in diagnostic CAT is different from which used in traditional CAT.
Four item selection methods--Shannon Entropy Method (SH), Utility Score Method 1
(U1),Utility Score Method 2 (U2) and the Kullback-Leibler Information Method (K-L)--is
compared in this study. The evaluation criterion is their efficiency in ability estimation
using rule space model. In order to calculate and compare the accuracy of examinees’
The 76th Annual and the 17th International Meeting of the Psychometric Society Page 311
attribute estimation, the Monte Carlo simulation method was used in both sets of studies.
the detailed statistics and analyses will be presented in the Annual Meeting. Plots of
exposure rate distribution for the items will also be provided too.
Computerized Classification Testing Under the DINA Model
Parallel Session: Computerized Adaptive Testing and Cognitive Diagnosis Modeling;
Thursday, 21 July, 4:00 p.m. -- 5:20 p.m.; D2-LP-10
Jyun-Ji Lin*, National Chung Cheng University, Taiwan
Wen Chung Wang, The Hong Kong Institute of Education, Hong Kong
Shu-Ying Chen, National Chung Cheng University, Taiwan
The DINA model has been developed to assess whether or not examinees have mastered the
latent binary attributes. In recent years, computerized adaptive testing (CAT) under the
DINA model has been developed to make cognitive diagnosis assessment more efficient.
However its accuracy is not very satisfied. The DINA model and CAT are very different
concepts, because the former focuses on classification of latent binary attributes but the
latter on estimation of latent continuous traits. In this study, we proposed computerized
classification testing (CCT) under the DINA model, because CCT is more in line with the
DINA model than CAT. A series of simulations were conducted to reveal the advantages of
CCT over CAT. Three independent variables were manipulated: (a) procedure (CCT and
CAT); (b) ability distribution of population (normal and uniform). The dependent variables
were classification rate and test length required. Item selection was based on the KL
information. The results show that CCT yielded a higher correct classification and required
a shorter test than CAT, suggesting CCT under the DINA model is feasible.
The 76th Annual and the 17th International Meeting of the Psychometric Society Page 312
The Application Exploration of Survival Analysis Method in Psychological research
Poster Session II: Thursday, 21 July, 5:30 p.m. – 7:00 p.m.
Chuan Chen*, South China Normal University, China
Min-Qiang Zhang, South China Normal University, China
This paper briefly describes the basic theory of survival analysis; based on the complete
Wechsler test through the Child Survival Analysis, It can illustrate the feasibility of Applied
in Psychology. And survival analysis with the traditional regression method and the
traditional OLS, Logistic regression analysis compared with survival analysis techniques
can better handle censored data, estimation error reduction; it also can handle time-varying
explanatory variable effect.
Applying MCMC Algorithm in Estimating Variance Components for Generalizability
Theory
Poster Session II: Thursday, 21 July, 5:30 p.m. – 7:00 p.m.
Kaiyin Guo*, South China Normal University, China
Min-Qiang Zhang, South China Normal University, China
Guangming Li, South China Normal University, China
Markov Chain Monte Carlo (MCMC) method, as a dynamic computer simulation technique,
was first applied in psychometrics field in 1990s. To an extent, generalizability theory (GT)
can be view as a combination of classical test theory and analysis of variance procedures. It
helps to untangle different sources of error so that the efficiency of the measurement can be
improved. As a result, the estimation of variance component is the key to GT. This paper
summarized some studies about applying MCMC method on the estimation of variance
component for GT. First, MCMC algorithm can be used in estimating the variability of
estimated variance components for GT. The results show that, compared with other methods
(Traditional, Bootstrap and Jackknife methods), it is quite suitable to apply MCMC method
with prior information in estimating standard errors and confident intervals. Second, in
GIRM (Generalizability in Item Response Modeling), which connects sampling model of
GT with scaling model of IRT, the application of MCMC algorithm can separate the
interaction of person and item from other residual errors in the p×i design, which has
developed and extended the traditional estimating method of variance components for GT.
Last but not least, using MCMC method to deal with missing data can avoid the information
loss and improve the effectiveness of the measurement. In the view of these studies,
applying MCMC algorithm in estimating variance components for GT is the main direction
of its basic research.

The 76th Annual and the 17th International Meeting of the Psychometric Society Page 313
The Criteria and Analysis of Subjective Assessments in Testing
Poster Session II: Thursday, 21 July, 5:30 p.m. – 7:00 p.m.
Rui Xiang*, Teachers College Columbia University, USA
The study intends to build a new statistical model to evaluate the subjective assessments
such as essay scoring or oral tests, based on the quality control theory from industry
statistics. We often see more than one scorer give subjective judgments to a test taker but it
is sometimes not equal enough. For example, if only a part of the scorers are selected to
give assessment on a test taker, different combinations of scorers may give different results.
The purpose of my study is to provide a relatively equal and objective assessment to these
subjective tests. The scores are assumed from a normal distribution with missing data. By
applying the 3σ or 2σ principle, I build a statistical process and construct a control criterion
for all the scores. If there is any outlier of the scores that goes beyond the range, the outlier
score is considered inappropriate for its test taker. If outliers exist, then I build a model to
adjust the scores. In the end, when the fluctuation of all scores goes within the criterion
range, these scores could be the accepted as final scores. An empirical study on a dataset of
scores from a university mathematical model contest in 2006 is also conducted. The data
contains 11 scorers and 244 test takers, and 3 out of 11 scorers are selected randomly for
each test takers. The model finds out unequal scores exist and adjusted scores are
implemented. The control criterions are also repeatedly testified.
The properness about dimension of achievement goal and role of the autonomy in
learning process
Poster Session II: Thursday, 21 July, 5:30 p.m. – 7:00 p.m.
Chia-Cheng Chen*,National Taiwan University of Arts, Taiwan
The theoretical and empirical work on achievement goals had developed from dichotomous
and trichotomous into 2 × 2 achievement goal framework recently. One of the aims in this
study is to examine how many dimensions of goal construct will fit the observed data well
by using the method of structural Equation Modeling. Besides, we attempt to examine the
relationships among the students` achievement goals, autonomy and pattern variables using
the path model and the sample size is 602 from junior high schools in Taiwan. The
conclusions in this research are as follows: (A) By using Confirmatory Factor Analysis, the
dichotomous model fitted the observed data better than the trichotomous model. (B) The
path model fitted the observed data well, but the direct effect between the autonomy and
mathematic grade is not significant. (C) The direct effect of autonomy on math achievement
is not significant, but it is significant as mediated by self- handicapping strategy. Based on
The 76th Annual and the 17th International Meeting of the Psychometric Society Page 314
the findings of this study, implications for achievement goal theory and research
methodology are discussed.
Students how to use self-regulated learning strategies in a web-based learning
environment
Poster Session II: Thursday, 21 July, 5:30 p.m. – 7:00 p.m.
Chun-Yuan Chang*, National Taipei University of Education, Taiwan
The purpose of this research was to study third-grade students’ self-regulated learning
strategies and learning outcomes in a web-based learning environment. The subjects of the
study are students from three classes of an elementary school in Jing Shan Dist, New Taipei
City. When teaching the units of the natural science subject to the three classes, the
researcher used a web-based learning environment to conduct teaching to all students in the
classes. After teaching, students were given The Self-regulated Learning Strategies
Inventory, Learning Science Attitude Questionnaire, and unit tests for the third unit. Finally,
based on the results of the study, suggestions are offered as references for elementary
school teachers using a web-based learning environment for administering self-regulated
learning researches and teaching.
The Effect of Different Compensatory Relationships in the Variance-Covariance
Structure on the Test of Fixed Effects in a Multilevel Linear Growth Curve Model
Poster Session II: Thursday, 21 July, 5:30 p.m. – 7:00 p.m.
Yuan-Hsuan Lee*, National Chiao Tung University, Taiwan
Oi-Man Kwok, Texas A&M University, USA
Jiun-Yu Wu, National Chiao Tung University, Taiwan
The importance of modeling a correct variance-covariance (V-C) structure for the repeated
measures in multi-level linear growth curve models (MLGCMs) has gained growing
attention in the methodological domain. Most studies, however, only focused on the impact
of misspecification in the within-subject V-C structure given a correctly specified
between-subject matrix. The current study aimed to evaluate the impact of compensatory
V-C structures (simple between vs complex within / complex between vs simple within) on
the test of the growth/fixed-effect parameters simultaneously. The study design adopted a
first-order autoregressive structure (AR1) as the true within-subject V-C structure and a
random intercept and slope model (UN1) as the between-subject V-C structure. Factors
considered include the size of the AR1 parameters, magnitude of the fixed effect parameters,
number of cases, and number of waves. The result showed that the commonly-used identity
(ID) within-subject structure with unstructured between-subject matrix performed equally
The 76th Annual and the 17th International Meeting of the Psychometric Society Page 315
well as the true model in the evaluation of the criterion variables. On the other hand, other
misspecified conditions had biased standard error estimates for the fixed effect and lead to
inflated Type I error rate or lowered statistical power.
Comparing Design-based and Model-based Latent Growth Models on Analyzing
longitudinal data: A Monte Carlo Study
Poster Session II: Thursday, 21 July, 5:30 p.m. – 7:00 p.m.
Oi-Man Kwok*, Texas A&M University, USA
Jiun-Yu Wu, National Chiao Tung University, Taiwan
Multilevel longitudinal data are commonly found in educational and psychological studies
(e.g., repeated measures nested within individuals and individuals further nested within
some higher level clusters such as schools or clinics). When analyzing this type of data, one
of the recommended analytical approaches is using the multilevel latent growth models
(MLGMs). There are two major forms of MLGM, namely, design-based MLGM and
model-based MLGM. The design-based approach takes the multilevel data structure into
account by adjusting standard errors with the Huber-White correction. Previous simulation
studies have also showed that, compared with the model-based approach, the design-based
MLGM can result in higher convergence rate and statistical power with simpler model
specification (i.e., only one model is needed for specification given the assumption of equal
model structure across all levels). On the other hand, the model-based approach offers
flexibility on specifying and analyzing different models at different data levels.
Nevertheless, past research focused exclusively on cross-sectional data with considering
only within-level covariates. In this study, we have compared the two approaches in
analyzing longitudinal data with covariates from different levels in the same model
simultaneously. The results showed that the fixed effects (or path coefficients) were in
general consistent across simulation conditions while the standard errors of these effects
from the design based approach were overly corrected, especially under the small sample
size conditions. This, in turn, resulted in lower statistical power in testing these fixed effects.
Implications of the findings and limitations are discussed.
The Recovery of Item and Person Parameters Estimated by the SCORIGHT
Poster Session II: Thursday, 21 July, 5:30 p.m. – 7:00 p.m.
Bor-Yaun Twu*, National University of Tainan, Taiwan
Jui-Chiao Tseng, Min-Hwei College of Health Care Management, Taiwan
Yen-Wen Yang, Min-Hwei College of Health Care Management, Taiwan
The 76th Annual and the 17th International Meeting of the Psychometric Society Page 316
The conventional IRT models assume the local independence between items and are not
able to model the dependency between items within a testlet. One of the solution to this
issue is the testlet response theory (TRT) proposed by the Wainer, Bradlow, & Wang (2007).
The SCORIGHT software, developed based on the TRT, not only can calibrate both
dichotomous and polytomous items, but also takes the testlet effects into account. It is
expected to be a very promising program.
Some study results showed that the SCORIGHT had good performance in terms of
parameter estimation, but a few researches showed that SCORIGHT may need
improvements in some special data collection design. According to Lin (2010) and Chang
(2010), when the nonequivalent group anchor test (NEAT) and balanced incomplete block
(BIB) designs are used, the SCORIGHT may not perform well as expected. This study will
investigate the recovery of parameter estimation thoroughly and hopefully, provide some
insight or suggestions to the field of psychometry.
Three data collection design (single form, NEAT, BIB), two test lengths (27, 54 items),
three sample sizes (600, 1200, 2604 examinees), two ability distributions (N(0,1), bi-modal),
four testlet effects (0, .5, 1.0, 1.5) as well as two burn-in periods will be manipulated in this
study. Each combination of conditions will be replicated 50 times. Root mean squared error
(RMSE) will be used to evaluate the recovery of SCORIGHT; in addition, the Q3 statistics
will also be used to indicate if the data set was generated as it was planned.
Sample Size Determination in SEM with Nonnormal Data.
Poster Session II: Thursday, 21 July, 5:30 p.m. – 7:00 p.m.
Hsin-Yun Liu*, National Taiwan University, Taiwan
Li-Jen Weng, National Taiwan University, Taiwan
Sample size determination is a critical issue in applications of structural equation modeling
(SEM). A number of authors have suggested that the ratio of sample size to the number of
parameters to be estimated (n:q ratio) should be taken into consideration when determining
the necessary sample sizes in SEM. Yet, there seems to be no consensus concerning the
optimal rule for the n:q ratio when applied to structural equation modeling. The present
simulation study was designed to search for possible optimal n:q ratios on correctly
specified models with non-normally distributed variables by examining the performance of
maximum likelihood chi-square test statistics, Satorra-Bentler scaled test statistics, and
various fit indices used in SEM. Design characteristics included distributions of variables
(normal, univariate skewness of 1 and kurtosis of 1, univariate skewness of 2 and kurtosis
of 7, univariate skewness of 3 and kurtosis of 21), the n:q ratios for sample size
determination (2:1, 5:1, 6:1, 7:1, 8:1, 9:1, 10:1, 15:1, 20:1), models of various sizes (6
models), and factor loadings (.6, .8). For variables of normal distribution, results showed
The 76th Annual and the 17th International Meeting of the Psychometric Society Page 317
that n:q ≧ 5 seemed a plausible rule of thumb as consistent with previous findings. For
non-normally distributed data, the optimal n:q ratios needed to be larger to yield trustworthy
test statistics and fit indices, especially as the degree of nonnormality in the data increased.
A Multi-dimensional Continuous Item Response Model for Probability Testing
Poster Session II: Thursday, 21 July, 5:30 p.m. – 7:00 p.m.
Yiping Zhang*, Center for Research on Educational Testing, Japan
Hiroshi Watanabe, Center for Research on Educational Testing, Japan
Probability testing (PT) is a way to respond to multiple- choice test items. In PT the
examinee gives his/her subjective probability (the percentage that each alternative is
thought to be the correct answer) to all the alternatives. By using PT more item information
can be drawn from the subjects than the other scoring methods that can be used for
multiple-choice items. In this presentation, a multi-dimensional continuous item response
model for PT is proposed. The subjective probability given to the correct answer yields the
item score. Although the score distributions of the items have various forms, they can be
expressed by beta distributions. And they can be transformed into the standard normal
distributions. In this model, the standard normal score is thought as the ability for answering
the item. The joint probability density function of the abilities for answering the items and
the latent traits of the test can be expressed by a multivariate normal distribution. In addition,
the matrix of item response information function and parameter estimation, a method of
estimating the subject's vector of latent traits are introduced.
Using Survival Analysis to Estimate Mediated Effects with Discrete-Time and
Censored Data
Poster Session II: Thursday, 21 July, 5:30 p.m. – 7:00 p.m.
Jenn-Yun Tein*, Arizona State University, USA
David P. MacKinnon, Arizona State University, USA
Mediation analyses help identify variables in the causal sequence relating predictor
variables to outcome variables. In many studies, the ‘timing’ or ‘occurrence’ of an event
(e.g., disease onset, drug use initiation, first arrests) is the outcome of interest and survival
analyses are applied. Tein & MacKinnon (2004) conducted a simulation study that applied
the commonly used Sobel’s multivariate delta formula for estimating the mediated effects
with survival data under the condition that the data were measured in a continuous scale and
there were no censored data. This study extends the previous study in two aspects: 1)
including data structures that are more commonly used in psychosocial research such as
observations made in discrete time rather than recorded on a continuous scale and some
The 76th Annual and the 17th International Meeting of the Psychometric Society Page 318
individuals in the sample do not experience the event of interest by the end of the
observation period, and 2) comparing four statistical methods of testing mediation --
asymmetric confidence interval, percentile bootstrap, bias-centered bootstrap, and
multivariate delta methods. We will conduct a simulation study to compare the performance
of these four methods under four experimental conditions, varying: 1) sample sizes, 2) sizes
of the regression coefficients making up the mediated effects, 3) proportions of right
censored data, and 4) discrete time points of data collection. The methods will be compared
in terms of Type I error rates, power, and the coverage of their confidence intervals for
detecting mediated effects.
Sample Size Planning with AIPE on RMSEA Revisited: Width? Or Values?
Poster Session II: Thursday, 21 July, 5:30 p.m. – 7:00 p.m.
Tzu-Yao Lin*, National Taiwan University, Taiwan
Li-Jen Weng, National Taiwan University, Taiwan
A graphical method based on Kelley and Lai (2011) is presented for sample size planning in
structural equation modeling (SEM). Kelley and Lai proposed to use the accuracy in
parameter estimation (AIPE) approach for RMSEA to determine sample size in SEM. In the
using of AIPE, researchers are able to obtain a corresponding sample size after deciding the
confidence interval (CI) width. A narrow CI implies that the plausible values of RMSEA
are confined in a relatively small range and the sample size needed could be large. However,
inferences made from RMSEA depend on the estimated values of RMSEA. The range of
values covered by the CI perhaps should also be examined in addition to the width. The
graphs presented incorporated the actual values of RMSEA included in the CIs and the
associated widths at a specified confidence level over various sample sizes. With limited
resources available, it could be a useful tool for researchers to plan the sample size under
acceptable costs and satisfactory range of RMSEA. Our approach that simultaneously
considers the width and the values of CI might be an informative and practical method for
sample size planning in SEM.
A Study of Standard Setting Method Using the Cluster Analysis
Poster Session II: Thursday, 21 July, 5:30 p.m. – 7:00 p.m.
Yeonbok Park*, Korea Institute for Curriculum and Evaluation, South Korea
Jiyoung Jung, Yonsei University, South Korea
Hee-Won Yang, Yonsei University, South Korea
Guemin Lee, Yonsei University, South Korea
The 76th Annual and the 17th International Meeting of the Psychometric Society Page 319
This study aims to suggest a method to set performance standards by using cluster analysis
and to review the validity and utility of the method. Similar standard setting procedures
introduced by Sireci, Robin, and Patellis (1997) were adopted in this study, but somewhat
different clustering approaches were investigated through hierarchical cluster analysis with
Rand / Adjusted Rand Indexes. To investigate the validity and utility of the standard setting
method using the cluster analysis, we reanalyzed data in which the Bookmark standard
setting procedures were originally implemented. The data used in this study were obtained
from the Korean National Diagnostic Tests of Basic Competency, which were composed of
five subject areas.
The differences between cut scores from the Bookmark and cluster analysis methods were
relatively small (0~3 score points compared to 30 score points in total) across five subject
areas. We found very high percents of agreement between two methods ranging from 95 to
100. Kappa coefficients were 0.63 for the science and 1.00 for the mathematics.
Classification consistency indices were computed within each method by assuming Beta or
4-Beta distribution for true score. Percents of agreement from the cluster analysis method
ranged from 94 to 97 similar to those from the Bookmark method. In sum, the cluster
analysis method can be considered as an alternative in setting performance standards when
standard setting panelists cannot be easily obtained. At least, this method can be served as a
criterion for another standard setting method to check external validity of the administered
method.
The Longitudinal Analysis of Gifted Students’ Science Self-Concept and Science
Achievement: A Multivariate Multilevel Latent Growth Model
Poster Session II: Thursday, 21 July, 5:30 p.m. – 7:00 p.m.
Yaling Hou*, National Pingtung University of Education, Taiwan
The main objective was to gain more insight into the development of science self-concept
and science achievement for junior high school gifted students. Data were consisted of 392
students were tested repeatedly every six months from eighth grade. Latent growth curve
model (LGM) was shown that the students’ science achievement presented a linear growth
of 0.21 per six months; student’s science self-concept was shown a nonlinear decline with
time. The multivariate multilevel LGM was indicated a positive correlation (r = .71)
between science achievement and science self-concept. In addition, the data was shown that
the correlation decreased gradually during the junior high schooling. Science self-concept
decreased and science achievement increased.
Comparing from the gender aspect, boy’s and girl’s science achievement was similar, but
girl’s science self-concept was evidently lower than that of boy’s did (the gap among the
original scores of each phase were from 3.3 to 5.6). The intercept of science achievement
The 76th Annual and the 17th International Meeting of the Psychometric Society Page 320
and self-concept were positively correlated, but the correlation between the changing
processes could not be confirmed. Having a good academic performance at early puberty
might be a positive effect in academic self-concept, there might be other reasons that cause
the self-concept to change over time.
The development of statistical thinking assessment
Poster Session II: Thursday, 21 July, 5:30 p.m. – 7:00 p.m.
Chien-Yi Huang*, National University of Tainan, Taiwan
Su-Wei Lin, National University of Tainan, Taiwan
In recent years, science and technology have growing importance in personal and social life,
the integration of information has become an important indicator of the mathematically
literate citizen. The probability and statistics are the important topics in mathematics
education for many countries. It shows that knowledge of statistical is quite valuable to
serve the needs of citizens and lifelong learning.
Statistical knowledge underpins statistical thinking, statistical understanding, statistical
reasoning and statistical literacy. On the other hand, statistical knowledge cannot occur
without statistical understanding and statistical thinking.
For most people, statistics refers to a theory that the experts from all sectors use to support
the argument is correct or not, but for statistical professionals, statistics refers to the art and
science of collecting, analyzing, presenting, and interpreting data.
According to the reference, we define that statistical thinking involves an understanding of
why and how statistical investigations are conducted, the study attempt to develop an
assessment used to measure statistical thinking. The structure of the assessment contains
three dimensions, understanding, construct strategy, reasoning and interpretation. This
assessment was used to examine the performance of statistical thinking of students in
statistical related departments of the universities. The study also provided the psychometric
characteristics of the assessment for reliability and validity evidences.
A Preliminary Validity Study for the On-line Literary Reading Assessment
Poster Session II: Thursday, 21 July, 5:30 p.m. – 7:00 p.m.
Lan-fang Chou*, National university of tainan, Taiwan
Pi-Hsia Hung, National University of Tainan, Taiwan
Adolescent readers vary tremendously in their ability to locate, understand, and use
information online. A growing collection of research suggests that students require new
comprehension skills and strategies to effectively read and learn from text on the Internet.
Recently, Taiwan constructed some digital archives for well known local literary authors.

The 76th Annual and the 17th International Meeting of the Psychometric Society Page 321
These resources are very valuable for enhancing students’ online reading literacy. The
purpose of this study is to infuse the digital archives to develop an Online Literary Reading
Assessment (OLRA) for the 10th graders of Taiwan to explore the validity issues. The
content specification table of OLRA is mainly based on the PISA Electronic Reading
Assessment framework. Both multiple choice and constructed response items are included
in OLRA. The students’ school grades for different subjects and the scores of their high
school entrance exams were collected as the related variables. There were around six
hundred 10th graders sampled for the OLRA field trial. The inter-rater reliability for scoring
and the convergent and discriminate validity issues will be discussed. The differences
between genders on OLRA will also be investigated.
The Validity Issues of an Affective Scale Embedded in an Algebra Dynamic
Assessment System
Poster Session II: Thursday, 21 July, 5:30 p.m. – 7:00 p.m.
Hui Ju Sun*, National University of Tainan, Taiwan
Pi Hsia Hung, National University of Tainan, Taiwan,
Children’s mathematical worlds are complex places containing both cognitive and affective
elements. One cannot ignore the affective domain if one wishes to understand children’s
mathematical learning (Walls, 2001). Examining student motivation and self-regulation is
an important undertaking because these processes have consistently been shown to predict
adaptive classroom and academic outcomes. The purpose of this study is to develop an
affective scale for investigating the relationship between students’ self-regulation and their
learning progress on an algebra dynamic assessment system (ALDAS). The ALDAS
integrated spreadsheets into algebra learning process for the 6th graders. The criterion
variables for detecting the effects of ALDAS are the growth slopes on mathematics and
affective scale in a 2 months interval. The affective scale is administered after each
intervention. The correlation coefficient between the slopes of affective scale and
mathematics performance will be discussed. The progressing characteristics of different
level self-regulation students on ALDAS will be described. The implications of an
embedded affective scale for mathematics intervention design will also be included.
A Study of the Effects of Non-equivalency of Equating Groups on Equating for
Mixed-Format Tests
Poster Session II: Thursday, 21 July, 5:30 p.m. – 7:00 p.m.
Jiwon Choi*, Yonsei University, South Korea
Jeonghwa Oh, Yonsei University, South Korea
Guemin Lee, Yonsei University, South Korea
The 76th Annual and the 17th International Meeting of the Psychometric Society Page 322
In recent years, tests containing a mixture of different item formats have often been used in
many practical testing situations. When the equating groups are non-equivalent, this has
significant effects on equating results. The present study is to investigate the effects of
non-equivalency of equating groups on equating for mixed-format tests under the
common-item nonequivalent groups design.
Simulation techniques were implemented to evaluate proper conditions for getting
appropriate equating relationship. Several simulation factors, including non-equivalency of
equating groups, proportions of anchor items, composition of multiple choice and
constructed response items, and equating methods, were considered. This study applies both
IRT (Item Response Theory) and CTT (Classical Test Theory) equating methods, such as
Stocking-Lord Method and concurrent calibration, Tucker Linear Method, Levine Linear
Method, and Frequency Estimation Equipercentile Method. Sample size is set to 3000,
which can be considered as reasonably large to provide stable estimates for equating
relationships.
It can be concluded that the equating methods yielded similar equating relationships when
the equating groups were equivalent. Non-equivalent groups, however, produced somewhat
different equating relationship. Moreover, the shorter the common items, the less accurate
were the equating relationships.
A Speeded Item Response Model: Leave the Harder Till Later
Poster Session II: Thursday, 21 July, 5:30 p.m. – 7:00 p.m.
Yu-Wei Chang*, National Tsing-Hua University, Taiwan
Rung-Ching Tsai, National Taiwan Normal University, Taiwan
Nan-Jung Hsu, National Tsing-Hua University, Taiwan
A speeded two-parameter logistic item response model is proposed.We consider the
situation where examinees may retain the harder items to the later period of the test in a
speeded test. As a result of such a strategy, they may or may not finish answering all the
items within the given time. Our proposed model tries to describe such a mechanism by
incorporating a speeded effect term into a two-parameter logistic model. Bayesian
estimation procedure of current model using Markov chain Monte Carlo is presented and its
performance over the two-parameter item response model in a speeded test is demonstrated
through simulations. At last, some limitations and possible extensions of the current model
are discussed.
A Simulation Study to Evaluate IRT Scale Transformation Methods with Fixed
c-parameters of Anchor Items
The 76th Annual and the 17th International Meeting of the Psychometric Society Page 323
Poster Session II: Thursday, 21 July, 5:30 p.m. – 7:00 p.m.
Junbum Lim*, Yonsei University, South Korea
Hwangkyu Lim, Yonsei University, South Korea
Guemin Lee, Yonsei University, South Korea
Because parameter estimates for different calibration running under the Item Response
Theory (IRT) model are linearly related, a linear equation can convert IRT parameter
estimates onto another scale metric without changing the probability of a correct response
(Kolen & Brennan, 2004; Lee & Fitzpatrick, 2008). Previous studies showed that the
c-parameter in the three parameter logistic (3PL) model was unstable. Lee and Fitzpatrick
(2008) proposed a new IRT scale transformation approach in the context of test score
equating with fixed c-parameters of anchor items. A rationale for fixed c-parameters for
Non-Equivalent Anchor Test design (NEAT design) can be established for the fact that the
c-parameters are not affected by any linear transformation. This study is designed to expand
their study using simulation techniques.
Simulation conditions include sample size, number of items, number of anchor items, and
non-equivalency of equating groups. Data will be generated under the 3PL model using
R-program. Each simulation condition will be replicated 100 times. RMSE (Root Mean
Square Error) will be used as a major criterion to evaluate the performance of scale
transformation methods of both fixed and non-fixed approaches.
The criterion-related validity coefficients of a situational interview (SI) and a behavior
description interview (BDI) in Railway policeman selection field in China
Poster Session II: Thursday, 21 July, 5:30 p.m. – 7:00 p.m.
Yingwu Li*, Tsinghua University, China
Yongda Yu, Tsinghua University, China
Recently, structured interview is one of the leading methods in China National Civil Servant
Examination (CNCSE). The criterion-related validity coefficients of a situational interview
(SI) and a behavior description interview (BDI) were investigated in the 8 railway police
departments in China. Both the SI and BDI had concurrent validity with job performance (n
= 1054, r = .29, r = .23, p < .05, respectively). Only the SI, however, had incremental
validity over and above the BDI in predicting job performance. Furthermore, the SI fully
mediated the relationship between BDI and job performance. The discussion questions the
extent to both SI and BDI provide unique or overlapping predictive validity when compared
with mental ability tests.
The 76th Annual and the 17th International Meeting of the Psychometric Society Page 324
A Multilevel Multidimensional Rasch Model with an Application to DIF by
Hierarchical Generalized Linear Model
Poster Session II: Thursday, 21 July, 5:30 p.m. – 7:00 p.m.
Hsin-Ying Huang*, National Chengchi University, Taiwan
Fur-Hsing Wen, Soochow University , Taiwan
Min-Ning Yu, National Chengchi University, Taiwan
It is known that the two-level hierarchical generalized linear model (HGLM) is equivalent
to the Rasch model. The purpose of this study is to show that the two-level HGLM can be
extended to a multilevel multidimensional Rasch model along with differential item
functioning (DIF). We attempted to identify DIF could be explained by both examinee and
group characteristic variables under multidimensional condition with HGLM. HLM-6.04
software was implemented with empirical data. The results provided supporting evidence
for the proposed multilevel multidimensional Rasch model. It was in particular suitable for
the analysis of educational measurement.
Sufficient conditions of equivalence in measurement model
Poster Session II: Thursday, 21 July, 5:30 p.m. – 7:00 p.m.
Wei-Sheng Lin*, National Chung Cheng University, Taiwan
Chung-Ping Chen , National Chung Cheng University, Taiwan
This research aims to understand sufficient conditions of equivalence in measurement
model. By expanding results of Tomarken and Waller (2003) and Raykov and Penev (2000),
we explored four conditions to find sufficient conditions which make measurement models
equivalent. In the first conditions, a model with correlated factors can be equivalent to other
orthogonal model with correlated measurement errors. A model with correlated factors can
be also equivalent to other orthogonal model with some indicators, which are loaded in the
same factors in original model, loaded on different factors. In the third condition, a model
with correlated errors of indicators within one factor can be equivalent with other model
with more factors. A model with correlated errors of some indicators within one factor can
be equivalent with the same model but with correlated errors of other indicators within the
same factor. In addition, simulated data is used to examine if the fit indices of the original
model and the generated equivalent model match. In conclusion, we discusses the influence
resulted from model structure and causal relationship when measurement model comes into
equivalence and the recommendation of avoiding having models in equivalence will be
suggested.

The 76th Annual and the 17th International Meeting of the Psychometric Society Page 325
Influence of pre-test design on the precision of the parameters estimation in the
multidimensional items bank
Poster Session II: Thursday, 21 July, 5:30 p.m. – 7:00 p.m.
Po-Hsi Chen*, National Taiwan Normal University, Taiwan
Jar-Wen Kuo, National Taiwan Normal University, Taiwan
Yao-Ting Sung, National Taiwan Normal University, Taiwan
The goal of the research is to investigate the influence of the pre-test design and sample size
on the precision of the parameters estimation in the multidimensional items bank. Three
types of pre-test design, three types of sample size, three types of dimensionalities of the
tests, and two types of correlation between latent traits were used as dependent variables.
Data were generated using the multidimensional Rasch Model. The dependent variables
were the root mean square of error (RMSE) of the item parameter and the latent traits.
Results of the item parameters estimation demonstrated that the larger the sample size and
the fewer the dimensionalities, the lower the RMSE of the item parameter. The balanced
incomplete block (BIB) design and non-equivalent group with variable anchor test (NEVAT)
design showed lower RMSE of the item parameter than non-equivalent group with anchor
test (NEAT) design. Results of the latent traits estimation demonstrated that the fewer the
dimensionalities the lower the RMSE of the latent traits. Three types of pre-test designs and
sample sizes showed the same RMSE of the latent traits. The authors suggested that in the
items banking stage of the multidimensional test, sample size should be large enough in
order to get precise estimation of the items parameter. The balanced incomplete block (BIB)
design and non-equivalent group with variable anchor test (NEVAT) are recommended to
be used.
The Relationships between Health Responsibility, Emotional Well-being and
Depression in Taiwan
Poster Session II: Thursday, 21 July, 5:30 p.m. – 7:00 p.m.
Po-Lin Chen*, National Chengchi University, Taiwan
Min-Ning Yu, National Chengchi University, Taiwan
Pei-Ching Chao, National Chengchi University, Taiwan
Jia-Jia Syu, National Chengchi University, Taiwan
Pei-Chun Chung, National Chengchi University, Taiwan
Purpose: Health responsibility is a resource used by people to cope with risk factor and
maintain emotional well-being, and it also may have a positive impact on physical health
and depression reduction. The main purpose of this study was to explore Taiwanese health
responsibility, emotional well-being and depression.
The 76th Annual and the 17th International Meeting of the Psychometric Society Page 326
Methods: There are 1934 people randomly selected from Taiwan. Responses from a survey
via questionnaires (“Health Responsibility Scale”, “Emotional Well-Being Scale” and
“Taiwan Depression Scale”), of Taiwan residents aged 18 years and over, are used to
explore the correlation among health responsibility, emotional well-being, and depression.
Structural equation modeling (SEM) is applied to estimate parameters and to compare
models.
Results: Findings are summarized as follows: 1. There are positive correlations existed
among the health responsibility and emotional well-being. 2. Health responsibility and
depression have been shown to be negatively correlated with one another. 3. Path analysis
reveals a negative relationship between emotional well-being and depression.
Conclusions: Results of this study identify important influences useful to health
professionals for promoting emotional well-being in Taiwan residents. Finally, some
suggestions for counseling interventions and future researches are proposed.
A mathematical model for trans-cortical gamma synchronizations under different
perceptual conditions
Poster Session II: Thursday, 21 July, 5:30 p.m. – 7:00 p.m.
Chien-Fu Lin*, National Chung Cheng University, Taiwan
Jay-Shake Li, National Chung Cheng University, Taiwan
In daily life, we have to rapidly and effectively deal with an ever-changing environment. In
order to cope with this challenge, the operation of neural system requires not only fast
reorganization but also good stabilization. Many researchers suggest that the transient
connections between remote neuronal modules to form a neural assembly might be the
solution for the task. It is hypothesized that synchronous neural activities are the mechanism
for the formation of neural assemblies. Numerous evidences supporting this idea have been
found in experimental studies. However, there is no satisfactory mathematical model to
integrate all the empirical findings so that a comprehensive understanding about how the
whole process might work can be achieved. In the present study, we build a mathematical
model based on an early work of Lopes Da Silva et al. in 1974 to simulate the
synchronization activity in neural assemblies. The model produces synchronous neuronal
firings between modules in primary and associative visual cortex. The synchronization
levels can respond to different features of input stimulus in a fashion similar to the
experimental findings by Engel et al. in 1991. The degree of input signal overlapping can
influence the synchronization between processing units located in remote cortical regions.
Based on these results, we suggest that input overlapping is the underlying mechanism for
the modulation of neural synchronization across cortical areas. Furthermore, the model
The 76th Annual and the 17th International Meeting of the Psychometric Society Page 327
provides a possible solution for the binding problem known in the study of visual
perceptions.
Model Specification for Latent Nonlinear Effects based on the Mean-Centering and
Double-Mean-Centering Strategies
Poster Session II: Thursday, 21 July, 5:30 p.m. – 7:00 p.m.
Shu-Ping Chen*, National Chengchi University, Taiwan
Chung-Ping Chen , National Cheng Kung University , Taiwan
Estimating nonlinear effects between theoretical constructs is an important concern in the
social sciences. In empirical studies, researchers often focus more on mediated moderation
or moderated mediation as opposed to moderation by itself. In previous research, we
generalized the constrained approach with noncentered observed variables to a matrix form
that encompasses the latent nonlinear effects of not only exogenous variables, but also
endogenous variables or a combination of the two. Constraints are of course specified in
matrix form using Muthén’s notation and the six matrices (α , ν , B , Λ , Ψ and Θ ) are
partitioned to fit into our nonlinear model framework. Going a step further, the current
research takes advantage of the mean-centering and double-mean-centering (Lin, Wen,
Marsh, & Lin, 2010) strategies to create simplified forms of the six partitioned matrices. Of
the resulting submatrices, those which are used to estimate latent nonlinear effects are
shown to be identical to their corresponding submatrix based on noncentered observed
variables. Moreover, the simple slopes that are calculated from the latent nonlinear effects
remain constant under scale transformation. Owing to these results, this research is able to
provide a simpler model specification process and a more flexible framework to formulate
complicated nonlinear models.
The development of the computerized imagination test
Poster Session II: Thursday, 21 July, 5:30 p.m. – 7:00 p.m.
Po-Hsi Chen, National Taiwan Normal University, Taiwan
Pei-Yu Lee, National Taiwan Normal University, Tanzania
Chun-Yu Hsu*, National Taiwan Normal University, Taiwan
Su-Ping Hung, National Taiwan Normal University, Taiwan
Jar-Wen Kuo, National Taiwan Normal University, Taiwan
The aim of the research is to develop a computerized imagination test system. In the prior
study, one hundred and thirty-eight high school and college students were asked to write
down the content of their imaging about the transportation vehicle 1,000 years in the future
and rated by well-trained rater using eight indices. These eight indices were analyzed with
The 76th Annual and the 17th International Meeting of the Psychometric Society Page 328
exploratory and confirmatory factor analysis. Results demonstrated that three factor of
imagination were suggested, which were named as extend imagination, quantity of
divergent imagination, and quality of divergent imagination. The computerized imagination
test system then designed to include three parts of subsystem, the subject interface for
typing the content of imagination, the automatic rating program for evaluating the extend
imagination and the quantity of divergent imagination, and the rater interface for rating the
quality of divergent imagination. Data of the computerized imagination testing will be
collected and reanalyzed using the same three-factor model in the future.
Impact of Optimal Item Bank Design on Parallel-Form Tests for Making Pass-Fail
Decisions
Poster Session II: Thursday, 21 July, 5:30 p.m. – 7:00 p.m.
Ting-Ting Yang*,Beijing Normal University, China
Yan Gao, Beijing Normal University, China
Mengjie He, Beijing Normal University, China
Tao Yang, Beijing Normal University, China
Optimal design methods have been widely applied to automated test assembly for decades.
Furthermore, studies have shown that optimal design can offer great gains in item bank
design, but little is known about how well it improves the measurement precision of
resulting tests, especially for linear parallel-forms tests(LPFTs) . This paper aims to
examine the impact of optimal item bank design on the psychometric properties of LPFTs
while making pass-fail decision. Two sets of parallel forms were built respectively based on
optimal and nonoptimal designed item banks. Then, the study compared three important
indicators of the resulting parallel forms: test information functions(IFs), decision accuracy
and decision consistency. This study was carried out using simulation techniques. Given
that the potential effect of passing score, the study set two target IFs(centered on the passing
score or the mean of the proficiency distribution)while conducting optimal item bank design.
Considering the role of test assembly in decision accuracy, this study manipulated two
variables related to test assembly: parallel test construction methods (simultaneous
/sequential ), the target IFs of test assembly (centered on the passing score or the mean of
the proficiency distribution). Finally, the effects of these variables on the accuracy and
consistency of pass-fail decision making were investigated. It's expected that (1)under the
condition of optimal design, the measurement accuracy of the tests will be always higher
than that of nonoptimal design condition;(2) The combined effects of target information
functions of item bank and test design needs further practical study.
The 76th Annual and the 17th International Meeting of the Psychometric Society Page 329
Confirmatory Factor Analysis of the 100-item IPIP measure on a large Facebook
dataset
Poster Session II: Thursday, 21 July, 5:30 p.m. – 7:00 p.m.
Luning Sun, University of Cambridge, UK
Iva Cek*, University of Cambridge, UK
Sabine A. K. Spindler, University of Cambridge, UK
Michal S. Kosinski, University of Cambridge, UK
David J. Stillwell, University of Nottingham, UK
John N. Rust, University of Cambridge, UK
The 100-item IPIP measure of Costa and McCrae's (1992) five NEO domains is a
commonly used set of items derived from the International Personality Item Pool (Goldberg,
1999). The present study aims to examine the psychometric properties of this measure. A
subset of 11,660 females and 10,360 males was selected from over 3,000,000 cases
available from the Facebook application 'myPersonality'. Cronbach's alphas of all the five
domains (mean: 0.901) were high. Confirmatory Factor Analysis was conducted for both
the overall measure and each individual domain, respectively. Save for the Openness
domain which displayed a poor model fit, implying the potential existence of extra factors,
the resulting domains showed reasonably good model fit. Subsequent exploratory factor
analysis revealed a small number of items that had either low loadings on target factors or
high cross-loadings on non-target factors. Based on this analysis, a smaller set of 20 items
was identified that was relatively reliable (mean alpha: 0.769). Further analyses showed not
only a comparable model fit but also an acceptable correlation (mean r: 0.869) with the
100-item measure, suggesting great potential use in future personality research. Taking the
present study as an example, the advantages of collecting data through online means such as
the 'Facebook' website are discussed, as well as the limitations.
A Tutorial on Structural Equation Modeling with Incomplete Observations: Multiple
Imputation and FIML Methods Using SAS
Poster Session II: Thursday, 21 July, 5:30 p.m. – 7:00 p.m.
Wei Zhang*, SAS Institute Inc, USA
Yiu-Fai Yung, SAS Institute Inc, USA
This presentation demonstrates the use of the MI, MIANALYSIS, and CALIS procedures of
SAS/STAT to fit structural equation models with incomplete observations (or missing data).
The multiple imputation method and the full information maximum likelihood (FIML)
method are two statistically proven methods for analyzing structural equation models with
incomplete observations. This presentation illustrates the steps required to carry out these

The 76th Annual and the 17th International Meeting of the Psychometric Society Page 330
two methods in the SAS system. Practical data examples are used throughout the
presentation. Although the multiple imputation method and the FIML method yield similar
estimation results, with its availability in the CALIS procedure the FIML method is more
convenient to use. To help understand the source of missingness, the CALIS procedure
provides detailed analysis of the missing patterns, including proportion coverage of sample
moments and the mean profiles of dominant missing patterns. When the number of
missing patterns is small, a multiple-group setup with the CALIS procedure can be used.
This is also illustrated with a real data example.
Mixture Extensions of the Linear Logistic Test Model (LLTM) using Markov Chain
Monte Carlo (MCMC) Estimation
Poster Session II: Thursday, 21 July, 5:30 p.m. – 7:00 p.m.
In-Hee Choi*, University of California, Berkeley, USA
Mark Wilson, University of California, Berkeley, USA
The purpose of this study is to investigate the use of a Markov chain Monte Carlo (MCMC)
for mixture extensions of the linear logistic test model (LLTM; Fischer, 1973). MCMC
estimation has been shown to be advantageous for estimating complex IRT models (Patz &
Junker, 1999). In particular, it is known to be useful in estimating mixture distributions
(Diebolt & Robert, 1994). The flexibility of the MCMC algorithm allows one to estimate
mixture extensions of the LLTM as well as the random weights LLTM (RW-LLTM;
Rijmen & De Boeck, 2002), a more generalized and complex LLTM. The MCMC
algorithm is implemented using WinBUGS (Spiegelhalter, Thomas, Best, & Lunn, 2003),
and results from an empirical example using verbal aggression data (De Boeck & Wilson,
2004; Vansteelandt, 2000) are presented to illustrate fitting mixture models of the LLTM
and random weights LLTM. The results indicate that the MCMC algorithm is successfully
employed to estimate the mixture extensions of the LLTM and RW-LLTM and the mixture
RW-LLTM provides a useful tool to detect latent classes differentiated in multidimensional
aspects, general propensity and item property specific propensity.
Using bifactor model to detect testlet effect
Poster Session II: Thursday, 21 July, 5:30 p.m. – 7:00 p.m.
Szu-Cheng Lu*, National University of Tainan, Taiwan
Bor-Yaun Twu, National University of Tainan, Taiwan
The bifactor model ( Holzinger & Swineford, 1937) had been indicated for a long while.
This model was always used in confirmatory factor analysis and was seldom used for
solving the real psychometric problems. When Gibbons & Hederker (1992) described the

The 76th Annual and the 17th International Meeting of the Psychometric Society Page 331
full-information item bifactor analysis in the IRT context and had it been implemented in
the TESTFACT program, the bifactor model became popular and receiving more attention.
Researchers were able to use this method to investigate the issues related to testlet effects,
dimensionality assessment, subscale score and rater effects. Among them, the testlet effect
and dimensionality assessment seem to be the most studied topics.
In this study, we focused on the application of bifactor model to the related issues of testlet
effect. Three different data sets will be simulated: full-independent data, full-testlet data,
and partial- independent and partial-testlet data. Two test lengths (20, 40 items) and three
testlet effects (0, 0.5, 1.0) will be manipulated and the sample size will be 1000 for each
data set. The purpose of this study is to investigate the performance of bifactor model when
it was apllied to model the testlet effect among items. At the same time, the Q3 statistics
proposed by Yen (1984) will also be calculated for each data set to see if this statistic was
able to indicate the dependency among items.
Establishing a Confirmatory Factor Analysis Model for the Self-Efficacy for Writing
Scale
Poster Session II: Thursday, 21 July, 5:30 p.m. – 7:00 p.m.
Yi-Fang Wu, University of Iowa, USA
Chia-Ling Tu*, National University of Tainan, Taiwan
More than two decades ago, Bandura (1986) proposed a view of human functioning that
emphasized the role of self-referent beliefs. Since then, many studies have been focused on
the relationships between students’ academic performance and the self-referent
characteristics based on Bandura’s sociocognitive perspective. For example, how
self-efficacy component contributes to writing, one of the most important communication
skills has been studied. The purpose of the current study is to review past studies and
establish a confirmatory factor analysis (CFA) model for the Self-efficacy for Writing Scale
(SEWS). SWES consists of three subscales, Comparison and Feedback, Social
Psychological Status as well as Writing Process. It is a newly-developed measure with the
purpose of classroom-based use for elementary teachers and students. Data has been
collected from 641 girls and boys across grades 4 to 6 in Taiwan. Mplus (2007) will be used
for constructing the CFA model; the results can provide the construct validity evidence for
items designed to assess self-efficacy for writing. The study will also include the
investigation of measurement invariance (Usher & Pajares, 2008; Kline, 2010) across
gender and grade, respectively. Simply put, we gather evidence to improve the quality of
SEWS and we also hope that the scale could be helpful to understand students’ self-efficacy
toward their writing ability in the future. With this piece of information, students may be
The 76th Annual and the 17th International Meeting of the Psychometric Society Page 332
informed self-beliefs that enable them to exercise a measure of control over their thoughts,
feelings, and actions in writing.
Utility of Local Linear Approximation in quantifying emotional trajectories of
romantic partners
Poster Session II: Thursday, 21 July, 5:30 p.m. – 7:00 p.m.
Amy Schmid*, Columbia University Teachers College, USA
Noelle Leonard, New York University College of Nursing, USA
Amanda Ritchie, New York University College of Nursing, USA
Marya Viorst-Gwadz, New York University College of Nursing, USA
Objective: When individuals discuss stressful topics with romantic partners, their emotions
may change The present study examined (1) mathematical methods of quantifying these
emotional changes, and (2) the association between emotional changes and relationship;
Method: Participants rated their relationship quality and were then videotaped during a
stressful 5-minute conversation with their romantic; Afterward, individuals watched the
video of their conversation and rated their emotional positivity at 15-second; Some
participants had zero-slope emotional trajectories, others had stable slopes, and others had
highly variable slopes (i.e., rapid up-and-down movement). We quantified each
participant’s trajectory using three methods. First, we took the mean rating over time.
Second, we calculated the standard deviation (SD) of ratings. Third, we used a technique
derived from Local Linear Approximation: we estimated the variability in the first
derivative of the emotion ratings by calculating the root mean square of the time varying
derivative of each individual’s ratings (“velocity”). This calculation captured the speed at
which participants’ slopes changed course over time. Dyadic HLM models were used to
predict relationship quality using mean, SD, and; Results: Low relationship quality was
significantly associated with high velocity, high SD, and low mean (i.e., very negative
emotions); All three predictors were highly correlated (alpha=.89) and produced nearly
identical results. Conclusions: Rapid emotional changes during stressful conversations are
associated with poor relationship. However, the mean, SD, and velocity of time series data
had similar predictive value in this instance.
Incorporating response time to model test behavior in a structural equation modeling
framework
Poster Session II: Thursday, 21 July, 5:30 p.m. – 7:00 p.m.
Shu-Chen Chan*, National Taiwan Normal University, Taiwan
Rung-Ching Tsai, National Taiwan Normal University, Taiwan
The 76th Annual and the 17th International Meeting of the Psychometric Society Page 333
Item response time has been shown valuable in identifying different test behavior of the test
takers. Recently, a mixture Rasch model with response time components showed that a
two-class solution representing rapid-guessers and solution behavior examinees fit the test
data better than one-class solution. However, inclusion of other additional classes, such as
fast responders, might still be necessary for fulfilling the assumption of independence of
item response and response time given latent class. In our study, we embed such a
simultaneous analysis of both item responses and response time into structural equation
modeling framework. Simulations are conducted not only to investigate the parameter
recovery of the proposed latent class models for various test behavior, but also to examine
possible estimation bias in item parameters when response time is unavailable and no
guessing behavior is assumed in the data.
Effects of the Open Recruiting System for Principal Employment on the School
Performance in Korea
Poster Session II: Thursday, 21 July, 5:30 p.m. – 7:00 p.m.
Hyejin Kim*, Pusan National University, South Korea
Chang-nam Hong, Pusan National University, South Korea
Gyeong-ryeon Gwak, Pusan National University, South Korea
Jiyoung Nam, Pusan National University, South Korea
Previous studies showed that leadership of school principals has become effective on
bringing about positive impacts on performance of school organizations. In response to
them, Korea has recently implemented the open recruiting system for principal employment,
in order to examine and select the candidate, through a democratic procedure, who equips
with new leadership and meets the needs of the school and the local community. This study
analyzes effects of the open recruitment system for principal employment on the school
performance in terms of two aspects: the principal’s job performance and the school’s
organizational characteristics. By reviewing previous literatures, 6 domains of job
performance are selected, including school vision set-up, teaching and learning support,
management of school organization, human resource and capital resource and cooperation
with families, local community and other schools, while characteristics of school
organizations such as trust, teachers’ collaboration, collective efficacy and job satisfaction
are chosen. Surveys are conducted on a total of 230 teachers from 16 elementary schools in
Busan which participated in the open recruitment system. And the paired two-sample t-test
is used for comparing changes in variables before and after the system was implemented.
The main results are as follows: (1) the open recruited principal is recognized to perform
better in all domains; (2) teachers recognize improvement on their trust on the principal,
collective efficacy and overall job satisfaction.

The 76th Annual and the 17th International Meeting of the Psychometric Society Page 334
The Relationship between Perceived School Support and Teacher's Commitment
Poster Session II: Thursday, 21 July, 5:30 p.m. – 7:00 p.m.
Jiyoung Nam**, Pusan National University, South Korea
Chang-nam Hong, Pusan National University, South Korea
Hyejin Kim, Pusan National University, South Korea
The purpose of this study was to examine the relationship between perceived school support
and teacher's commitment. Three research questions were selected to carry out this study.
First, are there differences in perception between perceived school support and teacher's
commitment in accordance with the background variables for elementary school teachers?
Second, what is the correlation between school support and teacher's commitment? Third,
what influence does the school support perceived by elementary school teachers have on
commitment?
This study conducted a survey on 300 teachers from elementary schools in Daegu
metropolitan city and the province of Gyeongsangbuk-do in Korea. Collected data were
analyzed by t-test and one way ANOVA, while the relation between elementary school
teachers’ perception of school support and their dedication was identified through
regression analysis.
Main results of the study are as follows: first, both the school support and the teacher’s
commitment perceived by the elementary school teachers had significant differences in
accordance with background variables. Second, as to the correlation between perceived
school support and teacher's commitment in general, perceived school support was closely
correlated with their dedication. Third, the overall effect of school support on overall
commitment to teaching was statistically significant.
The Longitudinal Structure of the Chinese version of Beck Depression Inventory II
using a Latent State-Trait Model
Poster Session II: Thursday, 21 July, 5:30 p.m. – 7:00 p.m.
Pei-Chen Wu*, National PingTung University of Education, Taiwan, Taiwan
Measures are usually applied in counseling and psychology to assess one’s trait or state.
However, the extent to which the measure assesses differences accounting for trait or state
is indefinite. The latent state-trait (LST) theory provides a framework for modeling changes
by separating the stable, occasion-specific and error-specific influences (Steyer, Ferring, &
Schmitt, 1992; Steyer, Schmitt, & Eid, 1999). In a 4-wave study, this study uses
longitudinal panel data from the adolescents (high school students, N= 820) and early adults
(college students, N=790) to estimate the state and trait variance to the reliable variance in
The 76th Annual and the 17th International Meeting of the Psychometric Society Page 335
depression of the Chinese version of Beck Depression Inventory II (BDI-II-C; Chinese
Behavioral Science Cooperation, 2000) within a LST model. Results have indicated that the
longitudinal structure of the BDI-II-C changed considerably depending on the age and
gender of participants. Adolescents’ BDI-II-C performed an occasion-specific dimension
more than a stable trait dimension; but early adults’ BDI-II-C was more sensitive to a trait
dimension than an occasion-specific dimension. The findings suggest that more attention
should be put on the longitudinal structure of depression measures and change comparisons
for particular purposes. For example, if we assess the change of trait-like depression (i.e.,
cognitive-styles), measures of trait-like depression should be chosen; when we evaluate the
change of state-like depression, measures of state-like depression should be selected.
Setting a Target Test Information Fuinction for Assembly of IRT-Based Classification
Tests
Poster Session II: Thursday, 21 July, 5:30 p.m. – 7:00 p.m.
Kentaro Kato*, Center for Research on Educational Testing, Japan
The test information function (TIF) is often used as an optimization criterion in assembly of
tests based on item response theory (IRT). On the one hand, setting a target TIF entails
considerations of various factors such as characteristics of items in the item bank and
feasible measurement accuracy. More or less arbitrarity is inevitable in this process. On the
other hand, it would also be helpful if one can set up a standard for the target TIF simply
based on desired test characteristics, i.e., without regard to those which items at hand can
provide. This study proposes a procedure to obtain a target TIF for IRT-based classification
(i.e., pass/fail) tests. The problem is formulated by decision theory, in which pass/fail
decisions are made by comparing maximum likelihood estimates of theta with a threshold
value and the loss function poses penalty of one for misclassified cases. The resulting risk
function is the misclassification rate given the true theta, which is a function of an unknown
target TIF. Then the target TIF is sought so that the overall misclassification rate (i.e., the
preposterior risk) falls below a prespecified threshold value. This cannot be done without
appropriate constraints on the form of the target TIF. Possible functional forms for the
target TIF and a computational method are discussed. A practical example is also presented.
A Comparison of Item Response Models for a Test Consisting of Testlets
Poster Session II: Thursday, 21 July, 5:30 p.m. – 7:00 p.m.
Naoya Toudou*, The University of Tokyo, Japan
A set of items that have a common stimulus (e.g., reading passage, information graph) is
called testlet. Responses to the items in a testlet often violate the assumption of local
The 76th Annual and the 17th International Meeting of the Psychometric Society Page 336
independence. Previous studies have indicated that this dependent structure causes bias in
item parameter and latent trait estimates when standard IRT methods are used. Several IRT
models that take local dependence into account have been proposed. These models can be
classified into three types, but no comparison has been done among these types of models in
terms of accuracy of parameter estimation. In this study, I performed a series of simulations
to compare the models by varying such conditions as the proportion of locally dependent
items and the degree of local dependence. Simulation results showed that in many
conditions the magnitude of bias in latent trait estimates was smaller when a standard IRT
model was applied rather than the models proposed to deal with local dependence, and that
the proportion of locally dependent items and the degree of local dependence affected the
accuracy of estimates. Finally, I confirmed the simulation results by a large set of real data.
Test of Independence by Asymptotic Lambda for Nominal Data using Bootstrap
Poster Session II: Thursday, 21 July, 5:30 p.m. – 7:00 p.m.
Yu Hin Ray Cheung*, The Chinese University of Hong Kong, Hong Kong
Lok Yin Joyce Kwan, The Chinese University of Hong Kong, Hong Kong
Wai Chan, The Chinese University of Hong Kong, Hong Kong
Asymmetric lambda is a common measure of association for nominal variables in a
contingency table. It measures the improvement in the prediction of the column variable
conditioned on the row variable, or vice versa. However, it is generally believed that the
performance of the asymptotic standard error (ASE) is poor when the sample size is small.
Moreover, given the same contingency table in which ties in the marginal probabilities
occur, the ASE estimates may vary when the rows or columns are arranged in different
order. In view of the above problems, this article proposed the use of bootstrap procedure as
a substitute to traditional asymptotic method. The performance of the standard error
estimates was assessed by a simulation study using R 2.12.2. Results showed that the
percentage bias of bootstrap standard error (BSE) was small across all conditions and
bootstrap percentile outperformed significant tests using ASE and BSE in most
configurations. This paper provides an empirical support for applied researchers to draw
statistical inference on the strength of association between two nominal variables as
measured by asymmetric lambda using bootstrap procedures.
A Structural Equation Modeling Approach for the Analysis of Conditional Indirect
Effects
Poster Session II: Thursday, 21 July, 5:30 p.m. – 7:00 p.m.
Lok Yin Joyce Kwan*, The Chinese University of Hong Kong, Hong Kong
Wai Chan, The Chinese University of Hong Kong, Hong Kong
The 76th Annual and the 17th International Meeting of the Psychometric Society Page 337
In path analysis, an indirect effect explains the mechanism that underlies the relationship
between an independent variable and a dependent variable through the inclusion of a third
variable, known as a mediating variable (Baron & Kenny, 1986). A conditional indirect
effect is said to be occurred when the strength of an indirect effect depends on the value of
some other variables, known as moderating variables in the model. In psychological
research, the conditional indirect effects are also termed as mediated moderation or
moderated mediation (Muller et al., 2005). Researchers usually use regression-based
method to study the conditional indirect effect (e.g. Preacher et al., 2007). Generally
speaking, the conditional indirect effect can easily be estimated by fitting the conditional
indirect effect model in structural equation modeling (SEM). However, few research studies
have been done to evaluate SEM as a useful tool to study conditional indirect effects. This
presentation discusses how conditional indirect effects are estimated and test for
significance by using SEM technique. We demonstrate how conditional indirect effect
models are estimated and test for significance using the asymptotic and bootstrap standard
error under the SEM framework. A simulation study is conducted to compare the
performance of the regression-based method with the SEM approach for studying
conditional indirect effects. Results show that the SEM method works better than the
regression-based method for the estimation of conditional indirect effect. Recommendations
are given to applied researchers on assessing conditional indirect models using SEM.
Sampling discrete m x n matrices with fixed margins
Poster Session II: Thursday, 21 July, 5:30 p.m. – 7:00 p.m.
Kathrin Gruber*,Vienna University of Economics and Business, Austria
Reinhold Hatzinger, Vienna University of Economics and Business, Austria
In this article a generalization of Chen's algorithm (2005) for simulating binary data
matrices with given row and column sums (and a set of structural zeros) will be presented.
The aim is to sample discrete data matrices with fixed marginals to build exact
nonparametric partial credit class tests. The challenge here is to plug in Masters' model and
derive a computational fast and efficient algorithm which can be generalized to n
categorical responses by recursive solving of a linear program with restrictions to the row
sums. Based on the sequential importance sampling (SIS) algorithm (Snijder, 1991; Chen,
Dinwood and Sullivant, 2006) by means of linear programming lower and upper bound
intervals are derived, on which a hypergeometric distribution is used as proposal
distribution. As an alternative approach modeling of the responses can also be done using a
markov chain by defining a transition matrix (MCMC application). The main result of this
article is a two stage sampling algorithm that is easy to implement and efficient. The
The 76th Annual and the 17th International Meeting of the Psychometric Society Page 338
algorithm will be introduced as well as the SIS and MCMC approaches that are built in the
linear program solution will be compared in computational and theoretical performance.
The Impacts of the Cognitive Components on the Variance of the Item Difficulties for
the Quantities Compare Test
Poster Session II: Thursday, 21 July, 5:30 p.m. – 7:00 p.m.
Wen Chun Tai*, National University of Tainan, Taiwan
Various cognitive complexities which are manipulated in the items have the impacts on the
students’ performance on the test or items. In order to support the teachers’ comprehensive
view of the teaching materials and provide a better understanding of students’ learning, it is
important to provide such information of the manipulation of cognitive components. The
primary purpose of this study was to examine a set of cognitive components that explicitly
explain item difficulties for quantities compare items. There were eighteen quantities
compare items in this study. Participants consisted of 417 first graders in 4 elementary
schools. This study proposed three cognitive components, key statement, location of
unknown in the equation, and direction of compare, to predict the item difficulty parameters.
In order to validate cognitive sources of item difficulties for quantities compare items, the
item difficulties were estimated by Rasch model, and adopted regression analysis to
examine the impact of these three cognitive components on the variance of item difficulties.
The results and implication will be discussed and will be helpful for the future mathematics
teaching and researches.
Examination of Reliability, Convergent Validity and Discriminant Validity By Using
Multitrait-Multimethod Matrix: Under The Constraint That Sum of The Method
Factors Equal Zero in Correlated Trait Correlated Method Model
Poster Session II: Thursday, 21 July, 5:30 p.m. – 7:00 p.m.
Saori Kubo*, Waseda University, Japan
Hideki Toyoda, Waseda University, Japan
The multitrait-multimethod (MTMM) matrix can be utilized as a means to examine the
convergent and discriminant validity of psychological measurement. The confirmatory
factor analysis (CFA) has become one of the most widely applied approaches for analyzing
the MTMM matrix. In CFA model for MTMM matrix, it is possible to obtain each of the
variance components due to trait, method, and error effect. The result of decomposition of
variance components allows for calculation of reliability coefficient and consistency
coefficients quantifying convergent and discriminant validity.
The 76th Annual and the 17th International Meeting of the Psychometric Society Page 339
Despite their simplicity of use, some CFA models for MTMM matrix, however, are sufferd
from several problems, for example improper solutions, non-identificarion, and difficulty of
interpretation. CT-CM (correlated trait correlated method) model is easily-interpreted, but is
often not identified. On the other hand, CT-C(M-1) (correlated trait correlated method
minus one) model is globally identified, but the researchers have to arbitrary choose one
method factor as comparison standard, and estimates change depending on the choice, that
is, the estimated result is not unique for a specific data. This is a profound problem,
considering the purpose of examining the reliability and validity of the measurement.
This study presents that the constraint that sum of the method factors equal zero in CT-CM
model permits a increase of identified data compared to the original CT-CM model, and
moreover requires no choice of researchers such as CT-C(M-1) model. The calculated
reliability and consistency coefficients also show that the model under this constraint is
useful for examine reliability and validity.
Scheffe-Type Paired Comparison Models to Examine Correlations Between
Preferences for Alternatives
Poster Session II: Thursday, 21 July, 5:30 p.m. – 7:00 p.m.
Norikazu Iwama*, Waseda University, Japan
Hideki Toyoda, Waseda University, Japan
An analysis of paired comparison data is one of the topics in structural equation modeling.
In this presentation, we focus on Scheffe’s paired comparison model for multi-valued paired
comparison data. For Scheffe-type paired comparison models proposed before, it has been
difficult to estimate and examine correlations between individual preferences for
alternatives appropriately. In this presentation, two models that enabled it are proposed. One
is a simple model that makes it possible to estimate correlations between individual
preferences. The other is an improved model that makes it possible to extract independent
components from those correlations.
Through the analysis of paired comparison data that were collected by a questionnaire
survey, where preferences for several new-product names were asked, it was shown that we
can estimate not only average preferences for alternatives, but also correlations between
individual preferences and loading matrices for independent components. In addition, the
effectiveness of proposed methods was confirmed by the interpretations of those estimates.
The Relationship between Parenting Styles and Emotional Intelligence of the Gifted
Students and Ordinary Students at Elementary Schools
Poster Session II: Thursday, 21 July, 5:30 p.m. – 7:00 p.m.
Chieh-Ju Tsao*,National Taichung University, Taiwan
The 76th Annual and the 17th International Meeting of the Psychometric Society Page 340
Bor-Chen Kuo, National Taichung University, Taiwan
Yu-Ting Chang, National Taichung University, Taiwan
Gifted students are powerful resources of a nation. People always emphasize gifted students’
exceptional intelligence and learning performance, but overlook the fact they have
psychological needs too. This study is to investigate the related factors which influence the
emotional intelligence of the elementary gifted students.When they are labeled by others as
gifted, consequently, mental pressure would be imposed on them which could affect their
emotional development. This study is to investigate the related factors which influence the
emotional intelligence of the elementary gifted students and elementary students . The
purpose of this study is to understand the school factor of the gifted elementary students and
elementary students : such as teachers’ teaching behavior , interaction between peers. In
order to provide a theoretical framwork for educational and counseling programs for gifted
students, this study also explores how theses factors are related to the emotioanl intelligence
of the students. This study uses the statistic analysis, including T-test analysis,regression
analysis and Structure Equation Modeling to test research hypotheses.
Finally, the results of the study provide a conceptual framework for designing the
educational and counseling programs and the future research in the area of gifted education.
Sequential and Nonsequential Specification Searches in Testing Factorial Invariance
Poster Session II: Thursday, 21 July, 5:30 p.m. – 7:00 p.m.
Myeongsun Yoon*, Texas A&M University, USA
EunSook Kim, Texas A&M University, USA
In testing factorial invariance, researchers have often used modification indexes to find
adequate partial invariant models and thus identify noninvariant items when the full
invariance model did not fit well. In using modification indexes for the purpose of detecting
noninvariant items, some have respecified the models sequentially one at a time for the item
with the largest modification index until the largest modification index did not exceed a
chosen critical value (i.e., 3.84) and others have used nonsequential specification searches
where all parameters with large modification indexes were relaxed at the same time. The
purpose of the present study was to empirically examine two different approaches for
specification searches in testing factorial invariance. The simulated data were generated to
represent different sample size conditions, different item type (continuous and ordered
categorical items), and various levels of partial invariant models. The results of the study
showed that sequential specification searches outperformed nonsequential specification
searches in correctly detecting noninvariant items across all simulation conditions. In
nonsequential specification searches, invariant items were more often incorrectly identified
The 76th Annual and the 17th International Meeting of the Psychometric Society Page 341
as noninvariant items. Implications of the findings are discussed along with the limitations
of the study.
Practicality of Person Fit Statistics as a Diagnostic Tool in a Computerized Adaptive
Testing Setting
Poster Session II: Thursday, 21 July, 5:30 p.m. – 7:00 p.m.
Shungwon Ro*, Kenexa, USA
Ji Eun Lee, University of Minnesota, USA
With the item response theory (IRT), person misfit refers to item response patterns not
following the IRT model in a way the model expects. Computerized adaptive testing (CAT)
is an advanced delivery mode of testing that adapts to each examinee. CAT is known to
work against person misfit in its algorithm. Therefore, any statistics intended to estimate
person misfit at the individual level does not seem to work very well. However, even under
the CAT setting, person fit statistics can be used for detection of item collusion, item breach
or overexposure. This paper looks into practicality of person fit statistics as a diagnostic tool
to address test security issues in an adaptive testing condition. In particular, detection power
of person fit statistics for item collusion will be investigated.
Predictive Data Mining as an Alternative to Standard Regression Modeling in Very
Large Data Sets
Poster Session II: Thursday, 21 July, 5:30 p.m. – 7:00 p.m.
Hongwei Yang, The University of Kentucky, USA
Kathryn Akers*, The University of Kentucky, USA
The study reviews several data mining predictive models as an alternative to standard
regression in the context of very large data sets. Data mining is usually defined as the
process of discovering meaningful hidden patterns in large amounts of data. Many
industries use data mining to address business problems, such as bankrupt prediction, risk
management, fraud detection, etc. Such applications in data mining primarily rely on its
ability to effectively make accurate predictions. Predictions in data mining are usually
conducted in two types of models: Decision trees and neural networks. The tree model is
designed to identify the most significant split of the outcome at each layer of the model
across all predictors, whereas the neural network model is capable of modeling nonlinear
associations between the outcome and predictors, which in most cases makes a better
approximation of the reality (usually nonlinear) so that the predictive power of the model is
improved. The study compares the two types of predictive models with standard regression
using a benchmark business application for fraud detection where the data set is large
The 76th Annual and the 17th International Meeting of the Psychometric Society Page 342
enough to be partitioned into separate sub-portions for model training, validation, and
testing. Various ways of model tuning are used to improve the predictive ability of each
model. All models are evaluated for goodness-of-fit at the final stage using fit statistics
including those that are specific to data mining. The analysis was performed in SAS
Enterprise Miner, an easy-to-use, readily available program usually provided free-of-charge
to higher education users through academic licenses.
A Procedure to Derive the Response Model for a Polytomous Item
Poster Session II: Thursday, 21 July, 5:30 p.m. – 7:00 p.m.
Wenjiu Du*, Southwest University, China
Hanmin Xiao, Southwest University, China
Those early polytomous models such as GRM (Samejima, 1969) or NCM (Bock, 1972) can
be applied to items with either ordered response categories or unordered. However, it's a
common fact that many items are scored in both of these categories. In the paper, a
definition of item node is firstly given. Based on item nodes and the assumption that the
probability of a correct response on an item node is fit by the two-parameter Logistic model,
three polytomous models are proposed. Especially, the response model for the first-type
items which is with ordered levels of response is the same as GRM in the format.
Simultaneously, a theorem about GRM is mathematically proved. Lastly, Some discussions
about the procedure and other models, for instance, PCM, are described.
In conclusion, the model for a polytomous item can be derived when the nodes of the item
and their relations are specified.
Issues in Testing Scalar Invariance in Structural Equation Modeling
Poster Session II: Thursday, 21 July, 5:30 p.m. – 7:00 p.m.
Chansoon Lee*, Sungkyunkwan University, South Korea
Soonmook Lee, Sungkyunkwan University, South Korea
There have been unresolved arguments about the requirement of scalar invariance as a
prerequisite of testing factor mean difference across groups in multi-group analysis of
structural equation modeling. To investigate this issue, we conducted simulation studies on
three conditions: difference in response intervals between groups, difference in response
thresholds between groups, and existence of a response set. Based on a simple model of one
factor with one observed categorical variable, we compared results from
X-ANOVA(analysis of variance on observed variables) and F-ANOVA(analysis of variance
on factor scores). There are three findings. First, when response intervals were different and
intercepts were identical between groups, both F-ANOVA and X-ANOVA were significant
The 76th Annual and the 17th International Meeting of the Psychometric Society Page 343
in the same direction. In this case, X-ANOVA will be enough to infer factor mean
differences. Second, when response thresholds were different and intercepts were different
between groups, F-ANOVA was significant despite that X-ANOVA was not significant.
Third, when a response set was expected and intercepts were different between groups,
F-ANOVA was not significant despite that X-ANOVA was significant. In the latter two
situations, testing factor mean difference is required even when scalar invariance does not
hold across groups. Meanings and limitations of the study, and suggestions for further
studies are discussed.
Testing for Measurement Invariance Using Linear and Nonlinear Confirmatory
Factor Analysis
Poster Session II: Thursday, 21 July, 5:30 p.m. – 7:00 p.m.
Dexin Shi*, University of Oklahoma, USA
Hairong Song, University of Oklahoma, USA
A. Robert Terry, University of Oklahoma, USA
In research involved with multiple-group comparisons, measurement invariance should first
be tested to assess whether the same construct is measured by same observed variables in a
similar way across groups. In structural equation modeling framework, measurement
invariance has typically been tested using linear confirmatory factor analytic models, while
leaving nonlinear confirmatory factor analytic models relatively underused. This study is
aimed to compare linear and nonlinear confirmatory factor analysis in testing for
measurement invariance using empirical data. The data used in this study are depression
scores measured by CES-D scale from the National Longitudinal Survey of Youth (NLSY)
1979: Child and Young Adult. There were 3168 females and 3105 males included in the
analysis. Both linear and nonlinear confirmatory factor analyses were used to assess
measurement invariance across gender groups. The results showed that both linear and
nonlinear factor analyses concluded a partial strong invariance on CES-D across gender;
however, the two analyses produced slightly different invariance patterns. Moreover, by
assuming measurements are categorical, nonlinear confirmatory factor analysis is more
conservative in establishing measurement invariance. Based on our results, implications and
suggestions are provided to applied researchers regarding to the uses of the linear and
nonlinear factor analyses in testing for measurement invariance.
Multilevel Analysis Reveals Increased Proactive Interference Among Low Working
Memory Span Individuals
Poster Session II: Thursday, 21 July, 5:30 p.m. – 7:00 p.m.
Ye Wang*, University of Florida, USA
The 76th Annual and the 17th International Meeting of the Psychometric Society Page 344
David Therriault, University of Florida, USA
James Algina, University of Florida, USA
Proactive interference (PI) is a reduction in the ability to retrieve new information because
prior learning interferes with storage and processing of the material to be learned. High- and
low-working memory (WM) span individuals may experience differences in how they
experience proactive interference (i.e., individuals who are lower in working memory
should also be more vulnerable to PI).
This study explored whether accuracy on later trials in the reading span task (i.e., a WM
task that require participants to read sentences while also remember a series of letters)
would be influenced by the buildup of PI. Seventy-five participants completed the task. A
within-subject multilevel binominal model was employed. In the following formula, P is the
expected proportion of correctly recalled letters in each trial, WM is the reading span score,
Trial is the serial number of the trial (15 trials in total), and Size is the number of letters to
be remembered in each trial (ranging from 3 to 7). The estimated model was
Logit(P)=2.49+0.04*WM+(0.002*WM–0.12)*Trial–0.64*Size.
The results indicate that for a WM score equal to 45 (i.e., the score that defines the lowest
quartile), the simple slope for Trial is (0.002*45 – 0.12) = -0.03. The simple slope is even
smaller for scores less than 45. Therefore, controlling for Size and WM, comparing the
fifteenth trial with the first trial, the odds ratio for correct letter recall is e^((-0.03)*14) =
0.66, indicating a decrease in the probability of correctly recalling letters from first trial to
fifteenth trial for low-WM participants.
Long-term Change of Relational Aggression among Mexican American Youth
Poster Session II: Thursday, 21 July, 5:30 p.m. – 7:00 p.m.
Xiaolan Liao*, University of Oklahoma, USA
Rand Conger, University of California, Davis, USA
Gary Stockdale, University of California, Davis, USA
Relational aggression is defined as harming others through purposeful manipulation or
damage to their peer relationships. Despite of many studies devoted to examine relational
aggression, long-term change or developmental patterns of relational aggression is under
studied. The goal of this study is two-folded: a) to assess the overall growth trajectory of
relational aggression during adolescence among Mexican American children, and b) to
examine the role of gender, parent-child conflict, parental involvement in child education,
and child-teacher attachment in explaining the differences in growth trajectories of
relational aggression during adolescence. Four waves of data were collected from 317
Mexican American families, starting at when children were in the 5th grade. The results
The 76th Annual and the 17th International Meeting of the Psychometric Society Page 345
from latent growth curve modeling showed that relational aggression declines among
Mexican American children from the 5th to the 8th grade, there were significant variations
among children in initial levels of aggression behaviors as well as the rate of decline, and
children with a higher level of relational aggression behaviors tended to decline with a
lower rate. Regarding to the effect of a few covariates under investigation, the results
indicated that parent-child conflict (negatively), parental involvement in child education
(positively), and child-teacher attachment (positively) contribute to the differences in levels
of relational regression. Moreover, parent-child conflict negatively influenced the rate of
change in aggression-- children with higher level of conflicts with their parents has lower
rate of decline. No gender difference was found in the growth trajectories of relational
aggression among Mexican American youth.
The Validation of Measurement Invariance across Gender in Volitional Questionnaire
Chinese-version
Poster Session II: Thursday, 21 July, 5:30 p.m. – 7:00 p.m.
Ming-Shan Yang*, National University of Tainan / National Chia-Yi Special Education
School , Taiwan
Siou-Ying Wu, National Chia-Yi Special Education School, Taiwan
Yen-Chao Chung, National Chia-Yi Special Education School, Taiwan
Szu-En Pan, National Chia-Yi Special Education School, Taiwan
Chia-Wei Hsiao, National University of Tainan, Taiwan
Abstract Meaningful comparison of scale responses by gender would
necessitate evidence of measurement invariance between responses obtained from the
different gender groups. Measurement invariance reveals the extent to which scale
responses maintain their meaning across groups and is essential to psychological measures.
The purpose of this study is to examine the measurement invariance of the Volitional
Questionnaire Chinese-version across gender. The Volitional
Questionnaire was developed by de las Heras and was translated into Mandarin via 2 stage
methodology in order to investigate the construct validity. Rasch analysis indicated that the
VO-C encompasses a unidimensionality. The students, about 100 males and 100 female,
who were diagnosed with mental retardation will be recruited and must be with sufficient
comprehension, normal sensorimotor function in upper extremity and ages are above 13
years old. Cubes arrangement activities are manipulated and scored in order to examine the
measurement invariance of the VO-C. Structural equation modeling
(SEM) will be used to investigate the measurement invariance of the Volitional
Questionnaire Chinese-version across gender. The data will be analyzed by using Analysis
of Moment Structures (AMOS) program.

The 76th Annual and the 17th International Meeting of the Psychometric Society Page 346
Psychometric Evaluation of the Italian Version of the Qualid Scale: A Contribution to
Cross-National Implementation of a Test for Qol in Late-Stage Dementia
Poster Session II: Thursday, 21 July, 5:30 p.m. – 7:00 p.m.
Tiziano Gomiero*, ANFFAS Trentino Onlus, Italy
Luc Pieter De Vreese, Health District of Modena, Italy
Ulrico Mantesso, ANFFAS Trentino Onlus, Italy
Elisa De Bastiani, ANFFAS Trentino Onlus, Italy
Elisabeth Weger, ANFFAS Trentino Onlus, Italy
OBJECTIVES: The aim of this study was to verify the reliability and validity of the Italian
version of an instrument for rating quality of life in persons with Intellectual Disability with
late-stage Alzheimer's disease and other dementing illnesses.
DESIGN: A group of professionals with experience submit the Quality of Life in Dementia
Scale (QUALID), an 11-item scale. The window of observation for each subject was 7 days.
A 5-point scale captured the frequency of each item. Lower scores reflected a higher quality
of life (QoL). Validity was assessed by comparison with other measures.
SETTING: Residential services specialized in the care of people with ID.
PARTICIPANTS: Professional caregivers of 40 persons with ID, divided into two equal
subgroups with and without dementia. The sample has a mean age of 56,4 ± 4,71 SD years,
22 persons are females, 60% have Down’s syndrome.
MEASUREMENTS: QUALID and AADS-I, an informant-based questionnaire targeting
the frequency and impact on management and quality of life (QoL) of dementia-related
Behavioral Excesses and Deficits in adult and elderly persons with ID.
RESULTS: QUALID scores ranged from 11 to 55 points and were skewed toward higher
QOL (lower scores). Internal consistency of items was high (Cronbach’ alpha .795), as were
test-retest reliability and consistency across recorders. There was relationship between
QUALID and the Behavioral Excesses sub-scales scores of AADS-I but not with the
Behavioral Deficit sub-scales.
CONCLUSION: The QUALID is a reliable and valid scale, administered to caregivers, for
rating QoL in persons with ID in late-stage dementing illness.
Invariance of Equating Functions Across Gender Groups of the Taiwan Assessment of
Student Achievement
Poster Session II: Thursday, 21 July, 5:30 p.m. – 7:00 p.m.
Hsuan-Po Wang*,National Taichung University of Education, Taiwan
Yu-Ju Lu, National Taichung University of Education, Taiwan
Bor-Chen Kuo, National Taichung University of Education, Taiwan
The 76th Annual and the 17th International Meeting of the Psychometric Society Page 347
Chien-Ming Cheng, National Taichung University of Education, Taiwan
This study investigates whether the functions linking number-correct scores to the Taiwan
Assessment of Student Achievement (TASA) scaled scores remain invariant over gender
groups, using 10 forms from TASA 2007 in Mathematics (TASA-MAT) for the 8th grade
students. The degree of population invariance was also compared across item response
theory (IRT) true score and IRT observed score equating methods that are commonly used
in the nonequivalent groups anchor test (NEAT) design. Equatability indices proposed by
Dorans and Holland (2000) were used to evaluate population invariance over gender
subpopulations. The root mean square difference (RMSD), the root expected square
difference (RESD), and the root expected mean square difference (REMSD) three types of
equatability measures were used to assess to what degree the linking functions were
invariant over gender subpopulations.
The goals of this article were to compare the RMSD, RESD, and REMSD results obtained
for the IRT true score equating and the IRT observed score equating. And there were
various methods for obtaining this scale transformation: the mean / mean (Loyd and Hoover,
1980) method, the mean / sigma method (Marco, 1977), and the characteristic curve
methods such as the Haebara (1980) and the Stocking and Lord (1983) methods. The
Results indicated that the conversions obtained from gender groups were similar to the
conversions obtained by using the total group, except the Form 7 transformed by the
method of Mean/Sigma. And in this form, RMSD exceeds SDTM at the high score region
when the Mean/Sigma method was applied.
Self-esteem and Individual Adaptability
Poster Session II: Thursday, 21 July, 5:30 p.m. – 7:00 p.m.
Huajian Cai*, Chinese Academy of Science, China
Hairong Song, University of Oklahoma, USA
In two studies, we examined that relationship between self-esteem and individual
adaptability. In study 1, by using a cross-sectional design, it was found that self-esteem was
significantly associated with individual adaptability, with low self-esteem associating with
low individual adaptability. In study 2, by using a longitudinal design, cross-lagged
regression analysis further revealed that self-esteem did not predicted subsequent levels of
individual adaptability and neither did individual adaptability predict subsequent levels of
self-esteem. These findings suggest that although self-esteem and individual adaptability are
related to each other, they do not have any prospective effect on each other.
The 76th Annual and the 17th International Meeting of the Psychometric Society Page 348
The DFTD Strategy with Likelihood Ratio Test method in Assessing DIF for
polytomous items
Poster Session II: Thursday, 21 July, 5:30 p.m. – 7:00 p.m.
Guo-Wei Sun*, National Sun Yat-sen University, Taiwan
Hui-Ching Chen, National Taichung University of Education, Taiwan
Ching-Lin Shih, National Sun Yat-sen University, Taiwan
The type I error rate rates of most DIF assessment methods were inflated as the percentage
of DIF items in the test increased. It should be noted that the power rate of DIF assessment
method is meaningless if the type I error rate is not well-controlled. To deal with this
problem, DIF-free-then-DIF (DFTD) strategy was recommended to implement in DIF
assessment methods (Wang, 2008). It is important to develop reliable ways in selecting
DIF-free items as anchor, otherwise, the matching variable may contain DIF items and the
subsequent DIF analysis is affected.
Higher accuracies in selecting DIF-free dichotomous items was found by using the scale
purification procedure in DFTD strategy If the same findings hold in polytomous items was
investigated in this study. Through a series of simulation studies, the scale purification
procedure was found can yield higher accuracy than other methods on identifying a set of
DIF-free items, especially when the percentage of DIF item is high. Furthermore, it was
found taking these selected items as anchor of DFTD strategy, the subsequent constant item
method performed well in controlling Type I error rates of DIF assessment.
Development of Creative Life Style Check List
Poster Session II: Thursday, 21 July, 5:30 p.m. – 7:00 p.m.
Wan-Ying Lin*, National Sun Yat-sen University, Taiwan
Ying-Yao Cheng, National Sun Yat-sen University, Taiwan
Li-Ming Chen, National Sun Yat-sen University, Taiwan
Ya-Hsueh Wang, National Sun Yat-sen University, Taiwan
A good scale of creative life styles not only provides feedback information about their
creative thinking for students, but also offers them useful information in understanding their
own creative behavior in life. This preliminary study aims to develop and validate the
Creative Life Style Check List for diagnosing undergraduates’ creative life styles toward
themselves, and let people know what kind of styles they belong and how to increase
creative life behavior. Participants were 304 undergraduates in Taiwan. A total of 30 draft
items were generated by research team members based on literature of creativity. The items
were checked by five experts from fields of education and psychological measurement.
The 76th Annual and the 17th International Meeting of the Psychometric Society Page 349
Unidimensional Rasch analysis was employed to examine model-data fit, differential item
functioning and the separation and order of item difficulty.
The results manifested that the Creativity Life Style Check List had a reasonably good
model-data fit, moderate correlation among the subscales, and no significant DIF across
gender. The Creativity Life Style Check List offers students a valuable tool for
understanding undergraduates’ creative live behavior for diagnosing students in need of
making more creativity in life.
Test for the Number of Factors in Exploratory Factor Analysis: A Nonparametric
Goodness-of-Fit Approach
Poster Session II: Thursday, 21 July, 5:30 p.m. – 7:00 p.m.
Kentaro Hayashi*, University of Hawaii at Manoa, USA
Finding the number of factors in exploratory factor analysis is an old problem. Yet, there
has been no uniformly the best procedures. The most famous methods are based on
eigenvalues of the correlation matrix, such as the Kaiser-Guttman
(eigenvalue-greater-than-one) rule, the scree plot, and the parallel analysis. If you employ
the maximum likelihood (ML) estimation, the likelihood ratio test (LRT) and information
criteria such as AIC and BIC are available. However, it is known that, when the number of
factors exceeds the true number of factors in the population, the factor loading matrix is no
longer uniquely identified and thus the regularity conditions for the asymptotic chi-square
distribution of the LRT no longer holds true. As a remedy for the afore-mentioned problem
associated with the LRT, we propose the procedure based on a nonparametric
goodness-of-fit method. Because the same phenomenon of possible violation of regularity
conditions occur in many other situations such as the neural network models and finite
mixture models, we think the applicability of the proposed method is quite wide.

The 76th Annual and the 17th International Meeting of the Psychometric Society Page 350
Friday, 22 July, 2011
Modeling Heterogeneity in Dynamical Structures and Processes
Symposium: Friday, 22 July, 9:20 a.m. -- 10:40 a.m., D1-LP-03
Fitting Nonlinear Differential Equation Models with Random Effects Using the
Stochastic Approximation Expectation-Maximization Algorithm
Sy-Miin Chow*, University of North Carolina at Chapel Hill, USA
Hongtu Zhu, University of North Carolina at Chapel Hill, USA
Andrew Sherwood, Duke University, USA
The past decade has evidenced the increased prevalence of irregularly spaced longitudinal
data in social sciences. Often lacking, however, are practical tools that allow researchers to
fit dynamic models to irregularly spaced data that may show heterogeneity in dynamical
structures. A stochastic approximation expectation-maximization algorithm for fitting
multivariate linear and nonlinear differential equations with random effects is presented.
The performance of the proposed approach is evaluated using two benchmark nonlinear
dynamical systems models, namely, the Van der Pol oscillator and the Lorenz equations.
The empirical utility of the proposed technique is illustrated using a set of ambulatory
cardiovascular data from 170 college students over the course of 24 hours. Pertinent
methodological challenges and unresolved issues are discussed.
Modeling physiological emotion specificity with regime switching state space models
Tom Lodewyckx*, University of Leuven, Belgium
Francis Tuerlinckx, University of Leuven, Belgium
Peter Kuppens, University of Leuven, Belgium
Nicholas Allen, University of Melboune, Australia
Lisa Sheeber, Oregon Research Institute, USA
Although there is no doubt that physiology is intricately linked to emotion, there is ongoing
debate about how physiological activation maps onto emotions. One theoretical view is
based on the assumption that there is a discrete set of specific emotions, each having a
typical physiological signature. Other views postulate distinct physiological signatures for
sets of emotions, such as positive and negative emotions, or approach and avoidance
emotions. When studying physiological emotion specificity, not only the particular
categorization of emotions (degree of specificity) is of interest, but also which properties of
the process are influenced by these emotional states (type of specificity). Until now,
specificity has mostly been narrowed down to the investigation of differences in average
The 76th Annual and the 17th International Meeting of the Psychometric Society Page 351
physiological activation, but even in the absence of mean differences, it might be that
specificity occurs at the level of variability or dynamics of the physiological processes.
To model both the degree and type of emotion specificity, we propose regime switching
state space modeling as an appropriate statistical approach. The regime variable defines the
degree of specificity, whereas the type of specificity is represented by which of the
parameters are regime-specific. We performed a Bayesian implementation of the regime
switching state space model consisting of traditional Gibbs sampling (to sample the system
parameters) and forward-filtering backward-sampling (to sample the underlying states).
This approach was applied to data consisting of second-to-second continuous physiological
measures and discrete behavioral emotion codings (representing the regimes) from
adolescents observed during emotion-eliciting interactions with their parents.
Exploratory Analysis of Heterogeneous Dynamic Models Using a Multi-sample SEM
Algorithm
Lawrence L. Lo*, Pennsylvania State University, USA
Peter C. M. Molenaar, The Pennsylvania State University, USA
Michael J. Rovine, Pennsylvania State University, USA
Advances in idiographic approaches have enabled detailed study of individual dynamics in
the psychological and neurobiological domains, yet there is increasing demand to unite
these methods with nomothetic perspectives. Although recent advances in this combined
approach have primarily occurred in fMRI research, there is potential for implementation in
any psychological inquiry. This presentation presents a new multilevel exploratory
algorithm for identifying and estimating dynamic relationships that may be shared among
persons or specific to an individual. The framework is based on a generalization of the state
space model that includes contemporaneous and lagged structural relationships within time
series data. Estimation procedures utilize dynamic extensions of structural equation models
and incorporate multiple persons by multi-sample methods. The algorithm identifies shared
and subject-specific structural relationships by a combination of likelihood ratio and
standard error statistics. A Monte Carlo simulation study demonstrates the accuracy of the
exploratory algorithm in varying conditions of sample size, model complexity, and level of
dynamic heterogeneity. A real data example using data from an fMRI study shows an
empirical application of the approach. The algorithm is incorporated in a free program that
has been written in R and conducts maximum likelihood estimation with the OpenMX
package. The program has been designed to be easy to use, merely requiring a data set with
no necessary additional commands; however, the program also contains several optional
commands to allow for flexible modeling capabilities. This combination of ease and
The 76th Annual and the 17th International Meeting of the Psychometric Society Page 352
flexibility is intended to facilitate research that combines idiographic and nomothetic
perspectives.
The Modelling and Efficient Estimation of Locally Stationary Time Series
Sebastien Van Bellegem*, University of Toulouse I & University of Louvain, France
Understanding phenomena that evolve over time is the focus of many studies in the
behavioral sciences. Typical models for time processes are based on the assumption that
their statistical properties (such as the mean, the variance or, more generally, the
second-order moment structure) remain constant over time. Although this stationarity
assumption is mathematically convenient, it appears that most individual time series in
empirical studies display a nonconstant statistical structure over time. As an example, one
may consider the time dynamics of individual emotion components that may be subject to
highly changing regimes (e.g., as a function of the amount of external stress). Those
regimes are sometimes unobserved, and the resulting emotion components cannot hardly be
described by stationary models.
In this talk several recent approaches to model non stationary time series are surveyed. Our
approach is to model the human process as a stationary process only locally, although it is
not stationary globally over time. Our goal is to propose a statistically efficient approach to
fit models with a time-varying statistical structure to data at hand and, more importantly, to
analyze the time-variation of statistical properties as a structural, explanatory characteristic
of the phenomenon under study. In the case of individual emotions, this could mean, for
instance, that the changing dynamics in emotion components, as estimated and understood
in our models, may display a generic profile that may be considered itself as an important
aspect of emotion dynamics.
Optimal Item Design in Multidimensional Two-Alternative Forced Choice Tests
Parallel Session: Multidimensional Item Response Theory – Methodology; Friday, 22
July, 9:20 a.m. -- 10:40 a.m.; D1-LP-06
Iwin Leenen*, Investigación y Evaluación, Mexico
Jimmy de la Torre, Rutgers University, USA
Vicente Ponsoda, Universidad Autónoma de Madrid, Spain
Pedro Hontangas, Universidad de Valencia, Spain
In the last decade, the use of forced choice items has regained interest as a possible way to
develop more fake-resistant personality measures. In a typical two-alternative forced-choice
test, each item is composed of two item components (e.g., personality adjectives) that
pertain to different latent dimensions/traits. Respondents are asked to select the component
The 76th Annual and the 17th International Meeting of the Psychometric Society Page 353
that they consider the best description of their personality. Traditional scoring counts the
number of (positive and negative) components selected for each dimension and leads to
compositional (or ipsative) data from which it is hard to deduce between-subject
information. In contrast, the multi-unidimensional pairwise preference (MUPP) model can
convey between-subject information (Stark, Chernyshenko, & Drasgow, 2005). Leenen,
Ponsoda, de la Torre, and Romero (2010) have recently reconsidered the MUPP model
within a Bayesian framework, and proposed a Markov chain Monte Carlo (MCMC)
estimation procedure for the parameters.
In this study, we investigate how the design of the test relates to the quality of parameter
recovery (based on MUPP and the MCMC procedure). In particular, we design a simulation
study, where the following factors are varied: (a) test length, (b) the number of latent traits
measured, (c) the number of different components per dimension, (d) the difference
between (the location parameters of) the components in a pair, and (e) the proportion of
unidimensional pairs (i.e., with both components from the same dimension) in the test.
The correspondence between true and estimated parameter values is evaluated using several
goodness-of-recovery statistics and compared across the conditions of the simulation
design.
The Confirmatory Multidimensional Generalized Graded Unfolding Model
Parallel Session: Multidimensional Item Response Theory – Methodology; Friday, 22
July, 9:20 a.m. -- 10:40 a.m.; D1-LP-06
Shiu-Lien Wu*, National Chung Cheng University, Taiwan
Wen Chung Wang, The Hong Kong Institute of Education, Hong Kong
Most of existing unfolding IRT (item response theory) models for Likert items are
unidimensional. When there are multiple tests of Likert items, or when a Likert item
measures more than one latent trait simultaneously, unidimensional unfolding models
become inefficient or inappropriate. To resolve this problem, we developed the
confirmatory multidimensional generalized graded unfolding model, which is a
multidimensional extension of the generalized graded unfolding model (Roberts, Donoghue,
& Laughlin, 2000), and conducted a series of simulations to evaluate its parameter recovery.
The simulation study demonstrated that the parameters of the new model can be recovered
fairly well with the R package R2WinBUGS and computer program WinBUGS. The Tattoo
Attitude Questionnaires with 3 scales of Likert items were analyzed to demonstrate the
advantages of the multidimensional model over the unidimensional model. The results
showed that the multidimensional model had a better fit than the unidimensional one (log
PsBF = 27.2); the multidimensional model yielded higher reliability estimates (.92, .89, .83)
for the 3 latent traits than the unidimensional one (.84, .85, .83); and the multidimensional
The 76th Annual and the 17th International Meeting of the Psychometric Society Page 354
model yielded higher correlation estimates among the 3 latent traits (.20 ~ .84) than the
unidimensional model (.04 ~ .30).
Pairwise Modeling Method for Longitudinal Item Response Data
Parallel Session: Multidimensional Item Response Theory – Methodology; Friday, 22
July, 9:20 a.m. -- 10:40 a.m.; D1-LP-06
Jian Tao*, Northeast Normal University, China
Zhi-Hui Fu, Shenyang Normal University, China
Ning-Zhong Shi, Northeast Normal University, China
Nan Lin, Washington University in Saint Louis, USA
Multidimensional item response theory (MIRT) models can be applied to longitudinal
educational surveys where a group of individuals are submitted to different tests over time
with some common items. However, computational problems typically arise as the
dimension of the latent variables increases. This is especially true when the latent variable
distribution cannot be integrated out analytically, as with MIRT models for binary data. In
this article, based on the pseudo-likelihood theory, we propose a pairwise modeling strategy
to estimate item and population parameters in longitudinal studies. Our pairwise method
effectively reduces the dimensionality of the problem and hence is applicable to
longitudinal IRT data with high-dimensional latent variables, which are challenging for
classical methods. And in the low-dimensional case, our simulation study shows that it
performs comparably with the classical methods. We further illustrated the implementation
of the pairwise method using a development study of mathematics levels of junior high
school students.
Random Item MIRID Modeling and its Application
Parallel Session: Multidimensional Item Response Theory – Methodology; Friday, 22
July, 9:20 a.m. -- 10:40 a.m.; D1-LP-06
Yongsang Lee*, UC Berkeley, USA
Mark Wilson, University of California at Berkeley, USA
The MIRID (Model with Internal Restrictions on Item Difficulty; Butter, 1994) model has
been found to be useful for investigating cognitive behavior in terms of the underlying
cognitive processes that lead to that behavior. The main objective of the MIRID model is to
enable one to test how component processes influence the complex cognitive behavior in
terms of the item parameters. The original MIRID model is indeed a fairly restricted model
for a number of reasons. One of these restrictions is that the model treats items as fixed and
thus does not fit measurement contexts where the concept of the random items is needed.
The 76th Annual and the 17th International Meeting of the Psychometric Society Page 355
This paper proposes random item approaches to the MIRID model, and describes both
simulation and empirical studies to test and illustrate the random item MIRID models.
Are there any Consequences of using Unidimensional IRT on a Multidimensional
Test?
Parallel Session: Multidimensional Item Response Theory – Methodology; Friday, 22
July, 9:20 a.m. -- 10:40 a.m.; D1-LP-06
Marie Wiberg*, Umeå University, Sweden
Achievement tests which measure more than one ability are sometimes modeled with
unidimensional item response theory (UIRT) although it is known that they are
multidimensional. The aim with this paper was to examine if there are any consequences of
using UIRT on a multidimensional college admission test. The test consist of five subscales
and can be divided into two sections, i.e. it can be considered either as a 1D(imension) test
(one test score is given), a 2D test (a verbal and a quantitative section) or as a 5D test (five
subscales). The real test was examined using both UIRT and multidimensional IRT (MIRT).
Further, simulations were used to examine item and ability parameter recovery when the
unidimensionality assumption was violated and if overspecified or misspecified
multidimensional models were used.
The result from the real test indicated that using UIRT for each section gave the smallest
amount of bias, followed by using 2D MIRT models. The largest bias was obtained when
using the 5D MIRT model. In the simulations, the item parameter recovery for
multidimensional items had more bias if the MIRT models used were slightly misspecified
compared with using UIRT models. When a test contained two sorts of unidimensional
items together with 2D items the 3D MIRT model yielded less bias than to use the correct
specified 2D MIRT model. In conclusion, UIRT models can be useful to use with
multidimensional tests, especially when it is problematic to specify which dimensions an
item belong to.
Evaluating the Quality of Rater-Mediated Assessments with a Multi-Method
Approach
Parallel Session: Rasch Models - Applications in Ability Measures; Friday, 22 July,
9:20 a.m. -- 10:40 a.m.; D1-LP-07
Amy Hendrickson*, The College Board, USA
George Engelhard, Jr., Emory University, USA
The purpose of the study is to describe methods for examining the quality of ratings
obtained on Advanced Placement (AP) exams. All of these exams include constructed
The 76th Annual and the 17th International Meeting of the Psychometric Society Page 356
response (CR) tasks that require scoring by raters. Given the importance, visibility, and
influence of the AP program, it is essential that the ratings meet a high level of
psychometric quality.
Data from current reader-reliability studies are used to illustrate a multi-methods approach
for analyzing ratings on the AP exams. Both Generalizability and Rasch measurement
theory are used to evaluate the quality of ratings. This study focuses on two AP exams:
English Language and Composition and Statistics. These exams include quite different
types of rater-mediated tasks – essays versus mathematical word problems and different
numbers of tasks – 3 versus 6. The level of rater consistency, thus, would be expected to be
quite different across these exams.
Both Generalizability Theory (implemented with GENOVA) and multifaceted Rasch
measurement (MFR; implemented with the Facets computer program) are used to assess
and compare the rater functioning across the tasks on these exams. Several earlier studies
(Engelhard and Myford, 2003; Wolfe, Myford, Engelhard, and Manalo, 2007) examined
features of the AP exam processes with MFR models. In addition, rater consistency is
regularly assessed for the AP exams using Generalizability Theory. This study compares
and contrasts the results from both approaches, and it provides a rich picture of how to
evaluate the quality of the ratings within these two measurement theories. This research
helps inform best practices in exam development, rater training, and scoring methodologies
for large-scale rater-mediated assessments.
Investigating Item Difficulty Change by Item Positions under the Rasch Model
Parallel Session: Rasch Models - Applications in Ability Measures; Friday, 22 July,
9:20 a.m. -- 10:40 a.m.; D1-LP-07
Luc T Le*, Australian Council for Educational Research, Australia
Van Nguyen, Australian Council for Educational Research, Australia
In operational testing programs using item response theory (IRT), item parameter
invariance is one of essential requirements in common item equating designs. However, in
practice, the stability of item parameters can be affected by many factors. Particularly, this
study utilised data from the large-scale Graduate Skills Assessment (GSA) in 2010 to
investigate the change of Rasch item difficulty by item positions. The test included 78
multiple-choice items and was presented in eight test forms by arranging the items in
different orders. Items addressed three components of generic skills: Critical Thinking,
Problem Solving and Interpersonal Understandings. Each test form was randomly
admistered to about 8000 Colombian university students in November 2010. In the cohort
there were roughly equal numbers of males and females.
The 76th Annual and the 17th International Meeting of the Psychometric Society Page 357
For each component, a three-faceted Rasch model was applied to evaluate the variation of
test form difficulty and item difficulty estimates by these forms. Then for each item, the
difference of item difficulty etsimates from each pair of the forms was examined in relation
to the position difference of the item in the forms.
Findings showed that there was a small variation in the test form difficulty. However, in
general, items themselves became more difficult when they were located towards the end of
the test. The change of the item difficulty correlated significantly with the corresponding
change of its position in the test. Moreover, the correlation was highest for Problem Solving
items and lowest for Interpersonal Understandings items. The correlations were higher for
males than for females.
A Mixed-Methods Approach for Exploring the Accuracy of Writing Self-Efficacy
Judgments
Parallel Session: Rasch Models - Applications in Ability Measures; Friday, 22 July,
9:20 a.m. -- 10:40 a.m.; D1-LP-07
George Engelhard*, Emory University, USA
Nadia Behizadeh, Emory University, USA
The purpose of this study is to describe a mixed-methods approach for examining accuracy
of student judgments regarding their writing self efficacy. A mixed-methods approach is
used in this study that includes: (1) calibration of a writing self-efficacy scale with a Rasch
measurement model, (2) identification of discrepancies between writing self-efficacy
judgments and teacher grades, and (3) detailed qualitative analyses (observations and
interviews) to increase our understanding of the relationships among these variables.
Accuracy is defined as the congruence and match between student confidence regarding
writing (writing self-efficacy) and the actual performance on these writing skills as reflected
in teacher grades (achievement). Eighth grade students in two classrooms (N=109) from a
school located in a major southeastern city in the United States are included in the study.
The Writing Self-Efficacy Scale is adapted from Pajares, Miller, & Johnson (1999), and it
consists of 15 items with a nine-category rating scale. Rasch analyses were conducted with
the Facets computer program (Linacre, 2007). The analyses indicate that students with
higher writing self-efficacy tend to have higher teacher grades in writing, and that boys
have slightly higher writing self-efficacy than girls. The analyses identified a small ordinal
interaction between gender and teacher grades with boys who receive grades of B tending to
be less accurate than girls with B grades. The qualitative analyses illustrate and support the
results of the quantitative analyses. This study combines Rasch analyses with qualitative
methods to obtain to deeper understanding of student confidence and accuracy related to
writing.

The 76th Annual and the 17th International Meeting of the Psychometric Society Page 358
Implementing a New Selection Model across 27 European Countries
Parallel Session: Rasch Models - Applications in Ability Measures; Friday, 22 July,
9:20 a.m. -- 10:40 a.m.; D1-LP-07
Markus Nussbaum*, European Personnel Selection Office, Belgium
Gilles Guillard, European Personnel Selection Office, Belgium
The European Personnel Selection Office (EPSO) delivers a staff selection service on behalf
of the Institutions of the European Union. For each selection process candidates from the 27
member states are assessed in order to select the best for possible recruitment as EU
Officials within the Institutions.
In 2008, EPSO initiated a major overhaul of its selection processes under the EPSO
Development Programme (EDP). From a psychometric point of view the key feature was
the shift from knowledge based to competency based assessment. The full document is
available here: http://europa.eu/epso/doc/edp_11_2010.pdf.
In March 2010, the first competition for graduates under this model was launched and a
total of 37,348 candidates were assessed against several competencies, including verbal,
numerical and abstract reasoning. All of these competencies were measured through
computer-based tests consisting of 20 items in verbal reasoning and 10 items each in
numerical and abstract reasoning. The verbal and numerical reasoning items were drawn
randomly from a database of approximately 2800 Rasch-compliant items in English, French
and German, which the candidates undertook in their second language. In abstract reasoning
there were 10 test forms with items compliant with the 2PL model and confirmed to be
compliant with the Rasch model as well.
The challenges in implementing the new selection model were to ensure fair and equal
treatment across the 27 member states with different cultures, education systems and 23
different languages. By applying a carefully selected mix of assessment methods and sound
psychometrics, EPSO can ensure equal opportunities for all candidates.
Rasch Modeling of a Mindful Learning Scale
Parallel Session: Rasch Models - Applications in Ability Measures; Friday, 22 July,
9:20 a.m. -- 10:40 a.m.; D1-LP-07
Zhenlin Wang*, The Hong Kong Institute of Education, Hong Kong
Christine, X. Wang, University at Buffalo, USA
Understanding the nature of teaching and learning is vital for self-regulated learners (Frye
& Wang, 2008). Children’s understanding of teaching and learning goes through a
transformation during early years: preschoolers often see teaching and learning as doing
The 76th Annual and the 17th International Meeting of the Psychometric Society Page 359
without mental involvement; only with the acquisition of theory of mind, the ability to make
mental state reasoning, do children start to comprehend that teaching and learning are
mental activities that involve intention and knowledge change, and become mindful learners.
To help understand this developmental path, we investigated children’s understanding of
mindful learning using Rasch modeling. Sixteen short stories were drawn from previous
studies (Frye & Ziv, 2005; Wang, 2010; Ziv & Frye, 2004) to assess children’s understating
of intention and knowledge change in teaching and learning. Ninety-seven children from an
east coastal U.S. city participated in this study, with mean age of 61.8 months. All children
finished a theory of mind scale (ToM), a receptive language ability test (PPVT), an
expressive language ability test (EVT), and the 16-item mindful learning scale. Rasch
modeling of the mindful learning scale found that all items fit the scale well with fit
statistics within -2 to +2. The item difficulty levels confirmed the theoretical prediction of
the difficulty sequence. Suggestions are made based on the Rasch modeling on selecting
items from the 16 stories to form a usable mindful learning scale for researchers and
educators alike to measure children’s developmental level. The relation among children’s
theory of mind ability, language ability, and mindful learning is discussed.
Transformation Structural Equation Models for Analyzing Highly Non-normal Data
Parallel Session: Structural Equation Modeling - Methodology II; Friday, 22 July,
9:20 a.m. -- 10:40 a.m.; D1-LP-08
Xinyuan Song*, The Chinese University of Hong Kong, Hong Kong
Zhaohua Lu, The Chinese Univesity of Hong Kong, Hong Kong
In behavioral, social, and psychological sciences, the most widely used models in assessing
latent variables are structural equation models (SEMs). When analyzing SEMs with
continuous variables, most existing statistical methods and software have been developed
based on the crucial assumption that the response variables are normally distributed with
constant variances. Although some recently developed parametric and nonparametric
methods can partially address the violation of this assumption, they encounter serious
difficulties in handling data with extremely non-normal distributions, such as highly skewed,
U-shaped, and other irregular distributions. The transformation model is a useful tool for
building a relationship between response variables and a bundle of explanatory variables,
which will allow the resulting model to justify the model assumptions and thus produce
more reliable results. One problem with the parametric transformation model is that the
choice of transformation is usually restricted to the power or shifted power family. The
limited flexibility of this parametric family could cause important features of the
distribution to be missed. A more comprehensive approach is to estimate the transformation
in a nonparametric way. We aim to develop a semiparametric transformation SEM.
The 76th Annual and the 17th International Meeting of the Psychometric Society Page 360
Nonparametric transformation functions are modeled with Bayesian P-splines. Markov
chain Monte Carlo algorithms are implemented to estimate transformation functions and
unknown parameters in the model. The proposed methodology is applied to a real study on
polydrug use.
Examination of Robustness of Heterogeneity of Residual Variance in Mediation Effect
with Categorical Exogenous Variable
Parallel Session: Structural Equation Modeling - Methodology II; Friday, 22 July,
9:20 a.m. -- 10:40 a.m.; D1-LP-08
Heining Cham*, Arizona State University, USA
Jenn-Yun Tein, Arizona State University, USA
Mediation is defined as the the causal relation of variable X on outcome Y accounted for by
mediator M (e.g., Baron & Kenny, 1986; MacKinnon et al., 2002, 2007; Shrout & Bolger,
2002). SEM framework provides a general representation of mediation models. A common
mediation model is that variable X is categorical (e.g., gender, experimental groups). Very
often, coding variable (e.g., dummy/effect codings) is used to represent categorical X,
which assumes homogeneity of residual variances of M and Y among all categories of X.
The use of coding variable of X impedes researchers to detect the violation of this
assumption by examining global fit indices (e.g., RMSEA and CFI), modification indices,
and outlier diagnostics (e.g., Cook's D, influence).
This works has two purposes. First, a simulation study is conducted to examine the
robustness of the violation of homogeneity of residual variances of M and Y across
categories of X in the mediation model. Relative bias of path coefficient estimates, relative
bias of standard errors, coverage rate the percentile bootstrap confidence interval of the
mediation effect, and Type-I error rate of the significance test of the mediation effect are
investigated.
Second, multi-group SEM is proposed to establish the mediation model with allows the
heterogeneity of residual variances of M and Y. Under this framework, researchers can also
uses multivariate significance tests (Wald/likelihood ratio test), global fit indices, and
outlier diagnostics. Such advantages over the coding variable framework is investigated in
the simulation study and demonstrated with a real example.
A Poor Person's Posterior Predictive Checking of Structural Equation Models
Parallel Session: Structural Equation Modeling - Methodology II; Friday, 22 July,
9:20 a.m. -- 10:40 a.m.; D1-LP-08
Taehun Lee*, University of California at Los Angeles, USA
Li Cai*, University of California at Los Angeles, USA
The 76th Annual and the 17th International Meeting of the Psychometric Society Page 361
Posterior Predictive Model Checking (PPMC) is a Bayesian method for assessing the
compatibility of a posited model to data by comparing the observed data to (plausible)
future observations simulated from the posterior predictive distribution. The PPMC method
is predicated upon the idea that, if the model fit is reasonable, future observations should
look “similar” to the observed data. In the present paper, we propose a Poor Person's
version of the PPMC (hereafter PP-PPMC) wherein the posterior distribution of model
parameters is replaced by a multivariate normal distribution with its center equal to the
MLE of parameters, and a dispersion matrix equal to the inverse of the information matrix.
PP-PPMC can be considered as an alternative to PPMC when one cannot afford (or is
unwilling) to draw samples from the full posterior. Using only byproducts of
likelihood-based estimation, the PP-PPMC offers a natural way of handling parameter
uncertainty in model assessment, without resorting to asymptotic arguments (cf. likelihood
ratio chi-square), and without further model-refitting (cf. parametric bootstrap). The
proposed method can also be effective in outlier detection (cf. Cook’s distance).
Through simulation studies and real data analysis, we explore the viability of the PP-PPMC
method in the context of structural equation modeling by employing various existing fit
indices as discrepancy measures. In particular, distributions of tail-area probabilities of
discrepancy measures are carefully examined under varying degrees of model
mis-specifications for the purposes of drawing practical recommendations about the
PP-PPMC method.
A New Family of Model Fit Indices in Confirmatory Factor Analysis: Information
Complexity (ICOMP) Criteria
Parallel Session: Structural Equation Modeling - Methodology II; Friday, 22 July,
9:20 a.m. -- 10:40 a.m.; D1-LP-08
Hongwei Yang*, The University of Kentucky, USA
Eylem Deniz, Mimar Sinan Fine Arts University, Turkey
Hamparsum Bozdogan, The University of Tennessee, USA
This study adds to the literature of model selection in confirmatory factor analysis (CFA) by
introducing a new family of model selection criteria called information complexity criteria,
or ICOMP. CFA tests hypotheses about the relationship between items and factors specified
using a priori model structure. A critical question in CFA is the choice of a champion model
from several competing models that provides a good fit to the data. Such a model
assessment and selection process should be primarily based on substantive, theoretical
considerations. Besides, statistical fit indices complement theoretical justifications when
evaluating competing models. Multiple model fit indices assess the fit of a CFA model from
The 76th Annual and the 17th International Meeting of the Psychometric Society Page 362
multiple perspectives. Among them are information criteria (AIC, CAIC, AICC, etc.), a
special case of relative fit criteria. ICOMP belongs to the group of information criteria.
Similar to other criteria, ICOMP takes the form of a penalized log likelihood function plus a
component that punishes model complexity. However, ICOMP is capable of taking into
account more aspects of the model than other criteria when assessing model complexity:
Inter-dependency of parameter estimates as well as number of model parameters, sample
size for model estimation, etc. Such a more comprehensive approach has been successful in
numerous applications, but its application to CFA has been limited so far. Therefore, this
study examines the performance of ICOMP in CFA through large scale simulations.
ICOMP criteria are compared with other well-established criteria in terms of the number of
times the true model is identified under varying modeling conditions.
MetaSEM: An R package to Conducting Meta-Analysis using Structural Equation
Modeling
Parallel Session: Structural Equation Modeling - Methodology II; Friday, 22 July,
9:20 a.m. -- 10:40 a.m.; D1-LP-08
Mike W.-L. Cheung*, National University of Singapore, Singapore
Meta-analysis and structural equation modeling (SEM) are usually treated as two unrelated
statistical techniques in the literature. Recently, it has been shown how meta-analysis can be
integrated into the general SEM framework (Cheung, 2008; Cheung & Chan, 2005; 2009).
metaSEM is an R package that conducts meta-analysis via OpenMx, a flexible SEM
package. metaSEM can be used to conduct: (1) fixed- and random-effects univariate and
multivariate meta-analysis; (2) fixed- and random-effects meta-analytic structural equation
modeling (MASEM) on correlation/covariance matrices. This talk will illustrate with
examples on how to conduct univariate and multivariate meta-analysis and MASEM with
the metaSEM package. Future development will also be discussed.
Power and Robustness Analysis of Multilevel Modeling of Longitudinal Growth
Parallel Session: Longitudinal Data Analysis; Friday, 22 July, 9:20 a.m. -- 10:40 a.m.;
D2-LP-08
Lihshing Wang*, University of Cincinnati, USA
When a non-random cluster design involves two or more groups where pretesting is
possible but randomization is not, three common statistical procedures exist for modeling
the treatment effects: Analysis of Covariance (ANCOVA), Repeated-Measures Analysis of
Variance (RMANOVA), and Multilevel Longitudinal Growth Analysis (MLGA). MLGA

The 76th Annual and the 17th International Meeting of the Psychometric Society Page 363
represents an appealing choice because it can produce unbiased results even when the data
are unbalanced in time and/or contain missing observations.
The present study provides simulation evidence to support the use of multilevel longitudinal
growth analysis in a non-random cluster design. Specifically, Type I error rate and power
under different simulation conditions (distributional assumptions, sample size, and
missingness) are compared across the three modeling approaches ANCOVA, RMANOVA,
and MLGA. Normality and compound symmetry (including sphericity) assumptions were
manipulated at two levels (met vs. not met). Cell sample size was manipulated at three
levels (30, 100, and 500). Missingness was manipulated at two levels (complete vs. missing
50% at random on posttest). The experiment was replicated 1000 times to calculate the
power at alpha = .1, .05, and .01.
Results suggest that within the current simulation framework, RMANOVA is more
powerful than ANCOVA in detecting true effects, but the evidence of MLGA over
RMANOVA is less compelling in a pre-post test design with only two time points. We
conclude that multiple analytical approaches should be tested for convergence; when
contradictory conclusions are found, judicious choice of the analytic method should be
based on the data structure resulting from non-random clustering.
A Joint Model for Selection Bias and Measurement Error
Parallel Session: Longitudinal Data Analysis; Friday, 22 July, 9:20 a.m. -- 10:40 a.m.;
D2-LP-08
Chueh-An Hsieh*, National Sun Yat-sen University, Taiwan
There has been a growing interest in observational studies in the use of propensity score
methods for estimating treatment effects and policy evaluation. Propensity score analysis is
a statistical technique which can be used to estimate causal effects, reduce bias, increase
precision, and statistically mimic randomization for an observational study. Thus, in the
present study we implement the propensity score approach, and demonstrate its application
within a unified latent growth curve modeling framework using data from the Longitudinal
Study of American Youth (LSAY; Miller, Kimmel, Hoffer, and Nelson, 2000). That is, as a
simple demonstration, a longitudinal analysis was conducted to evaluate the influence of
ability grouping and assess the corresponding changes in pupils’ belief in their self-efficacy.
It is expected that, through this extended case study, we can as intended demonstrate the
breadth of the propensity score method, and address the issues of selection bias and
measurement error in a more general analytic framework.
Fitting the Linear Mixed Models into the CLS Data with both Static and Dynamic
Predictors
The 76th Annual and the 17th International Meeting of the Psychometric Society Page 364
Parallel Session: Longitudinal Data Analysis; Friday, 22 July, 9:20 a.m. -- 10:40 a.m.;
D2-LP-08
Ji Hoon Ryoo, University of Nebraska, USA
Arthur J. Reynolds*, University of Minnesota, USA
Growth in Iowa Test of Basic Skills (ITBS) reading and mathematics achievement scores
from kindergarten to 8th grade were studied in 1,539 Chicago public school students who
are at risk of educational and social difficulties due to economic disadvantage and are
participants in the Chicago longitudinal study (CLS). We fit linear mixed models (LMM)
into the longitudinal achievement data within a variety of functional forms of time variable
including conventional polynomial model, trigonometric model, and fractional polynomial
model. In addition to the variety of functional forms to time variable, it will be discussed
how to model the change of scores when data include both static and dynamic predictors,
where the static predictor is time-independent covariate and the dynamic predictor is
time-dependent covariate. Instead of converting dynamic predictor to static predictor that
has often been done in practice, we consider dynamic predictor as it is in the analysis. This
study not only helps to document the patterns of students’ achievement in CLS but also
provides a unified framework on selecting a LMM for longitudinal achievement data when
both static and dynamic predictors are present.
Lord's Paradox and the Use of Growth and Value-Added Models for School
Accountability
Parallel Session: Longitudinal Data Analysis; Friday, 22 July, 9:20 a.m. -- 10:40 a.m.;
D2-LP-08
Andrew Ho*, Harvard Graduate School of Education, USA
When comparing the pretest-posttest differences between treatment and control groups, a
gain-score analysis and the analysis of covariance (ANCOVA) can yield conflicting results,
even as these analytic approaches seem to address the same research question. This paradox
was posed by Lord (1973) and clarified by Holland and Rubin (1983) in a formal causal
model that identifies two distinct counterfactual assumptions. In this paper, I describe how
similarly contrasting analytic approaches are used to support school accountability decisions
in the United States. On the one hand, a "trajectory model" extends a student's gain score
into the future and evaluates whether a future standard will be achieved. On the other hand,
a "prediction model" uses a regression equation to predict whether the standard will be
achieved in the future. The U.S. Department of Education classifies both as "growth
models" and is encouraging their proliferation under a recent federal funding competition
known as Race to the Top.
The 76th Annual and the 17th International Meeting of the Psychometric Society Page 365
The contrasts between these models are stark and are well informed by Lord's original
paradox and the Holland-Rubin causal model that disentangles it. I establish the extent to
which the models will disagree under common data structures, and I articulate the
assumptions that underlie their classification as "growth models.” The analysis extends to
multiple waves of data, where growth trajectories may be estimated across multiple points,
or a prediction equation can be estimated with multiple prior years. Finally, I discuss the
implications of Lord's paradox for models that estimate the "value added" of teachers and
schools.
Measurement Invariance in Longitudinal Data with a Developmental Latent Trait
over Time
Parallel Session: Longitudinal Data Analysis; Friday, 22 July, 9:20 a.m. -- 10:40 a.m.;
D2-LP-08
Ji Hoon Ryoo*, University of Nebraska, USA
In longitudinal data, the primary goal is to understand the change in a latent trait by
modeling observable indicators of the latent trait. In the process of estimating latent trait
scores from observable behavior, it is often assumed that the measurement providing the
observed variables is invariant over time. However, it has been discussed in the
measurement invariance literature that true measurement invariance is often rejected if the
premise is formally tested. The methodology for testing the invariance assumption using the
factor analysis (FA) has been available for over two decades; however, it has been focused
on testing measurement invariance at test-level while the testing result is mainly affected by
invariance at item-level. On the other hand, the item response theory (IRT) includes same
characteristics as FA, i.e., to investigate a latent trait by modeling observable indicators of
the latent trait. In addition, the equivalence at some classes of models was proved by
Takane and de Leeuw (1987), though there are additional classes in IRT models such as the
three-parameter logistic model (Millsap, 2010). In spite of advantages of IRT approach,
there are still many issues to unify the testing procedure. One of those issues would be the
existence of development on the latent trait measured over time. In this study, I examine
measurement invariance in longitudinal data measured by Test of Early Mathematics
Ability, 3rd ed. (TEMA-3) and discuss testing procedure when the development of the
latent trait is present.
Investigation and Validation of College Student Well-Being Property Scale
Parallel Session: Test Development and Validation - Nonability Measures I; Friday, 22
July, 9:20 a.m. -- 10:40 a.m.; D2-LP-09
Wei-Hao Chiang*, National Sun-Yat-sen University, Taiwan
The 76th Annual and the 17th International Meeting of the Psychometric Society Page 366
Zuway-R Hong, National Sun-Yat-sen University, Taiwan
The purposes of this study were to validate an instrument of College Student Well- being
Property Scale (CSWPS) and to investigation grade level, school, major, income, out-school
activity, and gender differences in Taiwan’s college students’ well-being properties. A total
of 130 college students completed CSWPS in 2011. Factor analyses, correlation analyses,
t-tests, and ANOVAs were conducted to compare the similarities and differences among
male and female students in different grade levels, schools, majors, income, and out-class
activities. The initial findings were as follows: the CSWPS indicated has an adequate
construct validity and internal reliability, eight components together accounted for 70.90%
of the variance;the internal consistency of the total items was found a high
Cronbach’sαof .92; there were non-significantly difference on the total scores of CSWPS;
junior students had significantly higher scores on negative emotion, life satisfaction and
communication than their sophomore counterparts; private college students had
significantly higher scores on autonomous, academic/out-class activity and communication
than their public college student counterparts; students who were majored in human and
social science had significantly higher scores on positive emotion, and life satisfaction than
those students who were majored in science and technology; high income college students
had significantly higher scores on life satisfaction and academic/ out-class activity than
these low income counterparts. Implication and limitation of these findings are provided
and discussed.
On the Test-Retest Reliability of the 100-item IPIP Scales: Differential Temporal
Stability of the Big Five Personality Traits
Parallel Session: Test Development and Validation - Nonability Measures I; Friday, 22
July, 9:20 a.m. -- 10:40 a.m.; D2-LP-09
Luning Sun*, University of Cambridge, UK
Michal S. Kosinski, University of Cambridge, UK
David J. Stillwell, University of Nottingham, UK
John N. Rust, University of Cambridge, UK
The 100-item IPIP scales (Goldberg, 1999) are commonly used to measure the NEO-PI-R
five-factor model (Costa & McCrae, 1992). The present study aims at examining the
temporal stability of the Big Five personality traits by analyzing the test-retest reliability of
the 100-item IPIP scales. A large
sample of IPIP data was collected via the Facebook application 'myPersonality', of which
78,053 participants completed the questionnaire at least twice, with time intervals ranging
from 1 day to 2 years. Test-retest correlations of all five personality domains are reported

The 76th Annual and the 17th International Meeting of the Psychometric Society Page 367
for the intervals of increasing days and weeks from 1 day to 3 months after the initial
administration. In order to control the effect of transient error, the correlation coefficients
for intervals greater than 1 week are compared
with those for the first week, and resulted in different onsets of stabilized significant
differences across personality traits. Accordingly, personality changes are shown to occur
after different intervals across the five domains, suggesting differential temporal stability of
the Big Five personality traits. Moreover, regression analyses reveal a gradual decay in the
test-retest reliability at different speed across the five domains. Finally, a number of factors
that might have an effect on the test-retest reliability are investigated, including the
personality scores, the retest interval, the internal consistency of the scales, and the number
of times the test has been taken before. Based on the results, an algorithm to predict the
test-retest reliability is proposed and discussed.
Mathematics Anxiety Scale for Filipino Students (MAS-FS): Reliability, Validity,
and Bias Detection
Parallel Session: Test Development and Validation - Nonability Measures I; Friday, 22
July, 9:20 a.m. -- 10:40 a.m.; D2-LP-09
Josefina Almeda*, University of the Philippines, Philippines
Many foreign-made instruments are found in the literature measuring Mathematics anxiety.
However, the manner how these items were written is not the same as how Filipinos write
items using the English language. Thus, an affective scale for Mathematics Anxiety was
developed to measure the level of Math anxiety of Filipino students (MAS-FS). The
objectives of the study were to test the reliability and validity of the instrument, extract
underlying constructs, and determine if items are free from gender and course bias.
Initially, two parallel forms consisting of 30-items each were developed. Then, the items
from the two forms were combined and administered to 180 college students. The combined
form was tested for internal consistency reliability using Cronbach’s alpha coefficient and
was found to be reliable with a coefficient of 0.969. The researcher tested the reliability of
the parallel forms and both were internally consistent reliable with Cronbach’s coefficient
of 0.939 and 0.940. The two forms were valid using principal component factor analysis.
Three factors were both extracted from the two forms: Attitude towards Math, Feeling
towards Math, and Experience with Math. For item bias detection, chi-square and ordinal
logistic regression were used. Some items in the MAS-FS display differential item
functioning. Undergraduate male and female students do not differ significantly in their
perspectives in answering the 30-item MAS-FS. Sciences and Social Science Courses have
different perspectives in answering several items of the instrument. The models
The 76th Annual and the 17th International Meeting of the Psychometric Society Page 368
demonstrate that subgroup sex and course have significant effect in answering the items of
MAS-FS.
Development and Validation of College Students Perception toward Parenting
Practice Scale
Parallel Session: Test Development and Validation - Nonability Measures I; Friday, 22
July, 9:20 a.m. -- 10:40 a.m.; D2-LP-09
Dong-Ting Zou*, National Sun Yat-sen University, Taiwan
Zuway-R Hong, National Sun Yat-sen University, Taiwan
The research reported in this study focuses on the development and validation of an
instrument of College Students’ Perception toward Parenting Practice Scale (CSPPPS). The
investigator-developed 30-item of CSPPPS was modified and derived from “parenting
styles scale” (Shiuejen, 1996). A total of 101 college students were randomly selected from
a large sample size university in Southern Taiwan. All participants completed the CSPPPS
in early spring 2011. Factor analyses, expert validity and internal consistency analyses were
conducted to assess its reliability and validity. The initial findings were as follows: father’s
version of CSPPPS indicated an adequate construct validity and internal reliability, two
components (i.e., request and response) together accounted for 57.47% of the variance;the
internal consistency of the total items was found a high Cronbach’s α of .94; mother’s
version of CSPPPS also indicated an adequate construct validity and internal reliability, two
components (i.e., request and response) together accounted for 55.25% of the variance;the
internal consistency of the total items was found a high Cronbach’s α of .92. The present
findings were coherent with Maccoby and Martin’s study (1983). Implications and
discussions of findings were provided and discussed.
Text Classification Frameworks for PTSD Screening Using N-Grams
Parallel Session: Test Development and Validation - Nonability Measures I; Friday, 22
July, 9:20 a.m. -- 10:40 a.m.; D2-LP-09
Qiwei He*, University of Twente, Netherlands
Bernard Veldkamp, University of Twente, Netherlands
The development of health information technology demonstrated breakthroughs on quality,
continuity, and efficiency of health care during the past decade. One such promising
application is the use of natural language processing to identify the clinical information
contained in unstructured free text documents and to codify the qualitative data into
structuralized quantitative data. This paper explored the benefits of using N-grams for the
The 76th Annual and the 17th International Meeting of the Psychometric Society Page 369
classification of patients’ self narratives in screening for posttraumatic stress disorder
(PTSD) within the text mining system.
Unlike the traditional face-to-face structured interviews with itemized questionnaires,
respondents were asked to write down their stories and symptoms online. Based on a
collection of 300 self narratives, we developed three text classification frameworks using
two standard machine learning algorithms, Decision Tree and Naïve Bayes, and one
self-designed classification model named Product Score. Feature selection was performed
using the Chi-square feature selection algorithm on a word-based space composed of
unigrams, bigrams, trigrams and mixture of N-grams.
With the sample in hand, the baseline unigram representation in conjunction with the
Product Score model performed the most effective and kept the highest consistency with
psychiatrists’ diagnoses. It was also notable that the classification accuracy was not
enhanced significantly when a more complex mixture of N-grams was used, though the
sensitivity and specificity were resulted in a more balanced way. This pilot study
demonstrated that the text mining technique was very efficient in screening for PTSD and
would be promising to be applied to a broader scope in education, psychology and
epidemiology research.
Computerized Classification Testing under the Higher-Order Polytomous IRT Model
Parallel Session: Computerized Adaptive Testing; Friday, 22 July, 9:20 a.m. -- 10:40
a.m.; D2-LP-10
Kung-Hsien Lee*, National Chung Cheng University, Taiwan
Wen Chung Wang, The Hong Kong Institute of Education, Hong Kong
Latent traits in the human sciences may have a hierarchical structure, for example, a
second-order latent trait “language proficiency” covers four first-order latent traits: listening,
speaking, reading, and writing. The higher-order IRT model has been developed to account
for tests measuring hierarchical latent traits. Being an IRT model, computerized
classification testing (CCT) and computerized adaptive testing (CAT) under the
higher-order IRT model can be developed. In this study, we focused on the development of
CCT algorithms. Specifically, item responses on the first-order latent traits were assumed to
follow the generalized partial credit model. The current-estimate approach was adopted for
item selection and the ability-confidence-interval approach was adopted for classification.
The results of simulation showed that the CCT algorithms were efficient; the higher
correlation between the first-order latent traits, the more points each item had, the fewer
categories for classification, the more accurate and efficient the classification would be.
On-line Calibration Design for Pretesting Items in Adaptive Testing
The 76th Annual and the 17th International Meeting of the Psychometric Society Page 370
Parallel Session: Computerized Adaptive Testing; Friday, 22 July, 9:20 a.m. -- 10:40
a.m.; D2-LP-10
Usama Ali*, Universsity of Illinois at Urbana-Champaign, USA
Hua-Hua Chang, Universsity of Illinois at Urbana-Champaign, USA
Among many issues that are currently of concern for large-scale computerized adaptive
tests (CAT) program, on-line calibration is especially important. Administration of CATs
requires pre-calibrating many new items, and therefore, it is crucial to be able to calibrate
test items in large quantities efficiently and economically to maintain the operational item
bank. Most current CAT programs tackle the problem by assembling new items into several
blocks and assign the blocks to examinees. As a result, the calibration is non-adaptive. The
objective of proposed research is to investigate whether an adaptive method is more
effective than the traditional methods based on either pre-assignment or random assignment
regarding to estimation consistency and item pool management. The adaptive approach tries
to select the optimal examinees to calibrate pretest items (e.g., Stocking, 1990). To evaluate
the performance of the new design, a simulation study is performed. An item bank of a real
operational test, fitted by 3-parameter logistic model, is used. For CAT adminstration,
maximum priority index (MPI; Cheng & Chang, 2009) is used to select 12-item tests and to
satisfy their content constraints; MLE is used for scoring. Three pretest items are seeeded at
preassigned positions using the different studied designs. Multiple-cycle EM procedure is
used for estimating item parameters. Sample size and Item parameters recovery through
bias and RMSE are used as evaluation criteria. Results, discussion, and future research are
reported.
Applying Kullback-Leibler Divergence to Detect Examinees with Item Pre-Knowledge
in Computerized Adaptive Testing
Parallel Session: Computerized Adaptive Testing; Friday, 22 July, 9:20 a.m. -- 10:40
a.m.; D2-LP-10
Hsiu-Yi Chao*, National Chung Cheng University, Taiwan
Jyun-Hong Chen, National Chung Cheng University, Taiwan
Shu-Ying Chen, National Chung Cheng University, Taiwan
Test security is always an important issue in computerized adaptive testing (CAT). When
item sharing occurs, a test-taker may receive test information from previous examinees (i.e.
informants), and his/her trait estimates may be over-estimated. The purpose of this study
is to apply Kullback-Leibler divergence (KL divergence; Kullback & Leibler, 1951) to
detect examinees with item pre-knowledge in CAT. The KL divergence has been
successfully applied for cheating detection in traditional paper and pencil tests (Belov &
The 76th Annual and the 17th International Meeting of the Psychometric Society Page 371
Armstrong, 2010), and may be a good alternative for detecting examinees with item
pre-knowledge in CATs. Simulation studies were conducted to investigate the
performance of the KL divergence on cheating detection in CATs. Type I error rate and
detection power were evaluation criteria. Results indicated that under various conditions
considered in this study, examinees with item pre-knowledge can be effectively detected by
using the KL divergence.
Overestimation of Fisher information in Variable Length CATs due to Capitalization
on Chance
Parallel Session: Computerized Adaptive Testing; Friday, 22 July, 9:20 a.m. -- 10:40
a.m.; D2-LP-10
Juan Ramon Barrada*, Universidad Autonoma de Barcelona, Spain
Julio Olea, Universidad Autonoma de Madrid, Spain
Francisco J. Abad, Universidad Autonoma de Barcelona, Spain
Previous research has shown that: (a) capitalization on chance (the tendency to select items
with overestimated discrimination paramater) is present on computerized adaptive testing;
(b) this leads to a minimal decrement of estimation of trait level accuracy; (c) looses in
accuracy due to capitalization are higher at the extreme levels of theta; and (d) the estimated
Fisher information in the estimated trait level is also overestimated. Taking this into
consideration, variable length CATs whose termination criteria is estimated standard error
will apply fewer items than needed to achieve the real requested accuracy. This problem
will be illustrated with a simulation study where ratio test length/item bank size, sample size
for the estimation of item parameters, stopping criteria and item selection rules (Fisher
information, progressive and proportional methods).
Computerized Adaptive Testing and Adaptive Experimental Design
Parallel Session: Computerized Adaptive Testing; Friday, 22 July, 9:20 a.m. -- 10:40
a.m.; D2-LP-10
Yun Tang*, Ohio State University, USA
Jay Myung, Ohio State University, USA
Michael Edwards, Ohio State University, USA
Mark Pitt, Ohio State University, USA
Computerized adaptive testing (CAT) has been intensively and widely studied in
educational testing. In CAT, an adaptive sequence of test items is chosen from an item bank
so as to accurately infer the examinee’s ability level with the fewest possible items.
Recently in cognitive science, an experimental methodology dubbed adaptive experimental
The 76th Annual and the 17th International Meeting of the Psychometric Society Page 372
design (AED) has been developed under the Bayesian decision theoretic framework. The
goal of AED is to conduct a cognitive experiment such that a participant’s mental process
can accurately be inferred in the fewest possible experimental trials. Given these apparent
similarities between the two adaptive methods, it would be useful to examine what could
possibly be learned from each other, especially from the CAT side given its history of
successful real world applications. Despite the recent demonstration of its feasibility, AED
needs to overcome many challenges before being used routinely in cognitive
experimentation. For instance, the huge computational cost of AED algorithm hinders its
application in real-time experiment. In contrast, CAT has various ready-to-use toolboxes for
speeding up the necessary computations. Addressing the computational issues in AED, we
have explored the possibility of multi-stage experimentation, adopting the multi-stage
testing method in CAT. The basic idea is that instead of trial-by-trial adaptation, experiment
designs could be updated after a block of trials and the computation time between
adaptations could be used flexibly to keep participants motivated. In this paper we present
simulation results showing the advantages of the multi-stage setup in AED.
Heterogeneity in Latent Variable Models
Symposium : Friday, 22 July, 1:30 p.m. -- 2:50 p.m., D1-LP-03
Testing Statistical and Substantive Hypotheses on the Distribution of the Observed
Data Within the Generalized Linear Item Response Model
Dylan Molenaar*, University of Amsterdam, The Netherlands
Conor Dolan, University of Amsterdam, Netherlands
In the generalized linear item response model (Mellenbergh, 1994), a continuous variable, Z,
is regressed on an underlying common factor. Z can represent the approximately
continuously distributed observed data (e.g., scores on 7 or more ordinal answer categories,
or subtests scores), or a hypothetical continuously distributed variable underlying the
observed polytomous item scores (e.g., Wirth & Edwards, 2007). In both cases (observed
data are continuous or polytomous), Z is commonly assumed to be normally distributed.
This distributional assumption implies specific assumptions in the regression of Z on the
common factor. We present statistical tests on these specific assumptions and explain how
violations of these assumptions can result in heterogeneity in the data. Additionally, we
show how the resulting models are interesting from a substantive point of view. Specifically,
we demonstrate how the models can be used in the field of intelligence (to investigate
ability differentiation; Spearman, 1924), in the field of personality (to investigate
schematicity; Markus, 1977) and in the field of behavior genetics (to investigate gene by
environment interactions; van der Sluis et al., 2006).
The 76th Annual and the 17th International Meeting of the Psychometric Society Page 373
A test for Cluster Bias: Detecting Violations of Measurement Invariance Across
Clusters in Multilevel Data
Suzanne Jak*, University of Amsterdam, The Netherlands
Frans Oort, University of Utrecht, Netherlands
Conor Dolan, University of Amsterdam, Netherlands
In case of cluster bias, measurements do not represent the same construct for subjects from
different clusters. We present a test for cluster bias, which can be used to detect violations
of measurement invariance across clusters in multilevel data. Using multilevel structural
equation modeling, separate models can be formulated for the within (subject) level and
between (cluster) level covariance matrices. Cluster bias is investigated by testing whether
the factor loadings at the within and between level are equal, and the residual variance at the
between level equals zero. The test is illustrated with an example from school research.
With simulations, we investigated the performance of the test for cluster bias in terms of
detection rate, false positives and estimation bias for different sample sizes and different
magnitudes of bias. Overall, the cluster bias test has sufficient power to detect cluster bias,
and the proportions of false positives are around the chosen alpha values.
Using Factor Analysis to Assess the Number of Factors in Measurements
Mariska Barendse*, University of Groningen, The Netherlands
Marieke Timmerman, University of Groningen, Netherlands
Frans Oort, University of Utrecht, Netherlands
If data are collected from a heterogeneous sample, then heterogeneity may yield additional
(unexpected) dimensions in the data set. Exploratory factor analysis can be used to
determine dimensionality as the number of common factors in a set of observed items.
Model selection can be based on fit indices. In a simulation study, we will compare various
methods of exploratory factor analysis, under various conditions. In generating the data we
vary the response scales (continuous, dichotomous, polytomous), the model approximation
error (zero, low), the size of the factor loadings (medium, high), and the inter-factor
correlations (zero, high). For each condition, 500 sets of data are generated and analysed
with exploratory factor analysis, with the following estimation methods: maximum
likelihood, robust maximum likelihood, weighted least squares, and full information
maximum likelihood. Frequently applied fit indices such as chi-square, standardized root
mean square residual, and root mean squared error of approximation will be used to decide
the number of factors. In addition, we will also use the (adjusted) chi-squared difference test
to decide the number of factors. The performance of the different estimation methods and fit
The 76th Annual and the 17th International Meeting of the Psychometric Society Page 374
indices is evaluated by the proportions of correctly assessed number of factors. Results will
be presented.
Analyzing Longitudinal Survey Data: A Bayesian IRT Model with Occasion-Specific
Item Parameters
Josine Verhagen*, University of Twente, The Netherlands
Jean-Paul Fox, University of Twente, Netherlands
Questionnaires are often administered repeatedly to measure changes in attitude,
performance or quality of life. To study individual latent growth given repeated
measurement data, a common assumption is that the measurement characteristics are
invariant over time. However, for several reasons, repeated testing can cause changes in the
characteristics of items, and in these cases it is not justifiable to use the same measurement
model for each occasion.
A Bayesian IRT model will be proposed which combines a longitudinal multilevel structure
on the latent variable with random occasion-specific item parameters. Linear or non-linear
time effects and time-varying covariates can be incorporated on both levels to explain
growth in the latent trait or systematic item parameter shifts. The model also allows for
measurement invariance tests without the need for anchor items. A Bayes factor can be used
to compare models with and without variance in occasion-specific item parameters, while a
highest posterior density region test can be used to detect differences in the estimated
occasion-specific item parameters. The result is a comprehensive model to analyze
longitudinal survey data. Examples of applications to longitudinal questionnaires in a
medical setting will be given.
Assessing the Response of Sports Training Items Using Within-Item Multidimensional
Modeling
Parallel Session: Multidimensional Item Response Theory – Applications; Friday, 22
July, 1:30 p.m. -- 2:50 p.m.; D1-LP-06
Shyh-ching Chi*,National Taiwan Sport University., Taiwan
The purpose of the study was to assess the Response of Sports Training Scale was based on
within-item multidimensional model. The scale includes 7 dimensions. As regards selection,
training, competition, medical science, leadership and management, counseling coach
character, there came up with multidimensional problems, and it is estimated that a high
correlation exists between dimensions (.954 to .993). First Alpha Factors was applied to
extract the common factors. For the determination of the dimensions in terms of attribution
of questions, 89 observations had been ruled out because of missing; and SAS multiple
The 76th Annual and the 17th International Meeting of the Psychometric Society Page 375
imputation is applied on the process. And then we used ConQuest multidimensional model
to estimate the test questions. The findings show: (1) test questions were fit to model. (2)
within-item multidimensional separation reliability 0.972 was better than between-item
multidimensional 0.875. (3) In the estimation of test questions in terms of standard errors,
the within-item multidimensional average 0.017 was also more accurate than the
between-item multidimensional average 0.028 (4) In the estimation of test questions in
terms of difficulty range, the within-item multi- dimension -0.198 to 0.478 was wider than
the between-item multi-dimension -0.163 to 0.188. (5) In the estimation of test questions in
terms of homogeneity test card square value, the within-item multidimensional 2474.95 was
greater than the between-item multidimensional 467.61. The conclusion of this study is that
the Response of Sports Training Scale is fit to the within-item multidimensional model.
Measuring Change and Response Format Effects in Large Scale Educational Testing
with LLRA
Parallel Session: Multidimensional Item Response Theory – Applications; Friday, 22
July, 1:30 p.m. -- 2:50 p.m.; D1-LP-06
Thomas Rusch*, Vienna University of Economics and Business, Austria
Ingrid Dobrovits, Vienna University of Economics and Business, Austria
Birgit Gatterer, Vienna University of Economics and Business, Austria
Reinhold Hatzinger, Vienna University of Economics and Business, Austria
Linear logistic models with relaxed assumptions (LLRA) are a flexible tool for item-based
measurement of change as well as multidimensional Rasch-type models. Their key feature
is to allow for multidimensional items and mutual dependencies of items as well as
imposing no assumptions on the distribution of the latent trait in the population. Inference
for such models becomes possible within a framework of conditional maximum likelihood
estimation (CML). We will use the flexibility of different versions of the LLRA to analyze
large scale educational test data (n=781) stemming from an introductory course on
accounting at WU. Here, we have a repeated measurement design with two time-points. The
items used form three theoretically distinct groups, each possibly comprising a
homogeneous scale. Additionally, the items were presented in two different response
formats (multiple choice and open answer). A number of subject-specific covariates that are
of interest for differential trend and item effects are available. Specifically we will use
LLRA to (i) estimate effects over time e.g. learning effects (ii) investigate the effect of
using different response formats (iii) assess if the dimensionality of items is as theoretically
expected (iv) find out if there are differential effects due to subject specific-covariates.
The 76th Annual and the 17th International Meeting of the Psychometric Society Page 376
The Measurement of Civic Knowledge and the Response Process Behind: A
Multidimensional Mixture IRT Modeling Approach
Parallel Session: Multidimensional Item Response Theory – Applications; Friday, 22
July, 1:30 p.m. -- 2:50 p.m.; D1-LP-06
Joseph Kui-Foon Chow*, The Hong Kong Institute of Education, Hong Kong
Kuan-Yu, Jin, The Hong Kong Institute of Education, Hong Kong
This paper was based on the International Civic and Citizenship Education Study (ICCS)
conducted by the IEA, where 14-year-old students responded to more than 120 attitudinal
items on civic and citizenship. As a typical outcome of large scale assessment, traditional
Rasch analyses produce single scale scores for each participating country for comparison in
a league table. In order to make realistic assessments of students’ level of trust, the
heterogeneity in the sample should be explored since there is evidence that unobserved
heterogeneity may provide multiple classes with unique characteristics (Willse, 2011).This
study, therefore, brings in the idea of “sub-populations” within a population. We will
demonstrate with empirical datasets to examine the use of the mixture Rasch model as an
alternative to the traditional Rasch model, especially when misfit items are observed and/ or
when there is a signal of threat to uni-dimensionality of the measurement scale.
We analyzed the dataset on students’ trust of political institutions (6 scaled items). By
“unmixing” the unobserved sub-populations, the mixture Rasch analysis showed that a
majority of students showed relatively more trust to the police but the minority showed less
trust; however, these two groups showed similar trust towards other institution. It should be
thus noticed that these unobserved groups within a sample may be very important to
identify especially when they represent a sizable proportion of the sample. Left unanalyzed,
heterogeneity may result in severe distortions and any implications drawn would be
misleading.
Modeling the PISA 2006 Science Data by Using Additive MIRT Model
Parallel Session: Multidimensional Item Response Theory – Applications; Friday, 22
July, 1:30 p.m. -- 2:50 p.m.; D1-LP-06
Mingchiu Chang*, National University of Tainan, Taiwan
Hueying Tzou, National University of Tainan, Taiwan
Many educational and psychological assessments are inherently multidimensional. However,
in practice, examinees’ proficiencies are estimated by using all test items in conventional
unidimensional IRT (CU-IRT) analysis while ignoring the issue of multidimensionality.
Under the unidimensional IRT framework, examinees’ proficiencies in each
domain/dimension are estimated repeatedly by using different subsets of items. However,
The 76th Annual and the 17th International Meeting of the Psychometric Society Page 377
the overall ability estimate may not be valid because of the extent to which the
unidimensional assumption is violated. Meanwhile, the ignoring of correlation between
domains/dimensions, the proficiency estimate in each domain is unreliable when the
number of items in each domain is limited. (Ackerman, 1992; de la Torre & Patz, 2005;
Wainer et al., 2001).
It’s impossible to obtain the overall and content specific ability estimates n one calibration
by using ConQuest. Thus, two five-dimensional scaling models were used in the PISA 2006
main study. The first model was used for reporting overall scores, and the second model
was used to generate scores for the three science subscales. Moreover, PISA used much
ancillary information into the estimation process.
The additive MIRT model proposed by Sheng and Wikle (2009) incorporates both general
and specific ability dimensions in the same model, and has been shown to perform better
than the CU-IRT model. The purpose of this study is to investigate the benefit and flexible
in the additive MIRT model to modeling the PISA 2006 science data. It is hope that we can
get accurate and effective estimation result in one calibration without ancillary information.
The Measurement of Chinese Language Proficiency based on Higher Order IRT
Model
Parallel Session: Multidimensional Item Response Theory – Applications; Friday, 22
July, 1:30 p.m. -- 2:50 p.m.; D1-LP-06
Rih-CHang Chao*, National Taichung University, Taiwan
Yahsun Tsai, National Taiwan Normal University, Taiwan
Bor-Chen Kuo, , National Taichung University, Taiwan
According to CEFR, language competences consist of general language competences (GLC)
and communicative language competences (CLC). GLC are those not specific to language,
but which are called upon for actions of all kinds. In contrast, CLC consists of 3 different
dimensions; linguistic, sociolinguistic and pragmatic, are those which empower a user or
learner to act using specifically linguistic means. In respect to the language proficiency
framework which is referring to as a two-level hierarchical assessment structure. Therefore,
a higher order item response model (HO-IRT) is applied to analyze the test data. The
objective of this study was to assess the language proficiency in Chinese for Chinese
heritage students (CHS) who enrolled in preparatory Chinese language programs at
National Taiwan Normal University. The performances of unidimensional IRT (UIRT) and
HO-IRT are compared in this study. There were 486 CHS taken Chinese Culture Test
(CCT). The results indicated that HO-IRT model fit these data and is able to explain these
data well compared with UIRT.
The 76th Annual and the 17th International Meeting of the Psychometric Society Page 378
Psychometric Validation of the Health-related Child Body Questionnaire (HRCBQ) to
Assess Chinese Caregiver Body Perception
Parallel Session: Rasch Models - Applications in Nonability Measures; Friday, 22 July,
1:30 p.m. -- 2:50 p.m.; D1-LP-07
Christine MS Chan*, The Hong Kong Institute of Education, Hong Kong
Wen Chung Wang, The Hong Kong Institue of Education, Hong Kong
Aims: It is likely that caregivers tend to base their ideas on personal subjective experience,
optimistic views and biased-cognition to the body questions raised. The HRCBQ was
developed to assess caregiver’s perception of child body image.
Methods: The HRCBQ consists of 17 health related child body questionnaire. Based on
Stunkard et al. (1983)’s work, similar drawings for a child body figures, depicting a child
aged 2-4 and a young adolescent aged 16-18 years old, ranging from very thin to very fat
(1-9 scales). The psychometric performance of the HRCBQ was validated in several stages
based on Rasch model, to identify items measuring biased-cognition, degree of items of
biased-cognition, favorable biased-cognition items and demographics among caregivers.
Results: 508 mothers and 1055 preschool teachers from 50 vary socio-economic
background of kindergartens completed the HRCBQ. Eight out of 17 items had been
identified as items of biased cognition; no misfit item was observed (critical range of 0.6 to
1.4). Among these 8 items, the easier bias item (item difficult= -1.52) and the most difficult
bias tem (item difficult=-1.28) were also identified. Home-maker mothers, student-teachers
and teachers from China had more bias than full time working mothers, practice-teachers
and teachers from Hong Kong (p<0.001). Mothers with lesser education, poor incomes had
more bias than the better groups (p<0.001).
Conclusions: The results of psychometric analyses confirmed that the HRCBQ had
consisted 8 items of biased cognition scientifically. More comprehensive items should be
further developed to confirm the HRCBQ and its impact on socio-cultural responsive
reliability.
Item Banks of Quality of Life Measures on Young Adult Survivors of Childhood
Cancer
Parallel Session: Rasch Models - Applications in Nonability Measures; Friday, 22 July,
1:30 p.m. -- 2:50 p.m.; D1-LP-07
I-Chan Huang*, University of Florida, USA
Gwendolyn Quinn, Moffitt Cancer Center, USA
Zhushan Li, Boston College, USA
Elizabeth Shenkman, University of Florida, USA

The 76th Annual and the 17th International Meeting of the Psychometric Society Page 379
This study aims to develop health-related quality of life (HRQOL) item banks for young
adult survivors of childhood cancer (YASCC) based on items derived from three existing
instruments. We identified YASCC who were between 21 and 30 years old and had been off
therapy for more than 2 years without cancer. Data were collected (N=151) via telephone
interviews. Three stages were utilized to develop item banks: mapping items from three
instruments into a common HRQOL construct, checking dimensionality using confirmatory
factor analyses (CFA), and equating items using Rasch modelling. Specifically, we
conducted CFA to analyze unidimensionality and local independence. Comparative Fit
Indices (CFI), Tucker-Lewis-Index (TLI), and Root Mean Square Error of Approximation
(RMSEA) were used to determine the assumption of unidimensionality. Residual
correlation was used to determine the assumption of local independency. Item fit was
examined through Rasch modelling using the index of
information-weighted/outlier-sensitive fit statistic mean square (INFIT/OUTFIT MNSQ).
Items with the MNSQ >1.3 or <0.7 were removed from the item banks. We assigned 123
items to an HRQOL construct comprised of six generic and eight survivor-specific domains.
CFA retained 107 items that meet the assumptions of unidimensionality and local
independence. Rasch analysis retained 68 items that satisfied the fit index. However, in
terms of difficulty parameters, items in most banks were relatively easy for the subjects,
whereas YASCCs’ underlying HRQOL was at the middle to lower levels. Future studies
are needed to refine the item banks, especially including more challenging items.
Teacher Quality of Work Life in Primary School Comparison of Psychometric
Properties Using Rasch Model
Parallel Session: Rasch Models - Applications in Nonability Measures; Friday, 22 July,
1:30 p.m. -- 2:50 p.m.; D1-LP-07
Nordin Abd. Razak*, Universiti Sains Malaysia, Malaysia
Ahmad Zamri Khairani, Universiti Sains Malaysia, Malaysia
Mahaya Salleh, Teacher Training Institute, Malaysia
The aim of this study is to examine and evaluate the psychometric properties of an
instrument which used to measure the Teacher Quality of Work Life and its dimensions
across the Malaysian major ethnic groups which is represented by the Malay, Chinese and
Indian teachers in three different types of Malaysian primary schools namely the National
Type Primary School (NTPS), the National Type Chinese Primary School (NTCPS), the
National Type Tamil Primary School (NTTPS). Teacher Quality of Work Life construct
consists of four main dimensions which are the Psychological Needs, the Social Needs, the
Political Needs and the Economical Needs and every main dimension has several
subdimensions except the Economical Needs. The sample used in this study contained

The 76th Annual and the 17th International Meeting of the Psychometric Society Page 380
1080 respondents from 90 primary schools in Penang and Kuala Muda/Yan District in
Kedah and 360 teachers were selected randomly from each type of primary schools. The
study was conducted by administering the questionnaires developed by Nordin et al. (2009)
and the psychometric properties were examined from several aspects such as fit statistic,
unidimensionality, item reliability and person score, Differential Item Functioning (DIF)
and comparing the similarities and differences of Teacher Quality of Work Life across
ethnic groups. Items were analysed using Rasch Measurement Model. The findings
indicated that four items did not fit the Rasch Model and as a result the items were omitted
from the scale. Subsequent analysis indicated that all the items fitted the model and
measuring one dimensional construct after omitting the four misfit items from the Teacher
Quality of Work Life instrument. The presence of Differential Item Functioning (DIF) items
and the results from one-way analysis of variance (ANOVA) showed that cultural
orientation had its influence on the responses from respondents of three etnic groups,
namely the Malay, Chinese and Indian of the construct being measured.
A Rasch Analysis of Positive Academic Affect Scale
Parallel Session: Rasch Models - Applications in Nonability Measures; Friday, 22 July,
1:30 p.m. -- 2:50 p.m.; D1-LP-07
Jingjing Yao*, The Hong Kong Institute of Education, Hong Kong
Positive academic affect is regarded as an important indicator in successful school
performance. There are many studies on positive or negative affect scales in the context of
America or other western culture, but seldom take place in China. Although there is
abundant literature on emotion and affect, most of the existing scales are constructed to
measure mood or emotion purely, and many of them with low reliability or poor validity.
To develop a brief and valid measure, we developed positive academic affect scale. Pilot
test data were collected from 134 high school students. The Rasch rating scale model was
used to analyze the data. Information on item fit, item diddiculty and internal consistency
was examind. The scale displayed satisfactory psychometric properties.
Validating an Instrument for Measuring Leadership Responsibilities of Hong Kong
Vice-Principals – A Rasch Analysis
Parallel Session: Rasch Models - Applications in Nonability Measures; Friday, 22 July,
1:30 p.m. -- 2:50 p.m.; D1-LP-07
Paula Kwan*, The Hong Kong Institute of Education, Hong Kong
Joseph Kui-Foon Chow, The Hong Kong Institute of Education, Hong Kong
The 76th Annual and the 17th International Meeting of the Psychometric Society Page 381
Literature has substantiated a growing trend in the recognition of the important role
vice-principals play in schools which is evident in the increasing amount of work focusing
on their roles and responsibilities, job satisfaction, and career aspiration. Amongst the
empirical studies, factor analysis is the most frequently used statistical tools. A possible
drawback of using factor analysis is the lack of a common framework based on which
comparison and consolidation of research findings produced by various researchers can be
made as different researchers literally adopt different sets of responsibility roles derived in
their studies. A more serious deficiency of using factor analysis is the lack of an objective
measure in the analysis.
The study aims to validate an instrument to measure Hong Kong secondary school
vice-principals’ responsibilities using Rasch Analysis. Based on responses from 331
vice-principals, Rasch analysis was applied to assess the model-data fit of the 56 4-point
Likert items , which included checking for optimal response categories usage, person
ability-item difficulty targeting, person and item reliabilities, principal component analysis
of standardised residuals and test of differential item functioning (DIF). The overall results
showed that except for a few misfitting items all other items can meaningfully contribute to
measuring a single construct at good reliability. In particular, among the items on the area
of “instructional leadership”, where there is lack of consensus among schools as the
literature suggested, DIF analysis was also performed to evaluate the differential
performance among respondents from different school subsidy types and school bandings.
Fitting Direct Covariance Structures by the MSTRUCT Modeling Language of the
CALIS Procedure
Parallel Session: Structural Equation Modeling - Applications II; Friday, 22 July, 1:30
p.m. -- 2:50 p.m.; D1-LP-08
Yiu-Fai Yung*, SAS Institute Inc., USA
This presentation demonstrates the applications of the MSTRUCT modeling language
implemented in the CALIS procedure of SAS/STAT (version 9.22 and later). The
MSTRUCT modeling language provides direct specifications of the structural parameters in
covariance matrices. As an educational tool, the MSTRUCT model specification technique
can be used to illustrate how the analysis of structural equation models is formulated
explicitly as the fitting of structural parameters to covariance matrices. More importantly,
The MSTRUCT modeling language provides links to many classical tests of covariance
patterns (for example, compound symmetry, intra-class correlation, and Type H pattern)
that are not implied by the functional relationships between variables. This presentation
demonstrates these tests by using the MSTRUCT model specifications. Because of its
flexibility, the MSTRUCT modeling technique can extend and modify the classical tests of
The 76th Annual and the 17th International Meeting of the Psychometric Society Page 382
covariance patterns rather effortlessly. Practical data examples are used throughout this
presentation.
Testing the Effectiveness of Three Multilevel Modeling Approaches in Addressing
Data Dependency with Empirical Data under Structural Equation Modeling
Framework
Parallel Session: Structural Equation Modeling - Applications II; Friday, 22 July, 1:30
p.m. -- 2:50 p.m.; D1-LP-08
Jiun-Yu Wu*, National Chiao Tung University, Taiwan
Yuan-Hsuan Lee, National Chiao Tung University, Taiwan
This study aims to examine the effectiveness of three modeling approaches (Design-based,
Model-based and Maximum modeling) in addressing the data dependency issue under the
structural equation modeling framework, which subsumes other conventional parametric
statistical methods. For the first two commonly used SEM multilevel modeling methods,
design-based based method adjusts the standard error of the fixed effect with Huber-White
Sandwich standard error estimator, while model-based approach specifies the statistical
model according to the multilevel sampling scheme. These two approaches, however, still
have their shortcomings: design-based approach usually yields biased parameter estimates
when analyzing multilevel data, and model-based approach generates inconsistent
parameter estimates with multilevel data with insufficient higher-level sampling units. This
study proposes the third SEM modeling method called “maximum modeling” to address
data dependency. Two empirical data(Taiwan students’ 2007 TIMSS performance data and
American students’ Harter academic competence belief)will be used to demonstrate the
disadvantages of the two commonly mentioned approaches and to suggest the use of
maximum modeling to better address the fallacy of statistical inferences when dependent
data is analyzed with SEM modeling method.
Measuring the Effects of School Reading Curriculum on Students Achievements by
Using Multilevel Structuring Equation Modeling
Parallel Session: Structural Equation Modeling - Applications II; Friday, 22 July, 1:30
p.m. -- 2:50 p.m.; D1-LP-08
Daeseok Kim*, The University of Gerogia, USA
Jongmin Ra, The University of Gerogia, USA
The goal of this study is to measure the effects of school reading curriculum on
students’performances by using multilevel structuring equation modeling.
The 76th Annual and the 17th International Meeting of the Psychometric Society Page 383
Research Model: Curriculum as a process of education is a variable that affects the
students’achievements. The basic purpose of this study is to examine the impacts of school
curriculum factors as determinants of student achievements. With regard to research
question to measure the effect size of school curriculum on students’achievements, we
considered students nested within schools. This research analyzed the effects of 1)
content/knowledge, 2) teaching methods, 3) learning time on students’ outcomes by
Level-1(student) variables. As Level-2(school) variables, 1) schools resources, 2) school
extra curricular activities, 3) school curriculum and assessment were analyzed. Because
constructs were assessed at both student and school level, this model could be described as
multilevel SEM. We tested the hypothesis that the effects of curriculum factors on
performance in reading were different in each state.
Sample: Empirical data were obtained through PISA 2009 database (www.pisa.oecd.org).
This extensive data set combines student questionnaires, school questionnaires and parent
questionnaires. The samples were drawn from South Korea and Finland. Cases with missing
value will be dropped from the analysis by the use of listwise deletion.
Self-Esteem, Depression and Rebellion in Adolescence: Application of Latent
Moderated Structural Equation Model
Parallel Session: Structural Equation Modeling - Applications II; Friday, 22 July, 1:30
p.m. -- 2:50 p.m.; D1-LP-08
Jen-Hua Hsueh*, National Taiwan Normal University, Taiwan
The present study explored the interaction effect between self-esteem and depression on
rebellion of adolescents in Taiwan, and the multidimensionality of self-esteem was taken
into account. Latent Moderated Structural equation approach (LMS) (Klein & Moosbrugger,
2000), which models interaction effects between latent variables without introducing
productive indicators, was used for analysis. LMS takes measurement error into account,
hence constructs a more proper model than conventional moderated regression. The data
used was derived from a longitudinal survey conducted by Taiwan Youth Project (TYP),
which is sponsored by Academia SINICA and the Institute of Sociology. The sample for
analyses consists of 2696 seventh grade adolescents. The results indicated that there are
three dimensions of self-esteem, named sense of control, sense of positive value, and sense
of negative value, and the interaction effects between self-esteem and depression on
rebellion were entirely different when distinct dimensions of self-esteem were considered.
Factor scores and interaction effect figures were presented to elaborate the direction and
slope of the interaction. Probable mechanisms and suggestions for research and practice
were proposed and discussed.
The 76th Annual and the 17th International Meeting of the Psychometric Society Page 384
Domain-Specific Risk Taking Scale: A Factor-Analytic Study with Chinese University
Students
Parallel Session: Structural Equation Modeling - Applications II; Friday, 22 July, 1:30
p.m. -- 2:50 p.m.; D1-LP-08
Joseph Wu*, City University of Hong Kong, Hong Kong
Hoi Yan Cheung, City University of Hong Kong, Hong Kong
Factor analysis is one of the most widely applied statistical methods in social sciences to
examine the dimensionality of an instrument. Moving from unitary to multi-facet is a
trajectory commonly observed in the development and refinement of many instruments
which goes hand in hand with an advancement of understanding on its underlying construct.
The Domain-Specific Risk-Taking (DOSPERT) scale (Blais & Weber, 2006) is a
multidimensional instrument that was recently developed to assess risk-taking attitudes. Its
construction anchored on a conceptualization that one’s perceptions on risky events should
be content-related and there should be intra-individual differences as well as
inter-individual differences across domains. In this study, the factor structure of DOSPERT
is examined with a sample of Chinese university students through both exploratory and
confirmatory factor analyses. Overall speaking, the multidimensionality of the DOSPERT
gained support from the results of this study. Recommendations on refinement of this
instrument are offered.
Distinguishing the Signal from Noise with the Binary Latent Type Variable
Parallel Session: Mixture Modeling; Friday, 22 July, 1:30 p.m. -- 2:50 p.m.; D2-LP-08
Levent Dumenci*, Virginia Commonwealth University, USA
Well-fitting measurement models are commonly used to make inferences about latent
trait(s). However, fit statistics are not informative of distinguishing a homogeneous
population involving a latent variable model from a heterogeneous population consisting of
(a) a latent variable model and (b) null model because the proportionality constraints
implied by the latent variable model holds in both types of models. A mixture model with
the binary Latent Type variable has been proposed to fit the latter model (Dumenci, 2011).
In this presentation, it is demonstrated with simulated data that the entropy measure and
posterior probability distribution of class membership can be used to determine whether or
not a well-fitting latent variable model includes a null subpopulation. Implications for
low-stake testing are discussed.
Bayesian Inference for Growth Mixture Models with Latent Class Dependent Missing
Data

The 76th Annual and the 17th International Meeting of the Psychometric Society Page 385
Parallel Session: Mixture Modeling; Friday, 22 July, 1:30 p.m. -- 2:50 p.m.; D2-LP-08
Zhenqiu Lu*, University of Notre Dame, USA
Zhiyong Zhang, University of Notre Dame, USA
Gitta Lubke, University of Notre Dame, USA
Growth mixture models (GMM) with non-ignorable missing data have drawn increasing
attention in research communities but have not been fully studied. The goal of the project is
to propose and to evaluate a Bayesian method to estimate the GMM with latent class
dependent missing data.
An extended growth mixture model is first presented, in which class probabilities depend on
some observed explanatory variables and data missingness depends on both the explanatory
variables and a categorical latent class variable. A full Bayesian method is then proposed to
estimate the model. Through the data augmentation algorithm, conditional posterior
distributions for all model parameters and missing data are obtained. A Gibbs sampling
procedure is then used to generate Markov chains of model parameters for statistical
inference. The application of the model and the method is first demonstrated through the
analysis of mathematical ability data. A simulation study considering three main factors (the
sample size, the class probability, and the missing data ignorability) is then conducted and
the results show that the proposed Bayesian estimation approach performs very well under
studied conditions. Finally, some implications of this study, including the convergence
problem, the sample size, the sensitivity of the model, and the future directions of the
approach, are discussed.
How to Find Hopeful Customer using Zero-Inflated Poisson Model with Latent Class
Parallel Session: Mixture Modeling; Friday, 22 July, 1:30 p.m. -- 2:50 p.m.; D2-LP-08
Kotaro Ohashi*, Waseda University, Japan
Hideki Toyoda, Waseda University, Japan
In this paper we will present an example to manage zero-inflated data which is regarded as
count data with excess zeros. Customer’s frequency of repeat visiting to M, which was one
of major department stores in Japan, was analyzed and the frequency was expected
zero-inflated condition in comparison with usual Poisson process. Therefore zero-inflated
Poisson (ZIP) model was considered. Generally, a customer who visits repeatedly is good
customer, so to find such good customer in this zero inflated condition we assumed two
latent classes of observations, hopeful customer class which was supposed to be Poisson
random variable with probability 1-p and hopeless customer class which was supposed that
only possible observation is zero with probability p. Even a customer’s frequency of repeat
visiting to M was zero, if she were hopeful customer she has possibilities to visit again
The 76th Annual and the 17th International Meeting of the Psychometric Society Page 386
following Poisson process. To separate two latent classes, customer’s characters such as
each customer’s mean daily times of accounting in M we prepared from ID-POS data which
was registered buying history were used. We use Markov Chain Monte Carlo (MCMC) in
analysis, and as the result we found about 2,000 hopeful customers whose frequency of
repeat visiting had been zero yet from randomly selected 10,000 customers.
Model Selection and Evaluation in Factor Mixture Modeling using A Two-Stage ML
Approach
Parallel Session: Mixture Modeling; Friday, 22 July, 1:30 p.m. -- 2:50 p.m.; D2-LP-08
Xiaoling Zhong*, The Hong Kong Institute of Education, Hong Kong
Ke-Hai Yuan, University of Notre Dame, USA
Finite factor mixture modeling is used to model the covariation between observed variables
within component. Major issues involved with factor mixture modeling include determining
the number of components in a mixture, and evaluating the overall model. However,
problems arise when using the conventional single-stage ML approach to fit a factor
mixture model. In particular, the determination of the number of components is confounded
with model misspecification. Besides, the single-stage ML approach only allows relative
model fit indices such as AIC and BIC, which do not support tests of model evaluation,
hence tests for factorial invariance across components are not available.
To circumvent these problems, this paper studies behavior of a newly-proposed two-stage
ML approach in model selection, and provided several fit indices for evaluating the overall
model. Results suggest that (1) The two-stage approach identifies the model with the correct
number of components more frequently when the model is misspecified or when the
distribution assumption is violated; (2) Even when the model and distribution are both
correctly specified, the classification-based criteria perform better with the two-stage
approach when all components share the same factor loadings; (3) Most provided fit indices
for overall model evaluation perform well, while the conventional chi-square difference test
statistics associated with either ML or GLS methods rejects the correct models too
frequently and can not be trusted.
The Mixture Item Response Model for Ability Decline during Testing
Parallel Session: Mixture Modeling; Friday, 22 July, 1:30 p.m. -- 2:50 p.m.; D2-LP-08
Kuan-Yu Jin*, The Hong Kong Institute of Education, Hong Kong
Wen Chung Wang, The Hong Kong Institute of Education, Hong Kong
In a long test or a low-stakes test, examinees may lose their interests or become tired as the
testing progresses. That is, examinees do not demonstrate fully their maximum ability
The 76th Annual and the 17th International Meeting of the Psychometric Society Page 387
throughout the test such that their performances decline gradually. If such effect of ability
decline during testing exists but is not taken into consideration by fitting a standard IRT
model, the difficulties of items presented toward the end of the test will be overestimated,
and as a result, the person measures will be biased. In this study, we developed a new
mixture IRT model that accounts for such effect directly. Parameter recovery was assessed
through simulations. The results showed that the parameters could be recovered fairly well
using WinBUGS. The simulation also demonstrated that: when test data had such effect,
fitting standard IRT models would overestimate item difficulties for items presented toward
the end of the test; whereas fitting the new model yielded accurate parameter estimates;
when test data did not have such effect, fitting the new model yielded parameter estimates
that were very similar to those obtained by fitting standard IRT models. In sum, the new
model is very useful when ability declines during testing and does little harm when such
effect does not exist.
Development and Validation of Students’ Attitude toward Math Scale
Parallel Session: Test Development and Validation - Nonability Measures II; Friday,
22 July, 1:30 p.m. -- 2:50 p.m.; D2-LP-09
Hsiang- Chun Wang*,National Sun Yat- sen University, Taiwan
Zuway-R Hong, National Sun Yat- sen University, Taiwan
The research reported in this study focuses on the development and validation of an
instrument on Elementary School Student Attitude toward Math Scale (ESSMS).
The investigator-developed 44-item of ESSMS was modified and derived from five related
attitudes toward mathematics scales. A total of 98 fifth grade students were randomly
selected from a large sample size elementary school in Southern Taiwan, they completed
the ESSMS in early spring 2011. Factor analyses, expert content validity ratio (CVR,
Lawshe, 1975) and internal consistency analyses were conducted to assess its reliability and
validity. The initial findings were as follows: ESSMS indicated an adequate construct
validity and internal reliability, five components (i.e., self-confidence in learning
mathematics, learning mathematics is useful for people, anxiety in learning math, self-
concept toward mathematics and motivation in learning mathematics) together accounted
for 53.53 % of the variance; each dimension’s internal consistency of the total scores were
Cronbach’sαof 0.81, 0.76, 0, 87, 0. 71, and 0.70, respectively; the internal consistency of
the total items was found a high Cronbach’sαof 0.96. Implications, limitations and
discussions of findings were provided and discussed.
An Investigation and Validation of Elementary School Students’ Positive Thinking
Scale
The 76th Annual and the 17th International Meeting of the Psychometric Society Page 388
Parallel Session: Test Development and Validation - Nonability Measures II; Friday,
22 July, 1:30 p.m. -- 2:50 p.m.; D2-LP-09
Chia-Jung Lin*, National Sun Yat- sen University, Taiwan
Zuway-R Hong, National Sun Yat- sen University, Taiwan
The purpose of this study was to validate an instrument of Elementary School Student
Positive Thinking Scale (ESPTS) that measure students’ positive thinking. An
investigator-developed 54-item scale that derived from “Questionnaire of Emotional Traits”
(Chang, 2002),”Positive thinking scale” (Chou, 2010), “Multidimensional Students Life
Satisfaction Scale” (Huebner, 2001), and “Self-esteem Scale” (Rosenberg,1962),
respectively. A total of 76 5th and 6th grades children completed the ESPTS in January
2011 in Southern Taiwan. We conducted factor analyses, correlation analyses, analysis of
variance (ANOVA), and Bonferroni post-hoc comparisons to compare the similarities and
differences between boys and girls with different parental practices families. The initial
findings were as follows: the ESPTS indicated has an adequate construct validity and
internal reliability, five components (i.e., positive emotion, self-confidence, school-self,
identity-self, and peer relationship) together accounted for 61.11% of the variance; the
internal consistency of the remaining items was found a high Cronbach’s α was .96;
children’s father with democratic practice had significantly higher scores on positive
thinking than mothers with less democratic practice. In addition, there were
non-significantly gender differences on children’s positive thinking scores. Implications of
the study included the recommended use of family education were provided and discussed.
A Investigation and Validation of College Students Reading Motivation Scale
Parallel Session: Test Development and Validation - Nonability Measures II; Friday,
22 July, 1:30 p.m. -- 2:50 p.m.; D2-LP-09
Tien-Chi Yu*, National Sun Yat-sen University, Taiwan
Zuway-R Hong, National Sun Yat-sen University, Taiwan
The purposes of this study were to validate an instrument of College Students Reading
Motivation Scale (CSRMS) and to investigate objectives of reading, reading material styles
and gender differences in Taiwan’s college students reading motivation. The
investigator-developed 47-item was modified and derived from Baker and Wigfield (1999)
and Wigfield and Guthrie’s (1997) Motivations for Reading Questionnaire (MRQ) by
investigators. A total of 28 female students and 72 male students were randomly selected
from a large sample size university in Southern Taiwan, they completed CSRMS in early
spring in 2011. Item analysis, factor analysis, t-tests and analysis of variance (ANOVAs)
were conducted to compare the similarities and differences between male and female
The 76th Annual and the 17th International Meeting of the Psychometric Society Page 389
students in different objectives of reading and reading material styles. The initial finding
were as follows: the CSRMS indicated an adequate construct validity and internal reliability,
eight components (i.e., reading self-efficacy, recognition, active involvement, curiosity,
social interaction, acceptance of challenge, importance and competitions with others)
together accounted for 69.61% of the variance; the internal consistency of the total items
was found a high Cronbach’s α of .94; female students had significantly higher CSRMS
total scores than those male counterparts; students who were frequently reading novels had
significantly higher CSRMS scores than students who reads novels less frequently; students
who were eager to acquire information had significant higher CSRMS scores than those less
interested in acquiring information. Implication and limitation of these findings were
provided and discussed.
Patterns of Evidence in Teacher Observations: The View through Five Lenses
Parallel Session: Test Development and Validation - Nonability Measures II; Friday,
22 July, 1:30 p.m. -- 2:50 p.m.; D2-LP-09
Catherine McClellan*, Educational Testing Service, USA
Steven Holtzman, Educational Testing Service, USA
Observation of classroom instruction is a widely-used tool for evaluation of efficacy of
teaching. This likely has been the case since the very beginning of what is thought of as
“formal” instruction. Recently, strong interest in ways to structure and formalize this
observation into a measurement system has led to the development of protocols focusing the
observer on specific aspects of instruction and classroom interactions.
One aspect of interest is the presence of temporal structures that may be common across
classrooms. Since the majority of classroom observation protocols require the observer to
monitor several dimensions of performance at once, it also is of interest to evaluate whether
patterns of evidence are common or distinct across dimensions within an instrument. Data
patterns, when combined with expert knowledge and interpretation, may lead to insights and
relationships between dimensions that were not obvious before. If such patterns could be
located, it could lead to modifications in the protocols, changes in the training of observers,
and recommendations for altering the focus of the observer at specific time periods of a
classroom session.
In this study, five observation protocols will be included. Data from approximately 50
classroom sessions each was coded in great detail by expert users of each instrument.
Time markers for meaningful occurrences for each scale were recorded. The frequency of
evidence for each scale, any apparent patterns of data occurrence, and commonalities and
differences across scales and instruments will be discussed.

The 76th Annual and the 17th International Meeting of the Psychometric Society Page 390
Ubuntu Game: An Educational Mechanism for Fostering Trust in a Divergent World
Parallel Session: Test Development and Validation - Nonability Measures II; Friday,
22 July, 1:30 p.m. -- 2:50 p.m.; D2-LP-09
Sunday Jacob*, Federal College of Education, Nigeria
The word 'Ubuntu' originates from one of the Bantu dialects of Africa, and it is pronounced
uu-Boon-too. It is a traditional African philosophy that offers people an understanding of
themselves in relation to the world. It means that a person is only a person through other
persons. We affirm our humanity when we acknowledge that of others. I am human because
I belong. It speaks about wholeness and compassion. It is based on this premise that Ubuntu
game was developed as an educational mechanism to help in ameliorating the problems
emanating from cultural, religious, political, socio-economic and ethnic differences
common in most parts of the world today. The specific objectives of the game, among
others, is to enable the students and other participants to: appreciate the diversity among
human beings, trust the differences among people for peaceful co-existence, share
experiences and ideas that will help in building trust and cohesion, internalize the principles
of trust, justice, fairness, respect, equality and dignity. The materials developed for playing
the game are: The Ubuntu board, a manual containing rules/regulations and playing
procedures as well as different sets of cards reflecting what they stand for. Other materials
are a dice, plastic cup and symbols of 4 different colours.
Nonparametric Method for Estimating Conditional Standard Error of Measurement
for Test Scores
Parallel Session: Nonparametric Statistics; Tuesday, 19 July, 4:00 p.m. -- 5:20 p.m.;
D2-LP-09
Louis Roussos*, Measured Progress, USA
Zhushan Li, Boston College, USA
The standard error or measurement (SEM) for raw score on an assessment is typically
estimated using a Classical Test Theory formula that yields a constant. Lord's Binomial
model and its multinomial extension have been proposed to obtain SEM conditional on test
score, but these methods assume all test items with the same maximum score will behave
the same, item responses are statistically independent, and SEM=0 at the extreme scores.
We propose a new method that makes none of these assumptions. For every item , we
calculate its variance conditional on all proportion-correct scores on the remaining items.
These scores stand in for proportion-correct on the total test. The variance associated with
proportion-correct scores of 0 or 1 will not necessarily be zero. When statistical

The 76th Annual and the 17th International Meeting of the Psychometric Society Page 391
independence can be assumed, the conditional variance of the total score will be the sum of
the conditional variances of the item scores; otherwise, we estimate the conditional
covariances of all possible item pairs for all possible rest scores (leaving out the two items
of the pair). The conditional variance of the total score is then the sum of the conditional
item variances minus twice the sum of all the pairwise conditional covariances. The
efficacy of the proposed method is evaluated in a simulation study using both
unidimensional and multidimensional item response theory models. Results are compared
with empirical SEM from the multiple trials as well as with SEM from the standard
classical test theory formula.
Multivariate Nonparametric Two-Sample Tests for Mixed Outcomes
Parallel Session: Nonparametric Statistics; Tuesday, 19 July, 4:00 p.m. -- 5:20 p.m.;
D2-LP-09
Denis Larocque*, HEC Montreal, Canada
Jaakko Nevalainen , University of Turku, Finland
Hannu Oja, University of Tampere, Finland
The literature on multivariate methods is abundant. However, most methods are designed
for the case where all outcomes are of the same type, either all continuous or all categorical.
The case where some outcomes are continuous and some categorical is referred to as mixed
outcomes. The literature about this specific situation is very sparse in general and almost
inexistent for nonparametric methods. In this talk we will present a brief review of the
different ways to model mixed outcomes. We will then focus on the two-sample problem,
that is, the problem of comparing two populations on the basis of a set of mixed outcomes.
We will introduce a new class of nonparametric tests along with its basic properties, show
the results from a simulation studies and present some illustrations with real data sets.
A Branch-and-Bound Max-Cardinality Algorithm for Exploratory Mokken Scale
Analysis
Parallel Session: Nonparametric Statistics; Tuesday, 19 July, 4:00 p.m. -- 5:20 p.m.;
D2-LP-09
Michael J. Brusco*, Florida State University, USA
Hans-Friedrich Koehn, University of Illinois at Champaign-Urbana, USA
Douglas Steinley, University of Missouri-Columbia, USA
Exploratory Mokken scale analysis can be conceptualized as a combinatorial optimization
problem: from a set of candidate items, a maximal subset must be selected such that
(1) the (normed) pairwise item covariances, H_jk, are all strictly positive; (2) the item
The 76th Annual and the 17th International Meeting of the Psychometric Society Page 392
scalability coefficients, H_j , of all items selected exceed a predetermined threshold, c; (3)
the set of selected items maximizes the scale coefficient, H. Mokken proposed a stepwise,
bottom-up algorithm, relying on a greedy search strategy, termed Automated Item Selection
Procedure (AISP), that has been implemented in the commercially distributed software
package MSP (the statistical software package Stata also contains a module for Mokken
analysis). Recently, AISP has been made freely available in the R package mokken that, as
a new development, also offers a genetic algorithm for exploratory Mokken scale analysis.
Among the class of object selection problems, maximum cardinality subset selection
requires finding the largest possible subset of objects that satisfies one or more constraints.
We present an exact branch-and-bound algorithm for maximum cardinality subset selection
tailored to exploratory Mokken scale analysis of a set of binary items. Computational results
are reported for simulated data with max. 80 items generated from (1) the DINA model; (2)
the five-parameter acceleration model; (3) the Rasch model (using different item
discrimination parameter settings for generating data sets that mix item subsets all satisfying
the double monotonicity condition, while the entire data sets do not) — thus, these data sets
represent incrementing challenges to the proposed algorithm.
2 and 2 Equals 4 !
Parallel Session: Nonparametric Statistics; Tuesday, 19 July, 4:00 p.m. -- 5:20 p.m.;
D2-LP-09
Rudy Ligtvoet*, University of Amsterdam, Netherlands
In item response theory (IRT), inferences are made about the ordering of subjects on the
basis of their scores on the test items, where each subject is characterized by a value on a
latent variable. In practice, however, the simple sum of the item score is often used instead
as a basis for subject comparison. For polytomously scored item scores such practice is
problematic as most of the polytomous IRT models do not imply a stochastic ordering of
the latent variable by the sum score (known as the SOL property). For such IRT model, the
ordering of subjects on the basis of their sum scores may be different from the ordering of
subjects’ latent values. Moreover, those IRT models that do imply SOL are often too
restrictive to fit the data. In this presentation, an isotonic (i.e., nonparametric) IRT model is
presented for polytomously scored items that guarantees that the subjects’ latent values are
stochastically ordered by the subjects’ sum score. It is further shown how the assumptions
underlying the isotonic model can be empirically tested. If the isotonic model fits the data,
empirical support is obtained for the use of the sum score as a basis for ordering subjects.
Assessing Dimensionality through Mokken Scale Analysis: What Happens When
Questionnaires Do Not Have Simple Structures?
The 76th Annual and the 17th International Meeting of the Psychometric Society Page 393
Parallel Session: Nonparametric Statistics; Tuesday, 19 July, 4:00 p.m. -- 5:20 p.m.;
D2-LP-09
Iris A.M. Smits*, University of Groningen, Netherlands
Marieke E Timmerman, University of Groningen, Netherlands
Rob R. Meijer, University of Groningen, Netherlands
The assessment of the dimensionality structure is an important aspect of scale evaluation.
Methods based on nonparametric item response theory may be attractive, since they rely on
less strict assumptions and therefore are more likely to fit data than parametric methods. In
this study, we evaluate procedures proposed in the context of Mokken Scale Analysis, using
the recently proposed genetic algorithm (van der Ark, 2010). In a comparative simulation
study, the performance of the procedures in various theoretically and empirically relevant
conditions will be examined. Among others, strictly unidimensional and multidimensional
structures and structures deviating from strict uni- or multidimensionality will be considered.
The latter is highly relevant in empirical practice, since many questionnaires are designed to
scale persons on both a total score and (multiple) sub scores. Implications for the use of
MSA procedures to assess the dimensionality structure in empirical practice will be
discussed.
The 76th Annual and the 17th International Meeting of the Psychometric Society Page 394
Author Index
A
Abad, Francisco J. ....................... 47, 106, 223, 371
Abd. Razak, Nordin ..................................... 78, 289
Ackerman, Terry ...............................36, 37, 70, 116
Adachi, Kohei .............................................. 30, 169
Akers, Kathryn ............................................ 96, 341
Alexandrowicz, Rainer ................................ 66, 253
Algina, James .............................................. 97, 344
Ali, Usama ................................................. 106, 370
Allen, Nicholas .......................................... 100, 350
Al-Mahrazi, Rashid ..................................... 17, 138
Almeda, Josefina ....................................... 105, 367
Alves, Cecilia, B. ......................................... 31, 172
Amanda, Fairchild ....................................... 40, 196
An, Weitian .................................................. 22, 153
Andrew Maul ....................................................... 11
Andrew, Maul .................................................... 122
Annemarie Zand Scholten ................................... 11
Annemarie, Zand Scholten ................................ 123
Arai, Sayaka ................................................ 22, 151
Ariyanti, Fitri ..................................40, 69, 195, 264
Ayers, Elizabeth ..................... 21, 72, 150, 270, 271
Azen, Razia .................................................. 24, 158
B
Bao, Yu ........................................................ 13, 127
Barendse, Mariska ..................................... 111, 373
Bassi, Francesca .......................................... 63, 247
Beersingh, Yvette ........................................ 32, 175
Béguin, Anton ......................... 12, 77, 102, 124, 126
Behizadeh, Nadia ....................................... 102, 357
Beland, Sebastien ...........................15, 33, 133, 176
Bennani, Mohammed ................................... 30, 169
Bennink, Margot .......................................... 84, 300
Bentler, Peter ............................. 7, 67, 85, 257, 301
Bergsma, Wicher P. ............................. 63, 246, 247
Bian, Ran ..................................................... 46, 219
Bian, Yufang .................................. 43, 47, 206, 222
Borsboom, Denny .................................... 11, 28, 79
Bouwmeester, Samantha .............................. 73, 272
Bozdogan, Hamparsum .............................. 103, 361
Braeken, Johan ............................................. 67, 256
Broomell, Stephen ....................................... 69, 261
Brown, Anna ........................................................ 99
Brown, Gavin T L ........................................ 78, 290
Browne, Michael .................................... 16, 85, 135
Brusco, Michael J....................................... 117, 391
Budescu, David .............................. 24, 69, 158, 261
Bullens, Jessie .............................................. 57, 242
C
Cai, Huajian ................................................. 98, 347
Cai, Li .............19, 70, 103, 143, 144, 145, 266, 360
Carlson, Ralph ....................................... 34, 76, 283
Carr, M ......................................................... 71, 269
Carter, Marjorie ........................................... 39, 191
Cek, Iva ........................................................ 93, 329
Ceulemans, Eva ........................................... 30, 168
Cham, Heining ........................................... 103, 360
Chan, Christine MS .................................... 113, 378
Chan, Shu-Chen ........................................... 94, 332
Chan, Wai ...................................... 86, 95, 304, 336
Chang, Chi ................................................... 47, 225
Chang, Chun-Yuan ...................................... 89, 314
Chang, Fang-chung ...................................... 43, 209
Chang, Hsuan-Chih ...................................... 26, 165
Chang, Hua-Hua ...... 58, 64, 83, 106, 244, 295, 370
Chang, Mingchiu ....................................... 112, 376
Chang, Yu-Ting ........................................... 96, 340
The 76th Annual and the 17th International Meeting of the Psychometric Society Page 395
Chang, Yu-Wei ............................................ 91, 322
Chao, Hsiu-Yi ............................................ 106, 370
Chao, Pei-Ching .............................43, 92, 207, 325
Chao, Rih-CHang ...................................... 112, 377
Chao, Yu-Ning ............................................ 41, 200
Che, Hong-Sheng ........................................ 46, 219
Chen, Cheng-Te ........................................... 43, 206
Chen, Chia-Cheng ....................................... 89, 313
Chen, Chi-Chan ........................................... 43, 206
Chen, Chuan ................................................ 89, 312
Chen, Chun-Hua .......................................... 88, 308
Chen, Hsiao-Chu ......................................... 35, 182
Chen, Huan-Wen ......................................... 46, 221
Chen, Hui-Ching .......................................... 98, 348
Chen, Jianshen ............................................. 23, 154
Chen, Jyun-Hong ......................... 35, 106, 184, 370
Chen, Li-Ming ................................55, 98, 235, 348
Chen, Mei-lin ............................................... 46, 221
Chen, Meng ................................................. 46, 219
Chen, Ping ......................................64, 92, 248, 327
Chen, Po-Hsi ....... 44, 46, 92, 93, 210, 218, 325, 327
Chen, Po-Lin ...................................43, 92, 207, 325
Chen, Qishan ............................................... 46, 219
Chen, Shu-Ying ........ 18, 35, 88, 106, 184, 311, 370
Chen, Xidan ................................................. 24, 157
Cheng, Chien-Ming ..................................... 97, 347
Cheng, Chin-Fei .......................................... 75, 280
Cheng, Chung-Ping .. 16, 85, 92, 136, 302, 324, 327
Cheng, Xiyou ............................................... 45, 216
Cheng, Yi-Chang ......................................... 43, 207
Cheng, Yi-Chun ........................................... 41, 197
Cheng, Ying ................................................. 55, 234
Cheng, Ying-Yao ............................55, 98, 235, 348
Cheung, Anthony B. L. .......................................... 9
Cheung, Hoi Yan ....................................... 114, 384
Cheung, Mike W.-L. .................... 75, 103, 112, 362
Cheung, Yu Hin Ray ................................... 95, 336
Chi, Fu-An ................................................... 45, 216
Chi, Shyh-ching ......................................... 112, 374
Chiang, Pei-Ming ......................................... 44, 209
Chiang, Wei-Hao ....................................... 105, 365
Chien, Yung-Tsai ......................................... 35, 182
Chiu, Chia-Yi ............................................... 13, 126
Cho, Sun-Joo ................................................ 70, 265
Choi, In-Hee ........................................... 37, 93, 330
Choi, Jinnie .................................................. 68, 260
Choi, Jiwon .................................................. 91, 321
Choi, Youn-Jeng .................................. 70, 265, 266
Choi, Younyoung ................................... 37, 73, 273
Chou, Lan-fang ............................................ 91, 320
Chou, Yeh-Tai ............................................. 26, 164
Chow, Kui-Foon .......... 76, 112, 113, 284, 376, 380
Chow, Sy-Miin ........................................... 100, 350
Chung, Pei-Chun ............................ 43, 92, 207, 325
Chung, Yen-Chao ........................................ 97, 345
Chung, Yeojin .............................................. 76, 282
Cohen, Allan S. .................................... 70, 265, 266
Cohen, Yoav ................................................ 25, 160
Conger, Rand ............................................... 97, 344
Conijn, Judith ............................................... 55, 236
Crane, Paul K. ................................ 23, 36, 153, 186
Croon, Marcel A. 40, 49, 63, 84, 192, 246, 247, 300
Cruickshank, K ............................................ 71, 269
Cui, Ying ........................................ 21, 86, 149, 304
D
Dai, Haiqi ..................................................... 58, 243
Dai, Yunyun ................................................. 18, 141
Daniels, Lia .................................................. 75, 281
De Bastiani, Elisa ......................................... 97, 346
De Boeck, Paul .............................. 14, 82, 293, 294
de la Torre, Jimmy ......................... 1, 101, 110, 352
De Roover, Kim ........................................... 30, 168
De Vreese Luc, Pieter .......................................... 97
De Vreese, Luc Pieter ........................................ 346
Deniz, Eylem ............................................. 103, 361
Denny Borsboom ............................................. 4, 11
The 76th Annual and the 17th International Meeting of the Psychometric Society Page 396
Denny, Borsboom .............................................. 122
Depril, Dirk .................................................. 46, 222
Diakow, Ronli .................................14, 72, 130, 272
Ding, Shuliang ....... 13, 21, 44, 45, 64, 88, 129, 149,
211, 215, 249, 250, 309
Dobrovits, Ingrid ....................................... 112, 375
Dolan, Conor ..................................... 111, 372, 373
Dorie, Vincent ............................................. 76, 282
Douglas, Jeffrey ........................................... 83, 295
Draxler, Clemens ............................66, 74, 253, 277
Du, Wenjiu .................................................. 96, 342
Dumenci, Levent ................................. 31, 115, 384
Dunn, G ....................................................... 71, 269
E
Edwards, Michael ........................ 70, 106, 266, 371
Emons, Wilco ................... 12, 17, 55, 125, 137, 237
Engelhard, George ............................. 102, 355, 357
Erosheva, Elena ........................................... 23, 153
F
Falk, Carl ..................................................... 29, 167
Fan, Xiaoling ............................................... 77, 287
Fan, Yang-Wallentin ................................... 86, 304
Fang, Jie ....................................................... 23, 155
Fantahun, Mehreteab ................................... 71, 269
Feldman, Betsy J. ........................................ 36, 186
Ferrara, Steve ............................................... 32, 174
Ferrer, Emilio .............................................. 67, 256
Fleischer, Jens .............................................. 66, 254
Flores, Carlo ................................................ 76, 283
Fox, Jean-Paul ........................................... 111, 374
Fu, Zhi-Hui ................................................ 101, 354
Fung, Tze-ho ........................................ 23, 114, 156
G
Gan, Dengwen ............................................. 64, 250
Gao, Yan .........................................54, 93, 232, 328
Gao, Yanhong .............................................. 73, 275
Gates, Kathleen M. ...................................... 53, 228
Gatterer, Birgit ........................................... 112, 375
Gelman, Andrew .......................................... 76, 282
Gierl, Mark J. ................... 31, 42, 86, 172, 204, 304
Gomez, Rapson ............................................ 55, 236
Gomiero, Tiziano ......................................... 97, 346
González, Jorge ............................................ 78, 289
Gonzalez-Betanzos, Fabiola......................... 47, 223
Goodwin, Matthew ...................................... 53, 229
Govindasamy, Priyalatha ............................. 36, 187
Grady, Matt .......................................................... 80
Grasman, Raoul P. P. P. ....................... 82, 293, 294
Gruber, Kathrin ............................................ 95, 337
Gruhl, Jonathan ............................................ 23, 153
Gu, Hai-Gen ................................................. 69, 263
Guillard, Gilles ........................................... 102, 358
Guo, Congying ............................................. 47, 222
Guo, Kaiyin .................................................. 89, 312
Gwak, Gyeong-ryeon ................................... 94, 333
H
Hagenaars, Jacques A. ......................... 63, 246, 247
Hagge, Sarah ................................................ 83, 297
Halpin, Peter F. .................................... 82, 293, 294
Han van der Maas ................................................ 11
Han van der, Maas ............................................. 122
Han, Yuna .................................................... 39, 190
Hansen, Mark ....................................... 19, 143, 144
Hashiguchi, Hiroki ....................................... 81, 291
Hashimoto, Takamitsu ................................. 32, 175
Hattie, John .................................................. 78, 290
Hatzinger, Reinhold ..................... 95, 112, 337, 375
Hau, Kit-Tai ................................................. 44, 210
Hayashi, Kentaro ......................................... 98, 349
Hayashi, Norio ............................................. 22, 152
He, Mengjie ................................... 54, 93, 232, 328
He, Qiwei ................................................... 105, 368
He, Sam .................................................................. 7
He, Wei ........................................................ 56, 238
The 76th Annual and the 17th International Meeting of the Psychometric Society Page 397
Heiser, Willem J. ................................................. 62
Hendrickson, Amy ..................................... 102, 355
Hessen, David J. .......................................... 33, 179
Hiroyuki, Tsurumi ....................................... 16, 135
Ho, Andrew ................................................. 86, 364
Hoijtink, Herbert ..... 2, 15, 23, 33, 61, 132, 176, 179
Holtzman, Steven....................................... 116, 389
Hong, Chang-nam ................................ 94, 333, 334
Hong, Sungjin .............................................. 34, 180
Hong, Zuway-R .......... 105, 116, 366, 368, 387, 388
Hontangas, Pedro ....................................... 101, 352
Hoshino, Takahiro ................................. 60, 73, 274
Hou, Yaling ................................................. 90, 319
Houts, Carrie ................................................ 70, 266
Hsiao, Chia-Wei .............................42, 97, 205, 345
Hsieh, Chueh-An ....................................... 104, 363
Hsieh, Hsing-Chuan ..................................... 85, 302
Hsieh, Mingchuan ........................................ 78, 288
Hsieh, Pei-Jung ............................................ 40, 194
Hsieh, Tien-Yu ............................................ 76, 284
Hsu, Chun-Yu .............................................. 93, 327
Hsu, I-Hau ................................................... 84, 299
Hsu, Nan-Jung ............................................. 91, 322
Hsueh, Jen-Hua .......................................... 114, 383
Hu, Xiangen ................................................. 32, 174
Huang, Chien-Yi .......................................... 91, 320
Huang, Hsin-Ying ........................................ 92, 324
Huang, I-Chan ........................................... 113, 378
Huang, Muhui .............................................. 18, 142
Huang, Pei-Tzu ............................................ 77, 285
Huang, Po-Hsien .......................................... 17, 139
Huang, Tsai-Wei .......................................... 31, 171
Huang, Xiaoting .......................................... 36, 185
Huang, Yan-Lin ........................................... 35, 184
Hune, Kim Gee ............................................ 56, 238
Hung, Man ................................................... 39, 191
Hung, Pi-Hsia ........... 41, 42, 91, 199, 205, 320, 321
Hung, Su-Ping ............................................. 93, 327
Hwang, Heungsun .................. 30, 67, 168, 256, 258
I
Ikehara, Kazuya ........................................... 25, 160
Ip, Edward .................................................... 14, 129
Irribarra, David Torres ................................. 14, 130
Islam, A.Y.M Atiquil ................................... 74, 277
Iwama, Norikazu .......................................... 96, 339
J
Jacob, Sunday ............................................ 116, 390
Jak, Suzanne ............................................... 111, 373
Jang, Sheu Jen .............................................. 45, 216
Janssen, Rianne ............................................ 78, 289
Jatnika, Ratna ............................................... 69, 264
Jennrich, Robert I. ........................................ 85, 301
Jeon, Minjeong ............................................. 32, 174
Jian, Xiao-Zhu .... 18, 31, 35, 39, 142, 172, 182, 190
Jiang, Lu ...................................................... 44, 213
Jiao, Can .......................... 34, 39, 73, 181, 190, 274
Jiao, Hong .................................................... 22, 153
Jin, Kuan-Yu ................ 76, 112, 115, 284, 376, 386
Johar, Elia Md .............................................. 87, 307
Johnson, Matthew ................................ 26, 108, 163
Jung, Jiyoung ............................................... 90, 318
Jung, Kwanghee ............................. 30, 67, 168, 256
Junker, Brian .................................... 15, 21, 57, 240
K
Kamakura, Wagner A. ................................... 61, 68
Kang, Chunhua ............................................ 31, 170
Kano, Yutaka ......................................... 20, 60, 147
Kao, Shu-Chuan ........................................... 66, 255
Kaplan, David .............................. 23, 103, 109, 154
Karabatsos, George .............................................. 80
Kato, Kentaro ............................................... 95, 335
Ke, Ming-Jin ................................................ 40, 193
Keith, A. Markus ......................................... 11, 123
Kelderman, Henk ................................... 52, 99, 227
The 76th Annual and the 17th International Meeting of the Psychometric Society Page 398
khairani, Ahmad Zamri ................................ 78, 289
Kim, Daeseok ............................................ 114, 382
Kim, EunSook ............................................. 96, 340
Kim, Hanjoe ................................................ 81, 292
Kim, Hyejin ......................................... 94, 333, 334
Kim, Jeong Bon ........................................... 40, 193
Kim, Seock-Ho ... 15, 26, 43, 70, 133, 208, 265, 266
Kim, Sukwoo ..................................43, 70, 208, 265
Kim, Sunghoon ............................................ 42, 202
Kim, YoungKoung ...................................... 26, 163
Kittagali, Anilkumar .................................... 77, 286
Klassen, Robert ............................................ 75, 281
Klugkist, Irene .......................................... 2, 57, 242
Kobayashi, Natsuko ..................................... 22, 152
Koehn, Hans-Friedrich .............................. 117, 391
Kohei, Adachi ........................................ 16, 67, 136
Kollenburg, Geert van ................................. 40, 192
Kopf, Julia ................................................... 18, 140
Kosinski, Michal S. ........ 58, 93, 105, 243, 329, 366
Kroonenberg, Pieter M. ............ 16, 29, 84, 166, 298
Kruyen, Peter ............................................... 17, 137
Kubo, Saori .................................................. 95, 338
Kuijpers, Renske E. ..................................... 63, 247
Kuo, Bor-Chen13, 35, 54, 58, 76, 77, 87, 88, 96, 97,
112, 128, 182, 234, 245, 283, 285, 287, 306, 308,
340, 346, 377
Kuo, Jar-Wen ..................................92, 93, 325, 327
Kuppens, Peter ........................................... 100, 350
Kwak, Kyuseop ................................................... 61
Kwan, Lok Yin Joyce .................................. 95, 336
Kwan, Paula ............................................... 113, 380
Kwan, Reggie .............................................. 58, 244
Kwok, Oi-Man ................................76, 89, 314, 315
Kwon, Yoon Jung ........................................ 42, 202
L
Lai, Hollis .......................................31, 42, 172, 204
Larocque, Denis ......................................... 117, 391
Le, Luc T ................................................... 102, 356
Lee, Chansoon ............................................. 96, 342
Lee, Daeyong ............................................... 43, 208
Lee, Guemin . 42, 45, 54, 90, 91, 202, 217, 231, 318,
321, 323
Lee, Jang-Han .............................................. 67, 258
Lee, Ji Eun ................................................... 96, 341
Lee, Kung-Hsien ........................................ 106, 369
Lee, Moonsoo .............................................. 19, 144
Lee, Pei-Yu .................................................. 93, 327
Lee, Seowoo ................................................. 43, 208
Lee, Sik-Yum ....................................................... 51
Lee, Soonmook .............................. 81, 96, 292, 342
Lee, Taehun ............................................... 103, 360
Lee, Wei-Ching ............................................ 75, 280
Lee, Won-Chan ...................................... 17, 54, 233
Lee, Yen ....................................................... 16, 136
Lee, Yongsang ........................................... 101, 354
Lee, Young-Sun ............................. 13, 31, 128, 170
Lee, Yuan-Hsuan ......................... 89, 114, 314, 382
Leenen, Iwin ........................................ 33, 101, 352
Lehrer, Rich ................................................. 72, 270
Leighton, Jacqueline P. ................................ 47, 224
Leonard, Noelle ........................................... 94, 332
Leung, Chi Keung Eddie .............................. 35, 183
Leung, Kat ................................................... 58, 244
Leung, Shing On ............................ 65, 69, 251, 264
Leutner, Detlev ............................................ 66, 254
Levine, Douglas ........................................... 24, 157
Li, Dongping ................................................ 46, 219
Li, Gang ....................................................... 42, 203
Li, Guang ..................................................... 44, 213
Li, Guangming ............................... 33, 89, 176, 312
Li, Jay-Shake ............................................... 92, 326
Li, Johnson Ching Hong .. 42, 75, 86, 204, 281, 304
Li, Lijuan ..................................................... 74, 275
Li, Ming-Yong ............................................. 35, 182
Li, Runze ...................................................... 53, 230
Li, Tony ............................................................. 220
The 76th Annual and the 17th International Meeting of the Psychometric Society Page 399
Li, Wei-Chun ............................................... 47, 223
Li, Xiang ...................................................... 44, 213
Li, Xiaopeng ................................................ 39, 189
Li, Yingwu ................................................... 91, 323
Li, Yongbo ................................................... 45, 213
Li, Zhen ....................................................... 22, 151
Li, Zhushan ................... 22, 113, 117, 152, 378, 390
Liang, Shuyi ................................................ 57, 241
Liao, Ting-Yao ............................................ 87, 306
Liao, Xiaolan ............................................... 97, 344
Ligtvoet, Rudy ........................................... 117, 392
Lim, Euijin ................................................... 54, 231
Lim, Hwangkyu ..............................54, 91, 231, 323
Lim, Jooseop ................................................ 40, 193
Lim, Junbum ................................................ 91, 323
Lin, Chia-Hua .............................................. 76, 283
Lin, Chia-Jung ........................................... 116, 388
Lin, Chien-Fu .............................................. 92, 326
Lin, Chien-ho ............................................... 42, 205
Lin, Chin-Kai ............................................... 58, 245
Lin, Jing-Jiun ............................................... 18, 142
Lin, Jyun-Ji .................................................. 88, 311
Lin, Keng-Min ............................................. 40, 192
Lin, Li-Yu .................................................... 42, 203
Lin, Nan ..................................................... 101, 354
Lin, Shin-Huei ............................................. 41, 196
Lin, Sieh-Hwa .............................................. 40, 194
Lin, Su-Wei ..... 41, 42, 91, 196, 197, 198, 199, 200,
203, 320
Lin, Ting Hsiang .......................................... 56, 237
Lin, Tzu-Yao ............................................... 90, 318
Lin, Wan-Ying ............................................. 98, 348
Lin, Wei-Sheng ............................................ 92, 324
Lin, Wen-Shin ............................................. 41, 198
Ling, Guangming ......................................... 25, 162
Liu, Cheng ................................................... 55, 234
Liu, Chen-Wei ............................................. 68, 261
Liu, Fang...................................................... 77, 287
Liu, Guixiong ............................................... 39, 189
Liu, Hongyun ................................. 15, 44, 134, 210
Liu, Hsiang-Chuan ....................................... 87, 306
Liu, Hsin-Yun .............................................. 90, 316
Liu, Hui .......................................... 18, 44, 142, 211
Liu, Jingchen .................................. 21, 76, 147, 282
Liu, Kun-Shia ............................................... 55, 235
Liu, Siwei ..................................................... 53, 229
Liu, Su-Fen .................................................. 39, 191
Liu, Tien-Hsiang .......................................... 26, 164
Liu, Xing ...................................................... 84, 298
Liu, Yan ....................................................... 83, 296
Liu, Yang ..................................................... 70, 267
Liu, Yu-Lung ............................................... 87, 306
Lo, Lawrence L. ......................................... 100, 351
Lodewyckx, Tom ....................................... 100, 350
Long, Ying ................................................... 45, 214
Lu, Szu-Cheng ............................................. 93, 330
Lu, Yu-Ju ..................................................... 97, 346
Lu, Zhaohua ............................................... 103, 359
Lu, Zhenqiu ................................................ 115, 385
Lubke, Gitta ............................................... 115, 385
Luh, Wei-ming ....................................... 24, 43, 207
Luo, Fang ..................................................... 43, 206
Luo, Fen ....................................................... 45, 215
Luo, Hao ...................................................... 86, 304
Lyhagen, Johan ...................................... 34, 86, 180
M
Ma, Shao qi .................................................. 39, 189
Ma, Song-Wei .............................................. 44, 209
Ma, Wenchao ............................................... 43, 206
MacKinnon, David P. .................................. 90, 317
Macready, George ........................................ 22, 153
Magis, David ................................................ 33, 176
Mair, Patrick ...................................................... 4, 7
Mantesso, Ulrico .......................................... 97, 346
Mao, Mengmeng .......................................... 44, 211
Mao, Xiuzhen ................................. 64, 88, 249, 309
The 76th Annual and the 17th International Meeting of the Psychometric Society Page 400
Mao, Yan ..................................................... 45, 216
Markus, Keith A. ...................... 11, 28, 53, 105, 230
Marshall, Thomas ........................................ 68, 259
Marya, Viorst-Gwadz .................................. 94, 332
Masyn, Katherine E. .................................... 36, 186
Maul, Andrew ...................................................... 11
Mayekawa, Shin-ichi ......................22, 24, 151, 156
McClellan, Catherine ........................... 55, 116, 389
McGuire, Leah ............................................. 70, 265
McNamee, R ................................................ 71, 269
Medrano, Hilda ............................................ 76, 283
Meijer, Rob R. ................................56, 79, 117, 393
Meng, Lixin ................................................. 56, 239
Meng, Xiang Bin ............................56, 83, 239, 295
Millsap, Roger ................................27, 67, 115, 257
Mislevy, Robert ........................................... 73, 273
Mittelhaëuser, Marie-Anne .......................... 12, 124
Miyazaki, Kei .............................................. 73, 274
Miyazaki, Yasuo .................................. 76, 117, 281
Mo, Lun ....................................................... 32, 174
Mok, Magdalena Mo Ching ... 69, 74, 110, 263, 264,
276
Molenaar, Dylan ........................................ 111, 372
Molenaar, Peter C. M. .......... 53, 100, 228, 229, 351
Molenberghs, Geert ............................. 71, 268, 269
Monroe, Scott .............................................. 19, 145
Mordeno, Imelu ........................................... 44, 212
Moskowitz, Debbie S. ................................. 67, 258
Mukherjee, Shubhabrata .............................. 36, 186
Murakami, Takashi ...................................... 30, 169
Musalek, Martin .......................................... 87, 307
Muthén, Bengt ....................................... 20, 37, 146
Myung, Jay ................................................ 106, 371
N
Nakagawa, Shigekazu .................................. 81, 291
Nam, Jiyoung ....................................... 94, 333, 334
Neale, Michael, C. ....................................... 68, 259
Nevalainen, Jaakko .................................... 117, 391
Nguyen, Van .............................................. 102, 356
Niki, Naoto................................................... 81, 291
Ning, Jianhui ................................................ 86, 303
Nishida, Yutaka ........................................... 57, 240
Nogami, Yasuko .......................................... 22, 152
Nordin, Mohamad Sahari ............................. 87, 307
Nussbaum, Markus .................................... 102, 358
O
Ogasawara, Haruhiko ........................... 81, 104, 291
Oh, Jeonghwa ............................................... 91, 321
Ohashi, Kotaro ........................................... 115, 385
Oja, Hannu ................................................. 117, 391
Okada, Akinori ............................................. 16, 135
Okada, Kensuke ........................................... 17, 138
Okubo, Tomoya ........................................... 24, 156
Olea, Julio .................................... 21, 106, 148, 371
Olivares-Aguilar, Margarita ......................... 67, 257
Ong, Saw Lan ................................ 36, 75, 187, 279
Oort, Frans ................................................. 111, 373
Oravecz, Zita ................................................ 82, 294
Ornstein, Petra ............................................. 34, 180
Otsu, Tatsuo ................................................. 32, 175
Ou, Yung Chih ............................................. 46, 218
Ozaki, Koken ............................................... 47, 226
P
Pai, Kai-Chih ............................................... 54, 234
Pan, J ............................................................ 71, 269
Pan, Szu-En .................................................. 97, 345
Pan, Yirao .................................................... 64, 250
Park, Yeonbok ............................................. 90, 318
Park, Yoon Soo .............................. 13, 31, 128, 170
Pitt, Mark ................................................... 106, 371
Ponsoda, Vicente ....................................... 101, 352
Por, Han-Hui ................................................ 69, 262
Postma, Albert ............................................. 57, 242
Preacher, Kristopher J. ................................. 85, 301
The 76th Annual and the 17th International Meeting of the Psychometric Society Page 401
Q
Qu, Xingjie .......................................... 45, 214, 216
Quinn, Gwendolyn ..................................... 113, 378
R
Ra, Jongmin ................................. 15, 114, 133, 382
Rabe-Hesketh, Sophia ...... 21, 68, 76, 150, 260, 282
Raiche, Gilles .............................................. 33, 176
Ram, Nilam .................................................. 53, 228
Ramon, Barrada Juan ................... 47, 106, 223, 371
Ratna, Jatnika .............................................. 40, 195
Razak, Nordin Abd. ................................... 113, 379
Reynolds, Arthur J. .................................... 104, 364
Ricker-Pedley, Kathryn ............................... 25, 161
Rijmen, Frank .............................................. 52, 227
Ritchie, Amanda .......................................... 94, 332
Ro, Shungwon ................................83, 96, 297, 341
Rojas, Guaner .............................................. 21, 148
Roussos, Louis ........................................... 117, 390
Rovine, Michael J. ................ 53, 100, 228, 229, 351
Rusch, Thomas ...................................... 4, 112, 375
Rust, John N. .................. 58, 93, 105, 243, 329, 366
Ryoo, Ji Hoon .................................... 104, 364, 365
Ryu, Ehri...................................................... 84, 300
S
Salleh, Mahaya .......................................... 113, 379
Samore, Matthew ......................................... 39, 191
San Martin, Ernesto ........................68, 78, 260, 289
Sano, Makoto ............................................... 65, 252
Savalei, Victoria .......................................... 29, 167
Schmid, Amy ............................................... 94, 332
Schuster, Christof ................................ 66, 113, 253
Schwartz, Robert ......................................... 72, 271
Schweizer, Karl ........................................... 75, 279
Sean, Keeley ...................................................... 220
Sebastien, Van Bellegem ................................... 100
Seol, Jaehoon ............................................... 83, 297
Serroyen, Jan ............................................... 71, 268
Shang, Zhiyong ............................................ 88, 309
Sheeber, Lisa .............................................. 100, 350
Shein, Paichi Pat .......................................... 55, 235
Shenkman, Elizabeth .................................. 113, 378
Sherwood, Andrew .................................... 100, 350
Sheu, Jen Jang .............................................. 46, 218
Shi, Danghui ........................................ 45, 213, 214
Shi, Dexin .................................................... 96, 343
Shi, Ning-Zhong .......................... 83, 101, 295, 354
Shiffman, Saul ............................................. 53, 230
Shih, Ching-Lin26, 43, 55, 98, 164, 165, 206, 235, 348
Shih, Shu-Chuan .......................................... 77, 285
Shim, Dahee ................................................. 43, 208
Shin, Seonho ................................................ 83, 297
Shiyko, Mariya ............................................. 53, 230
Shkedy, Ziv .................................................. 71, 269
Shyu, Chiou-Yueh ......................... 41, 44, 198, 212
Sijtsma, Klaas9, 12, 14, 17, 33, 37, 55, 118, 119, 124,
131, 137, 179, 237
Skrondal, Anders ................................... 25, 66, 109
Smithson, Michael ....................................... 69, 261
Smits, Iris A.M. .......................................... 117, 393
Sobel, Michael E. ................................... 20, 73, 146
Song, Byron Y. ............................................ 40, 193
Song, Hairong .................. 33, 96, 98, 177, 343, 347
Song, Lihong ................................................ 21, 149
Song, Xinyuan ........................................... 103, 359
Spindler, Sabine A. K. ................................. 93, 329
Spoden, Christian ......................................... 66, 254
Stahl, John .................................................... 66, 255
Steinley, Douglas ....................................... 117, 391
Stillwell, David J. ......................... 93, 105, 329, 366
Stockdale, Gary ............................................ 97, 344
Straat, Hendrik ............................................. 14, 131
Strobl, Carolin ...................................... 18, 107, 140
Su, Chi-Ming ............................................... 15, 133
Su, Ya-Hui ..................................... 18, 35, 142, 184
Suah, See Ling ............................................. 75, 279
The 76th Annual and the 17th International Meeting of the Psychometric Society Page 402
Sudsaen, Pattarasuda ................................... 15, 132
Sun, Guo-Wei .............................................. 98, 348
Sun, Hui Ju .................................................. 91, 321
Sun, Jianan ................................................... 13, 127
Sun, Luning ................................. 93, 105, 329, 366
Sun, Shuyan ........................................... 26, 37, 163
Sung, Pei-Ju ................................................. 41, 199
Sung, Yao-Ting ..............................44, 92, 211, 325
Sweet, Tracy ................................................ 57, 240
Syu, Jia-Jia ......................................43, 92, 207, 325
T
Tai, Wen Chun ............................................. 95, 338
Takai, Keiji .................................................. 20, 145
Takane, Yoshio ... 16, 23, 30, 67, 137, 154, 168, 256
Tam, Hak Ping ............................................. 74, 278
Tan, Frans E.S. ...................................... 57, 71, 268
Tan, Wen ..................................................... 45, 216
Tan, Xianming ............................................. 53, 230
Tan, Xiaolan ................................................ 24, 158
Tang, Jiuyuan .............................................. 45, 214
Tang, Shuwen .............................................. 24, 158
Tang, Yun .................................................. 106, 371
Tao, Chun-Hao ............................................ 44, 210
Tao, Jian ......................... 56, 83, 101, 239, 295, 354
Tein, Jenn-Yun ............................ 90, 103, 317, 360
ten Berge, Jos M.F. .........................30, 84, 118, 169
Tendeiro, Jorge N. ....................................... 30, 169
Teo, Timothy ............................................... 75, 278
Terry, A. Robert .......................................... 96, 343
Terry, Ackerman .................................................. 10
Therriault, David ......................................... 97, 344
Thissen, David .................... 10, 19, 70, 88, 101, 267
Tijmstra, Jesper ............................................ 33, 179
Timmerman, Marieke E. 30, 85, 111, 117, 168, 302,
373, 393
Ting, Mu-Yu ...................................77, 87, 287, 306
Torres Irribarra, David ......................................... 72
Torres, Irribarra David ............................... 271, 272
Toudou, Naoya ............................................. 95, 335
Toyoda, Hideki .25, 95, 96, 115, 160, 338, 339, 385
Tsai, Chu-Chu .............................................. 26, 165
Tsai, Rung-Ching ..... 40, 91, 94, 192, 193, 322, 332
Tsai, Yahsun .............................................. 112, 377
Tsang, Philip ................................................ 58, 244
Tsao, Chieh-Ju ............................................. 96, 339
Tseng, Jui-Chiao .......................................... 90, 315
Tseng, Shiau-Chian ...................................... 54, 233
Tu, Chia-Ling ............................................... 94, 331
Tu, Jinlu ....................................................... 40, 194
Tuerlinckx, Francis ...................... 82, 100, 294, 350
Twu, Bor-Yaun .............................. 90, 93, 315, 330
Tze, Virginia Man Chung ............................ 75, 281
Tzou, Hueying ..17, 41, 44, 112, 140, 200, 209, 376
U
Urbano, Lorenzo-Seva ................................. 85, 302
Usami, Satoshi ............................................. 81, 292
V
van Assen, Marcel ........................................ 55, 237
Van Bellegem, Sebastien ................................... 352
van der Ark, L. Andries .. 14, 29, 63, 131, 166, 246,
247
van der Heijden, Peter G. M. ....................... 33, 179
van der Linden, Wim J. .......................... 32, 83, 174
van der Maas, Han ............................................... 11
van der Palm, Daniël .................................... 29, 166
van Ginkel, Joost R. ..................................... 29, 166
Van Mechelen, Iven ..................................... 46, 222
VandeBerg, Lisa .......................................... 73, 272
Vandekerckhove, Joachim ........................... 82, 294
Veldkamp, Bernard .................................... 105, 368
Verhagen, Josine .................................. 37, 111, 374
Vermunt, Jeroen K. ........................ 29, 84, 166, 300
Visser, Ingmar .............................................. 68, 259
von Davier, Alina A. .............................. 48, 78, 290
von Davier, Matthias .................. 50, 52, 69, 78, 228
The 76th Annual and the 17th International Meeting of the Psychometric Society Page 403
W
Walker, Stephen G. .............................................. 80
Wang, Bo ........................................25, 46, 162, 219
Wang, Chang-Sheng .................................... 41, 198
Wang, Christine, X. ................................... 102, 358
Wang, Chun ................................. 83, 116, 295, 387
Wang, Hsuan-Po .......................................... 97, 346
Wang, Jun .................................................... 77, 287
Wang, Lihshing ......................................... 104, 362
Wang, Li-Jun ............................................... 69, 263
Wang, Lina .................................................. 46, 219
Wang, Peng .................................................. 58, 243
Wang, Wen Chung 9, 15, 26, 51, 55, 68, 69, 76, 88,
101, 106, 113, 115, 133, 165, 235, 261, 263, 284,
311, 353, 369, 378, 386
Wang, Wenyi ............................................... 21, 149
Wang, Xian .................................................. 47, 224
Wang, Xiaoqing ........................................... 45, 215
Wang, Ya-Hsueh ......................................... 98, 348
Wang, Yanhui .............................................. 46, 219
Wang, Ye ..................................................... 97, 343
Wang, Yuchung ................................................. 303
Wang, Yue ................................................... 15, 134
Wang, Zhenlin ........................................... 102, 358
Watanabe, Hiroshi ....................................... 90, 317
Weger, Elisabeth .......................................... 97, 346
Weissman, Alexander .......................14, 22, 35, 131
Wen, Fur-Hsing ........................................... 92, 324
Wen, Jian-Bing ............................................ 88, 310
Weng, Li-Jen .......................... 17, 90, 139, 316, 318
Wiberg, Marie ............................................ 101, 355
Wicherts, Jelte ..................................................... 27
Wilderjans, Tom F. ...................................... 46, 221
Wilson, Mark . 13, 62, 65, 68, 72, 93, 101, 119, 260,
270, 271, 330, 354
Won, Suk Hye ............................................. 67, 258
Wong, Kenneth ............................................ 58, 244
Woodward, Todd S. ..................................... 30, 168
Wools, Saskia ............................................... 12, 126
Wu, Cheng Ken ............................................ 56, 237
Wu, Chiao-Ying ........................................... 17, 140
Wu, Cindy .................................................... 46, 218
Wu, Eric .................................................................. 7
Wu, Hao ....................................................... 68, 259
Wu, Huey-Min ............................... 54, 58, 234, 245
Wu, Huiping ................................................. 65, 251
Wu, Jiun-Yu ......................... 89, 114, 314, 315, 382
Wu, Joseph ................................................. 114, 384
Wu, Margaret ............................................... 74, 278
Wu, Nan-Yi .................................................. 34, 179
Wu, Pei-Chen ............................................... 94, 334
Wu, Shiu-Lien ............................................ 101, 353
Wu, Siou-Ying ............................................. 97, 345
Wu, Yan-Ru ................................................. 76, 284
Wu, Yi-Fang ................................................ 94, 331
Wu, Zhihui ................................................... 64, 249
X
Xi, Zhong'en ................................................ 65, 252
Xia, Wei ....................................................... 84, 298
Xiang, Rui .................................................... 89, 313
Xiao, Hanmin ............................................... 96, 342
Xiao, Ming ................................................... 83, 296
Xie, Fusheng ........................................ 45, 214, 216
Xie, Qin ........................................................ 69, 262
Xin, Tao . 13, 22, 31, 42, 64, 88, 127, 151, 170, 201,
248, 249, 309
Xiong, Minping ............................................ 57, 241
Xiong, Qingqing .......................................... 86, 305
Xu, Gongjun ................................................. 21, 147
Xu, Kun Jacob .............................................. 74, 276
Xu, Nicole Ruihui ........................................ 69, 264
Xu, Xueli ...................................................... 52, 228
Y
Yamamoto, Kentaro ..................................... 52, 228
Yamamoto, Michio ...................................... 85, 302
The 76th Annual and the 17th International Meeting of the Psychometric Society Page 404
Yan, Miewen ............................................... 44, 213
Yan, Yuanhai ............................................... 13, 129
Yang, Chen .................................................. 83, 296
Yang, Chih-Chien34, 77, 84, 87, 179, 285, 299, 306
Yang, Chih-Wei ................ 13, 77, 88, 128, 285, 308
Yang, Hee-Won ..............................42, 90, 202, 318
Yang, Hongwei ............................ 96, 103, 341, 361
Yang, Ji Seung ............................................. 19, 145
Yang, Lin-shan ............................................ 83, 296
Yang, Ming-Shan ........................................ 97, 345
Yang, Tao .......................................54, 93, 232, 328
Yang, Tingting ................................54, 93, 232, 328
Yang, Yen-Wen ........................................... 90, 315
Yang, Zhiming ............................................. 83, 296
Yao, Jingjing .............................................. 113, 380
Yao, Wei-Che .............................................. 66, 254
Yau, Han-Dau ............................. 54, 66, 74, 87, 254
Ye, Baojuan ................................................. 46, 219
Ye, Maolin ................................................... 83, 296
Yeon, Park Jung ........................................... 47, 225
Ying, Zhiliang .............................................. 21, 148
Yoon, Myeongsun ....................................... 96, 340
Yoon, Park So .............................................. 45, 217
You, Xuqun ................................................. 40, 194
Young, Kim Ja ............................................. 54, 233
Yousfi, Safir ................................................. 33, 178
Yu, Hsiu-Ting .................................................... 108
Yu, Keling ................................................... 36, 187
Yu, Min-Ning ......................... 43, 92, 207, 324, 325
Yu, Tien-Chi .............................................. 116, 388
Yu, Yongda .................................................. 91, 323
Yuan, Ke-Hai .................. 20, 66, 115, 146, 253, 386
Yuchung Wang .................................................... 86
Yulianto, Aries ............................................ 36, 188
Yung, Yiu-Fai .............................. 93, 114, 329, 381
Z
Zamri, Khairani Ahmad ............................. 113, 379
Zand Scholten, Annemarie ................................... 11
Zeileis, Achim .............................................. 18, 140
Zhang, Guangjian ........................... 16, 85, 135, 301
Zhang, Jie-Ting ............................................ 73, 274
Zhang, Li ...................................................... 65, 251
Zhang, Li Jin ................................................ 41, 200
Zhang, Mingqiang ........................................ 18, 142
Zhang, Min-Qiang 23, 24, 31, 33, 34, 35, 39, 57, 65,
73, 86, 89, 155, 158, 172, 176, 181, 182, 189, 190,
241, 251, 274, 275, 305, 312
Zhang, Nan nan ............................................ 39, 190
Zhang, Quan ................................................. 32, 173
Zhang, Shanshan .......................................... 44, 210
Zhang, Shumei ............................... 13, 42, 127, 201
Zhang, Wei................................................... 93, 329
Zhang, Yiping .............................................. 90, 317
Zhang, Zhen Feng ........................................ 41, 200
Zhang, Zhiyong .......................................... 115, 385
Zhao, Jiarong ............................................... 84, 298
Zhao, Qian ................................................... 42, 203
Zhao, Yue............................................. 54, 107, 232
Zhao, Zi ........................................................ 45, 214
Zheng, Dai ................................................... 45, 214
Zheng, Xian-Liang ....................................... 69, 263
Zhong, Xiaoling ......................................... 115, 386
Zhou, Lixing ................................................ 23, 154
Zhou, Yangming .......................................... 44, 213
Zhu, Hongtu ............................................... 100, 350
Zhu, Jianjun ................................................. 22, 153
Zhu, Jinxin ................................................... 42, 201
Zou, Dong-Ting ......................................... 105, 368
Zubairi, Ainol Madziah ................................ 87, 307
Zwaan, Rolf A. ............................................. 73, 272
Zwitser, Robert ............................................ 12, 125

The 76th Annual and the 17th International Meeting of the Psychometric Society Page 405
General Information
Time Limit of Each Presentation
To accommodate as many presentations as possible, 4 or 5 presentations are included in
each 80-minute paper parallel session. For 4-presentation parallel sessions, each
presentation runs for 18 minutes, including 15 minutes of talk and 3 minutes of Q&As. For
5-presentation parallel sessions, each presentation runs for 15 minutes, including 12 minutes
of talk and 3 minutes of Q&As.
For symposia including discussants, the organizer is responsible for time limit of each
presentation.
For poster presentations, poster board with size 1.8 X 1.2 meters are available for each
presentation.
Shuttle Bus Schedule
Conference shuttle are arranged for conference participates. The shuttle picks up
participates at Mass Transit Railway (MTR) University Station and drops off at Tai Po
campus of The Hong Kong Institute of Education, the conference venue.
The shuttle bus pick-up schedule is listed in the following:
Tuesday, 19 July, 2011 8:00 a.m. 8:20 a.m.
Wednesday, 20 July, 2011 8:20 a.m. 8:40 a.m.
Thursday, 21 July, 2011 8:20 a.m. 8:40 a.m.
Friday, 22 July, 2011 8:00 a.m. 8:20 a.m
In addition to the above schedule, participates may take the campus shuttle bus departing
from Tai Po campus to MTR University Station and departing from MTR University
Station to the Tai Po campus. The campus shuttle bus runs every 10 or 15 minutes during
conference time.

The 76th Annual and the 17th International Meeting of the Psychometric Society Page 406
Contingency Plan in Case of Inclement Weather
According to Severe Weather Arrangements, the contingency plan in case of inclement
weather is arranged as follows:
- If Tropical Cyclone (No.8 or above) or Black rainstorm warning is in force at or after
7:00 a.m.in the morning of 18 July, the morning session of the workshop will be
cancelled. If the above signals remain hoisted at 12:00 noon, the afternoon sessions will
be cancelled.
- If Tropical Cyclone (No.8 or above) or Black rainstorm warning is in force at or after
7:00 a.m.in the morning of 19, 20 or 21 July, the morning sessions and events will be
cancelled. If the above signals still hold at 11:30 a.m., the afternoon sessions and events
will be cancelled.
- If Tropical Cyclone (No.8 or above) or Black rainstorm warning is in force at or after
6:30 a.m.in the morning of 22 July, the morning sessions and events will be cancelled. If
the above signals still hold at 11:30 a.m., the afternoon sessions and events will be
cancelled.
- The announcement about the program that are rescheduled or cancelled in the event of
inclement weather will be put on the website to notify conference participants.
Internet Access
For conference participates who do not have a valid HKIEd network account and password,
they could use the HKIEd wireless network without encryption. Please note that using this
connection method, data is not encrypted while transferring over the air. Users should not
use public wireless network unencrypted for sensitive transactions. In addition, computer
rooms are available for use.
Emergency Number
In emergency situations, you can contact the local police, ambulance service, fire
department and other emergency services by calling 999.

The 76th Annual and the 17th International Meeting of the Psychometric Society Page 407
Hospitals
As an international city, Hong Kong has world-class hospitals providing outstanding care.
Visitors using Accident and Emergency services in Hong Kong public hospitals are charged
a set fee of HK$570 per visit, but will always be treated even if they cannot pay
immediately.
The nearest hospital from the conference venue is:
Alice Ho Miu Ling Nethersole Hospital (with 24-hour Accident and Emergency Service)
Address 11 Chuen On Road, Tai Po, NT
Tel: (852) 2689 2000
Fax: (852) 2662 1690
E-mail [email protected]
Website http://www3.ha.org.hk/ahnh/

The 76th Annual and the 17th International Meeting of the Psychometric Society Page 408
NOTES


www.ied.edu.hk/arc www.ied.edu.hk/ps
10 Lo Ping Road, Tai Po, New Territories, Hong Kong