pseudopolar smectic-$c$ phases of azo-substituted achiral
TRANSCRIPT
PHYSICAL REVIEW E 101, 012701 (2020)
Pseudopolar smectic-C phases of azo-substituted achiral bent-core hockey-stick-shaped molecules
Deepshika Malkar,1 M. Monika,2 Veena Prasad,2 and Arun Roy1,*
1Raman Research Institute, C. V. Raman Avenue, Sadashivanagar, Bangalore 560080, India2Centre For Nano and Soft Matter Sciences, Bangalore 560013, India
(Received 20 June 2019; revised manuscript received 5 September 2019; published 2 January 2020)
We report experimental studies on an azo-substituted compound consisting of bent-core hockey-stick-shapedmolecules. The experimental results establish two pseudopolar tilted smectic phases, which are characterizedby an in-plane axial-vector order parameter in addition to tilt order in the smectic layers. Electro-opticalmeasurements in the mesophases indicate that the birefringence of the sample strongly depends on the appliedelectric field. We develop a theoretical model to account for this observation. The change in the birefringenceof the sample arises from the field-induced reorientation of the tilt plane of the molecules in the layer abovea threshold field. The effect is analogous to the field-induced Freedericksz transition which is quadratic in theapplied electric field.
DOI: 10.1103/PhysRevE.101.012701
I. INTRODUCTION
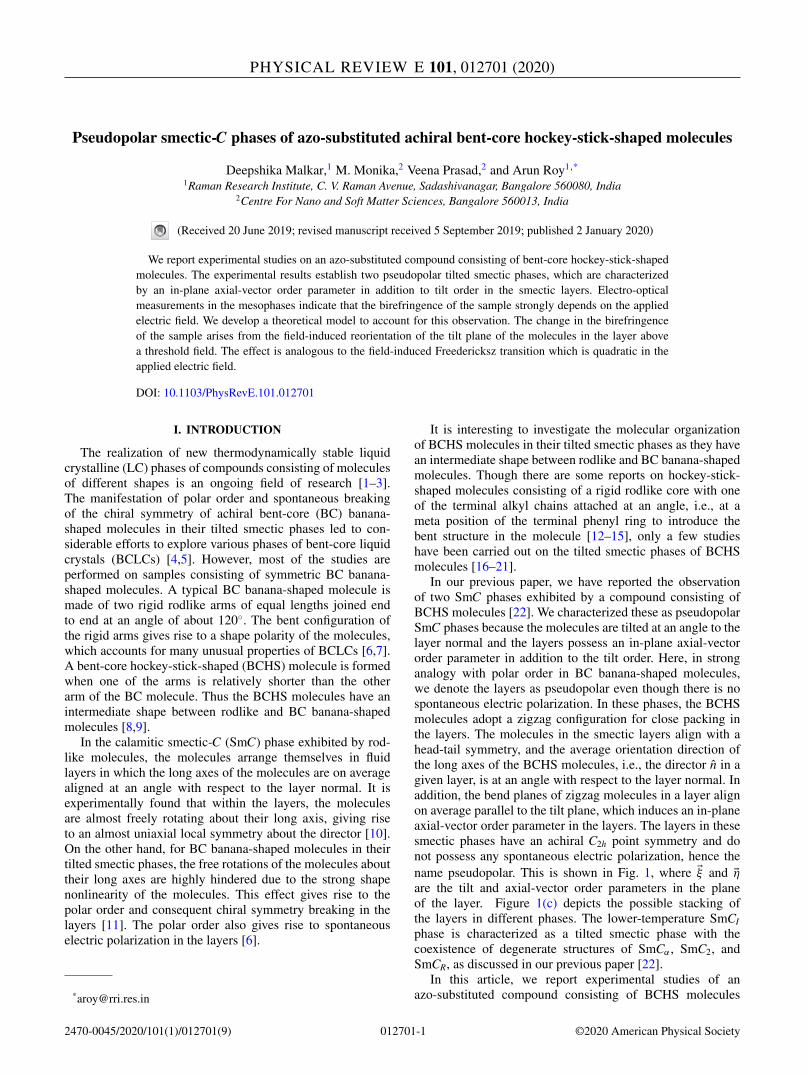
The realization of new thermodynamically stable liquidcrystalline (LC) phases of compounds consisting of moleculesof different shapes is an ongoing field of research [1–3].The manifestation of polar order and spontaneous breakingof the chiral symmetry of achiral bent-core (BC) banana-shaped molecules in their tilted smectic phases led to con-siderable efforts to explore various phases of bent-core liquidcrystals (BCLCs) [4,5]. However, most of the studies areperformed on samples consisting of symmetric BC banana-shaped molecules. A typical BC banana-shaped molecule ismade of two rigid rodlike arms of equal lengths joined endto end at an angle of about 120◦. The bent configuration ofthe rigid arms gives rise to a shape polarity of the molecules,which accounts for many unusual properties of BCLCs [6,7].A bent-core hockey-stick-shaped (BCHS) molecule is formedwhen one of the arms is relatively shorter than the otherarm of the BC molecule. Thus the BCHS molecules have anintermediate shape between rodlike and BC banana-shapedmolecules [8,9].
In the calamitic smectic-C (SmC) phase exhibited by rod-like molecules, the molecules arrange themselves in fluidlayers in which the long axes of the molecules are on averagealigned at an angle with respect to the layer normal. It isexperimentally found that within the layers, the moleculesare almost freely rotating about their long axis, giving riseto an almost uniaxial local symmetry about the director [10].On the other hand, for BC banana-shaped molecules in theirtilted smectic phases, the free rotations of the molecules abouttheir long axes are highly hindered due to the strong shapenonlinearity of the molecules. This effect gives rise to thepolar order and consequent chiral symmetry breaking in thelayers [11]. The polar order also gives rise to spontaneouselectric polarization in the layers [6].
It is interesting to investigate the molecular organizationof BCHS molecules in their tilted smectic phases as they havean intermediate shape between rodlike and BC banana-shapedmolecules. Though there are some reports on hockey-stick-shaped molecules consisting of a rigid rodlike core with oneof the terminal alkyl chains attached at an angle, i.e., at ameta position of the terminal phenyl ring to introduce thebent structure in the molecule [12–15], only a few studieshave been carried out on the tilted smectic phases of BCHSmolecules [16–21].
In our previous paper, we have reported the observationof two SmC phases exhibited by a compound consisting ofBCHS molecules [22]. We characterized these as pseudopolarSmC phases because the molecules are tilted at an angle to thelayer normal and the layers possess an in-plane axial-vectororder parameter in addition to the tilt order. Here, in stronganalogy with polar order in BC banana-shaped molecules,we denote the layers as pseudopolar even though there is nospontaneous electric polarization. In these phases, the BCHSmolecules adopt a zigzag configuration for close packing inthe layers. The molecules in the smectic layers align with ahead-tail symmetry, and the average orientation direction ofthe long axes of the BCHS molecules, i.e., the director n̂ in agiven layer, is at an angle with respect to the layer normal. Inaddition, the bend planes of zigzag molecules in a layer alignon average parallel to the tilt plane, which induces an in-planeaxial-vector order parameter in the layers. The layers in thesesmectic phases have an achiral C2h point symmetry and donot possess any spontaneous electric polarization, hence thename pseudopolar. This is shown in Fig. 1, where �ξ and �ηare the tilt and axial-vector order parameters in the planeof the layer. Figure 1(c) depicts the possible stacking ofthe layers in different phases. The lower-temperature SmCI
phase is characterized as a tilted smectic phase with thecoexistence of degenerate structures of SmCα , SmC2, andSmCR, as discussed in our previous paper [22].
In this article, we report experimental studies of anazo-substituted compound consisting of BCHS molecules
2470-0045/2020/101(1)/012701(9) 012701-1 ©2020 American Physical Society
MALKAR, MONIKA, PRASAD, AND ROY PHYSICAL REVIEW E 101, 012701 (2020)
FIG. 1. (a) The zigzag configuration of the molecules in thelayer. (b) The schematic representation of the order parameters ina given layer. (c) The possible layer stacking of the zigzag moleculesin different tilted smectic phases (from Ref. [22]).
exhibiting similar tilted smectic phases. We also develop atheoretical model to describe the effect of an external electricfield on the structure of these phases, which accounts for theobserved electro-optic properties of the samples.
II. EXPERIMENTAL RESULTS
A. Sample and calorimetric studies
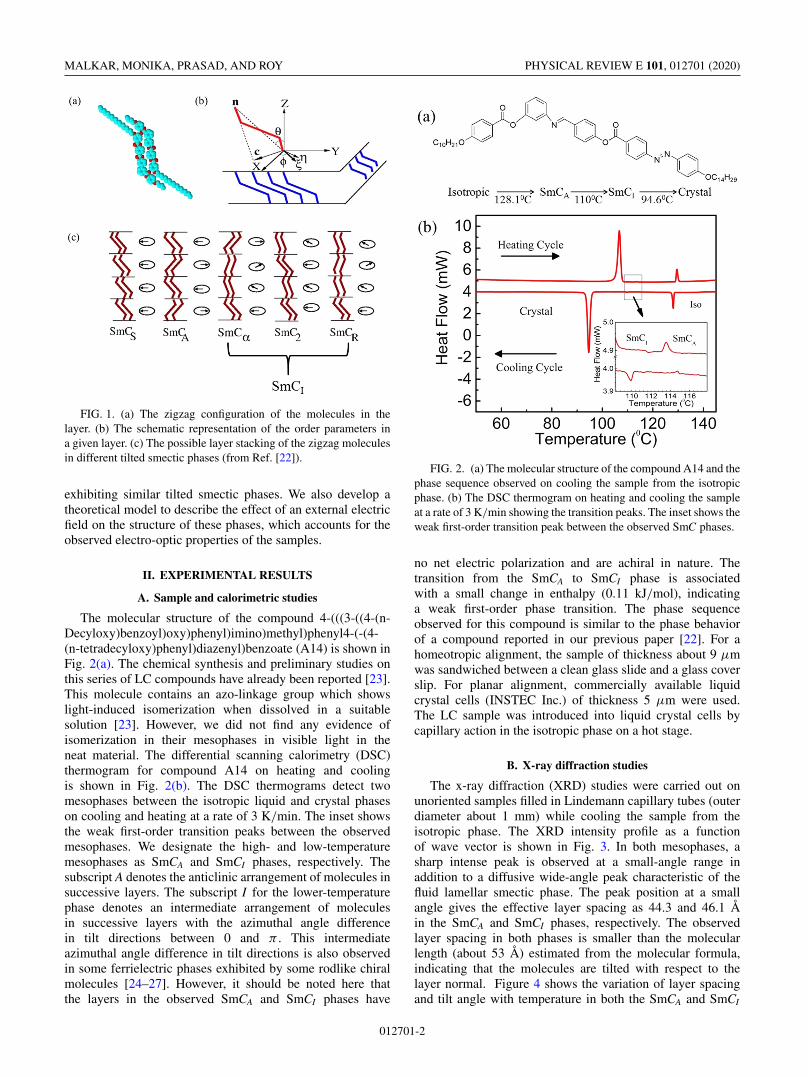
The molecular structure of the compound 4-(((3-((4-(n-Decyloxy)benzoyl)oxy)phenyl)imino)methyl)phenyl4-(-(4-(n-tetradecyloxy)phenyl)diazenyl)benzoate (A14) is shown inFig. 2(a). The chemical synthesis and preliminary studies onthis series of LC compounds have already been reported [23].This molecule contains an azo-linkage group which showslight-induced isomerization when dissolved in a suitablesolution [23]. However, we did not find any evidence ofisomerization in their mesophases in visible light in theneat material. The differential scanning calorimetry (DSC)thermogram for compound A14 on heating and coolingis shown in Fig. 2(b). The DSC thermograms detect twomesophases between the isotropic liquid and crystal phaseson cooling and heating at a rate of 3 K/min. The inset showsthe weak first-order transition peaks between the observedmesophases. We designate the high- and low-temperaturemesophases as SmCA and SmCI phases, respectively. Thesubscript A denotes the anticlinic arrangement of molecules insuccessive layers. The subscript I for the lower-temperaturephase denotes an intermediate arrangement of moleculesin successive layers with the azimuthal angle differencein tilt directions between 0 and π . This intermediateazimuthal angle difference in tilt directions is also observedin some ferrielectric phases exhibited by some rodlike chiralmolecules [24–27]. However, it should be noted here thatthe layers in the observed SmCA and SmCI phases have
FIG. 2. (a) The molecular structure of the compound A14 and thephase sequence observed on cooling the sample from the isotropicphase. (b) The DSC thermogram on heating and cooling the sampleat a rate of 3 K/min showing the transition peaks. The inset shows theweak first-order transition peak between the observed SmC phases.
no net electric polarization and are achiral in nature. Thetransition from the SmCA to SmCI phase is associatedwith a small change in enthalpy (0.11 kJ/mol), indicatinga weak first-order phase transition. The phase sequenceobserved for this compound is similar to the phase behaviorof a compound reported in our previous paper [22]. For ahomeotropic alignment, the sample of thickness about 9 μmwas sandwiched between a clean glass slide and a glass coverslip. For planar alignment, commercially available liquidcrystal cells (INSTEC Inc.) of thickness 5 μm were used.The LC sample was introduced into liquid crystal cells bycapillary action in the isotropic phase on a hot stage.
B. X-ray diffraction studies
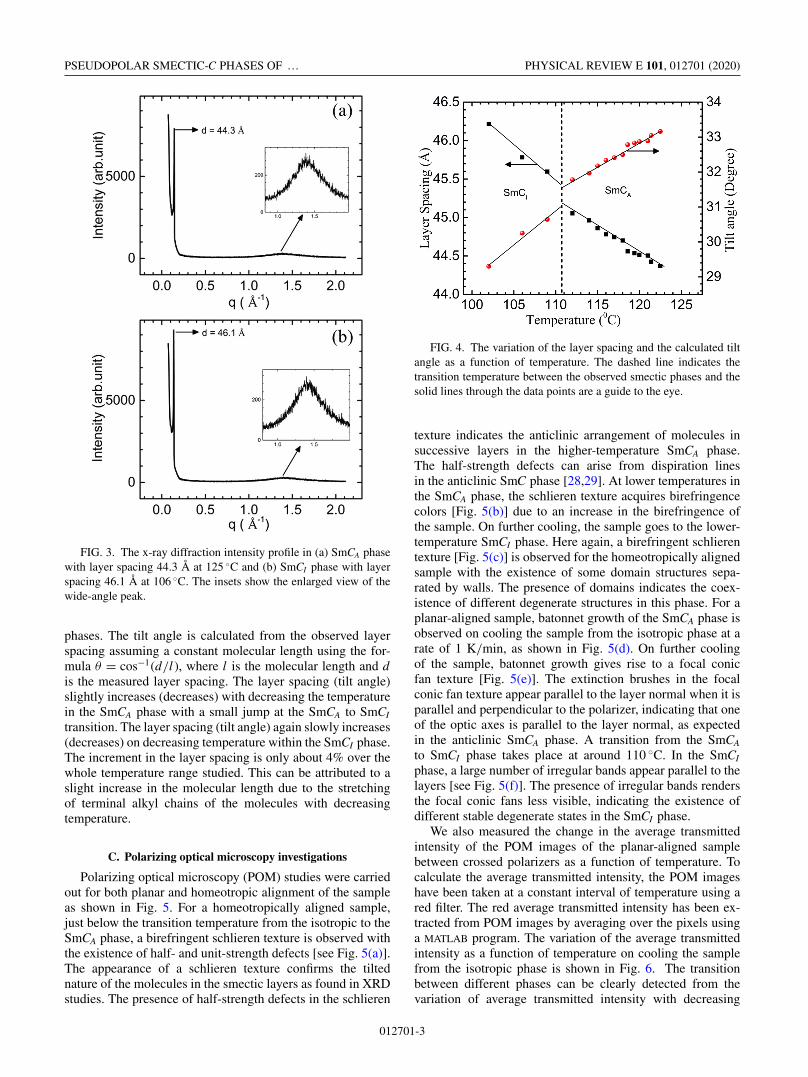
The x-ray diffraction (XRD) studies were carried out onunoriented samples filled in Lindemann capillary tubes (outerdiameter about 1 mm) while cooling the sample from theisotropic phase. The XRD intensity profile as a functionof wave vector is shown in Fig. 3. In both mesophases, asharp intense peak is observed at a small-angle range inaddition to a diffusive wide-angle peak characteristic of thefluid lamellar smectic phase. The peak position at a smallangle gives the effective layer spacing as 44.3 and 46.1 Åin the SmCA and SmCI phases, respectively. The observedlayer spacing in both phases is smaller than the molecularlength (about 53 Å) estimated from the molecular formula,indicating that the molecules are tilted with respect to thelayer normal. Figure 4 shows the variation of layer spacingand tilt angle with temperature in both the SmCA and SmCI
012701-2
PSEUDOPOLAR SMECTIC-C PHASES OF … PHYSICAL REVIEW E 101, 012701 (2020)
FIG. 3. The x-ray diffraction intensity profile in (a) SmCA phasewith layer spacing 44.3 Å at 125 ◦C and (b) SmCI phase with layerspacing 46.1 Å at 106 ◦C. The insets show the enlarged view of thewide-angle peak.
phases. The tilt angle is calculated from the observed layerspacing assuming a constant molecular length using the for-mula θ = cos−1(d/l ), where l is the molecular length and dis the measured layer spacing. The layer spacing (tilt angle)slightly increases (decreases) with decreasing the temperaturein the SmCA phase with a small jump at the SmCA to SmCI
transition. The layer spacing (tilt angle) again slowly increases(decreases) on decreasing temperature within the SmCI phase.The increment in the layer spacing is only about 4% over thewhole temperature range studied. This can be attributed to aslight increase in the molecular length due to the stretchingof terminal alkyl chains of the molecules with decreasingtemperature.
C. Polarizing optical microscopy investigations
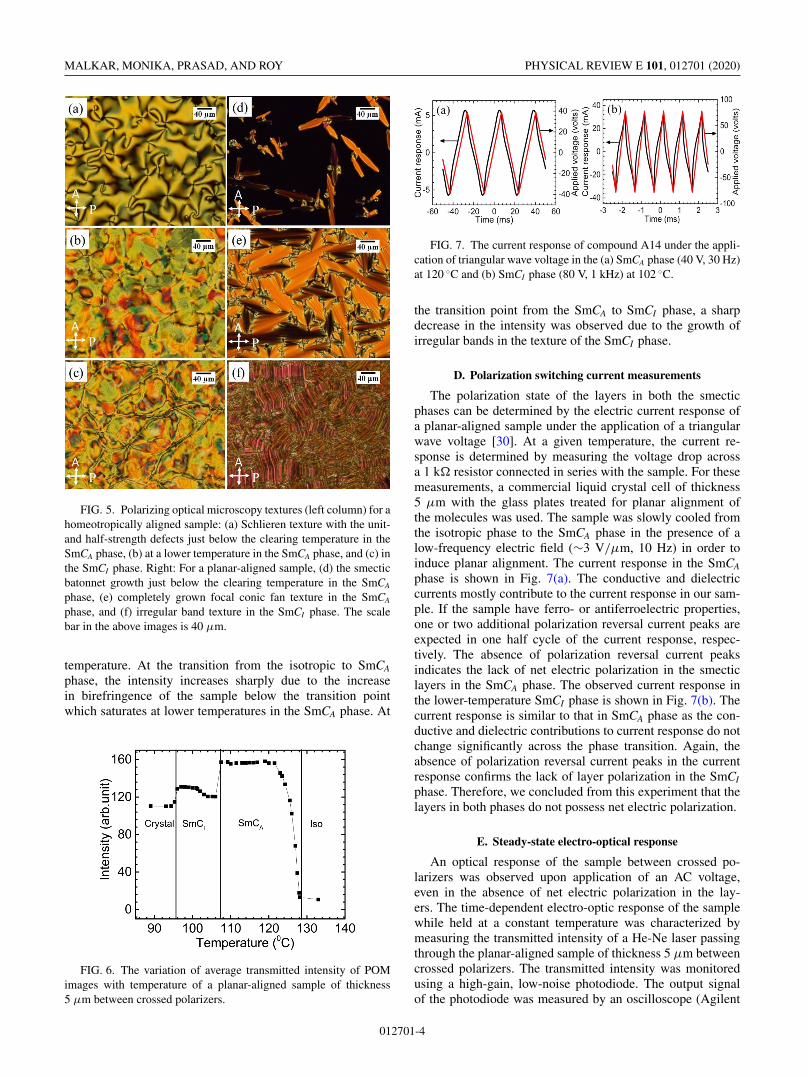
Polarizing optical microscopy (POM) studies were carriedout for both planar and homeotropic alignment of the sampleas shown in Fig. 5. For a homeotropically aligned sample,just below the transition temperature from the isotropic to theSmCA phase, a birefringent schlieren texture is observed withthe existence of half- and unit-strength defects [see Fig. 5(a)].The appearance of a schlieren texture confirms the tiltednature of the molecules in the smectic layers as found in XRDstudies. The presence of half-strength defects in the schlieren
FIG. 4. The variation of the layer spacing and the calculated tiltangle as a function of temperature. The dashed line indicates thetransition temperature between the observed smectic phases and thesolid lines through the data points are a guide to the eye.
texture indicates the anticlinic arrangement of molecules insuccessive layers in the higher-temperature SmCA phase.The half-strength defects can arise from dispiration linesin the anticlinic SmC phase [28,29]. At lower temperatures inthe SmCA phase, the schlieren texture acquires birefringencecolors [Fig. 5(b)] due to an increase in the birefringence ofthe sample. On further cooling, the sample goes to the lower-temperature SmCI phase. Here again, a birefringent schlierentexture [Fig. 5(c)] is observed for the homeotropically alignedsample with the existence of some domain structures sepa-rated by walls. The presence of domains indicates the coex-istence of different degenerate structures in this phase. For aplanar-aligned sample, batonnet growth of the SmCA phase isobserved on cooling the sample from the isotropic phase at arate of 1 K/min, as shown in Fig. 5(d). On further coolingof the sample, batonnet growth gives rise to a focal conicfan texture [Fig. 5(e)]. The extinction brushes in the focalconic fan texture appear parallel to the layer normal when it isparallel and perpendicular to the polarizer, indicating that oneof the optic axes is parallel to the layer normal, as expectedin the anticlinic SmCA phase. A transition from the SmCA
to SmCI phase takes place at around 110 ◦C. In the SmCI
phase, a large number of irregular bands appear parallel to thelayers [see Fig. 5(f)]. The presence of irregular bands rendersthe focal conic fans less visible, indicating the existence ofdifferent stable degenerate states in the SmCI phase.
We also measured the change in the average transmittedintensity of the POM images of the planar-aligned samplebetween crossed polarizers as a function of temperature. Tocalculate the average transmitted intensity, the POM imageshave been taken at a constant interval of temperature using ared filter. The red average transmitted intensity has been ex-tracted from POM images by averaging over the pixels usinga MATLAB program. The variation of the average transmittedintensity as a function of temperature on cooling the samplefrom the isotropic phase is shown in Fig. 6. The transitionbetween different phases can be clearly detected from thevariation of average transmitted intensity with decreasing
012701-3
MALKAR, MONIKA, PRASAD, AND ROY PHYSICAL REVIEW E 101, 012701 (2020)
FIG. 5. Polarizing optical microscopy textures (left column) for ahomeotropically aligned sample: (a) Schlieren texture with the unit-and half-strength defects just below the clearing temperature in theSmCA phase, (b) at a lower temperature in the SmCA phase, and (c) inthe SmCI phase. Right: For a planar-aligned sample, (d) the smecticbatonnet growth just below the clearing temperature in the SmCA
phase, (e) completely grown focal conic fan texture in the SmCA
phase, and (f) irregular band texture in the SmCI phase. The scalebar in the above images is 40 μm.
temperature. At the transition from the isotropic to SmCA
phase, the intensity increases sharply due to the increasein birefringence of the sample below the transition pointwhich saturates at lower temperatures in the SmCA phase. At
FIG. 6. The variation of average transmitted intensity of POMimages with temperature of a planar-aligned sample of thickness5 μm between crossed polarizers.
FIG. 7. The current response of compound A14 under the appli-cation of triangular wave voltage in the (a) SmCA phase (40 V, 30 Hz)at 120 ◦C and (b) SmCI phase (80 V, 1 kHz) at 102 ◦C.
the transition point from the SmCA to SmCI phase, a sharpdecrease in the intensity was observed due to the growth ofirregular bands in the texture of the SmCI phase.
D. Polarization switching current measurements
The polarization state of the layers in both the smecticphases can be determined by the electric current response ofa planar-aligned sample under the application of a triangularwave voltage [30]. At a given temperature, the current re-sponse is determined by measuring the voltage drop acrossa 1 k� resistor connected in series with the sample. For thesemeasurements, a commercial liquid crystal cell of thickness5 μm with the glass plates treated for planar alignment ofthe molecules was used. The sample was slowly cooled fromthe isotropic phase to the SmCA phase in the presence of alow-frequency electric field (∼3 V/μm, 10 Hz) in order toinduce planar alignment. The current response in the SmCA
phase is shown in Fig. 7(a). The conductive and dielectriccurrents mostly contribute to the current response in our sam-ple. If the sample have ferro- or antiferroelectric properties,one or two additional polarization reversal current peaks areexpected in one half cycle of the current response, respec-tively. The absence of polarization reversal current peaksindicates the lack of net electric polarization in the smecticlayers in the SmCA phase. The observed current response inthe lower-temperature SmCI phase is shown in Fig. 7(b). Thecurrent response is similar to that in SmCA phase as the con-ductive and dielectric contributions to current response do notchange significantly across the phase transition. Again, theabsence of polarization reversal current peaks in the currentresponse confirms the lack of layer polarization in the SmCI
phase. Therefore, we concluded from this experiment that thelayers in both phases do not possess net electric polarization.
E. Steady-state electro-optical response
An optical response of the sample between crossed po-larizers was observed upon application of an AC voltage,even in the absence of net electric polarization in the lay-ers. The time-dependent electro-optic response of the samplewhile held at a constant temperature was characterized bymeasuring the transmitted intensity of a He-Ne laser passingthrough the planar-aligned sample of thickness 5 μm betweencrossed polarizers. The transmitted intensity was monitoredusing a high-gain, low-noise photodiode. The output signalof the photodiode was measured by an oscilloscope (Agilent
012701-4
PSEUDOPOLAR SMECTIC-C PHASES OF … PHYSICAL REVIEW E 101, 012701 (2020)
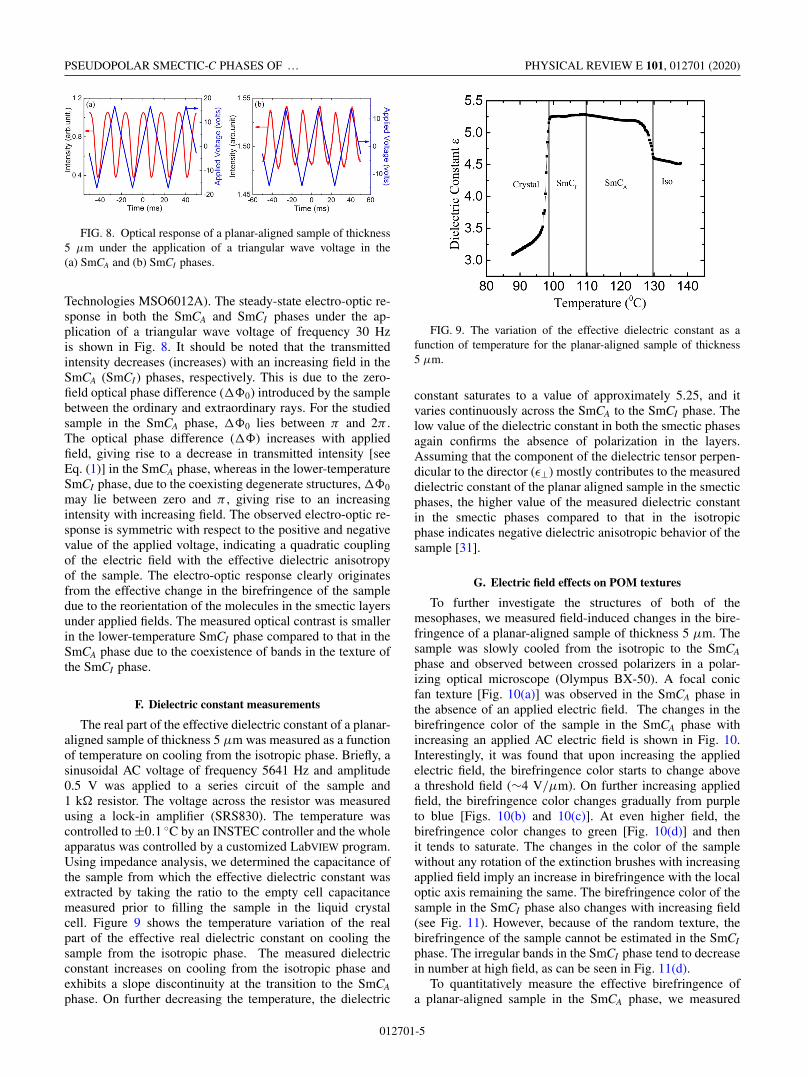
FIG. 8. Optical response of a planar-aligned sample of thickness5 μm under the application of a triangular wave voltage in the(a) SmCA and (b) SmCI phases.
Technologies MSO6012A). The steady-state electro-optic re-sponse in both the SmCA and SmCI phases under the ap-plication of a triangular wave voltage of frequency 30 Hzis shown in Fig. 8. It should be noted that the transmittedintensity decreases (increases) with an increasing field in theSmCA (SmCI ) phases, respectively. This is due to the zero-field optical phase difference (�0) introduced by the samplebetween the ordinary and extraordinary rays. For the studiedsample in the SmCA phase, �0 lies between π and 2π .The optical phase difference (�) increases with appliedfield, giving rise to a decrease in transmitted intensity [seeEq. (1)] in the SmCA phase, whereas in the lower-temperatureSmCI phase, due to the coexisting degenerate structures, �0
may lie between zero and π , giving rise to an increasingintensity with increasing field. The observed electro-optic re-sponse is symmetric with respect to the positive and negativevalue of the applied voltage, indicating a quadratic couplingof the electric field with the effective dielectric anisotropyof the sample. The electro-optic response clearly originatesfrom the effective change in the birefringence of the sampledue to the reorientation of the molecules in the smectic layersunder applied fields. The measured optical contrast is smallerin the lower-temperature SmCI phase compared to that in theSmCA phase due to the coexistence of bands in the texture ofthe SmCI phase.
F. Dielectric constant measurements
The real part of the effective dielectric constant of a planar-aligned sample of thickness 5 μm was measured as a functionof temperature on cooling from the isotropic phase. Briefly, asinusoidal AC voltage of frequency 5641 Hz and amplitude0.5 V was applied to a series circuit of the sample and1 k� resistor. The voltage across the resistor was measuredusing a lock-in amplifier (SRS830). The temperature wascontrolled to ±0.1 ◦C by an INSTEC controller and the wholeapparatus was controlled by a customized LabVIEW program.Using impedance analysis, we determined the capacitance ofthe sample from which the effective dielectric constant wasextracted by taking the ratio to the empty cell capacitancemeasured prior to filling the sample in the liquid crystalcell. Figure 9 shows the temperature variation of the realpart of the effective real dielectric constant on cooling thesample from the isotropic phase. The measured dielectricconstant increases on cooling from the isotropic phase andexhibits a slope discontinuity at the transition to the SmCA
phase. On further decreasing the temperature, the dielectric
FIG. 9. The variation of the effective dielectric constant as afunction of temperature for the planar-aligned sample of thickness5 μm.
constant saturates to a value of approximately 5.25, and itvaries continuously across the SmCA to the SmCI phase. Thelow value of the dielectric constant in both the smectic phasesagain confirms the absence of polarization in the layers.Assuming that the component of the dielectric tensor perpen-dicular to the director (ε⊥) mostly contributes to the measureddielectric constant of the planar aligned sample in the smecticphases, the higher value of the measured dielectric constantin the smectic phases compared to that in the isotropicphase indicates negative dielectric anisotropic behavior of thesample [31].
G. Electric field effects on POM textures
To further investigate the structures of both of themesophases, we measured field-induced changes in the bire-fringence of a planar-aligned sample of thickness 5 μm. Thesample was slowly cooled from the isotropic to the SmCA
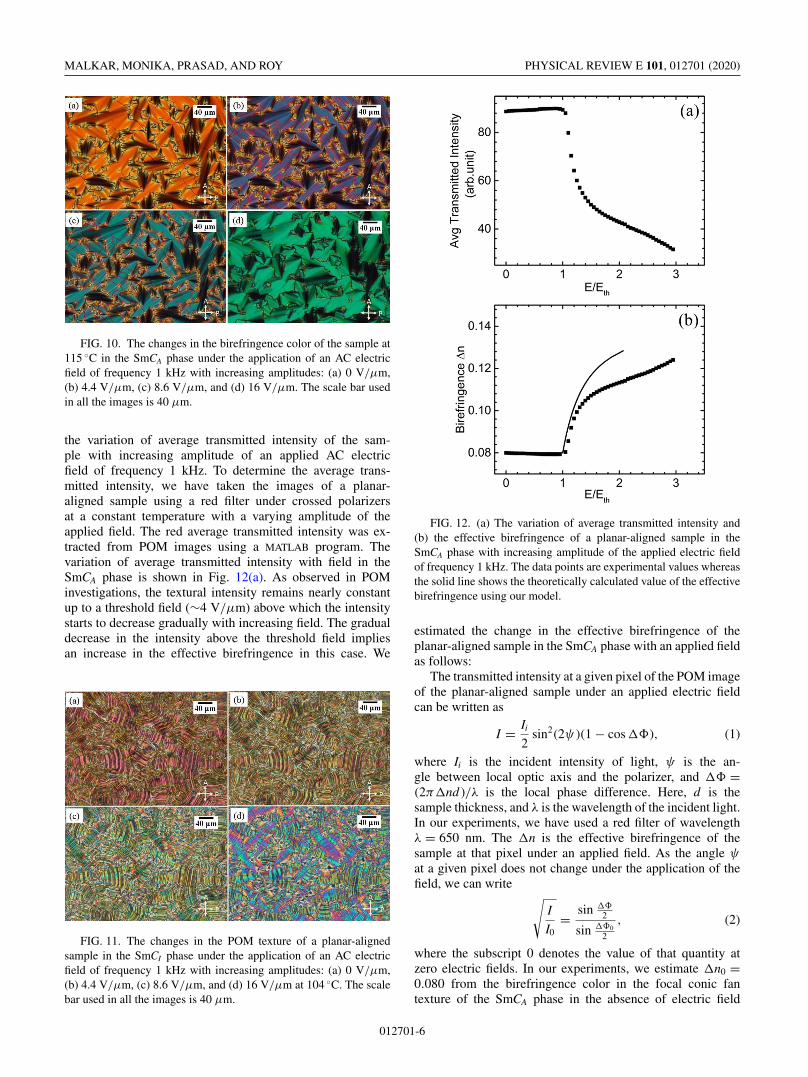
phase and observed between crossed polarizers in a polar-izing optical microscope (Olympus BX-50). A focal conicfan texture [Fig. 10(a)] was observed in the SmCA phase inthe absence of an applied electric field. The changes in thebirefringence color of the sample in the SmCA phase withincreasing an applied AC electric field is shown in Fig. 10.Interestingly, it was found that upon increasing the appliedelectric field, the birefringence color starts to change abovea threshold field (∼4 V/μm). On further increasing appliedfield, the birefringence color changes gradually from purpleto blue [Figs. 10(b) and 10(c)]. At even higher field, thebirefringence color changes to green [Fig. 10(d)] and thenit tends to saturate. The changes in the color of the samplewithout any rotation of the extinction brushes with increasingapplied field imply an increase in birefringence with the localoptic axis remaining the same. The birefringence color of thesample in the SmCI phase also changes with increasing field(see Fig. 11). However, because of the random texture, thebirefringence of the sample cannot be estimated in the SmCI
phase. The irregular bands in the SmCI phase tend to decreasein number at high field, as can be seen in Fig. 11(d).
To quantitatively measure the effective birefringence ofa planar-aligned sample in the SmCA phase, we measured
012701-5
MALKAR, MONIKA, PRASAD, AND ROY PHYSICAL REVIEW E 101, 012701 (2020)
FIG. 10. The changes in the birefringence color of the sample at115 ◦C in the SmCA phase under the application of an AC electricfield of frequency 1 kHz with increasing amplitudes: (a) 0 V/μm,(b) 4.4 V/μm, (c) 8.6 V/μm, and (d) 16 V/μm. The scale bar usedin all the images is 40 μm.
the variation of average transmitted intensity of the sam-ple with increasing amplitude of an applied AC electricfield of frequency 1 kHz. To determine the average trans-mitted intensity, we have taken the images of a planar-aligned sample using a red filter under crossed polarizersat a constant temperature with a varying amplitude of theapplied field. The red average transmitted intensity was ex-tracted from POM images using a MATLAB program. Thevariation of average transmitted intensity with field in theSmCA phase is shown in Fig. 12(a). As observed in POMinvestigations, the textural intensity remains nearly constantup to a threshold field (∼4 V/μm) above which the intensitystarts to decrease gradually with increasing field. The gradualdecrease in the intensity above the threshold field impliesan increase in the effective birefringence in this case. We
FIG. 11. The changes in the POM texture of a planar-alignedsample in the SmCI phase under the application of an AC electricfield of frequency 1 kHz with increasing amplitudes: (a) 0 V/μm,(b) 4.4 V/μm, (c) 8.6 V/μm, and (d) 16 V/μm at 104 ◦C. The scalebar used in all the images is 40 μm.
FIG. 12. (a) The variation of average transmitted intensity and(b) the effective birefringence of a planar-aligned sample in theSmCA phase with increasing amplitude of the applied electric fieldof frequency 1 kHz. The data points are experimental values whereasthe solid line shows the theoretically calculated value of the effectivebirefringence using our model.
estimated the change in the effective birefringence of theplanar-aligned sample in the SmCA phase with an applied fieldas follows:
The transmitted intensity at a given pixel of the POM imageof the planar-aligned sample under an applied electric fieldcan be written as
I = Ii
2sin2(2ψ )(1 − cos �), (1)
where Ii is the incident intensity of light, ψ is the an-gle between local optic axis and the polarizer, and � =(2π�nd )/λ is the local phase difference. Here, d is thesample thickness, and λ is the wavelength of the incident light.In our experiments, we have used a red filter of wavelengthλ = 650 nm. The �n is the effective birefringence of thesample at that pixel under an applied field. As the angle ψ
at a given pixel does not change under the application of thefield, we can write √
I
I0= sin �
2
sin �02
, (2)
where the subscript 0 denotes the value of that quantity atzero electric fields. In our experiments, we estimate �n0 =0.080 from the birefringence color in the focal conic fantexture of the SmCA phase in the absence of electric field
012701-6
PSEUDOPOLAR SMECTIC-C PHASES OF … PHYSICAL REVIEW E 101, 012701 (2020)
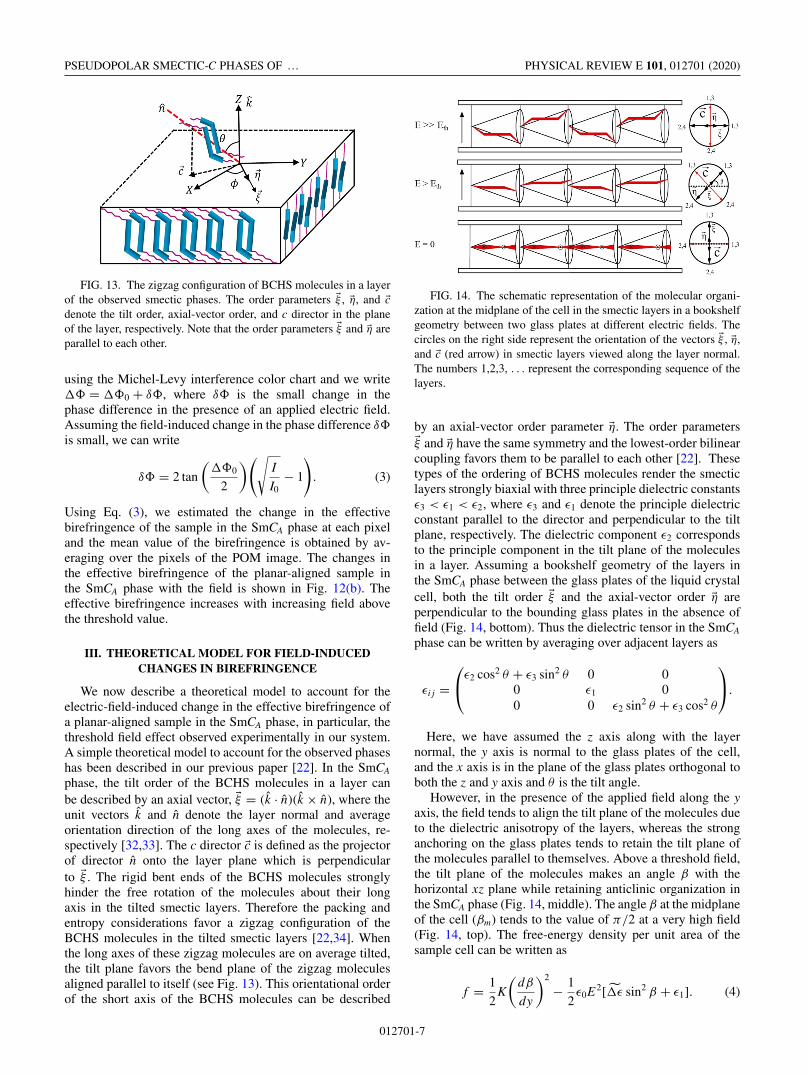
FIG. 13. The zigzag configuration of BCHS molecules in a layerof the observed smectic phases. The order parameters �ξ , �η, and �cdenote the tilt order, axial-vector order, and c director in the planeof the layer, respectively. Note that the order parameters �ξ and �η areparallel to each other.
using the Michel-Levy interference color chart and we write� = �0 + δ, where δ is the small change in thephase difference in the presence of an applied electric field.Assuming the field-induced change in the phase difference δ
is small, we can write
δ = 2 tan
(�0
2
)(√I
I0− 1
). (3)
Using Eq. (3), we estimated the change in the effectivebirefringence of the sample in the SmCA phase at each pixeland the mean value of the birefringence is obtained by av-eraging over the pixels of the POM image. The changes inthe effective birefringence of the planar-aligned sample inthe SmCA phase with the field is shown in Fig. 12(b). Theeffective birefringence increases with increasing field abovethe threshold value.
III. THEORETICAL MODEL FOR FIELD-INDUCEDCHANGES IN BIREFRINGENCE
We now describe a theoretical model to account for theelectric-field-induced change in the effective birefringence ofa planar-aligned sample in the SmCA phase, in particular, thethreshold field effect observed experimentally in our system.A simple theoretical model to account for the observed phaseshas been described in our previous paper [22]. In the SmCA
phase, the tilt order of the BCHS molecules in a layer canbe described by an axial vector, �ξ = (k̂ · n̂)(k̂ × n̂), where theunit vectors k̂ and n̂ denote the layer normal and averageorientation direction of the long axes of the molecules, re-spectively [32,33]. The c director �c is defined as the projectorof director n̂ onto the layer plane which is perpendicularto �ξ . The rigid bent ends of the BCHS molecules stronglyhinder the free rotation of the molecules about their longaxis in the tilted smectic layers. Therefore the packing andentropy considerations favor a zigzag configuration of theBCHS molecules in the tilted smectic layers [22,34]. Whenthe long axes of these zigzag molecules are on average tilted,the tilt plane favors the bend plane of the zigzag moleculesaligned parallel to itself (see Fig. 13). This orientational orderof the short axis of the BCHS molecules can be described
FIG. 14. The schematic representation of the molecular organi-zation at the midplane of the cell in the smectic layers in a bookshelfgeometry between two glass plates at different electric fields. Thecircles on the right side represent the orientation of the vectors �ξ , �η,and �c (red arrow) in smectic layers viewed along the layer normal.The numbers 1,2,3, . . . represent the corresponding sequence of thelayers.
by an axial-vector order parameter �η. The order parameters�ξ and �η have the same symmetry and the lowest-order bilinearcoupling favors them to be parallel to each other [22]. Thesetypes of the ordering of BCHS molecules render the smecticlayers strongly biaxial with three principle dielectric constantsε3 < ε1 < ε2, where ε3 and ε1 denote the principle dielectricconstant parallel to the director and perpendicular to the tiltplane, respectively. The dielectric component ε2 correspondsto the principle component in the tilt plane of the moleculesin a layer. Assuming a bookshelf geometry of the layers inthe SmCA phase between the glass plates of the liquid crystalcell, both the tilt order �ξ and the axial-vector order �η areperpendicular to the bounding glass plates in the absence offield (Fig. 14, bottom). Thus the dielectric tensor in the SmCA
phase can be written by averaging over adjacent layers as
εi j =⎛⎝ε2 cos2 θ + ε3 sin2 θ 0 0
0 ε1 00 0 ε2 sin2 θ + ε3 cos2 θ
⎞⎠.
Here, we have assumed the z axis along with the layernormal, the y axis is normal to the glass plates of the cell,and the x axis is in the plane of the glass plates orthogonal toboth the z and y axis and θ is the tilt angle.
However, in the presence of the applied field along the yaxis, the field tends to align the tilt plane of the molecules dueto the dielectric anisotropy of the layers, whereas the stronganchoring on the glass plates tends to retain the tilt plane ofthe molecules parallel to themselves. Above a threshold field,the tilt plane of the molecules makes an angle β with thehorizontal xz plane while retaining anticlinic organization inthe SmCA phase (Fig. 14, middle). The angle β at the midplaneof the cell (βm) tends to the value of π/2 at a very high field(Fig. 14, top). The free-energy density per unit area of thesample cell can be written as
f = 1
2K
(dβ
dy
)2
− 1
2ε0E2[�̃ε sin2 β + ε1]. (4)
012701-7
MALKAR, MONIKA, PRASAD, AND ROY PHYSICAL REVIEW E 101, 012701 (2020)
Here, K is a suitable elastic constant corresponding to thedistortion of the angle β across the sample cell and the lastterm corresponds to the free-energy density in the presence ofthe electric field. The �̃ε is the effective dielectric anisotropyof the sample in this configuration. The �̃ε is given by
�̃ε = δε cos2 θ + �ε sin2 θ, (5)
where �ε = (ε3 − ε1) and δε = (ε2 − ε1) are the dielectricanisotropy and dielectric biaxiality of the sample in the SmCA
phase.The free-energy density in Eq. (4) is analogous to that of a
planar-aligned nematic sample under an electric field [35] andpredicts a Freedericksz-type transition above a threshold fieldfor �̃ε > 0. The threshold field is given by
Eth = π
d
√K
ε0�̃ε. (6)
Assuming the elastic constant K ∼ 10−10 N in the SmCA
phase and �̃ε ∼ 0.2, the calculated threshold field fromEq. (6) is quite close to the experimentally measured thresholdfield in the SmCA phase.
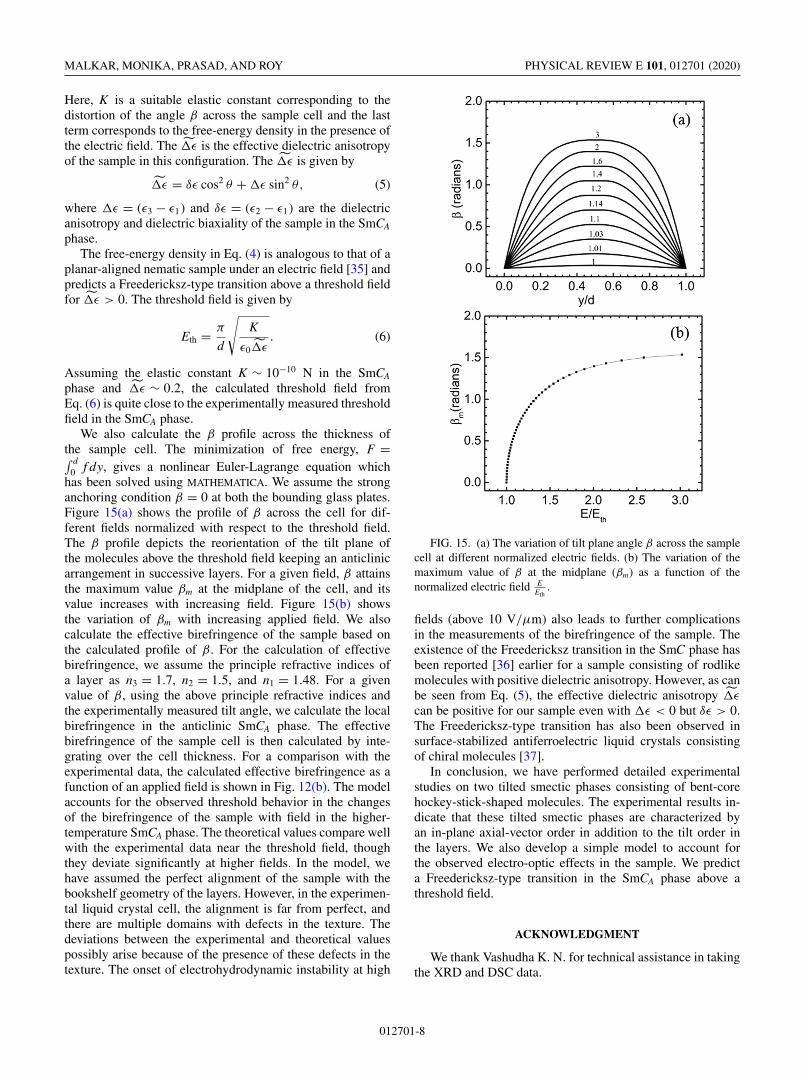
We also calculate the β profile across the thickness ofthe sample cell. The minimization of free energy, F =∫ d
0 f dy, gives a nonlinear Euler-Lagrange equation whichhas been solved using MATHEMATICA. We assume the stronganchoring condition β = 0 at both the bounding glass plates.Figure 15(a) shows the profile of β across the cell for dif-ferent fields normalized with respect to the threshold field.The β profile depicts the reorientation of the tilt plane ofthe molecules above the threshold field keeping an anticlinicarrangement in successive layers. For a given field, β attainsthe maximum value βm at the midplane of the cell, and itsvalue increases with increasing field. Figure 15(b) showsthe variation of βm with increasing applied field. We alsocalculate the effective birefringence of the sample based onthe calculated profile of β. For the calculation of effectivebirefringence, we assume the principle refractive indices ofa layer as n3 = 1.7, n2 = 1.5, and n1 = 1.48. For a givenvalue of β, using the above principle refractive indices andthe experimentally measured tilt angle, we calculate the localbirefringence in the anticlinic SmCA phase. The effectivebirefringence of the sample cell is then calculated by inte-grating over the cell thickness. For a comparison with theexperimental data, the calculated effective birefringence as afunction of an applied field is shown in Fig. 12(b). The modelaccounts for the observed threshold behavior in the changesof the birefringence of the sample with field in the higher-temperature SmCA phase. The theoretical values compare wellwith the experimental data near the threshold field, thoughthey deviate significantly at higher fields. In the model, wehave assumed the perfect alignment of the sample with thebookshelf geometry of the layers. However, in the experimen-tal liquid crystal cell, the alignment is far from perfect, andthere are multiple domains with defects in the texture. Thedeviations between the experimental and theoretical valuespossibly arise because of the presence of these defects in thetexture. The onset of electrohydrodynamic instability at high
FIG. 15. (a) The variation of tilt plane angle β across the samplecell at different normalized electric fields. (b) The variation of themaximum value of β at the midplane (βm) as a function of thenormalized electric field E
Eth.
fields (above 10 V/μm) also leads to further complicationsin the measurements of the birefringence of the sample. Theexistence of the Freedericksz transition in the SmC phase hasbeen reported [36] earlier for a sample consisting of rodlikemolecules with positive dielectric anisotropy. However, as canbe seen from Eq. (5), the effective dielectric anisotropy �̃ε
can be positive for our sample even with �ε < 0 but δε > 0.The Freedericksz-type transition has also been observed insurface-stabilized antiferroelectric liquid crystals consistingof chiral molecules [37].
In conclusion, we have performed detailed experimentalstudies on two tilted smectic phases consisting of bent-corehockey-stick-shaped molecules. The experimental results in-dicate that these tilted smectic phases are characterized byan in-plane axial-vector order in addition to the tilt order inthe layers. We also develop a simple model to account forthe observed electro-optic effects in the sample. We predicta Freedericksz-type transition in the SmCA phase above athreshold field.
ACKNOWLEDGMENT
We thank Vashudha K. N. for technical assistance in takingthe XRD and DSC data.
012701-8
PSEUDOPOLAR SMECTIC-C PHASES OF … PHYSICAL REVIEW E 101, 012701 (2020)
[1] S. Chandrasekhar, Liquid Crystals (Cambridge UniversityPress, Cambridge, UK, 1992).
[2] H. Takezoe and L. Eremin, Bent-Shaped Liquid Crystals: Struc-tures and Physical Properties (CRC Press, Boca Raton, FL,2017).
[3] A. Jakli and A. Saupe, One- and Two-Dimensional Fluids:Physical Properties of Smectic, Lamellar, and Columnar LiquidCrystals (CRC Press, Boca Raton, FL, 2006).
[4] T. Niori, T. Sekine, J. Watanabe, T. Furukawa, and H. Takezoe,J. Mater. Chem. 6, 1231 (1996).
[5] J. W. Goodby, P. J. Collings, T. Kato, C. Tschierske, H. F.Gleeson, and P. Raynes, Handbook of Liquid Crystals, 2nd ed.(Wiley-VCH, Weinheim, 2014), Vol. 4.
[6] R. A. Reddy and C. Tschierske, J. Mater. Chem. 16, 907(2006).
[7] F. C. Yu and L. J. Yu, Chem. Mater. 18, 5410 (2006).[8] T. J. Dingemans, N. S. Murthy, and E. T. Samulski, J. Phys.
Chem. B 105, 8845 (2001).[9] M. Horcic, V. Kozmik, J. Svoboda, and V. Novotna, J. Mater.
Chem. C 1, 7560 (2013).[10] Z. Luz and S. Meiboom, J. Chem. Phys. 59, 275 (1973).[11] D. R. Link, G. Natale, R. Shao, J. E. Maclennan, N. A. Clark,
E. Korblova, and D. M. Walba, Science 278, 1924 (1997).[12] F. C. Yu and L. J. Yu, Liq. Cryst. 35, 799 (2008).[13] B. Das, S. Grande, W. Weissflog, A. Eremin, M. W. Schröder,
G. Pelzl, S. Diele, and H. Kresse, Liq. Cryst. 30, 529 (2003).[14] A. Chakraborty, M. K. Das, B. Das, U. Baumeister, and W.
Weissflog, J. Mater. Chem. C 1, 7418 (2013).[15] R. Stannarius, J. Li, and W. Weissflog, Phys. Rev. Lett. 90,
025502 (2003).[16] P. Sathyanarayana, S. Radhika, B. K. Sadashiva, and S. Dhara,
Soft Matter 8, 2322 (2012).[17] M. Alaasar, Liq. Cryst. 43, 2208 (2016).[18] S. Radhika, H. T. Srinivasa, and B. K. Sadashiva, Liq. Cryst. 38,
785 (2011).
[19] M. Alaasar, S. Poppe, C. Kerzig, C. Klopp, A. Eremin, and C.Tschierske, J. Mater. Chem. C 5, 8454 (2017).
[20] D. D. Sarkar, R. Deb, N. Chakraborty, and V. S. R. Nandiraju,Liq. Cryst. 39, 1003 (2012).
[21] E. R. Cioanca, E. L. Epure, I. Carlescu, G. Lisa, D. Wilson, N.Hurduc, and D. Scutaru, Mol. Cryst. Liq. Cryst. 537, 51 (2011).
[22] D. Malkar, B. K. Sadashiva, and A. Roy, Soft Matter 12, 4960(2016).
[23] M. Monika, Veena Prasad, and N. G. Nagaveni, Liq. Cryst. 42,1490 (2015).
[24] A. Roy and N. V. Madhusudana, Europhys. Lett. 36, 221 (1996).[25] P. M. Johnson, D. A. Olson, S. Pankratz, T. Nguyen, J. Goodby,
M. Hird, and C. C. Huang, Phys. Rev. Lett. 84, 4870 (2000).[26] L. S. Matkin et al., Phys. Rev. E 64, 021705 (2001).[27] I. Musevic and M. Skarabot, Phys. Rev. E 64, 051706 (2001).[28] Y. Takanishi, H. Takezoe, A. Fukuda, H. Komura, and J.
Watanabe, J. Mater. Chem. 2, 71 (1992).[29] Y. Takanishi, H. Takezoe, A. Fukuda, and J. Watanabe,
Phys. Rev. B 45, 7684 (1992).[30] K. Miyasato, S. Abe, H. Takezoe, A. Fukuda, and E. Kuze,
Jpn. J. Appl. Phys. 22, L661 (1983).[31] W. H. de Jeu, Physical Properties of Liquid Crystalline Materi-
als (Gordon and Breach, London, 1980).[32] A. Roy, N. V. Madhusudana, P. Toledano, and A. M. Figueiredo
Neto, Phys. Rev. Lett. 82, 1466 (1999).[33] V. L. Lorman, A. A. Bulbitch, and P. Toledano, Phys. Rev. E 49,
1367 (1994).[34] E. N. Keller, E. Nachaliel, D. Davidov, and C. Böffel,
Phys. Rev. A 34, 4363 (1986).[35] P. G. de Gennes and J. Prost, The Physics of Liquid Crystals
(Clarendon Press, Oxford, UK, 1994).[36] G. Pelzl, P. Kolbe, U. Preukschas, S. Diele, and D. Demus,
Mol. Cryst. Liq. Cryst. 53, 167 (1979).[37] B. Wen, S. Zhang, S. S. Keast, M. E. Neubert, P. L. Taylor, and
C. Rosenblatt, Phys. Rev. E 62, 8152 (2000).
012701-9