proquest dissertations - ohiolink etd center
TRANSCRIPT
INFORMATION TO USERS
This manuscnpt has been reproduced from the microfilm master. UMI films the text directly from the original or copy submitted. Thus, some thesis and dissertation copies are in typewriter face, while others may be from any type of computer printer.
The quality of this reproduction is dependent upon the quality of the copy submitted. Broken or indistinct print, colored or poor quality illustrations and
photographs, print bleedthrough, substandard margins, and improper alignment can adversely affect reproduction.
In the unlikely event that the author did not send UMI a complete manuscript and there are missing pages, these will be noted. Also, if unauthorized copyright material had to be removed, a note will indicate the deletion.
Oversize materials (e.g., maps, drawings, charts) are reproduced by sectioning the original, beginning at the upper left-hand comer and continuing from left to right in equal sections with small overlaps.
Photographs included in the original manuscript have been reproduced xerographically in this copy. Higher quality 6" x 9” black and white photographic prints are available for any photographs or illustrations appearing in this copy for an additional charge. Contact UMI directly to order.
Bell & Howell Information and Learning 300 North Zeeb Road, Ann Arbor, Ml 48106-1346 USA
UMI600-521-0600


NOTE TO USERS
This reproduction is the best copy available
UMI

WORKING THE FAMILY IN:A CASE STUDY OF TFŒ DETERMINANTS OF EMPLOYEES’ ACCESS TO AND
USE OF ALTERNATIVE WORK ARRANGEMENTS,AND THEIR HOME-TO-WORK SPILLOVER
DISSERTATION
Presented in Partial Fulfillment of the Requirements for
the Degree Doctor of Philosophy in the
Graduate School of The Ohio State University
By
Mary Ellen Flack, M A , M A
* * * * * *
The Ohio State University 1999
Dissertation Committee:
Professor Lowell L. Hargens, Advisor
Professor Barbara F Reskin
Professor Toby L. Parcel
Approved by
Lowell L. Hargens, Advisor Department of Sociology
UMI Number 9951655
Copyright 1999 by Flack, Mary Ellen
All rights reserved.
UMI*UMI Microform9951655
Copyright 2000 by Bell & Howell Information and Leaming Company. All rights reserved. This microform edition is protected against
unauthorized copying under Title 17, United States Code.
Bell & Howell Information and Leaming Company 300 North Zeeb Road
P.O. Box 1346 Ann Aitor, Ml 48106-1346
Copyright by Mary Ellen Flack
1999
ABSTRACT
Century-old work arrangements designed for full-time employees are ill-suited to
today’s workers, the majority of whom do not have a family or household structure that
allows them to work unencumbered by external obligations. Some firms have adopted
work-home policies that oflFer alternative work arrangements such as flextime, compressed
work weeks, and telecommuting to help workers with increased vulnerability to domestic
interference juggle their dual responsibilities while maintaining their productivity.
Managers, however, typically have the discretion to make the scheduling options available.
Using qualitative, quantitative, and archival data collected in a case study of three
divisions in Midwest Securities (MW), a financial services organization, I investigated the
determinants o f three factors that affect the effectiveness of the options outlined in MW’s
work-home policy: (1) employees’ access to flextime, compressed work weeks, and
telecommuting; (2) employees’ use of the alternative arrangements; and (3) employees’
home-to-work spillover. I assessed the relationship between spillover and workers’ use o f
the scheduling options by estimating causal models that allowed a reciprocal relationship
between the two. My study thus contributes to our understanding of the totality of
circumstances that affect workers’ access to and use o f alternative work arrangements, as
well as the nature o f work-home conflict.
I assessed the influence of three sets o f factors on workers’ access to the
scheduling options: MW’s managerial guidelines for implementing the scheduling options
(job suitability, employee suitability, and the cost-benefit ratio); indicators of the context in
which employees worked; and employees’ personal and household characteristics.
I found inconsistent evidence that MW’s managerial guidelines explained the variation in
employees’ access to AW As. Indicators of employee suitability affected workers’ access
to flextime. Indicators of job and employee suitability affected workers’ access to
compressed work weeks. Indicators of employee suitability and the cost-benefit ratio
affected workers’ access to telecommuting. Personal and household characteristics had
little influence on workers’ access to the options. However, the context in which workers
performed their jobs—their division and their awareness of the policy—had a strong and
consistent effect on managers’ decisions to make the options available.
Similarly, I examined three sets of factors associated with employees use of
AW As: job factors influencing workers need and ability to use AW As; job factors related
to the perceived risk of using AWAs; and personal and household characteristics that
should affect need. Workers’ status and autonomy, the context in which they worked, and
their sex influenced employees’ use of flextime. In contrast, job measures related to the
complexity and interdependence of workers’ jobs, their work context, and their education,
household income, and sex affected workers’ use o f compressed work weeks. A third
group of factors affected workers’ telecommuting: the context in which employees
performed their jobs, employees’ seniority, the importance of facetime in their evaluation
process, and workers’ domestic spillover.
m
Home-to-work spillover stemmed primarily from domestic obligations. Women
experienced more spillover than similarly situated men, and having children and eldercare
responsibilities also increased employees’ domestic spillover. Telecommuting, the use of
compressed work weeks, and the ability to make job-related decisions were effective
means of reducing the intrusion of domestic concerns at work. Thus, my analyses suggest
that the relationship between employees’ domestic spillover and their use of an AW A
depends on the scheduling option.
My research provided evidence for five summary conclusions. First, the study
confirms research that the context in which employees perform their work is a key
influence on both managers’ decisions to make the options available and employees’
decisions to use AWAs. Second, the degree alternative work arrangements deviate from
traditional work arrangements has implications for managers’ decisions to make the
options available. Third, a variety of evidence establishes that managerial support for
alternative work arrangements is, in part, idiosyncratic. Fourth, consistent with Midwest’s
intent, managers implemented the firm’s work-home policy with little regard for workers’
familial circumstances. Moreover, telecommuting and compressed work weeks were
effective in reducing workers’ domestic spillover. Finally, corporations such as MW that
lack measures of individual productivity are unable to fully evaluate the effectiveness of
work-home policies.
1 consider the implications of my findings and conclusions, and I recommend
strategies for corporations interested in promoting employees’ access to and use o f work-
home policies.
IV

To Mike, Kate, and Dan - the center o f my universe, the cornerstones o f my being.
ACKNOWLEDGMENTS
Research suggests that work interferes far more with family, than family with
work. In my case, that has certainly been true. And so to Mike, Kate, and Dan— words
are inadequate to thank you for your steadfast support, patience, and understanding these
past years no matter how distracted and dysfunctional I became. Time and again, your
cheers and assistance were the best antidotes to the “dissertation blues.” Dan, your
frequent observation that “you seem stressed,” and Kate, your reassuring conviction that
“it’ll work out” were both oh-so-right. Mike, you were the calm refuge, as always,
throughout my stormy relationship with the dissertation. Moreover, your astute
observations and comforting counsel helped me endure many a tense moment.
We learn what is important, personally and professionally, in part from our role
models. And so to my parents and brother—thank you. Mom and Dad, you taught me to
value education and to focus on that which is worthwhile. Paul, you have helped me over
the years better understand the relationship between time and the art o f living. And you
have all been avid research assistants, as well! What valued and thoughtful gifts, both
tangible and intangible, you have shared with me.
I am also blessed both professionally and personally with two friends and
colleagues who have been immeasurable sources of inspiration, insight, and enthusiasm.
VI
Barbara Reskin, my mentor and teacher, this dissertation would not have happened
without you. Your wisdom, generosity of time and spirit, and encouragement provided
the framework for this project. Kitty Soldano, you have shared with me each and every
trial and triumph that shaped my graduate school experience. Thank you for miles of
walks and talks, gallons of coffee and wine, countless Wings lunches and Top dinners, and
for your never-ending faith and perspective.
And my committee members are incomparable. Lowell Hargens, you have
unstintingly shared your expertise, enthusiasm, good humor, and patience with me. Ever
the good doctor, you were always “in” and cured whatever analytical, procedural, or
dumb problem I had. Toby Parcel, your keen interest in and generous assistance with the
project have contributed immensely to my work. It has been a pleasure leaming from and
laughing with you both, and I am deeply indebted.
And there is also a champion ad hoc rescue and resuscitation team—those who
have unstintingly given gifts of time, expertise, and moral support whenever needed.
Laurie Krivo, Bob Kauftnan, Pam Paxton, Sally Kitch, Naomi Cassirer, Gail McGuire,
Michaela Dufur, Mary Ann Powell—your quick responses to calls for help have been
above and beyond the call of duty. How lucky I am!
And finally, my sincere thanks to all the good folks at Midwest who made my
work both possible and enjoyable.
vu
VITA
June 26, 1948.............................................................. Bom - Sandusky, Ohio
197 0 ..............................................................................B.A. English, Ohio WesleyanUniversity
197 1............................................................................. M A English, University of Michigan
1994............................................................................. M A Public Policy and Management,The Ohio State University
1996-98........................................................................Graduate Teaching Associate,The Ohio State University
FIELDS OF STUDY
Major Field: Sociology
Minor Fields: Work, Gender, Family, and Stratification
vm
TABLE OF CONTENTS
Page
Abstract........................................................................................................................... ü
Dedication........................................................................................................................ v
Acknowledgments.......................................................................................................... vi
V ita .............................................................................................................................. viii
List of Tables............................................................................................................... xii
List of Figures.............................................................................................................. xiv
Chapters:
1. Introduction.......................................................................................................... 1
Research Questions......................................................................................... 13Overview of Dissertation............................................................................... 14
2. Research Setting and Data Collection................................................................. 17
The Operations, Systems, and Actuarial Divisions........................................ 18Comparison of the Midwest Securities Workforce withthe U.S. Workforce.......................................................................................... 26Entrée to Inland Enterprise............................................................................. 28Data Collection Procedures............................................................................. 29
3. Determinants of MW Employees’ Access to Alternative WorkArrangements.............................................................................................................. 44
Hypotheses....................................................................................................... 46Sample, Measures, and Method of Analysis.................................................. 57Research Findings............................................................................................ 65Discussion......................................................................................................... 70Conclusion......................................................................................................... 82
Lx
Table of Contents (continued)
Chapters (continued): Page
4. Determinants o f MW Employees’ Use of Alternative Work Arrangementsand Their Home-to-work Spillover...................................................................... 103
Hypotheses....................................................................................................... 105Sample, Measures, and Method of Analysis.................................................. 119Research Findings............................................................................................ 125Discussion........................................................................................................ 136Conclusion....................................................................................................... 145
5. Conclusion.............................................................................................................. 161
Contributions o f the Research.......................................................................... 163Summary of Findings....................................................................................... 164Conclusions and Discussion............................................................................ 170Limitations of the Study and Recommendations for Future Research 175Recommendations............................................................................................. 179
Bibliography.................................................................................................................... 184
List of Appendices
Appendix A: Letter of Agreement................................................................................ 197
Appendix B: Schedules for Interviews and Focus GroupsSchedule for General Nonmanagerial FocusGroups and Managerial Interviews.......................................... 199Schedule for Pretest Focus Groups......................................... 200
Appendix C: Managerial and Nonmanagerial Survey InstrumentsSurvey of Managerial Employees............................................. 201Survey of Nonmanagerial Employees...................................... 212
Appendix D: Confirmation Letters to Interview and Focus Group Participants Sample Confirmation Letter to Participants in
Managerial Interviews.................................................. 221Sample Confirmation Letter to General Focus
Group Participants of Nonmanagers........................... 222Sample Confinnation Letter to Pretest FocusGroup Participants........................................................ 223
Table of Contents (continued)
List of Appendices (continued) Page
Appendix E: Administrative Letters of Support, Confirmation Letters, and Reminders to Sample Pool Members About the Survey
Sample Letter from Vice Presidents to SamplePool Members in Support of Survey.......................... 224Sample Letter to Sample Pool Members AboutGroup Administration o f Survey................................. 225Sample Reminder to Sample Pool Members forGroup Administration of Survey.................................. 226Midwest President’s Letter of Support toFollow-up Survey Group Members.............................. 227Letter to Follow-up Survey Group Members 228Reminder to Follow-up Survey Group Members 229
Appendix F: Estimation of Missing Values for Independent Variables 230
Appendix G: Employee Handbook: Alternative Work Arrangements 234
XI
LIST OF TABLES
Table Page
2 .1 Characteristics of Employees at Midwest and in the U.S.Workforce............................................................................................ 42
2.2 Survey Sample, Response Rates, Sampling Fractions, andSample Weights by Division............................................................... 43
3.1 Concepts, Measures, and Sources of Survey Questions..................... 85
3.2 Variable Measurement, Means, and Standard Deviations.................. 87
3.3 Correlations of Dependent and Independent Variables...................... 90
3.4 Percent of Managers Reporting Managerial Support for Flextime, Compressed Work Weeks, and Telecommuting inTheir Departments, by Division........................................................... 98
3.5 Reasons Managers Report Support and Nonsupport forAlternative Work Arrangements among Managers in Their Departments......................................................................................... 99
3.6 Percent of MW Employees Reporting Access to AlternativeWork Arrangements............................................................................. 100
3.7 OLS Regressions of MW Employees’ Access to Flextime, Compressed Work Weeks, and Telecommuting on MW Guidelines,Work Context, and Personal/Household Characteristics................. 101
4.1 Percent of MW Employees Who Use Alternative WorkArrangements, by Division................................................................ 151
4.2 Personal and Household Characteristics o f MidwestEmployees, by Sex............................................................................. 152
XU
List of Tables (continued)
Table Page
4.3 Percent of MW Employees Reporting Home-to-WorkSpillover, by Sex.................................................................................. 153
4.4 Structural Equation Regression Analyses of MW Employees’Use of Alternative Work Arrangements on Job and Personaland Household Characteristics............................................................ 157
4.5 Structural Equation Regression Analyses o f MW Employees’ Home-to-Work Spillover on Division, Job, Personal andHousehold Characteristics.................................................................... 159
xm
LIST OF FIGURES
Figure Page
3.1 Conceptual Model of MW Employees’ Perceived Access to Alternative WorkArrangements........................................................................................ 97
4 .1 Conceptual Model - Simultaneous Equation o f MW Employees’ Home-to-Work Spillover and Their Useof Alternative Work Arrangements..................................................... 150
4.2 Simultaneous Equation Model of MW Employees’Home-to-Work Spillover and Their Use of FlextimeSchedules.............................................................................................. 154
4.3 Simultaneous Equation Model of MW Employees’Home-to-Work Spillover and Their Use of CompressedWork Week Schedules.......................................................................... 155
4.4 Simultaneous Equation Model of MW Employees’Home-to-Work Spillover and Their Use of Telecommuting.............. 156
MV
CHAPTER I
INTRODUCTION
Week in and week out, more than 124 million women and men in the United States
go to work (U. S. Bureau of the Census 1996:table 616). The firms in which they work
have historically been characterized as “greedy organizations” that sought their
employees’ undivided loyalty (Coser 1974). Consequently, employers distrusted workers’
outside obligations, such as family responsibilities, that might reduce workers’ job
commitment and performance (Rodgers 1992:184; Googins 1991:8; Acker 1990:149).
Indeed, employees’ jobs were typically organized on the assumption that workers were
free of domestic responsibilities, and were thus able to devote full attention, time, and
energy to their jobs (Shelton 1992:151; Ferber and O’Farrell 1991:20; Acker 1990:150;
Kanter 1977b). Dramatic changes in the demographic composition of the U.S. labor force
have meant that a growing majority of both female and male employees no longer have a
family or household structure that allows them to work unencumbered by external
obligations. By 1997, only about one worker out of ten (14 percent) left a nonemployed
spouse or partner at home to deal with the demands o f their families and households
(Bond et al. 1998:28-9).'
' Nationally, one third (35 percent) of wage and salaried employees are single—and 78 percent of those who live with spouses or partners (i.e., a total of 51 percent o f the workforce) live in dual income households (Bond et al. 1998: 5, 28).
1
Thus, century-old work arrangements designed for full-time employees who were
free o f domestic obligations are ill-suited to today’s workers who experience home-to-
work conflict—conflict that can affect their job performance. Work-home balance has
become the “hot career issue of the new decade” (Hall 1990:5), and work-home policies
that offer alternative work arrangements (AWAs) designed to enhance employees’ ability
to meet the dual demands of home and work have proliferated. We know little about the
implementation of AWAs within firms, however. Moreover, assessment of work-home
policies’ effectiveness is limited. To enhance our understanding of the implementation,
use, and effectiveness of alternative work arrangements, I investigated three questions:
(1) what are the determinants of workers’ access to three alternative work arrangements,
(2) what are the determinants of workers’ use of AWAs, and (3) what are the
determinants of employees’ home-to-work spillover.
Although women and men have always worked to support themselves and their
dependents, that work has typically differed by sex. Sex became the paramount criterion
for the assignment o f tasks at home and in the workplace after the Industrial Revolution
when the creation o f a labor force distinguished paid from unpaid work. Married men
assumed primary responsibility for the economic well-being of their households through
their paid work, while married women assumed primary responsibility for unpaid domestic
tasks. Those women who were in the paid labor force tended to live in households in
which another woman undertook primary responsibility for domestic work.^
Whether married or single, immigrant and nonwhite women have traditionally had a higher labor force participation rate than other women, although the gap between black
By mid-20"' century, a sexual division of labor was firmly entrenched within both
the workplace and in the home. Being a "family man" meant being the family's primary, if
not sole, wage earner (Coltrane 1996:41; Hochschild 1990). The price of employment
and financial stability for many male workers was long hours that precluded doing
domestic work or spending much time with family members. Indeed, it was unmanly to
participate in certain domestic tasks, particularly those that were stereotypically female
(West and Zimmerman 1987:144; Coser 1974:93-4). These included food preparation
and caregiving to dependents, as well as tasks directed at maintaining family status, such
as participating in school or community volunteer activities (Papanek 1979:777-8). In the
workplace, the sexual division of labor segregated women and men into different jobs, and
positions with high status or responsibility were reserved for men (Reskin and Padavic
1994:49). Thus, employed women, whether single or married, rarely held the kind of
demanding managerial or professional jobs that presumed unlimited hours or no external
demands. The few women who did often sacrificed marriage and children (Linden
1994:96; Friedman 1991:21; Ferree 1987:326).
Three fundamental changes have taken place in the sexual division of labor over
the past 35 years. First, married women and mothers (regardless of their marital status)
have flooded into the labor force, doubling their participation since 1960 (U. S. Bureau of
and white women has almost disappeared (U. S. Bureau o f the Census 1996: tables 615; Bose 1987: 274, 280). World War II brought an influx of married women into the labor market and marked the turning point for women's labor force participation. By 1948, the proportion o f married women in the labor force exceeded the 1944 level, although women were typically restricted to poorly paid, secondary jobs that did not challenge their primary orientation to their families (Millman 1987:100, 124).
3
the Census 1996: tables 624, 626)/ Beginning in the 1970s, changes in the U.S. economy
raised women’s employment, as declining real income and productivity meant that families
needed two incomes to maintain their standard of living (Menaghan and Parcel
1990:1081-2; Googins 1991:4). Second, although employed women and men continue to
be concentrated in different kinds o f jobs, occupational sex segregation has declined
(Jacobs 1992:282). Increasingly, women work in “virtually all occupations” (Crosby
1991:25)— including traditionally male managerial, professional, and sales positions—
where the demands for overtime, travel, and working long hours potentially compete with
the needs of their families (Schwartz 1994:37-8; Ferree 1991:110; Presser 1989:523).
Third, the amount of time that women and men in dual-eamer couples devote to domestic
tasks is converging (Robinson and Godbey 1997:104; Shelton 1992:145). Males in the
1980s performed about half as much housework as their partners—double the amount
they performed in the 1960s—although the time men devote to childcare has remained
constant over that time period (Robinson and Godbey 1997:104).
These changes have increased the potential for both women and men to experience
the intrusion of domestic obligations into the workplace. This interference of home-
related demands at work is known as home-to-work spillover. “Spillover theory” proposes
that permeable boundaries between work and home facilitate the interference of home-
based responsibilities at work and work-based responsibilities at home (Zedeck 1992).
Such interference adversely affects work performance (Galinsky et al. 1991:115-7). It is.
The majority o f wives (61 percent) are now employed outside the home, as are the majority o f women with children, regardless of their marital status— 53 percent o f single
therefore, a topic o f interest to employers and employees, makers of public policy, and
researchers concerned with the optimal functioning of the labor force.
In addition to the demographic changes in the workforce, other factors have
compounded the potential for home-to-work spillover. First, employers assume that the
amount of time workers devote to their jobs is positively related to their productivity, and
that full-time, uninterrupted careers are the hallmark of committed employees (Lewis
1997:16-18; Schwartz 1994:37; Rodgers 1992:184; Starrels 1992:262). The typical
American employee annually spends more hours on the job than a decade ago (Schor
1992:29), and these long hours on the job contribute to their vulnerability to domestic
needs intruding at work.’* Indeed, two-thirds of the non-agricultural U.S. labor force
worked at least 40 hours a week in 1995; almost half of those workers— 3 1 percent o f the
total labor force—worked more than 40 hours a week (U. S. Bureau of the Census 1996:
table 630). Simultaneously, employees perceive that their use o f work-home policies—
from flexible time arrangements to leaves of absence—will negatively affect their careers
(Hochschild 1997:97; Haas and Hwang 1995:34; Schwartz 1994:26-9), Second, more
employees are traveling on business, leaving their partners and children to shift for
mothers and 64 percent of married mothers with children under age six (U. S. Bureau of the Census 1996: tables 626, 627).
’* Schor attributes the increase in part to employees working more weeks per year than in the past, not just more hours o f work per week (1992:29). Indeed, Robinson and Godbey (1997:288) argue that workers’ estimates o f hours worked per week—such as those used by Schor and the U.S. Census—are likely to be high, and that time diaries provide a more accurate measure. According to Robinson and Godbey’s calculations, the trend in the U.S. from 1965-1985 is for workers to work fewer hours per week (p. 94). They have no time diary data for the past 15 years, however, a period during which many firms downsized and during which the unemployed labor pool almost disappeared.
themselves in their absence (Miller 1996.B1). Finally, employees' elderly caregiving is on
the rise. One quarter o f workers had elder care responsibilities during 1997, but closer to
half (42 percent) expect to provide eldercare by the year 2002 (Bond et al 1998:151)/
Social institutions have responded to the changing workforce demographics in a
variety of ways. Some manufacturers and service providers have altered their products,
schedules, or structures in response to middle-class women’s growing labor force
participation. Thus, we have microwave foods, home-cleaning services, businesses that
offer catalogue shopping and 24-hour service, and stores that fill and deliver customers’
faxed or e-mailed orders.
Other institutions have responded little, if at all, to the changing profile of the paid
labor force. For example, most health-care professionals’ schedules still assume a parent
or caregiver is available during the workday. Similarly, child-care providers’ schedules
typically mirror the traditional workday and work week, despite the growing number of
jobs that involve evening, night, and weekend work (Presser 1989:524-5). School
systems have retained their nine-month, moming-to-mid-day schedules, leading to late-
aftemoon and “vacation acrobatics” as parents struggle to juggle work and family
demands (Crosby 1991:27). Other factors have aggravated scheduling conflicts. There is
little institutional support for employees’ non-routine demands at home, such as last
minute changes in a child’s school schedule—and little institutional support for employees’
non-routine demands at work, such as overtime. Finally, the proliferation of school-
related and after-school activities—from more parent-teacher conferences to more
Indeed, in the 21st century, workers are likely to be shouldering more elder- than childcare responsibilities (Friedman 1991:31; Galinsky et al. 1991:121).
6
organized sports and lessons for youngsters, combined with the transportation needs
dictated by suburban sprawl—make juggling parents’ and children’s schedules more
difficult (Crosby 1991; Googins 1991:42; Hayden 1984).® Thus, Googins argues
(1991:40) that there is a “provision of care” crisis among families as workers struggle to
fulfill their care-giving responsibilities in non-supportive—even hostile—environments.
Employed women and men face a conundrum. Men are less likely than their
fathers and grandfathers to have stay-at-home spouses to perform household and childcare
tasks, and thus are under more personal and societal pressure to help with domestic
responsibilities. Simultaneously, women—who continue to perform most domestic and
caregiving tasks—are increasingly likely to work for pay and to face job demands that
leave limited time for familial responsibilities. As paid work spills over into the home and
domestic work spills over into the workplace, both women and men feel the squeeze of
combining work and family (Reskin and Flack 1996:16; Barnett 1994:655; Friedman
1991:21).
Work-home conflict may have adverse consequences for both employees and
employers.’ The demands on employees to meet work and home obligations lead to stress
® Bankert and Googins (1996:47) suggest that employed parents’ need for children’s structured activities spawned the growth of before- and after-school programs.
’ The intrusion of home responsibilities at work or work responsibilities at home occurs only when the boundaries between the two are permeable (Lobel 1992:255). Nippert-Eng (1996) argued that “home” and “work” are not mutually exclusive. Rather, the two are part o f a continuum for which the possibilities for conceptualizing and juxtaposing the two range fi*om integration to segregation. “Home” and “work” are socially constructed such that the boundary between them varies for each worker depending on the broader historical and cultural norms of the society, as well as the specific occupational, workplace, familial, and individual norms.
7
(Ferber and OTarrell 1991:54; Galinsky and Stein 1990:368) and possibly impaired
performance for women and men in both spheres (Galinsky et al. 1993:68-75; Ferber and
OTarrell 1991:54). In their reviews of organizational research, Friedman (1991:12-4, 25)
and Galinsky et al. (1991:115-7) found evidence that the intrusion of home obligations at
work decreases employees’ effectiveness and productivity, indicated by workers'
decreased ability to concentrate and their increased absenteeism, tardiness, and stress.
Workers with little flexibility to deal with the competing demands of work and home have
lower job satisfaction and organizational commitment than those with more malleable
schedules (Galinsky et al. 1993:83; Friedman 1991:51; Friedman and Galinsky 1990:58).
Moreover, jobs that restrict workers' ability to balance their dual responsibilities limit
employers’ ability to recruit and retain the most qualified workers (Schwartz 1994:21;
Perlman 1993:17; Friedman 1991:11-3; Galinsky et al. 1991:130).
Both workers and employers have an incentive to find ways to decrease the
intrusion of domestic obligations at work. Women who have the financial leeway and
employment options to shape their careers and work schedules around familial
responsibilities have often done so (Presser 1989:531). Men are increasingly following
suit (Shellenbarger 1998:31). For example, workers resist promotions, relocation, or jobs
that require overtime or extensive travel in order to balance their work and family
obligations (Lewin 1995:25). Indeed, men are as likely as women to refuse promotions or
decrease their hours at work in response to family obligations (Kmec and Barry 1997;
Chapman 1987:30).* Second, workers may purchase services they previously performed
(Sheth and Sisodia 1999;A26; Robinson and Godbey 1997:36; Hochschild 1997:230-1;
Bergmann 1986) and reduce the time they spend on domestic tasks (Robinson and Godbey
1997:94; Schor 1992:36). A third strategy is to reduce the number o f dependents by
delaying or foregoing childbearing or marriage (Morris 1997:86; Spain and Bianchi
1996:174; Presser 1995:303; University of California at Los Angeles/Kom-Ferry
1993:149). Workers may also simply forfeit their leisure time in order to meet competing
responsibilities (Robinson and Godbey 1997:130; Schor 1992:5; Shelton 1992:145;
Galinsky et al. 1993:73). Another strategy for many women and men is to seek employers
with work-home policies that allow a better balance between their paid and unpaid
responsibilities (Shellenbarger 1997:B1; Galinsky et al. 1991:113).
Alternative work arrangements as work-home policies. One of the benefits
employees most frequently seek is flexibility in their work schedules to address both their
work and home obligations (National Report on Work and Family 1999:45; Galinsky
1992; Rodgers 1992:186; Galinsky and Stein 1990:375). The implicit assumption in
work-family literature is that the more flexibility employees have in the timing and location
of their work, the better equipped they are to balance competing work-home obligations
(Hill 1996:299; Friedman 1991:38).’ By the late 1980s, it was not unusual for firms to
* Two high-profile male workaholics exemplified the changing mores in 1995. Bill Galston, domestic-policy adviser to President Clinton, and Harvey Golub, American Express Co.’s chairman, resigned at the peaks of their careers to find jobs that permitted a better balance between work and family (Shellenbarger, June 21, 1995:A1; Knecht, Nov. 22, 1995:A1).
’ Hill et al.’s research (1996) about the relationship between work-home balance and telecommuting raised questions about the assumption that flexibility is helpAil. However, the telecommuting respondents in their study had not chosen to use the option. Rather, the firm assigned employees to telecommute in order to reduce ofGce space. Thus, it is
9
implement work-home policies, including those offering alternative work arrangements
such as flextime, compressed work week (CWW), and telecommuting. The scheduling
options were intended to help workers with increased vulnerability to domestic
interference juggle their dual responsibilities, and to increase organizations’ ability to
recruit and retain good workers (Witkowsky 1999:204; Kelly 1999:169; Galinsky et al.
1991:82). According to a 1988-90 survey of 188 Fortune 500 firms, about 88 percent
offered part-time schedules, 77 percent offered flextime, 48 percent offered job-sharing
arrangements, and 35 percent offered flexplace (Galinsky et al. 1991:87).'“ The majority
o f alternative work arrangements were not available to all employees within the firms,
however, because different norms applied to different workers and divisions (Hochschild
1997:96; Galinsky et al. 1991:84-6). Moreover, individual managers often have the
discretion to make corporate-sanctioned arrangements available to their subordinates
(Hochschild 1997:25; Rodgers 1992:191; Starrels 1992:261; Galinsky et al. 1991:84-6).
In sum, the boundary between the public and private spheres is increasingly
permeable, and both employers and employees are searching for effective strategies to
reduce home-to-work spillover. Most workers have home obligations that make them
vulnerable to the intrusion of domestic responsibilities at work (Bond et al. 1998:28-9;
Galinsky et al. 1993:41; U. S. Bureau of the Census 1996: tables 624, 626).
impossible to discern whether those using the option would have chosen to do so to reduce work-home conflict.
Larger firms are more likely than small to offer such benefits, although not all of the reported programs were official company policy or were available to all employees. Companies represented the largest employers in 30 industry groups drawn fi-om the Fortune 500 Industrial and Service lists. One-third o f the surveyed firms were in the
to
Characteristics o f the work group and job may mitigate or aggravate that risk, thus
affecting both the workers and their work (Jacobs and Gerson 1999:79). In addition,
alternative work arrangements designed to help reduce the disruption of spillover may be
inequitably implemented within firms. AW As are also likely to vary in their ability to
ameliorate employees’ home-to-work spillover because they offer employees different
degrees o f flexibility.
We know relatively little about the conditions under which managers make
alternative work arrangements available to their subordinates, the specific factors that
prompt employees to use the options, and the options’ ability to mitigate the adverse
consequences o f home-to-work spillover." Organizational data on such policies do not
always take into account restrictions on the scheduling options’ availability (Witkowsky
1999; Galinsky et al. 1991:84-6; ). However, the context of work, including supervisors’
support, typically affects employees’ access to and use of alternative arrangements
(Hochschild 1997: 25; Schwartz 1994:41-2; Kingston 1990:443; Raabe 1990:483-4).
Some managers may refuse to allow workers to use the options because they think work-
home issues are inappropriate concerns of business, they fear diminished control, or they
think such policies conflict with their responsibility to create a profitable department
(Hochschild 1997:32; Gallo 1993:29; Rodgers 1992:189; Kingston 1991:446; Christiansen
and Staines 1990:462; Friedman 1987:1). In addition, some workers may resist using
service sector and the remaining two-thirds were producers o f consumer and industrial products (Galinsky et al. 1991:82, 84, 108).
" In part this is because firms often adopt policies in order to emulate other organizations, improve their image, and gain legitimacy (Ingram and Simons 1995:1479; Galinsky et al.
11
alternative arrangements because they believe it will restrict their career advancement
(Jacobs and Gerson 1999:93; Hochschild 1999:97; Hammonds et al. 1997:98; Schwartz
1994:26-9; Rodgers 1992:189; Galinsky et al. 1991:54). Therefore, the category of
worker (e.g., part- or full-time), job characteristics (e.g., supervisory responsibilities),
occupation (e.g., blue- or white-collar), and work environment (e.g., division and
department) may influence workers’ access to and use of work-home programs
(Hochschild 1997:139; Schwartz 1994:15-6; Doerpinghaus and Feldman 1993:82;
Galinsky et al. 1993:4; Galinsky et al. 1991:84; Raabe 1990:483).
Alternative arrangements such as flextime, CWW, and telecommuting also varj' in
the degree of flexibility they offer and in the equipment costs associated with them (Kelly
1999:187; Christensen and Staines 1990:471; Raabe 1990:482; Bohen and Viveros-Long
1981). These factors may influence managers’ decisions to make the options available,
employees’ decisions to use them, and their effect on home-to-work spillover.
My research examines four related aspects of an organization’s work-home policy:
(1) factors that affect employees’ access to three alternative work arrangement—flextime,
CWW, and telecommuting; (2) factors that affect workers’ use of the three scheduling
options, (3) factors that affect home-to-work spillover, and (4) the relationship between
employees’ use o f AW As and their home-to-work spillover.
1991:55; Friedman 1987:6). Without a pre-policy needs assessment, however, evaluation of programs’ effectiveness is impossible.
12
The locus of the study is a midwest financial services conglomeration that I will
refer to as Inland Enterprise. My research focuses on three diverse business divisions
within one o f the Enterprise’s largest companies. Midwest Securities (MW).‘
My analyses expand our understanding of worker’ access to and use of flexible
work options, our knowledge of home-to-work spillover, and our understanding of the
interrelationships between to two. By differentiating between and investigating both
managers’ decisions to make the options available to their subordinates and workers’
decisions to use the options, I am able to assess the influence of job factors, the effects of
contextual factors, and personal and household characteristics on managers’ decisions to
make the options available and workers’ decisions to use AW As. By examining the
relationship between alternative work arrangements and the intrusion of domestic
concerns into the workplace, I am able to gauge the interdependence of the two.
Increased understanding of the dynamics of the policy’s implementation—as well as
increased understanding of AW As’ effectiveness in helping employees balance their work-
home conflict—will allow employers to devise strategies to successfully implement
alternative work arrangements throughout their organizations.
Research Questions
Workers’ access to the alternative work arrangements outlined in MW’s work-
home policy is conceptually distinct from workers’ use of the options. First, MW granted
managers the discretion to make the options available to their subordinates. To assist in
I use pseudonyms for the organizations to preserve anonymity.13
the implementation process, MW provided managers with A Guide to Implementing
Alternative Work Arrangements. The guide outlines three criteria for managers’
consideration when determining their subordinates’ access to the options. I investigate
three research questions about factors that affect employees’ access to flextime, CWW,
and telecommuting: (I) To what extent do MW’s guidelines account for managers’
decisions to make the alternative work arrangements available? (2) What role do other
factors, such as workplace, personal and household characteristics, play in that decision
making process? (3) Do managers use the same criteria to determine the availability of
each option, or do the criteria vary by AW A?
Second, workers considering using an AWA must decide how an alternative
arrangement will affect their job performance and the evaluation of that performance, as
well as their need to use the arrangement. I investigate three related questions about
factors that affect workers’ use of the scheduling options and the relationship between that
use and home-to-work spillover: (I) What determines employees’ use of MW’s alternative
work arrangements? (2) What factors influence employees’ home-to-work spillover? (3)
What is the relationship between employees’ decisions to use the options and their
domestic spillover?
Overview of Dissertation
This study contributes to our understanding of the implementation and use of
alternative work arrangements, the nature of work-home conflict, and their
interdependence. I identify contextual factors that promote or restrict employees’ access
14
to and use of alternative work arrangements, including organizational, job, and personal
characteristics. My research also assesses the effects o f work and personal factors on
employees’ home-to-work conflict. Reciprocal analyses of the relationship of the options’
use and domestic spillover identifies variations in the alternative work arrangements’
effectiveness in helping workers’ juggle their dual responsbilities.
I present my research methods, analyses, findings, and recommendations in
Chapters Two through Five. In Chapter Two I discuss the locus of the study, as well as
my research methods which include quantitative, qualitative, and archival data collected
from surveys, interviews, focus groups, participant observation, and MW publications.
The chapter provides an overview of MW and profiles of the three divisions in which
respondents work. In Chapter Three I focus on the determinants of employees’ access to
flextime, CWW, and telecommuting. I use OLS regressions to investigate factors that
influence the likelihood that MW employees have access to flexible scheduling options.
The chapter includes my hypotheses, variables’ measures, the results of my regression
analyses, a discussion of the results, and the conclusions I reach. In Chapter Four I
investigate the determinants of employees’ use of the three alternative work arrangements,
job-related and personal factors influencing their domestic spillover, and the relationship
between AW As and spillover. I use simultaneous equation models to analyze the
hypothesized reciprocal relationships between workers’ use o f alternative work
arrangements and their home-to-work spillover. The chapter includes my hypotheses,
measures in my analyses not described in Chapter Three, regression results, a discussion of
those results, and the conclusions I draw from the data. Chapter Five outlines the
15
contributions o f my research, summarizes and discusses the research findings, notes the
limitations o f my investigation and suggests future research, and provides policy
recommendations based on my results. I use qualitative data throughout the chapters to
explain and enrich my hypotheses and findings.
16
CHAPTER 2
RESEARCH SETTING AND DATA COLLECTION
In this chapter I discuss the setting for my research, my entry into the firm, and my
data collection procedures. I studied workers employed at a subsidiary of a financial
services conglomeration. Inland Enterprise. The Inland Enterprise is a multi-faceted
Fortune 500 organization of almost 100 companies. It is one o f the largest multi-service
financial services organizations in the United States with more than $80 billion in
combined assets in 1997 and more than one billion dollars in combined net revenues
(Inland Annual Report 1997).* The Inland companies share a common management,
overlapping boards of directors, and a common primary goal: “Our customers come first.”
The organization employs more than 30,000 workers throughout its subsidiaries in the
United States, Europe, and Puerto Rico.
In 1994 the senior management of Inland endorsed a work-home policy proposed
by Inland’s Human Resources Department that offered three flexible work options—
flextime, compressed work weeks, and telecommuting.^ Inland’s subsidiaries subsequently
* These numbers are approximate to preserve Inland Enterprise’s anonymity. Similarly, the numbers for Midwest are also approximate.
The polity also included job sharing as an alternative arrangement. Survey respondents who claimed to share jobs worked 40 hours a week, on average, indicating they do not clearly understand the definition of the option. Thus, I did not include job sharing in the analyses.
17
endorsed the policy, and it was announced to all Inland employees in the spring o f 1995.
Inland’s Human Resources Department was responsible for administering the policy
through human resources personnel assigned to each subsidiary. In 1997 I approached the
vice president of Inland’s Human Resources Department about assessing the
implementation of the policy for my dissertation.
In consultation with the vice president, I agreed to focus on three divisions of
Midwest Securities, the second largest company in Inland with 4200 employees. A senior
MW officer explained that as a financial services company, MW is “ ...in the information
business. There is no real tangible product except the written [policies] and the
[information] service that supports it.” Midwest Securities produces hundreds o f different
types of policies, and oversees the daily movement of millions of dollars between
customers’ mutual funds. The company has enjoyed spectacular growth in recent years
and the firm’s assets have grown five-fold in the past decade. MW had total assets of over
$50 billion and net revenue of $250 million in 1997, making it one of the country’s largest
writers of individual variable annuities.^ More than 2660 employees worked in the three
divisions at the time of this study. MW ofBces are located within the Inland home office
complex, a multiple-building site in a major metropolitan area.
The Operations, Systems, and Actuarial Divisions
MW workers’ jobs are “knowledge jobs” that involve creating, processing and
managing information (Bems and Bems 1992:34). The three targeted divisions work
Primarily a life insurance company. Midwest’s standard industrial code is 6311.18
together to produce the various policies MW offers. As line and support divisions,
however, the divisions differ in their functions, cultures, and rules of operation.
Operations division. The first division is the Operations business unit, described
by MW informants as “a high-tech sweatshop” and “a white-collar factory.” Operations is
a production-oriented core unit whose 1,789 employees work in an environment that is
shaped by a goal for routinized, high-volume service delivery on a daily basis. The
division’s workforce is predominantly white (86 percent) and female (66 percent). A new
vice president took charge of the division in 1997 shortly before I began this research.
The vast majority o f Operations workers are customer-service representatives who
work at call centers."* The service “reps” provide information about and service for
policies to external customers such as stock brokers, regional planners, and sales agents.
The employees use well-defined phone and computer procedures, as well as
communication skills, to answer customers’ questions, adjust contracts (e.g., change
benefits), and revise billing procedures. The majority o f jobs are entry-level, salaried
positions requiring only a high school education and one to three weeks training at MW.
As an Operations manager explained, the service reps “have a one-to-one
relationship [with customers] and the customers call asking for a specific person. And we
think that we need to match our hours to our customers’ hours.” Thus, the reps are
required to be available whenever their customers call. Two nonmanagers described the
work environment: “Callers—they are not deadlines or anything, [but] you don’t know
"* The Operations’ call centers are located in the main office complex. A call center typically has hundreds o f employees assigned to it. Each worker has a cubicle, phone, and computer.
19
when they are going to come or what is going to happen. But they have to be dealt with.”
And “you.. .have a constant customer either on the phone or someone coming to you.”
Productivity in the Operations division is gauged on a ratio basis between the
number o f customers’ policies processed and the unit’s expenses, augmented by customer-
service measures. As a nonmanagerial informant noted, “We have production deadlines
on a daily basis.” At the time of my study, the Operations division was understaffed
because of the area’s low unemployment rate (2.5 percent). Thus, workers’ had three to
eight hours of mandatory overtime per week and were under constant pressure to perform
their routinized jobs quickly. In sum, the Operations division offered me the opportunity
to investigate the effect that a highly routinized and competitively-oriented line unit has on
employees’ access to and use of alternative work arrangements, as well as their home-to-
work spillover.
Systems division. The second division is the Systems unit, whose 710 employees
provide day-to-day technical support to all facets of the corporation, including the
Operations and Actuarial divisions. The division is predominantly white (90 percent), and
men comprise just over half of its workforce (54 percent). A Human Resources manager
described this division as the “most stressed of the three” due to its reorganization six
months before this research began.
In the words o f a Systems manager, the division “is where the rubber meets the
road, from the standpoint that we are responsible for putting [computer equipment and
programs] in, and they have to work for our customers.” Because their “hot skills” are in
demand—and scarce both within and outside MW, Systems “techies” consider themselves
20
to be “elite” and “cutting edge.” Systems’ customers (that is, workers in other divisions)
describe Systems employees as mature and professional—but also warn that Systems
workers are sometimes complacent about their technological expertise, lack customer
relations skills, and are not always responsive to internal customers’ needs.
The division has two major workgroups; business analysts who interpret clients’
needs (that is, requests from Operations for new or revised products) to the computer
programmers; and programmers who write the computer code to produce the product. As
market forces create the demand for new products, insurance regulations change, and
procedures evolve. Systems personnel are responsible for the installation of new hardware
and software. Systems employees are also responsible for the redesign of software for
such things as underwriting and servicing policies, paying agents’ commissions, and billing
customers. Thus, Systems employees’ work is centered on technology and driven by
change. In addition, the pressure to meet other divisions’ needs is compounded by
external timelines imposed by market forces, the SEC, and insurance regulatory
commissions.’ Systems informants agreed that “project deadlines are not set by anyone in
Systems, so they make absolutely no sense [in terms of matching the work required with
the time allotted for it]. It stresses everyone so that our work quality goes down because
you can’t get things done in the time that they set.”
Systems employees generally work in project teams that are on call 24-hours a
day, 7 days a week for emergencies such as breakdowns in programs and urgent
’ Each state in which MW operates has a regulatory commission that defines the requirements for the financial service industry. Thus, requirements for contracts vary from state to state and are constantly being revised by the governments.
21
programming revisions. A Systems manager explained that “things break at midnight or
at 6 am. They just don’t break in the middle of the day.” Consequently, in another
manager’s words, “We’re in a production environment mode, so we—my team and I—
need to be accessible around the clock.” Team members rotate the on-call responsibilities
and carry pagers and cell phones to remain accessible. As one informant noted, “It’s nice
we have some individuals who like to come in early and others who come in later and stay
later. So we get the wide coverage.... [But] if you use the CWW and you take Fridays
off, then you are [expected] to be at home on Fridays in case of an emergency.”
In sum, both business and technological needs shape the division’s functions,
creating an internal environment of ongoing change. The division is known for using new
technology and new processes—such as the flexible scheduling options—for the sake of
innovation, not necessarily for the processes’ business application. Productivity in
Systems is explicitly calculated by financial and time-driven measures. Thus, the Systems
division provided me with the opportunity to evaluate the effect of an innovative,
technological, and change-driven business unit on workers’ access to and use of AW As, as
well as their home-to-work spillover.
Actuarial division. The Actuarial division provides analytical and research
expertise to the line departments that are charged with building sales and assets. Actuarial
workers perform contract and compliance work—determining, for example, the prices of
MW’s products by taking into account probabilities of mortality and morbidity, anticipated
expenses, and desired profit margins. With 167 workers, it is the smallest division that I
studied, and one of the smallest in MW and within the Inland Enterprise. The workers are
22
predominantly white (94 percent) and male (63 percent). A male manager described the
homogeneity within his department;
“ ...[T]he people that I work with [have] the same timeline in life, the same situations.... Married, have kids,... a lot of them are males [with] wives at home.... So you sorta know where the people you [work] with are at in their lives. It is a small, informal division so you get to know people more. There is [a lot of] interaction between the people. The people that I work with are very hard workers and are also very understanding [of my work and home situation].”
MW informants described Actuarial employees as “the folks with slide rules in
their pockets,” a reference to actuaries’ stereotypical demeanor rather than the actual tools
of their work. Indeed, one Actuarial officer described the impact of technology and the 20
percent annual growth rate of MW: “We have fewer actuaries that do more things. There
are more investigations, more analyses to make, and more competitive things ... [that] you
have to stay on top of.” Like Systems and Operations, Actuarial’s work is market driven
and “we don’t have that much control over deadlines.” Nevertheless, an Actuarial
manager summarized informants’ consensus that external customers’ project deadlines
rarely impose production pressures: “There have been very few times in [my] 15
years. ..when there was a rush or critical things that needed to be done. I’ve never had a
problem with that. It has been very infrequent.” The compilation of MW’s financial
reports, however, do impose time pressures. One month each quarter actuaries produce
detailed summaries of MW’s earnings for investors, a time-consuming activity that is
similar to accountants’ quarterly “busy seasons.”
Actuarial’s work is highly analytical, and the professionalism of the division is
widely respected. One manager summarized the distinctive nature of the division: “[It] is
23
secluded within the company. We tend to make our own rules and break our own rules.”
For example, employees’ promotions and status are determined by professional
examinations (e.g., the Society of Actuaries’ series of examinations). An informant
explained that “as you go through the exams..., you go up in rank as manager and you
have more responsibility.... People who work hard seem to get further along.”
Moreover, the Actuarial division has a long history of informal use o f nontraditional work
arrangements. As a manager-of-managers noted, that is because policy dictates that
managers grant “study time for people who are taking exams. The company has given
them so many hours allotment to study.”
Measuring productivity is more ambiguous than in the other divisions, however, as
a senior Actuary acknowledged; “There is no productivity measure that we use. It’s a
matter of getting things done and keeping the operations profitable and understanding
what is going on.” Also in contrast to the Operations and Systems divisions, the Actuarial
division has experienced little change over the past year. Thus, the division offered me the
opportunity to assess the effect that a professional research environment has on factors
affecting employees’ access to and use of flexible work arrangements, and the employees’
vulnerability to the intrusion of domestic concerns in the workplace.
Representative line and support divisions. The three divisions represent a cross
section of line and support divisions throughout the enterprise. The variation in the
divisions’ size is a proxy for characteristics such as structural differentiation, degree of
bureaucratization, and availability of replacement workers (Scott 1992:258-61; Baron
1984:41-2). The divisions’ Ainctions determine their customers and their measures of
24
productivity, influence the type o f employee who is drawn to—and who has the skills to
perform—each division’s specialized work, and shape the underlying work group
processes, values, and perspectives. A MW officer maintained, for example, that “so
many of the Operations workers deal with external clients, that [Operations workers] tend
to be grounded in reality—unlike Systems and Actuarial workers, whose clients are
internal customers ” In sum. Operations’ strength lies in its workers’ skills and their
customer relations. Daily production goals define the scheduling of work and productivity
in the division. In contrast. Systems’ strength lies in workers’ technological proficiency.
Project deadlines and ad hoc events determine Systems employees’ schedules and
measures of productivity. Actuarial’s strength lies in its employees’ analytical expertise.
Actuarial workers’ schedules—although also established by project deadlines—are
relatively long term with ambiguous measures of productivity. Thus, characteristics such
as each division’s focus, goals, work processes, professionalism, workforce composition,
and size shape the context in which employees work.
Despite the differences between the divisions, each is susceptible to the
productivity losses caused by employees’ home-to-work spillover. Productivity is difficult
to concretely measure in knowledge industries (Robinson and Godbey 1997:307),
especially in support units like Systems and Actuarial. Friedman argues (1991:11) that
productivity has “come to mean more than the classic economic definition o f ‘output over
input ... [Fjamily problems may cause worry at work, resulting in a loss of concentration
and the inability of the employee to perform up to par. ” MW employees attested to
spillover’s negative effects. According to a female nonmanager, “[Spillover] influences
25
how well you work and how focused you are on what you are doing during the day.” A
male coworker agreed: “[When you have spillover,] you end up making mistakes or you
don’t do quite as good a job as you could have.” Indeed, the negative effects of spillover
on employees’ job performance—and hence, on the firm’s productivity—are particularly
important in labor-intensive information and service industries like MW, where workers
account for 70 to 80 percent of all controllable costs (Friedman 1991:12).
A Comparison of the Midwest Securities Workforce with the U.S. Workforce
In terms of the representativeness of my sample, MW workers’ family
composition, eldercare responsibilities, and financial resources were similar to those o f the
U.S. workforce, as Table 2.1 shows.® The percent of MW employees who were married
or partnered mirrored the national workforce, as did the percent who had children 18
years or younger living at home. Indeed, almost a third of each group lived in dual income
households with children. In addition, thirteen percent o f the MW and national labor
forces provided care to elderly or disabled family members or friends at the time of the
two studies. Although about six percent of MW workers were single parents compared to
nine percent nationally, three times as many women as men were single parents in both
studies (t-test, p.<.05; Bond et al. 1998:30). Finally, MW workers’ financial resources
were also similar to employees’ nationwide.
® I weighted the MW sample to adjust for differences in sampling fractions between divisions. The 1997 National Study of the Changing Workforce (NSCW) is a random sample of civilian, non-institutionalized wage and salaried workers 18 years or older who resided in the contiguous 48 states.
26
[ Table 2.1 about here ]
The two labor forces differed along other dimensions, however. Mirroring the sex
and race composition of the financial service industry (Smith and Maese 1998:252; Reskin
and Padavic 1994:92), greater proportions o f MW workers were female and white than in
the U.S. labor force as a whole. MW workers were also younger and better educated than
their national counterparts. Moreover, MW employees typically worked fewer hours per
week than colleagues in the U.S. workforce as a whole. However, both groups reported
that they worked about five hours per week longer than officially scheduled (MW’s
official workweek is 38.75 hours; nationally, the workweek officially averages 38.5
hours)(Bond et al. 1998:72). Finally, workers nationally were more likely than MW
workers to live with family members that included parents, siblings, and in-laws.
The differences between the two labor forces’ sex and age structures, household
composition, and average weekly hours of paid employment may have implications for
workers’ domestic spillover. That is, to the extent that home-to-work spillover is
grounded in domestic obligations and is related to workers’ age, that women have greater
responsibility for care-giving and household tasks than men, and that increased hours at
work are inversely related to the time employees have to address household and familial
concerns, women and men in the MW may report different levels o f domestic spillover and
thus request and use alternative work arrangements to different degrees compared to their
national counterparts.
2 7
Entrée to Inland Enterprise
My association with Inland began informally in 1983. I met Fran, the spouse of an
Inland officer, while doing volunteer work in the community.’ We became friends, as did
our spouses and children. Over the next 15 years we socialized and vacationed together,
and I had the opportunity to meet many Inland employees at Fran’s home and at
community events. Fran’s husband took an interest in my research on work-home conflict
as I progressed through my graduate course work in sociology. Following my candidacy
in 1996, he urged me to explore research opportunities with the vice president o f Inland’s
Human Resources Department because Inland had recently adopted a work-home policy
that offered alternative work arrangements. The vice president, with whom I was socially
acquainted, agreed to discuss research options with me. At that meeting, he expressed
interest in an investigation of employees’ access to and use of AW As. Inland had not
assessed the implementation nor the effects of the work-home policy since its adoption in
1994. From the corporation’s perspective, this was an opportunity to gather that
information using few organizational resources.
We agreed upon Midwest Securities as the site of the research, on the firm’s work-
home policy as the focus of the study, and on the assistance that Inland and MW would
provide. That assistance included access to MW employees; letters of support from
MW’s president and division vice presidents; use of the MW’s internal mail and voice-mail
systems; use of Inland’s research department to provide random samples for focus groups,
interviews, and the survey; and postage for the return of the second-round surveys. Inland
’ I have changed the names of all individuals in this document to protect their anonymity.28
also agreed that it would not have access to the collected data (see Appendix A; Letter of
Agreement). The vice president appointed Dave, an Inland Human Resources manager, as
my liaison. In addition to keeping Inland apprised of the study, Dave’s responsibilities
included ensuring I had necessary resources and access to the appropriate employees
within MW, such as the company’s vice presidents, its Human Resources officer, and her
managers. Another key contact was Sally, the administrative assistant to MW’s Human
Resources officer. With her knowledge of the company and her contacts with
administrative assistants throughout the three MW divisions, she was the “go-to” person
when I needed to arrange meetings, for example, or obtain and distribute letters of
support.
Data Collection Procedures
I used archival, qualitative, and quantitative data collected from MW publications,
focus groups, interviews, surveys, and participant observation to address the research
questions.^ The triangulation of information allowed me to develop a more
comprehensive understanding of the determinants and processes influencing employees’
access to and use of AWAs, and the intrusion of workers’ domestic obligations into the
workplace.
' My liaisons at Inland and MW, as well as a variety of other informants, provided me with copies o f Inland and MW publications, reports, survey instruments, and memoranda. I used the data to construct the interview and focus group schedules and survey instruments, to understand the formal and informal norms of the company and divisions, and to help interprète the qualitative and quantitative data.
29
I used two strategies to facilitate employees’ participation in focus groups,
interviews, and surveys. First, I collected all qualitative and quantitative data during
work hours. To encourage employees’ participation, MW notified all managers in the
three divisions of the study and asked them to grant release time to participating workers.
I have no way of knowing if all managers received the memo or agreed to grant release
time to their subordinates, but the rates of participation in the data collection activities
suggest managers’ compliance with the request. Second, I conducted all meetings of
employees in rooms centrally located in the three-building complex housing MW. The
single site minimized participants’ travel time and maximized the timeliness o f
communication through the company’s internal mail system.
Unit of Analysis
Although the unit of analysis in my study is the individual, I draw comparisons
between contexts—that is, divisions and departments—and attach the data on divisions
and departments to individual data. Each division has multiple departments involving
multiple managers and their subordinates.^
’ One o f the norms o f the organization—and a factor making it difficult for employees to perform efficiently—is that departmental change is constant. As one informant explained, departments ''vary daily as processes are reorganized, new products are developed, and managers come and go.” Change implicitly reduces workers’ ability to perform, as reporting mechanisms, job responsibilities, and workgroup coordination and communication are ambiguous, at least temporarily. A nonmanager described his position; “[There] are massive amounts o f reorganization. Who works for whom.... I just got reorganized yesterday [and] I’m not sure who I work for.” Another added, “[Under the reorganization], they took [me] from one job to another, doing totally different things... [based on] the other duties as assigned’ clause in our employment contract. If [I] don’t want to, well—find a new job.”
30
Initial Focus Group and Interview Sample and Strategy
Using interviews with managers and focus groups with nonmanagers, I gathered
qualitative data on employees’ perceptions of—and experiences with—flexible work
arrangements and balancing the demands of home and work (see Appendix B; Schedules
for Interviews and Focus Groups). MW has used both interview and focus group
formats for a wide variety of internal research studies, and thus the majority of participants
were familiar with the procedures. I used information gathered in these discussions, in
part, to construct the survey instruments. I also drew on these qualitative data in
interpreting my statistical findings.
As noted, these interview and focus group participants were employees in
Midwest’s Systems, Actuarial, and Operations divisions. Inland’s Human Resource
Information Service used a random-numbers computer program to identify sample pools
of 120 nonmanagers (20 women and 20 men from each division) and 30 managers (5
women and 5 men from each division)." During work hours, I called employees from the
nonmanagerial pool until I had enlisted 10 participants for each of four 90-minute focus
groups.'^ I used the same technique to enlist 12 managers’ participation in 20-minute
I also had opportunities to talk with informants in less structured settings, such as a MW training for managers on diversity and numerous community and MW events.
" The size o f the sample pool was designed by HRIS to provide informants for all focus groups (initial and pretest) and interviews.
Four nonmanagers declined to participate. Nineteen others had scheduling conflicts, but they indicated they would be interested in participating in the pretest focus groups if their schedules permitted. No managers declined to participate, and those with scheduling conflicts also indicated interest in participating in the pretest focus groups.
31
interviews. Participation was voluntary. Although informants’ managers had been asked
to grant release time for their participation, no one was under pressure to participate.
Following Morgan (1997:34), I conducted four semi-structured focus groups with
a total of 34 nonmanagerial employees across the three divisions. In keeping with the
principle that focus groups should be strangers who share homogeneous backgrounds,
though not necessarily similar attitudes (Morgan 1997:34), I assigned nonmanagerial
volunteers to focus groups based on three factors: sex, care-giving responsibilities, and
MW division. Thus, the four groups were divided into those with women without care-
giving responsibilities, women with care-giving responsibilities, men without care-giving
responsibilities, and men with care-giving responsibilities. Each group was composed of
eight to ten people, with no more than three members in any one group drawn from any
one division. This minimized the risk that participants would know each other and
ensured a cross-section of employees from the divisions.
I used interviews rather than focus groups with MW managers and officers, given
their tighter time constraints relative to nonmanagerial employees. I conducted 18
interviews, including 11 with managers from across the three divisions, four Human
Resource employees who worked at Inland and MW, and the three senior vice presidents
of the Systems, Actuarial, and Operations divisions.
Six employees did not participate in their scheduled focus groups due to last-minute scheduling conflicts.
One manager did not participate in his scheduled interview due to a last-minute scheduling conflict.
3 2
One important result of the focus groups and interviews was my decision to have
slightly different versions of the survey for nonmanagers and managers. Because
managers have the discretion to implement the AW As, their survey asked questions about
colleagues’ support of, as well as managers’ resources for, AW As that were not included
in the nonmanagers’ survey (see Appendix C: Managerial and Nonmanagerial Survey
Instruments).
Pretest Sample and Strategy
I pretested the surveys in two focus groups, one of managers and one of
nonmanagers from the Systems, Actuarial, and Operations divisions. Pretest focus group
members were volunteers from the original sample pools for focus groups and interviews
who had not previously participated. In both groups I sought equal representation of
women and men, participation by those with and without care-giving responsibilities, and
representation from each division. I used the same procedure to enlist participation that I
had used earlier; a phone call to potential informants and a confirmation letter to
volunteers (see Appendix D: Confirmation Letters to Interview and Focus Group
Participants). Eight MW managers and eight nonmanagers completed and commented on
the draft s u r v e y s . A s with the earlier focus groups and interviews, all employees
participated voluntarily and managers granted release time to participants.
Following Converse and Presser (1986:52), the focus groups were designed as
“participating pretests” to assess the meaning of questions, task difficulty, the order of
All employees whom I invited to participate agreed to do so unless they had a scheduling conflict. Ten employees volunteered for each group, but only eight ultimately participated in each due to last-minute scheduling conflicts.
33
questions, skip patterns, respondents’ interest, and completion time (see Appendix B:
Schedules for Interviews and Focus Groups). Thus, the two pretests helped me to revise
the survey format for greater clarity and ease of response, identify appropriate language
for survey items, and determine survey completion time, which ranged from 15 to 25
minutes.
Survey Sample and Strategy
For the survey pool, HRIS identified simple random samples of managers and
nonmanagers using a random-numbers computer program. Because my research was
limited to three divisions within MW, informants in interviews and focus groups indicated
that survey respondents would be concerned about confidentiality. Managers agreed, for
example, that asking job titles would potentially identify a lot of people because so few
employees shared the same title at the managerial level. Using a sample of managers
matched with their subordinates would further contribute to concerns about
confidentiality. Therefore, the pool was stratified by division and by employees’
managerial and nonmanagerial status within each division, but I did not attempt to use
clustered samples.
Two criteria guided the composition and size of the sample pool. First, I sought to
obtain a ratio o f completed managers’ and nonmanagers’ surveys in each division that
reflected the overall ratio of managers and nonmanagers within each workforce. The
sample pool from each division therefore reflected the managerinonmanager ratio in that
division. Second, my goal was a minimum of 135 completed surveys from each of the
three divisions for a minimum total sample o f405 surveys. This is consistent with
34
Bootnsma’s recommendation of samples o f400 for analyses of simultaneous equation
models (1987:184). A sample size o f400 or more was also consistent with Milton’s
(1986:114-5) recommendation for OLS equations similar to my conceptual model of
workers’ access, and allowed for more complex OLS models should they be needed.**
Moreover, division samples of at least 135 respondents would allow me to conduct
ordinary least squares analyses of each division separately, should I choose to do so.
Because the Actuarial division was small, all Actuarial employees were included in its
sample pool.
Based on the response rates of other MW surveys, HRIS randomly selected 250
employees from both the Systems and the Operations divisions to generate samples
similar in size to the projected Actuarial sample.” Therefore, the total sample pool for
the survey was 667 MW managers and nonmanagers from across the three divisions.
I administered the surveys in two rounds at work because employees are more
likely to complete surveys distributed at work (with release time granted) than surveys
that are distributed to their homes (Friedman 1987:24). I administered the first round in a
** Milton’s technique for sample size (n) takes into account the desired level of significance (/), the number of variables in the final model (k), and the anticipated overall R . In addition, the sample should be large enough to ensure that an independent variable contributing an additional one percent of the explained variation (if entered last) be significant at the specified level (Aq^) (Milton 1986:114-5). Thus, the equation is n = k + I = t (1- R ) / Arj . I wanted alpha to equal .05, and anticipated 20 variables in the model, an R of .30, and equal to .01.
HRIS contended that the response rate of the Actuarial division was traditionally higher than the response rates o f the Systems and Operations divisions. Therefore, I needed larger sample pools from Systems and Operations to generate samples equal in size to the Actuarial sample.
35
group setting, followed by a mail-in survey to sample pool members who had not already
participated. The administration of the surveys in a group setting was advantageous for
two reasons. The form of administration is typically used by MW for survey
administration, so employees were familiar with it. Second, members of the sample pool
identified themselves when they arrived at the survey administration site and I noted their
participation. Consequently, I was able to immediately follow up with members o f the
pool who had not been able to participate at the assigned time.'*
Prior to the group administration of the survey, three survey-related mailings were
sent to MW employees using the company’s internal mail system (see Appendix E:
Administrative Letters o f Support, Confirmation Letters, and Reminders to Sample Pool
Members About the Survey). Three weeks before the survey administration, the senior
vice president of each division sent a memo outlining the project to all employees in their
respective division. By informing all employees, I hoped to minimize the potential
reaction of sample pool members that they were being singled out. Two and a half weeks
before I administered the survey, I sent a letter to employees in the sample pool inviting
their participation in the survey. I assigned each sample pool member a primary date,
time, and location for survey administration, and a second date to accommodate workers
'* Keeping track of participants in this way also allowed me to exclude one employee who wanted to participate but was not a member of the sample pool
I could not guarantee anonymity to respondents who participated in the group administration of the survey or who completed mail-in surveys. Both involved notification by internal mail and managers granted release time to participants. Moreover, other participants were present during the group administration of the surveys and co workers were potentially present when respondents completed mail-in surveys. However, I could ensure confidentiality to all participants by guaranteeing that no one, including myself, could match individual participants with their completed surveys.
36
with scheduling conflicts. Both the MW officers’ memos and my letter emphasized the
voluntary nature o f the survey and the random nature of employees’ selection, and
encouraged employee participation. Ten days before the survey administration, I sent a
second memo to the sample pool reiterating the invitation, as well as employees’ assigned
dates, times, and location.
I addressed three potential logistical problems to group administration: (1)
scheduling conflicts, (2) respondents’ need to leave their offices to participate, and (3) the
smooth administration of up to 175 surveys at a time. First, to reduce scheduling conflicts
and encourage participation, MW vice presidents notified their managers of the survey
dates and asked them to grant release time for their subordinates’ participation. Second,
to make the location convenient to MW employees (all of whom were located in the three-
building headquarters complex), I administered surveys in a central meeting site at Inland’s
corporate headquarters. In addition, I scheduled eight survey administration periods over
two days. Therefore, each employee could choose between two assigned times (one on
each date). Moreover, each period was an hour long, providing leeway for respondents to
take the 20-minute surveys. Third, Ohio State University colleagues provided assistance
on the survey dates to ensure the smooth group administration of the surveys. They
greeted respondents, kept track of which members of the sample pool participated, and
distributed surveys at an administration desk outside the meeting room. I remained in the
meeting room to answer participants’ questions.
The administration of the surveys at work, whether in a group setting or during the
follow up phase, raised the potential for two additional issues: employees’ lack of privacy
37
to complete surveys and their concerns about confidentiality. Both workers in the group
settings and those who received mail-in surveys may have lacked privacy to complete their
questionnaires. To minimize the privacy issue in the group sessions, I asked that
participants not sit near one another and that they not talk to each other while completing
surveys. In addition, I reduced the possibility that participants who worked together
would complete their surveys at the same time by assigning managers and nonmanagers to
different administration sessions, and dividing and assigning nonmanagerial employees
within divisions to three different administration times.
Following the group administration of the survey, I sent two mailings in MW’s
internal mail system to the 317 members of the sample pool who had not participated (see
Appendix E: Administrative Letters of Support, Confirmation Letters, and Reminders to
Sample Pool Members About the Survey). The first, sent a week after the group
administration of the survey, included a letter from me and a survey with a stamped
return envelope. To increase their confidence that MW would not have access to the
data, I asked respondents to mail their surveys back to me at The Ohio State University.
The internal mailing also included a letter from the president of the company emphasizing
the voluntary nature o f the survey and again encouraging participation. A week later, I
sent a reminder memo through MW’s internal mail system to all 317 initial
nonrespondents, as I had no means of knowing who had already responded to first
follow-up letter and who had not.
Confidentiality was another issue. Employees may have refused to participate if
they were concerned about the confidentiality of their responses. I used five strategies to
38
minimize sample pool members’ concerns about confidentiality and to ensure respondents
o f two things: that MW would not have access to the data, and that no one would be able
to match participants with their answers. First, my memos to employees guaranteed
participants’ confidentiality. Second, I used Ohio State University colleagues rather than
Inland or MW assistants to help administer the surveys. Third, employees placed their
completed surveys from the group sessions into closed boxes. Fourth, follow-up surveys
were mailed to The Ohio State University. Last, I included a contact phone number in
the memos in order to be able to respond to questions and concerns. No members of the
sample pools called with concerns.*’
Survey Response
Almost three-fourths (72.6 percent) of MW employees in the total sample pool
returned completed surveys (n=484), although response rates varied between divisions.
Table 2.2 presents the overall response rate, the rates for each division, and the resulting
sampling fractions and sample weights for the divisions.^’
[ Table 2.2 about here ]
Half (52.5 percent) of the survey pool completed surveys on the dates o f the group
administration. Managers’ and nonmanagers’ responses were consistent with the ratio of
*’ However, ten members of the sample pools who were unable to attend their assigned group sessions called to inquire about alternative ways to participate and were informed about the follow-up procedure.
Four hundred and eight-six MW employees completed surveys. I discarded the survey completed by an employee who was not in the sample pool. Another survey was unusable in the analyses because the respondent did not indicate whether he had access to the AWAs.
39
manager to nonmanager in each division and in the sample pools (t-tests, p<.05)."‘ An
additional fifth (20.1 percent) of the pool returned mail-in surveys.^
I base discussions of the demographic characteristics of the employee population
represented by the three divisions on data weighted to adjust for differences in sampling
fractions between divisions (see Table 2.2). Although the sample for the analyses in
Chapters 2 and 3 is 484, the sample for the analyses in Chapter 4 is 480 because four
surveys had incomplete data about respondents’ use of AWAs or their home-to-work
spillover. Therefore, I used a second set of sample weights in describing the entire
workforce in that chapter. I did not weight data in the regression analyses because 1
controlled for division.
Because the analyses of employees’ access to and use of AWAs required different
variables and regression techniques, I discuss the variables and methods of analyses I used
to investigate the determinants of workers’ access to alternative work arrangements in
Chapter 3. Similarly, in Chapter 4 I discuss the variables and methods of analyses I used
The ratio of managers to nonmanagers in Operations was 1:6 and in Systems it was 1:7. The Actuarial ratio was 1:1 because Actuarial promotions are based on professional tests and do not necessarily involve supervisory responsibility.
^ MW employees who completed the managers’ survey in the group setting did not dififer from those who mailed in their surveys by sex, race, degree of home-to-work spillover, or access to and use o f flextime, CWW, and telecommuting (t-tests, p< 05). In contrast, MW employees who completed the nonmanangers’ survey in the group setting differed from those who mailed in their surveys by sex and their access to flextime and CWW. A higher proportion o f women completed nonmanagerial surveys in the group setting than did those in the follow-up group (59 percent to 48 percent). Similarly, a higher proportion of respondents with access to flextime participated in the group setting than the follow-up (81 percent to 66 percent) and a higher proportion of those with access to CWW participated in the group setting than in the follow-up (70 percent to 57 percent).
40
to investigate the determinants o f and relationship between MW employees’ use of AWAs
and their home-to-work spillover.
41
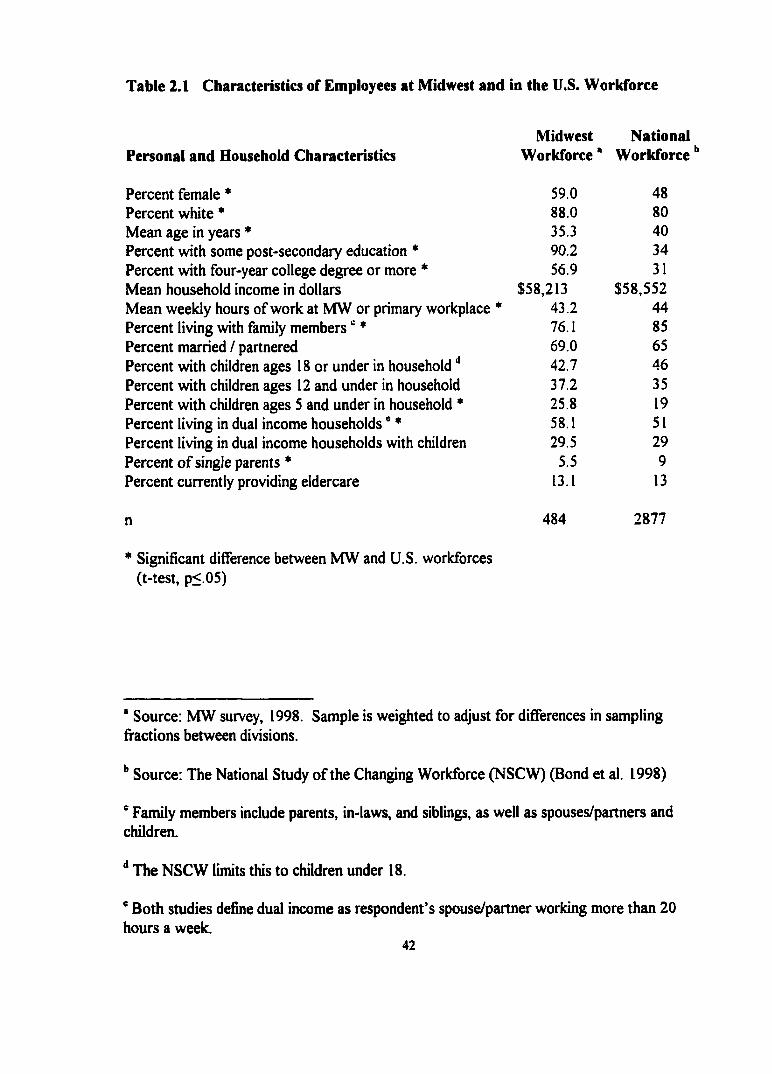
Table 2.1 Characteristics of Employees at Midwest and in the U.S. Workforce
Midwest NationalPersonal and Household Characteristics Workforce * Workforce
Percent female * 59.0 48Percent white * 88.0 80Mean age in years * 35.3 40Percent with some post-secondary education * 90.2 34Percent with four-year college degree or more * 56.9 31Mean household income in dollars $58,213 $58,552Mean weekly hours of work at MW or primary workplace * 43.2 44Percent living with family members ' * 76.1 85Percent married / partnered 69.0 65Percent with children ages 18 or under in household '* 42.7 46Percent with children ages 12 and under in household 37.2 35Percent with children ages 5 and under in household * 25.8 19Percent living in dual income households ' * 58.1 51Percent living in dual income households with children 29.5 29Percent o f single parents * 5.5 9Percent currently providing eldercare 13.1 13
n 484 2877
* Significant difFerence between MW and U.S. workforces (t-test, p<.05)
* Source; MW survey, 1998. Sample is weighted to adjust for differences in sampling fractions between divisions.
’’ Source: The National Study of the Changing Workforce (NSCW) (Bond et al. 1998)
" Family members include parents, in-laws, and siblings, as well as spouses/partners and children.
** The NSCW limits this to children under 18.
' Both studies define dual income as respondent’s spouse/partner working more than 20 hours a week.
42
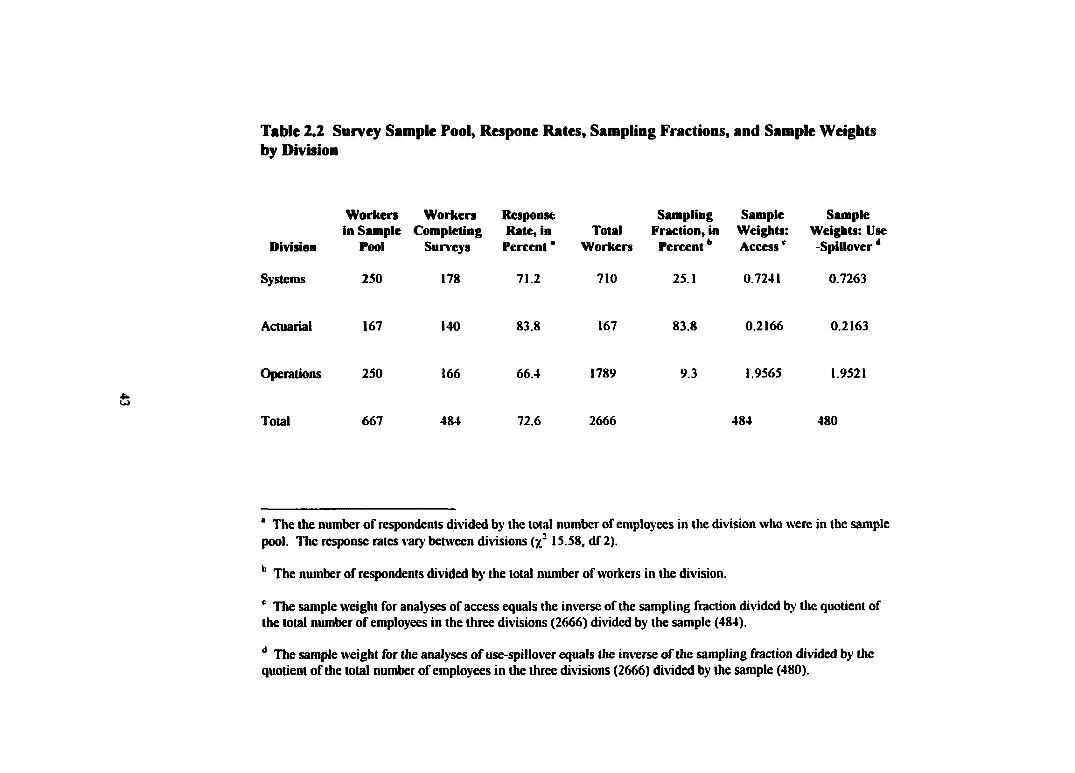
Table 2.2 Survey Sample Pool» Respone Rates, Sampling Fractions, and Sample Weights by Division
Division
Systems
Workers Workers Responsein Sample Completing Rate, in
Pool Surveys Percent "
250 178 71.2
TotalWorkers
710
Sampling Sample Fraction, in Weights:
Percent
25.1
Access '
0.7241
Sample Weights: Use -Spillover '
0.7263
Actuarial 167 140 83.8 167 83.8 0.2166 0.2163
Operations 250 166 66.4 1789 9.3 1.9565 1.9521
Total 667 484 72.6 2666 484 480
* The the number of respondents divided by the total number of employees in the division who were in the sample pool. The response rates vary between di\isions (%' 15.58, df 2).
The number of respondents divided by the total number of workers in the division.
' The sample weight for analyses of access equals the inverse of the sampling fraction divided by the quotient of the total number of employees in the three divisions (2666) di\'ided by the sample (484).
The sample weight for the analyses of use-spillover equals the inverse of the sampling fraction divided by the quotient of the total number of employees in the three divisions (2666) di\ided by the sample (480).
CHAPTER 3
DETERMINANTS OF MW EMPLOYEES’ ACCESS TO
ALTERNATIVE WORK ARRANGEMENTS
In Chapter One I reviewed the demographic changes and economic issues that
prompted organizations to adopt work-home policies over the past three decades. MW
adopted a work-home policy in 1994 that made three alternative work arrangements
available to its employees: flextime, compressed work weeks, and telecommuting. The
company’s official rationale for oSering the options was to help employees "try to balance
their home life responsibilities with their work demands... [and] assist [managers] as they
compete for the skilled staflF members they need (A Guide to Implementing Alternative
Work Arrangements 1995).” As a company officer explained, the policy was designed as
a work-home rather than a work-family policy
“...to address a multitude of issues involved in balancing work and home life in general...[not] just the child care issue that only touches the people who have kids. We needed to do something that cut across all our employees’ lives. And one of the best ways to do that was to really get serious about alternate work hours and locations.”
At the same time, MW emphasized that “whatever work arrangement [is]
selected—traditional or nontraditional—business objectives must be met and the needs of
the customer and other employees must not be compromised (A Guide to Implementing
44
Alternative Work Arrangements 1995).”* Thus, MW views maintaining productivity
(rather than workers’ need) as the paramount consideration for the implementation of
flexible options. A senior Human Resources officer summarized the goal o f the options:
“[We’re] in the business o f serving our customers [and] in some cases, that has to take
precedence. That we can’t pinch. But...beyond that, [we need] to really get serious
about more flexibility.” The vice presidents of each division expressed support for AWAs.
However, MW granted managers the discretion to make the options available to
their subordinates rather than guaranteeing the universal availability of AWAs. Echoing
the Human Resources officer quoted above, two 1995 memos to MW managers about the
options and a concurrent Inland newsletter article about AWAs argued that some jobs do
not lend themselves to flexibility. Thus, managers—who presumably are in the best
positions to determine this—have the discretion to make the options available.
In sum, managers are “the ‘point men’ of a given strategy and the potential ‘fall
guys’ when things go wrong” (Jackall 1988:21). Managers have the most at risk if they
implement the AWAs—as well as if they do not implement the AWAs—because they have
the responsibility to ensure subordinates’ short- as well as long-term productivity. This
chapter focuses on factors that influence workers’ access to the options.
Three sets o f factors should influence the implementation of AWAs. First, to help
managers in their decision-making process, MW distributed a managerial guidebook—A
* The duality—and sometimes inherent conflict—between the motive to help employees meet competing responsibilities and the motive to increase net revenue is starkly illustrated in another subsidiary company of Inland. Managers there are imposing flextime and CWW schedules on workers, regardless of employees’ personal preferences, as a means to provide broader service coverage to clients. Officers in that subsidiary have also asked managers to reduce office space and costs by requiring their subordinates to telecommute.
45
Guide to Implementing Alternative Work Arrangements—that defined three formal
criteria for implementation of the work/home policy: job suitability, employee suitability,
and the cost-benefit ratio of alternative work arrangements. Second, researchers have
found that contextual factors in the workplace influence employees’ access to AWAs
(Hochschild 1997:96; Schwartz 1994:36-8; Rodgers 1992:191). Third, MW Human
Resources officers believed that employees’ personal and household characteristics should
not influence their access to flextime, CWW, and telecommuting because the policy is a
work-home (rather than a work-family) program. However, prior research indicates that
employers and employees are concerned about disparate treatment based on familial
obligations (Khan 1994:3; Bailyn 1993:145; Grossman 1993:R8).
Therefore, I address three research questions: (1) To what extent do MW’s
guidelines account for managers’ decisions to make the options available? (2) What role
do other factors, such as workplace, personal and household characteristics, play in that
decision-making process? (3) Do managers use the same criteria to determine the
availability of each option, or do the criteria vary by AW A? Thus, in addition to job and
employee characteristics related to the guidelines, I investigate factors related to the
context in which employees work, as well as personal, familial, and household
characteristics that may promote or restrict workers’ access to the options.
Hypotheses
The three alternative work arrangements permit flexibility in the timing and
location of work. MW defines flextime as the flexible scheduling of work such that
46
employees begin their work daily before or after the regular starting time in their
department (but not as a function of CWW or telecommuting). However, managers
expect flextime workers to be present during core work hours that are established by
management. In contrast, employees using compressed work week schedules work a full
work week in fewer than five days.^ An employee using a typical CWW schedule, then,
would work 10 hours for four days and have the fifth workday off The third option is
telecommuting. Telecommuters use electronic communication to perform some or most
of their work away from the office setting (usually at home). Workers who telecommute
may do so on an ad hoc or regular basis, and therefore may combine telecommuting with
other alternative work arrangements. Managers typically expect regular telecommuters to
work in the office at least one day a week, however. Thus, the options differ in the degree
of flexibility they offer employees.
The Influence of Corporate Guidelines on Workers’ Access to AWAs
According to MW’s criteria for implementation of AWAs, managers should
evaluate three criteria: (1) whether the job is suitable for flexible options; in other words,
would nonstandard hours or location adversely affect external or internal customers; (2)
whether the employee is suitable—that is, whether they have the skills to work
independently; and (3) whether the benefits of employee flexibility (i.e., increased
attraction and retention of skilled workers and gains in productivity) outweigh the extra
supervision it may require. A nonmanagerial informant summed up the factors managers
considered: “The discussions I’ve seen [between managers and subordinates] involve who
Compressed work week schedules may also be designed for four-and-a-half day work weeks and 2-week periods.
47
you interact with, how they will be affected by your schedule, do you have the necessary
training, do you know how to actually do the job, do you need support from your manager
or co-workers, and how will we judge your performance.”
Job suitability. The first of the three managerial guidelines for implementation
suggests that characteristics of employees’ jobs should affect workers’ access to AWAs.
Two attributes of subordinates’ jobs should influence managers’ decisions to make the
options available: (1) the degree jobs require workers to interact with others, measured by
supervisory responsibility and the need to interact with a variety of people; and (2) the
demands of their jobs, measured by job complexity and speed.
First, jobs that are interdependent require their holders to be available to others,
whether clients or other MW employees. As an Operations manager noted, “We need to
match our hours to our [external and internal] customers’ hours.... [It is an] issue of
people not being there when others are calling for them.” Another argued, “[T]here is
great value in the face-to-face interaction with members of your team.” Similarly,
supervisors have a mandate to control subordinates and to be available and accessible to
them at all times (Bailyn 1993:33; Rodgers 1992:194). Therefore, job interdependency
should be adversely related to workers’ access to the options whether employees’
customers are external clients or MW coworkers.
In addition, firms have an incentive to retain workers who perform demanding
jobs, such as those characterized by complexity and speed (Witkowsky 1999:226;
Schwartz 1994:13; Morgan and Milliken 1992:229; Galinsky et al. 1991:111, 115;
Friedman and Johnson 1991:16; Kingston 1990:450). And as a senior human resources
48
officer explained, “The competition for employees is fierce.” Consistent with MW’s
rationale for implementation, demanding jobs that involve complexity and jobs that require
speed—for which I assume competition for workers exists—should be positively related
to employees’ access the options as a retention strategy.
Employee suitability. The second managerial guideline for making AWAs
available relates to employees’ suitability, which I conceptualize as their ability to work
independently. Two dimensions indicate employees’ ability to work independently: their
organizational status and their autonomy. Prior research has shown that high status is
associated with increased access to flexible schedules (Schwartz 1994:1,13; Galinsky et
al. 1993:4; Starrels 1992:265). Therefore, mirroring other studies, I expect that salary
grade, a measure o f status as well as compensation, should be positively related to access.
In addition, I use two measures of autonomy in the analyses for access: workers’
ability to make job-related decisions and their ability to perform jobs independently.
Autonomy allows workers a say in how and when they will work. Moreover, autonomy
implies that employees perform their jobs without managerial oversight, a prerequisite to
employees’ use of AWAs. Thus, MW employees who are able to make job-related
decisions and work independently should have greater access to the three options than
colleagues with less autonomy.
Cost-benefit ratio. The third guideline encourages managers to evaluate the ratio
of the costs of the alternative work arrangements (i.e., the need for extra supervisory
The measures of each o f the criteria are relevant to other criteria, as well. For example, job complexity, a measure used for job suitability, is also related to the cost-benefit ratio and the retention o f skilled workers—guideline three.
49
effort) relative to their benefits (i.e., productivity) when determining the options’
availability. Therefore, I examine two aspects of the cost-benefit ratio: evaluation factors
related to supervisory effort, and proxies for productivity.
Prior research has found that managers often mistrust subordinates’ work ethic and
resist AWAs because o f concerns about productivity (Rapoport and Bailyn 1996:18;
Bailyn 1993:144; Kingston 1990:446). As one MW worker said, “I’ve heard of the
options, but [in] my area it’s not accepted because it takes away from productivity”
Echoing the managers in Hochschild (1997:32), MW managers in interviews and survey
comments attested to the extra time and effort required for supervision of workers using
the options, describing it as a “nightmare” to track schedules and to monitor subordinates’
performance.** An Operations manager acknowledged, “The challenge of the flexible work
schedules is the extra time it takes a manager to track productivity, schedule work, assign
ad hoc assignments, etc. We already work overtime just to maintain our own workload,
but add the options and you have more effort and more pressure.”
* Managers also expressed fioistration with the long hours they were expected to work and their inability to formally use the flexible scheduling options. An Operations manager lamented that
“[upper] management is much less sympathetic with the personal difficulties experienced by line management. We often work 60 to 70 hours of overtime a month without comp time or any other type of compensations. Burnout is common among us. Job satisfaction would be higher if some consideration were given to [managers’ use o f flexible schedules].”
A similar refi^ain came fi’om an Actuarial manager: “Actuarial has no formal policy about the flexible schedules except for flextime. We are overworked and under-appreciated ”A Systems manager with 22 subordinates who is a single mother o f two reported that her “manager is hesitant to allow me the option of a flexible schedule because o f my position. However, [a flexible schedule] would allow me to lower my stress and be more productive.”
50
Factors that ameliorate or exacerbate managers’ concerns about the extra effort
needed to ensure productivity and maintain quality should influence managers’ willingness
to make the options available. Consequently, I expect that two evaluation factors—the
ease with which supervisors can evaluate the quality of subordinates’ work and, more
subjectively, the degree supervisors trust their subordinates— should be positively related
to workers’ access to AWAs. In addition, managers whose subordinates’ jobs are secure
should be more willing to exert the extra supervisory effort the options require than
managers whose subordinates’ jobs are at risk. Thus, I expect that perceived job security
will also be positively related to workers’ access to the options.
In contrast, another subjective evaluation measure should decrease workers’
access to AWAs because the less workers are trusted, the less privacy and flexibility they
get (Nippert-Eng 1996:162; Coser 1974:71). Thus, employees’ access to the options
should be adversely affected if “facetime” is important in respondents’ workgroups.^ In
that case, productivity and job commitment are evaluated on the basis of workers’ visible
presence, not solely on performance (Bailyn 1993:45,110). Explaining the relationship
between supervisory effort and facetime, a senior MW officer admitted, “[W]e still have
managers who think if they can’t see the people, then how could they possibly manage the
people. Once again, [we should be] looking at that whole idea of needing to be concerned
with results, as opposed to...how you get them.” In sum, managers’ use of both
Although workers’ perception of the importance of facetime may also be the result of employees’ lack of access to and use of AWAs, informants said that they considered the role facetime played in their evaluations when deciding whether to request access and to use available AWAs. Thus, I include facetime as an explanatory variable.
51
subjective and objective evaluation techniques should be important to their decisions
regarding subordinates’ access to AWAs.
On the assumption that skilled and experienced workers are more productive than
other workers, employers have traditionally provided benefits to attract and retain
employees with job-specific skills and experience, and thereby also reduce turnover costs
(Reskin and Padavic 1994:40; Galinsky et al. 1991:82). Indeed, the primary reason firms
adopt work-home programs is to improve the recruitment and retention of valued
employees (Witkowsky 1999:226; Galinsky et al. 1991:84; Galinsky and Stein 1990:373).
A senior MW officer agreed, noting that MW is “a growing service industry in an area
with a 2.5 percent unemployment rate. We need to offer incentives for productivity.
Flexible work arrangements are a low-cost answer.” Consequently, seniority and
education, traditionally proxies for workers’ expertise and productivity, should be
positively associated with employees’ access to the options.**
Summarizing the implicit intent of MW’s managerial guidelines, a Systems
manager captured many informants’ perspectives: decisions about subordinates’ access to
the options “comes down to knowing the individual...and [having] a good idea of what is
going to be accomplished.”
Seniority should also increase workers’ access to the options because workers who want to use the options can transfer over time to departments where the AWAs are available. A staff member in Human Resources summed it up: “People want to work in areas where management allows [flexible work schedules]. Eventually when non-supportive managers realize they’re losing workers to supportive managers, [the inconsistency between workgroups] may change.” Thus, some of the difference in access is attributable to workers’ desire, captured in the hypothesized effect of seniority on access.
52
Other Important Factors
In addition to MW’s formal criteria for implementation, contextual factors and
workers’ needs may influence managers’ decisions to make the options available. I
investigate the influence of two factors related to work context: division and employees’
knowledge of the work-home policy. I also assess the effects of employees’ need, as
indicated by their personal, familial, and household characteristics, on access to the
options.
The influence of contextual factors. Contextual factors are an important influence
on employees’ access to AWAs (Hochschild 1997:96; Schwartz 1994:36-8; Rodgers
1992:191). For example, employees’ access to work-home options within a company
varies by business unit (Hammonds et al. 1997:98; Galinsky et al. 1991: 84-6). As
discussed in Chapter 2, the three MW divisions I investigate differ in size, sex
composition, function, the means o f production, measures of productivity, and rules of
operation. Operations is a customer-service shop with daily production goals. The
Systems division is technologically and project based, it is highly competitive, and its
workgroup values innovation. The most conservative and stable unit is the Actuarial
division, where employees perform highly analytical work with ambiguous measures o f
productivity. The variables for division, then, capture the influence of stable
characteristics of workers’ location within the company that are not explicitly measured.
Given the pronounced differences between the three divisions, I expect that the
organizational attributes captured by the measures of division should have a net influence
on employees’ access to the options. Moreover, because workers in professional
53
occupations have traditionally been granted more access to AWAs than other workers
(Schwartz 1994:16; Galinsky et al. 1991:85; Christensen and Staines 1990:459), I expect
that Systems and Actuarial workers will have greater access to the AWAs than their
Operations counterparts.
The second contextual factor that should influence MW employees’ access to
AWAs is their awareness of the policy outlining the options. Policy awareness is a
prerequisite to employees’ requests about the options’ availability. Indeed, an Operations
manager acknowledged that “[waiting for individuals to ask about the options] has pretty
much been our policy.” Yet awareness o f the work-home policy is in large part based on
the prominence of the options within specific workgroups, as focus group participants
explained. For example, one described the typical new hire’s orientation to AWAs:
“When you are hired into a department, the manager—if they have the policy—will go
over it with you. You get information about the policy, but it's not really talked about
(emphasis added).” Confirming the importance of the options’ visible prominence,
another informant added, “I think a lot o f us are aware of [the AWAs] because so many
people use [them].” Workers’ knowledge of—and their subsequent requests for the
policy—often precede managers’ decisions to make the AWAs available. Therefore,
respondents’ awareness of the work-home policy should be positively linked to their
access to flexible scheduling arrangements.
In sum, employees’ division and their awareness of AWAs should influence
managers’ decisions to make the options available. Describing the effects o f the
54
contextual factors on colleagues’ access to AWAs, one nonmanagerial informant stated,
“[Access and use] depend on where you work [at MW].”
The influence of personal status and household characteristics. As noted,
MW designed its policy as a work-home rather than a work-family policy to recognize the
personal needs of employees with and without families. According to the guidelines,
managers’ assessments of workers’ personal needs and responsibilities should not affect
their implementation of the policy. Nevertheless, personal status, as well as familial and
household characteristics, shape the nature of employees’ external obligations and how
those demands are viewed by others. Indeed, employers and employees in other firms
have raised concerns about disparate treatment based on external obligations (Khan
1994:3; Bailyn 1993:145; Grossman 1993:R8). Therefore, I include measures of personal
and household characteristics in the analyses. For example, 1 include workers’ sex in the
analyses of access to AWAs. I do not predict the direction of its effect, however, because
research has suggested that women and men have equal access to most flexible work
arrangements which, by design, are gender neutral (Kelly 1999:191; Schwartz 1994:16).’
MW informants provided conflicting views of the importance o f family
composition. One nonmanager summed up the thoughts of his colleagues who believed
AWAs were “for people that have children. It seems to be more accepted if you need it
because you have a family.” In contrast, an Actuarial manager who had denied
telecommuting access to a subordinate argued, “[She] should not be staying at home
’ In the 1980s men had greater access to flextime than women (Christensen and Staines 1990:459), but women presumably had greater access to telecommuting which was designed to accommodate the personal and family needs of individual employees and
55
telecommunicating and taking care of children or elderly people. [She’ll] always be
deciding which is more important, the work or [her] family.” Nonmanagers discussing the
relationship between work and home in focus groups summed up the opposing
viewpoints, with one suggesting that “There’s [managerial] bias against those with
families.” Another countered, “There’s also bias against those without families.” I
investigate the influence o f marital status, children, and elder-care responsibilities on
employees’ access to the scheduling options.^ However, I make no predictions about their
influence on MW workers’ access to the AW As given the informants’ conflicting
viewpoints and the conflicting evidence.
Control variables. I control for employees’ weekly hours of work at MW, race,
age, and their household income. Weekly hours of work controls for differences in hours
spent at the worksite and the aflfect it may have on access. In terms of race, non
minorities report greater access than minorities to flexible work arrangements except
flextime (Schwartz 1994; 16). However, whites comprise 90 percent of the sample. Blacks
about 6 percent, Asians about three percent, and Hispanics and other races equal less than
two percent of the sample. Thus, the categories of nonwhites included in the sample are
likely to be too small to detect differences by race, should they exist. Age controls for life
primarily used by workers for data entry and programming (Hill et al. 1996:293). I found no information about sex as a determinant of access to CWW.
* Family composition and care-giving responsibilities were not strongly correlated with workers’ access to any option. The highest correlation between the family and care-giving measures (marital status, children under age S, children ages 6 to 12, children ages 13 to 18, and eldercare responsibilities) and access was between respondents’ access to CWW and the number of cMldren ages 13 to 18 (r=-. 118).
56
cycle dififerences (Friedman 1991 ;22; Spiierman and Schrank 1991:56)/ I include
household income in the analyses to control for differences in employees’ ability to
purchase services (e.g., care-giving and household repairs) that reduce employees’ need
for flexibility, and hence their requests.
Sample, Measures, and Method of Analysis
I used data collected in my employee surveys for the analyses. I based the format
of the surveys, in part, on the 1992 National Study of the Changing Workforce (Families
and Work Institute). I measured the variables with standard items where they were
available, as Table 3.1 shows.
[Table 3.1 about here ]
I modified the wording of approximately half of the items for three primary reasons: to
make the questions specific to MW, to make the questions consistent with MW
terminology, and to make response categories consistent across related questions
Measures
1 measured employees’ access to the alternative work arrangements with questions
that asked whether flextime, compressed work week schedules, and telecommuting were
available to the respondent to use. Respondents indicated whether they had access to the
option (coded 1), did not have access to the option (coded 2), or did not know if they had
access (coded 3).
“When you compare the men and women in the company, you are inevitably comparing a population o f older men and younger women. If you do not control for age, you may think you are looking at a gender effect when what you really have is an interference o f age and lifestyle differences” (Rodgers quoted in Friedman 1991:22).
57
I evaluated the influence of MW’s first managerial guideline, the suitability of
workers’ jobs to AW As, by investigating the influence of job interdependency and job
demands. I measured job interdependency with two indicators. Supervisory responsibility
measured the number of subordinates the respondent directly oversaw. Second,
respondents indicated the extent their jobs required them to deal with a variety of people,
from strongly disagree (coded 1) to strongly agree (coded 5).
I also measured the demands of workers’ jobs with two indicators. I gauged
respondents’ perception of job complexity using a factor of three Likert-like job
characteristics that are significantly correlated (p<01): (“My job is highly complex,” “My
job requires a high level of skill,” and “My job is not repetitious.”). The measure had a
Cronbach’s alpha o f .72. A high score corresponded to high job complexity. Another
characteristic indicative of a demanding job is the speed necessary to complete it.
Respondents indicated that their jobs required speed using a five point scale, from strongly
disagree (coded 1) to strongly agree (coded 5).
I used three measures for the managerial guideline focusing on employee
suitability, that is, the ability to work independently. First, I gauged organizational status
by salary grade, a measure with 9 categories (1 being the lowest grade). I
The income boundaries of the salary grades overlap, which, according to informants, is why it is used by MW workers as a status measure. Salary grade; 1 through 9 (the category boundaries were not listed in the survey):1. $ 13,500 - 27,0002. $ 16,000 - 33,0003. $ 19,000 - 42,0004. $ 24,000 - 53,0005. $ 28,000 - 63,0006. $36,000- 78,0007. $ 44,000 - 96,000
58
operationalized workers’ autonomy with two indicators; “I participate in making decisions
that affect my work” and “I can work independently ” I coded strong disagreement I; I
coded strong agreement 5.
I investigated the influence of two aspects of the cost-benefit ratio, the third
guideline: evaluation factors related to supervisory effort and proxies for productivity. I
evaluated the effects of four facets of the evaluation process. I measured the ease of
evaluating the quality of respondent’s work with a categorical variable (“It is easy for my
immediate supervisor to evaluate the quality of work that I do”). The second measure
asked respondents whether their supervisors trusted them. Responses for both questions
ranged from 1 to 5, with strongly disagree coded 1 and strongly agree coded 5. Third, my
measure o f job security was an item that asked how likely it was that respondents would
lose their jobs at MW in the next 6 months, with responses scaled from very likely (coded
I) to not at all likely (coded 4). Fourth, my binary measure of facetime asked if
respondents believed that the amount of time they spent at the office, whether they are
actually working or not, affected their supervisors’ evaluations of their work. I coded
negative responses 0 and positive responses 1.
I used two variables to assess the influence of proxies for productivity. To
measure seniority, I used an item that asked how long respondents had worked for MW. I
used a seven-category ordinal variable to measure education. Having less than a high
school education was coded 1, having a Ph.D. was coded 7.
8. $59,000-127,0009. $ 72,000 -146,000
59
Contextual factors. I used two indicators of the context in which employees
worked. I measured division with dummy variables for the Systems and Actuarial
divisions, with Operations as the reference category. I measured policy awareness with a
binary variable that asked respondents if they knew about the flexible scheduling options
outlined in MW’s work-home policy: flextime, CWW, telecommuting, and job sharing. “
Negative responses were coded 0; positive responses were coded 1.
Personal and household characteristics. I used flve indicators of personal and
household characteristics. 1 measured sex as a binary variable with male coded 0, female
coded 1. I had four measures of respondents’ familial composition and care-giving
responsibilities. I distinguished between respondents who were not currently married or
living with partners (coded 0) and those who had spouses or partners (coded 1). I used
three items to measure the number of children living in respondents households: the
number of children age 5 or younger, number of children between 6 and 12, and number
of children between 13 and 18. Responses for each were coded from 0 to 3 or more. To
measure care-giving to elderly and disabled family and friends, I used a binary variable
with no coded 0 and yes coded 1.
Controls. I had four control variables. I measured hours worked per week with
an item that asked how many hours a week respondents usually worked at their MW job.
I aggregated nonwhites into one category and measured race with a binary variable with
white coded 0, non white coded 1. I measured age with a linear transformation o f the year
" As noted, I did not analyze the fourth option offered in the work-home policy, job sharing.
6 0
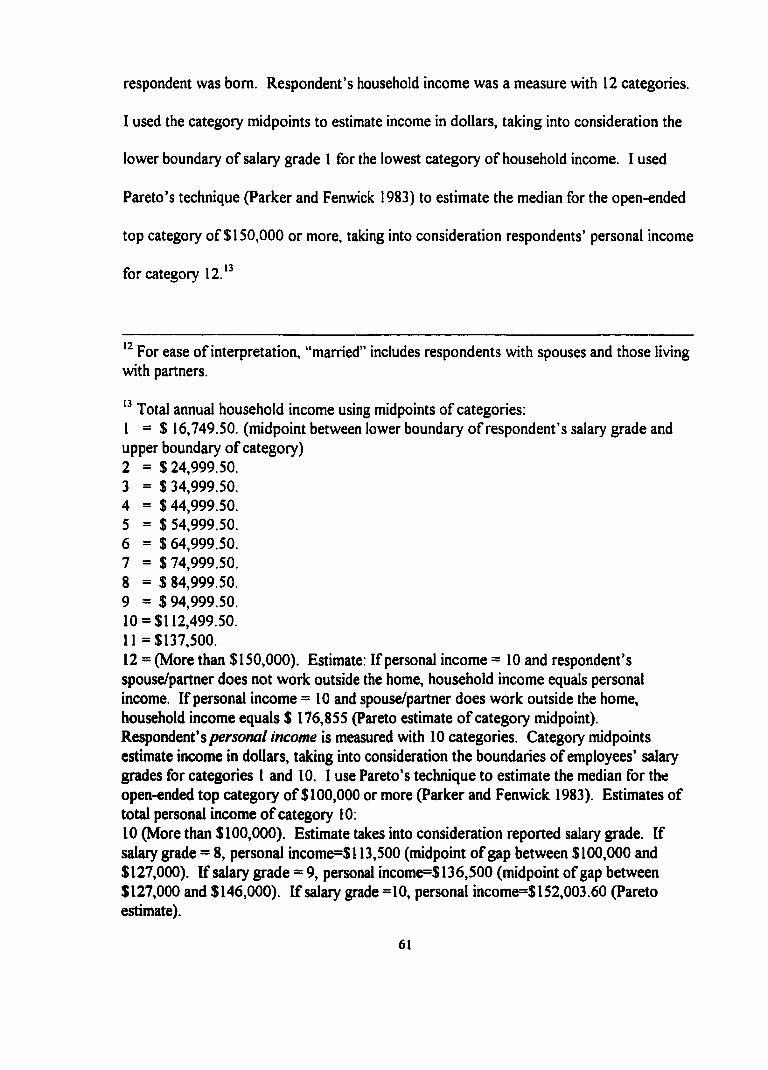
respondent was bom. Respondent’s household income was a measure with 12 categories.
I used the category midpoints to estimate income in dollars, taking into consideration the
lower boundary of salary grade 1 for the lowest category of household income. I used
Pareto’s technique (Parker and Fenwick 1983) to estimate the median for the open-ended
top category of $150,000 or more, taking into consideration respondents’ personal income
for category 12.*
For ease o f interpretation, "married” includes respondents with spouses and those living with partners.
Total annual household income using midpoints of categories:1 = $ 16,749.50. (midpoint between lower boundary of respondent’s salary grade andupper boundary of category)2 = $ 24,999.50.3 = $ 34,999.50.4 = $ 44,999.50.5 = $ 54,999.50.6 = S 64,999.50.7 = $ 74,999.50.8 = $ 84,999.50.9 = $ 94,999.50.10 = $112,499.50.11 =$137,500.12 = (More than $150,000). Estimate: If personal income = 10 and respondent’s spouse/partner does not work outside the home, household income equals personal income. If personal income = 10 and spouse/partner does work outside the home, household income equals $ 176,855 (Pareto estimate o f category midpoint).Respondent’s persona/ income is measured with 10 categories. Category midpoints estimate income in dollars, taking into consideration the boundaries of employees’ salary grades for categories 1 and 10. I use Pareto’s technique to estimate the median for the open-ended top category o f $100,000 or more (Parker and Fenwick 1983). Estimates of total personal income o f category 10:10 (More than $100,000). Estimate takes into consideration reported salary grade. If salary grade = 8, personal income=$ 113,500 (midpoint of gap between $100,000 and $127,000). If salary grade = 9, personal income=$136,500 (midpoint of gap between $127,000 and $146,000). If salary grade =10, personal income=$ 152,003.60 (Pareto estimate).
61
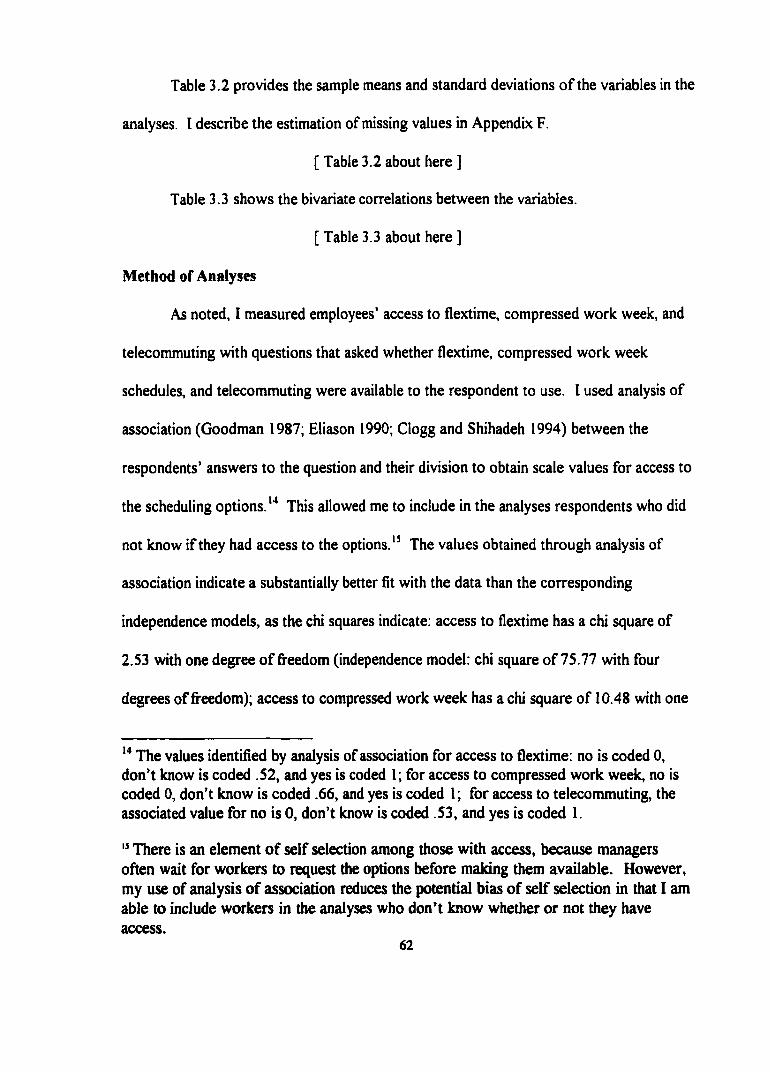
Table 3.2 provides the sample means and standard deviations o f the variables in the
analyses. I describe the estimation of missing values in Appendix F.
[ Table 3.2 about here ]
Table 3.3 shows the bivariate correlations between the variables.
[ Table 3.3 about here ]
Method of Analyses
As noted, I measured employees’ access to flextime, compressed work week, and
telecommuting with questions that asked whether flextime, compressed work week
schedules, and telecommuting were available to the respondent to use. I used analysis of
association (Goodman 1987; Eliason 1990; Clogg and Shihadeh 1994) between the
respondents’ answers to the question and their division to obtain scale values for access to
the scheduling options.'■* This allowed me to include in the analyses respondents who did
not know if they had access to the opt ions .The values obtained through analysis of
association indicate a substantially better fit with the data than the corresponding
independence models, as the chi squares indicate; access to flextime has a chi square of
2.53 with one degree o f freedom (independence model: chi square of 75 .77 with four
degrees of fi'eedom); access to compressed work week has a chi square of 10.48 with one
The values identified by analysis of association for access to flextime: no is coded 0, don’t know is coded .52, and yes is coded 1; for access to compressed work week, no is coded 0, don’t know is coded .66, and yes is coded 1; for access to telecommuting, the associated value for no is 0, don’t know is coded .53, and yes is coded I.
There is an element o f self selection among those with access, because managers often wait for workers to request the options before making them available. However, my use of analysis of association reduces the potential bias of self selection in that I am able to include workers in the analyses who don’t know whether or not they have access.
6 2
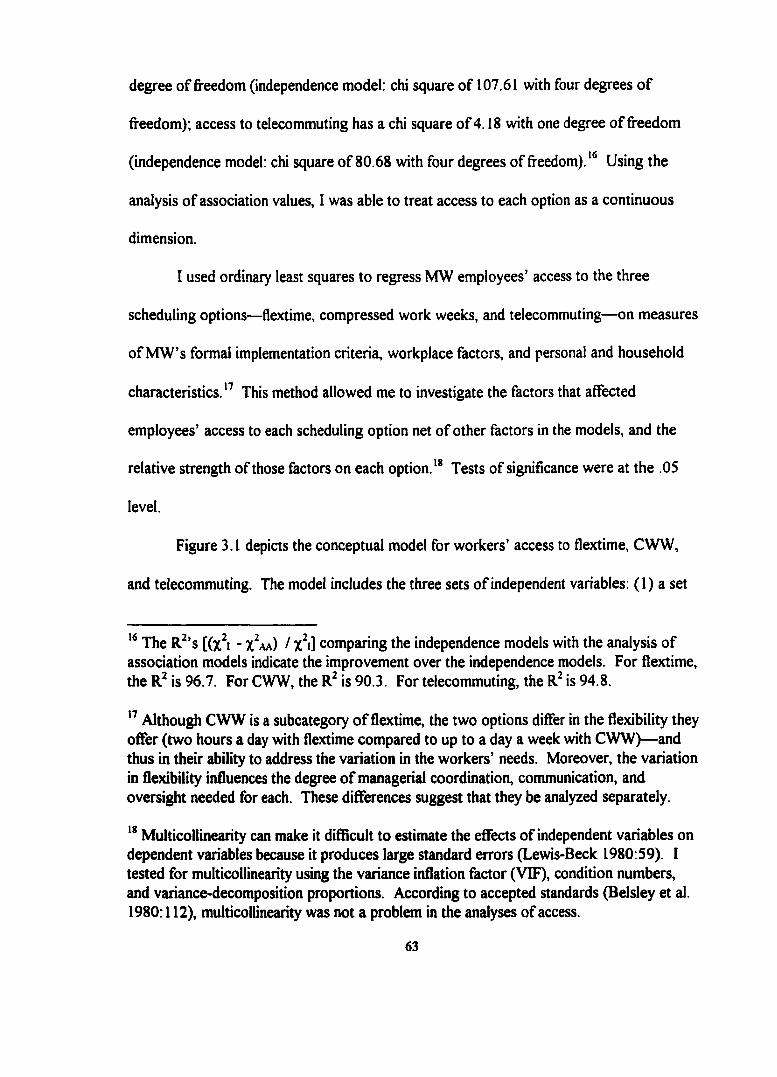
degree of freedom (independence model; chi square of 107.61 with four degrees o f
freedom); access to telecommuting has a chi square o f 4.18 with one degree of freedom
(independence model: chi square of 80.68 with four degrees of f reedom).Using the
analysis of association values, I was able to treat access to each option as a continuous
dimension.
I used ordinary least squares to regress MW employees’ access to the three
scheduling options—flextime, compressed work weeks, and telecommuting—on measures
of MW’s formal implementation criteria, workplace factors, and personal and household
characteristics.*’ This method allowed me to investigate the factors that affected
employees’ access to each scheduling option net of other factors in the models, and the
relative strength of those factors on each option.'* Tests of significance were at the .05
level.
Figure 3.1 depicts the conceptual model for workers’ access to flextime, CWW,
and telecommuting. The model includes the three sets o f independent variables: (I) a set
The R^’s [(x^ - X aa) / X^l comparing the independence models with the analysis of association models indicate the improvement over the independence models. For flextime, the is 96.7. For CWW, the R is 90.3. For telecommuting, the R is 94.8.
Although CWW is a subcategory o f flextime, the two options differ in the flexibility they offer (two hours a day with flextime compared to up to a day a week with CWW)— and thus in their ability to address the variation in the workers’ needs. Moreover, the variation in flexibility influences the degree o f managerial coordination, communication, and oversight needed for each. These differences suggest that they be analyzed separately.
'* MulticoUinearity can make it diflflcult to estimate the effects of independent variables on dependent variables because it produces large standard errors (Lewis-Beck 1980:59). I tested for multicollinearity using the variance inflation factor (VIF), condition numbers, and variance-decomposition proportions. According to accepted standards (Belsley et al. 1980:112), multicollinearity was not a problem in the analyses of access.
63
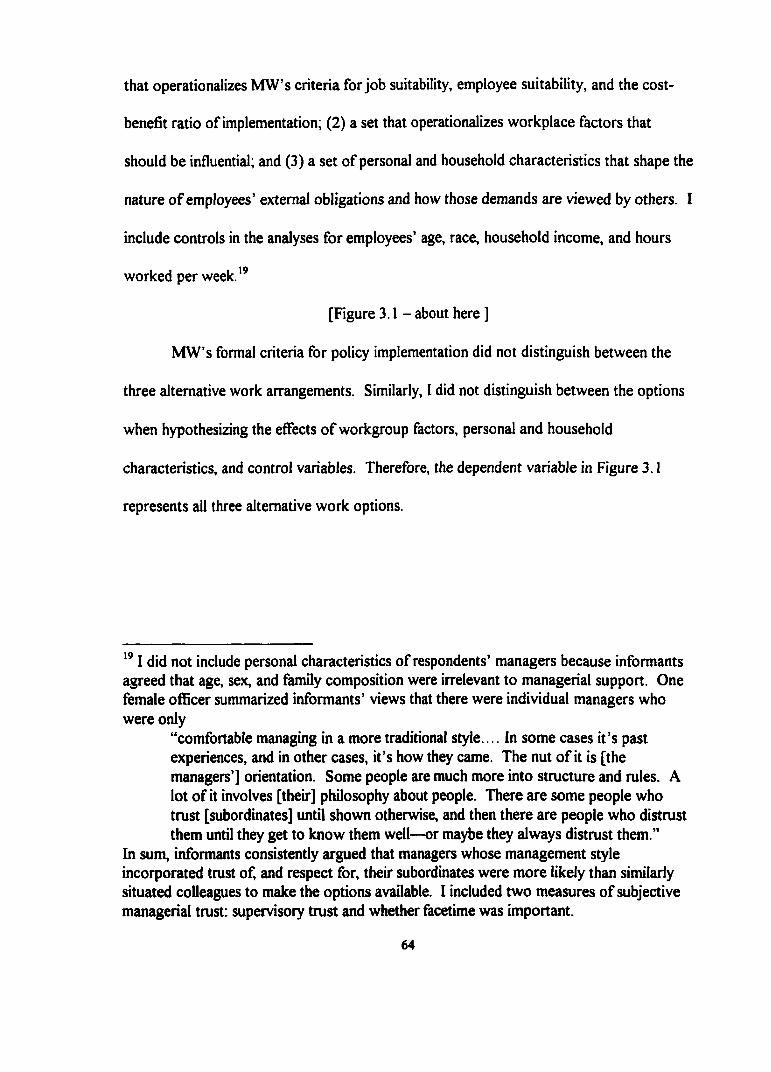
that operationalizes MW’s criteria for job suitability, employee suitability, and the cost-
benefit ratio of implementation; (2) a set that operationalizes workplace factors that
should be influential; and (3) a set of personal and household characteristics that shape the
nature o f employees’ external obligations and how those demands are viewed by others. I
include controls in the analyses for employees’ age, race, household income, and hours
worked per week.‘®
[Figure 3 . 1 - about here ]
MW’s formal criteria for policy implementation did not distinguish between the
three alternative work arrangements. Similarly, I did not distinguish between the options
when hypothesizing the effects o f workgroup factors, personal and household
characteristics, and control variables. Therefore, the dependent variable in Figure 3.1
represents all three alternative work options.
I did not include personal characteristics of respondents’ managers because informants agreed that age, sex, and family composition were irrelevant to managerial support. One female officer summarized informants’ views that there were individual managers who were only
“comfortable managing in a more traditional style. .. In some cases it’s past experiences, and in other cases, it’s how they came. The nut o f it is [the managers’] orientation. Some people are much more into structure and rules. A lot of it involves [their] philosophy about people. There are some people who trust [subordinates] until shown otherwise, and then there are people who distrust them until they get to know them well—or maybe they always distrust them.”
In sum, informants consistently argued that managers whose management style incorporated trust of, and respect for, their subordinates were more likely than similarly situated colleagues to make the options available. I included two measures of subjective managerial trust: supervisory trust and whether facetime was important.
6 4
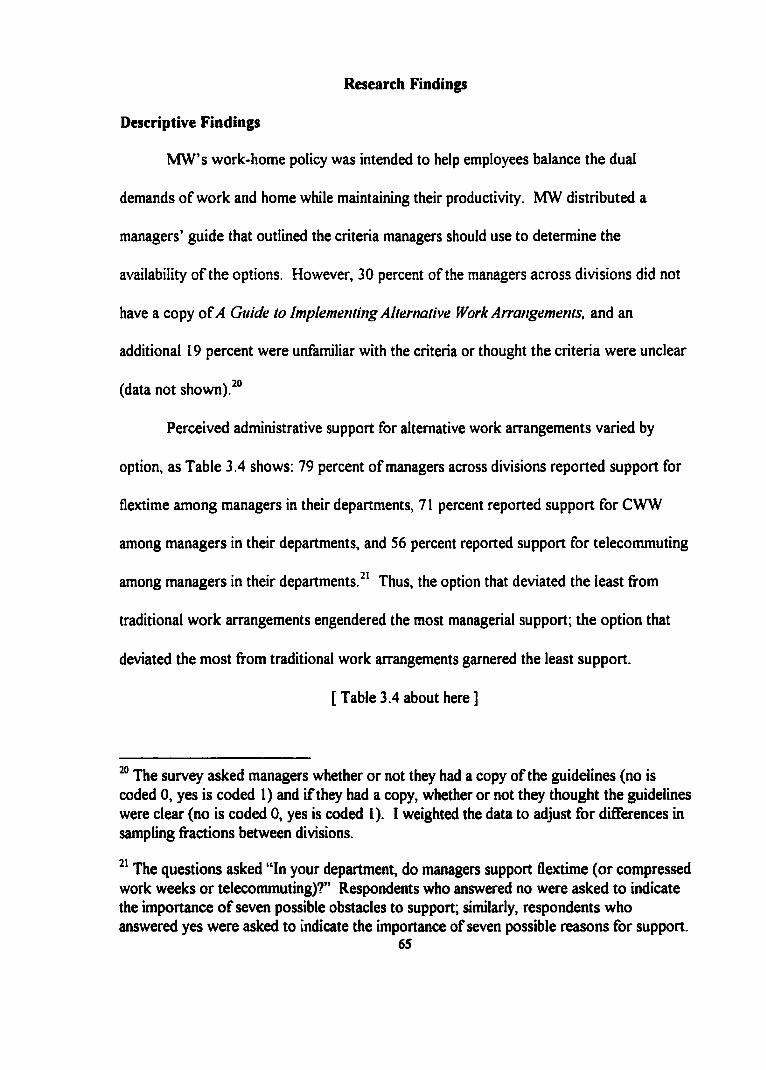
Research Findings
Descriptive Findings
MW’s work-home policy was intended to help employees balance the dual
demands of work and home while maintaining their productivity. MW distributed a
managers’ guide that outlined the criteria managers should use to determine the
availability of the options. However, 30 percent of the managers across divisions did not
have a copy o f-4 Guide to Implementing Alternative Work Arrangements, and an
additional 19 percent were unfamiliar with the criteria or thought the criteria were unclear
(data not shown).^“
Perceived administrative support for alternative work arrangements varied by
option, as Table 3.4 shows: 79 percent of managers across divisions reported support for
flextime among managers in their departments, 71 percent reported support for CWW
among managers in their departments, and 56 percent reported support for telecommuting
among managers in their departments.^' Thus, the option that deviated the least from
traditional work arrangements engendered the most managerial support; the option that
deviated the most from traditional work arrangements garnered the least support.
[ Table 3.4 about here ]
The survey asked managers whether or not they had a copy of the guidelines (no is coded 0, yes is coded I) and if they had a copy, whether or not they thought the guidelines were clear (no is coded 0, yes is coded 1). I weighted the data to adjust for differences in sampling fractions between divisions.
The questions asked “In your department, do managers support flextime (or compressed work weeks or telecommuting)?’’ Respondents who answered no were asked to indicate the importance o f seven possible obstacles to support; similarly, respondents who answered yes were asked to indicate the importance of seven possible reasons for support.
65
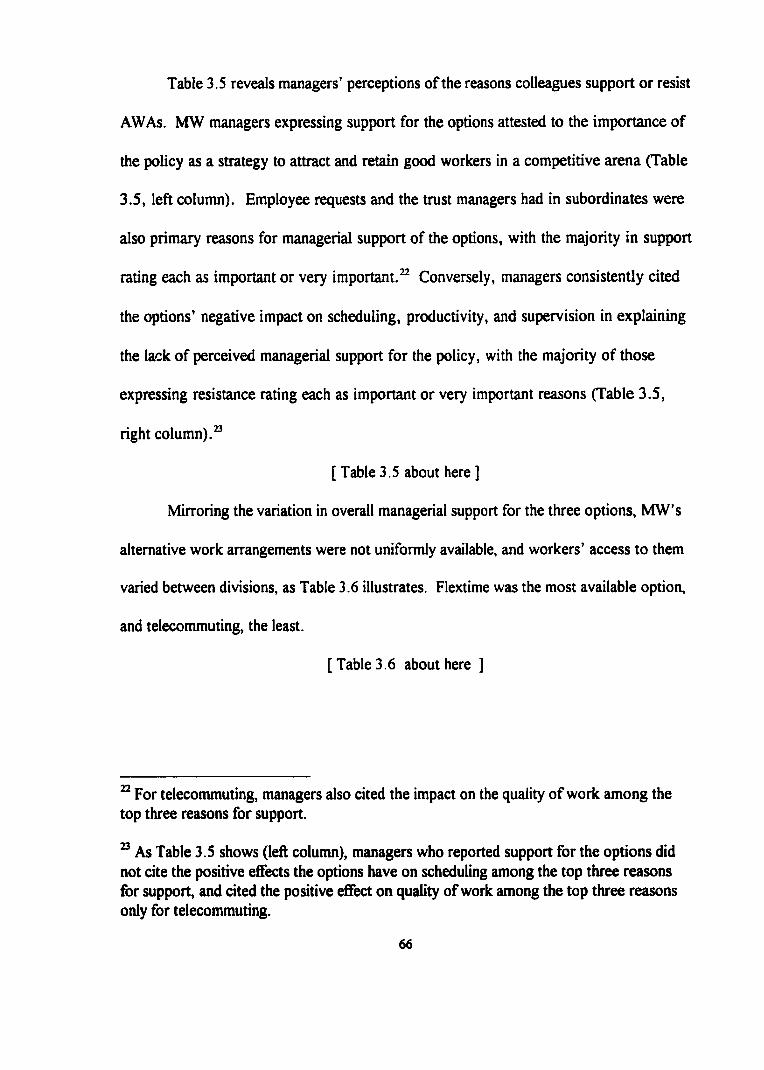
Table 3.5 reveals managers' perceptions of the reasons colleagues support or resist
AW As. MW managers expressing support for the options attested to the importance of
the policy as a strategy to attract and retain good workers in a competitive arena (Table
3.5, left column). Employee requests and the trust managers had in subordinates were
also primary reasons for managerial support of the options, with the majority in support
rating each as important or very important.^ Conversely, managers consistently cited
the options’ negative impact on scheduling, productivity, and supervision in explaining
the lack of perceived managerial support for the policy, with the majority of those
expressing resistance rating each as important or very important reasons (Table 3.5,
right column).^
[ Table 3.5 about here ]
Mirroring the variation in overall managerial support for the three options, MW’s
alternative work arrangements were not uniformly available, and workers’ access to them
varied between divisions, as Table 3.6 illustrates. Flextime was the most available option,
and telecommuting, the least.
[Table 3.6 about here ]
^ For telecommuting, managers also cited the impact on the quality of work among the top three reasons for support.
^ As Table 3.5 shows (left column), managers who reported support for the options did not cite the positive effects the options have on scheduling among the top three reasons for support, and cited the positive effect on quality of work among the top three reasons only for telecommuting.
6 6
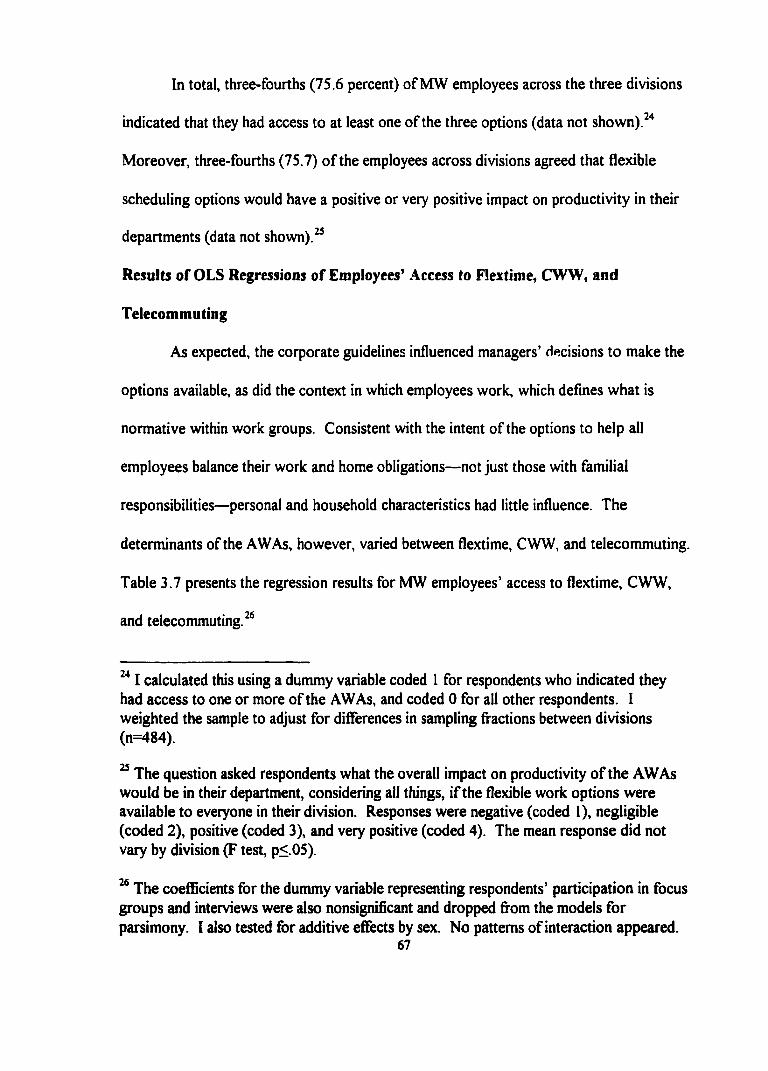
In total, three-fourths (75.6 percent) of MW employees across the three divisions
indicated that they had access to at least one of the three options (data not shown).^‘‘
Moreover, three-fourths (75.7) of the employees across divisions agreed that flexible
scheduling options would have a positive or very positive impact on productivity in their
departments (data not shown).^
Results of OLS Regressions of Employees’ Access to Flextime, CWW, and
Telecommuting
As expected, the corporate guidelines influenced managers’ decisions to make the
options available, as did the context in which employees work, which defines what is
normative within work groups. Consistent with the intent of the options to help all
employees balance their work and home obligations—not just those with familial
responsibilities—personal and household characteristics had little influence. The
determinants of the AWAs, however, varied between flextime, CWW, and telecommuting.
Table 3.7 presents the regression results for MW employees’ access to flextime, CWW,
and telecommuting. “
I calculated this using a dummy variable coded I for respondents who indicated they had access to one or more of the AWAs, and coded 0 for all other respondents. I weighted the sample to adjust for differences in sampling fl-actions between divisions (n=484).
“ The question asked respondents what the overall impact on productivity of the AWAs would be in their department, considering ail things, if the flexible work options were available to everyone in their division. Responses were negative (coded I), negligible (coded 2), positive (coded 3), and very positive (coded 4). The mean response did not vary by division (F test, p<.05).
The coefficients for the dummy variable representing respondents’ participation in focus groups and interviews were also nonsignificant and dropped fi'om the models for parsimony. I also tested for additive effects by sex. No patterns of interaction appeared.
67
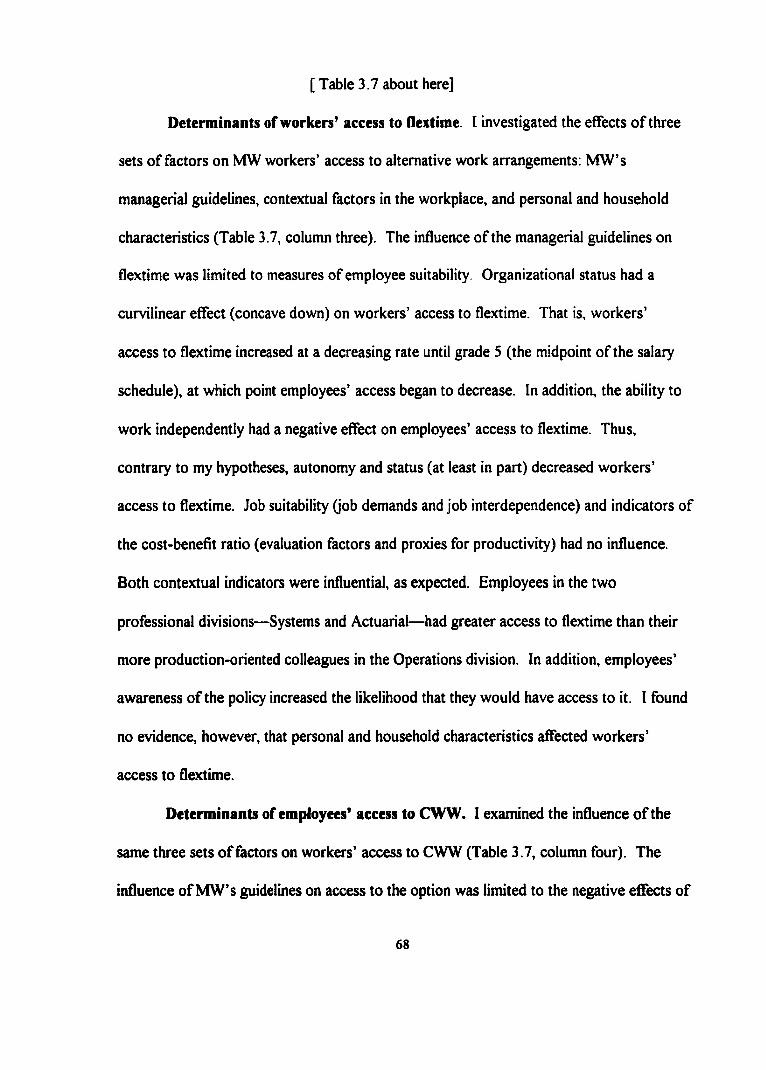
[ Table 3.7 about here]
Determinants of workers’ access to flextime. I investigated the effects o f three
sets of factors on MW workers’ access to alternative work arrangements: MW’s
managerial guidelines, contextual factors in the workplace, and personal and household
characteristics (Table 3.7, column three). The influence of the managerial guidelines on
flextime was limited to measures of employee suitability. Organizational status had a
curvilinear effect (concave down) on workers’ access to flextime. That is, workers’
access to flextime increased at a decreasing rate until grade 5 (the midpoint of the salary
schedule), at which point employees’ access began to decrease. In addition, the ability to
work independently had a negative effect on employees’ access to flextime. Thus,
contrary to my hypotheses, autonomy and status (at least in part) decreased workers’
access to flextime. Job suitability (job demands and job interdependence) and indicators of
the cost-benefit ratio (evaluation factors and proxies for productivity) had no influence.
Both contextual indicators were influential, as expected. Employees in the two
professional divisions—Systems and Actuarial—had greater access to flextime than their
more production-oriented colleagues in the Operations division. In addition, employees’
awareness of the policy increased the likelihood that they would have access to it. I found
no evidence, however, that personal and household characteristics affected workers’
access to flextime.
Determinants of employees’ access to CWW. I examined the influence o f the
same three sets o f factors on workers’ access to CWW (Table 3.7, column four). The
influence of MW’s guidelines on access to the option was limited to the negative effects of
68
three measures o f job and employee suitability. Two indicators of demanding and
interdependent jobs reduced employees’ access to the option: the speed required to
perform one’s job and the degree of supervisory responsibility the job entailed. Contrary
to my hypothesis, employees’ ability to work independently also decreased their access to
CWW. Second, contextual factors were again influential. Systems and Actuarial
employees had greater access to CWW than their Operations colleagues, and employees’
awareness of the work-home policy increased the likelihood they would have access to the
option. Third, in terms of personal and household characteristics, workers with eldercare
responsibilities had greater access to CWW than other workers. Teenage children,
however, reduced workers’ access to the option. I found no evidence that the complexity
of workers’ jobs, the degree employees worked with diverse people, organizational status
and ability to make job decisions, evaluation factors, proxies for productivity, or workers’
sex, marital status, and having children ages 12 and under influenced access to CWW.
Determinants of workers’ access to telecommuting. Indicators of MW's
managerial guidelines, the context in which employees worked, and workers’ personal and
household characteristics all played roles in employees’ access to telecommuting (Table
3.7, column five). In terms of the guidelines, indicators of employee suitability and the
cost-benefit ratio affected employees’ access to telecommuting. That is, workers’ status
increased their access to the option, as did perceived supervisory trust. In contrast,
respondents who believed facetime was an important element of their evaluations were
less likely to telecommute than others. Second, in terms of employees’ work context,
workers’ division was influential in the expected way: Systems and Actuarial employees
69
had greater access to telecommuting than Operations employees. Third, the only personal
factor that affected workers’ access to telecommuting was their eldercare obligations.
Employees who provided eldercare were more likely than their coworkers without
eldercare responsibilities to have access to telecommuting. The analyses did not support
the hypotheses that the demands and interdependence of workers’ jobs, employees’
awareness of MW’s policy, or workers’ sex, marital status, and family composition
affected employees’ access to telecommuting, however.
Controls. I controlled for employees’ household income, their weekly hours of
work, race, and age in my analyses of the determinants of employees’ access to AWAs.
The controls did not affect the availability of flextime or telecommuting. Age—a control
for life cycle differences—was important, but only to CWW: the older workers became,
the less access they had to CWW.^’
Discussion
My research addresses three questions: (1) To what extent are managers’ decisions
to make AWAs available to their subordinates based on MW’s formal guidelines for
implementation of the work-home policy? (2) Is workers’ access to the options influenced
by the context in which they work and subordinates’ personal and household
characteristics? (3) Are the determinants of employees’ access consistent across the three
options? As my analyses show, there are differences in the availability of the different
^ I also investigated the possibility that age had a curvilinear effect on workers’ access to AWAs, but it did not (analyses not shown).
70
alternative work arrangements, as well as in the factors that affect employees’ access to
each.
The Influence of MW Formal Criteria on Implementation
I found limited evidence that managers considered MW’s criteria for the
implementation of the firm’s three alternative work arrangements when determining
subordinates’ access to the options (Table 3.7: Job Suitability, Employee Suitability, and
Cost-Benefit Ratio panels). The first guideline encourages managers to consider the
suitability of subordinates’ jobs. I hypothesized that interdependent jobs would be
negatively associated with access, reflecting employees’ need to be available to internal
and external customers. In contrast, I expected demanding jobs would be positively
associated with access because corporations have an incentive to retain skilled workers.
The influence of these job characteristics was limited to workers’ access to CWW. As
expected, supervisory responsibility reduced workers’ access, but so did jobs requiring
speed. Thus, I found little support for the hypothesis that job suitability influences
workers’ access to alternative work arrangements.
The second guideline suggests that managers consider subordinates’ ability to
work independently when making decisions about implementing AWAs. I hypothesized
that workers’ organizational status and autonomy should increase of employees’ access to
AWAs. Status’s positive influence was restricted to workers’ access to telecommuting,
however. The variable had a curvilinear effect (concave down) on flextime and no effect
on CWW. Contrary to my hypothesis, the ability to work independently decreased
workers’ access to both flextime and CWW. The ability to make job-related decisions had
71
no influence on access to any o f the options. Thus, the evidence generally contradicts the
hypothesis that managers make AWAs available to workers who can perform their jobs
without oversight.
MW’s third guideline encourages managers to evaluate the ratio of the costs of
alternative work arrangements to their benefits when considering implementation o f the
options. However, proxies for productivity—workers’ seniority and education—had no
influence on employees’ access to AWAs. Related to the costs o f supervising workers on
AWAs, subordinates’ job security and the ease with which managers were able to evaluate
the quality o f subordinates’ work had no influence, either. Two measures of subjective
evaluation—facetime and supervisors’ trust in their subordinates—had influence but only
on managers’ decisions to make telecommuting available. Thus, I found little empirical
evidence that MW managers considered the cost-benefit ratio when making flexible
scheduling options available.
In sum, a primary reason MW adopted its work-home policy was to remain
competitive by retaining skilled and experienced workers on the assumption that they have
firm-specific skills, and hence are more productive than other workers. However, job
complexity, workers’ seniority and education, their job security, and managers’ ability to
measure the quality of employees’ work did not significantly affect employees’ access to
any option. As an Operations worker without access to the options explained, “In some
areas employees are treated as though they can be easily replaced regardless o f experience,
educational background, or productivity.”
72
In contrast, supervisory trust, facetime, the ability to work independently, the
speed required in workers’ jobs affected employees’ access to AWAs, but none had a
consistent effect on all three options. That the influence of supervisory trust and facetime
is limited to workers’ access to telecommuting may be explained, in part, by the lack of
explicit and easy-to-use measures of individual productivity at MW. In those situations,
managers are likely to “intuitively measure” productivity and have “incredible trust” in
subordinates before making telecommuting available (McCullough 1999:10a). Moreover,
two of the factors that are theoretically related to increased access to the options—the
ability to work independently and job speed—had the opposite effects. Further research is
needed to explain the adverse effects of autonomy and job speed. It is possible, however,
that workers with autonomy already have built-in job flexibility—and hence do not request
access to the options, a key reason managers implement the policy (Table 3.5, left column-
support). And jobs that require speed may be too demanding for workers to continue for
10 hours at a time under a CWW schedule.
The Influence of Contextual Factors on Workers’ Access to AWAs
Confirming prior research, two contextual attributes—employees’ location within
the firm and their awareness of the policy—were important determinants o f employees’
access to alternative work arrangements (see Table 3.7, Context panel). The bivariate
pattern between division and access shown in Table 3.6 persists net o f all factors which,
according to MW’s managerial guidelines, should make a difference. In fact, employees’
division was the sole factor that had a consistent effect on flextime, CWW, and
telecommuting. As expected, workers in the Systems and Actuarial divisions—two
73
professional divisions—had greater net access to each of the alternative work
arrangements than their production-oriented counterparts in the Operations division.
The second contextual factor, awareness of the work-home policy, is an indicator
of the importance of the options in the workplace and a prerequisite to employees’
requests about the strategies’ availability. Workers’ awareness of the policy increased the
likelihood that they would have access to flextime and CWW. It did not affect employees’
access to telecommuting, however. The lack of the variable’s influence on telecommuting
is explained, in part, by the option’s technological requirements. As an Operations
manager acknowledged, “We don’t have the system set up for telecommuting. If we did, I
would [let people work from home] ” In sum, my research supports prior evidence that
contextual factors affect the availability of flexible work strategies, regardless of company
policy.
The Influence of Personal and Household Factors on W orkers’ Access to AWAs
Consistent with MW’s intent to create a work-home rather than a work-family
policy, employees’ personal and familial situation minimally affected their access to AWAs
(Table 3.7, Personal/Household Characteristics panel). Workers’ personal situations had
no influence on their access to flextime and only limited influence on workers’ access to
CWW and telecommuting. The presence of teenagers decreased employees’ access to
CWW, the option that offers the longest workday but up to a full weekday free per week.
Prior research has shown that teens are a primary distraction to their parents on and off
the job, and the consequences of unsupervised time can be more drastic for them than
other children (Graham 1995:B I). The 10-hour days of CWW limit parents’ availability to
74
their children on a day-to-day basis more than flextime or telecommuting. Therefore, one
explanation for the negative relationship is that decreased access to CWW reflects fewer
requests by parents of teenagers than other workers, the number one reason managers
support the option (Table 3.5, left column).
In contrast, care-giving responsibilities to the elderly increased employees’ access
to both CWW and telecommuting. One explanation for this finding is that the ability to
work from home and the large block of release time that CWW offers facilitate employees’
ability to meet the needs of elders, such as providing elders with transportation to doctors’
appointments that must be scheduled during traditional working hours. Thus, those with
eldercare responsibilities may request CWW and telecommuting more than their
coworkers. Moreover, research has suggested that eldercare is seen as a more valid and
less negotiable issue to workers and employers than flexibility to meet the needs of
children (Shellenbarger 1997:B1; Friedman 1987:2). Having children is perceived as an
individual decision—a matter o f choice—whose consequences therefore rest with the
individual (Kelly 1999:189; Bailyn 1993; Friedman and Johnson 1991:10; Lewis and
Taylor 1996; Hochschild 1989). No choice is involved in having parents, however, and
managers—with their own eldercare issues potentially looming—may be able to readily
empathize with those who have elderly dependents (Ettner 1995:65; Shellenbarger
I994:AI).
75
Variation in the Determinants and Availability of Alternative Work Arrangements
and Related Supervisory Issues
With the exception of the influence of divisions, the determinants o f managerial
decision-making varied by scheduling arrangement, as noted. The variation in
determinants of workers’ access to AWAs may also be explained, in part, by differences in
the options’ history within MW. For example. MW employees informally used flextime
almost two decades prior to its official implementation. As an Operations manager with
20 years experience at MW noted, “Flextime has been a part of MW ever since I can
remember... It’s become such a part of our culture that we don’t have people scheduling
8 a.m. meetings.” Employees also used CWW informally prior to the policy’s adoption in
1994, but less widely and for a shorter period of time. Telecommuting is the newest
option and hence the least familiar to managers and nonmanagers. Summing up her
workgroup’s limited support of AWAs, one MW manager declared that “my coworkers
and managers [in the department] frown on all the options except flextime. But if
managers supported [CWW and telecommuting], coworkers would, too.” That flextime is
the most familiar and most accepted by management (see Tables 3.4 and 3.6) implies that
managers should be more likely to make it available based on fewer factors.
Moreover, because the AWAs deviate from standard work hours and location in
different degrees, managers’ concerns about—and the complexities of—scheduling,
oversight, and subordinates’ productivity are likely to vary between the options. For
example, flextime workers are present daily, employees who use CWW on a weekly
schedule are present four out of five workdays a week, and full-time telecommuters—
76
though rare—may be in the office as little as one day a week. Adding to the challenge,
managers overseeing CWW schedules must plan and coordinate work for subordinates
whose schedules vary dramatically throughout the week because employees in
workgroups stagger their days off.
Not surprisingly, MW managers and nonmanagers alike noted the scheduling
issues that arose from employees’ use of flexible scheduling options and that affected
work group performance. Recognizing the interdependence of workers’ jobs, a
nonmanagerial informant commented that “sometimes [alternative work arrangements]
make it a little bit more difficult to coordinate things because you have three or four
people on one project all with different schedules, days off. Getting them all together
when you need them can be difficult.” A Systems manager particularly objected to CWW:
“It makes my team’s job more difficult. It is a matter of them being productive.... People
being off does impact the team’s ability to put forth work to do the job.” Similarly, a
nonmanager mentioned the complexities introduced by flextime. “It leads to times when
you can’t find somebody. You don’t know when they are coming in or if they are going
to be late, especially with the flextime.... It can be very stressful.” Moreover, concerns
about short-term productivity tend to overshadow potential long-term benefits of
flexibility because departmental productivity may be measured weekly, while the
organization measures its productivity quarterly and provides formal performance
evaluations for employees annually. In sum, the determinants of the options are likely to
vary, in part, because the options vary in the timing and location o f work. Consequently,
they require different degrees of managerial supervision, coordination, communication,
77
and planning—and differ in their potential to affect subordinates’ job performance, and
hence productivity.
Given managers’ own long hours and heavy workload, a Systems manager
concluded that “it takes a very generous soul to accommodate the options, in spite o f all
the good reasons for doing so.” However, MW informants warned managers against
using inconvenience as an excuse to restrict the use of alternative work arrangements that
have long-term benefits. As another manager recognized, “although [flexible work
schedules are] sometimes inconvenient for managers, the alternatives are worse.
Managers (including myself) cannot afford to be lazy. Availability of CWW, flextime, etc.,
is a must if we want to attract and retain employees.”
It is likely that the different technological requirements of the AWAs—unmeasured
in the analyses—also aflfect employees’ access to the three options. That is, flextime and
its subcategory CWW require no additional equipment and thus no additional expenditures
by MW. In contrast, MW must purchase and maintain off-site computers, modems,
printers, and phone lines for employees who telecommute full time.^* Moreover,
technological limitations still restrict the option’s availability.^ A Systems officer noted
that “we don’t have the cost-effective technology that supports a true virtual corporation
where people can be anywhere.” Thus, unlike its effect on flextime and CWW, awareness
Informants who telecommuted on an ad hoc basis typically did so using their own equipment at home and did not ask MW to reimburse them for phone bills.
^ The basic technology for telecommuting was available in the 1970s (Hill et ai.1996:293), but line speeds for MW data transmission were so slow that full-time use, such as that by computer programmers or customer service representatives, was not practical from a productivity standpoint until the early 1990s.
78
of the work-home policy may have no effect on employees’ access to telecommuting
because the option remains out of reach of many MW employees due to technological
constraints.
Idiosyncratic Managerial Support
Because job, personal, household, and workplace characteristics do not explain
much of the variation in MW workers’ access to flextime. CWW, and telecommuting,
residual factors must be at work. As noted, almost half of MW managers across the three
divisions did not have MW’s implementation guide or thought the guidelines were unclear.
Managerial discretion combined with managers’ lack of information about the criteria
encourages idiosyncratic decision making about the availability o f the options.^” Indeed,
anecdotal evidence suggests that idiosyncratic managerial support (unmeasured in my
study) influences the availability of AWAs. For example, workers within the same
department do not necessarily have equal access to flexible options. An Actuarial
manager described the inconsistency within her work group. “There are five people with
supervisory responsibility in my area of 15 employees. Two of those five do not support
flexible work schedules [except] flextime. [And] each supervisor requires different levels
o f justification for using the options.” A nonmanager also emphasized the differences in
managerial support o f AWAs within her department, explaining that “we have different
managers in our team. Some of them eat, sleep, and breathe MW, and some of them
understand and are compassionate.” Managers are not immune to the idiosyncrasy o f their
Managers who do not have a copy of the implementation guide, however, may be familiar with the gist o f the guidelines through their experience with and observation of other managers. Thus, lack of a guidebook does not, in itself, translate into managers’ ignorance of, or disregard for, the criteria.
79
supervisors, either. An Operations manager-of-managers reported that she made CWW
available to her subordinates and that her vice president supported CWW, but her direct
supervisor “said I couldn’t do it. He had a bad attitude towards all of us. He didn’t want
to give anyone anything.... He blocked it for me.” This variation in access to the
scheduling options within departments underscores the idiosyncratic nature o f managerial
support, and thus emphasizes the impact of managerial discretion.
Managers consistently stressed the importance of managers’ attitudes for the
availability of the flexible options. For example, an Actuarial manager who was able to
informally rearrange his own schedule when personal obligations intruded at work noted
that “it is up to the individual managers. Some are more strict than others.... [A]reas are
known to be a little more strict or lenient than others...depending on the personalities of
some [managers]. Some [managers] like to keep tabs on everyone, minute by minute, to
make sure they are putting in their time....” Another attributed the variation in access to
dififerences in managers’ beliefs: “I don’t know that it is every manager’s personal belief in
doing a lot of [flexible scheduling]. 1 think you have some of those people that say,
‘Sorry about your home life. Deal with that after work.’” A Systems ofiBcer conceded,
“To some, the responsibilities of management are equated to ‘I need to see and touch you.
I need to watch you to know that you are doing the right thing.. . .’ The [managers] that
are less supportive [of AWAs] are maybe less enlightened or less experienced.”
The consensus among managerial informants was that their colleagues’ dififering
views on control and AWAs were grounded in managers’ experiences. An Operations
manager argued that “it is how [managers] were raised in MW. I know that is a weird
80
term, but some o f [the managers] come from ...[work units] where you punch a time
clock.” An Actuarial manager agreed: “Supervisors [were inflexible] to them, so they feel
that it is the way that it should be.” Conversely, a managerial informant also noted that
working for managers who had supported flexibility “makes me more supportive o f the
people that work for me. It gave me a really good example.” In sum, anecdotal evidence
suggests that managerial idiosyncrasy contributes to the variation in workers’ access to
alternative work arrangements. Moreover, managers attribute that idiosyncrasy to their
colleagues’ past experiences in the workplace.
Idiosyncratic implementation by individual managers and evident between
managers has had an additional consequence. Employees voiced their unsolicited
resentment in interviews, focus groups, and survey comments about the inequitable
implementation of the options.^' Some workers sensed favoritism. A Systems employee
argued that “alternative work schedules should be available for all employees under the
same manager, not just the favored few.” Supporting that view, a Systems manager
thought that “the flexible work policy should be administered more consistently with an
eye on its benefits, rather than sporadically, depending on management’s perspective of an
individual’s personal needs or their relationship with that individual.” Thus, although I
found no empirical evidence that personal or ascribed status as measured by gender and
race affected employees’ access to and use of the scheduling options, this does not
preclude the possibility that some MW workers have greater access to them based on
The four Human Resources managers and ofiBcers I interviewed welcomed my research as a means to highlight workers’ inequitable access to AWAs. Participants in all four focus groups also raised the issue, as did 20 survey respondents and half o f the managers whom I interviewed.
81
characteristics irrelevant to job suitability, employee performance, or corporate benefit, as
informants suggest.
Conclusion
As gatekeepers of workers’ access to AWAs—and as those whose coordination,
communication, and planning provide the basis for employees’ successful use of the
options—managers are key to the implementation of MW’s work-home policy. They are
also most vulnerable if AWAs’ implementation reduces productivity. MW granted
managers discretion because the firm believed managers were best positioned to decide
whether or not the use of AWAs would negatively affect subordinates’ job performance.
In addition, granting managerial discretion is a tactic the firm may have used to increase
managerial support for the work-home policy,M anagerial discretion, MW’s failure to
ensure managers had and understood objective implementation criteria, the lack o f
managerial training about the benefits of the options, the lack of individual measures o f
productivity, and the dearth o f training about implementation and supervisory strategies
have spawned idiosyncratic managerial decision-making and inequitable access.
Moreover, managers’ decision-making processes are unlikely to change without good
reasons to do so. As long as the organization holds managers responsible for short-term
productivity and does not take into account the long-run benefits to the firm and to the
employees o f flexible schedules, managers lack incentive to implement the policy.
Organizational theory recognizes that garnering the support o f those most affected by a change is critical for successfully implementing a new policy. A senior MW ofRcer explained that if you “cram something down someone’s throat, it just may not go well.
82
Echoing recommendations from prior research (Haas and Hwang 1995:35;
Cowans 1994:6; Murphy 1993:33; Rodgers 1992:192; Galinsky et al. 1991:54; Schwartz
1994:34), a number of informants emphasized the need for managerial training focused on
the benefits of flexibility and strategies for successful implementation. As a nonmanager
argued, “There has not been education provided to managers on how to make [AWAs]
work successfully.” An Actuarial manager with a supportive boss and a flexible schedule
summed up informants’ recommendations, which focused on teaching managers a new
way of relating to their subordinates:
I really wish that some sort of training could take place of those managers to get them to understand the give-give, win-win technique that [alternative work arrangements] can provide. This is almost critical enough that it should be required.... It is not teaching them the policies and procedures. It is basically getting them to treat people like human beings—understanding that they are not supervising machines.... [N]ot like they have to keep track of the number o f hours, the widgets that get produced. If you take care of the people who are doing the jobs, the number o f widgets that get made will be there [and] the time will be used better.
In addition, the reasons cited by managers for perceived administrative support of
AWAs in their division have implications for policy implementation. Managers’ reliance
on employees’ requests and their own trust in subordinates may contribute to the
inequitable implementation of the alternative arrangements. For example, managers’ and
CO workers’ distrust or unsympathetic attitudes can reduce requests, and hence access.
Moreover, trusted employees—the people most apt to be granted access—are likely to
mirror their managers’ attitudes (Kanter 1977a;49) and avoid requesting or using the
options.
The key to anything is to establish some sense of buy-in to change.... You don’t say, ‘OK, everybody shift to the left. We re doing it differently.’ It just doesn’t work.”
83
Finally, top MW officers are proud of the company’s work-home policy and tout
the options’ ability to help employees balance their competing work and home obligations.
One managerial informant concluded that top MW management “has come to realize that
you’ve got to have happy people in order to have productive people. These [scheduling
options] are just some of the ways. Money just does not cut it now a days. It is the time
that is important.” However, MW encourages managers to view subordinates’ home
circumstances as irrelevant to their job performance by creating policy implementation
criteria that ignore the effect of employees’ non-work obligations on their paid work.
Ironically, this reinforces the ideology of the separation of the spheres. The policy, if
implemented according to MW’s guidelines, is a work policy, not a work-home policy.
And as other researchers have suggested, giving managers discretion to implement the
options marginalizes the policy and implies that AWAs may negatively affect productivity
(Rapoport and Bailyn 1996:19).
In sum, MW has fostered an environment in which idiosyncratic managerial
decision-making and the context in which employees work are key determinants of
workers’ access to the options. The resulting inequitable implementation of AWAs thus
undermines MW’s intent to use the AWAs as strategies to retain skilled and productive
workers and it engenders ill will among workers. The inequitable implementation also
limits the availability of work arrangements that may, in fact, enhance workers’ job
performance, as well as provide employees with the flexibility needed to meet their non
work responsibilities.
84
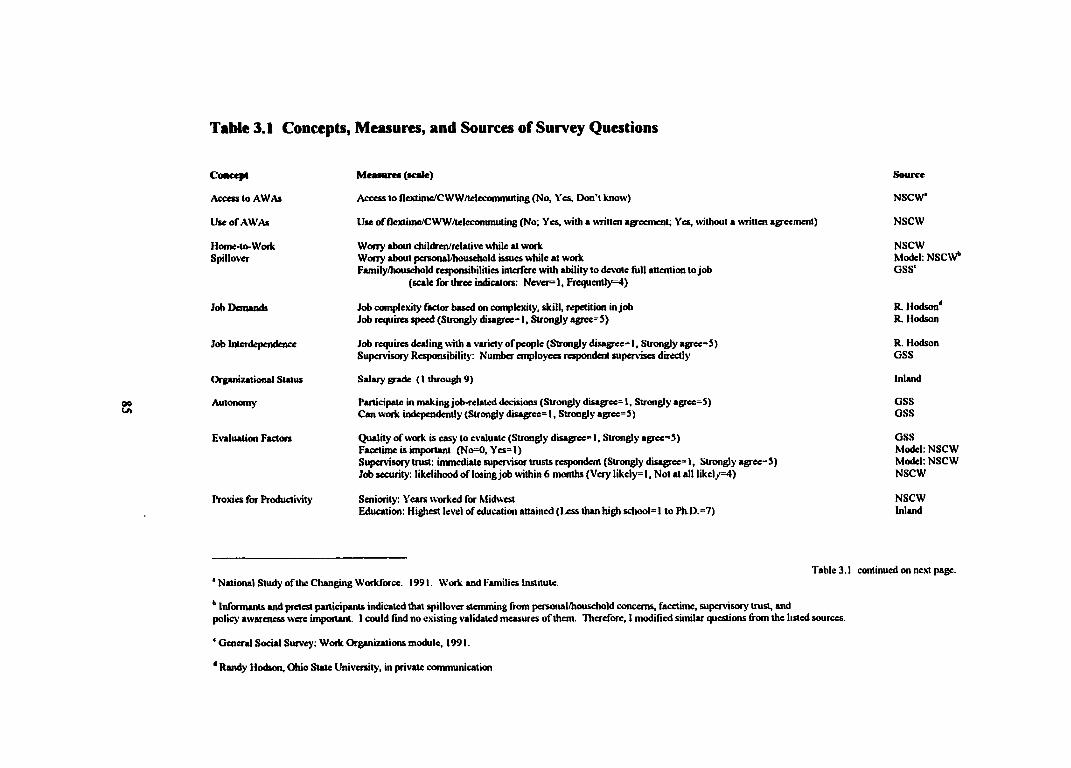
Table 3.1 Concepts, Measures, and Sources of Survey Questions
C oncep t
Access to AWAs
Use o f AWAs
Home-to-WofkSpillover
Job Demands
Job Interdependence
Organizational Status
Autonomy
Evaluation Factors
Proxies for Productivity
M easu res (scale)
Access to flextime/C WW/telecommuting (No, Yes, Don’t know)
Use o f flextime/C W W /telecommuting (No; Yes, with a written agreement; Yes, without a written agreement)
W orry about children/relative while at work W oiry about personal/household issues while at workFamily/household responsibilities interfere with ability to devote (till attention to job
(scale for three indicators: N ever= l, F re q u en tly ^ )
Job complexity factor based on complexity, skill, repetition in job Job requires speed (Strongly disagree^ I, Strongly a g re e ') )
Job requires dealing with a variety o f people (Strongly disagree» I , Strongly agree»))Supervisory Responsibility: Number employees respondent supervises directly
Salary grade ( I through 9)
Participate in m aking job-related decisions (Strongly disagree» I , Strongly agree»))Can work independently (Strongly disagree» I , Strongly agree»))
Quality o f work is easy to evaluau (Strongly disagree»!. Strongly agree»))Facetime is important (No=0, Yes» I )Supervisory trust: immediate supervisor trusts respondent (Strongly disagree»!. Strongly agree»))Job security: likelihood o f losingjob within 6 months (Very likel)-»!. N ot at all likely»4)
Seniority: Years worked for MidwestEducation: Highest level o f education attained (Less than high school» I to P h D »7)
Source
NSCW*
Nsew
NSCWModel: NSCW* OSS'
R. Hodson'*R. Hodson
R. Hodson GSS
Inland
GSSGSS
GSSModel: NSCW Model: NSCW NSCW
NSCWInland
' National Study o f the Changing Workforce. 1991. Work and Families Institute.
* Informants and pretest participants indicated that spillover stemming from personal/household concerns, facetime, supervisory trust, andpolicy awareness were important I could find no existing validated measures o f them. Therefore, I modifred similar questions from the listed sources.
' General Social Survey: W ork Organizations module, 1991.
* Randy Hodson, Ohio State University, in private communication
Table 3.1 continued on next page.
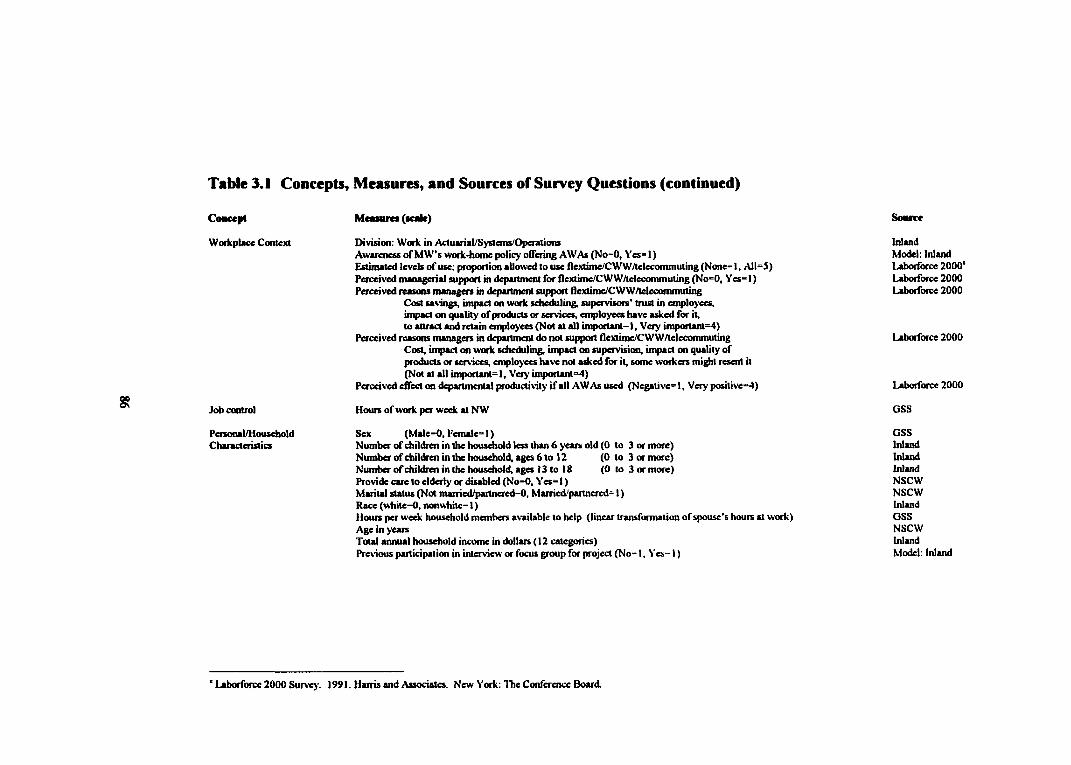
Table 3.1 Concepts, Measures, and Sources of Survey Questions (continued)
CoMCCpt
W ofkplace Context
Job control
Penonal/HouscholdC hvacieristics
Mcamrct (leak)
Division: W oik in ActuiriaVSystems/OperationsAwareness o f M W ’s work-home policy odering AW As (No=0, Yes= I )Estimated levels o f use: proportion allowed to use flextime/CW W /lelecommuting (N one-1 , All=3) Perceived managerial support in department for flextime/CW W /lcleconunuting (No=0, Yes=l ) Perceived reasons managers in department support flextime/CWWAelecommuting
Cost savings, impact on work scheduling, supervisors' trust in employees, imprwt on quality o f products or services, employees have asked for it, to rutract rutd retain employees (Not at all im portant^!. Very im portant-4)
Perceived reasons managers in department do not support flextime/CWWAelecommuting Cost, inqtact on work scheduling, impact on supervision, impact on quality of products or services, enq>lo>xes have not asked for it, some workers might resent it (Not at all im portant=l. Very important=4)
Perceived effect on departmental productivity i f all AW As used (Negative^ I , Very positive=4)
Hours o f work per week a t NW
Sex (M ale=0, Fem ale=l)Num ber o f children in the household less than 6 years old (0 to 3 or m ore)Number ofchildren in the ho u sd io ld ,ag e s6 to 12 (0 to 3 or m ore)Number o f children in the household, ages 13 to IS (0 to 3 or m ore)Provide care to elderly or disabled (No=0, Yes= I )M arital status (Not manied/paitncrcd^O, Married/partnered^ I )Race (white=0, nonwhite^ I )Hours per week household members available to help (linear transformation o f spouse's hours at work) Age in yearsTotal aimual household income in dollars ( 12 categories)Previous participation in interview or focus group for project (N o -1 , Y es-1 )
Source
InlandModel: Inland Labotforce 2000 ' Laborforce 2000 Labotforce 2000
Laborforce 2000
Laborforce 2000
OSS
GSSInlandInlandInlandNSCWNSCWInlandGSSNSCWInlandModel: Inland
* Laborforce 2000 Surve>'. 1991. Harris and Associates. New York: The ConfcrciHX Board.
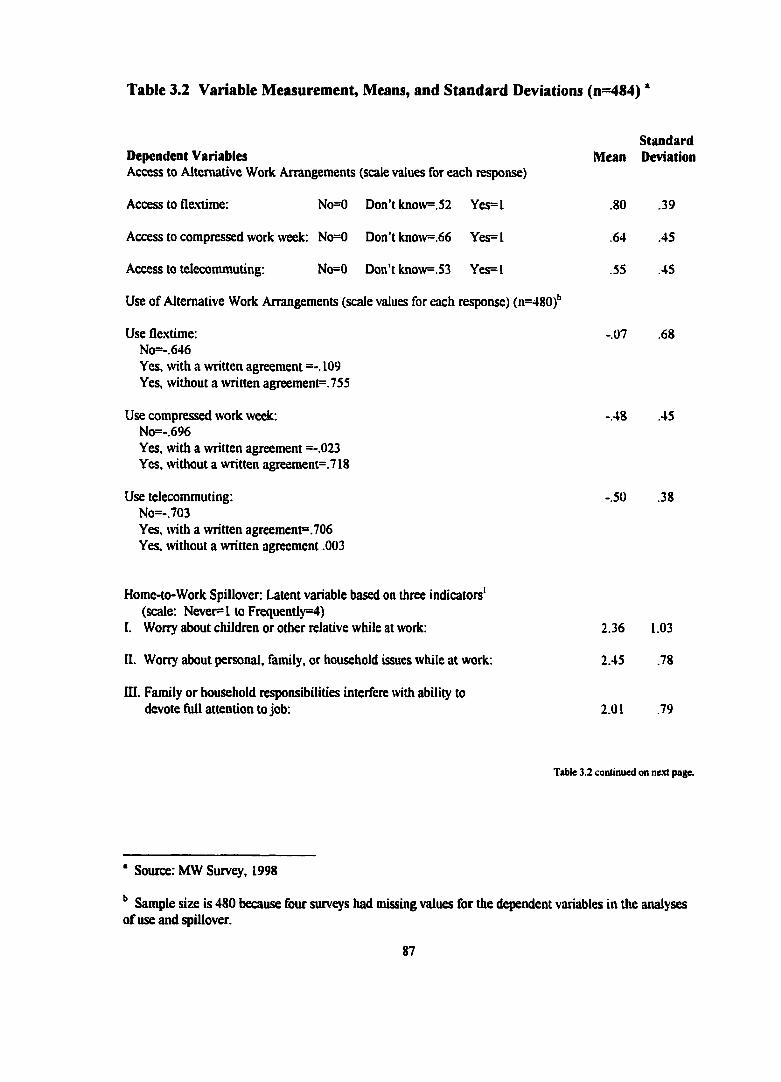
Table 3.2 Variable Measurement, Means, and Standard Deviations (n=484) *
StandardDependent VariablesAccess to Alternative Work Arrangements (scale values for each response)
Mean Deviation
Access to Qextime: No=0 Don’t know=.52 Yes=l .80 .39
Access to compressed work week: No=0 Don’t kn03v=.66 Yes=l .64 .45
Access to telecommuting: No=0 Don’t know=.53 Yes=l .55 .45
Use of Alternative Work Arrangements (scale values for each response) (n=48G)'’
Use flextime:No=-.646Yes, with a written agreement =-. 109 Yes, without a written agreement=.755
-.07 .68
Use compressed work week:No=-.696Yes, with a written agreement =-.023 Yes, without a written agreement=.718
-.48 .45
Use telecommuting:No=-.703Yes, with a written agreement=.706 Yes. without a written agreement .003
-.50 .38
Home-to-Work Spillover Latent variable based on three indicators' (scale: Never® 1 to Frequently=4)
I. Worry about children or other relative while at work: 2.36 1.03
H. Worry about personal, family, or household issues while at work: 2.45 .78
m . Family or household responsibilities interfere with ability to devote full attention to job: 2.01 .79
* Source: MW Survey, 1998
Table 3.2 continued on next page.
Sample size is 480 because four surveys had missing values for the dependent variables in the analyses of use and spillover.
87
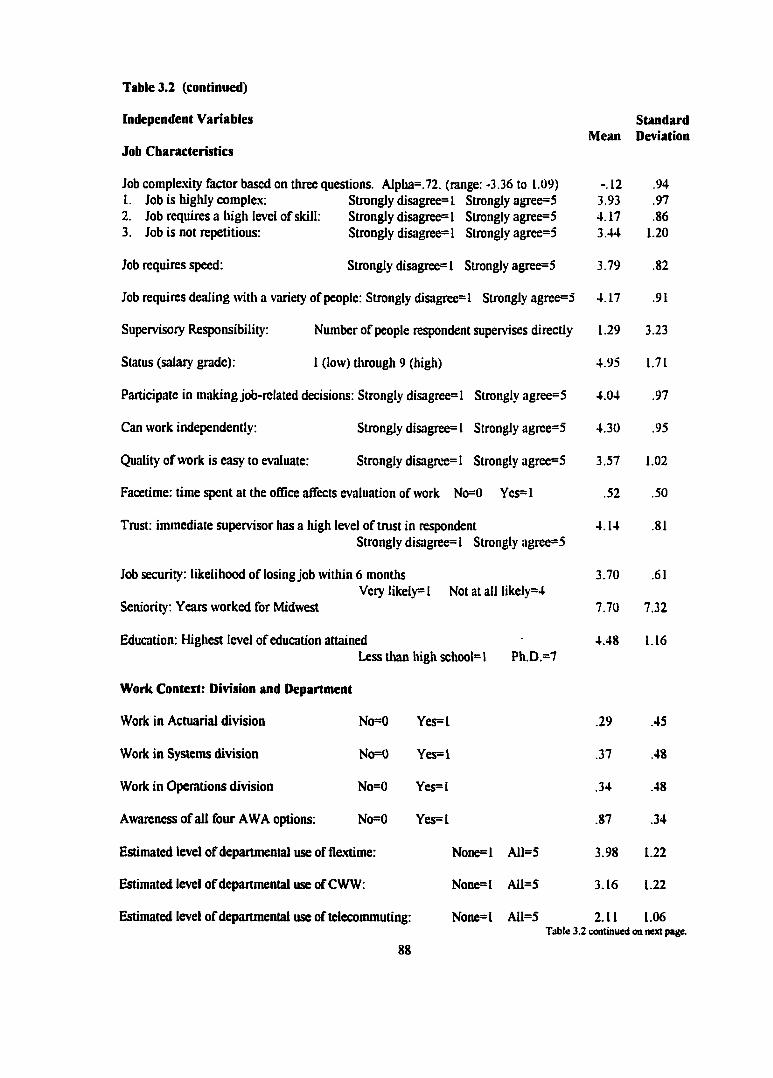
Table 3.2 (continued)
Independent Variables StandardMean Deviation
Job Characteristics
Job complexity factor based on three questions. Alplia=.72. (range; -3.36 to 1.09)1. Job is highly complex: Strongly disagree= I Strongly agree=52. Job requires a high level of skill: Strongly disagree^ 1 Strongly agree=53. Job is not repetitious: Strongly disagree= I Strongly agree=5
Job requires speed: Strongly disagree=l Strongly agree=5
Supervisory Responsibility: Number of people respondent supervises directly
Status (salary grade): 1 (low) tluough 9 (high)
Participate in making job-related decisions: Strongly disagree= 1 Strongly agree=5
Can work independently: Strongly disagree= 1 Strongly agree=5
Quality of work is easy to evaluate: Strongly disagree= 1 Strongly agree=5
Facetime: time spent at the office affects evaluation of work No=0 Yes= 1
Trust: immediate supervisor has a high level of trust in respondentStrongly disagree= 1 Strongly agree=5
Job security: likelihood of losingjob within 6 monthsVery likely= 1 Not at all likely=4
Seniority : Years worked for Midwest
Education: Highest level of education attainedLess than high school= 1 Ph.D.=7
Work Context: Division and Department
Work in Actuarial division No=0 Ycs=l
Work in Systems division No=0 Yes=l
Work in Operations division No=0 Yes=l
Awareness of all four A WA options: No=0 Yes= 1
Estimated level of departmental use of ffextime: None= 1 All=5
Estimated level of departmental use of CWW; None=l AU=S
Estimated level of departmental use of telecommuting: None= 1 A11=ST able 3.2 continued on next page.
88
-.12 .943.93 .974.17 .863.44 1.20
3.79 .82
4.17 .91
1.29 3.23
4.95 1.71
4.04 .97
4.30 .95
3.57 1.02
.52 .50
4.14 .81
3.70 .61
7.70 7.32
4.48 1.16
.29 .45
.37 .48
.34 .48
.87 .34
3.98 1.22
3.16 1.22
2.11 1.06
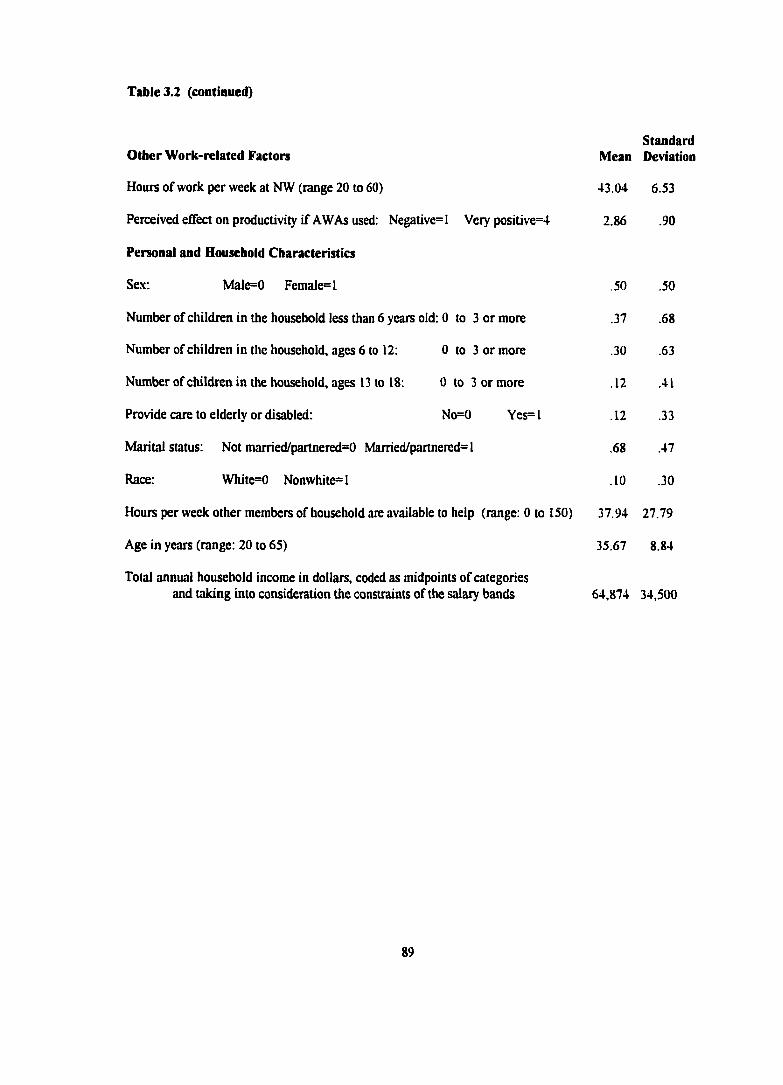
Standard
Table 3.2 (continued)
Other Work-related Factors
Hours of work per week at NW (range 20 to 60)
Perceived effect on productivity if AWAs used: Negative= I Very positive=4
Personal and Household Characteristics
Sex: Maie=0 Femaie=l
Number of children in the household less than 6 years old: 0 to 3 or more
Number of children in the household, ages 6 to 12: 0 to 3 or more
Number of cliildren in the household, ages 13 to 18: 0 to 3 or more
Provide care to elderly or disabled: No=0 Yes= I
Marital status: Not married/partnered=0 Married/partnered= I
Race: White=0 Nonwhite=l
Hours per week other members of household are available to help (range: 0 to 150)
Age in years (range: 20 to 65)
Total annual household income in dollars, coded as midpoints of categoriesand taking into consideration the constraints of the salary bands 64,874 34,500
Mean Deviai
43.04 6.53
2.86 .90
,50 .50
.37 .68
.30 .63
.12 .41
.12 .33
.68 .47
.10 .30
37.94 27.79
35.67 8.84
89
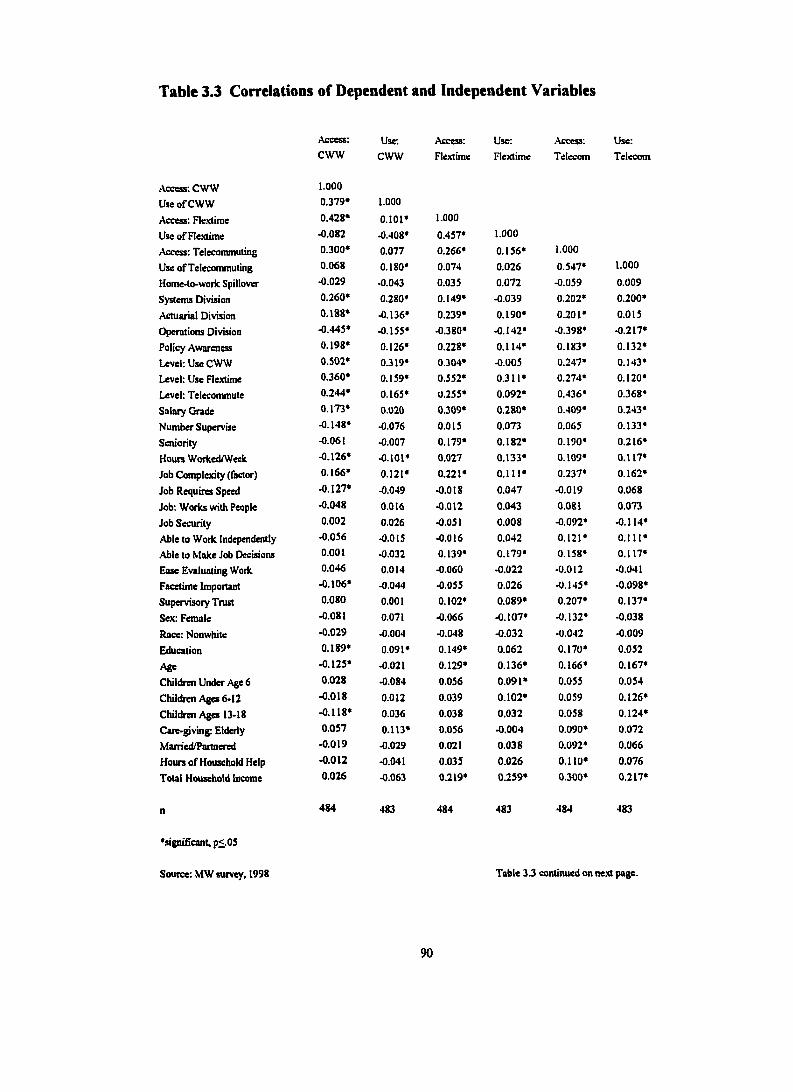
Table 3.3 Correlations of Dependent and Independent Variables
Access: Use: Access: Use: Access: Use:CWW CWW Flextime Flextime Telecom Telecom
Access; CWW 1.000
Use o f CWW 0.379* 1.000
Access: Flextime 0.428* 0.101* 1.000
Use o f Flextime -0.082 -0.408* 0.457* 1.000
Access: Telecommuting 0.300* 0.077 0.266* 0.156* 1.000
Use ofTelecommuting 0.068 0.180* 0.074 0.026 0.547* 1.000
Home-to-woric Spillover -0.029 -0.043 0.035 0.072 -0.059 0.009
Systems Division 0.260* 0.280* 0.149* -0.039 0.202* 0.200*
Actuarial Division 0.188* -0.136* 0.239* 0.190* 0.201* 0.015
Operations Division -0.445* -0.155* -0.380* -0.142* -0.398* -0.217*
Policy Awareness 0.198* 0.126* 0.228* 0.114* 0.183* 0.132*
Level: Use CWW 0.502* 0.319* 0.304* -0.005 0.247* 0.143*
Level: Use Flextime 0.360* 0.159* 0.552* 0.311* 0.274* 0.120*
Level: Telecommute 0.244* 0.165* 0.255* 0.092* 0.436* 0.368*
Salary Grade 0.173* 0.020 0309* 0.280* 0.409* 0.243*
Number Supervise -0.148* -0.076 0.015 0.073 0.065 0.133*
Seniority -0.061 -0.007 0.179* 0.182* 0.190* 0.216*
Hours Worked/Week -0.126* -0.101* 0.027 0.133* 0.109* 0.117*
Job Complexity (factor) 0.166* 0.121* 0.221* 0.111* 0.237* 0.162*
Job Requires Speed -0.127* -0.049 -0.018 0.047 -0.019 0.068
Job: W orks with People -0.048 0.016 -0.012 0.043 0.081 0.073
Job Security 0.002 0.026 -0.051 0.008 -0.092* -0.114*
Able to W ork Independently -0.056 -0.015 -0.016 0.042 0.121* 0.111*
Able to Make Job Decisions 0.001 -0.032 0.139* 0.179* 0.158* 0.117*
Ease Evaluating Work 0.046 0.014 -0.060 -0.022 -0.012 -0.041
Facetime Important -0.106* -0.044 -0.055 0.026 -0.145* -0.098*
Supervisory Trust 0.080 0.001 0.102* 0.089* 0.207* 0.137*
Sex: Female -0.081 0.071 -0.066 -0.107* -0.132* -0.038
Race: Nonwhite -0.029 -0.004 -0.048 -0.032 -0.042 -0.009
Education 0.189* 0.091* 0.149* 0.062 0.170* 0.052
Age -0.125* -0.021 0.129* 0.136* 0.166* 0.167*
Children Under Age 6 0.028 -0.084 0.056 0.091* 0.055 0.054
Children Ages 6>I2 -0.018 0.012 0.039 0.102* 0.059 0.126*
Children Ages 13-18 -0.118* 0.036 0.038 0.032 0.058 0.124*
Care-pving: Elderly 0.057 0.113* 0.056 -0.004 0.090* 0.072
Married/Partnered -0.019 -0.029 0.021 0.038 0.092* 0.066
Hours o f Household Help -0.012 -0.041 0.035 0.026 0.110* 0.076
Total Household Income 0.026 -0.063 0.219* 0 3 5 9 * 0.300* 0.217*
n 484 483 484 483 484 483
'significant. p<.05
Source: MW survey, 1998 Table 3 J continued on next page.
90
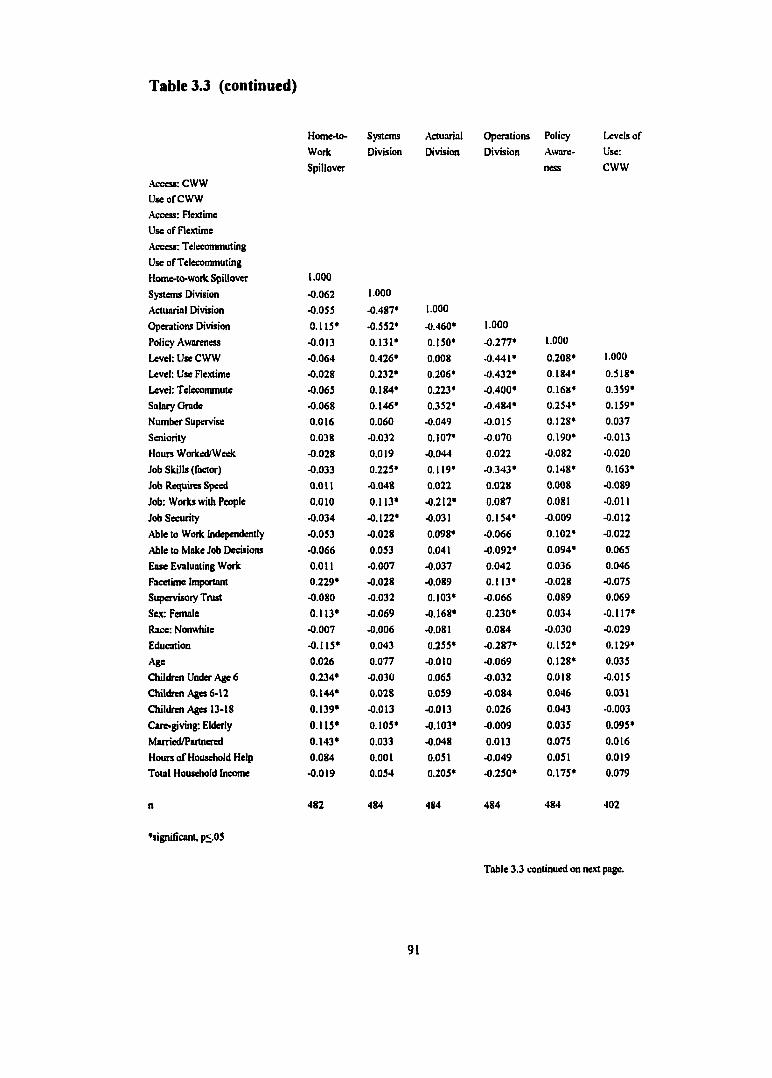
Table 3.3 (continued)
Access; CWW
Use o f CWW
Access: Flextime
Use o f Flextime
Access: Telecommuting
Use ofTelecommuting
^significant. p<.05
Home-to-
Work
Spillover
Systems Actuarial Operations Policy
Division Division Division Aware-
Levels o f
Use:
CWW
Home-to-wock Spillover
Systems Division
Actuarial Division
Operations Division
Policy Awareness
1.000
-0.062
-0.055
0.115*
-0.013
1.000
-0.487*
-0.552*
0.131*
1.000
-0.460*
0.150*
1.000
-0.277* 1.000
Level: Use CWW -0.064 0.426* 0.008 -0.441* 0.208* 1.000
Level: Use Flextime -0.028 0.232* 0.206* -0.432* 0.184* 0.518*
Level; Telecommute ■0.065 0.184* 0.223* -0.400* 0.168* 0.359*
Salary Grade -0.068 0.146* 0.352* -0.484* 0.254* 0.159*
Number Supervise 0.016 0.060 -0.049 -0.015 0.128* 0.037
Seniority 0.038 -0.032 0.107* -0.070 0.190* -0.013
Hours Worked/Week -0.028 0.019 -0.044 0.022 -0.082 -0.020
Job Skills (factor) -0.033 0.225* 0.119* -0.343* 0.148* 0.163*
Job Requires Speed 0.011 ■0.048 0.022 0.028 0.008 -0.089
Job: Works with People 0.010 0.113* -0.212* 0.087 0.081 -0.011
Job Security -0.034 -0.122* -0.031 0.154* -0.009 -0.012
Able to Work Independently -0.053 -0.028 0.098* -0.066 0.102* -0.022
Able to Make Job Decisions -0.066 0.053 0.041 -0.092* 0.094* 0.065
Ease Evaluating Work 0.011 -0.007 -0.037 0.042 0.036 0.046
Facetime Important 0.229* -0.028 -0.089 0.113* -0.028 -0.075
Supervisory Trust -0.080 -0.032 0.103* -0.066 0.089 0.069
Sex: Female 0.113* -0.069 -0.168* 0.230* 0.034 -0.117*
Race: Nonwhite -0.007 -0.006 -0.081 0.084 -0.030 -0.029
Education -0.115* 0.043 0.255* -0.287* 0.152* 0.129*
Age 0.026 0.077 -0.010 -0.069 0.128* 0.035
Children Under Age 6 0.234* -0.030 0.065 -0.032 0.018 -0.015
Children Ages 6-12 0.144* 0.028 0.059 -0.084 0.046 0.031
Children Ages 13-18 0.139* -0.013 -0.013 0.026 0.043 -0.003
Care-giving: Elderly 0.115* 0.105* -0.103* -0.009 0.035 0.095*
Married/Partnered 0.143* 0.033 -0.048 0.013 0.075 0.016
Hours o f Household Help 0.084 0.001 0.051 -0.049 0.051 0.019
Total Household Income -0.019 0.054 0.205* -0.250* 0.175* 0.079
n 482 484 484 484 484 402
Table 3.3 continued on next page.
91
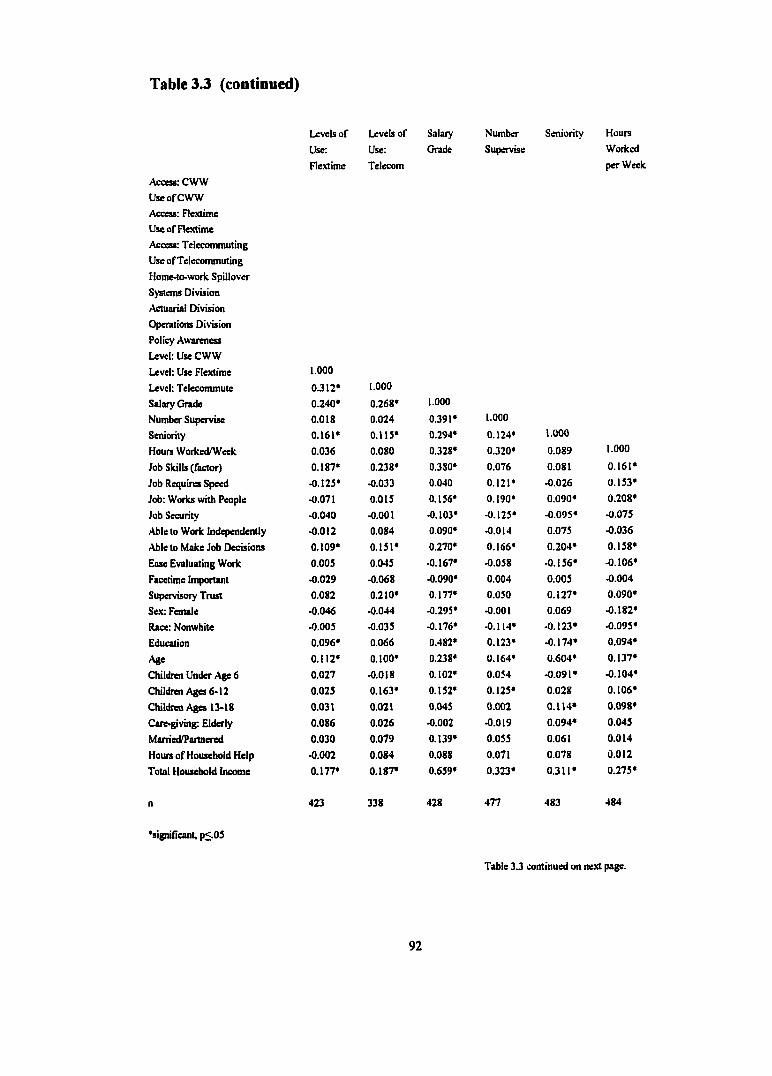
Table 3.3 (continued)
Access: CWW
Use o f CWW
Access: Hextime
Use o f Flextime
Access: Telecommuting
Use ofTelecommuting
Home-to-work Spillover
Systems Division
Actuarial Division
Operations Division
Policy Awareness
Level: Use CW W
'aignificant, p<.05
Levels o f
Use:
Flextime
Levels o f
Use:
Telecom
Salary
Grade
Number
Supervise
Seniority Hours
Worked
per Week
Level: Use Flextime 1.000
Level: Telecommute 0.312* 1.000
Salary Grade 0.240* 0.268* 1.000
Number Supervise 0.018 0.024 0.391* 1.000
Seniority 0.161* 0.115* 0.294* 0.124* 1.000
Hours Worked/Week 0.036 0.080 0.328* 0.320* 0.089 1.000
Job Skills (factor) 0.187* 0.238* 0.380* 0.076 0.081 0.161*
Job Requires Speed -0.125* -0.033 0.040 0.121* -0.026 0.153*
Job: Works with People -0.071 0.015 0.156* 0.190* 0.090* 0.208*
Job Security -0.040 -0.001 -0.103* -0.125* -0.095* -0.075
Able to Work Independently -0.012 0.084 0.090* -0.014 0.075 -0.036
Able to Make Job Decisions 0.109* 0.151* 0.270* 0.166* 0.204* 0.158*
Ease Evaluating Work 0.005 0.045 -0.167* -0.058 -0.156* -0.106*
Facetime Important -0.029 -0.068 -0.090* 0.004 0.005 -0.004
Supervisory Trust 0.082 0.210* 0.177* 0.050 0.127* 0.090*
Sex: Female -0.046 -0.044 -0.295* -0.001 0.069 -0.182*
Race: Nonwhite -0.005 -0.035 -0.176* -0.114* -0.123* -0.095*
Education 0.096* 0.066 0.482* 0.123* -0.174* 0.094*
Age 0.112* 0.100* 0.238* 0.164* 0.604* 0.137*
Children Under Age 6 0.027 -0.018 0.102* 0.054 -0.091* -0.104*
Children Ages 6-12 0.025 0.163* 0.152* 0.125* 0.028 0.106*
Children Ages 13-18 0.031 0.021 0.045 0.002 0.114* 0.098*
Care-giving: Elderly 0.086 0.026 -0.002 -0.019 0.094* 0.045
Married/Partnered 0.030 0.079 0.139* 0.055 0.061 0.014
Hours o f Household Help -0.002 0.084 0.088 0.071 0.078 0.012
Total Household Income 0.177* 0.187* 0.659* 0.323* 0.311* 0.275*
n 423 338 428 477 483 484
Table 3 J continued on next page.
92
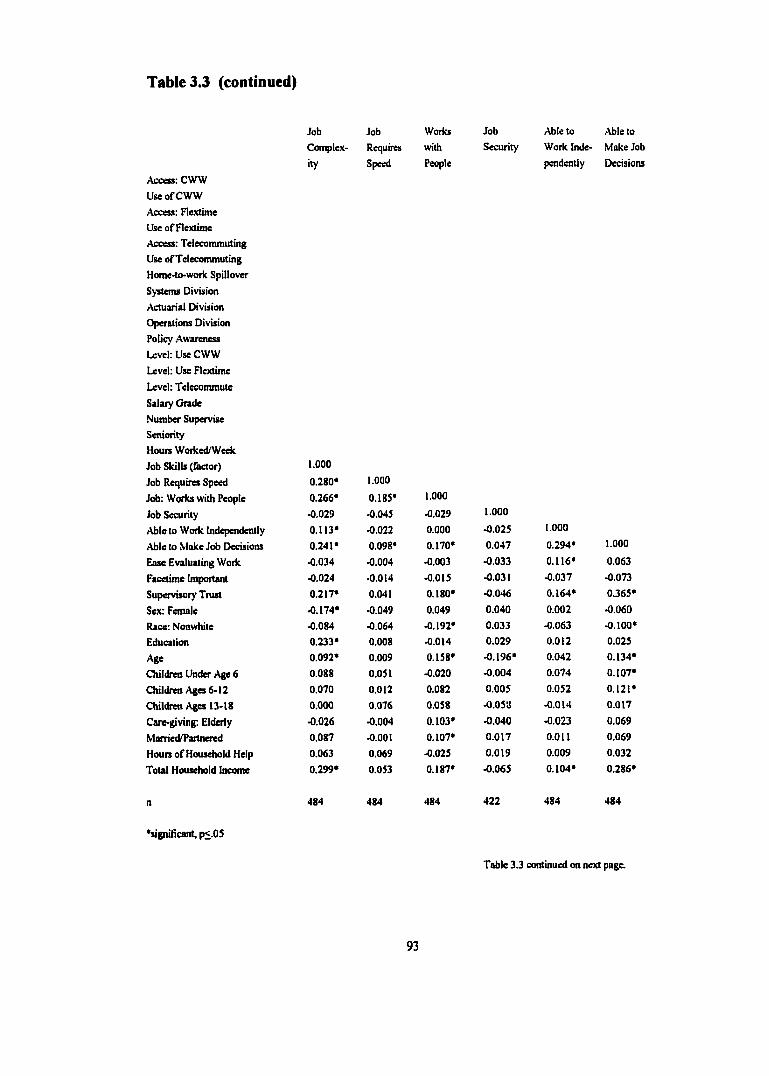
Table 3.3 (continued)
Access; CWW
Use o f CW W
Access: Flextime
Use o f Flextime
Access: Telecommuting
Use ofTelecommuting
Home-to-work Spillover
Systems Division
Actuarial Division
Operations Division
Policy Awareness
Level: Use CWW
Level: Use Flextime
Level: Telecommute
Salary Grade
Number Supervise
Seniority
Hours Worked/Week
*significanL p<.05
Job Job Works Job Able to Able to
Complex- Requires with Security W ork Inde- Make Job
ity Speed People pendently Decisions
Job Skills (factor) 1.000
Job Requires Speed 0.280* 1.000
Job: Works with People 0.266* 0.185* 1.000
Job Security -0.029 •0.045 -0.029 1.000
Able to W ork Independently 0.113* •0.022 0.000 -0.025 1.000
Able to Make Job Decisions 0.241* 0.098* 0.170* 0.047 0.294* 1.000
Ease Evaluating Work •0.034 •0.004 -0.003 -0.033 0.116* 0.063
Facetime Important -0.024 •0.014 -0.015 •0.031 -0.037 •0.073
Supervisory Trust 0.217* 0.041 0.180* •0.046 0.164* 0.365*
Sex: Female -0.174* •0.049 0.049 0.040 0.002 •0.060
Race: Nonwhite •0.084 •0.064 -0.192* 0.033 -0.063 •0.100*
Education 0.233* 0.008 -0.014 0.029 0.012 0.025
Age 0.092* 0.009 0.158* -0.196* 0.042 0.134*
Children Under Age 6 0.088 0.051 -0.020 -0.004 0.074 0.107*
Children Ages 6-12 0.070 0.012 0.082 0.005 0.052 0.121*
Children Ages 13-18 0.000 0.076 0.058 -0.058 -0.014 0.017
Cate-giving; Elderly -0.026 •0.004 0.103* -0.040 -0.023 0.069
Married/Partnered 0.087 •0.001 0.107* 0.017 0.0 I I 0.069
Hours o f Household Help 0.063 0.069 -0.025 0.019 0.009 0.032
Total Household Income 0.299* 0.053 0.187* -0.065 0.104* 0.286*
n 484 484 484 422 484 484
Table 3.3 continued on next page.
93
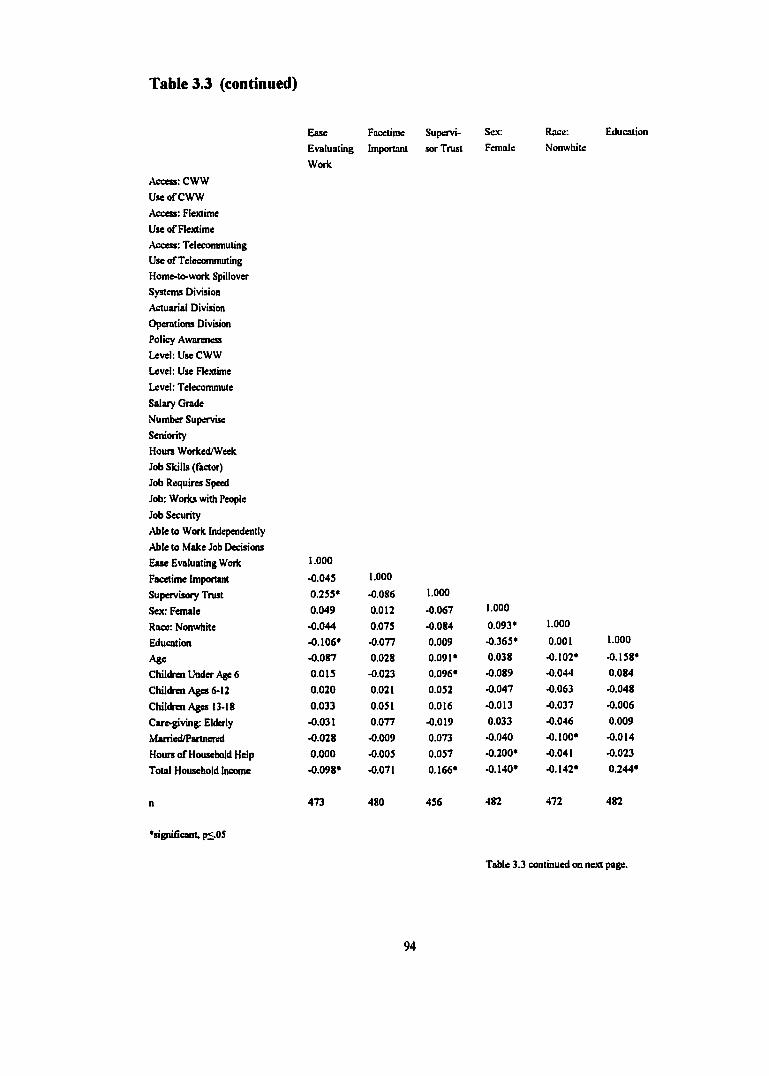
Table 3.3 (continued)
Access: CWW
Use o f CWW
Access: Flextime
Use o f Flextime
Access: Telecommuting
Use ofTelecommuting
Home-to-work Spillover
Systems Division
Actuarial Division
Operations Division
Policy Awareness
Level: Use CWW
Level: Use Flextime
Level: Telecommute
Salary Grade
Number Supervise
Seniority
Hours Worked/Week
Job Skills (factor)
Job Requires Speed
Job: Works with People
Job Security
Able to Work Independently
Able to Make Job Decisions
'significant, p<.0 J
Ease Facetime Supervi- Sex: Race:
Evaluating Important sor Trust Female Nonwhite
W ork
Education
Ease Evaluating Work 1.000
Facetime Important -0.045 I.OOO
Supervisory Trust 0.255* -0.086 I.OOO
Sex: Female 0.049 0.012 -0.067 1.000
Race: Nonwhite -0.044 0.075 -0.084 0 .0 9 3 ' 1.000
Education -0 .1 0 6 ' -0.077 0.009 -0 .365 ' 0.001 1.000
Age -0.087 0.028 0 .091 ' 0.038 -0 .102 ' -0.158*
Children Under Age 6 0.015 -0.023 0 .0 9 6 ' -0.089 -0.044 0.084
Children Ages 6-12 0.020 0.021 0.052 -0.047 -0.063 -0.048
Children Ages 13-18 0.033 0.051 0.016 -0.013 -0.037 -0.006
Care-giving: Elderly -0.031 0.077 -0.019 0.033 -0.046 0.009
Married/Partnered -0.028 -0.009 0.073 -0.040 -0.100* -0.014
Hours o f Household Help 0.000 -0.005 0.057 -0 .200 ' -0.041 -0.023
Total Household Income -0 .0 9 8 ' -0.071 0 .1 6 6 ' -0 .1 4 0 ' -0.142* 0.244*
n 473 480 456 482 472 482
Table 3 J continued on next page.
94
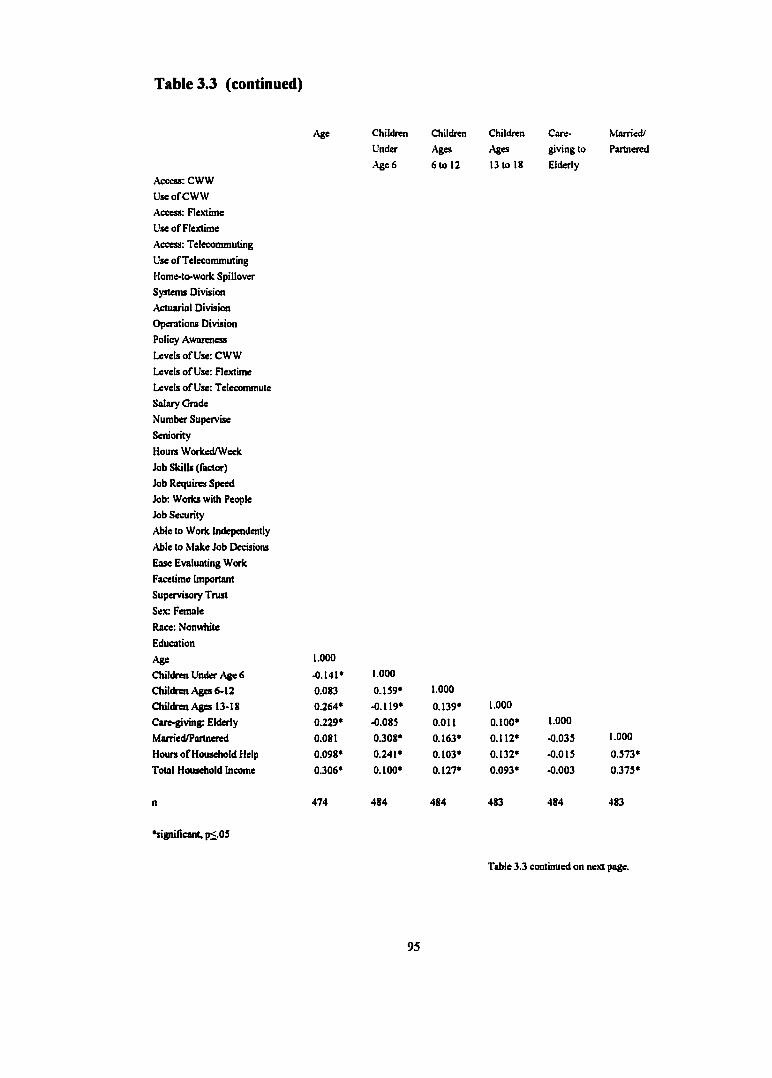
Table 3.3 (continued)
Access: CWW
Use o f CW W
Access: Flextime
Use o f Flextime
Access: Telecommuting
Use ofTelecommuting
Home-to-work Spillover
Systems Division
Actuariel Division
Operations Division
Policy Awareness
Levels o f Use: CW W
Levels o f Use: Flextime
Levels o f Use: Telecommute
Salary Grade
Number Supervise
Seniority
Hours Worked/Week
Job Skills (factor)
Job Requires Speed
Job: W orks with People
Job Security
Able to Work Independently
Able to Make Job Decisions
Ease Evaluating Work
Facetime Important
Supervisory Trust
Sex: Female
Race: Nonwhite
Education
‘significant. p<.05
Age Children Children Children Care- Married/
Under Ages Ages giving to Partnered
Age 6 6 to 12 13 to 18 Elderly
Age 1.000
Children Under Age 6 -0.141» 1.000
Children Ages 6-12 0.083 0.159» 1.000
Children Ages 13-18 0.264» -0.119» 0.139» 1.000
Care-giving; Elderly 0.229» -0.085 0.0 I t 0.100» 1.000
Married/Partnered 0.081 0.308» 0.163» 0 .1 12» -0.035 1.000
Hours o f Household Help 0.098» 0.241» 0.103» 0.132» -0.015 0.573»
Total Household Income 0 J0 6 » 0.100» 0.127» 0.093» -0.003 0.375»
n 474 484 484 483 484 483
Table 3.3 continued on next page.
95
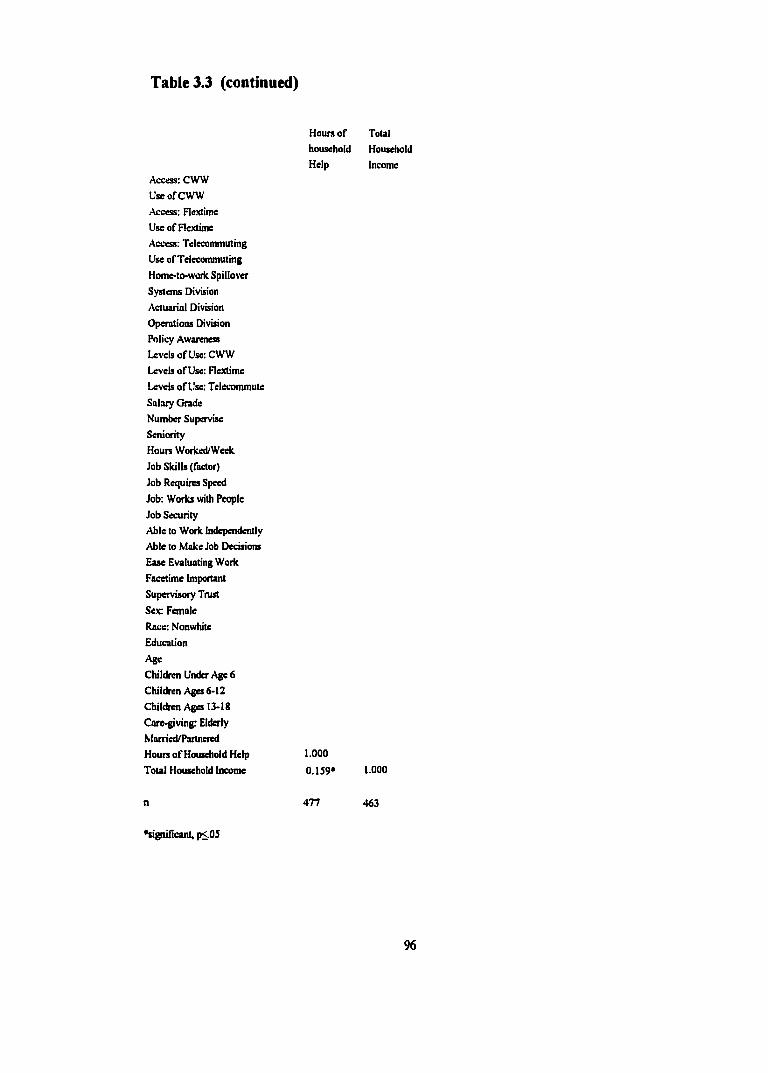
Table 3.3 (continued)
Hours o f Total
household Household
Help IncomeAccess; CWW
Use o f CWW
Access: Flextime
Use o f Flextime
Access: Telecommuting
Use ofTelecommuting
Home-to-work Spillover
Systems Division
Actuarial Division
Operations Division
Policy Awareness
Levels o f Use: CWW
Levels o f Use: Flextime
Levels o f Use: Telecommute
Salary Grade
Number Supervise
Seniority
Hours Worked/Week
Job Skills (factor)
Job Requires Speed
Job: Works with People
Job Security
Able to Work Independently
Able to Make Job Decisions
Ease Evaluating Work
Facetime Important
Supervisory Trust
Sex: Female
Race: Nonwhite
Education
Age
Children Under Age 6
Children Ages 6-12
Children Ages 13-18
Core-giving: Elderly
Married/Partnered
Hours o f Household Help
Total Household Income
1.0000.159»
477
1.000
463
«significant. p<.05
96
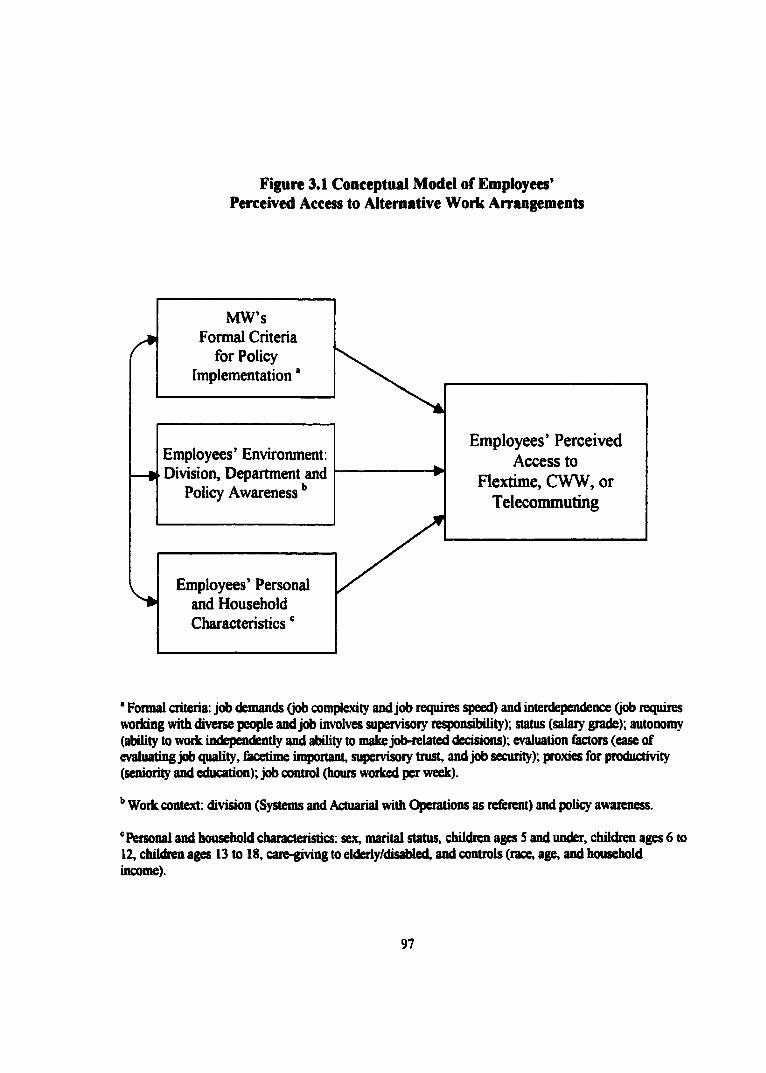
Figure 3.1 Conceptual Model of Employees*Perceived Access to Alternative Work Arrangements
MW’s Formal Criteria
for Policy Implementation '
Employees’ Environment: Division, Department and
Policy Awareness
Employees’ Personal and Household Characteristics '
Employees’ Perceived Access to
Flextime, CWW, or Telecommuting
* Formal criteria: job demands (job complexity and job requires speed) and interdependence (job requires working with diverse people and job involves supervisory responsibility); status (salary grade); autonomy (ability to worir independently and ability to make job-related decisions); evaluation hictors (ease of evaluating job quality, hicetime important, supervisory trust, and job security); proxies for productivity (seniority and education); job control (hours worked per week).
Work context: division (Systems and Actuarial with Operations as referent) and policy awareness.
‘Personal and household characteristics: sex, marital status, children ages 5 and under, children ages 6 to 12, children ages 13 to 18, care-giving to elderly/disabled, and controls (race, age, and household income).
97
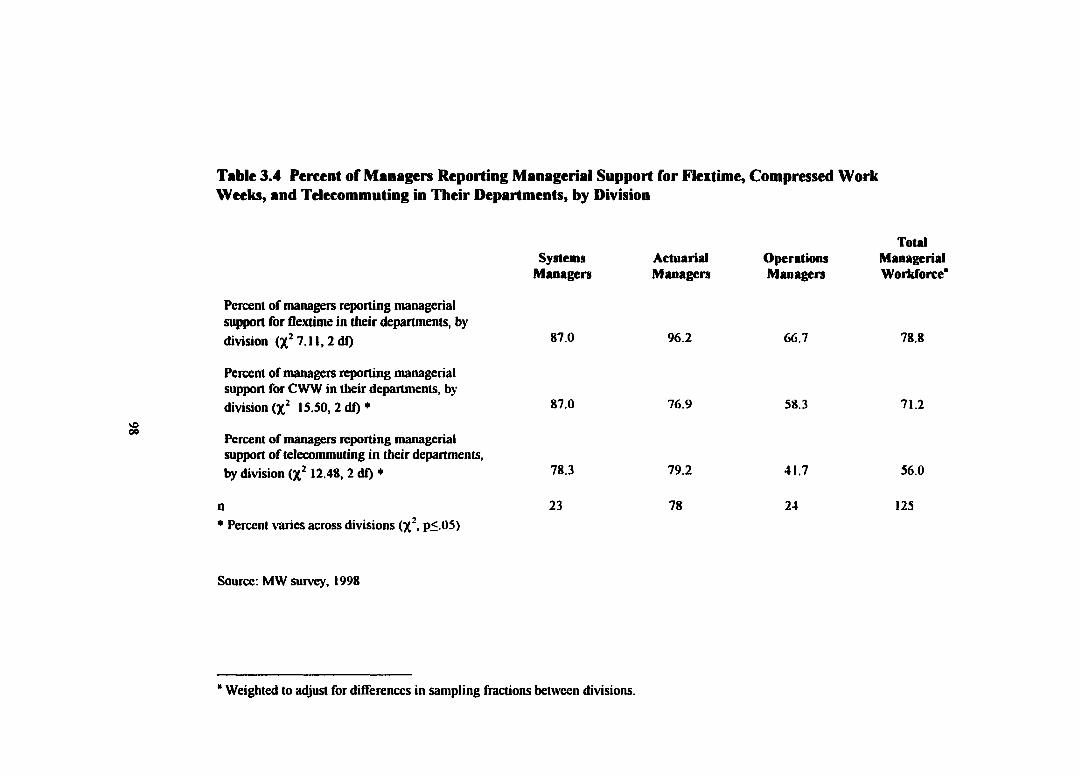
s
Table 3.4 Percent of Managers Reporting Managerial Support for Flextime, Compressed Work Weeks, and Telecommuting in Their Departments, by Division
TotalSystems Actuarial Operations Managerial
Managers Managers Managers Workforce*
Percent of managers reporting managerial support for flextime in their departments, bydivision (% 7.11,2 df) 66.7 78.8
Percent of managers reporting managerial support for CWW in their departments, bydivision (X 15.50,2 df)* 8^.0 76.9 58.3 71.2
Percent of managers reporting managerial support of telecommuting in their departments,by division (X 12.48,2 dO * 41.7 56.0
n 23 78 24 125* Percent varies across divisions (X*, p< 05)
Source; MW survey, 1998
* Weighted to adjust for difierences in sampling fractions between dirisions.
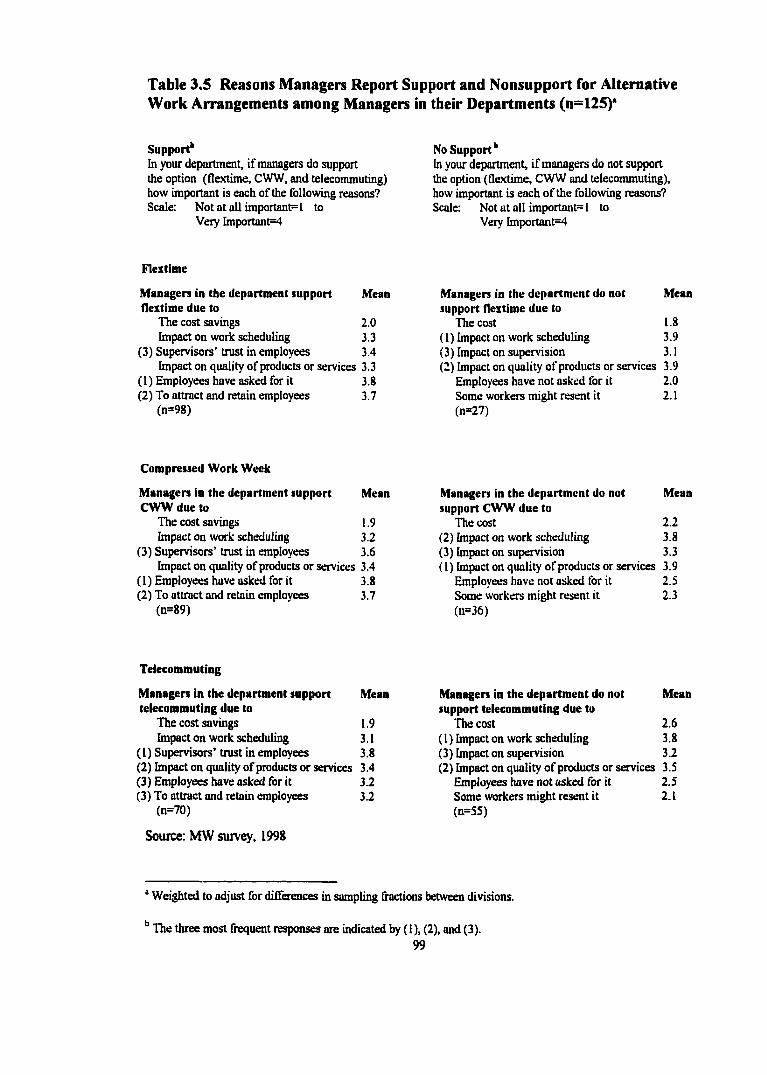
Table 3.5 Reasons Managers Report Support and Nonsupport for Alternative Work Arrangements among Managers in their Departments (n=12S)*
Support*In your department, if managers do support the option (flextime, CWW, and telecommuting) how important is each of the following reasons? Scale: Not at all important=l to
Very Important=4
No Support*In your department, if managers do not support the option (flextime, CWW and telecommuting), how important is each of the following reasons? Scale: Not at all important= 1 to
Very hnportant=4
Flextime
Managers in the department support Mean Managers in the department do not Meanflextime due to support flextime due to
The cost savings 2.0 The cost 1.8Impact on work scheduling 3.3 (1) Impact on work scheduling 3.9
(3) Supervisors’ trust in employees 3.4 (3) Impact on supervision 3.1Impact on quality of products or services 3.3 (2) Impact on quality of products or services 3.9
(1) Employees have asked for it 3.8 Employees have not asked for it 2.0(2) To attract and retain employees 3.7 Some workers might resent it 2.1
(n=98) (n=27)
Compressed Work Week
Managers in the department support Mean Managers in the department do not MeanCWW due to support CWW due to
The cost savings 1.9 The cost 2.2Impact on work scheduling 3.2 (2) Impact on work scheduling 3.8
(3) Supervisors’ trust in employees 3.6 (3) Impact on supervision 3.3Impact on quality of products or services 3.4 ( I ) Impact on quality of products or services 3.9
(1) Employees have asked for it 3.8 Employees have not asked for it 2.5(2) To attract and retain employees 3.7 Some workers might resent it 2.3
(n=89) (n=36)
Telecommuting
Managers in the department support Mean Managers in the department do not Meantelecommuting due to support telecommuting due to
The cost savings 1.9 The cost 2.6Impact on work scheduling 3.1 (1) Impact on work scheduling 3.8
( 1 ) Supervisors’ trust in employees 3.8 (3) Impact on supervision 3.2(2) Impact on quality of products or services 3.4 (2) Impact on quality of products or services 3.5(3) Employees have asked for it 3.2 Employees have not asked for it 2.5(3) To attract and retain employees 3.2 Some workers might resent it 2.1
(n=70) (n=55)
Source: MW survey, 1998
' Weighted to adjust for differences in sampling factions between divisions.
' The three most frequent responses are indicated by ( 1 ), (2), and (3).99
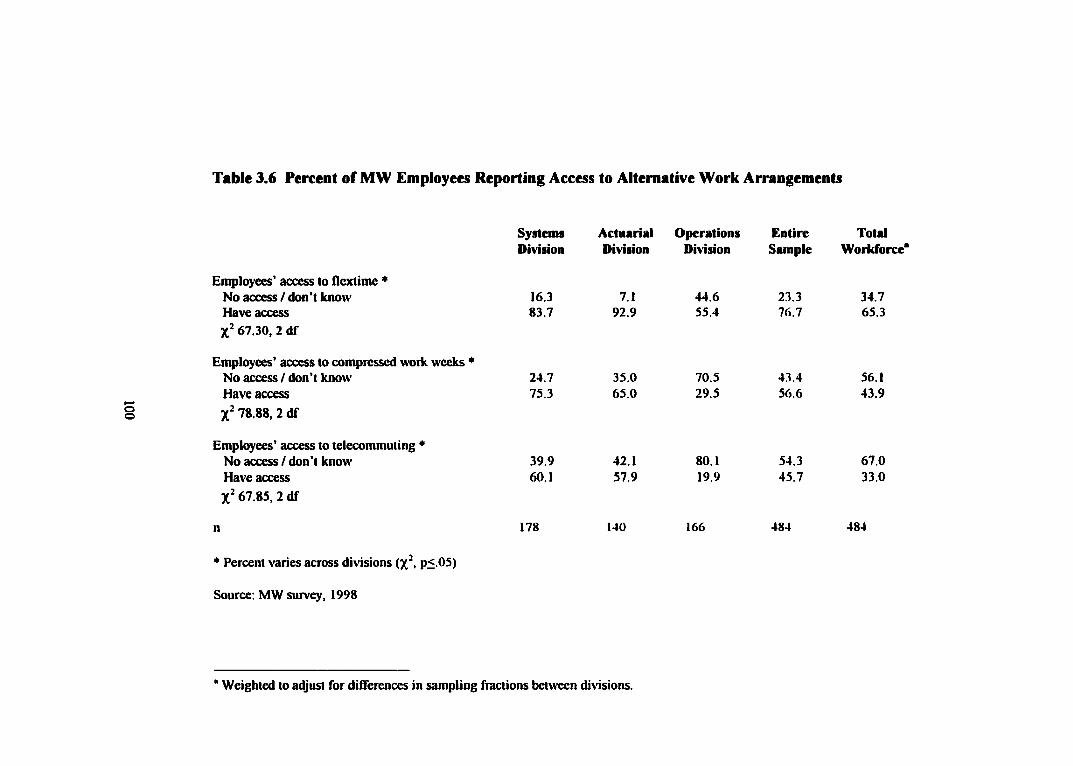
s
Table 3.6 Percent of MW Employees Reporting Access to Alternative Work Arrangements
Systems Actuarial Operations Entire TotalDivision Division Division Sample Workforce*
Employees’ access to flextime *No access / don’t know 16.3 7.1 44.6 23.3 34.7Have access 83.7 92.9 55.4 76.7 65.3jC 67.30, 2 df
Employees’ access to compressed work weeks *No access / don’t know 24.7 35.0 70.5 43.4 56.1Have access 75.3 65.0 29.5 56.6 43.9
78.88, 2 df
Employees’ access to telecommuting *No access / don’t know 39.9 42.1 80.1 54.3 67.0Have access 60.1 57.9 19.9 45.7 33.0X" 67.85, 2 df
n
* Percent varies across divisions (X', p< 05)
Source; MW survey, 1998
178 140 166 484 484
" Weighted to adjust for differences in sampling fractions between dirisions.
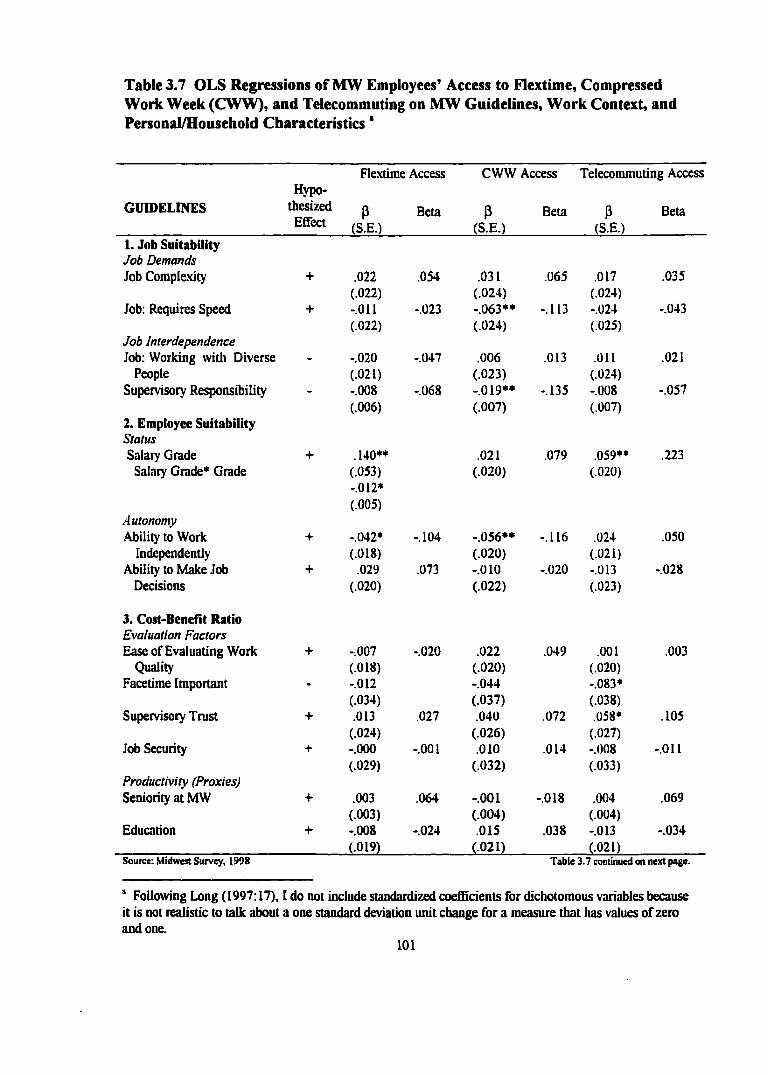
Table 3.7 OLS Regressions of MW Employees’ Access to Flextime, Compressed Work Week (CWW'), and Telecommuting on MW Guidelines, Work Context, and Personal/Household Characteristics '
GUIDELINESHypo
thesizedEffect
Fle.\time Access
P Beta(S.E.)
CWW Access
P Beta (S.E.)
Telecommuting Access
P Beta (S.E.)
1. Job SuitabilityJob DemandsJob Complexity + .022
(.022).054 .031
(.024).065 .017
(.024).035
Job: Requires Speed
Job Interdependence
+ -.011(.022)
-.023 -.063**(.024)
-.113 -.024(.025)
-.043
Job: Working with Diverse People
-.020(.021)
-.047 .006(.023)
.013 Oil(.024)
.021
Supervisory Responsibility
2. Employee SuitabilityStatus
-.008(.006)
-.068 -.019**(.007)
-.135 -.008(.007)
-.057
Salary Grade Salary Grade* Grade
Autonomy
+ .140**(.053)-.012*(.005)
.021(.020)
.079 .059**(.020)
.223
Ability to Work Independently
+ -.042*(.018)
-.104 -.056**(.020)
-.116 .024(.021)
.050
Ability to Make Job Decisions
3. Cost-Bcnefit RatioEvaluation Factors
+ .029(.020)
.073 -.010(.022)
-.020 -.013(.023)
-.028
Ease of Evaluating Work Quality
Facetime Important
+ -.007(.018)-.012(.034)
-.020 .022(.020)-.044(.037)
.049 .001(.020)-.083*(.038)
.003
Supervisory Trust + .013(.024)
.027 .040(.026)
.072 .058*(.027)
.105
Job Security
Productivity (Proxies)
+ -.000(.029)
-.001 .010(.032)
.014 -.008(.033)
-.011
Seniority at MW + .003(.003)
.064 -.001(.004)
-.018 .004(.004)
.069
Education + -.008(.019)
-.024 .015(.021)
.038 -.013 _ (.021)
-.034
Source: Midwest Survey, 1998 Table 3.7 continued on next page.
’ Following Long (1997:17), I do not include standardized coefficients for dichotomous variables because it is not realistic to talk about a one standard deviation unit change for a measure that has values of zero and one.
101
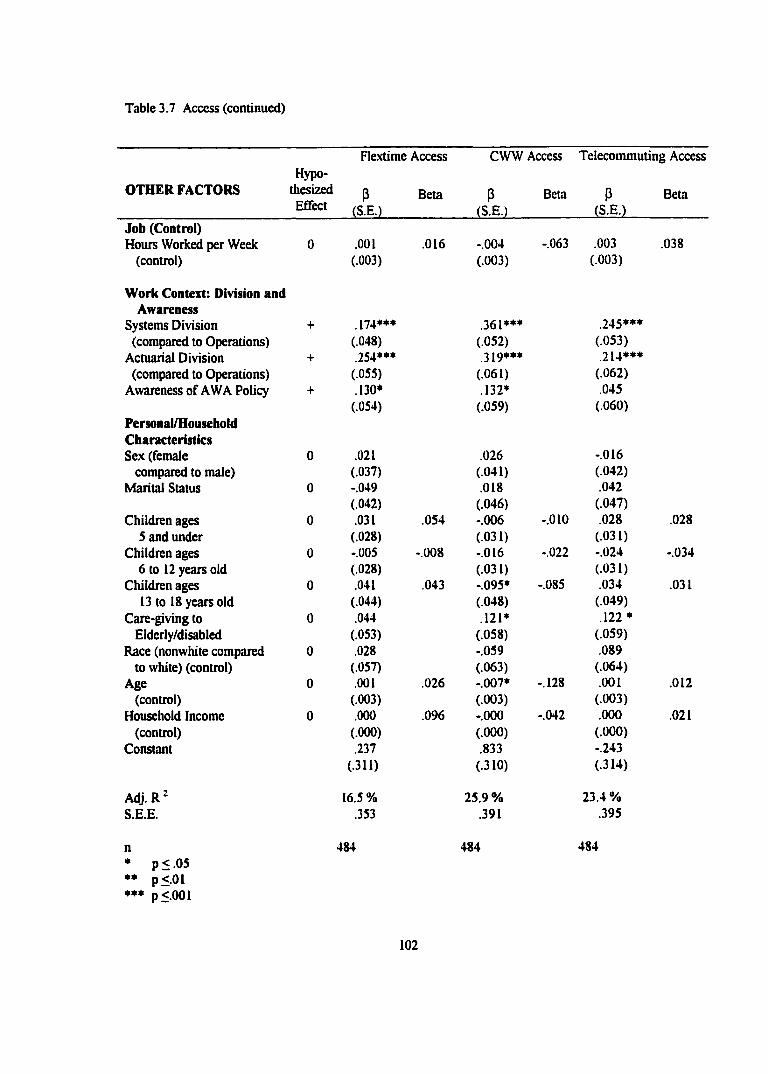
Table 3.7 Access (continued)
OTHER FACTORSHypo
thesizedEffect
Flextime Access
Beta
CWW Access Telecommuting Access
Beta Beta
Job (Control)Hours Worked per Week 0 .001 .016 -.004 -.063 .003 .038
(control) (.003) (.003) (.003)
W ork Context: Division andAwareness
Systems Division + .174*** .361*** .245***(compared to Operations) (.048) (.052) (.053)
Actuarial Division + .254*** .319*** .214***(compared to Operations) (.055) (.061) (.062)
Awareness of AWA Policy + .130* .132* .045(.054) (.059) (.060)
Personal/HouseholdCharacteristicsSex (female 0 .021 .026 -.016
compared to male) (.037) (.041) (.042)Marital Status 0 -.049 .018 .042
(.042) (.046) (.047)Children ages 0 .031 .054 -.006 -.010 .028 .028
S and under (.028) (.031) (.031)Children ages 0 -.005 -.008 -.016 -.022 -.024 -.034
6 to 12 years old (.028) (.031) (.031)Children ages 0 .041 .043 -.095* -.085 .034 .031
13 to 18 years old (.044) (.048) (.049)Care-giving to 0 .044 .121* .122*
Elderly/disabled (.053) (.058) (.059)Race (nonwhite compared 0 .028 -.059 .089
to white) (control) (.057) (.063) (.064)Age 0 .001 .026 -.007* -.128 .001 .012
(control) (.003) (.003) (.003)Household Income 0 .000 .096 -.000 -.042 .000 .021
(control) (.000) (.000) (.000)Constant .237 .833 -.243
(.311) (.310) (.314)
Adj.R* 16.5 % 25.9% 23.4%S£.E . .353 .391 .395
n 484 484 484P < 0 5 P < 0 1
**♦ p<.OOI**
102
CHAPTER 4
DETERMINANTS OF MW EMPLOYEES’ USE OF ALTERNATIVE WORK
ARRANGEMENTS AND THEIR HOME-TO-WORK SPILLOVER
In this chapter I Investigate MW employees’ use o f three alternative work
arrangements and their home-to-work spillover. Home-to-work spillover is negatively
related to job performance (Kelly 1999:183; Starrels 1992:268; Friedman 1991:11; Ferber
and O’Farrell 1991:60; Schultz et al. 1988). The underlying premise of MW’s work-home
scheduling options is that job flexibility could reduce employees’ work-home conflict by
permitting workers to more conveniently organize and address their home-based
responsibilities around their work. Therefore, I investigate three related questions about
factors that affect workers’ use of the scheduling options and the relationship between
employees’ use of AWAs and their home-to-work spillover: (1) What determines
employees’ use of MW’s alternative work arrangements? (2) What factors influence
employees’ home-to-work spillover? (3) What is the relationship between employees’ use
o f the options and their domestic spillover?
My first research question focuses on the determinants of employees’ use o f
AWAs. The three alternative work arrangements permit flexibility in the timing or
location of work, but they vary in the flexibility offered and the perceived risks associated
103
with their use—and hence in the costs and benefits to the employees with home-to-work
spillover. For example, managers permitting flextime typically allow subordinates the
opportunity to begin working up to two hours earlier or two hours later than the normal
starting time in their department. Workers are generally expected to adhere to the same
schedule each day, however. In contrast, employees on CWW schedules work a full work
week in four 10-hour days, although workers may design CWW for two-week periods.
However, employees on CWW schedules are expected to be available on their days off
during the workweek and may be called in for mandatory overtime. Telecommuters
occasionally or regularly perform their work away from the office—usually at home—
although those who routinely use the option are expected to work in the office on
scheduled days each week. Regardless of their scheduling arrangements, managers expect
employees to perform “on demand” overtime.
Employees interested in using AWAs must consider two key questions: “How will
use o f an AWA affect my job performance and the evaluation of that performance?” and
“How will use of an AWA affect my personal/home life?” I examine three sets o f factors
that should influence employees’ use of AWAs: (1) job characteristics and responsibilities
that should influence workers’ ability and need to use flexible arrangements; (2) workplace
factors that should affect the perceived risk employees associate with use o f the options;
and (3) personal and household factors that should affect employees’ need to use the
options.
Second, I investigate the predictors o f workers’ domestic spillover. Two groups
o f factors should affect the fi’equency that domestic concerns intrude at work: (1) the
104
personal, familial, and household characteristics that contribute to spillover; and (2)
factors related to employees’ jobs that affect their ability to address domestic concerns
during traditional hours o f work.
Third, there is widespread consensus that employees’ use of alternative work
arrangements and their work-family conflict are related. Indeed, MW’s assumption that
alternative scheduling options help workers balance their dual obligations implies
interdependent outcomes between use of the options and workers’ spillover. However,
research has generally failed to consider this reciprocal effect. ' Social scientists typically
model the relationship as recursive, focusing on how AWAs affect employees’ well-being
as a result of work-to-home conflict or how AWAs affect the tangible outcomes of home-
to-work conflict on the job, such as retention and absenteeism (Schwartz 1994:20;
Christensen and Staines 1990:460-9). In contrast to prior research, I use three
simultaneous equation models to analyze the hypothesized reciprocal relationships
between spillover and the three scheduling options offered by MW’s work-home policy.
Hypotheses
Determinants of Employees’ Use of Alternative Work Arrangements
Job characteristics that affect employees’ ability and need to use AWAs. The
nature of workers’ jobs influence how much their schedules can deviate from standard
hours and location—and thus should influence their decisions regarding the use of AWAs.
In the only research that I am aware of that uses a structural equation model, Leiter and Durup (1996) investigate the effect of change in respondents’ circumstances on spillover as a supplement to their longitudinal study of health care professionals’ spillover. They do
105
For example, employees who must be available to coworkers and customers should be less
likely than other workers to use options that take them away from traditional worksites
and schedules. Therefore, I expect that jobs that involve working with a variety of people
should be negatively related to workers’ use of the options. Similarly, while
organizational authority and status are associated with increased trust and privacy
(Nippert-Eng 1996:162; Coser 1974:71), they also convey the expectation of greater
commitment, availability, and responsibility (Bailyn 1993:33; Rodgers 1992:194). As a
MW employee explained, those in authority “feel like they have to be here every day...to
resolve whatever the issue [is].” The degree of workers’ supervisory responsibility, a
measure of both job interdependence and authority, should decrease employees’ use of the
options. In addition, those with higher status have inherent flexibility in their work that
may make alternative work arrangements superfluous. As a manager acknowledged, “I
can manipulate my schedule...as long as my responsibilities are covered.” Consequently, I
expect salary grade, an indicator of status, to be negatively linked to employees’ use of the
options, as well. In sum, jobs that require employees to work with others, as well as
factors that indicate organizational status and authority, should negatively affect workers’
use of scheduling arrangements that reduce the traditional time they spend in the
workplace.
In contrast, demanding jobs and jobs that involve autonomy should be associated
with increased use of the AWAs as workers seek to maintain their productivity, as well as
not investigate the feedback effects between home-to-work spillover and respondents’ use o f AWAs.
106
balance their work and home obligations.^ As a Systems nonmanager with a complex job
requiring speed explained, “Flexible scheduling has been very helpful in keeping me
focused and [it] improved my productivity at work.” An Operations manager, discussing
her subordinates' use of CWW, concurred; “[My subordinates’] jobs are very stressful.
They felt they would die without [CWW’s] day off.” And a nonmanagerial
telecommuter—also in a complex job requiring speed—believed that “the two days I work
from home are my most productive workdays, since there aren’t any interruptions and the
relaxed environment helps my attitude.” Thus, I expect that workers in jobs characterized
by complexity and the need for speed should use the options more than their counterparts
in less demanding jobs. In addition, workers accustomed to making job-related decisions
should use AWAs more than employees with less autonomy because such independence is
a prerequisite to use.^ In sum, jobs that are demanding should increase workers’ need to
use the options, and those with autonomy should increase workers’ ability to use AWAs.
Both, then, should be positively related to employees’ use net o f other factors.
Factors aflecting the perceived risk associated with employees’ use of the
options. Many workers believe that using AWAs will jeopardize their careers because
managers often associate the options’ use with reduced productivity and commitment
Employees with complex jobs also use flextime to avoid “work-to-work” spillover—that is, interruptions by coworkers. For example, an Operations manager in a complex job got in early each day because he could have “6:15 a m. to 8 a m. alone, before everyone else gets in. [It’s] the prime time to get things done.”
I used a second measure o f autonomy, employees’ ability to work independently, in the analyses o f access, but excluded it ftom the structural equation analyses. Whereas the ability to make job-related decisions must precede workers’ self-initiated use o f AWAs, the causal order of employees’ use of the options and their ability to work independently is
107
(Hochschild 1997:97; Hammonds et al. 1997:98; Sellers 1996:56; Rapoport and Bailyn
1996:16; Schwartz 1994:27-31; Galinsky et al. 1993:89; Rodgers 1992:184; Galinsky
1991:50). As a Systems manager acknowledged, “[Employees] worry about how It looks
to others” when they use an AW A. Although MW managerial informants agreed that they
did not consider subordinates’ use of the options in their evaluations,^ managers and
nonmanagers alike noted that administrators sometimes send subtle messages of
disapproval about employees who use the options. A nonmanager asserted that
“[mjanagers resent workers who leave at 5 pm. They feel they are less committed.”
Another argued, “People who [use the options] are not trusted by either coworkers or
managers ’ Indeed, one Actuarial nonmanager believed that “AWAs would be frowned
upon greatly in my area. Subtle management disapproval keeps me from [even] asking if
the options are really available.” In sum, consistent with prior research—and regardless of
the reality of the risk—some informants hesitated to use the options because they thought
AWAs sent a negative message to their managers.’ Thus, factors related to employees’
ambiguous. In addition, the variable was not significant in the analyses of the simultaneous equation models.
“* One manager captured the perspective of her colleagues: “I don't see [use of AWAs] coming into play during evaluations at all. I don’t think that it should.”
’ Managers in particular believed that except for flextime, their use o f AWAs was risky. For example, an Actuarial manager used flextime to “come and go as [I] please within certain limits. I’ve never had a problem here with management or the area that 1 work in.” In contrast, a Systems manager thought that using CWW jeopardized advancement “when we hit first line management and higher... I don’t know if it is forbidden.” Another manager of six employees concurred: “Most of the people who have taken advantage of these arrangements have had far less supervisory responsibility than my job has.” A unit manager with responsibility for 11 employees summed up the consensus: “Our management crew isn’t excited about us [using CWW or telecommuting].... I don’t think any o f our managers use CWW ... No [manager] is [regularly telecommuting] that I
108
evaluation, proxies for workers’ productivity, and the context in which employees work
should ameliorate or exacerbate that perceived risk.
Supervisors directly influence their subordinates’ success in an organization (Baron
1984:495) through the evaluation process. Consequently, I investigate the influence of
three evaluation factors that may ameliorate or exacerbate the perceived risk o f using
AWAs: (I) the perceived importance of facetime, regardless of employees’ actual
performance, (2) the ease with which supervisors can evaluate the quality o f subordinates’
work, and (3) employees’ perception of supervisory trust. Jobs that are evaluated on the
basis of facetime should be negatively related to MW workers’ use of the options. As a
manager-of-managers acknowledged, some managers “want to see [their subordinates]
when they get in and see that they stay late. . . [or] they think the workers are slacking.”
Conversely, performing work that is easy to evaluate and enjoying the trust of their
supervisors should reduce the risk employees associate with use of the options—and lead
to employees’ increased use of AWAs
Proxies for employees’ productivity should also decrease the risk workers
associate with using the options. Firms institute flexible scheduling options primarily to
retain skilled workers and maintain productivity (Witkowsky 1999:226; Schwartz 1994:6;
Morgan and Milliken 1992:240; Galinsky et al. 1991:84; Galinsky and Stein 1990:373).
As a nonmanager explained, the options “help retain good people who might look
elsewhere for employment or drop out of the workforce because of the outside work
issues tugging on them.” Thus, seniority and education, traditionally proxies for workers’
know of.” Employees interested in advancing in the hierarchy thus must consider the potential negative effect that using the options, particularly CWW and telecommuting,
109
skill and productivity, should increase workers’ value to the firm, reduce the perceived
risk of using the options, and have a net positive influence on employees’ use of flextime,
CWW, and telecommuting.®
Employees’ perceived job security should also be positively related to workers’ use
of the options. The more secure workers’ believe their jobs are, the less they should fear
taking the risks that are associated with using AWAs (Banker! and Googins 1996:47).
Different business units within the same organization have different expectations
and norms about work-home policies (Hochschild 1997:96; Galinsky et al. 1991:84-6).
Thus, contextual factors should affect whether employees use the options, in part by
reducing the risks associated with use (Hammonds et al. 1997:97-8; Glass and Fujimoto
1994:28; Schwartz 1994:35-9, 46-7, 52; Rodgers 1992:189, 191; Starrels 1992:261). I
investigate the effects of two contextual variables: employees’ division and the estimated
may have on their careers.
® I ran models in which I excluded education from the use equations in order to see if education were a proxy for the Actuarial (r=.255). Systems (r=.043), and Operations (r= -.287) divisions, and hence absorbing some of the influence of division. The effects of division did not change in models without education. Therefore, I retained education in the models of workers’ use of spillover as a proxy for productivity.
In addition, the causal order of workers’ seniority and their use of AWAs is ambiguous. Firms offer alternative work arrangements as retention strategies. Thus, it is conceivable that workers who use the options stay longer at MW. However, I found no evidence that managers considered seniority when deciding which employees had access to the arrangements (see Chapter 3). Anecdotal evidence, however, suggests that managers give MW workers with seniority priority in scheduling, such as choosing their day off with a CWW schedule, which may influence employees’ use of the options. Therefore, I include the variable in the analyses of use.
Following the initial analyses in which seniority was significant only for workers’ use o f telecommuting, I excluded seniority from all simultaneous equation models. I found no changes in the predictors of workers’ spillover or in their use of flextime and CWW, but the influence o f age became significant—presumably as a proxy for seniority
110
levels o f use o f the flextime, CWW, and telecommuting in respondents’ departments. As
noted, the three divisions differ in function, size, and rules of operation. Schwartz
(1994:66) argued that these attributes influence employees’ use of AWAs, their
perceptions about the use of AWAs, and the ramifications o f using AWAs. Thus, just as
division influenced individual managers’ decisions to make the options available (see
Chapter 3), I expect that the organizational attributes captured by division will Influence
employees’ use o f the scheduling options.
My second contextual measure is the estimated level o f departmental use of the
options. The level of use of an AWA reflects the decisions of managers throughout
respondents’ departments to allow access to, and hence use o f the option by respondents’
coworkers. The measure, then, indicates respondents’ perceptions of collective
managerial support within their departments for the options. The higher the estimated
level of use, the less perceived risk respondents should associate with using the options.
Moreover, the informal norms of the department and coworkers’ ingroup comparisons
shape workplace behavior and employees’ sense of entitlement (Lewis 1997:21; Starrels
1992:261; Major 1989:110; Baron 1988:494), underscoring the positive influence that the
estimated levels o f use should have. A Systems managers summed up the effects of the
two contextual factors: “[The viability o f AWAs] comes from an environment that accepts
that work isn’t the end all and be all. .. It is created within an organization, within specific
departments, and [by] the management teams that run [them].”
(r=.604)—in the analysis o f telecommuting. Therefore, I retained seniority in the final SEMs o f use because it, rather than age, is theoretically related to use.
Ill
The influence of workers’ personal and household characteristics on need.
Workers typically rank flexibility as a key strategy to help them to meet both home and
work obligations (National Report on Work and Family 1999:45; Friedman 1991:38;
Galinsky and Stein 1990:375). Summing up the comments o f many MW informants, a
male nonmanager stated, “Without alternative work arrangements, it would be very
difficult to balance work and family time. That balance...[helps both] the individual and
the company.” A male employee in the Actuarial division concurred, emphasizing that an
AWA “affords time to resolve issues that may conflict with normal working hours.”
Insofar as MW employees' personal and household obligations vary, their need for
the flexibility that AWAs offer should also vary. Thus, 1 investigate three personal and
household factors that should affect employees’ need for flexibility, and hence their use of
AWAs: (1) work-home conflict manifested by home-to-work spillover, (2) workers’ sex,
and (3) household income. Home-to-work spillover captures the effects o f respondents’
inability to devote fiill attention to their jobs due to the intrusion of family and care-giving
concerns. As a female nonmanager explained, “[Spillover] influences how well you work
and how focused you are on what you are doing during the day.” Therefore, it should be
positively related to workers’ use of AWAs because the options provide employees with
flexibility to perform potentially competing work and home responsibilities. Nevertheless,
the effects o f spillover on employees’ use of AWAs may diflfer between options because
the three arrangements vary in flexibility—and thus the arrangements may vary in their
ability to address home-to-work spillover.
112
The second personal characteristic, sex, should also influence employees’ net use
of alternative work arrangements. Women, as primary care-givers, want more flexibility in
their jobs than men do, on average—and they are more likely to use it than similarly
situated males (National Report on Work and Family 1999:45; Galinsky et al. 1993:86,
89; Chapman 1987:35). ’ In addition, the net effect o f sex on employees’ use o f flexible
work options should reflect gendered family and household obligations not explicitly
measured in the models, such as the responsibility for planning and coordinating children’s
activities (Leslie et al. 1991:208). Thus, I expect that women will use flexible work
options more than similarly situated men.
Finally, household income is an indicator of respondents’ ability to purchase
services, such as child care and repair work, that reduce the need for flexible schedules
(Hochschild 1997:230; Friedman 1991:23; Ferber and O’Farrell 1991:32; Coverman
1983 :632). As one manager acknowledged, “I am fortunate that the level of my income
allows me... to help smooth over some of those (household) things... [Otherwise] I
would have to rethink how I juggle and balance things.” Consequently, I expect
household income should be negatively related to employees’ use of alternative work
arrangements.
Control Variables. In predicting employees’ use of the options, I control for
workers’ race and age. The number o f nonwhites included in MW sample is likely to be
This is also related to rational economic choice that dictates that since women tend to earn less than men, women are more likely than men to use options that might cast doubt upon their commitment to their jobs. For example, women are more likely than men to work part-time and job share (Bond et al 1998:70; Presser 1989:526).
113
too small to detect differences by race, should they exist. Age controls for life cycle
differences (Friedman 1991:22; Spilerman and Schrank 1991:56; Raabe 1990:483).
Factors Influencing Employees’ Home>to-Work Spillover
I expect that MW employees’ home-to-work spillover will be grounded primarily
in home factors, although characteristics of workers’ jobs may mitigate or aggravate
domestic interference. The majority of MW employees have family ties and related
obligations. For example, 80 percent of MW employees have children, spouses, eldercare
responsibilities, or some combination of these familial and care-giving obligations that they
may occasionally or regularly worry about. Moreover, o f MW employees with
spouses/partners, eight out of ten (83 percent) had partners who worked at least 20 hours
a week. Thus, most MW workers do not leave a nonemployed spouse at home to deal
with the needs of their families. As a manager with 17 years experience explained, “If you
have something going on at home, it is really hard to forget the worries and concentrate
on work issues.” I investigate two sets of factors that should influence workers’ domestic
spillover: (1) family composition and care-giving responsibilities, and (2) job
characteristics that may affect the intrusion of domestic responsibilities at work.
The influence of family and care-giving responsibilities. Workers’ sex, as well
as their family composition and marital status, should influence their vulnerability to
domestic spillover at work. Sex remains the primary determinant of household and
caregiving tasks. Women bear primary responsibility for day-to-day, inflexible household
and childcare tasks (Bond et al. 1998:2; Shelton and John 1996:308; Manke et al.
1994:666; Galinsky et al. 1993:47-50; Shelton 1992:147-8; Leslie et al. 1991:208;
114
Hochschild 1989). Nevertheless, there is conflicting evidence regarding whether home-to-
work spillover is greater for women than men (Ferber and O’Farrell 1991:55). Some
researchers have found that women, as primary caretakers, experience more spillover at
work than men (Galinsky and Bond 1996:97; Friedman 1991:22; Pleck 1985).* Other
research suggests that similarly situated men report as much, if not more, stress and
spillover at work than their female counterparts (Reskin and Flack 1996:16; Barnett
1994:655; Galinsky et al. 1991:112; Bolger et al. 1989). Women and men are rarely
similarly situated, however. In addition, the effect of sex on spillover will reflect gendered
family and household obligations not explicitly measured in the models. Thus, net of other
factors in the models, I expect that women should experience more home-to-work
spillover than men.
The composition of MW employees’ families and their care-giving responsibilities
should also increase their home-to-work spillover. The unpredictable day-to-day needs of
children tend to make caregiving a continuous obligation and on-call work (Spain and
Bianchi 1996:168; Presser 1995b:300), although children o f different ages need different
types of care and supervision (Glass and Estes 1997:292; Friedman 1991:20). And the
needs of dependent elders may be even more variable than those o f children (Ettner
1995:65). Institutional supports outside the workplace are missing, however, for care
givers to children and the elderly (Ettner 1995:66; Galinsky et al. 1991:120-1; Friedman
1991:29-30; Googins 1991:221). Mirroring previous research in work-family conflict, I
expect that workers with children and elder-care responsibilities will be more vulnerable to
* The studies use a variety of measures of home-to-work spillover, none of which is identical to mine.
115
home-to-work spillover than their colleagues without dependents (Reskin and Flack
1996:16; Ferber and O’Farrell 1991:60; Galinsky et al. 1991:119, 123; Friedman
1987:42).
Although researchers assume that marital status affects spillover at work, there is
little evidence about its effect on the frequency that familial and domestic concerns intrude
at work. Having a spouse or partner to integrate into the work-home framework of
obligations may increase respondents' home-to-work spillover because there is an
additional person to whom workers are emotionally and logistically related.^ Conversely,
having a spouse/partner may reduce employees’ domestic spillover by providing
employees with ar. additional resource to address familial and household concerns.
Therefore, I do not predict the effect of being married/partnered on workers’ domestic
spillover.
Three other personal and familial characteristics should affect employees'
vulnerability to home-to-work spillover: workers’ age, the hours per week other
household members are available to assist in familial and household obligations, and
household income. First, I expect that age will have a curvilinear relationship (concave
down) to spillover because workers’ daily involvement with family members increases
with the birth of their children, but daily time devoted to childcare decreases as children
grow older (Robinson and Godbey 1997:191-2; Thompson and Walker 1991:81).
Second, the number of hours other adults in the household are available to share
Women’s household labor, for example, increases seven to nine hours a week when they get married while men’s household labor is unaffected (Shelton 1992:66). In the absence o f children, however, women’s household tasks are likely to be routine, predictable demands.
116
household and care-giving responsibilities (i.e., availability o f spouses or housemates net
of their paid hours at work) should decrease the frequency that respondents worry about
personal, familial, and household concerns. In fact, a nonmanager who lived alone argued
that being alone “is harder—much harder—because you have to leave [work] for
everything.”
Third, workers' household income should also mitigate the disruptive effect that
spillover has on work. Financial pressure is itself a source of spillover. As one
nonmanager argued, “None of us get paid enough..., [and with inadequate income] when
I’m at work, I think... of all my bills.” Moreover, income permits employees to purchase
services that they would otherwise need to perform, such as child care and food
preparation (Hochschild 1997:230-1; Friedman 1991:23; Ferber and O’Farrell 1991:32;
Coverman 1983:632). And the larger the household income, the more affordable are
higher-quality services (Galinsky and Stein 1990:370) that alleviate w o r r y . I n sum, I
expect that the frequency respondents worry about familial and household issues should
have a curvilinear relationship to workers’ age, and spillover should be inversely related to
the temporal and financial resources workers have available to address domestic issues.
The influence of job characteristics. Job flexibility and job demands should also
influence workers’ vulnerability to spillover at work (Jacobs and Gerson 1999:79; Reskin
and Flack 1996:16; Friedman 1991:17-18; Googins 1991:51). For example, research has
found that home-to-work spillover is less likely as employees move up the organizational
Heimer (1996:259) argues that employees are not be able to buy services that alleviate unexpected and emergency circumstances. While this is undoubtedly true to some extent, financial resources enable the purchase of higher-quality goods and services, thus reducing
117
hierarchy (Friedman 1991:24). Thus, two factors associated with organizational status—
autonomy and salary grade— should decrease the frequency that employees’ concerns
about personal, familial, and household issues intrude into the workplace. Autonomy,
indicated by the ability to make job-related decisions, grants employees the discretion to
manage their workloads and address domestic issues as needed. Similarly, net of other
job and personal characteristics, the higher status indicated by salary grade may permit
workers to rearrange their schedules to fulfill domestic obligations, thereby reducing the
frequency of interruption (Friedman 1991:23; Galinsky et al. 1991:85). Status may also
provide employees with buffers such as secretaries and voice mail that limit interruptions
(Nippert-Eng 1996:144). Therefore, insofar as autonomy and status provide workers with
the flexibility to meet competing obligations, they should decrease employees’ work-to-
home spillover.
Alternative work arrangements that provide workers with scheduling flexibility
should also help employees fulfill the dual demands of home and work (Hill et al.
1996:298; Rodgers 1992:197). For example, a male nonmanager, touting the advantages
o f being on a flexible schedule regardless of familial composition, noted that "there are a
lot o f things that you can only take care of during business hours, and if you are working
during business hours, you can’t deal with those other things.” Thus, I expect that
employees’ use o f flextime, CWW, and telecommuting will reduce the frequency that
personal, familial, and household concerns interrupt their work. Yet to the extent that the
the likelihood of their failure. Financial resources also permit workers to reserve back up services for emergency occurrences, such as childcare for snow days.
118
options vary in their flexibility and thus in their ability to help workers address domestic
issues, their effects on spillover may differ.
Finally, two dimensions of employees’ job demands should decrease domestic
interruption at work. Both complex jobs and supervisory roles that involve interacting
with others require greater concentration than other jobs. Therefore, they should be
inversely related to the frequency that external concerns intrude into the workplace.
In sum, job characteristics may affect employees’ vulnerability to spillover in two
ways: by imposing or removing tangible or intangible barriers to the intrusion of domestic
concerns at work, and by providing or denying employees flexibility to address personal,
family, and household issues.
Controls for the analyses of home-to-work spillover. I control for the effects of
division and education on employees’ home-to-work spillover. Division controls for
differences in sampling fractions between the Systems, Actuarial, and Operations units. 1
also control for education, which is associated with factors that may affect spillover, such
as participation in housework and sex role attitudes (Presser 1994:358, South and Spitze
1994:339; Huber and Spitze 1983).“
Sample, Measures, and Method of Analysis
Sample
I used data collected in my employee surveys for the analyses. I excluded four
cases from my analyses because the respondents had missing values on one or both
119
dependent variables. Thus, my analyses of workers’ use of alternative work arrangements
and their home-to-work spillover involved 480 respondents.
Measures
I measured employees’ use of each of the scheduling options with a question that
asked if flextime (or CWW or telecommuting) were available, did respondents personally
use this option? Responses included no (coded I); use of the option without a written
agreement (coded 2); and use of the option with a written agreement (coded 3). I
assigned a no value to respondents who did not have access.
I operationalized the concept of home-to-work spillover as the intrusion of
domestic concerns into the workplace. I measured it with three Likert-like indicators (“In
the past year, how often have you worried about your children or other relative while at
work,” “How often in the past year have your worried about personal, family, or
household issues while at work,” and “In the past year how often have family or
household responsibilities interfered with your ability to devote full attention to your job”).
Responses ranged from never (coded I) to frequently (coded 4). I assigned a value of I to
respondents who replied that the questions were not applicable. The indicators are
substantially intercorrelated with Pearson coefficients averaging about .53.
I measured the estimated levels of departmental use o f the options with items that
asked what would be the largest proportion of workers in respondents’ department who
would be allowed to use flextime/CWW/telecommuting if they wanted to, fi'om none
(coded I) to all (coded 5). I measured hours of household help available to the
" Education typically decreases the time women devote to household tasks and increases the time men devote to household chores.
120
respondent as a linear transformation of number of adults in the household and
spouses’/partners’ hours of work a week at all paid jobs. I assigned adults in the
household a value of 80 hours of availability per week minus the number o f hours they
work per week. I assumed that roommates worked 40 hours per week.
The measures of other job, employee, workgroup factors, and personal and
household characteristics that I used in my analyses of workers’ use of AWAs and their
spillover correspond to the measures that I used in the analyses of access. The sources of
the measures are included in Table 3.1. The measures’ means and standard deviations are
included in Table 3.2, and their correlations are included in Table 3.3. I describe the
estimation of missing values in Appendix F.
Method of Analysis
MW’s assumption that alternative scheduling options help workers balance their
dual obligations implies simultaneous and interdependent outcomes between workers’ use
o f the options and their spillover. Estimation of the determinants of and relationship
between domestic spillover and of each AWA requires two regression equations. Thus,
structural equation models (SEMs) were appropriate for my analyses (Hoyle 1995:1;
Berry 1984:9; Asher 1983:12).
Figure 4.1 is a conceptual model of hypothesized relationships between employees’
home-to-work spillover and their use of flextime, CWW, and telecommuting. I estimated
a nonrecursive model for each alternative work arrangement. 1 used one conceptual
model for all three scheduling options because workers must evaluate the same set of
factors regarding their use of each option, despite differences in the flexibility and hence in
121
the associated risk of using the three AWAs. Similarly, the hypothesized determinants of
domestic spillover were consistent across scheduling options.
[ Figure 4.1 about here - conceptual model ]
As noted, I measured employees’ use of each of the scheduling options with a
question that asks if flextime (or CWW or telecommuting) were available, did respondents
personally use this option. I used analysis of association (Goodman 1987; Eliason 1990;
Clogg and Shihadeh 1994) to obtain scale values for employees’ use of the scheduling
options.'^ The models fit the data well, as their chi squares indicate: the chi square for
workers’ use of flextime is 2.90 with one degree of freedom; for employees’ use of
compressed work week, the chi square is .98 with one degree of freedom; and the chi
square for workers’ use of telecommuting is 1.07 with one degree of freedom. Using the
The values identified by the analysis of association for employees’ use o f a compressed work week are: “no,” coded -.696; “yes, with a written agreement,” coded -.023; and “yes, without a written agreement,” coded .718. Use of flextime: “no” is coded -.646, “yes, with a written agreement” is coded -. 109, and “yes, without a written agreement” is coded .755. Use of telecommuting; “no” is coded -.709, “yes, with a written agreement ” is coded .706, and “yes, without a written agreement” is coded .003.
The order of the values derived using the analysis o f association is not consistent across AWAs. For example, the derived values are in the same order for the use of flextime and CWW. “No” is approximately -.7; “yes, with a written agreement” falls close to zero; and “yes, without a written agreement” is approximately .7 for both AWAs. For telecommuting, “no” is also approximately -.7. However, the order for the two measures of “yes” are reversed: “yes, without a written agreement” is close to zero, and “yes with a written agreement” is approximately .7.
Informants suggested that this difference is due to the nature of the arrangements. That is, flextime and CWW are more widely accepted and used more regularly than telecommuting. Informants also reported that only managers whose styles are “by-the- book” and who are suspicious of their subordinates or the options request written agreements for flextime and CWW. In contrast, employees who telecommute regularly are likely to have formal agreements with their managers, regardless o f managerial style, due to the supervisory and financial issues involved in working ofl-site with company equipment. According to informants and participant observation, however, the majority of
122
values derived by the analysis of association, I could treat employees’ use of each AWA as
a continuous dimension that I analyzed with SEM regression.
The use o f structural equation models also allowed me to operationalize home-to-
work spillover as a latent variable constructed from three indicators. I fixed the first
item’s parameter at one. Therefore, the latent variable spillover was on the same scale as
its measured indicators (MacCallum 1995:23). The proportion of the variance in each
indicator explained by home-to-work spillover in the measurement model is equal to its
squared multiple correlation coefficient (Bollen 1989a:200). With R^s equal to .50, .56,
and .54, the indicators are substantially correlated with the concept.
I included correlated disturbance terms in the models, as well, because it is likely
that I omitted variables from the equations that affect both home-to-work spillover and the
use o f the alternative work arrangements.'^ The models did not include variables whose
causal order with respect to the use of AWAs is ambiguous, such as the ability to work
independently, hours of work per week, and hours spent on household chores and
caregiving.
The degree the options deviate from traditional work arrangements varies. This
variation has implications for the risk workers’ associate with using each, as well as the
flexibility each offers. For example, factors that affect employees’ use of flextime, CWW,
and telecommuting may differ. Therefore, I used three SEMs—one to analyze the
telecommuters are occasional users who do not have formal agreements with their managers.
I tested each equation in the models separately for multicoUinearity using the variance inflation factor (VIE), condition numbers, and variance-decomposition proportions in OLS
123
determinants of and relationship between spillover and each of the alternative work
arrangement. All tests o f significance were at the .05 level.
I constrained the eflfect of flextime on spillover because its effect on spillover was
positive in the initial simultaneous equation model o f the two. Since this is theoretically
improbable, I constrained flextime’s effect to zero, the highest non-positive value possible.
The determinants of spillover in the constrained SEM were generally consistent with the
determinants of spillover in an OLS regression with flextime as an independent variable,
and I report the results o f the constrained SEM for flextime here.*'*
I did not limit my analyses to employees with access to the options for two
reasons. First, restricting the sample to those with access to an AWA would eliminate
many workers who experience spillover. Second, employees’ access to an AWA is a
component, rather a predictor, of their use of option. That is, there is a perfect association
between a subgroup o f workers; those who use the option and those with access to it.
Thus, limiting each analysis to workers with access to the AWA would bias the estimates
o f the eflfect o f its use on domestic spillover and the effect of spillover on its use.
I used the Amos Version 3.6 program for analyses.*’ The maximum likelihood
function provided by the program is the most widely used fitting function for SEMs, with
regressions. MulticoUinearity was not a problem in the OLS analyses o f use or o f home- to-work spillover.
*“* The influence of children ages 6 to 13 was insignificant (P=. 105, SE=.065) in the OLS regression o f spillover when I constrained flextime’s influence to zero. The effects o f the other variables in the OLS model were consistent with their effects in the simultaneous equation model.
124
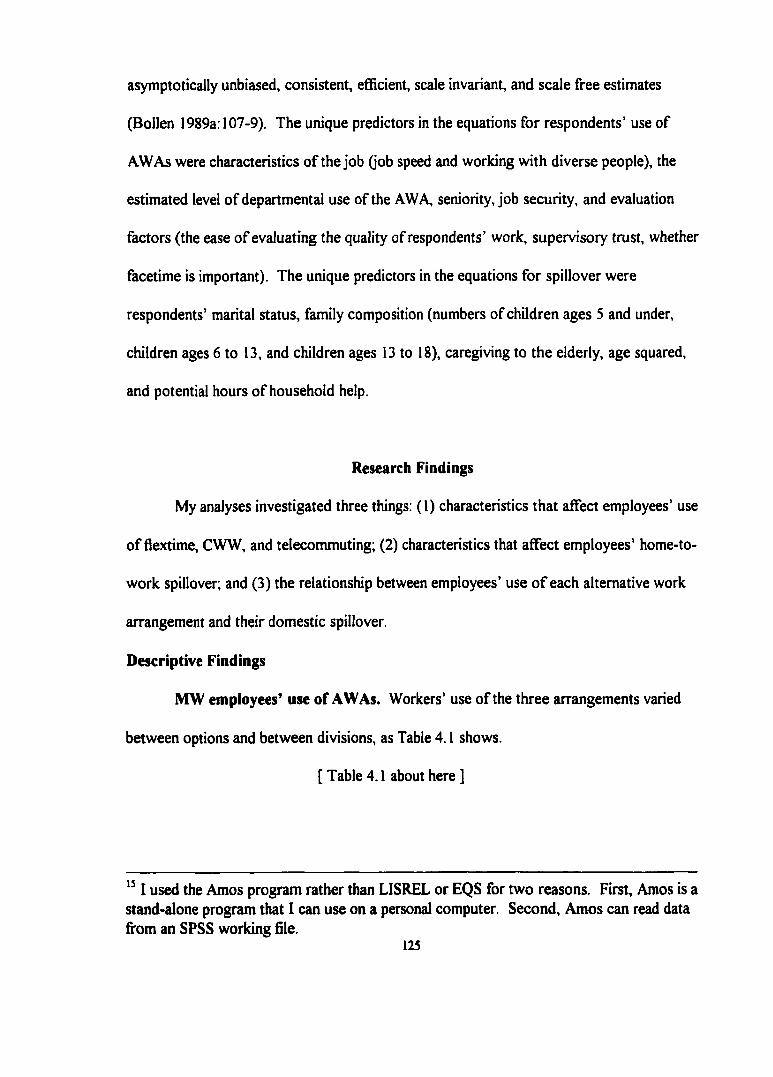
asymptotically unbiased, consistent, efficient, scale invariant, and scale free estimates
(Bollen 1989a: 107-9). The unique predictors in the equations for respondents’ use of
AWAs were characteristics of the job (job speed and working with diverse people), the
estimated level of departmental use of the AWA seniority, job security, and evaluation
factors (the ease o f evaluating the quality of respondents’ work, supervisory trust, whether
facetime is important). The unique predictors in the equations for spillover were
respondents’ marital status, family composition (numbers of children ages 5 and under,
children ages 6 to 13, and children ages 13 to 18), caregiving to the elderly, age squared,
and potential hours o f household help.
Research Findings
My analyses investigated three things: (1) characteristics that affect employees’ use
o f flextime, CWW, and telecommuting; (2) characteristics that affect employees’ home-to-
work spillover; and (3) the relationship between employees’ use o f each alternative work
arrangement and their domestic spillover.
Descriptive Findings
MW employees’ use of AWAs. Workers’ use of the three arrangements varied
between options and between divisions, as Table 4.1 shows.
[ Table 4.1 about here ]
I used the Amos program rather than LISREL or EQS for two reasons. First, Amos is a stand-alone program that I can use on a personal computer. Second, Amos can read data from an SPSS working file.
125
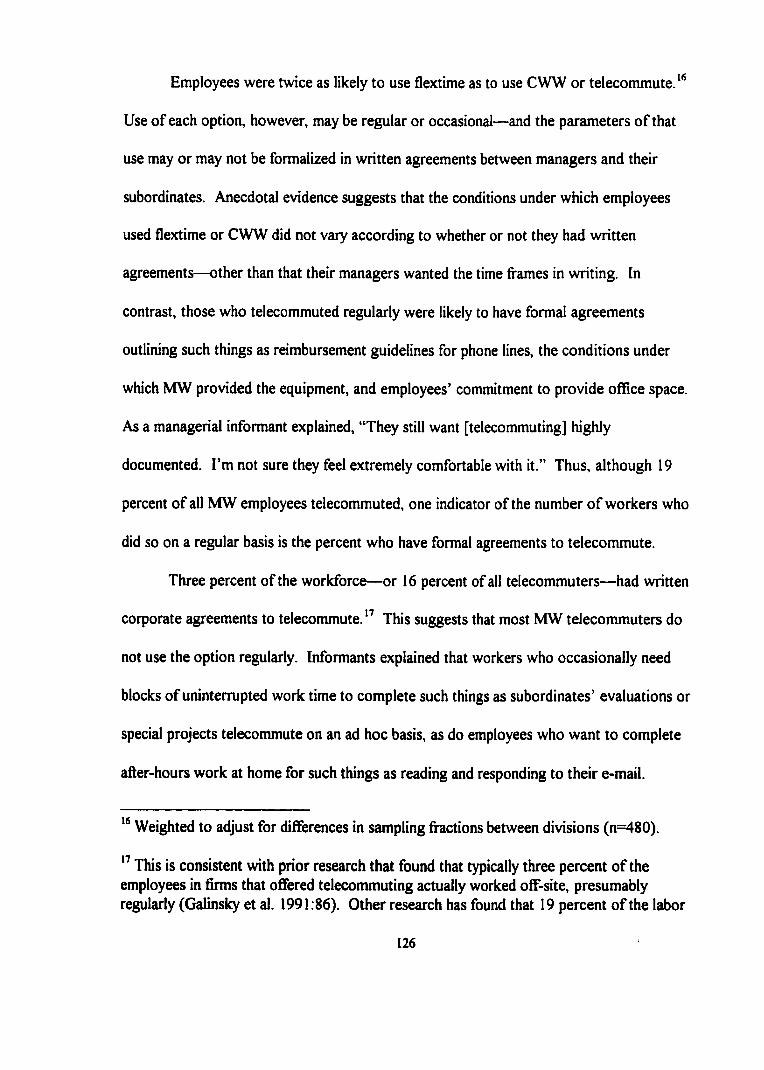
Employees were twice as likely to use flextime as to use CWW or telecommute/**
Use of each option, however, may be regular or occasional—and the parameters o f that
use may or may not be formalized in written agreements between managers and their
subordinates. Anecdotal evidence suggests that the conditions under which employees
used flextime or CWW did not vary according to whether or not they had written
agreements—other than that their managers wanted the time frames in writing. In
contrast, those who telecommuted regularly were likely to have formal agreements
outlining such things as reimbursement guidelines for phone lines, the conditions under
which MW provided the equipment, and employees’ commitment to provide office space.
As a managerial informant explained, “They still want [telecommuting] highly
documented. I’m not sure they feel extremely comfortable with it.” Thus, although 19
percent o f all MW employees telecommuted, one indicator of the number o f workers who
did so on a regular basis is the percent who have formal agreements to telecommute.
Three percent of the workforce—or 16 percent of all telecommuters—had written
corporate agreements to telecommute.*’ This suggests that most MW telecommuters do
not use the option regularly. Informants explained that workers who occasionally need
blocks of uninterrupted work time to complete such things as subordinates’ evaluations or
special projects telecommute on an ad hoc basis, as do employees who want to complete
after-hours work at home for such things as reading and responding to their e-mail.
*® Weighted to adjust for differences in sampling fractions between divisions (n=480).
*’ This is consistent with prior research that found that typically three percent of the employees in firms that offered telecommuting actually worked oflf-site, presumably regularly (Galinsky et al. 1991:86). Other research has found that 19 percent o f the labor
126
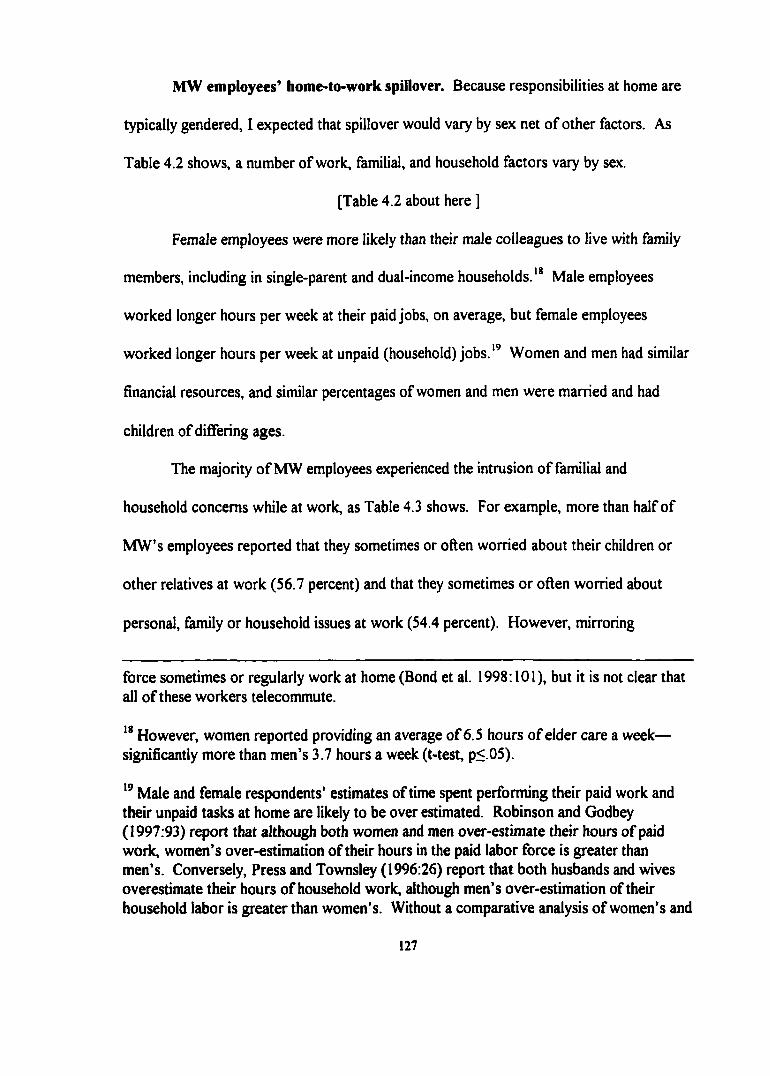
MW employees’ home-to-work spillover. Because responsibilities at home are
typically gendered, I expected that spillover would vary by sex net of other factors. As
Table 4.2 shows, a number of work, familial, and household factors vary by sex.
[Table 4.2 about here ]
Female employees were more likely than their male colleagues to live with family
members, including in single-parent and dual-income households.** Male employees
worked longer hours per week at their paid jobs, on average, but female employees
worked longer hours per week at unpaid (household) jobs.*® Women and men had similar
financial resources, and similar percentages of women and men were married and had
children of differing ages.
The majority o f MW employees experienced the intrusion of familial and
household concerns while at work, as Table 4.3 shows. For example, more than half of
MW’s employees reported that they sometimes or often worried about their children or
other relatives at work (56.7 percent) and that they sometimes or often worried about
personal, family or household issues at work (54.4 percent). However, mirroring
force sometimes or regularly work at home (Bond et al. 1998; 101), but it is not clear that all of these workers telecommute.
** However, women reported providing an average of 6.5 hours o f elder care a week— significantly more than men’s 3.7 hours a week (t-test, p< 05).
*® Male and female respondents’ estimates of time spent performing their paid work and their unpaid tasks at home are likely to be over estimated. Robinson and Godbey (1997:93) report that although both women and men over-estimate their hours of paid work, women’s over-estimation of their hours in the paid labor force is greater than men’s. Conversely, Press and Townsley (1996:26) report that both husbands and wives overestimate their hours of household work, although men’s over-estimation of their household labor is greater than women’s. Without a comparative analysis of women’s and
127
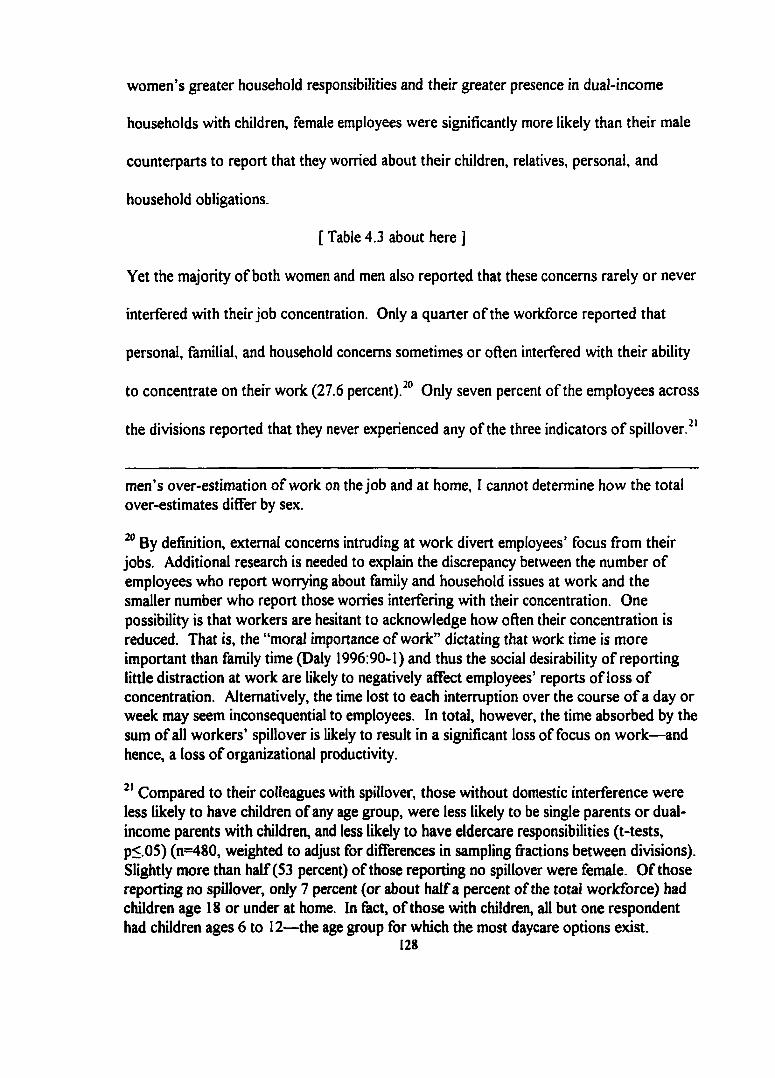
women’s greater household responsibilities and their greater presence in dual-income
households with children, female employees were significantly more likely than their male
counterparts to report that they worried about their children, relatives, personal, and
household obligations.
[ Table 4.3 about here ]
Yet the majority o f both women and men also reported that these concerns rarely or never
interfered with their job concentration. Only a quarter of the workforce reported that
personal, familial, and household concerns sometimes or often interfered with their ability
to concentrate on their work (27.6 percent).^" Only seven percent of the employees across
the divisions reported that they never experienced any of the three indicators of spillover.^'
men’s over-estimation of work on the job and at home, I cannot determine how the total over-estimates diflfer by sex.
By definition, external concerns intruding at work divert employees’ focus from their jobs. Additional research is needed to explain the discrepancy between the number of employees who report worrying about family and household issues at work and the smaller number who report those worries interfering with their concentration. One possibility is that workers are hesitant to acknowledge how often their concentration is reduced. That is, the “moral importance of work” dictating that work time is more important than family time (Daly 1996:90-1) and thus the social desirability o f reporting little distraction at work are likely to negatively affect employees’ reports of loss o f concentration. Alternatively, the time lost to each interruption over the course o f a day or week may seem inconsequential to employees. In total, however, the time absorbed by the sum of all workers’ spillover is likely to result in a significant loss of focus on work—and hence, a loss of organizational productivity.
Compared to their colleagues with spillover, those without domestic interference were less likely to have children of any age group, were less likely to be single parents or dualincome parents with children, and less likely to have eldercare responsibilities (t-tests, p<05) (n=480, weighted to adjust for differences in sampling fi*actions between divisions). Slightly more than half (53 percent) of those reporting no spillover were female. O f those reporting no spillover, only 7 percent (or about half a percent of the total workforce) had clüldren age 18 or under at home. In fact, of those with children, all but one respondent had children ages 6 to 12—the age group for which the most daycare options exist.
128
Determinants of Employees’ Use of AWAs
I expected that three sets of factors would influence workers’ use of AWAs. First,
I hypothesized that the nature of employees’ jobs and their job demands would influence
employees’ ability and need to use the options. Second, because management often links
employees’ use of AWAs with reduced commitment and productivity, I expected that
variables associated with the perceived risk of using the AWAs would influence the use of
AWAs. These include attributes of (1) employees’ evaluation process, (2) proxies for
their productivity, and (3) contextual factors. Third, I hypothesized that personal and
household factors would affect employees’ need to use MW’s alternative work
arrangements.
Analyses of the simultaneous equation models provide three summary conclusions
that I explore more fully in the Discussion section. First, the context in which employees
work is a key influence on workers’ use of AWAs. Second, the determinants of
employees’ use of flextime, CWW, and telecommuting vary between options. Third,
although employees’ home-to-work spillover stems primarily from workers’ personal
status, familial, and care-giving responsibilities, job flexibility can mitigate the intrusion of
domestic concerns into the workplace.
Figures 4.2 to 4.4 depict the causal models for the reciprocal effects of employees’
home-to-work spillover and their use of flextime, CWW, and telecommuting, respectively.
[Figure 4.2 about here]
About nine percent had eldercare responsibilities and 61 percent were married. Just over half of those reporting no spillover (S4 percent) had spouses or partners who worked for pay.
129
[Figure 4.3 about here]
[Figure 4.4 about here]
I report the SEM regression results for the equations o f employees’ use of
flextime, CWW, and telecommuting in Table 4.4 and the SEM regression results for the
equations for home-to-work spillover in Table 4.5.^ In both tables, I report the
coeflBcients for the model incorporating flextime in column three, the coefficients for the
CWW model in column four, and the coefficients for the model with telecommuting in
column five. The measures of fit indicate that the models fit the data well.“
[ Table 4.4 about here ]
[ Table 4.5 about here ]
“ I initially tested for the additive effects o f sex in the equation o f workers’ use of AWAs and the additive effects of sex and marital status in the spillover equations. None had consistent effects across models, which suggests that any effect capitalized on chance. Therefore, I did not include them in the final analyses.
^ Following Hoyle (1995:15), I evaluated the models to the observed data using five goodness-of-fit tests. The test, the most common index of fit, is sensitive to sample size and number of variables in the models, and thus is an inadequate statistical test of model fit (for a summary of the discussion see Hoyle 1995). Consequently, I report four additional measures of fit. Two measures compare a baseline (or independence) model with the estimated model (Arbuckle 1997:563). (1) IFI is Bollen’s (1989b) incremental fit index. IFI values close to 1 indicate a good fit. (2) NFI: The Bentler-Bonett (1980) normed fit index. NFI values close to 1 indicate a good fit. Another measure is the AGFI, or adjusted goodness of fit index. The AGFI is a variation of Joreskog and Sorbom’s goodness o f fit index (1984) that takes into account the degrees o f freedom available for testing the model. The upper limit o f the AGFI is one, indicating a perfect fit. The measure is not bounded below by zero, however. The last goodness-of-fit measure is RMSEA and CI(90), which together are a measure of model adequacy that compensates for the effect o f model complexity (MacCallum 1995:30). RMSEA is the root mean square error of approximation. A RMSEA of about .05 or less indicates a close fit of the model relative to its degrees of fi-eedom, with up to .08 or less indicating a reasonable error o f approximation (Browne and Cudeck 1993). I indicate the lower and upper limits o f a 90-percent confidence interval on the population value by (LO 90) and (HI 90).
130
Determinants of workers’ use of flextime. I found evidence that the nature of
workers’ jobs, the context in which employees worked, and employees’ personal status
influenced their use o f flextime, although not always as I had hypothesized (Table 4.4,
column three). As expected, workers’ autonomy increased employees’ use of the option.
Contrary to my hypothesis, however, organizational status also had a positive effect on the
use of flextime. Both contextual factors were important. The perceived level of flextime
use in respondents’ department was positively associated with respondents’ use o f the
option. In addition, location within the firm played a role in use of the AW A: workers in
the Systems division used flextime less than their colleagues in the Operations division.
The sole personal or household characteristic that affected flextime use was workers’ sex.
In contrast to my hypothesis, women used flextime less than similarly situated men (one
tailed, p< 05). The demands of workers’ jobs, job interdependency, the proxies for
productivity, evaluation factors, household income, and employees’ home-to-work
spillover had no influence on workers’ use of flextime.
Determinants of workers’ use of compressed work weeks. The nature and
demands of workers’ jobs, contextual factors at work, other factors influencing perceived
risk, and personal and household characteristics all played a role in employees’ decisions
to use CWW, as expected (Table 4.4, column four). In terms of the nature and demands
o f jobs, job complexity was positively related to workers’ use of the option, while
supervisory responsibility was negatively related to its use. One contextual factor, the
acceptability of CWW in respondents’ departments (indicated by the estimated levels of
use), increased workers’ use of the option. Two other measures associated with the
131
perceived risk of using CWW were important. Workers’ perception that they were
evaluated on the basis of facetime decreased the likelihood that they would use the AW A.
However, education (a proxy for productivity) increased respondents’ use. And
consistent with my hypotheses for the effects of personal and household characteristics,
women were more likely to use the option than similarly situated men, while increased
household income decreased employees’ use of CWW. Contrary to expectations,
however, a number of factors had no influence; jobs that required speed and those that
involved working with diverse people, workers’ status and autonomy, division, workers’
seniority and job security, and the ease of evaluating the quality o f respondents’ work and
the perceived supervisory trust.
Determinants of workers’ telecommuting. Employees’ home-to-work spillover
and four factors associated with the perceived risk of telecommuting influenced workers’
decisions to telecommute, as hypothesized (Table 4.4, column five). Workers’ domestic
spillover increased their use o f the option. Similarly, two contextual indicators influenced
MW employees’ decisions to telecommute. The estimated level o f use in respondents’
departments was positively related to workers’ use. In addition, division was important:
Systems workers telecommuted more than their Operations counterparts. One proxy for
productivity—experience—also increased the likelihood o f telecommuting, as expected.
However, employees who believed facetime was important to their evaluations were less
likely to telecommute than other employees. The demands of workers’ jobs, the
interdependence of jobs, workers’ status and autonomy, workers’ education and job
security, the ease of evaluating the quality o f respondents’ work and the perceived trust of
132
their supervisors, respondents’ sex, and household income had no influence on
employees’ decisions to telecommute.
Summary. As expected, the nature of workers’ jobs, factors associated with the
perceived risk of using the options, and employees’ sex, domestic spillover, and household
income affected workers’ use of AW As. With the exception of the effect of the estimated
levels of use, however, the variables inconsistently influenced workers’ use of flextime,
CWW, and telecommuting.
Determinants of Employees’ Work-to-Bome Spillover
The influence of personal and household characteristics. As expected,
personal and familial characteristics were consistently important determinants of
employees’ home-to-work spillover (see Table 4.5, Personal/Household Characteristics
panel). Women, traditionally the primary emotional and physical care-givers in families,
experienced more spillover than similarly situated men. Thus, the bivariate patterns
between workers’ sex and their spillover remained stable in the reciprocal analyses net of
all other variables in the models.
My survey is based on respondents’ self reports, limiting my data to employees’
perceptions, however. Respondents’ reports o f the frequency they experience home-to-
work spillover thus may be overestimated or underestimated, as are time estimates o f paid
employment or housework, (Robinson and Godbey 1997; Press and Townsley 1996). If
employees consistently over- or underestimated domestic spillover, this limitation should
133
not influence the general pattern that women experience more spillover than similarly
situated men. **
Family composition and care-giving responsibilities also affected the likelihood of
spillover. Having minor children, regardless of age group, increased employees’ spillover
at work. Indeed, the presence of children ages 5 and under was a strong predictor of
spillover in all three equations (flextime Beta=.303, CWW Beta=.303, and telecommuting
Beta=.338). Similarly, employees who provided elder care also experienced more
spillover than their non-caregiving counterparts. These determinants help explain the
demographics of workers who had no spillover. Those reporting no spillover had no
preschoolers or teens at home, and comparatively few elementary-age children and elder-
care responsibilities.
Being married or partnered, however, had no net influence on employees’
spillover. This nonsignificant finding could be the result of off-setting effects: having a
The more familiar respondents are with events and tasks, the more accurate are the estimates of time and frequency (Robinson and Godbey 1997; Press and Townsley 1994). Thus, research has found that men’s overestimation of time at work is less than women’s (Robinson an Godbey 1997:93), and women’s overestimation of time spent on household tasks is less than men’s (Press and Townsley 1996:26). Extending this pattern to home- to-work spillover, if respondents’ estimates of spillover are overestimated, the gap between women’s estimates and reality is likely to be smaller than men’s because women are more familiar with care-giving and household tasks. That is, women have greater responsibility for domestic obligations, are more likely to shape their work around their familial obligations due to the potential for spillover, and are more likely to miss work due to problems with childcare than their male counterparts (Presser I995a:592; Presser I995b:313). Thus, the general pattern o f the effect of sex on spillover remains the same if respondents overestimate spillover.
As noted, however, the moral importance of work and the social desirability o f not acknowledging that home interferes with work are likely to negatively affect employees’ reports o f spillover. This implies that respondents’ reports of spillover may be underestimated. However, underestimation of spillover would not affect my conclusion
134
spouse or partner should increase workers’ domestic obligations and concerns, while
simultaneously providing a partner to help address personal and household issues.
As expected, age had a curvilinear relationship (concave down) with home-to-
work spillover for the SEMs with flextime and CWW. That is, employees’ spillover
typically increased at a decreasing rate until they reached age 33 (in model with flextime)
and age 34 (in the model with CWW). Workers’ spillover then began decreasing at an
increasing rate.^* Age did not have a curvilinear effect in the model of spillover with
telecommuting.^
My analyses found no support for the hypotheses that household resources affect
the frequency that employees worry about their personal, familial, and household
obligations at work. Neither household income nor the amount of time other household
members were available to provide assistance was related to spillover. Thus, although
financial and temporal resources should reduce workers’ routine obligations for which
substitutes can be purchased or that others can perform, such resources are not likely to
mitigate workers’ intangible concerns grounded in emotional ties—particularly concerns
that involve pressing issues with family and fiiends.
about the effect of sex on spillover if women and men equally underestimate the frequency of spillover.
^ In the SEM with flextime, the coefiicient of age on spillover for employees 20 years old was P=.026; for employees 60 years old, P=-.054. In the SEM with CWW, the coefficient of age on spillover for employees 20 years old was P=.028; for employees 60 years old, P=-.052.
Therefore, I report the results of the spillover model incorporating telecommuting with a linear specification of age for parsimony.
I also investigated the possibility that respondents’ age would have a curvilinear effect on their use o f AW As (analyses not shown), but it did not.
135
Consistent with MW’s intent, however, the analyses provide evidence that flexible
work arrangements are effective strategies to reduce work-home conflict. Indeed,
employees’ use of CWW (Beta= -.428) and telecommuting (Beta= -.297) were
comparatively strong determinants of the intrusion of personal, familial, and care-giving
concerns at work. Thus, workers who used CWW and telecommuting reduced their
home-to-work spillover and were presumably able to concentrate more fully on their jobs.
In addition to flexibility in job scheduling, flexibility on the job reduces workers’
domestic spillover. For example, employees’ ability to make job-related decisions
consistently reduced spillover in each model of spillover. Indicators o f job demands and
status, however, had no net influence on domestic spillover in the simultaneous equation
models. Therefore, I found no evidence that job factors other than flexibility aggravate or
mitigate employees’ spillover.
Summary. My analyses show that the frequency that domestic concerns intrude
into the workplace stems primarily from workers’ sex, family circumstances, and care-
giving responsibilities. Although indicators of job demands had no influence, flexibility at
work—particularly the use of CWW and telecommuting—reduced home-to-work
spillover, just as the AW As were designed to do.
Discussion
In this chapter I used three structural equation models to investigate the
determinants of workers’ use of the three scheduling options outlined by MW’s work-
136
home policy, the determinants of their home-to-work spillover, and the interdependent
relationship between the two outcomes. I draw three conclusions from the analyses.
Work Context Is Important
Confirming previous research, I found strong support for the hypothesis that the
context in which employees work affects employees’ use of alternative work
arrangements. I investigated the influence of two contextual factors; division within the
firm and the estimated levels o f use in respondents’ departments for the options. As
expected, the organizational attributes captured by division influenced employees’ use of
the options, although the influence was inconsistent between AW As. Systems workers
used flextime less than their counterparts in Operations, minimally supporting prior
research that workers may be perceived as unprofessional if they use alternative work
arrangements (Hochschild 1999:97; Seller 1996:56; Rodgers 1992:194; Schwartz
1994:31). But perhaps not surprisingly, as the most technologically advanced (and
equipped) workgroup in the company. Systems employees telecommuted more than
Operations workers, albeit with greater access to the option.
The estimated departmental level of use, the second contextual factor, captures the
perceived collective support o f managers. It, too, affected MW employees’ use of the
scheduling options. In fact, the estimated levels of use were among the strongest
predictors of workers’ use of flextime (Beta=.316), CWW (Beta=.245), and
telecommuting (Beta=.327)—and the only indicator that had a consistent effect on each
137
option.^’ As expected, the more normative use of an alternative arrangement was in
employees’ departments, the more likely workers were to risk using the option. However,
it is probable that this, in part, reflects a selection eflfect: workers may transfer to
departments where options are available, as noted in Chapter 3, and where use of the
options is accepted.^^
Determinants of AW As
Second, the determinants of employees’ use of AW As vary between options
except for the consistent positive effect of the estimated departmental levels o f use. For
example, characteristics of workers’ jobs and workers’ position in the organizational
hierarchy inconsistently aflfected employees’ decisions to use the options (Table 4.4, Job
Factors Influencing Need and Ability to Use AW As panel). The influence of job demands
and job interdependence was restricted to employees’ use of CWW. Similarly, employees’
organizational status and autonomy influenced only their use of flextime. None of the
indicators of job factors related to employees’ need and ability to use AW As influenced
workers’ decisions to telecommute. Thus, I found limited support for the hypothesis that
interdependent jobs decrease employees’ use of AW As. I found no support for the
hypothesis that organizational status decreases use o f the options because the effect of
status on flextime use was positive. I also found only minimal support for the hypotheses
In OLS regressions o f workers’ use of the options limited to those with access (not shown), the level of departmental use was also the only variable that consistently aflfected the three options.
I will explore further the importance of employees’ self selection and transfers in fliture focus groups and interviews.
138
that demanding jobs and those providing autonomy were associated with increased use of
AWAs.
Factors associated with the perceived risks of using the options also had
inconsistent effects on employees’ use of AWAs (Table 4.4, Job Factors Related to
Perceived Risk panel). Division was important to workers’ use of flextime and
telecommuting, but its effects differed between divisions and options. Facetime, the sole
factor related to workers’ evaluation that had influence, adversely affected the use o f both
CWW and telecommuting, but it had no effect on the use of flextime. The variable’s
negative effects were centered, then, on the two options that most noticeably reduce the
traditional time that workers spend in the office. This finding may reflect the increased
risk employees associate with using options that take them from the office for the
comparatively large blocks of time that CWW and telecommuting offer if managers
evaluate workers on the basis of time spent in the office. The effects of the two proxies
for productivity were limited to education’s positive relationship with workers’ use of
CWW and seniority’s positive relationship with employees’ telecommuting. Like the
evaluation factors, neither proxy influenced employees’ use of flextime, the option that
deviates the least from traditional hours and location of work. Thus, the analyses
provided moderate support for the hypothesis that factors that reduce the perceived risk
associated with using the options are influential, but they provide little support for the idea
that workers use the options as retention strategies.
Finally, evidence that personal and household characteristics influenced workers’
use o f flextime, CWW, and telecommuting varied between options (Table 4.4,
139
Personal/Household Characteristics panel). Spillover’s sole eflfect was its positive
influence on telecommuting, the option offering workers the most opportunity to
interweave work and home responsibilities. Household income was important, but only to
workers’ use of CWW. In contrast, sex influenced both the use of flextime and of CWW,
but in opposite ways.
Explanation. The degree that each option deviates from traditional work
arrangements—and hence the degree of flexibility each option offers to meet workers’
needs and the implicit differences in perceived risk of using the various options—help
explain the variation in AWAs’ determinants. Each option offers a different degree of
flexibility. In terms of workers’ use, then, the desirability o f an option and its ability to
reduce spillover depend on the congruence between users’ need and the flexibility the
option offers (Christensen and Staines 1990:471; Bohen and Viveros-Long 1981:147).
Flextime allows employees to address domestic concerns at the beginning or end of the
day. With limited flexibility, the option offers the least benefit to employees with family
responsibilities, the basis for home-to-work spillover (Galinsky et al. 1991:130; Presser
1989:534; Bohen and Viveros-Long 1981). In contrast, CWW schedules provide workers
with a comparatively larger weekly or biweekly block of time in which to attend to
personal and familial concerns. However, CWW employees must be available on their
days off for work—and may lose that time, which limits the inherent flexibility the option
purports to offer. As one nonmanager explained, “[Managers] can cancel your CWW.
They can call you up that morning or the night before.” A manager agreed: “If you use
140
CWW... then you are to be at home on [your day oflf] in case of an emergency or they
need you. ...You have these constraints. What was the advantage of the CWW?”^
Informants across divisions welcomed telecommuting as a strategy allowing them
to be available to their families at opportune times. Workers typically telecommuted on an
ad hoc basis rather than as their regular work arrangement, however. Nevertheless, a
manager who occasionally worked from home praised telecommuting’s flexibility: “Iff
need to work at home [in the morning so I can] take my son to the doctor, I can do that.
[My boss] has set up a number of people in our area with a home office for that situation.”
Another manager occasionally and informally allowed her subordinates to telecommute:
“We don’t have anyone that [regularly] works at home. When [telecommuting] has been
done, it has been on a very informal basis. Something may come up and a person.. .call(s)
in and ask(s) to work at home for the day.” Thus, telecommuting allows MW workers to
integrate their home and work obligations, even if the option is used only on a short-term
basis.
Finally, MW employees understand that some managers believe subordinates’ use
o f alternative work arrangements make managers’ jobs more complex (see Table 3.5, right
column)—and that complexity, in turn, may affect their own jobs and evaluations. One
nonmanager noted that AWAs frustrate her boss, and “when he gets frustrated, I get
^ Informants who used the option fell into five main groups: (I) caregivers who used their day off to take chronically ill spouses, children, or parents to doctors’ appointments; (2) employees with long commutes; (3) employees who had been working long hours without comp time, and who thus used the option to reduce their workweek to approximately 40 hours; (4) employees who used it for childcare-related reasons (e.g., to give their spouses a day off or to be with their children during the daytime over summer break); and (5) employees who found it convenient to have a large block of time on a weekday to attend to personal and household tasks.
141
frustrated.... When he is happy. I’m happy. It makes my job a lot easier.” Similarly,
another informant described how a coworker on CWW “drives my boss nuts” on the days
the coworker is not in the office—a reaction that implicitly inhibits others’ use. And
presumably the more an option deviates from traditional hours and location, the more
complex supervision becomes. A manager who was opposed to CWW because the
different schedules “make my team’s job more difficult” also believed that “flextime does
not affect scheduling at all.” In terms of managers’ experience overseeing telecommuters,
one nonmanager summarized the consensus among informants; “A few people, not in my
area.. .come in one day a week and work at home the rest. I know that [telecommuting] is
available and people have taken advantage of it, but I don’t know a lot of people who
have.” “ Another manager acknowledged that “it is harder to evaluate someone when they
are not on site. You can’t just sit down and see how they are doing. You actually have to
schedule a meeting.” In sum, concerns about AWAs’ effect on supervision (and by
implication, on employees’ productivity) are reflected in the differences in managerial
support for and workers’ access to the options—and thus in the risk employees associate
with their use. The variation in risk between options, then, is likely to influence the
determinants of the options’ use.
The variation in flexibility between options, as well as differences in perceived risk
associated with their use, may also explain men’s greater use o f flextime and women’s
greater use of CWW. Insofar as paid employment is central to the identity of more men
than women (Ferber and O’Farrell 1991:44), men have more at stake in maintaining the
As noted, technical considerations also restrict telecommuting because the technology to allow workers to regularly telecommute (rather than on an ad hoc basis) is still not
142
appearance of commitment to work. Conversely, to the extent that parental identity is
more salient to women than men (Simon 1992) and their household responsibilities are
greater, women have more at stake in meeting their household obligations. Thus, men—
who presumably need less flexibility to meet home-based obligations—may prefer flextime
which offers comparatively little risk, while women may need the greater flexibility that
CWW offers, regardless of risk.
In sum, the saliency of job and personal characteristics should vary between
options for two reasons. First, flextime, CWW, and telecommuting offer different degrees
of flexibility that appeal to workers with differing needs, whether those needs are related
to spillover or not. Second, the perceived risk associated with using the options should
also vary between options and contribute to the variation in their determinants.
The Nature of Home-to-Work Spillover
My third conclusion is that home-to-work spillover stems primarily from domestic
obligations, but alternative work arrangements are effective strategies that reduce the
intrusion o f domestic concerns into the workplace. As expected, workers’ family
composition, their responsibilities to the elderly, and being female rather than male
increased the likelihood of experiencing domestic spillover. Indeed, the strongest
determinant of spillover in the flextime and telecommuting models was the presence of
children ages 5 and under, and it was the second strongest predictor o f spillover in the
CWW model. It may be that the diflSculties parents face with preschoolers’ childcare
needs underlie the strength o f the influence of children ages 5 and under on spillover, as
previous research has suggested (Bond et al. 1998; 137; Galinsky et al. 1993:65; Galinsky
uniformly available throughout MW. 143
et al. 1991:116). Moreover, researchers have suggested that men’s home-to-work
spillover is comparatively low because women’s is comparatively high. That is, if women
assume responsibility for domestic concerns during the working day, men do not have to
(Emlen and Koren 1984). Workers’ financial and temporal resources, however, had no
net effects on spillover. One explanation for this lack of influence may be that home-to-
work spillover—a measure of employees’ intangible emotional concern—differs in nature
from other, more concrete indictors of home-to-work conflict such as tardiness and
absenteeism. Thus, whereas employees may purchase or find substitutes to perform tasks
that interfere with their work, even the substitution of services may not be able to
significantly alleviate employees’ worry about their external responsibilities.
Job factors that provide flexibility at work decrease the intrusion o f domestic
issues on the job, as expected. Because domestic spillover is negatively related to job
performance, employers and managers should welcome evidence that job autonomy and
the use of CWW and telecommuting significantly decrease the fi-equency that employees’
personal, familial, and household concerns intrude at work. That flextime was not an
effective strategy to reduce spillover, however, is evidence that alternative work
arrangements vary in their usefulness to employees experiencing work-home conflict.
However, I have assumed that employees’ spillover precedes and induces employees to
use alternative work arrangements, and I used cross-sectional data based on that
assumption. But spillover is not static and will increase or decrease over time as workers’
involvement with, and concerns about, family and fiiends change— regardless of
employees’ schedules. Thus, workers who use flextime, the option offering the least
144
flexibility, may find that it is inadequate to blunt the demands of increasing work-home
conflict/'
Conclusion
Social scientists, employers, and employees have assumed that work-home conflict
and the use of flexible scheduling options are related, but my analyses suggest that the
nature of that relationship depends on the scheduling option used. For example, the
relationship between workers’ use of CWW and their spillover was recursive: CWW
arrangements decreased employees’ home-to-work spillover, but spillover did not increase
workers’ use of CWW arrangements. The relationship between MW employees’
telecommuting and their home-to-work spillover was reciprocal: telecommuting decreased
their spillover, and their spillover increased the likelihood that they would telecommute.
Flextime and spillover, however, had no significant relationship. Thus, spillover differently
affects employees’ use of AWAs, and the options’ effects on spillover vary.^^
The variation in the options’ ability to reduce spillover is likely to be grounded in
the degree of flexibility each offers. However, alternative work arrangements’ ability to
help workers achieve balance is compromised if employees use the options for work-
In addition, more workers have access to the flextime than other AWAs. Thus, many workers with spillover are constrained by access to use flextime for issues that may not be amenable to the limited flexibility the option offers.
I have investigated the effect of one facet of work-home conflict, home-to-work spillover, on workers’ use o f the options. A complete assessment o f the relationships between work-home conflict and AWAs would involve employees’ use o f AWAs in reciprocal models o f worWo-home spillover. Work-to-home spillover should have a greater influence on workers’ use o f AWAs than home-to-work spillover because it is more prevalent (Bond et al. 1998:116; Leiter and Dump 1996:41; Galinsky et al.l993:71).
145
related reasons, such as mandatory overtime. Yet a number of informants using flextime
began their workdays early in order to complete required overtime and still be finished by
the end of the traditional workday. Informants on CWW also used the option to reduce
their overtime. That is, what had been overtime with a traditional schedule became the
normal workday with a CWW—but the employees were then able to end their workweeks
early.^ Similarly, informants who telecommuted on an ad hoc basis frequently did so to
reduce their overtime at the worksite, not their total time working. As one nonmanager
explained, “Telecommuting in my area is only for after-hours work or when on vacation at
home.... [It] would be nice to have it as an option for a normal day.” Echoing this, a
single manager with custody of his children explained, “I have home access where I can
dial in to work. Even on days that I’m off, I can do a lot of things. . . making sure people
are getting what they need and answering questions.” However, to the extent that the
scheduling options are used to complete mandatory overtime work, they are primarily a
work policy.
Managers play critical roles in the implementation of MW’s work-home policy,
both in workers’ access to and use of flexible scheduling options. In addition to the ill will
among workers stemming from their inequitable access to AWAs, unsolicited anecdotal
evidence also suggests that some managers lack the skills necessary to successfully
oversee and coordinate work between employees on traditional and alternative
arrangements. Managerial ineptitude causes resentment for two groups of workers; those
This is also beneficial to the company. An Operations manager decried the expected weekly hours worked of 60 to 70 hours a month without comp time: “Burnout is common among managers...[but] team members were given the option to work CWW schedules in order to reduce the level of overtime, and it worked.”
146
whose jobs are complicated by their managers’ inability to plan for and coordinate work,
and those whose colleagues misuse AWAs. "* First, both employees who used alternative
work arrangements and those who did not resented extended work hours stemming from
the uneven flow o f work. Managers and nonmanagers noted that employees on CWW
schedules could have their days off canceled if the work flow increased. As one worker
complained, “They can call you up that morning or the night before and tell you that you
are not going to get the day off.” Another employee chose not to use a compressed work
week because “if I took advantage of CWW, I was expected to be available on all days
off.” Others charged that employees working standard schedules also paid a price for the
uneven flow of work and lack of coordination between workers. An Actuarial manager
on flextime noted that “management has been very unsuccessful at balancing flexible work
schedules with necessary overtime. People not on CWW are required to work overtime
with little if any compensation, while those on CWW get their days off. This has created a
great deal o f resentment.” In sum, the unpredictable flow of work that causes unplanned
overtime precipitates the resentment of workers, whether or not they are using alternative
work arrangements. Although this is, in part, determined by external clients, informants
argued that managers’ lack of skill and the resulting inability to coordinate work between
employees on traditional and alternative schedules exacerbate the problem.
A second criticism among informants about coworkers’ use of AWAs was that
managers did not hold employees who abused the options accountable. For example, an
^ Eleven survey respondents and three o f the four focus groups raised the issue o f overtime grounded in uneven and poorly planned work. Six survey respondents and three focus groups commented on coworkers’ unchecked abuse of AWAs.
147
Operations manager witnessed “a number of people routinely abusing the flexible
scheduling options ...with an adverse eflfect on productivity,” but there were no
consequences for the abusers. Nonmanagers worried about the personal and
organizational consequences of unchecked abuse. As one explained, “If you know the
people.. .abusing it, then that makes you never want to ask for it. You know that is part
of the stereotype of the person using that program.” Another feared “that abuse may
cause MW to cut [the policy] out completely.” Managers I interviewed described how
they had addressed abuse, typically by reviewing expectations with wayward employees
and monitoring their performance. Managers revoked the options as a last resort.
As one informant succinctly concluded, “The success or failure of [AWAs]
depends on managers’ attitudes and how well the program is managed.” Managers are a
key influence in both workers’ access to and use of AWAs. As gatekeepers of the policy’s
implementation, they have the discretion to determine workers’ access to AWAs. In
addition, the consistently strong positive eflfect of the estimated level of departmental use
underscores the importance of managers’ perceived collective support on employees’ use
o f flextime, CWW, and telecommuting. Finally, managers’ ability to plan for and
coordinate work between employees on dififerent schedules is essential to the effective
functioning of workgroups using AWAs.
Despite differences in the flexibility that the alternative arrangements offer,
workers’ access to and use o f each is grounded in the “primacy of work” (Kofodimos
1997:59). Work-related factors are the primary determinants o f MW managers’ decisions
148
to make the options available, and maintaining or increasing productivity is allegedly
managers’ paramount consideration. And despite managerial protestations to the
contrary, nonmanagers and managers alike believed that using the options may cause their
supervisors to question their productivity and commitment—and hence jeopardize their
careers. Employees desiring to use the options must implicitly justify that use negatively:
that is, by arguing that using an AW A will not affect their work. Ignored in the equation
are the AWAs’ positive influence on workers’ home-to-work spillover—which, in turn,
should positively affect users’ work. Therefore, the ability of CWW and telecommuting to
reduce workers’ domestic spillover provides a strong argument in favor o f implementation
of the alternatives by corporations concerned with their bottom line.
149
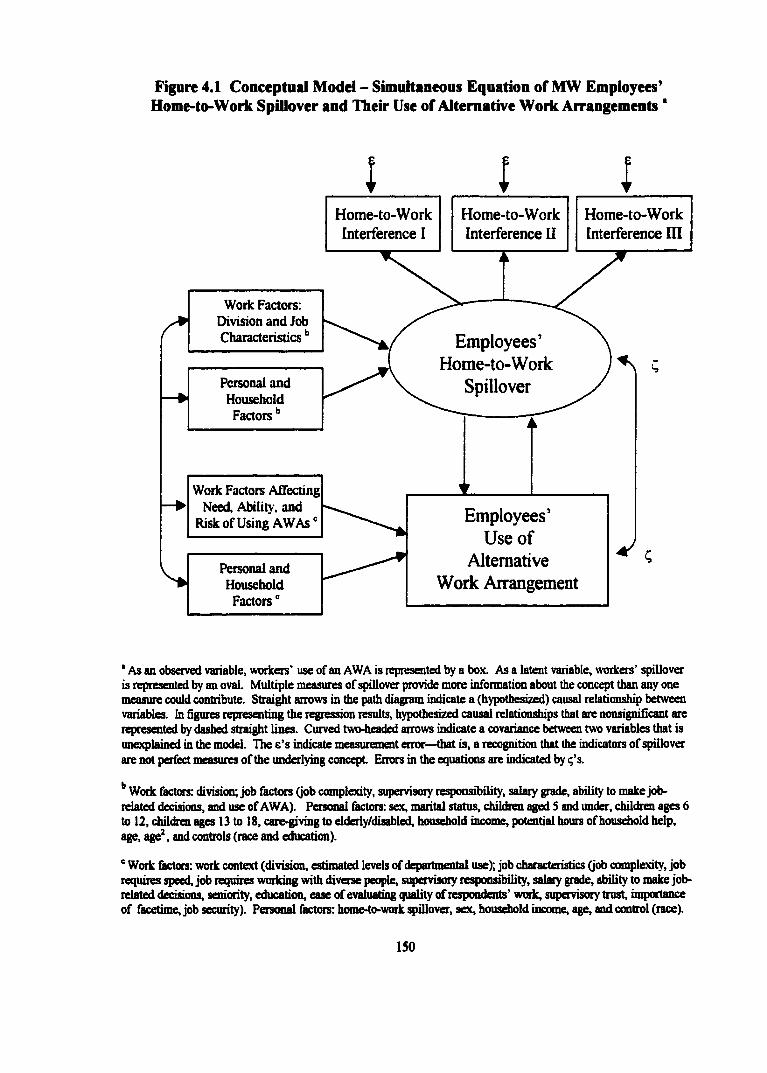
Figure 4.1 Conceptual Model - Simultaneous Equation of MW Employees’Home-to-Work Spillover and Their Use of Alternative Work Arrangements '
I I I
Employees’Home-to-Work
Spillover
Home-to-Work Interference HI
Home-to-Work Interference II
Home-to-Work Interference I
Personal and Household
Factors'
Woric Factors: Division and Job Characteristics
Personal and Household Factors
Work Factors Affecting Need, Ability, and
Risk of Using AWAs ' Employees’ Use of
Alternative Work Arrangement
* As an observed variable, woricers' use of an AWA is represented by a box. As a latent variable, workers' spillover is represented by an oval. Multiple measures of spillover provide more information about the concept than any one measure could contribute. Strai^t arrows in the path diagram indicate a (hypothesized) causal relationship between variables, ht Ggures representing the regression results, hypothesized causal relationships that are nonsigndficant are represented by dashed straight lines. Curved two-headed arrows indicate a covariance between two variables that is unexplained in the model. The e’s indicate measurement error—that is, a recognition that the indicators of spillover are not perfect measures of the underlying concept Errors in the equations are indicated by q’s.
Work factors: division; job Actors (job complexity, supervisory responsibility, salary grade, ability to make job- related decisions, and use of AWA). Personal factors; sex, marital status, chddren aged 5 and under, childrar ages 6 to 12, children ages 13 to 18, care-giving to elderly/disabled, household income, potential hours of household help, age, age', and controls (race and education).
' Worit factors: work context (division, estimated levels of departmental use); job characteristics (job complexity, job requires speed, job requires working with diverse people, supervisory responsibility, salary grade, ability to make job- related decisions, seniority, education, ease of evaluaÂig quality of respondents’ work, supervisory trust, importance of facetime, job security). Personal fhctors: home-to-work spillover, sex, household income, age, and control (race).
150
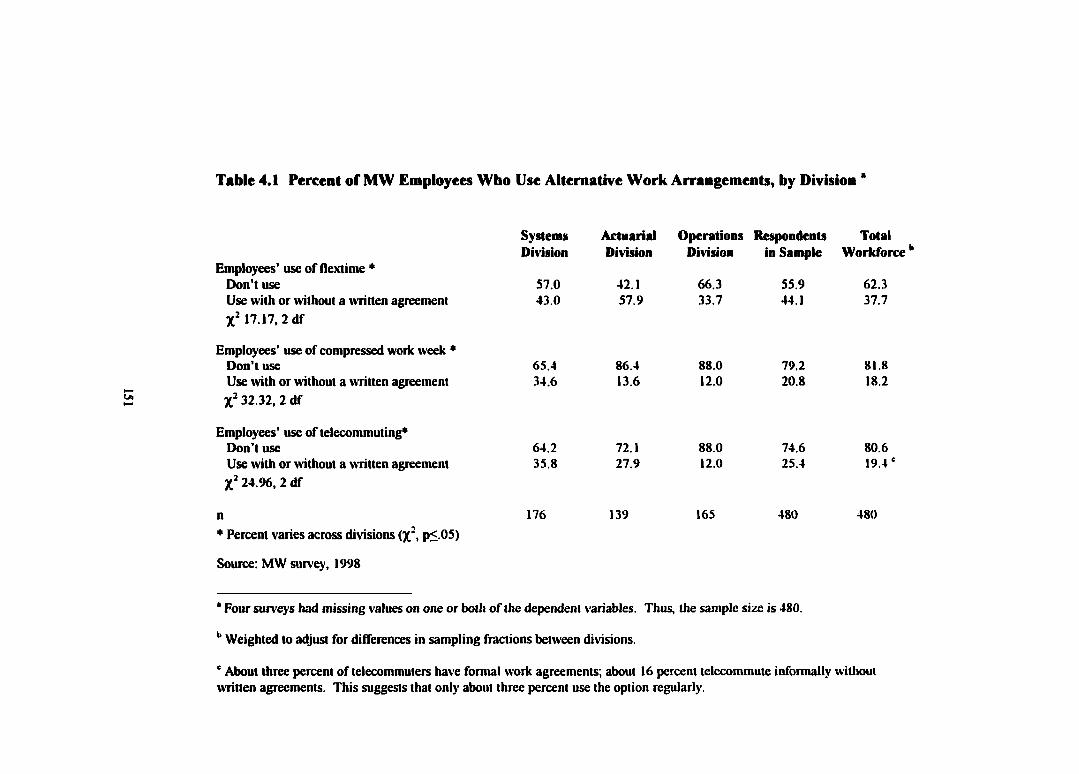
Table 4.1 Percent of MW Employees Who Use Alternative Work Arrangements, by Division *
Systems Actuarial Operations Respondents Total Division Division Dirision in Sample Workforce **
Employees’ use of flextime *Don't use 57.0 42.1 66.3 55.9 62.3Use with or without a ufitten agreement 43.0 57.9 33.7 44.1 37.7
17.17. 2 df
Employees’ use of compressed work week *Don’t use 65.4 86.4 88.0 79.2 81.8Use with or without a written agreement 34.6 13.6 12.0 20.8 18.2
u, 32.32. 2 df
Employees’ use of telecommuting*Don’t use 64.2 72.1 88.0 74.6 80.6Use with or without a written agreement 35.8 27.9 12.0 25.4 19.4 ‘X' 24.96. 2 df
n 176 139 165 480 480♦ Percent varies across divisions (X‘, p< 05)
Source; MW survey. 1998
* Four surveys had missing values on one or botli of the dependent variables. Thus, the sample size is 480.
Weighted to adjust for diflerences in sampling fractions between divisions.
‘ About three percent of telecommuters have formal work agreements; about 16 percent telecommute informally without written agreements. This suggests that only about three percent use the option regularly.
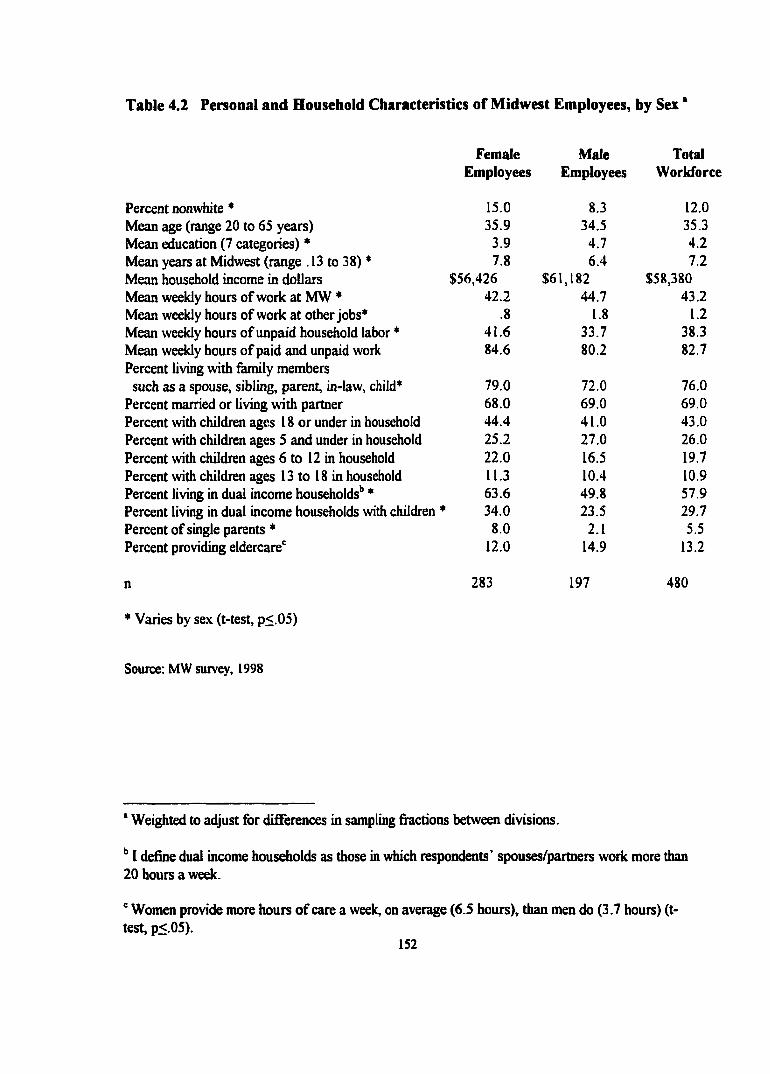
Table 4.2 Personal and Household Characteristics of Midwest Employees, by Sex '
Female Male TotalEmployees Employees Workforce
Percent nonwhite * 15.0 8.3 12.0Mean age (range 20 to 63 years) 35.9 34.5 35.3Mean education (7 categories) * 3.9 4.7 4.2Mean years at Midwest (range . 13 to 38) ♦ 7.8 6.4 7.2Mean household income in dollars $56,426 $61,182 $58,380Mean weekly hours of work at MW * 42.2 44.7 43.2Mean weekly hours of work at other jobs* .8 1.8 1.2Mean weekly hours of unpaid household labor * 41.6 33.7 38.3Mean weekly hours of paid and unpaid work 84.6 80.2 82.7Percent living with fiunily members such as a spouse, sibling, parent, in-law, child* 79.0 72.0 76.0
Percent married or living with partner 68.0 69.0 69.0Percent with children ages 18 or under in household 44.4 41.0 43.0Percent with children ages 5 and under in household 25.2 27.0 26.0Percent with children ages 6 to 12 in household 22.0 16.5 19.7Percent with children ages 13 to 18 in household 11.3 10.4 10.9Percent living in dual income households'* * 63.6 49.8 57.9Percent living in dual income households with children * 34.0 23.5 29.7Percent of single parents * 8.0 2.1 5.5Percent providing eldercare' 12.0 14.9 13.2
n 283 197 480
* Varies by sex (t-test, p<.05)
Source: MW survey, 1998
' Weighted to adjust for dififerences in sampling factions between divisions.
I define dual income households as those in which respondents' spouses/partners work more than 20 hours a week.
' Women provide more hours of care a week, on average (6.5 hours), than men do (3.7 hours) (t- test, p<.05).
152
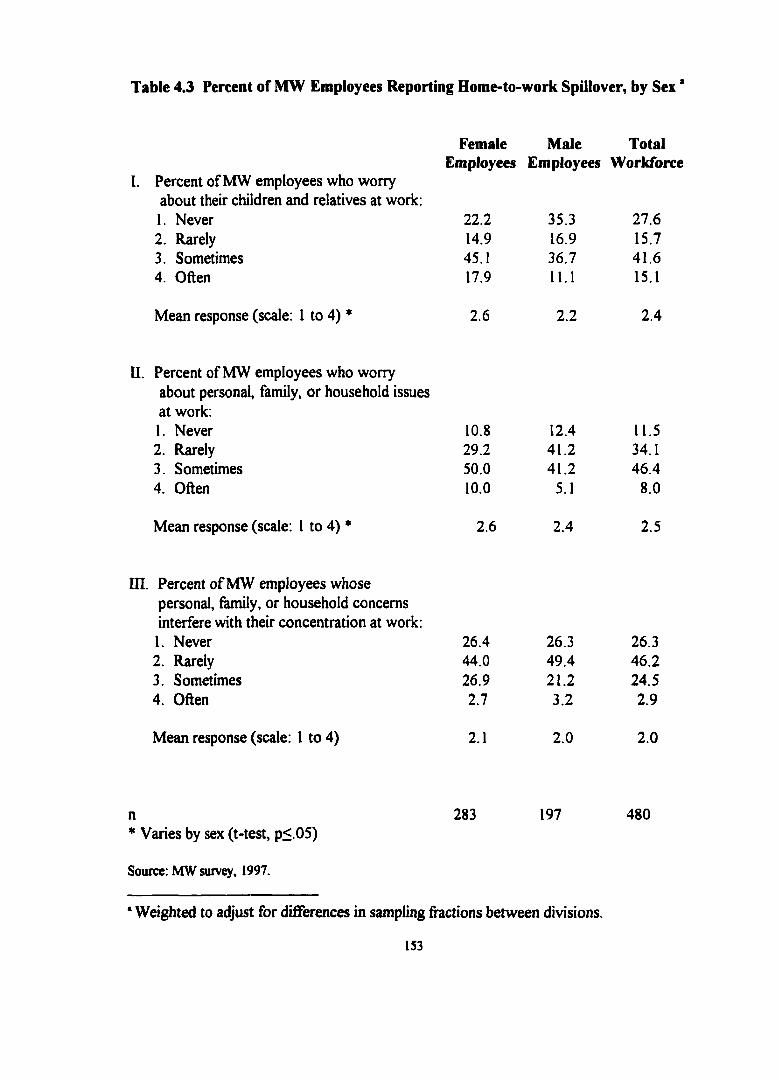
Table 4.3 Percent of MW Employees Reporting Home-to-work Spillover, by Sex *
Female Male TotalEmployees Employees Workforce
I. Percent of MW employees who worry about their children and relatives at work;I. Never 22.2 35.3 27.62. Rarely 14.9 16.9 15.73. Sometimes 45.1 36.7 41.64. Often 17.9 11.1 15.1
Mean response (scale: 1 to 4) * 2.6 2.2 2.4
II. Percent of MW employees who worry about personal, family, or household issues at work:1. Never 10.8 12.4 11.52. Rarely 29.2 41.2 34.13. Sometimes 50.0 41.2 46.44. Often 10.0 5.1 8.0
Mean response (scale: I to 4) * 2.6 2.4 2.5
ni. Percent of MW employees whose personal, family, or household concerns interfere with their concentration at work:1. Never 26.4 26.3 26.32. Rarely 44.0 49.4 46.23. Sometimes 26.9 21.2 24.54. Often 2.7 3.2 2.9
Mean response (scale: 1 to 4) 2.1 2.0 2.0
n 283 197 480* Varies by sex (t-test, p<.05)
Source; MW survey, 1997.
* Weighted to adjust for dififerences in sampling fi-actions between divisions.
153
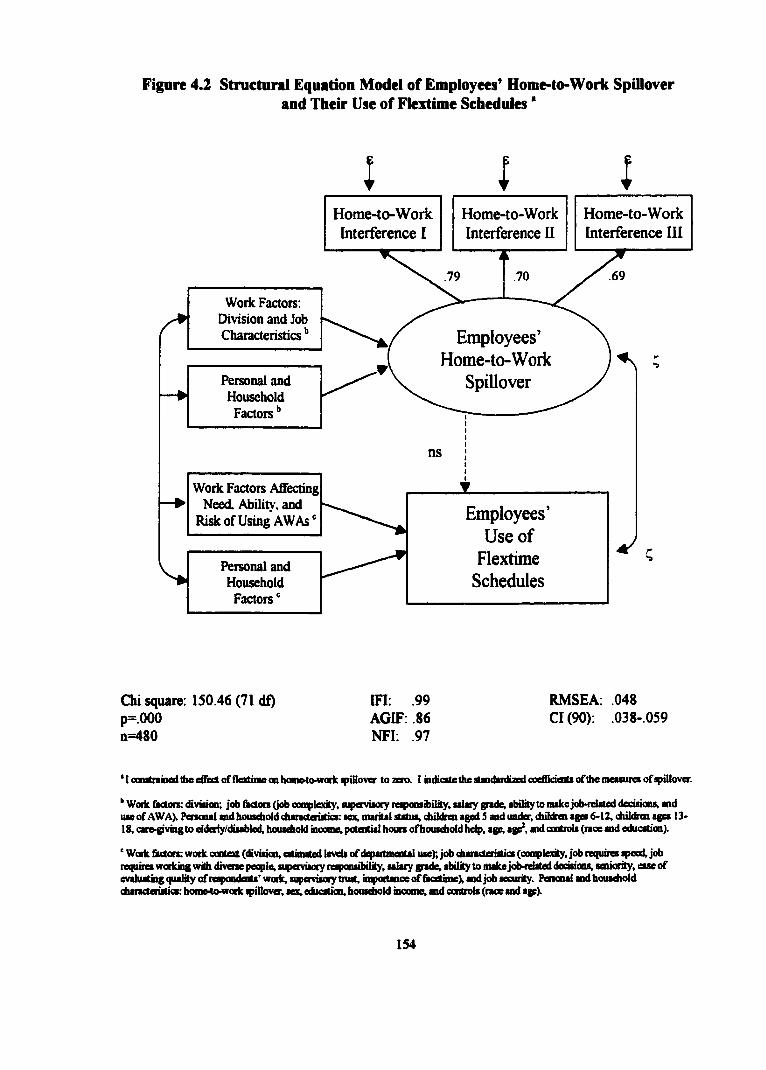
Figure 4.2 Structural Equation Model of Employees’ Home-to-Work Spilloverand Their Use of Flextime Schedules *
I I I
.69.79 .70
Employees’Home-to-Work
Spillover
ns
Home-to-Work Interference II
Home-to-Work Interference I
Home-to-Work Interference III
Personal and Household
Factors ‘
Work Factors: Division and Job Characteristics
Personal and Household Factors *’
Woric Factors Affecting Need. Ability, and
Risk of Using AWAs ‘ Employees’ Use of
Flextime Schedules
Chi square: 150.46 (71 df)p=.000n=480
ffl: .99AGIF: .86 NFl: .97
RMSEA: .048 Cl (90): .038-059
‘ I con tfn iM d the effect o f flextmie on homMowoffc spillover to zero. I indicetethe tlmidmrdized coeffidentt o f the meaeurci o f ipUlover.
W oik factotK diviiion; job fiK ton (job complexity, lupervisaty le^Mosibilily, u le iy grade, ability to m akejob-fdated decisions, and uae o f AWA). Personal and household cfaaracteriatics; sex, marital status, ch ildkn agpd 3 and under, children ages 6*12, children ages 13* 18, care-giving to elderly/disabled, household tacome, potential hours o fhousdiold help, age, age*, and controls (race and education).
‘ Work Actors: w ork context (division, estimated levels o f departmental use); job characteristics (complexity, job requires speed, job requires workmg with diverse people, supervisory responsibility, salary grade, ability to m ake job-related decisions, seniority, ease o f evaluatmg quality o f respotularts' work, supervisory h u rt, importance o f Acetnne), arwljob security. Personal and household characteristics: hom oto-w ork qiillover, sex, education, household moame, and controb Crace and age).
154
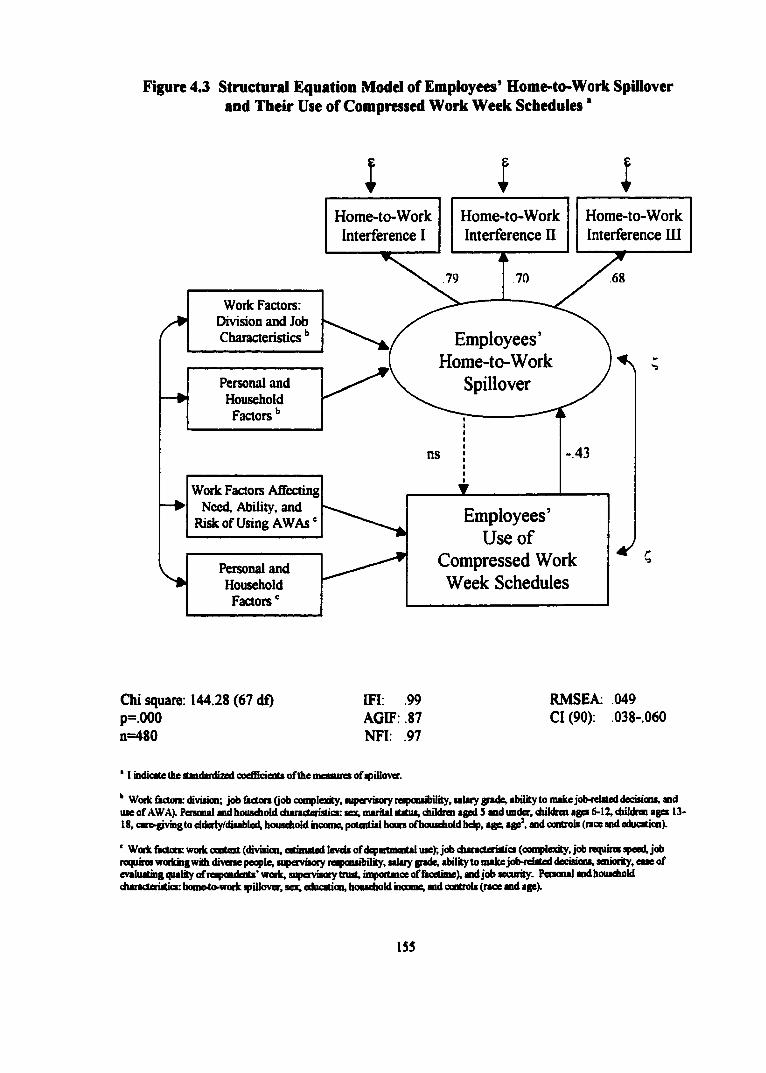
Figure 4.3 Structural Equation Model of Employees’ Home-to-Work Spilloverand Their Use of Compressed Work Week Schedules *
I I I
70 6879
Employees’Home-to-Work
Spillover
-.43ns
Horae-to-Work Interference III
Home-to-Work Interference I
Home-to-Work Interference II
Work Factors: Division and Job Characteristics
Personal and Household Factors *’
Work Factors Affecting Need, Ability, and
Risk of Using AWAs '
Personal and Household
Factors *
Employees’ Use of
Compressed Work Week Schedules
Chi square: 144.28 (67 df)p=.000n=480
IFI: .99AGIF: .87 NFI: .97
RMSEA: .049 Cl (90): .038-060
' I indicate the sUndardizBdcoeffideats o f the m eaw ics o f apfllover.
W ork (actor*: divisian; jo b A ctor: (job complexity, supervisory respcosibility, salary grade, ability to m ake job-related decision*, and use o f AWA). Personal and household cfaaracteristica: sex, mwital status, diildrcn aged S and under, children ages 6-12, children ages 13- 18, care-givmgto elderiy/dixabled, household income, potortial hours o f household help, agp, agp^, and oontrols (race and education).
' W ork ActocK work context (divisian, aeim srad leveb ofdepartmerrtai use); job diaracteriatics (complexity, job requires apeed, job rerprire* workmg with diverse people, srqiervisory responsibility, salary grade, ability to m ake job-related decisians, aeruorky, ease o f evaluating quality ofre^xm denA ' work, supervisory trust, importance o f Acethne), and jo b security. Persosul and household characteristics: hom eto-w ork spillover, sex, education, household ncom e, and controls (race and age).
155
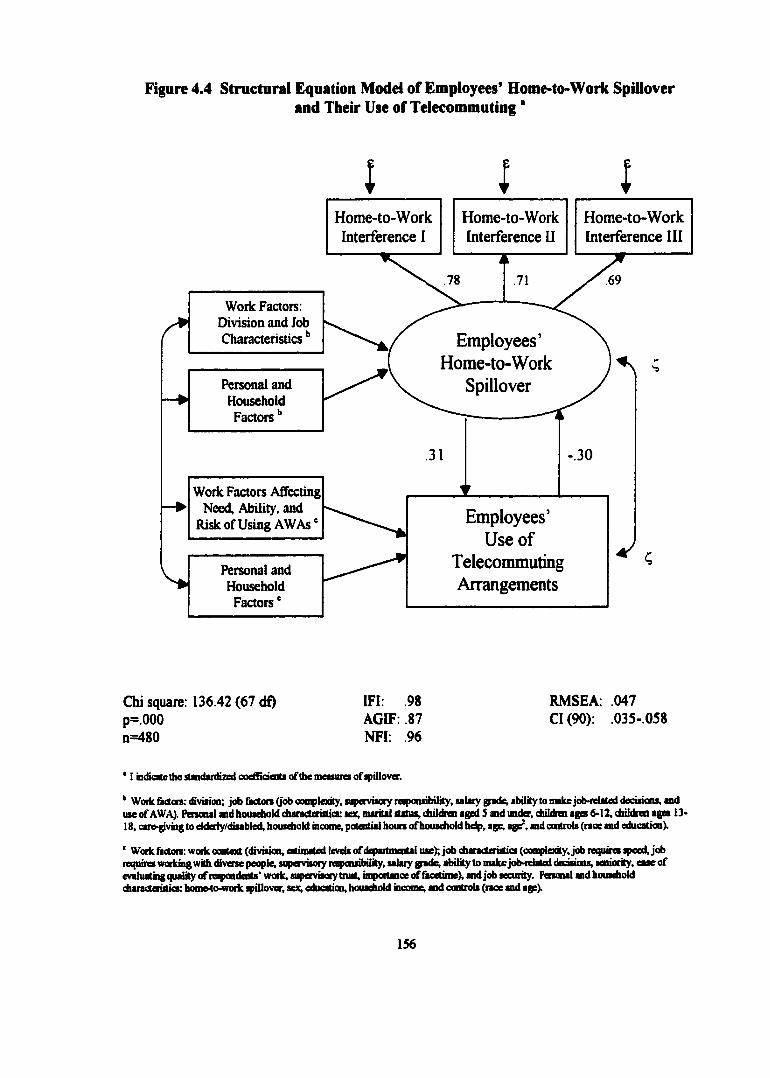
Figure 4.4 Structural Equation Model of Employees’ Home-to-Work Spilloverand Their Use of Telecommuting *
I IHome-to-Work Interference I
Work Factors: Division and Job Characteristics *’
—>Personal and Household Factors
—►Work Factors A£fecting
Need, Ability, and Risk of Using AWAs*
Personal and Household Factors '
Employees’Home-to-Work
Spillover
IHome-to-Work Interference II
I
Home-to-Work Interference III
.31
1
----------- -—
r
i
-.30
Employees’Use of
TelecommutingArrangements
Chi square; 136.42 (67 df)p = . 0 0 0
n=480
IFI: .98AGIF: .87 NFI: .96
RMSEA: .047 Cl (90): .035-058
' I nd ic tte the sU ndaidizedooeffidoX softheiiieuuK s o f spillover.
* W offcfiuton:diviiiaa; job fiK tonO 'oboaaipie»ty,iuperviM fyrapantibility , salary gpule,«bflity to m ikejo lM elateddedfians, and use o r AWA). Pmonml and housdiohi d u n d ê ris tic s : sex, m ariu l status, d itld rm aged 5 and under, children agps 6-12, dtildrcn ages 13- 18, cat»givm g to ehkrty/disabled, household mcome, potential houis orhouschold help, age, age ', and controls (race and education).
‘ W ork Actors: w ork context (division, estimated levels o r departm alal use); jo b characteristics (complexity, job requires speed, job reipdres working with diverse people, supervisory responsibility, salary grade, ability to makejob-relsted decisions, seniority, esse oT m«l:i««mgq,imt*y n f rwpwiifcâr»* urnrif, «upenrienfytnMS, tirpa tM ioeof fiic^im e), lild job «acurity. Personal SOd household characteristics: hometo-worfc spillover, sex, education, household stcome, and oonlrols (race and age).
156
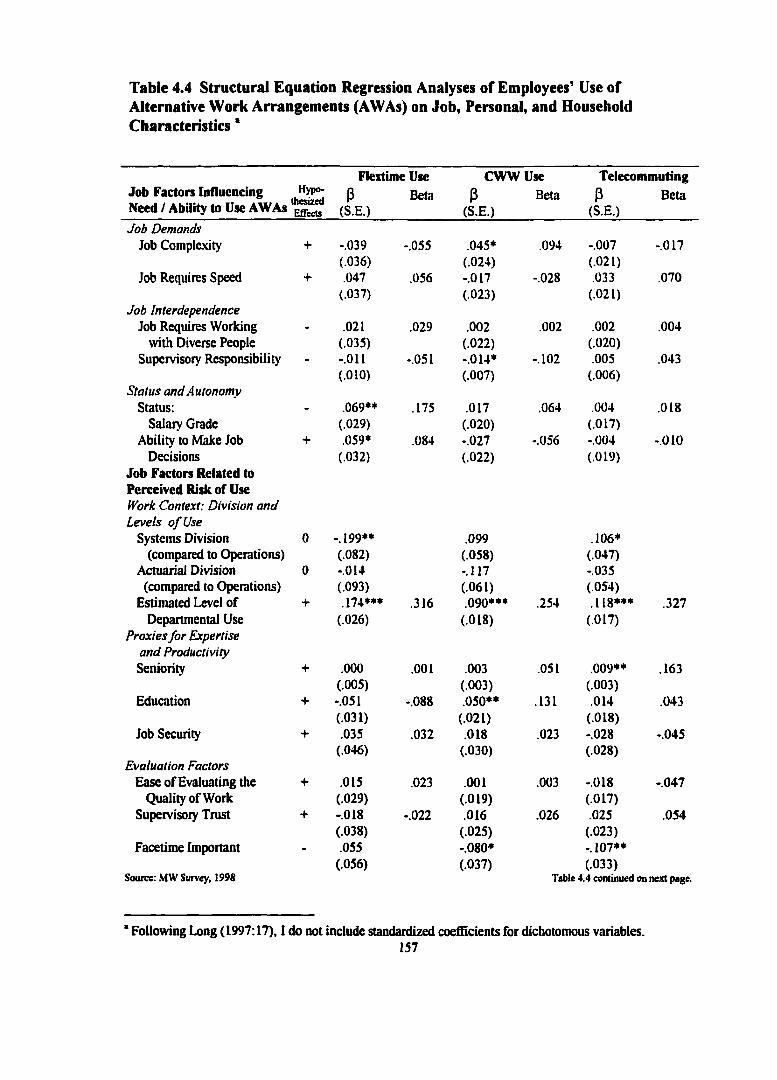
Table 4.4 Structurai Equation Regression Analyses of Employees’ Use of Alternative Work Arrangements (AWAs) on Job, Personal, and Household Characteristics *
Hypo-
Need / Ability to Use AWAsJob Factors Influencing
Flextime UseP Beta
(S.E.)
CWWUse(3 Beta
(S.E.)
TelecommutingP Beta
(S.E.)Job Demands
Job Complexity + -.039 -.055 .045* .094 -.007 -.017(.036) (.024) (.021)
Job Requires Speed + .047 056 -.017 -028 .033 .070(.037) (.023) (.021)
Job InterdependenceJob Requires Working - .021 .029 .002 002 .002 .004
with Diverse People (.035) (.022) (.020)Supervisory Responsibility - -O il -.051 -.014* -102 .005 .043
(.010) (.007) (.006)Status and Autonomy
Status: - .069** .175 .017 064 .004 .018Salary Grade (.029) (.020) (.017)
Ability to Make Job + .059* .084 -027 -.056 -.004 -.010Decisions (.032) (.022) (.019)
Job Factors Related toPerceived Risk of Usetf'ork Context: Division andLevels o f Use
Systems Division 0 -.199** .099 .106*(compared to Operations) (.082) (.058) (.047)
Actuarial Division 0 -.014 -.117 -.035(compared to Operations) (.093) (.061) (.054)
Estimated Level of + .174*** .316 .090*** .254 .118*** .327Departmental Use (.026) (.018) (.017)
Proxies for Expertiseand ProductivitySeniority + .000 .001 .003 .051 .009** .163
(.005) (.003) (.003)Education + -.051 -.088 .050** .131 .014 .043
(.031) (.021) (.018)Job Security + .035 .032 018 .023 -.028 -.045
(.046) (.030) (.028)Evaluation Factors
Ease of Evaluating the + .015 .023 .001 .003 -.018 -.047Quality of Work (.029) (.019) (.017)
Supervisory Trust + -.018 -.022 .016 .026 .025 .054(.038) (.025) (.023)
Facetime Important - .055 -.080* -.107**(.056) (.037) (.033)
Source: MW Survey, 1998 Table 4.4 continued on next page.
' Following Long (1997:17), I do not include standardized coefBcients for dichotomous variables.157
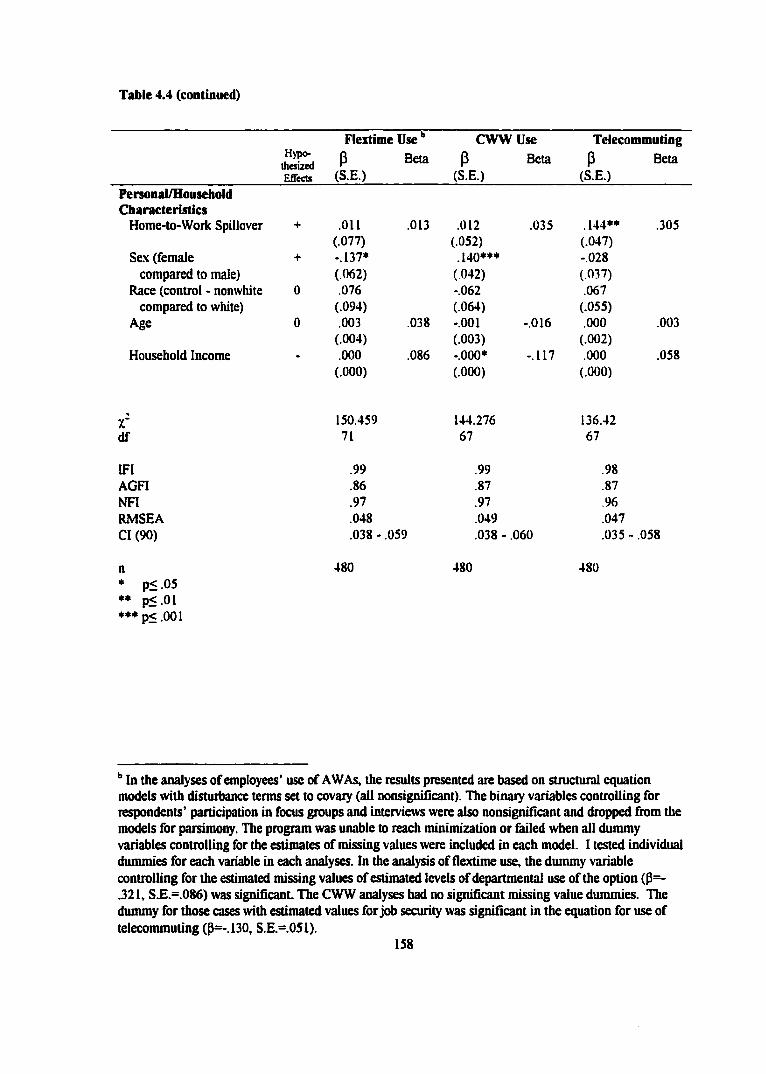
Table 4.4 (continued)
HypothesizedECTects
Flextime UseP Beta
(S.E.)
CWWUseP Beta
(S.E.)
TelecommutingP Beta
(S.E.)Personal/HouseholdCharacteristics
Home-to-Work Spillover + .011 .013 .012 .035 .144** .305(.077) (.052) (.047)
Sex (female + -.137* .140*** -.028compared to male) (.062) (042) (037)
Race (control - nonwhite 0 .076 -.062 .067compared to white) (.094) (.064) (.055)
Age 0 .003 .038 -.001 -016 .000 .003(.004) (.003) (.002)
Household Income - .000 .086 -.000* -.117 .000 .058(.000) (.000) (.000)
X* 150.459 144.276 136.42df 71 67 67
IFl .99 .99 .98AGFl .86 .87 .87NFI .97 .97 .96RMSEA .048 .049 .047C l(90) .038 - .059 .038 - .060 .035 - .058
n 480 480 480p<.05 p<.Oi
***p<.001
In the analyses of employees’ use of AWAs, the results presented are based on structural equation models with disturbance terms set to covaiy (all nonsignificant). The binary variables controlling for respondents’ participation in focus groups and interviews were also nonsignificant and dropped firom the models for parsimony. The program was unable to reach minimization or &iled when all dummy variables controlling for the estimates of missing values were included in each model. 1 tested individual dummies for each variable in each analyses. In the analysis of flextime use, the dummy variable controlling for the estimated missing values of estimated levels of departmental use of the option (P=- .321, S.E.=.086) was significant The CWW analyses had no significant missing value dununies. The dimuny for those cases with estimated values for job security was significant in the equation for use of teleconunuting (P=-.130, S.E.=.051).
158
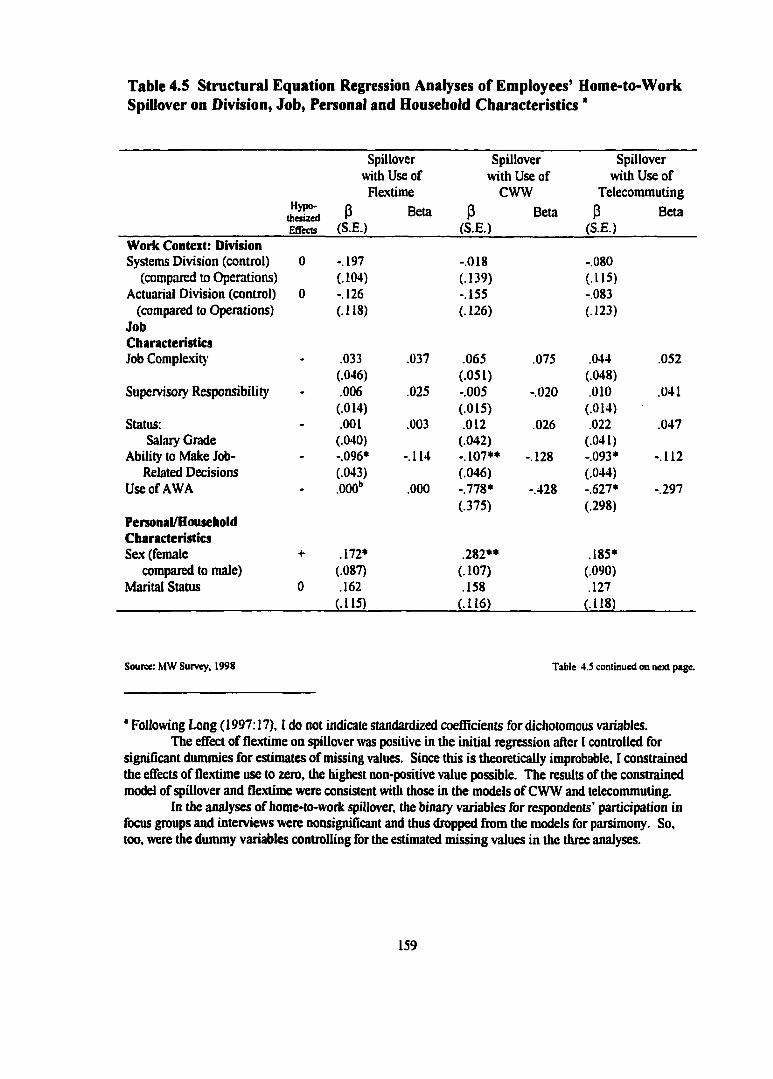
Table 4.5 Structural Equation Regression Analyses of Employees’ Home-to-Work Spillover on Division, Job, Personal and Household Characteristics '
Spillover Spillover Spilloverwith Use of with Use of with Use ofFlextime CWW Telecommuting
Hypothesized |3 Beta (3 Beta P BetaEfiects (S.E.) (S.E.) (S.E.)
Work Context: DivisionSystems Division (control) 0 -.197 -.018 -080
(compared to Operations) (.104) (.139) (.115)Actuarial Division (control) 0 -.126 -.155 -083
(compared to Operations) (.118) (.126) (.123)JobCharacteristicsJob Complexit) .033 .037 .065 .075 .044 .052
(.046) (.051) (.048)Supervisory Responsibility .006 .025 -.005 -.020 .010 .041
(.014) (.015) (.014)Status: .001 .003 .012 026 .022 .047
Salary Grade (.040) (.042) (.041)Ability to Make Job- -.096* -.114 -.107** -128 -.093* -.112
Related Decisions (.043) (.046) (.044)Use of AWA .000“ .000 -.778* -.428 -.627* -.297
(.375) (.298)Personal/HouseholdCharacteristicsSex (female 4- .172* .282** .185*
compared to male) (.087) (.107) (.090)Marital Status 0 .162 .158 .127
(.115) _ (.116) (.118)
Source: MW Survey, 1998 Table 4 .) continued on next page.
* Following Long (1997:17), I do not indicate standardized coefficients for dichotomous variables.The effect of flextime on spillover was positive in the initial regression after I controlled for
significant dummies for estimates of missing values. Since this is theoretically improbable, I constrained the effects of flextime use to zero, the highest non positive value possible. The restdts of the constrained model of spillover and flextime were consistent wiüi those in the models of CWW and telecommuting.
In the analyses of home-to-work spillover, the binary variables for respondents’ participation in focus groups and interviews were nonsignificant and thus dropped from the models for parsimony. So, too, were the dummy variables controlling for the estimated missing values in the three analyses.
159
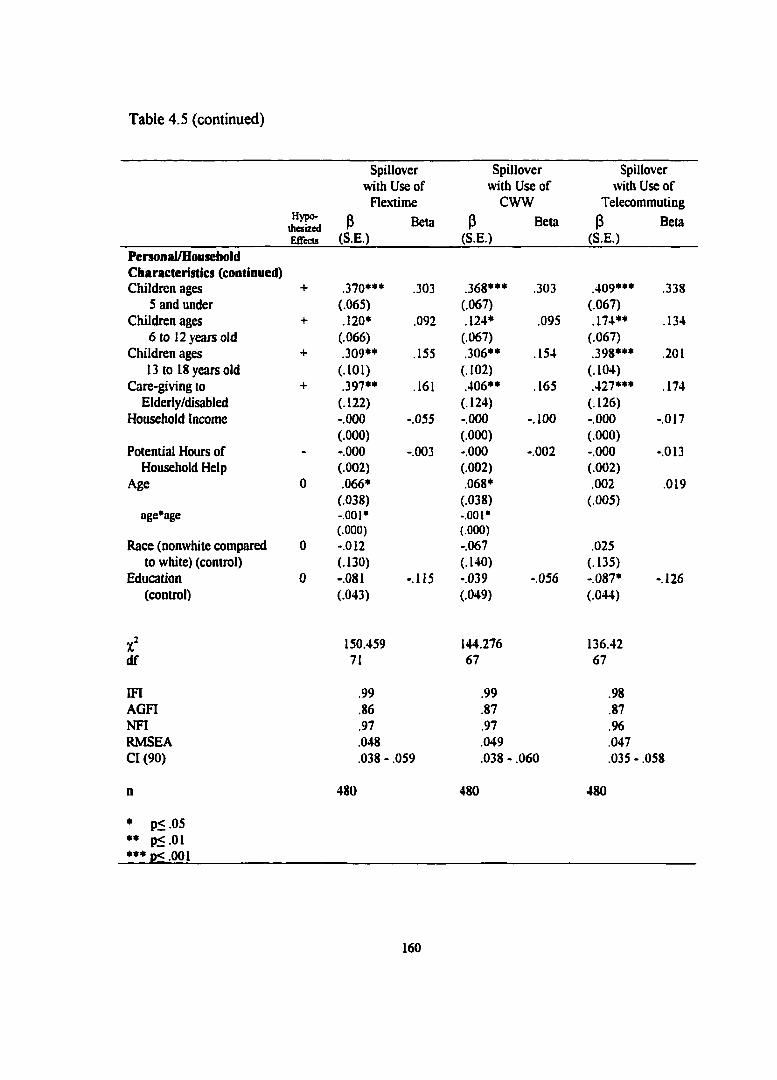
Table 4.5 (continued)
HypothesizedEffects
Spillover with Use of
Rextime3 Beta
(S.E.)
Spillover with Use of
CWW3 Beta
(S.E.)
Spillover with Use of
Telecommuting3 Beta
(S.E.)Personal/HouseboldCharacteristics (continued)Children ages + .370*** .303 .368*** .303 .409*** .338
S and under (.065) (.067) (.067)Children ages + .120* .092 .124* .095 .174** .134
6 to 12 years old (.066) (.067) (.067)Children ages + .309** .155 .306** .154 .398*** .201
13 to 18 years old (.101) (.102) (.104)Care-giving to + .397** .161 .406** .165 .427*** .174
Elderly/disabled (.122) (.124) (.126)Household Income -.000 -.055 -.000 -.100 -.000 -.017
(.000) (.000) (.000)Potential Hours of - -.000 -.003 -.000 -.002 -.000 -.013
Household Help (.002) (.002) (.002)Age 0 .066* .068* .002 .019
(.038) (.038) (.005)age’age - .0 0 1 * -.001*
( .0 0 0 ) ( .0 0 0 )
Race (nonwhite compared 0 -.012 -.067 .025to white) (control) (.130) (.140) (.135)
Education 0 -.081 -.115 -.039 -.056 -.087* -.126(control) (.043) (.049) (.044)
150.459 144.276 136.42df 71 67 67
IFI .99 .99 .98AGFI .86 .87 .87NFI .97 .97 .96RMSEA .048 .049 047C l(90) .038- .059 .038- .060 .035 - .058
n 480 480 480
* P5.05** p< 01*♦* D< .001
160
CHAPTERS
CONCLUSION
The demographic composition of the workforce has dramatically changed over the
past three decades as social, economic, and technological changes have drawn women into
the labor force. The majority of workers no longer leave behind a nonemployed spouse or
partner to deal with the demands of home and family. Thus, firms’ expectations of finding
ideal workers who can “set aside personal and emotional considerations [on the job]”
(Kanter 1977:22) are out of synch with reality. Work-home conflict in the form of home-
to-work spillover negatively affects workers’ job performance (Friedman 1991:11-4;
Galinsky et al. 1991:115-7). Many employees cannot afford to reduce their work hours,
however (Ferber and O’Farrell 1991:126; Presser 1989:535). Moreover, employees may
not want to jeopardize their careers by cutting back (Lewis 1997:16; Haas and Hwang
1995:28; Schwartz 1994:32-4).
In response to the changing demographics and needs of the workforce, some
employers have implemented alternative work arrangements to recruit and retain
productive workers, and to reduce the negative effects of employees’ work-home conflict
on job performance (Witkowslqf 1999:204; Kelly 1999:169; Galinsky et al. 1991:82-3).
Employees, for their part, use flexibility at work as a primary strategy to meet the dual
161
obligations of home and work (National Report on Work and Family 1999:45; Galinsky
1992; Rodgers 1992:186; Galinsky and Stein 1990:375). By making their work and home
schedules more complementary, employees are able to reduce scheduling conflicts and
thus more conveniently and effectively perform both work- and nonwork-related
obligations (Bailyn et al. 1997:14; Starrels 1992:260; Friedman 1991:51-3).
Using qualitative, quantitative, and archival data collected in a case study of a
Midwest Securities, a financial services organization, I investigated three questions: (1)
what are the determinants of workers’ access to three alternative work arrangements, (2)
what are the determinants of workers’ use of AWAs, and (3) what are the determinants of
employees’ home-to-work spillover. I found that although the work-home policy offering
the AWAs was company-wide, managers had the discretion to implement the options. The
firm’s paramount consideration was meeting business objectives and customers’ needs
(whether internal or external clients). Productivity, then, was to guide managers’
decisions about subordinates’ access to the options. MW provided managers with three
criteria to guide decisions about workers’ access to the AWAs: job suitability, employee
suitability, and the cost-benefit ratio to the corporation. Because the policy was designed
as a work-Aome rather than a 'woxk-family policy, it was to be available to all employees
who met the criteria, not just those with family responsibilities. Employees could decide
whether or not to use available options.
162
Contributions of the Research
Corporate policies can be effective only if they are implemented and used. Thus,
firms interested in AWAs as strategic tools to help their employees balance work-home
obligations need to know the factors that affect the availability, as well as the use, of
AWAs. Little research, however, has examined the two critical decision-making points
that shape AWAs’ effectiveness in the work place: managers’ decisions to make AWAs
available and employees’ decisions to use AWAs. My study thus contributes to our
understanding of the totality of circumstances that affect AWAs’ relationship with work-
home conflict.
Second, social scientists have studied the relationship between AWAs and work-
home conflict as if it were one directional. This is unrealistic, however. The premise o f
work-home policies is that employees’ spillover and their use of AWAs are
interdependent: use of AWAs should reduce employees’ spillover, and employees with
spillover should use AWAs to help balance their work-home conflict. I address this gap in
research by estimating causal models that allowed a reciprocal relationship between
employees’ spillover and their use of AWAs.
Third, like other facets of home-to-work conflict—such as tardiness and
absenteeism—the frequency that employees’ personal, household, and familial concerns
intrude at work has the potential to affect job performance. Indeed, we can expect the
global economy with its 24-7 work schedules to aggravate this aspect of home-to-work
spillover within our labor force, which is dominated by workers with familial obligations.
Sparse research has focused on this component o f employees’ home-to-work spillover,
163
however, or the effectiveness of AWAs designed to ameliorate it. My study, then,
expands our understanding of the nature of home-to-work spillover and its relationship to
flexible scheduling options.
Summary of Findings
Analyses of Employees’ Access to AWAs
Managerial support for and workers’ access to the options varied between
alternatives. Managers reported substantially more administrative support for flextime (79
percent) than for CWW (71 percent) and telecommuting (56 percent). Managers also
reported that supervisors’ trust in subordinates, employees’ requests, and the use of
AWAs to attract and retain workers were the key reasons managers in their departments
supported AWAs. Conversely, the obstacles to support, according to managers, were the
options’ negative impact on work scheduling, supervision, and the quality of products or
services produced.
Workers’ access to the options paralleled the differences in perceived managerial
support for AWAs. Workers had the greatest access to flextime (65 percent of employees
across the divisions), followed by CWW (44 percent), and telecommuting (33 percent). In
total, three-fourths of all employees across the three MW divisions had access to at least
one o f the options.
I addressed three research questions about factors that affect employees’ access to
flextime, CWW, and telecommuting; (1) To what extent do MW’s guidelines account for
managers’ decisions to make the alternative work arrangements available? (2) What role
164
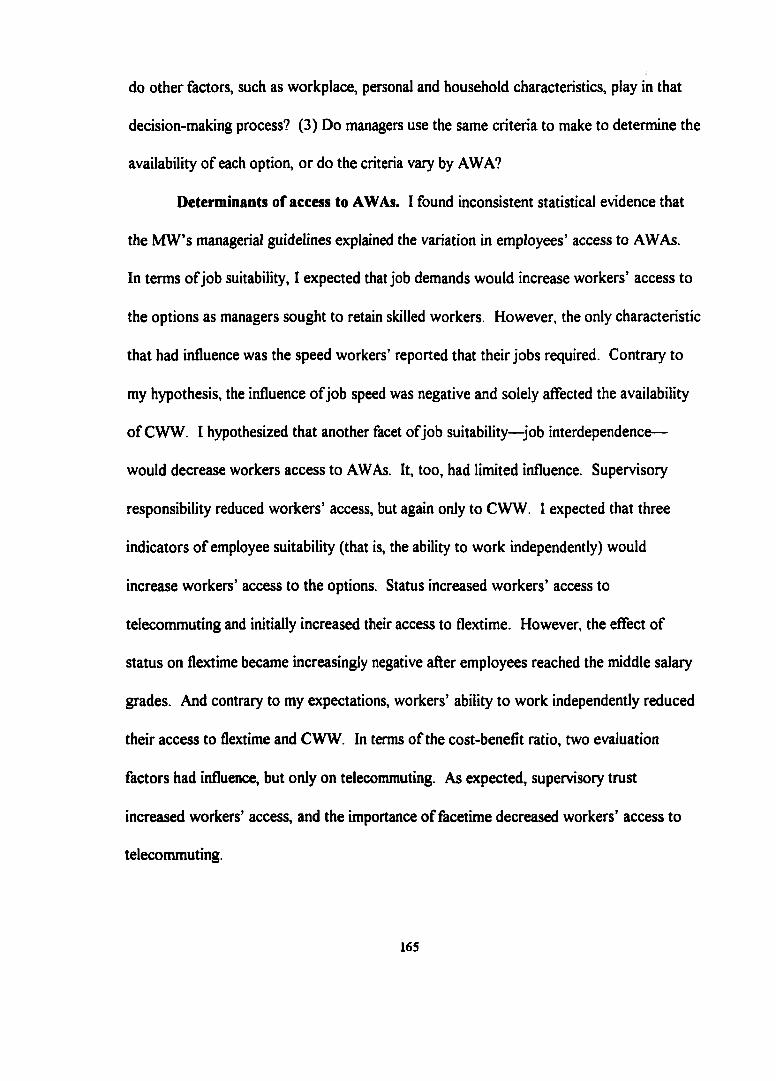
do other factors, such as workplace, personal and household characteristics, play in that
decision-making process? (3) Do managers use the same criteria to make to determine the
availability of each option, or do the criteria vary by AWA?
Determinants of access to AWAs. I found inconsistent statistical evidence that
the MW’s managerial guidelines explained the variation in employees’ access to AWAs
In terms of job suitability, I expected that job demands would increase workers’ access to
the options as managers sought to retain skilled workers. However, the only characteristic
that had influence was the speed workers’ reported that their jobs required. Contrary to
my hypothesis, the influence of job speed was negative and solely affected the availability
of CWW. I hypothesized that another facet of job suitability—job interdependence—
would decrease workers access to AWAs. It, too, had limited influence. Supervisory
responsibility reduced workers’ access, but again only to CWW. I expected that three
indicators o f employee suitability (that is, the ability to work independently) would
increase workers’ access to the options. Status increased workers’ access to
telecommuting and initially increased their access to flextime. However, the effect of
status on flextime became increasingly negative after employees reached the middle salary
grades. And contrary to my expectations, workers’ ability to work independently reduced
their access to flextime and CWW. In terms of the cost-beneflt ratio, two evaluation
factors had influence, but only on telecommuting. As expected, supervisory trust
increased workers’ access, and the importance of facetime decreased workers’ access to
telecommuting.
165
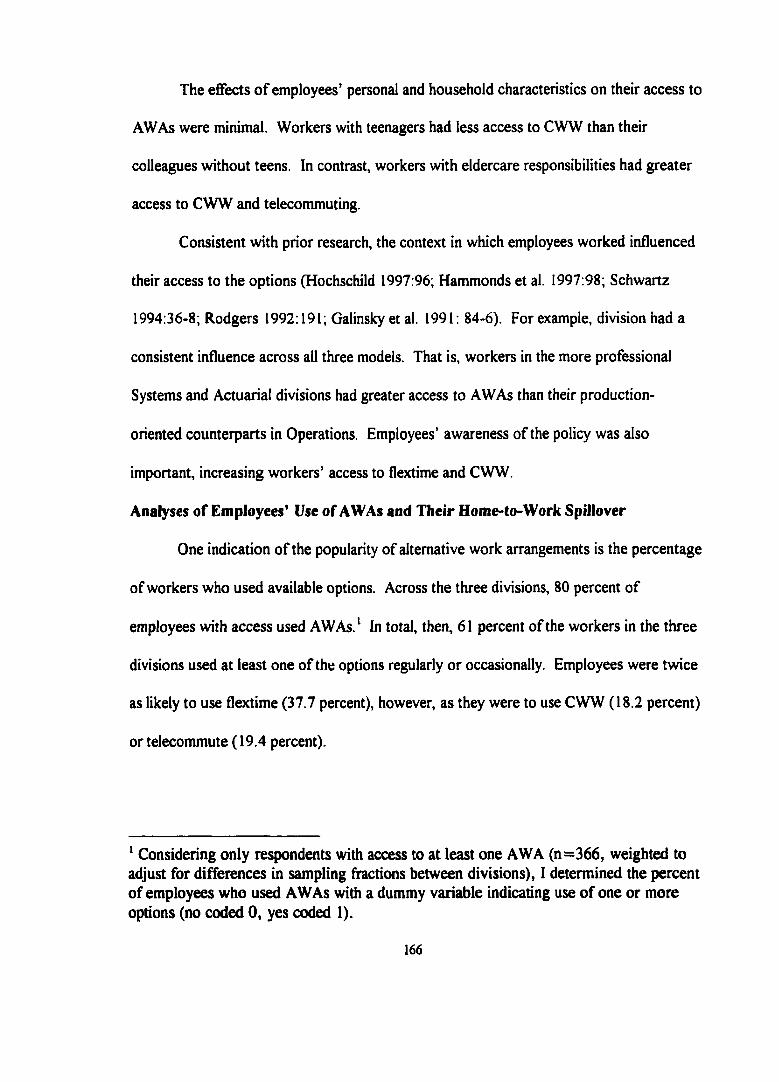
The effects o f employees’ personal and household characteristics on their access to
AWAs were minimal. Workers with teenagers had less access to CWW than their
colleagues without teens. In contrast, workers with eldercare responsibilities had greater
access to CWW and telecommuting.
Consistent with prior research, the context in which employees worked influenced
their access to the options (Hochschild 1997:96; Hammonds et al. 1997:98; Schwartz
1994:36-8; Rodgers 1992:191; Galinsky et al. 1991: 84-6). For example, division had a
consistent influence across all three models. That is, workers in the more professional
Systems and Actuarial divisions had greater access to AWAs than their production-
oriented counterparts in Operations. Employees’ awareness of the policy was also
important, increasing workers’ access to flextime and CWW.
Analyses of Employees’ Use of AWAs and Their Home-to-Work Spillover
One indication o f the popularity of alternative work arrangements is the percentage
of workers who used available options. Across the three divisions, 80 percent of
employees with access used AWAs.‘ In total, then, 61 percent of the workers in the three
divisions used at least one of the options regularly or occasionally. Employees were twice
as likely to use flextime (37.7 percent), however, as they were to use CWW (18.2 percent)
or telecommute ( 19.4 percent).
' Considering only respondents with access to at least one AWA (n=366, weighted to adjust for differences in sampling fractions between divisions), I determined the percent of employees who used AWAs with a dummy variable indicating use o f one or more options (no coded 0, yes coded I).
166
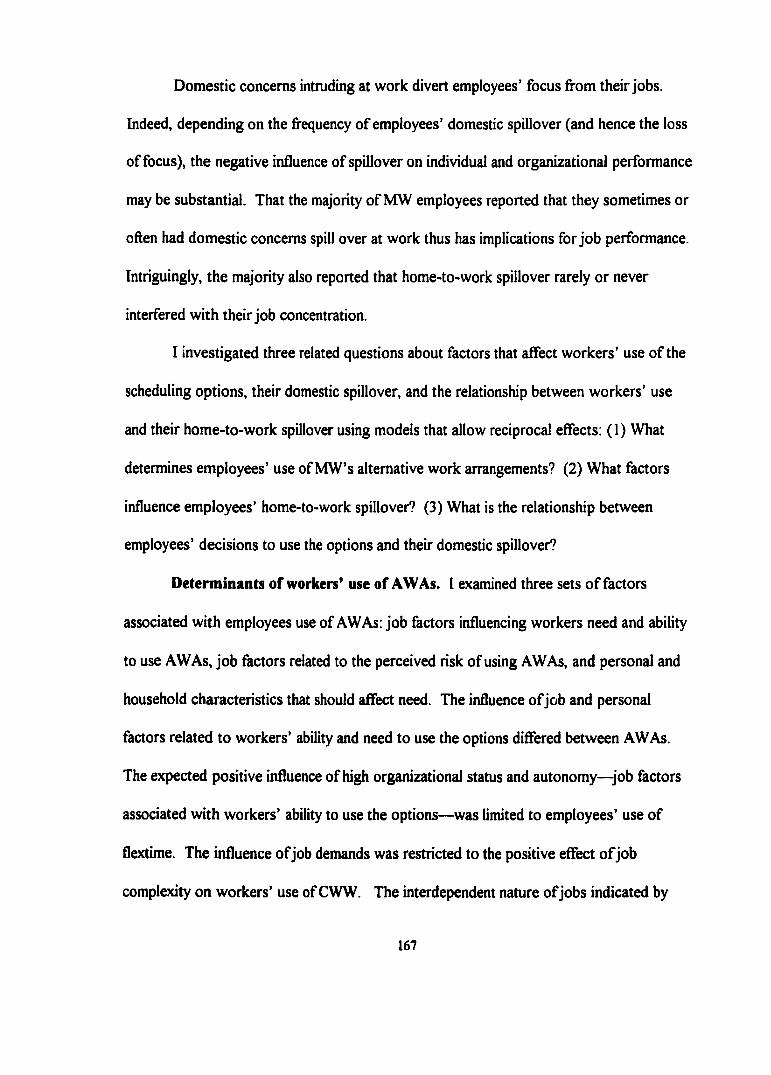
Domestic concerns intruding at work divert employees’ focus from their jobs.
Indeed, depending on the frequency of employees’ domestic spillover (and hence the loss
of focus), the negative influence of spillover on individual and organizational performance
may be substantial. That the majority of MW employees reported that they sometimes or
often had domestic concerns spill over at work thus has implications for job performance.
Intriguingly, the majority also reported that home-to-work spillover rarely or never
interfered with their job concentration.
I investigated three related questions about factors that affect workers’ use of the
scheduling options, their domestic spillover, and the relationship between workers’ use
and their home-to-work spillover using models that allow reciprocal effects: (1) What
determines employees’ use of MW’s alternative work arrangements? (2) What factors
influence employees’ home-to-work spillover? (3) What is the relationship between
employees’ decisions to use the options and their domestic spillover?
Determinants of workers’ use of AWAs. I examined three sets o f factors
associated with employees use of AWAs: job factors influencing workers need and ability
to use AWAs, job factors related to the perceived risk of using AWAs, and personal and
household characteristics that should affect need. The influence o f job and personal
factors related to workers’ ability and need to use the options differed between AWAs.
The expected positive influence of high organizational status and autonomy—job factors
associated with workers’ ability to use the options—was limited to employees’ use of
flextime. The influence o f job demands was restricted to the positive effect o f job
complexity on workers’ use of CWW. The interdependent nature of jobs indicated by
167
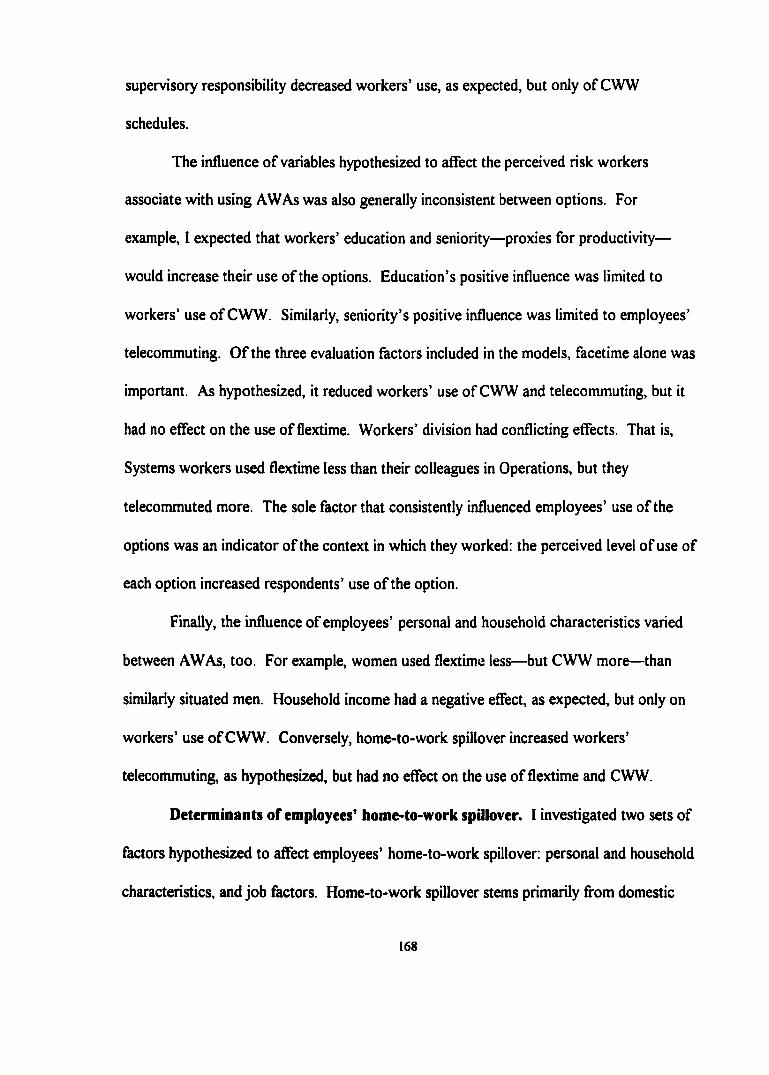
supervisory responsibility decreased workers’ use, as expected, but only of CWW
schedules.
The influence of variables hypothesized to affect the perceived risk workers
associate with using AWAs was also generally inconsistent between options. For
example, I expected that workers’ education and seniority—proxies for productivity—
would increase their use of the options. Education’s positive influence was limited to
workers’ use of CWW. Similarly, seniority’s positive influence was limited to employees’
telecommuting. O f the three evaluation factors included in the models, facetime alone was
important. As hypothesized, it reduced workers’ use of CWW and telecommuting, but it
had no effect on the use of flextime. Workers’ division had conflicting effects. That is.
Systems workers used flextime less than their colleagues in Operations, but they
telecommuted more. The sole factor that consistently influenced employees’ use of the
options was an indicator of the context in which they worked; the perceived level o f use of
each option increased respondents’ use o f the option.
Finally, the influence of employees’ personal and household characteristics varied
between AWAs, too. For example, women used flextime less—but CWW more—than
similarly situated men. Household income had a negative effect, as expected, but only on
workers’ use o f CWW. Conversely, home-to-work spillover increased workers’
telecommuting, as hypothesized, but had no effect on the use of flextime and CWW.
Determinants of employees’ home-to-work spillover. I investigated two sets of
factors hypothesized to affect employees’ home-to-work spillover: personal and household
characteristics, and job factors. Home-to-work spillover stems primarily from domestic
168
obligations, as expected. Confirming my hypothesis, women experienced more spillover
than similarly situated men across models incorporating the three AWAs. In addition,
providing eldercare and having children (regardless o f age group) increased employees’
domestic spillover net o f other factors. Age was also important in models of spillover
with flextime and CWW: until workers reached their mid-30s, spillover increased at a
decreasing rate. The relationship between age and spillover then became negative.
As hypothesized, job flexibility—manifested in workers’ autonomy and their use of
alternative work arrangements—enhanced employees’ ability to balance their home and
work obligations. Employees’ ability to make job-related decisions consistently decreased
their domestic interference across models. Employees’ use of CWW and telecommuting
also reduced their domestic spillover. In sum, workers’ personal status, familial
composition, and care-giving responsibilities contributed to their home-to-work spillover,
but workers’ job flexibility mitigated that spillover.
The relationships between work-to-home spillover and the use of AWAs.
Employers and employees have assumed that work-home conflict and the use o f flexible
scheduling options are related, but the nature of that relationship has not been clear.
Understanding the causal connections between home-to-work spillover and AWAs will
help employers devise effective strategies to address workers’ domestic spillover, and it
will provide evidence to advocates of AWAs that flexible scheduling options reduce
workers’ spillover.
My analyses suggest that the relationship between employees’ domestic spillover
and their use of an AWA depends on the scheduling option. In my analyses,
169
telecommuting had a reciprocal relationship with domestic spillover. Telecommuting
reduced employees’ spillover, and spillover increased workers’ telecommuting. The
relationship between CWW and spillover was recursive. CWW scheduling decreased
employees’ home-to-work spillover. Flextime and spillover, however, had no significant
relationship. CWW and telecommuting, then, are eflfective strategies employers can oflFer
and workers can use to reduce spillover at work. Moreover, workers with spillover are
likely to increase their telecommuting.
Conclusions and Discussion
My analyses provide evidence for five summary conclusions.
Work Context Is Important
First, my study confirms research that the context in which employees perform
their work is a key influence on both managers’ decisions to make the options available
and employees’ decisions to use AWAs (Hammonds et al. 1997:98; Bailyn 1993;
Schwartz 1994:36-8; Rodgers 1992:191; Starrels 1992:260; Galinsky et al. 1991: 84-6).
Both contextual variables in the access models (division and policy awareness) were
important, as were the contextual variables in the use models (division and estimated
levels o f departmental use of the options). Indeed, employees’ division was the only
consistent predictor o f workers’ access to AWAs Similarly, the estimated level of
departmental use o f each AWA was a strong and consistent predictor across models o f
use. The context in which MW employees work, then, shapes employees’ access to and
use of alternative work arrangements.
170
The importance of contextual factors underscores the schism between MW’s
official adoption o f the Human Resources’ policy and evidence of organizational support
for it. For example, top MW and Inland officers I interviewed expressed pride in the
company’s work-home policy and touted AWAs’ ability to help employees balance their
competing work and home obligations. However, few MW respondents could identify
any senior MW or Inland officer who publicly advocated for AWAs No informants could
identify an officer who used an AWA. Informants could not identify specific articles or
other information that they had received from MW or Inland about AWAs, either. Indeed,
only two memos announcing the policy were sent to managers and supervisors in the
spring of 1995, and a single article announcing the policy appeared shortly thereafter in the
corporate newsletter. Moreover, half o f the MW managers across the three divisions
either did not have A Guide to Implementing Alternative Work Arrangements or thought
the managerial guidelines were unclear. Finally, the employee handbook devotes only one
o f400 pages to the policy and procedures for employees’ use of AWAs (see Appendix G).
In sum, there is sparse evidence of overt corporate support for the policy, and this
subtly influences both the availability and use of alternative work arrangements. Because
the context of work influences managers’ decisions about making the options available,
the lack of overt support undermines MW’s and Inland’s avowed desire for policy
implementation. Similarly, the lack of overt support influences workers’ decisions about
requesting and using the options. Prior research, my analyses, and MW informants
suggest that more explicit support o f the AWAs at the corporate, division, department,
and workgroup level would increase MW employees’ requests for and use of the options
171
by reducing the perceived risk attached to the use of AWAs (Haas and Hwang 1995;
Schwartz 1994; Starrels 1992:260-1). This contrasts with Hochschild's argument (1997)
that employees resist AWAs because they prefer work to home.
The Variation in AWAs’ Flexibility Has Implications for Managerial Support
The degree alternative work arrangements deviate from tradition work
arrangements also has implications for their implementation. Managers reported the most
support among their colleagues for flextime (the option that deviates the least from
traditional work arrangements) and the least support for telecommuting (the option that
deviates the most). Workers’ access to the options mirrors these differences in perceived
managerial support: workers had the greatest access to flextime and the least access to
telecommuting. The options’ history within the firm reflects this pattern, as well.
Workers had informal access to flextime for decades. CWW was also informally available,
but less widely or for as long. Access to telecommuting was rare prior to the adoption of
MW’s work-home policy.
Indeed, the complexities of overseeing subordinates using nontraditional work
arrangements are a key reason managers did not support AWAs. It is easy to understand
why. Managers must be able to coordinate schedules, design reasonable and equitable
workloads for subordinates, and build in sufficient time frames for the completion o f work.
The greater the number o f subordinates who use AWAs—and the greater the variety of
options used—the more complicated it becomes for managers to perform their jobs and
ensure productivity. Managers who rely on direct control of their subordinates and who
use traditional means of evaluating job performance (such as hours at work) are ill
172
equipped to oversee employees using AWAs. Thus, these managers are unlikely to
support AWAs and, a priori, they are unlikely to effectively manage workgroups whose
members use alternative work arrangements.
Managerial Idiosyncrasy Influences Implementation
By definition, managers with the discretion to implement the options also have the
opportunity to make idiosyncratic decisions. Moreover, managers' lack of information
about the implementation criteria encourages idiosyncratic decision making. A variety of
evidence establishes that managerial support for AWAs is, in part, idiosyncratic. For
example, residual factors must be at work because job, personal, household, and
workplace characteristics do not explain much of the variation in MW workers’ access to
AWAs In addition, MW informants agreed that workers performing the same job within
departments and within workgroups did not have equal access to the options. Managers
within the same work group, for example, required different levels of justification before
making the options available to their subordinates. And informants at all job levels
acknowledged that some managers refused to make AWAs available to anyone, regardless
o f the job, employee, cost-benefit ratio, or AWA. Managers’ idiosyncratic decision
making, however, results in the inequitable implementation of MW’s work-home policy.
Implementation as a Work-/fome Policy
Consistent with MW’s intent to create a work-Ao/we rather than a 'Mox\/i-family
policy, employees’ personal and household characteristics had little influence on workers’
access to the options. Women and men, married and single workers, and those with and
without children under the ages o f 13 had equal access to the options. The only personal
173
characteristic that increased workers’ access to AWAs—specifically, to CWW and
telecommuting—was employees’ responsibility for eldercare. Thus, there is little support
for employers’ and employees’ concerns that work-home policies unfairly benefit
employees with family and care-giving obligations (Khan 1994:3; Bailyn 1993:145;
Grossman 1993:R8).
Work-Home Policy’s EfTectiveness Is Ambiguous
From the firm’s point of view, the effectiveness of MW’s work-home policy is
ambiguous. MW adopted the policy to help employees balance their work and home
obligations and thereby increase the recruitment and retention of skilled workers.
Productivity was the paramount consideration for managers determining workers’ access
to the options. As a strategy to reduce work-home conflict, the policy is successful:
CWW and telecommuting decrease the frequency that workers’ domestic spillover
interferes with their work. I found no evidence, however, that managers considered
workers’ skill or productivity (indicated by education and seniority as proxies) when
determining the availability of the options. In addition, my study could not evaluate the
effect o f AWAs or spillover on job performance because MW lacks measures o f individual
workers’ productivity.^
Individual measures o f productivity in knowledge jobs such as those o f Systems and Actuarial workers are virtually nonexistent. Projects are the “products” and completion on time is the measure of performance. With constantly changing projects and timefi'ames, the ambiguous definition of “outcomes” make it difiBcult to gauge short-term productivity. Operations workers’ productivity can be more easily measured by the number o f transactions they complete within a specified timeframe, but Operations does not use individual measures of productivity.
174
Limitations of the Study and Recommendations for Future Research
Additional research is needed to address questions left unanswered due to the
limitations of my study.
Temporal Limitations
Studies of employee spillover and its negative relationship to job performance have
assumed that workers’ domestic interference precedes and induces employees to use
AWAs. Our social world is not always so orderly, however. For example, workers who
initiate an AWA for one reason, such as personal convenience, may find themselves with
increased spillover stemming from the addition of care-giving responsibilities later (e.g.,
the birth of a child or the illness of a parent).
Unfortunately, the cross-sectional design of this study does not allow me to
analyze the relationships between employees’ use of alternative work arrangements and
workers’ domestic spillover over time. Longitudinal analyses incorporating pre- and post
measures of employees’ spillover based on time diaries (for accurate measures of
spillover) and workers’ use o f alternative work arrangements—in tandem with qualitative
information about changes in employees’ spillover—would clarify the causal relationships.
Employees’ Access to AWAs
Research in firms where access is universal and employees’ use o f AWAs has no
negative career implications is also necessary to further define the nature of the
relationships between spillover and AWAs. Not all MW employees who would like to use
AWAs had access, nor did all employees who had access to the options feel free to use
them. However, limiting my analyses to workers with access would have eliminated
175
employees with domestic interference and therefore biased the options’ effects on home-
to-work spillover—as well as spillover’s effect on the AWAs. Indeed, the determinants of
employees’ use of the options and the determinants of their spillover (and hence the nature
of the relationship between spillover and the use of AWAs) would be unbiased only if two
conditions were met; (1) all employees in the sample had access to the options, and
(2) employees perceived no risk in using the options. This is not the case in my study,
however. Thus, the limited implementation of the options and the perceived risk of using
AWAs restricts my study’s findings about the determinants of and causal relationships
between spillover and workers’ use of AWAs.
Selection Bias
My sample pool did not include former employees who had resigned or been fired
because of their work-home conflict. Evidence that those employees had been using
AWAs would undermine my finding that workers’ use of AWAs reduces their spillover.
MW does not perform exit interviews, however, so there is no data about the reasons the
employees left. Thus, I am unable to clarify whether the exclusion of these workers from
the sample pool biased my results. Future interviews with MW human resources
personnel and former MW employees will help determine the extent of the bias.^
Turnover at MW is approximately 16 percent, although it tends to be higher in the Operations division than elsewhere. Anecdotal evidence suggests that MW offers more flexibility than many other area firms, and that employees value it. Indeed, one informant related that she had left MW for more pay, but came back to the firm because it offered the flexibility she needed to balance work and home obligations.
176
Generalizability
MW mirrors other firms across the country in its rationale for adopting the policy
and the implementation process it uses. Like other firms, MW adopted the policy as a
means to recruit and retain employees for its labor-intensive workforce in an area with a
low unemployment rate (Witkowsky 1999:226; Galinsky et al. 1991:81). And like other
firms that permit AWAs, managers have the discretion to implement the options so that
access is not universal (Hochschild 1997:96; Rodgers 1992:191; Starrels 1992:261;
Galinsky et al. 1991:84-6).
In addition, my study Involves three distinct divisions that reflect a variety of work
contexts across firms. That is, the divisions’ goals, rules of operation, measures of
productivity, size, workforce composition, and culture differ. Therefore, the analyses take
into account variations between production and support units, between customer- and
technologically-oriented units, between professional and nonprofessional units, between
predominantly female and predominantly male workgroups, and between hierarchical and
less bureaucratic workgroups. The divisions also represent a variety of modes of
production that allow workers varying degrees of flexibility in their schedules.
Moreover, key findings of my study confirm prior research. The context in which
workers perform their jobs is an important influence on workers’ access to and use of
AWAs (Hochschild 1997: 25; Schwartz 1994:41-2; Bailyn 1993; Kingston 1990:443;
Raabe 1990:483-4). Management’s and managers’ support of the options, in part
idiosyncratic, plays a pivotal role in AWAs’ implementation (Hochschild 1997:32; Gallo
1993:29; Bailyn 1993; Rodgers 1992:189; Kingston 1991:446; Christiansen and Staines
177
1990:462; Friedman 1987:1). AWAs vary in their ability to reduce spillover (Raabe
1990:482; Bohen and Viveros-Long 1981). This agreement with prior studies’ findings
suggests that the main results of my case study are generalizable to other firms that do not
make AWAs available to all employees.
Nevertheless, Midwest Securities may be unique in ways that restrict the
generalizability o f my findings. MW is a rapidly growing for-profit financial services
organization within a highly competitive industry. MW’s predominantly female workforce
holds white-collar “knowledge jobs” that involve the creation and management of
information. Research involving both service and manufacturing firms, then, is needed to
further define the influence that managerial idiosyncrasy, work context, and workers’
needs have on employees’ access to and use of AWAs. Similarly, across-firm research
using reciprocal analyses will refine our understanding of the relationship between the
workers’ spillover and their use of AWAs.
Expanding the Research Focus
Many facets of the work-home nexus remain to be examined. My study suggests
three areas in particular. First, reciprocal analyses are needed that incorporate time-series
data for a variety o f measures o f home-to-work spillover (such as psychological distress,
absenteeism, and lack of energy at work)— as well as the full range of alternative work
arrangements (including options involving reduced time on the job). This would expand
our understanding of the relationships between AWAs and work-home conflict in general,
and help firms design comprehensive and effective work-home policies.
178
Related to that, the absence of concrete measures of individual productivity in MW
leaves unanswered key questions about the relationships between productivity, spillover,
and AWAs. Indeed, it is difGcult for firms to see the connection between individual and
organizational productivity, between spillover and productivity, and between AWAs and
productivity in the absence of such measures. Thus, longitudinal research is needed in
firms that have such measures to accurately gauge the effects o f spillover and AWAs on
workers’ Job performance over time.
Finally, managerial discretion lies at the heart of the idiosyncratic implementation
of work-home policies. To more fully understand the roots o f managers’ idiosyncratic
support, future research needs to assess specific managerial experiences and characteristics
(such as managers’ background in the firm and personal traits) that shape managers’
attitudes about AWAs and about subordinates who use them. I was unable to use
clustered samples of managers and their subordinates, but such samples would avoid
potential bias introduced by respondents’ perceptions about such things as their managers’
decision-making processes.
Recommendations
The influence o f management permeates the design, implementation, and use of a
firm’s work-home policy. Senior management defines the rationale and purpose of the
policy. Top management also decides who has the power to implement the policy. When
firms grant managers the discretion for implementation, employees infer that senior
management believes alternative work arrangements may cause problems for managers
179
and the company (Lewis 1997:15-6; Rapoport and Bailyn 1996:19). And if AWAs
complicate managers’ and coworkers’ jobs, workers’ use of AWAs may indeed be a
problem. This risk becomes a part of the corporate culture that subsequently affects
managers’ support of the AWAs, as well as workers’ requests for and use of the options.
Yet by granting managerial discretion, firms foster idiosyncratic—and thus inequitable—
access to and use of the options.
Firms that want to reduce the risk managers and workers associate with AWAs, as
well as assure the equitable implementation and eflfective use of AWAs, should pursue two
strategies. The first is to adopt the work-home policy as an integral corporate strategy
related to productivity, and publicize the policy as such. The second is to ensure that the
managers have the skills and tools necessary to equitably and effectively implement the
policy.
Integrating and Marketing the Work-home Policy
First, top management must emphasize its faith in, and support o f alternative work
arrangements by making the work-home policy a key corporate strategy. That is, if firms
believe that AWAs are important tools to recruit and retain valued employees and increase
workers’ eflRciency, the work-home policy needs to be implemented and publicized as an
integral corporate strategy to improve productivity. Adoption of work-home policies as
human resource programs marginalizes the programs, because the policies are then only
peripherally linked to employee and corporate performance (Rapoport and Bailyn
1996; 12). This separation of work-home policies from core corporate policies also
180
appears to pit employees’ work-home balance against organizational productivity (Bailyn
1993:121).
To underscore management’s support of AW As and the options’ effectiveness,
firms can market the work-home policy within the company. Research has suggested that
a “champion ”—a top oflBcer who publicly advocates for and educates others about the
options—is important to the successful implementation o f work-home policies (Rodgers
1992:191; Galinsky et al. 1991:50). Internal publications can also regularly highlight
AW A “success stories” to inform employees of the procedures for and outcomes of the
work-home policy. Similarly, new employees’ orientations and managerial trainings
should make it clear that top management supports employees’ requests for the options,
managers’ decisions to make the options available, and employees’ decisions to use the
options.
In keeping with Ranter’s (Kanter 1977a:63) thesis o f homosocial reproduction
with its “pressures for on-site and off-work conformity” among managers—and mirroring
the approach in cutting-edge family-fiiendly firms (Conlin 1999:94; Shellenbarger
1999:31; Biddle 1999:A l; Shellenbarger 1997c:Bl)‘‘—perhaps the most effective way to
achieve managerial support of a work-family balance is to have top management model it.
A MW manager described the influence of the firm’s top executives on managerial and
company norms: “If the CEO of the company starts wearing shorts [to work], we’ll all
start wearing shorts.” Thus, if firms want employees to balance their work-home
obligations and believe AWAs will help them achieve that balance, ofBcers and managers
181
need to demonstrate their belief in and acceptance of AWAs by using them. More than
any other strategy, top management’s use of AWAs signals that alternative schedules are
normative, and that employees’ use of AWAs does not hinder career advancement. As a
senior MW officer argued, “More and more, the senior executives—in particular—need...
to have their boss say, ‘Hey, it’s not all work. I have these responsibilities at home, and I
can’t be here at such-and such a time because of them.’ [We’ve got to learn] it’s OK to
say that.”
Ensuring Managers Have the Necessary Skills and Tools for Policy Implementation
The second strategy to reduce inequitable access to the options and to ensure the
effectiveness of AWAs focuses on the managers who are responsible for policy
implementation. If firms are serious about implementing AWAs, they must ensure that
managers have the skills and tools needed to oversee workers on alternative schedules.
For example, if firms want managers to use a specific set of criteria when determining the
availability o f AWAs, the companies must make sure managers have and understand the
criteria. In addition, job-related problems that result from employees’ use o f AWAs (such
as workgroup delays, uneven work loads and overtime among workers, and employees’
abuse o f the options) are rooted in poor planning, coordination, communication, and
employee training. As other researchers have argued, managerial training that addresses
these issues should reduce managers’ resistance to AWAs and increase their ability to
supervise workers using a variety of work arrangements (Cowans 1994:6; Schwartz
1994:56; Rodgers 1992:192). Restructuring work may also decrease the potential for
* The Arms include some of the largest companies in the U.S., such as IBM and AT&T, as well as smaller companies experiencing rapid growth, such as Apple
182
problems. MW managerial and nonmanagerial informants agreed, for example, that
working in teams and employee cross-training fostered increased cooperation,
communication, and accomplishment within workgroups whose members used AWAs.
If firms tie their work-home policies in any way to productivity or the recruitment
and retention o f productive employees, they must provide managers with individual
measures of employees’ short-term and long-term productivity to accurately gauge the
effects of employees’ use of AWAs. In the absence of such information, managers who
must ensure productivity have little cause to make the options available, particularly if
implementation threatens to complicate supervision. Similarly, employees without such
measures have little data upon which to build a case for their use of options.
Conclusion
My research provides evidence that AWAs reduce home-to-work spillover.
However, firms that value the timeframes of employees’ work—traditional schedules and
linear career paths—rather than the results of that work, and the constant availability of
workers and mandatory overtime rather than strategic planning and staffing—must change
their values before alternative work arrangements can become normative work
arrangements.
Computer’s Newton unit and Charter Communications in St. Louis.183
BIBLIOGRAPHY
Acker, Joan. 1990. “Hierarchies, Jobs, and Bodies; A Theory of Gendered Organizations." Gender and Society 4:139-58.
Arbuckle, James L. 1997. Amos Users'Guide Version 3.6. Chicago: SmallWaters Corp.
Asher, Herbert B. 1983. Causal Modeling. Newbury Park: Sage.
Bailyn, Lotte. \993. Breaking the Mold. New York: The Free Press.
Bailyn, Lotte. May, 1995. “The Impact of Corporate Culture on Work-Family Integration. Talk given at the Drexel University 5“* International Stein Conference; reproduced by Radcliffe Public Policy Institute.
Bailyn, Lotte, Joyce K. Fletcher, and Deborah Kolb. 1997. “Unexpected Connections: Considering Employees’ Personal Lives Can Revitalize Your Business.” Sloan Management Review Summer: 11-9.
Bankert, Ellen C. and Bradley K. Googins. 1996. “Family-Friendly— Says Who?”Across the Board (July/August):45-49.
Barnett, Rosalind C. 1994. “Home-to-Work Spillover Revisited: A Study of Full-Time Employed Women in Dual-Earner Couples.” Journal o f Marriage and the Family 56:647-56.
Barnett, Rosalind C. and Caryl Rivers. 1996. She Works/He Works: How Two-Income Families Are Happier, Healthier, and Better O ff San Francisco: HarperSanFrancisco.
Baron, James N. 1984. “Organizational Perspectives on Stratification.” Annual Review o f Sociology 84:37-69.
Belsley, David, Edwin Kuh, and Roy Welsch. 1980. Regression Diagnostics: Identifying Influential Data and Sources o f Collinearity. New York: John Wiley and Sons.
Bentler, P.M. and D. G. Bonett. 1980. “Significance Tests and Goodness of Fit in the Analysis of Covariance Structures.” Psychological Bulletin 88:588-606.
184
Bergmann, Barbara R. 1986. The Economic Emergence o f Women. New York: BasicBooks.
Bems, Pam and Jim Beras. 1992. “Good for Business: Corporations Adopt the Family.” Management Review (September):34-38.
Berry, William D. 1984. Nonrecursive Causal Models. Newbury Park, CA: Sage.
Biddle, Frederic M. 1999. “Work Week.” Wall Street Jotimal (September I5):Al.
Bohen, H.C. and A. Viveros-Long. 1981. Balancing Jobs and Family Life: Do Flexible Work Schedules Help? Philadelphia: Temple University Press.
Bolger, Niall, Anita de Longes, Ronald C. Kessler, and Elaine Wethington. “The Contagion of Stress Across Multiple Roles.” Journal o f Marriage and the Family 51:175-183.
Bollen, Kenneth A. 1989a. Structural Equations with Latent Variables. New York: John Wiley and Sons.
Bollen, Kenneth A. 1989b. “A New Incremental Fit Index for General Structural Equation Models. Sociological Methods and Research 17:303-316.
Bond, James T., Ellen Galinsky, and Jennifer E. Swanberg. 1998. The 1997 National Study o f the Changing Workforce. New York: Families and Work Institute.
Boomsma, A 1987. “The Robustness o f Maximum Likelihood Estimation in Structural Equation Models.” Pp. 160-188 in Cuttance, P. and R. Ecob (eds.) Structural Modeling by Example: Applications in Educational, Sociological, and Behavioral Research. Cambridge University Press.
Bose, Christine E. 1987. “Dual Spheres.” Pp. 267-85 in Beth B. Hess and Myra Marx Ferree (eds.). Analyzing Gender: A Handbook o f Social Science Research. Newbury Park, CA: Sage.
Browne, M. W. and R. Cudeck. 1993. “Alternative Ways of Assessing Model Fit.” Pp. 136-162 in Bollen, K.A. and J.S. Long (eds.) Testing Structural Equation Models. Newbury Park, CA: Sage.
Caproni, Paula J. 1997. “Work/Life Balance: You Can’t Get There from Here.” Journal o f Applied Behavioral Science 33(l):46-56.
Chapman, Fern Schumer. 1987. “Executive Guilt: Who’s Taking Care o f the Children?” Fortune (February 16):30-37.
185
Christensen, Kathleen E. and Graham L. Staines. 1990. “Flextime: A Viable Solution to Work/Family Conflict?” The Journal o f Family Issues 11(4):455-76.
Clogg, Clifford C. and Edward S. Shihadeh. 1994. Statistical Models fo r Ordinal Variables. Thousand Oaks, CA: Sage.
Coltrane, Scott. 1996. Family Man: Fatherhood, Housework, and Gender Equity. New York: Oxford University Press.
Conlin, Michelle. 1999. “9 to 5 Isn’t Working Anymore.” Business Week (September 20):94,98.
Converse, Jean M. and Stanley Presser. 1986. Survey Questions. Newbury Park, CA; Sage.
Coser, Lewis. 1974. Greedy Institutions: Patterns o f Undivided Commitment. New York: The Free Press.
Coverman, Shelley. 1983. “Gender, Domestic Labor Time, and Wage Inequality.” American Sociological Review 48 (Oct.):623-37.
Cowans, Deborah Shalowitz. 1994. “Work/Family Benefits: New Work Options Increase Flexibility.” Business Insurance (July 25):3,6.
Crosby, Faye J. 1991. Juggling: The Unexpected Advantages o f Balancing Career and Home fo r Women and Their Families. New York: The Free Press.
Daly, Kerry J. 1996. Families and Time: Keeping Pace in a Hurried Culture. Thousand Oaks CA: Sage.
Davis, James Allen and Tom W. Smith; General Social Surveys, 1972-1994 [machine- readable data file.] Principal Investigator, James A Davis; Director and Co-Principal Investigator, Tom W Smith. NORC ed. Chicago: National Opinion Research Center, producer 1994; Storrs, CT: The Roper Center for Public Opinion Research, University of Connecticut, distributor.
Doerpinghaus, Helen I. and Daniel C. Feldman. 1993. “Employee Benefit Packages for Part-Time Workers.” Benefits Quarterly Second Quarter:72-82.
Edwards, Richard. 1979. Contested Terrain. BasicBooks.
Eisenberg, Daniel. 1998. “Family Secrets at Work.” Time (August 27):64.
186
Eliason, Scott R. 1990. The Categorical Data Analysis System. Version 3.5 User’s Manual. Department of Sociology, University of Iowa.
Emien, Arthur and Paul Koren. 1984. Hard to Find and Difficult to Manage: The Effects o f Child Care on the Workplace. Regional Research Institute for Human Services, Portland State University, Portland OR.
Ettner, Susan L. 1995. “The Impact o f Parent Care’ on Female Labor Supply Decisions.” Demography 32(l):63-80.
Families and Work Institute. 1991. The National Study o f the Changing Workforce.New York.
Ferber, Marianne A. and Brigid 0 ’Farrell with La Rue Allen. 1991. Eds. Work and Family: Policies fo r a Changing Work Force. Panel on Employer Policies and Working Families, Washington, D C : National Academy Press.
Ferree, Myra Marx. 1987. “She Works Hard for a Living: Gender and Class of the Job.” Pp. 322-47 in Hess, Beth B. and Myra Marx Ferree (eds.). Analyzing Gender: A Handbook o f Social Science Research. Newbury Park, CA: Sage.
Ferree, Myra Marx. 1991. “Beyond Separate Spheres: Feminism and Family Research.” Pp. 103-121 in Booth, Alan (ed.). Contemporary Families: Looking Forward, Looking Back. Minneapolis MN: National Council on Family Relations.
Friedman, Dana E. 1987. Family-Supportive Policies: The Corporate Decision-Making Process. New York: The Conference Board, Inc.
Friedman, Dana E. 1991. Linking Work-Family Issues to the Bottom Line. New York: The Conference Board, Inc.
Friedman, Dana and Ellen Galinsky. 1990. “Who Makes the Best (and Worst) Boss?” Working M other (July):56-60.
Friedman, Dana E., Ellen Galinsky, and Veronica Plowden. Eds. 1992. Parental Leave and Productivity. New York: Families and Work Institute.
Friedman, Dana E. and Arlene A. Johnson. 1991. “Strategies for Promoting a Work- Family Agenda.” New York: The Conference Board, Inc.
Galinsky, Ellen. 1992. Work and Family: 1992, Status Report and Outlook. New York: Families and Work Institute.
187
Galinslcy, Ellen and James T. Bond. 1996. “Work and Family: The Experiences of Mothers and Fathers in the U.S. Labor Force.” Pp. 79-103 in Costello, Cynthia and Barbara BCivimae Krimgold (eds.). The American Woman 1996-97. Volume 6, Women’s Research and Education Institute: Washington, D C
Galinsky, Ellen, James T. Bond, and Dana E. Friedman. 1993. The Changing Workforce: Highlights o f the National Study. New York: Families and Work Institute.
Galinsky, Ellen, Dana E. Friedman, and Carol A. Hernandez. 1991. The Corporate Reference Guide to Work-Family Programs. New York: Families and Work Institute.
Galinsky, Ellen and Peter J. Stein. 1990. “The Impact of Human Resource Policies on Employees.” The Journal o f Family Issues 11(4):368-83.
Gallo, Kathy. 1993. “Getting a Work-Family Program Started.” Pp. 29-30 in Friedman, Dana E. and Theresa Brothers (eds ), Work-Family Needs: Leading Corporations Respond. New York: The Conference Board, Inc.
Glass, Jennifer L. and Sarah Beth Estes. 1997. “ The Family Responsive Workplace.” Annual Review o f Sociology 23:289-313. Palo Alto C A: Annual Reviews Inc.
Glass, Jennifer and Tetsushi Fujimoto. 1994. “Employer Characteristics and the Provisions of Family Responsive Policies.” Presented at the 1994 annual meeting of the American Sociological Association, Los Angeles, CA.
Goodman, Leo A. 1987. “New Methods for Analyzing the Intrinsic Character of Qualitative Variables Using Cross-Classified Data.” American Journal o f Sociology 93:529-83.
Googins, Bradley K. 1991. Work/Family Conflicts: Private Lives—Public Responses. New York: Auburn House.
Graham, Ellen. 1995. “Working Parents’ Torment: Teens After School.” Wall Street Journal (May 9): B1.
Grossman, Laurie M. 1993. “What About Us?” Wall Street Journal Reports (June 21): R8.
A Guide to Implementing Alternative Work Arrangements. 1995. Inland Enterprise.
Haas, Linda and Philip Hwang. 1995. “Company Culture and Men’s Usage of Family Leave Benefits in Sweden.” Family Relations 44:28-36.
188
Hall, D. 1990. “Promoting Work/Family Balance; An Organizational Change Approach.” Organizational Dynamics (Winter):5-17.
Hammonds, Keith H., with Roy Furchgott, Steve Hamm, and Paul C. Judge. 1997. “Work and Family Special Report.” Business Week (September 15):96-99.
Hayden, Dolores. 1984. Redesigning the American Dream. New York: Norton.
Heimer, Carol A. 1996. “Gender Inequalities in the Distribution of Responsibility.” Pp. 241-273 in Baron, James N., David B. Grusky, and Donald J. Treiman (eds.), Social Differentiation and Social Inequality: Essays in Honor o f John Pock. Westview Press.
Hill, E. Jeffrey, Alan J. Hawkins, and Brent C. Miller. 1996. “Work and Family in the Virtual Office: Perceived Influences of Mobile Telework.” Human Relations 43:293-301.
Hochschild, Arlie with Anne Machung. 1989. The Second Shift. New York: Viking.
Hochschild, Arlie Russell. 1997. The Time Bind: When Work Becomes Home and Home Becomes Work. New York: Metropolitan Books.
Hoyle, Rick. H. 1995. “The Structural Equation Modeling Approach.” Pp. 1-15 in R. H. Hoyle (ed ). Structural Equation Modeling. Newbury Park, CA: Sage.
Huber, Joan and Glenna Spitze. 1983. Sex Stratification: Children, Housework, and Jobs. New York: Academic.
Ingram, Paul and Tal Simons. 1995. “Institutional and Resource Dependence Determinants of Responsiveness to Work-Family Issues.” Academy o f Management Journal 38(5): 1466-82.
1997 Inland Annual Report. 1997. Inland Enterprise.
Jackall, Robert. \9%%. M oral Mazes. New York: Oxford University Press.
Jacobs, Jerry A. 1992. “Women’s Entry into Management: Trends in Earnings,Authority, and Values among Salaried Managers.” Administrative Science Quarterly 37:282-301.
Jacobs, Jerry A. and Kathleen Gerson. 1991. “Do Americans Feel Overworked?: Comparing Ideal and Actual Working Time.” Pp. 71-95 in Parcel, T.L. and D. B. Cornfield (eds ). Work and Family: Research Itiforming Policy. Thousand Oaks CA: Sage.
189
Johnson, Arlene and Fabian Linden. 1992. Availability o f a Quality Workforce. R-IOIO- 92: The Conference Board, Inc.
Jokeskog, K. G., and Sorbom, D. 1984. USREL-VI User's Guide (3'' ed.). Mooresville, IN: Scientific Software.
Kanter, Rosabeth Moss. 1977a. Men and Women o f the Corporations. BasicBooks.
Kanter, Rosabeth Moss. 1977b. Work and Family in the United Slates: A Critical Review and Agenda fo r Research and Policy. New York: Russell Sage Foundation.
Kamerman, Sheila B. and Alfred J. Kahn. 1987. The Responsive Workplace. New York: Columbia University Press.
Kelly, Erin. 1999. “Becoming Family-Friendly: Work-Family Program Innovation Among the Largest U.S. Corporations.” Pp. 169-202 in Hodson, Randy (senior ed.) and Toby L. Parcel (volume ed ). Research in the Sociology o f Work: Work and Family, Volume 7. Stamford CT: JAI Press.
Khan, Sameera. 1994. “’Family Perks of No Benefit to Many Employees.” Business Insurance (July 25):3-4.
Kingston, Paul W. 1990. “Illusions and Ignorance About the Family-Responsive Workplace.” Journal o f Family Issues 11(4):438-54.
Kmec, Julie A. and Kathryn Barry. 1997. "When Paid Work Interrupts Family Life: Determinants of Job-Family Conflicts." Presented at the American Sociological Association Annual Conference. August, 1997. Toronto, Canada.
Knecht, G. Bruce. Nov. 22, 1995. “Do You Know Me? As American Express Loses Its President, His Kids Gain a Dad.” Wall Street Journal (Nov. 22): Al.
Kofodimos, Joan. 1997. “Interpreting Lessons Learned.” Journal o f Applied Behavioral Science 33(l):57-63.
Kunda, Gideon. 1992. Engineering Culture: Control and Commitment in a High Tech Corporation. Philadelphia: Temple University Press.
Kwolek-Folland, Angel. 1994. Engendering Business: Men and Women in the Corporate Office, 1870-1930. Baltimore: Johns Hopkins University Press.
Laborforce 2000 Survey. Harris and Associates. New York; The Conference Board.
190
Leiter, Michael P. and Marie Josette Dump. 1996. "Work, Home, and In-Between: A Longitudinal Study o f Spillover.” Journal o f Applied Behavioral Science 32 (l):29-47.
Lennon, Mary Clare and Sarah Rosenfield. 1994. "Relative Fairness and the Division of Housework: The Importance of Options.” American Journal o f Sociology 100 (2):506- 31.
Leonard, Mary. 1997. “For Many, the Perfect Christmas Bonus is Time.” The Columbus Dispatch. December 21, I997:3J.
Leslie, Leigh A., Elaine A Anderson, and Meredith P. Branson. 1991. "Responsibility for Children; The Role o f Gender and Employment.” Journal o f Family Issues 12(2): 197- 210.
Lewin, Tamar. 1995. "Workers of Both Sexes Make Trade-Offs for Family, Study Shows.” New York Times (Oct. 29):25.
Lewis, Suzan. 1997. "’Family Friendly’ Employment Policies: A Route to Changing Organizational Culture or Playing About at the Margins?” Gender, Work and Organizations 4(1): 13-23.
Lewis-Beck, Michael. 1980. Applied Regression: An Introduction. Sage University Paper.
Lewis, S. and K. Taylor. 1996. “Evaluating the Impact of Family-Friendly Employment Policies: A Case Study.” In S. Lewis and J. Lewis (eds.) The Work-Family Challenge. Rethinking Employment. London: Sage.
Linden, Dana Wechsler. July 4,1994. "The Class o f ’65.” Forbes 154(l):92-S.
Lobei, Sharon Alisa. 1992. "A Value-Laden Approach to Integrating Work and Family Life.” Human Resource Management 3 1(3):249-265.
Long, J. Scott. 1997. Regression Models fo r Categorical and Limited Dependent Variables. Thousand Oaks, CA: Sage.
MacCallum, Robert C. 1995. "Model Specification: Procedures, Strategies, and Related Issues.” Pp. 16-35 in R. H. Hoyle (ed.), Structural Equation Modeling. Newbury Park, CA: Sage.
McCullough, Jill. 1999. “With Phones and Fax Machines, HR Types Take on Telecommuters ” Business First (August 13):8a-10a.
191
Menaghan, Elizabeth G. and Toby L. Parcel. 1990. “Parental Employment and Family Life: Research in the 1980s.” Journal o f Marriage and the Family 52:1079-98.
Milkman, Ruth. 1987. “Demobilization and the Reconstruction o f ‘Women’s Place” in Industry.” Chapter 7, pp. 99-127 in Gender at Work: The Dynamics o f Job Segregation by Sex during World War 11. Urbana: University o f Illinois Press.
Miller, Lisa. 1996. “Managing the Lives Travelers Leave Behind.” Wall Street Journal (Nov. 1):B1.
Milton, Sande. 1986. “A Sample Size Formula for Multiple Regression Studies.” Public Opinion Quarterly (50): 112-118.
Mirvis, Philip (ed.). 1993. “A Competitive Workforce: The Issues and the Study.”Pp. 1-31 in Mirvis, Philip (ed.) Building the Competitive Workforce. John Wiley and Sons.
Morgan, David L. 1997. Focus Groups as Qualitative Research (Second edition). Newbury Park, CA: Sage.
Morgan, Hal and Frances J. Milliken. 1992. “Keys to Action: Understanding Differences in Organizations’ Responsiveness to Work-and-Family Issues.” Human Resource Management 31(3):227-48.
Morris, Betsy. 1997. “Is Your Family Wrecking Your Career (and vice versa)?” Fortune (March 17):71-90.
Munch, Allison, J. Miller McPerson, and Lynn Smith-Lovin. 1997. “Gender, Children, and Social Contact: The Effects of Childrearing for Men and Women.” American Sociological Review 62:509-20.
Murphy, Sharon. 1993. “Managers Learn the Work-Family Lesson.” Pp.33-4 in Friedman, Dana E. and Theresa Brothers (eds ), Work-Family Needs: Leading Corporations Respond. New York: The Conference Board, Inc.
The National Report on Work and Family. 1999. “W/F Balance Becomes the Major Job Concern; Telework a Potential Solution.” Silver Springs MD:12(6):45.
Nippert-Eng, Christena E. 1996. Home and Work: Negotiating Boundaries Through Everyday Life. Chicago: University o f Chicago Press.
Papanek, Hanna. 1979. “Family Status Production: The ‘Work’ and ‘Non-Work’ o f Women.” Signs: Journal o f Women in Culture and Society 4(4):775-81.
192
Parker, Robert Nash and Rudy Fenwick 1983. “The Pareto Curve and Its Utility for Open-Ended Income Distributions in Survey Research.” Social Forces 61:872-85.
Perlman, Lawrence. 1993. “A Pregnant CEO: In Whose Lifetime?” Pp. 15-8 in Friedman, Dana E. and Theresa Brothers (eds.), Work-Family Needs: Leading Corporations Respond. New York: The Conference Board, Inc.
Pleck, Joseph. 1985. Working Wives/Working Husbands. Beverly Hills, CA: Sage.
Press, Julie E. and Eleanor Townsley. 1996. “Yet Another Gender Gap: Reporting Housework Contributions.” Unpublished.
Presser, Harriet B. 1989. “Can We Make Time for Children? The Economy, Work Schedules, and Child Care.” Demography 26(4):523-43.
Presser, Harriet B. 1994. “Employment Schedules among Dual-eamer Spouses and the Division of Household Labor by Gender.” American Sociological Review 59:348-64.
Presser, Harriet B. 1995a. “Job, Family, and Gender: Determinants of Nonstandard Work Schedules Among Employed Americans in 1991.” Demography 32(4):577-598.
Presser, Harriet B. 1995b. “Are the Interests of Women Inherently at Odds with the Interests of Children or the Family? A Viewpoint.” Pp. 297-319 in Mason, K O and A. Jensen (eds.). Gender and Family Change in Industrialized Countries. Oxford: Oxford University Press.
Raabe, Phyllis Hutton. 1990. “The Organizational Effects of Workplace Family Policies: Past Weaknesses and Recent Progress Toward Improved Research.” Journal o f Family Issues ll(4):477-9l.
Rapoport, Rhona and Lotte Bailyn. 1996. Relinking Life and Work: Toward a Better Future. New York: Ford Foundation.
Reskin, Barbara and Meg Flack. 1996. “Hard at Work: Gender, Families, and Jobs.” Presented at the American Sociological Association Annual Conference. August 19,1996. New York City.
Reskin, Barbara and Irene Padavic. 1994. Women and Men at Work. Thousand Oaks CA: Pine Forge Press.
Robinson, John P. and Geoflfrey Godbey. 1997. Time fo r Life: The Surprising Ways Americans Use Their Time. University Park PA; Pennsylvania State University Press.
193
Rodgers, Charles S. 1992. “The Flexible Workplace: What Have We Learned?” Human Resource Management 31(3): 183-99.
Schor, Juliet B. 1992. The Overworked American: The Unexpected Decline o f Leisure. New York: BasicBooks.
Schultz, J.B., Y.L. Chung, and D. G. Henderson. 1988. “Work/family Concerns of University Faculty.” Journal o f Social Behavior and Personality 3:249-64.
Schwartz, Debra B. 1994. An Examination o f the Impact o f Family-Friendly Policies on the Glass Ceiling. New York: Families and Work Institute.
Scott, W. Richard. 1992. Organizations: Rational, Natural, and Open Systems. Englewood Cliffs, NJ: Prentice-Hall, Inc.
Sellers, Patricia. 1996. “Women, Sex, and Power.” Fortune (August 5):42-56.
Shellenbarger, Sue. 1992. “Lessons from the Workplace: How Corporate Policies and Attitudes Lag Behind Workers’ Changing Needs.” Human Resources Management 31(3): 157-69.
Shellenbarger, Sue. 1994. “Many Employers Flout Family and Medical Leave Law.” fVall Street Journal (July 26) :B 1.
Shellenbarger, Sue. 1995. “Bill Galston Tells the President: My Son Needs Me More.” Wall Street Journal (June 21 ):B 1.
Shellenbarger, Sue. 1997a. “New Job Hunters Ask Recruiters, ‘Is There a Life After Work?’” Wall Street Journal (January 29):B 1.
Shellenbarger, Sue. 1997b. “We Take Better Care of Our Elderly Parents than Most Realize.” Wall Street Journal (March 12):B1.
Shellenbarger, Sue. 1997c. “More Corporations Are Using Flexibility to Lure Employees.” Wall Street Journal (September 17):B1.
Shellenbarger, Sue. 1998. “Three Fathers Reflect on the Exhausting Joys o f Bigger Role at Home.” Wall Street Journal (April 22) :B 1.
Shellenbarger, Sue. 1999. “Family-Friendly CEOs Are Changing cultures at More Workplaces.” Wall Street Journal (September 15):B1.
Shelton, Beth Anne. 1992. Women, Men, and Time: Gender Differences in Paid Work, Housework, and Leisure. Westport CT: Greenwood Press.
194
Shelton, Beth Anne and Daphne John. 1996. “The Division of Household Labor.” Ammal Review o f Sociology 22:299-322.
Sheth, Jagdish N. and Rajendra S. Sisodia. 1999. “Outsourcing Comes Home.” Wall Street Journal (June 28):A26.
Simon, Robin W. 1992. “Parental Role Strains, Salience of Parental Identity, and Gender Differences in Psychological Distress.” Journal o f Health and Social Behavior 33:25-35.
Smith, Barry D. and Judy Elmore Maese. 1998. “Diversity Trends in the Insurance Industry.” CPCU Journal 51(4):248-252.
Smolowe, Jill. 1996. “The Stalled Revolution.” Time (May 6):63.
South, Scott J. and Glenna Spitze. 1994. “Housework In Marital and Nonmarital Households.” American Sociological Review 59:327-347.
Spain, Daphne and Suzanne M. Bianchi. 1996. Balancing Act. New York: Russell Sage Foundation.
Spilerman, Seymour and Harris Schrank. 1991. “Responses to the Intrusion of Family Responsibilities in the Workplace.” Research in Social Stratification and Mobility 10:27-61.
Starrels, Maijorie E. 1992. “The Evolution of Workplace Family Policy Research.” The Journal o f Family Issues 13(3):259-78.
Thompson, Paul. 1990. The Nature o f Work. London: MacMillan Education Ltd.
University of California at Lose Angeles/Kom-Feny International. 1993. Decade o f the Executive Woman. Los Angeles: University of California at Los Angeles.
U.S. Bureau of the Census. 1996. Statistical Abstract o f the United States: 1996 (116“* edition.) Washington, DC.
U.S. Bureau of Labor Statistics. 1988. “BLS Reports on Employer Child Care Practices.” Bureau o f Labor Statistics News (January): 1-7.
West, Candace and Don H. Zimmerman. 1987. “Doing Gender.” Gender and Society 1(2): 125-51.
195
Witkowsky, Kristine M. 1999. “Theorizing Corporate Family Policies: How Advocates Built T he Business Case’ for ‘Family-Friendly’ Programs.” Pp. 203-32 in Hodson, Randy (senior ed.) and Toby L. Parcel (volume ed ). Research in the Sociology o f Work: Work and Family, Volume 7. Stamford CT: JAI Press.
Zedeck, S. 1992. Work, Families, and Organizations. San Francisco. Jossey-Bass.
196
APPENDK A
LETTER OF AGREEMENT
The balance o f work and home responsibilities is a major issue for workers across the United States, and one that receives constant attention in industry journals. Employers and human resource personnel in all industries are exploring strategies to help their employees achieve a balance among their obligations and thus promote productivity in the workplace.
The Inland Enterprise recognizes that each one of its employees faces the competing demands of work and home, regardless of their familial status. Thus, the Enterprise Management Council has adopted policies for flexible work arrangements that apply to employees throughout the Enterprise. Ms. Meg Flack, a researcher from The Ohio State University, will conduct a case study on the effectiveness of the Enterprise’s flexible work arrangements in reducing home-to-work conflict and promoting job satisfaction, commitment, and hence, productivity. This research will be conducted under the supervision of Dr. Lowell Hargens, Professor of Sociology, The Ohio State University.
In order to demonstrate the Enterprise’s commitment to its work/home policies and promote the timely collection and analysis of data, the Inland Enterprise agrees to;• Provide sponsorship for the project, i.e., a letter in support of the project from the vice
president o f Human Resources, to potential participants. Sponsorship will continue for one year from the date of execution of the study.
• Provide release time for employees to participate in focus groups, interviews, and a survey. The OflBce of Human Resources uses focus groups, interviews, and surveys for a wide variety of research studies, and flexible work arrangements are official corporate policies. Thus, no stigma will be attached to those who choose to participate in these discussions or the survey.
• Provide meeting space(s) for focus groups, interviews, and the administration of the survey.
• Provide assistance in identifying a pool of potential participants from which Ms. Flack will solicit participants for focus groups, interviews, and a survey.
• Provide Ms Flack with a temporary Inland ID as a researcher to facilitate entry to the buildings.
197
Letter o f Agreement (continued)
The Enterprise agrees to• Provide Ms. Flack with a temporary internal mail address and voice mail number to
facilitate internal communications.• Provide pre-approved direct services and materials, such as envelopes, address labels,
and copies of the survey.• Provide Ms. Flack with access to the inter-office mail system.• Allow Ms. Flack access to pre-approved, non-confidential archival materials, e.g.,
newsletters and employees demographics.
The Inland Enterprise and its affiliates will:• Not provide clerical assistance to Ms. Flack.• Not pursue or ask for data that identifies individuals.• Not participate in the analysis or interpretation of results.• Not compensate Ms. Flack nor provide reimbursement for ordinary business expenses.
Ms. Flack will:• Present the Enterprise with a final report of the analysis of the aggregate data within
one year after study completion.• Preserve the anonymity o f Inland Enterprise in all presentations and publications
outside the Enterprise that may arise from this project.• Collect all data and maintain the data’s confidentiality and anonymity in accordance
with the procedures and guidelines of The Ohio State University’s Human Subjects Review Committee.
• Protect the identity of all individuals who participate in the study.
dateVice President, Human Resources
____________________________ dateMeg Flack, Researcher
198
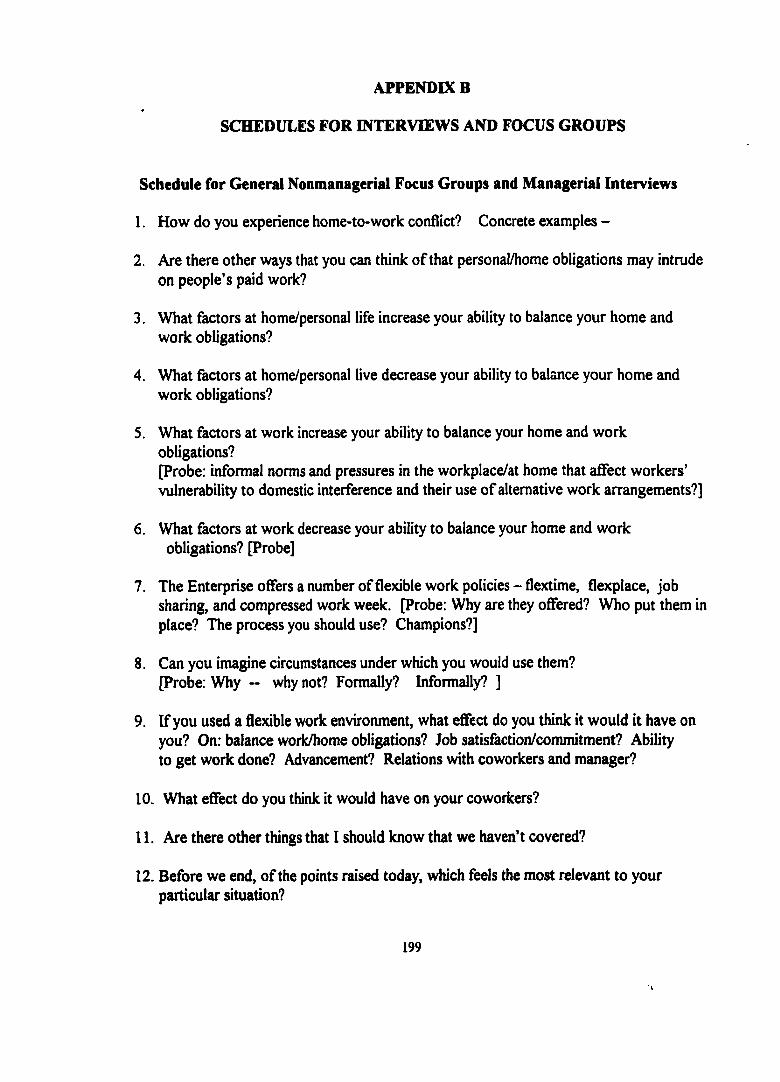
APPENDIX B
SCHEDULES FOR INTERVIEWS AND FOCUS GROUPS
Schedule for General Nonmanagerial Focus Groups and Managerial Interviews
1. How do you experience home-to-work conflict? Concrete examples -
2. Are there other ways that you can think of that personal/home obligations may intrude on people’s paid work?
3. What factors at home/personal life increase your ability to balance your home and work obligations?
4. What factors at home/personal live decrease your ability to balance your home and work obligations?
5. What factors at work increase your ability to balance your home and work obligations?[Probe: informal norms and pressures in the workplace/at home that affect workers’ vulnerability to domestic interference and their use o f alternative work arrangements?]
6. What factors at work decrease your ability to balance your home and workobligations? [Probe]
7. The Enterprise offers a number of flexible work policies - flextime, flexplace, job sharing, and compressed work week. [Probe: Why are they offered? Who put them in place? The process you should use? Champions?]
8. Can you imagine circumstances under which you would use them?[Probe: Why - why not? Formally? Informally? ]
9. If you used a flexible work environment, what effect do you think it would it have on you? On: balance work/home obligations? Job satisfaction/commitment? Abilityto get work done? Advancement? Relations with coworkers and manager?
10. What effect do you think it would have on your coworkers?
11. Are there other things that I should know that we haven’t covered?
12. Before we end, o f the points raised today, which feels the most relevant to your particular situation?
199
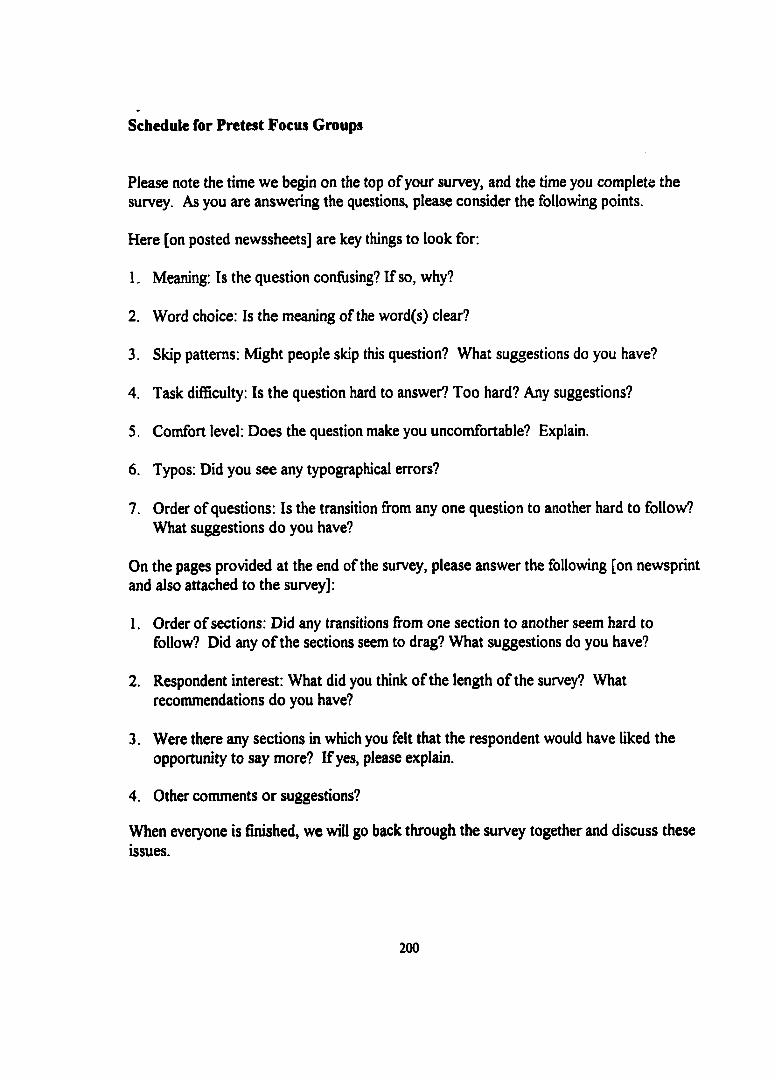
Schedule for Pretest Focus Groups
Please note the time we begin on the top o f your survey, and the time you complete the survey. As you are answering the questions, please consider the following points.
Here [on posted newssheets] are key things to look for;
1. Meaning: Is the question confusing? If so, why?
2. Word choice: Is the meaning of the word(s) clear?
3. Skip patterns: Might people skip this question? What suggestions do you have?
4. Task difficulty: Is the question hard to answer? Too hard? Any suggestions?
5. Comfort level: Does the question make you uncomfortable? Explain.
6. Typos: Did you see any typographical errors?
7. Order of questions: Is the transition from any one question to another hard to follow? What suggestions do you have?
On the pages provided at the end of the survey, please answer the following [on newsprint and also attached to the survey]:
1. Order of sections: Did any transitions from one section to another seem hard to follow? Did any o f the sections seem to drag? What suggestions do you have?
2. Respondent interest: What did you think o f the length of the survey? What recommendations do you have?
3. Were there any sections in which you felt that the respondent would have liked the opportunity to say more? If yes, please explain.
4. Other comments or suggestions?
When everyone is finished, we will go back through the survey together and discuss these issues.
200
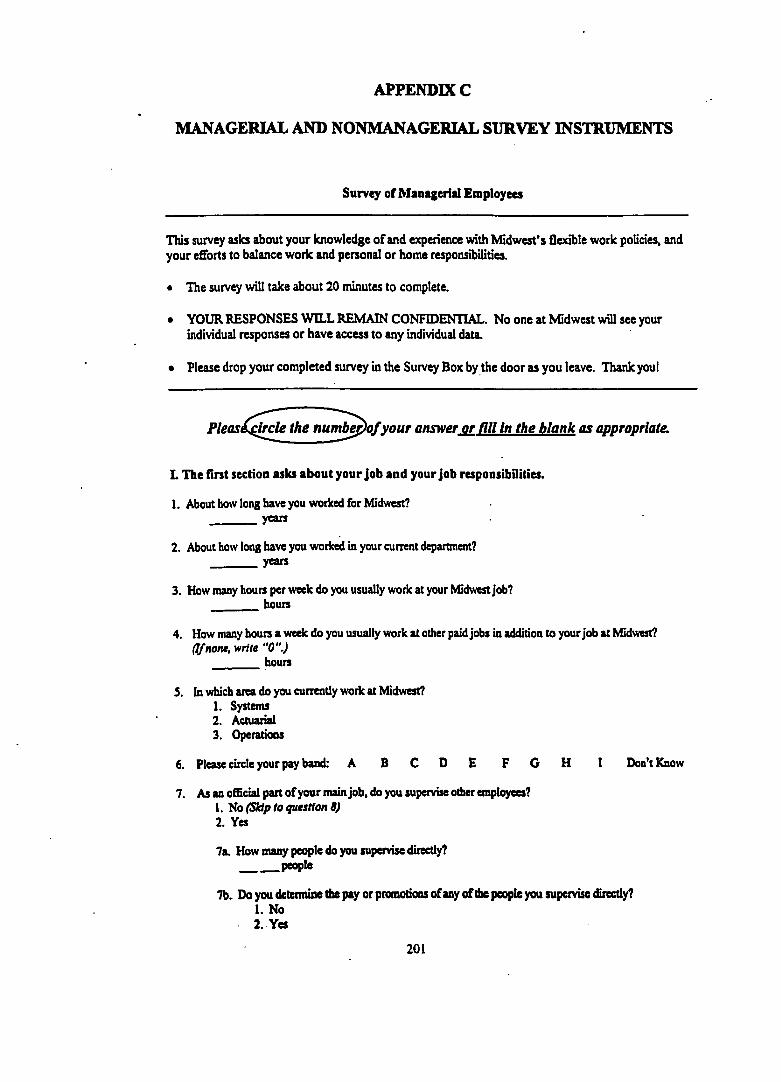
APPENDIX C
MANAGERIAL AND NONMANAGERIAL SURVEY INSTRUMENTS
Survey of Managerial Employees
TMs survey asks about your knowledge of and experience with Midwest’s flexible work policies, and your eSbrts to balance work and personal or home responsibilities.
• The survey will take about 20 minutes to complete.
• YOUR RESPONSES WILL REMAIN CONFIDENTIAL. No one at Midwest will see your individual responses or have access to any individual data.
• Please drop your completed survey in the Survey Box by the door as you leave. Thank you!
P lease^ cle the numbe^of your answer or fill in the blank as appropriate.
L The first section asks about your job and your job responsibilities.
1. About how long have you worked for Midwest?_________ years
2. About how long have you worked in your current department?________ years
3. How many hours per week do you usually work at your Midwest job?_________ hours
4. How many hours a week do you usually work at other paid jobs in addition to your job at Midwest?(If none, vrite "0".)
_________ houn
3. In which area do you currently work at Midwest?1. Systems2. Actuarial3. Operations
6. Please circle your pay band: A B C D E F G H 1 Don’t Know
7. As an official part o f your main job, do you supervise other employees?1. No (SMp to quatfon 8)2. Yes
7a. How mary people do you supervise directly? people
7b. Do you dctemiine the pay or promotions o f any o f the people you supervise directly?1. No2. Yes
201
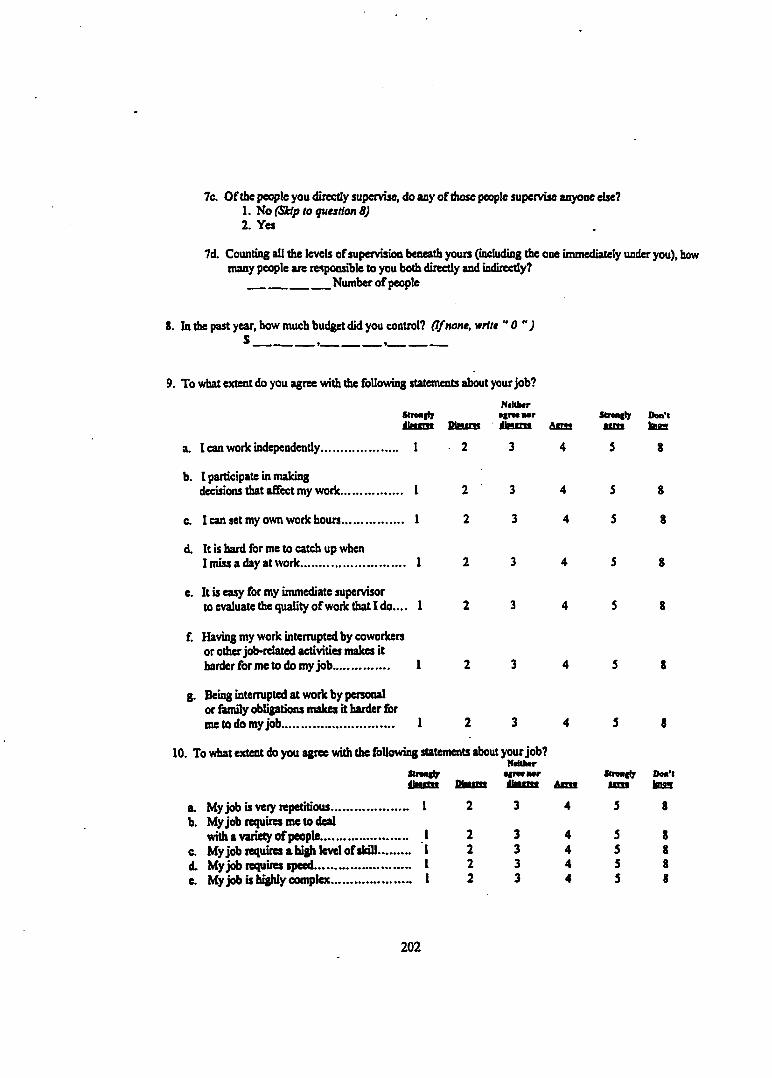
7c. O f the people you directly supervise, do any o f those people supervise anyone else?1. No (Sldp to question 8)2. Yes
7(L Counting all the levels o f supervision beneath yours (including the one immediately under you), how many people are responsible to you both directly and indirectly?
_______________Number o f people
8. In the past year, how much budget did you control? (1/none, write "0 “J
9. To what extent do you agree with the following statements about your job?
N«Nh«rSironilySliMm Ëissas
■gncBorU aim A«t»«
sm«|ly«trw
Don'tiBIOW
a. I can work independently........................... 1 2 3 4 5 8
b. I participate in makingdecisions that affect my work.................... I 2 3 4 5 8
c. I can set my own work hours.................... 1 2 3 4 5 8
d. It is hard for me to catch up whenI miss a day at work................................... 1 2 3 4 5 8
e. It is easy for my immediate supervisorto evaluate the quality o f work that I do.. .. 1 2 3 4 5 8
f. Having my work interrupted by coworkers or other job-related activities makes it harder for me to do my job.................... 1 2 3 4 5 8
g. Being interrupted at work by personal or fiunily obligations makes it harder for me to do my job........................................ I 2 3 4 5 8
10. To what extent do you agree with the following statements about your job?Ntüktr
Snwgtr «cncaor S Im w niMirM SiM iw A tm
Straagljru n t
Don'tloas
a. Myjob is very repetitious........................ I 2 3 4 5 8b. Myjob requires me to deal
with a variety o f people............................ 1 2 3 4 5 8c. Myjob requires a high level o f skill....... 1 2 3 4 3 8d. Myjob requires speed.............................. I 2 3 4 5 8e. Myjob is highly complex........................ 1 2 3 4 5 8
202
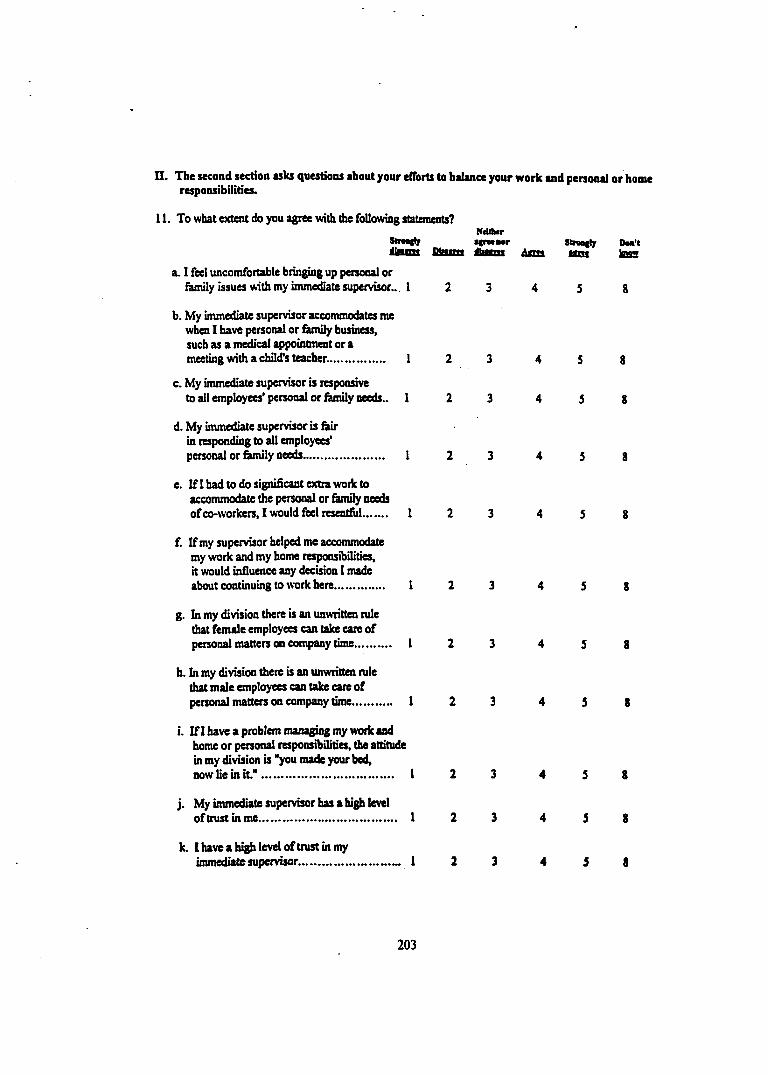
n . The second section isks questions mhout your efforts to biUnce your work and personal or home responsibilities.
11. To what extent do you agree with the following statements?NddMr
S tn n h ifm B o r Smofly Don'taiMorto PbooToo SbotToo Aotoo Imoor
a. I feel uncomfortable bringing up personal orfamily issues with my immediate supervisor... 1 2 3 4 5 8
b. My immediate supervisor accommodates me when I have personal or fiunily business, such as a medical appointment or ameeting with a child's teacher. 1 2 3 4 5 8
c. My immediate supervisor is responsiveto all employees'personal or fiunily needs.. 1 2 3 4 5 8
d. My immediate supervisor is Air in responding to all employees'personal or 6m ily needs 1 2 3 4 5 8
e. I f l had to do significant extra work to accommodate the personal or fiunily needsof co-workers, I would feel resentful 1 2 3 4 5 8
f. If my supervisor helped me accommodate my work and my home responsibilities, it would influence any decision I madeabout continuing to work here 1 2 3 4 5 8
g. In my division there is an unwritten rule that female employees can take care o fpenonal matters on company time 1 2 3 4 5 8
h. In my division there is an unwritten rule that male employees can take care ofpersonal matters on company time 1 2 3 4 5 8
i. I f l have a problem managing my work and home or personal responsibilities, the attitude in my division is "you made your bed,now lie in i t * ............................................... 1 2 3 4 5 8
j. My immediate supervisor has a high leveloftrustinme................................................. 1 2 3 4 5 8
k. I have a high level o f trust in myimmediate supervisor................................. 1 2 3 4 5 8
203
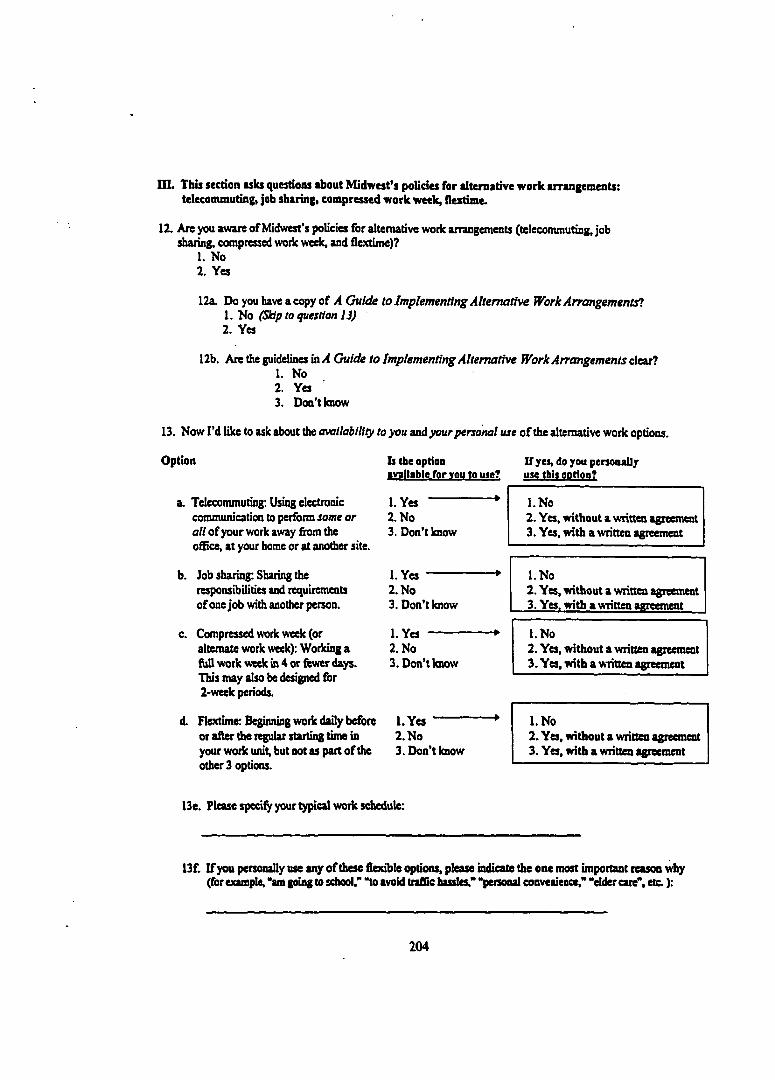
ni. This section isks questions ibout Midwest’s policies for litemative work arrangements: telecommuting, job sharing, compressed workweek, flextime.
12. Are you aware o f Midwest's policies for alternative work arrangements ( te lecom m u tin g , jo b sharing, compressed work wesk, and flextime)?
1. No2. Yes
12a. Do you have a copy o f A Guide to Implementing Alternative Work Arrangements!1. No (Skip to question 13)2. Yes
12b. Aze the gdidüîDssia A Guide to Implementing Alternative Work Arrangements c\eu!1. No2. Yes3. Don’t know
13. Now I'd like to ask about the avaiiability to you and your personal use o f the alternative work options.
Option
a. Telecommuting; Using electronic conununication to perform some or ail o f your work away firom the office, at your home or at another site.
Is th e option av a ilab le fo r y o u to u s e ?
1.Yes ---------2. No3. Don't know
I f yes, do you p e rso n a lly u se th is op tion?
1. No2. Yes, without a written agreement3. Yes, with a written agreement
b. Job sharing: Sharing the responsibilities and requirements o f one job with another person.
c. Compressed work week (or alternate work week): Working a full work week in 4 or fewer days. This may also he designed for 2-week periods.
d. Flextime: Beginning work daily before or after the regular starting time in your work unit, but not as part o f the other 3 options.
1.Yes ---------2. No3. Don’t know
1.Yes ---------2. No3. Don’t know
1.Ye s ----------2. No3. Don’t know
1.No2. Yes, without a written agreement3. Yes, with a written agreement
1.No2. Yes, without a written agreement3. Yes, with a written agreement
1.No2. Yes, without a written agreement3. Yes, with a written agreement
13e. Please specify your fypical work schedule:
13£ If you penonally use any o f these flexible options, please indicate the one most important reason why (for example, "am going to school,” "to avoid traffic hassles,” "personal convenience,” "elder care”, etc. ):
204
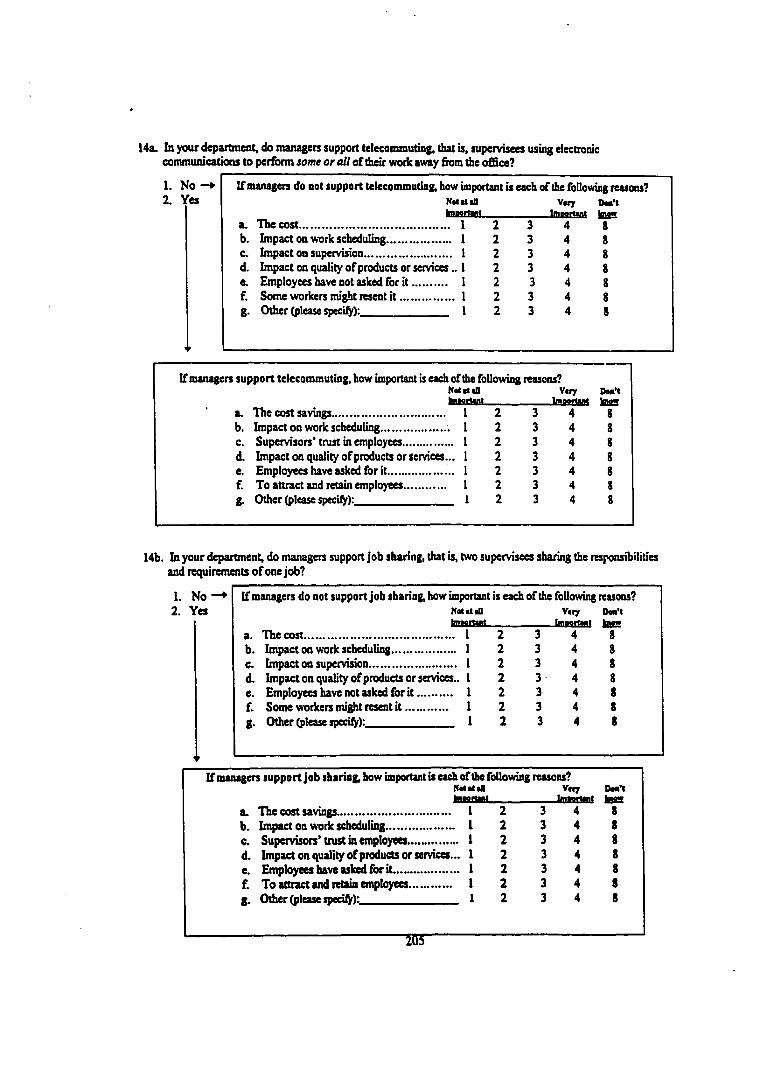
14a. In your department, do roanagen support telecommuting, that is, supervisees using electronic communications to perform some or all of their work away from the ofiBce?
1. No-2. Yes
If managers do not support telecommuting, how important is each of the following reasons?Vuy Don't
hiMrtint--------- Imoortont Iroma. The cost............................................. 1 2 3 4 8b. Impact on work scheduling................... 1 2 3 4 8c. Impact on supervision.......................... 1 2 3 4 8d. Impact on quality of products or services.. I 2 3 4 8e. Employees have not asked for it .......... I 2 3 4 8f. Some workers might resent i t ................ I 2 3 4 8K. Other foleasespecifvV I 2 3 4 8
If managers support telecommuting, how important is each of the following reasons?
a.
NototiObnoorUnl
The cost savings.................................. 1 2 3
Vtiy Don't .imasittnt teas
4 8b. Impact on work scheduling................... . 1 2 3 4 8c. Supervisors' trust in employees............... 1 2 3 4 8d. Impact on quality of products or services... 1 2 3 4 8e. Employees have asked for it.................... 1 2 3 4 8f. To attract and retain employees............. 1 2 3 4 8g. Other folease snecifv): 1 2 3 4 8
14b. In your department, do managers support job sharing, that is, two supervisees sharing the responsibilities and requirements of one job?
1. No-2. Yes
If managers do not support job sharing, how important is each of the following reasons?Net ml mil Vmiy Dmn't humrtmnl tmooftmnl loMB
a. The cost............................................. 1 2 3 4 8b. Impact on work scheduling.................. 1 2 3 4 8c. Impact on supervision.......................... 1 2 3 4 8d. Impact on quality of products or services.. 1 2 3 4 8e. Employees have not asked for i t .......... 1 2 3 4 8f. Some workers might resent i t ............. 1 2 3 4 8p. Other folease snecifv): 1 2 3 4 8
If managers support job sharing, how important is each of the following reasons?NmtmtmD VirjtatsittB!__________ Immaisanl
Dmn’tjbss
a. The cost savings.............................................. 1 2 3 4 8b. Impact on work scheduling.................... 1 2 3 4 8c. Supervisors’ trust in employees....»........». 1 2 3 4 8d. Impact on quality of products or services... 1 2 3 4 8e. Employees have asked for it— ............. 1 2 3 4 8f. To attract and retain employees............ 1 2 3 4 8p. Other fnleasesnedN): 1 2 3 4 8
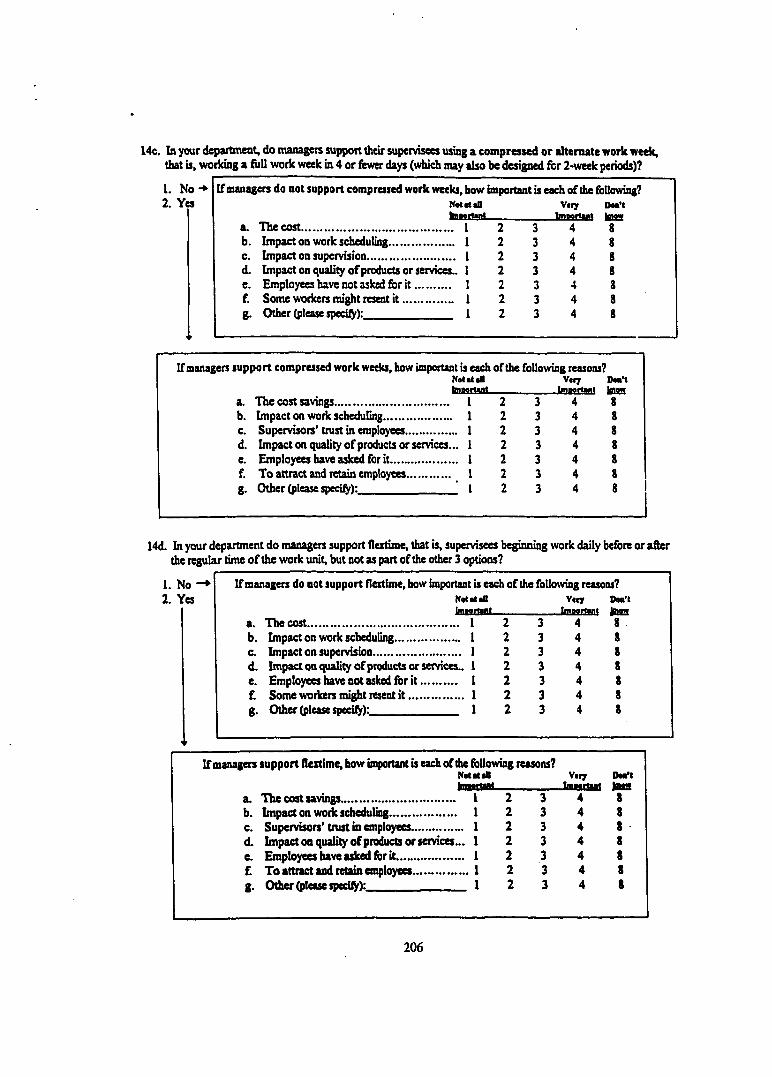
14c. In your department, do managers support their supervisees using a compressed or alternate work week, that is, working a &U work week in 4 or fewer days (which may also be designed for 2-week periods)?
1. No-*2. Yes
If managers do not support compressed work weeks, how important is each of the following?
a. The cost..................................
NottlantaiMrtant
........... 1 2 3
Vtiy-Imwranl
4
DmHloss8
b. Impact on work scheduling....... ........... 1 2 3 4 8c. Impact on supervision............. ........... I 2 3 4 8d. Impact on quality of products or services.. 1 2 3 4 8e. Employees have not asked for it ........... 1 2 3 4 8f. Some workers might resent i t ... ........... I 2 3 4 8g Other (nlease snecifv): I 2 3 4 8
If managers support compressed work weeks, how important is each of the following reasons?NatiliO V<i7 Don'ttaasnu!__________ Inustlffil loss
a. The cost savings.................................. I 2 3 4 8b. Impact on work scheduling.................... I 2 3 4 8c. Supervisors’ trust in employees............... 1 2 3 4 8d. Impact on quality of products or services... 1 2 3 4 8e. Employees have asked for it.................... 1 2 3 4 8f. To attract and retain employees............. 1 2 3 4 8B. Other folease snecifel: 1 2 3 4 8
14d. In your department do managers support flextime, that is, supervisees beginning work daily before or after the regular time of the work unit, but not as part of the other 3 options?
1. No -2. Yes
If managers do not support flextime, how important is each of the following reasons?NstUiU V<iy Doa'tImwfttflt------------------- Imasrant
a. The cost............................................. 1 2 3b. Impact on work scheduling................... 1 2 3c. Impact on supervision.......................... 1 2 3d. Impact on quality of products or services.. 1 2 3e. Employees have not asked for i t 1 2 3f. Some workers might resent i t ................ 1 2 3g. Other (please speciQr):_____________ 1 2 3
8888888
If managers support flextime, how important is each of the following reasons?NotWiB Vnj Dm'IfcwMtwr_____________ tm»ot<MH jBfS
8 8 8 8 8 8 8
a. The cost savings.................................. 1 2b. Impact on work scheduling.................... 1 2c. Supervisors’ trust in employees............. » 1 2d. Impact on qualiÿ of products or services... 1 2e. Employees have asked fer it.................... 1 2f. To attract and retain employees................ 1 2g Other fplease snecifek 1 2
206
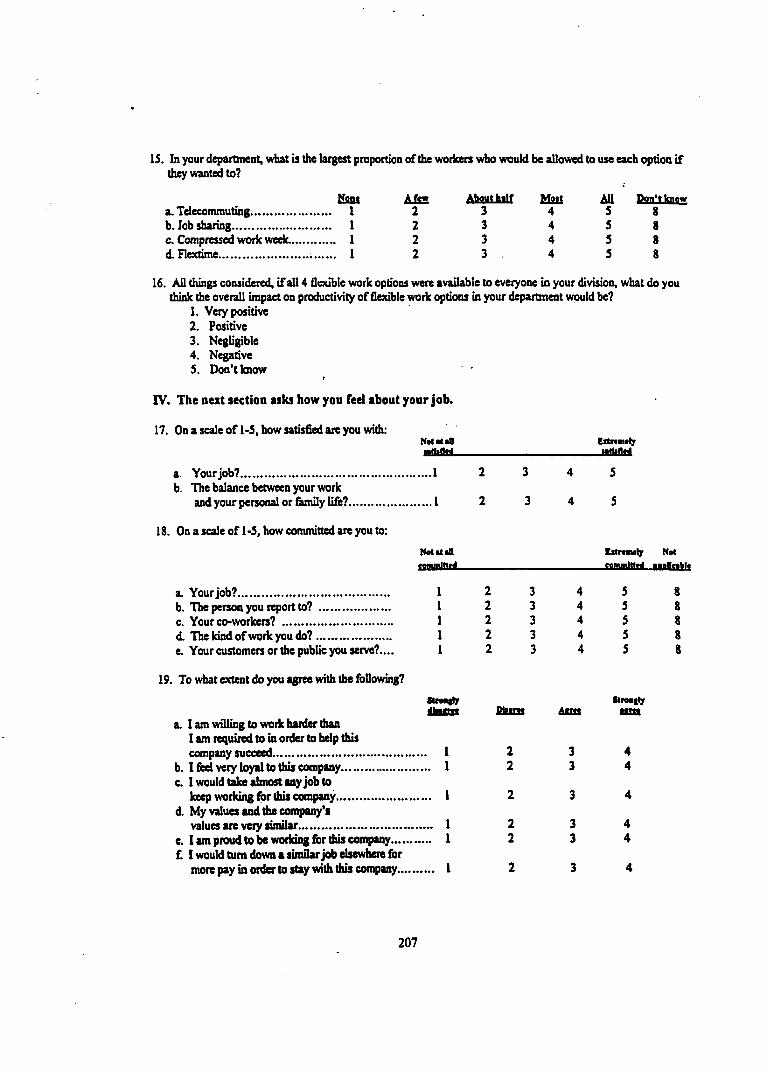
15. In your department, what is the largest proportion of the workers who would be allowed to use each option if they wanted to?
K a u A few About h i l f M o tt A ll Don’t knowa. Telecommuting........................ 1 2 3 4 5 8b. Job sharing............................. 1 2 3 4 5 8c. Compressed workweek.............. 1 2 3 4 5 8d. Flextime.......................... ........ I 2 3 . 4 5 8
16. All things considered, if all 4 flexible work options were available to everyone in your division, what do you think the overall impact on productivity of flexible work options in your department would be?
1. Very positive2. Positive3. Negli^le4. Negative5. Don’t know
IV. The next section asks how you feel about your job.
17. On a scale of 1-5, how satisfied are you with:Not ■ Id HtbOeL
Estrtmciy
a. Your job?...........................................................1 2 3 4 5b. The balance between your work
and your personal or fiunily life? 1 2 3 4 5
18. On a scale of 1-5, how committed are you to:Not l i dwmmimi-
E itraM ljr Not com m lnd ■■■BaW.
a. Your job?.............................................b. The person you report to? .....................c. Your co-workers? .................................d. The kind of work you do?......................e. Your customers or the public you serve?....
19. To what extent do you agree with the following?
a. I am willing to work harder thanI am required to in order to help this company succeed........................................
b. I feel very loyal to this company...................c. I would take abnost any job to
keep working for this company.....................d. My values and the company's
values are very similar................................e. I am proud to be working for this company....f I would turn down a simOarjob elsewhere for
more pay in order to stay with this company...
sifMiir
22222
fituns
22
22
44444
Aid sStMNgly
207
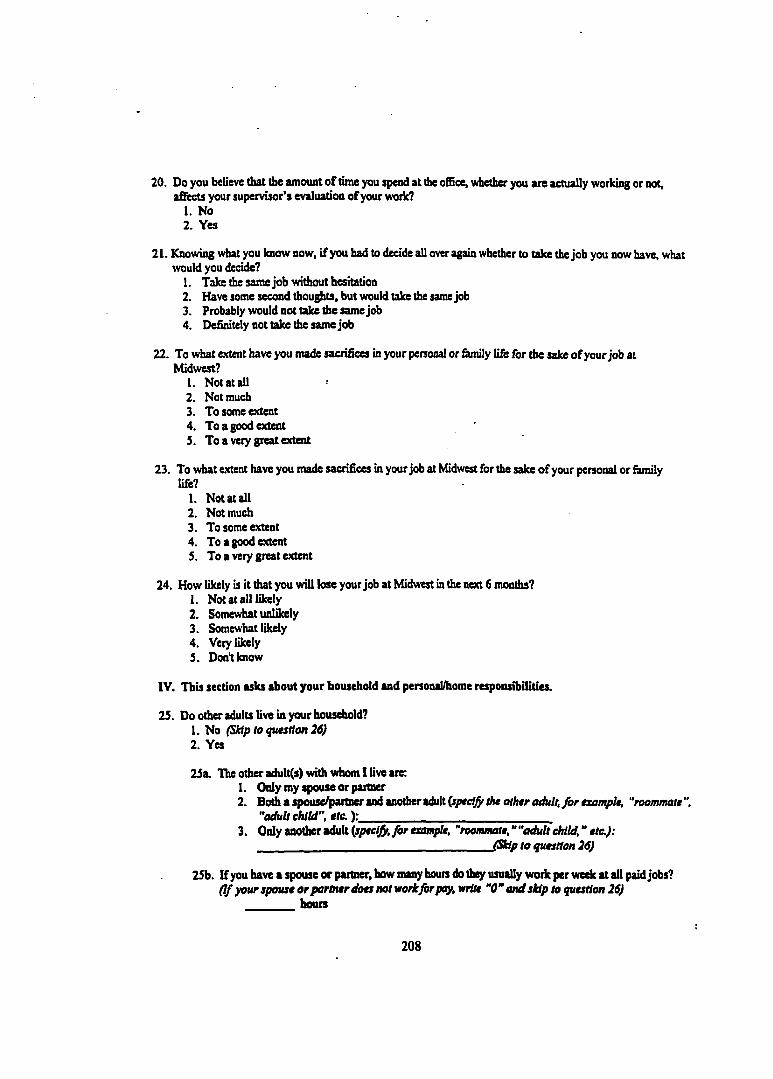
20. Do you believe that the amount of time you spend at the o£5ce, whether you are actually working or not, a&cts your supervisor’s evaluation of your work?
1. No2. Yes
21. Knowing what you know now, if you had to decide all over again whether to take the job you now have, what would you decide?
1. Take the same job without hesitation2. Have some second thoughts, but would take the same job3. Probably would not take the same job4. Definitely not take the same job
22. To what extent have you made sacrifices in your personal or fiunily life for the sake of your job at Midwest?
1. Not at all2. Not much3. To some extent4. To a good extent5. To a very great extent
23. To what extent have you made sacrifices in your job at Midwest for the sake of your personal or family life?
1. Not at all2. Not much3. To some extent4. To a good extent5. To a very great extent
24. How likely is it that you will lose your job at Midwest in the next 6 months?1. Not at all likely2. Somewhat unl&ely3. Somewhat likely4. Very likely5. Don't know
IV. This section asks about your household and personal/home responsibHities.
23. Do other adults live in your household?1. No (Skip to question 26)2. Yes
25a. The other adultfs) with whom I live are:1. Only my spouse or partner2. Both a spouse/partMr and another adult {specif the other adult, fo r example, “roommate ",
“adult child”, etc. ):_________________________________ _3. OtilyaaoÙtu*da\t(specifo,forexample, “roommate,““adultchild,” etc.):
_________________________________________ (Skip to question 26)
25b. If you have a spouse or partner, how many hours do they usually work per week at all paid jobs?Of your spouse or partner d o a not work for pay, write ”0 ” m dsldp to question 26)
________hours
208
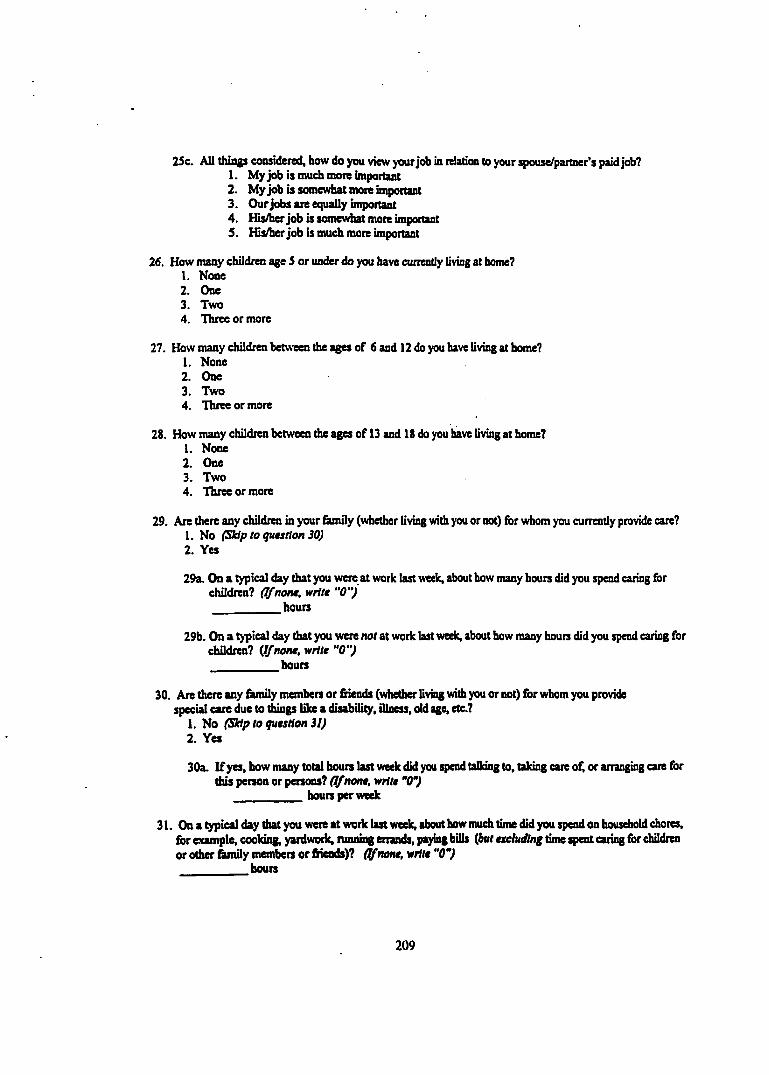
25c. AU things considered, how do you view your job in relation to your spouse/partner’s paid job?1. My job is much more important2. My job is somewhat more important3. Our jobs are equaUy important4. His/her job is somewhat more important5. His/her job is much more important
26. How many children age 5 or under do you have currently living at home?1. None2. One3. Two4. Three or more
27. How many children between the ages of 6 and 12 do you have Uving at home?1. None2. One3. Two4. Three or more
28. How many children between the ages of 13 and 18 do you have living at home?1. None2. One3. Two4. Three or more
29. Are there any children in your fiunily (whether living with you or not) for whom you currently provide care?1. No (Skip to question 30)2. Yes
29a. On a typical day that you were at work last week, about how many hours did you spend caring for children? (Ifnone, write “0")__________ hours
29b. On a typical day that you were not at work last week, about how many hours did you spend caring for duldnal (Jf none, write "0”)__________ hours
30. Are there any family members or friends (whether living with you or not) for whom you provide special care due to foings like a disability, illness, old age, etc.?
1. No (Slip to question 31)2. Yes
30a. If yes. how many total hours last week did you spend talking to, taking care of, or arranging care for this person or persons? (I/none, write "0")
___________hours per week
31. On a p ic a l day that you were at work last wedc, about how much time did you spend on household chores, for example, cooking, yard work, running errands, paying bills (but excluding time spent caring for children or other fondly members or fiieads)? (If none, wrile "0")
________ hours
209
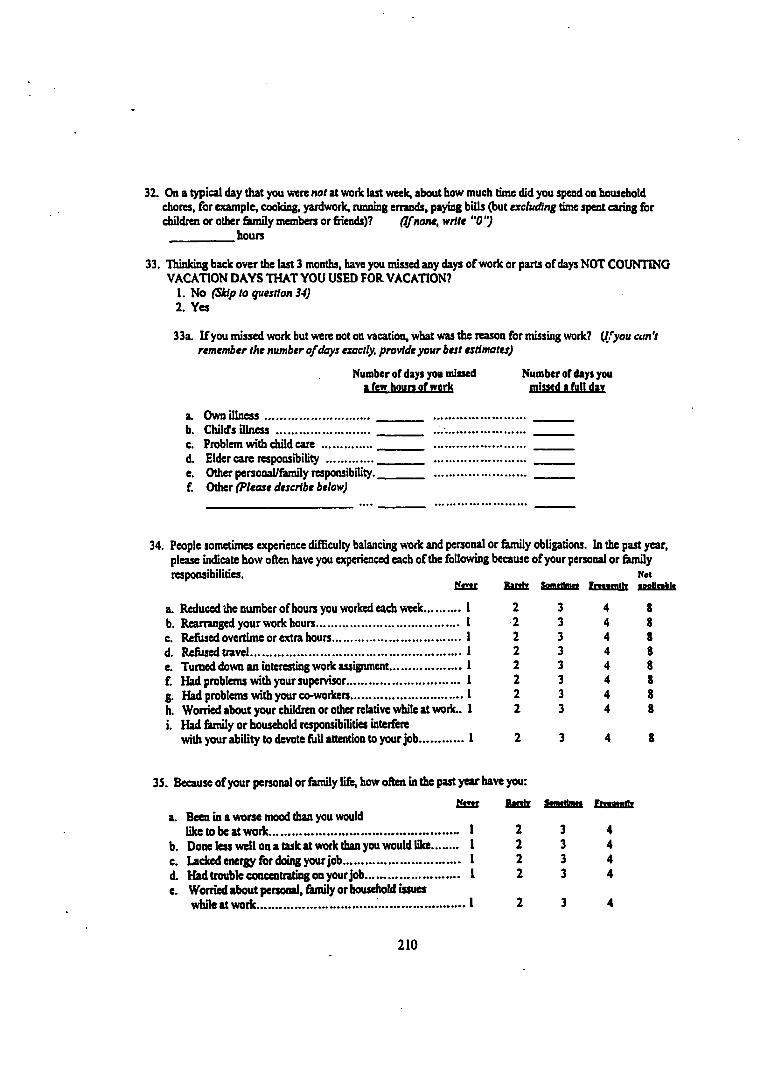
32. On a ica l day that you were not at work last week, about how much time did you spend on household chores, for example, cooking, yardwork, running errands, paying bills (but excluding time spent caring for children or other fiunily members or friends)? (If none, write "0 “)__________hours
33. Thinking back over the last 3 months, have you missed any days of work or parts of days NOT COUNTING VACATION DAYS THAT YOU USED FOR VACATION?
1. No (Sfafp to question 34)2. Yes
33a. If you missed work hut were not on vacation, what was the reason for missing work? (Ifyou ain't remember the number of days exactly, provide your best estimates)
N um ber o f days you m issed a few hours o f w ork
N um b er o f days you
a. Own illness...............................b. Child's illness ............................c. Problem with child care ...............d. Elder care responsibility ..............e. Other persooad/fiimily responsibility.f. Other (Please describe below)
34. People sometimes experience difficulty balancing work and personal or fiunily obligations. In the past year, please indicate how often have you experienced each of the following because of your personal or 6mily responsibilities. rtot
Nssti R inli XmrtlnMi trsssmllr
a. Reduced the number ofhours you worked each week 1 2b. Rearranged your work hours........................................... 1 2c. Refused overtime or extra hours...................................... 1 2d. Refused travel............................................................... 1 2e. Turned down an interesting work assignment.......................1 2f. Had problems with your supervisor.................................. 1 2g. Had problems with your co-workers...................................1 2h. Worried about your children or other relative while at work.. 1 2i. Had family or household responsibilities interfere
with your ability to devote full attention to your job 1 2
88888888
35. Because of your personal or fiunily life, how often in the past year have you;W w t r R h i Iy
a. Been in a worse mood than you wouldlike to be at work.......................................................» I 2
b. Done less well on a task at work than you would like I 2c. Lacked energy fr>r doing your job I 2d. Had trouble concentrating on your job i 2e. Worried about personal, family or household issues
while at work I 2
4444
210
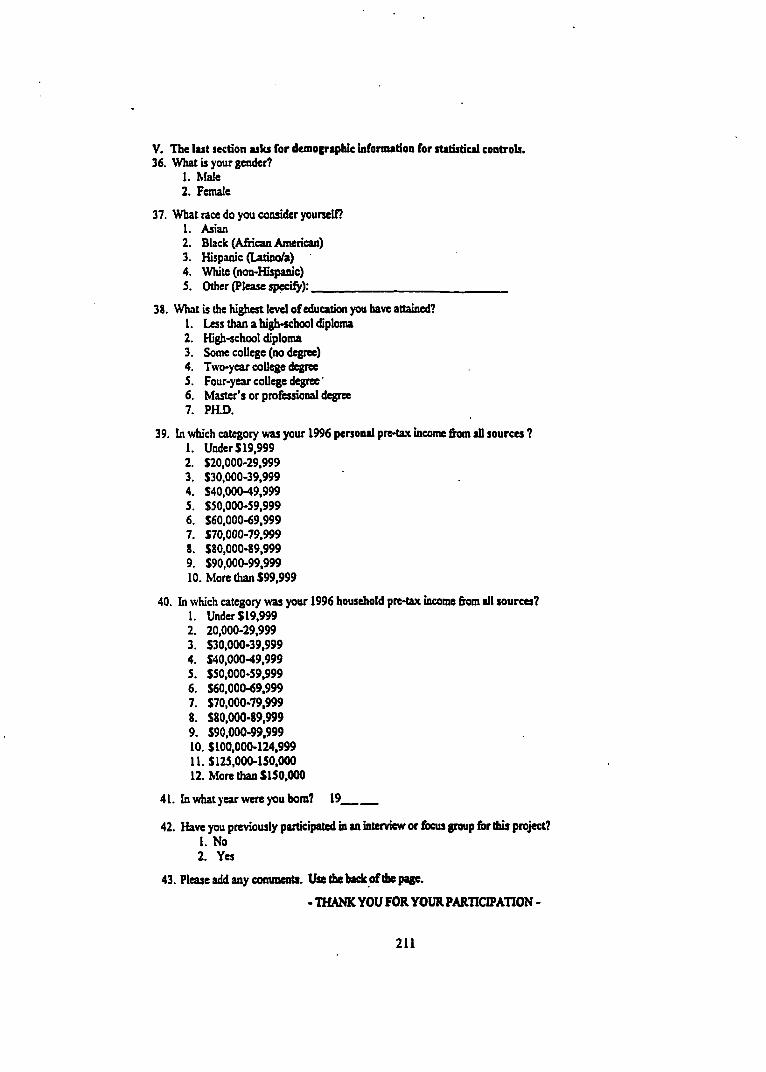
V. The lu t section u k s for démographie infonnatioa for statistical controls.36. What is your gender?
1. hWe2. Female
37. What race do you consider yourself?1. Asian2. Black (African American)3. Hispanic (Latino/a)4. White (non-Hispanic)5. Other OPleue specify):______________________
38. What is the highest level of education you have attained?1. Less than a high-school diploma2. High-school diploma3. Some college (no degree)4. Two-year college degree5. Four-year college degree'6. Master’s or professional degree7. PH.D.
39. In which category was your 1996 personal pre-tax income from all sourcu ?1. Under 119,9992. S20,000-29,9993. 530,000-39,9994. 540,000-49,9995. 530,000-59,9996. 560,000-69,9997. 570,000-79,9998. 580,000-89,9999. 590,000-99,99910. More than 599,999
40. In which category was your 1996 household pre-tax income firom all sourcu?1. Under 519,9992. 20,000-29,9993. 530,000-39,9994. 540,000-49,9995. 550,000-59,9996. 560,000-69,9997. 570,000-79,9998. 580.000-89,9999. 590,000-99,99910. 5100,000-124,99911. 5125,000-150,00012. More than 5150,000
4L. In what year were you bom? 19_____
42. Have you previously participated in an interview or focus group fbr this project?1. No2. Yu
43. Pleue add any comments. Use the back of the page.
- THANK YOU FOR YOUR PARTICIPATION -
211
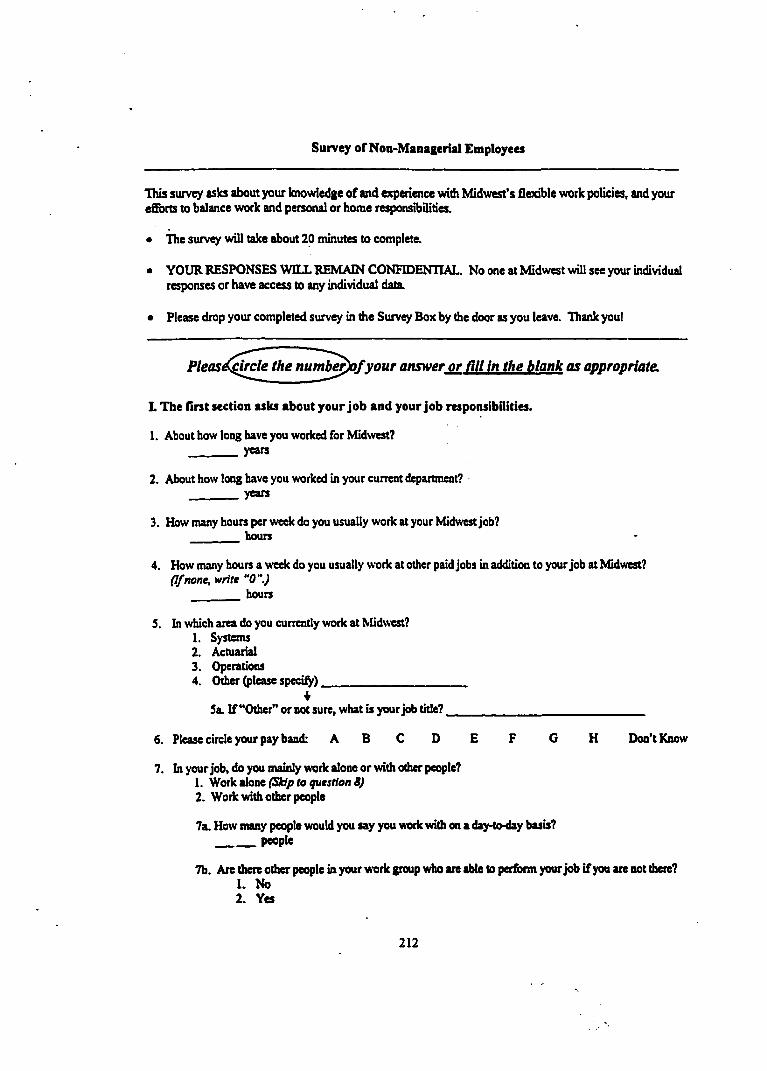
Survey of Non-Managerial Employees
This survey asks about your knowledge of and experience with Midwest's flexible work policies, and your eSbtts to balance work and personal or home responsibilities.
• The survey will take about 20 minutes to complete.
• YOUR RESPONSES WILL REMAIN CONFIDENTIAL. No one at Midwest will see your individual responses or have access to aiy individual data.
• Please drop your completed survey in the Survey Box by the door as you leave. Thank youl
Pleas^^^cUthe n u ^ e ^ fy o u r answer or fill in the blank as appropriate.
L The first section asks about your job and your job responsibilities.
1. About how long have you worked for Midwest?_______ years
2. About how long have you worked in your current department?_______ years
3. How many hours per week do you usually work at your Midwest job?________hours
4. How many hours a week do you usually vvork at other paid jobs in addition to your job at Midwest? (Ifnone, write "0".)
_______ hours
5. In which area do you currently work at Midwest?1. Systems2. Actuarial3. Operations4. Other (please specify)______________________
i5a. If “Other” or not sure, what is your job title?______________________________
6. Please circle your pay band: A B C D E F C H Don’t Know
7. In your job, do you mainly work alone or with other people?1. Work alone (Skip to question 8)2. Work with other people
7a. How many people would you say you work with on a day-to-day basis? Pwple
7b. Are there other people in your work group who are able to perform your job if you are not there?1. No2. Yes
212
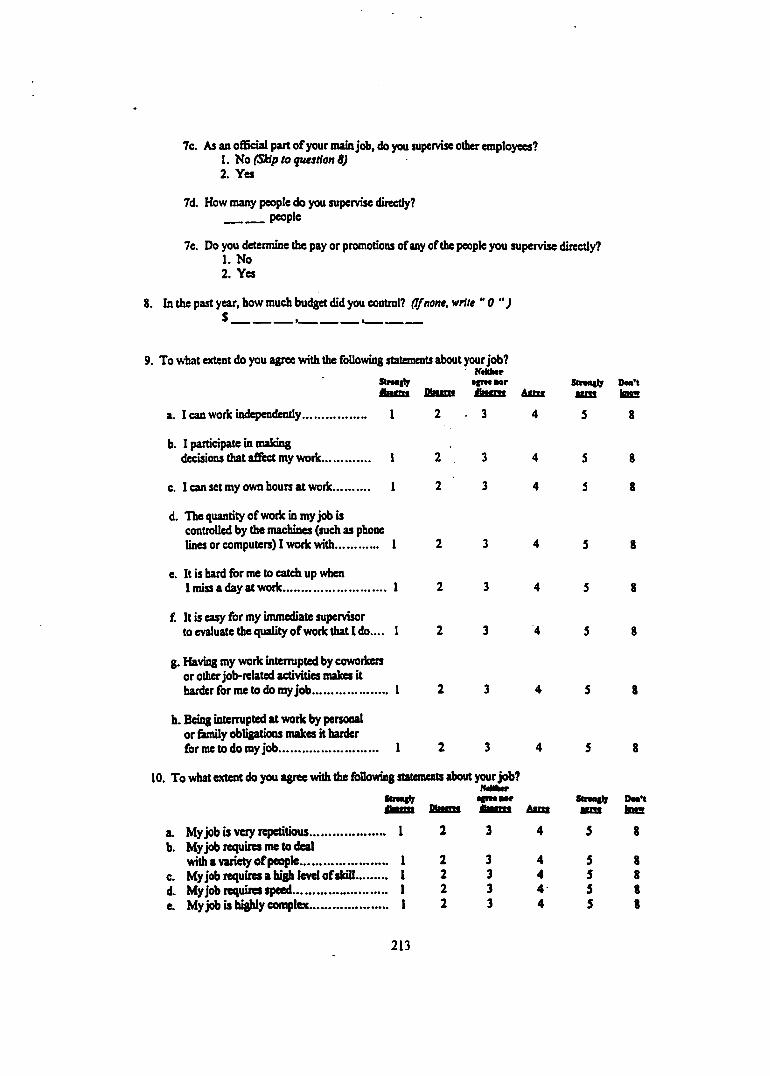
7c. As an official part of your main job, do you supervise other employees?1. Ho (Skip to question 8)2. Yes
7(L How many people do you supervise directly? people
7e. Do you determine the pay or promotions of any of the people you supervise directly?1. No2. Yes
8. In the past year, how much budget did you control? (I/none, write “ 0 “)$ , .________
9. To what extent do you agree with the following statements about your job?' NtHlMr
S(iM|ly iimaor Smofljr t>oa’tilwtfw Ohm#™ Slwtrw A«r«« mew Imnw
a. I can work independently 1 2 3 4 S 8
b. I participate in makingdecisions that affect my work 1 2 . 3 4 S 8
c. I can set my own hours at work 1 2 3 4 3 8
d. The quantity of work in my job is controlled by the machines (such as phonelines or computers) I work with 1 2 3 4 3 8
e. It is hard for me to catch up when1 miss a day at work 1 2 3 4 3 8
f. It is easy for my immediate supervisorto evaluate the quality of work that 1 do.... 1 2 3 4 3 8
g. Having my work interrupted by coworkers or other job-related activities makes itharder for me to do my job....................... 1 2 3 4 3 8
h. Being interrupted at work by personal or fomily obligations makes it harderfor me to do my job 1 2 3 4 5 8
10. To what extent do you agree with the following statements about your job?NdUMr
Sinasb iimMr Skwgly Doa’tniiomo eiioot«« A«rt« o«w laww
a. My job is very repetitious...................... 1 2 3 4 3 8b. My job requires me to deal
with a variety of people.......................... 1 2 3 4 3 8c. Myjob requires a high level of skill 1 2 3 4 3 8d. Myjob requires speed........................... 1 2 3 4 3 8e. Myjob is highly complex....................... 1 2 3 4 3 8
213
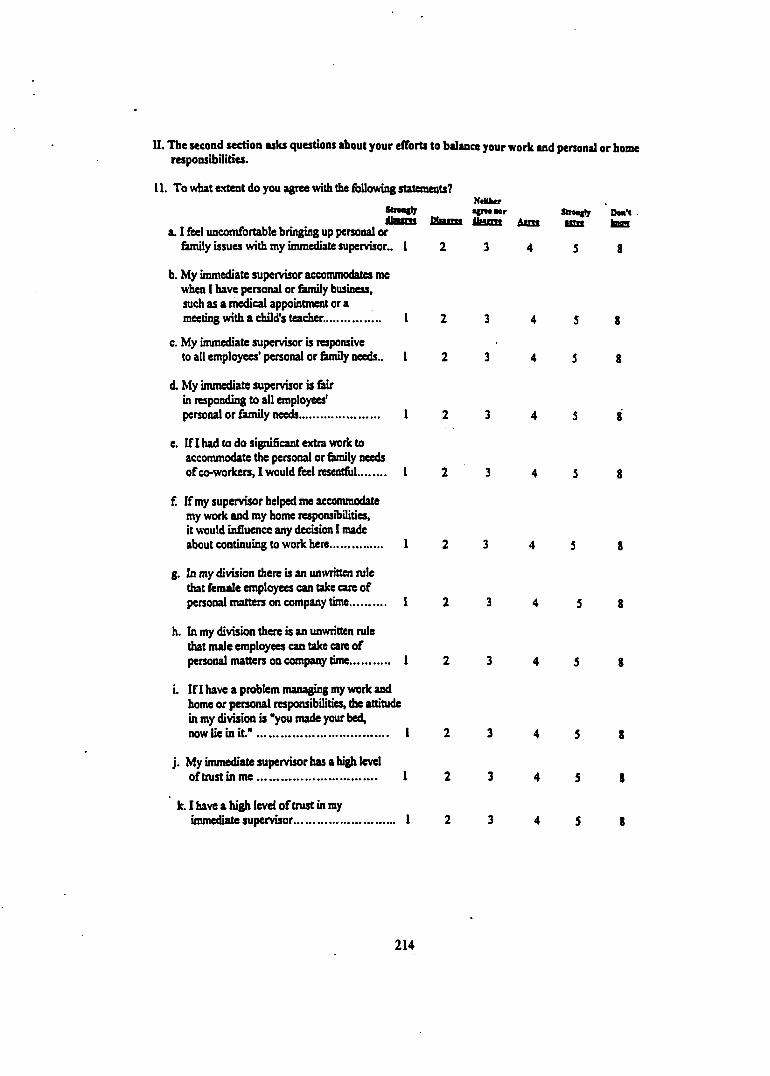
IL The second section asks questions about your elTorts to balance your work and personal or home responsibilities.
11. To what extent do you agree with the Allowing statements?ItiUlur•fntMr snwgly Don't .
iiasm Ww™ «MOT» Asos nwa. I feel uncomfortable bringing up personal or
&mily issues with my immediate supervisor.. 1 2 3 4 5 8
b. My immediate supervisor accommodates me when 1 have personal or Amily business, such as a medical appointment or ameeting with a child's teacher................. 1 2 3 4 S 8
c. My immediate supervisor is responsiveto all employees’ personal or fiunily needs.. 1 2 3 4 S 8
d. My immediate supervisor is Air in responding to all employees'personal or Amily needs........................ 1 2 3 4 S 8
e. If I had to do significant extra work to accommodate the personal or Amily needsof co-workers, I would feel resentful 1 2 3 4 3 8
f. If my supervisor helped me accommodate my work and my home responsibilities, it would influence any decision 1 madeabout continuing to work here 1 2 3 4 3 8
g. In my division there is an unwritten rule that female employees can take care ofpersonal matters on company time 1 2 3 4 3 8
h. In my division there is an unwritten rule that male employees can take care ofpersonal matters on company time 1 2 3 4 S 8
i. Ifl have a problem managing my work and home or personal responsibilities, the attitude in my division is "you made your bed,now lie in it." 1 2 3 4 5 8
j. My immediate supervisor has a high leveloftrustinme.................................... 1 2 3 4 5 8
k. I have a high level of trust in myimmediate supervisor.............................. 1 2 3 4 5 8
214
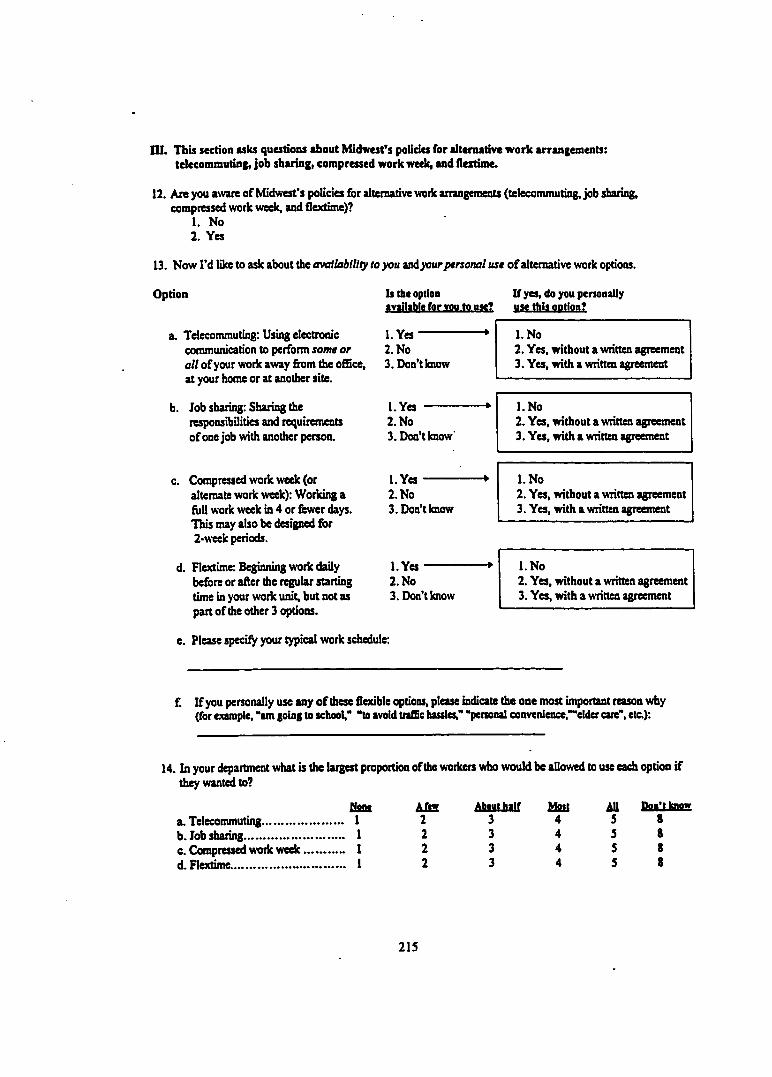
ni. This section asks questions about Midwest’s policies for alternative work arrangements: telecommuting, job sharing, compressed workweek, and flextime.
12. Are you aware of Midwest's policies for alternative work arrangements (telecommuting, job sharing, compressed work week, and flextime)?
1. No2. Yes
13. Now I’d like to ask about the availablUly to you and your ptnonal use of alternative work options.
Option Is the option available for YOU to use?
a. Telecommuting; Using electronic communication to perform some or all of your work away from the office, at your home or at another site.
b. Job sharing: Sharing the responsibilities and requirements of one job with another person.
c. Compressed work week (or alternate work week): Working a frill work week in 4 or fewer days. This may also be designed for 2-week periods.
d. Flextime: Beginning work daily before or after the regular starting time in your work unit, but not as part of the other 3 options.
1.Ye s --------2. No3. Don’t know
1.Yes -------2. No3. Don’t know
1.Ye s --------2. No3. Don’t know
1.Ye s --------2. No3. Don’t know
If yes, do you personally
1.No2. Yes, without a written agreement3. Yes, with a written agreement
1.No2. Yes, without a written agreement3. Yes, with a written agreement
1.No2. Yes, svithout a written agreement3. Yes, with a written agreement
1.No2. Yes, svithout a written agreement3. Yes, with a written agreement
e. Please specify your typical work schedule:
f. If you personally use any of these flexible options, please indicate the one most important reason why (for example, "am going to school," "to avoid tiafflc hassles," "personal convenience,""elder care”, etc.):
14. In your department what is the largest proportion of the workers who would be allowed to use each option if they wanted to?
Wone A few About half Molt All PPtt’tlBHwa. Telecommuting I 2 3 4 5 8b. Job sharing.............................. I 2 3 4 3 8c. Compressed svork week I 2 3 4 5 8d. Flextime.................................. 1 2 3 4 5 8
215
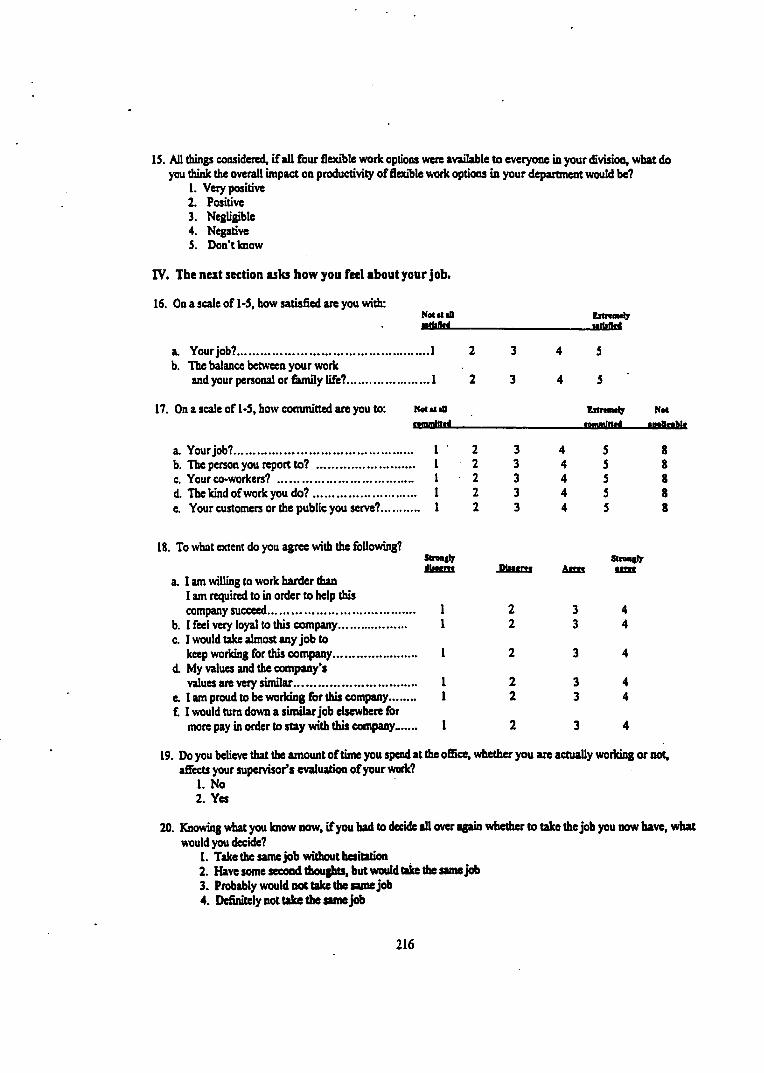
15. AU things considered, if all four flexible work options were available to everyone in your division, what do you think the overaU impact on productivity of flexible work options in your department would be?
1. Very positive2. Positive3. Negligible4. Negative5. Don’t know
IV. The next section asks how you feel about your job.
16. On a scale of 1-5, how satisfled are you with:
a. Your job?..................................b. The balance between your work
and your personal or &mily life?.
17. On a scale of 1-5, how committed are you to:
a. Your job?.............................................b. The person you report to? ....................c. Your co-workers? ................................d. The kind of work you do?....................e. Your customers or the public you serve?.
MotMiOwHilIrt
.1
.1
Not l t d
wmmlllri
22222
3
3
33333
4
4
MotMillnM s
88888
18. To what extent do you agree with the foUowing?
a. I am willing to work harder thanI am required to in order to help this company succeed.........................................
b. 1 feel very loyal to this company....................c. 1 would take almost any job to
keep working for this company......................d. My values and the company’s
values are very similar.................................e. lam proud to be working for this company....f. I would turn down a similar job elsewhere for
more pay in order to stay with this company....
SInatIr
1
D b tir n
22
22
A irttSirm iljr■«w
19. Do you believe that the amount of time you spend at the office, whether you are actually working or not, affects your supervisor’s evaluation of your work?
1. No2. Yes
20. Knowing what you know now, if you had to decide all over again whether to take the job you now have, what would you decide?
1. Take the same job without hesitation2. Have some second thoughts, but would lake the same job3. Probably would not take the same job4. Definitely not take the same job
216
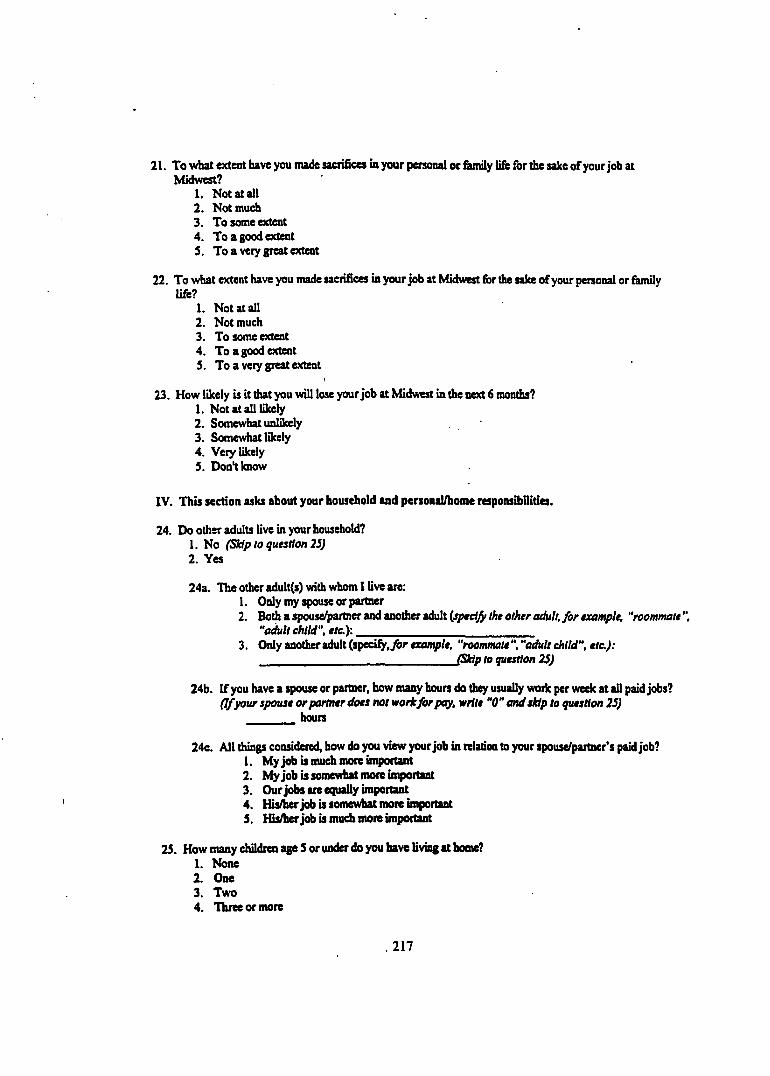
21. To what extent have you made sacrifices ia your personal or 6mily life &r the sake of your job at Midwest?
1. Not at all2. Not much3. To some extent4. To a good extent5. To a very great extent
22. To what extent have you made sacrifices in your job at Midwest for the sake of your personal or fiunily life?
1. Not at all2. Not much3. To some extent4. To a good extent5. To a veiy great extent
23. How likely is it that you will lose your job at Midwest in the next 6 months?1. Not at all likely2. Somewhat unlficely3. Somewhat likely4. Very likely5. Don't know
IV. This section asks about your household and personal/home responsibilities.
24. Do other adults live in your household?1. No (Skip to question 23)2. Yes
24a. The other adult(s) with whom Hive are:1. Only my spouse or partner2. Both a spouse/partner and another adult {speeijy the other adult, for example, "roommate ”,
"aAtU M d “, etc.):__________________________3. Only another adult (specify,ybr example, "roommate ", "adult child", etc.):
(Skip to question 25)
24b. If you have a spouse or partner, how many hours do thqr usually work per week at all pud jobs? (Ifyour spouse or partner does not work for pay, write “0" and skip to question 23)
________hours
24c. All things considered, how do you view your job in relation to your spouse/partner’s paid job?1. Myjob is much more important2. Myjob is somewhat more important3. Our jobs are equally important4. His/her job is somewhat more important5. His/her job is much more important
25. How many children age S or under do you have living at home?1. None2. One3. Two4. Three or more
. 2 1 7
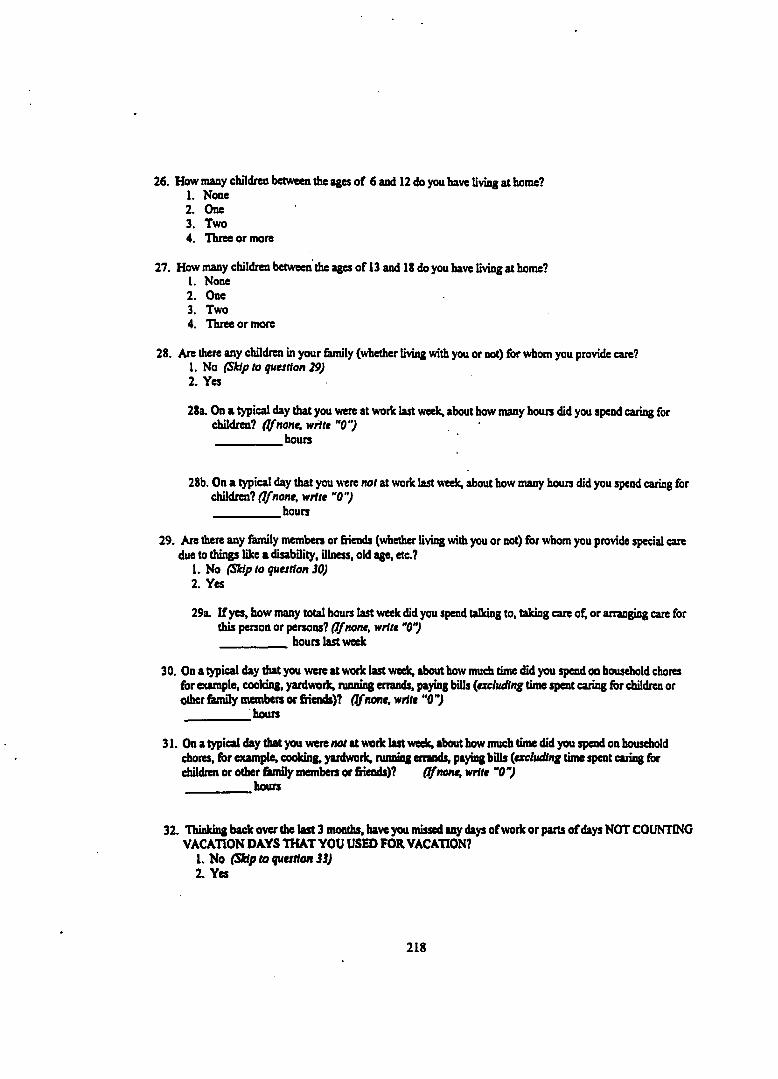
26. How many children between the ages of 6 and 12 do you have living at home?1. None2. One3. Two4. Three or more
27. How many children between the ages of 13 and 18 do you have living at home?1. None2. One3. Two4. Three or more
28. Are there any children in your 6mily (whether living with you or not) for whom you provide care?1. No (Skip to question 29)2. Yes
28a. On a typical day that you were at work last week, about how many hours did you spend caring for children? (îfnone, wrï/e "0”__________ hours
28b. On a typical day that you were not at work last week, about how many hours did you spend caring for childrni? ( Tnone, write "0")__________ hours
29. Are there any family members or friends (whether living with you or not) for whom you provide special care due to things like a disability, illness, old age, etc.?
1. No (Sktp to question 30)2. Yes
29a. If yes, how many total hours last week did you spend talking to, taking care o^ or arranging care for this person or persons? (If none, write "0")___________hours last week
30. On a typical day that you were at work last week, about how much time did you spend on household chores for example, cooking, yardwork, ninning errands, paying bills {excluding time spent caring fbr children or other family membets or friends)? Of none, wrile “0“) __________hours
31. On atypical day that you were nor at work last week, about how much time did you spend on household chores, for example, cooking, yardwork, running errands, paying bills {excluding time spent caring for childrni or other fiunily members or friends)? (^nane, write “0 )__________hours
32. Thinking back over the last 3 months, have you missed aity days ofwork or parts of days NOT COUNTING VACATION DAYS THAT YOU USED FOR VACATION?
1. No (SUp to question 33)2. Yes
218
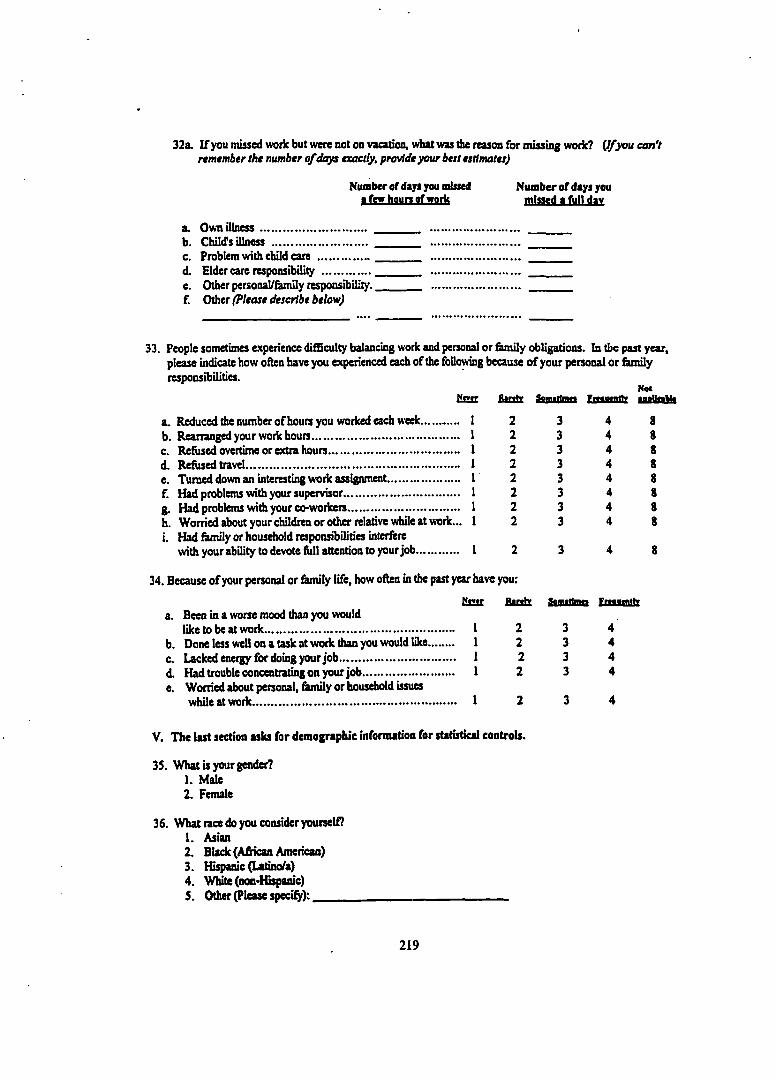
32a. If you missed work but were not on vacation, what was the reason for missing woik? {Jfymi can't nmtmbtr the number of days exactly, provide your bat esiimatesj
Number of days you missed ifpyhwn.8Lff9rk
Number of days you missed a fall dav
a. Own illness................................ .b. Child's illness ............................ ..c. Problem with child care ............... ..d. Elder care responsibility .............. ..e. Other persoiud/Bunily responsibility..f. O üxt (Please describe below)
33. People sometimes experience difBculty balancing work and personal or family obligations. In the past year, please indicate how often have you experienced each of the fallowing because of your personal or family responsibilities.
Notfisat Bsotz SonnUnwi fwiwrtlT mbBciM»
a. Reduced the number ofhours you worked each week...........b. Rearranged your work hours............................................c. Refused overtime or extra hours.......................................d. Refused travel................................................................e. Turned down an interesting work assignment......................f. Had problems with your supervisor...................................g. Had problems with your co-workers.................................h. Worried about your children or other relative while at work...i. Had family or household responsibilities interfere
with your ability to devote fUll attention to your job............. 1
22222222
34. Because of your personal or family life, how often in the past year have you:Wwr
a. Been in a worse mood than you wouldlike to be at work......................................................... 1
b. Done less well on a task at work than you would like 1c. Lacked energy for doing your job.................................. 1d. Had trouble concentrating on your job........................... 1e. Worried about personal, family or household issues
while at work............................................................. I
2222
33333333
88888888
BSOht SoTnflmr. Frtaamrtr
4444
V. The last section asks for demographic information for statistical controls.
35. What is your gender?1. Male2. Female
36. What race do you consider yourself?1. Asian2. Black (African American)3. Hispanic (üttino/a)4. White (non-Hispanic)5. Other please specify):_____
219
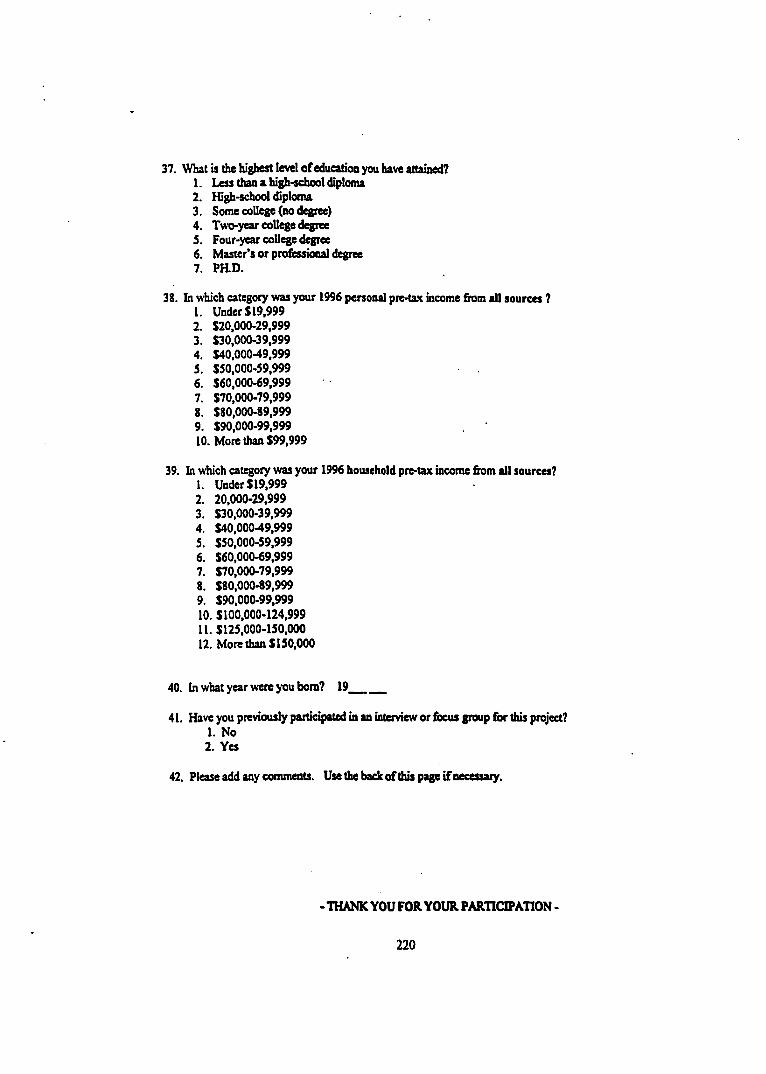
37. Wbat is the highest level of education you have attained?1. Less than a high-school diploma2. High-school diploma3. Some college (no degree)4. Two-year college degree5. Four-year college degree6. Master’s or professional degree7. PH.D.
38. In which category was your 1996 personal pre-tax income fiom all sources ?1. Under $19,9992. $20,000-29,9993. $30,000-39,9994. $40,000-49,9995. $50,000-59,9996. $60,000-69,9997. $70,000-79,9998. $80,000-89,9999. $90,000-99,99910. More than $99,999
39. In which category was jraur 1996 household pre-tax income from all sources?1. Under $19,9992. 20,000-29,9993. $30,000-39,9994. $40,000-49,9995. $50,000-59,9996. $60,000-69,9997. $70,000-79,9998. $80,000-89,9999. $90,000-99,99910. $100,000-124,99911. $125,000-150,00012. More than $150,000
40. In what year were you bom? 19_____
41. Have you previously participated in an interviewer fiicus group for this project?1. No2. Yes
42. Please add any comments. Use the back ofthis page if necessary.
-THANK YOU FOR YOUR PARTICIPATION -
220
APPENDIX D
CONFIRMATION LETTERS TO INTERVIEW AND FOCUS GROUP PARTICIPANTS
Sample Confirmation Letter to Participants in Managerial Interviews
November 24, 1997
Dear (manager’s name),
Thank you for agreeing to participate in the 90-minute focus group on flexible work arrangements. I am looking forward to hearing your perceptions and experiences, both as a manager o f other employees and as an Individual who also deals with home and work responsibilities. I will meet you:
Date: Tuesday, November 12, 1997 Time: 8:30 a.m.Place: Main Building, MW Conference Room, 4rth Floor
I want to assure you of several things. First, your participation in this interview is voluntary. You will be one of a number of managers from across Midwest divisions who will be discussing their perceptions of, and experiences with, flexible work arrangements and balancing the demands of home and work. If at any point during the discussion you want to end your participation, you may do so. Second, the record I make of thé interview will remain confidential. No one at Midwest or Inland will have access to the record of the discussion, and you will not be identified by name in any report. Midwest and Inland will only receive a summary report in which the results of all interviews, focus groups, and a survey will be grouped together.
If you have any questions, feel free to contact me at the my Ohio State phone number (292-6681), or my temporary Midwest phone number (9-6099). If you find you need to reschedules the interview, please let me know as soon as possible.
Again, thank you for helping make this research possible. Your participation wül help Midwest and Inland design a workplace that encourages a balance between work and home obligations.
Sincerely,
Meg Flack, ResearcherThe Ohio State University
221
Sample Confirmation Letter to General Focus Group Participants of Nonmanagers
November I, 1997
Dear (nonmanager’s name),
Thank you for agreeing to participate in the 90-minute focus group on flexible work arrangements. I am looking forward to hearing your perceptions and experiences. Our group will meet;
Date: Tuesday, November 12, 1997 Time: 8:30 - 10:00 a.m.Place: Main Building, MW Conference Room, 4rth Floor
I want to assure you of several things. First, your participation in this focus group is voluntary. You will be part of a group of 8-10 nonmanagerial employees from across Midwest divisions who will be discussing their perceptions of, and experiences with, flexible work arrangements and balancing the demands of home and work. If at any point during the discussion you want to end your participation, you may do so. Second, your supervisor will grant you release time to participate. You will not be asked to put in overtime to make up for your participation. Third, the record I make o f the focus group will remain confidential. No one at I^dwest or Inland will have access to the record of the discussion, and participants will be coded by number, not identified by name.Midwest and Inland will only receive a summary report in which the results of focus groups, interviews, and a survey will be grouped together.
If you have any questions, feel free to contact me at the my Ohio State phone number (292-6681), or my temporary Midwest phone number (9-6099). If you find you cannot participate in the focus group, please let me know as soon as possible.
Again, thank you for helping make this research possible, and contributing information that will help Midwest and Inland design a workplace that encourages a balance between work and home obligations.
Sincerely,
Meg Flack, ResearcherThe Ohio State University
222
Sample Confirmation Letter to Pretest Focus Group Participants
November 26, 1997
Dear (employee’s name).
Thank you for agreeing to participate in the focus group! The group will critique a draft survey designed to evaluate the effectiveness o f Midwest’s flexible work arrangements in helping employees balance home and work responsibilities. Your comments and perceptions will be used to refine the survey, which will later be administered to a random sample of Midwest employees. The group will meet:
Date: Wednesday, December 10 Time: 1-2 p.m.Place: Main Building, MW Conference Room, 4rth floor
I want to assure you of several things. First, your participation in this focus group is voluntary. You will be part of a group of 9-12 managers (nonmanagers) from across Midwest divisions who will take part in the group. If at any point during the discussion you want to end your participation, you may do so. Second, the record I make of the focus group will remain confidential. No one at Midwest or Inland will have access to the record of the discussion, and participants will not be identified by name. Midwest and Inland will only receive a summary report in which the results of interviews, focus groups, and the survey will be grouped together.
If you have any questions, feel fi’ee to contact me at my Ohio State University number (292-6681) or at my temporary Midwest phone number (9-6099). If you find you cannot participate in the focus group, please let me know as soon as possible.
Again, thank you for helping make this research possible, and contributing information that will help Midwest and Inland design a workplace that supports employees’ efforts to meet work and home obligations.
Sincerely,
Meg Flack, ResearcherThe Ohio State University
223
APPENDIX E
ADMINISTRATIVE LETTERS OF SUPPORT, CONFIRMATION LETTERS, AND REMINDERS TO SAMPLE POOL MEMBERS ABOUT THE SURVEY
Sample Letter from Vice Presidents to Sample Pool Members in Support of Survey
December 28, 1997
TO: All Systems employeesFROM: (division vice president)RE: Alternative Work Arrangements Study
Balancing the Demands of Work and Home
Midwest adopted formal policies for flexible work arrangements about three years ago. The goal of the alternative work environment policies (A.W. A.) is to help employees balance their home and work responsibilities, and thus increase workers’ job satisfaction and productivity. Meg Flack, an independent researcher and doctoral candidate in sociology at Ohio State, is conducting an evaluation of the effectiveness o f those policies. The Midwest senior management team and the Enterprise Office o f Human Resources support this evaluation.
Randomly selected individuals from the Systems office will be invited to participate in a 20-minute survey. The survey will be administered January 20 and 21 during the work day in Jeffers Auditorium and supervisors will provide release time for their direct reports’ participation.
Employees’ participation is entirely voluntary. Midwest and Inland will not have access to any individual data collected; individual data collected in the survey will remain confidential. Participants’ identities will be protected in all reports.
I encourage you to support this research if you are selected to participate in the survey on January 20 or 21. Based on the survey results, Midwest and Inland will be able to design jobs, work arrangements, and organizational environments that help employees meet competing home and work responsibilities. By doing so, we will foster job satisfaction and commitment, and thus enhance our productivity.
Thank you, in advance, for your help with this project.
224
Sample Letter to Sample Pool Members About Group Administration of Survey
January 5, 1998
Dear Midwest Employee,
As (vice president of the division) indicated in his memo to Systems employees last week, Midwest is evaluating the effectiveness of its flexible work arrangements in helping employees balance their home and work responsibilities. As an independent researcher, I am conducting that evaluation under the supervision of Professor Lowell Hargens o f The Ohio State University. Although I am not affiliated with Midwest, the senior management of the Systems office and the Enterprise’s Office of Human Resources supports this work.
Over the past few months, a random sample of Midwest employees has participated in focus groups and interviews to help design a survey for this evaluation. Now a random sample of Midwest employees from across different Midwest divisions has been selected to participate in that survey. You are one of a number of managers (nonmanagerial employees) being asked to give their opinions in the survey. Participation is voluntary
In order that the results represent the experiences of people at Midwest, your participation is important. Release time will be granted for your participation and the survey will take about 20 minutes to complete. Your responses will be confidential and no one will be able to identify you by your answers. Indeed, no one at Midwest or Inland will see your answers and your name will never appear in any report about the survey or the evaluation.
The survey will be administered: Date: January 20, 1998 (Tuesday)Time; 8:30 - 9:30 a m.Place: Main Building, Midwest Auditorium
If you are unable to participate at that time, a make-up session is scheduled for:Date: January 21, 1998 (Wednesday)Time: 11:30 - 12:30 am.Place: Main Building, Midwest Auditorium
If you have any questions or need to arrange an alternate time, please contact me at Ohio State University (292-6681) or at my temporary Midwest phone number (9-6099). Thank you for making this research possible, and contributing information that will help Midwest and Inland design workplaces that help employees meet their work and home obligations.
Sincerely,
Meg Flack, Project ResearcherThe Ohio State University
225
Sample Reminder to Sample Pool for Group Administration of Survey
To: Randomly selected MW managers (nonmanagers)
Date: January 10, 1998
Reminder:
You have been randomly selected to participate in the survey evaluating MW’s flexible work policies. Participation is voluntary. You are asked to take the 20-minute survey any time between:
Date: January 20, 1998 (Tuesday)Time: 8:30 - 9:30 a m.Place: Main Building, Midwest Auditorium
If you are unable to participate at that time, a make-up session is scheduled for:Date: January 21, 1998 (Wednesday)Time: 11:30 - 12:30 am.Place: Main Building, Midwest Auditorium
Answers will be confidential and your supervisor will grant release time for your voluntary assistance. MW will not have access to the data. If you have a question or need to arrange for an alternate time, please contact me at Ohio State University (292-6681) or at my temporary Midwest extension (9-6099).
Thank you for making this evaluation possible!
Meg Flack, Project ResearcherThe Ohio State University
226
Midwest President’s Letter of Support to Follow-up Survey Group Members
January 26, 1998
TO; Midwest employees
FROM: (company president)
RE: Alternative Work Arrangements Study:Balancing the Demands of Work and Home
The enclosed survey is part o f a study to evaluate the effectiveness of Midwest’s flexible
work arrangements and their ability to help employees manage both work and home
responsibilities. The Midwest senior management team and the Enterprise Office of
Human Resources support this evaluation.
Because the survey involves a small sample of Midwest employees who were selected at
random, the research depends upon each individual filling out and returning their survey.
Supervisors will provide release time for their direct reports’ participation. Midwest and
Inland will not have access to any individual data collected; individual data collected in the
survey will remain confidential. Participants’ identities will be protected in all reports.
Participation is voluntary. I encourage you to support this research, however. Based on
the survey results. Midwest will be able to design jobs, work arrangements, and
organizational environments that help employees meet competing home and work
responsibilities. By doing so, we will foster job satisfaction and commitment, and thus
enhance our productivity.
Thank you in advance for your time and support ofthis important research.
?27
Letter to Follow-up Survey Group Members
January 26, 1998
Dear Midwest Employee,
Your thoughts and experiences count! You are part of a small random sample being
asked to give their opinions in a survey evaluating the effectiveness of MW’s flexible work
schedules in helping employees balance their home and work responsibilities. Your
participation is voluntary and important—whether or not you use a flexible work schedule.
I am sending it to you because I recognize it is difficult to find a convenient time for
everyone in the sample pool to take the survey in a group setting. Release time will be
granted for your participation. The survey will take about 20 minutes to complete.
Please complete the survey at your earliest convenience and return it by February 2 in the
enclosed stamped envelope. Your responses will be confidential and no one will be able to
identify you by your answers. Indeed, no one at Midwest will see your answers, and your
name will never appear in any report about the survey.
Thank you! Your perspective will help Midwest design a workplace that helps employees
meet both their work and home obligations.
Sincerely,
Meg Flack, Project Researcher
The Ohio State University
228
Reminder to Follow-up Survey Group Members
- SURVEY REMINDER -
If you’ve already completed and returned your survey about MW’s flexible work policies,
thank you very much!If not...
PLEASE COMPLETE AND RETURN YOUR SURVEY
ABOUT MW’S FLEXIBLE WORK POLICIES AT YOUR EARLIEST CONVENIENCE!
Participation is voluntary.All information is confidential.
Thank you -
Meg Flack, Project Researcher OSU Department of Sociology
300 Bricker Hall 190 North Oval Mall
Columbus, OH 43210-1353 614-292-6681
229
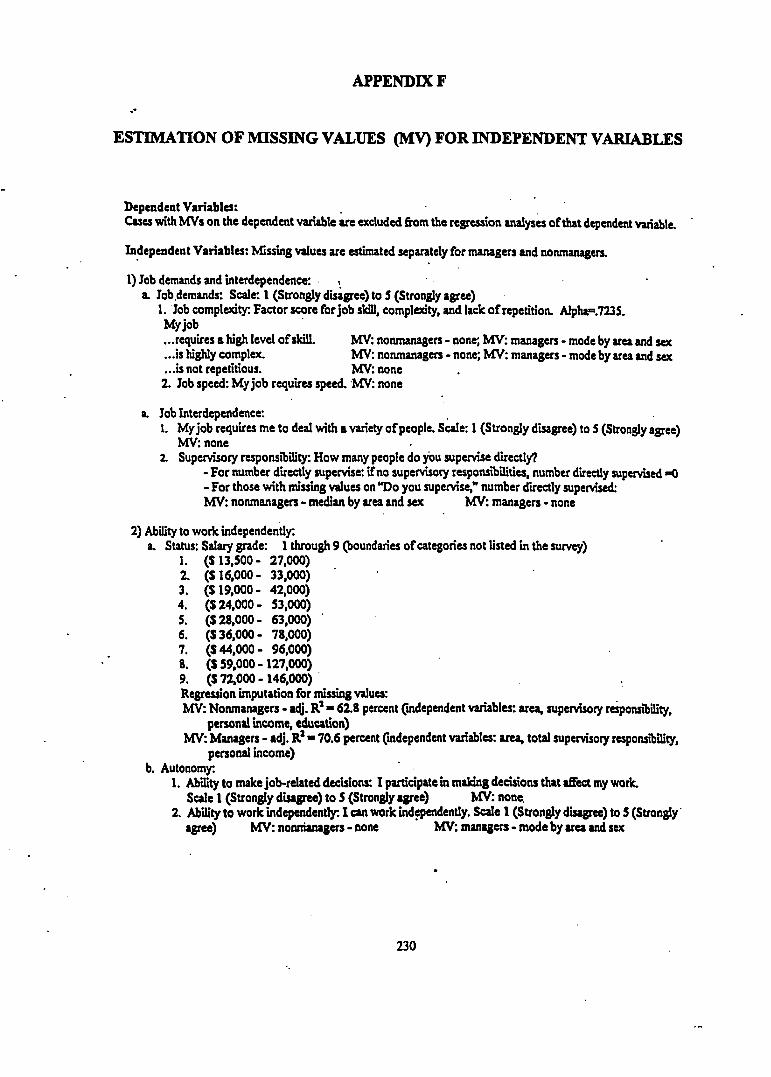
APPENDIX F
ESTIMATION OF MISSING VALUES (MV) FOR INDEPENDENT VARIABLES
Dependent Variables:Cues with MVs on the dependent variable are excluded from the regression analyses of that dependent variable.
Independent Variables: Missing values are estimated separately for managers and nonmanagers.
1) Job demands and interdependence: .a. Job demands: Scale: 1 (Strongly disagree) to S (Strongly agree)
1. Job complexity: Factor score for job skSl, complexity, and lack of repetition. Alpha=.7235.Myjob...requires a high level of sidll. MV: nonmanagers - none; MV: managers - mode by area and sex...is highly complex. MV: nonmaimgers - none; MV: managers - mode by area and sex...is not repetitious. MV: none2. Job speed: Myjob requires speed. MV: none
a Job Interdependence:1. Myjob requires me to deal with a variety of people. Scale; 1 (Strongly disagree) to S (Strongly agree)
hW: none2. Supervisory responsibility: How many people do you supervise directly?
- For number directly supervise: if no supervisory responsibilities, number directly supervised =0- For those with missing values on T o you supervise,” number directly supervised:MV: nonmanagers - median by area and sex managers - none
2) Ability to work independently:a. Status: Salary grade: 1 through 9 (boundaries of categories not listed in the survey)
1. (S 13,500 - 27,000)2. (516,000 - 33,000)3. (S 19,000 - 42,000)4. ($24,000 - 53,000)5. ($28,000 - 63,000)6. ($36,000 - 78,000)7. ($44,000 - 96,000)8. ($59.000-127,000)9. ($72.000-146,000)Regression imputation for missing values:MV: Nonmanagers - adj. R? - 62.8 percent (independent variables: area, supervisory responsibility,
personal income, education)MV: Managers - adj. R? - 70.6 percent independent variables: area, total supervisory responsibility,
personal income)b. Autonomy.
1. Ability to make job-related decisions: I participate in making decisions that affect my work.Scale 1 (Strongly disagree) to 5 (Strongly agree) MV: none.
2. Abili^ to work independently I can work independently. Scale 1 (Strongly disagree) to 5 (Strongly agree) MV: nonmanagers - none MV: managers - mode by area and sex
230
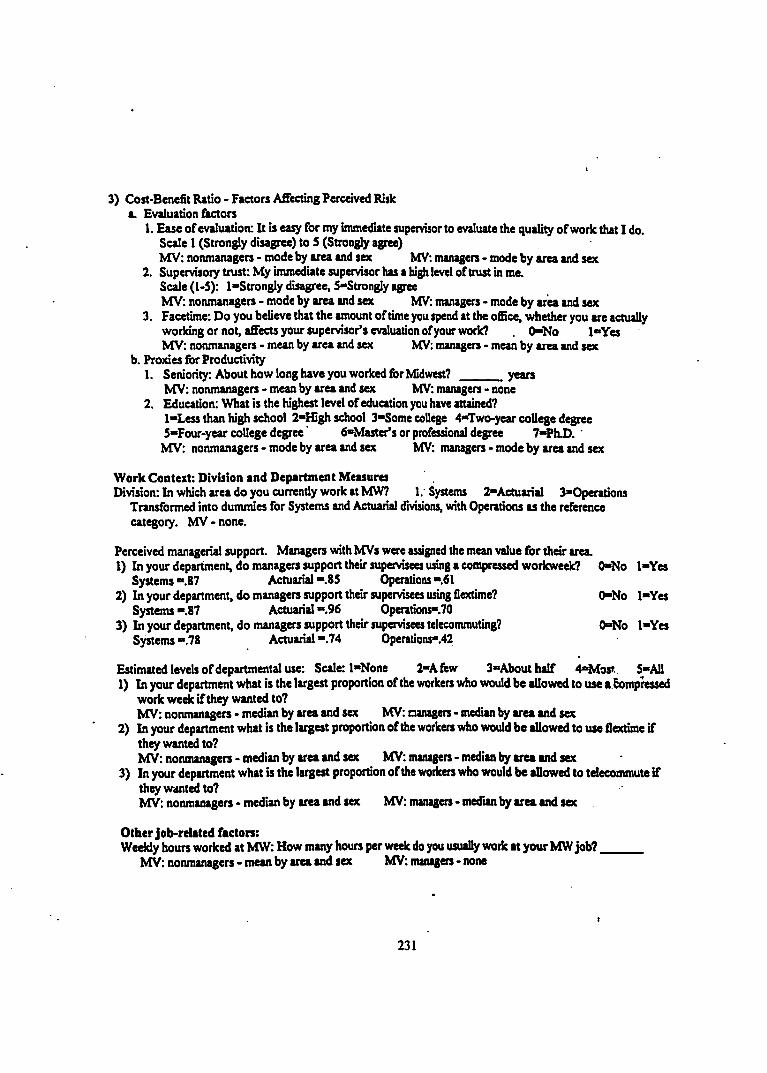
3) Cost-Benefit Ratio - Factors Affecting Perceived Riska. Evaluation factors
1. Ease of evaluation: It is easy for my immediate supervisor to evaluate the quality of work that I do. Scale 1 (Strongly disagree) to S (Strongly agree)MV: nonmanagers - mode by area and sex MV: managers - mode by area and sex
2. Supervisory trust: My immediate supervisor has a high level of trust in me.Scale (1-5): 1-Strongly disagree, 5-Strongly agreeMV; nonmanagers - mode by area and sex MV: managers - mode by area and sex
3. Facetime: Do you believe that the amount of time you spend at the oflSce, whether you are actually working or not, affects your supervisor’s evaluation of your work? 0*No 1-Yes MV: nonmanagers - mean by area and sex MV: managers • mean by area and sex
b. Proxies for Productivity1. Seniority: About how long have you worked for Midwest? years
MV: nonmanagers - mean by area and sex MV: managers - none2. Education: What is the highest level of education you have attained?
1-Less than high school 2-High school 3-Some college 4-Two-year college degree 5-Four-year college degree 6-Master’s or profesaonal degree 7-PhD. 'MV: nonmanagers - mode by area and sex MV; managers - mode by area and sex
W ork Contest: Division and Department MeasuresDivision: In which area do you currently work at MW? 1. Systems 2-Actuarial 3-Operations
Transformed into dummies for Systems and Actuarial divisions, with Operations as the reference category. MV - none.
Perceived managerial support. Managers with MVs were assigned the mean value for their area.1) In your department, do managers support their supervisees udng a compressed workweek? 0-No 1-Yes
Systems-.87 Actuarial-.85 Operations-.612) In your department, do managers support their supervisees using flextime? 0-No 1-Yes
Systems -.87 Actuarial -.96 Operations-.703) In your department, do managers support their supervisees telecommuting? 0-No 1-Yes
Systems -.78 Actuarial -.74 Operations-.42
Estimated levels of departmental use: Scale: 1-None 2-Afew 3=About half 4-Most 5-All1) In your department what is the largest proportion of the workers who would be allowed to use a bompressed
work week if they wanted to?MV: nonmanagers-median by area and sex MV: nanagen - median by area and sex
2) In your department what is the largest proportion of the workers who would be allowed to use flextime if they wanted to?MV: nonmanagers-median by area and sex MV: managers-median by area and sex
3) In your department what is the largest proportion of the workers who would be allowed to telecommute if th ^ wanted to?MV: nonmanagers-median by area and sex MV: managers-median by area and sex
Other job-related factors:Weekly hours worked at MW: How many hours per week do you usually work at your MW job?______
MV: nonmanagers - mean by area and sex MV: managers - none
231
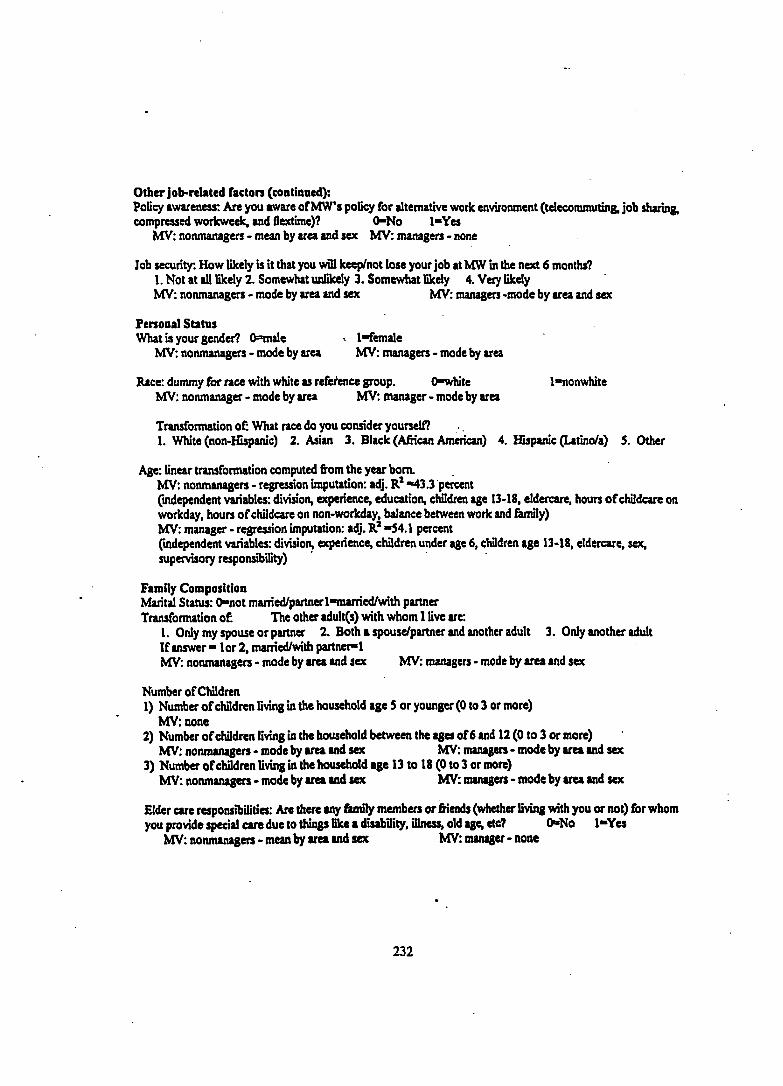
Other Job-rdated factor: (continued):Policy awareneu; Are you aware of MW’s poUqr for alternative work environment (telecommuting, job during, compreued workweek, and flextime)? 0 “No l-Yes
MV: nonmanagers • mean by area and sex MV: managers • none
Job security. How likely is it that you will keep/not lose your job at MW in the next 6 months?1. Not at all likely 2. Somewlut unlikely 3. Somewhat likely 4. Very likelyMV: nonmanagers • mode by area and sex MV: managers -mode by area and sex
Fenonal StatusWhat is your gender? 0=male ' 1-female
MV: nonmanagers • mode by area MV: managers-mode by area
Race: dummy for race with white as reference group. 0-white l-nonwhiteMV: nonmanager - mode by area MV: manager - mode by area
Transformation of: What race do you consider yourself?1. White (non-Hispanic) 2. Asian 3. Black (Afiican American) 4. Hispanic (Latino/a) S. Other
Age: linear transformation computed from the year bom.MV: nonmanagers - regression imputation: adj. R? -43.3 percent(Independent variables: division, experience, education, cltildren age 13-18, eldercare, hours of childcare on workday, hours of childcare on non-workday, balance between woric and 6mily)MV: manager - regression imputation: adj. R’ -54.1 percent(independent variables: division, experience, children under age 6, children age 13-18, eldercare, sex, supervisory responsibility)
Family CompositionMarital Status: 0-not married/partnerl-married/with partner Transformation of: The other adult(s) with whom I live are:
1. Only my spouse or partner 2. Both a spouse/partner and another adult 3. Only another adultIf answer - lor 2, married/with partner-1MV: nonmanagers - mode by area and sex MV: managers - mode by area and sex
Number of CKldren1) Number of children living in the household age 5 or younger (0 to 3 or more)
MV; none2) Number of children living in the household between the ages of 6 and 12 (0 to 3 or more)
MV: nonmanagers - mode by area and sex MV: managers - mode by area and sex3) Number of children living in the household age 13 to 18 (0 to 3 or more)
MV: nonmanagers - mode by area and sex MV: managers - mode by area and sex
Elder care responsibilities: Are there any 6müy members or friends (whether living with you or not) for whom you provide spedal care due to things like a disability, illness, old age, etc? 0-No 1-Yes
MV: nonmanagers-mean by area and sex MV: manager-none
232
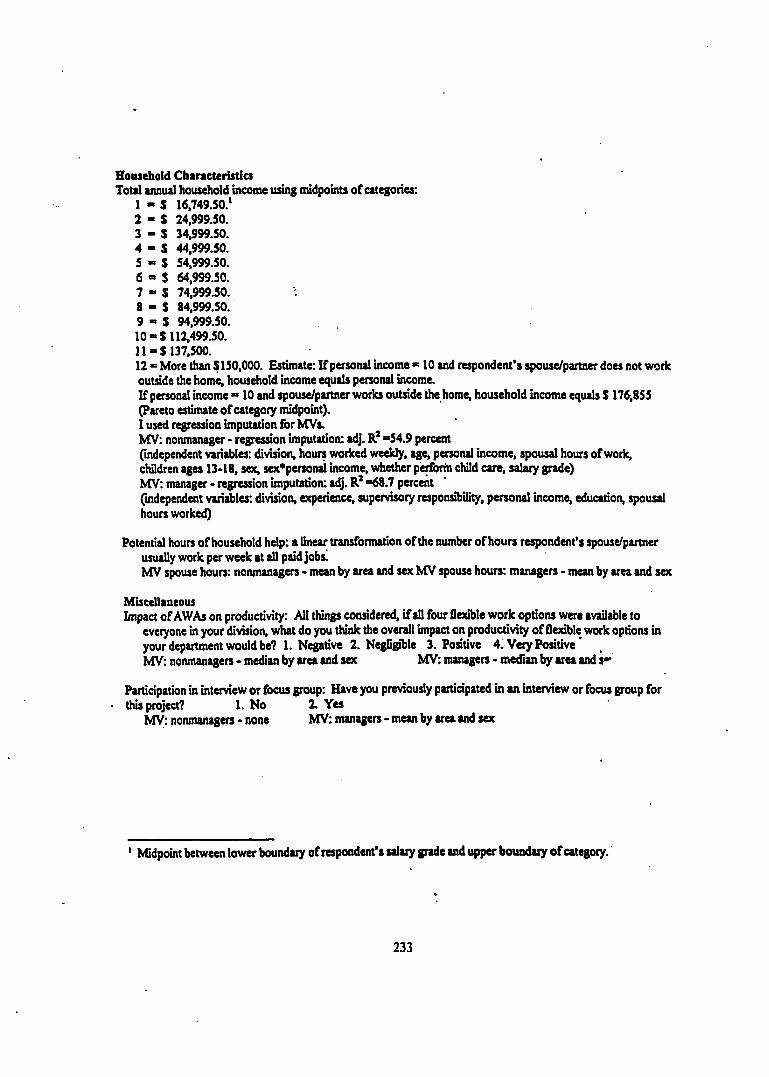
Household CharacteristicsTotal annual household income using midpoints of categories;
1 - S 16,749.50.*2 - S 24,999.50.3 - S 34,999.50.4 - S 44,999.50.5 - S 54,999.50.6 = S 64,999.50.7 - S 74,999.50.8 - $ 84,999.50.9 - $ 94,999.50.10 »S 112,499.50.11 “ $137,500.12“ More than $150,000. Estimate: If personal income “ 10 and respondent’s spouse/partner does not work outside the home, household income equals personal income.If personal income “ 10 and spouse/partner works outside the home, household income equals $ 176,855 (Pareto estimate of category midpoint).I used regression imputation for MVs.MV: nonmanager • regression imputation: adj. B? “54.9 percent(independent variables: division, hours worked weekly, age, personal income, spousal hours of work, children ages 13-18, sex, sex*personal income, whether perform child care, salary grade)MV: manager - regression imputation: adj. R? “68.7 percent(independent variables: division, experience, supervisory responsibility, personal income, education, spousal hours worked)
Potential hours of household help: a linear transformation of the number of hours respondent’s spouse/partner usually work per week at all paid jobslMV spouse hours: nonmanagers - mean by area and sex MV spouse hours: managers - mean by area and sex
MiscellaneousImpact of AWAs on productivity: All things conridered, if all four flexible work options were available to
everyone in your division, what do you think the overall impact on productivi^ of flexible work options in your department would be? 1. Negative 2. Neglipble 3. Positive 4 'VeryPoritive *MV: nonmanagers - median by area and sex MV; managers - median by area and s**
Participation in interview or focus group; Have you previously participated in an interview or focus group for • this project? 1. No 2. Yes
MV; nonmanagers - none MV: managers-mean by area and sex
Midpoint between lower boundary of respondent’s salary grade and upper boundary of category.
233
APPENDIX G
EM PLOYEE HANDBOOK: ALTERNATIVE WORK ARRANGEMENTS
Alternative Work EnvironmentFlextimeFlexible work scheduling allows adaptable start and end times as established by management. A standard number of hours must be worked within a set time period. Start and stop times may be changed on a daily, weekly, monthly, or annual basis as needed. Core times when employees are expected on the job will be established by management.
Compressed Work WeekA compressed work week usually involves a full-time work schedule that is compressed into fewer than five work days. Examples are: four 10-hour days or three 13-hour days.
TelecommutingTelecommuting is defîned as job production performed outside of the office, traditionally, in the employee’s home or alternate location. Office equipment is provided by the company. Production standards and supervisory relationships are deffned by management and reviewed periodically for continued applicability. The employee is expected to come into the office on a regular basis for communication needs and to maintain a sense of relationship with the overall operation.
Job SharingJob sharing occurs when one job is performed by two people sharing the responsibilities and requirements of a particular job. Job parameters are determined by management and agreed to by the job share participants.
There may be some instances where AWE arrangements will not be compatible with business needs. Local management will determine the suitability of the various AWE offerings. In many cases, however, an AWE may result in an improvement in production or service, and business objectives will not be affected adversely. There may also be AWE opportimities within the management ranks.
These flexible work arrangements provide a proactive opportunity to address the multifaceted lives of our employees. If you are interested in participating in an AWE, notify your manager.
234