propagation of impacts after oil spills at sea: categorization and quantification of local vs...
TRANSCRIPT

Contents lists available at ScienceDirect
International Journal of Disaster Risk Reduction
International Journal of Disaster Risk Reduction 7 (2014) 1–8
2212-42http://d
n Tel.:E-m
journal homepage: www.elsevier.com/locate/ijdrr
Propagation of impacts after oil spills at sea: Categorizationand quantification of local vs regional and immediate vsdelayed impacts
Berrin Tansel n
Florida International University, Civil and Environmental Engineering Department, Miami, FL, United States
a r t i c l e i n f o
Article history:Received 19 June 2013Received in revised form2 November 2013Accepted 4 November 2013Available online 4 December 2013
Keywords:Oil spillsCoastal ecosystemsCause and effectContaminant transportEnvironmental impactsRisk analysisImpact analysis
09/$ - see front matter & 2013 Elsevier Ltd.x.doi.org/10.1016/j.ijdrr.2013.11.001
þ1 305 348 2928; fax: þ1 305 348 2802.ail address: [email protected]
a b s t r a c t
The propagation of the water quality impacts after oil spills at sea were analyzed andquantified in relation to transformation and transport characteristics of oil over time asthe impact radius expands depending on the characteristics of the spill. The potentialimpacts were categorized in time domain as immediate and delayed impacts and inspatial domain as local and regional impacts. Transformation and transport characteristicsof the oil were analyzed based on the interactions between different media (air, water,sediments) over time. Knowledge based scoring system was used for the impact intensityand duration of impacts based on the interactions between different media. The potentialimpacts were quantified over time in relation to spill characteristics (i.e., oil type, spill size,spill location). The methodology was demonstrated to compare the potential impacts aftera gasoline spill and a crude oil spill of similar quantities at the same location. The impactscoring methodology can be used for planning and resource allocation and planningpurposes for developing oil spill response as well as assessing and communicatingmitigation needs in time and geographical scales.
& 2013 Elsevier Ltd. All rights reserved.
1. Introduction
Despite the efforts to prevent spills, almost 14,000 oilspills are reported each year in the United States [1].Impacts from an oil spill could be significant dependingon the location of the spill and amount spilled [2]. Afterpetroleum based oil enter a water body, they are trans-formed and transported with water currents, wind effects,and biochemical processes. For example, the emulsifiedoils in natural waters have different transport character-istics than oil slicks since they have significantly highersorption potential by sediments due to increased contactarea. Oil spills near coastal areas can have significantimpacts in coastal and estuarine ecosystems.
All rights reserved.
Although oil spills on land has significantly lower mobilitydue to limited turbulence effects and ground coverage (i.e.,vegetation, structures); conditions at sea can result inrapidly increasing and significantly larger impact radiusdue to the high mobility and phase transfer of oil fractions(e.g., by volatilization, sorption). Oil spills at sea undergoseveral processes including spreading, evaporation, dissolu-tion, emulsification, and sedimentation. Due to wind effectsand currents, oil spills at sea have significantly differentpersistence and transformation profiles in comparison tothose on land. The intensity of mixing due to wind and seaconditions, absence of surface coverage (e.g., vegetation),dynamic nature of the air–water interface; and significantlylarge air–water interface due to waves create favorableconditions for transfer of volatile organic compounds (VOCs)by evaporation and stripping; dissipation of VOCs in air phaseby wind action; dissolution of soluble fractions in waterphase; formation of oil-in-water droplets in e water phase

Fig. 1. Schematic of the impact analysis procedure.
B. Tansel / International Journal of Disaster Risk Reduction 7 (2014) 1–82
(oil-in-water emulsion); and maintaining aerobic conditionsin the mixing layer.
Significant amount of research is available on riskassessment to evaluate the potential hazards prior to anevent. However, studies on the expansion of the impactradius over time in relation to geographical location thereis limited. The impacts after an oil spill can be observedover time and over large geographical areas. Spatiotem-poral dynamic model frameworks have been developed foranalysis of the factors that influence temporal changesafter specific disaster such as water flooding after under-ground mining disasters [3]. However, these approachesrequire detailed information, and extensive data. Fuzzyanalyses are often to describe the probability distributionof disaster prevention and mitigation [4].
Human health risk assessments are performed withdefinitive end points (for example, cancer) and species(humans, animals, plants) are targeted [5]. Ecologicalimpact studies are often performed at a geographicallocation and based on the inherent species at that location.However, spills at a specific location can have significantimpacts over large geographical areas which may experi-ence the impacts at different intensities over time [6].Water bodies are vulnerable for initiating domino effectswhich can impact the well being of coastal communities.The impact radius of these effects can increase over timedue to the mobility of water systems, transfer of contami-nants from one phase to another, and significance of thewater body as a natural resource for coastal communities(i.e., fishing, sports, and tourism) [7].
There are often significant experiences, data and infor-mation available from past disasters to characterize thebehavior of interconnected systems over time. The knowl-edgebase can provide a basis for risk analysis for naturalsystems [8].
The purpose of this study was to develop a methodol-ogy to categorically assess the propagation of potentialimpacts after oil spills at sea. The propagation of the waterquality impacts was analyzed in relation to significanttransformation and transport routes of oil fractions overtime as the impact radius expands depending spill size.The potential impacts were categorized in time domain asimmediate and delayed impacts and in spatial domain aslocal and regional effects. The methodology was used tocompare gasoline and crude oil spills with similar quantitiesat the same geographical location.
2. Methodology
The quantitative impact assessment methodology wasdeveloped based on the general quantitative risk assessmentmethodology presented in Fig. 1. The assessment methodo-logy was modified for the projected impacts based on thecharacteristics of the oil spill (i.e., cause) and the potentialimpact scenarios depending on the transport and persistencecharacteristics of the oil fractions in the water system.
Fig. 1 presents the processes that affect transport andpersistence of oil fractions after spills at sea. The petroleumbased oil fractions may mobilize with currents, transferfrom one phase to another, and/or can be metabolized bymarine organisms. For the analyses, the coastal system was
defined in relation to the nearest coastline to the spilllocation. Immediate effects were defined as adverse effectsthat are expected to occur within 24 h after the contami-nant release to water body. Delayed effects refer to adverseeffects that are expected to occur after one day. Transforma-tion and transport and mechanisms of oil in water to othermedia were identified using an interaction network forpropagation of potential impacts in water as well as inmedia that are in contact with water. (Fig. 2).
The effects of marine and weather conditions on disper-sion of oil slick, emulsion formation (i.e., mixing, evapora-tion, aggregation) compounded with potential naturalhazards (i.e., tropical storms and hurricanes) present uniquechallenges for spill management. The availability of data inthe form of aerial photos, satellite images, and monitoringefforts create an opportunity to understand the behavior ofoil slicks relative to emulsification rates in subtropicalwaters, transformation of slick to emulsion form, rate ofcreaming processes relative to sea conditions, and transportcharacteristics of disperse phase in coastal and openwaters.As the weathering processes continue, larger molecularweight hydrophobic fractions (i.e., asphaltenes) which can-not evaporate easily start forming emulsions. From a spillmanagement perspective, emulsification at sea adverselyaffects the spill management efforts since emulsified oilscan be more viscous than the original oils and droplets canmove faster than the slick phase.
Fig. 3 presents the anticipated fate of oil at sea in relationto oil characteristics, current/wave intensity, and sedimentinteractions during short term and long term states. Theimpact radius can expand immediately after the spill depend-ing on the sea and current conditions as well as over timedepending on the water–sediment interactions.
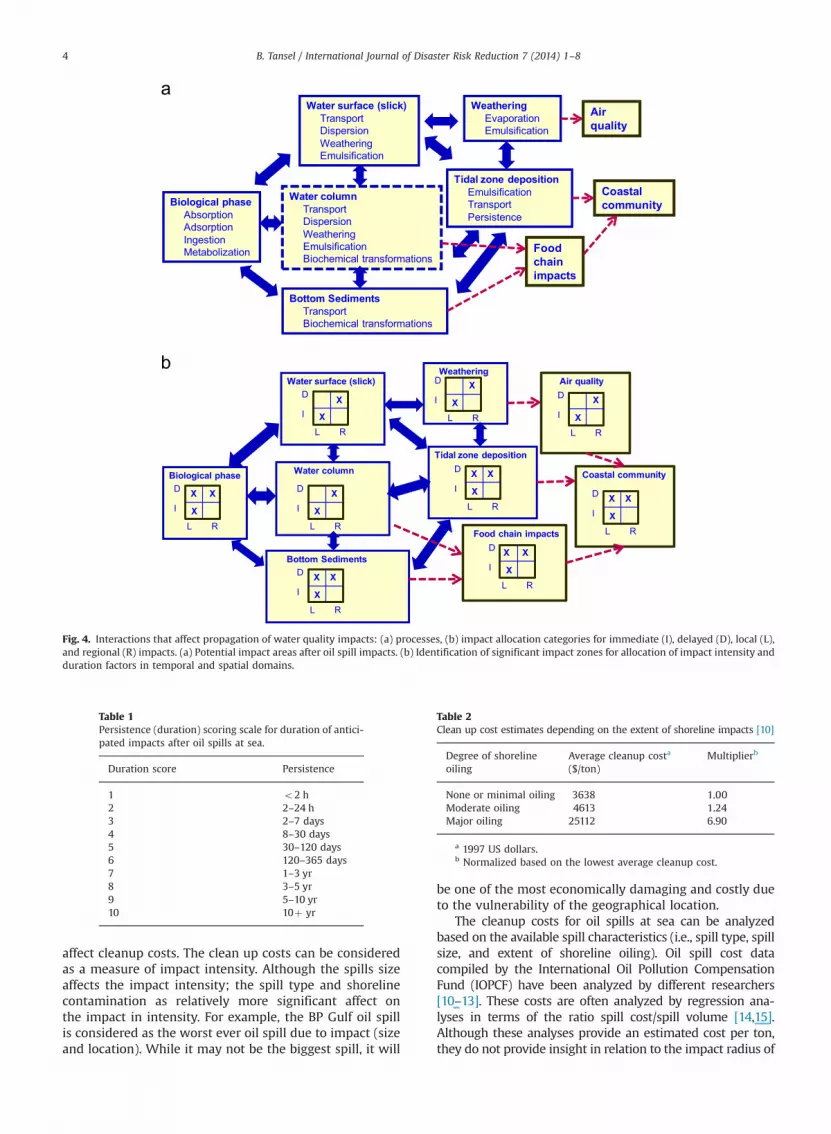
Fig. 4a presents the interaction diagram for the transportand transformation of oils after spills at sea. Based on theinteractions between different phases, an impact diagramcan be developed as presented in Fig. 4b to categorize theimmediate (I) and delayed (D) effects in time scale as wellas local (L) and regional (R) effects in spatial scale.
For the analyses conducted, a local effect was consideredas an adverse effect that takes place within the immediatevicinity (less than 20 mile radius) of the spill location.Regional effect refers to an adverse effect that affects the

Emulsification/stripping zone
Entrained water
Emulsification
Wind, wave, tidal action
Water currents
Oil slick Tar ballsWeathering
Sediments
Oil plume Water column
Sediment zone
Oil droplets
Dissolution
Sorption
Sinking
Metabolization
Mixing and transport by currents and wave action
Increasing pressure
Decreasing temperatureSp
ill Q
uant
ity s
cale
Mill
ilter
s
Spill
Tim
e sc
ale
Transformation time scale
Transport and geographical distribution scale
Persistence time scale
Spill
Fre
quen
cyO
n tim
e
Dai
ly
Shoreline deposition
Shoreline
Fig. 2. Processes that affect transport and persistence of oil fractions after spills at sea.
Oil/Water density ratio
Currents Sediment interaction
<1
1<
High
Low
High
Low
High
Low
Majority floating
Initial state
Majority below surface
Short term stateLong term state
Suspended in water
Sinking to bottom
Sinking-Stranding onshore-Resuspension-Reflotation
Floating-Tar ball formation-Shoreline deposition
Sinking-After mixing with sand
Dispersion-Transport by currents and waves
High
Low
Sinking to bottom
Sinking to bottom
Coastal impacts
High
Low
Emulsification
Floating
Expansion of impact radius
Expansion of impact radius
Expansion of impact radius
Expansion of impact radius
Fig. 3. Anticipated fate of oils spilled at sea in relation to oil characteristics, current/wave intensity, and sediment interactions (with modifications afterNRC [9]).
B. Tansel / International Journal of Disaster Risk Reduction 7 (2014) 1–8 3
areas within 20–250 mile radius of the contaminant releaselocation.
After the impacts for each system were identified, theintensity and duration scores were assigned for eachimpact type (I, D, L, R). A scoring systems from 1 to 10was developed for both the impact intensity and impact
duration. For the impact duration, a score of 1 correspondsto an impact that would be observed for less than 2 h, anda score of 10 corresponds an impact which would last over10 yr as presented in Table 1.
Each spill involves a unique set of circumstances basedon spill location, oil type, and proximity to coastline that
Bottom SedimentsTransportBiochemical transformations
Water columnTransportDispersionWeatheringEmulsificationBiochemical transformations
Biological phaseAbsorptionAdsorptionIngestionMetabolization
Tidal zone depositionEmulsificationTransport Persistence
WeatheringEvaporationEmulsification
Air quality
Food chain impacts
Water surface (slick)TransportDispersionWeatheringEmulsification
Coastal community
Bottom Sediments
Water columnBiological phase
Tidal zone deposition
WeatheringAir quality
Food chain impacts
Water surface (slick)
Coastal communityD
I X
D
I X
D
I X
D
I X
X
D
I XD
I X
X
D
I XX X
X X
D
I X
X
D
I XL R
L R
L R
L R
L R
L R
L R
L R
L R
X X
X X
X X
X
Fig. 4. Interactions that affect propagation of water quality impacts: (a) processes, (b) impact allocation categories for immediate (I), delayed (D), local (L),and regional (R) impacts. (a) Potential impact areas after oil spill impacts. (b) Identification of significant impact zones for allocation of impact intensity andduration factors in temporal and spatial domains.
Table 1Persistence (duration) scoring scale for duration of antici-pated impacts after oil spills at sea.
Duration score Persistence
1 o2 h2 2–24 h3 2–7 days4 8–30 days5 30–120 days6 120–365 days7 1–3 yr8 3–5 yr9 5–10 yr10 10þ yr
Table 2Clean up cost estimates depending on the extent of shoreline impacts [10]
Degree of shorelineoiling
Average cleanup costa
($/ton)Multiplierb
None or minimal oiling 3638 1.00Moderate oiling 4613 1.24Major oiling 25112 6.90
a 1997 US dollars.b Normalized based on the lowest average cleanup cost.
B. Tansel / International Journal of Disaster Risk Reduction 7 (2014) 1–84
affect cleanup costs. The clean up costs can be consideredas a measure of impact intensity. Although the spills sizeaffects the impact intensity; the spill type and shorelinecontamination as relatively more significant affect onthe impact in intensity. For example, the BP Gulf oil spillis considered as the worst ever oil spill due to impact (sizeand location). While it may not be the biggest spill, it will
be one of the most economically damaging and costly dueto the vulnerability of the geographical location.
The cleanup costs for oil spills at sea can be analyzedbased on the available spill characteristics (i.e., spill type, spillsize, and extent of shoreline oiling). Oil spill cost datacompiled by the International Oil Pollution CompensationFund (IOPCF) have been analyzed by different researchers[10–13]. These costs are often analyzed by regression ana-lyses in terms of the ratio spill cost/spill volume [14,15].Although these analyses provide an estimated cost per ton,they do not provide insight in relation to the impact radius of
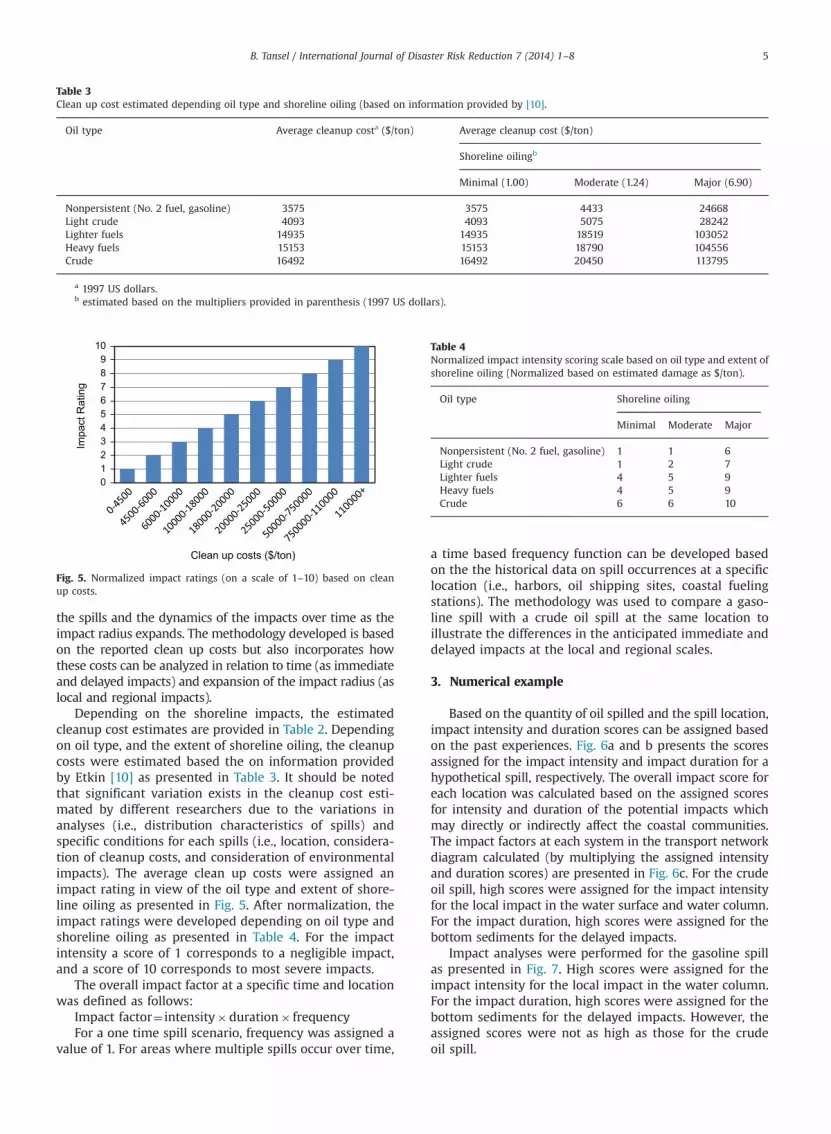
Table 3Clean up cost estimated depending oil type and shoreline oiling (based on information provided by [10].
Oil type Average cleanup costa ($/ton) Average cleanup cost ($/ton)
Shoreline oilingb
Minimal (1.00) Moderate (1.24) Major (6.90)
Nonpersistent (No. 2 fuel, gasoline) 3575 3575 4433 24668Light crude 4093 4093 5075 28242Lighter fuels 14935 14935 18519 103052Heavy fuels 15153 15153 18790 104556Crude 16492 16492 20450 113795
a 1997 US dollars.b estimated based on the multipliers provided in parenthesis (1997 US dollars).
0 1 2 3 4 5 6 7 8 9
10
Impa
ct R
atin
g
Clean up costs ($/ton)
Fig. 5. Normalized impact ratings (on a scale of 1–10) based on cleanup costs.
Table 4Normalized impact intensity scoring scale based on oil type and extent ofshoreline oiling (Normalized based on estimated damage as $/ton).
Oil type Shoreline oiling
Minimal Moderate Major
Nonpersistent (No. 2 fuel, gasoline) 1 1 6Light crude 1 2 7Lighter fuels 4 5 9Heavy fuels 4 5 9Crude 6 6 10
B. Tansel / International Journal of Disaster Risk Reduction 7 (2014) 1–8 5
the spills and the dynamics of the impacts over time as theimpact radius expands. The methodology developed is basedon the reported clean up costs but also incorporates howthese costs can be analyzed in relation to time (as immediateand delayed impacts) and expansion of the impact radius (aslocal and regional impacts).
Depending on the shoreline impacts, the estimatedcleanup cost estimates are provided in Table 2. Dependingon oil type, and the extent of shoreline oiling, the cleanupcosts were estimated based the on information providedby Etkin [10] as presented in Table 3. It should be notedthat significant variation exists in the cleanup cost esti-mated by different researchers due to the variations inanalyses (i.e., distribution characteristics of spills) andspecific conditions for each spills (i.e., location, considera-tion of cleanup costs, and consideration of environmentalimpacts). The average clean up costs were assigned animpact rating in view of the oil type and extent of shore-line oiling as presented in Fig. 5. After normalization, theimpact ratings were developed depending on oil type andshoreline oiling as presented in Table 4. For the impactintensity a score of 1 corresponds to a negligible impact,and a score of 10 corresponds to most severe impacts.
The overall impact factor at a specific time and locationwas defined as follows:
Impact factor¼ intensity�duration� frequencyFor a one time spill scenario, frequency was assigned a
value of 1. For areas where multiple spills occur over time,
a time based frequency function can be developed basedon the the historical data on spill occurrences at a specificlocation (i.e., harbors, oil shipping sites, coastal fuelingstations). The methodology was used to compare a gaso-line spill with a crude oil spill at the same location toillustrate the differences in the anticipated immediate anddelayed impacts at the local and regional scales.
3. Numerical example
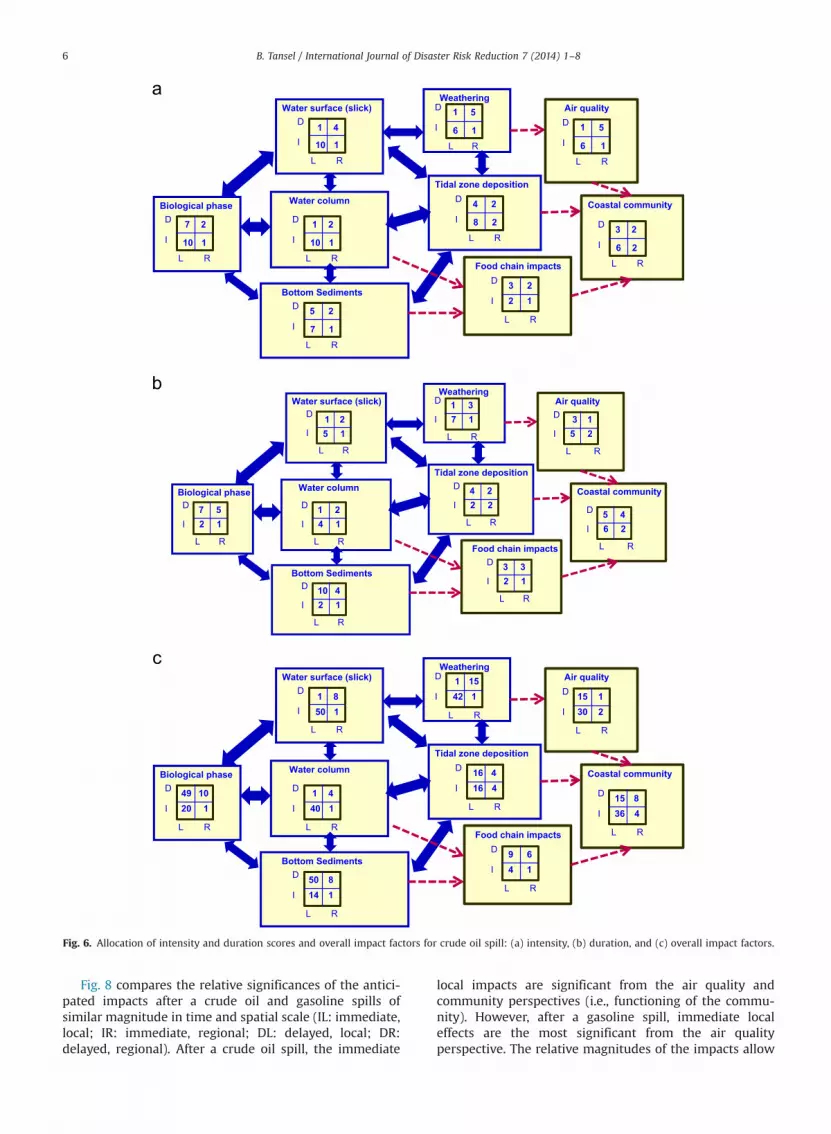
Based on the quantity of oil spilled and the spill location,impact intensity and duration scores can be assigned basedon the past experiences. Fig. 6a and b presents the scoresassigned for the impact intensity and impact duration for ahypothetical spill, respectively. The overall impact score foreach location was calculated based on the assigned scoresfor intensity and duration of the potential impacts whichmay directly or indirectly affect the coastal communities.The impact factors at each system in the transport networkdiagram calculated (by multiplying the assigned intensityand duration scores) are presented in Fig. 6c. For the crudeoil spill, high scores were assigned for the impact intensityfor the local impact in the water surface and water column.For the impact duration, high scores were assigned for thebottom sediments for the delayed impacts.
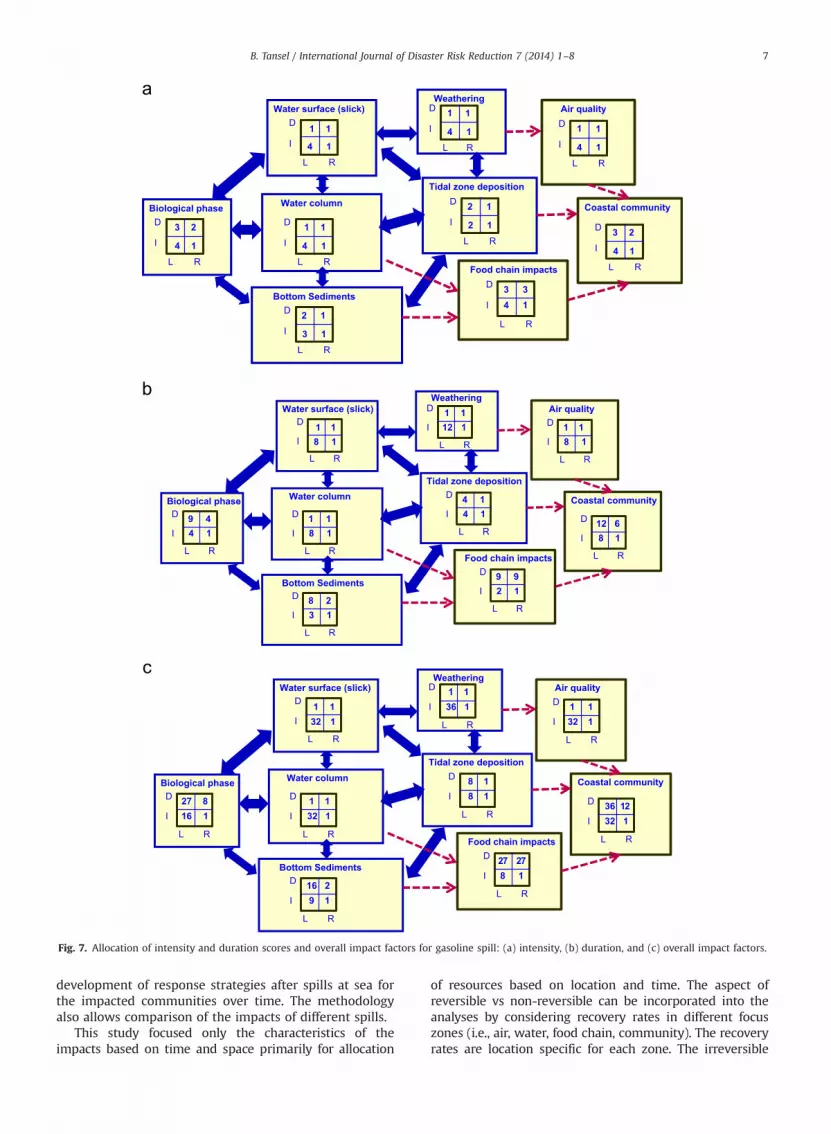
Impact analyses were performed for the gasoline spillas presented in Fig. 7. High scores were assigned for theimpact intensity for the local impact in the water column.For the impact duration, high scores were assigned for thebottom sediments for the delayed impacts. However, theassigned scores were not as high as those for the crudeoil spill.
Bottom Sediments
Water columnBiological phase
Tidal zone deposition
WeatheringAir quality
Food chain impacts
Water surface (slick)
Coastal communityD
I
D
I
D
I
1D
I
5
D
ID
I
D
I
1D
I 6 1
5
D
I
Bottom Sediments
Water columnBiological phase
Tidal zone deposition
WeatheringAir quality
Food chain impacts
Water surface (slick)
Coastal communityD
I
D
I
D
I
D
I
D
ID
I
D
I
D
I
L R
D
I
L R
Bottom Sediments
Water columnBiological phase
Tidal zone deposition
WeatheringAir quality
Food chain impacts
Water surface (slick)
Coastal communityD
I
D
I
D
I
D
I
D
ID
I
D
I
D
I
D
I
L R
L R
L R
L R
L R
L R
L R
L R
L R
L R
L R
L R
L R
L R
L R
L R
L R
L R
L R
L R
L R
L R
L R
L R
L R
10 1
7 2
10 1
7 1
5 2
6 1
8 2
4 2
10 1
1 2
2 13 2
6 2
3 2
1 4
2 17 5
5 1
2 110 4
7 11 3
2 24 2
4 11 2
2 13 3
5 23 1
6 25 4
1 2
20 149 10
50 1
14 150 8
42 11 15
16 416 4
40 11 4
4 19 6
30 215 1
36 415 8
1 8
Fig. 6. Allocation of intensity and duration scores and overall impact factors for crude oil spill: (a) intensity, (b) duration, and (c) overall impact factors.
B. Tansel / International Journal of Disaster Risk Reduction 7 (2014) 1–86
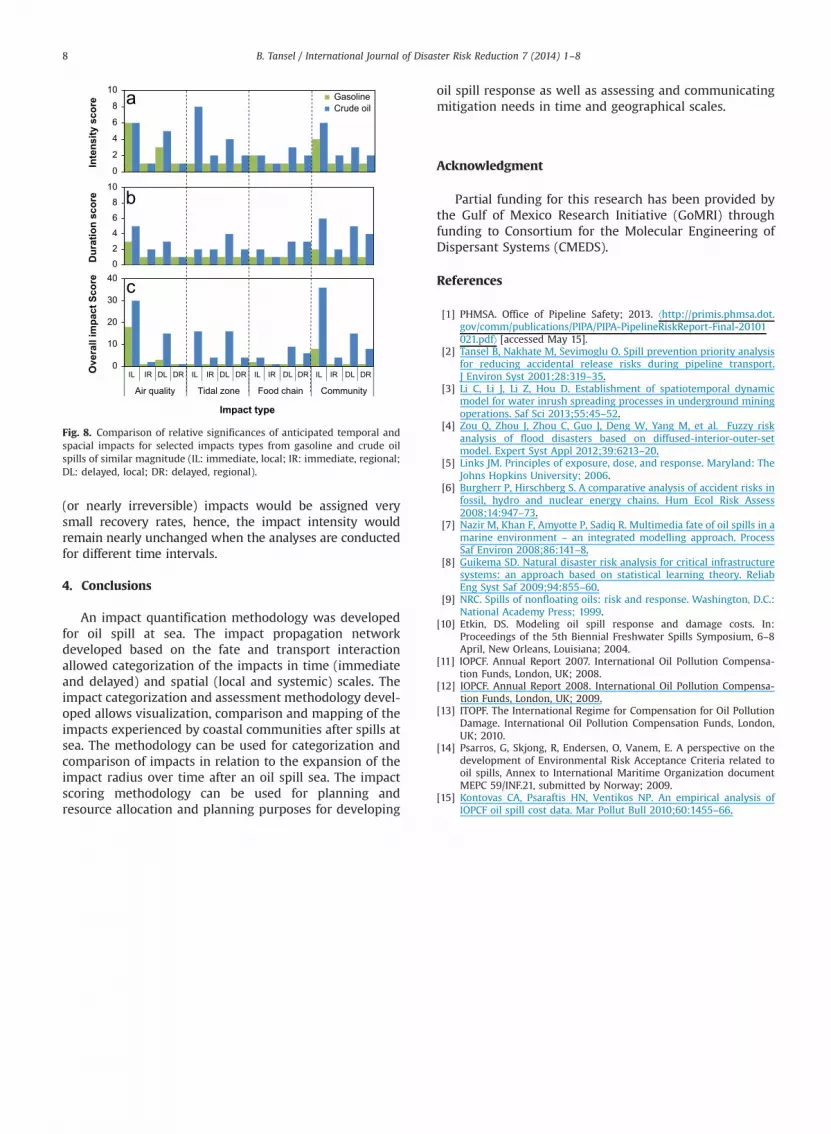
Fig. 8 compares the relative significances of the antici-pated impacts after a crude oil and gasoline spills ofsimilar magnitude in time and spatial scale (IL: immediate,local; IR: immediate, regional; DL: delayed, local; DR:delayed, regional). After a crude oil spill, the immediate
local impacts are significant from the air quality andcommunity perspectives (i.e., functioning of the commu-nity). However, after a gasoline spill, immediate localeffects are the most significant from the air qualityperspective. The relative magnitudes of the impacts allow
Bottom Sediments
Water columnBiological phase
Tidal zone deposition
WeatheringAir quality
Food chain impacts
Water surface (slick)
Coastal communityD
I
D
I
D
I
1D
I
1
D
ID
I
D
I
1D
I
1
D
I4 1L R
3 2
4 1L R
3 1L R
2 1
4 1L R
2 1L R
2 1
4 1L R
1 1
4 1
L R
3 3
4 1L R
4 1L R
3 2
1 1
Bottom Sediments
Water columnBiological phase
Tidal zone deposition
WeatheringAir quality
Food chain impacts
Water surface (slick)
Coastal communityD
I
D
I
D
I
D
I
D
ID
I
D
I
D
I
D
I
Bottom Sediments
Water columnBiological phase
Tidal zone deposition
WeatheringAir quality
Food chain impacts
Water surface (slick)
Coastal communityD
I
D
I
D
I
D
I
D
ID
I
D
I
D
I
D
I
4 1
L R
9 4
8 1
L R
3 1
L R
8 2
12 1
L R
1 1
4 1
L R
4 1
8 1
L R
1 1
2 1
L R
9 9
8 1
L R
1 1
8 1
L R
12 6
1 1
16 1
L R
27 8
32 1
L R
9 1
L R
16 2
36 1
L R
1 1
8 1
L R
8 1
32 1
L R
1 1
8 1
L R
27 27
32 1
L R
1 1
32 1
L R
36 12
1 1
Fig. 7. Allocation of intensity and duration scores and overall impact factors for gasoline spill: (a) intensity, (b) duration, and (c) overall impact factors.
B. Tansel / International Journal of Disaster Risk Reduction 7 (2014) 1–8 7
development of response strategies after spills at sea forthe impacted communities over time. The methodologyalso allows comparison of the impacts of different spills.
This study focused only the characteristics of theimpacts based on time and space primarily for allocation
of resources based on location and time. The aspect ofreversible vs non-reversible can be incorporated into theanalyses by considering recovery rates in different focuszones (i.e., air, water, food chain, community). The recoveryrates are location specific for each zone. The irreversible
0
2
4
6
8
10 In
tens
ity s
core
Gasoline Crude oil
0
2
4
6
8
10
Dur
atio
n sc
ore
0
10
20
30
40
IL IR DL DR IL IR DL DR IL IR DL DR IL IR DL DR
Air quality Tidal zone Food chain Community
Ove
rall
impa
ct S
core
Impact type
Fig. 8. Comparison of relative significances of anticipated temporal andspacial impacts for selected impacts types from gasoline and crude oilspills of similar magnitude (IL: immediate, local; IR: immediate, regional;DL: delayed, local; DR: delayed, regional).
B. Tansel / International Journal of Disaster Risk Reduction 7 (2014) 1–88
(or nearly irreversible) impacts would be assigned verysmall recovery rates, hence, the impact intensity wouldremain nearly unchanged when the analyses are conductedfor different time intervals.
4. Conclusions
An impact quantification methodology was developedfor oil spill at sea. The impact propagation networkdeveloped based on the fate and transport interactionallowed categorization of the impacts in time (immediateand delayed) and spatial (local and systemic) scales. Theimpact categorization and assessment methodology devel-oped allows visualization, comparison and mapping of theimpacts experienced by coastal communities after spills atsea. The methodology can be used for categorization andcomparison of impacts in relation to the expansion of theimpact radius over time after an oil spill sea. The impactscoring methodology can be used for planning andresource allocation and planning purposes for developing
oil spill response as well as assessing and communicatingmitigation needs in time and geographical scales.
Acknowledgment
Partial funding for this research has been provided bythe Gulf of Mexico Research Initiative (GoMRI) throughfunding to Consortium for the Molecular Engineering ofDispersant Systems (CMEDS).
References
[1] PHMSA. Office of Pipeline Safety; 2013. ⟨http://primis.phmsa.dot.gov/comm/publications/PIPA/PIPA-PipelineRiskReport-Final-20101021.pdf⟩ [accessed May 15].
[2] Tansel B, Nakhate M, Sevimoglu O. Spill prevention priority analysisfor reducing accidental release risks during pipeline transport.J Environ Syst 2001;28:319–35.
[3] Li C, Li J, Li Z, Hou D. Establishment of spatiotemporal dynamicmodel for water inrush spreading processes in underground miningoperations. Saf Sci 2013;55:45–52.
[4] Zou Q, Zhou J, Zhou C, Guo J, Deng W, Yang M, et al. Fuzzy riskanalysis of flood disasters based on diffused-interior-outer-setmodel. Expert Syst Appl 2012;39:6213–20.
[5] Links JM. Principles of exposure, dose, and response. Maryland: TheJohns Hopkins University; 2006.
[6] Burgherr P, Hirschberg S. A comparative analysis of accident risks infossil, hydro and nuclear energy chains. Hum Ecol Risk Assess2008;14:947–73.
[7] Nazir M, Khan F, Amyotte P, Sadiq R. Multimedia fate of oil spills in amarine environment – an integrated modelling approach. ProcessSaf Environ 2008;86:141–8.
[8] Guikema SD. Natural disaster risk analysis for critical infrastructuresystems: an approach based on statistical learning theory. ReliabEng Syst Saf 2009;94:855–60.
[9] NRC. Spills of nonfloating oils: risk and response. Washington, D.C.:National Academy Press; 1999.
[10] Etkin, DS. Modeling oil spill response and damage costs. In:Proceedings of the 5th Biennial Freshwater Spills Symposium, 6–8April, New Orleans, Louisiana; 2004.
[11] IOPCF. Annual Report 2007. International Oil Pollution Compensa-tion Funds, London, UK; 2008.
[12] IOPCF. Annual Report 2008. International Oil Pollution Compensa-tion Funds, London, UK; 2009.
[13] ITOPF. The International Regime for Compensation for Oil PollutionDamage. International Oil Pollution Compensation Funds, London,UK; 2010.
[14] Psarros, G, Skjong, R, Endersen, O, Vanem, E. A perspective on thedevelopment of Environmental Risk Acceptance Criteria related tooil spills, Annex to International Maritime Organization documentMEPC 59/INF.21, submitted by Norway; 2009.
[15] Kontovas CA, Psaraftis HN, Ventikos NP. An empirical analysis ofIOPCF oil spill cost data. Mar Pollut Bull 2010;60:1455–66.