productivity in the tourism industry
TRANSCRIPT
Productivity in the Tourism Industry
CARLOS P. BARROS AND FERNANDO P. ALVES*
Abstract
This paper analyzes the efficiency of a Portuguese public-owned hotel chain, Enatur. It applies data envelopment analysis (DEA) to estimate total factor productivity (TFP) change: while breaking it down into technical e~ciency and technological change. The bench.marking procedure used is an internal one, which compares hotels with each other. For the period 1999-2001, the hotels are ranked according to their total productivity change. It is concluded that some hotels experienced productivity growth, while others faced a decline. Some implications beneficial for managerial policies were drawn from this study. (JEL D24, L83, M21, 052)
I n t r o d u c t i o n
The World Tourism Organization claimed that in the next few years, Portugal would face large-scale growth in tourism arrivals [Financial Times: Survey on Portugal, 2001]. Yet, the Portuguese hotel industry has been suffering from various flaws, thwarting the country's future as one of Europe's main tourist areas. There are four main problems, among others. First, as reported in the late 1990s, there is a decreasing number of Dutch and German tourists. Second, there is an increasing number of countries, such as Turkey and Tunisia, entering the tourist market in the Mediterranean Sea by competing with better quality and lower prices. Third, there has been an inadequate public policy over the last few years, relying on hotel construction subsidized by European funds. Fourth, various promotional campaigns, though managed by the public regulatory agency Instituto do Com@rcio Externo de Portugal (ICEP), suffered from small bad-timed investments. Indeed, ICEP has had responsibilities for Portuguese exports, including tourism. However, to some extent, the tourist industry feels that ICEP has neglected tourism.
Facing such flaws, the hotel industry has reacted by increasing its efficient use of inputs. By various means, the hotel industry has tried to reduce the relative inflexibility of its supply. One procedure for improving competitiveness is benchmarking, which is a search for the industry's best practices that will lead to superior performance [Cano et al., 2001]. Among various techniques for benchmarking homogenous productive units, there is data envelopment analysis (DEA), which is a nonparametric technique [Anderson, et al., 1999; Anderson, Lewis, and Parker, 1999; Anderson, Fok, and Scott, 2000; Morey and Dittman, 1995; Bell and Morey, 1995]
This paper analyzes the efficiency of Portugal's public-owned hotel chain, Enatur, with DEA for the period 1999-2001. The paper analyzes total factor productivity (TFP) by" breaking it down into technical efficiency and technological change. It concludes that few hotels achieved total productivity improvements in that period. In other words, a larger fraction of them achieved improvements in technical efficiency. However, only a small fraction reached improvements in technological change. Mainly, the failure to attain total productivity
*Technical University of Lisbon--Portugal.
215
216 IAER: AUGUST 2004, VOL. 10, NO. 3
improvements is due to technological change debilities. This paper expands on previous research in three ways. First, the DEA approach to European hotels is applied. Previous papers dealt only with U.S. hotels. Second, the Malmquist index for hotels is estimated. It is unknown whether any previous papers on the tourism industry used this technique. Third, the efficiency of one hotel chain is investigated. Previous papers dealt with either hotels or travel departments of different firms.
The paper is organized as follows. First, it describes the institutional setting and reviews the existing literature in this field. Then, it explains the theoretical framework, gathers the data, measures the efficiency results, analyzes the combinations of technical efficiency and technological efficiency, and discusses the results. Finally, the paper submits the authors' conclusions.
Ins t i tu t iona l Se t t ing
In 1940, among the various then-designed public policies to develop tourism, Portugal launched a network of small tourist hotels managed by a state-owned company, Enatur (v~avw.Pousadas.pt). Since then, this hotel chain has been restoring and preserving some of Portugal's most hospitable heritage and architecture while promoting tourism. Enatur, as a member of the Federation of Traditional Accommodation and Historic Houses, is similar to the Spanish Hosterias y Hospederias Reales, also a national chain of exclusive hotels, the paradores. However, the Portuguese chain has two t)~pes of hotels: 27 regional hotels and 15 historic hotels, not to mention a franchised hotel. In 1950, the first historic hotels ap- peared and were located in previously restored monuments such as manors, castles, palaces, convents, and monasteries, refurbished to satisfy clients' most refined needs.
From north to south, this hotel chain is scattered all around Portugal (see the location map on Enatur's website). In 1999, the major supplying countries were Germany with 17.2 percent, the U.S. with 15.7 percent, and the U.K. with 10.4 percent. Portuguese tourists are rare customers of Enatur due to their lower disposable incomes.
The Secretary of State for Tourism, hierarchically dependent on the Ministry of the Econ- omy, appoints Enatur's managers on a political basis from a set of various public managers specializing in tourism management. In turn, Enatur's management board appoints the hotel specialized managers on a technical basis.
Enatur, as a public enterprise, must attain two conflicting objectives: promoting tourism and restoring and preserving Portugal's old heritage and architecture. These contradictory objectives resulted in small hotels, thus, onty generating small-scale economies. Indeed, some hotels became highly indebted, as the repair and maintenance costs are high, particularly for older buildings. In terms of their location, some hotel-monuments, being scattered around the country, show no initial tourist intent, except for vistas. Such loss-making characteristics affect the overall performance.
Literature R e v i e w
Papers on hotel efficiency using frontier models included Bell and Morey [1995], who studied 31 travel departments, with the help of DEA, by estimating their efficiency ratios. On one hand, they used four inputs: (1) actual levels of support costs (fees, labor, space, and technology), (2) actual levels of expenditure on travel (hotel, flight, and car rental charges), (3) level of environmental factors (means of negotiating discounts, percentage of trips with commuter flights required), and (4) nominal levels of other expenditures. On the other hand, they chose, as outputs, the level of service provided (excellent and average).
B A R R O S A N D ALVES: T O U R I S M 217
Morey and Dittman [1995] also probed the efficiency of 54 hotels with the use of DEA. On one hand, they treated nine inputs: (1) salaries, (2) energy costs, (3) fixed market expenditure, (4) room division expenditure, (5) non-salary expenses with property, (6) non- salary expenses with administrative work, (7) non-salary expenses with variable advertising, (8) payroll and related expenses for administrative work, and (9) salaries and related expenses with variable advertising. On the other hand, they handled four outputs: (1) market share, (2) rate of growth, (3) total revenue, and (4) level of service provided.
By using the DEA approach, Anderson et al. [2000] also evaluated the efficiency of 48 hotels. They estimated their aUocative and technical efficiency by using cross-sectional data on prices, inputs, and outputs. They managed five inputs: (1) number of rooms, (2) full-time equivalent workers, (3) total gaming-related expenditure, (4) total expenditure on food and beverages, and (5) various other expenditures. However, they only considered two outputs: (1) total revenue and (2) other revenue.
In 1994, Anderson, Fish, and Michello [1999] examined the efficiency of 48 hotels with the utilization of an econometric, stochastic, and translog cost frontier. They assessed five inputs: (1) number of rooms, (2) total gaming-related expenditure, (3) total expenditure on food and beverages, (4) number of full-time equivalent workers, and (5) other expenditure. They also only measured two outputs: (1) total revenue and (2) other revenue. To estimate the daily room price, they divided hotel revenue by the product of the number of rooms, occupancy rate, and number of days per year. To estimate a worker's salary, they divided total hotel revenue per full-time equivalent employee. To proxy the price of food, gaming, beverages, and other expenditure, they estimated each of these items as a percentage of total revenue.
Anderson, Lewis, and Parker [1999] dissected the efficiency of 31 travel management departments with the use of DEA and a stochastic cost frontier. They operated nine inputs: (1) fee expenditure, (2) car expenditure, (3) technology costs, (4) labor expenditure, (5) hotel expenditure, (6) hourly labor costs, (7) part-time labor costs, (8) total air travel expenditure, and (9) building and occupancy expenditure. They defined output by the number of trips. To convert inputs into prices, they divided the following three input categories by the number of trips. First, to estimate the price of labor, they divided labor expenditure by the number of trips. Second, to assess the price of travel, they divided travel expenditure by the number of trips. Third, to estimate the price of capital, they divided capital expenditure by the number of trips.
Barros [2004] also analyzed the efficiency of Enatur by using a stochastic cost frontier. He measured the price of three inputs: price of labor, price of capital, and price of food. To measure price of labor, he divided the total salary expenditure by the number of equivalent employees. To gauge the price of capital, he estimated the ratio of earnings divided by the book value of the premises. To calculate the price of food, he calculated the ratio of food expenditures in total expenditures. To compute the output, he made use of the value of sales and the number of nights slept. Finally, to account for the separation between historic and regional pousadas in the sample, he brought a dummy variable into play.
Theo re t i ca l F r a m e w o r k
This paper adopts the efficient frontier approach. The theoretical model underlying ef- ficient considerations posits that the tourism firm receives a subsidy. The subsidy cap is a regulatory mechanism, which is analogous to the well-known price cap [BSs, 1994]. Let q(l, h) be the production function of the tourism enterprise, where q is output, t is labor, and k is capital. Let w and r be the unit price of labor and capital. Given q0 [q(lO kO)] the quantity
218 IAER: AUGUST 2004, VOL. l0 t NO. 3
to be produced, a firm subject to a subsidy cap has to solve the following maximization problem:
min wl + rk
I ,k
s.t.
qo <_ q(t, k)
wI + rl - ~q(I, k) < t car
(1)
where t cap is the subsidy cap and ~ is the market price per unit of tourism item sold, as fixed by the competition in the tourism markets. This assumption reflects the fact that the price of tourism items, since they are tradable goods, are fixed in competitive markets. From a regulatory point of view, this assumption implies that the only regulatory instrument available is the transfer subsidy, not the price.
The Lagrangian of the problem (1) is given by:
minL : wl + rk + ~ [q0 _ q(l, k)] + l [wl + rk - ~q(I, k) - t cap] (2)
I ,k
From the Kuhn-Tucker conditions, since the production function is convex and the objec- tire function is linear, ~ > 0, and qO = q(l, k). The market mechanism satisfies the economic efficient property. The first conditions, with respect to t and k, are:
which gives:
OL
0l OL
Ok
_Oq Oq w + ~ - ~P07 -~7:0
_Oq Oq r + )~r - ),~=-: - ~-=: = 0
Ok (3)
cOq/m _ w(Z + ~,) w - - - - ( 4 )
Oq/Ok 7-(1+ ~) r
Analogous to the price cap, the subsidy cap mechanism is compatible with the economic efficiency properties [Leibenstein, 1966]. Yet, the final result depends on the extent that the firm is able to manipulate the subsidy received from the regulator and adopts a nonefficient procedure. It also depends on the control the regulator exerts on the firm.
To analyze Enatur's behavior and regulation, a MMmquist's [1953] productivity index is estimated based on DEA. This index brakes down changes in productivity into technical efficiency" and technological change.
Formally, Malmquist based his index on the output distance function, defined as:
dT(x t yt) = inf O : (x ,-~y ) E S t , (5)
where x denotes a vector of inputs; y is a vector of outputs; S t is the technology" set; super- script T is the technology reference period, usually T = t or T = t + 1; and 1/0 is the amount
B A R R O S A N D ALVES: T O U R I S M 219
by which outputs in year t could have been increased, given the inputs used, if technology for year T had been fully utilized.
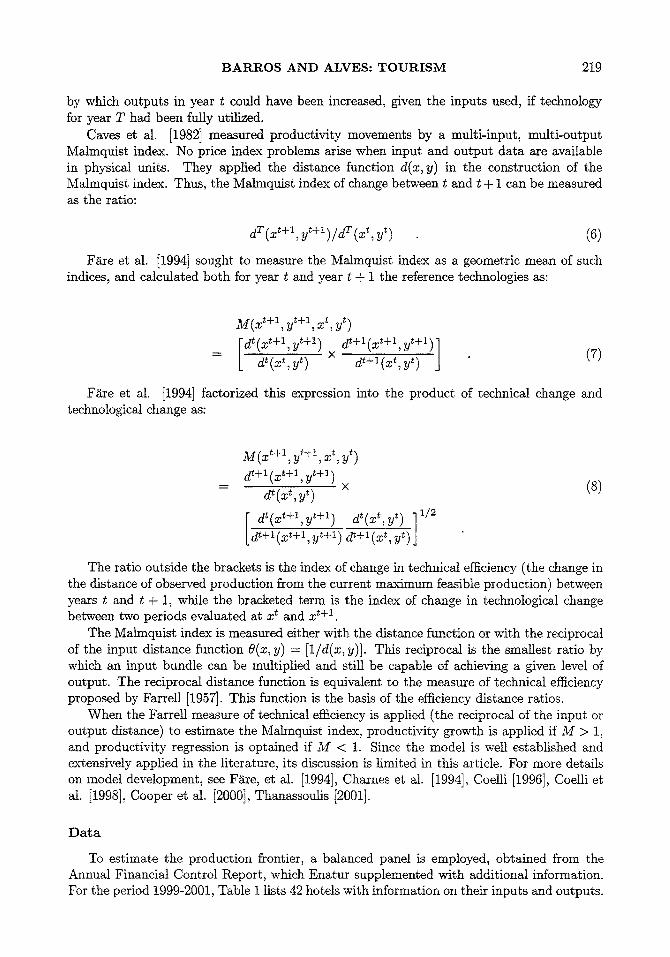
Caves et al. [1982] measured productivity movements by a multi-input, multi-output Malmquist index. No price index problems arise when input and output data are available in physical units. They applied the distance function d(x, y) in the construction of the Malmquist index. Thus, the Malmquist index of change between t and t + 1 can be measured as the ratio:
dr(x , y +l)/dr (x , y') (6)
F~Lre et al. [1994] sought to measure the Malmquist index as a geometric mean of such indices, and calculated both for year t and year t + 1 the reference technologies as:
M(x~+l, yt+l, z t yt) d*(xt+l,y t+t) dt+l(xt+l,yt+l)]
× (7)
F~re et al. [1994] factorized this expression into the product of technical change and technological change as:
M(xt+l, yt+t x t, yt) d'+l(z'+I,y'+l) ×
dt(x ̀ , yt)
[ 2 l
(s)
The ratio outside the brackets is the index of change in technical efficiency (the change in the distance of observed production from the current maximum feasible production) between years t and t + 1, while the bracketed term is the index of change in technological change between two periods evaluated at x t and x t+l.
The Malmquist index is measured either with the distance function or with the reciprocal of the input distance function 0(x, y) = [lid(x, y)]. This reciprocal is the smallest ratio by which an input bundle can be multiplied and still be capable of achiexdng a given level of output. The reciprocal distance function is equivalent to the measure of technical efficiency proposed by Farrell [1957]. This function is the basis of the efficiency distance ratios.
When the Farrell measure of technical efficiency is applied (the reciprocal of the input or output distance) to estimate the Malmquist index, productivity growth is applied if M > 1, and productivity regression is optained if M < t. Since the model is well established and extensively applied in the literature, its discussion is limited in this article. For more details on model development, see F~e , et al. [1994], Charnes et al. [1994], Coelli [1996], Coelli et al. [1998], Cooper et al. [2000], Thanassoulis [200t].
Data
To estimate the production frontier, a balanced panel is employed, obtained from the Annual Financial Control Report, which Enatur supplemented with additional information. For the period 1999-2001, Table I lists 42 hotels with information on their inputs and outputs.
220 IAER: AUGUST 2004~ VOL. 10, NO. 3
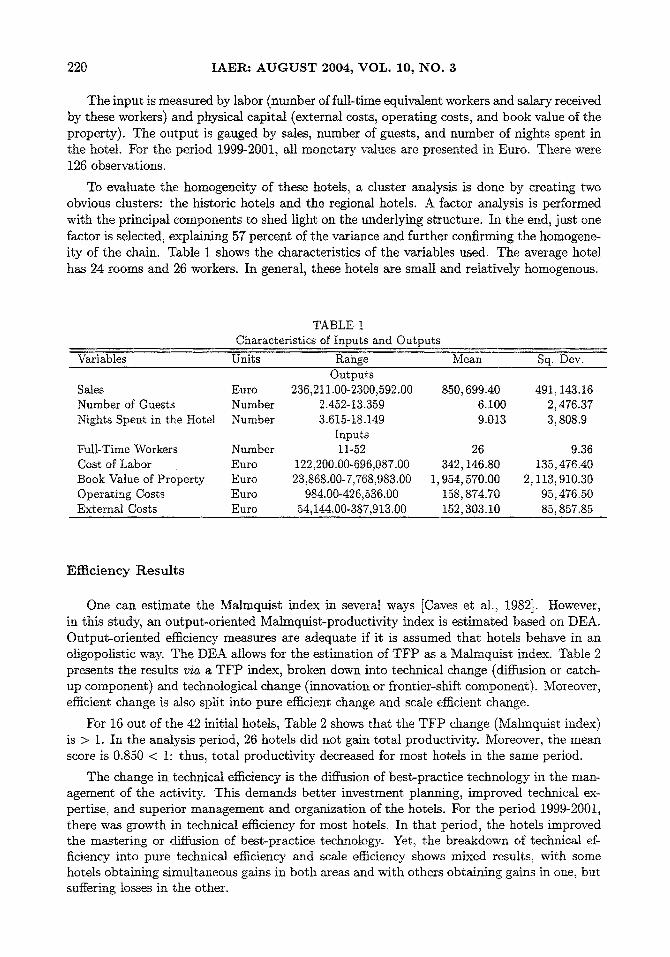
The input is measured by labor (number of full-time equivalent workers and salary received by these workers) and physical capital (external costs, operating costs, and book value of the property). The output is gauged by sales, number of guests, and number of nights spent in the hotel. For the period 1999-2001, all monetary values are presented in Euro. There were 126 observations.
To evaluate the homogeneity of these hotels, a cluster analysis is done by creating two obvious clusters: the historic hotels and the regional hotels. A factor analysis is performed with the principal components to shed light on the underlying structure. In the end, just one factor is selected, explaining 57 percent of the variance and further confirming the homogene- ity of the chain. Table 1 shows the characteristics of the variables used. The average hotel has 24 rooms and 26 workers. In general, these hotels are small and relatively homogenous.
TABLE 1 Characteristics of Inputs and Outputs
Variables Units Range Mean Sq. Dev. Outputs
Sales Euro 236,211.00-2300,592.00 850,699.40 491,143.16 Number of Guests Number 2.452-i3.359 6 . 1 0 0 2,476.37 Nights Spent in the Hotel Number 3.615-18.149 9.013 3,808.9
Inputs Full-Time Workers Number 11-52 26 9.36 Cost of Labor Euro 122,200.00-696,087.00 342,146.80 135,476.40 Book Value of Property Euro 23,868.00-7,768,983.00 1,954,570.00 2,113,910.30 Operating Costs Euro 984.00-426,536.00 158,874.70 95,476.50 External Costs Euro 54,144.00-387,913.00 152,303.10 85,857.85
Efficiency Resu l t s
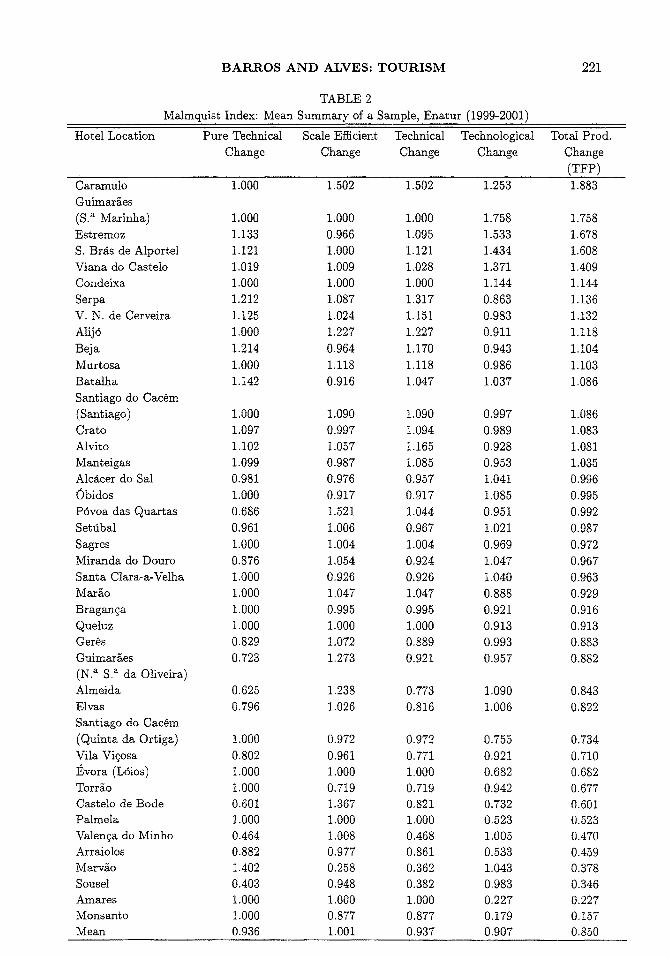
One can estimate the Malmquist index in several ways [Caves et al., 1982]. However, in this study, an output-oriented Malmquist-productivity index is estimated based on DEA. Output-oriented efficiency measures are adequate if it is assumed that hotels behave in an oligopolistic way. The DEA allows for the estimation of TFP as a Malmquist index. Table 2 presents the results via a TFP index, broken down into technical change (diffusion or catch- up component) and technological change (innovation or frontier-shift component). Moreover, efficient change is also split into pure efficient change and scale efficient change.
For 16 out of the 42 initial hotels, Table 2 shows that the TFP change (Malmquist index) is > 1. In the analysis period, 26 hotels did not gain total productivity. Moreover, the mean score is 0.850 < 1: thus, total productivity decreased for most hotels in the same period.
The change in technical efficiency is the diffusion of best-practice technology in the man- agement of the activity. This demands better investment planning, improved technical ex- pertise, and superior management and organization of the hotels. For the period 1999-2001, there was growth in technical efficiency for most hotels. In that period, the hotels improved the mastering or diffusion of best-practice technology. Yet, the breakdown of technical ef- ficiency into pure technical efficiency and scale efficiency shows mixed results, with some hotels obtaining simultaneous gains in both areas and with others obtaining gains in one, but suffering losses in the other.
B A R R O S A N D ALVES: T O U R I S M 221
TABLE 2 Malmquist Index: Mean Summary of a Sample, Enatur (1999-2001)
Hotel Location Pure Technical Scale Efficient Technical Technological Total Prod. Change Change Change Change Change
(TFP) Caramulo 1.000 1.502 1.502 1.253 1.883 Cuimar~es (S. a Marinha) 1.000 1.000 1,000 1.758 1,758 Estremoz 1.133 0.966 1.095 1.533 1.678 S. Br~s de Alportel 1,121 1.000 1,121 1.434 1.608 Viana do Castelo 1.019 1.009 1.028 1.371 1.409
Condeixa 1.000 1.000 1.000 1.144 1.144
Serpa 1.212 1.087 1.317 0.863 1.136 V. N. de Cerveira 1,125 1.024 1.I51 0.983 1.132 Mij6 1.000 1.227 1,227 0.911 1.118 Beja 1.214 0.964 1.170 0.943 1.104 Murtosa 1.000 1.118 1.118 0.986 1.103 Batalha 1.142 0.916 1.047 1.037 1.086 Santiago do Cac~m (Santiago) 1.000 1.090 1.090 0.997 1.086 Crato 1.097 0.997 1.094 0.989 1.083 Alvito 1,102 1.057 1.165 0.928 1.081 Manteigas 1.099 0.987 1.085 0.953 1.035 Atc~cer do Sal 0.981 0.976 0.957 1.041 0.996 Obidos 1,000 0.917 0.917 1.085 0,995 P6voa das Quartas 0.686 1.521 1.044 0.951 0.992 Setdbal 0.961 1.006 0.967 1.021 0.987 Sagres 1.000 1.004 1.004 0.969 0.972 Miranda do Douro 0.876 1.054 0.924 1.047 0.967 Santa Clara-a-Velha 1.000 0.926 0.926 1.040 0.963
MarCo 1.000 1.047 1.047 0.888 0.929 Bragan~,a 1.000 0.995 0.995 0.921 0.916 Queluz 1.000 1.000 1.000 0.913 0.913 Germs 0.829 1,072 0.889 0.993 0.883 Guimar£es 0,723 1.273 0.921 0.957 0,882 (N. a S. a d a Oliveira) Almeida 0.625 1,238 0.773 1.090 0.843 Elvas 0.796 1.026 0.816 1.006 0.822 Santiago do Cac6m (Quinta da Ortiga) 1.000 0.972 0.972 0.755 0,734 Vila Vi~osa 0.802 0.96t 0.771 0.921 0.710 ]~vora (Ldios) 1.000 1.000 1.000 0.682 0.682 Torr~o 1.000 0.719 0.719 0.942 0.677 Castelo de Bode 0,601 1.367 0,821 0,732 0.601 Palmela 1,000 1.000 1,000 0.523 0.523 Valenq, a do Minho 0.464 1.008 0.468 1.005 0.470 Arraiolos 0.882 0.977 0.861 0.533 0.459 Marvao 1.402 0.258 0.362 1.043 0.378 Souset 0.403 0.948 0,382 0.983 0.346 Amares 1.000 1.000 1.000 0.227 0.227 Monsanto 1.000 0.877 0.877 0.179 0.157 Mean 0.936 1.001 0.937 0.907 0.850
222 IAER: AUGUST 2004, VOL. 10, NO. 3
The improvement in pure technical efficiency reveals that there were investments in orga- nizational factors associated with hotel management, such as marketing initiatives, improve- ment in quality, achievement of a better balance between inputs and outputs, and so on. Scale efficiency, dependent on size, improved in the aforementioned period for many hotels. Thus, despite the small number of rooms, some hotels achieved a size that permitted them to obtain economies of scale. Scale efficiency change is the only variable for which the mean value is > t.
Technological change is the consequence of innovation, such as the adoption of new tech- nologies by best-practice hotels. If a small group of hotels is excluded, the index is < 1: innovation deteriorated in the period 1999-2001. Investment in new technologies (procedures, techniques, and methodologies) or in related equal skills upgrades was low.
Combina t ions of Technical Efficiency and Technological Change in t he Sample
Overall, four combinations of technical efficiency and technological change are contem- plated. First, there are hotels in which improvements in technical efficiency co-existed with improvements in technological change. This group includes seven hotels: (1) Batalha, (2) Condeixa, (3) Estremoz, (4) Caramulo, (5) Viana do Castelo, (6) S. Br~ de Alportel, and (7) Guimar~es (Santa Marinha). In that period, these were Enatur's best-performing hotels, showing improvements in technical efficiency. They upgraded organizational factors associ- ated with the application of inputs (low costs and low number of workers), the degree of utilization of outputs (high number of clients and nights spent in the hotel), as well as the relationship between inputs and outputs. These hotels not only show scale economies related to their size but also show innovations related to new investments. Second, there are ho- tels in which improvements in technical efficiency coexisted with a decline in technological change. This group contains 16 hotels: (I) Beja, (2) Crato, (3) Serpa, (4) Alij6, (5) MarCo, (6) Alvito, (7) Amares, (8) Queluz, (9) Sagres, (10) Murtosa, (11) Palmela, (12) Manteigas, (13) l~vora (Ldios), (14) V. N. de Cerveira, (15) Santiago de Cac6m, and (16) Pdvoa das Quartas. These hotels upgraded organizational factors without introducing new technolo- gies, which would improve organizational factors. These hotels must acquire new technology and develop their performance by upgrading the necessary commensurate skills. Third, there are hotels in which deteriorating technical efficiency coexisted with improvements in tech- nological change. This group consists of nine hotels: (i) Elvas, (2) MarCo, (3) 0bidos, (4) Almeida, (5) Set~bal, (6) Alc~cer do Sal, (7) Santa Clara-a-Velha, (8) Miranda do Douro, and (9) Valen~a do Minho. These hotels invested in new technologies but were not able to balance the use of inputs versus outputs, which is a contradictory procedure. Finally% there are hotels in which deteriorating technical efficiency coexisted with deteriorating technologi- cal change. This group comprises I0 hotels: (I) Germs, (2) Torr~o, (3) Sousel, (4) Bragan~a, (5) Monsanto, (6) Arraiolos, (7) Vila Vi~osa, (8) Castelo de Bode, (9) Santiago do Cac~m (Quinta da Ortiga), and (I0) Gnimar~es (Nossa Senhora da Oliveira). These inefficient hotels must improve the organizational factors related to the balanced use of inputs versus outputs or adopt new technologies related to the upgrading of organizational skills.
These results encompass all possible combinations. To achieve best-practice procedures in hotel management, there is room for adjustment in almost all of the hotels.
D i s c u s s i o n
This paper proposed a simple framework for the evaluation of Enatur's hotels and the rationalization of their management activities. Based on a DEA model, this study incor-
B A R R O S A N D ALVES: T O U R I S M 223
porated multiple inputs and outputs in determining relative efficiencies. It a l~ provided relative benchmarks for improving operations in low-performing hotels. Finally, this study presented the main characteristics of productivity technology in small hotels.
In fact, technical efficiency demands that any unit should allocate resources without waste. Thus, it refers to a movement towards the best-practice frontier activity production. Ob- viously, a movement towards this sort of production is an improvement, but a movement away from it is deterioration. In dynamic terms, an efficiency change (diffusion) reveals a change between two successive technical efficiency frontiers. Often, technical inefficiency is a consequence of several factors. In this paper, nine factors are cited, which can be the cause of waste in Enatur Hotels. First, rigidities associated with the pattern of ownership might in- duce the principal-agent relationship [Jensen and Meckling, 1976; Dalbor and Andrew, 2000]. The principal-agent relationship relates to the difficulty of controlling those empowered as managers acting on behalf of the owner (the government). Second, rigidities associated with the labor market [Ingrain and Baum, 1997] give rise to the collective action problem [Olson, 1971]. Workers can get a free ride on the management's own efforts to improve perfor- mance. This situation happens when the state does not link job tenure to performance, an unfortunate traditional procedure in the public sector. Due to some or all of these factors, hotels may operate at a level below their potential, the maximum possible output, given the production setting that applies to the specific hotel activity. Third, there are location and agglomeration effects [Baum and Haveman, 1997]. Fourth are organizational factors associ- ated with X-efficiency [Leibenstein, 1966]. Fifth, size factors associated with scale and scope economies exist [Chung and Kalnins, 2001]. Sixth, the time lags that exist in acquiring new technology and the necessary commensurate skills upgrade, due to inertia effects. Seventh are the organizational factors associated with human capital, such as a lack of incentive for the improvement of efficiency, an ill-fated common attitude in most public enterprises. Eighth when there is unequal access to information about activities, due to asymmetric information between different hotels. In fact, some of them may even enjoy privileged access to informa- tion, which is common in the lack of transparency [WTilhamson, 1998]. Lastly is managerial procedures. Perhaps Enatur's management should adopt an enhanced-incentive management policy, forcing inefficient hotels to catch up with the efficient frontier. This managerial proce- dure must set objectives and appraisal programs by closely linking incentives and payments to performance, thus, holding people accountable and encouraging the organization to look at the value of sales.
Technological change (innovation) involves any investment that improves the total pro- ductivity of a productive unit. It arises due to capital accumulation, which gives rise to the adoption of technology by best-practice hotels, thus, shifting the frontier of technology. In the hotel business, technological change means investing in new methods, procedures, and techniques with the aim of improving results. In this context, a good policy would be to emulate foreign methodologies that have previously shown excellent results.
In conclusion, there is room for improvement in Enatur's hotel chain, but a caveat is vital. Since the data set is compact, conclusions are limited.
Conclus ion
This paper proposed a simple framework for the evaluation of a Portuguese hotel chain and the rationalization of its operational activities. The analysis is based on a Malmquist productivity index, which allowed total productivity to be broken down in technical efficiency change and technological e~ciency change. The study provided internal benchmarks for

224 IAER: AUGUST 2004~ VOL. 10~ NO. 3
improving the operations of low-performing pousadas. From the study, several interesting and useful managerial insights and implications were discussed.
The contributions of this paper are various. First, the efficient indices, TFP change in- dex (Matmquist index), technical efficient change index, and technological efficient change index were identified. Second, the technical efficient change was broken down in pure-efficient change index and scale-efficient change index. Third, benchmarks were provided for improv- ing the operations of low-performing hotels. In the previously mentioned period, the total productivity change is varied. In that period, the average total-productivity index denotes that there is no growth, except for a small number of hotels.
Moreover, splitting the total productivity change between efficient change and technolog- ical change revealed that many hotels achieved efficient technical change but no technological change. Overall, a high level of waste was observed.
In summary, Enatur needs organizational governance, with incentives, transparency, and accountabifity. Explicitly, this effort might compel the hotel chain to achieve efficiency in their operational activities. In this way, Enatur might overcome the deficits in technical and technological efficiency observed in the sample analyzed for the period 1999-2000. Through an active intervention policy, the state should enforce such modifications. In a highly-competitive market setting, the better-equipped chain should prosper rather than merely survive. Alter- natively, the state should privatize the hotel chain. It is believed that, in the tong term, this option announced by the new incumbent government might represent a better decision. After all, it is known that competition stimulates growth and innovation.
References
Anderson, R. I.; Fish, M.; Xia, Y.; Michello, F. "Measuring Efficiency in the Hotel Industry: A Stochastic Frontier Approach," International Journal of Hospitality Management, 18, 1, 1999, pp. 45-57.
Anderson, R. I.; Lewis, D.; Parker, M. E. "Another Look at the Efficiency of Corporate Travel Management Departments," Journal of Travel Research, 37, 3, 1999, pp. 267-72.
Anderson, R. I.; Fok, R.; Scott, J. "Hotel Industry Efficiency: An Advanced Linear Programming Examination," American Business Review, 18, 1, 2000, pp. 40-8.
Barros, C. P. "A Stochastic Cost Frontier in the Portuguese Hotel Industry." Tourism Economics (forthcoming), 2004.
Baum, J. A. C.; Haveman, H. A. "Love Thy Neighbor? Differentiation and Agglomeration in the Manhattan Hotel Industry, 1898-1990," Administrative Science Quarterly, 42~ 2, 1997, pp. 304- 38.
Bell, R. A.; Morey, R. C. "Increasing the Efficiency of Corporate Travel Management Through Macro Benchmarking," Journal of Travel Research~ 33, 3, 1995, pp. 11-20.
Bbs, D. Pricing and Price Regulation: An Economic Theory for Public Enterprises and Public Utilities, 3 rd ed., New York: Elsevier, 1994.
Cano, M.; Drummond, S.; Miller, C.; Barclay, S. "Learning from Others: Benchmarking in Diverse Tourism Industries," Total Quality Management~ 12, 7/8, 2001, pp. 974-80.
Caves, D. W.; Christensen, L. R.; Diewert, W. E. "The Economic Theory of Index Numbers and the Measurement of Input, Output, and Productivity," Econometrica, 50, 6, 1982, pp. 1393-414.
Charnes, A.; Cooper, W. W.; Lewin, A. Y.; Seiford, L. M. Data Envelopment Analysis: Theory, Methodology, and Applications, Boston: Kluwer, 1994.
Coelli, T. J. A Guide to DEAP Version 2.1: A Data Envelopment Analysis (Computer Program), Working Paper No. 8/96, Armidale, Australia: Centre for Efficiency and Productivity Analysis, University of New England, 1996.
Coelli, T. J.; Rao, D. S. P.; Battese, G. E. An Introduction to Efficiency and Productivity Analysis, Boston: Kluwer, 1998.
B A R R O S A N D ALVES: T O U R I S M 225
Cooper, W. W.; Seiford, L. M.; Tone, K. Data Envelopment Analysis, Boston: Kluwer, 2000. Chung, W.; Kalnins, A. "Agglomeration Effects and Performance: A Test of the Texas Lodging
Industry," Strategic Management Journal, 22, 10, 2001, pp. 969-88. Dalbor, M. C.; Andrew, W. P. "Agency Problems and Hotel Appraisal Accuracy: An Exploratory
Study," International Journal of Hospitality Management, 19, 4, 2000, pp. 353-60. Fare, R. S.; Grosskopf, S.; Lovel, C. A. K. Production Frontiers, New York: Cambridge University
Press, 1994. Farrell, M. J. "The Measurement of Productive Efficiency," Journal of the Royal Statistical Society,
Series A, 120, 3, 1957, pp. 253-90. Financial Times: Survey on Portugal, October 21, 2002. Ingram, P.; Baum, J. A. C. "Chain Affiliation and the Failure of Manhattan Hotels, 1898-1980,"
Administration Science Quarterly, 42, 1, 1997, pp. 68-102. Jensen, M. C.; Meckling, W. H. "Theory of the Firm: Managerial Behavior, Agency Costs, and
Ownership Structure," Journal of Financial Economics, 3, 4, 1976, pp. 305-60. Leibenstein, H. "Atlocative Efficiency vs. X-Efficiency," American Economic Review, 56, 3~ 1966,
pp. 392-414. Malmquist, S. "Index Numbers and Indifference Surfaces," Trabajos de Estadistica, 4, 1953, pp.
209-42. Morey, R. C.; Dittman, D. A. "Evaluating a Hotel GM's Performance: A Case Study in Benchmark-
ing," CornelI Hotel Restaurant ~ Administration Quarterly, 36, 5, 1995, pp. 30-5. Olson, M. Logic of Collective Action; Public Goods and the Theory of Groups, Cambridge, MA:
Harvard University Press, 1965, 1968, 1971. Thanassoulis, E. Introduction to the Theory and Application of Data Envelopment Analysis: A
Foundation Text with Integrated Software, Norwell, MA: Kluwer, 2001. Williamson, O. E. "The Institutions of Governance," American Economic Review, 88, 2, 1998, pp.
75-9.