production of solid biofuel from agricultural wastes of the palm oil industry by hydrothermal...
TRANSCRIPT
ORIGINAL PAPER
Production of Solid Biofuel from Agricultural Wastes of the PalmOil Industry by Hydrothermal Treatment
Ahmad T. Yuliansyah • Tsuyoshi Hirajima •
Satoshi Kumagai • Keiko Sasaki
Received: 24 April 2010 / Accepted: 25 September 2010 / Published online: 21 October 2010
� Springer Science+Business Media B.V. 2010
Abstract In this study, upgrading of agricultural waste,
in the form of oil palm fronds and trunks, into solid biofuel
was investigated using hydrothermal treatment. A slurry of
300 mL of water and 30 g of material was treated in a
500-mL batch autoclave equipped with stirrer, thermo-
meter, and pressure sensor. Experiments were conducted in
the temperature range 200–350�C at an initial pressure of
2.0 MPa. The slurry was gradually heated to the target
temperature and held for a further 30 min. Approximately
35–65% of the original material was recovered as a solid
product with favorable solid fuel characteristics. The gross
calorific value ranged from 19.9 to 29.7 MJ/kg and the
equilibrium moisture content was 7.6–4.5 wt%. The carbon
content varied from 51.4 to 78.5 wt% and the oxygen
content was 42.1–16.1 wt% after upgrading. Changes in the
solid composition and carbon functional groups following
upgrading were identified by FTIR and 13C NMR. In
addition, analyses on the liquid product (by GC–MS) and
the gas product (by GC) were carried out to clarify the
decomposition behavior of material.
Keywords Upgrading � Agricultural waste � Biomass �Hydrothermal treatment � Solid biofuel
Introduction
The rapid increase in energy consumption within the last
few years, combined with the steady depletion of fossil fuel
reserves, has prompted a global search for alternative
energy resources. Biomass is a promising alternative owing
to its sustainability and environmental friendliness. Various
types of biomass products are available in large quantities
and have potential for further utilization.
One potential biomass source that is abundant in most
tropical countries is oil palm waste. This waste can be
categorized into two types: waste from harvesting and
replanting activity in plantation fields and waste from the
milling process to obtain palm oil. Numerous studies on
utilization of milling waste (oil palm fiber, shell, and
empty fruit bunches) have been conducted for energy
applications [1–3], pulp and papermaking [4–6], bio-
adsorbents [7–10], construction materials [11, 12], and
biocomposites [13–15]. However, most of the milling
waste is fully utilized by the palm oil industry either as an
additional energy source (oil palm fiber and shell) or as
fertilizer (empty fruit bunches). By contrast, only a few
studies have considered the utilization of harvesting
waste. Currently, most of this waste is used convention-
ally as an organic fertilizer in plantation fields. However,
unpleasant smells coupled with a slow release of CO2 and
CH4 gas on decomposition, which can last for up to
1 year, are common problems. Nevertheless, oil palm
fronds and trunks have great potential. In 2005, approxi-
mately 43.05 million ton of frond and 13.94 million ton
of trunk wastes were generated in Indonesia, the largest
crude palm oil producer in the world. This amount will
continue increase with the rapid growth in the Indonesian
palm oil industry. Thus, a better method to manage such
wastes is highly desired.
A. T. Yuliansyah—On leave from Department of Chemical
Engineering, Gadjah Mada University, Indonesia.
A. T. Yuliansyah � T. Hirajima (&) � K. Sasaki
Department of Earth Resources Engineering, Faculty of
Engineering, Kyushu University, 744 Motooka, Nishi-ku,
Fukuoka 819-0395, Japan
e-mail: [email protected]
S. Kumagai
Research and Education Center of Carbon Resources, Kyushu
University, 744 Motooka, Nishiku, Fukuoka 819-0395, Japan
123
Waste Biomass Valor (2010) 1:395–405
DOI 10.1007/s12649-010-9045-3

Various treatment methods for several agricultural
wastes have been reviewed in several papers [16–19]. For
energy application purposes, the methods can be simply
divided into thermo-chemical and biological processes [20,
21]. Hydrothermal treatment is one of thermo-chemical
processes have attracted much attention recently. In this
process, biomass is treated in hot compressed water
yielding in gases, aqueous organics and upgraded solid [22,
23]. After filtered and dried, the obtained solid can be used
for solid fuel due to its high calorific value. Compared to
other thermo-chemical conversion methods such as pyro-
lysis and gasification, the temperature for hydrothermal
treatment is much lower (200–350�C for hydrothermal,
compared with 450–550�C for pyrolysis and 900–1200�C
for gasification) [16, 24]. In addition, biomass conversion
takes place in a wet environment so high moisture content
of feed biomass is not an issue. The role of water in the
treatment is not only as a medium, but also a chemical
reactant on decomposition. Therefore, such method is
suitable for treating biomass with high moisture content,
such as agricultural wastes which contain more than 50 wt. %
of moisture in fresh condition. A contrast situation is found
on pyrolysis and gasification which have a limitation on
moisture content of the feed [24, 25].
Many studies using hydrothermal treatment have been
conducted, but most of these used the method as a biomass
pretreatment step in bio-ethanol production [26–29]. Few
studies have considered benefits of the resulting solid. The
focus of the present study was upgrading of solid material
into solid biofuel by hydrothermal treatment. Therefore, we
evaluated the feasibility of upgrading oil palm fronds and
trunks and investigated their decomposition behavior dur-
ing hydrothermal treatment.
Experimental
Materials
Oil palm waste in the form of fronds and trunks was col-
lected from an oil palm plantation in southern Sumatra,
Indonesia. Both raw fronds and trunks were chipped into
pieces of approximately 2 cm in width of slabs. Prior to
use, the chips were ground using a cutting mill to form
powder with a maximum particle size of 1 mm. The
composition of the waste material is listed in Table 1.
Apparatus and Experimental Procedure
Experiments were carried out in a 500-mL batch-type auto-
clave (Taiatsu Techno MA 22) equipped with a stirrer and an
automatic temperature controller (Fig. 1). The autoclave had
a maximum temperature of 400�C and a maximum pressure
of 30 MPa. A slurry of 300 mL of water and 30 g of waste
material was loaded into the autoclave. A stream of N2 gas
was used to purge air from the autoclave and to maintain an
initial internal pressure of 2.0 MPa. With stirring at 200 rpm,
the autoclave was heated to the target temperature at an
average rate of 6.6�C/min. The target temperature, ranging
from 200 to 350�C, was automatically adjusted. Once the
target temperature was reached, the sample was held for a
further 30 min before the autoclave was cooled to ambient
Table 1 Composition of the raw materials
Component Frond Trunk
Cellulose (wt. %, d.b) 31.0 39.9
Hemicellulose (wt. %, d.b) 17.1 21.2
Klason lignin (wt. %, d.b) 22.9 22.6
Wax (wt. %, d.b) 2.0 3.1
Ash (wt. %, d.b) 2.8 1.9
Others 24.2 11.3
Control Board
PS
TS
Cooling water inCooling water out
Vessel
PS = Pressure SensorTS = Temperature Sensor
N2
Fig. 1 Schematic diagram of
the experimental apparatus
396 Waste Biomass Valor (2010) 1:395–405
123

conditions. Pressure and temperature profile for the experi-
ments was described in Fig. 2.
After cooling, the gas products were fed into a gasometer
(Shinagawa DC-1) to measure the volume. The gas was
sampled using a microsyringe (ITO MS-GANX00) and its
composition was determined by gas chromatography with
thermal conductivity detection (Shimadzu GC-4C). The
remaining slurry was filtered using an ADVANTEC 5C
filter and a water aspirator. The solid part was dried in an
oven at 105�C to yield the final solid product.
Analysis
The solid products were characterized using several tech-
niques. The elemental composition was measured using
Yanaco CHN Corder MT-5 and MT-6 elemental analyzer.
The cellulose, hemicellulose, and lignin contents were
measured using a procedure recommended by the US
National Renewable Energy Laboratory [30] that is sub-
stantially similar to ASTM E1758-01. The mineral com-
position in ash was determined using X-ray fluorescence
(XRF) on Rigaku ZSX Primus II equipment. In addition,
proximate, total sulfur and gross calorific value (GCV)
analyses were carried out according to JIS M 8812, JIS M
8819, and JIS M 8814, respectively. The equilibrium
moisture content (EMC) of raw frond and trunk and the
corresponding solid products was determined according to
JIS M 8811. An aliquot of the sample was placed in a
desiccator containing saturated salt solution at a constant
relative humidity (75% RH). After equilibrium was reached,
the moisture content of the solid was quickly measured
using a Sartorius MA 150 analyzer. Identification of the
chemical structure and functional groups was performed on
a Fourier transform infrared (FTIR) spectrometer (JASCO
670 Plus) using the KBr disk technique. Cross polarization/
magic angle spinning (CP/MAS) 13C NMR spectra were
measured on a solid-state spectrophotometer (JEOL CMX-
300) with the following conditions: 10,000 scans; contact
time, 2 ms; spinning speed,[12 kHz; pulse repetition time,
7 s. The spectrum was calibrated using hexamethyl ben-
zene. Curve fitting analysis of the spectrum was performed
using Grams/AI 32 ver. 8.0 software. Composition of the
liquid products were analyzed by gas chromatography—
mass spectrophotometer (GC–MS) Agilent 6890 N equip-
ped with Jeol JMS-Q1000GC(A) system. Additionally, total
organic carbon content of liquid was determined on a Shi-
madzu TOC-5000A instrument. Solid yield, energy densi-
fication ratio, and energy yield are three important
parameters in this study which are defined as [31]:
Solid yield ¼�mass of dried solid product=
mass of dried feed material�� 100%
Energy densification ratio ¼ GCV of product=
GCV of feed material
Energy yield ¼ solid yield � energy densification ratio
.
Results and Discussion
Product Distribution
Hydrothermal treatment led to thermal degradation of the
feed material. Physical and chemical bonds in the material
were broken, so that large long-chain compounds such as
cellulose, hemicellulose and lignin were broken down into
smaller and simpler molecules. Furthermore, some of the
molecules were dissolved into liquid part and some others
were degraded to gases. The remainder of feed material
was recovered as a solid residue. Filtration and drying
yielded a solid product from this residue.
Figure 3 shows the distribution of organic compounds,
represented by percentage carbon, in the gas, liquid, and
solid phases. However, a small amount of material was not
recovered during filtration and drying. The results indicate
that most of the carbon remained in the solid phase and that
the relative amount gradually decreased as the temperature
increased. Conversely, the proportion of carbon in the gas
phase steadily increased with temperature. For the liquid
phase, a unique characteristic was observed. The relative
amount of carbon increased with temperature to a maxi-
mum at *270�C and then decreased owing to polymeri-
zation of soluble compounds to produce solid precipitates.
Solid products
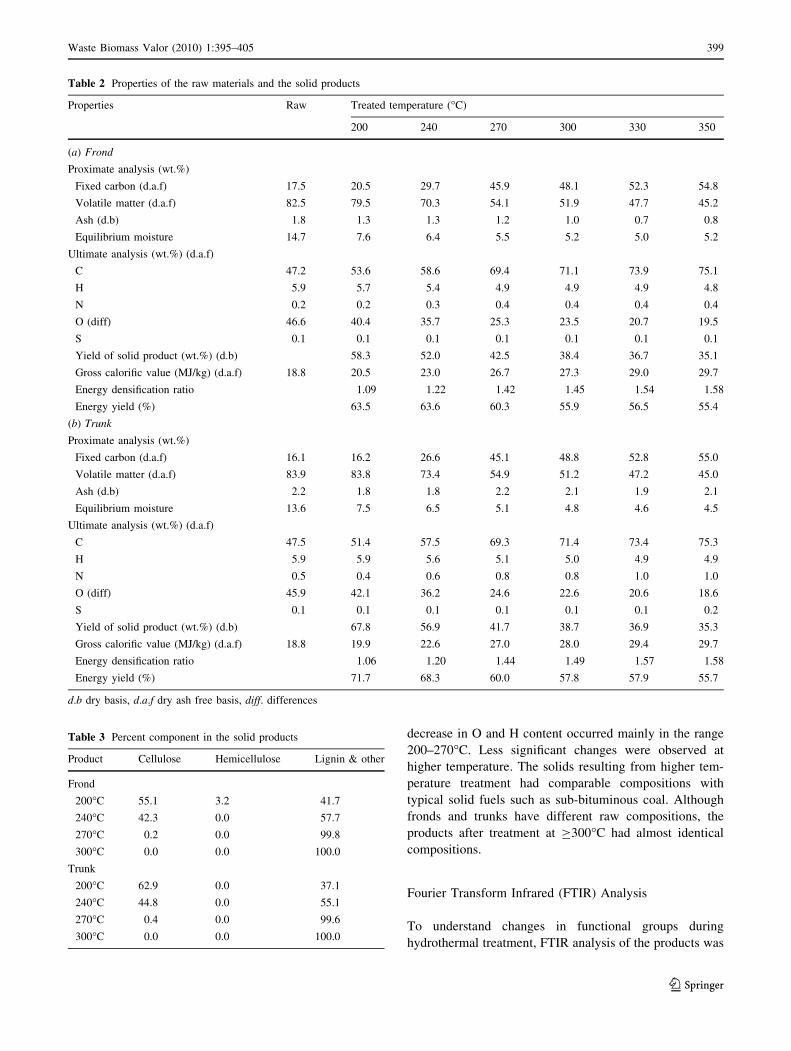
The properties of solid products for different temperature
treatments are described in Table 2. Reaction temperature
Fig. 2 Pressure and temperature profile for experiments (1 200�C;
2 240�C; 3 270�C; 4 300�C; 5 330�C; 6 350�C)
Waste Biomass Valor (2010) 1:395–405 397
123

had a significant effect to the solid yield, energy densifi-
cation ratio and energy yield of the solid products.
Increasing temperature led to a decrease in solid yield and
energy yield, while energy densification ratio increased.
For the same reaction temperature, the solid product of
trunk had a higher solid yield and energy yield than frond.
However, the differences were smaller at higher tempera-
ture. At 200�C, the solid yields were 58.3 and 67.8 wt%,
while the energy yields were 63.5 and 71.7%, for frond and
trunk, respectively. The solid yield reduced to 35.1 and
35.3 wt%, while the energy yield decreased to 55.4 and
55.7% at 350�C treatment.
Like other biomass materials, both fronds and trunks
have very high volatile content of 82.5 and 83.9 wt%, in
contrast to the low fixed carbon of 17.5 and 16.1 wt%,
respectively. Progressive decomposition reactions occurred
at higher temperature, leading to an increase in fixed carbon
content and a decrease in volatile content. Treatment at
350�C increased the fixed carbon content to 54.8 and
55.0 wt% and decreased the volatile content to 45.2 and
45.0 wt% for fronds and trunks, respectively. This led to an
increase in gross calorific value of the solid product.
The calorific value is correlated with the elemental
composition of a solid. The data in Table 2 show that an
increase in calorific value is correlated with an increase in
carbon content and a decrease in oxygen content. Com-
pared to the raw material, the solid produced at 350�C has
*59% higher carbon content and *58% lower oxygen
content. These results suggest that components degraded
and removed from the material were mainly oxygen-rich
compounds. Dramatic changes in the calorific value and
elemental composition took place in the temperature range
200–270�C.
Due to thermal degradation, the content of cellulose,
hemicellulose, and lignin in the solid decreased. Table 3
shows the percentage of these components in the solid
products after treatment at 200–300�C. The data suggest
that hemicellulose and cellulose were relatively easier to
degrade than lignin. The treatment significantly degraded
both hemicellulose and cellulose to produce a more lig-
neous solid. Slightly different behavior was observed for
hemicellulose decomposition between frond and trunk
material. The frond solid produced at 200�C still had a
small amount of hemicellulose, which completely vanished
on treatment at 240�C. On the other hand, no hemicellulose
was found for the trunk products, even for treatment
200�C. This suggests that hemicellulose decomposition
started at temperatures\200�C. By contrast, cellulose was
gradually degraded at higher temperature and \0.5 wt%
(on a solid product basis) remained after treatment at
270�C. This behavior is in agreement with previous reports
[22, 32].
The obtained solids contained a small amount of ash
ranging from 0.7 to 2.2 wt% (Table 2). The use of these
low-ash products as fuel will be beneficial because it will
reduce potential for solid deposition on burner equipment
that commonly found on combustion of high-ash fuel.
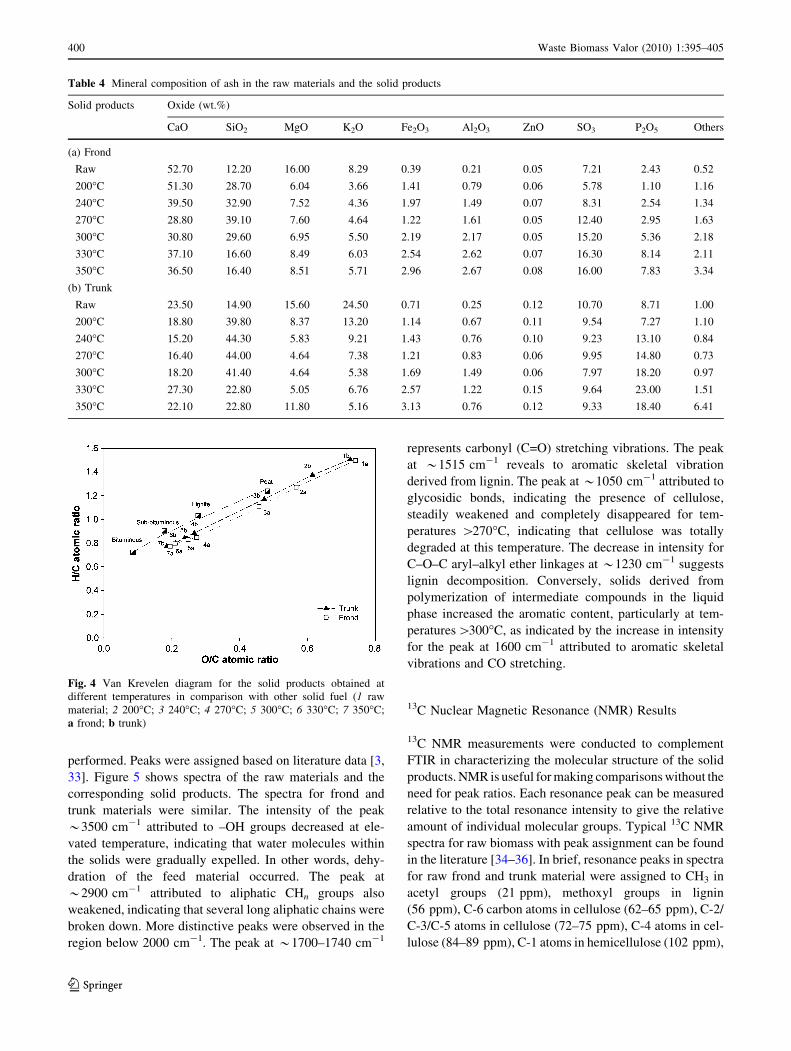
Table 4 shows ash analysis of frond and trunk solid prod-
ucts. As can be seen from this table, CaO and SiO2 were
two major oxides accounted for 28.80–51.30 and
16.40–39.10 wt% for frond, and 15.20–27.30 and
22.80–44.30 wt% for trunk, respectively. The data in
table 4 also indicates that some minerals such as CaO,
MgO and K2O were selectively leached from material
during treatment.
Coal Band
Under hydrothermal treatment, frond and trunk materials
undergo a coalification-like process, as demonstrated in the
Van Krevelen diagram in Fig. 4. The raw materials have
high atomic H/C and O/C ratios, which both gradually
decreased during treatment. The slope of the trajectories
suggests that the O content decreased in proportion to the H
content, probably due to dehydration. It is clear that the
Fig. 3 Distribution of carbon in the hydrothermal product a frond;
b trunk
398 Waste Biomass Valor (2010) 1:395–405
123
decrease in O and H content occurred mainly in the range
200–270�C. Less significant changes were observed at
higher temperature. The solids resulting from higher tem-
perature treatment had comparable compositions with
typical solid fuels such as sub-bituminous coal. Although
fronds and trunks have different raw compositions, the
products after treatment at C300�C had almost identical
compositions.
Fourier Transform Infrared (FTIR) Analysis
To understand changes in functional groups during
hydrothermal treatment, FTIR analysis of the products was
Table 2 Properties of the raw materials and the solid products
Properties Raw Treated temperature (�C)
200 240 270 300 330 350
(a) Frond
Proximate analysis (wt.%)
Fixed carbon (d.a.f) 17.5 20.5 29.7 45.9 48.1 52.3 54.8
Volatile matter (d.a.f) 82.5 79.5 70.3 54.1 51.9 47.7 45.2
Ash (d.b) 1.8 1.3 1.3 1.2 1.0 0.7 0.8
Equilibrium moisture 14.7 7.6 6.4 5.5 5.2 5.0 5.2
Ultimate analysis (wt.%) (d.a.f)
C 47.2 53.6 58.6 69.4 71.1 73.9 75.1
H 5.9 5.7 5.4 4.9 4.9 4.9 4.8
N 0.2 0.2 0.3 0.4 0.4 0.4 0.4
O (diff) 46.6 40.4 35.7 25.3 23.5 20.7 19.5
S 0.1 0.1 0.1 0.1 0.1 0.1 0.1
Yield of solid product (wt.%) (d.b) 58.3 52.0 42.5 38.4 36.7 35.1
Gross calorific value (MJ/kg) (d.a.f) 18.8 20.5 23.0 26.7 27.3 29.0 29.7
Energy densification ratio 1.09 1.22 1.42 1.45 1.54 1.58
Energy yield (%) 63.5 63.6 60.3 55.9 56.5 55.4
(b) Trunk
Proximate analysis (wt.%)
Fixed carbon (d.a.f) 16.1 16.2 26.6 45.1 48.8 52.8 55.0
Volatile matter (d.a.f) 83.9 83.8 73.4 54.9 51.2 47.2 45.0
Ash (d.b) 2.2 1.8 1.8 2.2 2.1 1.9 2.1
Equilibrium moisture 13.6 7.5 6.5 5.1 4.8 4.6 4.5
Ultimate analysis (wt.%) (d.a.f)
C 47.5 51.4 57.5 69.3 71.4 73.4 75.3
H 5.9 5.9 5.6 5.1 5.0 4.9 4.9
N 0.5 0.4 0.6 0.8 0.8 1.0 1.0
O (diff) 45.9 42.1 36.2 24.6 22.6 20.6 18.6
S 0.1 0.1 0.1 0.1 0.1 0.1 0.2
Yield of solid product (wt.%) (d.b) 67.8 56.9 41.7 38.7 36.9 35.3
Gross calorific value (MJ/kg) (d.a.f) 18.8 19.9 22.6 27.0 28.0 29.4 29.7
Energy densification ratio 1.06 1.20 1.44 1.49 1.57 1.58
Energy yield (%) 71.7 68.3 60.0 57.8 57.9 55.7
d.b dry basis, d.a.f dry ash free basis, diff. differences
Table 3 Percent component in the solid products
Product Cellulose Hemicellulose Lignin & other
Frond
200�C 55.1 3.2 41.7
240�C 42.3 0.0 57.7
270�C 0.2 0.0 99.8
300�C 0.0 0.0 100.0
Trunk
200�C 62.9 0.0 37.1
240�C 44.8 0.0 55.1
270�C 0.4 0.0 99.6
300�C 0.0 0.0 100.0
Waste Biomass Valor (2010) 1:395–405 399
123
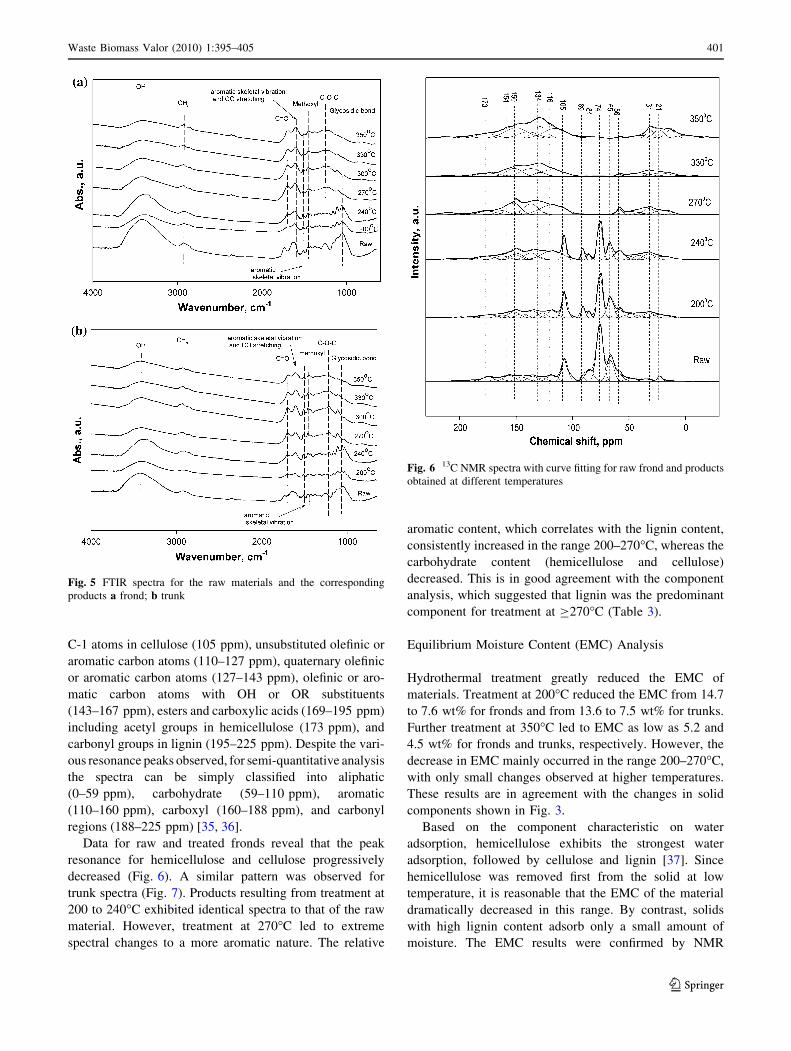
performed. Peaks were assigned based on literature data [3,
33]. Figure 5 shows spectra of the raw materials and the
corresponding solid products. The spectra for frond and
trunk materials were similar. The intensity of the peak
*3500 cm-1 attributed to –OH groups decreased at ele-
vated temperature, indicating that water molecules within
the solids were gradually expelled. In other words, dehy-
dration of the feed material occurred. The peak at
*2900 cm-1 attributed to aliphatic CHn groups also
weakened, indicating that several long aliphatic chains were
broken down. More distinctive peaks were observed in the
region below 2000 cm-1. The peak at *1700–1740 cm-1
represents carbonyl (C=O) stretching vibrations. The peak
at *1515 cm-1 reveals to aromatic skeletal vibration
derived from lignin. The peak at *1050 cm-1 attributed to
glycosidic bonds, indicating the presence of cellulose,
steadily weakened and completely disappeared for tem-
peratures [270�C, indicating that cellulose was totally
degraded at this temperature. The decrease in intensity for
C–O–C aryl–alkyl ether linkages at *1230 cm-1 suggests
lignin decomposition. Conversely, solids derived from
polymerization of intermediate compounds in the liquid
phase increased the aromatic content, particularly at tem-
peratures[300�C, as indicated by the increase in intensity
for the peak at 1600 cm-1 attributed to aromatic skeletal
vibrations and CO stretching.
13C Nuclear Magnetic Resonance (NMR) Results
13C NMR measurements were conducted to complement
FTIR in characterizing the molecular structure of the solid
products. NMR is useful for making comparisons without the
need for peak ratios. Each resonance peak can be measured
relative to the total resonance intensity to give the relative
amount of individual molecular groups. Typical 13C NMR
spectra for raw biomass with peak assignment can be found
in the literature [34–36]. In brief, resonance peaks in spectra
for raw frond and trunk material were assigned to CH3 in
acetyl groups (21 ppm), methoxyl groups in lignin
(56 ppm), C-6 carbon atoms in cellulose (62–65 ppm), C-2/
C-3/C-5 atoms in cellulose (72–75 ppm), C-4 atoms in cel-
lulose (84–89 ppm), C-1 atoms in hemicellulose (102 ppm),
Table 4 Mineral composition of ash in the raw materials and the solid products
Solid products Oxide (wt.%)
CaO SiO2 MgO K2O Fe2O3 Al2O3 ZnO SO3 P2O5 Others
(a) Frond
Raw 52.70 12.20 16.00 8.29 0.39 0.21 0.05 7.21 2.43 0.52
200�C 51.30 28.70 6.04 3.66 1.41 0.79 0.06 5.78 1.10 1.16
240�C 39.50 32.90 7.52 4.36 1.97 1.49 0.07 8.31 2.54 1.34
270�C 28.80 39.10 7.60 4.64 1.22 1.61 0.05 12.40 2.95 1.63
300�C 30.80 29.60 6.95 5.50 2.19 2.17 0.05 15.20 5.36 2.18
330�C 37.10 16.60 8.49 6.03 2.54 2.62 0.07 16.30 8.14 2.11
350�C 36.50 16.40 8.51 5.71 2.96 2.67 0.08 16.00 7.83 3.34
(b) Trunk
Raw 23.50 14.90 15.60 24.50 0.71 0.25 0.12 10.70 8.71 1.00
200�C 18.80 39.80 8.37 13.20 1.14 0.67 0.11 9.54 7.27 1.10
240�C 15.20 44.30 5.83 9.21 1.43 0.76 0.10 9.23 13.10 0.84
270�C 16.40 44.00 4.64 7.38 1.21 0.83 0.06 9.95 14.80 0.73
300�C 18.20 41.40 4.64 5.38 1.69 1.49 0.06 7.97 18.20 0.97
330�C 27.30 22.80 5.05 6.76 2.57 1.22 0.15 9.64 23.00 1.51
350�C 22.10 22.80 11.80 5.16 3.13 0.76 0.12 9.33 18.40 6.41
Fig. 4 Van Krevelen diagram for the solid products obtained at
different temperatures in comparison with other solid fuel (1 raw
material; 2 200�C; 3 240�C; 4 270�C; 5 300�C; 6 330�C; 7 350�C;
a frond; b trunk)
400 Waste Biomass Valor (2010) 1:395–405
123
C-1 atoms in cellulose (105 ppm), unsubstituted olefinic or
aromatic carbon atoms (110–127 ppm), quaternary olefinic
or aromatic carbon atoms (127–143 ppm), olefinic or aro-
matic carbon atoms with OH or OR substituents
(143–167 ppm), esters and carboxylic acids (169–195 ppm)
including acetyl groups in hemicellulose (173 ppm), and
carbonyl groups in lignin (195–225 ppm). Despite the vari-
ous resonance peaks observed, for semi-quantitative analysis
the spectra can be simply classified into aliphatic
(0–59 ppm), carbohydrate (59–110 ppm), aromatic
(110–160 ppm), carboxyl (160–188 ppm), and carbonyl
regions (188–225 ppm) [35, 36].
Data for raw and treated fronds reveal that the peak
resonance for hemicellulose and cellulose progressively
decreased (Fig. 6). A similar pattern was observed for
trunk spectra (Fig. 7). Products resulting from treatment at
200 to 240�C exhibited identical spectra to that of the raw
material. However, treatment at 270�C led to extreme
spectral changes to a more aromatic nature. The relative
aromatic content, which correlates with the lignin content,
consistently increased in the range 200–270�C, whereas the
carbohydrate content (hemicellulose and cellulose)
decreased. This is in good agreement with the component
analysis, which suggested that lignin was the predominant
component for treatment at C270�C (Table 3).
Equilibrium Moisture Content (EMC) Analysis
Hydrothermal treatment greatly reduced the EMC of
materials. Treatment at 200�C reduced the EMC from 14.7
to 7.6 wt% for fronds and from 13.6 to 7.5 wt% for trunks.
Further treatment at 350�C led to EMC as low as 5.2 and
4.5 wt% for fronds and trunks, respectively. However, the
decrease in EMC mainly occurred in the range 200–270�C,
with only small changes observed at higher temperatures.
These results are in agreement with the changes in solid
components shown in Fig. 3.
Based on the component characteristic on water
adsorption, hemicellulose exhibits the strongest water
adsorption, followed by cellulose and lignin [37]. Since
hemicellulose was removed first from the solid at low
temperature, it is reasonable that the EMC of the material
dramatically decreased in this range. By contrast, solids
with high lignin content adsorb only a small amount of
moisture. The EMC results were confirmed by NMR
Fig. 5 FTIR spectra for the raw materials and the corresponding
products a frond; b trunk
Fig. 6 13C NMR spectra with curve fitting for raw frond and products
obtained at different temperatures
Waste Biomass Valor (2010) 1:395–405 401
123
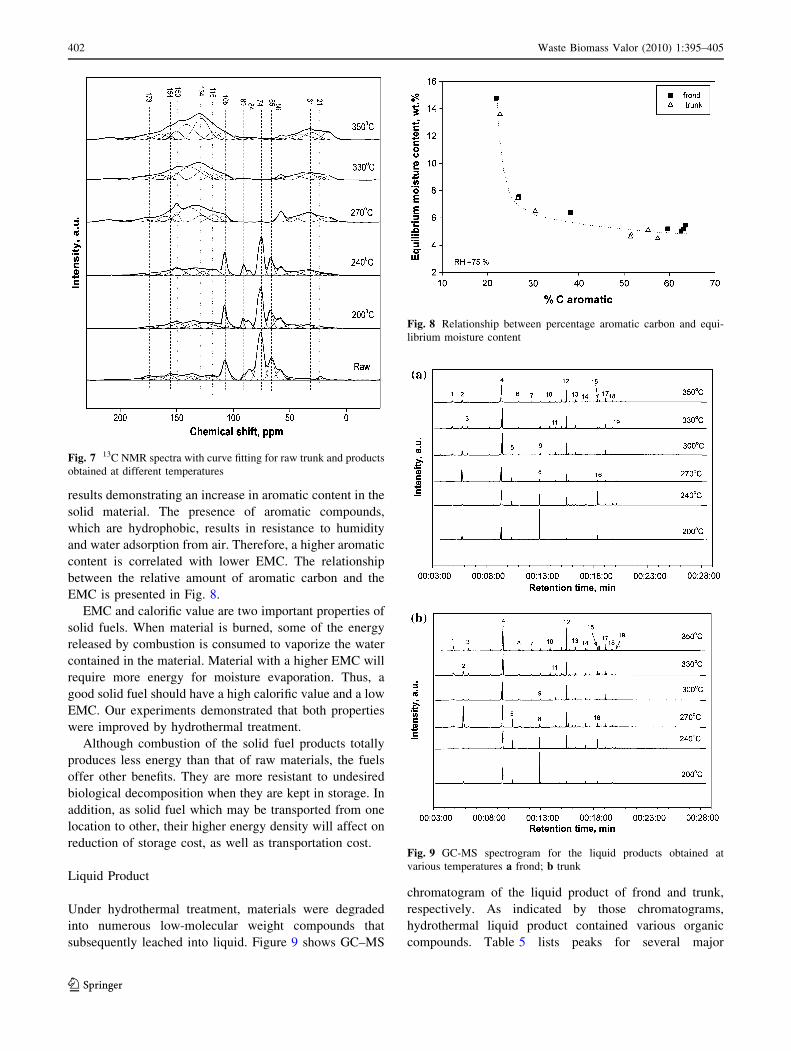
results demonstrating an increase in aromatic content in the
solid material. The presence of aromatic compounds,
which are hydrophobic, results in resistance to humidity
and water adsorption from air. Therefore, a higher aromatic
content is correlated with lower EMC. The relationship
between the relative amount of aromatic carbon and the
EMC is presented in Fig. 8.
EMC and calorific value are two important properties of
solid fuels. When material is burned, some of the energy
released by combustion is consumed to vaporize the water
contained in the material. Material with a higher EMC will
require more energy for moisture evaporation. Thus, a
good solid fuel should have a high calorific value and a low
EMC. Our experiments demonstrated that both properties
were improved by hydrothermal treatment.
Although combustion of the solid fuel products totally
produces less energy than that of raw materials, the fuels
offer other benefits. They are more resistant to undesired
biological decomposition when they are kept in storage. In
addition, as solid fuel which may be transported from one
location to other, their higher energy density will affect on
reduction of storage cost, as well as transportation cost.
Liquid Product
Under hydrothermal treatment, materials were degraded
into numerous low-molecular weight compounds that
subsequently leached into liquid. Figure 9 shows GC–MS
chromatogram of the liquid product of frond and trunk,
respectively. As indicated by those chromatograms,
hydrothermal liquid product contained various organic
compounds. Table 5 lists peaks for several major
Fig. 7 13C NMR spectra with curve fitting for raw trunk and products
obtained at different temperatures
Fig. 8 Relationship between percentage aromatic carbon and equi-
librium moisture content
Fig. 9 GC-MS spectrogram for the liquid products obtained at
various temperatures a frond; b trunk
402 Waste Biomass Valor (2010) 1:395–405
123
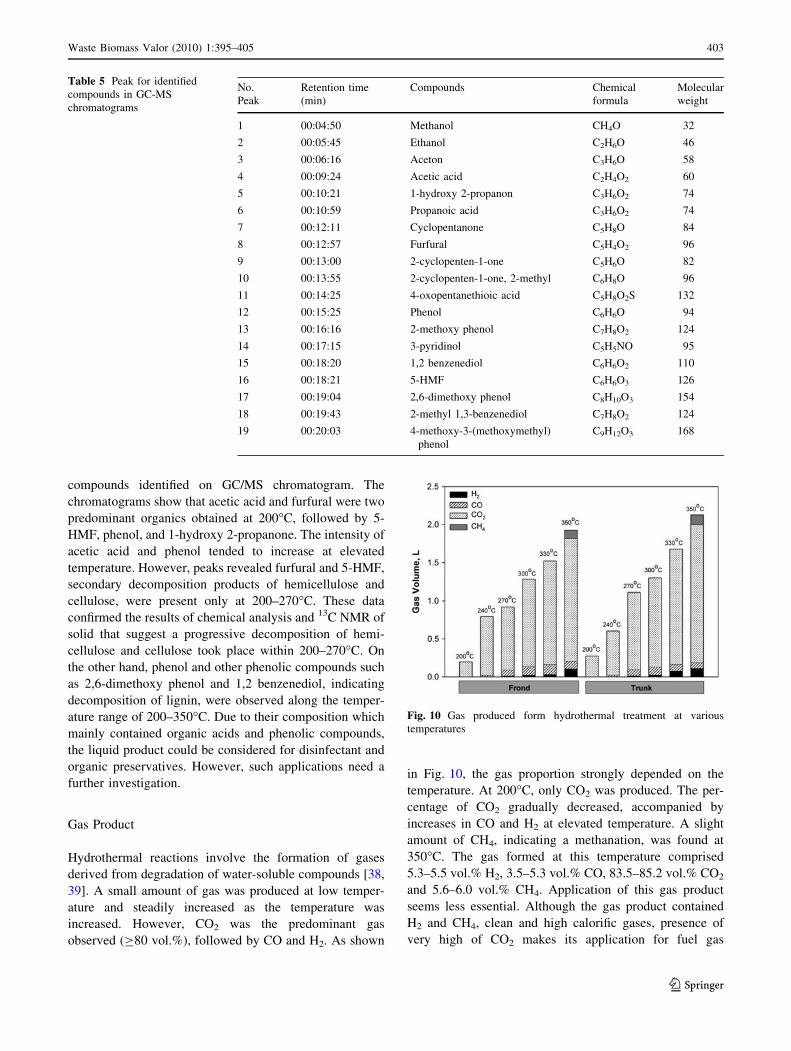
compounds identified on GC/MS chromatogram. The
chromatograms show that acetic acid and furfural were two
predominant organics obtained at 200�C, followed by 5-
HMF, phenol, and 1-hydroxy 2-propanone. The intensity of
acetic acid and phenol tended to increase at elevated
temperature. However, peaks revealed furfural and 5-HMF,
secondary decomposition products of hemicellulose and
cellulose, were present only at 200–270�C. These data
confirmed the results of chemical analysis and 13C NMR of
solid that suggest a progressive decomposition of hemi-
cellulose and cellulose took place within 200–270�C. On
the other hand, phenol and other phenolic compounds such
as 2,6-dimethoxy phenol and 1,2 benzenediol, indicating
decomposition of lignin, were observed along the temper-
ature range of 200–350�C. Due to their composition which
mainly contained organic acids and phenolic compounds,
the liquid product could be considered for disinfectant and
organic preservatives. However, such applications need a
further investigation.
Gas Product
Hydrothermal reactions involve the formation of gases
derived from degradation of water-soluble compounds [38,
39]. A small amount of gas was produced at low temper-
ature and steadily increased as the temperature was
increased. However, CO2 was the predominant gas
observed (C80 vol.%), followed by CO and H2. As shown
in Fig. 10, the gas proportion strongly depended on the
temperature. At 200�C, only CO2 was produced. The per-
centage of CO2 gradually decreased, accompanied by
increases in CO and H2 at elevated temperature. A slight
amount of CH4, indicating a methanation, was found at
350�C. The gas formed at this temperature comprised
5.3–5.5 vol.% H2, 3.5–5.3 vol.% CO, 83.5–85.2 vol.% CO2
and 5.6–6.0 vol.% CH4. Application of this gas product
seems less essential. Although the gas product contained
H2 and CH4, clean and high calorific gases, presence of
very high of CO2 makes its application for fuel gas
Table 5 Peak for identified
compounds in GC-MS
chromatograms
No.
Peak
Retention time
(min)
Compounds Chemical
formula
Molecular
weight
1 00:04:50 Methanol CH4O 32
2 00:05:45 Ethanol C2H6O 46
3 00:06:16 Aceton C3H6O 58
4 00:09:24 Acetic acid C2H4O2 60
5 00:10:21 1-hydroxy 2-propanon C3H6O2 74
6 00:10:59 Propanoic acid C3H6O2 74
7 00:12:11 Cyclopentanone C5H8O 84
8 00:12:57 Furfural C5H4O2 96
9 00:13:00 2-cyclopenten-1-one C5H6O 82
10 00:13:55 2-cyclopenten-1-one, 2-methyl C6H8O 96
11 00:14:25 4-oxopentanethioic acid C5H8O2S 132
12 00:15:25 Phenol C6H6O 94
13 00:16:16 2-methoxy phenol C7H8O2 124
14 00:17:15 3-pyridinol C5H5NO 95
15 00:18:20 1,2 benzenediol C6H6O2 110
16 00:18:21 5-HMF C6H6O3 126
17 00:19:04 2,6-dimethoxy phenol C8H10O3 154
18 00:19:43 2-methyl 1,3-benzenediol C7H8O2 124
19 00:20:03 4-methoxy-3-(methoxymethyl)
phenol
C9H12O3 168
Fig. 10 Gas produced form hydrothermal treatment at various
temperatures
Waste Biomass Valor (2010) 1:395–405 403
123

inappropriate. On the other hand, its utilization for high
purity CO2 source will be costly since an additional sepa-
ration process is needed. Meanwhile, conversion into the
gas products is less than 10%, as shown in the carbon
balance (Fig. 3).
Conclusions
Upgrading of oil palm frond and trunk was investigated by
hydrothermal treatment at 200–350�C for 30 min.
Approximately 35–65 wt% of the original material was
recovered after the process as solid fuel. The very high
oxygen and volatile matter content of the original material
were significantly reduced. By contrast, the fixed carbon
content increased sharply due to carbonization. The van
Krevelen diagram revealed that solids resulting from
treatment at C330�C have a composition comparable to
that of sub-bituminous coal. FTIR analysis confirmed that
oxygen elimination due to dehydration in conjunction with
decomposition of hemicellulose and cellulose occurred at
200–270�C. At temperatures [270�C, the structure of the
solid dramatically changed and was dominated by lignin.
This was indicated by an increase in aromatic compounds,
as determined by 13C NMR spectroscopy.
Hydrothermal treatment progressively changes the cal-
orific value and EMC of materials. Treatment at 350�C
produced solid with a gross calorific value as high as
29.7 MJ/kg (for both materials) and EMC of *5.2 and
*4.5 wt% for frond and trunk material, respectively.
However, significant changes in the calorific value and the
EMC was observed in 200–270�C range, which can be
attributed to progressive removal of hemicellulose and
cellulose. This was in agreement with the GC–MS analysis
results, showing that decomposition products of hemicel-
lulose and cellulose (furfural and 5-HMF) were observed
only at 200–270�C. The GC–MS result also indicated
degradation of lignin took place along the temperature
range of 200–350�C.
After treatment, liquid containing various organic
compounds, mainly organic acids and phenolic com-
pounds, was produced. A small amount of gas was formed
at low temperature and steadily increased as the tempera-
ture was increased. However, CO2 was the predominant
gas observed (C80 vol.%).
Although total energy produced from combustion of this
solid product was less than that of raw material, the use of
this fuel offers other benefits. The fuel had higher energy
density and lower EMC which may improve its handling
and storage properties. Thus, it is proposed that hydro-
thermal treatment could become an advantageous tech-
nology for producing solid fuel from biomass wastes.
Acknowledgments The authors are grateful for support of this
research by a Grant-in-Aid for Scientific Research No. 21246135
from the Japan Society for the Promotion of Science (JSPS) and the
Global COE program (Novel Carbon Resources Sciences, Kyushu
University).
References
1. Abdullah, N., Gerhauser, H.: Bio-oil derived from empty fruit
bunches. Fuel 87, 2606–2613 (2008)
2. Nasrin, A.B., Ma, A.N., Choo, Y.M., Mohammad, S., Rohaya,
M.H., Azali, A., Zainal, Z.: Oil palm biomass as potential sub-
stitution raw materials for commercial biomass briquettes pro-
duction. Am. J. Appl. Sci. 5, 179–183 (2008)
3. Yang, H., Yan, R., Chen, H., Lee, D.H., Liang, D.T., Zheng, C.:
Pyrolysis of palm oil wastes for enhanced production of hydrogen
rich gases. Fuel Process. Technology 87, 935–942 (2006)
4. Tanaka, R., Kosugi, A., Mori, Y.: Utilization of lignocellulosic
biomass discharged from palm oil industries. J. Jpn. Inst. Energy
86, 368–370 (2007)
5. Rodriguez, A., Serrano, L., Moral, A., Perez, A., Jimenez, L.: Use
of high-boiling point organic solvents for pulping oil palm empty
fruit bunches. Bioresour. Technol. 99, 1743–1749 (2008)
6. Gonzales, M., Canton, L., Rodriguez, A., Labidi, J.: Effect of
organosolv and soda pulping processes on the metals content of
non-woody pulps. Bioresour. Technol. 99, 6621–6625 (2008)
7. Hussein, M.Z., Tarmizi, R.S.H., Zainal, Z., Ibrahim, R., Badri,
M.: Preparation and characterization of active carbons from oil
palm shells. Carbon 34, 1447–1454 (1996)
8. Lua, A.C., Guo, J.: Preparation and characterization of activated
carbons from oil-palm stones for gas-phase adsorption. Colloids
Surf. A 179, 151–162 (2001)
9. Alam, M.Z., Muyibi, S.A., Mansor, M.F., Wahid, R.: Activated
carbons derived from oil palm empty-fruit bunches: application
to environmental problems. J. Environ. Sci. 19, 103–108 (2007)
10. Hameed, B.H., Tan, I.A.W., Ahmad, A.L.: Preparation of oil
palm empty fruit bunch-based activated carbon for removal of 2,
4, 6-trichlorophenol: optimization using response surface meth-
odology. J. Hazard. Mater. 164, 1316–1324 (2009)
11. Zaidon, A., Nizam, A.M.N., Nor, M.Y.M., Abood, F., Paridah,
M.T., Yuziah, M.Y.N., Jalaluddin, H.: Properties of particleboard
made from pretreated particles of rubberwood, EFB, and rub-
berwood–EFB blend. J. Appl. Sci. 7, 1145–1151 (2007)
12. Deraman, M., Zakaria, S., Husin, M., Aziz, A.A., Ramli, R.,
Mokhtar, A., Yusof, M.N.M., Sahri, M.H.: X-Ray diffraction
studies on fiber of oil palm empty fruit bunch and rubberwood for
medium-density fiberboard. J. Mater. Sci. Lett. 18, 249–253
(1999)
13. Rozman, H.D., Tay, G.S., Abubakar, A., Kumar, R.N.: Tensile
properties of oil palm empty fruit bunch–polyurethane compos-
ites. Eur. Polym. J. 37, 1759–1765 (2001)
14. Rozman, H.D., Saad, M.J., Ishak, Z.A.M.: Flexural and impact
properties of oil palm empty fruit bunch (EFB)–polypropylene
composites–the effect of maleic anhydride chemical modification
of EFB. Polym. Test 22, 335–341 (2003)
15. Khalid, M., Ratnam, C.T., Chuah, T.G., Ali, S., Choong, T.S.Y.:
Comparative study of polypropylene composites reinforced with
oil palm empty fruit bunch fiber and oil palm derived cellulose.
Mater Des. 29, 173–178 (2008)
16. Arvanitoyannis, I.S., Kassaveti, A., Stefanatos, S.: Current and
potential uses of thermally treated olive oil waste. Int. J. Food
Sci. Technol. 42, 852–867 (2007)
17. Arvanitoyannis, I.S., Tserkezou, P.: Wheat, barley and oat waste:
a comparative and critical presentation of methods and potential
404 Waste Biomass Valor (2010) 1:395–405
123

uses of treated waste. Int. J. Food Sci. Technol. 43, 694–725
(2008)
18. Arvanitoyannis, I.S., Tserkezou, P.: Corn and rice waste: a
comparative and critical presentation of methods and current and
potential uses of treated waste. Int. J. Food Sci. Technol. 43,
958–988 (2008)
19. Arvanitoyannis, I.S., Varzakas, T.H.: Vegetable waste treatment:
Comparison and critical presentation of methodologies. Crit. Rev.
Food Sci Nutr. 48, 205–247 (2008)
20. McKendry, P.: Energy production from biomass (part 2): con-
version technologies. Bioresour. Technol. 83, 47–54 (2002)
21. Ni, M., Leung, D.Y.C., Leung, M.K.H., Sumathy, K.: An over-
view of hydrogen production from biomass. Fuel Process Tech-
nol. 87, 461–472 (2006)
22. Ando, H., Sakaki, T., Kokusho, T., Shibata, M., Uemura, Y.,
Hatate, Y.: Decomposition behavior of plant biomass in hot-
compressed water. Ind. Eng. Chem. Res. 39, 3688–3693 (2000)
23. Sasaki, M., Adschiri, T., Arai, K.: Fractionation of sugarcane
bagasse by hydrothermal treatment. Bioresour. Technol. 86,
301–304 (2003)
24. Zhang, L.H., Xu, C.B., Champagne, P.: Overview of recent
advances in thermo-chemical conversion of biomass. Energy
Convers. Manage. 51, 969–982 (2010)
25. Kruse, A.: Hydrothermal biomass gasification. J. Supercrit. Fluids
47, 391–399 (2009)
26. Allen, S.G., Schulman, D., Lichwa, J., Antal, M.J., Laser, M.,
Lynd, L.R.: A comparison between hot liquid water and steam
fractionation of corn fiber. Ind. Eng. Chem. Res. 40, 2934–2941
(2001)
27. Ehara, K., Saka, S.: A comparative study on chemical conversion
of cellulose between the batch-type and flow-type systems in
supercritical water. Cellulose 9, 301–311 (2002)
28. Hamelinck, C.N., Van Hooijdonk, G., Faaij, A.P.C.: Ethanol from
lignocellulosic biomass: techno-economic performance in short-,
middle- and long-term. Biomass Bioenerg. 28, 384–410 (2005)
29. Laser, M., Schulman, D., Allen, S.G., Lichwa, J., Antal, M.J.,
Lynd, L.R.: A comparison of liquid hot water and steam
pretreatments of sugar cane bagasse for bioconversion to ethanol.
Bioresour. Technol. 81, 33–44 (2002)
30. Sluiter, A., Hames, B., Ruiz, R., Scarlata, C., Sluiter, J., Tem-
pleton, D., Crocker, D.: Determination of structural carbohy-
drates and lignin in biomass. The US national renewable energy
laboratory technical report, (2005)
31. Yan, W., Acharjee, T.C., Coronella, C.J., Vasquez, V.R.: Ther-
mal pretreatment of lignocellulosic biomass. Environ. Prog Sus-
tain. Energy 28, 435–440 (2009)
32. Ehara, K., Saka, S.: Decomposition behavior of cellulose in
supercritical water, subcritical water, and their combined treat-
ments. J. Wood Sci. 51, 148–153 (2005)
33. Kobayashi, N., Okada, N., Hirakawa, A., Sato, T., Kobayashi, J.,
Hatano, S., Itaya, Y., Mori, S.: Characteristics of solid residues
obtained from hot-compressed-water treatment of woody bio-
mass. Ind. Eng. Chem. Res. 48, 373–379 (2009)
34. Capanema, E.A., Balakshin, M.Y., Kadla, J.F.: Quantitative
characterization of a hardwood milled wood lignin by nuclear
magnetic resonance spectroscopy. J. Agric. Food Chem. 53,
9639–9649 (2005)
35. Wikberg, H., Maunu, S.L.: Characterisation of thermally modi-
fied hard- and softwoods by C-13 CPMAS NMR. Carbohydr.
Polym. 58, 461–466 (2004)
36. Wooten, J.B., Kalengamaliro, N.E., Axelson, D.E.: Character-
ization of bright tobaccos by multivariate analysis of C-13
CPMAS NMR spectra. Phytochemistry 70, 940–951 (2009)
37. Morohoshi, N.: Woody biomass utilization. Buneido Shuppan,
Tokyo, p. 84 (1991) (in Japanese)
38. Kruse, A., Dinjus, E.: Hot compressed water as reaction medium
and reactant: 2. degradation reactions. J. Supercrit. Fluids 41,
368–369 (2007)
39. Srokol, Z., Bouche, A.G., van Estrik, A., Strik, R.C.J., Masch-
meyer, T., Peters, J.A.: Hydrothermal upgrading of biomass to
biofuel: studies on some monosaccharide model compounds.
Carbohydr. Res. 339, 1717–1726 (2004)
Waste Biomass Valor (2010) 1:395–405 405
123