production of carbonated vegetable oils from a kinetic
TRANSCRIPT
HAL Id: tel-02867962https://tel.archives-ouvertes.fr/tel-02867962
Submitted on 15 Jun 2020
HAL is a multi-disciplinary open accessarchive for the deposit and dissemination of sci-entific research documents, whether they are pub-lished or not. The documents may come fromteaching and research institutions in France orabroad, or from public or private research centers.
L’archive ouverte pluridisciplinaire HAL, estdestinée au dépôt et à la diffusion de documentsscientifiques de niveau recherche, publiés ou non,émanant des établissements d’enseignement et derecherche français ou étrangers, des laboratoirespublics ou privés.
Production of carbonated vegetable oils from a kineticmodeling to a structure-reactivity approach
Xiaoshuang Cai
To cite this version:Xiaoshuang Cai. Production of carbonated vegetable oils from a kinetic modeling to a structure-reactivity approach. Chemical and Process Engineering. Normandie Université, 2019. English. �NNT :2019NORMIR05�. �tel-02867962�
THESE
Pour obtenir le diplôme de doctorat
Spécialité Génie des Procédé
Préparée au sein de « I’Institut National des Sciences Appliquées de Rouen Normandie »
Production of carbonated vegetable oils from a kinetic modeling to a structure-reactivity approach
Présentée et soutenue par Xiaoshuang CAI
Thèse dirigée par Dr. HDR Sébastien LEVENEUR, Laboratoire de sécurité des procédés chimiques-LSPC & Docent à Åbo Akademi Univerity.
Logo Etablissement Logo Ecole Doctorale Logo laboratoire
Thèse soutenue publiquement le 12 mars 2019 devant le jury composé de
Michel Cabassud Professeur / Université de Toulouse, France Rapporteur
Jean-Marc Commenge Professeur / Université de Lorraine, France Rapporteur
Hudebine Damien Directeur expert / IFP Energies Nouvelles, France Examinateur
Valeria Casson Moreno Professor assistant / Université of Bologna, Italy Examinatrice
Françoise Maugé Directrice de recherche / Laboratoire Catalyse & Spectrochimie, France
Examinatrice
Sébastien Leveneur Asociate professor / Laboratoire de Sécurité des Procédés Chimiques, France
Directeur de thèse

II

III
To my family

IV
V
Curriculum Vitae
Xiaoshuang CAI
Born in 1989, Nanyang, Henan, China
M.Sc. Eng. 2015
Grain, Oil and Vegetable Protein Engineering, Faculty of Food Science and Engineering, Wuhan
Polytechnic University, CHINA
Education:
Chemical engineering, 2015-2019
National Institute of Applied Sciences of Rouen (INSA-Rouen), FRANCE
Grain, oil and vegetable protein engineering, 2012–2015
Faculty of Food Science and Engineering, Wuhan Polytechnic University, CHINA
Master thesis: Gastrointestinal absorption, anti-oxidation mechanisms of Crocetin of
Gardenia Jasminoides Ellis on cancer cells.
Project:
Johan Gadolin Scholarship program: Find the appropriate heterogeneous catalyst for the
carbonation of epoxidized vegetable oil, Finland, 2018. (October 2018-March 2019)
PhD Grants from the China Scholarship Council: Co-operation Program with the UT and INSA:
Carbonation of vegetable oils, France, 2015.
Experience:
05/2018–08/2018: Supervision of bachelor student (Matos Manoelito) research project
‘Carbonation of fatty acid methyl ester of cottonseed oil’ at LSPC, INSA Rouen.
01/2018–06/2018: Assistant-teacher for analysis particles (12 hours).
11/2017–01/2018: Supervision of master students (Boris Kasabov and Baptiste Lefebvre)
research project ‘Experimental design for monitoring exothermic reactions with calorimetry’
at LSPC, INSA Rouen.
02/2017–06/2017: Supervision of master thesis (Wander Y. Perez Sena) ‘Kinetic and thermal
study of the polymerization of carbonated vegetable oils’ at LSPC, INSA Rouen.
05/2016–07/2016: Supervision of master student (Georgiana Alexa) research project ’Risk
assessment for the aminolysis of carbonated vegetable oil’ at LSPC, INSA Rouen.

VI
VII
简 历
蔡小双
1989 年生于中国河南省南阳市
于 2015 年获武汉轻工大学粮食、油脂及植物蛋白工程全日制硕士研究生学位
教育背景
2012.09 -2015.07 武汉轻工大学 | 粮食、油脂及植物蛋白工程 | 工学硕士
硕士研究课题 « 栀子源藏花酸的吸收利用及细胞抗氧化机制研究»
2015.10-2019.03 法国国立鲁昂应用科学学院 (INSA-Rouen) | 过程工程
科研经历
2015.10-2019.03 法国 UT-INSA/CSC 国际合作项目 « 植物油的碳酸化研究»
2018.10 -2019.02 芬兰 Johan Gadolin Scholarship 项目 « 植物油的碳酸化的非均相
催化剂的筛选及应用»
教学实践
2016.05 – 2016.07 指导研究生(Georgiana Alexa)项目“棉籽油环氧化反应研究”及
“亚麻籽油聚合反应反应过程的热风险评估”
2017.02 – 2017.06 指导研究生(Boris Kasabov and Lefebvre Baptiste)项目“植物油基
环碳酸酯的聚合反应的热动力学研究”
2017.11 – 2018.01 指导研究生(Wander Y. Perez Sena)项目“用量热法监测放热反应
的实验设计”
2018.01 – 2018.06 试验指导教学 (12 个学时)
2018.05 – 2018.08 指导研究生(Matos Manoelito)项目“棉籽油脂肪酸甲酯环碳酸化
反应研究”

VIII
IX
Acknowledgements
The research is the co-operation program with China Scholarship Council and the UT and INSA
(France). The majority of this work is performed at the Laboratoire de Sécurité des Procédés
Chimiques of INSA de Rouen during the years of 2015-2019. On the occasion of the completion
of the thesis, I would like to express my sincere gratitude!
I would like to express my gratitude to the China Scholarship Council (China) for providing me
the scholarship, and I would like to express my gratitude to the UT-INSA (France) for the
technical support.
I would like to thank my supervisor Dr. Sébastien LEVENEUR for his patient supervision. His
scientific knowledge, availability makes this project credible and facilitate in progress. Thank
you very much again for your inspiration, support and help over the past three and a half years.
From topics of this project conceiving to research plans developing, the results of the
experiments discussing to scientific articles co-publishing, and then the first draft of the thesis
revising to the final draft determined, every breakthrough in research progress is inseparable
from my supervisor’s careful guidance and patience. I would like to express my sincere respect!
I would like to thank all the staffs behind the scenes at INSA-Rouen University (France), thank
you very much for your timely and great help on my study and my life. I would like to include
thanks to every permanant staff from the laboratory LSPC (Laboratoire de Sécurité des
Procédés Chimiques): Béchara TAOUK, Lamia VERNIÈRES-HASSIMI, Lionel ESTEL, Alain
LEDOUX, Lokmane ABDELOUAHED, Bruno DARONAT, Sylvie POUBELLE, Jean-pierre HEBERT,
Raphaël DELAMARE, Giovanna DELAMARE, Axelle TRUFFERT, Fatima ABID, Pereira DE ARAUJO
MARIA, Christine DEVOUGE, Jeremy DESHAIS, thank you very much for your encouragement
and great help on my study and friendliness. I would like also to thank Nasreddine KÉBIR for
helping with the NMR analysis.
I would like to thank Professor Tapio Salmi from Åbo Akademi University for welcoming me at
Johan Gadolin Process Chemistry Centre (PCC) and helped with the catalyst screening for the
carbonation work. I learned so much from the participation in this project. It makes me well
knowledged and made my work experience richer. I would like to include my thanks to all the
staffs and colleagues at PCC: Pasi TOLVANEN, Pasi VIRTANEN, Kari ERÄNEN, Jani RAHKILA,

X
Narendra KUMAR, Adrianna FREITES AGUILERA, Soudabeh SAEED, Leolincoln CORREIA. Thank
you all for your help and encouragement.
I want to thank all my colleagues in LSPC, Junliu ZHENG, Vivianna CONTRAS, Nassima
BENAMARA, Chetna MOHABEER, Emmanuelle VIARD, Yanjun WANG, Marie DÉCULTOT,
Xiaojia LU, Elizabeth GARCÍA HERNANDEZ, Wander PEREZ SENA, Jundong WANG, Lilivet
UBIERA RUIZ, Luis CÉSAR REYES, etc. All of you are my sunshine and making my French life
wonderful. Special thanks to Chetna, you are so intelligent, sincere and kindness. We
accompanied each other and became strong together during the past three years. I also want
to thank all my friends who have been unequivocally since my days in China and France: Yuan
LIU, Yuhui ZHAO, Lulu LIU and Yongshuai CHENG, thanks for accompanies and all the smiles
and tears we have shared together. It is my great fortune to be able to meet everyone here.
I would like to express my sincere thanks and best wishes to everyone.
I would like to thank my supervisor during my master period, Professor Jingren HE, thank you
very much for your teaching and supporting on the road to scientific research. Thanks for
giving me the right guidance when I am confused for my future. Thank you for advicing me to
go aboard to see the outside world. I would like to thank Doctor Zhenzhou ZHU, thank you
very much for your encouragement and help during my application and preparation of the
interview for the CSC/UT-INSA program. Also, thanks a lot for all my master colleagues, Lige
DUAN, Ning YANG, Minjie KUANG, Shengwen ZHANG, etc. for your encouragement. Thank
you all!
I want to thank all the reviewers for my publishments and to include thanks to all the judges
of my doctoral thesis defense: Michel CABASSUD, Jean-Marc COMMENGE, Damien HUDEBINE,
Valeria CASSON MORENO, Françoise MAUGÉ, thank you very much for your time and valuable
advice.
At last, I would like to thank my parents and my family members, thank you very much for
your support and companionship. You are always my greatest motivation for my life and my
study.
Rouen, France
March, 2019
Xiaoshuang CAI
XI
Remerciements
Ces recherches sont effectuées en collaboration avec le China Scholarship Council (CSC) et UT-
INSA en France. La majorité des travaux est effectuée au Laboratoire de Sécurité des Procédés
Chimiques (LSPC) de l'INSA de Rouen au cours des années 2015-2019. A la fin d'achèvement
de ma thèse, je voudrais exprimer ma sincère reconnaissance.
Je voudrais exprimer ma gratitude au China Scholarship Council (Chine) pour m'avoir fourni la
bourse, et je voudrais exprimer ma gratitude à l'UT-INSA (France) pour le soutien technique.
Je souhaite remercier mon superviseur, le Dr Sébastien LEVENEUR, pour sa supervision
patiente. Ses connaissances scientifiques, sa disponibilité rendent ce projet crédible et
facilitent le progrès. Merci encore pour votre inspiration, votre soutien et vos aides au cours
des trois dernières années et demie. Des sujets de ce projet à la conception des plans de
recherche, des résultats des expérimentations à la coédition d'articles scientifiques, puis de la
première révision de ma thèse à la version finale, chaque percée dans la recherche est
indissociable de la direction minutieuse et patience de mon superviseur. Je voudrais exprimer
mon respect sincère.
Je souhaite remercier tous les membres du personnel de l'INSA de Rouen (France), qui se
trouvent dans les coulisses, merci beaucoup pour votre aide précieuse et efficace dans mon
étude et dans ma vie. Je voudrais remercier tous les collaborateurs permanents des
laboratoires du LSPC: Béchara TAOUK, Lamia VERNIÈRES-HASSIMI, Lionel ESTEL, Alain LEDOUX,
Lokmane ABDELOUAHED, Bruno DARONAT, Sylvie POUBELLE, Jean-pierre HEBERT, Raphaël
DELAMARE, Giovanna DELAMARE, Axelle TRUFFERT, Fatima ABID, Pereira DE ARAUJO MARIA,
Christine DEVOUGE, Jeremy DESHAIS, merci beaucoup pour vos encouragements et votre aide
précieuse dans mon étude et votre gentillesse. J'aimerais remercier Nasreddine KÉBIR pour
son aide dans l'analyse par NMR.
Je remercier Professeur Tapio Salmi à l'Université Åbo Akademi de Turku/Åbo, de m'avoir
invité à Johan Gadolin Process Chemistry Centre (PCC) et a contribué à la projection de
catalyseur pour le travail de carbonatation. J'ai tellement appris de la participation à ce projet.
Cela me permet d’avoir de bonnes connaissances et d’enrichir mon expérience de travail.
J'aimerais remercier tous les membres du personnel et les collègues du PCC: Pasi TOLVANEN,
Pasi VIRTANEN, Kari ERÄNEN, Jani RAHKILA, Narendra KUMAR, Adrianna FREITES AGUILERA,
XII
Soudabeh SAEED, Leolincoln CORREIA, etc. Merci à tous pour votre aide et vos
encouragements.
Je voudrais remercier tous mes beaux collègues du LSPC, Junliu ZHENG, Vivianna CONTRAS,
Nassima BENAMARA, Chetna MOHABEER, Emmanuelle VIARD, Yanjun WANG, Marie
DÉCULTOT, Xiaojia LU, Elizabeth GARCÍA HERNANDEZ, Wander PEREZ SENA, Jundong WANG,
Lilivet UBIERA RUIZ, Luis CÉSAR REYES, etc. Vous êtes tous mon rayon de soleil et de faire ma
vie française merveilleux dans ce pays étranger. Un merci spécial à Chetna, tu es intelligent,
sincère et gentil. Nous nous sommes accompagnés et devenus forts ensemble au cours des
trois dernières années. Je tiens aussi à remercier tous mes amis qui ont été sans équivoque
depuis mes jours en Chine et en France: Yuan LIU, Yuhui ZHAO, Lulu LIU et Yongshuai CHENG.
Merci pour tous les sourires et les larmes que nous avons partagés ensemble. C'est ma grande
chance de pouvoir rencontrer tout le monde ici. Je voudrais exprimer mes sincères
remerciements et mes meilleurs vœux à tous.
J'aimerais remercier mon superviseur durant ma période de master, Professeur Jingren HE.
Merci beaucoup pour votre enseignement et votre soutien sur le chemin de la recherche
scientifique. Merci de me advicing d'aller à France pour voir le monde extérieur. Je voudrais
remercier le Docteur Zhenzhou Zhu. Merci beaucoup pour vos encouragements et votre aide
pendant ma candidature et la préparation de l'entretien pour l’application pour le programme
CSC / UT-INSA. Merci beaucoup pour tous mes collègues, Lige DUAN, Ning YANG, Minjie
KUANG, Shengwen ZHANG, etc. pour vos encouragements. Merci à tous!
Je tiens à remercier tous les relecteurs pour mes publications. Je souhaite remercier tous les
juges de ma soutenance de thèse: Michel CABASSUD, Jean-Marc COMMENGE, Damien
HUDEBINE, Valeria CASSON MORENO, Françoise MAUGE, merci beaucoup pour votre temps
et vos précieux conseils.
Je voudrais voudrais remercier mes parents et les membres de ma famille, merci beaucoup
pour votre soutien et votre camaraderie. Vous êtes toujours ma plus grande motivation pour
ma vie et mes études.
Rouen, France
Mars, 2019
Xiaoshuang CAI
XIII
致 谢
时光如梭,三年半的博士生涯转眼已接近尾声。回首这三年半以来在法国 INSA-Rouen
的学习生活,心中充满感激。在这里,我得到了诸多祖国同胞和法国同事的关怀,尤
其感激导师 Sébastien LEVENEUR 对我的帮助,正是他们的关怀和帮助,使得我的学业顺
利完成。在论文完稿之际,我谨向他们表示最真诚的谢意!
诚挚感谢中国留学生基金委与法国 UT-INSA 合作项目为我们提供的这次难得的学习机
会,感谢祖国为我们提供的奖学金支持和法国 UT-INSA 提供的科研环境,使我们能够在
这里潜心做科研。
衷心感谢我的导师 Sébastien LEVENEUR 博士。孜孜不倦,感谢您在学习和生活上对我的
谆谆教诲;亦师亦友,感谢您在科研生活上为我们营造了一个严谨而又和谐的环境。
点点滴滴我都会铭记在心。本课题从课题的构思到研究计划的制定、从实验结果的讨
论到一篇篇科研成果的共同发表,再到毕业论文初稿的逐章修改直到定稿,每一个环
节都离不开导师的耐心阅读和悉心指导。在此论文完成之际,请允许我向您致以诚挚
的敬意!
感谢法国国立鲁昂应用科学学院(INSA-Rouen University)每一位辛勤的工作人员,感
谢你们曾经的帮助;感谢 LSPC(Laboratoire de Sécurité des Procédés Chimiques)大家庭
的每一位优秀的成员:Béchara TAOUK,Lamia VERNIÈRES-HASSIMI,Lionel ESTEL, Alain
LEDOUX, Lokmane ABDELOUAHED, Bruno DARONAT, Sylvie POUBELLE, Jean-pierre
HEBERT,Raphaël DELAMARE,Giovanna DELAMARE,Axelle TRUFFERT,Fatima ABID,
Pereira De Araujo Maria,Christine DEVOUGE,Jeremy DESHAIS,等等,感谢你们在这三
年半以来,在学习和生活中对我的关心、鼓励和帮助。感谢 PBS( Laboratoire
Polymères Biopolymères Surface)实验室的 Nasreddine KÉBIR 提供的核磁分析帮助。
感谢芬兰奥博学术大学 Johan Gadolin 化学工艺中心(Johan Gadolin Process Chemistry
Center)的 Tapio Salmi 教授邀请并提供宝贵的学习的机会,使得我的专业知识和技能得
到了进一步充实。感谢该部门每一位同事:Pasi TOLVANEN,Pasi VIRTANEN,Kari
ERÄNEN, Jani RAHKILA,Narendra KUMA,Adrianna FREITES AGUILERA,Soudabeh SAEED,
Leolincoln CORREIA,等等,感谢你们的热情和帮助。
XIV
再次感谢 LSPC 部门的所有优秀的博士生们,Junliu ZHENG,Vivianna CONTRAS,Nassima
BENAMARA,Chetna MOHABEER,Emmanuelle VIARD,Yanjun WANG,Marie DÉCULTOT,
Xiaojia LU,Elizabeth GARCÍA HERNANDEZ,Wander PEREZ SENA,Jundong WANG,Lilivet
UBIERA RUIZ,Luis CÉSAR REYES,等等。在这三年半时间里我们欢笑与共,谢谢大家使
我的异国学习生活多姿多彩。同时,感谢一直支持和陪伴我的朋友们,刘媛,赵宇辉,
刘璐璐,成永帅,等等,谢谢你们一直以来的陪伴和守候。求学之路,能遇到大家,
是我莫大的幸运!
感谢我的研究生导师,武汉轻工大学何静仁教授在科研道路上的指引和鼓励,感谢祝
振洲老师在出国申请以及面试期间不遗余力的帮助和指导,使得我有机会能够去看看
外面的世界,开阔了我的眼界。感谢实验室所有的同事,段李歌,邝敏杰,杨宁,张
胜文,等等。谢谢你们的鼓励和支持。
感谢审阅过所有发表论文的审稿人,特别感谢参与此次毕业答辩的所有评委:Michel
Cabassud, Jean-Marc Commenge, Hudebine Damien, Valeria Casson Moreno, Françoise
Maugé, 非常感谢您在百忙之中前来参加我的毕业答辩,以及对论文提出的宝贵意见。
感谢我的父母和家人,感谢你们的默默的支持和陪伴,伴我走过了这么多年漫长求学
历程。你们永远是我生活和学习的最大动力,
最后,再次向所有关心和帮助我的人致以诚挚的感谢和永远的祝福。
蔡小双
2019 年 3 月
于法国,鲁昂
XV
Abstract
Nowadays, biomass and carbon dioxide valorization are considered as a helpful solution to
the environmental issues of global warming and the depletion of petroleum reserves. Thus,
vegetable oils have attracted increasing attention of academic and industrial communities, as
one of the potential renewable biomass that can be applied to the production of fossil
substitute for sustainable development, owning to their advantages of renewable, sustainable,
biodegradable, and universally available with huge feedstock. Among decades of researches,
epoxidation and carbonation processes are two popular application methods for vegetable oil
valorization.
The conversion of vegetable oils into epoxidized ones is defined by a conversion of
unsaturated compound into an epoxide group. So far, the potential application for the
production of epoxidized oil in the industrial is the Prileschajew oxidation, which is a well-
known conventional way to be used as the commercial production process. This type of
epoxidation uses percarboxylic acid as an oxygen carrier, which is formed in situ in the
aqueous phase, and then epoxidize the unsaturated groups on the vegetable oils into epoxide
groups. During the process, however, this method presents side reaction of ring-opening of
the epoxide group. Therefore, the selective epoxidation process conditions need to be
optimized in order to minimize the ring-opening reactions. In this study, process parameters
including the concentration of acid catalyst (sulfuric acid), reactants (water, epoxide group,
hydrogen peroxide, acetic acid) and the reaction temperature have been discussed for the
epoxidation and ring opening of vegetable oils. During the kinetic modeling stage, the related
kinetic constants for the ring opening reactions were estimated. Based on this model, the ring
opening by acetic and peracetic acids was found to be faster than by water and hydrogen
peroxide. A semibatch reactor, where hydrogen peroxide and sulfuric acid were added, was
found to be the most suitable configuration.
To determine the optimum operating conditions and scale up the epoxidation or carbonation
processes, it requires the database of different physicochemical properties, i.e. viscosity,
density, refractive index, or specific heat capacity and the evolutions of these properties with
the temperature. However, this information is absent in the literature. For this study, the
evolution of these properties with temperature and compositions (double bond, epoxide and
carbonated groups concentration) was determined for three vegetable oils and their
XVI
corresponding epoxidized and carbonated forms (cottonseed oil, linseed oil and soybean oil).
Density and refractive indices of these oils were found to vary linearly with temperature.
Based on the measurement of changes in viscous stresses with shear rates, these oils were
found to be Newtonian fluids. It was demonstrated that specific heat capacity follows a
polynomial equation of second order with temperature. Based on these results, it was
demonstrated that some correlations could be used to predict the evolutions of these
physicochemical properties at different composition and temperature based on the
knowledge of the property of the pure compounds.
Carbonation of epoxidized vegetable oil is a promising way to prepare bio-based polyols for
the production of polyurethane by non-isocyanate route. To promote the use of these
feedstocks in industrial scale, kinetic and thermodynamic data are needed for better energy
integration and cost optimization. The kinetics of the carbonation of epoxidized cottonseed
oil by tetra-n-butylammonium bromide, a homogeneous catalyst, was studied. Reaction
parameters, i.e. reaction temperature (110-140°C), reaction pressure (20-50 bar),
concentration of catalyst (0.06-0.30mol.L-1) and epoxides (1.67-3.80mol.L-1) were investigated.
A kinetic model was developed and the rate constant and activation energy were estimated.
The reliability of the kinetic constants was further verified by using Markov chain Monte Carlo
method.
In order to investigate the correlation between the reactivities of vegetable oil and its fatty
acid building-blocks concerning carbonation reaction, we have compared the kinetics of
carbonationof epoxidized cottonseed oil (ECSO) and its epoxidized fatty acid methyl ester
(EFAME). Mass transfer and physicochemical properties of these reactions were determined
and further applied to estimate the intrinsic rate constants during the kinetic modeling stage.
Epoxidized fatty acid methyl ester was found to have higher carbonation reactivity than the
one of epoxidized vegetable oil. The rate constant of carbonation of fatty acid methyl ester
was estimated to be 1.4 times higher than the one of ECSO. A linear relationship between the
carbonation rate constant of epoxidized vegetable oil and its fatty acid methyl ester with
temperature was found.
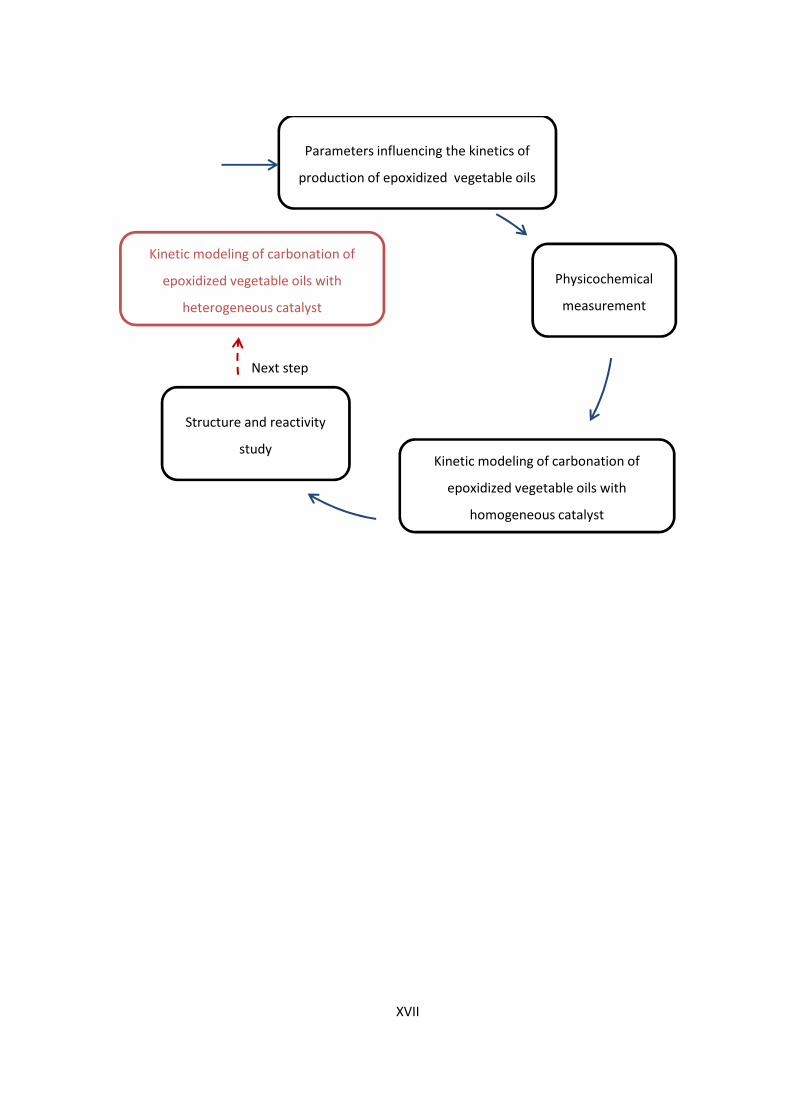
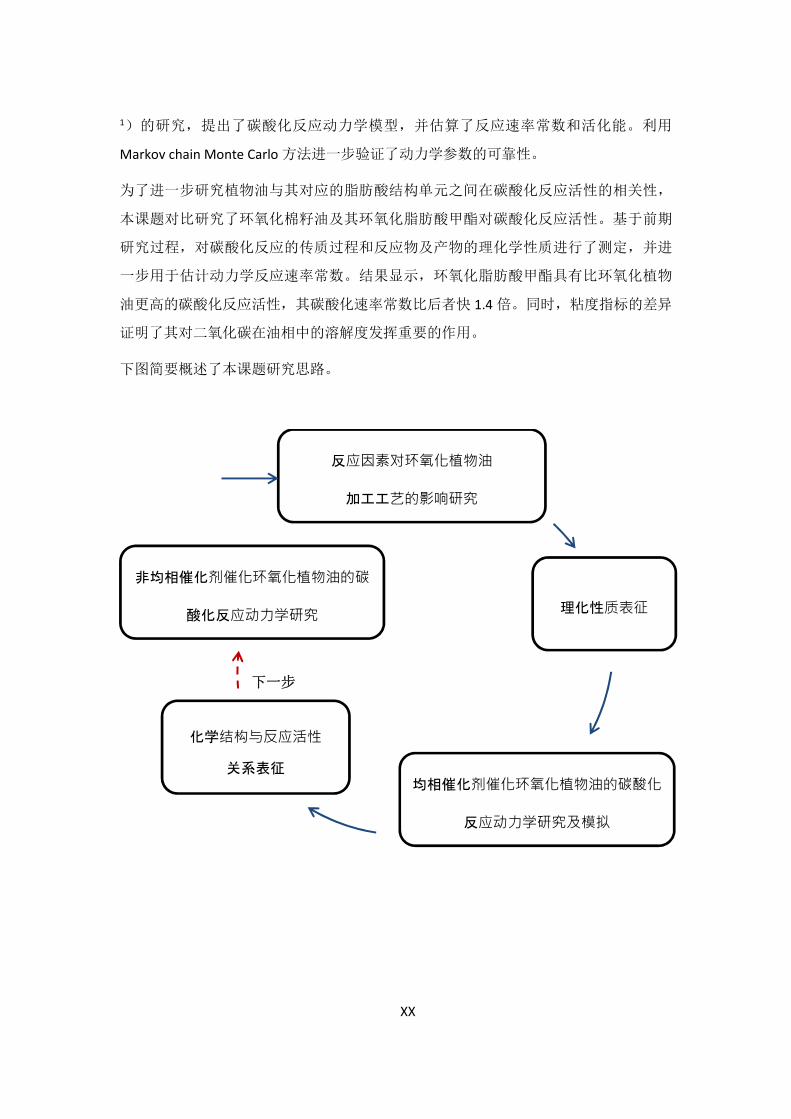
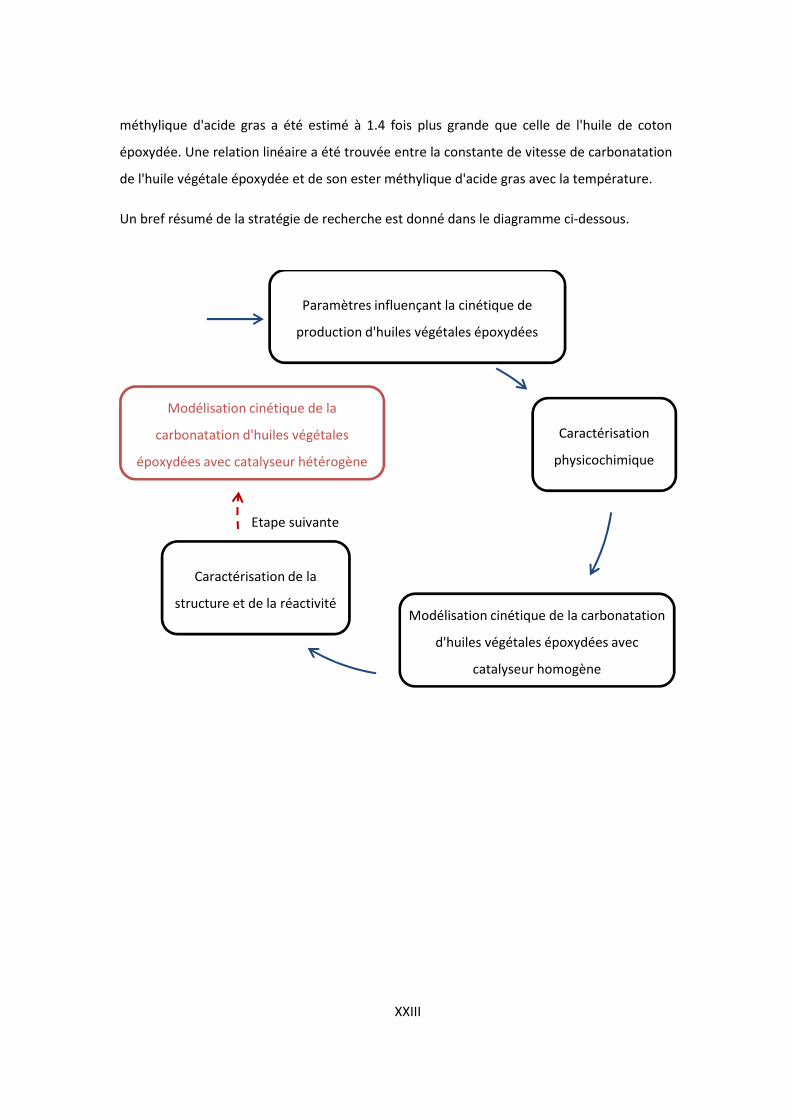
A brief summary of the research strategy is given in the diagram below.
XVII
Parameters influencing the kinetics of
production of epoxidized vegetable oils
Physicochemical
measurement
Kinetic modeling of carbonation of
epoxidized vegetable oils with
homogeneous catalyst
Structure and reactivity
study
Kinetic modeling of carbonation of
epoxidized vegetable oils with
heterogeneous catalyst
Next step

XVIII
XIX
摘 要
当前,生物质和二氧化碳的废物利用被认为是解决全球变暖和石油储备枯竭的环境问
题的有效方法之一。作为潜在的可再生的生物质之一,植物油可用于生产可持续发展
的化石替代品。因其具有可再生,可持续,可生物降解特性以及储量巨大且普遍可用
的优势,因此越来越受到学术界和工业界的关注。在过去数十年的研究中,环氧化和
碳酸化过程是植物油的两种常用应用方法。
Prileschajew 环氧化过程是目前常规的商业生产环氧化植物油的方法。该方法以在水相
中原位生成的过氧羧酸为氧载体,将植物油的不饱和基团氧化成环氧基团。但是,该
方法的缺点是环氧化过程中存在环氧基团开环的副反应,在一定程度上会降低环氧化
反应的效率。因此,有必要对环氧化工艺条件进行选择性优化以降低开环副反应。因
此,该课题研究了环氧化工艺参数,包括酸催化剂(硫酸)的浓度,反应物浓度(水,
环氧基团,过氧化氢,乙酸)和反应温度,对环氧化和开环反应的影响。在此基础上,
建立反应动力学模型,模拟开环反应的过程并评估相关动力学常数。结果表明,乙酸
和过乙酸的开环速度比水和过氧化氢快, 而且,通过加入过氧化氢和硫酸的半间歇反
应方式是最合适环氧化过程。
为了进一步确定最佳的环氧化植物油加工工艺条件且其实现规模化生产,需要不同植
物油的理化性质的数据库,即充分了解粘度,密度,折射率,比热容以及这些数据随
温度的变化情况,等等。然而,相关的数据尚且需要补充和完善。鉴于此,本论文初
步选择了三种主要植物油(棉籽油,亚麻子油和大豆油)作为研究对象,对这些理化
性质随着温度和官能团组分(双键,环氧化基团,碳酸化基团)的变化进行测定和模
拟。结果表明,以牛顿流体形式存在的油样,其密度和折射率随温度呈现线性变化,
而粘度与温度则为指数函数关系。与此同时,比热容与参考温度下的比热容的比率和
温度遵循二阶多项式方程关系。该研究结果为进一步通过相关性来预测理化学性质在
不同组成和温度下的演变提供了参考性依据。
环氧化植物油的碳酸化是制备生物基多元醇的最具前景的方法。该产物可以进一步通
过非异氰酸酯途径生产聚氨酯。为了促进环氧化植物油的工业规模碳酸化的过程,同
样需要相关动力学和热力学数据,以实现更好的能源一体化和优化生产成本。因此,
本课题以环氧化棉籽油为代表,采用四丁基溴化铵作为均相催化剂,研究了在均相催
化剂催化作用下的碳酸化动力学。根据对碳酸化反应参数,即反应温度(110-140℃),
反应压力(20-50bar),催化剂浓度(0.06-0.30mol.L-1)和环氧基浓度(1.67-3.80mol.L-
XX
1)的研究,提出了碳酸化反应动力学模型,并估算了反应速率常数和活化能。利用
Markov chain Monte Carlo 方法进一步验证了动力学参数的可靠性。
为了进一步研究植物油与其对应的脂肪酸结构单元之间在碳酸化反应活性的相关性,
本课题对比研究了环氧化棉籽油及其环氧化脂肪酸甲酯对碳酸化反应活性。基于前期
研究过程,对碳酸化反应的传质过程和反应物及产物的理化学性质进行了测定,并进
一步用于估计动力学反应速率常数。结果显示,环氧化脂肪酸甲酯具有比环氧化植物
油更高的碳酸化反应活性,其碳酸化速率常数比后者快 1.4 倍。同时,粘度指标的差异
证明了其对二氧化碳在油相中的溶解度发挥重要的作用。
下图简要概述了本课题研究思路。
反应因素对环氧化植物油
加工工艺的影响研究
理化性质表征
均相催化剂催化环氧化植物油的碳酸化
反应动力学研究及模拟
化学结构与反应活性
关系表征
非均相催化剂催化环氧化植物油的碳
酸化反应动力学研究
下一步
XXI
Résumé
La valorisation de la biomasse et du dioxyde de carbone est à présent considérée comme une
solution aux problèmes environnementaux du réchauffement climatique et l'épuisement des
réserves de pétrole. Ainsi, les huiles végétales ont attiré l'attention croissante des milieux
universitaires et industriels, comme une source de biomasse potentielle renouvelable qui peut
être appliquée à la production de substitut fossile pour un développement durable, due à
leurs caractères renouvelables, durables, biodégradables. De plus, cette biomasse est
disponible avec une énorme quantité. Durant des décennies de recherches, les processus
d'époxydation et de carbonatation sont deux méthodes d'application populaires pour la
valorisation des huiles végétales.
La conversion des huiles végétales en huiles époxydées est définie par une conversion d'un
composé insaturé en un groupe époxyde. Jusqu'ici, l'oxydation de Prileschajew est la
méthode de synthèse plus efficace pour la possible industrialisation du processu
d’époxydation de huiles végétales, qui est une manière conventionnelle bien connue à utiliser
comme processus de production commerciale. Ce type d’époxydation utilise l’acide
percarboxylique comme transporteur d’oxygène qui est formé in situ dans la phase aqueuse,
et ensuite époxyde les groupes insaturés des huiles végétales en groupes époxyde. Cependant,
cette méthode présente une réaction secondaire d’ouverture du cycle du groupe époxyde au
cours du processus. Donc, les conditions du procédé d'époxydation doivent être optimisées
afin de minimiser les réactions d'ouverture de cycle. Des paramètres de réaction, y compris la
concentration en catalyseur acide (acide sulfurique), réactifs (eau, groupe époxyde, peroxyde
d'hydrogène, acide acétique) et la température de réaction, ont été discutés dans cette étude
pour l'époxydation et réaction d’ouverture de cycle des huiles végétales. Au cours de la
modélisation cinétique, les constantes cinétiques associées pour les réactions d'ouverture du
cycle ont été estimées. En se basant sur ce modèle, les réactions d'ouverture du cycle époxyde
par les acides acétique et peracétique sont plus rapides que celles de l'eau et du peroxyde
d'hydrogène. Un réacteur en mode semi-fermé, avec addition du peroxyde d'hydrogène et de
l'acide sulfurique, est la configuration la plus appropriée pour la production d’huiles végétales
époxydées.
Pour déterminer les conditions optimales et passer à échelle industrielle dans les procédés
d’époxydation et de la carbonation, il faut connaître différentes propriétés physicochimiques
XXII
telles que la viscosité, la densité, l'indice de réfraction, la capacité thermique spécifique et les
évolutions de ces données avec la température. Cependant, aucune information sur ces
propriétés est disponible dans la littérature. Pour cette étude, l'évolution de ces propriétés
ont été déterminées pour trois huiles végétales et leurs dérivés époxydées et carbonates
(l'huile de coton, l'huile de lin et l'huile de soja) avec la température et leur composition. La
densité et l'indice de réfraction ont été trouvé linéairement dépendant de la température
pour les huiles étudiées. La relation entre la contrainte de cisaillement et le taux de
cisaillement dans l’étude de viscosité, indique que ces huiles sont des fluides newtoniens. Il a
été démontré que la capacité thermique spécifique suit une équation polynomiale du second
ordre avec la température.
Sur la base de ces résultats, il a été démontré que certaines corrélations pourraient être
utilisées pour prédire les évolutions de ces propriétés physicochimiques à différentes
compositions et températures.
Carbonation de l'huile végétale époxydée est une méthode prometteuse pour préparer des
polyols biosourcés et ensuite appliquée à la production de polyuréthane par méthode non-
isocyanate. Pour promouvoir l'utilisation de ces matières premières dans l'industrie, les
données cinétiques et thermodynamiques sont nécessaires pour une meilleure intégration
énergétique et une optimisation des coûts. Un etude cinétique de la carbonatation de l'huile
de coton époxydée a été mené en presence d’un catalyseur homogène: le bromure de tétran-
n-butylammonium. Des paramètres de réaction comme la température de réaction (110-
140 °C), la pression de réaction (20-50 bars), la concentration de catalyseur (0.06- 0.30mol.L-
1) et d'époxydes (1.67-3.80 mol.L-1) ont été étudiés. Un modèle cinétique a été proposé. La
constante cinétique et l'énergie d'activation ont été estimées. La fiabilité des paramètres
cinétiques a ensuite été vérifiée en utilisant la méthode de Monte Carlo à chaîne de Markov.
Afin d'étudier la corrélation entre la réactivité d'huile végétale et sa forme estérifiée par le
méthanol, nous avons comparé la réactivité de carbonatation de l'huile de coton époxydée et
de son ester méthylique d'acide gras époxydé. Transfert de masse et propriétés
physicochimiques de ces réactions ont été déterminés, et ensuite, appliqué pour estimer les
constantes cinétiques intrinsèques pendant la phase de modélisation cinétique. L'ester
méthylique d'acide gras époxydé s'est avéré avoir une réactivité de carbonatation supérieure
à celle de l'huile végétale époxydée. La constante de vitesse de carbonatation de l'ester
XXIII
méthylique d'acide gras a été estimé à 1.4 fois plus grande que celle de l'huile de coton
époxydée. Une relation linéaire a été trouvée entre la constante de vitesse de carbonatation
de l'huile végétale époxydée et de son ester méthylique d'acide gras avec la température.
Un bref résumé de la stratégie de recherche est donné dans le diagramme ci-dessous.
Paramètres influençant la cinétique de
production d'huiles végétales époxydées
Caractérisation
physicochimique
Modélisation cinétique de la carbonatation
d'huiles végétales époxydées avec
catalyseur homogène
Caractérisation de la
structure et de la réactivité
Modélisation cinétique de la
carbonatation d'huiles végétales
époxydées avec catalyseur hétérogène
Etape suivante

XXIV
XXV
LIST OF PUBLICATIONS
The thesis consists of the following publications, which are referred in the doctor thesis.
I. X. Cai, J.L. Zheng, J. Wärnå, T. Salmi, B. Taouk, S. Leveneur. Influence of gas-liquid mass
transfer on kinetic modeling: Carbonation of epoxidized vegetable oils. Chemical Engineering
Journal, 313(2017) 1168-1183.
Contribution: X. Cai has conducted all the experiments and participated to write the article.
II. X. Cai, K. Ait Aissa, L. Estel, S. Leveneur. Investigation of the Physicochemical Properties for
Vegetable Oils and Their Epoxidized and Carbonated Derivatives. Journal of Chemical &
Engineering Data, 63(2018) 1524-1533.
Contribution: X. Cai has contributed to build the research plan, has conducted all the
experiments, participated to write the major part of the article and has edited the article
manuscript.
III. X. Cai, J.L. Zheng, A.F. Aguilera, L. Vernières-Hassimi, P. Tolvanen, T. Salmi, S. Leveneur.
Influence of ring-opening reactions on the kinetics of cottonseed oil epoxidation. International
Journal of Chemical Kinetics, 2018, 1–16.
Contribution: X. Cai has actively participated to build the research plan and conducted all the
experiments, has participated to write the major part of the article and edited the article
manuscript.
IV. X. Cai, M. Matos, S. Leveneur. Structure-reactivity: comparison between the carbonation
of epoxidized vegetable oils and the corresponding epoxidized fatty acid methyl ester.
Industrial & Engineering Chemistry Research, 2019.
Contribution: X. Cai has actively participated to build the research plan, has conducted and
supervised (M. Matos) all the experiments, has actively participated to the kinetic model, has
written the article and has edited the article manuscript.
OTHER PUBLICATIONS RELATED TO THE TOPIC
1. W.Y. Pérez-Sena, X. Cai, N. Kebir, L. Vernières-Hassimi, C. Serra, T. Salmi, S. Leveneur.
Aminolysis of cyclic-carbonate vegetable oils as a non-isocyanate route for the synthesis of
polyurethane: A kinetic and thermal study. Chemical Engineering Journal, 346(2018) 271-280.
2. X. Cai, J.L. Zheng, J. Wärnå, T. Salmi, B. Taouk, S. Leveneur, ‘Influence of gas-liquid mass
transfer on kinetic modeling: Carbonation of epoxidized vegetable oils’, 10th International
XXVI
Symposium on Catalysis in Multiphase Reactors (CAMURE-10) & 9th International symposium
on Multifunctional Reactors (ISMR-9), July 7th-10th, 2017, Qingdao, China, oral presentation.
3. X. Cai, J.L. Zheng, J. Wärnå, T. Salmi, B. Taouk, S. Leveneur, ‘Biomass and CO2 valorization:
Epoxidation and Carbonation of vegetable oils’, 10th World Congress of Chemical Engineering,
October 1th-5th, 2017, Barcelona, Spain, oral presentation.
4. W.Y. Pérez-Sena, X. Cai, N. Kebir, L. Vernières-Hassimi, C. Serra, T. Salmi, S. Leveneur,
‘Development of a kinetic model for polyurethanization from carbonated vegetable oils’
Proceedings of the 25th International Conference on Chemical Reaction Engineering (ISCRE25),
May 20th-23th, 2018, Florence, Italy, poster.
5. X. Cai, S. Leveneur, J.L. Zheng, A.F. Aguilera, P. Tolvanen, T. Salmi. ‘Carbonation of vegetable
oils - a modelling approach‘ Making Boundaries Malleable: Advancing Reaction Engineering
through New Materials, Unique Chemistries and Advanced Computation (NASCRE 4), March
10th-13th, 2019, Houston Texas, U.S.A., oral presentation.
Résumé étendu de la thèse
Production d'huiles Végétales Carbonées: Modélisation
Cinétique par un Approche de Structure-Réactivité
Projet réalisé d'octobre 2015 à mars 2019
Sous la direction et la supervision de Sébastien LEVENEUR
Présenté le 12 mars 2019
Par Xiaoshuang CAI
Doctorant au Laboratoire de sécurité des procédés chimiques
INSA-ROUEN NOMANDIE

Contenu
1. Introduction .......................................................................................................................................... i
2. Objectif ................................................................................................................................................. i
3. Résultats et Discussion .........................................................................................................................ii
3.1 Influence des reactions d'ouverture du cycle oxirane sur la cinétique de l'époxydation d’huile
de coton biologique ..............................................................................................................................ii
3.1.1 Expériences d'étude cinétique ................................................................................................ii
3.1.2 Modélisation cinétique ............................................................................................................ii
3.2 Interactions entre groupes fonctionnels et propriétés physicochimiques: une application pour
huiles végétales et les formes modifiées (huiles végétales époxydées et carbonnées) .................... vii
3.2.1 Indice de réfraction ............................................................................................................... vii
3.2.2 Masse volumique .................................................................................................................. vii
3.2.3 Viscosité ................................................................................................................................. vii
3.2.4 Capacité calorifique spécifique ............................................................................................. vii
3.2.5 Effets des groupes fonctionnels sur les propriétés physico-chimiques ............................... viii
3.3 Carbonatation des huiles végétales époxydées ........................................................................... xii
3.3.1 Étude cinétique de la réaction carbonatation ....................................................................... xii
3.3.2 Étude de transfert de masse de CO2 .................................................................................... xvi
3.3.3 Modèle cinétique ................................................................................................................ xxii
3.4 Structure et réactivité: la comparaison entre l’huiles végétales et esters méthyliques d'huiles
végétales.......................................................................................................................................... xxiv
3.4.1 Comparaison des propriétés physico-chimiques ............................................................... xxiv
3.4.2 Comparaison du transfert en masse .................................................................................. xxvi
3.4.3 Comparaison de cinétiques ............................................................................................... xxvii
4. Conclusion ....................................................................................................................................... xxix
Référence ............................................................................................................................................ xxxi
i
1. Introduction
Dans la première section de ce travail, des études cinétiques de l'époxydation et d'ouverture du cycle
oxirane ont été effectués pour optimiser la production d'huile de coton époxydée. L'époxydation
d'huile de coton par l'acide peracétique a été étudiée dans un réacteur discontinu. Les constantes
cinétiques pour la réaction d'ouverture du cycle oxirane par l'eau, peroxyde d'hydrogène, acide
acétique et acide peracétique ont été estimées. Une stratégie adéquate de modélisation pour
l'ouverture du cycle oxirane a été bien développé.
Dans la deuxième section, propriétés physicochimiques (viscosité, masse volumique, indice réfraction,
capacité calorifique spécifique) ont été mesuré pour trois huiles végétales (huile de soja et de coton et
de lin) et des formes modifiées. Des solutions d'huile végétale frais, d’huiles végétales époxydées et
d'huiles végétales carbonées ont été synthétisées afin d’évaluer l'effet des groupes de fonctionnel. Il a
pu être montré que la masse volumique et l’indice de réfraction de ces huiles varie linéairement avec
la température. La viscosité de ces huiles, dont se sont révélés des fluides newtoniens, suit une
fonction exponentielle de la température.
Puis, la cinétique de la carbonatation d’huiles végétales époxydées a été exploré afin de déterminer
l’effet des différents paramètres de la réaction, comme la pression, la température et la concentration
du groupe époxyde. En plus, un modèle cinétique, y compris le transfert massique pour le
carbonatation d’huiles végétales époxydées, a été construit.
Dénièrent, des huiles végétales et leurs ester méthylique ont été sélectionnée comme sujet de
recherche pour faire une enquête de la relation entre la structure et la réactivité chimique dans des
réactions de carbonatation. La relation entre les constantes cinétiques de deux substances différents
en structure dans la réaction de carbonatation ont estimées en tenant en compte les propriétés
physicochimiques et les paramètres de transfert de masse.
2. Objectif
Cette thèse doctorale est centrée sur les réactions d'époxydation et carbonatation des huiles végétales.
L'objectif de ce travail a été divisé en quatre parties:
1) Une étude cinétique de l'époxydation et l'ouverture du cycle oxirane d'huile végétale;
2) Une enquête préliminaire sur les propriétés physicochimiques des huiles végétales (huile de
soja, de coton et de lin) et leurs formes modifiées (huiles végétales époxydées et carbonnées).
ii
3) Une étude cinétique de la carbonatation des huiles végétales époxydées avec un catalyseur
homogène, à savoir bromure de tétra-n-butylammonium (TBABr);
4) Une étude de la relation entre la structure et la réactivité chimique dans la réaction de
carbonatation des huiles végétales et leurs ester méthylique.
3. Résultats et Discussion
3.1 Influence des reactions d'ouverture du cycle oxirane sur les cinétiques de l'époxydation d’huile
de de coton biologique
L'époxydation d'huile de coton par l'acide peracétique a été étudiée dans un réacteur discontinu. En
développant une stratégie de modélisation appropriée, les constantes cinétiques pour la réaction
d'ouverture du cycle oxirane par l'eau, peroxyde d'hydrogène, acide acétique et acide peracétique ont
été estimées. Le principal objectif de ce travail est de minimiser les réactions secondaires à réaction
d'ouverture du cycle oxirane, pour trouver la configuration du réacteur qui convient le mieux. Le
présent travail fournit une base pour l'optimisation de technique du traitement d’époxydes à l'avenir.
Ce chapitre est divisé en trois parties: étude cinétique pour l'ouverture du cycle oxirane, modélisation
cinétique et la discussion du les distributions de produits d'ouverture du cycle oxirane.
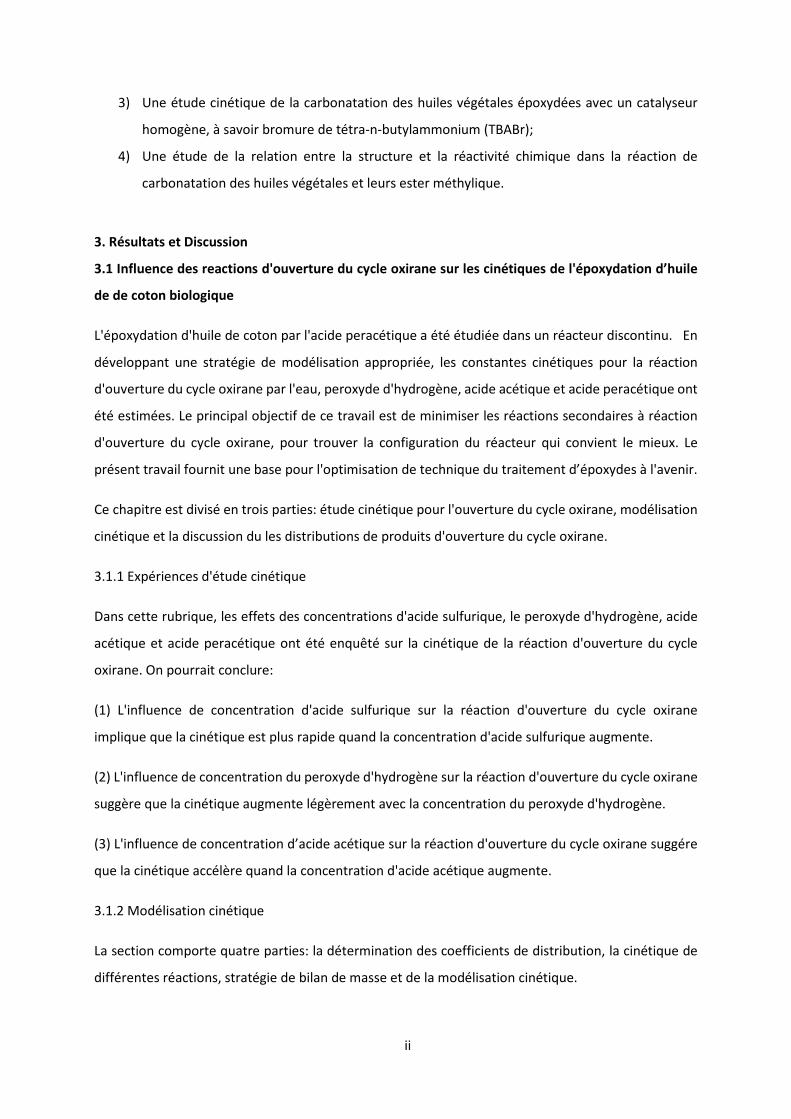
3.1.1 Expériences d'étude cinétique
Dans cette rubrique, les effets des concentrations d'acide sulfurique, le peroxyde d'hydrogène, acide
acétique et acide peracétique ont été enquêté sur la cinétique de la réaction d'ouverture du cycle
oxirane. On pourrait conclure:
(1) L'influence de concentration d'acide sulfurique sur la réaction d'ouverture du cycle oxirane
implique que la cinétique est plus rapide quand la concentration d'acide sulfurique augmente.
(2) L'influence de concentration du peroxyde d'hydrogène sur la réaction d'ouverture du cycle oxirane
suggère que la cinétique augmente légèrement avec la concentration du peroxyde d'hydrogène.
(3) L'influence de concentration d’acide acétique sur la réaction d'ouverture du cycle oxirane suggére
que la cinétique accélère quand la concentration d'acide acétique augmente.
3.1.2 Modélisation cinétique
La section comporte quatre parties: la détermination des coefficients de distribution, la cinétique de
différentes réactions, stratégie de bilan de masse et de la modélisation cinétique.
iii
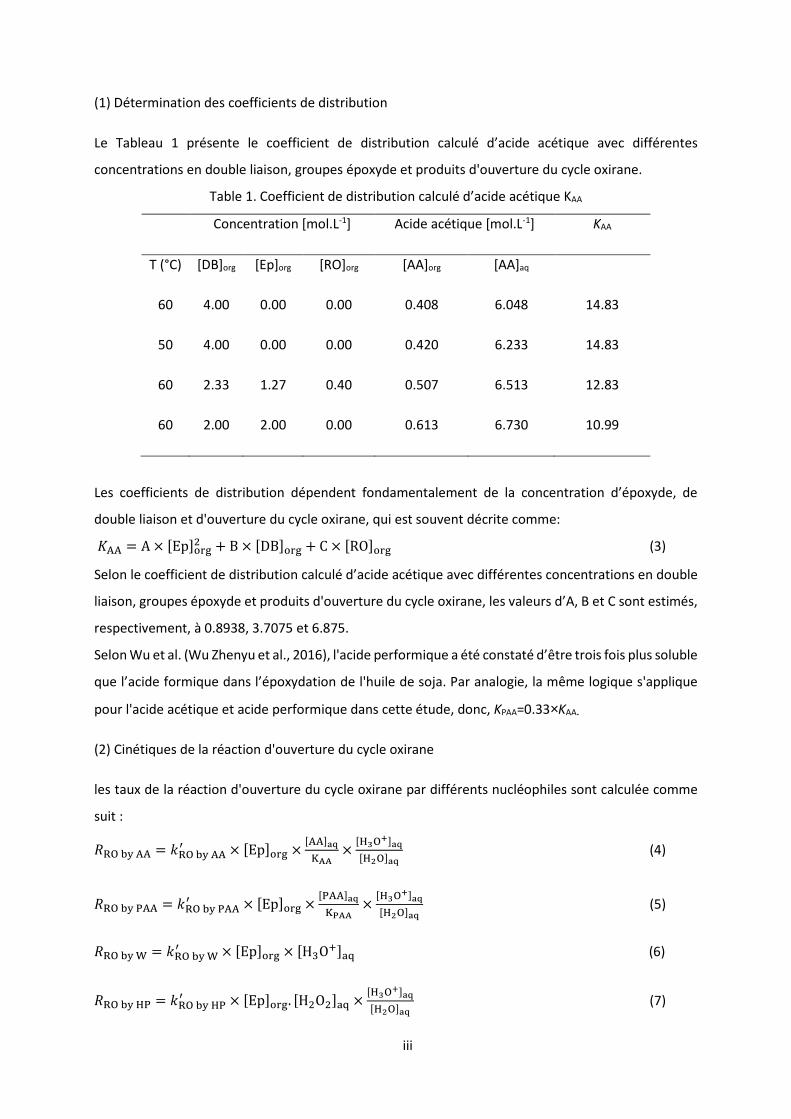
(1) Détermination des coefficients de distribution
Le Tableau 1 présente le coefficient de distribution calculé d’acide acétique avec différentes
concentrations en double liaison, groupes époxyde et produits d'ouverture du cycle oxirane.
Table 1. Coefficient de distribution calculé d’acide acétique KAA
Concentration [mol.L-1] Acide acétique [mol.L-1] KAA
T (°C) [DB]org [Ep]org [RO]org [AA]org [AA]aq
60 4.00 0.00 0.00 0.408 6.048 14.83
50 4.00 0.00 0.00 0.420 6.233 14.83
60 2.33 1.27 0.40 0.507 6.513 12.83
60 2.00 2.00 0.00 0.613 6.730 10.99
Les coefficients de distribution dépendent fondamentalement de la concentration d’époxyde, de
double liaison et d'ouverture du cycle oxirane, qui est souvent décrite comme:
��� = A × �Ep�� + B × �DB�� + C × �RO�� (3)
Selon le coefficient de distribution calculé d’acide acétique avec différentes concentrations en double
liaison, groupes époxyde et produits d'ouverture du cycle oxirane, les valeurs d’A, B et C sont estimés,
respectivement, à 0.8938, 3.7075 et 6.875.
Selon Wu et al. (Wu Zhenyu et al., 2016), l'acide performique a été constaté d’être trois fois plus soluble
que l’acide formique dans l’époxydation de l'huile de soja. Par analogie, la même logique s'applique
pour l'acide acétique et acide performique dans cette étude, donc, KPAA=0.33×KAA.
(2) Cinétiques de la réaction d'ouverture du cycle oxirane
les taux de la réaction d'ouverture du cycle oxirane par différents nucléophiles sont calculée comme
suit :
������� = �������� × �Ep�� × �������� × � !�"��� #��� (4)
�����$�� = �����$��� × �Ep�� × �$�����%�� × � !�"��� #��� (5)
�����& = �����&� × �Ep�� × �H(O)*+ (6)
����� $ = ����� $� × �Ep��. �H O *+ × � !�"��� #��� (7)
iv
ici que, �������� , �����$��� , �����&� et ����� $� sont égaux à."/.0/ . 12#312!3" , ."/.0/ . 12#312!3" ,
."/.0/ . 12#312!3" . 415 et ."/.0/ . 12#312!3" . 412%, respectivement.
Selon Leveneur et al. (Leveneur et al., 2008), la concentration d'ions d'hydroxonium peut être estimer
à partir des concentrations d’acide acétique et d'acide sulfurique, comme :
�H(O)*+ = 4 × �H SO7*+ +8� #9�:��#7 + 2 × �<<= × �H SO7*+ × �W*+ + �??@ABCC.= × �AA*+ × �W*+ (8)
ici que, �<<= est la deuxième dissociation de l'acide sulfurique (Knopf et al., 2003) and �??@ABCC.= est la
dissociation de l’’acide acétique (Sue et al., 2004).
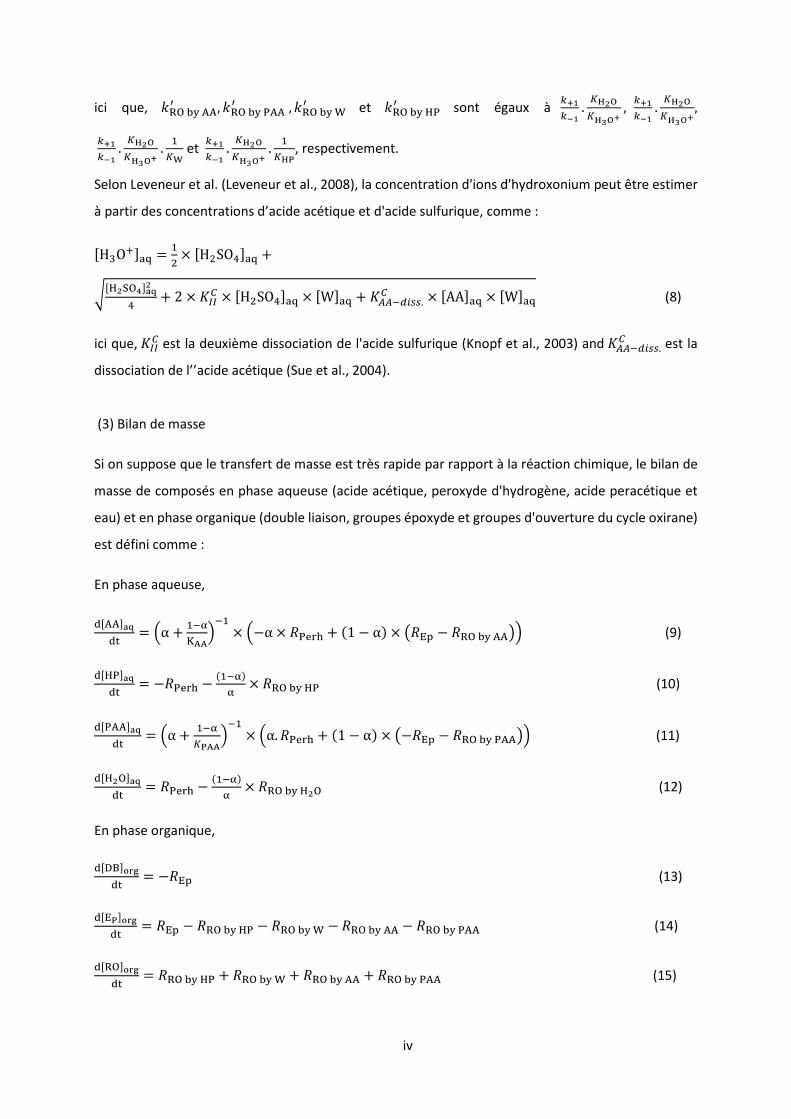
(3) Bilan de masse
Si on suppose que le transfert de masse est très rapide par rapport à la réaction chimique, le bilan de
masse de composés en phase aqueuse (acide acétique, peroxyde d'hydrogène, acide peracétique et
eau) et en phase organique (double liaison, groupes époxyde et groupes d'ouverture du cycle oxirane)
est défini comme :
En phase aqueuse,
D�����DE = Fα + 4@H���I@4 × F−α × �$K�L + M1 − αO × P�QR − �������SI (9)
D� $��DE = −�$K�L − M4@HOH × ����� $ (10)
D�$����DE = Fα + 4@H1%��I@4 × Fα.�$K�L + M1 − αO × P−�QR − �����$��SI (11)
D� #���DE = �$K�L − M4@HOH × ����� #� (12)
En phase organique,
D�TUVWXDE = −�QR (13)
D�Q%VWXDE = �QR − ����� $ − �����& − ������� − �����$�� (14)
D���VWXDE = ����� $ + �����& + ������� + �����$�� (15)
v
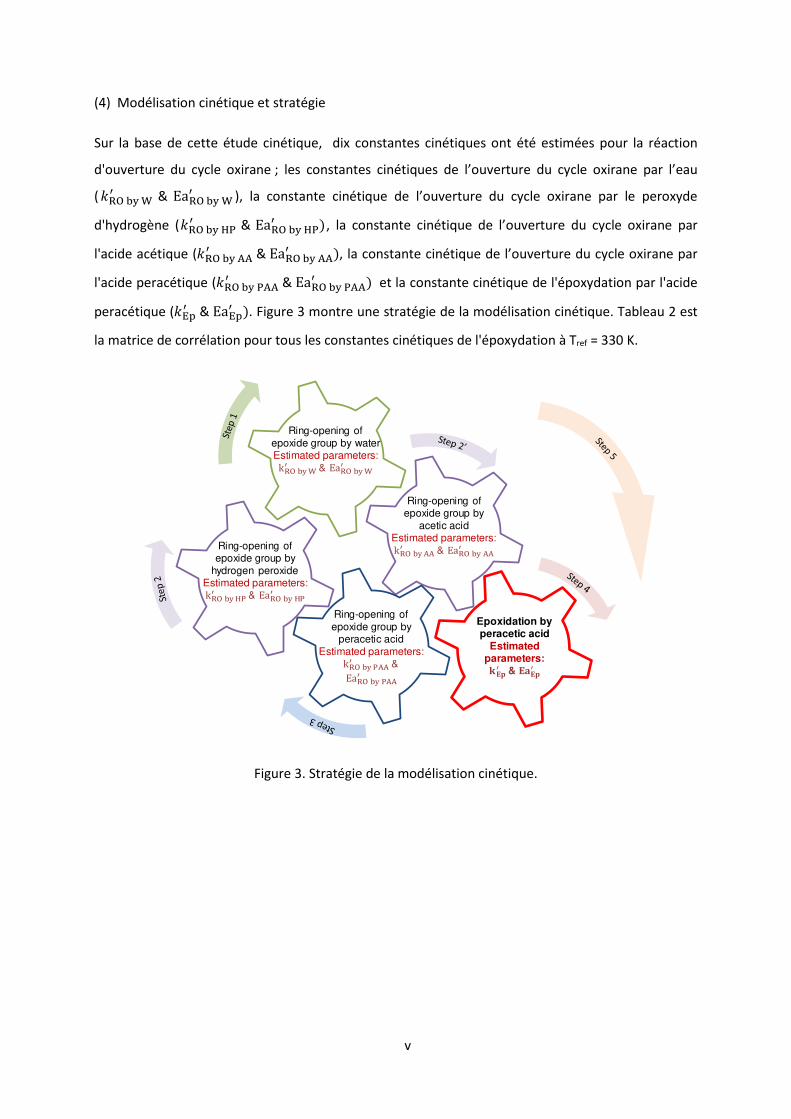
(4) Modélisation cinétique et stratégie
Sur la base de cette étude cinétique, dix constantes cinétiques ont été estimées pour la réaction
d'ouverture du cycle oxirane ; les constantes cinétiques de l’ouverture du cycle oxirane par l’eau
(�����&� & Ea����&� ), la constante cinétique de l’ouverture du cycle oxirane par le peroxyde
d'hydrogène (����� $� & Ea���� $� O, la constante cinétique de l’ouverture du cycle oxirane par
l'acide acétique (�������� & Ea������� O, la constante cinétique de l’ouverture du cycle oxirane par
l'acide peracétique (�����$��� & Ea����$��� O et la constante cinétique de l'époxydation par l'acide
peracétique (�QR� & EaQR� O. Figure 3 montre une stratégie de la modélisation cinétique. Tableau 2 est
la matrice de corrélation pour tous les constantes cinétiques de l'époxydation à Tref = 330 K.
Figure 3. Stratégie de la modélisation cinétique.
Ring-opening of epoxide group by waterEstimated parameters: k����&� & Ea����&�
Ring-opening of epoxide group by
hydrogen peroxideEstimated parameters: k���� $� & Ea���� $�
Ring-opening of epoxide group by
acetic acidEstimated parameters: k������� & Ea�������
Ring-opening of epoxide group by
peracetic acidEstimated parameters: k����$��� & Ea����$���
Epoxidation by peracetic acid
Estimated parameters: [\]� & \^\]�
vi
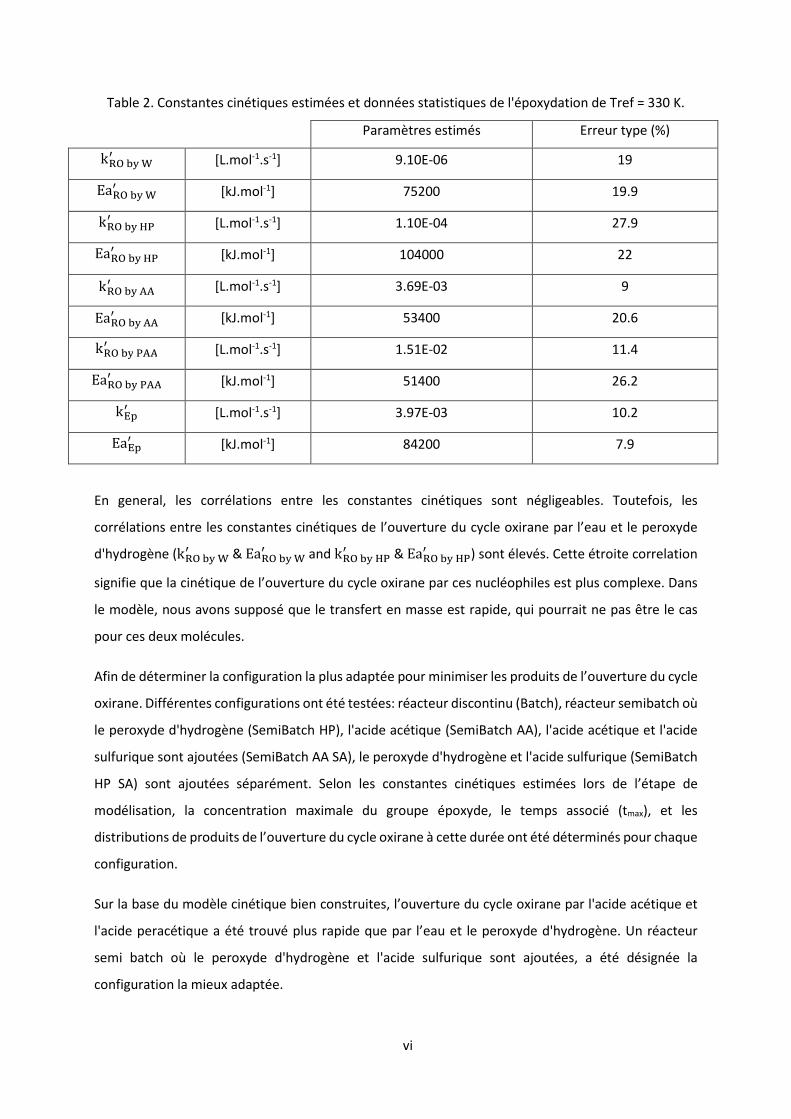
Table 2. Constantes cinétiques estimées et données statistiques de l'époxydation de Tref = 330 K.
Paramètres estimés Erreur type (%)
k����&� [L.mol-1.s-1] 9.10E-06 19
Ea����&� [kJ.mol-1] 75200 19.9
k���� $� [L.mol-1.s-1] 1.10E-04 27.9
Ea���� $� [kJ.mol-1] 104000 22
k������� [L.mol-1.s-1] 3.69E-03 9
Ea������� [kJ.mol-1] 53400 20.6
k����$��� [L.mol-1.s-1] 1.51E-02 11.4
Ea����$��� [kJ.mol-1] 51400 26.2
kQR� [L.mol-1.s-1] 3.97E-03 10.2
EaQR� [kJ.mol-1] 84200 7.9
En general, les corrélations entre les constantes cinétiques sont négligeables. Toutefois, les
corrélations entre les constantes cinétiques de l’ouverture du cycle oxirane par l’eau et le peroxyde
d'hydrogène (k����&� &Ea����&� and k���� $� &Ea���� $� ) sont élevés. Cette étroite correlation
signifie que la cinétique de l’ouverture du cycle oxirane par ces nucléophiles est plus complexe. Dans
le modèle, nous avons supposé que le transfert en masse est rapide, qui pourrait ne pas être le cas
pour ces deux molécules.
Afin de déterminer la configuration la plus adaptée pour minimiser les produits de l’ouverture du cycle
oxirane. Différentes configurations ont été testées: réacteur discontinu (Batch), réacteur semibatch où
le peroxyde d'hydrogène (SemiBatch HP), l'acide acétique (SemiBatch AA), l'acide acétique et l'acide
sulfurique sont ajoutées (SemiBatch AA SA), le peroxyde d'hydrogène et l'acide sulfurique (SemiBatch
HP SA) sont ajoutées séparément. Selon les constantes cinétiques estimées lors de l’étape de
modélisation, la concentration maximale du groupe époxyde, le temps associé (tmax), et les
distributions de produits de l’ouverture du cycle oxirane à cette durée ont été déterminés pour chaque
configuration.
Sur la base du modèle cinétique bien construites, l’ouverture du cycle oxirane par l'acide acétique et
l'acide peracétique a été trouvé plus rapide que par l’eau et le peroxyde d'hydrogène. Un réacteur
semi batch où le peroxyde d'hydrogène et l'acide sulfurique sont ajoutées, a été désignée la
configuration la mieux adaptée.
vii
3.2 Interactions entre groupes fonctionnels et propriétés physicochimiques: une application pour
huiles végétales et leurs formes modifiées (huiles végétales époxydées et carbonnées)
L'évolution des différentes propriétés physicochimiques a été examiné, comme l'indice de réfraction,
la viscosité dynamique, la masse volumique et la capacité calorifique spécifique des huiles végétales,
des huiles végétales époxydées et des huiles végétales carbonnées à différentes températures et
concentrations des groupes insaturés, époxydées et carbonnées. Trois types des huiles végétales
différents ont été sélectionnés: l'huile de coton, l'huile de lin et l'huile de soya. Afin de prédire
l'évolution de ces propriétés à différentes concentrations des groupes fonctionnels, nous avons
mesuré les propriétés physicochimiques pour différents mélanges d'huile de soja avec ses produits
dérivés (huile de soja époxydées et carbonnées).
3.2.1 Indice de réfraction
À l'évolution des l'indice de réfractiono des huiles végétales différents et de leurs dérivés époxydées
et carbonnées, il a suggéré que la valeur de l'indice de réfraction dépendent des concentrations des
liaisons doubles, groupes insaturés, époxydées et carbonnées. En effet, l'indice de réfractiono d'huile
de lin et ses dérivés sont supérieurs à l'huile de coton et l'huile de soya et ses dérivés.
3.2.2 Masse volumique
La valeur de la masse volumique s'avère être sensible aux concentrations des doubles liaisons, des
groupes époxydées et carbonnées. La masse volumique des huiles végétales est inférieure à celle de
leur formes époxydées et carbonnées. La masse volumique de l'huile de lin a été trouvée supérieure à
celle de l'huile de coton et l'huile de soya à des températures variant entre 283.15 K et 353.15 K. Cette
tendance était observée aussi pour l'espèce époxydées.
3.2.3 Viscosité
Les groupes fonctionnels exercent une forte influence sur les valeurs de viscosité. L'évolution de la
viscosité dynamique est dans l'ordre suivant : µ(huile végétale) < µ(huile végétale époxydée) < µ(huile
végétale carbonnée) a une même température. À 283.15 K, la viscosité de l'huile de lin est 80 mPa.s
si l'on compare avec celui de l'huile de coton (120 mPa.s) et l'huile de soya (100 mPa.s). La viscosité
d'huile de lin a été observée inférieur que celle des huiles de soya et de coton. De la même façon, on
a pu constater que les valeurs de viscosité augmentent considérablement quand le nombre de groupe
carbonate augmente.
3.2.4 Capacité calorifique spécifique
viii
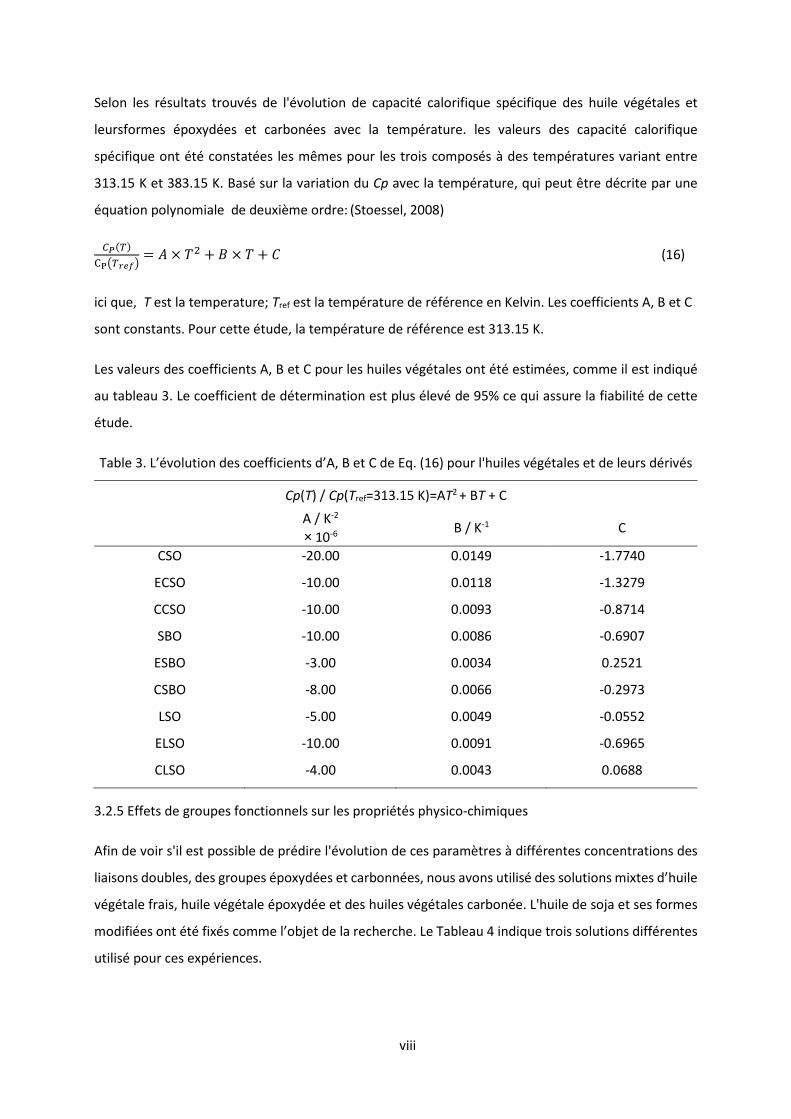
Selon les résultats trouvés de l'évolution de capacité calorifique spécifique des huile végétales et
leursformes époxydées et carbonées avec la température. les valeurs des capacité calorifique
spécifique ont été constatées les mêmes pour les trois composés à des températures variant entre
313.15 K et 383.15 K. Basé sur la variation du Cp avec la température, qui peut être décrite par une
équation polynomiale de deuxième ordre: (Stoessel, 2008)
=_M`Oa%P`bcdS = e × f +g × f + h (16)
ici que, T est la temperature; Tref est la température de référence en Kelvin. Les coefficients A, B et C
sont constants. Pour cette étude, la température de référence est 313.15 K.
Les valeurs des coefficients A, B et C pour les huiles végétales ont été estimées, comme il est indiqué
au tableau 3. Le coefficient de détermination est plus élevé de 95% ce qui assure la fiabilité de cette
étude.
Table 3. L’évolution des coefficients d’A, B et C de Eq. (16) pour l'huiles végétales et de leurs dérivés
Cp(T) / Cp(Tref=313.15 K)=AT2 + BT + C
A / K-2
× 10-6 B / K-1 C
CSO -20.00 0.0149 -1.7740
ECSO -10.00 0.0118 -1.3279
CCSO -10.00 0.0093 -0.8714
SBO -10.00 0.0086 -0.6907
ESBO -3.00 0.0034 0.2521
CSBO -8.00 0.0066 -0.2973
LSO -5.00 0.0049 -0.0552
ELSO -10.00 0.0091 -0.6965
CLSO -4.00 0.0043 0.0688
3.2.5 Effets de groupes fonctionnels sur les propriétés physico-chimiques
Afin de voir s'il est possible de prédire l'évolution de ces paramètres à différentes concentrations des
liaisons doubles, des groupes époxydées et carbonnées, nous avons utilisé des solutions mixtes d’huile
végétale frais, huile végétale époxydée et des huiles végétales carbonée. L'huile de soja et ses formes
modifiées ont été fixés comme l’objet de la recherche. Le Tableau 4 indique trois solutions différentes
utilisé pour ces expériences.
ix
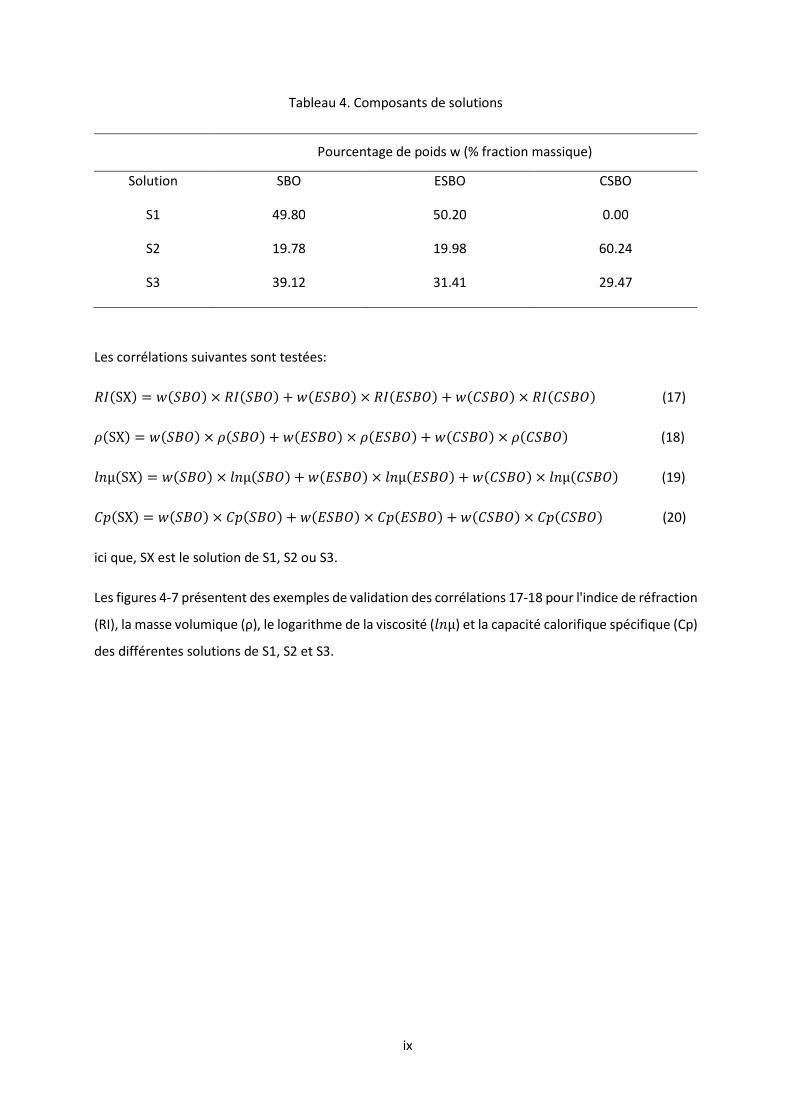
Tableau 4. Composants de solutions
Pourcentage de poids w (% fraction massique)
Solution SBO ESBO CSBO
S1 49.80 50.20 0.00
S2 19.78 19.98 60.24
S3 39.12 31.41 29.47
Les corrélations suivantes sont testées:
�iMSXO = kMlgmO × �iMlgmO + kMnlgmO × �iMnlgmO + kMhlgmO × �iMhlgmO (17)
oMSXO = kMlgmO × oMlgmO + kMnlgmO × oMnlgmO + kMhlgmO × oMhlgmO (18)
pqμMSXO = kMlgmO × pqμMlgmO + kMnlgmO × pqμMnlgmO + kMhlgmO × pqμMhlgmO (19)
hsMSXO = kMlgmO × hsMlgmO + kMnlgmO × hsMnlgmO + kMhlgmO × hsMhlgmO (20)
ici que, SX est le solution de S1, S2 ou S3.
Les figures 4-7 présentent des exemples de validation des corrélations 17-18 pour l'indice de réfraction
(RI), la masse volumique (ρ), le logarithme de la viscosité (pqμ) et la capacité calorifique spécifique (Cp)
des différentes solutions de S1, S2 et S3.
x
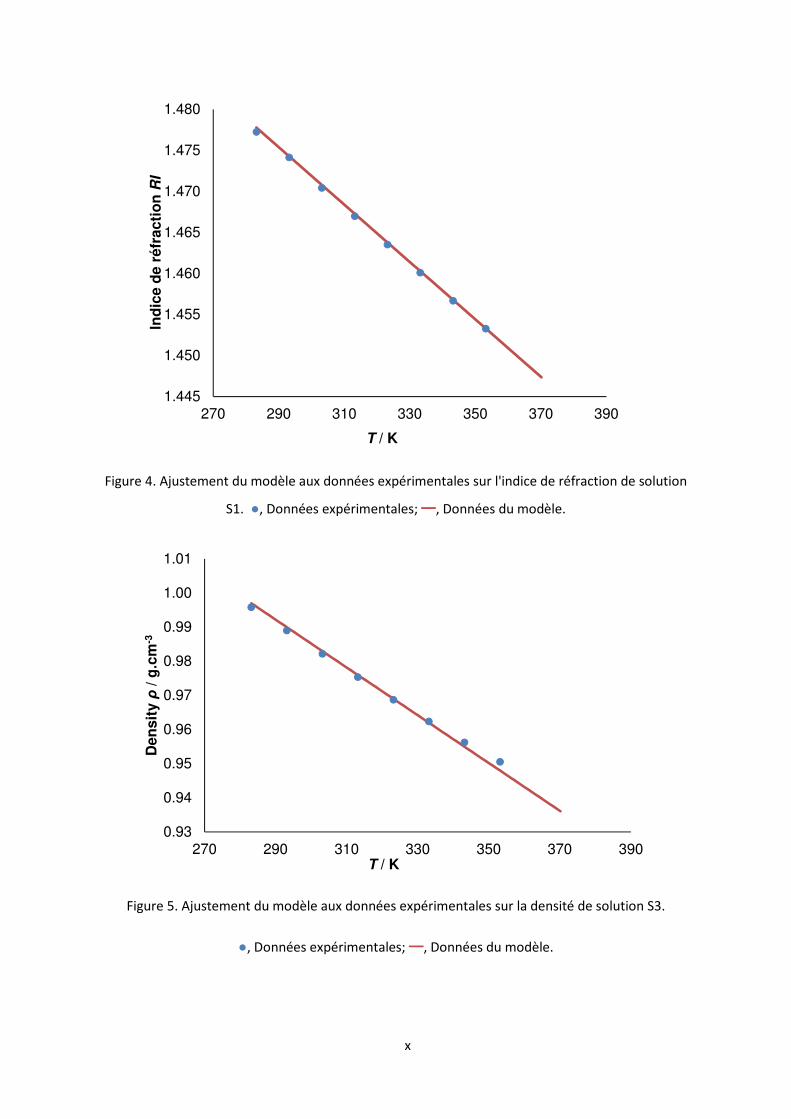
Figure 4. Ajustement du modèle aux données expérimentales sur l'indice de réfraction de solution
S1. ●, Données expérimentales; ━, Données du modèle.
Figure 5. Ajustement du modèle aux données expérimentales sur la densité de solution S3.
●, Données expérimentales; ━, Données du modèle.
1.445
1.450
1.455
1.460
1.465
1.470
1.475
1.480
270 290 310 330 350 370 390
Ind
ice d
e r
éfr
acti
on
RI
T / K
0.93
0.94
0.95
0.96
0.97
0.98
0.99
1.00
1.01
270 290 310 330 350 370 390
Den
sit
y ρ
/ g
.cm
-3
T / K
S3 40%SBO+30%ESBO+30%CSBO
xi
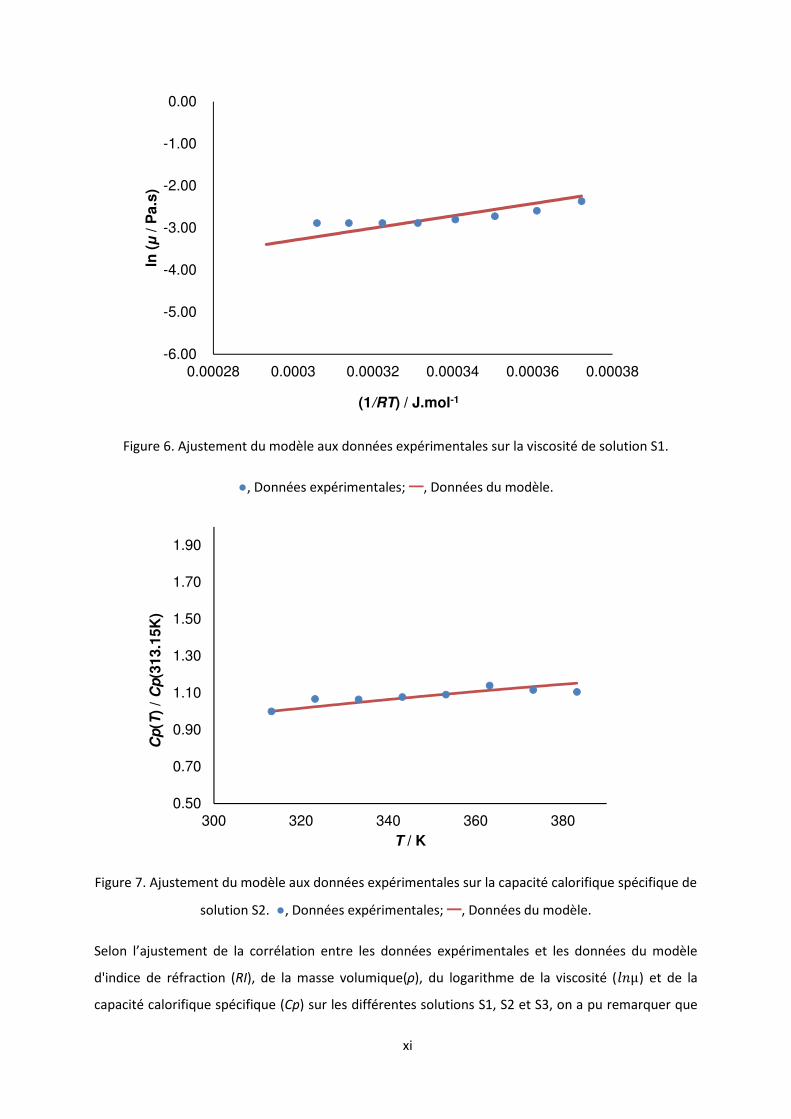
Figure 6. Ajustement du modèle aux données expérimentales sur la viscosité de solution S1.
●, Données expérimentales; ━, Données du modèle.
Figure 7. Ajustement du modèle aux données expérimentales sur la capacité calorifique spécifique de
solution S2. ●, Données expérimentales; ━, Données du modèle.
Selon l’ajustement de la corrélation entre les données expérimentales et les données du modèle
d'indice de réfraction (RI), de la masse volumique(ρ), du logarithme de la viscosité (pqμ) et de la
capacité calorifique spécifique (Cp) sur les différentes solutions S1, S2 et S3, on a pu remarquer que
-6.00
-5.00
-4.00
-3.00
-2.00
-1.00
0.00
0.00028 0.0003 0.00032 0.00034 0.00036 0.00038
ln (µ
/ P
a.s
)
(1/RT) / J.mol-1
0.50
0.70
0.90
1.10
1.30
1.50
1.70
1.90
300 320 340 360 380
Cp
(T)
/ C
p(3
13.1
5K
)
T / K
xii
les données expérimentales (l’indice de réfraction, la densité et la capacité calorifique spécifique)
peuvent être précitées fructueusement avec une valeur moyenne globale de l'erreur relative
statistique inférieure à 2.5 %. Cependant, la valeur moyenne globale de l'erreur relative statistique de
lnµ est supérieur dû au fait que Eq. (19) ne prend pas en compte l'interaction entre les groupes
fonctionnels.
3.3 Carbonation des huiles végétales époxydées
Dans cette section, un modèle cinétique de la réaction de carbonatation d'huile de coton époxydée
catalysée par TBABr a été proposée. Dans un système de gaz-liquide, il convient de prendre en
considération le transfert de masse.
Dans un premier temps, un modèle de transfert massique a été construit afin de pouvoir prédire
l’évolution des coefficients de transfert massique volumétrique, des coefficients de Henry,
l'avancement de réaction et la température. Ensuite, un modèle cinétique a été proposée à différents
niveaux de température, de catalyseur, de concentrations des groupes époxyde et de pression du CO2.
3.3.1 Étude cinétique de réaction carbonatation
L’influence de la pression du CO2 (20-50bar), la température (110-140°C), la concentration initiale de
groupes époxyde (1.67-3.80 mol.L-1) et la concentration en catalyseur (0.06-0.3 mol.L-1) sur la cinétique
de la carbonatation ont été examinées. Les expériences ont été conduites dans des conditions
isobarique et isotherme.
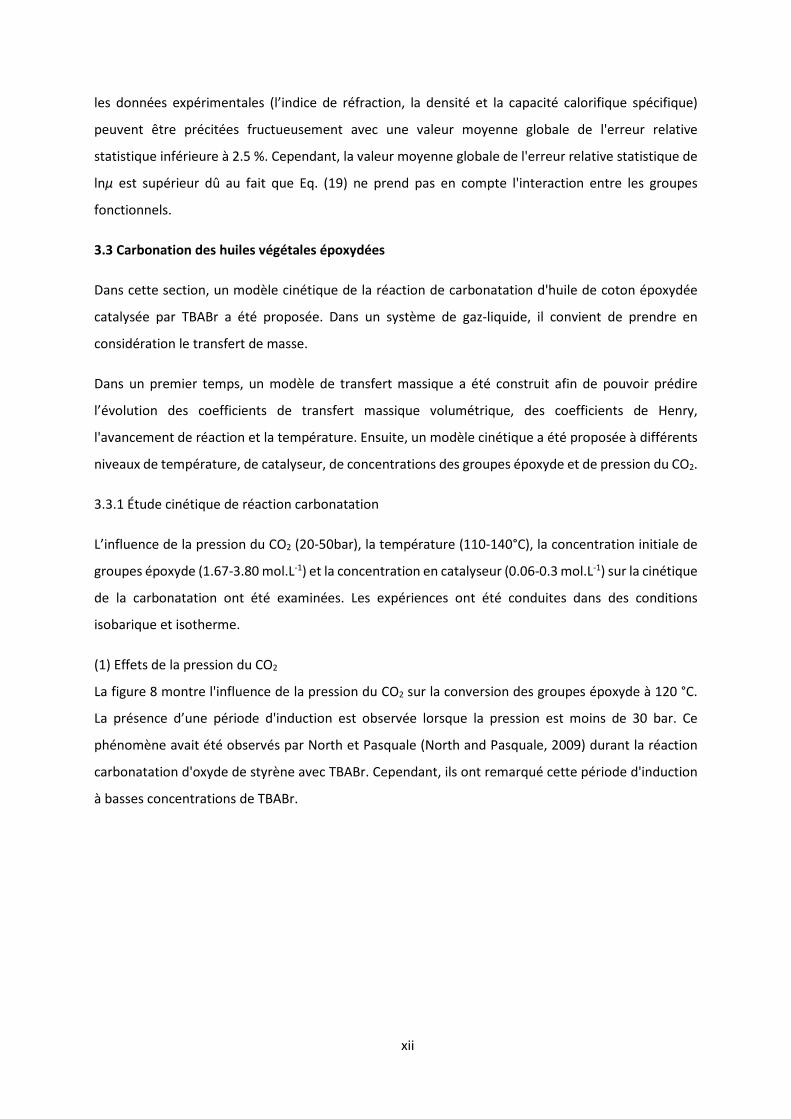
(1) Effets de la pression du CO2
La figure 8 montre l'influence de la pression du CO2 sur la conversion des groupes époxyde à 120 °C.
La présence d’une période d'induction est observée lorsque la pression est moins de 30 bar. Ce
phénomène avait été observés par North et Pasquale (North and Pasquale, 2009) durant la réaction
carbonatation d'oxyde de styrène avec TBABr. Cependant, ils ont remarqué cette période d'induction
à basses concentrations de TBABr.
xiii
Figure 8. Effets de la pression du CO2 sur la cinétique de carbonatation à 120°C,
[TBABr] = 0.13 mol.L-1, [ECSO]0= 3.4-3.5 mol.L-1 et une vitesse de rotation de 500 rpm
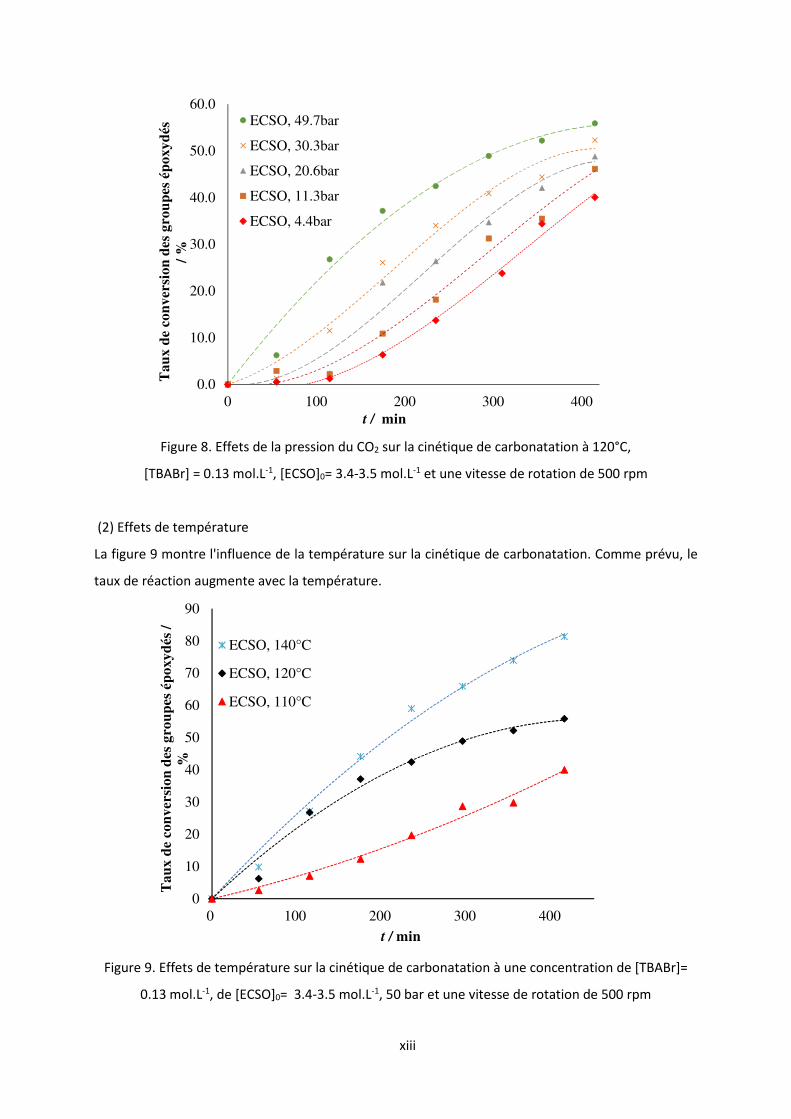
(2) Effets de température
La figure 9 montre l'influence de la température sur la cinétique de carbonatation. Comme prévu, le
taux de réaction augmente avec la température.
Figure 9. Effets de température sur la cinétique de carbonatation à une concentration de [TBABr]=
0.13 mol.L-1, de [ECSO]0= 3.4-3.5 mol.L-1, 50 bar et une vitesse de rotation de 500 rpm
0.0
10.0
20.0
30.0
40.0
50.0
60.0
0 100 200 300 400
Ta
ux d
eco
nv
ersi
on
des
gro
up
es é
po
xy
dés
/ %
t / min
ECSO, 49.7bar
ECSO, 30.3bar
ECSO, 20.6bar
ECSO, 11.3bar
ECSO, 4.4bar
0
10
20
30
40
50
60
70
80
90
0 100 200 300 400
Ta
ux d
eco
nv
ersi
on
des
gro
up
es é
poxyd
és /
%
t / min
ECSO, 140°C
ECSO, 120°C
ECSO, 110°C
xiv
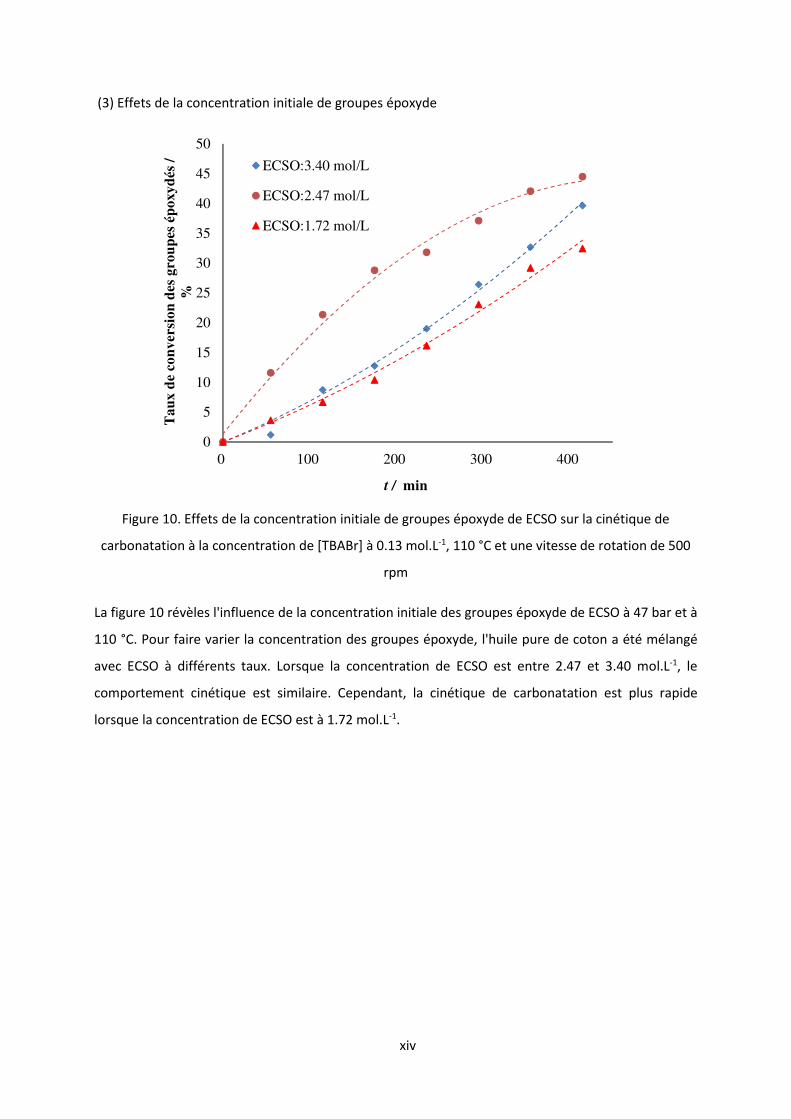
(3) Effets de la concentration initiale de groupes époxyde
Figure 10. Effets de la concentration initiale de groupes époxyde de ECSO sur la cinétique de
carbonatation à la concentration de [TBABr] à 0.13 mol.L-1, 110 °C et une vitesse de rotation de 500
rpm
La figure 10 révèles l'influence de la concentration initiale des groupes époxyde de ECSO à 47 bar et à
110 °C. Pour faire varier la concentration des groupes époxyde, l'huile pure de coton a été mélangé
avec ECSO à différents taux. Lorsque la concentration de ECSO est entre 2.47 et 3.40 mol.L-1, le
comportement cinétique est similaire. Cependant, la cinétique de carbonatation est plus rapide
lorsque la concentration de ECSO est à 1.72 mol.L-1.
0
5
10
15
20
25
30
35
40
45
50
0 100 200 300 400
Ta
ux d
eco
nv
ersi
on
des
gro
up
es é
po
xy
dés
/
%
t / min
ECSO:3.40 mol/L
ECSO:2.47 mol/L
ECSO:1.72 mol/L
xv
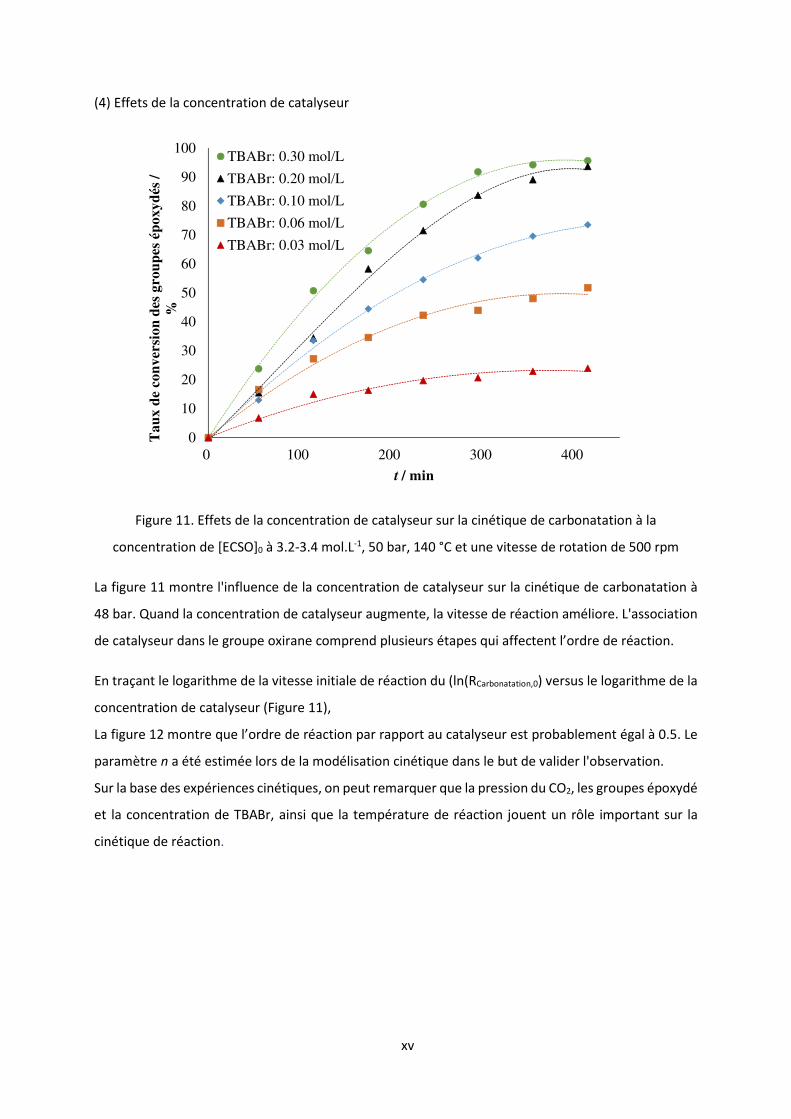
(4) Effets de la concentration de catalyseur
Figure 11. Effets de la concentration de catalyseur sur la cinétique de carbonatation à la
concentration de [ECSO]0 à 3.2-3.4 mol.L-1, 50 bar, 140 °C et une vitesse de rotation de 500 rpm
La figure 11 montre l'influence de la concentration de catalyseur sur la cinétique de carbonatation à
48 bar. Quand la concentration de catalyseur augmente, la vitesse de réaction améliore. L'association
de catalyseur dans le groupe oxirane comprend plusieurs étapes qui affectent l’ordre de réaction.
En traçant le logarithme de la vitesse initiale de réaction du (ln(RCarbonatation,0) versus le logarithme de la
concentration de catalyseur (Figure 11),
La figure 12 montre que l’ordre de réaction par rapport au catalyseur est probablement égal à 0.5. Le
paramètre n a été estimée lors de la modélisation cinétique dans le but de valider l'observation.
Sur la base des expériences cinétiques, on peut remarquer que la pression du CO2, les groupes époxydé
et la concentration de TBABr, ainsi que la température de réaction jouent un rôle important sur la
cinétique de réaction.
0
10
20
30
40
50
60
70
80
90
100
0 100 200 300 400
Ta
ux d
eco
nv
ersi
on
des
gro
up
es é
po
xy
dés
/
%
t / min
TBABr: 0.30 mol/L
TBABr: 0.20 mol/L
TBABr: 0.10 mol/L
TBABr: 0.06 mol/L
TBABr: 0.03 mol/L
xvi
Figure 12. ln(RCarbonatation,0) versus ln([TBABr]) à la concentration de [ECSO]0 =3.2-3.4 mol.L-1, 50 bar,
140 °C et une vitesse de rotation de 500 rpm
3.3.2 Étude de transfert massique de CO2
Un des objectifs de cette section est la détermination des coefficients de transfert massique entre les
phases gazeux et liquide, ainsi comme la solubilité du CO2 dans le mélange de réaction. Il est important
aussi de vérifier Les variations de ces paramètres en fonction de conversion.
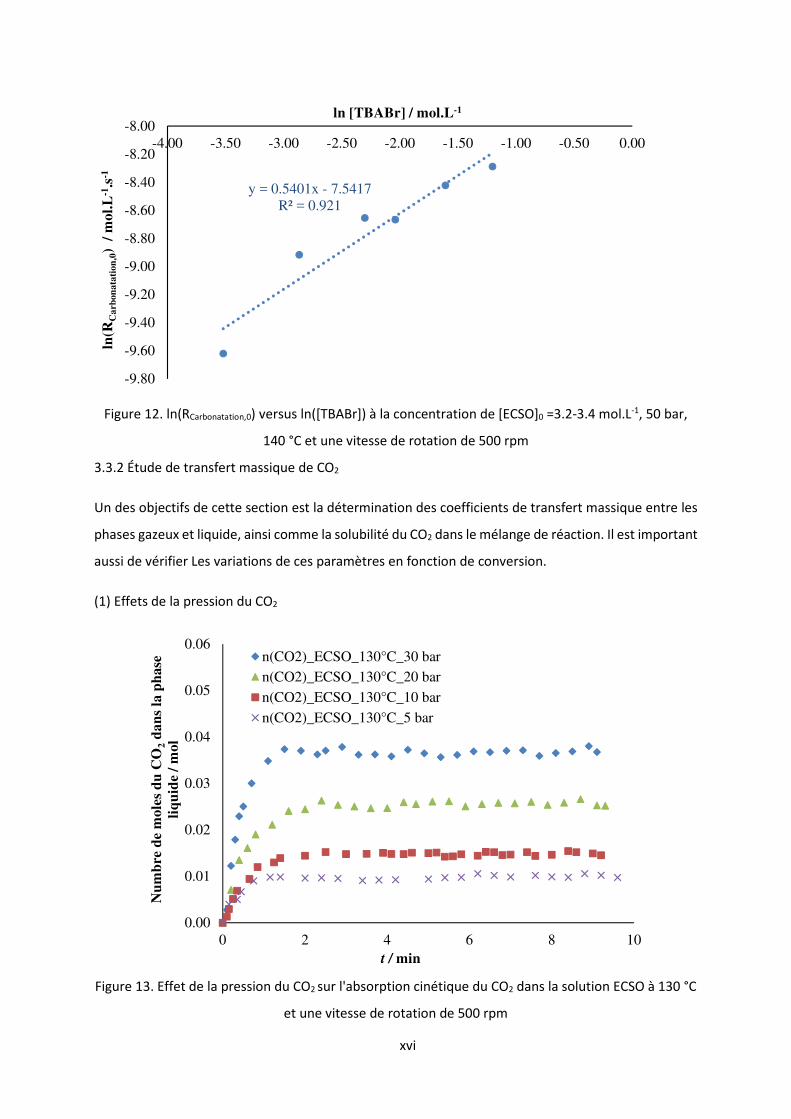
(1) Effets de la pression du CO2
Figure 13. Effet de la pression du CO2 sur l'absorption cinétique du CO2 dans la solution ECSO à 130 °C
et une vitesse de rotation de 500 rpm
y = 0.5401x - 7.5417R² = 0.921
-9.80
-9.60
-9.40
-9.20
-9.00
-8.80
-8.60
-8.40
-8.20
-8.00-4.00 -3.50 -3.00 -2.50 -2.00 -1.50 -1.00 -0.50 0.00
ln(R
Ca
rbon
ata
tion
,0)
/ m
ol.
L-1
.s-1
ln [TBABr] / mol.L-1
0.00
0.01
0.02
0.03
0.04
0.05
0.06
0 2 4 6 8 10
Nu
mb
re d
e m
ole
s d
u C
O2
dan
sla
ph
ase
liq
uid
e/
mol
t / min
n(CO2)_ECSO_130°C_30 barn(CO2)_ECSO_130°C_20 bar
n(CO2)_ECSO_130°C_10 bar
n(CO2)_ECSO_130°C_5 bar
xvii
La figure 13 présente l'évolution du nombre de moles du CO2 dans la phase à 130 °C. On a observé qu’à
mesure que la pression de CO2 augmente, la cinétique de carbonatation devient plus rapide.
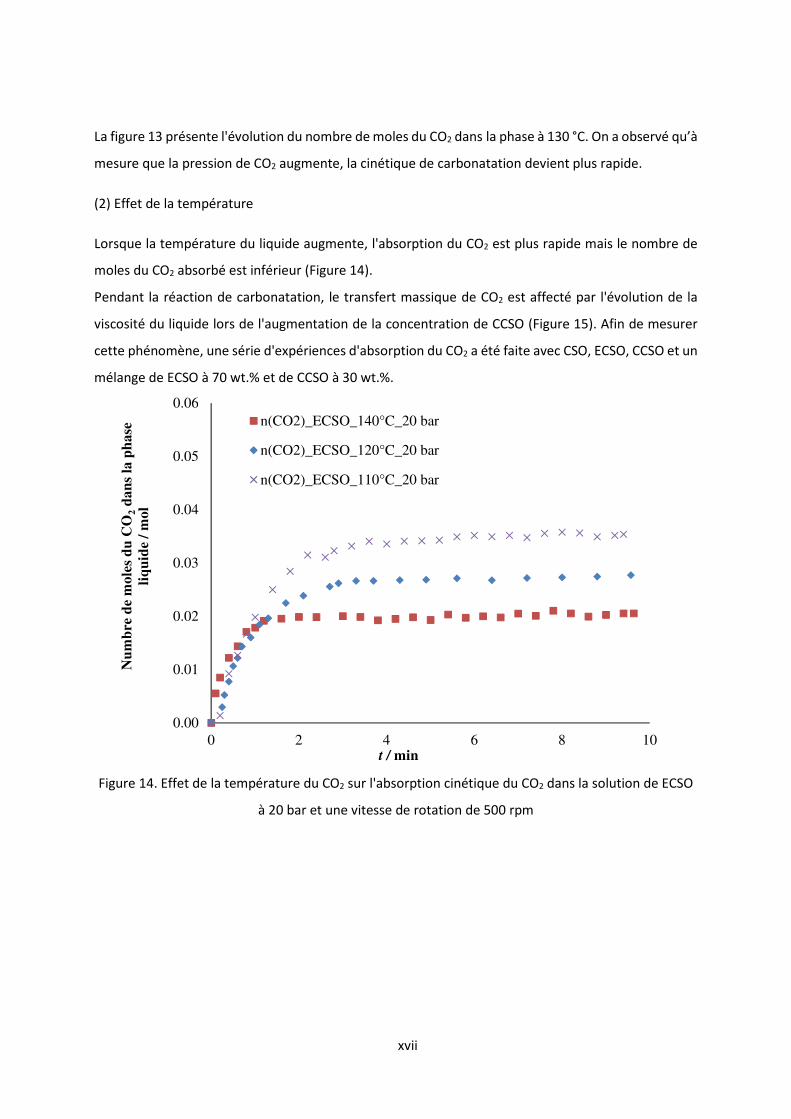
(2) Effet de la température
Lorsque la température du liquide augmente, l'absorption du CO2 est plus rapide mais le nombre de
moles du CO2 absorbé est inférieur (Figure 14).
Pendant la réaction de carbonatation, le transfert massique de CO2 est affecté par l'évolution de la
viscosité du liquide lors de l'augmentation de la concentration de CCSO (Figure 15). Afin de mesurer
cette phénomène, une série d'expériences d'absorption du CO2 a été faite avec CSO, ECSO, CCSO et un
mélange de ECSO à 70 wt.% et de CCSO à 30 wt.%.
Figure 14. Effet de la température du CO2 sur l'absorption cinétique du CO2 dans la solution de ECSO
à 20 bar et une vitesse de rotation de 500 rpm
0.00
0.01
0.02
0.03
0.04
0.05
0.06
0 2 4 6 8 10
Nu
mb
re d
e m
ole
s d
u C
O2
dan
sla
ph
ase
liq
uid
e /
mol
t / min
n(CO2)_ECSO_140°C_20 bar
n(CO2)_ECSO_120°C_20 bar
n(CO2)_ECSO_110°C_20 bar
xviii
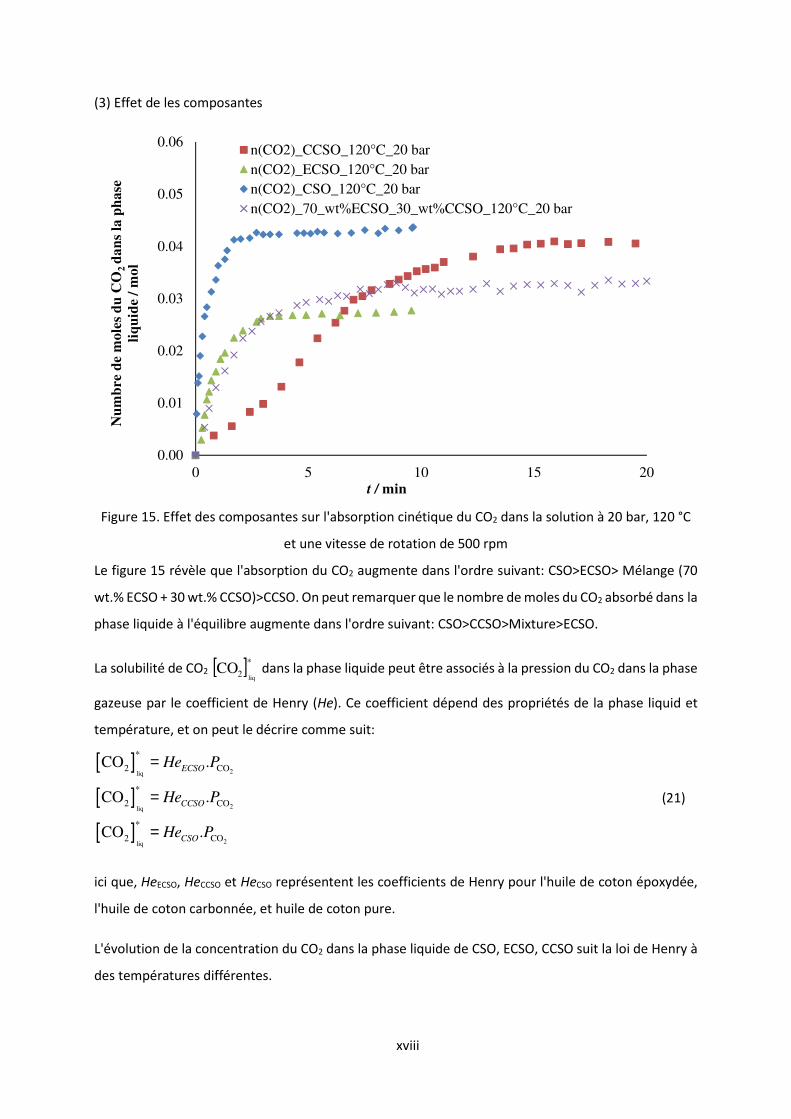
(3) Effet de les composantes
Figure 15. Effet des composantes sur l'absorption cinétique du CO2 dans la solution à 20 bar, 120 °C
et une vitesse de rotation de 500 rpm
Le figure 15 révèle que l'absorption du CO2 augmente dans l'ordre suivant: CSO>ECSO> Mélange (70
wt.% ECSO + 30 wt.% CCSO)>CCSO. On peut remarquer que le nombre de moles du CO2 absorbé dans la
phase liquide à l'équilibre augmente dans l'ordre suivant: CSO>CCSO>Mixture>ECSO.
La solubilité de CO2 [ ]*2 liqCO dans la phase liquide peut être associés à la pression du CO2 dans la phase
gazeuse par le coefficient de Henry (He). Ce coefficient dépend des propriétés de la phase liquid et
température, et on peut le décrire comme suit:
[ ][ ][ ]
2liq
2liq
2liq
*
2 CO
*
2 CO
*
2 CO
CO .
CO .
CO .
ECSO
CCSO
CSO
He P
He P
He P
=
=
=
(21)
ici que, HeECSO, HeCCSO et HeCSO représentent les coefficients de Henry pour l'huile de coton époxydée,
l'huile de coton carbonnée, et huile de coton pure.
L'évolution de la concentration du CO2 dans la phase liquide de CSO, ECSO, CCSO suit la loi de Henry à
des températures différentes.
0.00
0.01
0.02
0.03
0.04
0.05
0.06
0 5 10 15 20
Nu
mb
re d
e m
ole
s d
u C
O2
da
ns
la p
ha
se
liq
uid
e /
mo
l
t / min
n(CO2)_CCSO_120°C_20 barn(CO2)_ECSO_120°C_20 barn(CO2)_CSO_120°C_20 barn(CO2)_70_wt%ECSO_30_wt%CCSO_120°C_20 bar
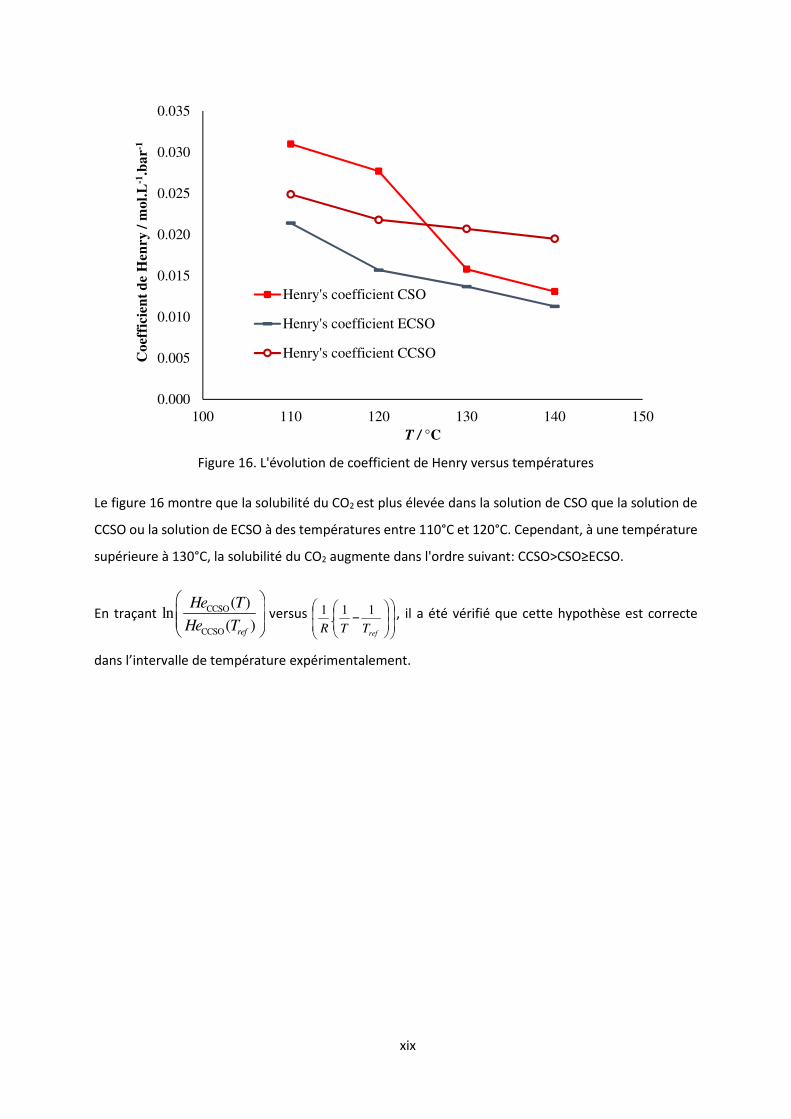
xix
Figure 16. L'évolution de coefficient de Henry versus températures
Le figure 16 montre que la solubilité du CO2 est plus élevée dans la solution de CSO que la solution de
CCSO ou la solution de ECSO à des températures entre 110°C et 120°C. Cependant, à une température
supérieure à 130°C, la solubilité du CO2 augmente dans l'ordre suivant: CCSO>CSO≥ECSO.
En traçant CCSO
CCSO
( )ln
( )ref
He T
He T
versus
−
refTTR
11.
1 , il a été vérifié que cette hypothèse est correcte
dans l’intervalle de température expérimentalement.
0.000
0.005
0.010
0.015
0.020
0.025
0.030
0.035
100 110 120 130 140 150
Co
effi
cien
t d
e H
enry
/ m
ol.
L-1
.ba
r-1
T / °C
Henry's coefficient CSO
Henry's coefficient ECSO
Henry's coefficient CCSO

xx
Figure 17. Courbe de Van’t Hoff pour coefficients de Henry de l'huile de coton (CSO), l'huile de coton
époxydée (ECSO) et l'huile de coton carbonnée (CCSO)
Le figure 17 montre que la dissolution du CO2 est plus exothermique dans la solution de CSO (∆H= -
40.406 kJ.mol-1) que dans la solution de ECSO (∆H= -29.03 kJ.mol-1) et que dans la solution de CCSO
(∆H= -11.52 kJ.mol-1).
(4) Modèle du transfert massique
Au cours de l’étape de modélisation du transfert massique, le nombre de moles de CO2 absorbé dans la
phase liquide a été utilisé comme la valeur observable. Les coefficients de transfert massique modifié
( )'.akL pour CSO, ECSO et CCSO ont été estimées par une analyse de régression.
L'incertitude du modèle proposé aux données expérimentales est en général satisfaisante. Le
coefficient de l’explication dépasse 90%. Le modèle décrit bien les données expérimentales pour
l'absorption ci du CO2 dans l'huile de coton pure, l'huile de coton époxydée et l'huile de coton
carbonnée. Le figures 18 montre un exemple des résultats de la modélisation.
y = 37571xR² = 0.9188
y = 29030xR² = 0.9693
y = 11516xR² = 0.9375
-1
-0.9
-0.8
-0.7
-0.6
-0.5
-0.4
-0.3
-0.2
-0.1
0-0.000025 -0.00002 -0.000015 -0.00001 -0.000005 0
CSO
ECSO
CCSO
1� × M1f − 1f(t(.4u�Oln
xyfxyf(t(.4u�
xxi
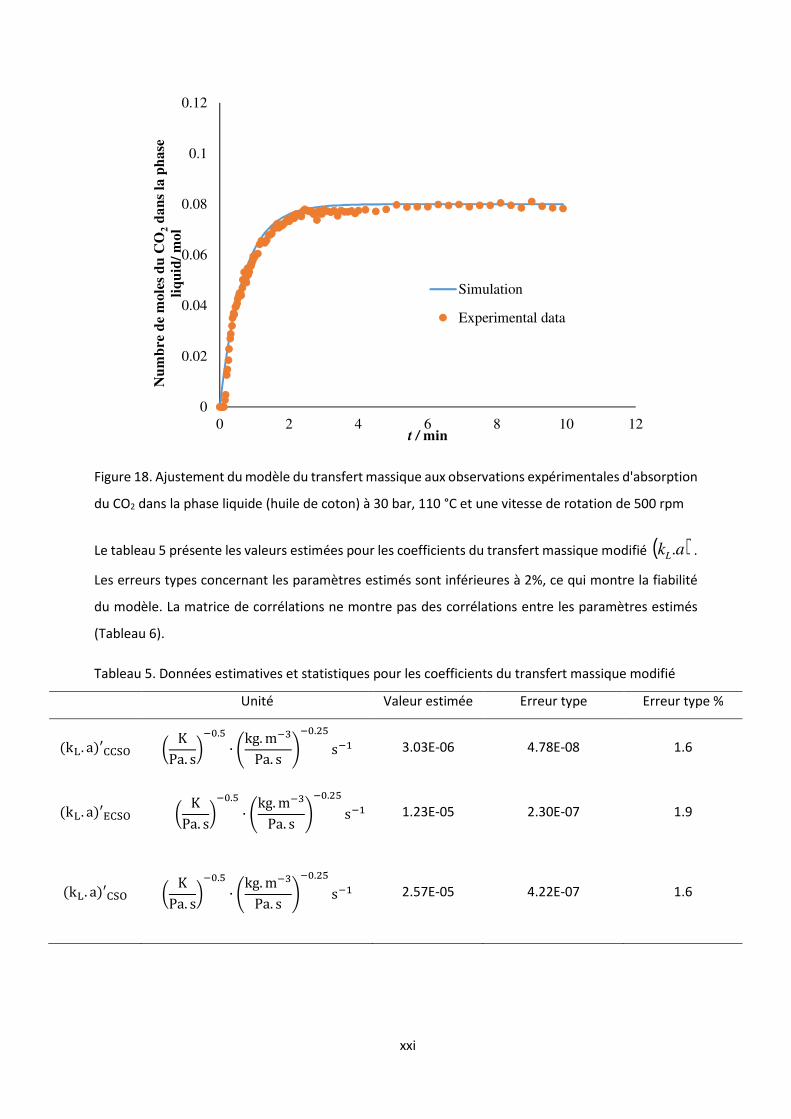
Figure 18. Ajustement du modèle du transfert massique aux observations expérimentales d'absorption
du CO2 dans la phase liquide (huile de coton) à 30 bar, 110 °C et une vitesse de rotation de 500 rpm
Le tableau 5 présente les valeurs estimées pour les coefficients du transfert massique modifié ( )'.akL .
Les erreurs types concernant les paramètres estimés sont inférieures à 2%, ce qui montre la fiabilité
du modèle. La matrice de corrélations ne montre pas des corrélations entre les paramètres estimés
(Tableau 6).
Tableau 5. Données estimatives et statistiques pour les coefficients du transfert massique modifié
Unité Valeur estimée Erreur type Erreur type %
Mkz. aO′aa9� | KPa. s�@�.u ∙ �kg.m@(Pa. s �
@�. u s@4 3.03E-06 4.78E-08 1.6
Mkz. aO′Qa9� | KPa. s�@�.u ∙ �kg.m@(Pa. s �
@�. u s@4 1.23E-05 2.30E-07 1.9
Mkz. aO′a9� | KPa. s�@�.u ∙ �kg.m@(Pa. s �
@�. u s@4 2.57E-05 4.22E-07 1.6
0
0.02
0.04
0.06
0.08
0.1
0.12
0 2 4 6 8 10 12
Nu
mb
re d
e m
ole
s d
u C
O2
da
ns
la p
ha
se
liq
uid
/ m
ol
t / min
Simulation
Experimental data
xxii
Tableau 6. Matrice de corrélation
Mkz. aO�aa9� Mkz. aO′Qa9� Mkz. aO′a9�
Mkz. aO′aa9� 1
Mkz. aO′Qa9� -0.007 1
Mkz. aO′a9� x x 1
3.3.3 Modèle cinétique
Au cours de l’étape de modélisation cinétique, la concentration du groupe époxydée a été utilisée
comme la valeur observable.
Les constantes cinétiques estimées sont le taux constant (kcarbonatation) et l’énergie d'activation pour la
réaction de carbonatation (EaCarbonatation) et le réaction d’ordre (n) sur catalyseur.
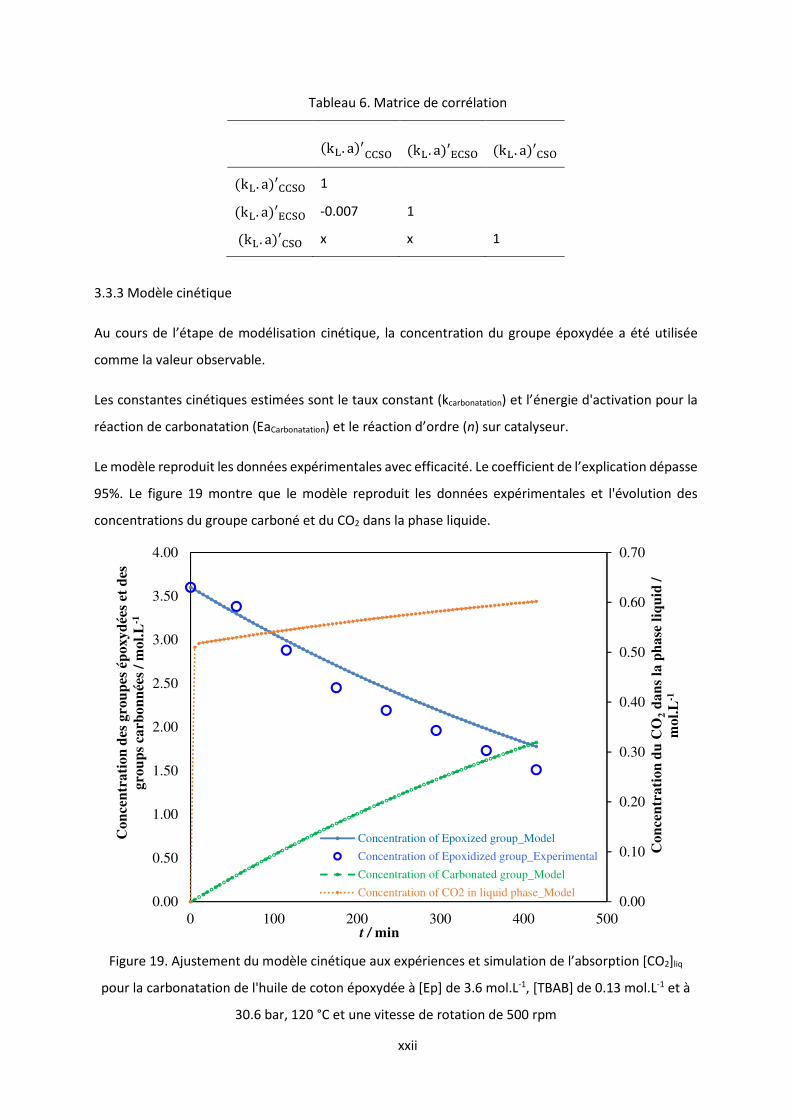
Le modèle reproduit les données expérimentales avec efficacité. Le coefficient de l’explication dépasse
95%. Le figure 19 montre que le modèle reproduit les données expérimentales et l'évolution des
concentrations du groupe carboné et du CO2 dans la phase liquide.
Figure 19. Ajustement du modèle cinétique aux expériences et simulation de l’absorption [CO2]liq
pour la carbonatation de l'huile de coton époxydée à [Ep] de 3.6 mol.L-1, [TBAB] de 0.13 mol.L-1 et à
30.6 bar, 120 °C et une vitesse de rotation de 500 rpm
0.00
0.10
0.20
0.30
0.40
0.50
0.60
0.70
0.00
0.50
1.00
1.50
2.00
2.50
3.00
3.50
4.00
0 100 200 300 400 500
Co
nce
ntr
ati
on
du
CO
2d
an
s la
ph
ase
liq
uid
/
mol.
L-1
Co
nce
ntr
ati
on
des
gro
up
es é
poxyd
ées
et d
es
gro
up
s ca
rbon
née
s/
mol.
L-1
t / min
Concentration of Epoxized group_Model
Concentration of Epoxidized group_Experimental
Concentration of Carbonated group_Model
Concentration of CO2 in liquid phase_Model
xxiii
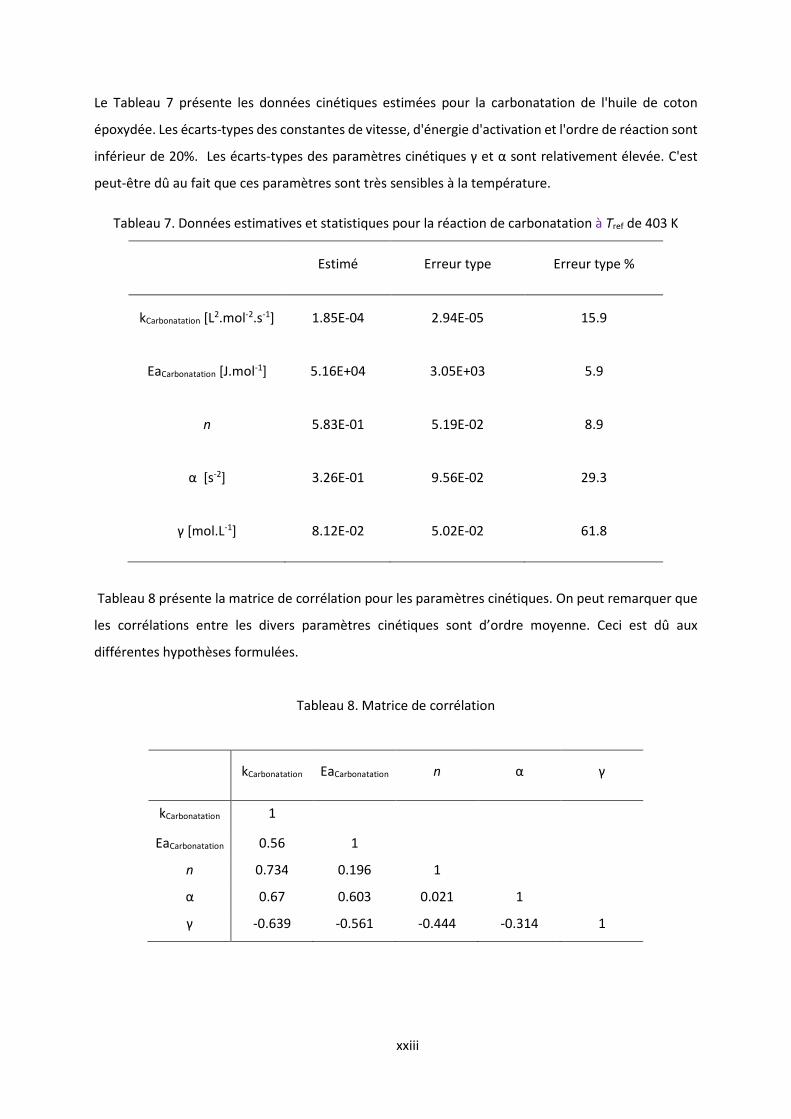
Le Tableau 7 présente les données cinétiques estimées pour la carbonatation de l'huile de coton
époxydée. Les écarts-types des constantes de vitesse, d'énergie d'activation et l'ordre de réaction sont
inférieur de 20%. Les écarts-types des paramètres cinétiques γ et α sont relativement élevée. C'est
peut-être dû au fait que ces paramètres sont très sensibles à la température.
Tableau 7. Données estimatives et statistiques pour la réaction de carbonatation à Tref de 403 K
Estimé Erreur type Erreur type %
kCarbonatation [L2.mol-2.s-1] 1.85E-04 2.94E-05 15.9
EaCarbonatation [J.mol-1] 5.16E+04 3.05E+03 5.9
n 5.83E-01 5.19E-02 8.9
α [s-2] 3.26E-01 9.56E-02 29.3
γ [mol.L-1] 8.12E-02 5.02E-02 61.8
Tableau 8 présente la matrice de corrélation pour les paramètres cinétiques. On peut remarquer que
les corrélations entre les divers paramètres cinétiques sont d’ordre moyenne. Ceci est dû aux
différentes hypothèses formulées.
Tableau 8. Matrice de corrélation
kCarbonatation EaCarbonatation n α γ
kCarbonatation 1
EaCarbonatation 0.56 1
n 0.734 0.196 1
α 0.67 0.603 0.021 1
γ -0.639 -0.561 -0.444 -0.314 1
xxiv
3.4 Structure et réactivité: Comparaison entre l’huiles végétales et esters méthyliques d'huiles
végétales
L'objectif de la présente étude est de mesurer l'effet de l'obstacle stérique sur la cinétiques de la
carbonatation de l'huile de coton, où les centres réactionnels sont situées sur les fragments d'esters
méthyliques. A cette fin, une comparaison entre la réactivité de l'huile de coton et ses contreparties
des esters méthyliques seront effectués. Afin de mener cette étude, Il est obligatoire de tenir compte
des phénomènes de transfert de masse de CO2 lors du passage d'une phase gazeuse à une phase
aqueuse. Ce phénomène est perturbé par les propriétés physico-chimiques du solvant utilisé. La
réaction de carbonatation effectuée par avec un catalyseur homogène comme le bromure de tétra-n-
butylammonium (TBABr) a été examiné.
3.4.1 Comparaison des propriétés physico-chimiques
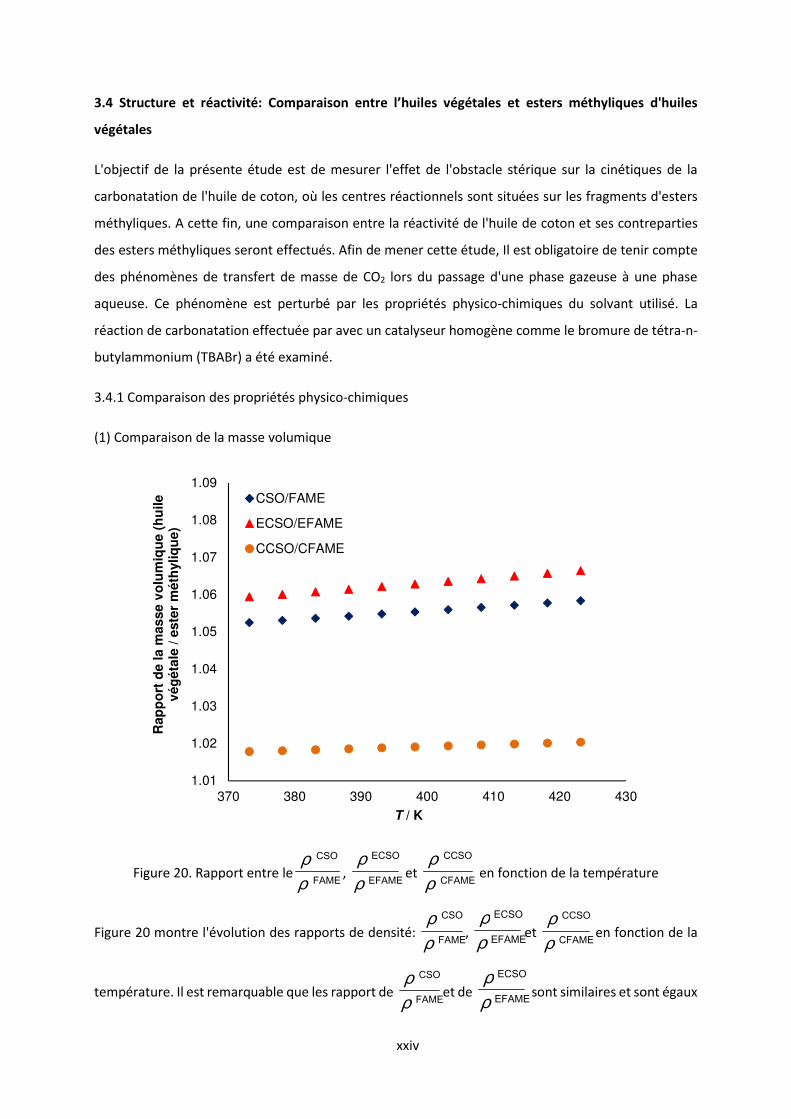
(1) Comparaison de la masse volumique
Figure 20. Rapport entre leFAME
CSO
ρρ
, EFAME
ECSO
ρρ
et CFAME
CCSO
ρρ
en fonction de la température
Figure 20 montre l'évolution des rapports de densité: FAME
CSO
ρρ
, EFAME
ECSO
ρρ
et CFAME
CCSO
ρρ
en fonction de la
température. Il est remarquable que les rapport de FAME
CSO
ρρ
et de EFAME
ECSO
ρρ
sont similaires et sont égaux
1.01
1.02
1.03
1.04
1.05
1.06
1.07
1.08
1.09
370 380 390 400 410 420 430
Rap
po
rt d
e la m
asse v
olu
miq
ue (
hu
ile
vég
éta
le/ este
r m
éth
yliq
ue)
T / K
CSO/FAME
ECSO/EFAME
CCSO/CFAME
xxv
à 1.05, tandis que les rapport de CFAME
CCSO
ρρ
est inférieur et egal à 1.02 a des températures variant entre
100°C et 150°C. Donc, quand le groupe fonctionnel est plus grand, La différence de densité entre l'huile
végétale et les esters méthyliques est inférieur.
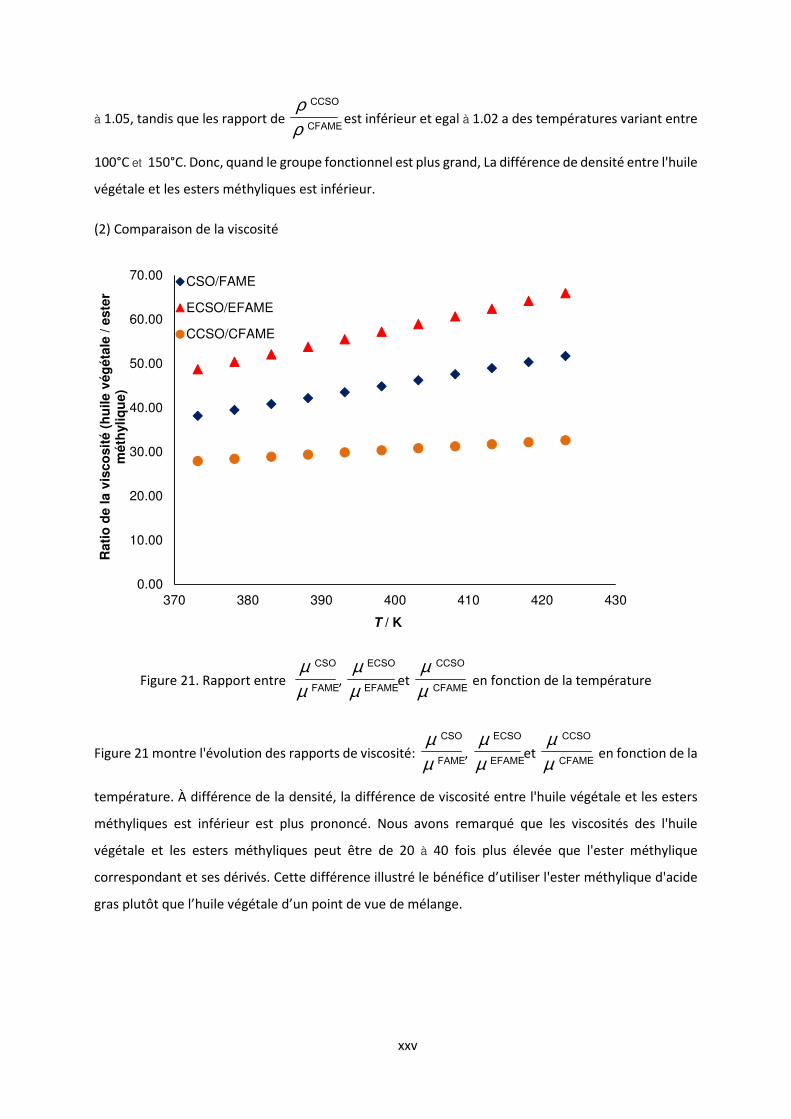
(2) Comparaison de la viscosité
Figure 21. Rapport entre FAME
CSO
µµ
, EFAME
ECSO
µµ
et CFAME
CCSO
µµ
en fonction de la température
Figure 21 montre l'évolution des rapports de viscosité: FAME
CSO
µµ
, EFAME
ECSO
µµ
et CFAME
CCSO
µµ
en fonction de la
température. À différence de la densité, la différence de viscosité entre l'huile végétale et les esters
méthyliques est inférieur est plus prononcé. Nous avons remarqué que les viscosités des l'huile
végétale et les esters méthyliques peut être de 20 à 40 fois plus élevée que l'ester méthylique
correspondant et ses dérivés. Cette différence illustré le bénéfice d’utiliser l'ester méthylique d'acide
gras plutôt que l’huile végétale d’un point de vue de mélange.
0.00
10.00
20.00
30.00
40.00
50.00
60.00
70.00
370 380 390 400 410 420 430
Rati
o d
e l
a v
isco
sit
é(h
uile v
ég
éta
le/ este
r m
éth
yliq
ue)
T / K
CSO/FAME
ECSO/EFAME
CCSO/CFAME
xxvi
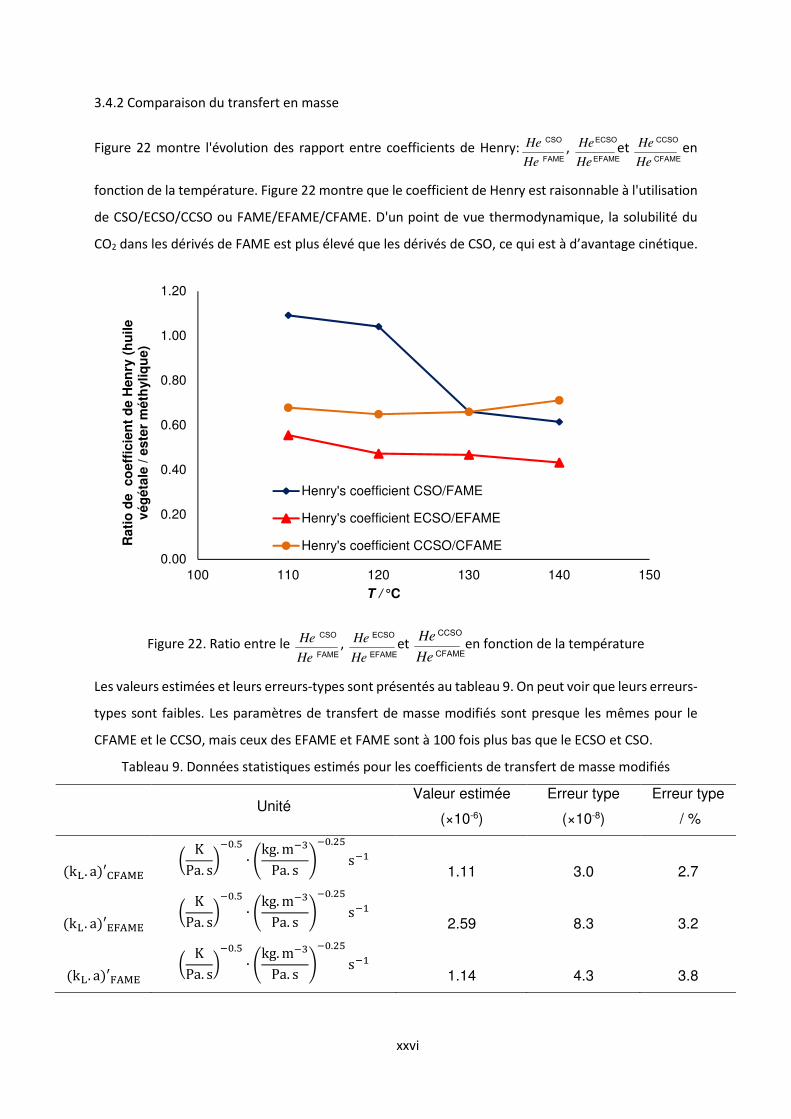
3.4.2 Comparaison du transfert en masse
Figure 22 montre l'évolution des rapport entre coefficients de Henry:FAME
CSO
He
He , EFAME
ECSO
He
He et CFAME
CCSO
He
He en
fonction de la température. Figure 22 montre que le coefficient de Henry est raisonnable à l'utilisation
de CSO/ECSO/CCSO ou FAME/EFAME/CFAME. D'un point de vue thermodynamique, la solubilité du
CO2 dans les dérivés de FAME est plus élevé que les dérivés de CSO, ce qui est à d’avantage cinétique.
Figure 22. Ratio entre le FAME
CSO
He
He , EFAME
ECSO
He
He et CFAME
CCSO
He
He en fonction de la température
Les valeurs estimées et leurs erreurs-types sont présentés au tableau 9. On peut voir que leurs erreurs-
types sont faibles. Les paramètres de transfert de masse modifiés sont presque les mêmes pour le
CFAME et le CCSO, mais ceux des EFAME et FAME sont à 100 fois plus bas que le ECSO et CSO.
Tableau 9. Données statistiques estimés pour les coefficients de transfert de masse modifiés
Unité
Valeur estimée
(×10-6)
Erreur type
(×10-8)
Erreur type
/ %
Mkz. aO′a���Q | KPa. s�
@�.u ∙ �kg.m@(Pa. s �@�. u s@4
1.11 3.0 2.7
Mkz. aO′Q���Q | KPa. s�
@�.u ∙ �kg.m@(Pa. s �@�. u s@4
2.59 8.3 3.2
Mkz. aO′���Q | KPa. s�
@�.u ∙ �kg.m@(Pa. s �@�. u s@4
1.14 4.3 3.8
0.00
0.20
0.40
0.60
0.80
1.00
1.20
100 110 120 130 140 150
Rati
o d
e
co
eff
icie
nt
de H
en
ry (
hu
ile
vég
éta
le/ este
r m
éth
yliq
ue)
T / °C
Henry's coefficient CSO/FAME
Henry's coefficient ECSO/EFAME
Henry's coefficient CCSO/CFAME
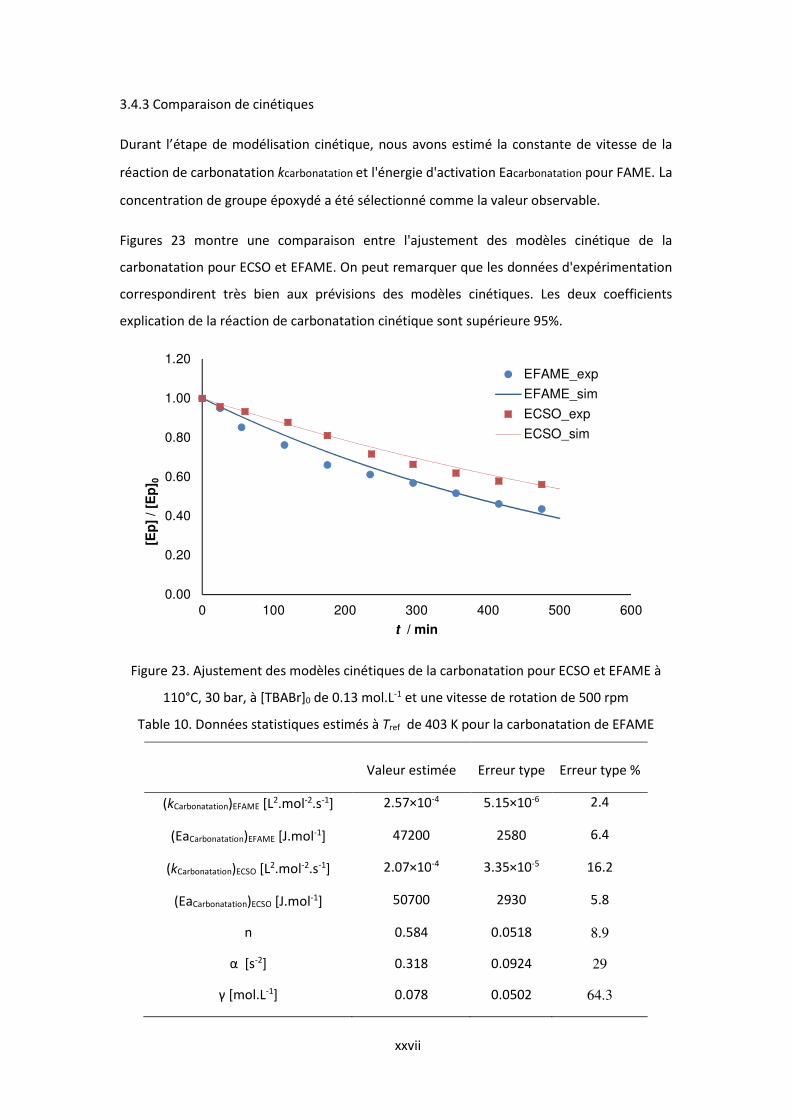
xxvii
3.4.3 Comparaison de cinétiques
Durant l’étape de modélisation cinétique, nous avons estimé la constante de vitesse de la
réaction de carbonatation kcarbonatation et l'énergie d'activation Eacarbonatation pour FAME. La
concentration de groupe époxydé a été sélectionné comme la valeur observable.
Figures 23 montre une comparaison entre l'ajustement des modèles cinétique de la
carbonatation pour ECSO et EFAME. On peut remarquer que les données d'expérimentation
correspondirent très bien aux prévisions des modèles cinétiques. Les deux coefficients
explication de la réaction de carbonatation cinétique sont supérieure 95%.
Figure 23. Ajustement des modèles cinétiques de la carbonatation pour ECSO et EFAME à
110°C, 30 bar, à [TBABr]0 de 0.13 mol.L-1 et une vitesse de rotation de 500 rpm
Table 10. Données statistiques estimés à Tref de 403 K pour la carbonatation de EFAME
Valeur estimée Erreur type Erreur type %
(kCarbonatation)EFAME [L2.mol-2.s-1] 2.57×10⁻⁴ 5.15×10⁻⁶ 2.4
(EaCarbonatation)EFAME [J.mol-1] 47200 2580 6.4
(kCarbonatation)ECSO [L2.mol-2.s-1] 2.07×10⁻⁴ 3.35×10⁻⁵ 16.2
(EaCarbonatation)ECSO [J.mol-1] 50700 2930 5.8
n 0.584 0.0518 8.9
α [s-2] 0.318 0.0924 29
γ [mol.L-1] 0.078 0.0502 64.3
0.00
0.20
0.40
0.60
0.80
1.00
1.20
0 100 200 300 400 500 600
[Ep
] / [E
p] 0
t / min
EFAME_exp
EFAME_sim
ECSO_exp
ECSO_sim
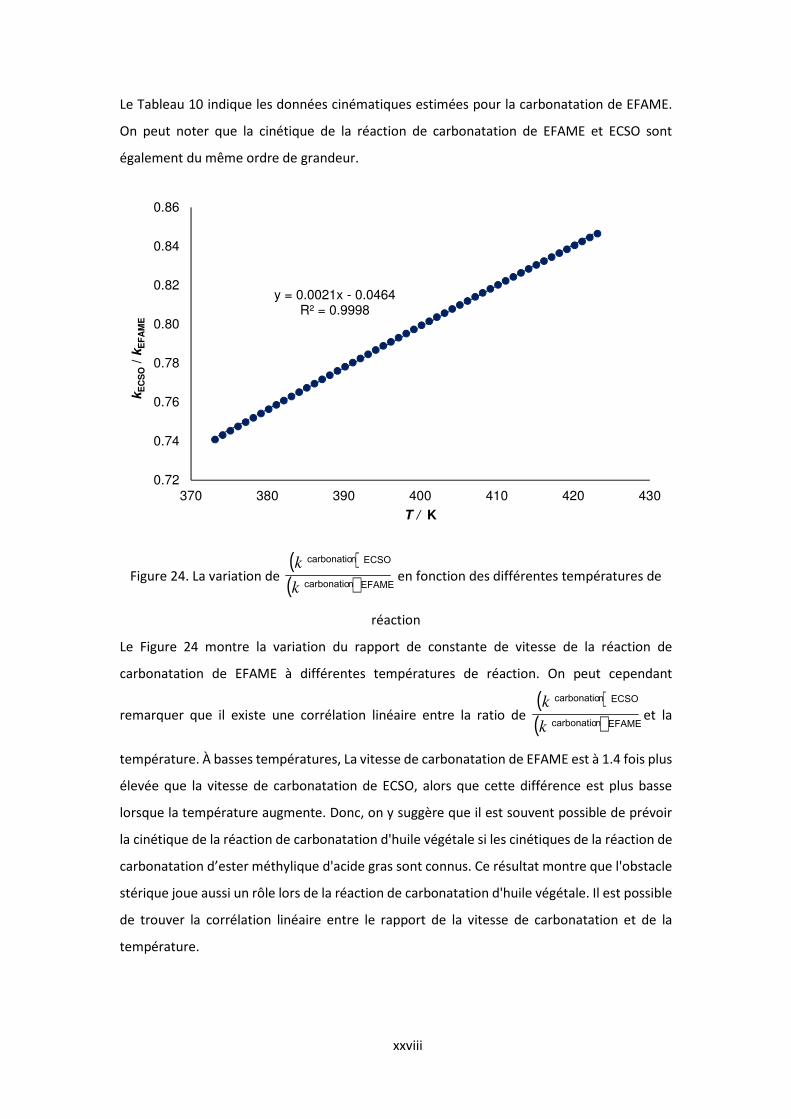
xxviii
Le Tableau 10 indique les données cinématiques estimées pour la carbonatation de EFAME.
On peut noter que la cinétique de la réaction de carbonatation de EFAME et ECSO sont
également du même ordre de grandeur.
Figure 24. La variation de ( )( )EFAMEncarbonatio
ECSOncarbonatio
k
k en fonction des différentes températures de
réaction
Le Figure 24 montre la variation du rapport de constante de vitesse de la réaction de
carbonatation de EFAME à différentes températures de réaction. On peut cependant
remarquer que il existe une corrélation linéaire entre la ratio de ( )( )EFAMEncarbonatio
ECSOncarbonatio
k
ket la
température. À basses températures, La vitesse de carbonatation de EFAME est à 1.4 fois plus
élevée que la vitesse de carbonatation de ECSO, alors que cette différence est plus basse
lorsque la température augmente. Donc, on y suggère que il est souvent possible de prévoir
la cinétique de la réaction de carbonatation d'huile végétale si les cinétiques de la réaction de
carbonatation d’ester méthylique d'acide gras sont connus. Ce résultat montre que l'obstacle
stérique joue aussi un rôle lors de la réaction de carbonatation d'huile végétale. Il est possible
de trouver la corrélation linéaire entre le rapport de la vitesse de carbonatation et de la
température.
y = 0.0021x - 0.0464R² = 0.9998
0.72
0.74
0.76
0.78
0.80
0.82
0.84
0.86
370 380 390 400 410 420 430
kE
CS
O/ k
EF
AM
E
T / K
xxix
4. Conclusion
Cette recherche a été concentrée sur quatre aspects pour la valorisation des huiles végétales:
Premièrement, époxydation cinétiques pour l'époxydation et l'ouverture du cycle oxirane
d'huile végétale ont été étudiés dans un réacteur discontinu. En développant une stratégie
adaptée de modélisation, les constantes cinétiques ont été estimées pour les réactions de
l'ouverture du cycle oxirane par l'eau, le peroxyde d'hydrogène, l'acide peracétique et l'acide
acétique. En guise de conclusion, il ressort que l'ouverture du cycle oxirane par l'acide
peracétique et l'acide acétique est plus rapide que celles par l'eau, le peroxyde d'hydrogène.
Un réacteur semibatch où le peroxyde d'hydrogène et l'acide sulfurique sont constamment
ajoutées a été jugéet une configuration optimale pour maximiser la concentration du groupe
époxyde et réduire la concentration de produits d'ouverture du cycle oxirane.
Deuxièmement, les interactions entre les groupes fonctionnels (double liaison, groupe
époxydée et groupe carbonnée) et les propriétés physicochimiques ont été examinées pour
les huiles végétales et leurs dérivés époxydées et dérivés carbonnées. L'influence de la
température sur les propriétés physicochimiques comme la densité, l'indice de réfraction, la
viscosité et la capacité calorifique spécifique ont été discutées. En conclusion, l'indice de
réfraction et la densité diminue linéairement lorsque la température augmente. La viscosité
de ces huiles est proportionnel à la température. La capacité calorifique spécifique a été jugé
relativement constant avec la température. La conversion des groupes époxydées et des
groupes carbonnées contribue à une augmentation de la viscosité, ce qui suggère que les
composants huileux affectuer les paramètres physicochimiques, qui influencent le transfert
de masse dans les milieux eau/gaz pendant la réaction de carbonatation. Donc, en s'appuyant
sur les évolutions du des composés purs correspondants, les propriétés physicochimiques
comme la densité, l'indice de réfraction, la viscosité et la capacité calorifique spécifique des
huiles végétales pourrait être prédite.
Ensuite, un modèle de la cinétique pour la carbonatation de l'huile de coton avec un catalyseur
homogène du bromure de tétra-n-hexylammonium (TBABr) a été développé. Pendant une
étude de cinétique, le phénomène de transfert de masse du CO2 a également été pris en
compte et l'évolution des paramètres de transfert de masse en fonction de la température et
des composants ont été estimées lors d’étape de modélisation pour transfert de masse du
CO2. Une expression cinétique pour la carbonatation de l'huile de coton époxydée est dérivé
en supposant que la réaction de carbonatation est statique. Les résultats de transfert de
masse montrent que la dissolution du CO2 est exothermique dans la phase huileuse.
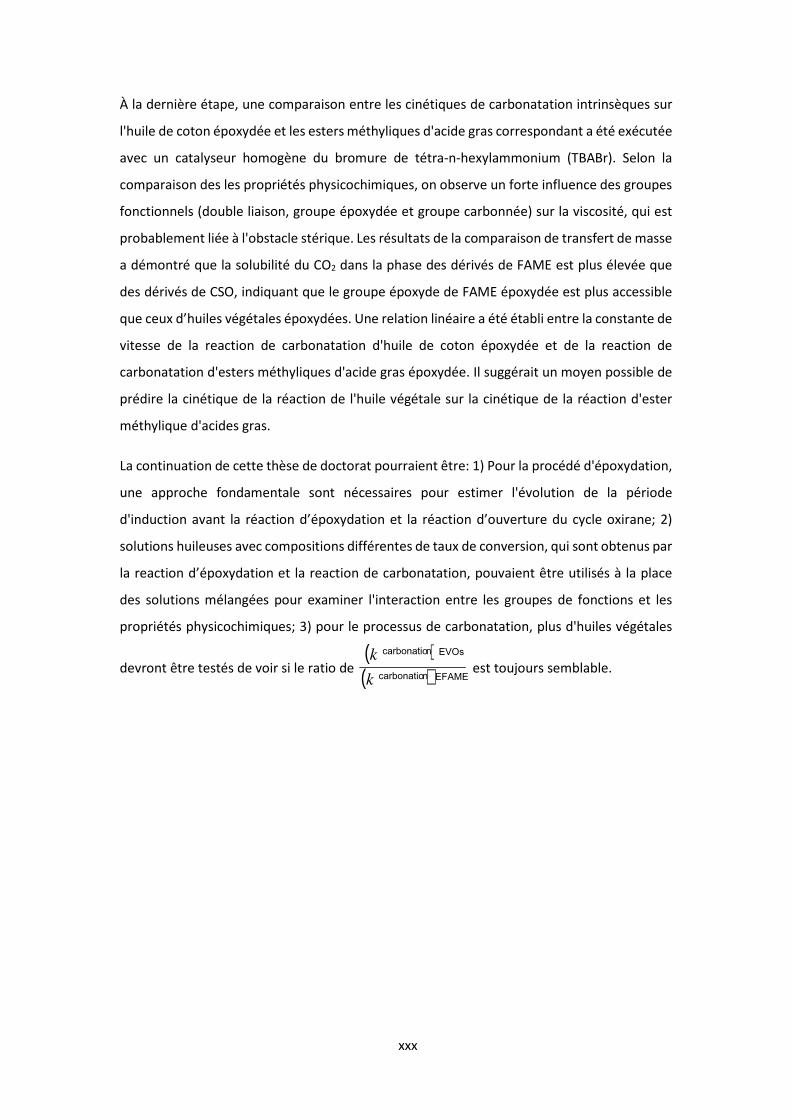
xxx
À la dernière étape, une comparaison entre les cinétiques de carbonatation intrinsèques sur
l'huile de coton époxydée et les esters méthyliques d'acide gras correspondant a été exécutée
avec un catalyseur homogène du bromure de tétra-n-hexylammonium (TBABr). Selon la
comparaison des les propriétés physicochimiques, on observe un forte influence des groupes
fonctionnels (double liaison, groupe époxydée et groupe carbonnée) sur la viscosité, qui est
probablement liée à l'obstacle stérique. Les résultats de la comparaison de transfert de masse
a démontré que la solubilité du CO2 dans la phase des dérivés de FAME est plus élevée que
des dérivés de CSO, indiquant que le groupe époxyde de FAME époxydée est plus accessible
que ceux d’huiles végétales époxydées. Une relation linéaire a été établi entre la constante de
vitesse de la reaction de carbonatation d'huile de coton époxydée et de la reaction de
carbonatation d'esters méthyliques d'acide gras époxydée. Il suggérait un moyen possible de
prédire la cinétique de la réaction de l'huile végétale sur la cinétique de la réaction d'ester
méthylique d'acides gras.
La continuation de cette thèse de doctorat pourraient être: 1) Pour la procédé d'époxydation,
une approche fondamentale sont nécessaires pour estimer l'évolution de la période
d'induction avant la réaction d’époxydation et la réaction d’ouverture du cycle oxirane; 2)
solutions huileuses avec compositions différentes de taux de conversion, qui sont obtenus par
la reaction d’époxydation et la reaction de carbonatation, pouvaient être utilisés à la place
des solutions mélangées pour examiner l'interaction entre les groupes de fonctions et les
propriétés physicochimiques; 3) pour le processus de carbonatation, plus d'huiles végétales
devront être testés de voir si le ratio de ( )( )EFAMEncarbonatio
EVOsncarbonatio
k
k est toujours semblable.
xxxi
Référence
[1] Knopf, D.A., Luo, B.P., Krieger, U.K., Koop, T., 2003. Thermodynamic Dissociation
Constant of the Bisulfate Ion from Raman and Ion Interaction Modeling Studies of
Aqueous Sulfuric Acid at Low Temperatures. J. Phys. Chem. A 107, 4322–4332.
https://doi.org/10.1021/jp027775+
[2] Leveneur, S., Salmi, T., Murzin, D.Y., Estel, L., Wärnå, J., Musakka, N., 2008. Kinetic Study
and Modeling of Peroxypropionic Acid Synthesis from Propionic Acid and Hydrogen
Peroxide Using Homogeneous Catalysts. Ind. Eng. Chem. Res. 47, 656–664.
https://doi.org/10.1021/ie070670e
[3] North, M., Pasquale, R., 2009. Mechanism of Cyclic Carbonate Synthesis from Epoxides
and CO2. Angew. Chem. 121, 2990–2992. https://doi.org/10.1002/ange.200805451
[4] Stoessel, F., 2008. Thermal Safety of Chemical Processes: Risk Assessment and Process
Design. John Wiley & Sons.
[5] Sue, K., Ouchi, F., Minami, K., Arai, K., 2004. Determination of Carboxylic Acid Dissociation
Constants to 350 °C at 23 MPa by Potentiometric pH Measurements. J. Chem. Eng. Data
49, 1359–1363. https://doi.org/10.1021/je049923q
[6] Wu Zhenyu, Nie Yong, Chen Wei, Wu Lihang, Chen Ping, Lu Meizhen, Yu Fengwen, Ji
Jianbing, 2016. Mass transfer and reaction kinetics of soybean oil epoxidation in a formic
acid-autocatalyzed reaction system. Can. J. Chem. Eng. 94, 1576–1582.
https://doi.org/10.1002/cjce.22526
I
Table of Contents_
Chapter I Literature review ...................................................................................................... 1
1.1 Introduction ..................................................................................................................... 1
1.2 Vegetable oils .................................................................................................................. 2
1.3 Biomass and CO2 valorization .......................................................................................... 7
1.4 Epoxidation of vegetable oils .......................................................................................... 8
1.5 Carbonation of vegetable oils ....................................................................................... 15
1.6 Relationships of chemical structure and properties ..................................................... 20
1.6.1 Chemical structure and physicochemical properties ............................................. 20
1.6.2 Chemical structure and reactivity .......................................................................... 21
1.7 Objective of the doctoral thesis .................................................................................... 23
Chapter II Materials, setup and analysis ................................................................................ 25
2.1 Introduction ................................................................................................................... 25
2.2 Materials ........................................................................................................................ 25
2.3 Apparatus and experimental procedures for physicochemical properties
measurements ..................................................................................................................... 26
2.3.1 Refractive index measurement .............................................................................. 26
2.3.2 Density measurement ............................................................................................ 26
2.3.3 Viscosity measurement .......................................................................................... 26
2.3.4 Specific heat capacity measurement ...................................................................... 26
2.4 Apparatus and experimental procedures for epoxidation and ring opening experiment
............................................................................................................................................. 27
2.4.1 Preparation of epoxidized vegetable oil ................................................................. 27
2.4.2 Preparation of cottonseed oil fatty acid methyl ester ........................................... 28
2.4.3 Preparation of epoxidized cottonseed oil fatty acid methyl ester ......................... 28
2.5 Apparatus and experimental procedures for carbonation experiment ........................ 29
2.6 Analysis method ............................................................................................................ 30
2.6.1 Determination of the fatty acid methyl ester components ................................... 30
2.6.2 Concentration of epoxide content ......................................................................... 30
2.6.3 Concentration of double bonds .............................................................................. 31
2.6.4 Concentration of hydrogen peroxide content........................................................ 31
2.6.5 Concentration of acid ............................................................................................. 31
2.7 Modeling section ........................................................................................................... 32
II
Chapter III Influence of ring opening reactions on the kinetics of bio-based cottonseed oil
epoxidation .............................................................................................................................. 33
3.1 Introduction ................................................................................................................... 33
3.2 Experimental section ..................................................................................................... 34
3.3 Results and discussion ................................................................................................... 37
3.3.1 Kinetic study experiments ...................................................................................... 37
3.3.2 Kinetic model .......................................................................................................... 40
3.3.3 Influence of the configuration on ring opening products distribution .................. 53
3.4 Conclusion ..................................................................................................................... 56
Chapter IV Interaction between functional groups and physicochemical properties:
application to vegetable oils and their epoxidized and carbonated derivatives .................... 57
4.1 Introduction ................................................................................................................... 57
4.2 Experimental section ..................................................................................................... 58
4.3. Results and discussion .................................................................................................. 59
4.3.1 Refractive index ...................................................................................................... 59
4.3.2 Density .................................................................................................................... 61
4.3.3 Viscosity .................................................................................................................. 63
4.3.4 Specific heat capacity ............................................................................................. 66
4.3.5 Effects of functional groups in the mixing .............................................................. 70
4.4. Conclusion .................................................................................................................... 74
Chapter V Carbonation of epoxidized vegetable oils ............................................................. 75
5.1 Introduction ................................................................................................................... 75
5.2 Experimental section ..................................................................................................... 75
5.2.1 Preparation of the epoxidized compound .............................................................. 75
5.2.2 Kinetic study of carbonation reaction .................................................................... 75
5.2.3 Mass transfer study for CO2 ................................................................................... 76
5.3 Results and discussion ................................................................................................... 79
5.3.1 Preliminary kinetic experiments ............................................................................. 79
5.3.2 Kinetic model principles ......................................................................................... 83
5.3.3 Mass transfer experiments ..................................................................................... 85
5.3.4 Mass transfer model ............................................................................................... 94
5.3.5 Kinetic model .......................................................................................................... 98
5.4 Conclusions .................................................................................................................. 104
Chapter VI Structure-reactivity: comparison between vegetable oils and fatty acid methyl
ester ....................................................................................................................................... 105
III
6.1 Introduction ................................................................................................................. 105
6.2 Experimental section ................................................................................................... 105
6.2.1 Measurement of CO2 Solubility ............................................................................ 106
6.2.2 Carbonation kinetics ............................................................................................. 107
6.2.3 Analytical methods ............................................................................................... 109
6.3 Results and discussion ................................................................................................. 109
6.3.1 Comparison of physicochemical properties ......................................................... 109
6.3.2 Mass transfer comparison .................................................................................... 111
6.3.3 Kinetics comparison ............................................................................................. 121
6.4 Conclusion ................................................................................................................... 125
CONCLUSIONS ....................................................................................................................... 127
APPENDICES ........................................................................................................................... 129
Appendix I Interaction between functional groups and physicochemical properties ..... 129
Appendix II Carbonation of epoxidized vegetable oils ..................................................... 139
Appendix III Structure-reactivity: comparison between vegetable oils and fatty acid
methyl ester ...................................................................................................................... 141
NOTATION ............................................................................................................................. 147
GREEK LETTERS ...................................................................................................................... 148
SUBSCRIPTS AND SUPERSCRIPTS ........................................................................................... 149
ABBREVIATIONS ..................................................................................................................... 150
BIBLIOGRAPHY ....................................................................................................................... 151
LIST OF TABLES ................................................................................................................ 163
LIST OF FIGURES ............................................................................................................... 165

IV
1
Chapter I Literature review
1.1 Introduction
Nowadays, due to increasing standards of global environmental awareness, sustainable
industrialization based on the renewable resources becomes increasingly popular. It was
reported that, 90% of global organic chemicals will come from renewable materials by 2090
(Eissen et al., 2002).
Thus, renewable materials like plant fiber (Ramesh et al., 2017), fat (Alptekin and Canakci,
2010), vegetable oils (Tan and Chow, 2010), wood (Goldstein, 2018), polysaccharides (Kikuchi
and Komatsu, 2017) and microspheres (Hossain et al., 2015) are being investigated instead of
fossil fuels. Plenty of bio-based products are developed and commercialized, such as alcohols
(polyols, glycols, etc.) (Meylan et al., 2015), lubricant (Mikkelsen et al., 2010), stabilizer and
plasticizer for polymers (Aresta et al., 2014; Cuéllar-Franca and Azapagic, 2015; Jones et al.,
2014; Markewitz et al., 2012; Yang et al., 2012), toughener (Clark et al., 2016), epoxy blends
(Cheali et al., 2014) and so on. Among these bio-based green materials, vegetable oils are
very popular, due to their huge global feedstock, advantages of renewability, biodegradability,
low toxicity and comparably lower cost. During the past decades, these oils have attracted
much attention from researchers and chemical industrialists, who have found them to be a
renewable source of material for eco-friendly bio-based articles synthesis (Tan and Chow,
2010; Zhang et al., 2017).
Epoxidation and carbonation of vegetable oils were proved to be a good approach to combine
biomass and carbon dioxide valorization. Moreover, the capture and utilization of carbon
dioxide (CCU) in the chemical field is a promising solution with respect to the global warming
issue (Martens et al., 2017). However, to promote the use of vegetable oil and carbon dioxide
feedstocks at industrial scale, it is compulsory to gather physicochemical, kinetic and
thermodynamic data for better integration and cost optimization.
In this chapter, different species of vegetable oils commonly applied in industry and
valorization approaches of carbon dioxide were summarized. It is aimed to give a
comprehensive understanding to research background on the application of vegetable oils
and valorization of carbon dioxide. Besides, the review mainly focuses on the research
advances in epoxidation and carbonation of vegetable oils in terms of chemical structure,
preparation, characterization and physicochemical properties.
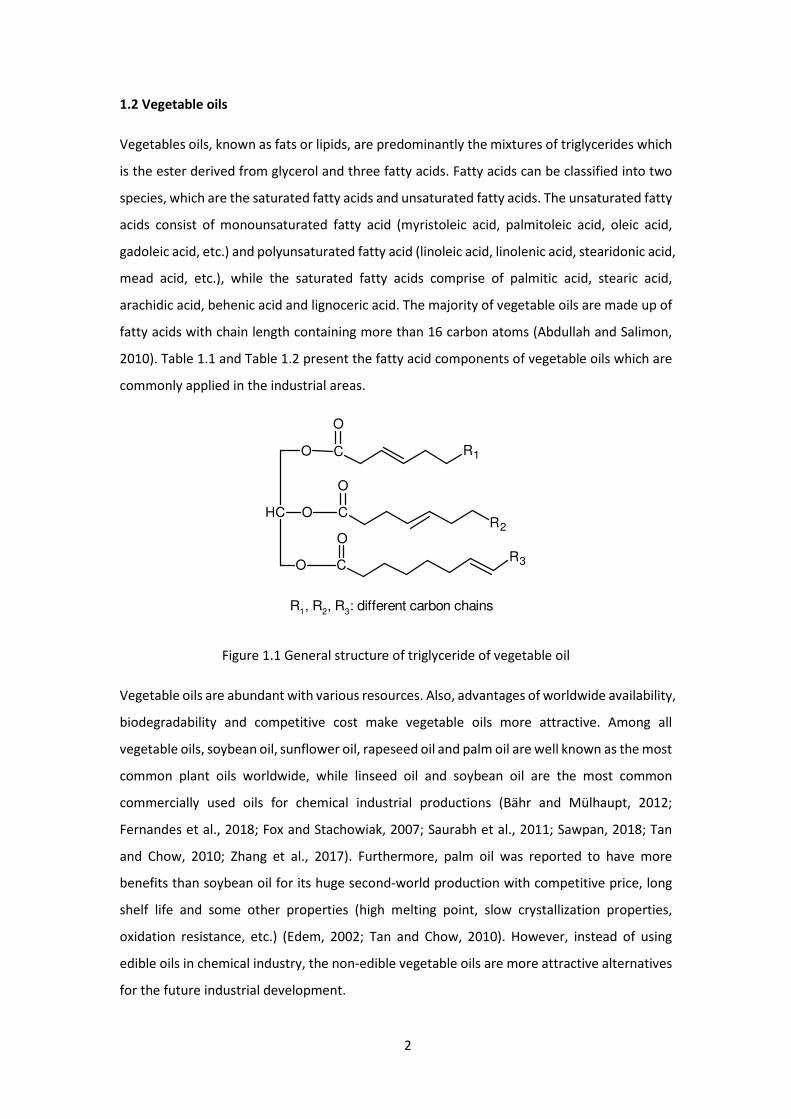
2
1.2 Vegetable oils
Vegetables oils, known as fats or lipids, are predominantly the mixtures of triglycerides which
is the ester derived from glycerol and three fatty acids. Fatty acids can be classified into two
species, which are the saturated fatty acids and unsaturated fatty acids. The unsaturated fatty
acids consist of monounsaturated fatty acid (myristoleic acid, palmitoleic acid, oleic acid,
gadoleic acid, etc.) and polyunsaturated fatty acid (linoleic acid, linolenic acid, stearidonic acid,
mead acid, etc.), while the saturated fatty acids comprise of palmitic acid, stearic acid,
arachidic acid, behenic acid and lignoceric acid. The majority of vegetable oils are made up of
fatty acids with chain length containing more than 16 carbon atoms (Abdullah and Salimon,
2010). Table 1.1 and Table 1.2 present the fatty acid components of vegetable oils which are
commonly applied in the industrial areas.
CH O C
O
O
O
C
C
O
O
R1
R3
R2
R1, R2, R3: different carbon chains
Figure 1.1 General structure of triglyceride of vegetable oil
Vegetable oils are abundant with various resources. Also, advantages of worldwide availability,
biodegradability and competitive cost make vegetable oils more attractive. Among all
vegetable oils, soybean oil, sunflower oil, rapeseed oil and palm oil are well known as the most
common plant oils worldwide, while linseed oil and soybean oil are the most common
commercially used oils for chemical industrial productions (Bähr and Mülhaupt, 2012;
Fernandes et al., 2018; Fox and Stachowiak, 2007; Saurabh et al., 2011; Sawpan, 2018; Tan
and Chow, 2010; Zhang et al., 2017). Furthermore, palm oil was reported to have more
benefits than soybean oil for its huge second-world production with competitive price, long
shelf life and some other properties (high melting point, slow crystallization properties,
oxidation resistance, etc.) (Edem, 2002; Tan and Chow, 2010). However, instead of using
edible oils in chemical industry, the non-edible vegetable oils are more attractive alternatives
for the future industrial development.
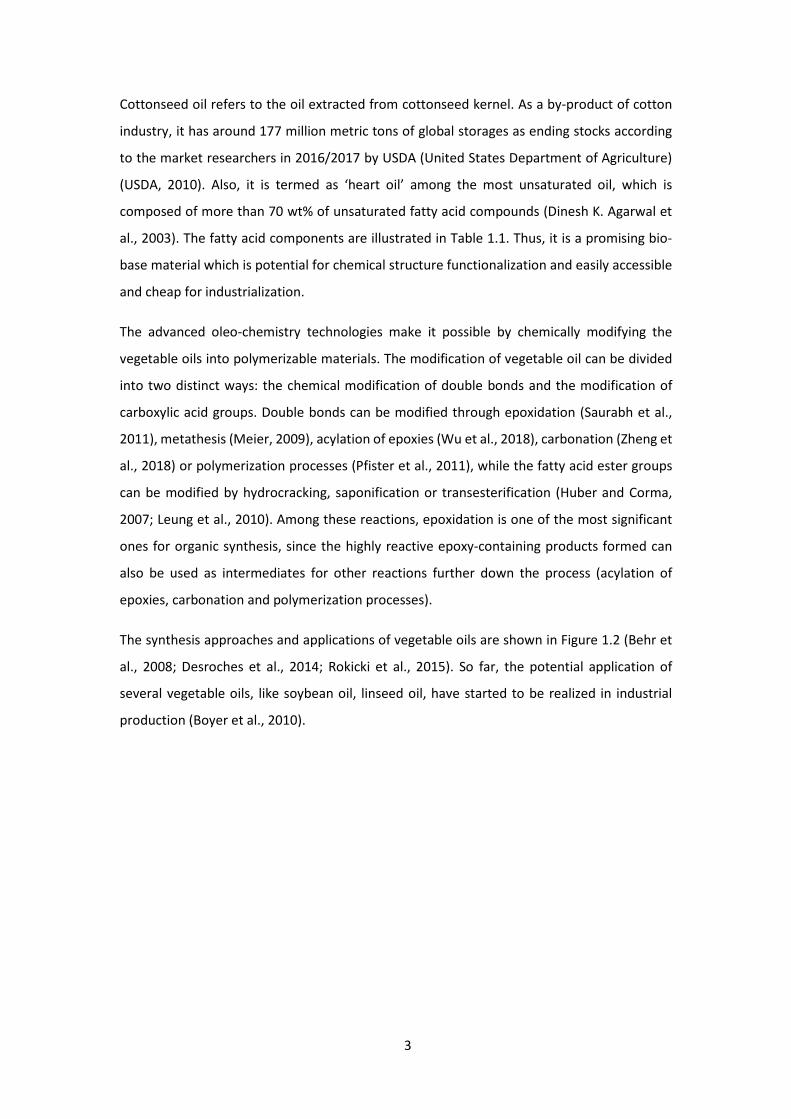
3
Cottonseed oil refers to the oil extracted from cottonseed kernel. As a by-product of cotton
industry, it has around 177 million metric tons of global storages as ending stocks according
to the market researchers in 2016/2017 by USDA (United States Department of Agriculture)
(USDA, 2010). Also, it is termed as ‘heart oil’ among the most unsaturated oil, which is
composed of more than 70 wt% of unsaturated fatty acid compounds (Dinesh K. Agarwal et
al., 2003). The fatty acid components are illustrated in Table 1.1. Thus, it is a promising bio-
base material which is potential for chemical structure functionalization and easily accessible
and cheap for industrialization.
The advanced oleo-chemistry technologies make it possible by chemically modifying the
vegetable oils into polymerizable materials. The modification of vegetable oil can be divided
into two distinct ways: the chemical modification of double bonds and the modification of
carboxylic acid groups. Double bonds can be modified through epoxidation (Saurabh et al.,
2011), metathesis (Meier, 2009), acylation of epoxies (Wu et al., 2018), carbonation (Zheng et
al., 2018) or polymerization processes (Pfister et al., 2011), while the fatty acid ester groups
can be modified by hydrocracking, saponification or transesterification (Huber and Corma,
2007; Leung et al., 2010). Among these reactions, epoxidation is one of the most significant
ones for organic synthesis, since the highly reactive epoxy-containing products formed can
also be used as intermediates for other reactions further down the process (acylation of
epoxies, carbonation and polymerization processes).
The synthesis approaches and applications of vegetable oils are shown in Figure 1.2 (Behr et
al., 2008; Desroches et al., 2014; Rokicki et al., 2015). So far, the potential application of
several vegetable oils, like soybean oil, linseed oil, have started to be realized in industrial
production (Boyer et al., 2010).
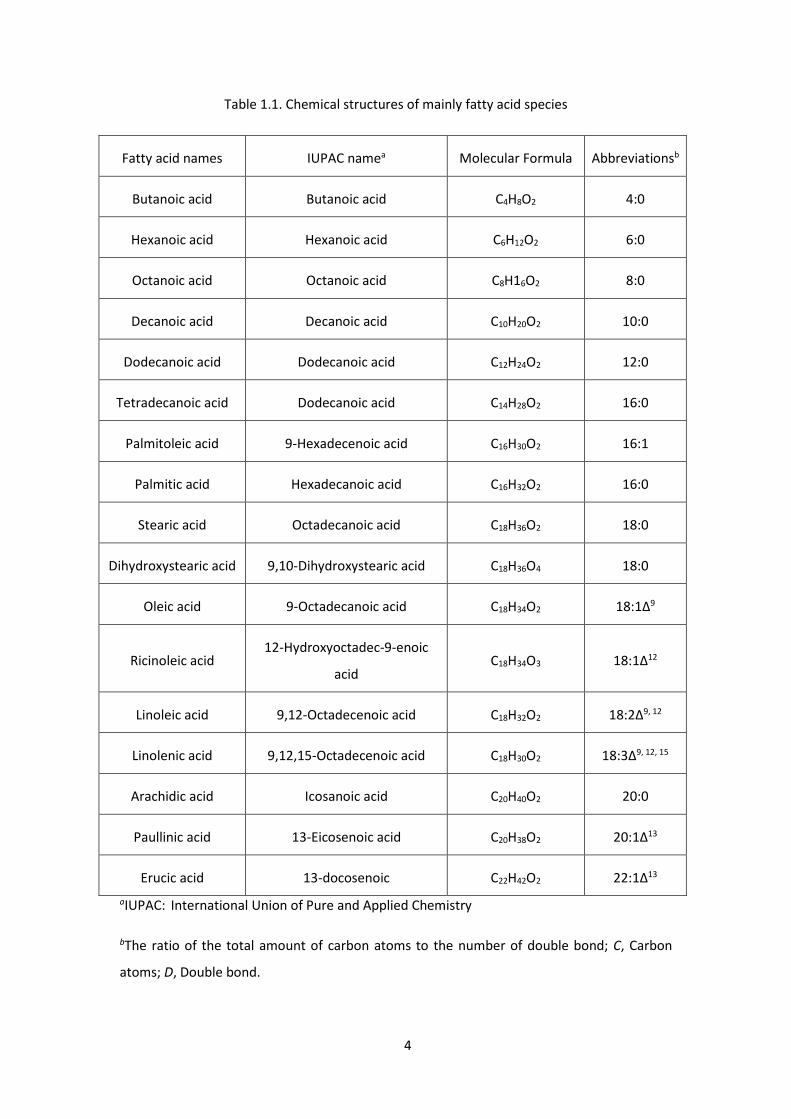
4
Table 1.1. Chemical structures of mainly fatty acid species
Fatty acid names IUPAC namea Molecular Formula Abbreviationsb
Butanoic acid Butanoic acid C4H8O2 4:0
Hexanoic acid Hexanoic acid C6H12O2 6:0
Octanoic acid Octanoic acid C8H16O2 8:0
Decanoic acid Decanoic acid C10H20O2 10:0
Dodecanoic acid Dodecanoic acid C12H24O2 12:0
Tetradecanoic acid Dodecanoic acid C14H28O2 16:0
Palmitoleic acid 9-Hexadecenoic acid C16H30O2 16:1
Palmitic acid Hexadecanoic acid C16H32O2 16:0
Stearic acid Octadecanoic acid C18H36O2 18:0
Dihydroxystearic acid 9,10-Dihydroxystearic acid C18H36O4 18:0
Oleic acid 9-Octadecanoic acid C18H34O2 18:1∆9
Ricinoleic acid 12-Hydroxyoctadec-9-enoic
acid C18H34O3 18:1∆12
Linoleic acid 9,12-Octadecenoic acid C18H32O2 18:2∆9, 12
Linolenic acid 9,12,15-Octadecenoic acid C18H30O2 18:3∆9, 12, 15
Arachidic acid Icosanoic acid C20H40O2 20:0
Paullinic acid 13-Eicosenoic acid C20H38O2 20:1∆13
Erucic acid 13-docosenoic C22H42O2 22:1∆13
aIUPAC: International Union of Pure and Applied Chemistry
bThe ratio of the total amount of carbon atoms to the number of double bond; C, Carbon
atoms; D, Double bond.
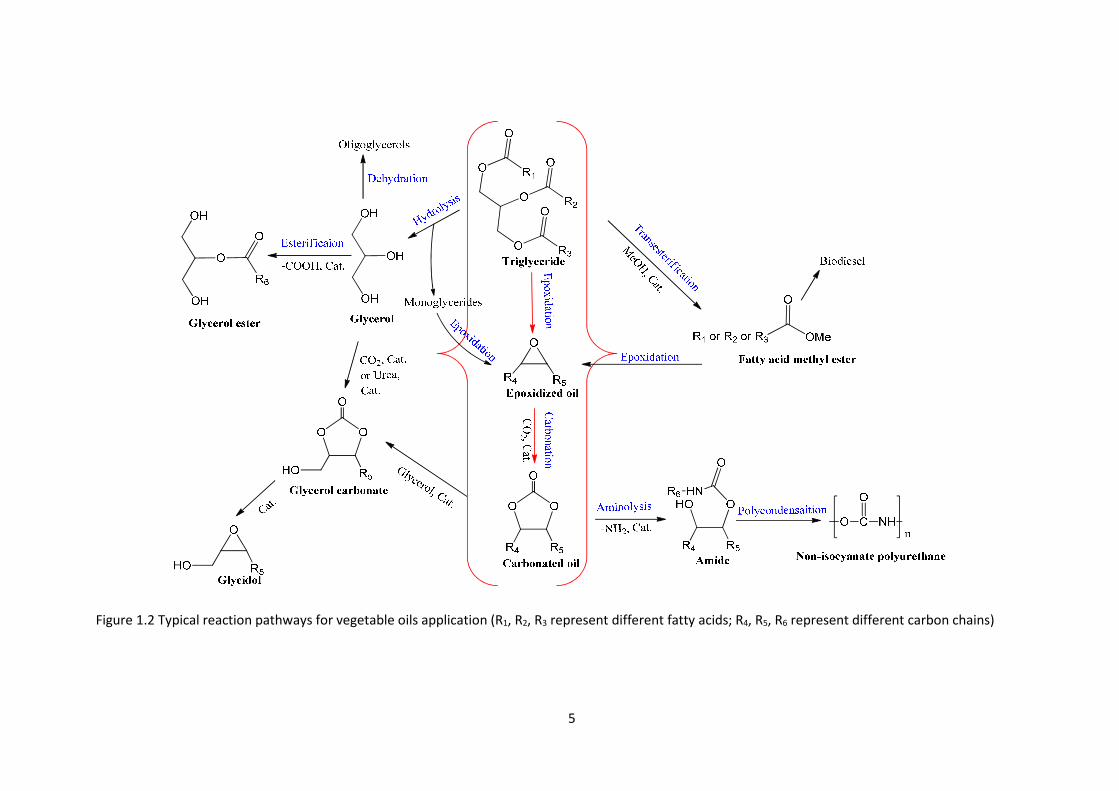
5
Figure 1.2 Typical reaction pathways for vegetable oils application (R1, R2, R3 represent different fatty acids; R4, R5, R6 represent different carbon chains)
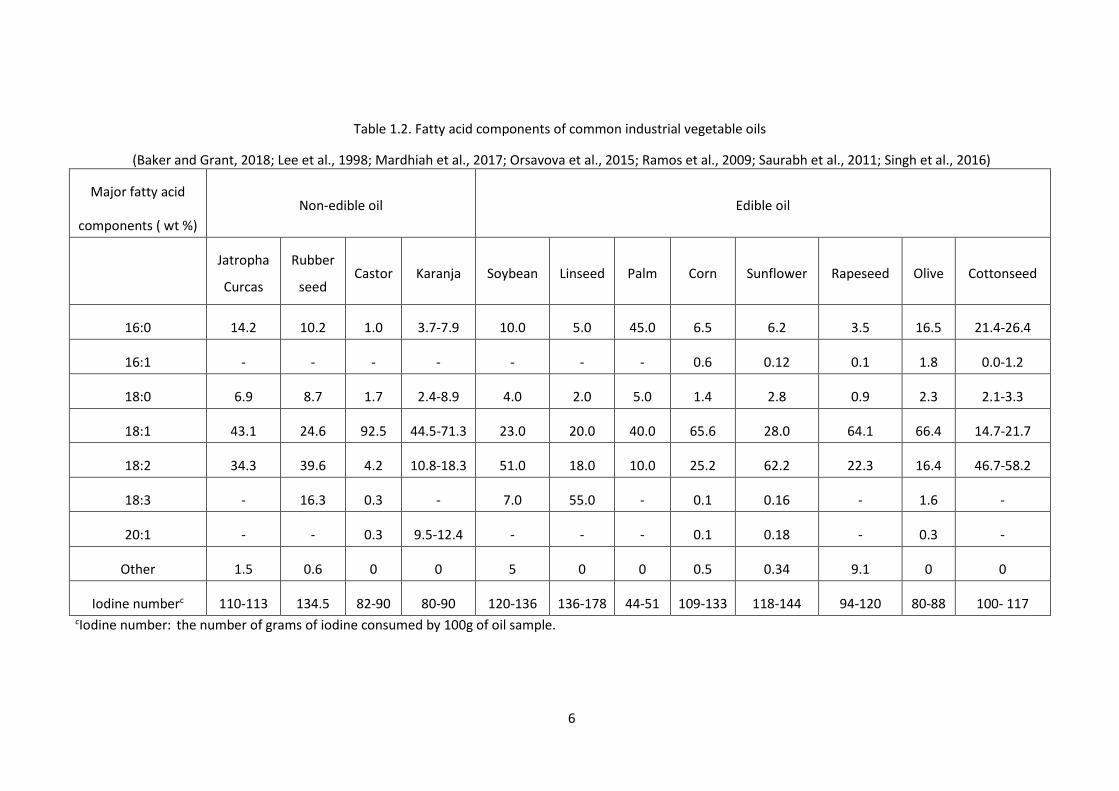
6
Table 1.2. Fatty acid components of common industrial vegetable oils
(Baker and Grant, 2018; Lee et al., 1998; Mardhiah et al., 2017; Orsavova et al., 2015; Ramos et al., 2009; Saurabh et al., 2011; Singh et al., 2016)
Major fatty acid
components ( wt %)
Non-edible oil Edible oil
Jatropha
Curcas
Rubber
seed Castor Karanja Soybean Linseed Palm Corn Sunflower Rapeseed Olive Cottonseed
16:0 14.2 10.2 1.0 3.7-7.9 10.0 5.0 45.0 6.5 6.2 3.5 16.5 21.4-26.4
16:1 - - - - - - - 0.6 0.12 0.1 1.8 0.0-1.2
18:0 6.9 8.7 1.7 2.4-8.9 4.0 2.0 5.0 1.4 2.8 0.9 2.3 2.1-3.3
18:1 43.1 24.6 92.5 44.5-71.3 23.0 20.0 40.0 65.6 28.0 64.1 66.4 14.7-21.7
18:2 34.3 39.6 4.2 10.8-18.3 51.0 18.0 10.0 25.2 62.2 22.3 16.4 46.7-58.2
18:3 - 16.3 0.3 - 7.0 55.0 - 0.1 0.16 - 1.6 -
20:1 - - 0.3 9.5-12.4 - - - 0.1 0.18 - 0.3 -
Other 1.5 0.6 0 0 5 0 0 0.5 0.34 9.1 0 0
Iodine numberc 110-113 134.5 82-90 80-90 120-136 136-178 44-51 109-133 118-144 94-120 80-88 100- 117 cIodine number: the number of grams of iodine consumed by 100g of oil sample.
7
1.3 Biomass and CO2 valorization
The chemical structure modifications of vegetable oils are effective way to achieve the
biomass valorization. Transesterification of vegetable oils (soybean oil, palm oil, cottonseed
oil, sunflower oil, rapeseed oil, etc.) is the most promising way to produce biodiesel fuels (Kim
et al., 2004; Pinzi et al., 2009; Singh and Singh, 2010). For the production of biodiesel fuels by
the transesterification of soybean oil is already industrialized (Fukuda et al., 2001; Körbitz,
1999), and polymerization of vegetable oils, which consists of epoxidation, carbonation and
polymerization processes, has been considered as a potential way to produce polyols and
polyurethanes (Petrović, 2008). Also, diverse applications from vegetable oil and its
epoxidized, carbonated derivatives were made in industry, e.g., epoxidized and carbonated
vegetable oils can be used as precursor of lubricant (Panchal et al., 2017) and plasticizer
(Thakur et al., 2017), thermoplastic elastomers and thermosetting polymers (Fernandes et al.,
2018; Islam et al., 2014).
Carbon dioxide is an example of chemically quite stable waste products. The annual
anthropogenic production of CO2 is 32 Gt, but only 0.2 Gt of CO2 is used as raw materials in
industry (de Haro et al., 2016). The high stability of the carbon dioxide molecule makes its
chemical conversion very difficult. How CO2 should be valorized to be economically and
environmentally viable?
Fortunately, carbon dioxide can be used as a reagent in some industrial processes such as
production of urea, methanol and inorganic carbonate (Lathi and Mattiasson, 2007).
Academic and industrial communities are working on this molecule to turn it into an attractive
raw material. Then, it will be possible to develop a circular consumption of CO2 at industrial
scale. The use of CO2 is well perceived from public (Rodis et al., 2002), and the not-in-my-
backyard syndrome could be avoided.
Review articles seem to favor the Carbon Capture and Utilization (CCU) instead of Carbon
Capture and Storage (CCS) (Carbonell-Verdu et al., 2016; Jin and Park, 2007; Kolanthai et al.,
2015; Rodis et al., 2002; Xia and Larock, 2010). From an economic viewpoint, CCU activities
lead to the production of chemicals/fuels which can generate profit. Such business activities
could lead to a circular economy based on CO2. The only storage of CO2 in different kinds of
reservoir does not generate profit, but the injection of CO2 to recover oil like in the process of
Enhanced Oil Recovery (EOR) might be profitable. From an environmental viewpoint, it is
important to store the captured CO2 for a long-term, CCS technology could overcome this
8
problem but the risk of leakage is still under debate. The challenge for CCU activity is the
development of process with low environmental impact. As noticed by Cuéllar-Franca and
Azapagic (Cuéllar-Franca and Azapagic, 2015), CCU technology should privilege the
development of materials and products with longer lifetimes, such as polymers
(polycarbonate or polyurethane).
The promotion of biomass or/and CO2 valorization processes involves the knowledge of the
kinetics and the thermodynamics of the chemical transformations (Cheali et al., 2014). Indeed,
these data are needed for the process design and early conception stages for energy
integration and cost evaluation (Souza et al., 2014). Processes based on biomass or CO2 can
be highly energy-demanding, thus one should have a synthetic view on the processes to
diminish the energy consumption.
1.4 Epoxidation of vegetable oils
During the past decades, the use of epoxidized vegetable oils has been popular and more
desirable for industrial development (Abdullah and Salimon, 2010; Desroches et al., 2014; Fox
and Stachowiak, 2007). They have been widely used in chemical industry, such as plasticizers
and stabilizers for environmentally friendly polymers, additives for lubricant, and precursors
or intermediates for urethane and so on (Carbonell-Verdu et al., 2016; Chandrasekara et al.,
2011; Saurabh et al., 2011; Tan and Chow, 2010). Figure 1.4 illustrates typical products derived
from epoxidized vegetable oils, like ring opening products, aminolysis products, hydrolysis
products, carbonation products, which could be further used as starting materials for the
production of bio-lubricants or additives for lubricants (Karmakar et al., 2017).
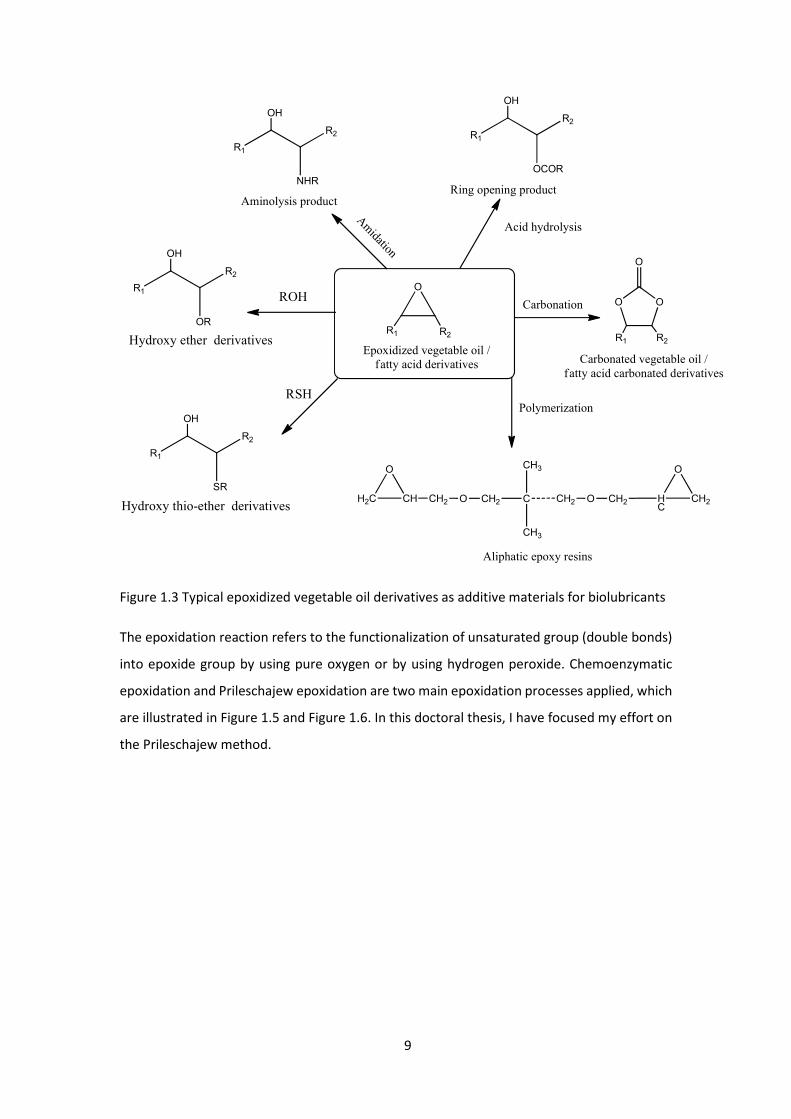
9
Figure 1.3 Typical epoxidized vegetable oil derivatives as additive materials for biolubricants
The epoxidation reaction refers to the functionalization of unsaturated group (double bonds)
into epoxide group by using pure oxygen or by using hydrogen peroxide. Chemoenzymatic
epoxidation and Prileschajew epoxidation are two main epoxidation processes applied, which
are illustrated in Figure 1.5 and Figure 1.6. In this doctoral thesis, I have focused my effort on
the Prileschajew method.
Epoxidized vegetable oil /
fatty acid derivatives
O
R1 R2
Carbonation
Carbonated vegetable oil /
fatty acid carbonated derivatives
OO
R1 R2
O
Polymerization
Aliphatic epoxy resins
O
H2C CH CH2 O CH2 C
CH3
CH3
CH2 O CH2
O
HC
CH2
Acid hydrolysis
R1
R2
OH
OCOR
Ring opening product
Amidation
R1
R2
OH
NHR
Aminolysis product
R1
R2
OH
OR
Hydroxy ether derivatives
ROH
R1
R2
OH
SR
Hydroxy thio-ether derivatives
RSH
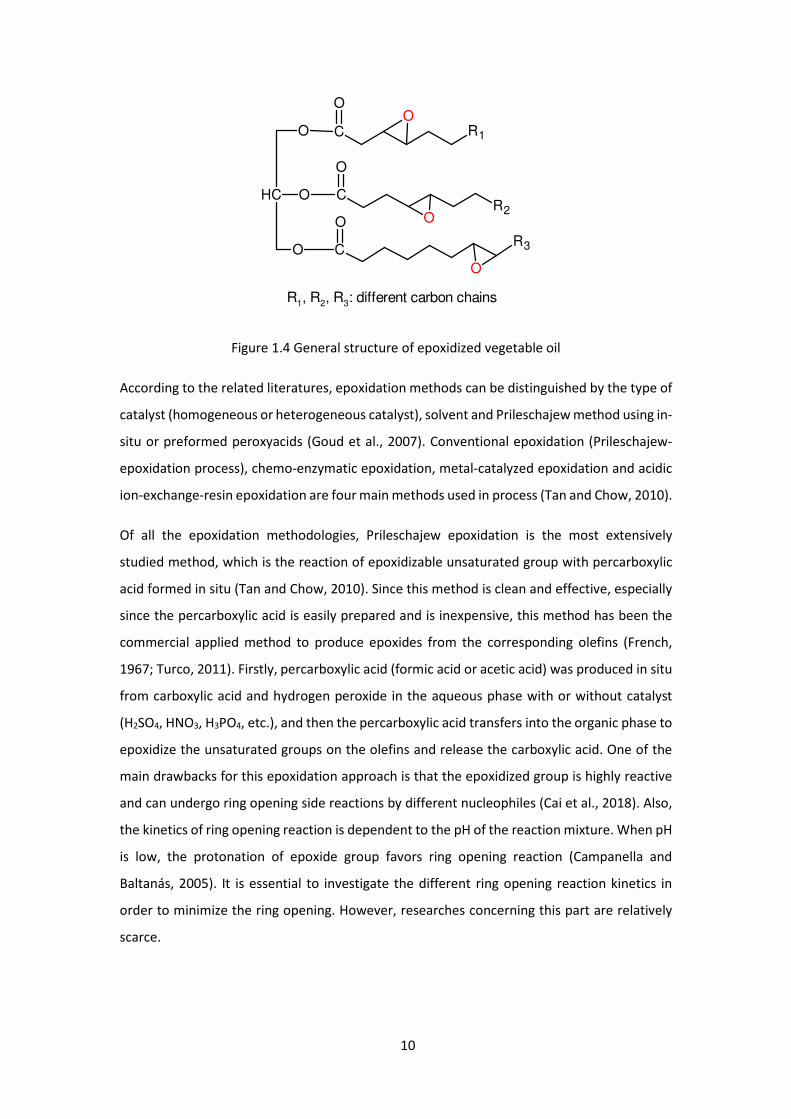
10
CH O C
O
O
O
O
C
C
O
O
R1
O
R3
R2
O
R1, R2, R3: different carbon chains
Figure 1.4 General structure of epoxidized vegetable oil
According to the related literatures, epoxidation methods can be distinguished by the type of
catalyst (homogeneous or heterogeneous catalyst), solvent and Prileschajew method using in-
situ or preformed peroxyacids (Goud et al., 2007). Conventional epoxidation (Prileschajew-
epoxidation process), chemo-enzymatic epoxidation, metal-catalyzed epoxidation and acidic
ion-exchange-resin epoxidation are four main methods used in process (Tan and Chow, 2010).
Of all the epoxidation methodologies, Prileschajew epoxidation is the most extensively
studied method, which is the reaction of epoxidizable unsaturated group with percarboxylic
acid formed in situ (Tan and Chow, 2010). Since this method is clean and effective, especially
since the percarboxylic acid is easily prepared and is inexpensive, this method has been the
commercial applied method to produce epoxides from the corresponding olefins (French,
1967; Turco, 2011). Firstly, percarboxylic acid (formic acid or acetic acid) was produced in situ
from carboxylic acid and hydrogen peroxide in the aqueous phase with or without catalyst
(H2SO4, HNO3, H3PO4, etc.), and then the percarboxylic acid transfers into the organic phase to
epoxidize the unsaturated groups on the olefins and release the carboxylic acid. One of the
main drawbacks for this epoxidation approach is that the epoxidized group is highly reactive
and can undergo ring opening side reactions by different nucleophiles (Cai et al., 2018). Also,
the kinetics of ring opening reaction is dependent to the pH of the reaction mixture. When pH
is low, the protonation of epoxide group favors ring opening reaction (Campanella and
Baltanás, 2005). It is essential to investigate the different ring opening reaction kinetics in
order to minimize the ring opening. However, researches concerning this part are relatively
scarce.
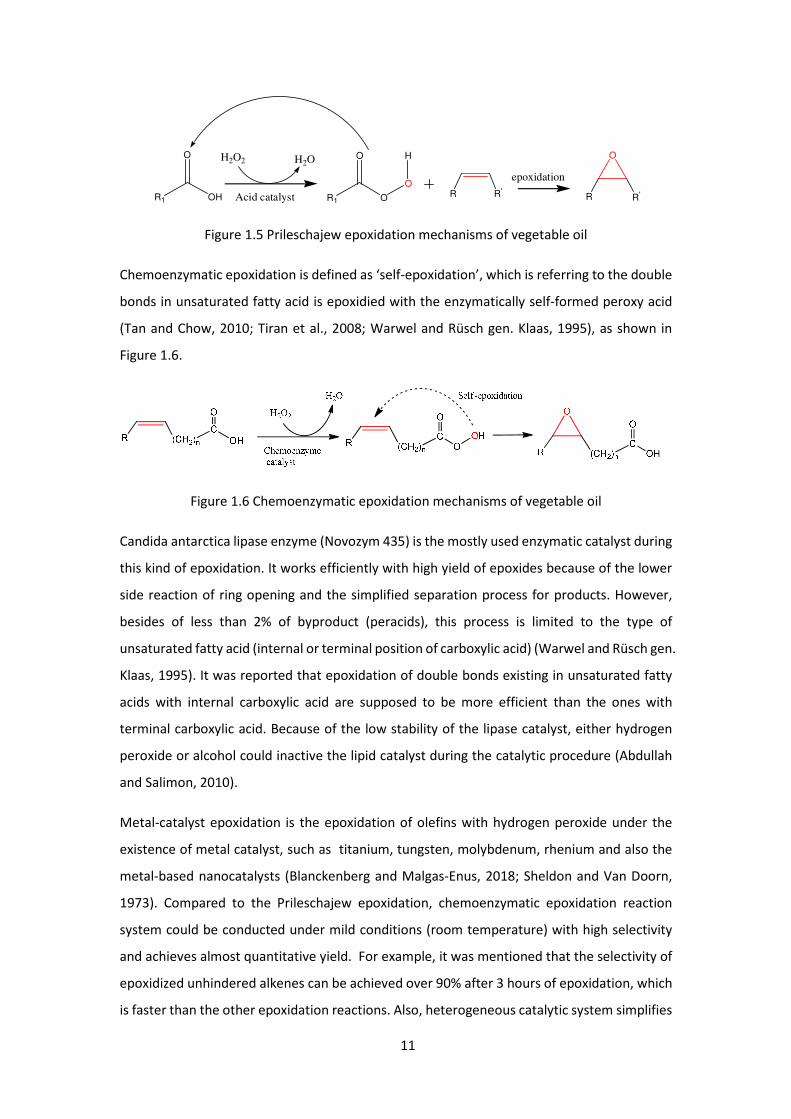
11
R1 OH
O
R1 O
O
O HH2O2 H2O
Acid catalyst R R'R R'
O
epoxidation
Figure 1.5 Prileschajew epoxidation mechanisms of vegetable oil
Chemoenzymatic epoxidation is defined as ‘self-epoxidation’, which is referring to the double
bonds in unsaturated fatty acid is epoxidied with the enzymatically self-formed peroxy acid
(Tan and Chow, 2010; Tiran et al., 2008; Warwel and Rüsch gen. Klaas, 1995), as shown in
Figure 1.6.
Figure 1.6 Chemoenzymatic epoxidation mechanisms of vegetable oil
Candida antarctica lipase enzyme (Novozym 435) is the mostly used enzymatic catalyst during
this kind of epoxidation. It works efficiently with high yield of epoxides because of the lower
side reaction of ring opening and the simplified separation process for products. However,
besides of less than 2% of byproduct (peracids), this process is limited to the type of
unsaturated fatty acid (internal or terminal position of carboxylic acid) (Warwel and Rüsch gen.
Klaas, 1995). It was reported that epoxidation of double bonds existing in unsaturated fatty
acids with internal carboxylic acid are supposed to be more efficient than the ones with
terminal carboxylic acid. Because of the low stability of the lipase catalyst, either hydrogen
peroxide or alcohol could inactive the lipid catalyst during the catalytic procedure (Abdullah
and Salimon, 2010).
Metal-catalyst epoxidation is the epoxidation of olefins with hydrogen peroxide under the
existence of metal catalyst, such as titanium, tungsten, molybdenum, rhenium and also the
metal-based nanocatalysts (Blanckenberg and Malgas-Enus, 2018; Sheldon and Van Doorn,
1973). Compared to the Prileschajew epoxidation, chemoenzymatic epoxidation reaction
system could be conducted under mild conditions (room temperature) with high selectivity
and achieves almost quantitative yield. For example, it was mentioned that the selectivity of
epoxidized unhindered alkenes can be achieved over 90% after 3 hours of epoxidation, which
is faster than the other epoxidation reactions. Also, heterogeneous catalytic system simplifies
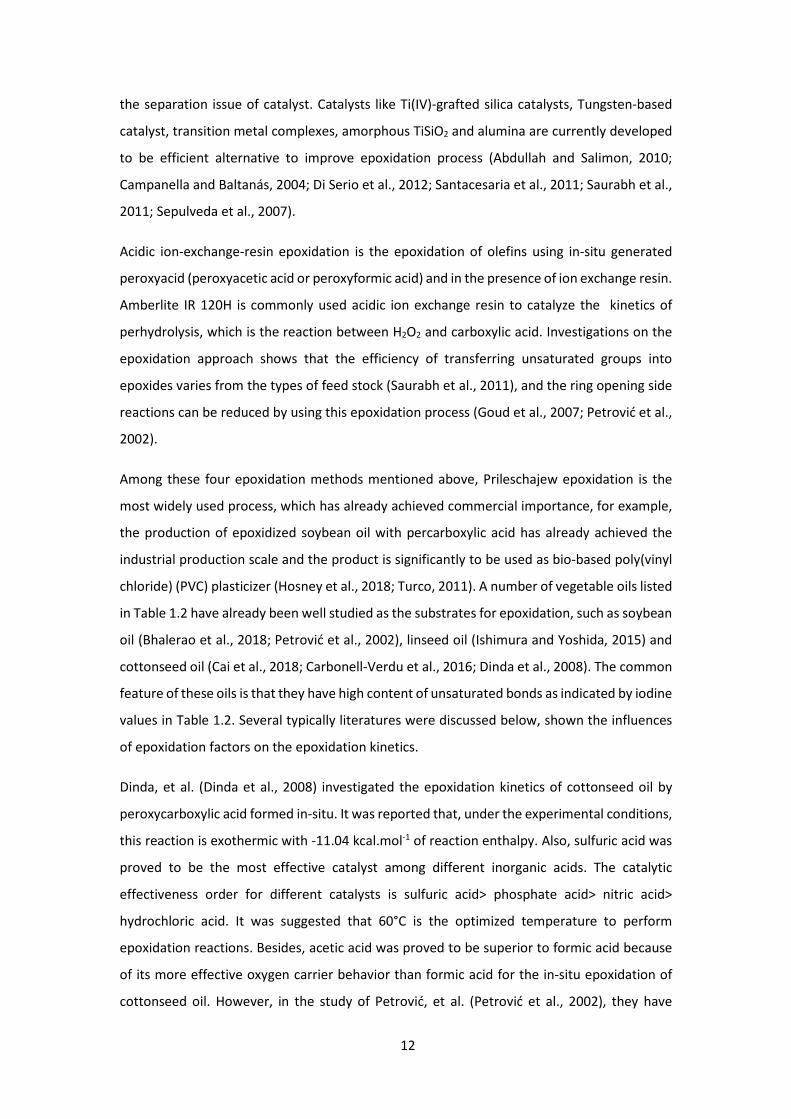
12
the separation issue of catalyst. Catalysts like Ti(IV)-grafted silica catalysts, Tungsten-based
catalyst, transition metal complexes, amorphous TiSiO2 and alumina are currently developed
to be efficient alternative to improve epoxidation process (Abdullah and Salimon, 2010;
Campanella and Baltanás, 2004; Di Serio et al., 2012; Santacesaria et al., 2011; Saurabh et al.,
2011; Sepulveda et al., 2007).
Acidic ion-exchange-resin epoxidation is the epoxidation of olefins using in-situ generated
peroxyacid (peroxyacetic acid or peroxyformic acid) and in the presence of ion exchange resin.
Amberlite IR 120H is commonly used acidic ion exchange resin to catalyze the kinetics of
perhydrolysis, which is the reaction between H2O2 and carboxylic acid. Investigations on the
epoxidation approach shows that the efficiency of transferring unsaturated groups into
epoxides varies from the types of feed stock (Saurabh et al., 2011), and the ring opening side
reactions can be reduced by using this epoxidation process (Goud et al., 2007; Petrović et al.,
2002).
Among these four epoxidation methods mentioned above, Prileschajew epoxidation is the
most widely used process, which has already achieved commercial importance, for example,
the production of epoxidized soybean oil with percarboxylic acid has already achieved the
industrial production scale and the product is significantly to be used as bio-based poly(vinyl
chloride) (PVC) plasticizer (Hosney et al., 2018; Turco, 2011). A number of vegetable oils listed
in Table 1.2 have already been well studied as the substrates for epoxidation, such as soybean
oil (Bhalerao et al., 2018; Petrović et al., 2002), linseed oil (Ishimura and Yoshida, 2015) and
cottonseed oil (Cai et al., 2018; Carbonell-Verdu et al., 2016; Dinda et al., 2008). The common
feature of these oils is that they have high content of unsaturated bonds as indicated by iodine
values in Table 1.2. Several typically literatures were discussed below, shown the influences
of epoxidation factors on the epoxidation kinetics.
Dinda, et al. (Dinda et al., 2008) investigated the epoxidation kinetics of cottonseed oil by
peroxycarboxylic acid formed in-situ. It was reported that, under the experimental conditions,
this reaction is exothermic with -11.04 kcal.mol-1 of reaction enthalpy. Also, sulfuric acid was
proved to be the most effective catalyst among different inorganic acids. The catalytic
effectiveness order for different catalysts is sulfuric acid> phosphate acid> nitric acid>
hydrochloric acid. It was suggested that 60°C is the optimized temperature to perform
epoxidation reactions. Besides, acetic acid was proved to be superior to formic acid because
of its more effective oxygen carrier behavior than formic acid for the in-situ epoxidation of
cottonseed oil. However, in the study of Petrović, et al. (Petrović et al., 2002), they have
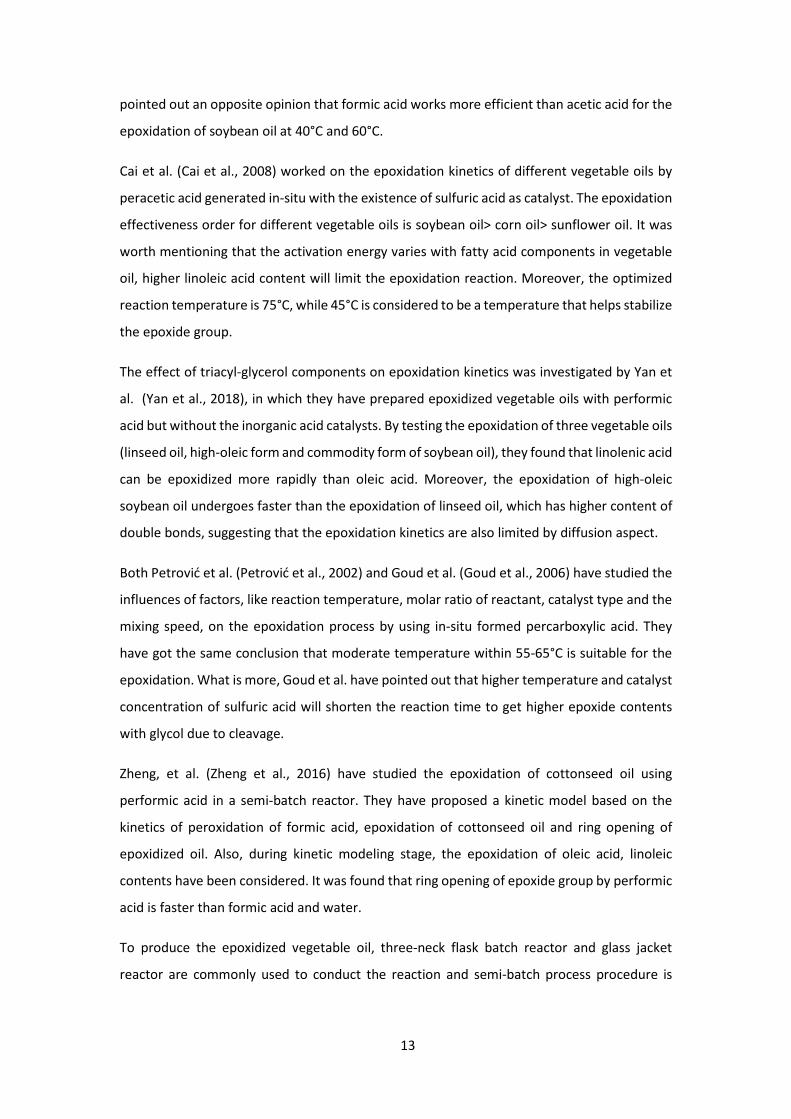
13
pointed out an opposite opinion that formic acid works more efficient than acetic acid for the
epoxidation of soybean oil at 40°C and 60°C.
Cai et al. (Cai et al., 2008) worked on the epoxidation kinetics of different vegetable oils by
peracetic acid generated in-situ with the existence of sulfuric acid as catalyst. The epoxidation
effectiveness order for different vegetable oils is soybean oil> corn oil> sunflower oil. It was
worth mentioning that the activation energy varies with fatty acid components in vegetable
oil, higher linoleic acid content will limit the epoxidation reaction. Moreover, the optimized
reaction temperature is 75°C, while 45°C is considered to be a temperature that helps stabilize
the epoxide group.
The effect of triacyl-glycerol components on epoxidation kinetics was investigated by Yan et
al. (Yan et al., 2018), in which they have prepared epoxidized vegetable oils with performic
acid but without the inorganic acid catalysts. By testing the epoxidation of three vegetable oils
(linseed oil, high-oleic form and commodity form of soybean oil), they found that linolenic acid
can be epoxidized more rapidly than oleic acid. Moreover, the epoxidation of high-oleic
soybean oil undergoes faster than the epoxidation of linseed oil, which has higher content of
double bonds, suggesting that the epoxidation kinetics are also limited by diffusion aspect.
Both Petrović et al. (Petrović et al., 2002) and Goud et al. (Goud et al., 2006) have studied the
influences of factors, like reaction temperature, molar ratio of reactant, catalyst type and the
mixing speed, on the epoxidation process by using in-situ formed percarboxylic acid. They
have got the same conclusion that moderate temperature within 55-65°C is suitable for the
epoxidation. What is more, Goud et al. have pointed out that higher temperature and catalyst
concentration of sulfuric acid will shorten the reaction time to get higher epoxide contents
with glycol due to cleavage.
Zheng, et al. (Zheng et al., 2016) have studied the epoxidation of cottonseed oil using
performic acid in a semi-batch reactor. They have proposed a kinetic model based on the
kinetics of peroxidation of formic acid, epoxidation of cottonseed oil and ring opening of
epoxidized oil. Also, during kinetic modeling stage, the epoxidation of oleic acid, linoleic
contents have been considered. It was found that ring opening of epoxide group by performic
acid is faster than formic acid and water.
To produce the epoxidized vegetable oil, three-neck flask batch reactor and glass jacket
reactor are commonly used to conduct the reaction and semi-batch process procedure is
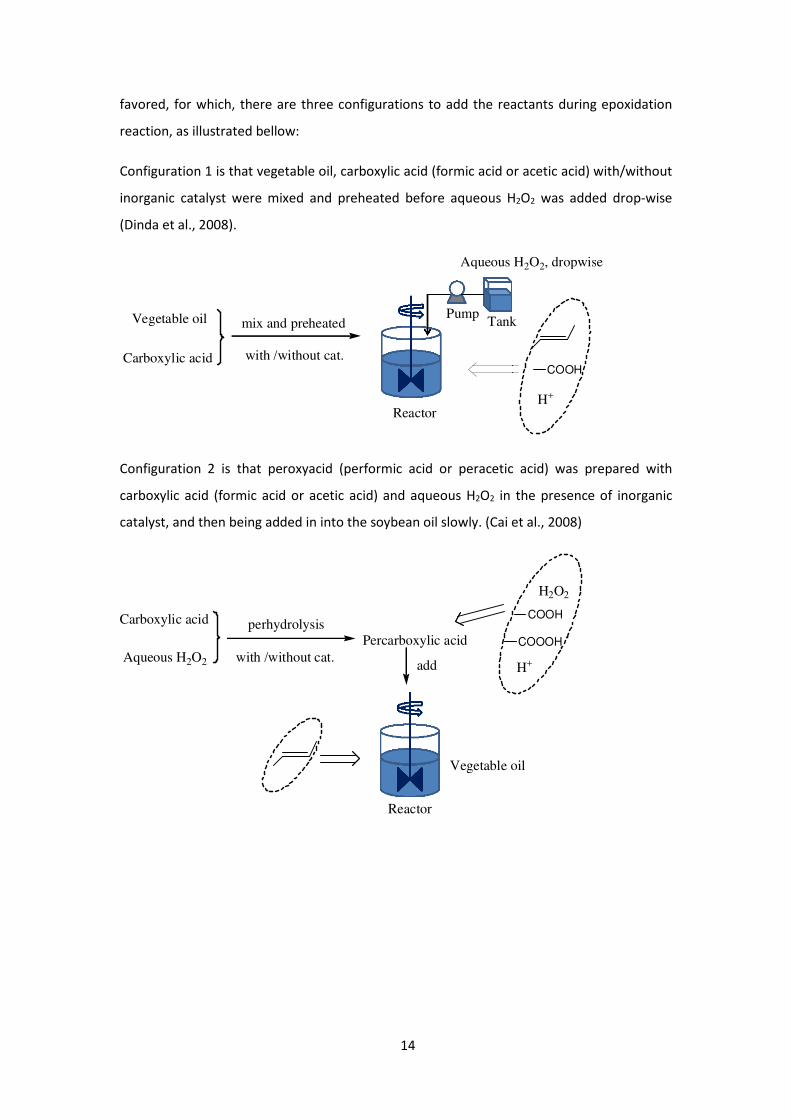
14
favored, for which, there are three configurations to add the reactants during epoxidation
reaction, as illustrated bellow:
Configuration 1 is that vegetable oil, carboxylic acid (formic acid or acetic acid) with/without
inorganic catalyst were mixed and preheated before aqueous H2O2 was added drop-wise
(Dinda et al., 2008).
Vegetable oil
Carboxylic acid
mix and preheated
Aqueous H2O2, dropwise
with /without cat.COOH
H+
Reactor
TankPump
Configuration 2 is that peroxyacid (performic acid or peracetic acid) was prepared with
carboxylic acid (formic acid or acetic acid) and aqueous H2O2 in the presence of inorganic
catalyst, and then being added in into the soybean oil slowly. (Cai et al., 2008)
Vegetable oil
Carboxylic acid perhydrolysis
Aqueous H2O2 with /without cat.Percarboxylic acid
add
COOOH
H+
COOH
H2O2
Reactor
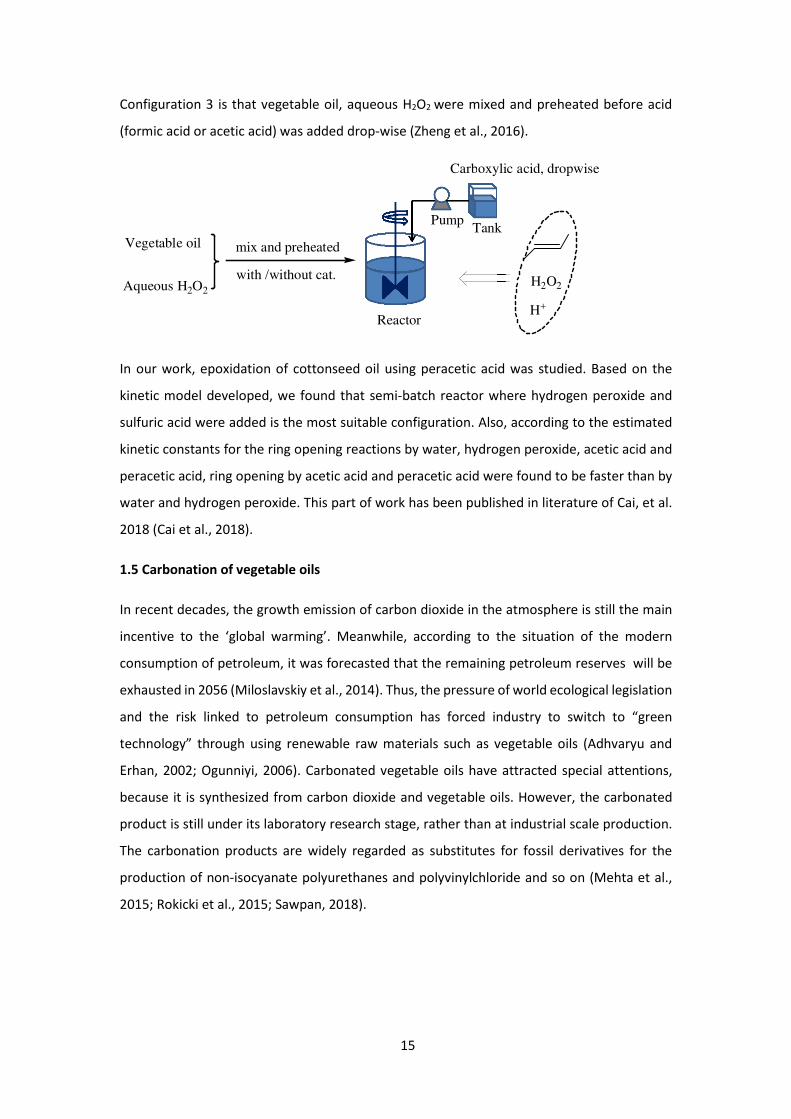
15
Configuration 3 is that vegetable oil, aqueous H2O2 were mixed and preheated before acid
(formic acid or acetic acid) was added drop-wise (Zheng et al., 2016).
Vegetable oil
Aqueous H2O2
mix and preheated
Carboxylic acid, dropwise
with /without cat. H2O2
H+
Reactor
TankPump
In our work, epoxidation of cottonseed oil using peracetic acid was studied. Based on the
kinetic model developed, we found that semi-batch reactor where hydrogen peroxide and
sulfuric acid were added is the most suitable configuration. Also, according to the estimated
kinetic constants for the ring opening reactions by water, hydrogen peroxide, acetic acid and
peracetic acid, ring opening by acetic acid and peracetic acid were found to be faster than by
water and hydrogen peroxide. This part of work has been published in literature of Cai, et al.
2018 (Cai et al., 2018).
1.5 Carbonation of vegetable oils
In recent decades, the growth emission of carbon dioxide in the atmosphere is still the main
incentive to the ‘global warming’. Meanwhile, according to the situation of the modern
consumption of petroleum, it was forecasted that the remaining petroleum reserves will be
exhausted in 2056 (Miloslavskiy et al., 2014). Thus, the pressure of world ecological legislation
and the risk linked to petroleum consumption has forced industry to switch to “green
technology” through using renewable raw materials such as vegetable oils (Adhvaryu and
Erhan, 2002; Ogunniyi, 2006). Carbonated vegetable oils have attracted special attentions,
because it is synthesized from carbon dioxide and vegetable oils. However, the carbonated
product is still under its laboratory research stage, rather than at industrial scale production.
The carbonation products are widely regarded as substitutes for fossil derivatives for the
production of non-isocyanate polyurethanes and polyvinylchloride and so on (Mehta et al.,
2015; Rokicki et al., 2015; Sawpan, 2018).
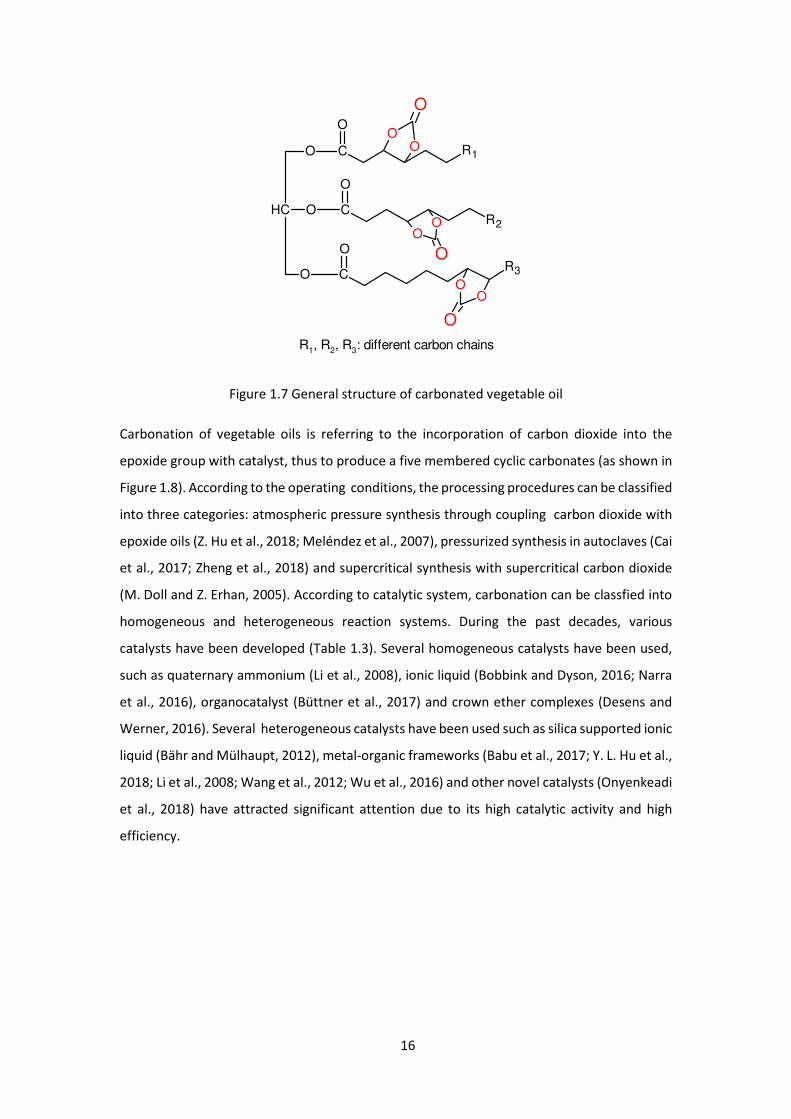
16
CH O C
O
O
O
C
C
O
O
R1
R3
R2
OO
OO
OO
O
O
O
R1, R2, R3: different carbon chains
Figure 1.7 General structure of carbonated vegetable oil
Carbonation of vegetable oils is referring to the incorporation of carbon dioxide into the
epoxide group with catalyst, thus to produce a five membered cyclic carbonates (as shown in
Figure 1.8). According to the operating conditions, the processing procedures can be classified
into three categories: atmospheric pressure synthesis through coupling carbon dioxide with
epoxide oils (Z. Hu et al., 2018; Meléndez et al., 2007), pressurized synthesis in autoclaves (Cai
et al., 2017; Zheng et al., 2018) and supercritical synthesis with supercritical carbon dioxide
(M. Doll and Z. Erhan, 2005). According to catalytic system, carbonation can be classfied into
homogeneous and heterogeneous reaction systems. During the past decades, various
catalysts have been developed (Table 1.3). Several homogeneous catalysts have been used,
such as quaternary ammonium (Li et al., 2008), ionic liquid (Bobbink and Dyson, 2016; Narra
et al., 2016), organocatalyst (Büttner et al., 2017) and crown ether complexes (Desens and
Werner, 2016). Several heterogeneous catalysts have been used such as silica supported ionic
liquid (Bähr and Mülhaupt, 2012), metal-organic frameworks (Babu et al., 2017; Y. L. Hu et al.,
2018; Li et al., 2008; Wang et al., 2012; Wu et al., 2016) and other novel catalysts (Onyenkeadi
et al., 2018) have attracted significant attention due to its high catalytic activity and high
efficiency.
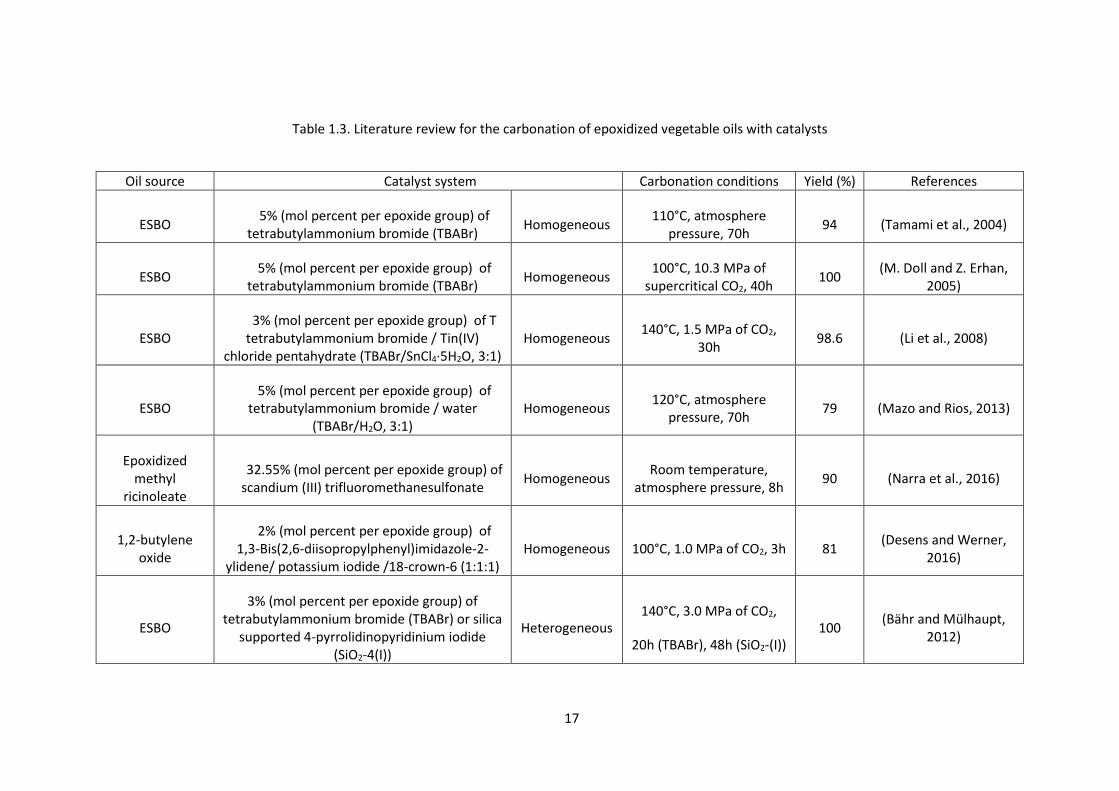
17
Table 1.3. Literature review for the carbonation of epoxidized vegetable oils with catalysts
Oil source Catalyst system Carbonation conditions Yield (%) References
ESBO 5% (mol percent per epoxide group) of
tetrabutylammonium bromide (TBABr) Homogeneous
110°C, atmosphere pressure, 70h
94 (Tamami et al., 2004)
ESBO 5% (mol percent per epoxide group) of
tetrabutylammonium bromide (TBABr) Homogeneous
100°C, 10.3 MPa of supercritical CO2, 40h
100 (M. Doll and Z. Erhan,
2005)
ESBO 3% (mol percent per epoxide group) of T
tetrabutylammonium bromide / Tin(IV) chloride pentahydrate (TBABr/SnCl4·5H2O, 3:1)
Homogeneous 140°C, 1.5 MPa of CO2,
30h 98.6 (Li et al., 2008)
ESBO 5% (mol percent per epoxide group) of
tetrabutylammonium bromide / water (TBABr/H2O, 3:1)
Homogeneous 120°C, atmosphere
pressure, 70h 79 (Mazo and Rios, 2013)
Epoxidized methyl
ricinoleate
32.55% (mol percent per epoxide group) of scandium (III) trifluoromethanesulfonate
Homogeneous Room temperature,
atmosphere pressure, 8h 90 (Narra et al., 2016)
1,2-butylene oxide
2% (mol percent per epoxide group) of 1,3-Bis(2,6-diisopropylphenyl)imidazole-2-
ylidene/ potassium iodide /18-crown-6 (1:1:1) Homogeneous 100°C, 1.0 MPa of CO2, 3h 81
(Desens and Werner, 2016)
ESBO
3% (mol percent per epoxide group) of tetrabutylammonium bromide (TBABr) or silica
supported 4-pyrrolidinopyridinium iodide (SiO2-4(I))
Heterogeneous 140°C, 3.0 MPa of CO2,
20h (TBABr), 48h (SiO2-(I)) 100
(Bähr and Mülhaupt, 2012)
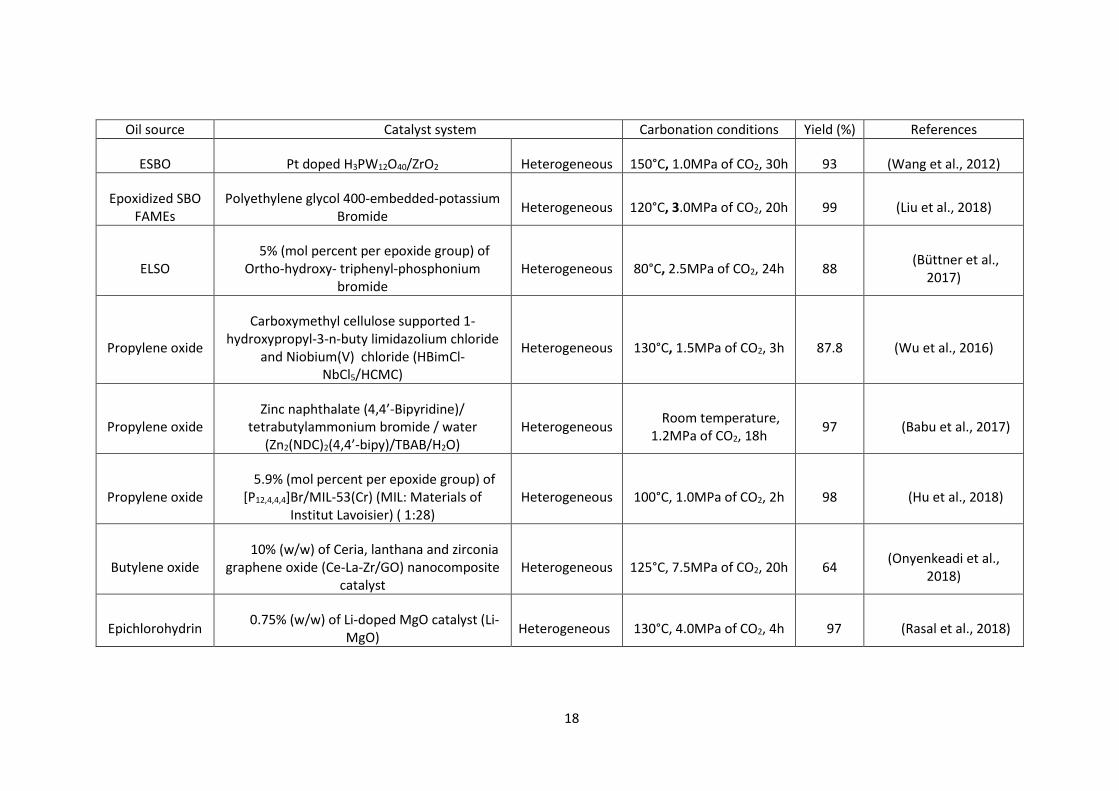
18
Oil source Catalyst system Carbonation conditions Yield (%) References
ESBO Pt doped H3PW12O40/ZrO2 Heterogeneous 150°C, 1.0MPa of CO2, 30h 93 (Wang et al., 2012)
Epoxidized SBO FAMEs
Polyethylene glycol 400-embedded-potassium Bromide
Heterogeneous 120°C, 3.0MPa of CO2, 20h 99 (Liu et al., 2018)
ELSO 5% (mol percent per epoxide group) of
Ortho-hydroxy- triphenyl-phosphonium bromide
Heterogeneous 80°C, 2.5MPa of CO2, 24h 88 (Büttner et al.,
2017)
Propylene oxide
Carboxymethyl cellulose supported 1-hydroxypropyl-3-n-buty limidazolium chloride
and Niobium(V) chloride (HBimCl-NbCl5/HCMC)
Heterogeneous 130°C, 1.5MPa of CO2, 3h 87.8 (Wu et al., 2016)
Propylene oxide Zinc naphthalate (4,4’-Bipyridine)/
tetrabutylammonium bromide / water (Zn2(NDC)2(4,4’-bipy)/TBAB/H2O)
Heterogeneous Room temperature,
1.2MPa of CO2, 18h 97 (Babu et al., 2017)
Propylene oxide 5.9% (mol percent per epoxide group) of
[P12,4,4,4]Br/MIL-53(Cr) (MIL: Materials of Institut Lavoisier) ( 1:28)
Heterogeneous 100°C, 1.0MPa of CO2, 2h 98 (Hu et al., 2018)
Butylene oxide 10% (w/w) of Ceria, lanthana and zirconia
graphene oxide (Ce-La-Zr/GO) nanocomposite catalyst
Heterogeneous 125°C, 7.5MPa of CO2, 20h 64 (Onyenkeadi et al.,
2018)
Epichlorohydrin 0.75% (w/w) of Li-doped MgO catalyst (Li-
MgO) Heterogeneous 130°C, 4.0MPa of CO2, 4h 97 (Rasal et al., 2018)
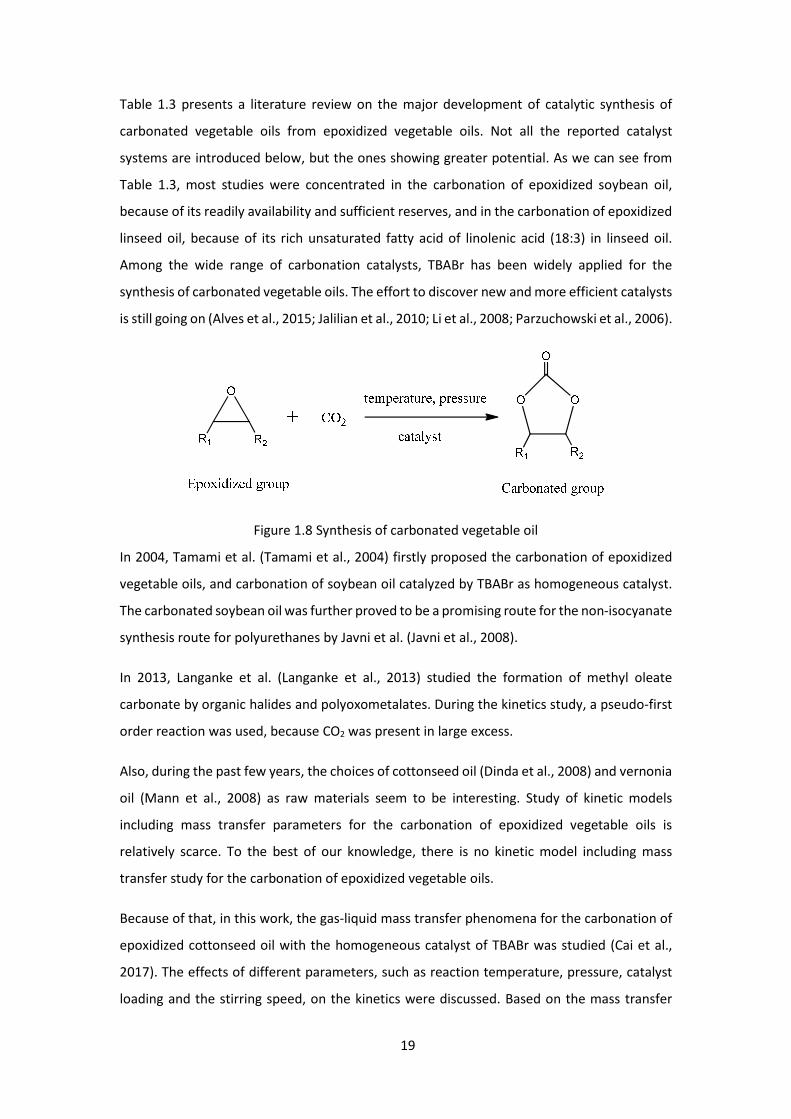
19
Table 1.3 presents a literature review on the major development of catalytic synthesis of
carbonated vegetable oils from epoxidized vegetable oils. Not all the reported catalyst
systems are introduced below, but the ones showing greater potential. As we can see from
Table 1.3, most studies were concentrated in the carbonation of epoxidized soybean oil,
because of its readily availability and sufficient reserves, and in the carbonation of epoxidized
linseed oil, because of its rich unsaturated fatty acid of linolenic acid (18:3) in linseed oil.
Among the wide range of carbonation catalysts, TBABr has been widely applied for the
synthesis of carbonated vegetable oils. The effort to discover new and more efficient catalysts
is still going on (Alves et al., 2015; Jalilian et al., 2010; Li et al., 2008; Parzuchowski et al., 2006).
Figure 1.8 Synthesis of carbonated vegetable oil
In 2004, Tamami et al. (Tamami et al., 2004) firstly proposed the carbonation of epoxidized
vegetable oils, and carbonation of soybean oil catalyzed by TBABr as homogeneous catalyst.
The carbonated soybean oil was further proved to be a promising route for the non-isocyanate
synthesis route for polyurethanes by Javni et al. (Javni et al., 2008).
In 2013, Langanke et al. (Langanke et al., 2013) studied the formation of methyl oleate
carbonate by organic halides and polyoxometalates. During the kinetics study, a pseudo-first
order reaction was used, because CO2 was present in large excess.
Also, during the past few years, the choices of cottonseed oil (Dinda et al., 2008) and vernonia
oil (Mann et al., 2008) as raw materials seem to be interesting. Study of kinetic models
including mass transfer parameters for the carbonation of epoxidized vegetable oils is
relatively scarce. To the best of our knowledge, there is no kinetic model including mass
transfer study for the carbonation of epoxidized vegetable oils.
Because of that, in this work, the gas-liquid mass transfer phenomena for the carbonation of
epoxidized cottonseed oil with the homogeneous catalyst of TBABr was studied (Cai et al.,
2017). The effects of different parameters, such as reaction temperature, pressure, catalyst
loading and the stirring speed, on the kinetics were discussed. Based on the mass transfer
20
study, which was designed to predict the evolution of the volumetric mass transfer
coefficients and Henry’s constants with reaction advancement and temperature, a kinetic
model was further proposed for the carbonation of epoxidized cottonseed oil catalyzed by
TBABr.
1.6 Relationships of chemical structure and properties
In case of vegetable oil, Yan et al. (Yan et al., 2018) proved that both the fatty acid components
and function groups will affect physicochemical properties of the products and the
corresponding reaction kinetics. Then, what is the specific nature of their constituting
elements? What is the effect of their structures on their building-blocks? Is it possible to
predict the reaction kinetics and mechanism through the establishment of a correlation
between the chemical structure activity of these elements and their building-blocks? To reply
such issues, the evaluation of chemical structure activity of the element and its corresponding
compound is indispensable. However, researches concerning the relationships of chemical
structure and properties are scarce.
For the chemical structure activity evaluation, two aspects are necessarily investigated: the
physicochemical properties (density, viscosity, refractive index, heat capacity) and the
reactivity: kinetic and thermodynamic constants of a chemical reaction.
1.6.1 Chemical structure and physicochemical properties
Numerous articles have reported the physicochemical properties of various triglycerides, fatty
acids, and methyl esters.
Demirbas (Demirbas, 2008) has investigated physical properties of 22 kinds of vegetable oils
and 14 kinds of methyl esters. It was reported the viscosity of vegetable oil can be highly
decreased after being transesterified into methyl ester form.
Scala and Wool (Scala and Wool, 2005) pointed out that the chemical modification of
triglycerides may change the interactions between molecules, thus resulting in a change in
viscosity. For example, the viscosity of triglycerides increased as a result of slight polarity
increase after being epoxidized.
Miloslavskiy et al. (Miloslavskiy et al., 2014) have pointed that during carbonation process,
viscosity of epoxidized vegetable oils increase by ten times. Thus, the properties of raw
materials play important roles during chemical structure modifications, such as epoxidation
and carbonation reactions.
21
Yan et al. (Yan et al., 2018) have studied the role of fatty acid profiles on the epoxidation
kinetics of three different vegetable oils (commodity soybean oil, high-oleic soybean oil and
linseed oil). Also, physicochemical properties of the epoxidized products, such as the viscosity,
X-ray diffraction data and differential calorimetry were measured. They pointed out that
epoxidation process may increase the viscosity of oils during functionality, but with almost no
effect on the melting temperature. Also, they mentioned that structural regularity can
increase viscosity by improving molecular packing. Thus, with respect to triglycerides, when
the double bonds increase, molecular packing will be reduced and viscosity will decrease.
Also, in our previous work (Cai et al., 2018), different physicochemical properties such as
viscosity, density, refractive index, and specific heat capacity for the epoxidized and
carbonated forms of vegetable oils (soybean oil, linseed oil and cottonseed oil) were
investigated. The evolution of these properties with temperature and components in double
bond, epoxide, and carbonated groups were studied. We have found that some correlations,
for example, density and refractive index of these oils vary linearly with temperature and the
ratio of specific heat capacity at a temperature to the specific heat capacity at a reference
temperature follows a polynomial equation of second order with temperature, could be used
to predict the evolutions of these physicochemical properties at different components and
temperatures based on the property knowledge of the pure compounds.
1.6.2 Chemical structure and reactivity
Quantitative structure-activity relationship (QSAR) (Chen et al., 2015; Cheng et al., 2018) and
quantitative structure-property relationship (QSPR) techniques are used to link the chemical
activities with the element and its building-blocks, while linear free-energy relationship (LFER)
to predict the kinetic and thermodynamic constants (Leveneur, 2017). As to LFER description,
two types of equations can be applied, i.e., the Hammett equation for aromatic systems,
which takes into account the polar, steric and resonance effects, and the Taft equation for
aliphatic systems, which takes into account polar, steric effects (Hancock, 1961; Lilja et al.,
2002).
Several different research groups have tried to establish this kind of correlation for different
reactions and pointed out that the correlation of intrinsic kinetic parameter between the
constituting element and the building-blocks is important (Cheng et al., 2018; Leveneur, 2017).
22
In 1950, Bolland (Bolland, 1950) have investigated the influence of chemical structure on α-
methylenic reactivity of olefins. He mentioned that the unsaturated group in the chemical
structure of an olefin can determine the rate of its oxidation reaction.
Hita, et al. (Hita et al., 2018) have studied the relationships between chemical structure of
lignin and reactivity during iron catalytic hydrogenation process. The observed structure
relationships show that higher concentrations of methoxy groups appear to promote lignin
gas formation during hydro treatment. Also, aliphatic compound with low oxygen content and
higher content of lignin are not favorable for obtaining phenolic compounds.
Otto, et al. (Otto et al., 2018) have pointed out that all chemical reactions follow a pattern of
associated activations, which are closely related to the steric effects in the chemical structure.
As a chemical platform, vegetable oil can be valorized through chemical modification into
variety of products or intermediate materials, including polymers, composites, emulsions,
coatings, binders in ink formulations, gels (Murawski and Quirino, 2018). The epoxidized
vegetable oils are widely applied as the stabilizers and plasticizers for polyvinyl chloride and
rubber compounds (Bueno-Ferrer et al., 2010; Chandrasekara et al., 2011). Based on the
epoxidized vegetable oils, carbonated vegetable oils have attracted much interest that it is
the reactant for non-isocyanate polyurethanes (NIPUs) product (Maisonneuve et al., 2015).
However, literature recording the correlation between the chemical structure activity of fatty
acid and vegetable oils is yet scarce.
Moreover, transesterification of vegetable oils (soybean oil, palm oil, cottonseed oil,
sunflower oil, rapeseed oil, etc.) is the most common way to be used for biodiesel production
(Fukuda et al., 2001; Leung et al., 2010). Several studies have proved that transesterification
process helps to decrease the viscosity of vegetable oils, which is 9 to 17 times of fatty acid
methyl esters and affects mass transfer and diffusion efficiency (Demirbas, 2008; Demirbaş,
2002; Rastogi et al., 2002).
In 2015, Huang et al. (Huang et al., 2015) have studied the epoxidation of different fatty acid
methyl esters, and have demonstrated that the kinetics of epoxidation and ring-opening
increases with the number of unsaturated groups.
In 2016, Omonov et al. (Omonov et al., 2016) have compared the kinetics of epoxidation of
canola oil and its transesterified form. They have found that the kinetics of epoxidation of the
transesterified form was faster, but they did not take into account the mass transfer,
difference of viscosity and different side reactions.
23
To the best of our knowledge, no one has performed a fair comparison, i.e., measuring
intrinsic kinetic constant, between the kinetics of vegetable oil and their corresponding fatty
acid methyl ester.
1.7 Objective of the doctoral thesis
As concerns this work, the thesis is made of seven chapters. Chapter II deals with a wide
literature review of research advance on the methods for biomass and CO2 valorization
through epoxidation and carbonation of vegetable oils. Chapter III presents a short
explanation of the materials, setup and analysis methods that we used to carry out all the
experiments. From Chapter IV to Chapter VII, these four chapters expose all experiment
results obtained, in which Chapter IV is focused on the influence of ring opening reactions on
the kinetics of bio-based cottonseed oil epoxidation; Chapter V is focused on the Interaction
between functional groups and physicochemical properties of vegetable oils and their
epoxidized and carbonated derivatives; Chapter VI is focused on the carbonation of epoxidized
vegetable oils; Chapter VII is focused on the comparison of chemical structure and reactivity
between vegetable oils and fatty acid methyl ester. Chapter VIII provides a comprehensive
summary of all the research content in this thesis.
The aim of this doctoral thesis focuses on the epoxidation and carbonation of vegetable oils.
The objective of this work was divided into four parts:
- kinetics study of epoxidation and ring opening of vegetable oils by using acetic/peracetic
acid in the presence of sulfuric acid;
- investigation on the physicochemical properties of vegetable oils (soybean oil, cottonseed
oil and linseed oil) and their modified counterparts (epoxidized and carbonated);
- kinetics study of carbonation of epoxidized vegetable oils with homogeneous catalyst,
namely Tetra-n-butylammonium bromide (TBABr);
- study of structure-reactivity relationship between vegetable oil and its fatty acid methyl
ester for the carbonation reaction.
In the first part of work, kinetics studies of epoxidation and ring-opening were done to
optimize the production of epoxidized cottonseed oil. Epoxidation of cottonseed oil by
peracetic acid in a batch reactor was studied. The kinetic constants for the ring-opening
reactions by water, hydrogen peroxide and acetic and peracetic acids were estimated. A
suitable modeling strategy for ring opening was well developed.
24
For the second part, physicochemical properties (viscosity, density, refractive index, or
specific heat capacity) were measured for three kinds of vegetable oils (soybean oil,
cottonseed oil and linseed oil) and their modified forms. Solution of fresh vegetable oil,
synthesized epoxidized vegetable oil and synthesized carbonated vegetable oil was made to
investigate the effect of function groups. It was demonstrated that density and refractive
index of these oils vary linearly with temperature. Viscosity of these oils, which were found to
be Newtonian fluids, is an exponential function of temperature. In addition, these correlations
could be used to predict the evolutions of these physicochemical properties at different
components and temperatures based on the property knowledge of the pure compounds.
Then, the carbonation kinetics of epoxidized vegetable oils were investigated for the effects
of different reaction parameters, like reaction pressure, reaction temperature and epoxide
group concentration on. Furthermore, a kinetic model including mass transfer phenomena for
the carbonation of epoxidized cottonseed oil was built.
At last, vegetable oil and its fatty acid methyl ester form were selected as research subject to
investigate the relationship of chemical structure and reactivity via carbonation reactions.
Relationship between the carbonation reaction kinetic constants of two substances was
estimated by taking into account the physicochemical properties and mass transfer
parameters.
25
Chapter II Materials, setup and analysis
Part of this chapter is adapted from the post print of the following articles:
[1] X. Cai, J.L. Zheng, A.F. Aguilera, L. Vernières-Hassimi, P. Tolvanen, T. Salmi, S. Leveneur.
Influence of ring-opening reactions on the kinetics of cottonseed oil epoxidation. International
Journal of Chemical Kinetics, 2018, 1-16.
Link: https://doi.org/10.1002/kin.21208
Further permissions related to the material excerpted should be directed to the Wiley Online
Library. Copyright © 2018 Wiley Periodicals, Inc.
[2] X. Cai, K. Ait Aissa, L. Estel, S. Leveneur. Investigation of the Physicochemical Properties
for Vegetable Oils and Their Epoxidized and Carbonated Derivatives. Journal of Chemical &
Engineering Data, 63(2018) 1524-1533.
Link: https://doi.org/10.1021/acs.jced.7b01075
Further permissions related to the material excerpted should be directed to the ACS
Publications. Copyright © 2018 American Chemical Society
[3] X. Cai, J.L. Zheng, J. Wärnå, T. Salmi, B. Taouk, S. Leveneur. Influence of gas-liquid mass
transfer on kinetic modeling: Carbonation of epoxidized vegetable oils. Chemical Engineering
Journal, 313(2017) 1168-1183.
Link: https://doi.org/10.1016/j.cej.2016.11.012
Further permissions related to the material excerpted should be directed to the ScienceDirect.
Copyright © 2019 Elsevier B.V. or its licensors or contributors. ScienceDirect® is a registered
trademark of Elsevier B.V.
2.1 Introduction
In this chapter, all the materials and setup that we used for the experiments are presented.
Section 2.2 is about the materials; Sections 2.3-2.5 describes the setups and Section 2.6 is
about the analytical methods. Section 2.7 describes the numerical methods used to solve out
the ODEs.
2.2 Materials
For synthesis procedure, refined cottonseed oil, linseed oil was purchased from ThermoFisher
Scientific GmbH (Schwerte, Germany). Soybean oil was purchased from Sigma Company
(Sigma, USA). Sulphuric acid (purity> 98 wt.%), formic acid (purity> 99 wt.%), acetic acid (purity>
99 wt.%), hydrogen peroxide (33 wt.% in water) were obtained from VWR International SAS
(Fontenay-sous-Bois, France). Tetra-n-butylammonium bromide (TBABr, purity>98wt.%) were
purchased from Alfa Aesar (Alfa Aesar GmbH & Co., Ward Hill, MA, USA).
26
For analytical procedure, tetraethylammonium bromide (TEAB, 98 wt.%) and of perchloric
acid standardized solution (0.1 mol.L-1 in acetic acid) were obtained from Alfa Aesar (Alfa
Aesar GmbH & Co., Ward Hill, MA, USA). Hanus standard solution, 2-propanol, and chloroform
were obtained from VWR International SAS (Fontenay-sous-Bois, France). The iodine solution
(0.1 mol.L-1) was obtained from Chem-Lab NV (Chem-Lab, Belgium). Sodium thiosulfate
solution (0.1 mol.L-1) and ammonium cerium (IV) sulfate solution were purchased from Sigma-
Aldrich (Sigma Aldrich Chemical Co, USA).
2.3 Apparatus and experimental procedures for physicochemical properties measurements
2.3.1 Refractive index measurement
Refractive index was measured by using the Abbemat 300 refractometer (Anton Paar, Austria)
with an accuracy of 0.0001 nD according to the manufacturer. Densities were measured by
using DMA 4100 M (Anton Paar, Austria) with an accuracy of temperature of ±0.02°C and an
accuracy of measurement of ±0.05 kg.m-3 according to the manufacturer.
2.3.2 Density measurement
Density was measured using a digital glass vibrating-tube densitometer (DMA5000, Anton
Paar Ltd, Herts, UK) with an accuracy of ±0.001 kg.m-3 and ±0.001 K for the temperature
according to the manufacturer.
2.3.3 Viscosity measurement
The dynamic viscosity of vegetable oil and its epoxidized and carbonated derivatives were
measured by the Brookfield CAP2000+ viscometer (Brookfield Engineering Laboratories, Inc.,
Stoughton, MA). It is equipped with a cone plate geometry system and precise temperature
control system. CAP spindle 01 was used during the viscosity measurement. The rotational
speed of the cone was fixed at 20 RPM under high torque model. The shear rate was selected
as 267 S-1. For each sample, the value of viscosity was obtained after 60 s of hold time for
temperature stabilization and 60 s of recording time for criterion of stability. The accuracy of
viscosity is ±2% of full scale range (FSR), and ±2 °C for the temperature according to the
manufacturer.
The dynamic viscosity of fatty acid methyl ester and its epoxidized and carbonated derivatives
were measured in a digital rolling-ball viscometer (Lovis 2000 MME, Anton Paar, Graz, Austria)
with an accuracy of ±0.5 % and ±0.002 °C for the temperature according to the manufacturer.
2.3.4 Specific heat capacity measurement
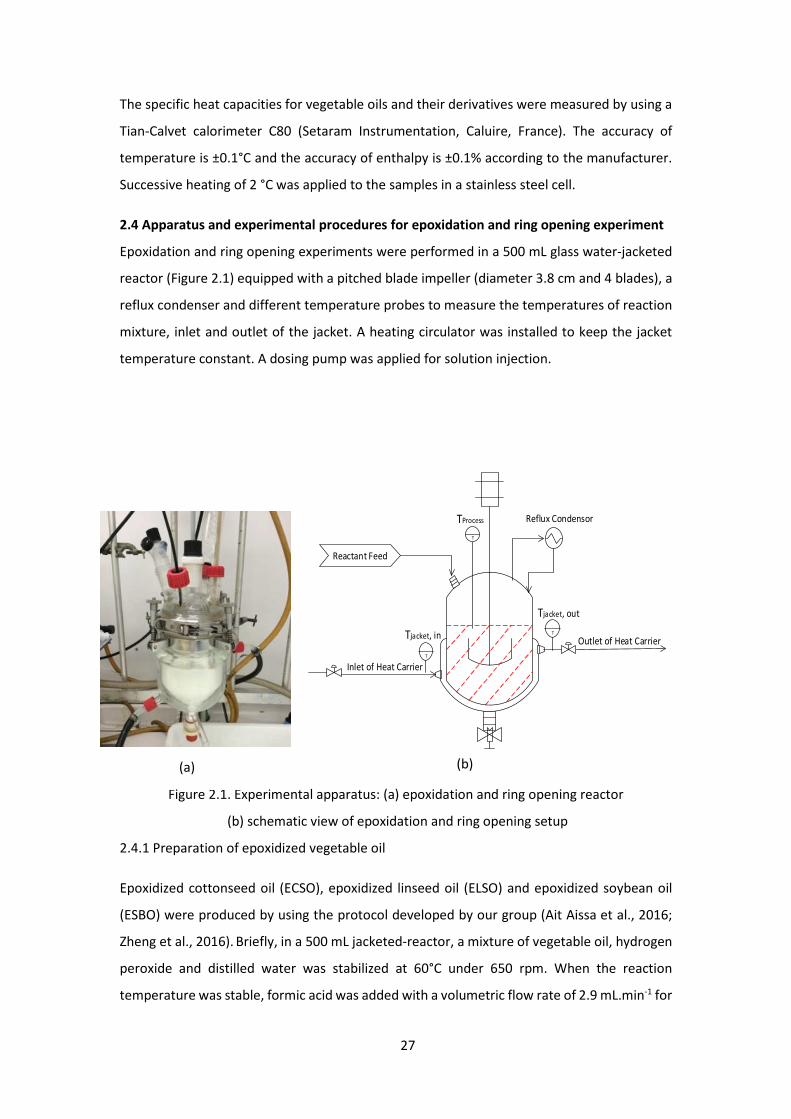
27
The specific heat capacities for vegetable oils and their derivatives were measured by using a
Tian-Calvet calorimeter C80 (Setaram Instrumentation, Caluire, France). The accuracy of
temperature is ±0.1°C and the accuracy of enthalpy is ±0.1% according to the manufacturer.
Successive heating of 2 °C was applied to the samples in a stainless steel cell.
2.4 Apparatus and experimental procedures for epoxidation and ring opening experiment
Epoxidation and ring opening experiments were performed in a 500 mL glass water-jacketed
reactor (Figure 2.1) equipped with a pitched blade impeller (diameter 3.8 cm and 4 blades), a
reflux condenser and different temperature probes to measure the temperatures of reaction
mixture, inlet and outlet of the jacket. A heating circulator was installed to keep the jacket
temperature constant. A dosing pump was applied for solution injection.
Reactant Feed
TProcess
Outlet of Heat CarrierT
T
Inlet of Heat Carrier
Reflux Condensor
Tjacket, in T
Tjacket, out
Figure 2.1. Experimental apparatus: (a) epoxidation and ring opening reactor
(b) schematic view of epoxidation and ring opening setup
2.4.1 Preparation of epoxidized vegetable oil
Epoxidized cottonseed oil (ECSO), epoxidized linseed oil (ELSO) and epoxidized soybean oil
(ESBO) were produced by using the protocol developed by our group (Ait Aissa et al., 2016;
Zheng et al., 2016). Briefly, in a 500 mL jacketed-reactor, a mixture of vegetable oil, hydrogen
peroxide and distilled water was stabilized at 60°C under 650 rpm. When the reaction
temperature was stable, formic acid was added with a volumetric flow rate of 2.9 mL.min-1 for
(a) (b)
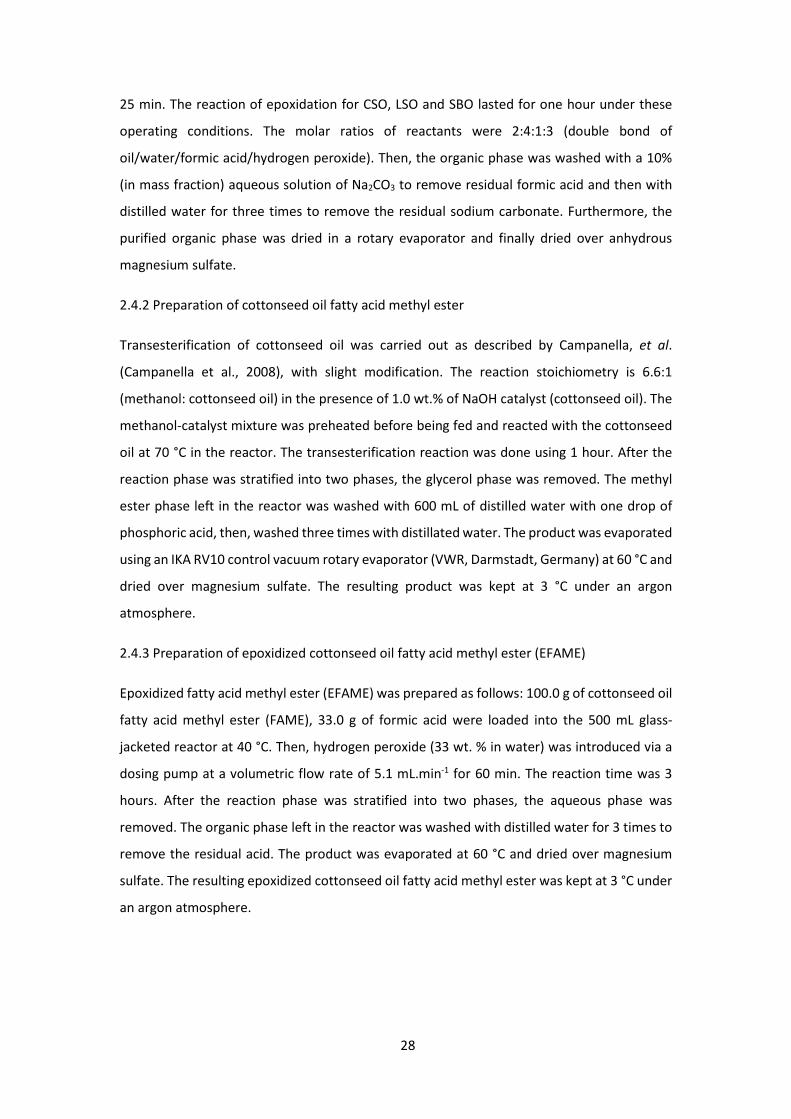
28
25 min. The reaction of epoxidation for CSO, LSO and SBO lasted for one hour under these
operating conditions. The molar ratios of reactants were 2:4:1:3 (double bond of
oil/water/formic acid/hydrogen peroxide). Then, the organic phase was washed with a 10%
(in mass fraction) aqueous solution of Na2CO3 to remove residual formic acid and then with
distilled water for three times to remove the residual sodium carbonate. Furthermore, the
purified organic phase was dried in a rotary evaporator and finally dried over anhydrous
magnesium sulfate.
2.4.2 Preparation of cottonseed oil fatty acid methyl ester
Transesterification of cottonseed oil was carried out as described by Campanella, et al.
(Campanella et al., 2008), with slight modification. The reaction stoichiometry is 6.6:1
(methanol: cottonseed oil) in the presence of 1.0 wt.% of NaOH catalyst (cottonseed oil). The
methanol-catalyst mixture was preheated before being fed and reacted with the cottonseed
oil at 70 °C in the reactor. The transesterification reaction was done using 1 hour. After the
reaction phase was stratified into two phases, the glycerol phase was removed. The methyl
ester phase left in the reactor was washed with 600 mL of distilled water with one drop of
phosphoric acid, then, washed three times with distillated water. The product was evaporated
using an IKA RV10 control vacuum rotary evaporator (VWR, Darmstadt, Germany) at 60 °C and
dried over magnesium sulfate. The resulting product was kept at 3 °C under an argon
atmosphere.
2.4.3 Preparation of epoxidized cottonseed oil fatty acid methyl ester (EFAME)
Epoxidized fatty acid methyl ester (EFAME) was prepared as follows: 100.0 g of cottonseed oil
fatty acid methyl ester (FAME), 33.0 g of formic acid were loaded into the 500 mL glass-
jacketed reactor at 40 °C. Then, hydrogen peroxide (33 wt. % in water) was introduced via a
dosing pump at a volumetric flow rate of 5.1 mL.min-1 for 60 min. The reaction time was 3
hours. After the reaction phase was stratified into two phases, the aqueous phase was
removed. The organic phase left in the reactor was washed with distilled water for 3 times to
remove the residual acid. The product was evaporated at 60 °C and dried over magnesium
sulfate. The resulting epoxidized cottonseed oil fatty acid methyl ester was kept at 3 °C under
an argon atmosphere.
29
2.5 Apparatus and experimental procedures for carbonation experiment
A high-pressure stainless-steel autoclave (Parr Instrument Company, Moline, 300 mL) was
used as the carbonation reactor (Figure 2.2). In this reaction system, a gas feed system
including a CO2 bottle and a gas reservoir was connected to the reactor. A gas monitoring
system equipped with temperature and pressure probes inside the gas reservoir was
connected to a computer. A gas entrainment impeller (diameter 2.5 cm) with a hollow shaft
was used. The uncertainty for the pressure probe was 0.01 bars and that for the temperature
probe was 0.1 °C. The reactor was equipped with a temperature control system.
The carbonation of epoxidized vegetable oil or fatty acid methyl ester was carried out as follow:
briefly, the epoxidized cottonseed oil and the catalyst TBABr were weighted out in the reactor
at 100 °C. Then, the reactor was heated to the designed temperature. The gas feed system
was adjusted to desired value via the pressure regulator and remained open. The atmosphere
inside reactor was purged with CO2 for two times via valve V3 and then remained open. The
value (pressure, temperature) inside the gas reservoir and the temperature inside the reactor
were simultaneously recorded. After the pressure and temperature were stabilized, the
agitation was started at 500 rpm. Samples were withdrawn in one hour intervals via a valve
and the epoxide content was determined by titration.
N2 Bottle
CO2 Bottle
Reactor Vessel
Gas Reservoir
Temp Probe
Pressure Probe
Pressure Probe
Magnetic Stirrer
Valve 1
Temp Probe
Pressure Regulator
Valve 2
Sampling Port
Valve 3
Figure 2.2. Experimental apparatus: (a) carbonation reactor (b) Schematic view of
carbonation setup
(a) (b)
30
2.6 Analysis method
2.6.1 Determination of the fatty acid methyl ester components
(1) Gas chromatography
For determining the fatty acid methyl ester components, a Bruker Scion GC436 gas
chromatography, equipped with a split injector and an elastic quartz capillary column (ZB-5,
Phenomenex, 30 m × 0.32 mm i.d., 0.25 μm film thickness), was applied. Helium (99.99 %) was
used as carrier gas at a constant flow rate of 1.0 mL.min-1. The temperature of the injector
was 300 °C. The oven temperature was programmed as 40 °C for 2 min duration and then
increased to 300 °C at 8.0 °C.min-1 heating rate and maintained for 34.5 min. The injection
volume was 1.0 μL and the split mode was 30:1. All data acquisition and analysis were
performed using the Compass CDS software (Agilent Technologies, version 3.0).
The esterification of components in oil sample was performed as follows: 0.1 mL of the oil
sample (4 mg.mL-1 in methanol) was sampling into a 10 mL glass vial. Then, 2.5 mL of toluene-
methanol mixture (volume fraction 20 %), 0.1 mL of C15 internal standard solution
(pentadecanoic ethyl ester, 1 mg.mL-1 of in methanol) and 0.2 mL of acethyl chloride (purity >
98 %) were added to the vial. The mixture was pretreated at 80 °C for 1 hour before 4.0 mL
of sodium carbonate solution (6 wt. % in water) and 2.0 mL of toluene were added. Finally,
this mixture was vortexed for 5 minutes and further analyzed by GC.
(2) Fourier-transform infrared spectroscopy
1H NMR spectra were recorded on a Bruker 300 Fourier transform spectrometer at 300 MHz
in CDCl3 solutions using tetramethylsilane (TMS) as internal standard.
IR spectra were recorded on a FTIR spectrometer (Perkin-Elmer Spectrum 2000) equipped
with a diamond ATR device (Attenuated Total Reflection). Spectra were obtained from 10
scans in the (4000–500) cm−1 range. The enthalpies of reaction were measured using a Tian-
Calvet heat flow calorimeter C80 (Setaram, France).
2.6.2 Concentration of epoxide content
Epoxide content was titrated by the method of Jay (Maerker, 1965). Briefly, 0.100 g of oil
sample or organic phase (±0.001 g) was weighted out and dissolved in 10 mL of chloroform,
followed by addition of 20 wt. % (in acetic acid) tetraethylammonium bromide (10 mL). Then,
the mixture was titrated by 0.1 mol.L-1 of perchloric acid (in acetic acid) standardized solution
with a TIM-840 automatic titrator (Radiometer Analytical, France). The concentration of
epoxide groups is calculated as
�Ep = ����W���V��.4F�������� I (2.1)
31
where, 0.1 is the concentration of perchloric acid standardized solution, mol.L-1; Vtitration is the
titration volume of sample, L; msample is the mass of measurement sample, g; ρ is the oil density
of the sample, g.cm-3.
2.6.3 Concentration of double bonds
Double bonds were titrated as described in the Hanus iodine monobromide method (Paquot,
2013), with some modifications. Briefly, 0.200 g of oil sample or organic phase (± 0.001g) was
dissolved in 10 mL of chloroform and 10 mL of HANUS (0.1 mol.L-1, iodine solution according
HANUS), followed by being kept in dark place for 1 h of reaction. Then, 10 wt. % (in water)
potassium iodide (10 mL) and 100 mL of water were added for titration with 0.1 mol.L-1 sodium
thiosulfate solution. The concentration of double bond is calculated as
�DB = M������@����W���V�O×�.4F�������� × I (2.2)
where, 0.1 is the concentration of sodium thiosulfate solution, mol.L-1; Vblank is the titration
volume of blank, L; Vtitration is the titration volume of sample, L; msample is the mass of
measurement sample, g; ρ is the oil density of the sample, g.cm-3.
2.6.4 Concentration of hydrogen peroxide content
Hydrogen peroxide content was titrated by the method of Greenspan and Mackellar
(Greenspan and Mackellar, 1948). Briefly, 0.130 g of aqueous phase (±0.001 g) was weighted
out and dissolved in 50 mL of 5 wt. % sulfuric acid-water solution with two drops of Ferroin
indicator. The mixture was then titrated with 0.1 mol.L-1 of standard cerium (IV) sulfate
solution to reach a pale blue endpoint. The concentration of hydrogen peroxide is calculated
as
�H O = M����W���V�@������O×�.4×4.��4F(7×�������/.�� I (2.3)
where, 0.1 is the concentration of standard cerium (IV) sulfate solution, mol.L-1; Vblank is the
titration volume of blank, L; Vtitration is the titration volume of sample, L; 1.701 is the equivalent
weight constant; 34 is the molar mass of hydrogen peroxide, g.mol-1; msample is the mass of
measurement sample, g; 1.09 is the density of the solution, g.cm-3.
2.6.5 Concentration of acid
This titration was performed to determine the concentration of acid in the aqueous and
organic phases at the equilibrium. For the concentration in the aqueous phase, 0.300 g of
aqueous phase was dissolved in 50 mL of distilled water, while, for the concentration in the
organic phase 0.500 g of organic phase was dissolved in 50 mL of 2-propanol. Both samples
32
were titrated by 0.2 mol.L-1 of sodium hydroxide solution with an automatic titrator (TIM-840)
separately. The concentration of acid is calculated as
�H) = ����W���V�×�. |�������ρ
� (2.4)
where, 0.2 is the concentration of sodium hydroxide solution, mol.L-1; Vsample is the titration
volume of sample, L; msample is the mass of measurement sample, g; ρ is the density of the
solution, g.cm-3.
2.7 Modeling section
During the kinetic modeling stage, the modeling was performed by using ModEst software,
written in Fortran 90 (H. Haario, 2001). The system of ordinary differential Equations (ODEs)
was solved out by the ODESSA algorithm, which is a package of Fortran routines based on
backward difference method (Leis and Kramer, 1988).
The coefficient of determination R2 is one of the most common measure to evaluate the
goodness of a data fitting and is defined as:
( )( )2
i
2ii2
yy
yy1R
−−−=
(2.5)
where, is the observable simulated by the model, y is the mean value of the experimental
observables and yi is the experimental observable. The concentrations of double bond,
epoxide group were used as observables. The standard error of the parameter estimated
represents 95% of confidence interval.
The objective function ω was
( )∑ −=i
2ii yyω (2.6)
The objective function was firstly minimized by the simplex algorithm (Spendley et al., 1962),
using poor initial guess values when the knowledge of the initial guess values was not known.
After that, the Levenberg-Marquardt algorithm (Marquardt, 1963) was used to improve the
parameter estimation.
iy
33
Chapter III Influence of ring opening reactions on the kinetics of bio-
based cottonseed oil epoxidation
Part of this chapter is adapted from the post print of the following article:
X. Cai, J.L. Zheng, A.F. Aguilera, L. Vernières-Hassimi, P. Tolvanen, T. Salmi, S. Leveneur.
Influence of ring-opening reactions on the kinetics of cottonseed oil epoxidation. International
Journal of Chemical Kinetics, 2018, 1-16.
Link: https://doi.org/10.1002/kin.21208
Further permissions related to the material excerpted should be directed to the Wiley Online
Library. Copyright © 2018 Wiley Periodicals, Inc.
3.1 Introduction
In this chapter, epoxidation of cottonseed oil by peracetic acid in batch reactor was studied.
By developing a suitable modeling strategy, the kinetic constants for the ring opening
reactions by water, hydrogen peroxide, acetic and peracetic acids were estimated. The main
goal of this part of work is to minimize the ring opening side reactions and to find the most
suitable reactor configuration. This study provides a reference basis for the future
optimization of epoxy processing technology. Section 3.2 gives details about the experimental
procedure. Section 3.3 shows the experiment results and discussion. Section 3.4 gives the
conclusion for this part of work.
34
3.2 Experimental section
Epoxidized cottonseed oil (ECSO) was prepared as described in the Section 2.4.1.
For the kinetic experiments, approximately 150 mL of epoxidized cottonseed oil was added
into the reactor with specific amount of water to be fully mixed at the desired temperature.
Then, depending on the type of ring opening reaction a designed amount of acetic acid (AA),
sulfuric acid (H2SO4) or hydrogen peroxide (H2O2) were preheated and added into the reactor
to start the ring opening reaction. To follow the concentration of epoxide and double bond
groups, 6 mL of sample was taken at regular intervals, followed by centrifugation (5000 rpm,
10 min) to separate the organic and aqueous phases. The two separated phases were then
analyzed in the titration steps. Table 3.1 shows the ring opening experimental matrix.
For the kinetic modeling, only the concentrations of double bond and epoxide groups were
determined at different reaction time. The initial concentrations of hydrogen peroxide and
acetic acid in the aqueous phase were determined. Some experiments to determine the molar
equilibrium distribution were performed, and the equilibrium concentration of acetic acid in
the aqueous and organic phases was measured.
As shown in Table 3.1, the terms of Ep and DB represent the initial concentration of epoxide
and double bond groups in the organic phase. Runs 1 to 6 are the set of experiments to study
ring opening reaction by water. Runs 7 to 11 are the set of experiments to study the ring
opening reactions by hydrogen peroxide. Runs 12 to 17 are the set of experiments to study
the ring opening by acetic acid. Runs 18 to 25 represent the set of experiments to study the
effect of peracetic acid on the ring opening reaction. Runs 26 to 29 are the set of experiments
for the epoxidation reaction by PAA. At time zero, no peracetic acid (PAA) was present.
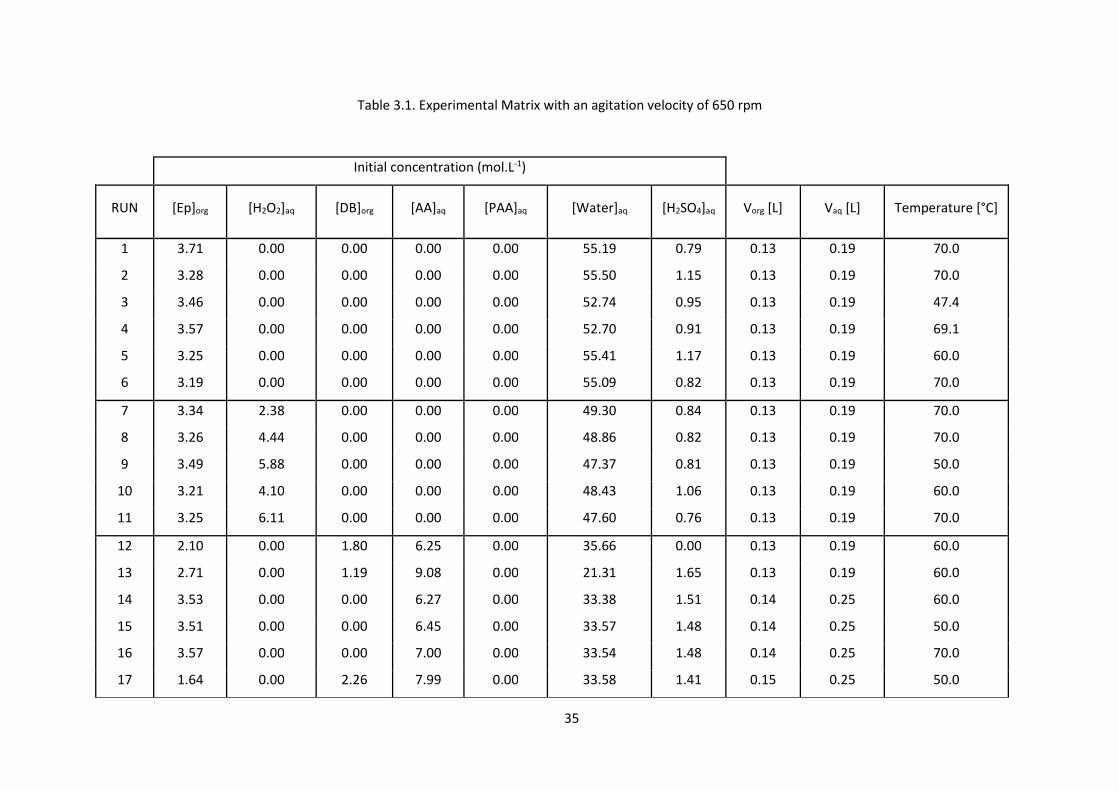
35
Table 3.1. Experimental Matrix with an agitation velocity of 650 rpm
Initial concentration (mol.L-1)
RUN [Ep]org [H2O2]aq [DB]org [AA]aq [PAA]aq [Water]aq [H2SO4]aq Vorg [L] Vaq [L] Temperature [°C]
1 3.71 0.00 0.00 0.00 0.00 55.19 0.79 0.13 0.19 70.0
2 3.28 0.00 0.00 0.00 0.00 55.50 1.15 0.13 0.19 70.0
3 3.46 0.00 0.00 0.00 0.00 52.74 0.95 0.13 0.19 47.4
4 3.57 0.00 0.00 0.00 0.00 52.70 0.91 0.13 0.19 69.1
5 3.25 0.00 0.00 0.00 0.00 55.41 1.17 0.13 0.19 60.0
6 3.19 0.00 0.00 0.00 0.00 55.09 0.82 0.13 0.19 70.0
7 3.34 2.38 0.00 0.00 0.00 49.30 0.84 0.13 0.19 70.0
8 3.26 4.44 0.00 0.00 0.00 48.86 0.82 0.13 0.19 70.0
9 3.49 5.88 0.00 0.00 0.00 47.37 0.81 0.13 0.19 50.0
10 3.21 4.10 0.00 0.00 0.00 48.43 1.06 0.13 0.19 60.0
11 3.25 6.11 0.00 0.00 0.00 47.60 0.76 0.13 0.19 70.0
12 2.10 0.00 1.80 6.25 0.00 35.66 0.00 0.13 0.19 60.0
13 2.71 0.00 1.19 9.08 0.00 21.31 1.65 0.13 0.19 60.0
14 3.53 0.00 0.00 6.27 0.00 33.38 1.51 0.14 0.25 60.0
15 3.51 0.00 0.00 6.45 0.00 33.57 1.48 0.14 0.25 50.0
16 3.57 0.00 0.00 7.00 0.00 33.54 1.48 0.14 0.25 70.0
17 1.64 0.00 2.26 7.99 0.00 33.58 1.41 0.15 0.25 50.0
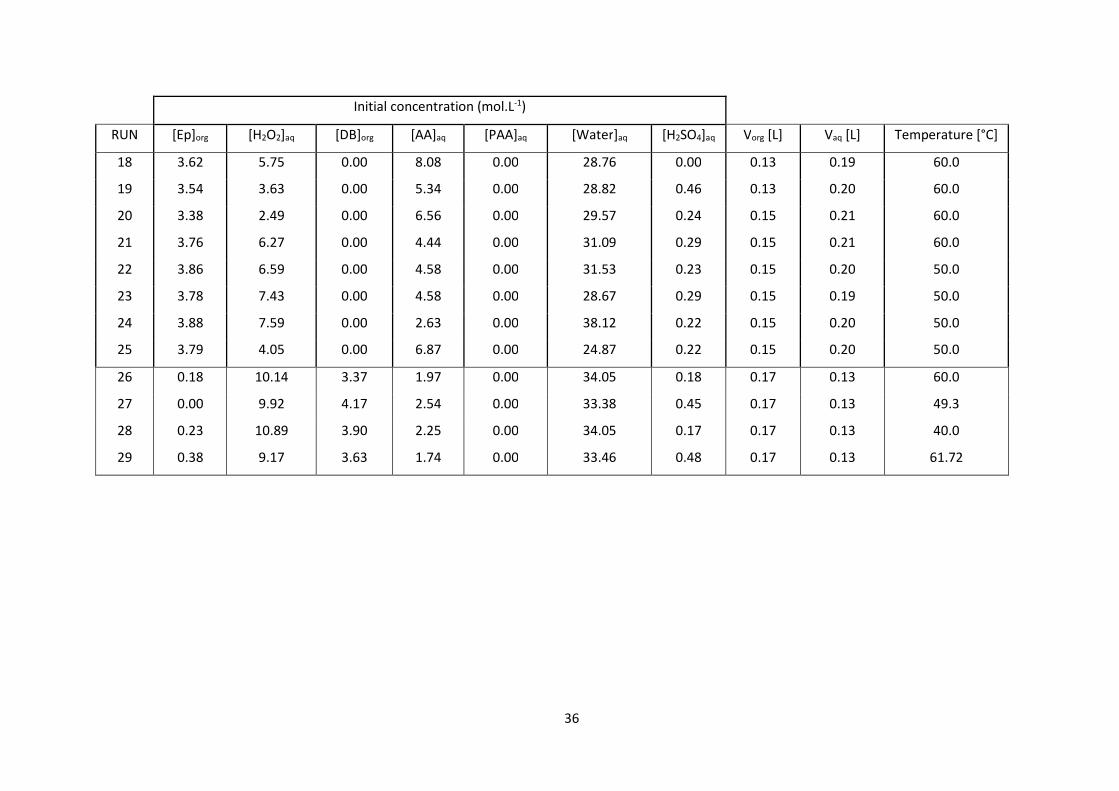
36
Initial concentration (mol.L-1)
RUN [Ep]org [H2O2]aq [DB]org [AA]aq [PAA]aq [Water]aq [H2SO4]aq Vorg [L] Vaq [L] Temperature [°C]
18 3.62 5.75 0.00 8.08 0.00 28.76 0.00 0.13 0.19 60.0
19 3.54 3.63 0.00 5.34 0.00 28.82 0.46 0.13 0.20 60.0
20 3.38 2.49 0.00 6.56 0.00 29.57 0.24 0.15 0.21 60.0
21 3.76 6.27 0.00 4.44 0.00 31.09 0.29 0.15 0.21 60.0
22 3.86 6.59 0.00 4.58 0.00 31.53 0.23 0.15 0.20 50.0
23 3.78 7.43 0.00 4.58 0.00 28.67 0.29 0.15 0.19 50.0
24 3.88 7.59 0.00 2.63 0.00 38.12 0.22 0.15 0.20 50.0
25 3.79 4.05 0.00 6.87 0.00 24.87 0.22 0.15 0.20 50.0
26 0.18 10.14 3.37 1.97 0.00 34.05 0.18 0.17 0.13 60.0
27 0.00 9.92 4.17 2.54 0.00 33.38 0.45 0.17 0.13 49.3
28 0.23 10.89 3.90 2.25 0.00 34.05 0.17 0.17 0.13 40.0
29 0.38 9.17 3.63 1.74 0.00 33.46 0.48 0.17 0.13 61.72
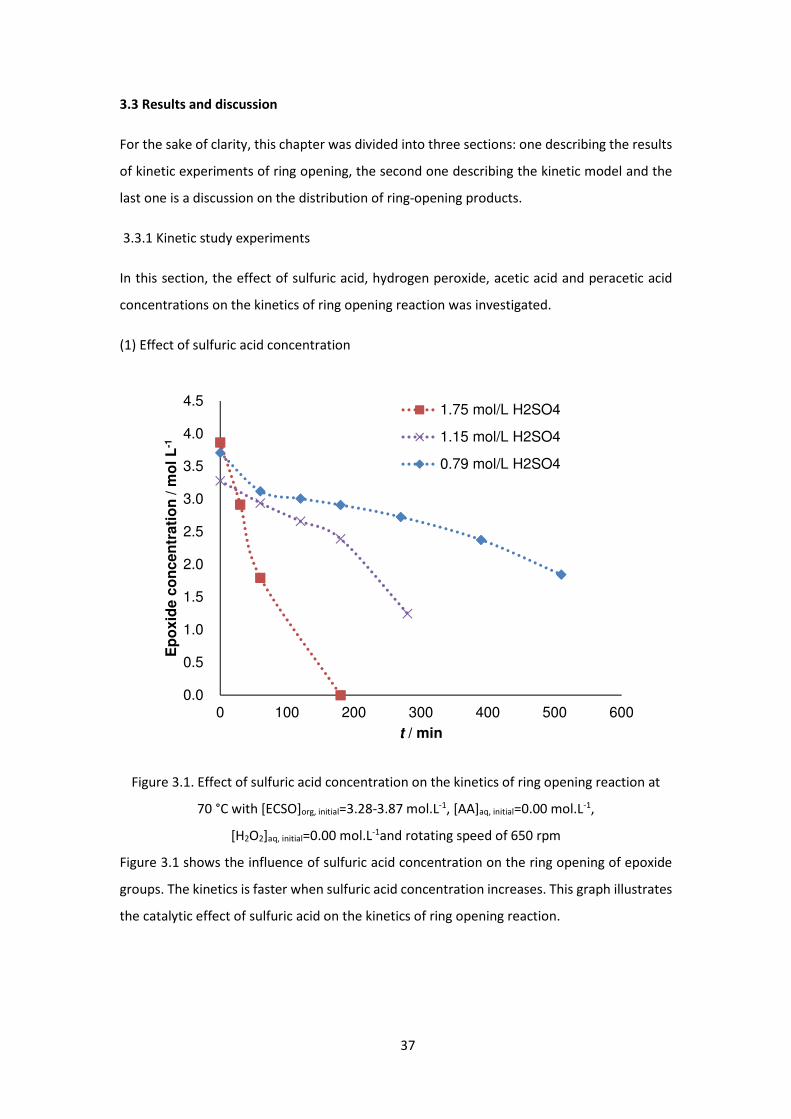
37
3.3 Results and discussion
For the sake of clarity, this chapter was divided into three sections: one describing the results
of kinetic experiments of ring opening, the second one describing the kinetic model and the
last one is a discussion on the distribution of ring-opening products.
3.3.1 Kinetic study experiments
In this section, the effect of sulfuric acid, hydrogen peroxide, acetic acid and peracetic acid
concentrations on the kinetics of ring opening reaction was investigated.
(1) Effect of sulfuric acid concentration
Figure 3.1. Effect of sulfuric acid concentration on the kinetics of ring opening reaction at
70 °C with [ECSO]org, initial=3.28-3.87 mol.L-1, [AA]aq, initial=0.00 mol.L-1,
[H2O2]aq, initial=0.00 mol.L-1and rotating speed of 650 rpm
Figure 3.1 shows the influence of sulfuric acid concentration on the ring opening of epoxide
groups. The kinetics is faster when sulfuric acid concentration increases. This graph illustrates
the catalytic effect of sulfuric acid on the kinetics of ring opening reaction.
0.0
0.5
1.0
1.5
2.0
2.5
3.0
3.5
4.0
4.5
0 100 200 300 400 500 600
Ep
oxid
e c
on
cen
trati
on
/ m
ol L
-1
t / min
1.75 mol/L H2SO4
1.15 mol/L H2SO4
0.79 mol/L H2SO4
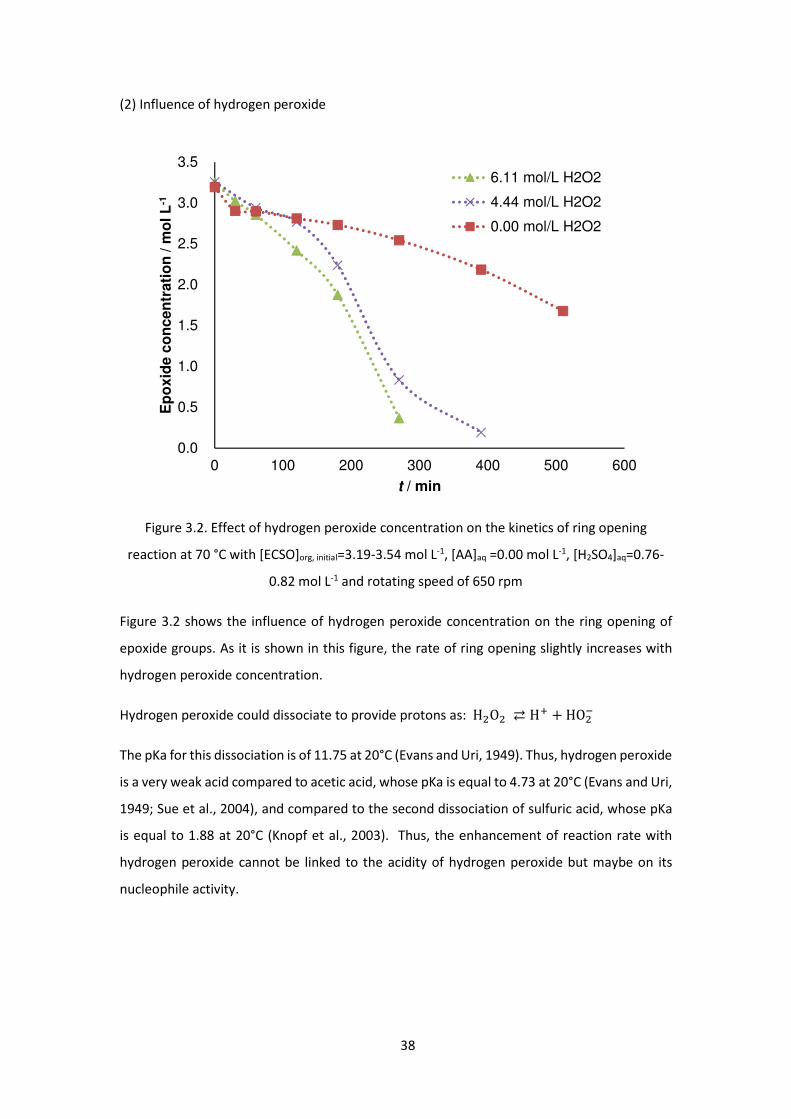
38
(2) Influence of hydrogen peroxide
Figure 3.2. Effect of hydrogen peroxide concentration on the kinetics of ring opening
reaction at 70 °C with [ECSO]org, initial=3.19-3.54 mol L-1, [AA]aq =0.00 mol L-1, [H2SO4]aq=0.76-
0.82 mol L-1 and rotating speed of 650 rpm
Figure 3.2 shows the influence of hydrogen peroxide concentration on the ring opening of
epoxide groups. As it is shown in this figure, the rate of ring opening slightly increases with
hydrogen peroxide concentration.
Hydrogen peroxide could dissociate to provide protons as: H O ⇄ H) + HO @
The pKa for this dissociation is of 11.75 at 20°C (Evans and Uri, 1949). Thus, hydrogen peroxide
is a very weak acid compared to acetic acid, whose pKa is equal to 4.73 at 20°C (Evans and Uri,
1949; Sue et al., 2004), and compared to the second dissociation of sulfuric acid, whose pKa
is equal to 1.88 at 20°C (Knopf et al., 2003). Thus, the enhancement of reaction rate with
hydrogen peroxide cannot be linked to the acidity of hydrogen peroxide but maybe on its
nucleophile activity.
0.0
0.5
1.0
1.5
2.0
2.5
3.0
3.5
0 100 200 300 400 500 600
Ep
oxid
e c
on
cen
trati
on
/ m
ol L
-1
t / min
6.11 mol/L H2O2
4.44 mol/L H2O2
0.00 mol/L H2O2
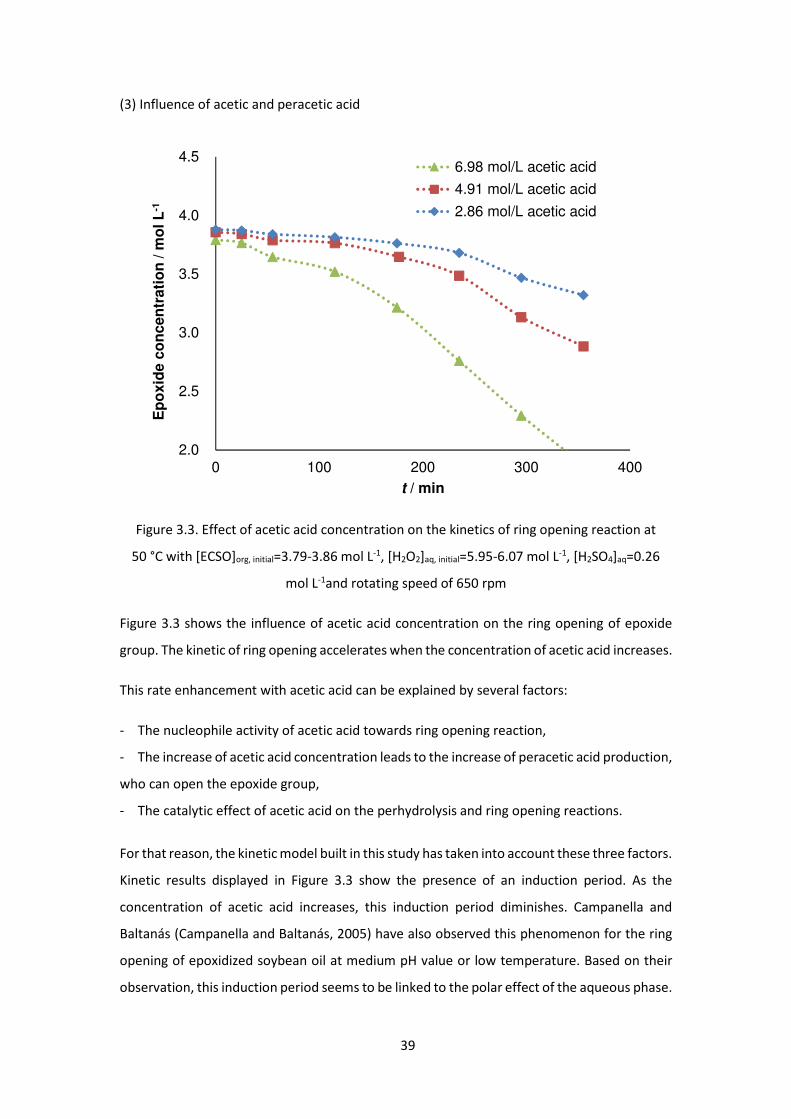
39
(3) Influence of acetic and peracetic acid
Figure 3.3. Effect of acetic acid concentration on the kinetics of ring opening reaction at
50 °C with [ECSO]org, initial=3.79-3.86 mol L-1, [H2O2]aq, initial=5.95-6.07 mol L-1, [H2SO4]aq=0.26
mol L-1and rotating speed of 650 rpm
Figure 3.3 shows the influence of acetic acid concentration on the ring opening of epoxide
group. The kinetic of ring opening accelerates when the concentration of acetic acid increases.
This rate enhancement with acetic acid can be explained by several factors:
- The nucleophile activity of acetic acid towards ring opening reaction,
- The increase of acetic acid concentration leads to the increase of peracetic acid production,
who can open the epoxide group,
- The catalytic effect of acetic acid on the perhydrolysis and ring opening reactions.
For that reason, the kinetic model built in this study has taken into account these three factors.
Kinetic results displayed in Figure 3.3 show the presence of an induction period. As the
concentration of acetic acid increases, this induction period diminishes. Campanella and
Baltanás (Campanella and Baltanás, 2005) have also observed this phenomenon for the ring
opening of epoxidized soybean oil at medium pH value or low temperature. Based on their
observation, this induction period seems to be linked to the polar effect of the aqueous phase.
2.0
2.5
3.0
3.5
4.0
4.5
0 100 200 300 400
Ep
oxid
e c
on
cen
trati
on
/ m
ol L
-1
t / min
6.98 mol/L acetic acid
4.91 mol/L acetic acid
2.86 mol/L acetic acid
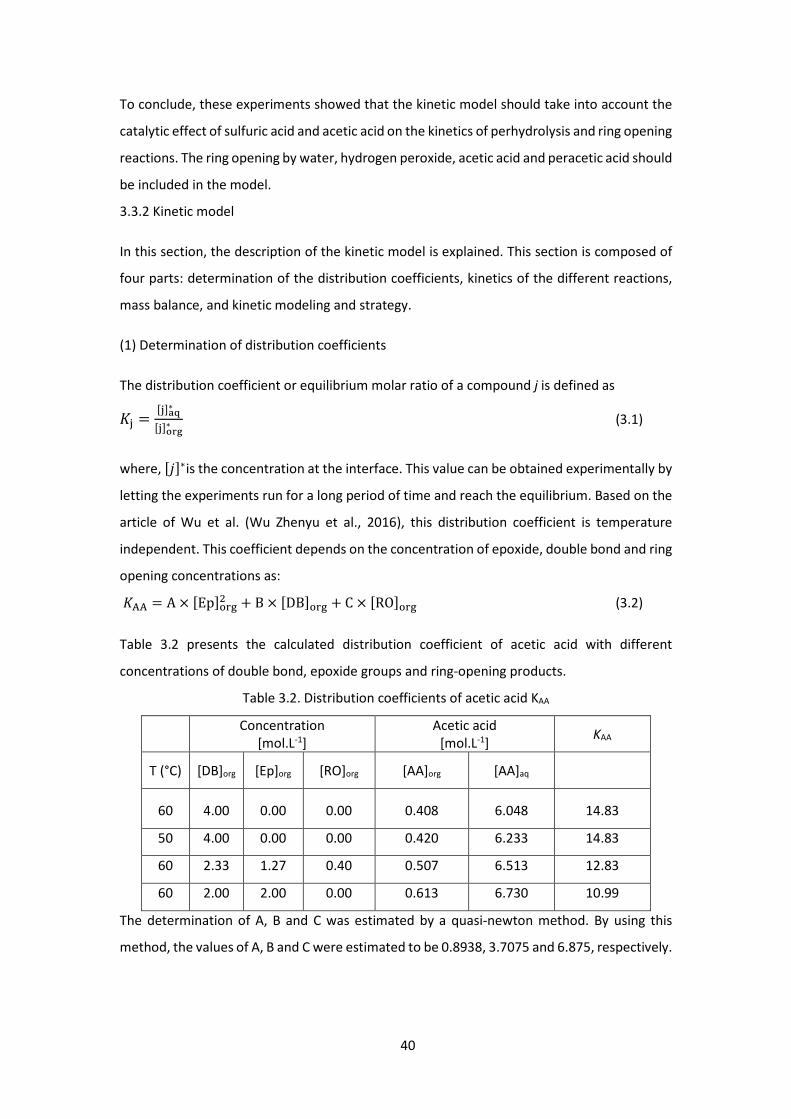
40
To conclude, these experiments showed that the kinetic model should take into account the
catalytic effect of sulfuric acid and acetic acid on the kinetics of perhydrolysis and ring opening
reactions. The ring opening by water, hydrogen peroxide, acetic acid and peracetic acid should
be included in the model.
3.3.2 Kinetic model
In this section, the description of the kinetic model is explained. This section is composed of
four parts: determination of the distribution coefficients, kinetics of the different reactions,
mass balance, and kinetic modeling and strategy.
(1) Determination of distribution coefficients
The distribution coefficient or equilibrium molar ratio of a compound j is defined as
�� = ����∗��VWX∗ (3.1)
where, ��∗is the concentration at the interface. This value can be obtained experimentally by
letting the experiments run for a long period of time and reach the equilibrium. Based on the
article of Wu et al. (Wu Zhenyu et al., 2016), this distribution coefficient is temperature
independent. This coefficient depends on the concentration of epoxide, double bond and ring
opening concentrations as:
��� = A × �Ep�� + B × �DB�� + C × �RO�� (3.2)
Table 3.2 presents the calculated distribution coefficient of acetic acid with different
concentrations of double bond, epoxide groups and ring-opening products.
Table 3.2. Distribution coefficients of acetic acid KAA
Concentration [mol.L-1]
Acetic acid [mol.L-1]
KAA
T (°C) [DB]org [Ep]org [RO]org [AA]org [AA]aq
60 4.00 0.00 0.00 0.408 6.048 14.83
50 4.00 0.00 0.00 0.420 6.233 14.83
60 2.33 1.27 0.40 0.507 6.513 12.83
60 2.00 2.00 0.00 0.613 6.730 10.99
The determination of A, B and C was estimated by a quasi-newton method. By using this
method, the values of A, B and C were estimated to be 0.8938, 3.7075 and 6.875, respectively.
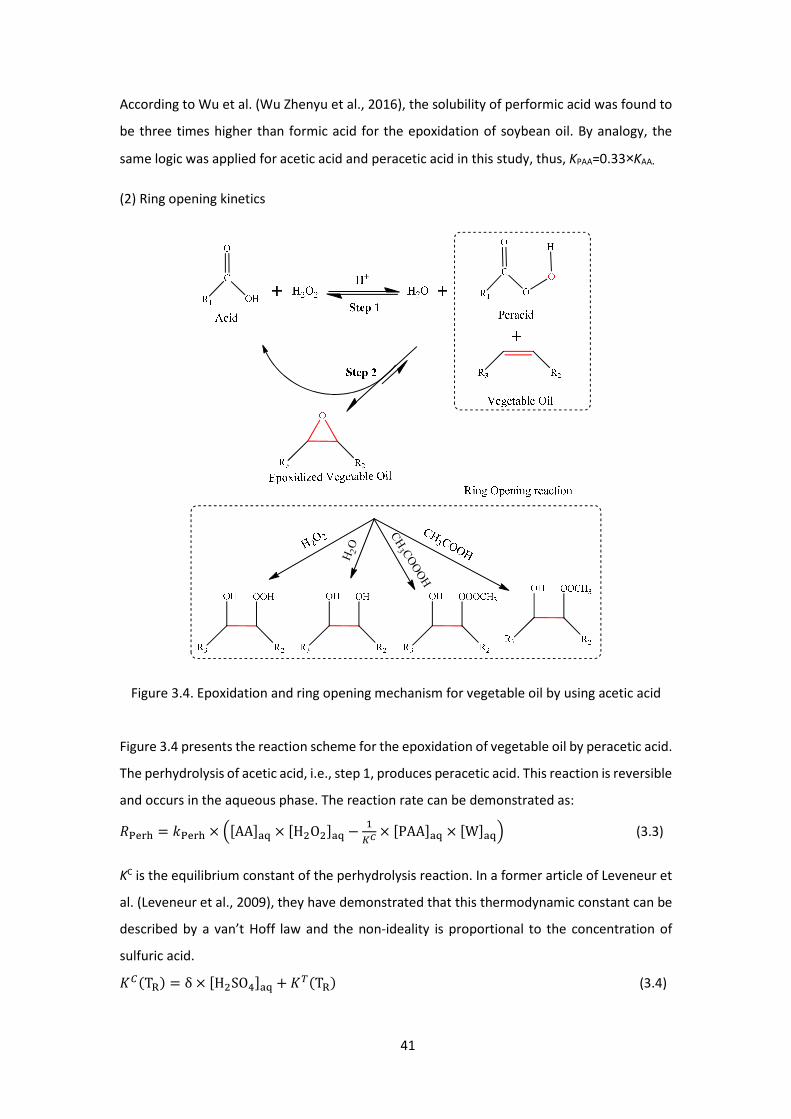
41
According to Wu et al. (Wu Zhenyu et al., 2016), the solubility of performic acid was found to
be three times higher than formic acid for the epoxidation of soybean oil. By analogy, the
same logic was applied for acetic acid and peracetic acid in this study, thus, KPAA=0.33×KAA.
(2) Ring opening kinetics
Figure 3.4. Epoxidation and ring opening mechanism for vegetable oil by using acetic acid
Figure 3.4 presents the reaction scheme for the epoxidation of vegetable oil by peracetic acid.
The perhydrolysis of acetic acid, i.e., step 1, produces peracetic acid. This reaction is reversible
and occurs in the aqueous phase. The reaction rate can be demonstrated as:
�$K�L = �$K�L × F�AA*+ × �H O *+ − 41� × �PAA*+ × �W*+I (3.3)
KC is the equilibrium constant of the perhydrolysis reaction. In a former article of Leveneur et
al. (Leveneur et al., 2009), they have demonstrated that this thermodynamic constant can be
described by a van’t Hoff law and the non-ideality is proportional to the concentration of
sulfuric acid.
�=MT�O = δ × �H SO7*+ +�`MT�O (3.4)
H2O
CH3 COOOH
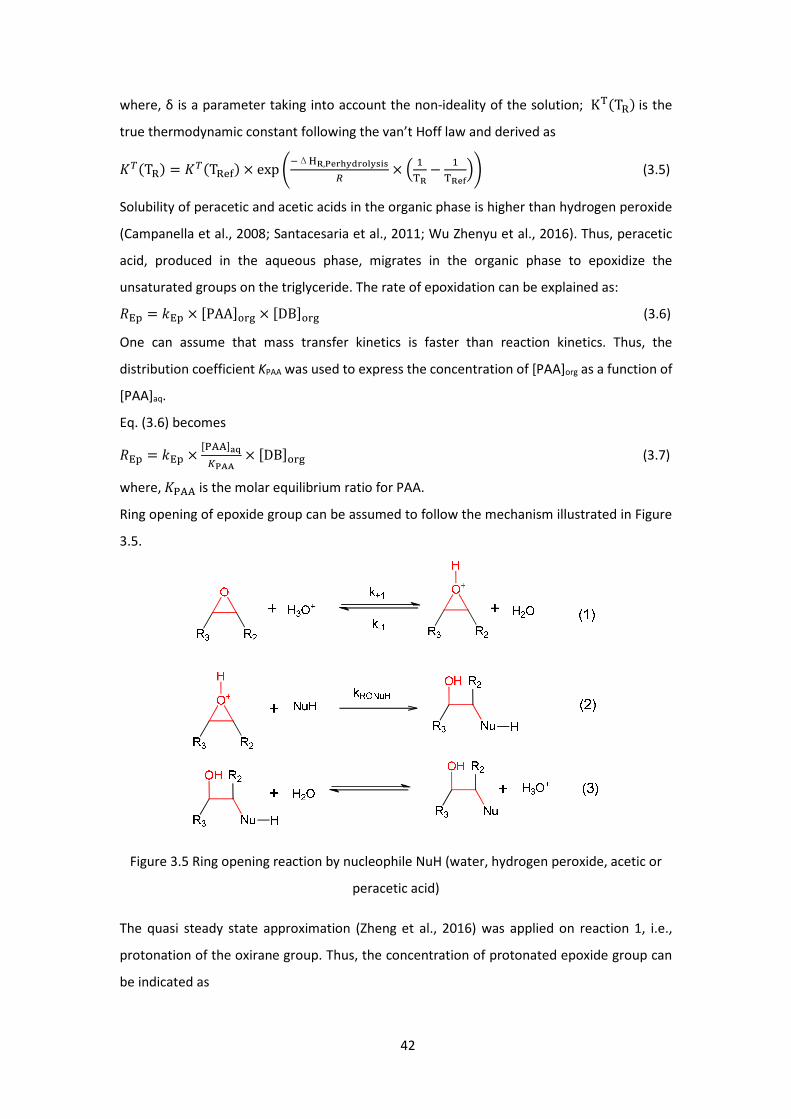
42
where, δ is a parameter taking into account the non-ideality of the solution; K�MT�O is the
true thermodynamic constant following the van’t Hoff law and derived as
�`MT�O = �`MT�K O × exp �@Δ £,%�W¤¥¦WV�¥���§ × F 4�£ − 4�£�¨I� (3.5)
Solubility of peracetic and acetic acids in the organic phase is higher than hydrogen peroxide
(Campanella et al., 2008; Santacesaria et al., 2011; Wu Zhenyu et al., 2016). Thus, peracetic
acid, produced in the aqueous phase, migrates in the organic phase to epoxidize the
unsaturated groups on the triglyceride. The rate of epoxidation can be explained as:
�QR = �QR × �PAA�� × �DB�� (3.6)
One can assume that mass transfer kinetics is faster than reaction kinetics. Thus, the
distribution coefficient KPAA was used to express the concentration of [PAA]org as a function of
[PAA]aq.
Eq. (3.6) becomes
�QR = �QR × �$����1%�� × �DB�� (3.7)
where, �$�� is the molar equilibrium ratio for PAA.
Ring opening of epoxide group can be assumed to follow the mechanism illustrated in Figure
3.5.
Figure 3.5 Ring opening reaction by nucleophile NuH (water, hydrogen peroxide, acetic or
peracetic acid)
The quasi steady state approximation (Zheng et al., 2016) was applied on reaction 1, i.e.,
protonation of the oxirane group. Thus, the concentration of protonated epoxide group can
be indicated as
43
�E$) = ."/�QRVWX� !�"VWX.0/� #�VWX (3.8)
The rate determining step is reaction 2, and thus the reaction rate for the ring opening
reaction by a nucleophile can be evaluated as
�����©ª = �����©ª × �E$)�� × �NuH��
= �����©ª × ."/.�QRVWX.� !�"VWX.0/.� #�VWX × �NuH�� (3.9)
The kinetics of mass transfer was assumed to be faster. Then, the concentrations of
hydroxonium and water in the organic phase can be expressed by using the coefficients of
distribution � !�" and � #�.
Eq. (3.9) becomes
�����©ª = �����©ª × �E$)�� × �NuH��
= k����©ª ′ × �Ep��. �H(O)*+�H O*+ × �NuH��
= k����©ª ′ × �QRVWX.� !�"��� #��� × �©ª ��1®2 (3.10)
where, �����©ª ′ is a lump constant equal to 12#312!3".
Hence, the rates of the ring opening reactions by different nucleophiles are
������� = �������′ × �Ep�� × �������� × � !�"��� #��� (3.11)
�����$�� = �����$��′ × �Ep�� × �$�����%�� × � !�"��� #��� (3.12)
�����& = �����&′ × �Ep�� × �H(O)*+ (3.13)
����� $ = ����� $′ × �Ep��. �H O *+ × � !�"��� #��� (3.14)
where, �������′ , �����$��′ , �����&′ and ����� $′ are equal to
."/.0/ . 12#312!3" , ."/.0/ . 12#312!3" , ."/.0/ . 12#312!3" . 415 and
."/.0/ . 12#312!3" . 412%, respectively.
According to Leveneur et al. (Leveneur et al., 2008), the concentration of hydroxonium ion
can be derived by taking into account the concentration of acetic and sulfuric acids as
44
�H(O)*+ = 4 × �H SO7*+ +8� #9�:��#7 + 2 × �<<= × �H SO7*+ × �W*+ + �??@ABCC.= × �AA*+ × �W*+ (3.15)
where, �<<= is the second dissociation of sulfuric acid (Knopf et al., 2003) and �??@ABCC.= is the
dissociation of acetic acid (Sue et al., 2004).
One can notice that the estimation of the kinetic constants for epoxidation, ring opening by
water, hydrogen peroxide, acetic and peracetic acids is cumbersome. Indeed, the number of
kinetic constants to estimate is 10. Thus, one should define a proper strategy to estimate them.
(3) Mass balance
Experiments were carried out in a batch reactor under isothermal mode.
By assuming fast mass transfer compared to chemical reaction, mass balance of compounds
in the aqueous and organic phases can be simplified to (Leveneur et al., 2014),
Da¯,��DE = |α + 4@H�¯ �@4 × Pα × ∑ν²� × �*+,² + M1 − αO × ∑ν²� × ���,²S (3.16)
Da¯,VWXDE = Pα × K� + 1 − αS@4 × Pα × ∑ν²� × �*+,² + M1 − αO × ∑ν²� × ���,²S (3.17)
Solubility of water, hydroxonium ions and hydrogen peroxide was assumed to be negligible in
the organic phase. Solubility of CSO, ECSO and RO products in the aqueous phase was assumed
to be negligible. Hence, the distribution coefficients for water, hydroxonium ion, hydrogen
peroxide, CSO, ECSO and RO products can be written
�&; � !�"; � #�# →∞ and �a9�; �µ=¶·;��� → 0
Mass balances of acetic acid, hydrogen peroxide, peracetic acid and water in the aqueous
phase can be derived as:
D�����DE = Fα + 4@H���I@4 × F−α × �$K�L + M1 − αO × P�QR − �������SI (3.18)
D� $��DE = −�$K�L − P4@αSα
× ����� $ (3.19)
D�$����DE = Fα + 4@H1%��I@4 × Fα.�$K�L + M1 − αO × P−�QR − �����$��SI (3.20)
D� #���DE = �$K�L − M4@HOH × ����� #� (3.21)
45
Mass balances of double bond, epoxide group and ring opening group in the organic phase
can be derived as
D�TUVWXDE = −�QR (3.22)
D�Q%VWXDE = �QR − ����� $ − �����& − ������� − �����$�� (3. 23)
D���VWXDE = ����� $ + �����& + ������� + �����$�� (3.24)
(4) Kinetic modeling and strategy
To estimate the 10 kinetic constants, the following methodology was used:
-Step 1: kinetic constants of ring opening by water (�����&′ & Ea����&′
) were estimated by
using Runs 1 to 6;
-Step 2: kinetic constants of ring opening by hydrogen peroxide (����� $′ & Ea���� $′ O were
estimated by using Runs 7 to 11 and by using �����&′ & Ea����&′
from step 1;
-Step 2’: this step was done in parallel than step 2, kinetic constants of ring opening by acetic
acid (�������′ & Ea������′ O were estimated by using Runs 12 to 17 and by using k����&′
&
Ea����&′ from step 1;
-Step 3: kinetic constants of ring opening by peracetic acid (�����$��′ & Ea����$��′ O were
estimated by using Runs 18 to 25 and by using �����&′ & Ea����&′
from step 1, ����� $′ &
Ea���� $′ from step 2 and �������′
& Ea������′ from step 2’ ;
-Step 4: kinetic constants of epoxidation by peracetic acid (�QR′ & EaQR′ O were estimated by
using Runs 26 to 29 and by using �����&′ & Ea����&′
from step 1, ����� $′ & Ea���� $′
from step 2, �������′ & Ea������′
from step 2’ and �����$��′ & Ea����$��′
from step 3 ;
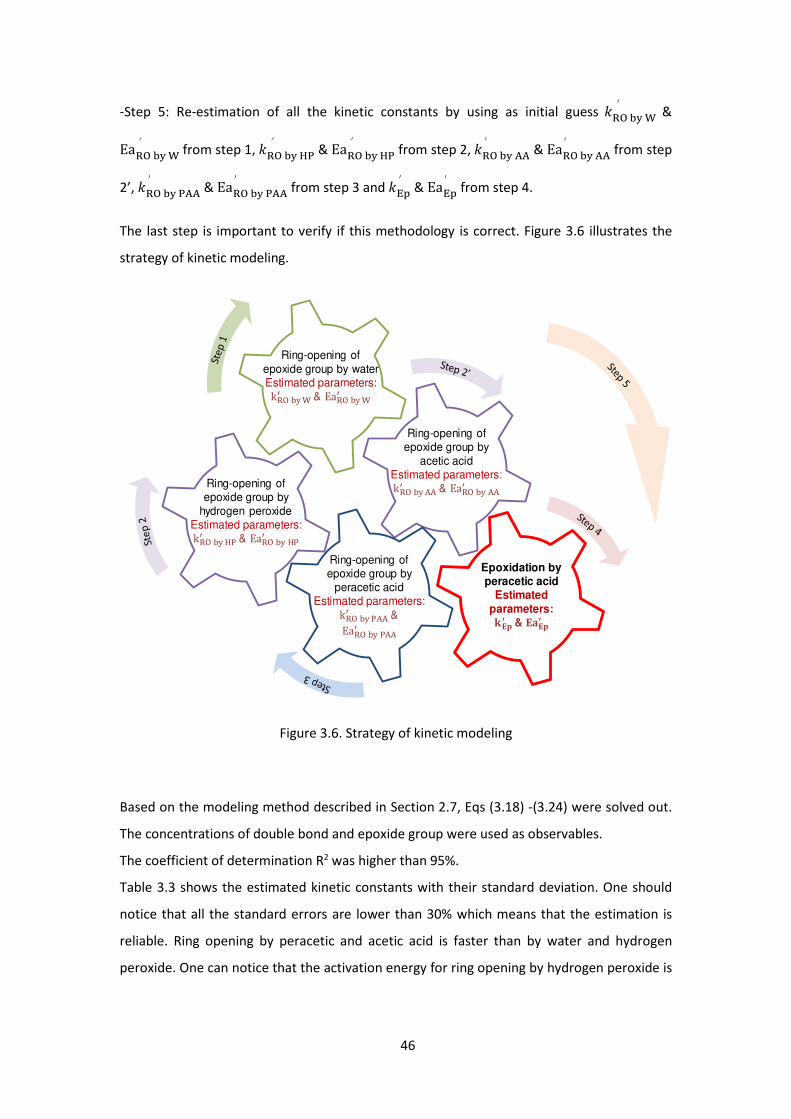
46
-Step 5: Re-estimation of all the kinetic constants by using as initial guess �����&′ &
Ea����&′ from step 1, ����� $′ & Ea���� $′
from step 2, �������′ & Ea������′
from step
2’, �����$��′ & Ea����$��′
from step 3 and �QR′ & EaQR′ from step 4.
The last step is important to verify if this methodology is correct. Figure 3.6 illustrates the
strategy of kinetic modeling.
Figure 3.6. Strategy of kinetic modeling
Based on the modeling method described in Section 2.7, Eqs (3.18) -(3.24) were solved out.
The concentrations of double bond and epoxide group were used as observables.
The coefficient of determination R2 was higher than 95%.
Table 3.3 shows the estimated kinetic constants with their standard deviation. One should
notice that all the standard errors are lower than 30% which means that the estimation is
reliable. Ring opening by peracetic and acetic acid is faster than by water and hydrogen
peroxide. One can notice that the activation energy for ring opening by hydrogen peroxide is
Ring-opening of epoxide group by waterEstimated parameters: k����&� & Ea����&�
Ring-opening of epoxide group by
hydrogen peroxideEstimated parameters: k���� $� & Ea���� $�
Ring-opening of epoxide group by
acetic acidEstimated parameters: k������� & Ea�������
Ring-opening of epoxide group by
peracetic acidEstimated parameters: k����$��� & Ea����$���
Epoxidation by peracetic acid
Estimated parameters: [\]� & \^\]�
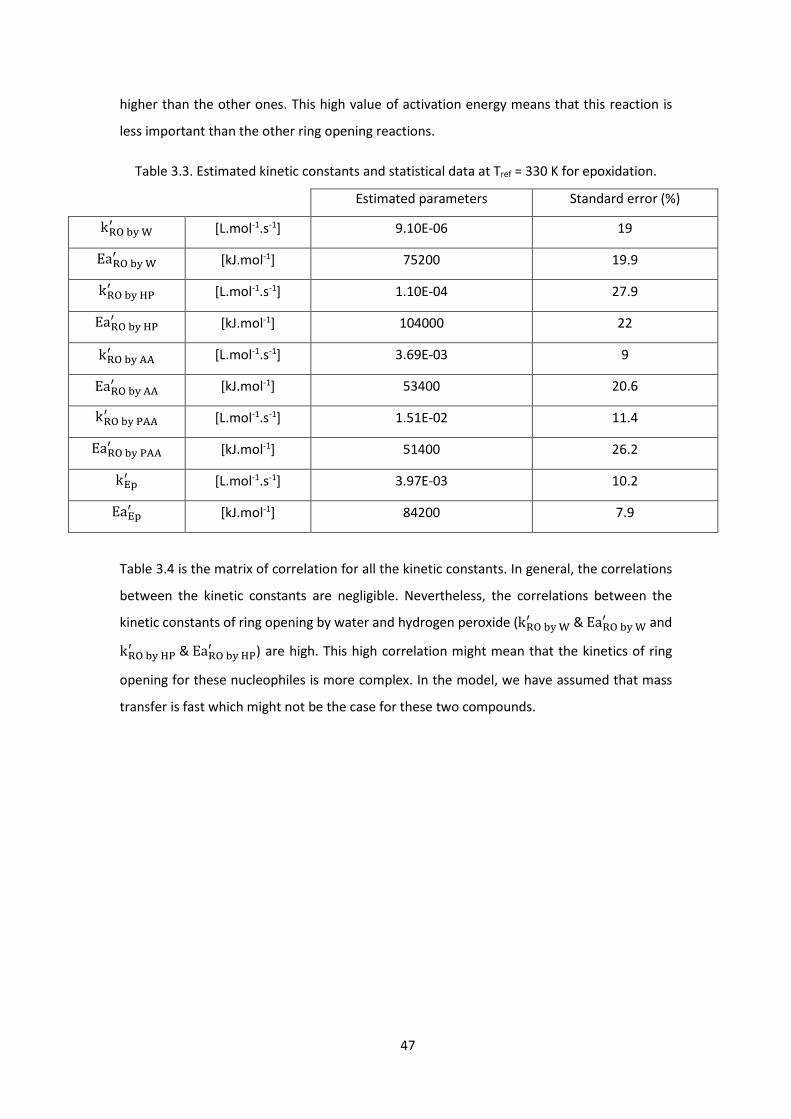
47
higher than the other ones. This high value of activation energy means that this reaction is
less important than the other ring opening reactions.
Table 3.3. Estimated kinetic constants and statistical data at Tref = 330 K for epoxidation.
Estimated parameters Standard error (%)
k����&� [L.mol-1.s-1] 9.10E-06 19
Ea����&� [kJ.mol-1] 75200 19.9
k���� $� [L.mol-1.s-1] 1.10E-04 27.9
Ea���� $� [kJ.mol-1] 104000 22
k������� [L.mol-1.s-1] 3.69E-03 9
Ea������� [kJ.mol-1] 53400 20.6
k����$��� [L.mol-1.s-1] 1.51E-02 11.4
Ea����$��� [kJ.mol-1] 51400 26.2
kQR� [L.mol-1.s-1] 3.97E-03 10.2
EaQR� [kJ.mol-1] 84200 7.9
Table 3.4 is the matrix of correlation for all the kinetic constants. In general, the correlations
between the kinetic constants are negligible. Nevertheless, the correlations between the
kinetic constants of ring opening by water and hydrogen peroxide (k����&� &Ea����&� and
k���� $� &Ea���� $� ) are high. This high correlation might mean that the kinetics of ring
opening for these nucleophiles is more complex. In the model, we have assumed that mass
transfer is fast which might not be the case for these two compounds.
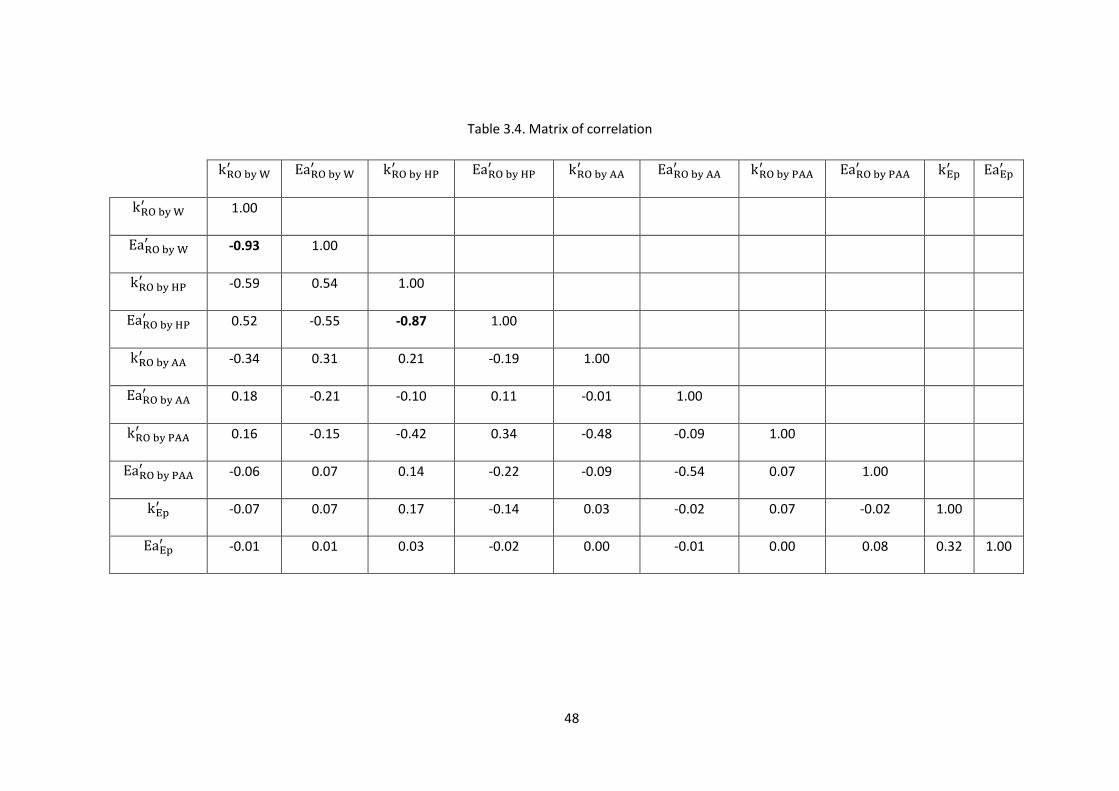
48
Table 3.4. Matrix of correlation
k����&� Ea����&� k���� $� Ea���� $� k������� Ea������� k����$��� Ea����$��� kQR� EaQR�
k����&� 1.00
Ea����&� -0.93 1.00
k���� $� -0.59 0.54 1.00
Ea���� $� 0.52 -0.55 -0.87 1.00
k������� -0.34 0.31 0.21 -0.19 1.00
Ea������� 0.18 -0.21 -0.10 0.11 -0.01 1.00
k����$��� 0.16 -0.15 -0.42 0.34 -0.48 -0.09 1.00
Ea����$��� -0.06 0.07 0.14 -0.22 -0.09 -0.54 0.07 1.00
kQR� -0.07 0.07 0.17 -0.14 0.03 -0.02 0.07 -0.02 1.00
EaQR� -0.01 0.01 0.03 -0.02 0.00 -0.01 0.00 0.08 0.32 1.00
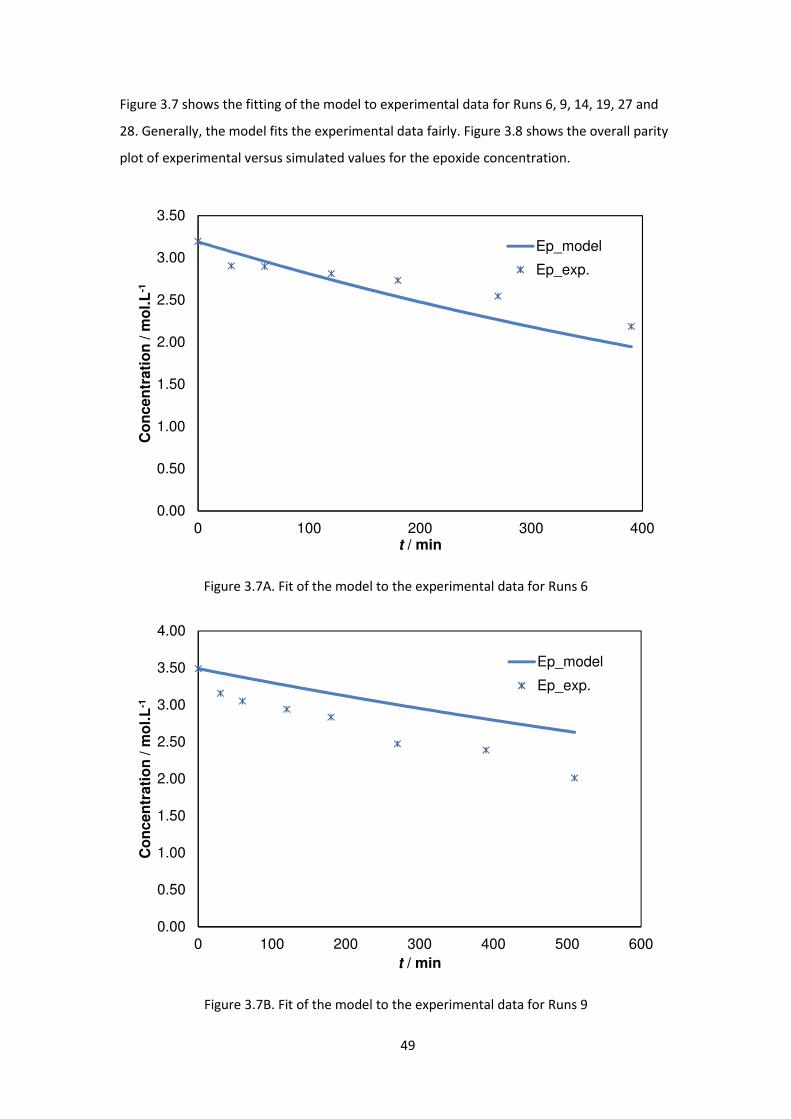
49
Figure 3.7 shows the fitting of the model to experimental data for Runs 6, 9, 14, 19, 27 and
28. Generally, the model fits the experimental data fairly. Figure 3.8 shows the overall parity
plot of experimental versus simulated values for the epoxide concentration.
Figure 3.7A. Fit of the model to the experimental data for Runs 6
Figure 3.7B. Fit of the model to the experimental data for Runs 9
0.00
0.50
1.00
1.50
2.00
2.50
3.00
3.50
0 100 200 300 400
Co
ncen
trati
on
/ m
ol.
L-1
t / min
Ep_model
Ep_exp.
0.00
0.50
1.00
1.50
2.00
2.50
3.00
3.50
4.00
0 100 200 300 400 500 600
Co
ncen
trati
on
/ m
ol.
L-1
t / min
Ep_model
Ep_exp.
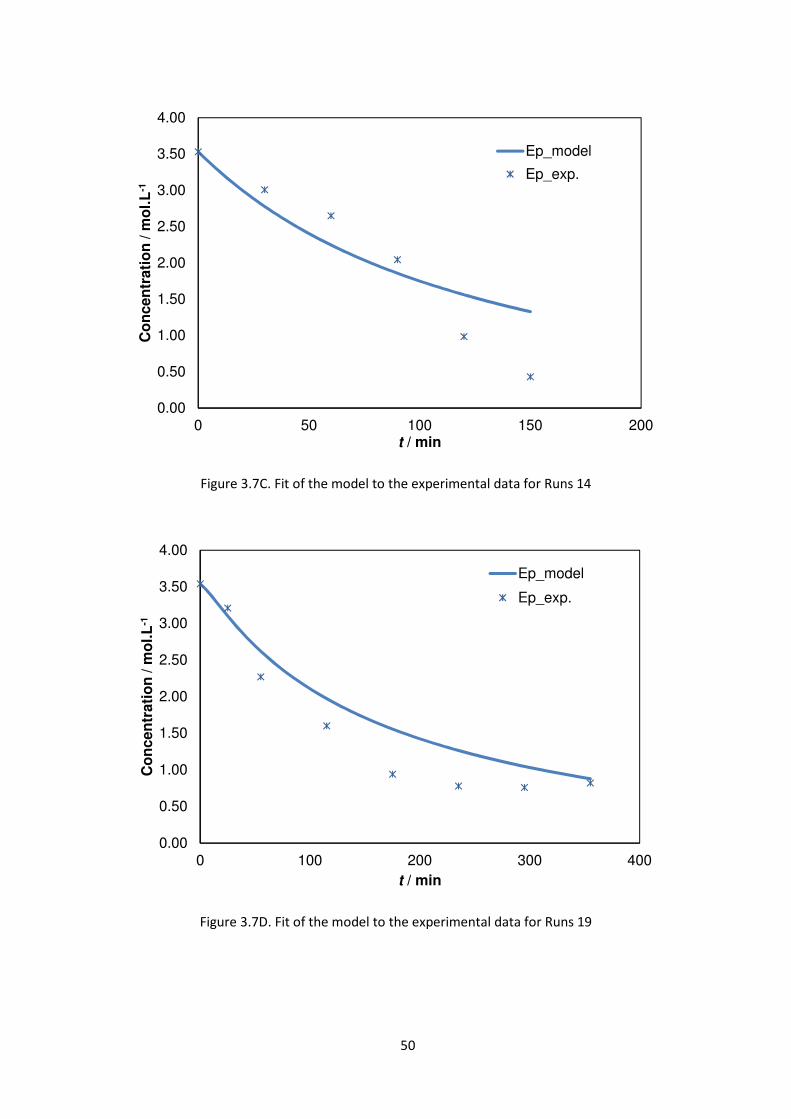
50
Figure 3.7C. Fit of the model to the experimental data for Runs 14
Figure 3.7D. Fit of the model to the experimental data for Runs 19
0.00
0.50
1.00
1.50
2.00
2.50
3.00
3.50
4.00
0 50 100 150 200
Co
ncen
trati
on
/ m
ol.
L-1
t / min
Ep_model
Ep_exp.
0.00
0.50
1.00
1.50
2.00
2.50
3.00
3.50
4.00
0 100 200 300 400
Co
ncen
trati
on
/ m
ol.
L-1
t / min
Ep_model
Ep_exp.
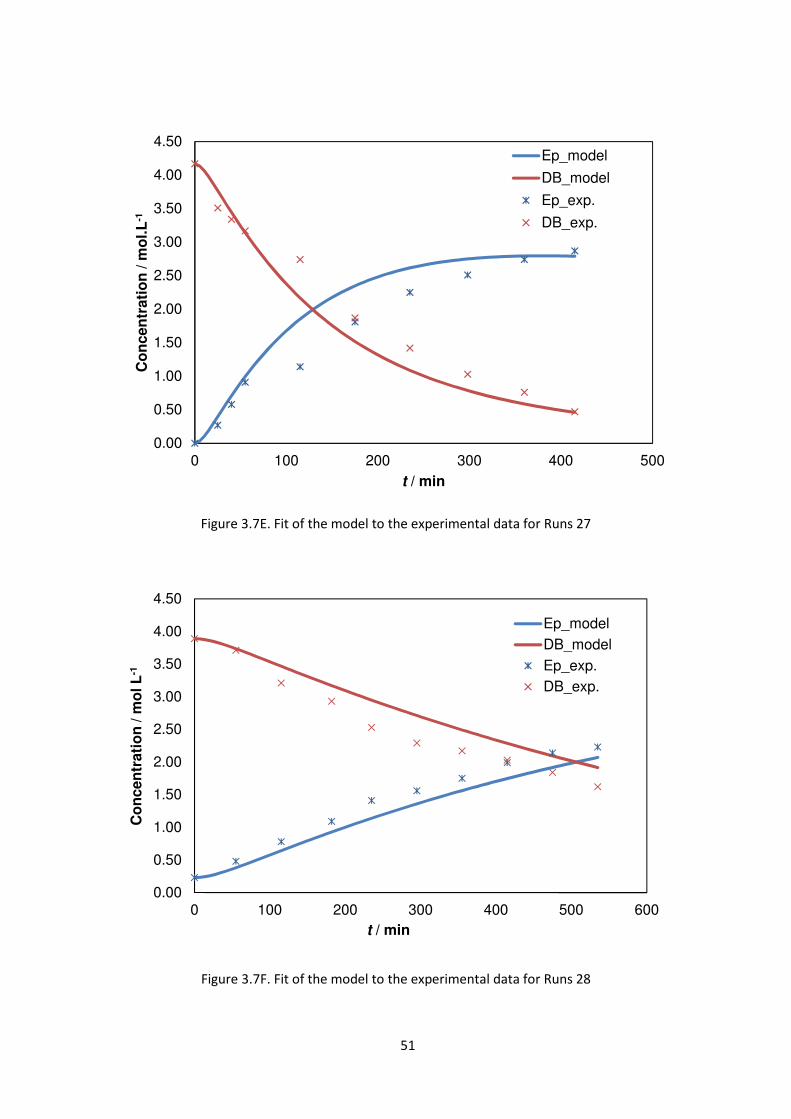
51
Figure 3.7E. Fit of the model to the experimental data for Runs 27
Figure 3.7F. Fit of the model to the experimental data for Runs 28
0.00
0.50
1.00
1.50
2.00
2.50
3.00
3.50
4.00
4.50
0 100 200 300 400 500
Co
ncen
trati
on
/ m
ol.
L-1
t / min
Ep_model
DB_model
Ep_exp.
DB_exp.
0.00
0.50
1.00
1.50
2.00
2.50
3.00
3.50
4.00
4.50
0 100 200 300 400 500 600
Co
ncen
trati
on
/ m
ol L
-1
t / min
Ep_modelDB_modelEp_exp.DB_exp.
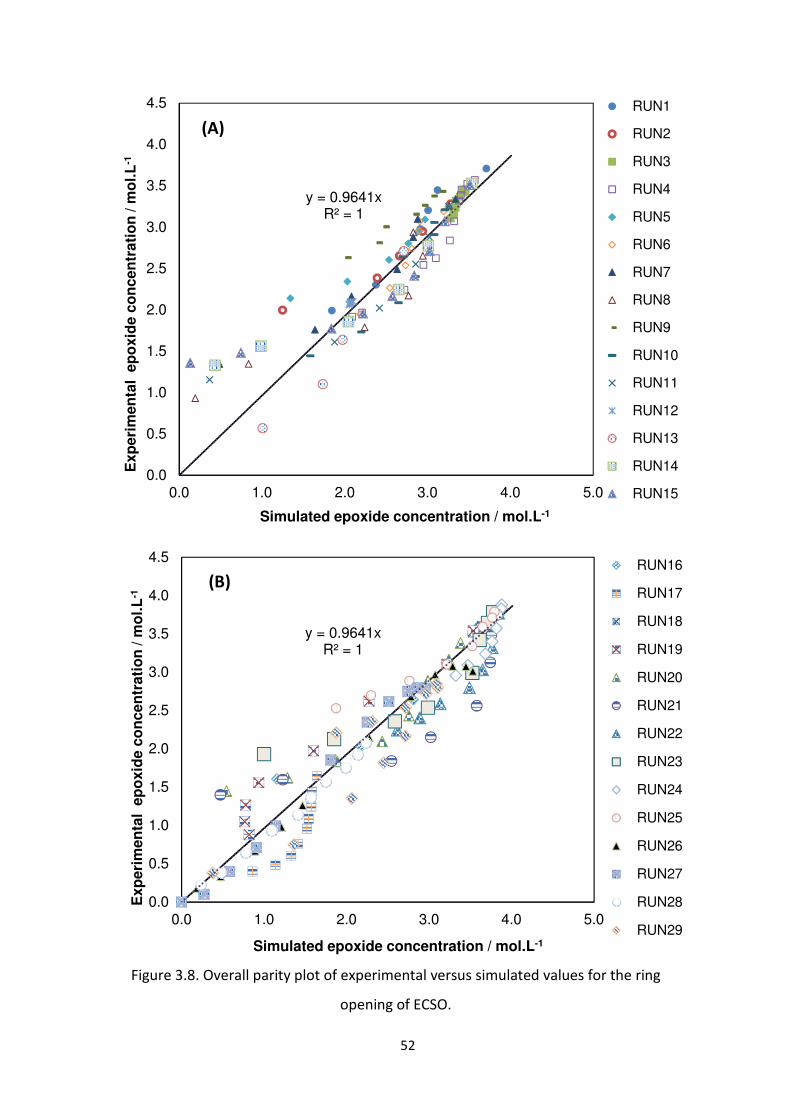
52
Figure 3.8. Overall parity plot of experimental versus simulated values for the ring
opening of ECSO.
y = 0.9641xR² = 1
0.0
0.5
1.0
1.5
2.0
2.5
3.0
3.5
4.0
4.5
0.0 1.0 2.0 3.0 4.0 5.0
Exp
eri
men
tal e
po
xid
e c
on
cen
trati
on
/ m
ol.
L-1
Simulated epoxide concentration / mol.L-1
RUN1
RUN2
RUN3
RUN4
RUN5
RUN6
RUN7
RUN8
RUN9
RUN10
RUN11
RUN12
RUN13
RUN14
RUN15
(A)
y = 0.9641xR² = 1
0.0
0.5
1.0
1.5
2.0
2.5
3.0
3.5
4.0
4.5
0.0 1.0 2.0 3.0 4.0 5.0
Exp
eri
men
tal e
po
xid
e c
on
cen
trati
on
/ m
ol.
L-1
Simulated epoxide concentration / mol.L-1
RUN16
RUN17
RUN18
RUN19
RUN20
RUN21
RUN22
RUN23
RUN24
RUN25
RUN26
RUN27
RUN28
RUN29
(B)
53
3.3.3 Influence of the configuration on ring opening products distribution
The goal of this section is to determine the best configuration to minimize the ring opening
products. From the previous section, one can notice that it is not possible to avoid ring
opening side reactions. The different configurations tested were:
-Batch reactor (Batch),
- Semi-batch reactor where hydrogen peroxide was added (SemiBatch HP),
- Semi-batch reactor where acetic acid was added (SemiBatch AA),
- Semi-batch reactor where acetic and sulfuric acid were added (SemiBatch AA SA),
- Semi-batch reactor where hydrogen peroxide and sulfuric acid were added (SemiBatch HP
SA).
Based on the kinetic constants estimated during the modeling stage, the maximum
concentration of epoxide group and its associated time (tmax), and the ring opening product
distribution at this time were determined for each configuration. Table 3.5 presents the
experimental conditions for each configuration under isothermal conditions.
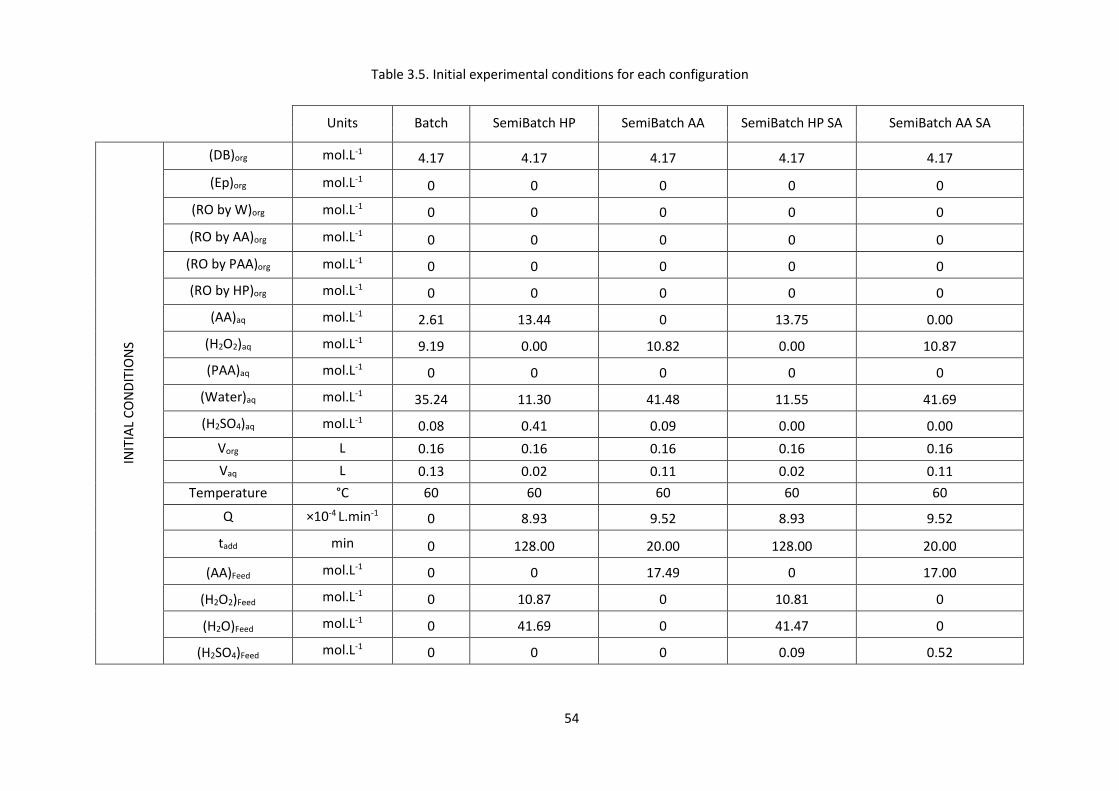
54
Table 3.5. Initial experimental conditions for each configuration
Units Batch SemiBatch HP SemiBatch AA SemiBatch HP SA SemiBatch AA SA
INIT
IAL
CO
ND
ITIO
NS
(DB)org mol.L-1 4.17 4.17 4.17 4.17 4.17
(Ep)org mol.L-1 0 0 0 0 0
(RO by W)org mol.L-1 0 0 0 0 0
(RO by AA)org mol.L-1 0 0 0 0 0
(RO by PAA)org mol.L-1 0 0 0 0 0
(RO by HP)org mol.L-1 0 0 0 0 0
(AA)aq mol.L-1 2.61 13.44 0 13.75 0.00
(H2O2)aq mol.L-1 9.19 0.00 10.82 0.00 10.87
(PAA)aq mol.L-1 0 0 0 0 0
(Water)aq mol.L-1 35.24 11.30 41.48 11.55 41.69
(H2SO4)aq mol.L-1 0.08 0.41 0.09 0.00 0.00
Vorg L 0.16 0.16 0.16 0.16 0.16
Vaq L 0.13 0.02 0.11 0.02 0.11
Temperature °C 60 60 60 60 60
Q ×10-4 L.min-1 0 8.93 9.52 8.93 9.52
tadd min 0 128.00 20.00 128.00 20.00
(AA)Feed mol.L-1 0 0 17.49 0 17.00
(H2O2)Feed mol.L-1 0 10.87 0 10.81 0
(H2O)Feed mol.L-1 0 41.69 0 41.47 0
(H2SO4)Feed mol.L-1 0 0 0 0.09 0.52
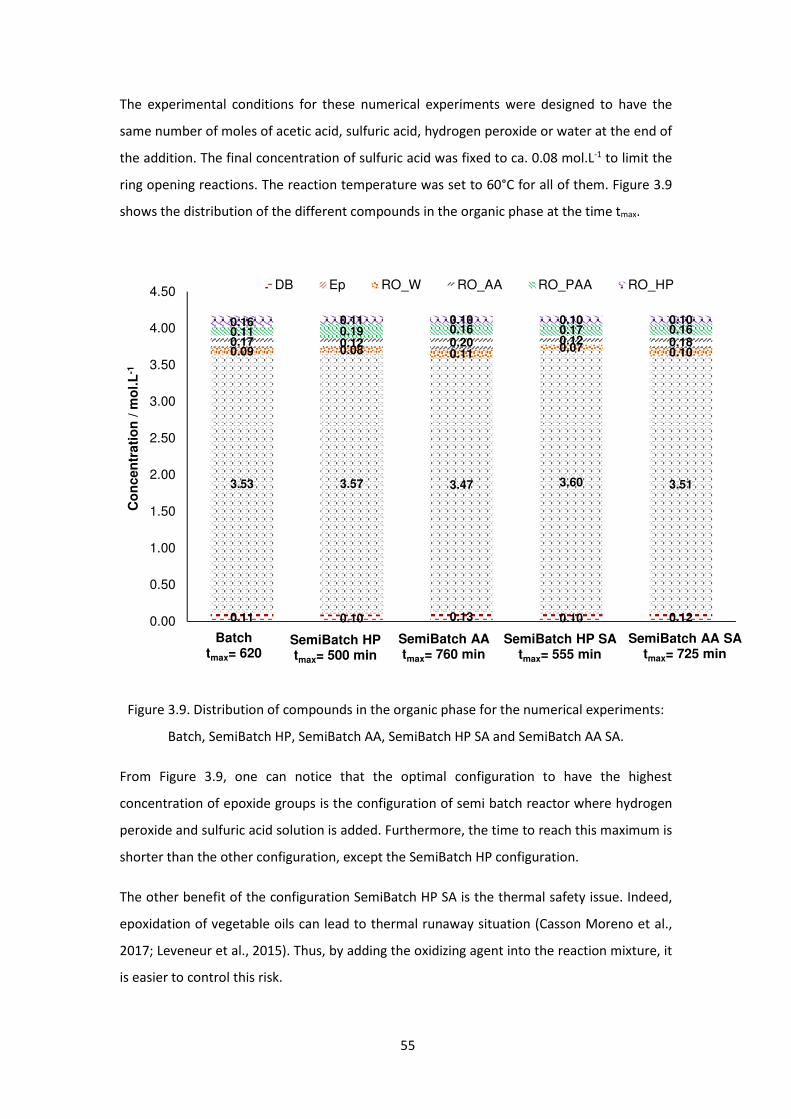
55
The experimental conditions for these numerical experiments were designed to have the
same number of moles of acetic acid, sulfuric acid, hydrogen peroxide or water at the end of
the addition. The final concentration of sulfuric acid was fixed to ca. 0.08 mol.L-1 to limit the
ring opening reactions. The reaction temperature was set to 60°C for all of them. Figure 3.9
shows the distribution of the different compounds in the organic phase at the time tmax.
Figure 3.9. Distribution of compounds in the organic phase for the numerical experiments:
Batch, SemiBatch HP, SemiBatch AA, SemiBatch HP SA and SemiBatch AA SA.
From Figure 3.9, one can notice that the optimal configuration to have the highest
concentration of epoxide groups is the configuration of semi batch reactor where hydrogen
peroxide and sulfuric acid solution is added. Furthermore, the time to reach this maximum is
shorter than the other configuration, except the SemiBatch HP configuration.
The other benefit of the configuration SemiBatch HP SA is the thermal safety issue. Indeed,
epoxidation of vegetable oils can lead to thermal runaway situation (Casson Moreno et al.,
2017; Leveneur et al., 2015). Thus, by adding the oxidizing agent into the reaction mixture, it
is easier to control this risk.
0.11 0.10 0.13 0.10 0.12
3.53 3.57 3.47 3.60 3.51
0.09 0.08 0.110.07 0.10
0.17 0.12 0.20 0.12 0.180.11 0.19 0.16 0.17 0.160.16 0.11 0.10 0.10 0.10
0.00
0.50
1.00
1.50
2.00
2.50
3.00
3.50
4.00
4.50
Batch SemiBatch HP SemiBatch AA SemiBatch HP SA SemiBatch AA SA
Co
ncen
trati
on
/ m
ol.L
-1
DB Ep RO_W RO_AA RO_PAA RO_HP
Batch tmax= 620
SemiBatch HP tmax= 500 min
SemiBatch AA tmax= 760 min
SemiBatch HP SA tmax= 555 min
SemiBatch AA SA tmax= 725 min
56
3.4 Conclusion
The influence of ring opening reactions during the epoxidation of cottonseed oil by peracetic
acid was investigated. In the first part, a kinetic study shown that all the nucleophiles, i.e.,
water, hydrogen peroxide, acetic and peracetic acids, can attack the epoxide groups. An
induction period was observed to be present when the concentration of sulfuric acid was low.
Hence, a modeling strategy was developed to estimate the 10 kinetic constants of this system.
A pseudohomogeneous model was used by taking into account the distribution coefficients
of acetic and peracetic acids. These distribution coefficients were found to be dependent on
the concentrations of epoxide groups, double bond and ring opening products. For that, the
estimation of the ring opening reactions was done apart to get some reliable initial guess
values during the last stage of the modeling. The correlation between the kinetic constants
can be considered as negligible. It was found that ring opening by peracetic and acetic acid is
faster than by water and hydrogen peroxide.
Based on this model, the semi batch reactor, where hydrogen peroxide and sulfuric acid were
added continuously, was found to be the optimal configuration to maximize the concentration
of epoxide group and minimize the concentration of ring opening products.
57
Chapter IV Interaction between functional groups and
physicochemical properties: application to vegetable oils and their
epoxidized and carbonated derivatives
Part of this chapter is adapted from the post print of the following article:
Cai, X., Ait Aissa, K., Estel, L., & Leveneur, S. (2018). Investigation of the Physicochemical
Properties for Vegetable Oils and Their Epoxidized and Carbonated Derivatives. Journal of
Chemical & Engineering Data, 63(5), 1524-1533.
Link: https://pubs.acs.org/doi/pdfplus/10.1021/acs.jced.7b01075
Further permissions related to the material excerpted should be directed to the ACS
Publications. Copyright © 2018 American Chemical Society.
4.1 Introduction
The evolution of different physicochemical properties was investigated, such as refractive
index, dynamic viscosity, density and specific heat capacity of vegetable oils, epoxidized
vegetable oils and carbonated vegetable oils at different temperatures and concentrations of
unsaturated, epoxide and carbonated groups. Three different types of vegetable oils were
selected: cottonseed, linseed and soybean oils. We have chosen these vegetable oils because
they are more representative since their components of unsaturated fatty acids and the iodine
numbers are quite different (Table 4.1). The objective is to investigate the influence of the
functional groups on the physicochemical properties, primarily because these functional
groups change with the progress of the reaction. In order to predict the evolution of these
properties at different concentrations of functional groups, we have measured the
physicochemical properties of different mixtures of soybean oil and its derivatives. In this
chapter, Section 4.2 gives detailed information about the experimental procedure. Section 4.3
shows the experiment results and discussion. Section 4.4 gives the conclusion for this part of
the work.
Table 4.1. Components of vegetable oils in mass fraction
Palmitic Palmitoleic Stearic Oleic Linoleic Linolenic Iodine number
C16:0 C16:1 C18:0 C18:1 C18:2 C18:3
Linseed oil 5.10 0.30 2.50 18.90 18.10 55.10 175.18
Soybean oil 10.60 - 4.80 22.50 52.30 8.20 132.16
Cottonseed oil 28.70 - 0.90 13.00 57.40 - 116.88
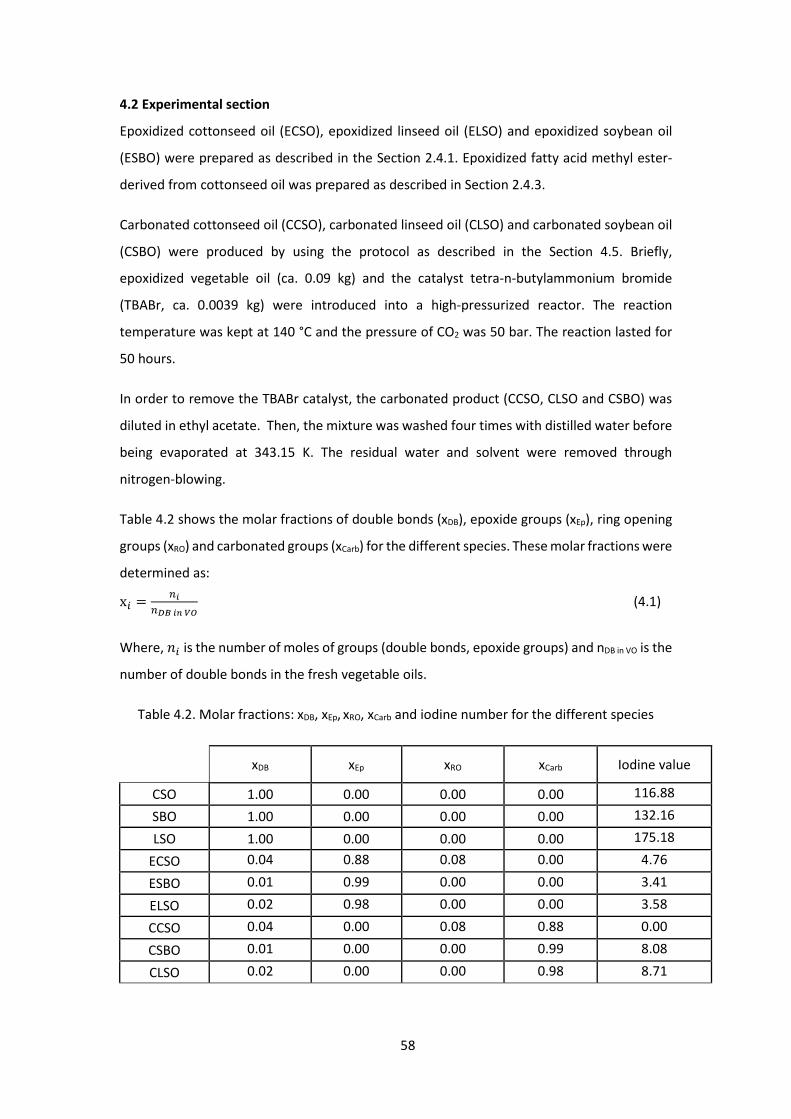
58
4.2 Experimental section
Epoxidized cottonseed oil (ECSO), epoxidized linseed oil (ELSO) and epoxidized soybean oil
(ESBO) were prepared as described in the Section 2.4.1. Epoxidized fatty acid methyl ester-
derived from cottonseed oil was prepared as described in Section 2.4.3.
Carbonated cottonseed oil (CCSO), carbonated linseed oil (CLSO) and carbonated soybean oil
(CSBO) were produced by using the protocol as described in the Section 4.5. Briefly,
epoxidized vegetable oil (ca. 0.09 kg) and the catalyst tetra-n-butylammonium bromide
(TBABr, ca. 0.0039 kg) were introduced into a high-pressurized reactor. The reaction
temperature was kept at 140 °C and the pressure of CO2 was 50 bar. The reaction lasted for
50 hours.
In order to remove the TBABr catalyst, the carbonated product (CCSO, CLSO and CSBO) was
diluted in ethyl acetate. Then, the mixture was washed four times with distilled water before
being evaporated at 343.15 K. The residual water and solvent were removed through
nitrogen-blowing.
Table 4.2 shows the molar fractions of double bonds (xDB), epoxide groups (xEp), ring opening
groups (xRO) and carbonated groups (xCarb) for the different species. These molar fractions were
determined as:
xB = ¹º¹»¼º½¾¿ (4.1)
Where, qB is the number of moles of groups (double bonds, epoxide groups) and nDB in VO is the
number of double bonds in the fresh vegetable oils.
Table 4.2. Molar fractions: xDB, xEp, xRO, xCarb and iodine number for the different species
xDB xEp xRO xCarb Iodine value
CSO 1.00 0.00 0.00 0.00 116.88
SBO 1.00 0.00 0.00 0.00 132.16
LSO 1.00 0.00 0.00 0.00 175.18
ECSO 0.04 0.88 0.08 0.00 4.76
ESBO 0.01 0.99 0.00 0.00 3.41
ELSO 0.02 0.98 0.00 0.00 3.58
CCSO 0.04 0.00 0.08 0.88 0.00
CSBO 0.01 0.00 0.00 0.99 8.08
CLSO 0.02 0.00 0.00 0.98 8.71
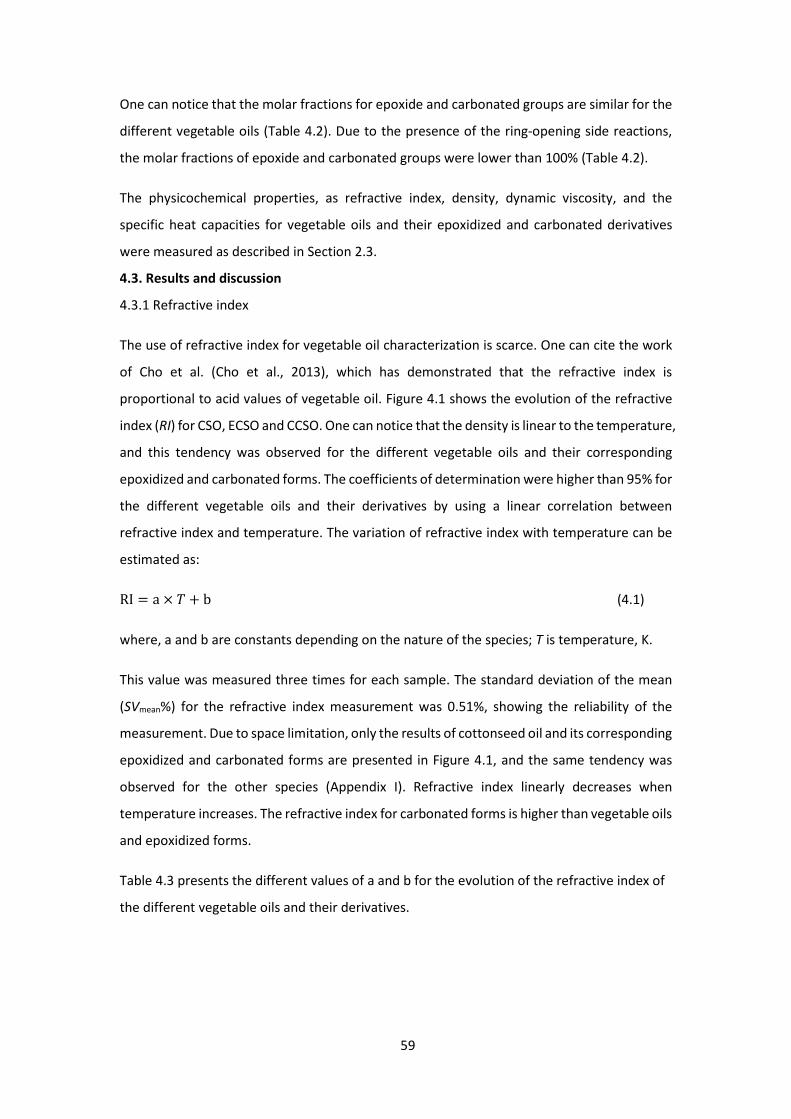
59
One can notice that the molar fractions for epoxide and carbonated groups are similar for the
different vegetable oils (Table 4.2). Due to the presence of the ring-opening side reactions,
the molar fractions of epoxide and carbonated groups were lower than 100% (Table 4.2).
The physicochemical properties, as refractive index, density, dynamic viscosity, and the
specific heat capacities for vegetable oils and their epoxidized and carbonated derivatives
were measured as described in Section 2.3.
4.3. Results and discussion
4.3.1 Refractive index
The use of refractive index for vegetable oil characterization is scarce. One can cite the work
of Cho et al. (Cho et al., 2013), which has demonstrated that the refractive index is
proportional to acid values of vegetable oil. Figure 4.1 shows the evolution of the refractive
index (RI) for CSO, ECSO and CCSO. One can notice that the density is linear to the temperature,
and this tendency was observed for the different vegetable oils and their corresponding
epoxidized and carbonated forms. The coefficients of determination were higher than 95% for
the different vegetable oils and their derivatives by using a linear correlation between
refractive index and temperature. The variation of refractive index with temperature can be
estimated as:
RI = a × f + b (4.1)
where, a and b are constants depending on the nature of the species; T is temperature, K.
This value was measured three times for each sample. The standard deviation of the mean
(SVmean%) for the refractive index measurement was 0.51%, showing the reliability of the
measurement. Due to space limitation, only the results of cottonseed oil and its corresponding
epoxidized and carbonated forms are presented in Figure 4.1, and the same tendency was
observed for the other species (Appendix I). Refractive index linearly decreases when
temperature increases. The refractive index for carbonated forms is higher than vegetable oils
and epoxidized forms.
Table 4.3 presents the different values of a and b for the evolution of the refractive index of
the different vegetable oils and their derivatives.
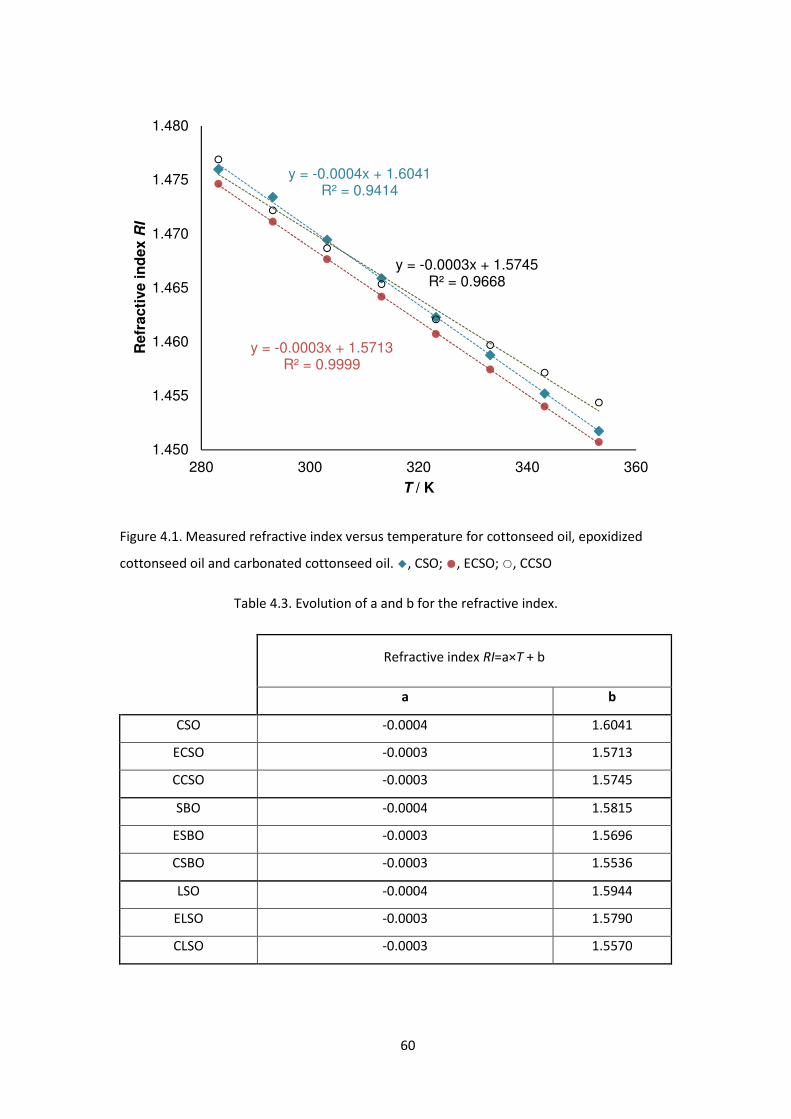
60
Figure 4.1. Measured refractive index versus temperature for cottonseed oil, epoxidized
cottonseed oil and carbonated cottonseed oil. ◆, CSO; ●, ECSO; ○, CCSO
Table 4.3. Evolution of a and b for the refractive index.
Refractive index RI=a×T + b
a b
CSO -0.0004 1.6041
ECSO -0.0003 1.5713
CCSO -0.0003 1.5745
SBO -0.0004 1.5815
ESBO -0.0003 1.5696
CSBO -0.0003 1.5536
LSO -0.0004 1.5944
ELSO -0.0003 1.5790
CLSO -0.0003 1.5570
y = -0.0004x + 1.6041R² = 0.9414
y = -0.0003x + 1.5713R² = 0.9999
y = -0.0003x + 1.5745R² = 0.9668
1.450
1.455
1.460
1.465
1.470
1.475
1.480
280 300 320 340 360
Refr
acti
ve in
dex R
I
T / K
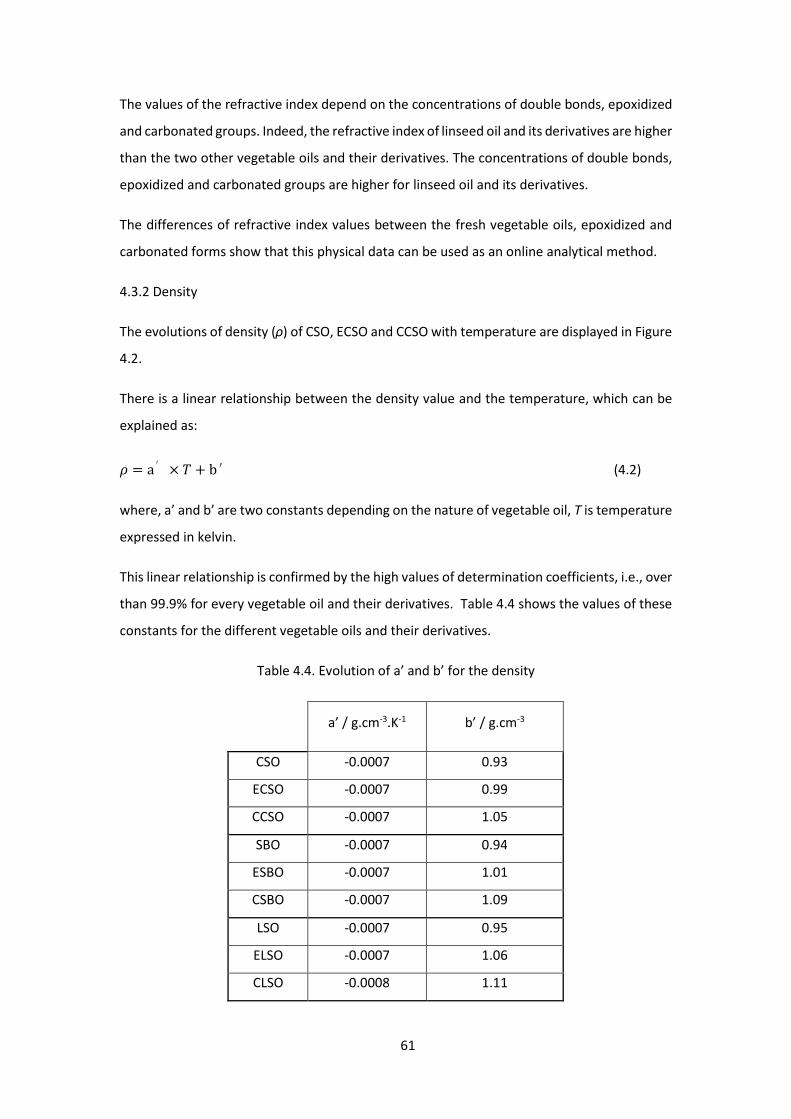
61
The values of the refractive index depend on the concentrations of double bonds, epoxidized
and carbonated groups. Indeed, the refractive index of linseed oil and its derivatives are higher
than the two other vegetable oils and their derivatives. The concentrations of double bonds,
epoxidized and carbonated groups are higher for linseed oil and its derivatives.
The differences of refractive index values between the fresh vegetable oils, epoxidized and
carbonated forms show that this physical data can be used as an online analytical method.
4.3.2 Density
The evolutions of density (ρ) of CSO, ECSO and CCSO with temperature are displayed in Figure
4.2.
There is a linear relationship between the density value and the temperature, which can be
explained as:
o = a′ × f + b′ (4.2)
where, a’ and b’ are two constants depending on the nature of vegetable oil, T is temperature
expressed in kelvin.
This linear relationship is confirmed by the high values of determination coefficients, i.e., over
than 99.9% for every vegetable oil and their derivatives. Table 4.4 shows the values of these
constants for the different vegetable oils and their derivatives.
Table 4.4. Evolution of a’ and b’ for the density
a’ / g.cm-3.K-1 b’ / g.cm-3
CSO -0.0007 0.93
ECSO -0.0007 0.99
CCSO -0.0007 1.05
SBO -0.0007 0.94
ESBO -0.0007 1.01
CSBO -0.0007 1.09
LSO -0.0007 0.95
ELSO -0.0007 1.06
CLSO -0.0008 1.11
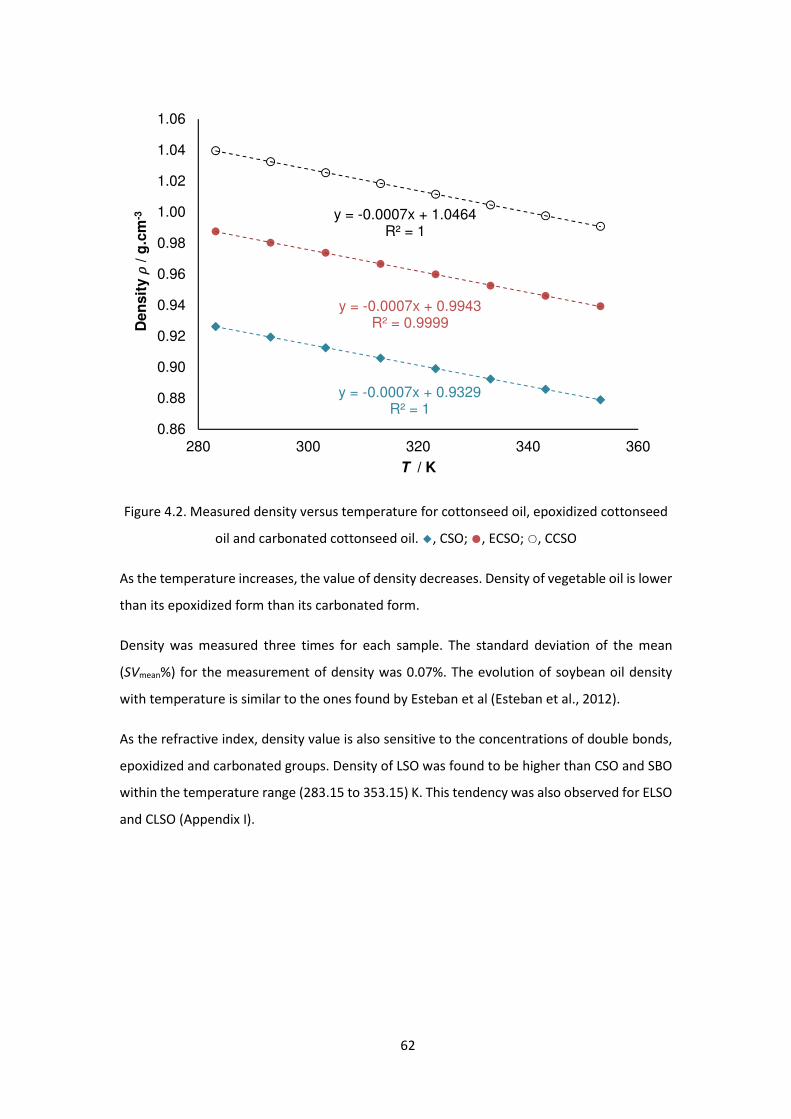
62
Figure 4.2. Measured density versus temperature for cottonseed oil, epoxidized cottonseed
oil and carbonated cottonseed oil. ◆, CSO; ●, ECSO; ○, CCSO
As the temperature increases, the value of density decreases. Density of vegetable oil is lower
than its epoxidized form than its carbonated form.
Density was measured three times for each sample. The standard deviation of the mean
(SVmean%) for the measurement of density was 0.07%. The evolution of soybean oil density
with temperature is similar to the ones found by Esteban et al (Esteban et al., 2012).
As the refractive index, density value is also sensitive to the concentrations of double bonds,
epoxidized and carbonated groups. Density of LSO was found to be higher than CSO and SBO
within the temperature range (283.15 to 353.15) K. This tendency was also observed for ELSO
and CLSO (Appendix I).
y = -0.0007x + 0.9329R² = 1
y = -0.0007x + 0.9943R² = 0.9999
y = -0.0007x + 1.0464R² = 1
0.86
0.88
0.90
0.92
0.94
0.96
0.98
1.00
1.02
1.04
1.06
280 300 320 340 360
Den
sit
y o/
g.c
m-3
T / K
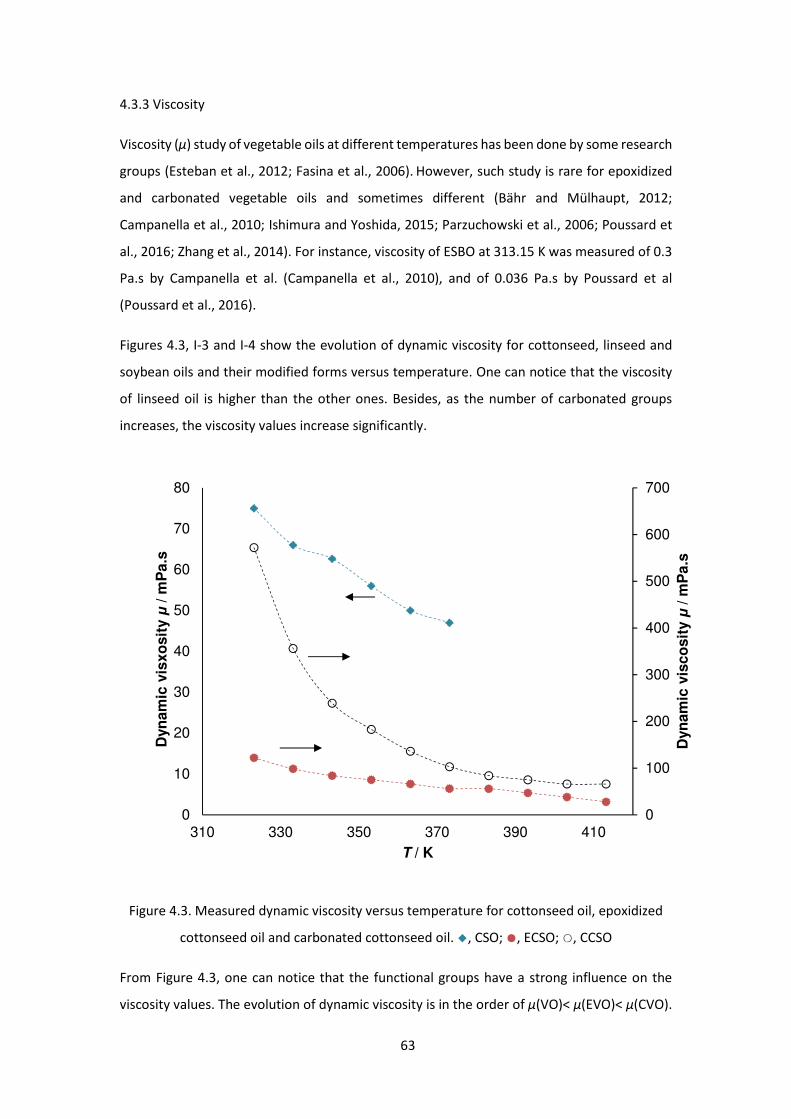
63
4.3.3 Viscosity
Viscosity (µ) study of vegetable oils at different temperatures has been done by some research
groups (Esteban et al., 2012; Fasina et al., 2006). However, such study is rare for epoxidized
and carbonated vegetable oils and sometimes different (Bähr and Mülhaupt, 2012;
Campanella et al., 2010; Ishimura and Yoshida, 2015; Parzuchowski et al., 2006; Poussard et
al., 2016; Zhang et al., 2014). For instance, viscosity of ESBO at 313.15 K was measured of 0.3
Pa.s by Campanella et al. (Campanella et al., 2010), and of 0.036 Pa.s by Poussard et al
(Poussard et al., 2016).
Figures 4.3, I-3 and I-4 show the evolution of dynamic viscosity for cottonseed, linseed and
soybean oils and their modified forms versus temperature. One can notice that the viscosity
of linseed oil is higher than the other ones. Besides, as the number of carbonated groups
increases, the viscosity values increase significantly.
Figure 4.3. Measured dynamic viscosity versus temperature for cottonseed oil, epoxidized
cottonseed oil and carbonated cottonseed oil. ◆, CSO; ●, ECSO; ○, CCSO
From Figure 4.3, one can notice that the functional groups have a strong influence on the
viscosity values. The evolution of dynamic viscosity is in the order of µ(VO)< µ(EVO)< µ(CVO).
0
100
200
300
400
500
600
700
0
10
20
30
40
50
60
70
80
310 330 350 370 390 410
Dyn
am
ic v
isco
sit
y µ
/ m
Pa.s
Dyn
am
ic v
isxo
sit
y µ
/ m
Pa.s
T / K
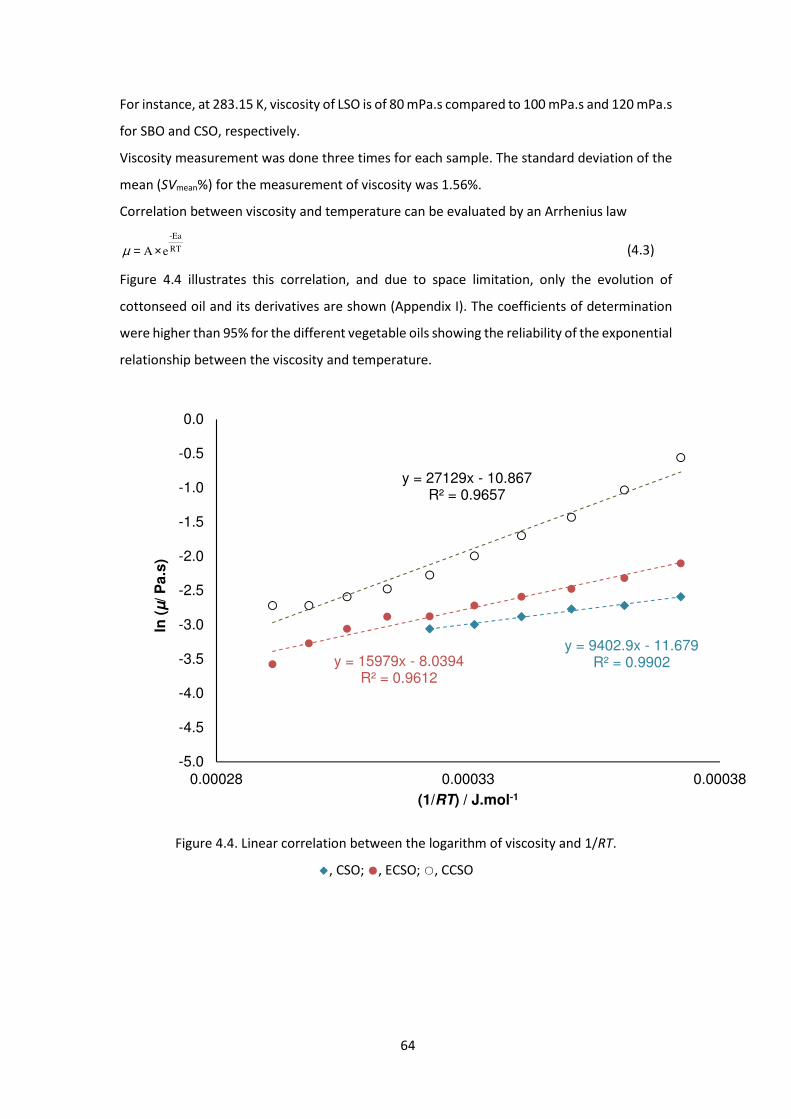
64
For instance, at 283.15 K, viscosity of LSO is of 80 mPa.s compared to 100 mPa.s and 120 mPa.s
for SBO and CSO, respectively.
Viscosity measurement was done three times for each sample. The standard deviation of the
mean (SVmean%) for the measurement of viscosity was 1.56%.
Correlation between viscosity and temperature can be evaluated by an Arrhenius law
RT
-Ea
eA ×=µ (4.3)
Figure 4.4 illustrates this correlation, and due to space limitation, only the evolution of
cottonseed oil and its derivatives are shown (Appendix I). The coefficients of determination
were higher than 95% for the different vegetable oils showing the reliability of the exponential
relationship between the viscosity and temperature.
Figure 4.4. Linear correlation between the logarithm of viscosity and 1/RT.
◆, CSO; ●, ECSO; ○, CCSO
y = 9402.9x - 11.679R² = 0.9902y = 15979x - 8.0394
R² = 0.9612
y = 27129x - 10.867R² = 0.9657
-5.0
-4.5
-4.0
-3.5
-3.0
-2.5
-2.0
-1.5
-1.0
-0.5
0.0
0.00028 0.00033 0.00038
ln (
µ/ P
a.s
)
(1/RT) / J.mol-1

65
Table 4.5. Arrhenius data for Eq. (4.3)
A / Pa.s Ea / J.mol-1
CSO 8.0E-06 -9402.9
ECSO 3.23E-04 -15979
CCSO 1.90E-05 -27129
SBO 2.96E-03 -8688.7
ESBO 5.20E-07 -21482
CSBO 1.70E-05 -28247
LSO 5.34E-03 -6617.7
ELSO 1.00E-04 -21986
CLSO 1.80E-05 -30371
Compared to the literature, the measured viscosities of the fresh vegetable oils are slightly
higher. For example, the viscosity of SBO at 333.15 K was found to be 0.02 Pa.s by Campanella
et al. (Campanella et al., 2010), Esteban et al. (Esteban et al., 2012), and Fasina et al. (Fasina
et al., 2006), whereas we found 0.07 Pa.s.
Based on our experimental data and Eq. (4.3), the viscosity of ELSO was found to be similar to
the one measured at 298.15 K by Ishimura et al. for the ESBO (Ishimura and Yoshida, 2015),
the viscosity was found to be 0.2 Pa.s in this work which is the same with the one measured
by Campanella et al. (Campanella et al., 2010) but higher than the one measured by Poussard
et al. (Poussard et al., 2016), i.e., 0.036 Pa.s. The study made by Zhang et al. (Zhang et al., 2014)
shows similar viscosity values for the ECSO compared to our work.
The viscosity data for carbonated vegetable oils in the literature varies. One can cite the
following values: CSBO was found to be 2.5 Pa.s at 323.15 K (Bähr and Mülhaupt, 2012), 24.4
Pa.s at 313.15 K (Poussard et al., 2016), and 30.2 Pa.s at 293.15 K (Parzuchowski et al., 2006).
Compared to these values, our data are lower. Nevertheless, for the CCSO we have found
similar values to the ones measured by Zhang et al (Zhang et al., 2014).
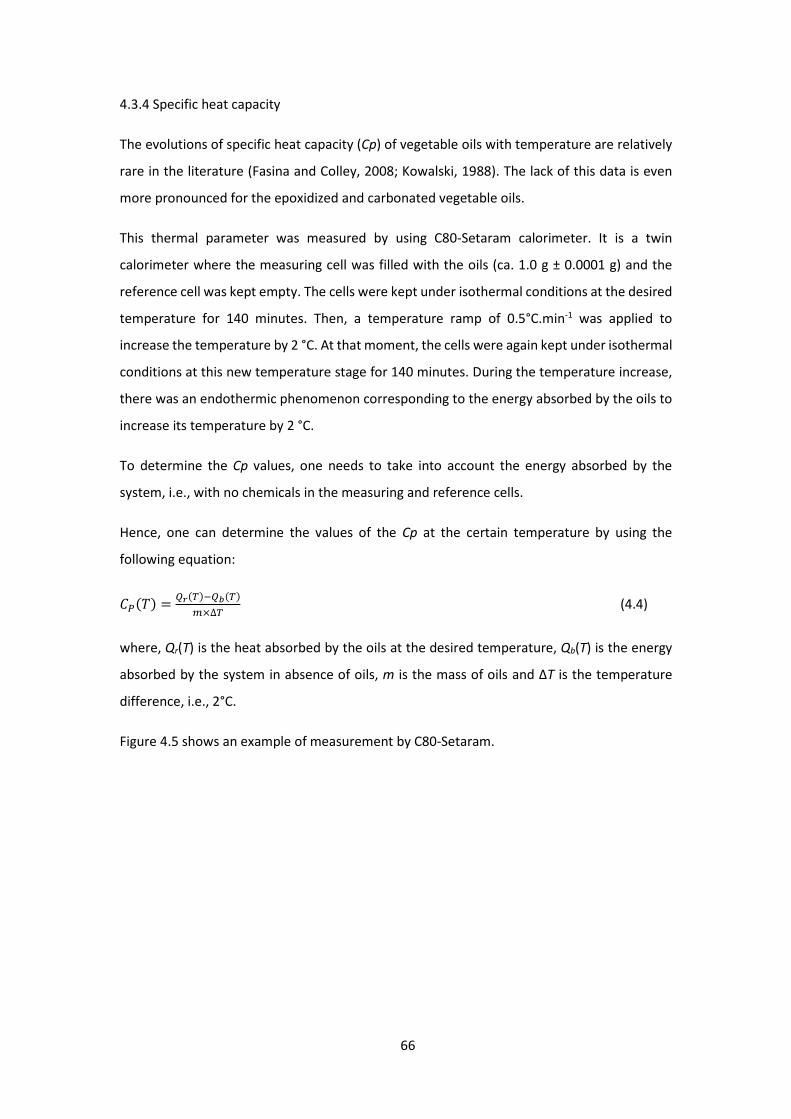
66
4.3.4 Specific heat capacity
The evolutions of specific heat capacity (Cp) of vegetable oils with temperature are relatively
rare in the literature (Fasina and Colley, 2008; Kowalski, 1988). The lack of this data is even
more pronounced for the epoxidized and carbonated vegetable oils.
This thermal parameter was measured by using C80-Setaram calorimeter. It is a twin
calorimeter where the measuring cell was filled with the oils (ca. 1.0 g ± 0.0001 g) and the
reference cell was kept empty. The cells were kept under isothermal conditions at the desired
temperature for 140 minutes. Then, a temperature ramp of 0.5°C.min-1 was applied to
increase the temperature by 2 °C. At that moment, the cells were again kept under isothermal
conditions at this new temperature stage for 140 minutes. During the temperature increase,
there was an endothermic phenomenon corresponding to the energy absorbed by the oils to
increase its temperature by 2 °C.
To determine the Cp values, one needs to take into account the energy absorbed by the
system, i.e., with no chemicals in the measuring and reference cells.
Hence, one can determine the values of the Cp at the certain temperature by using the
following equation:
hÂMfO = ÃbM`O@ÃÄM`OÅ×∆` (4.4)
where, Qr(T) is the heat absorbed by the oils at the desired temperature, Qb(T) is the energy
absorbed by the system in absence of oils, m is the mass of oils and ΔT is the temperature
difference, i.e., 2°C.
Figure 4.5 shows an example of measurement by C80-Setaram.
67
Figure 4.5. Illustration of Cp measurement with C80 for SBO
●, Temperature_SBO; ▲, Temperature_Blank; ○, Heat_flow_SBO; △, Heat_flow_Blank.
The standard deviation of the mean (SVmean%) for the measurement of Cp was 1.06%.
Figure 4.6 shows the evolutions of Cp for LSO, ELSO and CLSO with temperature. One can
notice that the values of this parameter are similar for these three compounds within the
temperature range (313.15 to 383.15) K. We have also observed this tendency for the
other two vegetable oils (Appendix I).
-3.5
-3
-2.5
-2
-1.5
-1
-0.5
0
322.0
322.5
323.0
323.5
324.0
324.5
325.0
0 2000 4000 6000 8000 10000
Heat_
flo
w / m
W
T/ K
t / s
∆T
Qb
Qr
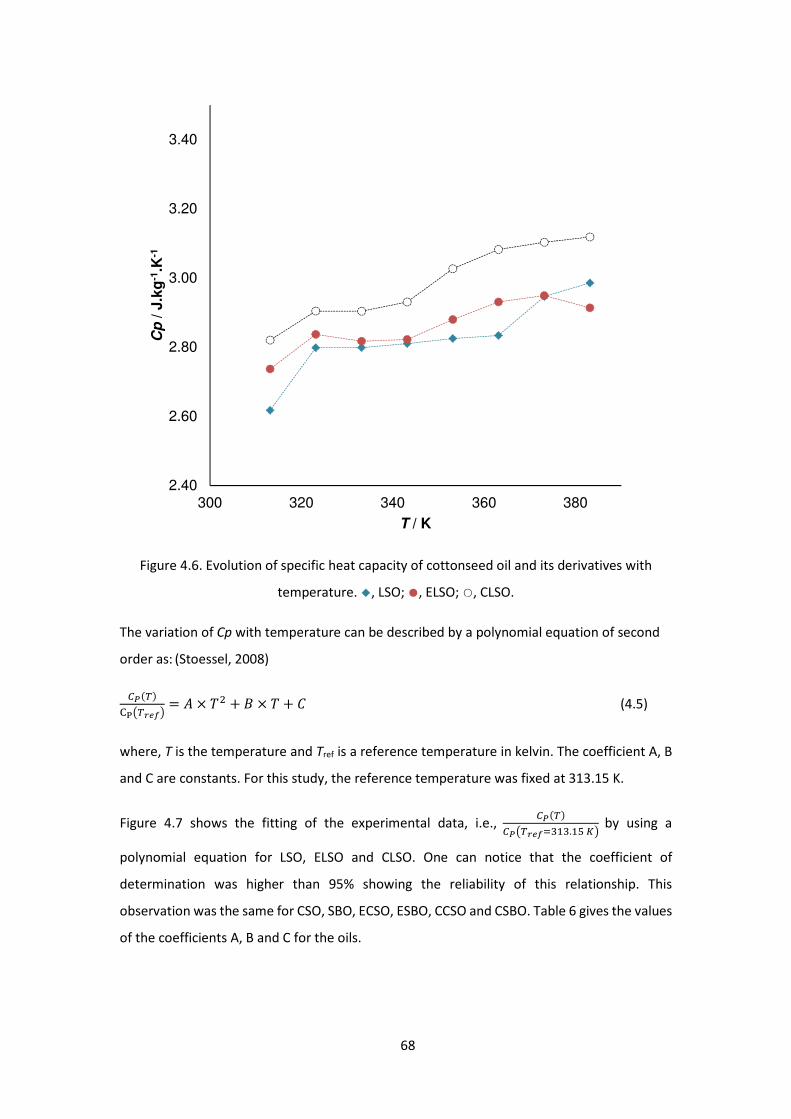
68
Figure 4.6. Evolution of specific heat capacity of cottonseed oil and its derivatives with
temperature. ◆, LSO; ●, ELSO; ○, CLSO.
The variation of Cp with temperature can be described by a polynomial equation of second
order as: (Stoessel, 2008)
=_M`Oa%P`bcdS = e × f +g × f + h (4.5)
where, T is the temperature and Tref is a reference temperature in kelvin. The coefficient A, B
and C are constants. For this study, the reference temperature was fixed at 313.15 K.
Figure 4.7 shows the fitting of the experimental data, i.e., =_M`O=_P`bcdÇ(4(.4u1S by using a
polynomial equation for LSO, ELSO and CLSO. One can notice that the coefficient of
determination was higher than 95% showing the reliability of this relationship. This
observation was the same for CSO, SBO, ECSO, ESBO, CCSO and CSBO. Table 6 gives the values
of the coefficients A, B and C for the oils.
2.40
2.60
2.80
3.00
3.20
3.40
300 320 340 360 380
Cp
/ J.k
g-1
.K-1
T / K
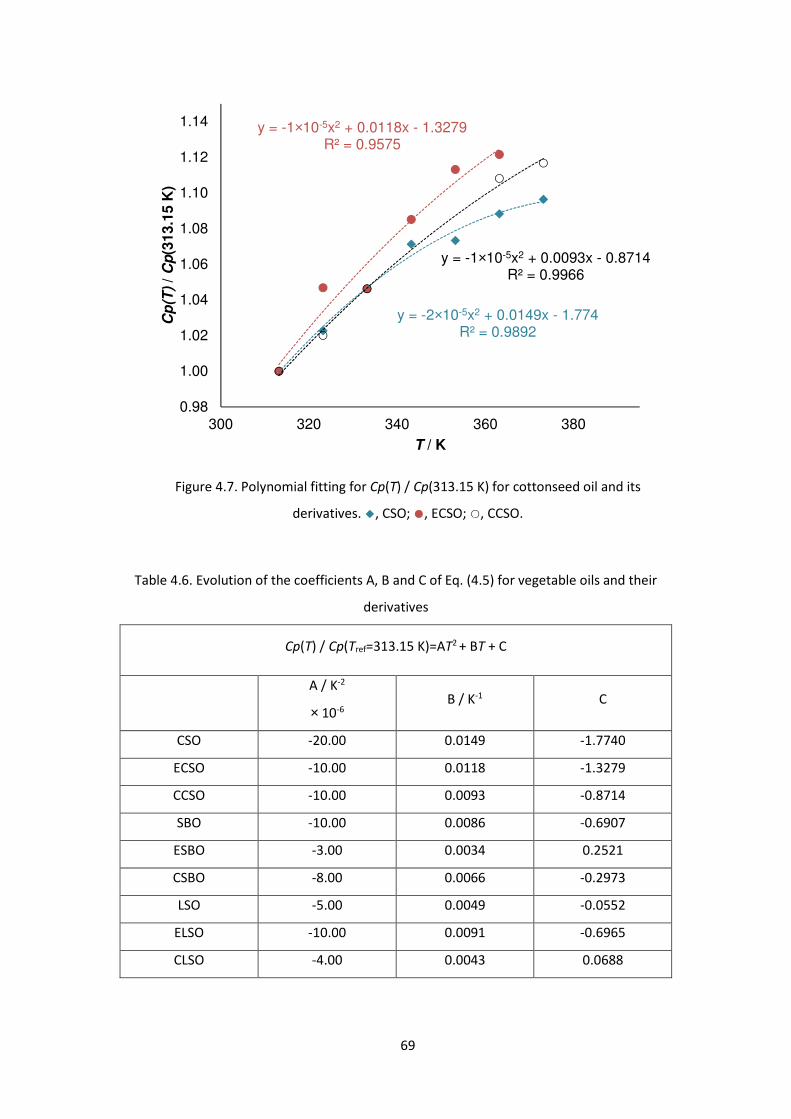
69
Figure 4.7. Polynomial fitting for Cp(T) / Cp(313.15 K) for cottonseed oil and its
derivatives. ◆, CSO; ●, ECSO; ○, CCSO.
Table 4.6. Evolution of the coefficients A, B and C of Eq. (4.5) for vegetable oils and their
derivatives
Cp(T) / Cp(Tref=313.15 K)=AT2 + BT + C
A / K-2
× 10-6 B / K-1 C
CSO -20.00 0.0149 -1.7740
ECSO -10.00 0.0118 -1.3279
CCSO -10.00 0.0093 -0.8714
SBO -10.00 0.0086 -0.6907
ESBO -3.00 0.0034 0.2521
CSBO -8.00 0.0066 -0.2973
LSO -5.00 0.0049 -0.0552
ELSO -10.00 0.0091 -0.6965
CLSO -4.00 0.0043 0.0688
y = -2×10-5x2 + 0.0149x - 1.774R² = 0.9892
y = -1×10-5x2 + 0.0118x - 1.3279R² = 0.9575
y = -1×10-5x2 + 0.0093x - 0.8714R² = 0.9966
0.98
1.00
1.02
1.04
1.06
1.08
1.10
1.12
1.14
300 320 340 360 380
Cp
(T)
/ C
p(3
13.1
5 K
)
T / K
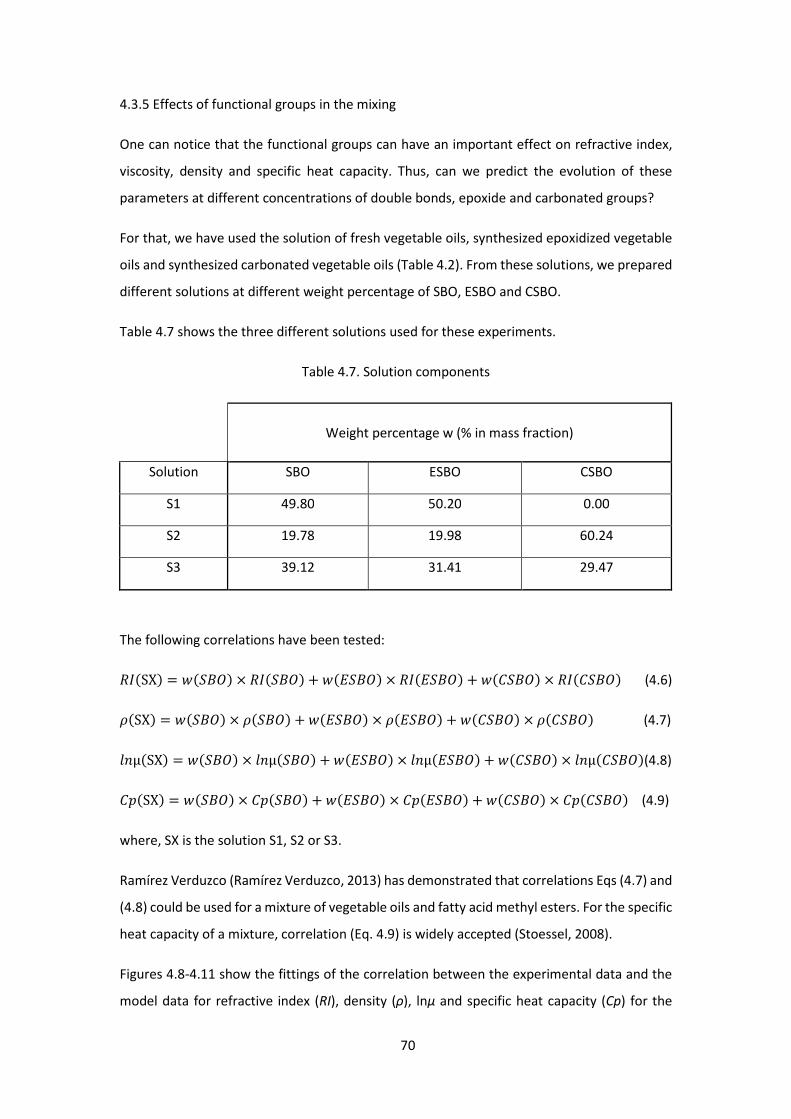
70
4.3.5 Effects of functional groups in the mixing
One can notice that the functional groups can have an important effect on refractive index,
viscosity, density and specific heat capacity. Thus, can we predict the evolution of these
parameters at different concentrations of double bonds, epoxide and carbonated groups?
For that, we have used the solution of fresh vegetable oils, synthesized epoxidized vegetable
oils and synthesized carbonated vegetable oils (Table 4.2). From these solutions, we prepared
different solutions at different weight percentage of SBO, ESBO and CSBO.
Table 4.7 shows the three different solutions used for these experiments.
Table 4.7. Solution components
Weight percentage w (% in mass fraction)
Solution SBO ESBO CSBO
S1 49.80 50.20 0.00
S2 19.78 19.98 60.24
S3 39.12 31.41 29.47
The following correlations have been tested:
�iMSXO = kMlgmO × �iMlgmO + kMnlgmO × �iMnlgmO + kMhlgmO × �iMhlgmO (4.6)
oMSXO = kMlgmO × oMlgmO + kMnlgmO × oMnlgmO + kMhlgmO × oMhlgmO (4.7)
pqμMSXO = kMlgmO × pqμMlgmO + kMnlgmO × pqμMnlgmO + kMhlgmO × pqμMhlgmO(4.8)
hsMSXO = kMlgmO × hsMlgmO + kMnlgmO × hsMnlgmO + kMhlgmO × hsMhlgmO (4.9)
where, SX is the solution S1, S2 or S3.
Ramírez Verduzco (Ramírez Verduzco, 2013) has demonstrated that correlations Eqs (4.7) and
(4.8) could be used for a mixture of vegetable oils and fatty acid methyl esters. For the specific
heat capacity of a mixture, correlation (Eq. 4.9) is widely accepted (Stoessel, 2008).
Figures 4.8-4.11 show the fittings of the correlation between the experimental data and the
model data for refractive index (RI), density (ρ), lnµ and specific heat capacity (Cp) for the
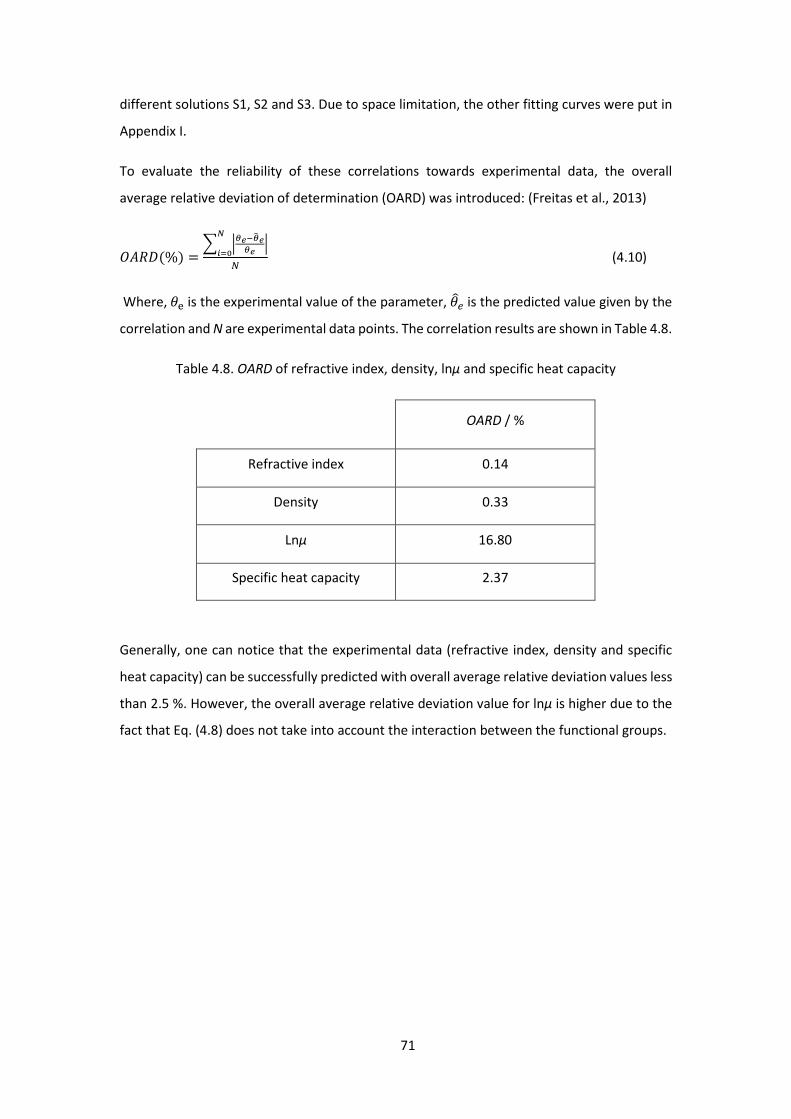
71
different solutions S1, S2 and S3. Due to space limitation, the other fitting curves were put in
Appendix I.
To evaluate the reliability of these correlations towards experimental data, the overall
average relative deviation of determination (OARD) was introduced: (Freitas et al., 2013)
me�ÈM%O =Ê ËÌc0ÌÍcÌc ËκÏ�Ð (4.10)
Where, ÑK is the experimental value of the parameter, ÑÒÓ is the predicted value given by the
correlation and N are experimental data points. The correlation results are shown in Table 4.8.
Table 4.8. OARD of refractive index, density, lnµ and specific heat capacity
OARD / %
Refractive index 0.14
Density 0.33
Lnµ 16.80
Specific heat capacity 2.37
Generally, one can notice that the experimental data (refractive index, density and specific
heat capacity) can be successfully predicted with overall average relative deviation values less
than 2.5 %. However, the overall average relative deviation value for lnµ is higher due to the
fact that Eq. (4.8) does not take into account the interaction between the functional groups.
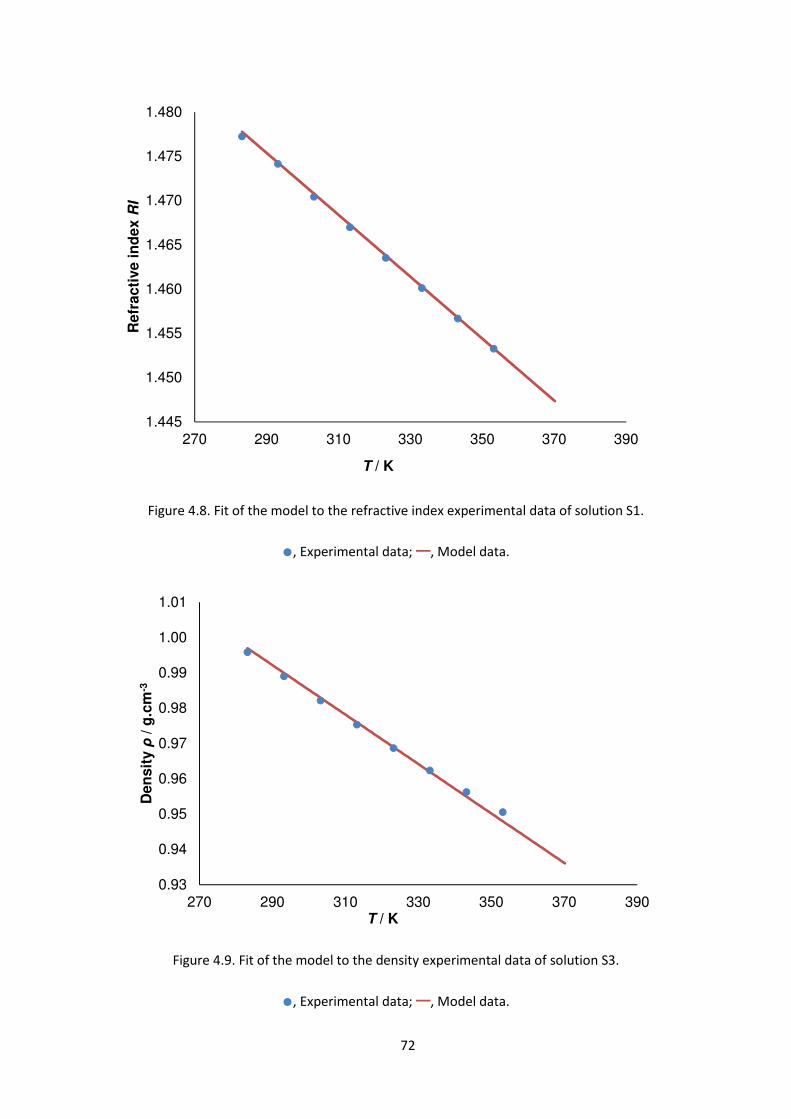
72
Figure 4.8. Fit of the model to the refractive index experimental data of solution S1.
●, Experimental data; ━, Model data.
Figure 4.9. Fit of the model to the density experimental data of solution S3.
●, Experimental data; ━, Model data.
1.445
1.450
1.455
1.460
1.465
1.470
1.475
1.480
270 290 310 330 350 370 390
Refr
acti
ve in
dex R
I
T / K
0.93
0.94
0.95
0.96
0.97
0.98
0.99
1.00
1.01
270 290 310 330 350 370 390
Den
sit
y ρ
/ g
.cm
-3
T / K
S3 40%SBO+30%ESBO+30%CSBO
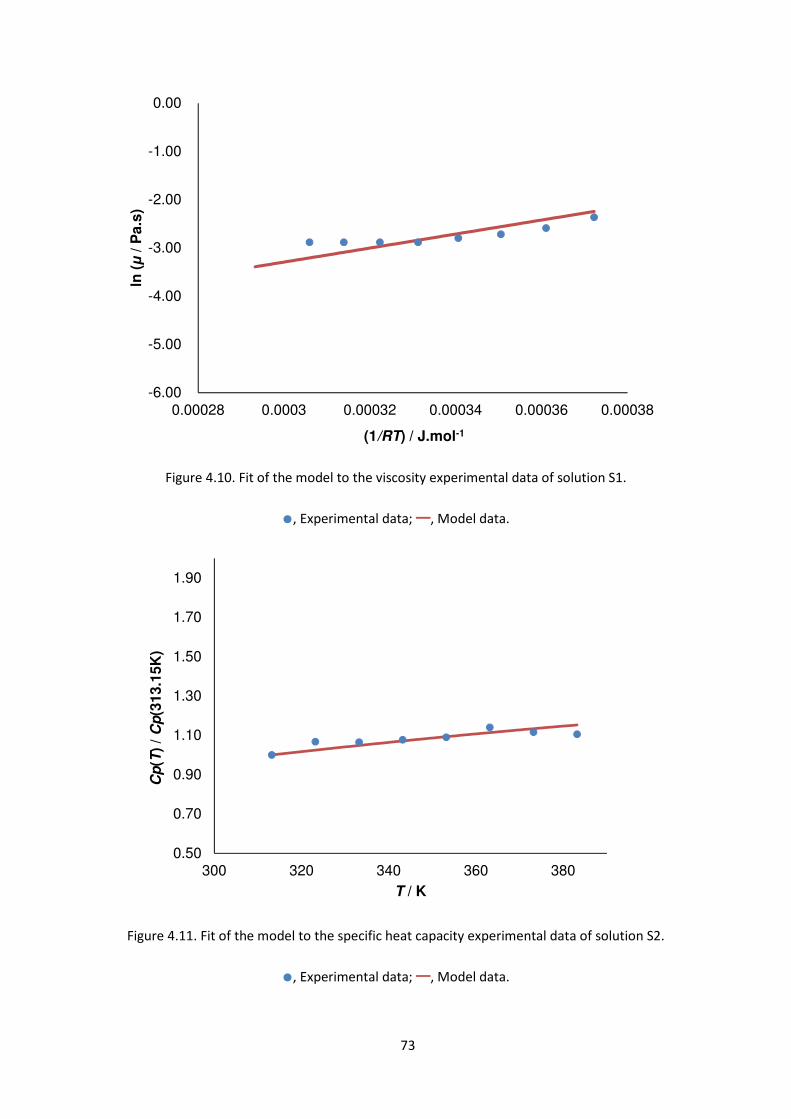
73
Figure 4.10. Fit of the model to the viscosity experimental data of solution S1.
●, Experimental data; ━, Model data.
Figure 4.11. Fit of the model to the specific heat capacity experimental data of solution S2.
●, Experimental data; ━, Model data.
-6.00
-5.00
-4.00
-3.00
-2.00
-1.00
0.00
0.00028 0.0003 0.00032 0.00034 0.00036 0.00038
ln (µ
/ P
a.s
)
(1/RT) / J.mol-1
0.50
0.70
0.90
1.10
1.30
1.50
1.70
1.90
300 320 340 360 380
Cp
(T)
/ C
p(3
13.1
5K
)
T / K
74
4.4. Conclusion
This study proposed to investigate the influence of temperature on density, refractive index,
viscosity and specific heat capacity for vegetable oils and their epoxidized and carbonated
derivatives. Indeed, these data are missing in the literature.
It was demonstrated that refractive index value decreases linearly as the temperature
increases. This parameter could be used as an analytical method to segregate vegetable oils
and their derivatives. Density of these oils decreases linearly as temperature increases. It was
found that the viscosity of vegetable oils is exponentially proportional to the temperature.
The values for the specific heat capacity were found to be relatively constant with
temperature and did not change significantly between fresh vegetable oils and their
derivatives. Nevertheless, the ratio =_M`O=_P`bcdS follows a polynomial of second order with
temperature allowing predicting the values of Cp for each oil. Hence, the functional groups
have an effect on these parameters. The last part of this study demonstrated that it is possible
to predict the values of these physicochemical parameters in case of mixture by knowing the
evolutions of the pure compounds.
75
Chapter V Carbonation of epoxidized vegetable oils
Part of this chapter is adapted from the post print of the following article:
X. Cai, J.L. Zheng, J. Wärnå, T. Salmi, B. Taouk, S. Leveneur. Influence of gas-liquid mass transfer
on kinetic modeling: Carbonation of epoxidized vegetable oils. Chemical Engineering Journal,
313(2017) 1168-1183.
Link: https://doi.org/10.1016/j.cej.2016.11.012
Further permissions related to the material excerpted should be directed to the ScienceDirect.
Copyright © 2019 Elsevier B.V. or its licensors or contributors. ScienceDirect® is a registered
trademark of Elsevier B.V.
5.1 Introduction
In this chapter, a kinetic model for the carbonation of epoxidized cottonseed oil catalyzed by
TBABr was proposed. For gas-liquid reaction system, one should take into account the kinetics
of mass transfer.
In the first stage, a mass transfer model was built to predict the evolution of the volumetric
mass transfer coefficients and Henry’s constants with reaction advancement and temperature.
Then, a kinetic model was built at different reaction temperature, catalyst and epoxide
concentrations and CO2 pressure.
Section 5.2 gives the information about the experimental procedure. Section 5.3 shows the
experiment results and the discussion.
5.2 Experimental section
5.2.1 Preparation of the epoxidized compound
Epoxidized cottonseed oil (ECSO) was prepared as described in the Section 2.4.1 and Appendix
II.
5.2.2 Kinetic study of carbonation reaction
Carbonation of epoxidized cottonseed (CCSO) oil was carried out by using the same protocol
as described in the Section 2.5 according to the article of our group (Ait Aissa et al., 2016).
Table 5.1 shows the experimental matrix for the different carbonation conditions.
The conversion rate (%) of epoxide was selected as a response value for the carbonation
evaluation. It was calculated as Eq. (5.1).
ConversionrateM%O = F1 − �²E�*EKDKRÙ²DKÚÛEKÛEÜÛ²E²*ÝKRÙ²DKÚÛEKÛE I × 100 (5.1)
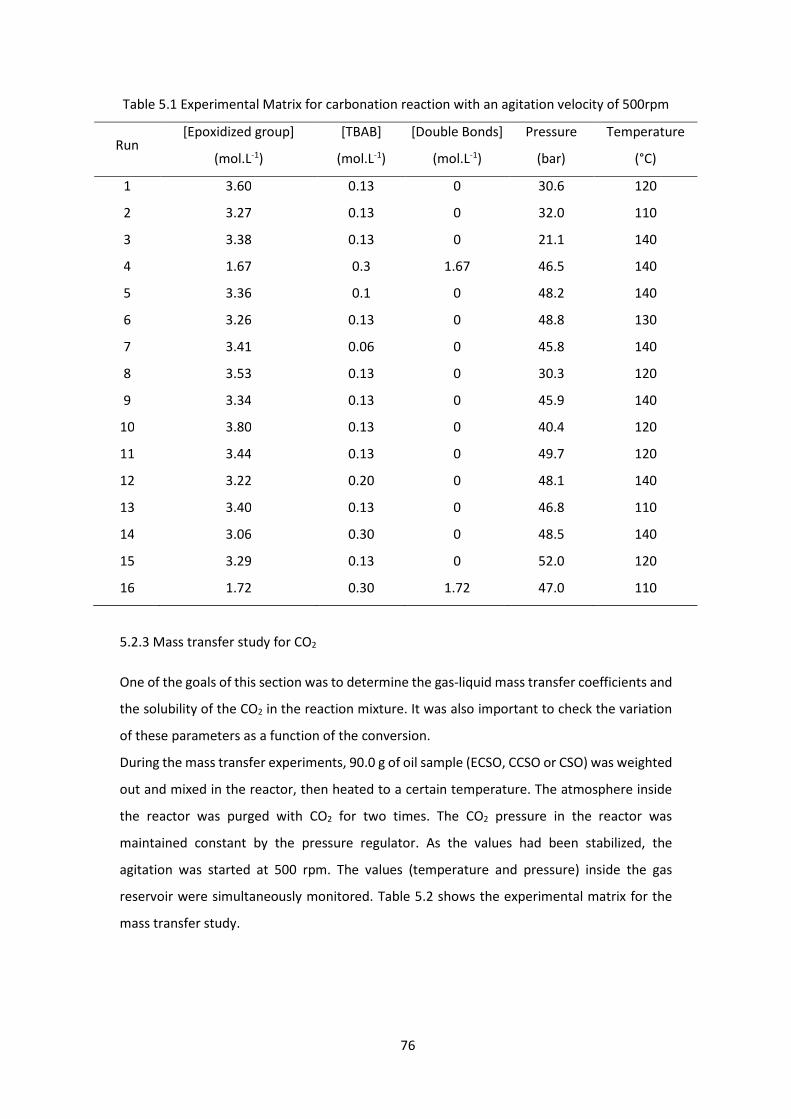
76
Table 5.1 Experimental Matrix for carbonation reaction with an agitation velocity of 500rpm
Run [Epoxidized group]
(mol.L-1)
[TBAB]
(mol.L-1)
[Double Bonds]
(mol.L-1)
Pressure
(bar)
Temperature
(°C)
1 3.60 0.13 0 30.6 120
2 3.27 0.13 0 32.0 110
3 3.38 0.13 0 21.1 140
4 1.67 0.3 1.67 46.5 140
5 3.36 0.1 0 48.2 140
6 3.26 0.13 0 48.8 130
7 3.41 0.06 0 45.8 140
8 3.53 0.13 0 30.3 120
9 3.34 0.13 0 45.9 140
10 3.80 0.13 0 40.4 120
11 3.44 0.13 0 49.7 120
12 3.22 0.20 0 48.1 140
13 3.40 0.13 0 46.8 110
14 3.06 0.30 0 48.5 140
15 3.29 0.13 0 52.0 120
16 1.72 0.30 1.72 47.0 110
5.2.3 Mass transfer study for CO2
One of the goals of this section was to determine the gas-liquid mass transfer coefficients and
the solubility of the CO2 in the reaction mixture. It was also important to check the variation
of these parameters as a function of the conversion.
During the mass transfer experiments, 90.0 g of oil sample (ECSO, CCSO or CSO) was weighted
out and mixed in the reactor, then heated to a certain temperature. The atmosphere inside
the reactor was purged with CO2 for two times. The CO2 pressure in the reactor was
maintained constant by the pressure regulator. As the values had been stabilized, the
agitation was started at 500 rpm. The values (temperature and pressure) inside the gas
reservoir were simultaneously monitored. Table 5.2 shows the experimental matrix for the
mass transfer study.
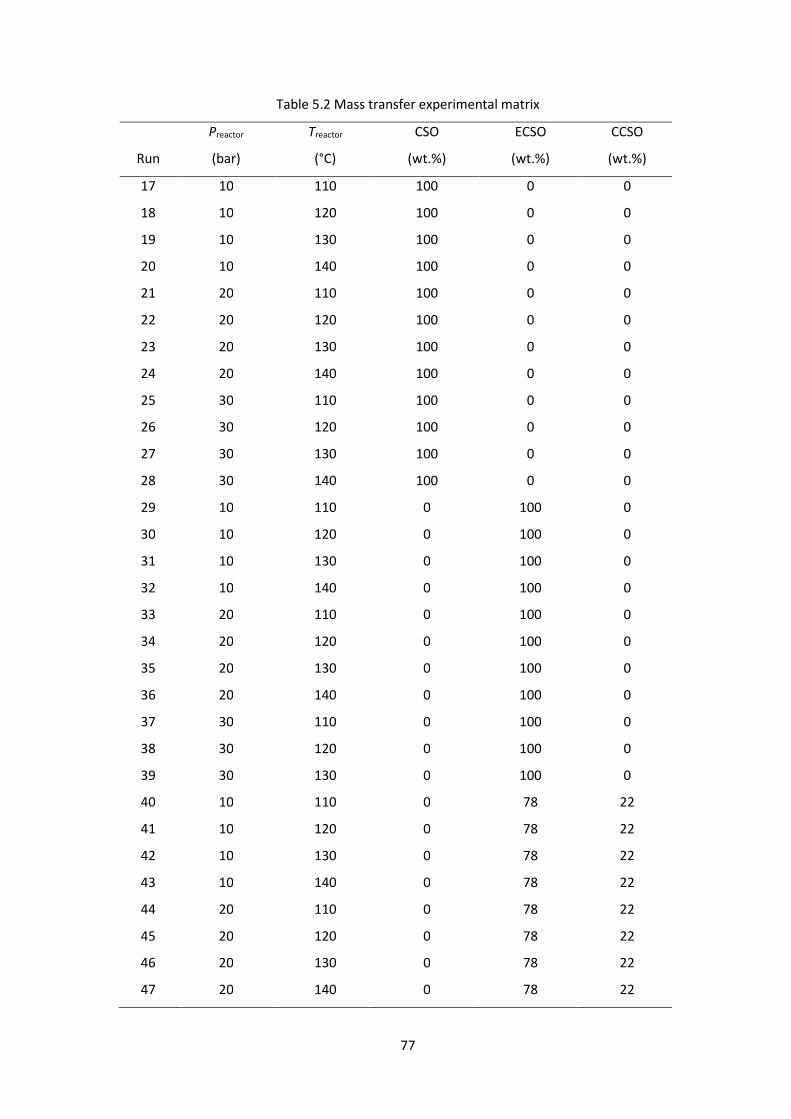
77
Table 5.2 Mass transfer experimental matrix
Run
Preactor
(bar)
Treactor
(°C)
CSO
(wt.%)
ECSO
(wt.%)
CCSO
(wt.%)
17 10 110 100 0 0
18 10 120 100 0 0
19 10 130 100 0 0
20 10 140 100 0 0
21 20 110 100 0 0
22 20 120 100 0 0
23 20 130 100 0 0
24 20 140 100 0 0
25 30 110 100 0 0
26 30 120 100 0 0
27 30 130 100 0 0
28 30 140 100 0 0
29 10 110 0 100 0
30 10 120 0 100 0
31 10 130 0 100 0
32 10 140 0 100 0
33 20 110 0 100 0
34 20 120 0 100 0
35 20 130 0 100 0
36 20 140 0 100 0
37 30 110 0 100 0
38 30 120 0 100 0
39 30 130 0 100 0
40 10 110 0 78 22
41 10 120 0 78 22
42 10 130 0 78 22
43 10 140 0 78 22
44 20 110 0 78 22
45 20 120 0 78 22
46 20 130 0 78 22
47 20 140 0 78 22
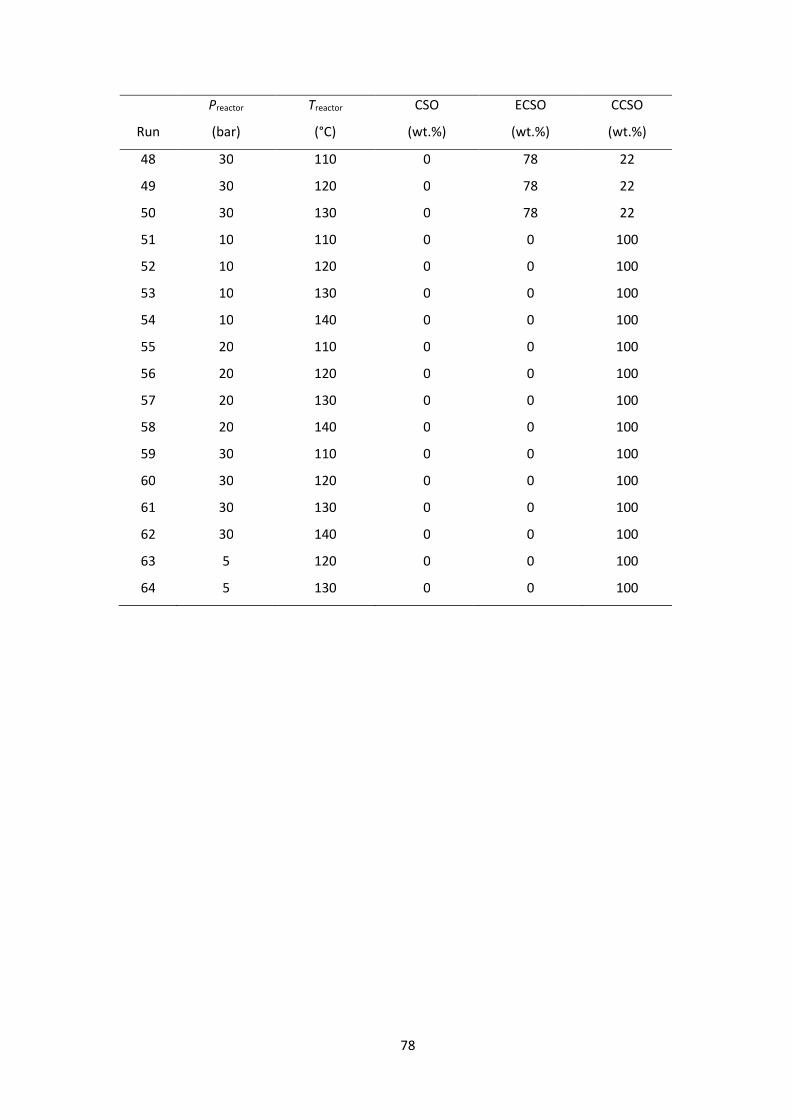
78
Run
Preactor
(bar)
Treactor
(°C)
CSO
(wt.%)
ECSO
(wt.%)
CCSO
(wt.%)
48 30 110 0 78 22
49 30 120 0 78 22
50 30 130 0 78 22
51 10 110 0 0 100
52 10 120 0 0 100
53 10 130 0 0 100
54 10 140 0 0 100
55 20 110 0 0 100
56 20 120 0 0 100
57 20 130 0 0 100
58 20 140 0 0 100
59 30 110 0 0 100
60 30 120 0 0 100
61 30 130 0 0 100
62 30 140 0 0 100
63 5 120 0 0 100
64 5 130 0 0 100
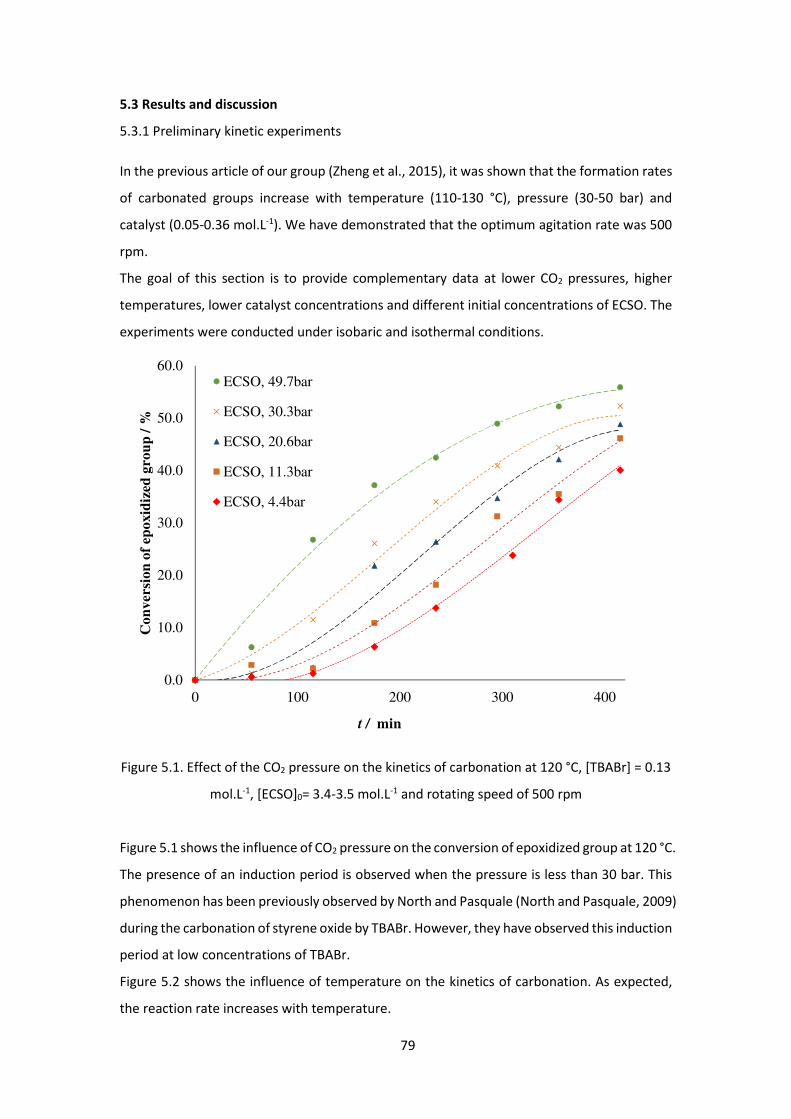
79
5.3 Results and discussion
5.3.1 Preliminary kinetic experiments
In the previous article of our group (Zheng et al., 2015), it was shown that the formation rates
of carbonated groups increase with temperature (110-130 °C), pressure (30-50 bar) and
catalyst (0.05-0.36 mol.L-1). We have demonstrated that the optimum agitation rate was 500
rpm.
The goal of this section is to provide complementary data at lower CO2 pressures, higher
temperatures, lower catalyst concentrations and different initial concentrations of ECSO. The
experiments were conducted under isobaric and isothermal conditions.
Figure 5.1. Effect of the CO2 pressure on the kinetics of carbonation at 120 °C, [TBABr] = 0.13
mol.L-1, [ECSO]0= 3.4-3.5 mol.L-1 and rotating speed of 500 rpm
Figure 5.1 shows the influence of CO2 pressure on the conversion of epoxidized group at 120 °C.
The presence of an induction period is observed when the pressure is less than 30 bar. This
phenomenon has been previously observed by North and Pasquale (North and Pasquale, 2009)
during the carbonation of styrene oxide by TBABr. However, they have observed this induction
period at low concentrations of TBABr.
Figure 5.2 shows the influence of temperature on the kinetics of carbonation. As expected,
the reaction rate increases with temperature.
0.0
10.0
20.0
30.0
40.0
50.0
60.0
0 100 200 300 400
Con
ver
sion
of
epoxid
ized
gro
up
/ %
t / min
ECSO, 49.7bar
ECSO, 30.3bar
ECSO, 20.6bar
ECSO, 11.3bar
ECSO, 4.4bar
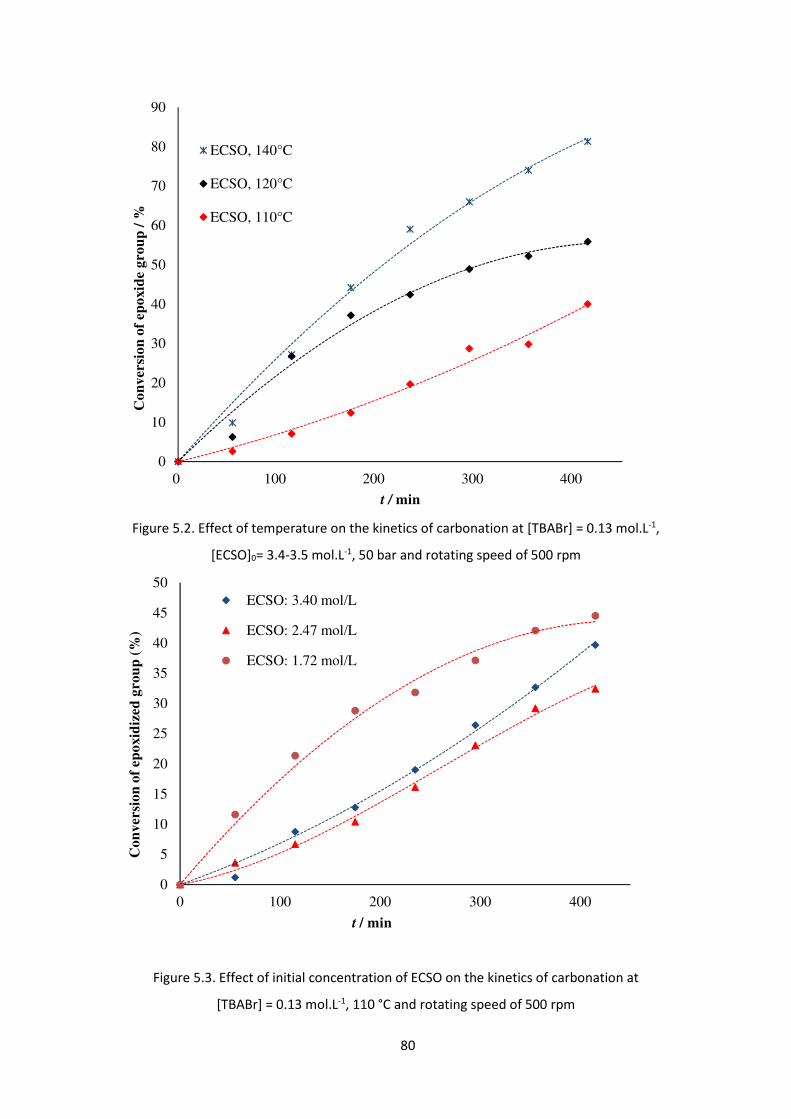
80
Figure 5.2. Effect of temperature on the kinetics of carbonation at [TBABr] = 0.13 mol.L-1,
[ECSO]0= 3.4-3.5 mol.L-1, 50 bar and rotating speed of 500 rpm
Figure 5.3. Effect of initial concentration of ECSO on the kinetics of carbonation at
[TBABr] = 0.13 mol.L-1, 110 °C and rotating speed of 500 rpm
0
10
20
30
40
50
60
70
80
90
0 100 200 300 400
Co
nv
ersi
on
of
epo
xid
e g
rou
p /
%
t / min
ECSO, 140°C
ECSO, 120°C
ECSO, 110°C
0
5
10
15
20
25
30
35
40
45
50
0 100 200 300 400
Co
nv
ersi
on
of
epoxid
ized
gro
up
(%
)
t / min
ECSO: 3.40 mol/L
ECSO: 2.47 mol/L
ECSO: 1.72 mol/L
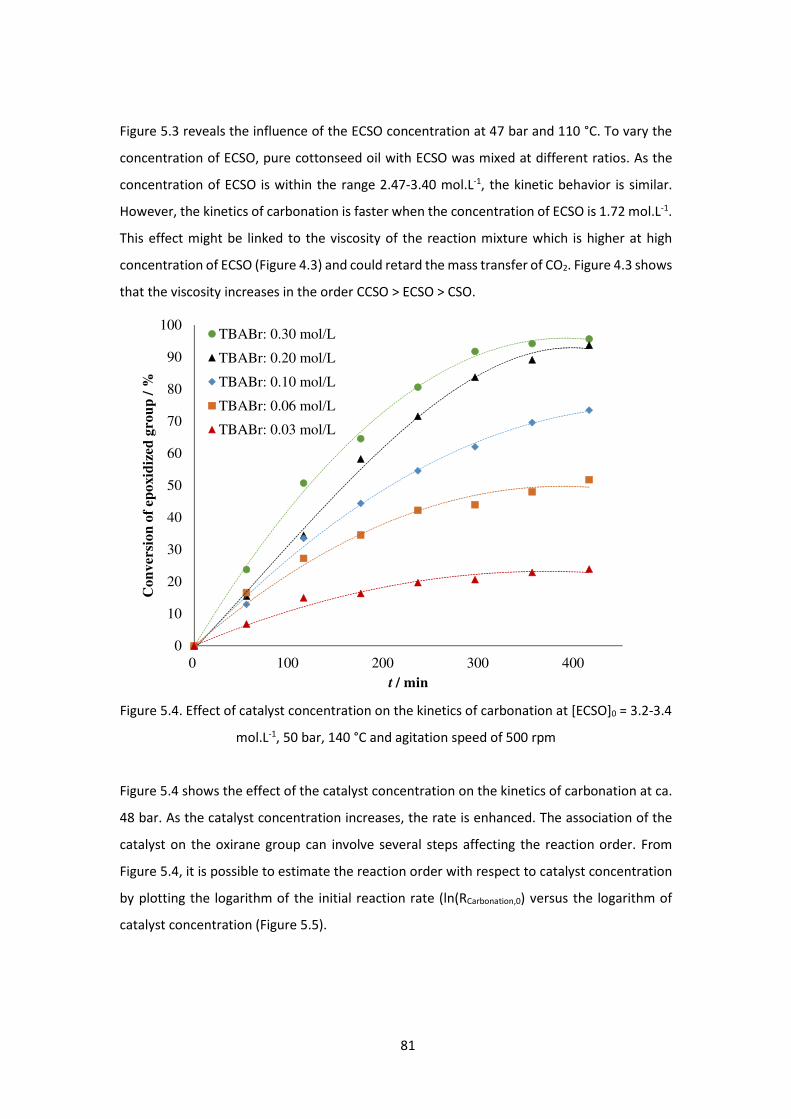
81
Figure 5.3 reveals the influence of the ECSO concentration at 47 bar and 110 °C. To vary the
concentration of ECSO, pure cottonseed oil with ECSO was mixed at different ratios. As the
concentration of ECSO is within the range 2.47-3.40 mol.L-1, the kinetic behavior is similar.
However, the kinetics of carbonation is faster when the concentration of ECSO is 1.72 mol.L-1.
This effect might be linked to the viscosity of the reaction mixture which is higher at high
concentration of ECSO (Figure 4.3) and could retard the mass transfer of CO2. Figure 4.3 shows
that the viscosity increases in the order CCSO > ECSO > CSO.
Figure 5.4. Effect of catalyst concentration on the kinetics of carbonation at [ECSO]0 = 3.2-3.4
mol.L-1, 50 bar, 140 °C and agitation speed of 500 rpm
Figure 5.4 shows the effect of the catalyst concentration on the kinetics of carbonation at ca.
48 bar. As the catalyst concentration increases, the rate is enhanced. The association of the
catalyst on the oxirane group can involve several steps affecting the reaction order. From
Figure 5.4, it is possible to estimate the reaction order with respect to catalyst concentration
by plotting the logarithm of the initial reaction rate (ln(RCarbonation,0) versus the logarithm of
catalyst concentration (Figure 5.5).
0
10
20
30
40
50
60
70
80
90
100
0 100 200 300 400
Con
ver
sion
of
epoxid
ized
gro
up
/ %
t / min
TBABr: 0.30 mol/L
TBABr: 0.20 mol/L
TBABr: 0.10 mol/L
TBABr: 0.06 mol/L
TBABr: 0.03 mol/L
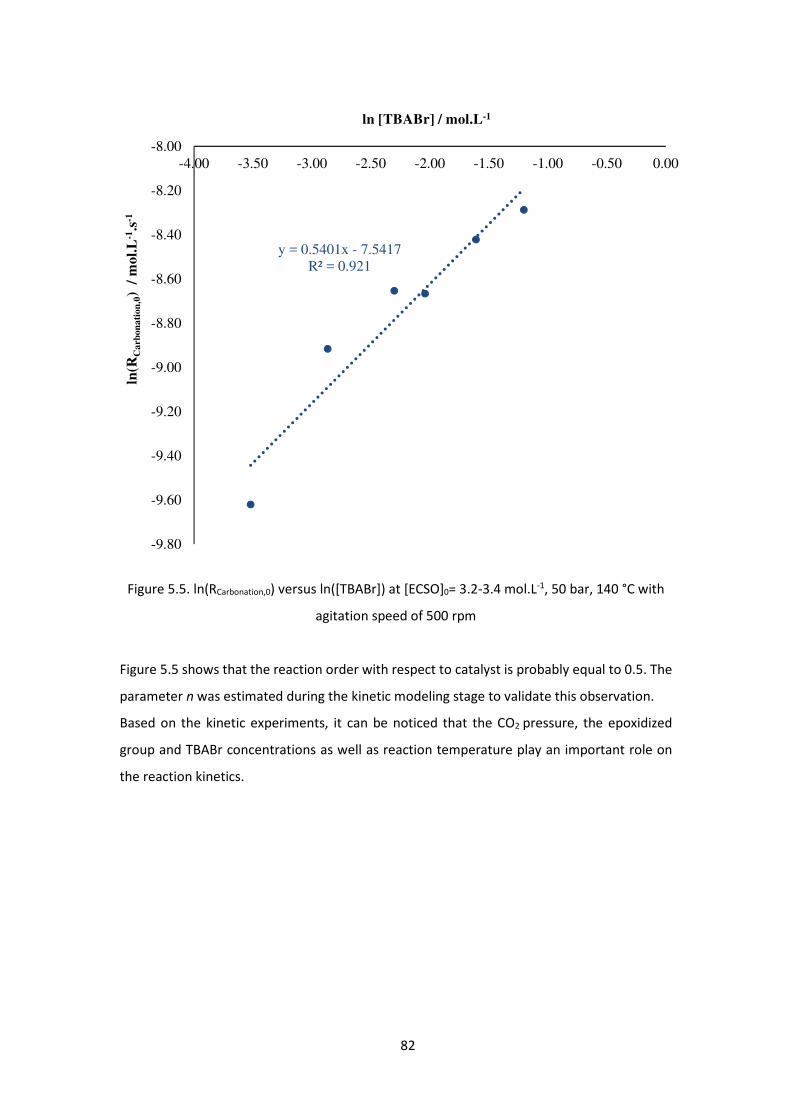
82
Figure 5.5. ln(RCarbonation,0) versus ln([TBABr]) at [ECSO]0= 3.2-3.4 mol.L-1, 50 bar, 140 °C with
agitation speed of 500 rpm
Figure 5.5 shows that the reaction order with respect to catalyst is probably equal to 0.5. The
parameter n was estimated during the kinetic modeling stage to validate this observation.
Based on the kinetic experiments, it can be noticed that the CO2 pressure, the epoxidized
group and TBABr concentrations as well as reaction temperature play an important role on
the reaction kinetics.
y = 0.5401x - 7.5417R² = 0.921
-9.80
-9.60
-9.40
-9.20
-9.00
-8.80
-8.60
-8.40
-8.20
-8.00-4.00 -3.50 -3.00 -2.50 -2.00 -1.50 -1.00 -0.50 0.00
ln(R
Ca
rbon
ati
on
,0)
/ m
ol.
L-1
.s-1
ln [TBABr] / mol.L-1
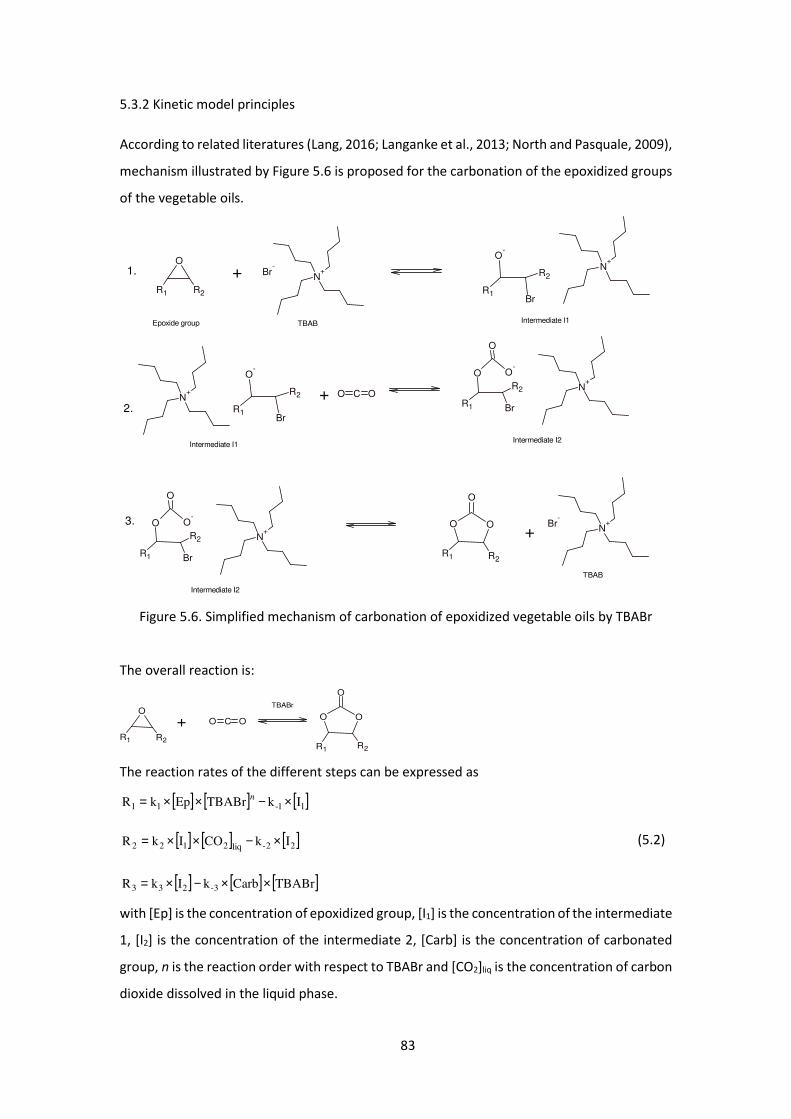
83
5.3.2 Kinetic model principles
According to related literatures (Lang, 2016; Langanke et al., 2013; North and Pasquale, 2009),
mechanism illustrated by Figure 5.6 is proposed for the carbonation of the epoxidized groups
of the vegetable oils.
O
R1 R2
N++ Br
-O
-
R1
R2
Br
N+
Epoxide group TBAB Intermediate I1
O-
R1
R2
Br
N+
Intermediate I1
+ O C O
O
R1
R2
Br
O
O-
N+
Intermediate I2
1.
2.
3. O
R1
R2
Br
O
O-
N+
Intermediate I2
O
R1 R2
O
O + N+Br
-
TBAB
Figure 5.6. Simplified mechanism of carbonation of epoxidized vegetable oils by TBABr
The overall reaction is:
O
R1 R2
+TBABr
O C O O
R1 R2
O
O
The reaction rates of the different steps can be expressed as
[ ] [ ] [ ]
[ ] [ ] [ ]
[ ] [ ] [ ]TBABrCarbkIkR
IkCOIkR
IkTBABrEpkR
3-233
22-liq2122
11-11
××−×=
×−××=
×−××= n
(5.2)
with [Ep] is the concentration of epoxidized group, [I1] is the concentration of the intermediate
1, [I2] is the concentration of the intermediate 2, [Carb] is the concentration of carbonated
group, n is the reaction order with respect to TBABr and [CO2]liq is the concentration of carbon
dioxide dissolved in the liquid phase.
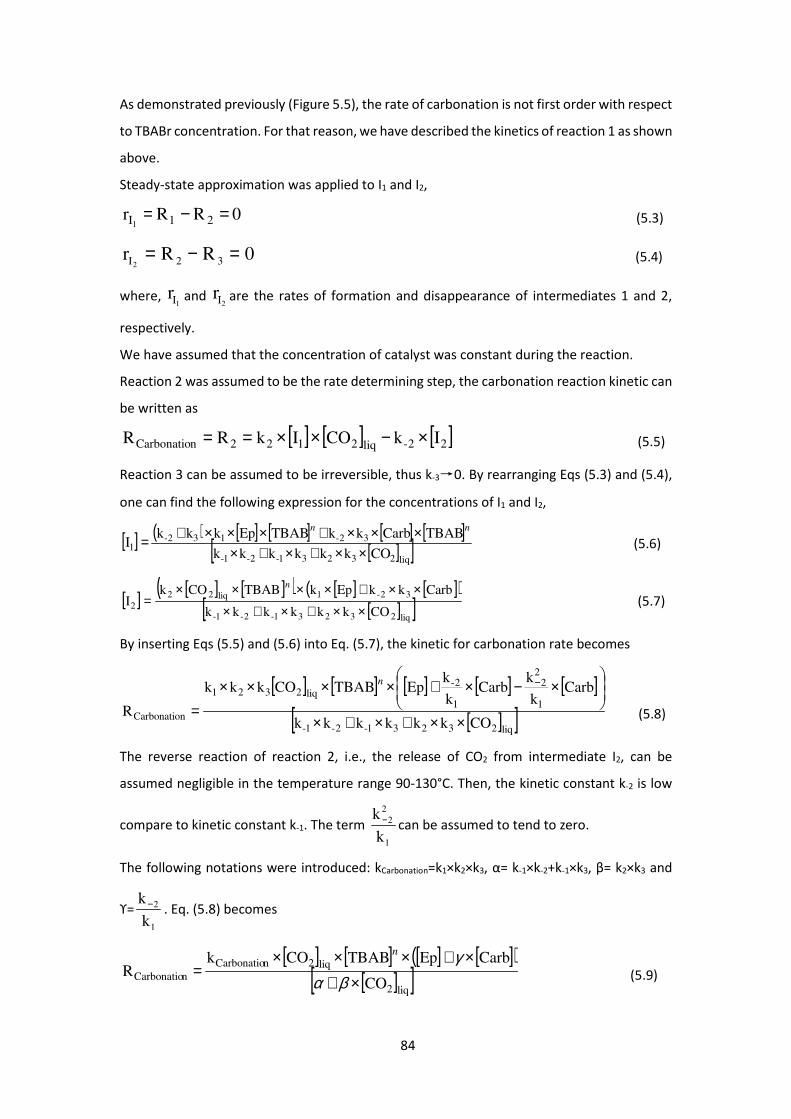
84
As demonstrated previously (Figure 5.5), the rate of carbonation is not first order with respect
to TBABr concentration. For that reason, we have described the kinetics of reaction 1 as shown
above.
Steady-state approximation was applied to I1 and I2,
0RRr 21I1=−= (5.3)
0RRr 32I2=−= (5.4)
where, 1I
r and 2I
r are the rates of formation and disappearance of intermediates 1 and 2,
respectively.
We have assumed that the concentration of catalyst was constant during the reaction.
Reaction 2 was assumed to be the rate determining step, the carbonation reaction kinetic can
be written as
[ ] [ ] [ ]22-liq2122nCarbonatio IkCOIkRR ×−××== (5.5)
Reaction 3 can be assumed to be irreversible, thus k-3→0. By rearranging Eqs (5.3) and (5.4),
one can find the following expression for the concentrations of I1 and I2,
[ ] ( ) [ ] [ ] [ ] [ ][ ][ ]liq23231-2-1-
32-132-1 COkkkkkk
TBABCarbkkTBABEpkkkI
××+×+××××+×××+=
nn
(5.6)
[ ] [ ] [ ]( ) [ ] [ ]( )[ ][ ]liq23231-2-1-
32-1liq222 COkkkkkk
CarbkkEpkTBABCOkI
××+×+×
××+××××=
n
(5.7)
By inserting Eqs (5.5) and (5.6) into Eq. (5.7), the kinetic for carbonation rate becomes
[ ] [ ] [ ] [ ] [ ]
[ ][ ]liq23231-2-1-
1
22
1
2-liq2321
nCarbonatio COkkkkkk
Carbk
kCarb
k
kEpTBABCOkkk
R××+×+×
×−×+××××
=
−n
(5.8)
The reverse reaction of reaction 2, i.e., the release of CO2 from intermediate I2, can be
assumed negligible in the temperature range 90-130°C. Then, the kinetic constant k-2 is low
compare to kinetic constant k-1. The term 1
22
k
k− can be assumed to tend to zero.
The following notations were introduced: kCarbonation=k1×k2×k3, α= k-1×k-2+k-1×k3, β= k2×k3 and
ϒ=1
2
k
k− . Eq. (5.8) becomes
[ ] [ ] [ ] [ ]( )[ ][ ]liq2
liq2nCarbonationCarbonatio CO
CarbEpTBABCOkR
×+
×+×××=
βαγn
(5.9)
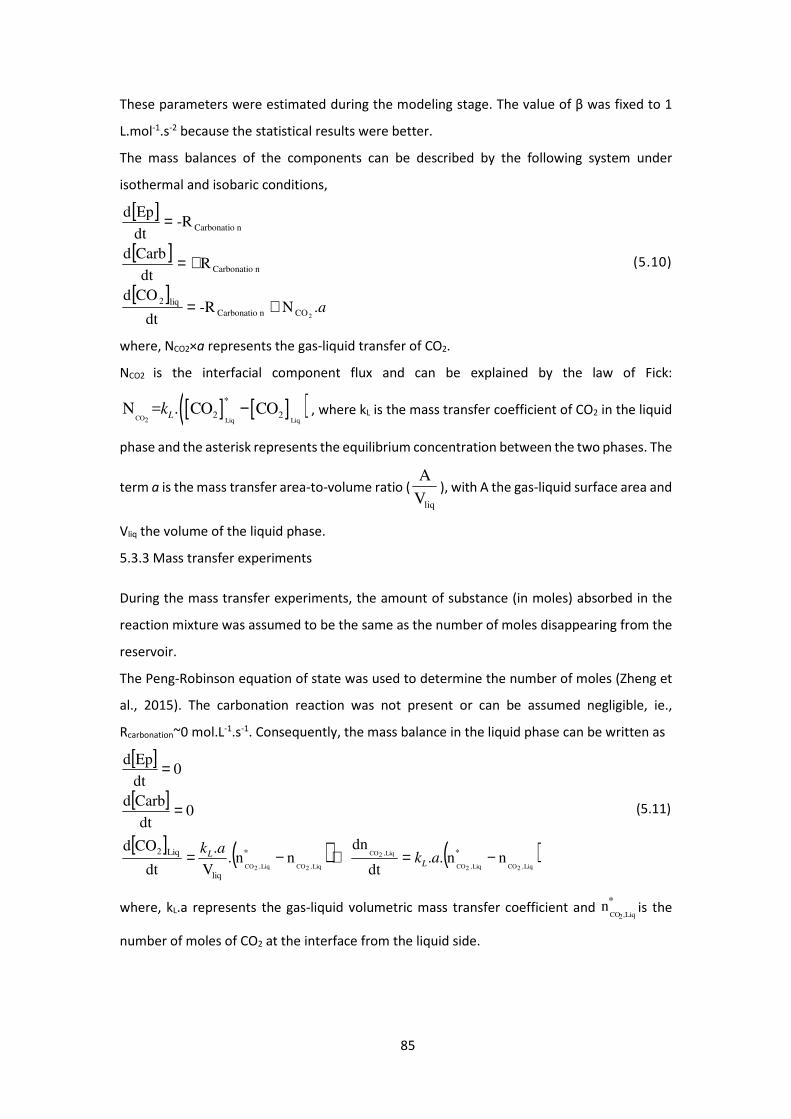
85
These parameters were estimated during the modeling stage. The value of β was fixed to 1
L.mol-1.s-2 because the statistical results were better.
The mass balances of the components can be described by the following system under
isothermal and isobaric conditions,
[ ]
[ ]
[ ]a.N-R
dt
COd
Rdt
Carbd
-Rdt
Epd
2COnCarbonatioliq2
nCarbonatio
nCarbonatio
+=
+=
=
(5.10)
where, NCO2×a represents the gas-liquid transfer of CO2.
NCO2 is the interfacial component flux and can be explained by the law of Fick:
[ ] [ ]( )CO2 Liq Liq
*
2 2N = . CO COLk − , where kL is the mass transfer coefficient of CO2 in the liquid
phase and the asterisk represents the equilibrium concentration between the two phases. The
term a is the mass transfer area-to-volume ratio (liqV
A), with A the gas-liquid surface area and
Vliq the volume of the liquid phase.
5.3.3 Mass transfer experiments
During the mass transfer experiments, the amount of substance (in moles) absorbed in the
reaction mixture was assumed to be the same as the number of moles disappearing from the
reservoir.
The Peng-Robinson equation of state was used to determine the number of moles (Zheng et
al., 2015). The carbonation reaction was not present or can be assumed negligible, ie.,
Rcarbonation~0 mol.L-1.s-1. Consequently, the mass balance in the liquid phase can be written as
[ ]
[ ]
[ ] ( ) ( )Liq,2COLiq,2CO
Liq,2CO
Liq,2COLiq,2COnn..
dt
dnnn.
V
.
dt
COd
0dt
Carbd
0dt
Epd
**
liq
Liq2 −=⇔−=
=
=
akak
LL
(5.11)
where, kL.a represents the gas-liquid volumetric mass transfer coefficient and *
Liq,2COn is the
number of moles of CO2 at the interface from the liquid side.
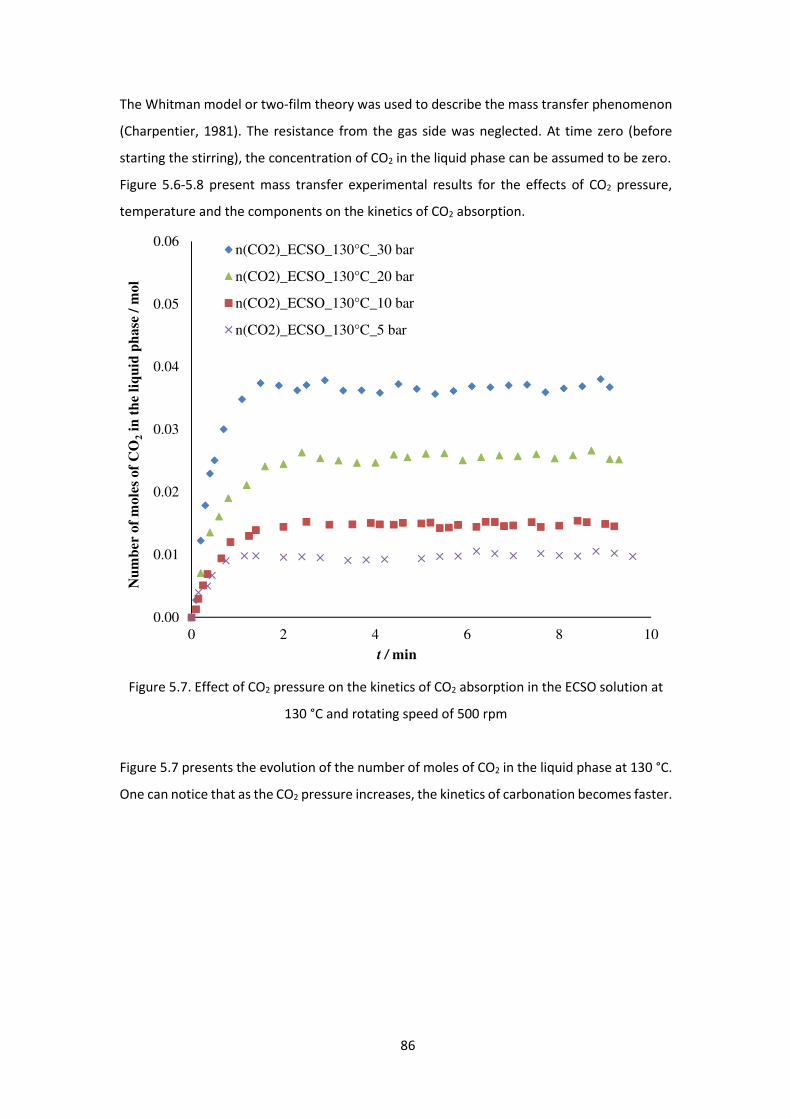
86
The Whitman model or two-film theory was used to describe the mass transfer phenomenon
(Charpentier, 1981). The resistance from the gas side was neglected. At time zero (before
starting the stirring), the concentration of CO2 in the liquid phase can be assumed to be zero.
Figure 5.6-5.8 present mass transfer experimental results for the effects of CO2 pressure,
temperature and the components on the kinetics of CO2 absorption.
Figure 5.7. Effect of CO2 pressure on the kinetics of CO2 absorption in the ECSO solution at
130 °C and rotating speed of 500 rpm
Figure 5.7 presents the evolution of the number of moles of CO2 in the liquid phase at 130 °C.
One can notice that as the CO2 pressure increases, the kinetics of carbonation becomes faster.
0.00
0.01
0.02
0.03
0.04
0.05
0.06
0 2 4 6 8 10
Nu
mb
er o
f m
ole
s of
CO
2in
th
e li
qu
id p
ha
se /
mo
l
t / min
n(CO2)_ECSO_130°C_30 bar
n(CO2)_ECSO_130°C_20 bar
n(CO2)_ECSO_130°C_10 bar
n(CO2)_ECSO_130°C_5 bar
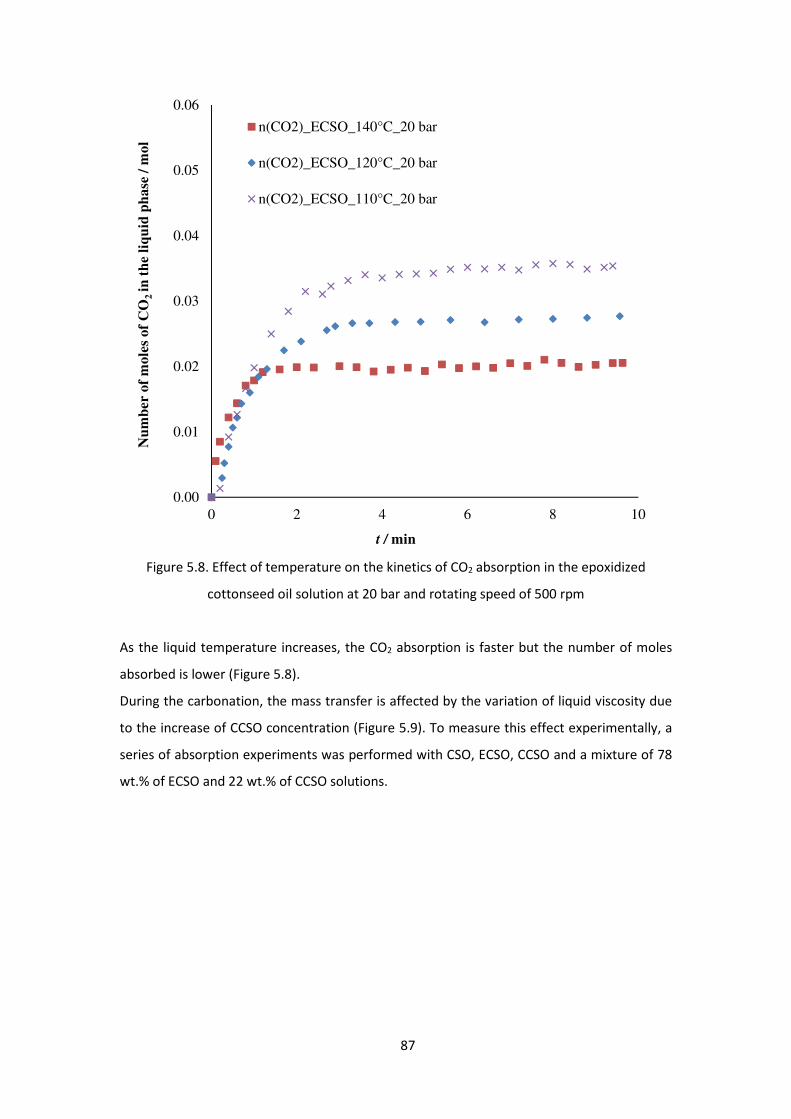
87
Figure 5.8. Effect of temperature on the kinetics of CO2 absorption in the epoxidized
cottonseed oil solution at 20 bar and rotating speed of 500 rpm
As the liquid temperature increases, the CO2 absorption is faster but the number of moles
absorbed is lower (Figure 5.8).
During the carbonation, the mass transfer is affected by the variation of liquid viscosity due
to the increase of CCSO concentration (Figure 5.9). To measure this effect experimentally, a
series of absorption experiments was performed with CSO, ECSO, CCSO and a mixture of 78
wt.% of ECSO and 22 wt.% of CCSO solutions.
0.00
0.01
0.02
0.03
0.04
0.05
0.06
0 2 4 6 8 10
Nu
mb
er o
f m
ole
s o
f C
O2
in t
he
liq
uid
ph
ase
/ m
ol
t / min
n(CO2)_ECSO_140°C_20 bar
n(CO2)_ECSO_120°C_20 bar
n(CO2)_ECSO_110°C_20 bar
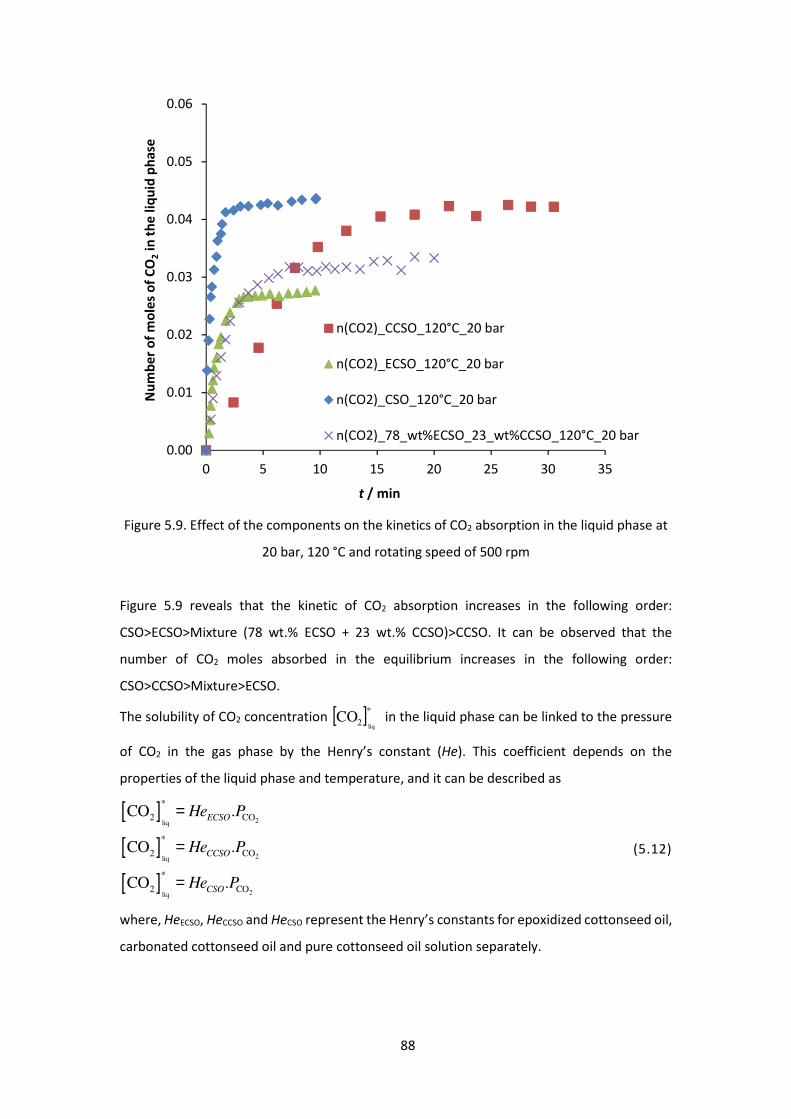
88
Figure 5.9. Effect of the components on the kinetics of CO2 absorption in the liquid phase at
20 bar, 120 °C and rotating speed of 500 rpm
Figure 5.9 reveals that the kinetic of CO2 absorption increases in the following order:
CSO>ECSO>Mixture (78 wt.% ECSO + 23 wt.% CCSO)>CCSO. It can be observed that the
number of CO2 moles absorbed in the equilibrium increases in the following order:
CSO>CCSO>Mixture>ECSO.
The solubility of CO2 concentration [ ]*2 liqCO in the liquid phase can be linked to the pressure
of CO2 in the gas phase by the Henry’s constant (He). This coefficient depends on the
properties of the liquid phase and temperature, and it can be described as
[ ][ ][ ]
2liq
2liq
2liq
*
2 CO
*
2 CO
*
2 CO
CO .
CO .
CO .
ECSO
CCSO
CSO
He P
He P
He P
=
=
=
(5.12)
where, HeECSO, HeCCSO and HeCSO represent the Henry’s constants for epoxidized cottonseed oil,
carbonated cottonseed oil and pure cottonseed oil solution separately.
0.00
0.01
0.02
0.03
0.04
0.05
0.06
0 5 10 15 20 25 30 35
Nu
mb
er
of
mo
les
of
CO
2in
th
e l
iqu
id p
ha
se
t / min
n(CO2)_CCSO_120°C_20 bar
n(CO2)_ECSO_120°C_20 bar
n(CO2)_CSO_120°C_20 bar
n(CO2)_78_wt%ECSO_23_wt%CCSO_120°C_20 bar
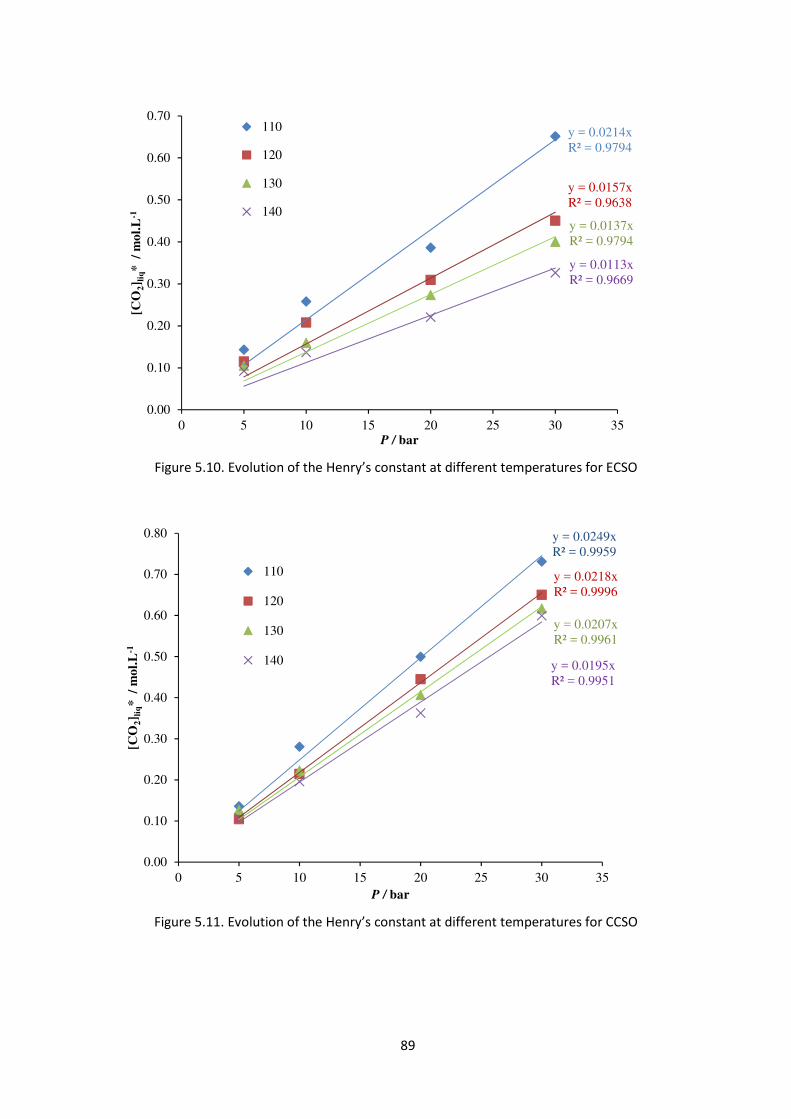
89
Figure 5.10. Evolution of the Henry’s constant at different temperatures for ECSO
Figure 5.11. Evolution of the Henry’s constant at different temperatures for CCSO
y = 0.0214xR² = 0.9794
y = 0.0157xR² = 0.9638
y = 0.0137xR² = 0.9794
y = 0.0113xR² = 0.9669
0.00
0.10
0.20
0.30
0.40
0.50
0.60
0.70
0 5 10 15 20 25 30 35
[CO
2] l
iq*
/
mo
l.L
-1
P / bar
110
120
130
140
y = 0.0249xR² = 0.9959
y = 0.0218xR² = 0.9996
y = 0.0207xR² = 0.9961
y = 0.0195xR² = 0.9951
0.00
0.10
0.20
0.30
0.40
0.50
0.60
0.70
0.80
0 5 10 15 20 25 30 35
[CO
2] l
iq*
/
mo
l.L
-1
P / bar
110
120
130
140
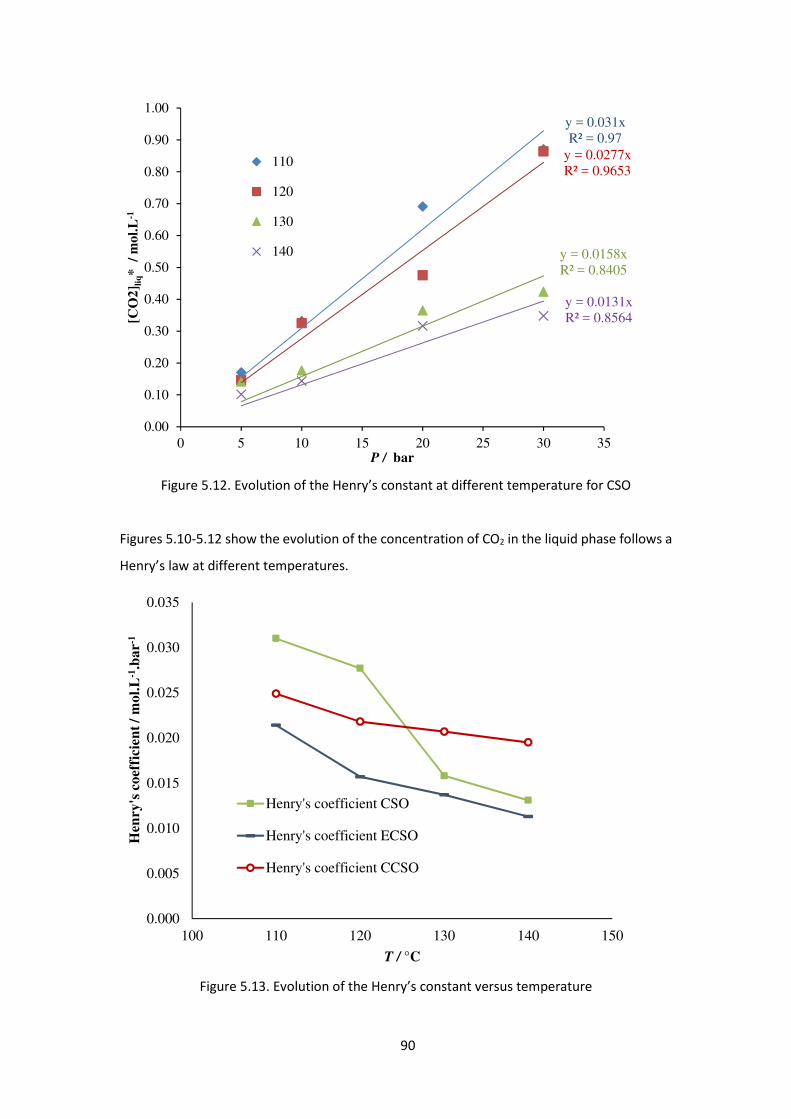
90
Figure 5.12. Evolution of the Henry’s constant at different temperature for CSO
Figures 5.10-5.12 show the evolution of the concentration of CO2 in the liquid phase follows a
Henry’s law at different temperatures.
Figure 5.13. Evolution of the Henry’s constant versus temperature
y = 0.031xR² = 0.97
y = 0.0277xR² = 0.9653
y = 0.0158xR² = 0.8405
y = 0.0131xR² = 0.8564
0.00
0.10
0.20
0.30
0.40
0.50
0.60
0.70
0.80
0.90
1.00
0 5 10 15 20 25 30 35
[CO
2] l
iq*
/
mo
l.L
-1
P / bar
110
120
130
140
0.000
0.005
0.010
0.015
0.020
0.025
0.030
0.035
100 110 120 130 140 150
Hen
ry's
coef
fici
ent
/ m
ol.
L-1
.bar-1
T / °C
Henry's coefficient CSO
Henry's coefficient ECSO
Henry's coefficient CCSO
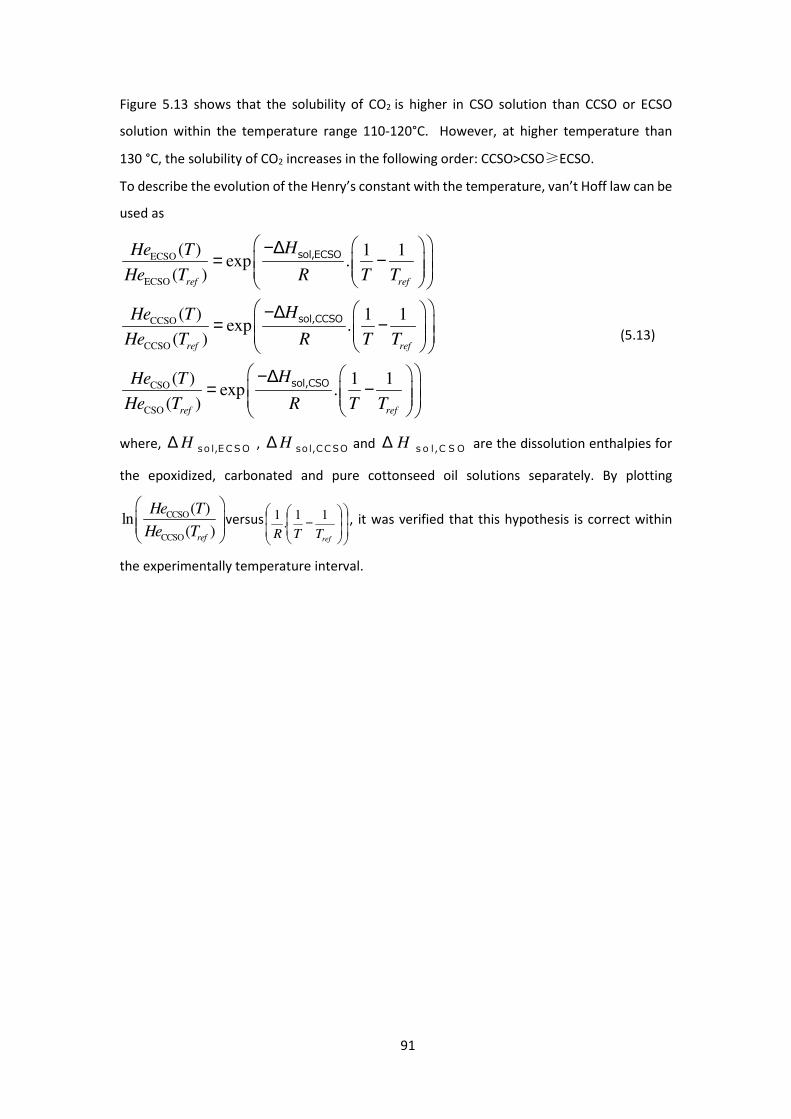
91
Figure 5.13 shows that the solubility of CO2 is higher in CSO solution than CCSO or ECSO
solution within the temperature range 110-120°C. However, at higher temperature than
130 °C, the solubility of CO2 increases in the following order: CCSO>CSO≥ECSO.
To describe the evolution of the Henry’s constant with the temperature, van’t Hoff law can be
used as
ECSO
ECSO
CCSO
CCSO
CSO
CSO
( ) 1 1exp .
( )
( ) 1 1exp .
( )
( ) 1 1exp .
( )
ref ref
ref ref
ref ref
HHe T
He T R T T
HHe T
He T R T T
HHe T
He T R T T
−∆= −
−∆= −
−∆= −
sol,ECSO
sol,CCSO
sol,CSO
(5.13)
where, H∆ so l,E C S O , H∆ so l,C C SO and H∆ s o l ,C S O are the dissolution enthalpies for
the epoxidized, carbonated and pure cottonseed oil solutions separately. By plotting
CCSO
CCSO
( )ln
( )ref
He T
He T
versus
−
refTTR
11.
1 , it was verified that this hypothesis is correct within
the experimentally temperature interval.
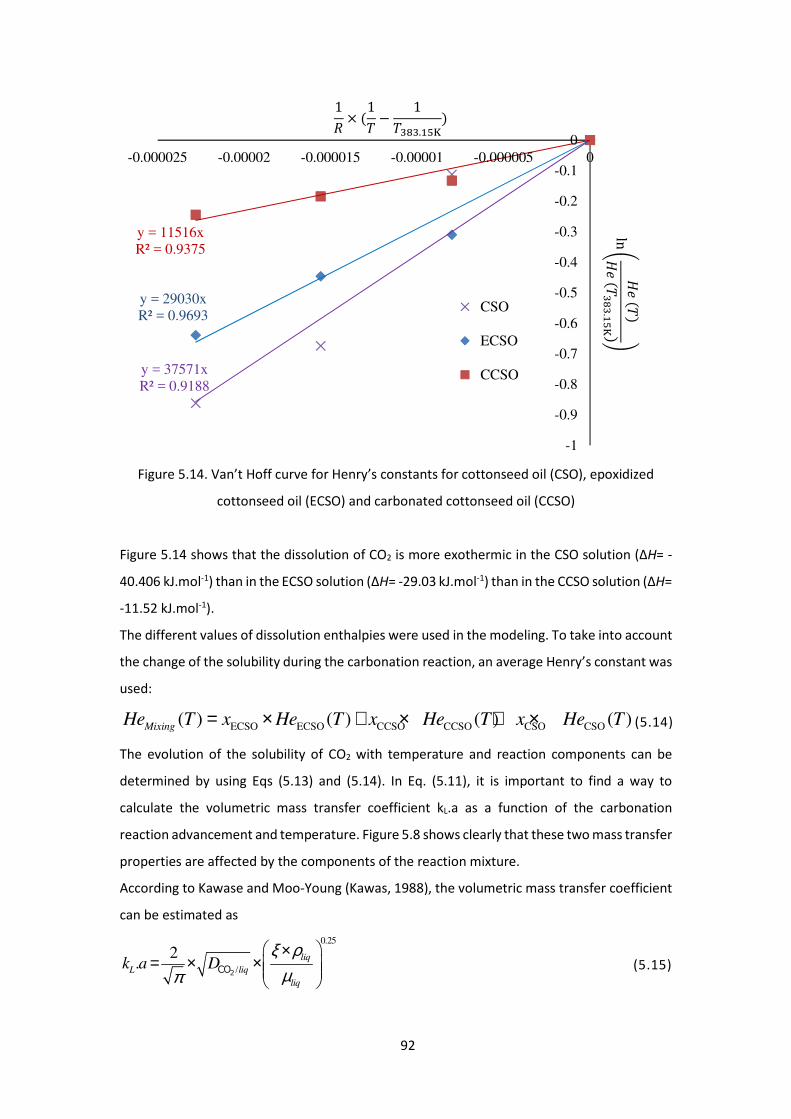
92
Figure 5.14. Van’t Hoff curve for Henry’s constants for cottonseed oil (CSO), epoxidized
cottonseed oil (ECSO) and carbonated cottonseed oil (CCSO)
Figure 5.14 shows that the dissolution of CO2 is more exothermic in the CSO solution (∆H= -
40.406 kJ.mol-1) than in the ECSO solution (∆H= -29.03 kJ.mol-1) than in the CCSO solution (∆H=
-11.52 kJ.mol-1).
The different values of dissolution enthalpies were used in the modeling. To take into account
the change of the solubility during the carbonation reaction, an average Henry’s constant was
used:
ECSO ECSO CCSO CCSO CSO CSO( ) ( ) ( ) ( )Mixing
He T x He T x He T x He T= × + × + × (5.14)
The evolution of the solubility of CO2 with temperature and reaction components can be
determined by using Eqs (5.13) and (5.14). In Eq. (5.11), it is important to find a way to
calculate the volumetric mass transfer coefficient kL.a as a function of the carbonation
reaction advancement and temperature. Figure 5.8 shows clearly that these two mass transfer
properties are affected by the components of the reaction mixture.
According to Kawase and Moo-Young (Kawas, 1988), the volumetric mass transfer coefficient
can be estimated as
0.25
/
2. liq
L liq
liq
k a Dξ ρ
µπ ×
= × ×
2CO (5.15)
y = 37571xR² = 0.9188
y = 29030xR² = 0.9693
y = 11516xR² = 0.9375
-1
-0.9
-0.8
-0.7
-0.6
-0.5
-0.4
-0.3
-0.2
-0.1
0-0.000025 -0.00002 -0.000015 -0.00001 -0.000005 0
CSO
ECSO
CCSO
1� × M1f − 1f(t(.4u�Oln
xyfxyf(t(.4u�
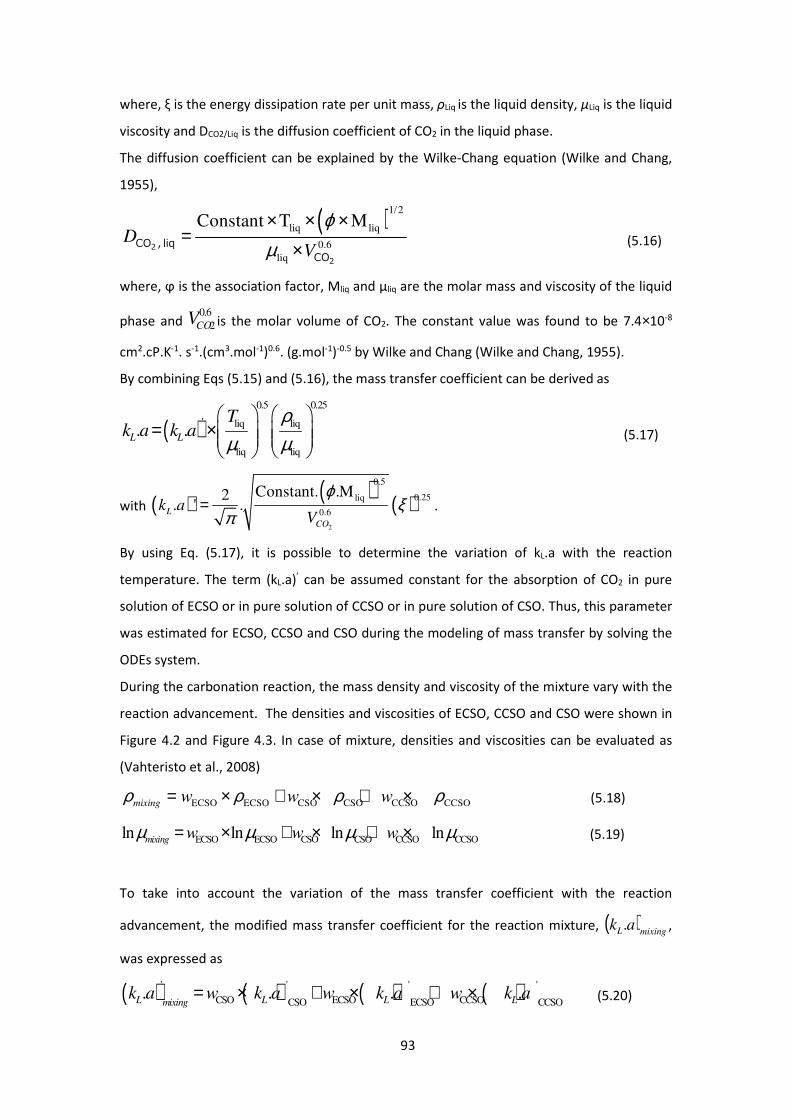
93
where, ξ is the energy dissipation rate per unit mass, ρLiq is the liquid density, µLiq is the liquid
viscosity and DCO2/Liq is the diffusion coefficient of CO2 in the liquid phase.
The diffusion coefficient can be explained by the Wilke-Chang equation (Wilke and Chang,
1955),
( )1/2
liq liq
0.6liq
Constant T MD
V
ϕµ× × ×
=×2
2
CO , liqCO
(5.16)
where, ϕ is the association factor, Mliq and µliq are the molar mass and viscosity of the liquid
phase and 6.02COV is the molar volume of CO2. The constant value was found to be 7.4×10⁻⁸
cm2.cP.K-1. s-1.(cm3.mol-1)0.6. (g.mol-1)-0.5 by Wilke and Chang (Wilke and Chang, 1955).
By combining Eqs (5.15) and (5.16), the mass transfer coefficient can be derived as
( )0.5 0.25
' liq liq
liq liq
. .L L
Tk a k a
ρµ µ
= ×
(5.17)
with ( ) ( ) ( )2
0.5
0.25liq
0.6
Constant. .M2. ' .L
CO
k aV
ϕξ
π= .
By using Eq. (5.17), it is possible to determine the variation of kL.a with the reaction
temperature. The term (kL.a)’ can be assumed constant for the absorption of CO2 in pure
solution of ECSO or in pure solution of CCSO or in pure solution of CSO. Thus, this parameter
was estimated for ECSO, CCSO and CSO during the modeling of mass transfer by solving the
ODEs system.
During the carbonation reaction, the mass density and viscosity of the mixture vary with the
reaction advancement. The densities and viscosities of ECSO, CCSO and CSO were shown in
Figure 4.2 and Figure 4.3. In case of mixture, densities and viscosities can be evaluated as
(Vahteristo et al., 2008)
ECSO ECSO CSO CSO CCSO CCSOmixing w w wρ ρ ρ ρ= × + × + × (5.18)
ECSO ECSO CSO CSO CCSO CCSOln ln ln lnmixing w w wµ µ µ µ= × + × + × (5.19)
To take into account the variation of the mass transfer coefficient with the reaction
advancement, the modified mass transfer coefficient for the reaction mixture, ( )'.mixingL ak ,
was expressed as
( ) ( ) ( ) ( )' ' ' '
CSO ECSO CCSOCSO ECSO CCSO. . . .L L L Lmixing
k a w k a w k a w k a= × + × + × (5.20)
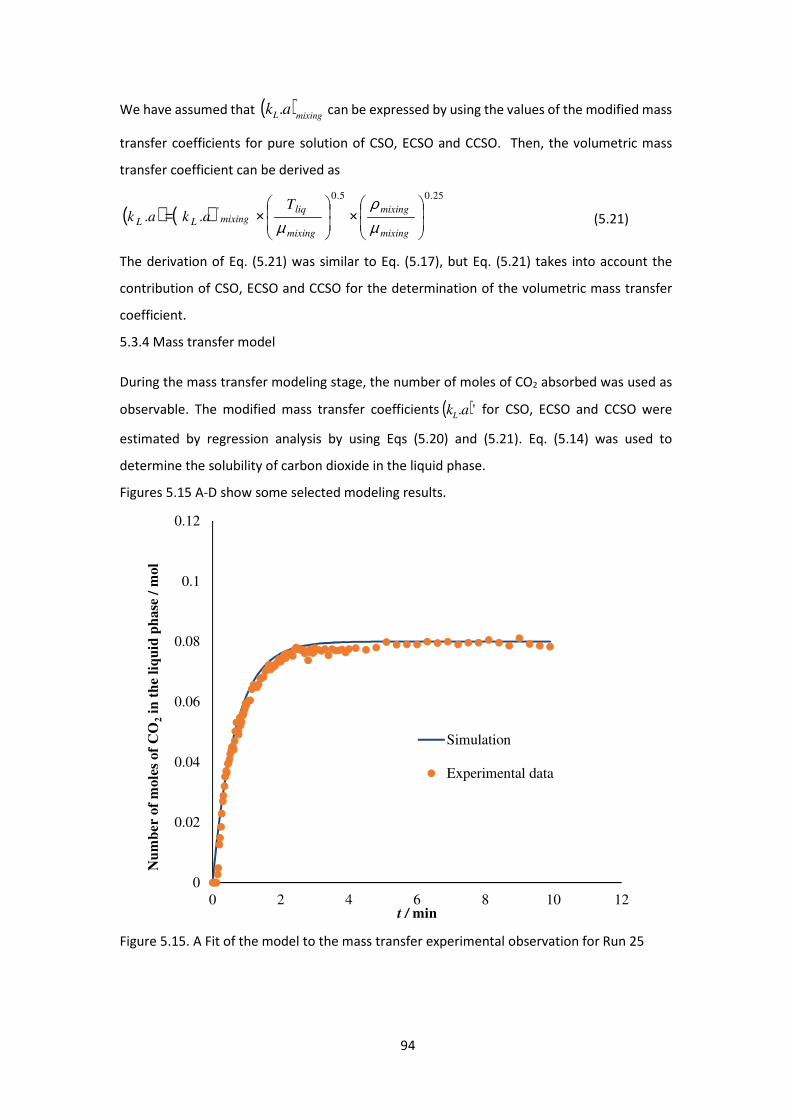
94
We have assumed that ( )'.mixingL ak can be expressed by using the values of the modified mass
transfer coefficients for pure solution of CSO, ECSO and CCSO. Then, the volumetric mass
transfer coefficient can be derived as
( ) ( )25.05.0
'..
×
×=
mixing
mixing
mixing
liqmixingLL
Takak
µρ
µ (5.21)
The derivation of Eq. (5.21) was similar to Eq. (5.17), but Eq. (5.21) takes into account the
contribution of CSO, ECSO and CCSO for the determination of the volumetric mass transfer
coefficient.
5.3.4 Mass transfer model
During the mass transfer modeling stage, the number of moles of CO2 absorbed was used as
observable. The modified mass transfer coefficients ( )'.akL for CSO, ECSO and CCSO were
estimated by regression analysis by using Eqs (5.20) and (5.21). Eq. (5.14) was used to
determine the solubility of carbon dioxide in the liquid phase.
Figures 5.15 A-D show some selected modeling results.
Figure 5.15. A Fit of the model to the mass transfer experimental observation for Run 25
0
0.02
0.04
0.06
0.08
0.1
0.12
0 2 4 6 8 10 12
Nu
mb
er o
f m
ole
s of
CO
2in
th
e li
qu
id p
hase
/ m
ol
t / min
Simulation
Experimental data
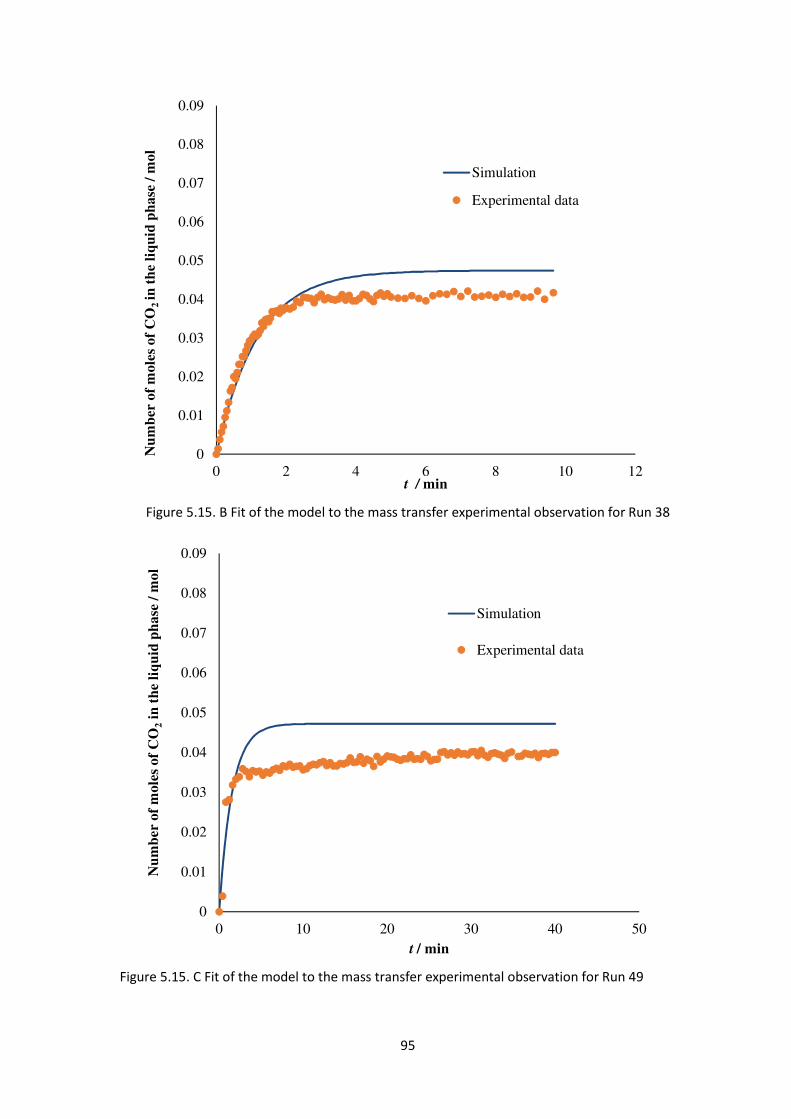
95
Figure 5.15. B Fit of the model to the mass transfer experimental observation for Run 38
Figure 5.15. C Fit of the model to the mass transfer experimental observation for Run 49
0
0.01
0.02
0.03
0.04
0.05
0.06
0.07
0.08
0.09
0 2 4 6 8 10 12
Nu
mb
er o
f m
ole
s o
f C
O2
in t
he
liq
uid
ph
ase
/ m
ol
t / min
Simulation
Experimental data
0
0.01
0.02
0.03
0.04
0.05
0.06
0.07
0.08
0.09
0 10 20 30 40 50
Nu
mb
er o
f m
ole
s of
CO
2in
th
e li
qu
id p
hase
/ m
ol
t / min
Simulation
Experimental data
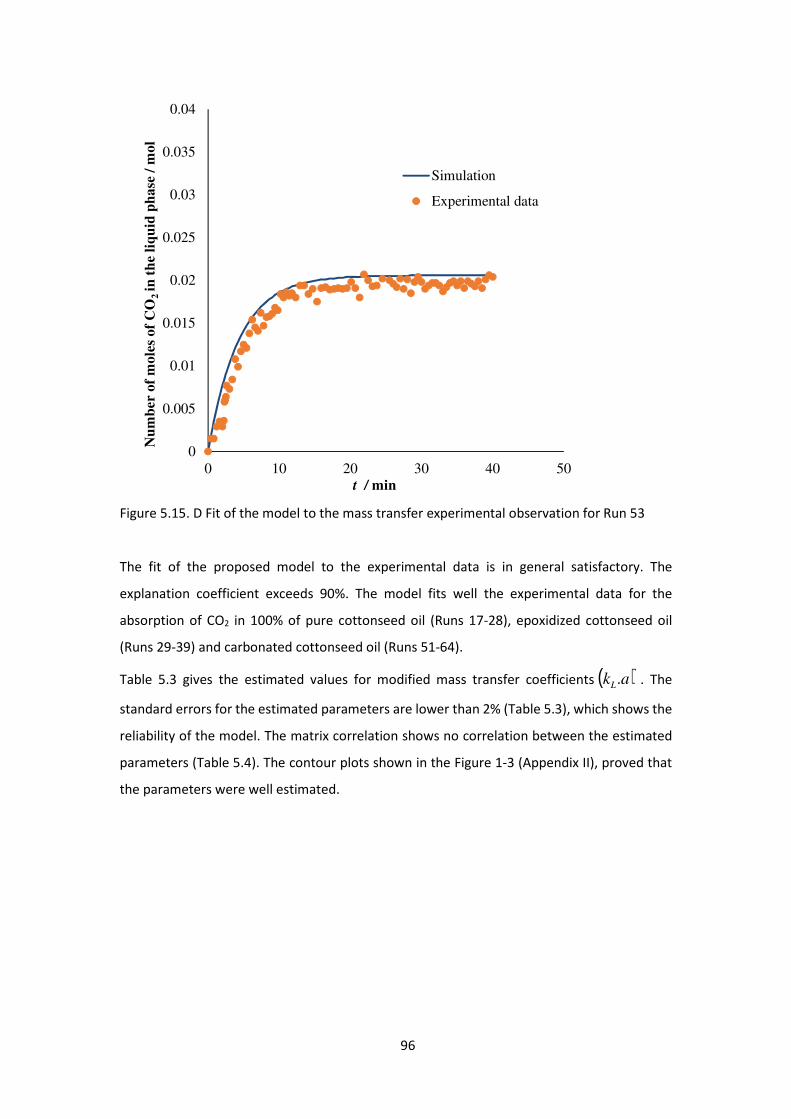
96
Figure 5.15. D Fit of the model to the mass transfer experimental observation for Run 53
The fit of the proposed model to the experimental data is in general satisfactory. The
explanation coefficient exceeds 90%. The model fits well the experimental data for the
absorption of CO2 in 100% of pure cottonseed oil (Runs 17-28), epoxidized cottonseed oil
(Runs 29-39) and carbonated cottonseed oil (Runs 51-64).
Table 5.3 gives the estimated values for modified mass transfer coefficients ( )'.akL . The
standard errors for the estimated parameters are lower than 2% (Table 5.3), which shows the
reliability of the model. The matrix correlation shows no correlation between the estimated
parameters (Table 5.4). The contour plots shown in the Figure 1-3 (Appendix II), proved that
the parameters were well estimated.
0
0.005
0.01
0.015
0.02
0.025
0.03
0.035
0.04
0 10 20 30 40 50
Nu
mb
er o
f m
ole
s o
f C
O2
in t
he
liq
uid
ph
ase
/ m
ol
t / min
Simulation
Experimental data
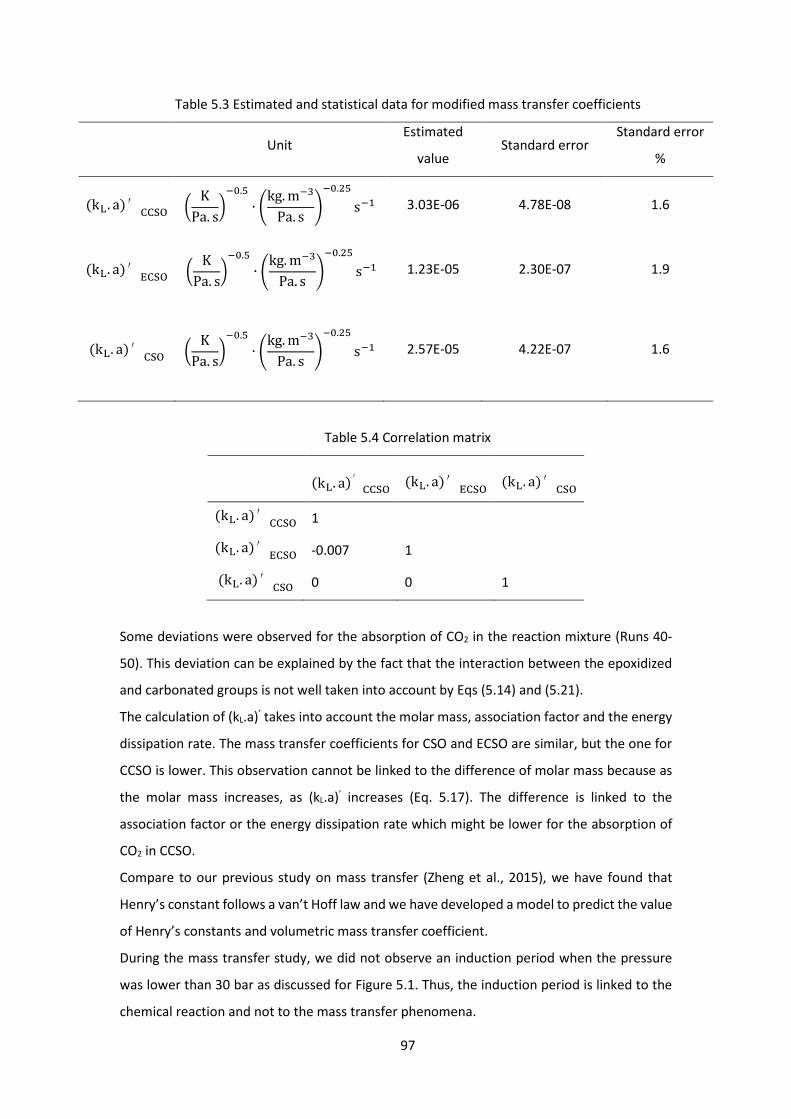
97
Table 5.3 Estimated and statistical data for modified mass transfer coefficients
Unit Estimated
value Standard error
Standard error
%
Mkz. aO′aa9� | KPa. s�@�.u ∙ �kg.m@(Pa. s �
@�. u s@4 3.03E-06 4.78E-08 1.6
Mkz. aO′Qa9� | KPa. s�@�.u ∙ �kg.m@(Pa. s �
@�. u s@4 1.23E-05 2.30E-07 1.9
Mkz. aO′a9� | KPa. s�@�.u ∙ �kg.m@(Pa. s �
@�. u s@4 2.57E-05 4.22E-07 1.6
Table 5.4 Correlation matrix
Mkz. aO′aa9� Mkz. aO′Qa9� Mkz. aO′a9�
Mkz. aO′aa9� 1
Mkz. aO′Qa9� -0.007 1
Mkz. aO′a9� 0 0 1
Some deviations were observed for the absorption of CO2 in the reaction mixture (Runs 40-
50). This deviation can be explained by the fact that the interaction between the epoxidized
and carbonated groups is not well taken into account by Eqs (5.14) and (5.21).
The calculation of (kL.a)’ takes into account the molar mass, association factor and the energy
dissipation rate. The mass transfer coefficients for CSO and ECSO are similar, but the one for
CCSO is lower. This observation cannot be linked to the difference of molar mass because as
the molar mass increases, as (kL.a)’ increases (Eq. 5.17). The difference is linked to the
association factor or the energy dissipation rate which might be lower for the absorption of
CO2 in CCSO.
Compare to our previous study on mass transfer (Zheng et al., 2015), we have found that
Henry’s constant follows a van’t Hoff law and we have developed a model to predict the value
of Henry’s constants and volumetric mass transfer coefficient.
During the mass transfer study, we did not observe an induction period when the pressure
was lower than 30 bar as discussed for Figure 5.1. Thus, the induction period is linked to the
chemical reaction and not to the mass transfer phenomena.
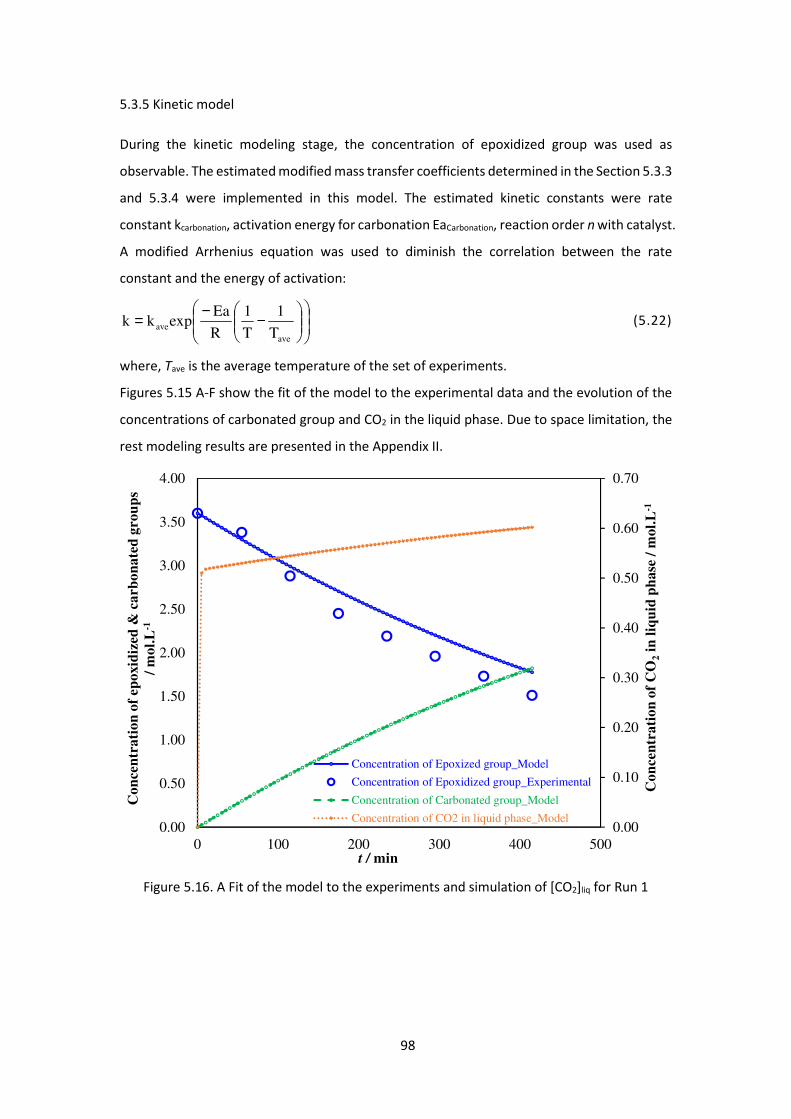
98
5.3.5 Kinetic model
During the kinetic modeling stage, the concentration of epoxidized group was used as
observable. The estimated modified mass transfer coefficients determined in the Section 5.3.3
and 5.3.4 were implemented in this model. The estimated kinetic constants were rate
constant kcarbonation, activation energy for carbonation EaCarbonation, reaction order n with catalyst.
A modified Arrhenius equation was used to diminish the correlation between the rate
constant and the energy of activation:
(5.22)
where, Tave is the average temperature of the set of experiments.
Figures 5.15 A-F show the fit of the model to the experimental data and the evolution of the
concentrations of carbonated group and CO2 in the liquid phase. Due to space limitation, the
rest modeling results are presented in the Appendix II.
Figure 5.16. A Fit of the model to the experiments and simulation of [CO2]liq for Run 1
−−=
aveave T
1
T
1
R
Eaexpkk
0.00
0.10
0.20
0.30
0.40
0.50
0.60
0.70
0.00
0.50
1.00
1.50
2.00
2.50
3.00
3.50
4.00
0 100 200 300 400 500
Con
cen
trati
on
of
CO
2in
liq
uid
ph
ase
/ m
ol.
L-1
Co
nce
ntr
ati
on
of
epoxid
ized
& c
arb
on
ate
d g
rou
ps
/ m
ol.
L-1
t / min
Concentration of Epoxized group_Model
Concentration of Epoxidized group_Experimental
Concentration of Carbonated group_Model
Concentration of CO2 in liquid phase_Model
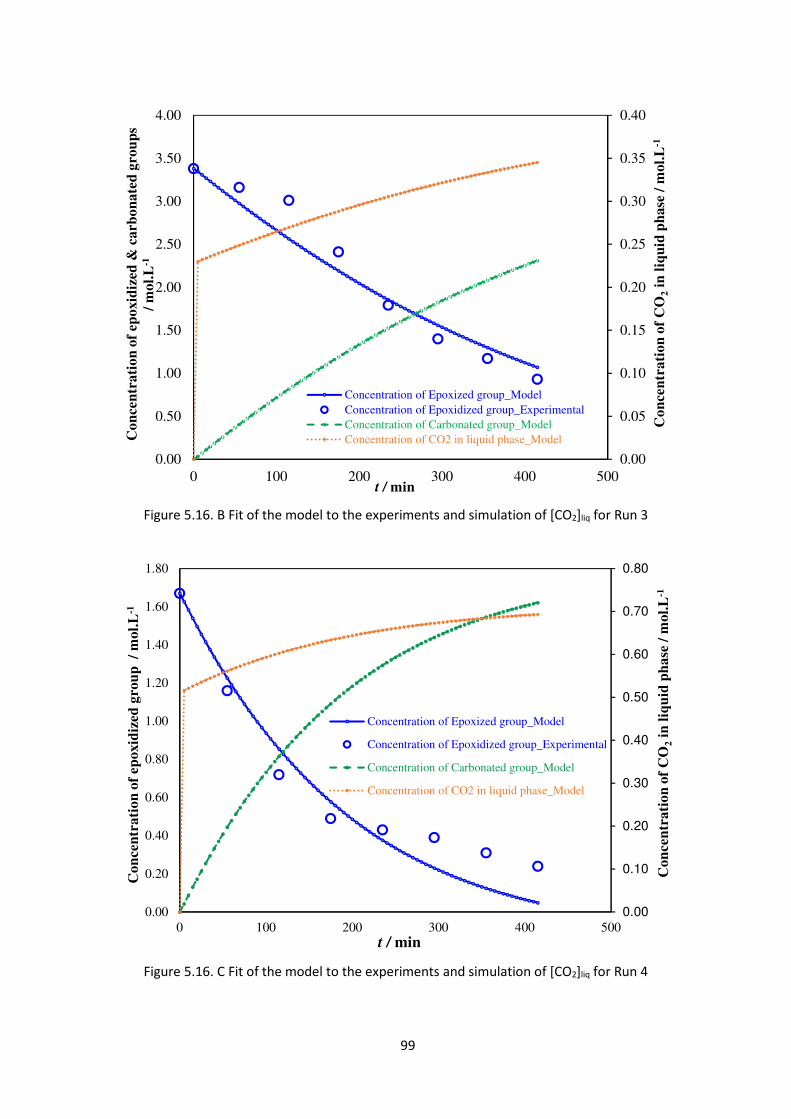
99
Figure 5.16. B Fit of the model to the experiments and simulation of [CO2]liq for Run 3
Figure 5.16. C Fit of the model to the experiments and simulation of [CO2]liq for Run 4
0.00
0.05
0.10
0.15
0.20
0.25
0.30
0.35
0.40
0.00
0.50
1.00
1.50
2.00
2.50
3.00
3.50
4.00
0 100 200 300 400 500
Co
nce
ntr
ati
on
of
CO
2in
liq
uid
ph
ase
/ m
ol.
L-1
Co
nce
ntr
ati
on
of
epo
xid
ized
& c
arb
on
ate
d g
rou
ps
/ m
ol.
L-1
t / min
Concentration of Epoxized group_ModelConcentration of Epoxidized group_ExperimentalConcentration of Carbonated group_ModelConcentration of CO2 in liquid phase_Model
0.00
0.10
0.20
0.30
0.40
0.50
0.60
0.70
0.80
0.00
0.20
0.40
0.60
0.80
1.00
1.20
1.40
1.60
1.80
0 100 200 300 400 500
Co
nce
ntr
ati
on
of
CO
2in
liq
uid
ph
ase
/ m
ol.
L-1
Co
nce
ntr
ati
on
of
epoxid
ized
gro
up
/
mol.
L-1
t / min
Concentration of Epoxized group_Model
Concentration of Epoxidized group_Experimental
Concentration of Carbonated group_Model
Concentration of CO2 in liquid phase_Model
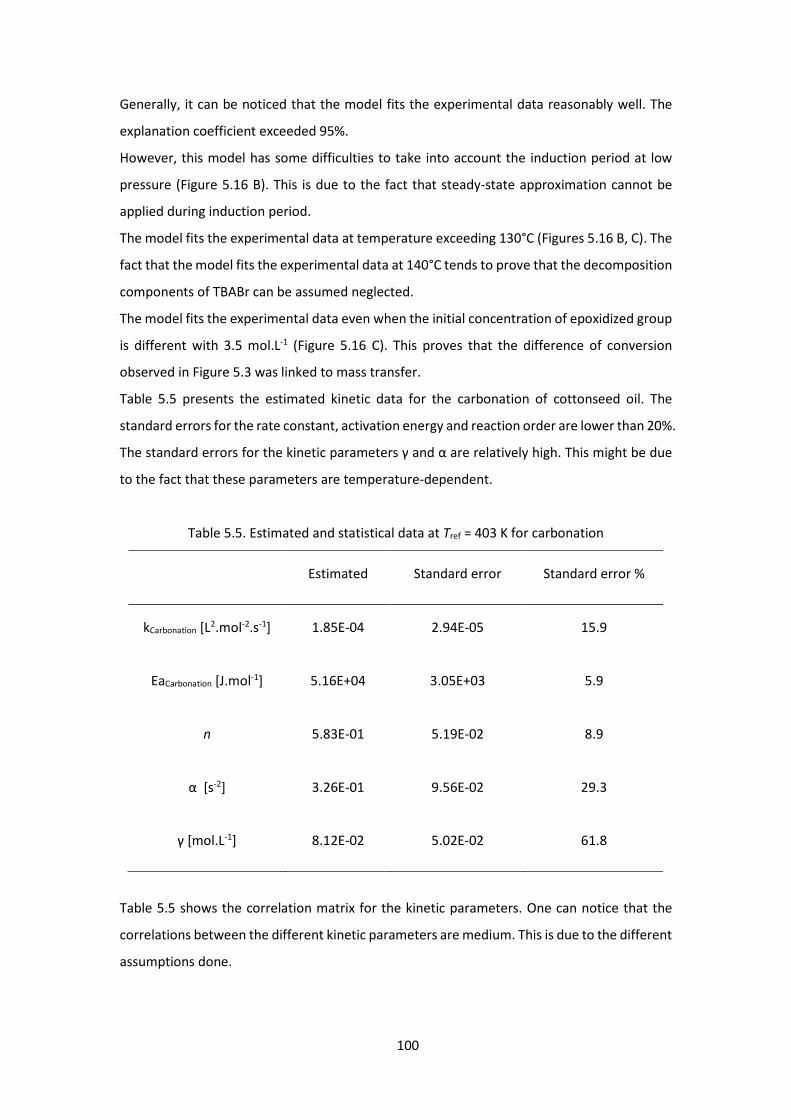
100
Generally, it can be noticed that the model fits the experimental data reasonably well. The
explanation coefficient exceeded 95%.
However, this model has some difficulties to take into account the induction period at low
pressure (Figure 5.16 B). This is due to the fact that steady-state approximation cannot be
applied during induction period.
The model fits the experimental data at temperature exceeding 130°C (Figures 5.16 B, C). The
fact that the model fits the experimental data at 140°C tends to prove that the decomposition
components of TBABr can be assumed neglected.
The model fits the experimental data even when the initial concentration of epoxidized group
is different with 3.5 mol.L-1 (Figure 5.16 C). This proves that the difference of conversion
observed in Figure 5.3 was linked to mass transfer.
Table 5.5 presents the estimated kinetic data for the carbonation of cottonseed oil. The
standard errors for the rate constant, activation energy and reaction order are lower than 20%.
The standard errors for the kinetic parameters γ and α are relatively high. This might be due
to the fact that these parameters are temperature-dependent.
Table 5.5. Estimated and statistical data at Tref = 403 K for carbonation
Estimated Standard error Standard error %
kCarbonation [L2.mol-2.s-1] 1.85E-04 2.94E-05 15.9
EaCarbonation [J.mol-1] 5.16E+04 3.05E+03 5.9
n 5.83E-01 5.19E-02 8.9
α [s-2] 3.26E-01 9.56E-02 29.3
γ [mol.L-1] 8.12E-02 5.02E-02 61.8
Table 5.5 shows the correlation matrix for the kinetic parameters. One can notice that the
correlations between the different kinetic parameters are medium. This is due to the different
assumptions done.
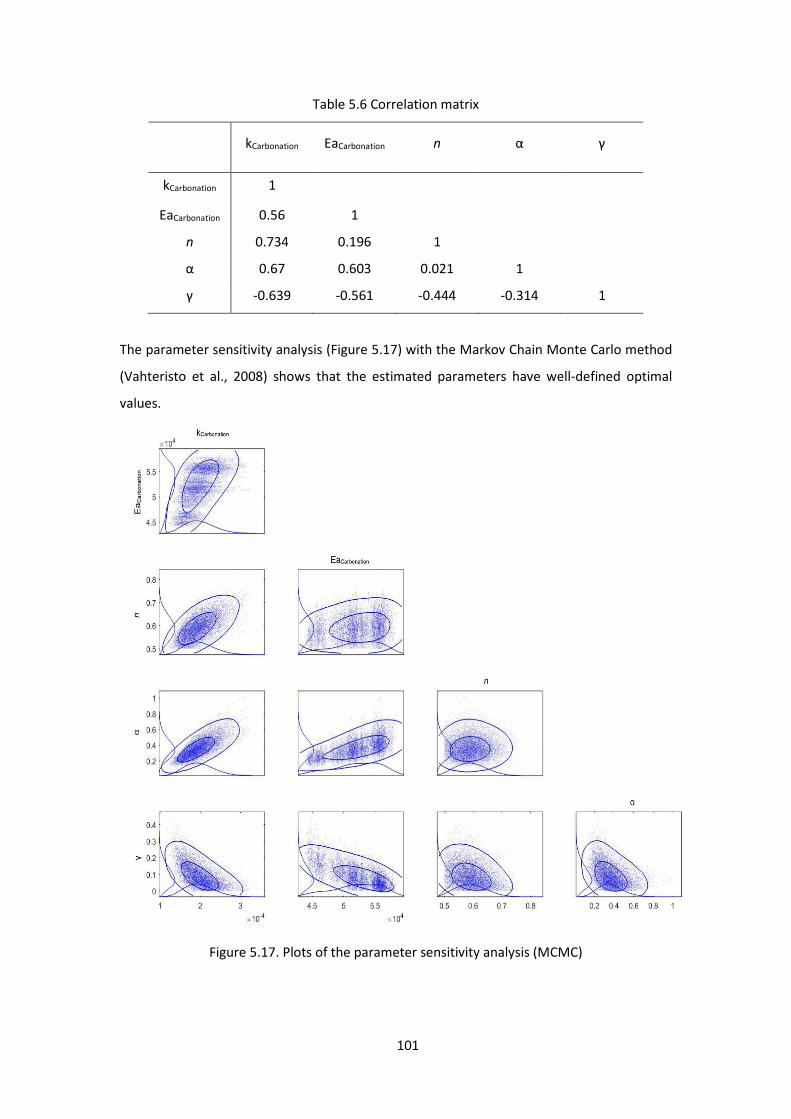
101
Table 5.6 Correlation matrix
kCarbonation EaCarbonation n α γ
kCarbonation 1
EaCarbonation 0.56 1
n 0.734 0.196 1
α 0.67 0.603 0.021 1
γ -0.639 -0.561 -0.444 -0.314 1
The parameter sensitivity analysis (Figure 5.17) with the Markov Chain Monte Carlo method
(Vahteristo et al., 2008) shows that the estimated parameters have well-defined optimal
values.
Figure 5.17. Plots of the parameter sensitivity analysis (MCMC)
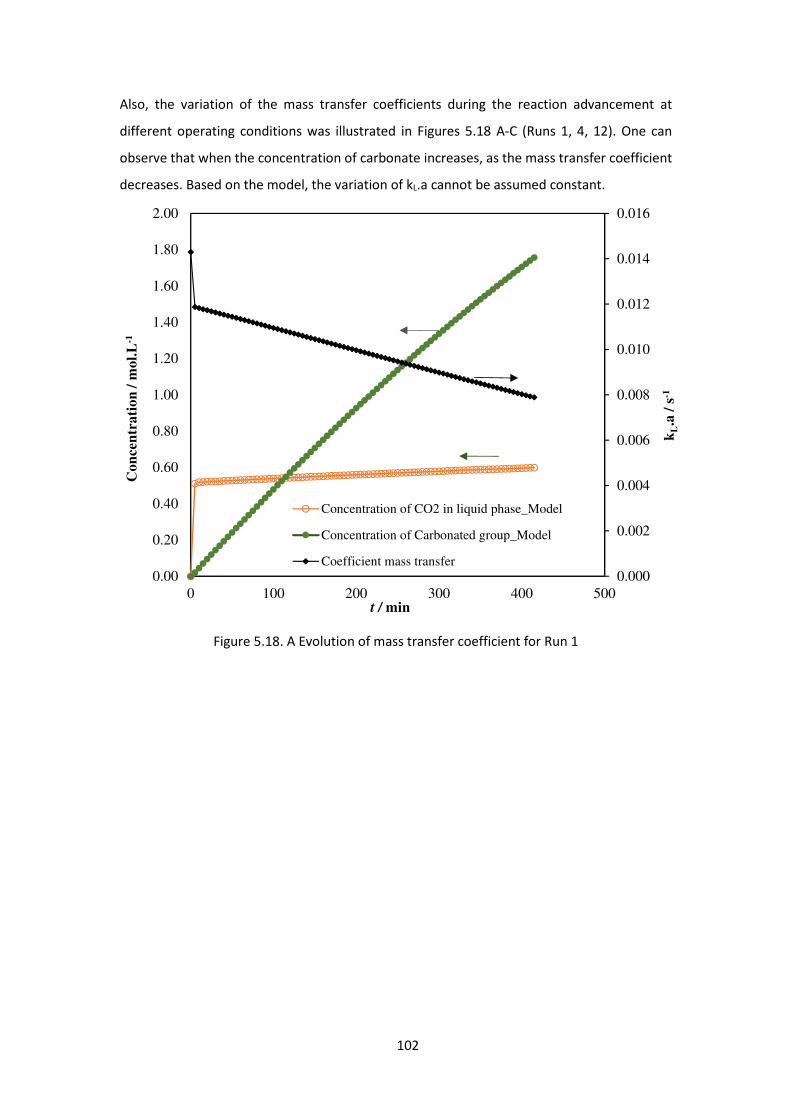
102
Also, the variation of the mass transfer coefficients during the reaction advancement at
different operating conditions was illustrated in Figures 5.18 A-C (Runs 1, 4, 12). One can
observe that when the concentration of carbonate increases, as the mass transfer coefficient
decreases. Based on the model, the variation of kL.a cannot be assumed constant.
Figure 5.18. A Evolution of mass transfer coefficient for Run 1
0.000
0.002
0.004
0.006
0.008
0.010
0.012
0.014
0.016
0.00
0.20
0.40
0.60
0.80
1.00
1.20
1.40
1.60
1.80
2.00
0 100 200 300 400 500
Con
cen
tra
tio
n / m
ol.
L-1
t / min
Concentration of CO2 in liquid phase_Model
Concentration of Carbonated group_Model
Coefficient mass transfer
kL.a
/s-1
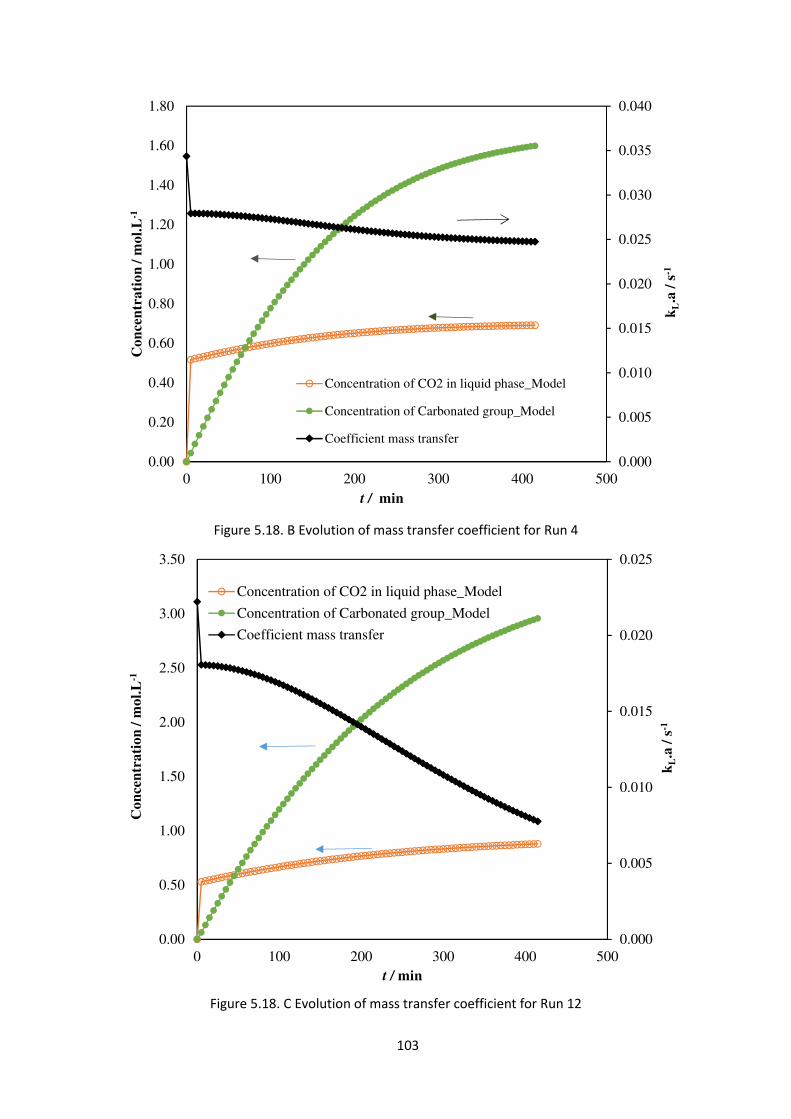
103
Figure 5.18. B Evolution of mass transfer coefficient for Run 4
Figure 5.18. C Evolution of mass transfer coefficient for Run 12
0.000
0.005
0.010
0.015
0.020
0.025
0.030
0.035
0.040
0.00
0.20
0.40
0.60
0.80
1.00
1.20
1.40
1.60
1.80
0 100 200 300 400 500
Co
nce
ntr
ati
on
/ m
ol.
L-1
t / min
Concentration of CO2 in liquid phase_Model
Concentration of Carbonated group_Model
Coefficient mass transfer
kL.a
/ s
-1
0.000
0.005
0.010
0.015
0.020
0.025
0.00
0.50
1.00
1.50
2.00
2.50
3.00
3.50
0 100 200 300 400 500
Con
cen
trati
on
/ m
ol.
L-1
t / min
Concentration of CO2 in liquid phase_Model
Concentration of Carbonated group_Model
Coefficient mass transfer
kL.a
/ s
-1
104
5.4 Conclusions
The kinetics of the carbonation of epoxidized cottonseed oil in an autoclave was studied in
the presence of TBABr, as a homogeneous catalyst. The conversion of epoxidized groups to
carbonated groups leads to an increase of the viscosity, which has a strong influence on the
gas-liquid mass transfer.
The parameters influencing the mass transfer effects were investigated in the first stage.
Modified volumetric mass transfer coefficients were used to represent the mass transfer of
CSO, ECSO and CCSO. The benefit of these coefficients is that they are temperature, viscosity
and density independent. By using these coefficients, it is possible to determine the value of
the volumetric mass transfer as a function of the reaction advancement. It was demonstrated
that Henry’s constants for CSO, ECSO and CCSO follow van’t Hoff law. The exothermicity of
the CO2 dissolution increases in the following order CCSOCOECSOCOCSOCO HHH /2/2/2 ∆>∆>∆ . The
proposed approach to take into account mass transfer phenomena is an empirical approach
by assuming that the effects of double bond, epoxidized and carbonated groups are addable.
Some further investigation should be performed by determining local mass transfer
coefficient by using CFD calculation.
In the last stage, a kinetic model was developed. It was assumed that the reaction between
the epoxidized group and TBABr producing an intermediate was in quasi-equilibrium (steady
state), while the rate-determining step was the reaction between this intermediate and
dissolved CO2. Thus, the rate of carbonation was expressed with the concentration of TBABr,
epoxidized group and dissolved CO2. By including the mass transfer parameters estimated in
the previous stage, the rate constant at the reference temperature of 403 K was estimated to
be 2.07×10⁻⁴ L2.mol-2.s-1 and activation energy was estimated to 50060 J.mol-1. The reliability
of the kinetic parameters was verified by using Markov chain Monte Carlo method.
105
Chapter VI Structure-reactivity: comparison between
vegetable oils and fatty acid methyl ester
Part of this chapter is adapted from the post print of the following article:
X. Cai, M. Matos, S. Leveneur. Structure-reactivity: comparison between the carbonation of
epoxidized vegetable oils and the corresponding epoxidized fatty acid methyl ester. Industrial
& Engineering Chemistry Research, 2019.
Link: https://doi.org/10.1021/acs.iecr.8b05510
Further permissions related to the material excerpted should be directed to the ACS
Publications. Copyright © 2019 American Chemical Society.
6.1 Introduction
Several studies have shown that one should transesterify vegetable oils to decrease their
viscosity. It is true that viscosity plays an important role, but steric hindrance due to the
conformation of the chemical structure of vegetable oils changes the chemical reactivity.
The objective of this study is to measure the effect of steric hindrance on the kinetics of
carbonation of epoxidized vegetable oils where the reactive centers are located on the fatty
acid moieties. For that, a comparison between the reactivity of a cottonseed oil and its fatty
acid methyl ester counterpart will be done. To carry out such study, it is compulsory to take
into account the mass transfer phenomena of carbon dioxide from gas to liquid phase. This
phenomenon is interfered by the physicochemical properties of the solvent. Carbonation
reaction performed by using homogeneous catalyst of tetra-n-butylammonium bromide
(TBABr) was studied.
In this chapter, Section 6.2 gives the detail information about the experimental procedure.
Section 6.3 shows the experiment results and discussion. Section 6.4 gives the conclusion for
this part of work.
6.2 Experimental section
Epoxidized cottonseed oil (ECSO) was prepared as described in Section 2.4.1. Fatty acid methyl
ester derived from cottonseed oil was prepared as described in Section 2.4.2. Epoxidized fatty
acid methyl ester derived from cottonseed oil was prepared as described in Section 2.4.3.
Apparatus and experimental procedures for carbonation experiment were introduced in
Section 2.5.
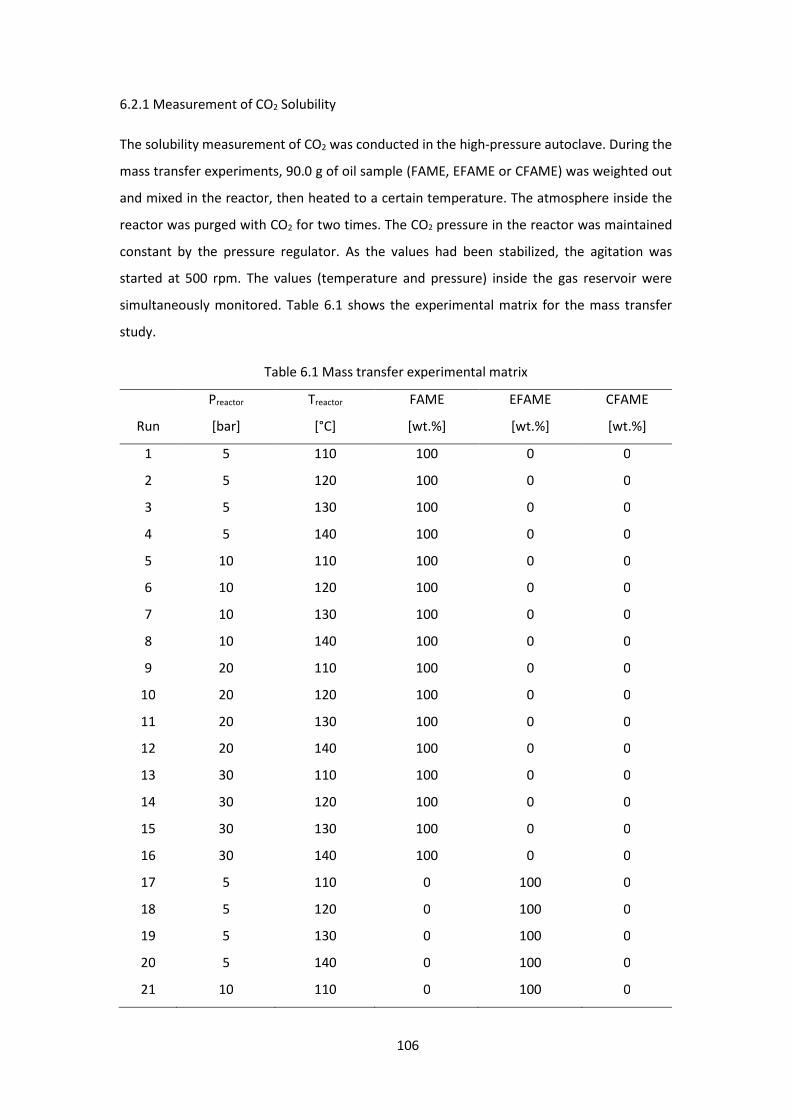
106
6.2.1 Measurement of CO2 Solubility
The solubility measurement of CO2 was conducted in the high-pressure autoclave. During the
mass transfer experiments, 90.0 g of oil sample (FAME, EFAME or CFAME) was weighted out
and mixed in the reactor, then heated to a certain temperature. The atmosphere inside the
reactor was purged with CO2 for two times. The CO2 pressure in the reactor was maintained
constant by the pressure regulator. As the values had been stabilized, the agitation was
started at 500 rpm. The values (temperature and pressure) inside the gas reservoir were
simultaneously monitored. Table 6.1 shows the experimental matrix for the mass transfer
study.
Table 6.1 Mass transfer experimental matrix
Run
Preactor
[bar]
Treactor
[°C]
FAME
[wt.%]
EFAME
[wt.%]
CFAME
[wt.%]
1 5 110 100 0 0
2 5 120 100 0 0
3 5 130 100 0 0
4 5 140 100 0 0
5 10 110 100 0 0
6 10 120 100 0 0
7 10 130 100 0 0
8 10 140 100 0 0
9 20 110 100 0 0
10 20 120 100 0 0
11 20 130 100 0 0
12 20 140 100 0 0
13 30 110 100 0 0
14 30 120 100 0 0
15 30 130 100 0 0
16 30 140 100 0 0
17 5 110 0 100 0
18 5 120 0 100 0
19 5 130 0 100 0
20 5 140 0 100 0
21 10 110 0 100 0
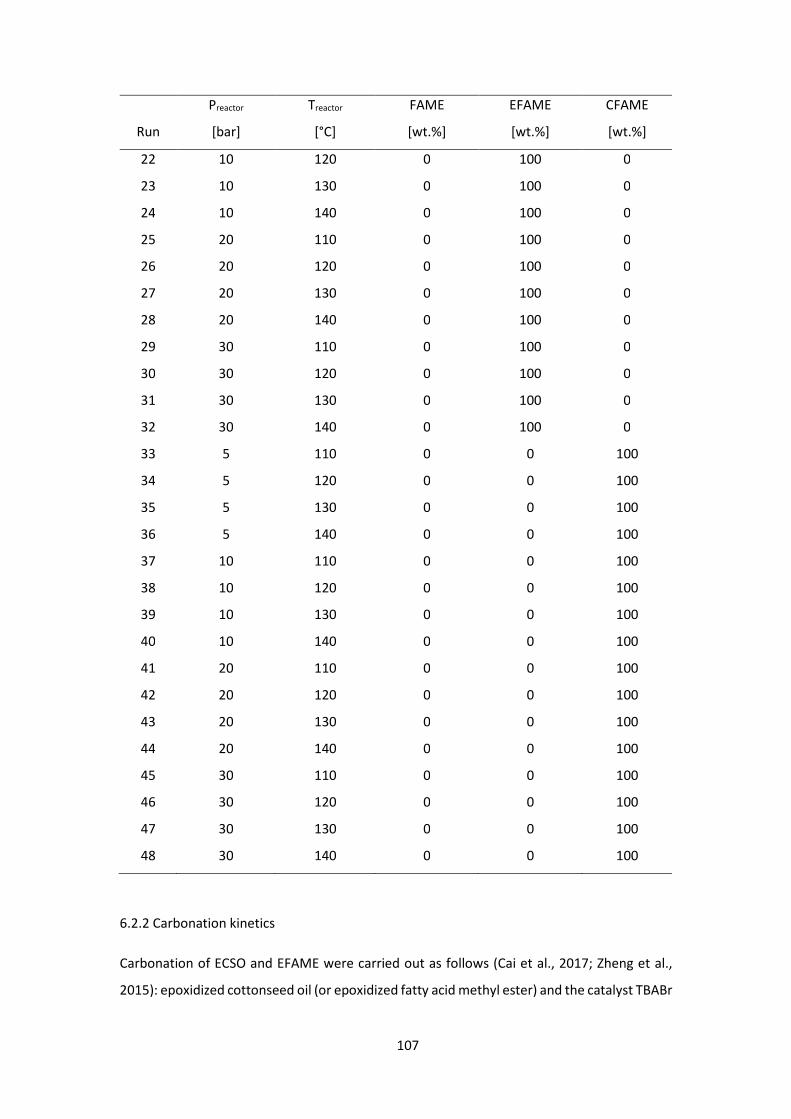
107
Run
Preactor
[bar]
Treactor
[°C]
FAME
[wt.%]
EFAME
[wt.%]
CFAME
[wt.%]
22 10 120 0 100 0
23 10 130 0 100 0
24 10 140 0 100 0
25 20 110 0 100 0
26 20 120 0 100 0
27 20 130 0 100 0
28 20 140 0 100 0
29 30 110 0 100 0
30 30 120 0 100 0
31 30 130 0 100 0
32 30 140 0 100 0
33 5 110 0 0 100
34 5 120 0 0 100
35 5 130 0 0 100
36 5 140 0 0 100
37 10 110 0 0 100
38 10 120 0 0 100
39 10 130 0 0 100
40 10 140 0 0 100
41 20 110 0 0 100
42 20 120 0 0 100
43 20 130 0 0 100
44 20 140 0 0 100
45 30 110 0 0 100
46 30 120 0 0 100
47 30 130 0 0 100
48 30 140 0 0 100
6.2.2 Carbonation kinetics
Carbonation of ECSO and EFAME were carried out as follows (Cai et al., 2017; Zheng et al.,
2015): epoxidized cottonseed oil (or epoxidized fatty acid methyl ester) and the catalyst TBABr
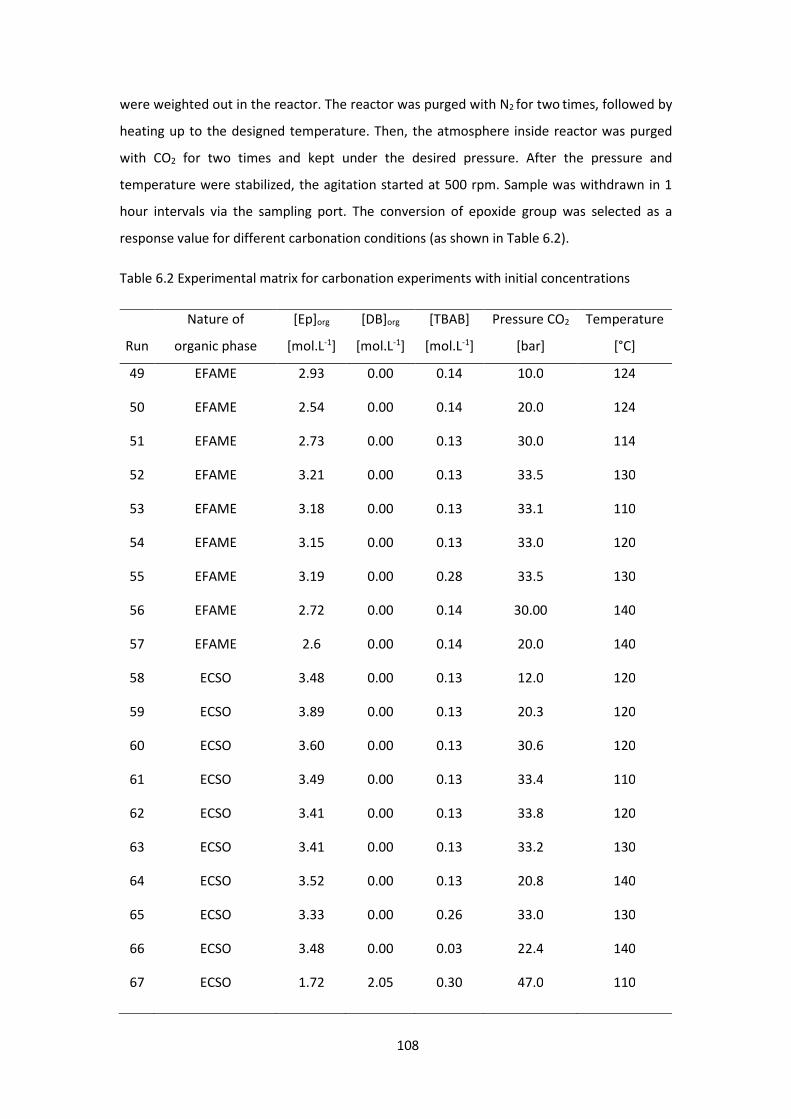
108
were weighted out in the reactor. The reactor was purged with N2 for two times, followed by
heating up to the designed temperature. Then, the atmosphere inside reactor was purged
with CO2 for two times and kept under the desired pressure. After the pressure and
temperature were stabilized, the agitation started at 500 rpm. Sample was withdrawn in 1
hour intervals via the sampling port. The conversion of epoxide group was selected as a
response value for different carbonation conditions (as shown in Table 6.2).
Table 6.2 Experimental matrix for carbonation experiments with initial concentrations
Run
Nature of
organic phase
[Ep]org
[mol.L-1]
[DB]org
[mol.L-1]
[TBAB]
[mol.L-1]
Pressure CO2
[bar]
Temperature
[°C]
49 EFAME 2.93 0.00 0.14 10.0 124
50 EFAME 2.54 0.00 0.14 20.0 124
51 EFAME 2.73 0.00 0.13 30.0 114
52 EFAME 3.21 0.00 0.13 33.5 130
53 EFAME 3.18 0.00 0.13 33.1 110
54 EFAME 3.15 0.00 0.13 33.0 120
55 EFAME 3.19 0.00 0.28 33.5 130
56 EFAME 2.72 0.00 0.14 30.00 140
57 EFAME 2.6 0.00 0.14 20.0 140
58 ECSO 3.48 0.00 0.13 12.0 120
59 ECSO 3.89 0.00 0.13 20.3 120
60 ECSO 3.60 0.00 0.13 30.6 120
61 ECSO 3.49 0.00 0.13 33.4 110
62 ECSO 3.41 0.00 0.13 33.8 120
63 ECSO 3.41 0.00 0.13 33.2 130
64 ECSO 3.52 0.00 0.13 20.8 140
65 ECSO 3.33 0.00 0.26 33.0 130
66 ECSO 3.48 0.00 0.03 22.4 140
67 ECSO 1.72 2.05 0.30 47.0 110
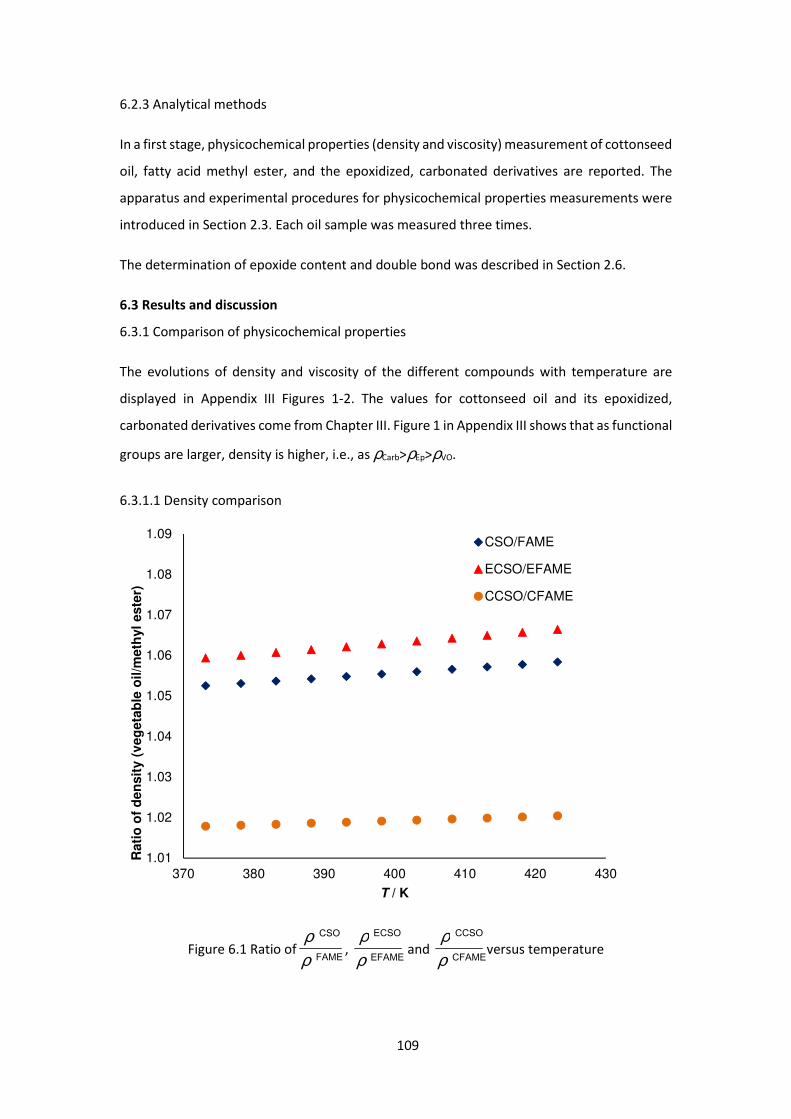
109
6.2.3 Analytical methods
In a first stage, physicochemical properties (density and viscosity) measurement of cottonseed
oil, fatty acid methyl ester, and the epoxidized, carbonated derivatives are reported. The
apparatus and experimental procedures for physicochemical properties measurements were
introduced in Section 2.3. Each oil sample was measured three times.
The determination of epoxide content and double bond was described in Section 2.6.
6.3 Results and discussion
6.3.1 Comparison of physicochemical properties
The evolutions of density and viscosity of the different compounds with temperature are
displayed in Appendix III Figures 1-2. The values for cottonseed oil and its epoxidized,
carbonated derivatives come from Chapter III. Figure 1 in Appendix III shows that as functional
groups are larger, density is higher, i.e., as ρCarb>ρEp>ρVO.
6.3.1.1 Density comparison
Figure 6.1 Ratio ofFAME
CSO
ρρ
, EFAME
ECSO
ρρ
and CFAME
CCSO
ρρ
versus temperature
1.01
1.02
1.03
1.04
1.05
1.06
1.07
1.08
1.09
370 380 390 400 410 420 430
Rati
o o
f d
en
sit
y (
veg
eta
ble
oil/m
eth
yl
este
r)
T / K
CSO/FAME
ECSO/EFAME
CCSO/CFAME
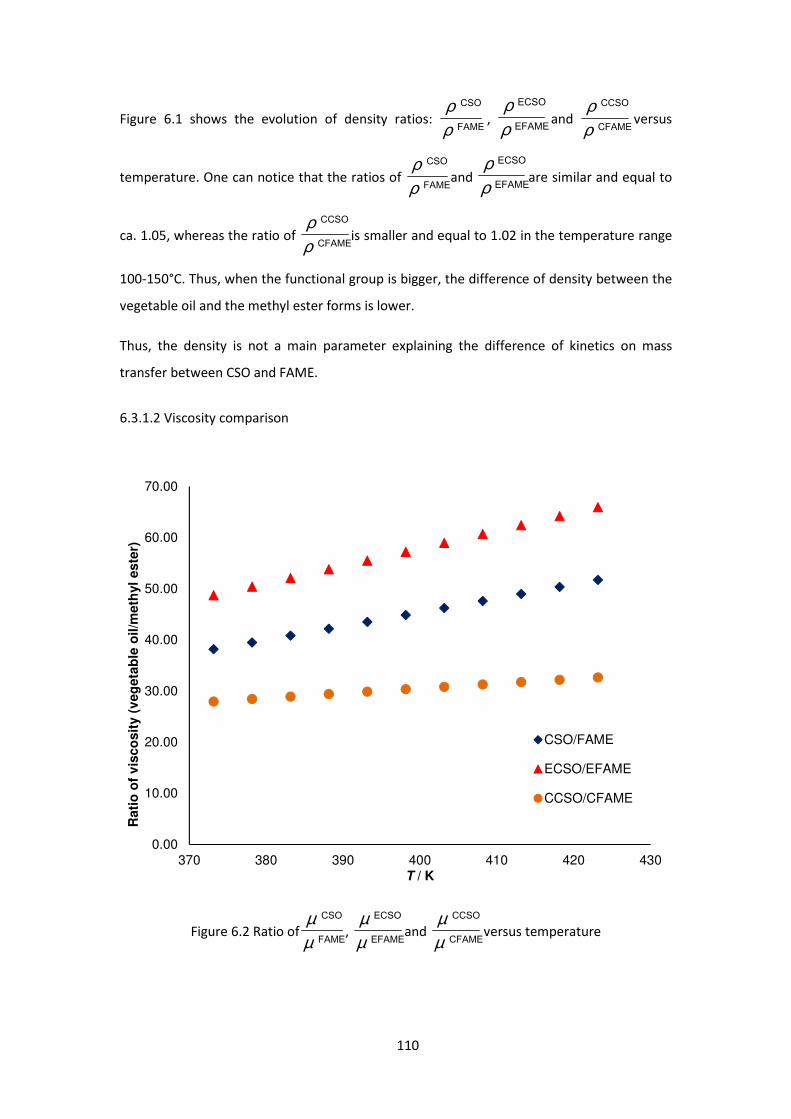
110
Figure 6.1 shows the evolution of density ratios: FAME
CSO
ρρ
, EFAME
ECSO
ρρ
and CFAME
CCSO
ρρ
versus
temperature. One can notice that the ratios of FAME
CSO
ρρ
and EFAME
ECSO
ρρ
are similar and equal to
ca. 1.05, whereas the ratio of CFAME
CCSO
ρρ
is smaller and equal to 1.02 in the temperature range
100-150°C. Thus, when the functional group is bigger, the difference of density between the
vegetable oil and the methyl ester forms is lower.
Thus, the density is not a main parameter explaining the difference of kinetics on mass
transfer between CSO and FAME.
6.3.1.2 Viscosity comparison
Figure 6.2 Ratio ofFAME
CSO
µµ
, EFAME
ECSO
µµ
and CFAME
CCSO
µµ
versus temperature
0.00
10.00
20.00
30.00
40.00
50.00
60.00
70.00
370 380 390 400 410 420 430
Rati
o o
f v
isco
sit
y (
veg
eta
ble
oil/m
eth
yl
este
r)
T / K
CSO/FAME
ECSO/EFAME
CCSO/CFAME
111
Figure 6.2 shows the evolution of viscosity ratios: FAME
CSO
µµ
, EFAME
ECSO
µµ
and CFAME
CCSO
µµ
versus
temperature. Unlike density behavior, the viscosity difference between vegetable oil and
methyl ester derivatives is more pronounced. We clearly notice that viscosity of vegetable oil
and its derivatives can be 20 to 40 times higher than the corresponding methyl ester and its
derivatives. This difference illustrated the benefit of using fatty acid methyl ester instead of
vegetable oil from a mixing viewpoint.
In case of mixture, the following correlations were used to determine the viscosity and density
(Cai et al., 2017):
CFAMECFAMEEFAMEEFAMEFAMEFAMEmixing ρρρρ ×+×+×= www (6.1)
CFAMECFAMEEFAMEEFAMEFAMEFAMEmixing µµµµ lnlnlnln ×+×+×= www (6.2)
where, wj is the weight percentage of the compound in mass fraction, wt.%;
6.3.2 Mass transfer comparison
As described in Chapter V, this stage is designed to measure the solubility of CO2 in the
reaction mixture. For that, two mass transfer parameters should be evaluated with the
variation of functional groups, CO2 pressure and temperature: Henry’s constant and global
mass transfer coefficient from the liquid side.
During the experiments, the pressure inside the reactor was maintained constant by using a
pressure regulator, and the decrease of pressure inside the reservoir was monitored. The
same treatment described in the previous Chapter V was applied in this mass transfer study.
The Whitman model was used to describe the mass transfer phenomenon (Charpentier, 1981).
Experiments were performed in absence of catalyst to avoid any chemical reaction. The
amount of CO2 absorbed in the reaction mixture was assumed to be the same as the ones
disappeared from the gas reservoir. Peng-Robinson equation of state was applied to
determine the number of moles of CO2 in the gas phase.
The mass balance of the components in the liquid phase can be described as
[ ]0=
t dEp d (6.3)
[ ]0=
t dCarb d (6.4)
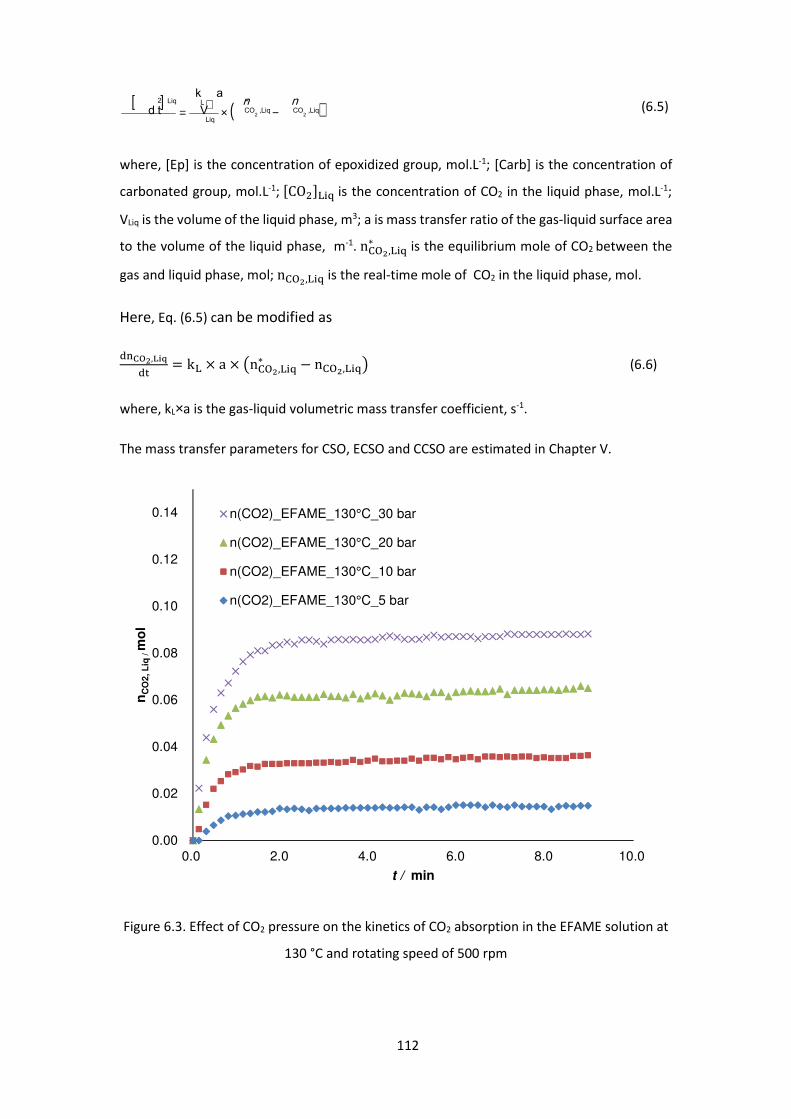
112
[ ] ( )Liq,CO*
Liq,COLiq
LLiq222V
akt d
CO dnn −×
⋅= (6.5)
where, [Ep] is the concentration of epoxidized group, mol.L-1; [Carb] is the concentration of
carbonated group, mol.L-1; �CO z²+ is the concentration of CO2 in the liquid phase, mol.L-1;
VLiq is the volume of the liquid phase, m3; a is mass transfer ratio of the gas-liquid surface area
to the volume of the liquid phase, m-1. na�#,z²+∗ is the equilibrium mole of CO2 between the
gas and liquid phase, mol; na�#,z²+is the real-time mole of CO2 in the liquid phase, mol.
Here, Eq. (6.5) can be modified as
DÛÞ3#,ß��DE = kz × a × Pna�#,z²+∗ − na�#,z²+S (6.6)
where, kL×a is the gas-liquid volumetric mass transfer coefficient, s-1.
The mass transfer parameters for CSO, ECSO and CCSO are estimated in Chapter V.
Figure 6.3. Effect of CO2 pressure on the kinetics of CO2 absorption in the EFAME solution at
130 °C and rotating speed of 500 rpm
0.00
0.02
0.04
0.06
0.08
0.10
0.12
0.14
0.0 2.0 4.0 6.0 8.0 10.0
nC
O2, L
iq / m
ol
t / min
n(CO2)_EFAME_130°C_30 bar
n(CO2)_EFAME_130°C_20 bar
n(CO2)_EFAME_130°C_10 bar
n(CO2)_EFAME_130°C_5 bar
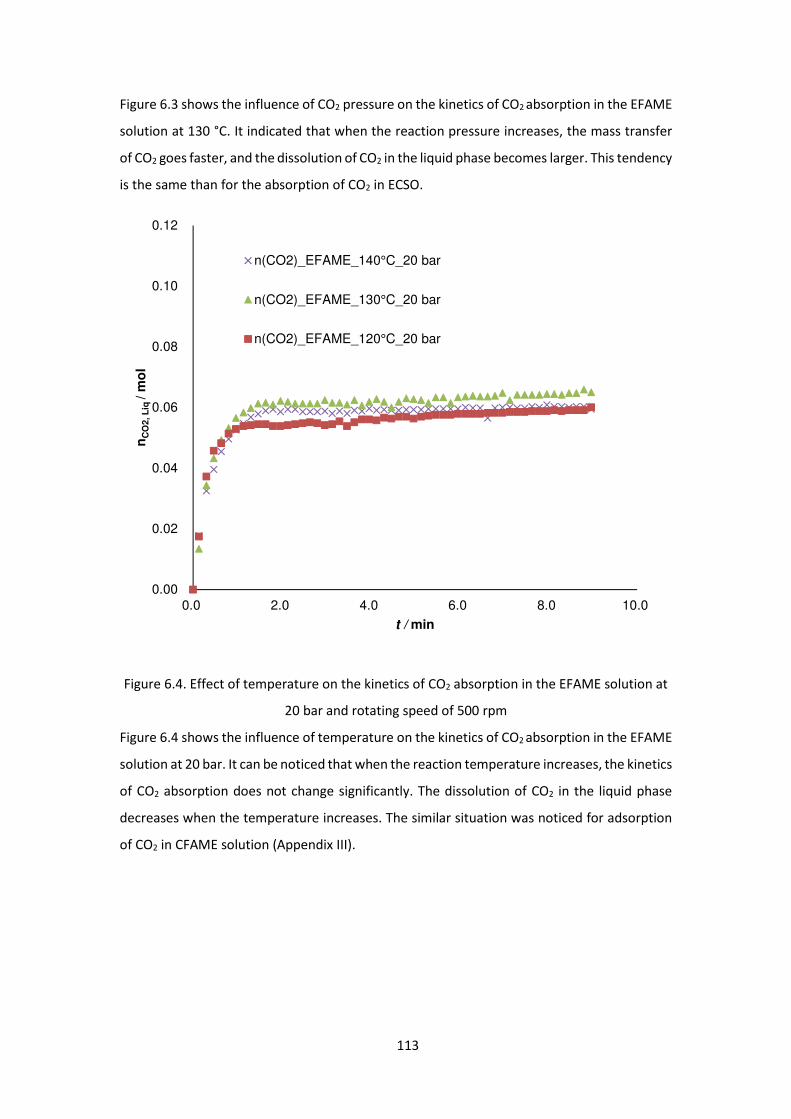
113
Figure 6.3 shows the influence of CO2 pressure on the kinetics of CO2 absorption in the EFAME
solution at 130 °C. It indicated that when the reaction pressure increases, the mass transfer
of CO2 goes faster, and the dissolution of CO2 in the liquid phase becomes larger. This tendency
is the same than for the absorption of CO2 in ECSO.
Figure 6.4. Effect of temperature on the kinetics of CO2 absorption in the EFAME solution at
20 bar and rotating speed of 500 rpm
Figure 6.4 shows the influence of temperature on the kinetics of CO2 absorption in the EFAME
solution at 20 bar. It can be noticed that when the reaction temperature increases, the kinetics
of CO2 absorption does not change significantly. The dissolution of CO2 in the liquid phase
decreases when the temperature increases. The similar situation was noticed for adsorption
of CO2 in CFAME solution (Appendix III).
0.00
0.02
0.04
0.06
0.08
0.10
0.12
0.0 2.0 4.0 6.0 8.0 10.0
nC
O2, L
iq /
mo
l
t / min
n(CO2)_EFAME_140°C_20 bar
n(CO2)_EFAME_130°C_20 bar
n(CO2)_EFAME_120°C_20 bar
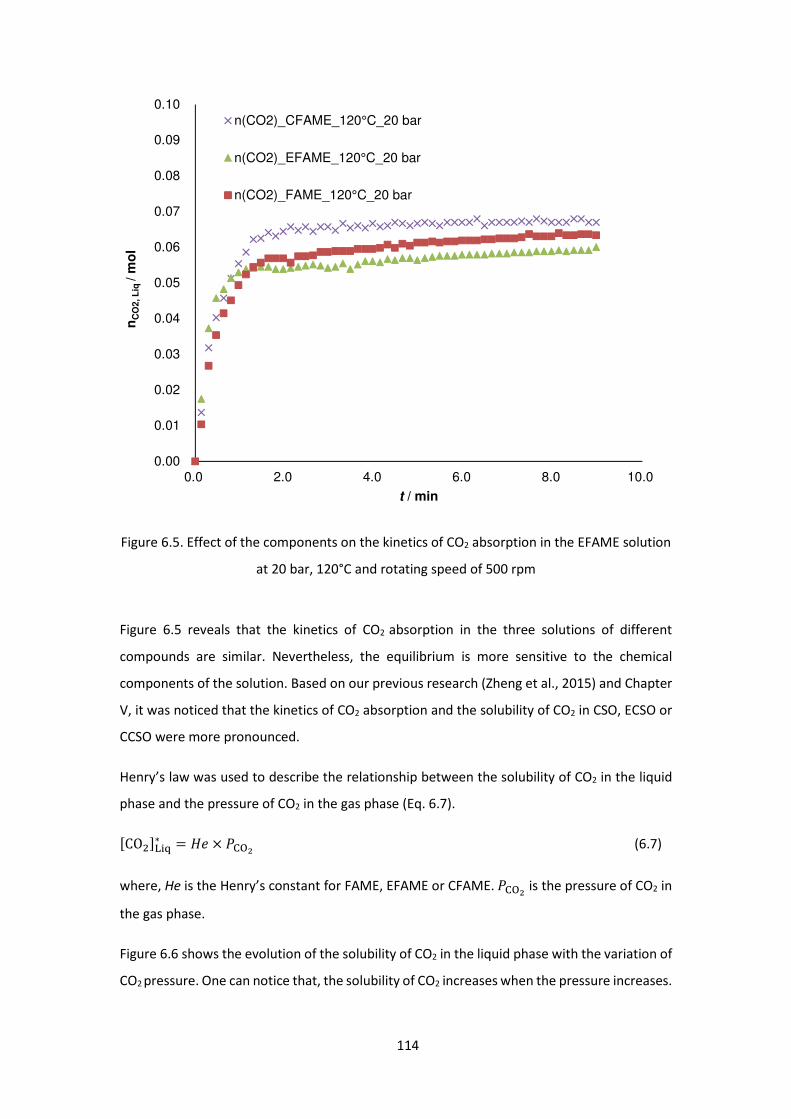
114
Figure 6.5. Effect of the components on the kinetics of CO2 absorption in the EFAME solution
at 20 bar, 120°C and rotating speed of 500 rpm
Figure 6.5 reveals that the kinetics of CO2 absorption in the three solutions of different
compounds are similar. Nevertheless, the equilibrium is more sensitive to the chemical
components of the solution. Based on our previous research (Zheng et al., 2015) and Chapter
V, it was noticed that the kinetics of CO2 absorption and the solubility of CO2 in CSO, ECSO or
CCSO were more pronounced.
Henry’s law was used to describe the relationship between the solubility of CO2 in the liquid
phase and the pressure of CO2 in the gas phase (Eq. 6.7).
�CO z²+∗ = xy × àa�# (6.7)
where, He is the Henry’s constant for FAME, EFAME or CFAME. àa�# is the pressure of CO2 in
the gas phase.
Figure 6.6 shows the evolution of the solubility of CO2 in the liquid phase with the variation of
CO2 pressure. One can notice that, the solubility of CO2 increases when the pressure increases.
0.00
0.01
0.02
0.03
0.04
0.05
0.06
0.07
0.08
0.09
0.10
0.0 2.0 4.0 6.0 8.0 10.0
nC
O2, L
iq /
mo
l
t / min
n(CO2)_CFAME_120°C_20 bar
n(CO2)_EFAME_120°C_20 bar
n(CO2)_FAME_120°C_20 bar
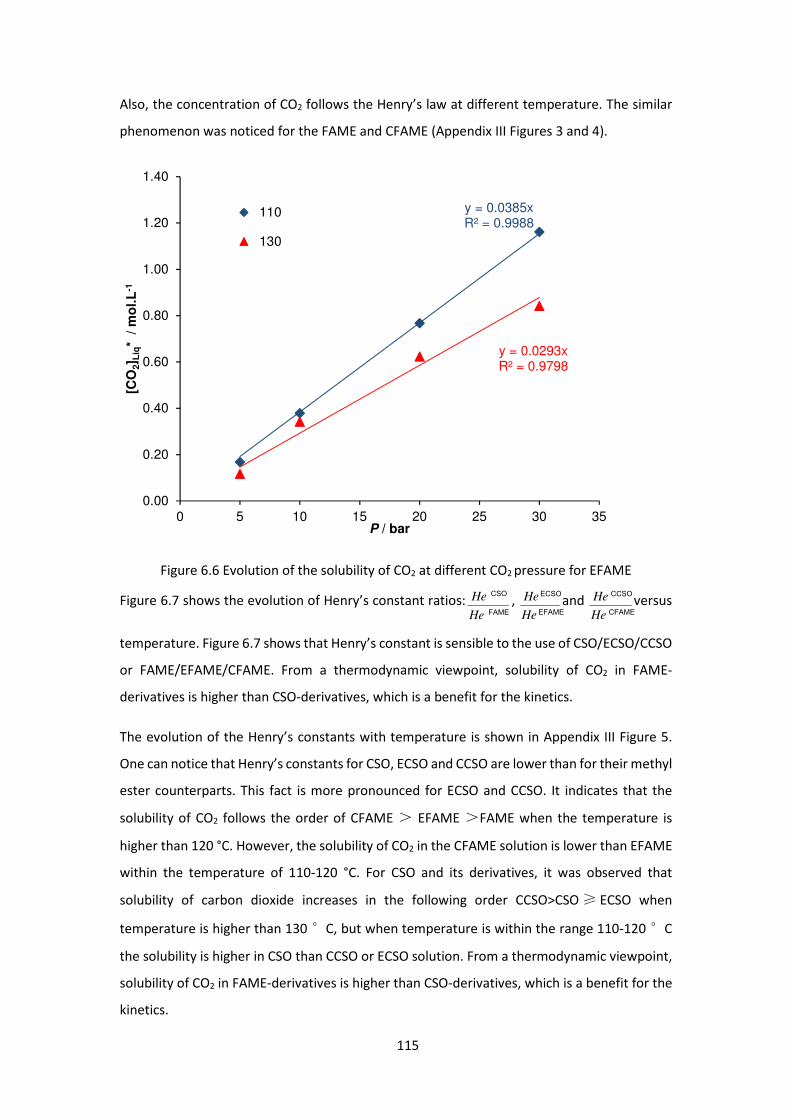
115
Also, the concentration of CO2 follows the Henry’s law at different temperature. The similar
phenomenon was noticed for the FAME and CFAME (Appendix III Figures 3 and 4).
Figure 6.6 Evolution of the solubility of CO2 at different CO2 pressure for EFAME
Figure 6.7 shows the evolution of Henry’s constant ratios:FAME
CSO
He
He , EFAME
ECSO
He
He and CFAME
CCSO
He
He versus
temperature. Figure 6.7 shows that Henry’s constant is sensible to the use of CSO/ECSO/CCSO
or FAME/EFAME/CFAME. From a thermodynamic viewpoint, solubility of CO2 in FAME-
derivatives is higher than CSO-derivatives, which is a benefit for the kinetics.
The evolution of the Henry’s constants with temperature is shown in Appendix III Figure 5.
One can notice that Henry’s constants for CSO, ECSO and CCSO are lower than for their methyl
ester counterparts. This fact is more pronounced for ECSO and CCSO. It indicates that the
solubility of CO2 follows the order of CFAME > EFAME >FAME when the temperature is
higher than 120 °C. However, the solubility of CO2 in the CFAME solution is lower than EFAME
within the temperature of 110-120 °C. For CSO and its derivatives, it was observed that
solubility of carbon dioxide increases in the following order CCSO>CSO ≥ ECSO when
temperature is higher than 130 °C, but when temperature is within the range 110-120 °C
the solubility is higher in CSO than CCSO or ECSO solution. From a thermodynamic viewpoint,
solubility of CO2 in FAME-derivatives is higher than CSO-derivatives, which is a benefit for the
kinetics.
y = 0.0385xR² = 0.9988
y = 0.0293xR² = 0.9798
0.00
0.20
0.40
0.60
0.80
1.00
1.20
1.40
0 5 10 15 20 25 30 35
[CO
2] L
iq*
/ m
ol.L
-1
P / bar
110
130
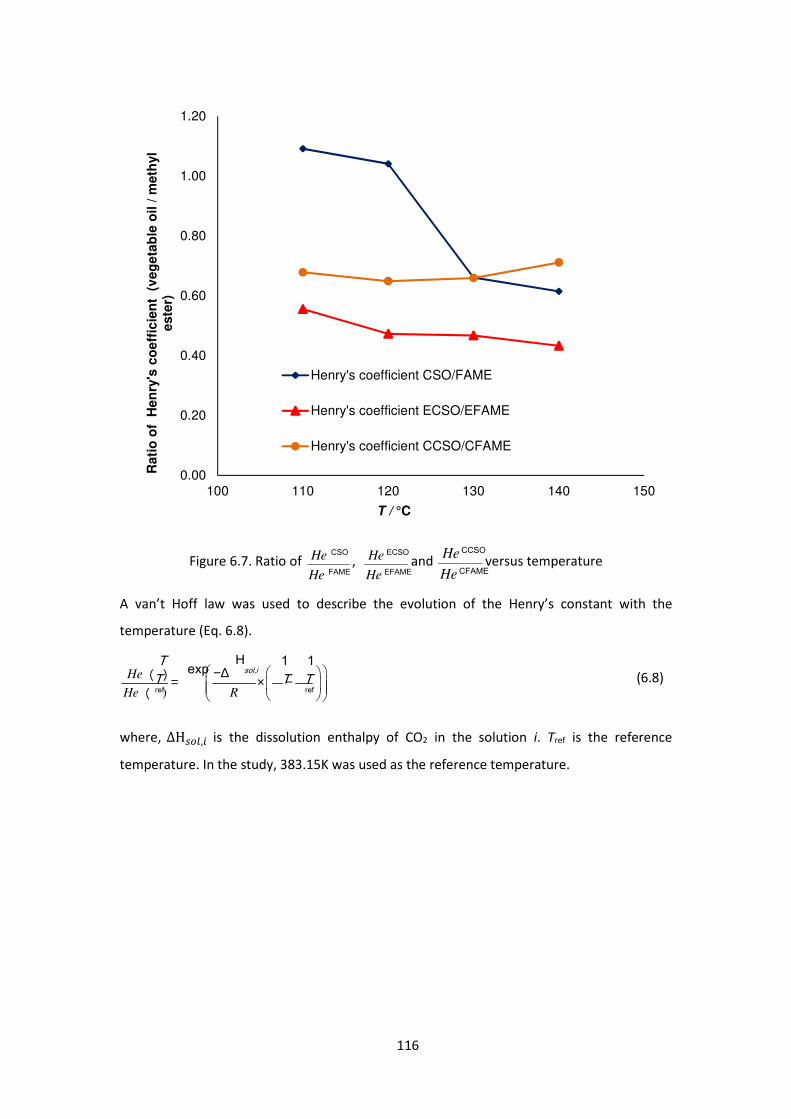
116
Figure 6.7. Ratio of FAME
CSO
He
He , EFAME
ECSO
He
He and CFAME
CCSO
He
Heversus temperature
A van’t Hoff law was used to describe the evolution of the Henry’s constant with the
temperature (Eq. 6.8).
)
He
He R
−∆ = × −
ref ref
H( ) 1 1exp
( sol,iT
T T T (6.8)
where, ∆HCáâ,B is the dissolution enthalpy of CO2 in the solution i. Tref is the reference
temperature. In the study, 383.15K was used as the reference temperature.
0.00
0.20
0.40
0.60
0.80
1.00
1.20
100 110 120 130 140 150
Rati
o o
f H
en
ry's
co
eff
icie
nt
(v
eg
eta
ble
oil /
meth
yl
este
r)
T / °C
Henry's coefficient CSO/FAME
Henry's coefficient ECSO/EFAME
Henry's coefficient CCSO/CFAME
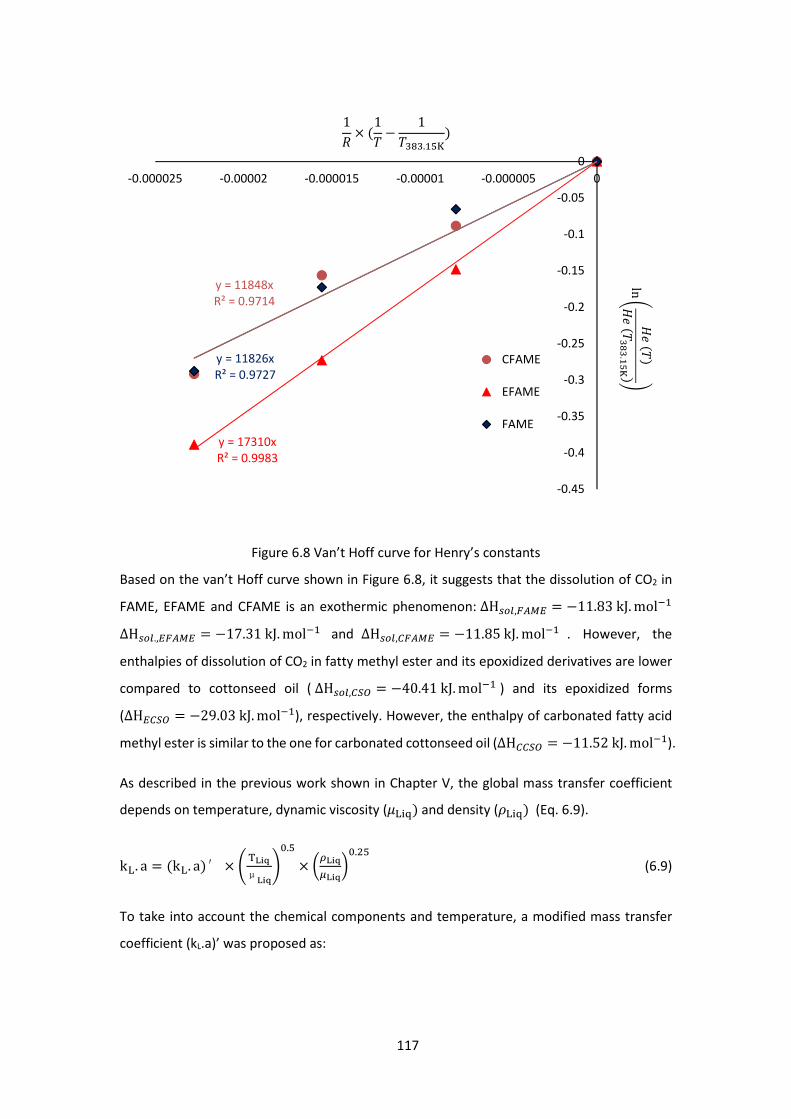
117
Figure 6.8 Van’t Hoff curve for Henry’s constants
Based on the van’t Hoff curve shown in Figure 6.8, it suggests that the dissolution of CO2 in
FAME, EFAME and CFAME is an exothermic phenomenon: ∆HCáâ,ã?äµ = −11.83kJ.mol@4
∆HCáâ.,µã?äµ = −17.31kJ.mol@4 and ∆HCáâ,=ã?äµ = −11.85kJ.mol@4 . However, the
enthalpies of dissolution of CO2 in fatty methyl ester and its epoxidized derivatives are lower
compared to cottonseed oil ( ∆HCáâ,=¶· = −40.41kJ.mol@4 ) and its epoxidized forms
(∆Hµ=¶· = −29.03kJ.mol@4), respectively. However, the enthalpy of carbonated fatty acid
methyl ester is similar to the one for carbonated cottonseed oil (∆H==¶· = −11.52kJ.mol@4).
As described in the previous work shown in Chapter V, the global mass transfer coefficient
depends on temperature, dynamic viscosity (ìz²+O and density (oz²+O (Eq. 6.9).
kz. a = Mkz. aO′ × ��ß��μß���
�.u × |íß��îß����. u
(6.9)
To take into account the chemical components and temperature, a modified mass transfer
coefficient (kL.a)’ was proposed as:
y = 11848xR² = 0.9714
y = 17310xR² = 0.9983
y = 11826xR² = 0.9727
-0.45
-0.4
-0.35
-0.3
-0.25
-0.2
-0.15
-0.1
-0.05
0
-0.000025 -0.00002 -0.000015 -0.00001 -0.000005 0
CFAME
EFAME
FAME
1� × M1f − 1f(t(.4u�Oln
xyfxyf(t(.4u�
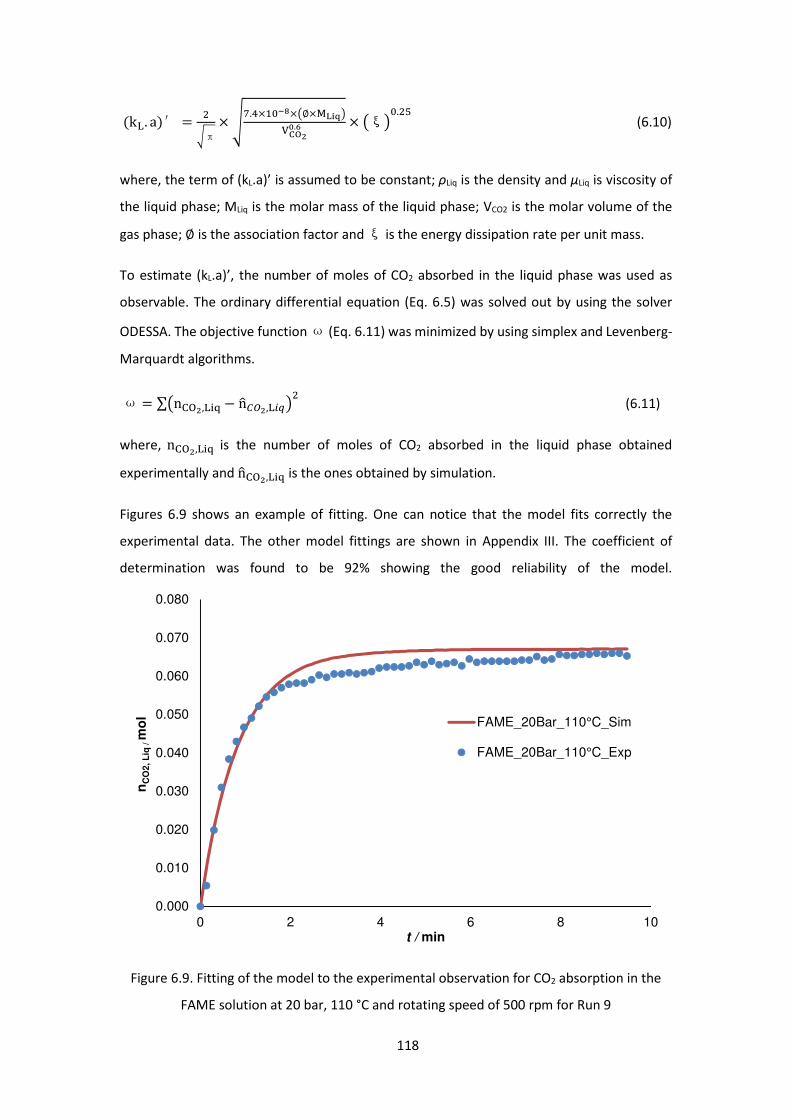
118
Mkz. aO′ = 8π ×ï�.7×4�
0ð×P∅×�ß��S�Þ3#�.ò × PξS�. u (6.10)
where, the term of (kL.a)’ is assumed to be constant; ρLiq is the density and μLiq is viscosity of
the liquid phase; MLiq is the molar mass of the liquid phase; VCO2 is the molar volume of the
gas phase; ∅ is the association factor and ξ is the energy dissipation rate per unit mass.
To estimate (kL.a)’, the number of moles of CO2 absorbed in the liquid phase was used as
observable. The ordinary differential equation (Eq. 6.5) was solved out by using the solver
ODESSA. The objective function ω (Eq. 6.11) was minimized by using simplex and Levenberg-
Marquardt algorithms.
ω = ∑Pna�#,z²+ − nó=·#,zBôS (6.11)
where, na�#,z²+ is the number of moles of CO2 absorbed in the liquid phase obtained
experimentally and nóa�#,z²+ is the ones obtained by simulation.
Figures 6.9 shows an example of fitting. One can notice that the model fits correctly the
experimental data. The other model fittings are shown in Appendix III. The coefficient of
determination was found to be 92% showing the good reliability of the model.
Figure 6.9. Fitting of the model to the experimental observation for CO2 absorption in the
FAME solution at 20 bar, 110 °C and rotating speed of 500 rpm for Run 9
0.000
0.010
0.020
0.030
0.040
0.050
0.060
0.070
0.080
0 2 4 6 8 10
nC
O2, L
iq / m
ol
t / min
FAME_20Bar_110°C_Sim
FAME_20Bar_110°C_Exp
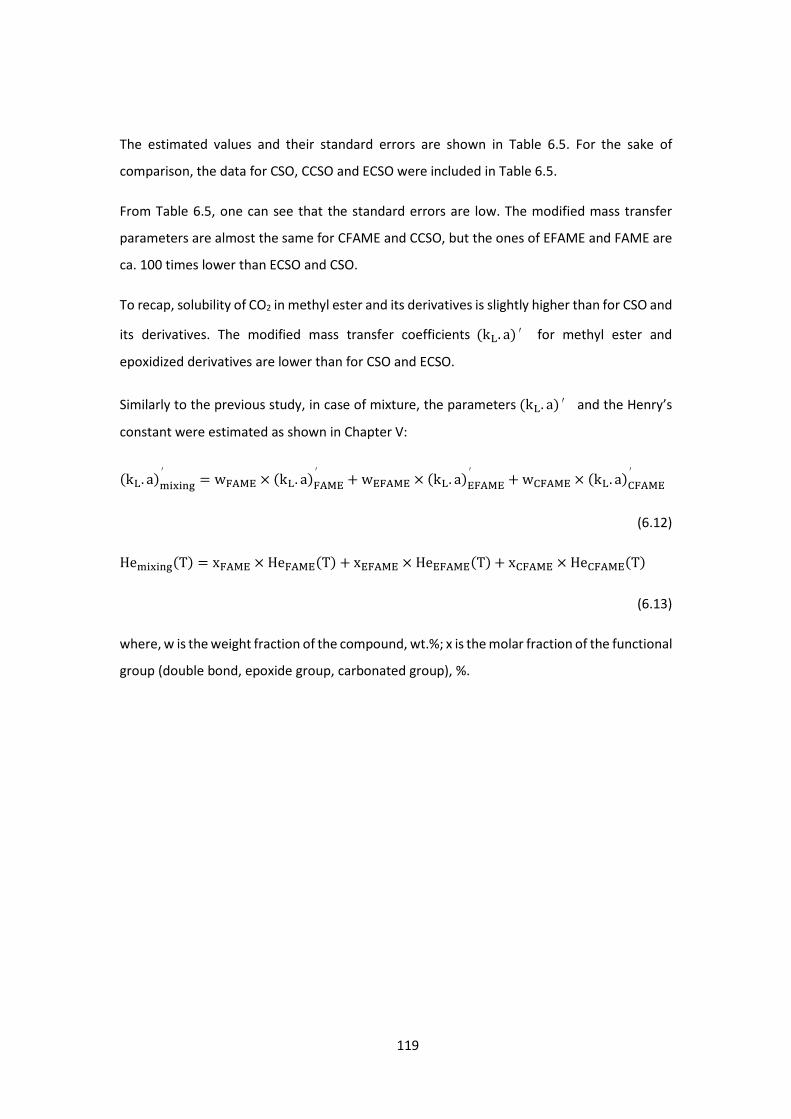
119
The estimated values and their standard errors are shown in Table 6.5. For the sake of
comparison, the data for CSO, CCSO and ECSO were included in Table 6.5.
From Table 6.5, one can see that the standard errors are low. The modified mass transfer
parameters are almost the same for CFAME and CCSO, but the ones of EFAME and FAME are
ca. 100 times lower than ECSO and CSO.
To recap, solubility of CO2 in methyl ester and its derivatives is slightly higher than for CSO and
its derivatives. The modified mass transfer coefficients Mkz. aO′ for methyl ester and
epoxidized derivatives are lower than for CSO and ECSO.
Similarly to the previous study, in case of mixture, the parameters Mkz. aO′ and the Henry’s
constant were estimated as shown in Chapter V:
Mkz. aOõ²Ù²Û�′ = w���Q × Mkz. aO���Q′ +wQ���Q × Mkz. aOQ���Q′ +wa���Q × Mkz. aOa���Q′
(6.12)
Heõ²Ù²Û�MTO = x���Q × He���QMTO + xQ���Q × HeQ���QMTO + xa���Q × Hea���QMTO (6.13)
where, w is the weight fraction of the compound, wt.%; x is the molar fraction of the functional
group (double bond, epoxide group, carbonated group), %.
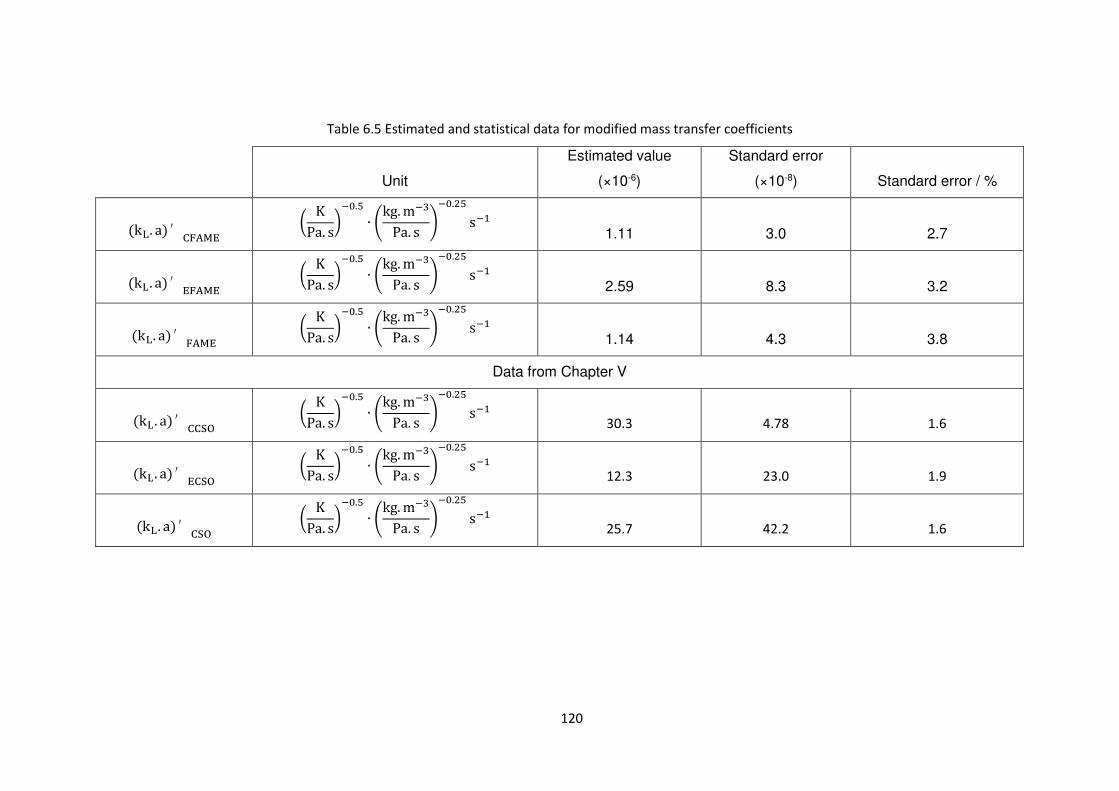
120
Table 6.5 Estimated and statistical data for modified mass transfer coefficients
Unit
Estimated value
(×10-6)
Standard error
(×10-8) Standard error / %
Mkz. aO′a���Q | KPa. s�@�.u ∙ �kg.m@(Pa. s �
@�. u s@4 1.11 3.0 2.7
Mkz. aO′Q���Q | KPa. s�@�.u ∙ �kg.m@(Pa. s �
@�. u s@4 2.59 8.3 3.2
Mkz. aO′���Q | KPa. s�@�.u ∙ �kg.m@(Pa. s �
@�. u s@4 1.14 4.3 3.8
Data from Chapter V
Mkz. aO′aa9� | KPa. s�@�.u ∙ �kg.m@(Pa. s �
@�. u s@4 30.3 4.78 1.6
Mkz. aO′Qa9� | KPa. s�@�.u ∙ �kg.m@(Pa. s �
@�. u s@4 12.3 23.0 1.9
Mkz. aO′a9� | KPa. s�@�.u ∙ �kg.m@(Pa. s �
@�. u s@4 25.7 42.2 1.6
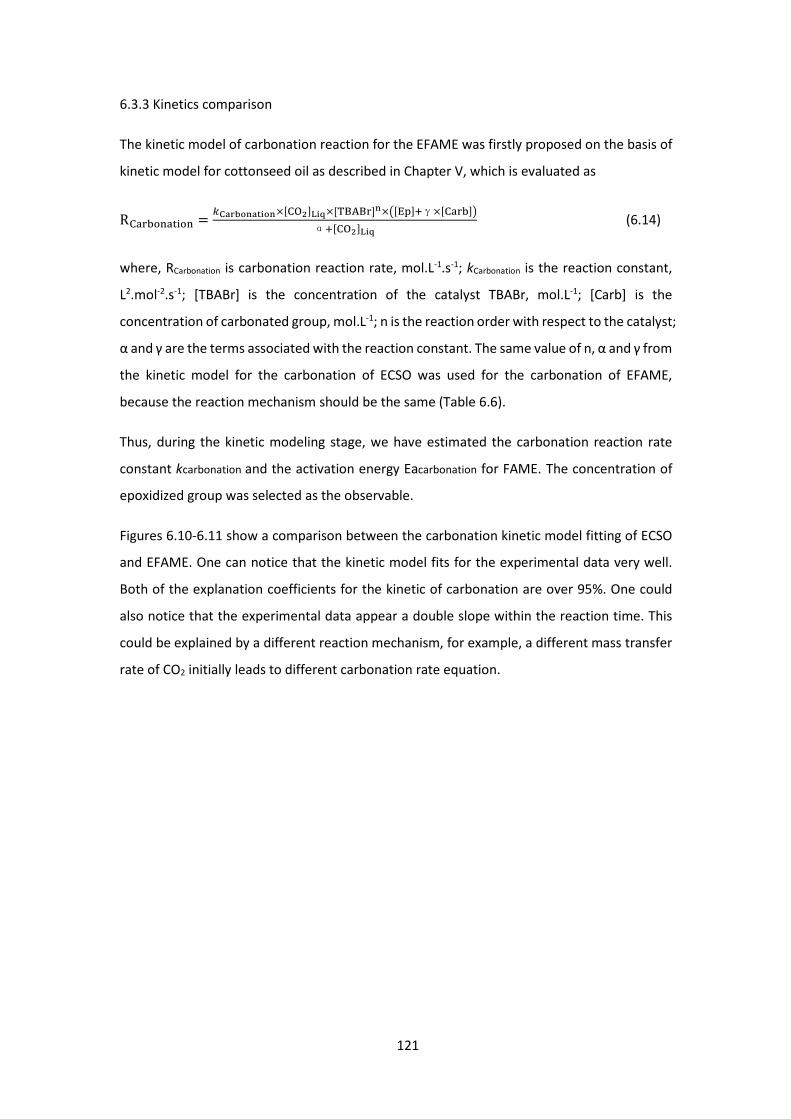
121
6.3.3 Kinetics comparison
The kinetic model of carbonation reaction for the EFAME was firstly proposed on the basis of
kinetic model for cottonseed oil as described in Chapter V, which is evaluated as
Ra*��Û*E²Û = .Þ�W�V����V�×�a�#ß��×��U�U��×P�QR)γ×�a*��Sα)�a�#ß�� (6.14)
where, RCarbonation is carbonation reaction rate, mol.L-1.s-1; kCarbonation is the reaction constant,
L2.mol-2.s-1; [TBABr] is the concentration of the catalyst TBABr, mol.L-1; [Carb] is the
concentration of carbonated group, mol.L-1; n is the reaction order with respect to the catalyst;
α and γ are the terms associated with the reaction constant. The same value of n, α and γ from
the kinetic model for the carbonation of ECSO was used for the carbonation of EFAME,
because the reaction mechanism should be the same (Table 6.6).
Thus, during the kinetic modeling stage, we have estimated the carbonation reaction rate
constant kcarbonation and the activation energy Eacarbonation for FAME. The concentration of
epoxidized group was selected as the observable.
Figures 6.10-6.11 show a comparison between the carbonation kinetic model fitting of ECSO
and EFAME. One can notice that the kinetic model fits for the experimental data very well.
Both of the explanation coefficients for the kinetic of carbonation are over 95%. One could
also notice that the experimental data appear a double slope within the reaction time. This
could be explained by a different reaction mechanism, for example, a different mass transfer
rate of CO2 initially leads to different carbonation rate equation.
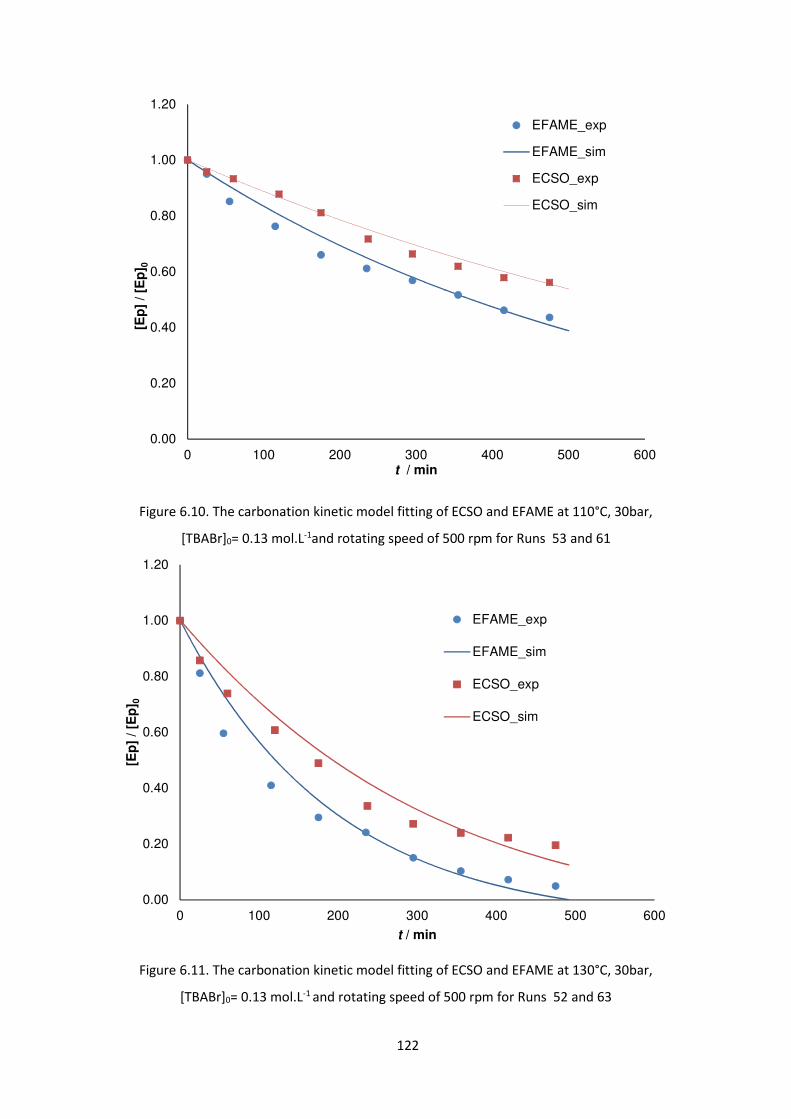
122
Figure 6.10. The carbonation kinetic model fitting of ECSO and EFAME at 110°C, 30bar,
[TBABr]0= 0.13 mol.L-1and rotating speed of 500 rpm for Runs 53 and 61
Figure 6.11. The carbonation kinetic model fitting of ECSO and EFAME at 130°C, 30bar,
[TBABr]0= 0.13 mol.L-1 and rotating speed of 500 rpm for Runs 52 and 63
0.00
0.20
0.40
0.60
0.80
1.00
1.20
0 100 200 300 400 500 600
[Ep
] / [E
p] 0
t / min
EFAME_exp
EFAME_sim
ECSO_exp
ECSO_sim
0.00
0.20
0.40
0.60
0.80
1.00
1.20
0 100 200 300 400 500 600
[Ep
] / [E
p] 0
t / min
EFAME_exp
EFAME_sim
ECSO_exp
ECSO_sim
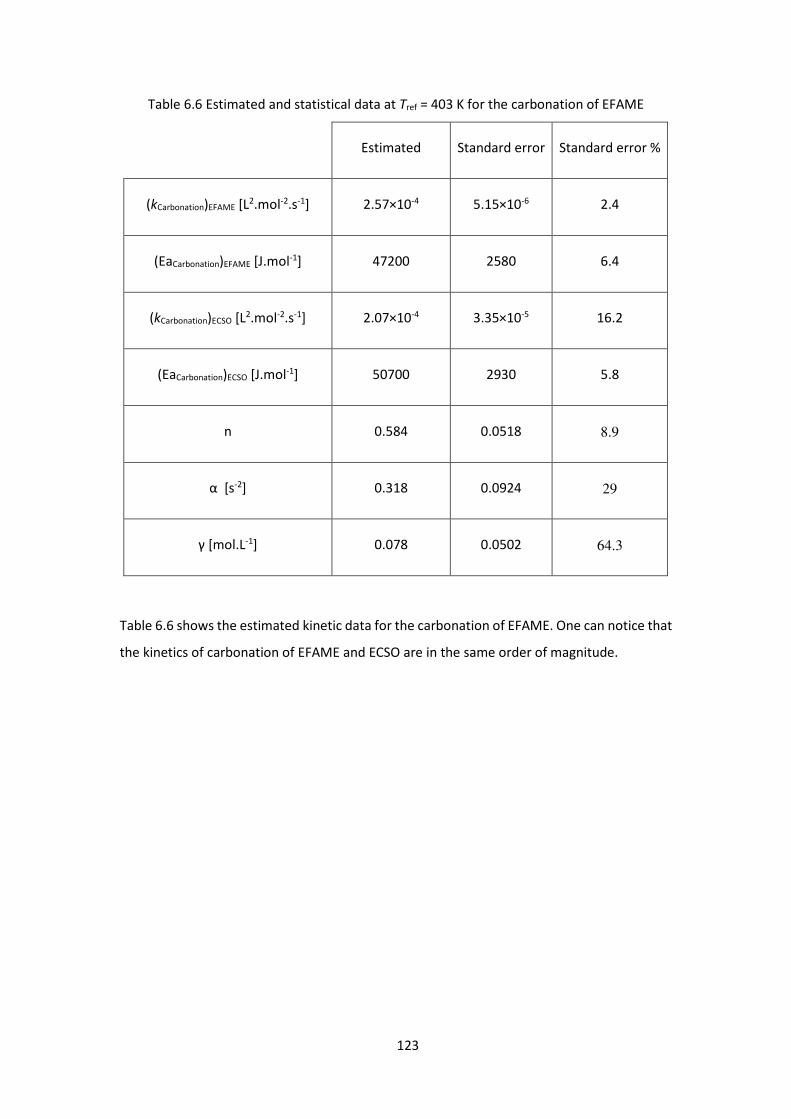
123
Table 6.6 Estimated and statistical data at Tref = 403 K for the carbonation of EFAME
Estimated Standard error Standard error %
(kCarbonation)EFAME [L2.mol-2.s-1] 2.57×10⁻⁴ 5.15×10⁻⁶ 2.4
(EaCarbonation)EFAME [J.mol-1] 47200 2580 6.4
(kCarbonation)ECSO [L2.mol-2.s-1] 2.07×10⁻⁴ 3.35×10⁻⁵ 16.2
(EaCarbonation)ECSO [J.mol-1] 50700 2930 5.8
n 0.584 0.0518 8.9
α [s-2] 0.318 0.0924 29
γ [mol.L-1] 0.078 0.0502 64.3
Table 6.6 shows the estimated kinetic data for the carbonation of EFAME. One can notice that
the kinetics of carbonation of EFAME and ECSO are in the same order of magnitude.
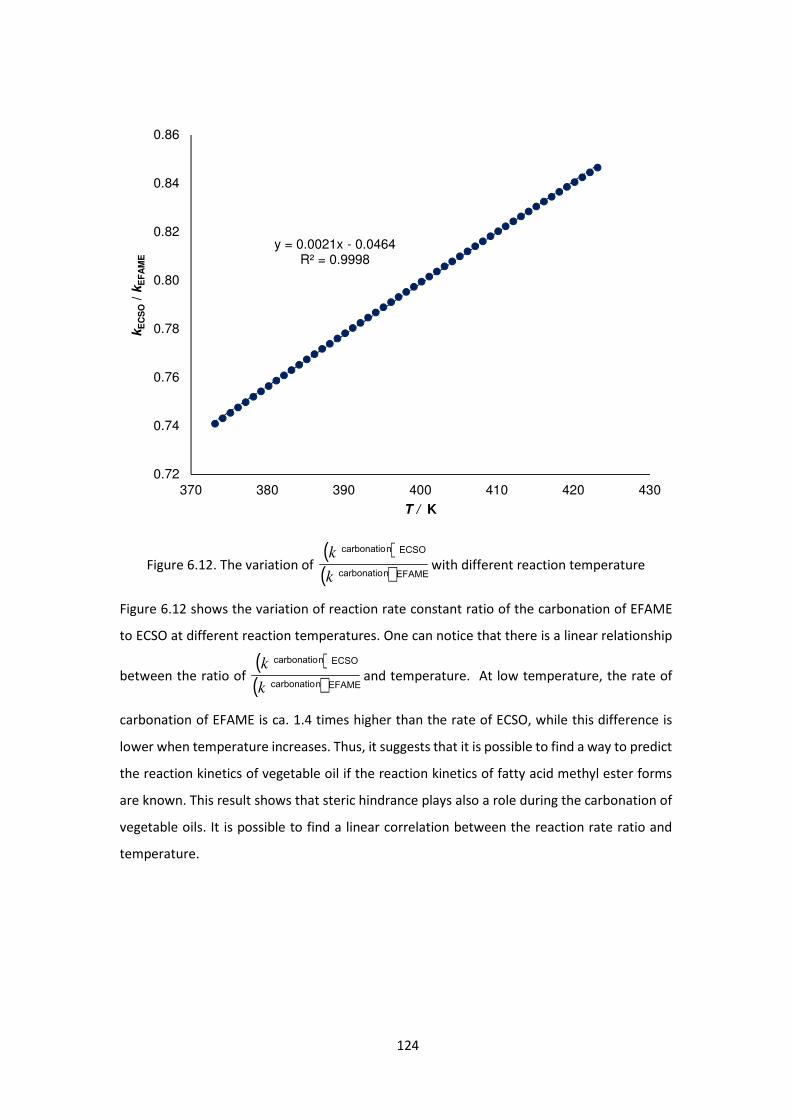
124
Figure 6.12. The variation of ( )( )EFAMEncarbonatio
ECSOncarbonatio
k
kwith different reaction temperature
Figure 6.12 shows the variation of reaction rate constant ratio of the carbonation of EFAME
to ECSO at different reaction temperatures. One can notice that there is a linear relationship
between the ratio of ( )( )EFAMEncarbonatio
ECSOncarbonatio
k
kand temperature. At low temperature, the rate of
carbonation of EFAME is ca. 1.4 times higher than the rate of ECSO, while this difference is
lower when temperature increases. Thus, it suggests that it is possible to find a way to predict
the reaction kinetics of vegetable oil if the reaction kinetics of fatty acid methyl ester forms
are known. This result shows that steric hindrance plays also a role during the carbonation of
vegetable oils. It is possible to find a linear correlation between the reaction rate ratio and
temperature.
y = 0.0021x - 0.0464R² = 0.9998
0.72
0.74
0.76
0.78
0.80
0.82
0.84
0.86
370 380 390 400 410 420 430
kE
CS
O/ k
EF
AM
E
T / K
125
6.4 Conclusion
In this chapter, a comparison between the intrinsic carbonation kinetics of epoxidized
cottonseed oil and the corresponding fatty acid methyl ester was performed by using
homogeneous catalyst. In this part of work, the mass transfer parameters, like the Henry’s
constant and global mass transfer coefficient were determined for epoxidized fatty acid
methyl ester systems. Also, physicochemical properties of density and viscosity were
measured. We have found that density for the two systems were similar. The difference of
viscosity was proved to be important, for instance, at 140 °C, the density ratios are observed
as follow: îÞ÷3îø�ùú ≈50,
îúÞ÷3îúø�ùú ≈40 and îÞÞ÷3îÞø�ùú ≈20.
Besides, the dissolution of CO2 was higher in FAME-derivatives than in CSO-derivatives, and
the carbonation rate constant of EFAME is higher than ECSO in the temperature range 100-
150 °C. Furthermore, there exists a linear relationship between the reaction rate constant
ratios of the carbonation of ECSO and EFAME. It suggested that it is possible to find a way to
predict the reaction kinetics of vegetable oil based on the reaction kinetics of fatty acid methyl
ester forms.
A continuation of this work could be to study more vegetable oils to see if the ratio of
M.û�W�V����V�Oúü3�M.û�W�V����V�Oúø�ùú is always similar.

126
127
CONCLUSIONS
This research has studied four aspects for the valorization of vegetable oils:
Firstly, kinetics of epoxidation of vegetable oil and ring opening of epoxidized vegetable oil
was studied in batch reactor. By developing a suitable modeling strategy, the kinetic constants
for the ring opening reactions by water, hydrogen peroxide, acetic and peracetic acids were
estimated. As conclusion, it shows that ring opening by peracetic and acetic acid is faster than
by water and hydrogen peroxide. The semibatch reactor, where hydrogen peroxide and
sulfuric acid were added continuously, was found to be the optimal configuration to maximize
the concentration of epoxide group and minimize the concentration of ring opening products.
Secondly, interactions between functional groups (double bond, epoxide group and
carbonated group) and physicochemical properties were investigated for vegetable oils and
their epoxidized and carbonated derivatives. The influence of temperature on the
physicochemical properties like density, refractive index, viscosity and specific heat capacity
were discussed. As conclusion, refractive index value and density decreases linearly as
temperature increases. Viscosity of these oils is exponentially proportional to temperature.
Specific heat capacity was found to be relatively constant with temperature. The conversion
of epoxidized groups to carbonated groups leads to an increase of the viscosity, suggesting
that the oil components affect the physicochemical parameters, which will influence the gas-
liquid mass transfer during the carbonation reactions. Thus, based on the evolutions of the
corresponding pure compounds, the physicochemical properties of density, refractive index,
viscosity and specific heat capacity of vegetable oils could be predicted.
Then, a kinetic model for the carbonation of epoxidized cottonseed oil using a homogeneous
catalyst of tetra-n-butylammonium bromide (TBABr) was developed. During the kinetic study,
mass transfer phenomenon of carbon dioxide was taken into consideration, and the evolution
of mass transfer parameters with temperature and components were estimated during the
mass transfer modeling stage. A kinetic expression for the carbonation of epoxidized
cottonseed oil was derived by assuming the reaction in a steady state. The mass transfer
results show that the dissolution of CO2 in the oil phase is exothermic.
At last stage, a comparison between the intrinsic carbonation kinetics of epoxidized
cottonseed oil and the corresponding fatty acid methyl ester was performed by using
homogeneous catalyst tetra-n-butylammonium bromide (TBABr). From the comparisons of
the physicochemical properties, we have observed a strong influence of the functional groups
128
(double bond, epoxide group and carbonated group) on the viscosity value, which is probably
associated with steric hindrance. The mass transfer comparison results showed that the
solubility of CO2 was higher in FAME-derivatives than in CSO-derivatives, indicating that
epoxide groups of epoxidized FAME is more accessible than the ones of epoxidized vegetable
oils. A linear relationship was found between the reaction rate constant of the carbonation of
epoxidized cottonseed oil and epoxidized fatty acid methyl ester. It suggested a possible way
to predict the reaction kinetics of vegetable oil base on the reaction kinetics of fatty acid
methyl ester forms.
Continuations of this doctoral thesis could be: 1) for the epoxidation process, a fundamental
approach need to be found to estimate the evolution of the induction period before the start
of epoxidation and ring opening reaction; 2) oil solutions with different conversion rates,
which are obtained from the epoxidation and carbonation reactions, could be used instead of
the mixed solutions to study the interaction between function groups and physicochemical
properties; 3) for the carbonation process, more vegetable oils need to be tested to see if the
ratio of ( )( )EFAMEncarbonatio
EVOsncarbonatio
k
k is always similar.
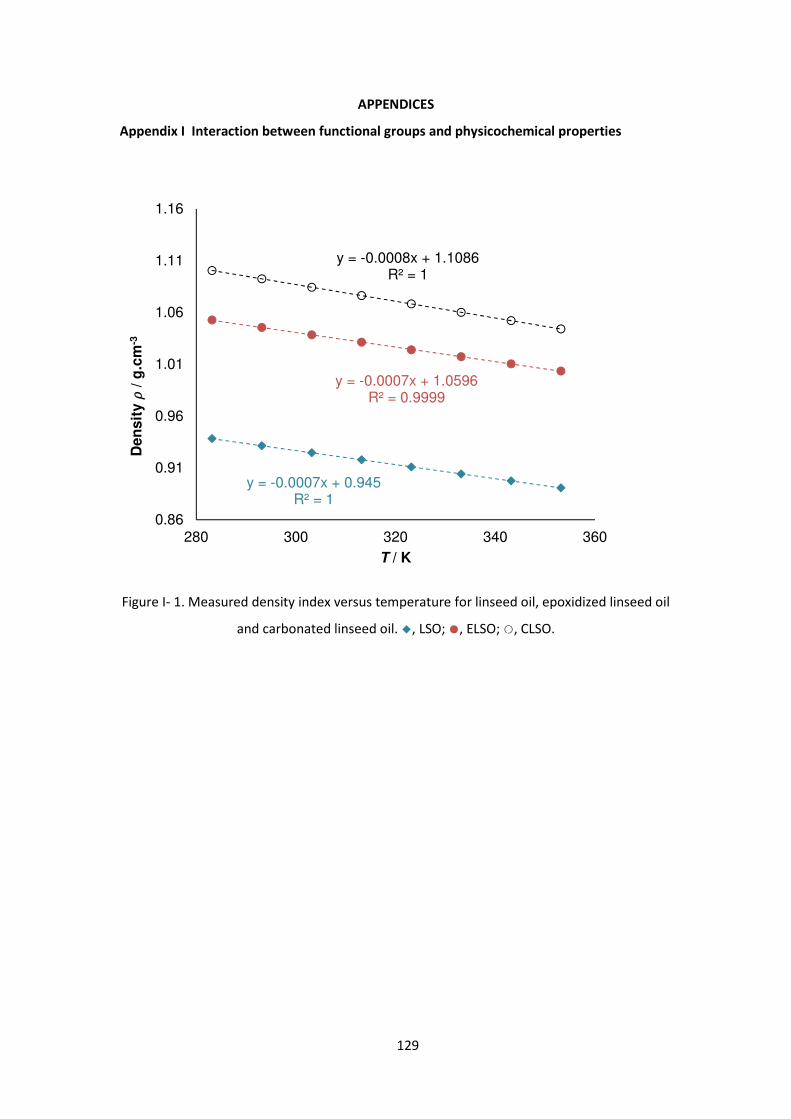
129
APPENDICES
Appendix I Interaction between functional groups and physicochemical properties
Figure I- 1. Measured density index versus temperature for linseed oil, epoxidized linseed oil
and carbonated linseed oil. ◆, LSO; ●, ELSO; ○, CLSO.
y = -0.0007x + 0.945R² = 1
y = -0.0007x + 1.0596R² = 0.9999
y = -0.0008x + 1.1086R² = 1
0.86
0.91
0.96
1.01
1.06
1.11
1.16
280 300 320 340 360
Den
sit
y o/
g.c
m-3
T / K
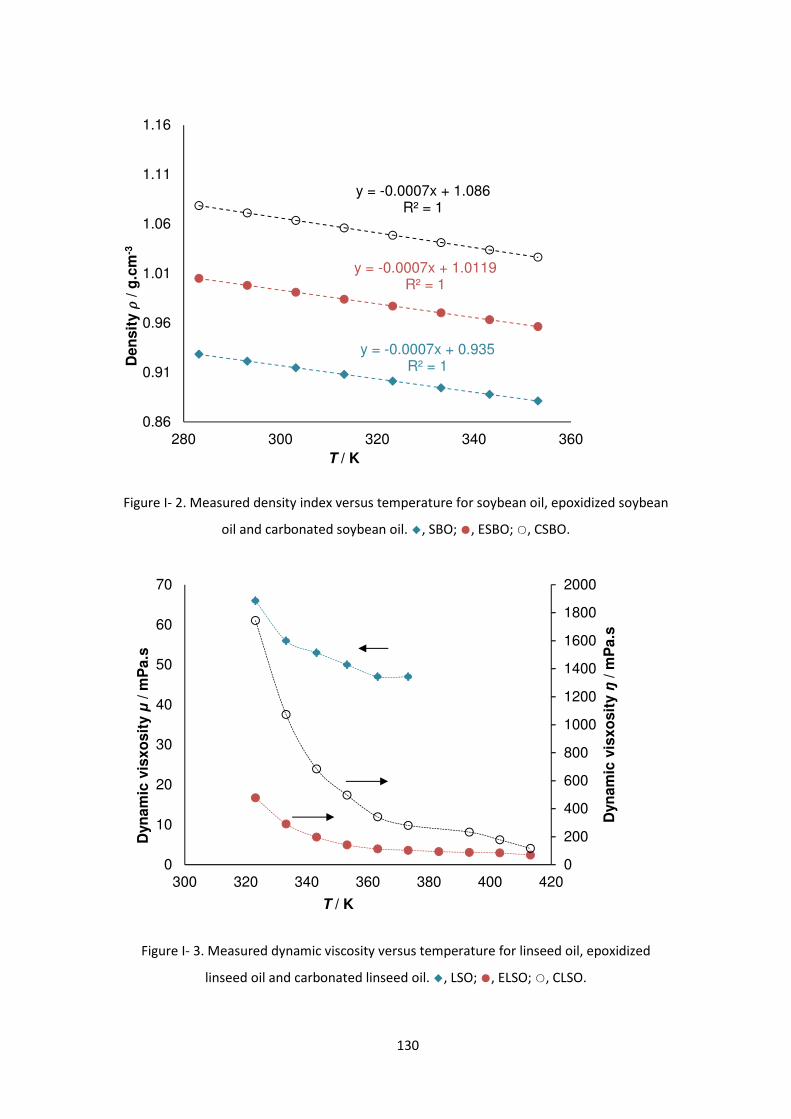
130
Figure I- 2. Measured density index versus temperature for soybean oil, epoxidized soybean
oil and carbonated soybean oil. ◆, SBO; ●, ESBO; ○, CSBO.
Figure I- 3. Measured dynamic viscosity versus temperature for linseed oil, epoxidized
linseed oil and carbonated linseed oil. ◆, LSO; ●, ELSO; ○, CLSO.
y = -0.0007x + 0.935R² = 1
y = -0.0007x + 1.0119R² = 1
y = -0.0007x + 1.086R² = 1
0.86
0.91
0.96
1.01
1.06
1.11
1.16
280 300 320 340 360
Den
sit
y o/
g.c
m-3
T / K
0
200
400
600
800
1000
1200
1400
1600
1800
2000
0
10
20
30
40
50
60
70
300 320 340 360 380 400 420
Dyn
am
ic v
isxo
sit
yŋ
/ m
Pa.s
Dyn
am
ic v
isxo
sit
yµ
/ m
Pa.s
T / K
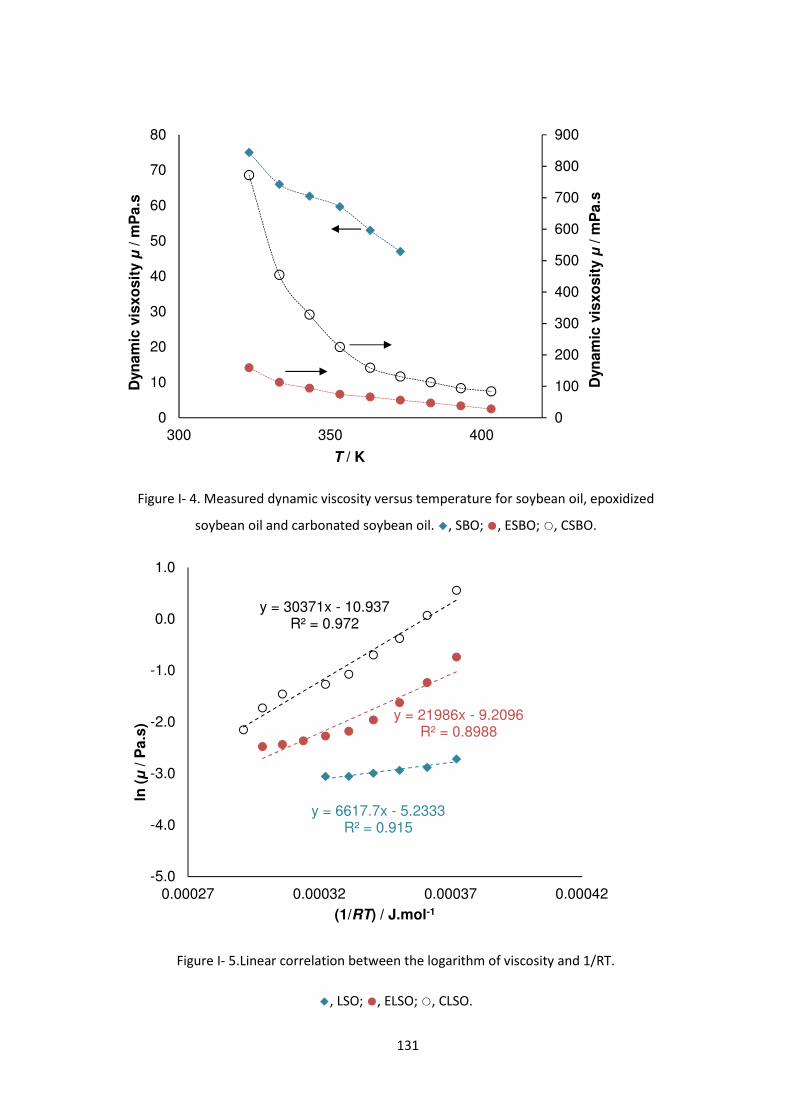
131
Figure I- 4. Measured dynamic viscosity versus temperature for soybean oil, epoxidized
soybean oil and carbonated soybean oil. ◆, SBO; ●, ESBO; ○, CSBO.
Figure I- 5.Linear correlation between the logarithm of viscosity and 1/RT.
◆, LSO; ●, ELSO; ○, CLSO.
0
100
200
300
400
500
600
700
800
900
0
10
20
30
40
50
60
70
80
300 350 400
Dyn
am
ic v
isxo
sit
y µ
/ m
Pa.s
Dyn
am
ic v
isxo
sit
y µ
/ m
Pa.s
T / K
y = 6617.7x - 5.2333R² = 0.915
y = 21986x - 9.2096R² = 0.8988
y = 30371x - 10.937R² = 0.972
-5.0
-4.0
-3.0
-2.0
-1.0
0.0
1.0
0.00027 0.00032 0.00037 0.00042
ln (µ
/ P
a.s
)
(1/RT) / J.mol-1
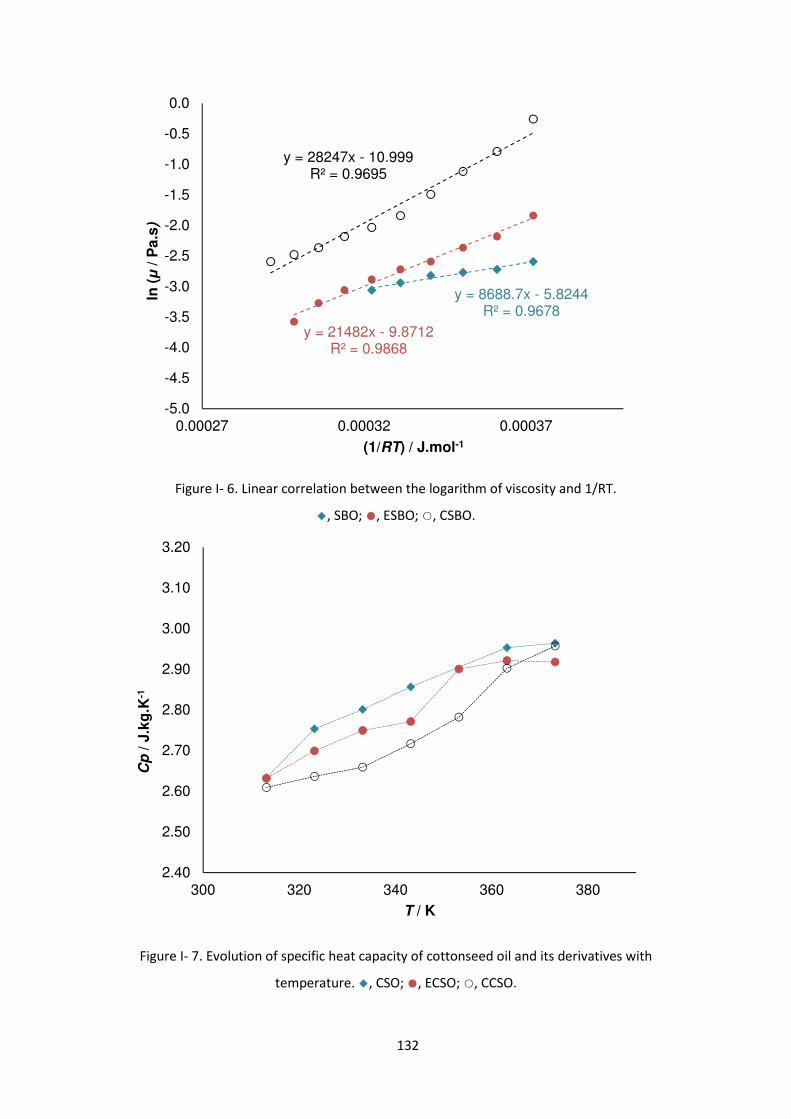
132
Figure I- 6. Linear correlation between the logarithm of viscosity and 1/RT.
◆, SBO; ●, ESBO; ○, CSBO.
Figure I- 7. Evolution of specific heat capacity of cottonseed oil and its derivatives with
temperature. ◆, CSO; ●, ECSO; ○, CCSO.
y = 8688.7x - 5.8244R² = 0.9678
y = 21482x - 9.8712R² = 0.9868
y = 28247x - 10.999R² = 0.9695
-5.0
-4.5
-4.0
-3.5
-3.0
-2.5
-2.0
-1.5
-1.0
-0.5
0.0
0.00027 0.00032 0.00037
ln (µ
/ P
a.s
)
(1/RT) / J.mol-1
2.40
2.50
2.60
2.70
2.80
2.90
3.00
3.10
3.20
300 320 340 360 380
Cp
/ J.k
g.K
-1
T / K
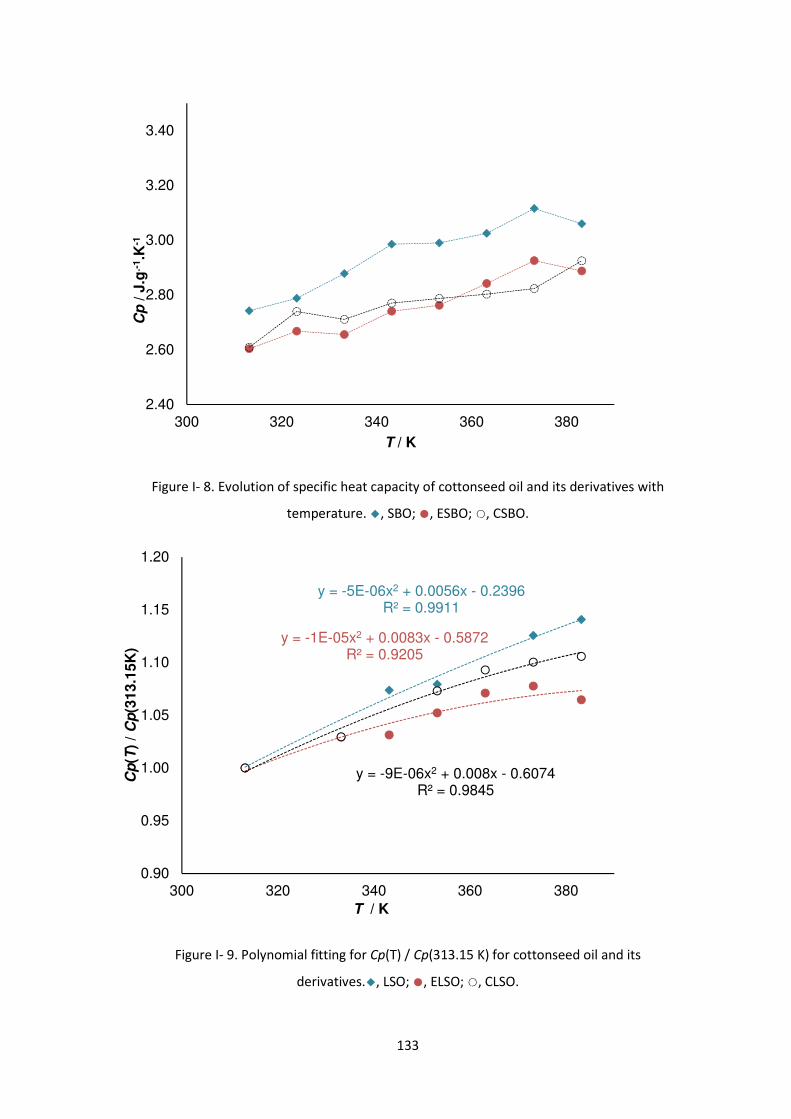
133
Figure I- 8. Evolution of specific heat capacity of cottonseed oil and its derivatives with
temperature. ◆, SBO; ●, ESBO; ○, CSBO.
Figure I- 9. Polynomial fitting for Cp(T) / Cp(313.15 K) for cottonseed oil and its
derivatives.◆, LSO; ●, ELSO; ○, CLSO.
2.40
2.60
2.80
3.00
3.20
3.40
300 320 340 360 380
Cp
/ J.g
.-1.K
-1
T / K
y = -5E-06x2 + 0.0056x - 0.2396R² = 0.9911
y = -1E-05x2 + 0.0083x - 0.5872R² = 0.9205
y = -9E-06x2 + 0.008x - 0.6074R² = 0.9845
0.90
0.95
1.00
1.05
1.10
1.15
1.20
300 320 340 360 380
Cp
(T)
/ C
p(3
13.1
5K
)
T / K
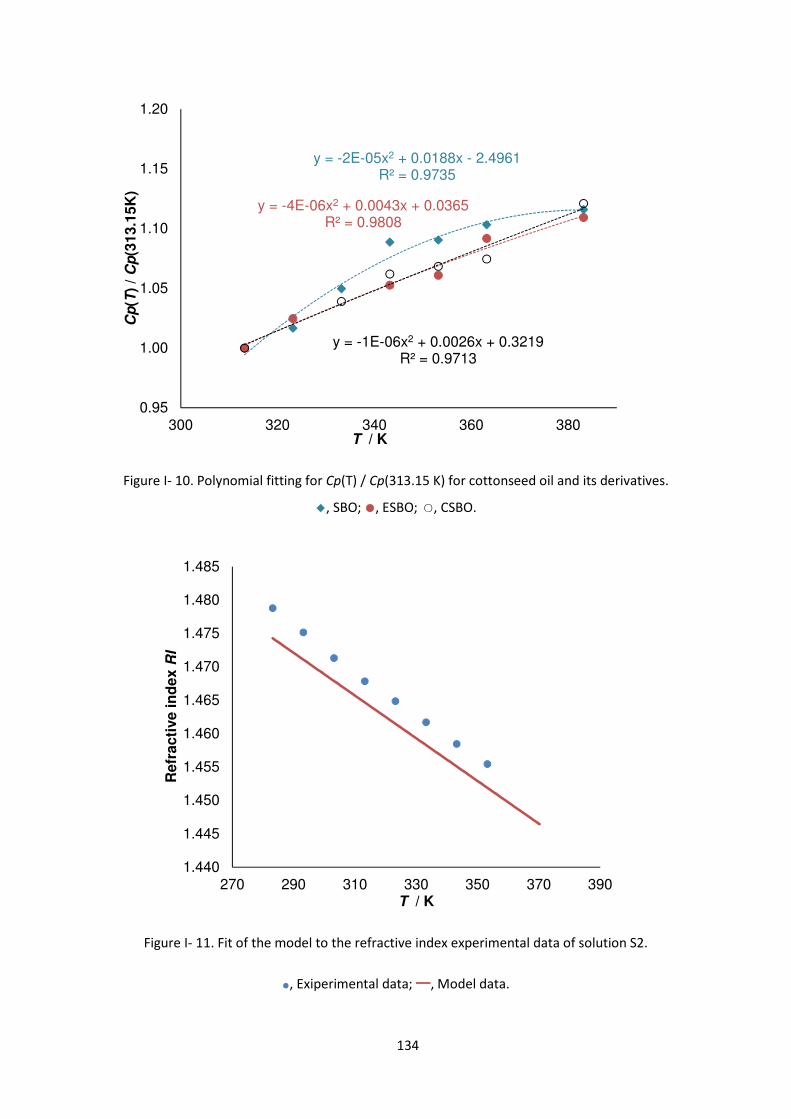
134
Figure I- 10. Polynomial fitting for Cp(T) / Cp(313.15 K) for cottonseed oil and its derivatives.
◆, SBO; ●, ESBO; ○, CSBO.
Figure I- 11. Fit of the model to the refractive index experimental data of solution S2.
●, Exiperimental data; ━, Model data.
y = -2E-05x2 + 0.0188x - 2.4961R² = 0.9735
y = -4E-06x2 + 0.0043x + 0.0365R² = 0.9808
y = -1E-06x2 + 0.0026x + 0.3219R² = 0.9713
0.95
1.00
1.05
1.10
1.15
1.20
300 320 340 360 380
Cp
(T)
/ C
p(3
13.1
5K
)
T / K
1.440
1.445
1.450
1.455
1.460
1.465
1.470
1.475
1.480
1.485
270 290 310 330 350 370 390
Refr
acti
ve in
dex R
I
T / K
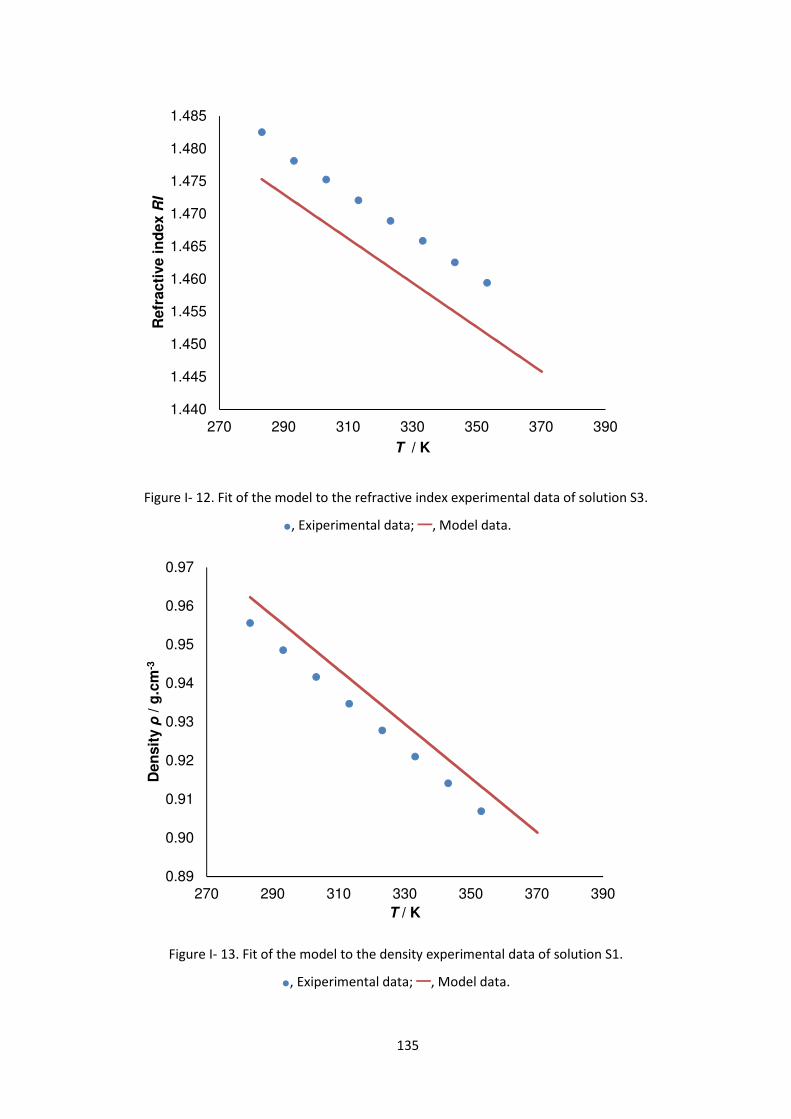
135
Figure I- 12. Fit of the model to the refractive index experimental data of solution S3.
●, Exiperimental data; ━, Model data.
Figure I- 13. Fit of the model to the density experimental data of solution S1.
●, Exiperimental data; ━, Model data.
1.440
1.445
1.450
1.455
1.460
1.465
1.470
1.475
1.480
1.485
270 290 310 330 350 370 390
Refr
acti
ve in
dex R
I
T / K
0.89
0.90
0.91
0.92
0.93
0.94
0.95
0.96
0.97
270 290 310 330 350 370 390
Den
sit
y ρ
/ g
.cm
-3
T / K
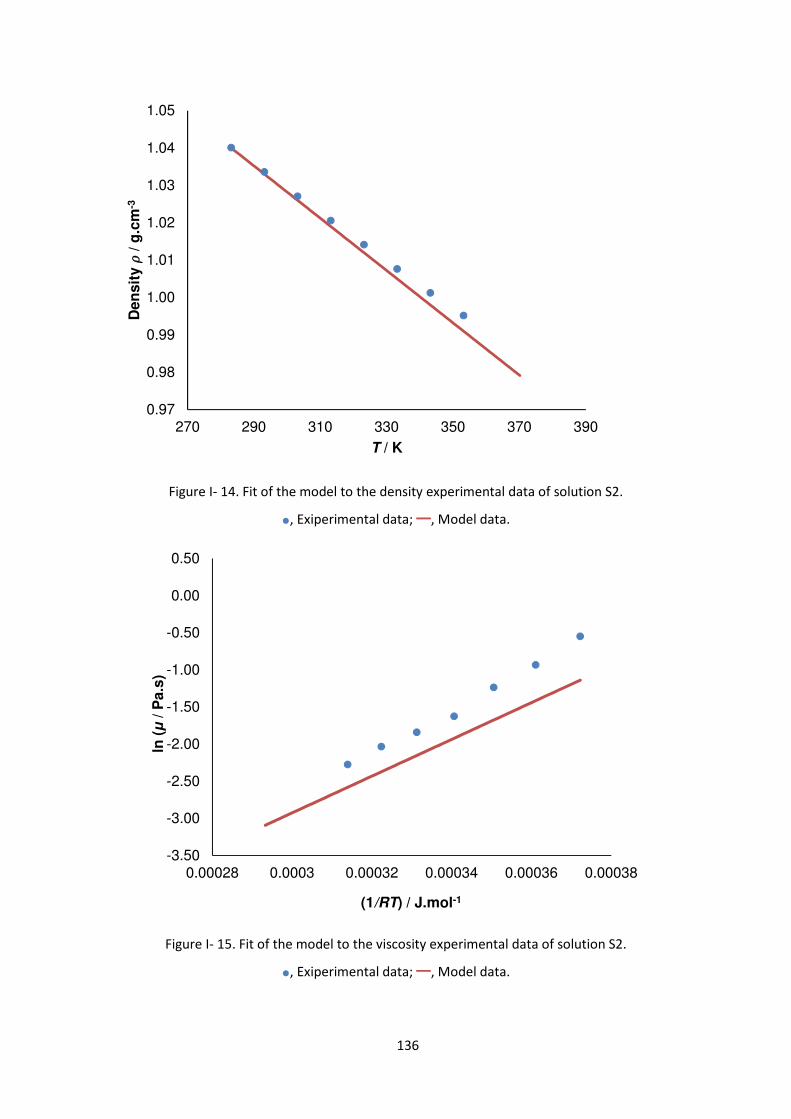
136
Figure I- 14. Fit of the model to the density experimental data of solution S2.
●, Exiperimental data; ━, Model data.
Figure I- 15. Fit of the model to the viscosity experimental data of solution S2.
●, Exiperimental data; ━, Model data.
0.97
0.98
0.99
1.00
1.01
1.02
1.03
1.04
1.05
270 290 310 330 350 370 390
Den
sit
y o/
g.c
m-3
T / K
-3.50
-3.00
-2.50
-2.00
-1.50
-1.00
-0.50
0.00
0.50
0.00028 0.0003 0.00032 0.00034 0.00036 0.00038
ln (µ
/ P
a.s
)
(1/RT) / J.mol-1
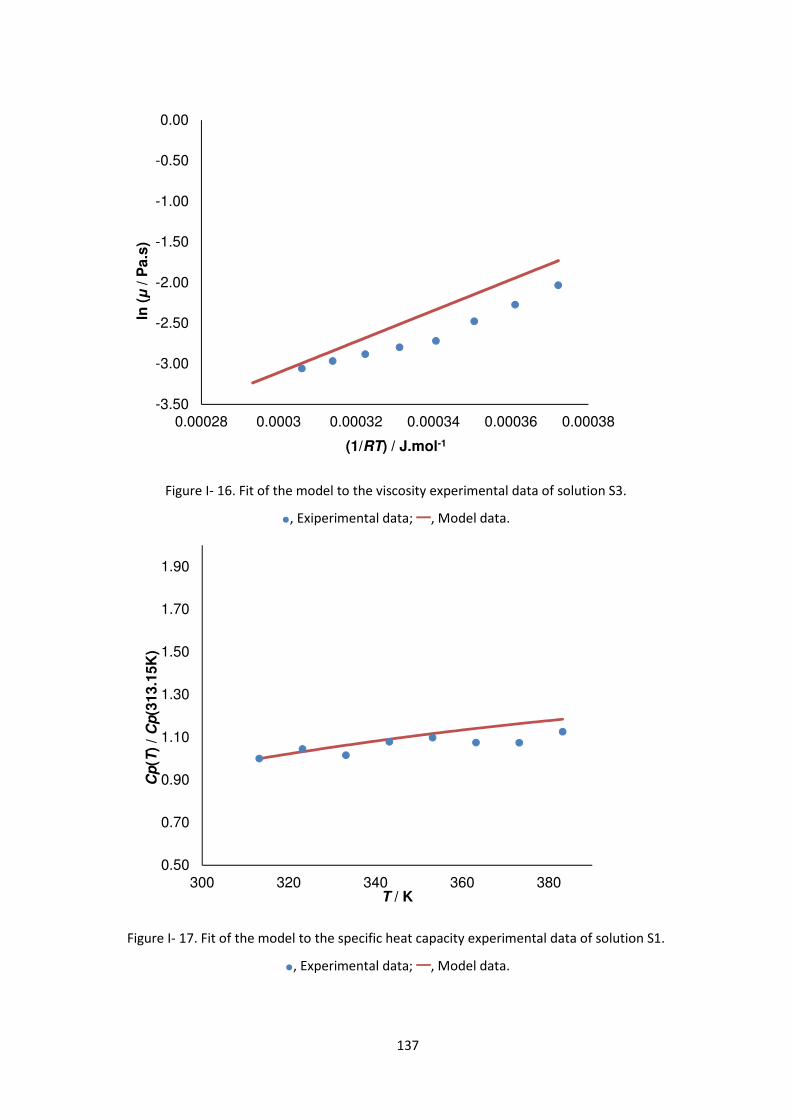
137
Figure I- 16. Fit of the model to the viscosity experimental data of solution S3.
●, Exiperimental data; ━, Model data.
Figure I- 17. Fit of the model to the specific heat capacity experimental data of solution S1.
●, Experimental data; ━, Model data.
-3.50
-3.00
-2.50
-2.00
-1.50
-1.00
-0.50
0.00
0.00028 0.0003 0.00032 0.00034 0.00036 0.00038
ln (µ
/ P
a.s
)
(1/RT) / J.mol-1
0.50
0.70
0.90
1.10
1.30
1.50
1.70
1.90
300 320 340 360 380
Cp
(T)
/ C
p(3
13.1
5K
)
T / K
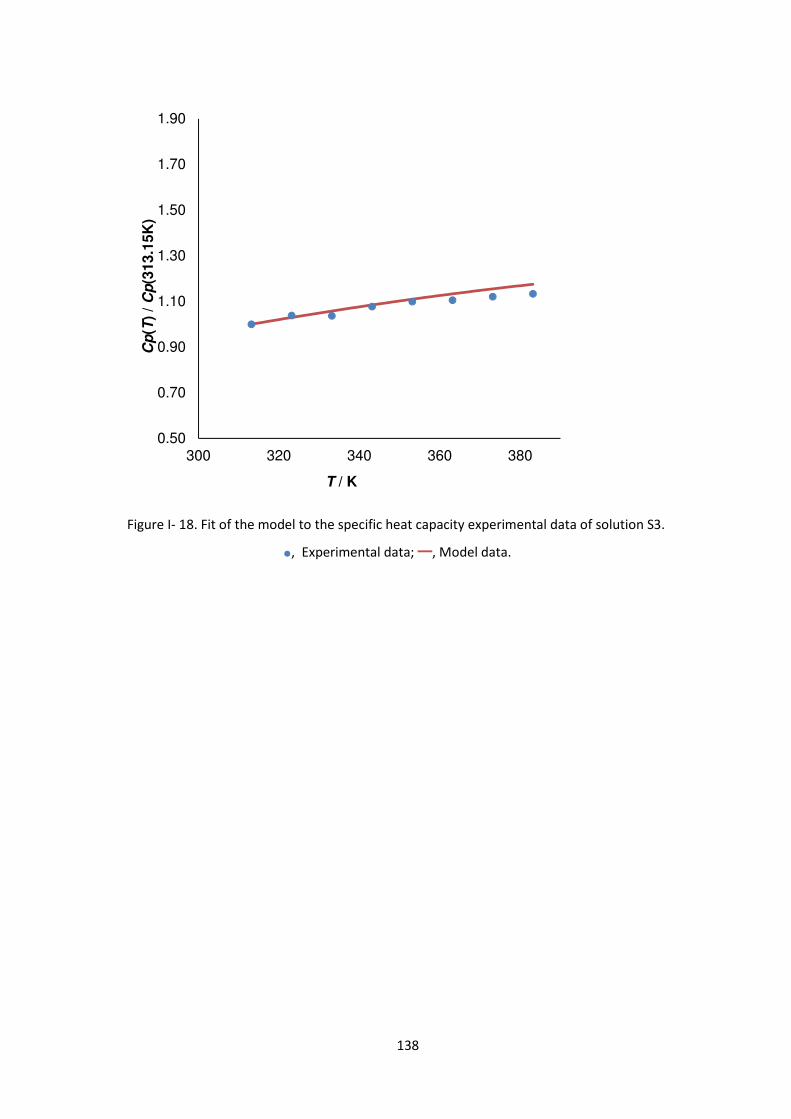
138
Figure I- 18. Fit of the model to the specific heat capacity experimental data of solution S3.
●, Experimental data; ━, Model data.
0.50
0.70
0.90
1.10
1.30
1.50
1.70
1.90
300 320 340 360 380
Cp
(T)
/ C
p(3
13.1
5K
)
T / K
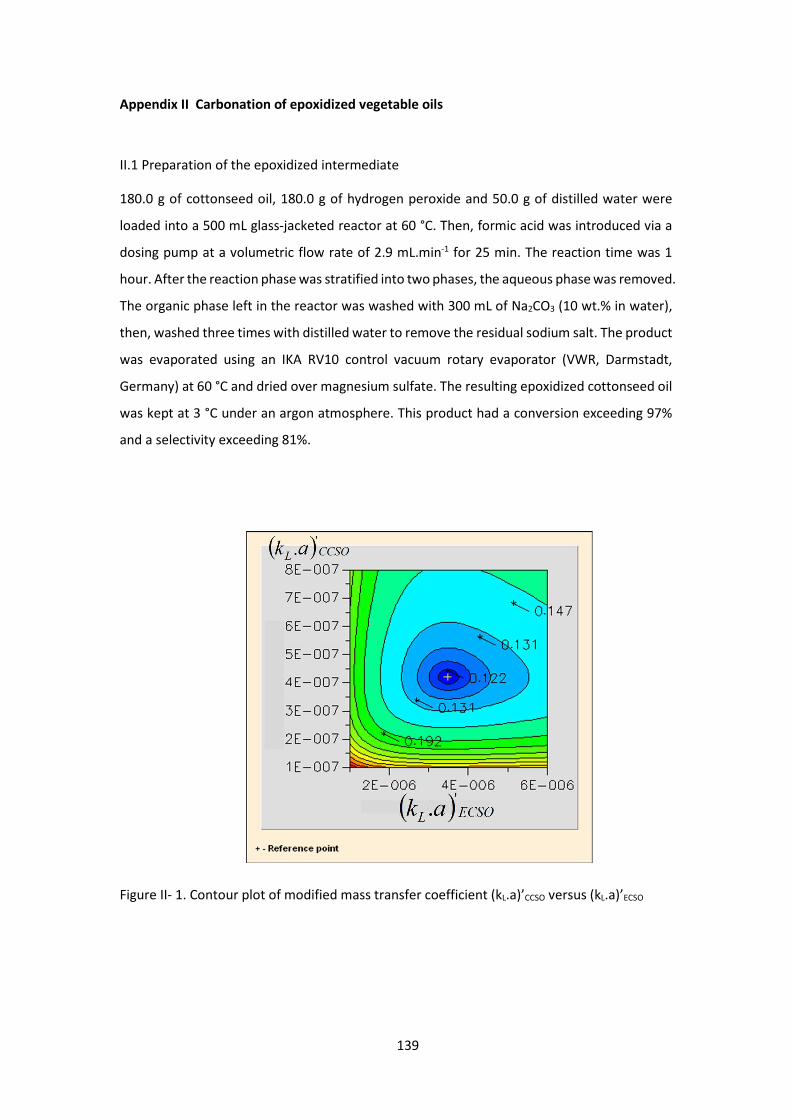
139
Appendix II Carbonation of epoxidized vegetable oils
II.1 Preparation of the epoxidized intermediate
180.0 g of cottonseed oil, 180.0 g of hydrogen peroxide and 50.0 g of distilled water were
loaded into a 500 mL glass-jacketed reactor at 60 °C. Then, formic acid was introduced via a
dosing pump at a volumetric flow rate of 2.9 mL.min-1 for 25 min. The reaction time was 1
hour. After the reaction phase was stratified into two phases, the aqueous phase was removed.
The organic phase left in the reactor was washed with 300 mL of Na2CO3 (10 wt.% in water),
then, washed three times with distilled water to remove the residual sodium salt. The product
was evaporated using an IKA RV10 control vacuum rotary evaporator (VWR, Darmstadt,
Germany) at 60 °C and dried over magnesium sulfate. The resulting epoxidized cottonseed oil
was kept at 3 °C under an argon atmosphere. This product had a conversion exceeding 97%
and a selectivity exceeding 81%.
Figure II- 1. Contour plot of modified mass transfer coefficient (kL.a)’CCSO versus (kL.a)’ECSO
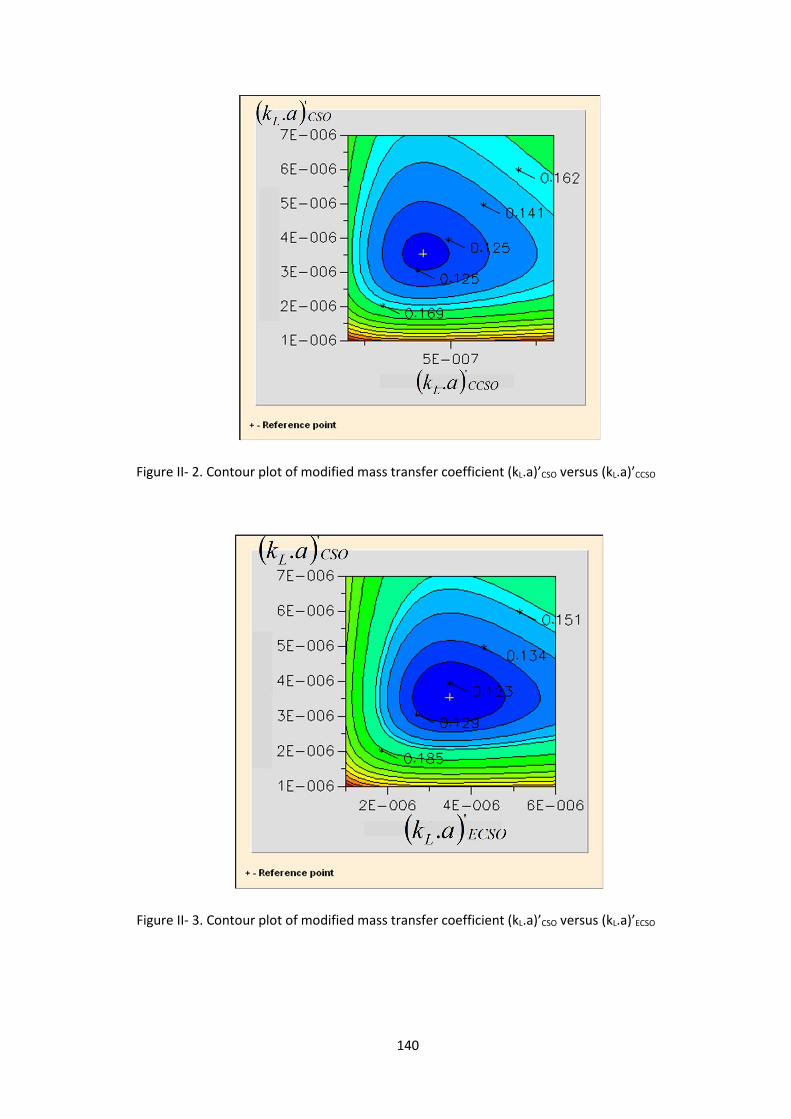
140
Figure II- 2. Contour plot of modified mass transfer coefficient (kL.a)’CSO versus (kL.a)’CCSO
Figure II- 3. Contour plot of modified mass transfer coefficient (kL.a)’CSO versus (kL.a)’ECSO
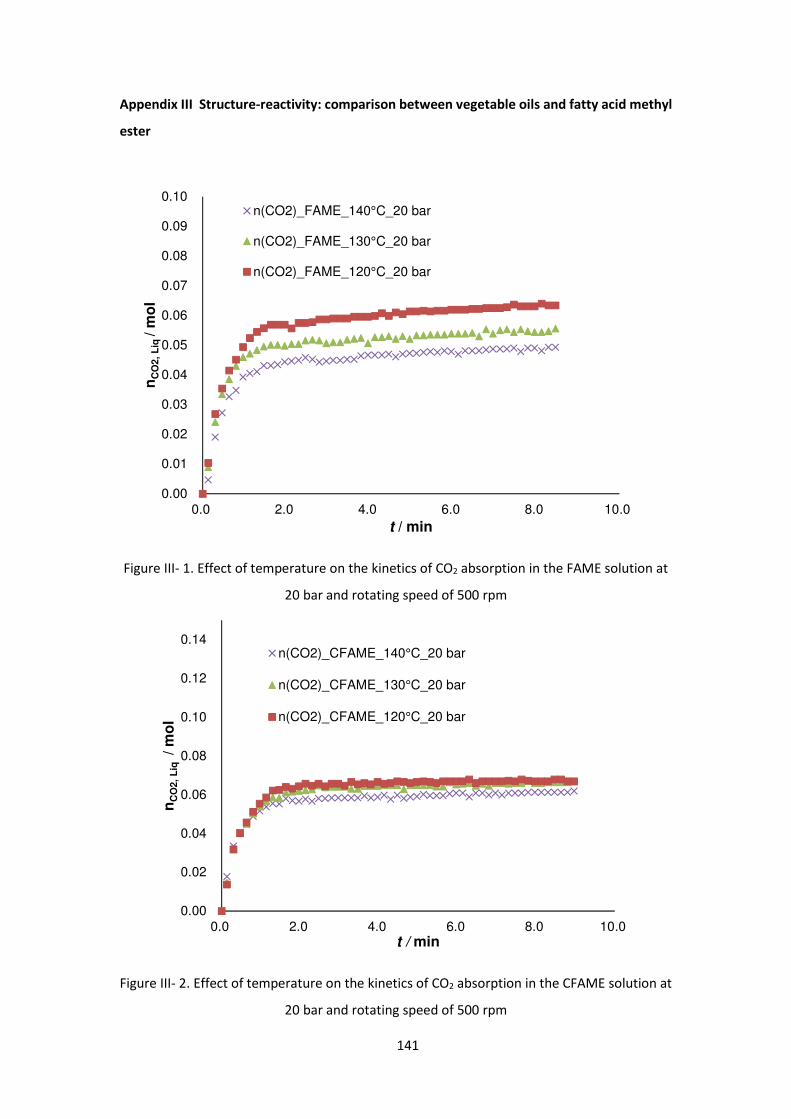
141
Appendix III Structure-reactivity: comparison between vegetable oils and fatty acid methyl
ester
Figure III- 1. Effect of temperature on the kinetics of CO2 absorption in the FAME solution at
20 bar and rotating speed of 500 rpm
Figure III- 2. Effect of temperature on the kinetics of CO2 absorption in the CFAME solution at
20 bar and rotating speed of 500 rpm
0.00
0.01
0.02
0.03
0.04
0.05
0.06
0.07
0.08
0.09
0.10
0.0 2.0 4.0 6.0 8.0 10.0
nC
O2
, L
iq /
mo
l
t / min
n(CO2)_FAME_140°C_20 bar
n(CO2)_FAME_130°C_20 bar
n(CO2)_FAME_120°C_20 bar
0.00
0.02
0.04
0.06
0.08
0.10
0.12
0.14
0.0 2.0 4.0 6.0 8.0 10.0
nC
O2
, L
iq / m
ol
t / min
n(CO2)_CFAME_140°C_20 bar
n(CO2)_CFAME_130°C_20 bar
n(CO2)_CFAME_120°C_20 bar
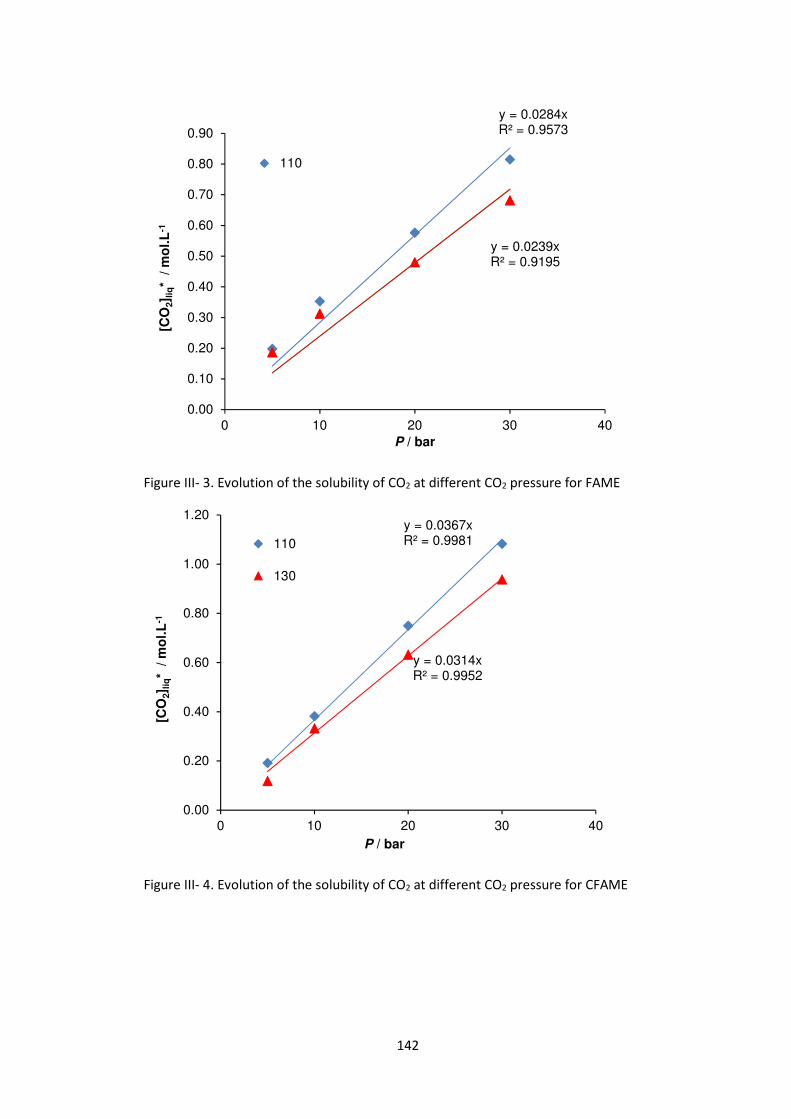
142
Figure III- 3. Evolution of the solubility of CO2 at different CO2 pressure for FAME
Figure III- 4. Evolution of the solubility of CO2 at different CO2 pressure for CFAME
y = 0.0284xR² = 0.9573
y = 0.0239xR² = 0.9195
0.00
0.10
0.20
0.30
0.40
0.50
0.60
0.70
0.80
0.90
0 10 20 30 40
[CO
2] l
iq*
/ m
ol.L
-1
P / bar
110
y = 0.0367xR² = 0.9981
y = 0.0314xR² = 0.9952
0.00
0.20
0.40
0.60
0.80
1.00
1.20
0 10 20 30 40
[CO
2] l
iq*
/ m
ol.L
-1
P / bar
110
130
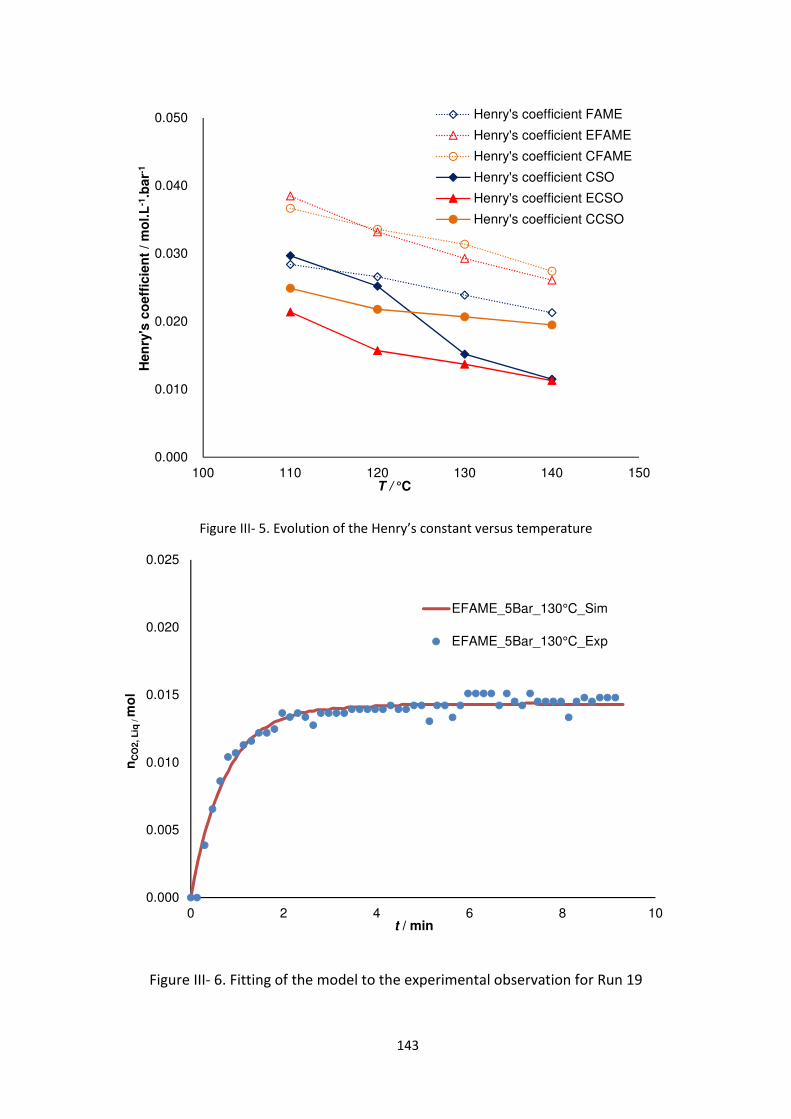
143
Figure III- 5. Evolution of the Henry’s constant versus temperature
Figure III- 6. Fitting of the model to the experimental observation for Run 19
0.000
0.010
0.020
0.030
0.040
0.050
100 110 120 130 140 150
Hen
ry's
co
eff
icie
nt
/ m
ol.L
-1.b
ar-
1
T / °C
Henry's coefficient FAME
Henry's coefficient EFAME
Henry's coefficient CFAME
Henry's coefficient CSO
Henry's coefficient ECSO
Henry's coefficient CCSO
0.000
0.005
0.010
0.015
0.020
0.025
0 2 4 6 8 10
nC
O2, L
iq / m
ol
t / min
EFAME_5Bar_130°C_Sim
EFAME_5Bar_130°C_Exp
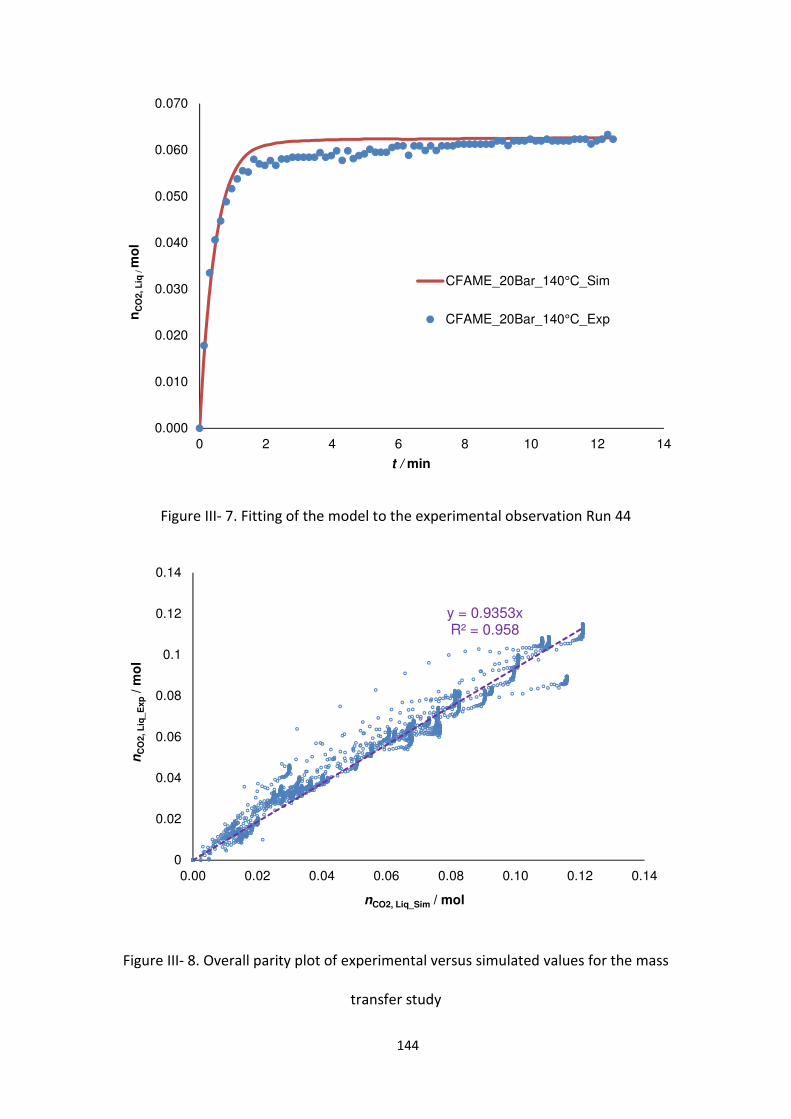
144
Figure III- 7. Fitting of the model to the experimental observation Run 44
Figure III- 8. Overall parity plot of experimental versus simulated values for the mass
transfer study
0.000
0.010
0.020
0.030
0.040
0.050
0.060
0.070
0 2 4 6 8 10 12 14
nC
O2, L
iq / m
ol
t / min
CFAME_20Bar_140°C_Sim
CFAME_20Bar_140°C_Exp
y = 0.9353xR² = 0.958
0
0.02
0.04
0.06
0.08
0.1
0.12
0.14
0.00 0.02 0.04 0.06 0.08 0.10 0.12 0.14
nC
O2, L
iq_E
xp
/ m
ol
nCO2, Liq_Sim / mol
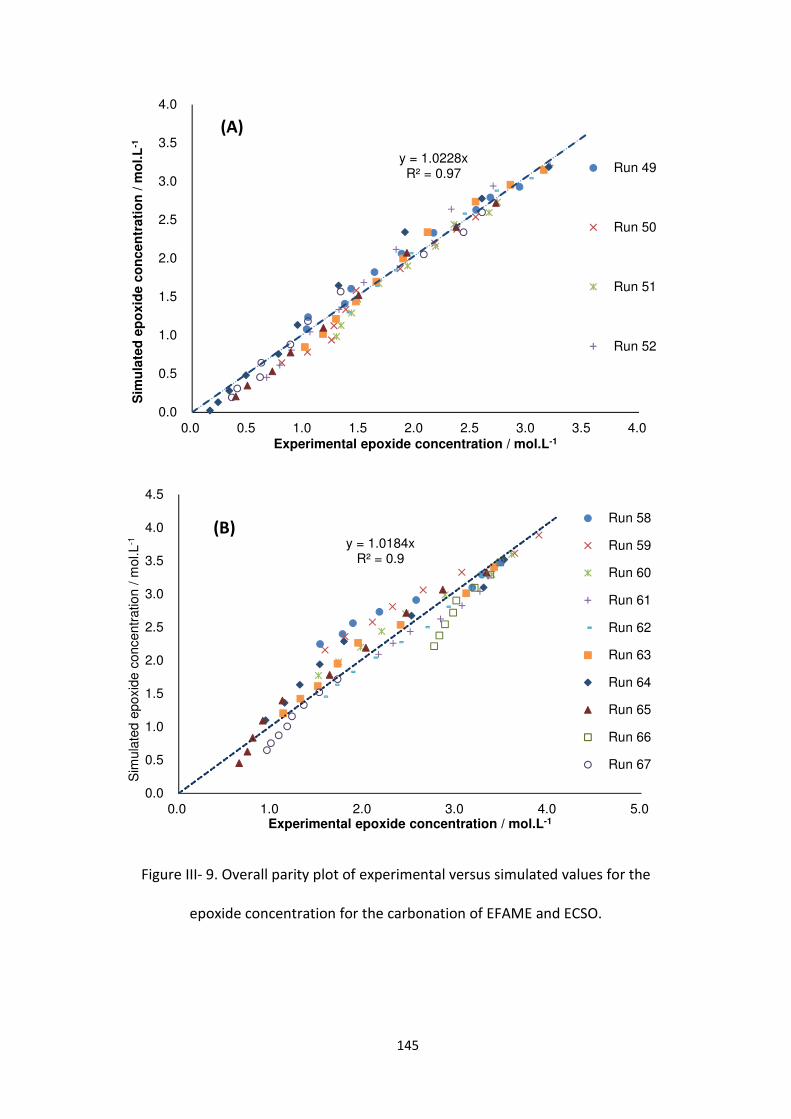
145
Figure III- 9. Overall parity plot of experimental versus simulated values for the
epoxide concentration for the carbonation of EFAME and ECSO.
y = 1.0228xR² = 0.97
0.0
0.5
1.0
1.5
2.0
2.5
3.0
3.5
4.0
0.0 0.5 1.0 1.5 2.0 2.5 3.0 3.5 4.0
Sim
ula
ted
ep
oxid
e c
on
cen
trati
on
/ m
ol.L
-1
Experimental epoxide concentration / mol.L-1
Run 49
Run 50
Run 51
Run 52
(A)
y = 1.0184xR² = 0.9
0.0
0.5
1.0
1.5
2.0
2.5
3.0
3.5
4.0
4.5
0.0 1.0 2.0 3.0 4.0 5.0
Sim
ulat
ed e
poxi
de c
once
ntra
tion
/ mol
.L-1
Experimental epoxide concentration / mol.L-1
Run 58
Run 59
Run 60
Run 61
Run 62
Run 63
Run 64
Run 65
Run 66
Run 67
(B)

146
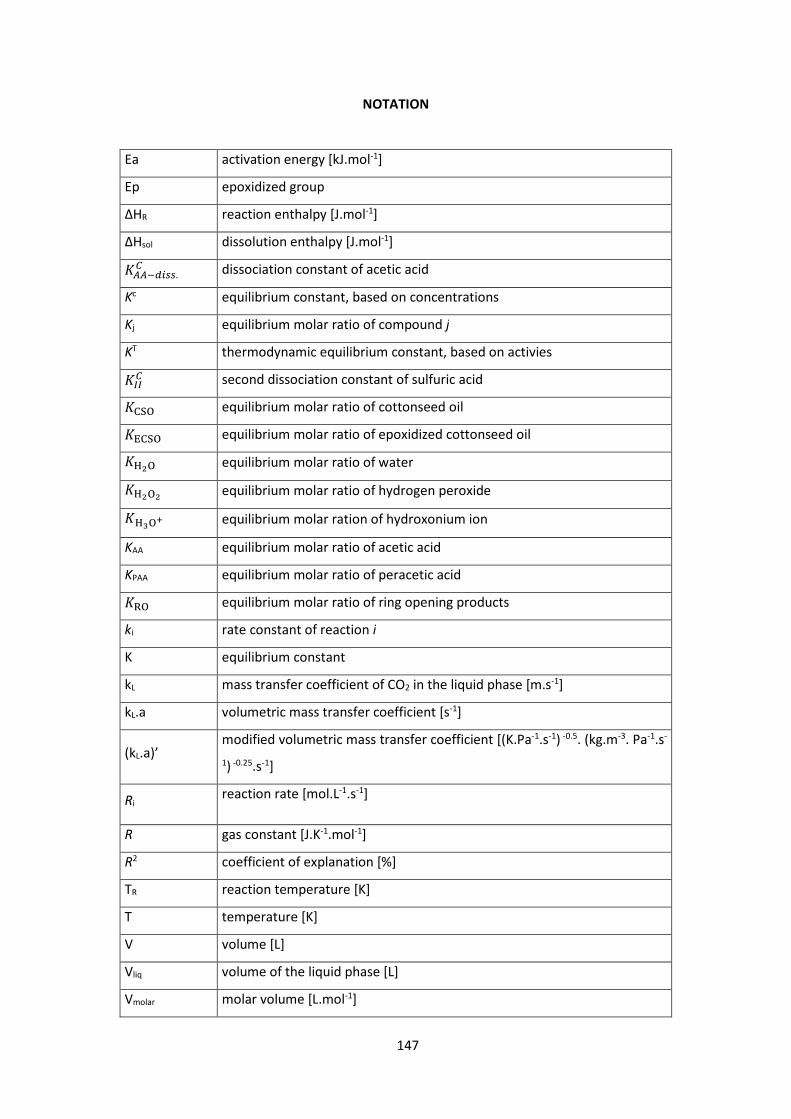
147
NOTATION
Ea activation energy [kJ.mol-1]
Ep epoxidized group
ΔHR reaction enthalpy [J.mol-1]
ΔHsol dissolution enthalpy [J.mol-1]
�??@ABCC.= dissociation constant of acetic acid
Kc equilibrium constant, based on concentrations
Kj equilibrium molar ratio of compound j
KT thermodynamic equilibrium constant, based on activies
�<<= second dissociation constant of sulfuric acid
�a9� equilibrium molar ratio of cottonseed oil
�Qa9� equilibrium molar ratio of epoxidized cottonseed oil
� #� equilibrium molar ratio of water
� #�# equilibrium molar ratio of hydrogen peroxide
� !�" equilibrium molar ration of hydroxonium ion
KAA equilibrium molar ratio of acetic acid
KPAA equilibrium molar ratio of peracetic acid
��� equilibrium molar ratio of ring opening products
ki rate constant of reaction i
K equilibrium constant
kL mass transfer coefficient of CO2 in the liquid phase [m.s-1]
kL.a volumetric mass transfer coefficient [s-1]
(kL.a)’ modified volumetric mass transfer coefficient [(K.Pa-1.s-1) -0.5. (kg.m-3. Pa-1.s-
1) -0.25.s-1]
Ri reaction rate [mol.L-1.s-1]
R gas constant [J.K-1.mol-1]
R2 coefficient of explanation [%]
TR reaction temperature [K]
T temperature [K]
V volume [L]
Vliq volume of the liquid phase [L]
Vmolar molar volume [L.mol-1]
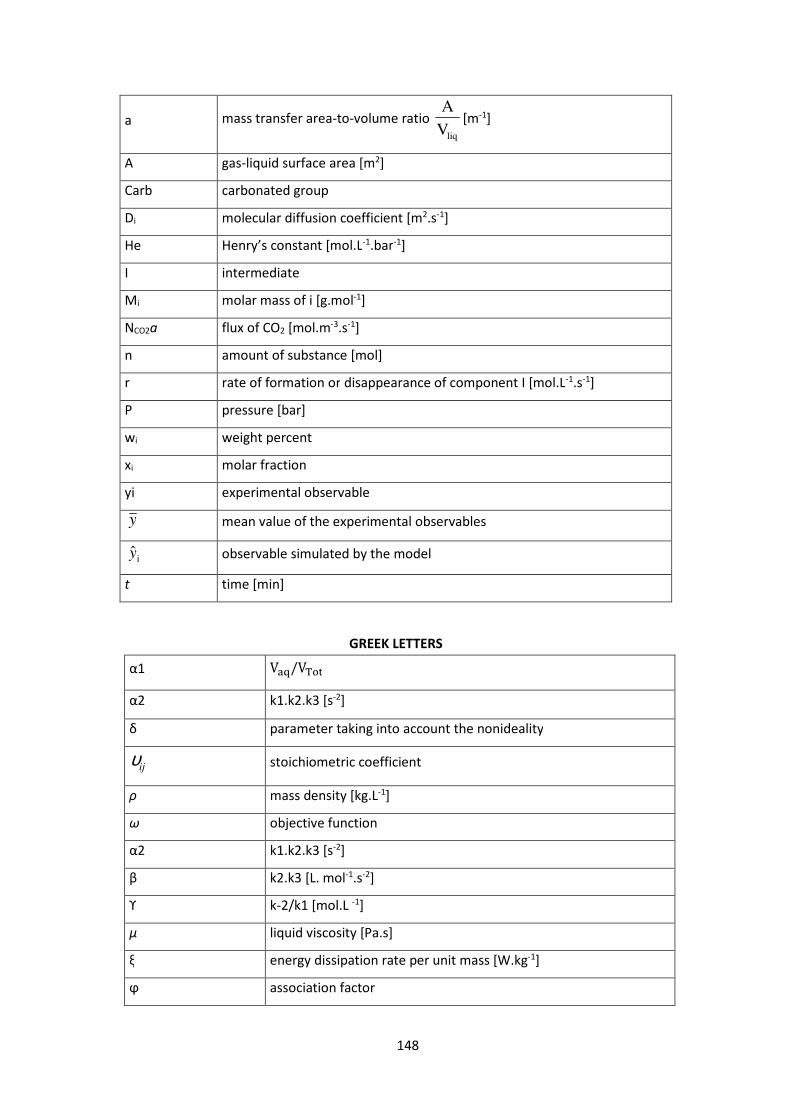
148
a mass transfer area-to-volume ratio liqV
A[m-1]
A gas-liquid surface area [m2]
Carb carbonated group
Di molecular diffusion coefficient [m2.s-1]
He Henry’s constant [mol.L-1.bar-1]
I intermediate
Mi molar mass of i [g.mol-1]
NCO2a flux of CO2 [mol.m-3.s-1]
n amount of substance [mol]
r rate of formation or disappearance of component I [mol.L-1.s-1]
P pressure [bar]
wi weight percent
xi molar fraction
yi experimental observable
y mean value of the experimental observables
observable simulated by the model
t time [min]
GREEK LETTERS
α1 V*+/V�E
α2 k1.k2.k3 [s-2]
δ parameter taking into account the nonideality
ijυ stoichiometric coefficient
ρ mass density [kg.L-1]
ω objective function
α2 k1.k2.k3 [s-2]
β k2.k3 [L. mol-1.s-2]
ϒ k-2/k1 [mol.L -1]
µ liquid viscosity [Pa.s]
ξ energy dissipation rate per unit mass [W.kg-1]
ϕ association factor
iy
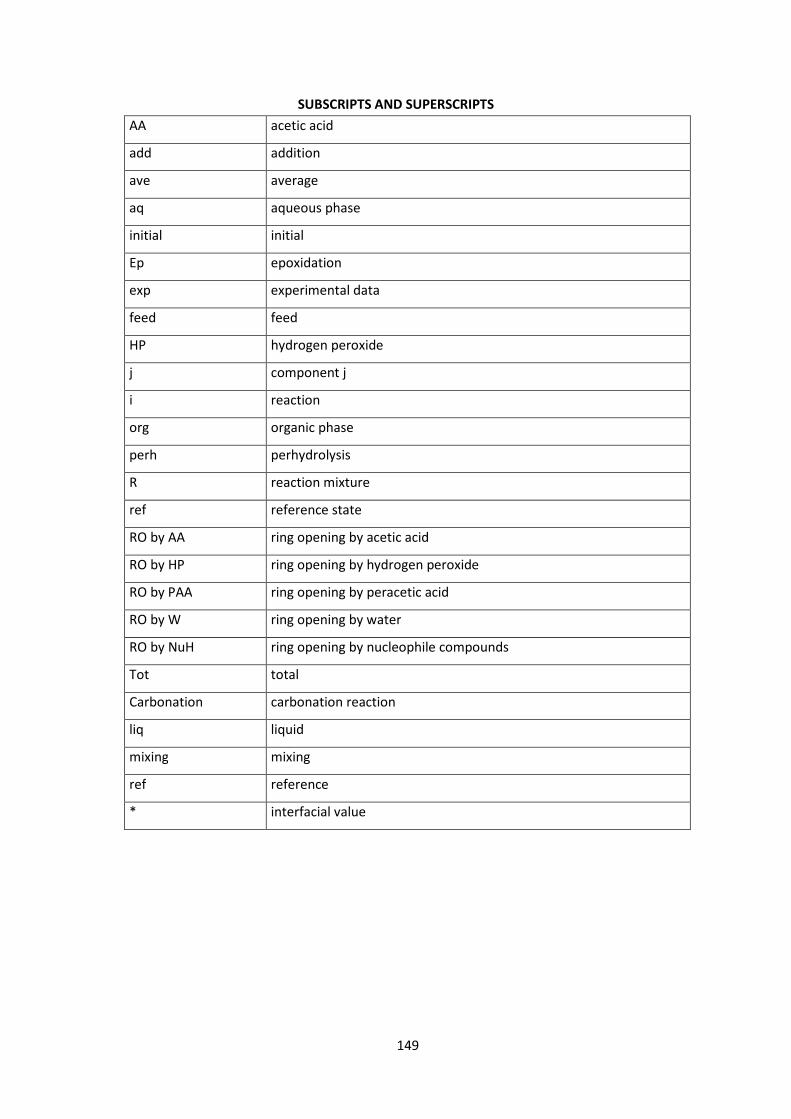
149
SUBSCRIPTS AND SUPERSCRIPTS
AA acetic acid
add addition
ave average
aq aqueous phase
initial initial
Ep epoxidation
exp experimental data
feed feed
HP hydrogen peroxide
j component j
i reaction
org organic phase
perh perhydrolysis
R reaction mixture
ref reference state
RO by AA ring opening by acetic acid
RO by HP ring opening by hydrogen peroxide
RO by PAA ring opening by peracetic acid
RO by W ring opening by water
RO by NuH ring opening by nucleophile compounds
Tot total
Carbonation carbonation reaction
liq liquid
mixing mixing
ref reference
* interfacial value
150
ABBREVIATIONS
CSO cottonseed oil
ECSO epoxidized cottonseed oil
CCSO carbonated cottonseed oil
SBO soybean oil
ESBO epoxidized soybean oil
CSBO carbonated soybean oil
LSO linseed oil
ELSO epoxidized linseed oil
CLSO carbonated linseed oil
FAME cottonseed oil fatty acid methyl ester
EFAME epoxidized fatty acid methyl ester
CFAME carbonated fatty acid methyl ester
DB double bond group
Ep epoxide group
HP hydrogen peroxide
NuH nucleophile agent
ODE ordinary differential equation
PAA peroxyacetic acid
RO ring opening product
W water
CCS carbon capture and storage
CCU carbon capture and utilization
TBABr tetra-n-butylammonium bromide
TEAB tetraethylammonium bromide
151
BIBLIOGRAPHY
[1] Abdullah, B.M., Salimon, J., 2010. Epoxidation of vegetable oils and fatty acids: catalysts, methods and advantages. J. Appl. Sci. 10, 1545–1553. https://doi.org/10.3923/jas.2010.1545.1553
[2] Adhvaryu, A., Erhan, S.Z., 2002. Epoxidized soybean oil as a potential source of high-temperature lubricants. Ind. Crops Prod. 15, 247–254. https://doi.org/10.1016/S0926-6690(01)00120-0
[3] Ait Aissa, K., Zheng, J.L., Estel, L., Leveneur, S., 2016. Thermal Stability of Epoxidized and Carbonated Vegetable Oils. Org. Process Res. Dev. 20, 948–953. https://doi.org/10.1021/acs.oprd.6b00040
[4] Alptekin, E., Canakci, M., 2010. Optimization of pretreatment reaction for methyl ester production from chicken fat. Fuel 89, 4035–4039. https://doi.org/10.1016/j.fuel.2010.04.031
[5] Alves, M., Grignard, B., Gennen, S., Detrembleur, C., Jerome, C., Tassaing, T., 2015. Organocatalytic synthesis of bio-based cyclic carbonates from CO2 and vegetable oils. RSC Adv. 5, 53629–53636. https://doi.org/10.1039/C5RA10190E
[6] Aresta, M., Dibenedetto, A., Angelini, A., 2014. Catalysis for the Valorization of Exhaust Carbon: from CO2 to Chemicals, Materials, and Fuels. Technological Use of CO2. Chem. Rev. 114, 1709–1742. https://doi.org/10.1021/cr4002758
[7] Babu, R., Kim, S.H., Kathalikkattil, A.C., Kuruppathparambil, R.R., Kim, D.W., Cho, S.J., Park, D.W., 2017. Aqueous microwave-assisted synthesis of non-interpenetrated metal-organic framework for room temperature cycloaddition of CO2 and epoxides. Appl. Catal. Gen. 544, 126–136. https://doi.org/10.1016/j.apcata.2017.07.018
[8] Bähr, M., Mülhaupt, R., 2012. Linseed and soybean oil-based polyurethanes prepared via the non-isocyanate route and catalytic carbon dioxide conversion. Green Chem. 14, 483–489. https://doi.org/10.1039/C2GC16230J
[9] Baker, B.P., Grant, J.A., 2018. Cottonseed Oil Profile. [10] Behr, A., Eilting, J., Irawadi, K., Leschinski, J., Lindner, F., 2008. Improved utilisation of
renewable resources: New important derivatives of glycerol. Green Chem. 10, 13–30. https://doi.org/10.1039/B710561D
[11] Bhalerao, M.S., Kulkarni, V.M., Patwardhan, A.V., 2018. Ultrasound-assisted chemoenzymatic epoxidation of soybean oil by using lipase as biocatalyst. Ultrason. Sonochem. 40, 912–920. https://doi.org/10.1016/j.ultsonch.2017.08.042
[12] Blanckenberg, A., Malgas-Enus, R., 2018. Olefin epoxidation with metal-based nanocatalysts. Catal. Rev. 0, 1–57. https://doi.org/10.1080/01614940.2018.1492503
[13] Bobbink, F.D., Dyson, P.J., 2016. Synthesis of carbonates and related compounds incorporating CO2 using ionic liquid-type catalysts: State-of-the-art and beyond. J. Catal., Catalytic CO2 conversion processes to fuels and other small molecules 343, 52–61. https://doi.org/10.1016/j.jcat.2016.02.033
[14] Bolland, J.L., 1950. Kinetic studies in the chemistry of rubber and related materials. VII.—influence of chemical structure on the α-methylenic reactivity of olefins. Trans. Faraday Soc. 46, 358–368.
[15] Boyer, A., Cloutet, E., Tassaing, T., Gadenne, B., Alfos, C., Cramail, H., 2010. Solubility in CO2 and carbonation studies of epoxidized fatty acid diesters : towards novel precursors
152
for polyurethane synthesis. Green Chem. 12, 2205–2213. https://doi.org/10.1039/C0GC00371A
[16] Bueno-Ferrer, C., Garrigós, M.C., Jiménez, A., 2010. Characterization and thermal stability of poly(vinyl chloride) plasticized with epoxidized soybean oil for food packaging. Polym. Degrad. Stab., 2nd International Conference on Biodegradable Polymers and Sustainable Composites - Alicante 2009 95, 2207–2212. https://doi.org/10.1016/j.polymdegradstab.2010.01.027
[17] Büttner, H., Steinbauer, J., Wulf, C., Dindaroglu, M., Schmalz, H.-G., Werner, T., 2017. Organocatalyzed Synthesis of Oleochemical Carbonates from CO2 and Renewables. ChemSusChem 10, 1076–1079. https://doi.org/10.1002/cssc.201601163
[18] Cai, C., Dai, H., Chen, R., Su, C., Xu, X., Zhang, S., Yang, L., 2008. Studies on the kinetics of in situ epoxidation of vegetable oils. Eur. J. Lipid Sci. Technol. 110, 341–346. https://doi.org/10.1002/ejlt.200700104
[19] Cai, X., Ait Aissa, K., Estel, L., Leveneur, S., 2018. Investigation of the Physicochemical Properties for Vegetable Oils and Their Epoxidized and Carbonated Derivatives. J. Chem. Eng. Data 63, 1524–1533. https://doi.org/10.1021/acs.jced.7b01075
[20] Cai, X., Zheng, J.L., Wärnå, J., Salmi, T., Taouk, B., Leveneur, S., 2017. Influence of gas-liquid mass transfer on kinetic modeling: Carbonation of epoxidized vegetable oils. Chem. Eng. J. 313, 1168–1183. https://doi.org/10.1016/j.cej.2016.11.012
[21] Campanella, A., Baltanás, M.A., 2005. Degradation of the oxirane ring of epoxidized vegetable oils in liquid-liquid systems: I. Hydrolysis and attack by H2O2. Lat. Am. Appl. Res. 35, 205–210.
[22] Campanella, A., Baltanás, M.A., 2004. Degradation of the oxirane ring of epoxidized vegetable oils with solvated acetic acid using cation-exchange resins. Eur. J. Lipid Sci. Technol. 106, 524–530. https://doi.org/10.1002/ejlt.200400965
[23] Campanella, A., Fontanini, C., Baltanás, M.A., 2008. High yield epoxidation of fatty acid methyl esters with performic acid generated in situ. Chem. Eng. J. 144, 466–475. https://doi.org/10.1016/j.cej.2008.07.016
[24] Campanella, A., Rustoy, E., Baldessari, A., Baltanás, M.A., 2010. Lubricants from chemically modified vegetable oils. Bioresour. Technol. 101, 245–254. https://doi.org/10.1016/j.biortech.2009.08.035
[25] Carbonell-Verdu, A., Garcia-Sanoguera, D., Jordá-Vilaplana, A., Sanchez-Nacher, L., Balart, R., 2016. A new biobased plasticizer for poly(vinyl chloride) based on epoxidized cottonseed oil. J. Appl. Polym. Sci. 133. https://doi.org/10.1002/app.43642
[26] Casson Moreno, V., Russo, V., Tesser, R., Di Serio, M., Salzano, E., 2017. Thermal risk in semi-batch reactors: The epoxidation of soybean oil. Process Saf. Environ. Prot. 109, 529–537. https://doi.org/10.1016/j.psep.2017.05.001
[27] Chandrasekara, G., Mahanama, M.K., Edirisinghe, D.G., Karunanayake, L., 2011. Epoxidized vegetable oils as processing aids and activators in carbon-black filled natural rubber compounds. J. Natl. Sci. Found. Sri Lanka 39, 243–250. http://doi.org/10.4038/jnsfsr.v39i3.3628.
[28] Charpentier, J.C., 1981. Mass-Transfer Rates in Gas-Liquid Absorbers and Reactors. Adv. Chem. Eng. 11, 1–133. https://doi.org/10.1016/S0065-2377(08)60025-3
[29] Cheali, P., Gernaey, K.V., Sin, G., 2014. Toward a Computer-Aided Synthesis and Design of Biorefinery Networks: Data Collection and Management Using a Generic Modeling Approach. ACS Sustain. Chem. Eng. 2, 19–29. https://doi.org/10.1021/sc400179f
[30] Chen, B., Zhang, T., Bond, T., Gan, Y., 2015. Development of quantitative structure activity relationship (QSAR) model for disinfection byproduct (DBP) research: A review
153
of methods and resources. J. Hazard. Mater. 299, 260–279. https://doi.org/10.1016/j.jhazmat.2015.06.054
[31] Cheng, Z., Yang, B., Chen, Q., Shen, Z., Yuan, T., 2018. Quantitative relationships between molecular parameters and reaction rate of organic chemicals in Fenton process in temperature range of 15.8 °C–60 °C. Chem. Eng. J. 350, 534–540. https://doi.org/10.1016/j.cej.2017.12.105
[32] Cho, Y.J., Kim, T.E., Gil, B., 2013. Correlation between refractive index of vegetable oils measured with surface plasmon resonance and acid values determined with the AOCS official method. LWT - Food Sci. Technol. 53, 517–521. https://doi.org/10.1016/j.lwt.2013.03.016
[33] Clark, J.H., Farmer, T.J., Herrero-Davila, L., Sherwood, J., 2016. Circular economy design considerations for research and process development in the chemical sciences. Green Chem. 18, 3914–3934. https://doi.org/10.1039/C6GC00501B
[34] Cuéllar-Franca, R.M., Azapagic, A., 2015. Carbon capture, storage and utilisation technologies: A critical analysis and comparison of their life cycle environmental impacts. J. CO2 Util. 9, 82–102. https://doi.org/10.1016/j.jcou.2014.12.001
[35] de Haro, J.C., Rodríguez, J.F., Pérez, Á., Carmona, M., 2016. Incorporation of azide groups into bio-polyols. J. Clean. Prod. 138, 77–82. https://doi.org/10.1016/j.jclepro.2016.05.012
[36] Demirbas, A., 2008. Relationships derived from physical properties of vegetable oil and biodiesel fuels. Fuel 87, 1743–1748. https://doi.org/10.1016/j.fuel.2007.08.007
[37] Demirbaş, A., 2002. Biodiesel from vegetable oils via transesterification in supercritical methanol. Energy Convers. Manag. 43, 2349–2356. https://doi.org/10.1016/S0196-8904(01)00170-4
[38] Desens, W., Werner, T., 2016. Convergent Activation Concept for CO2 Fixation in Carbonates. Adv. Synth. Catal. 358, 622–630. https://doi.org/10.1002/adsc.201500941
[39] Desroches, M., Benyahya, S., Besse, V., Auvergne, R., Boutevin, B., Caillol, S., 2014. Synthesis of bio-based building blocks from vegetable oils: A platform chemicals approach. Lipid Technol. 26, 35–38. https://doi.org/10.1002/lite.201400014
[40] Di Serio, M., Turco, R., Pernice, P., Aronne, A., Sannino, F., Santacesaria, E., 2012. Valuation of Nb2O5–SiO2 catalysts in soybean oil epoxidation. Catal. Today, The 7th International Symposium on Group Five Elements 192, 112–116. https://doi.org/10.1016/j.cattod.2012.03.069
[41] Dinda, S., Patwardhan, A.V., Goud, V.V., Pradhan, N.C., 2008. Epoxidation of cottonseed oil by aqueous hydrogen peroxide catalysed by liquid inorganic acids. Bioresour. Technol. 99, 3737–3744. https://doi.org/10.1016/j.biortech.2007.07.015
[42] Dinesh K. Agarwal, Singh, P., Chakrabarty, M., Shaikh, A.J., Gayal, S.G., 2003. Cottonseed Oil Quality, Utilization and Processing (CICR Technical Bulletin 25).
[43] Edem, D.O., 2002. Palm oil: Biochemical, physiological, nutritional, hematological and toxicological aspects: A review. Plant Foods Hum. Nutr. 57, 319–341. https://doi.org/10.1023/A:1021828132707
[44] Eissen, M., Metzger, J.O., Schmidt, E., Schneidewind, U., 2002. 10 Years after Rio—Concepts on the Contribution of Chemistry to a Sustainable Development. Angew. Chem. Int. Ed. 41, 414–436. https://doi.org/10.1002/1521-3773(20020201)41:3<414::AID-ANIE414>3.0.CO;2-N
[45] Esteban, B., Riba, J.R., Baquero, G., Rius, A., Puig, R., 2012. Temperature dependence of density and viscosity of vegetable oils. Biomass Bioenergy 42, 164–171. https://doi.org/10.1016/j.biombioe.2012.03.007
154
[46] Evans M G, 1949. Evans M G, Uri N. The dissociation constant of hydrogen peroxide and the electron affinity of the HO2 radical. Trans. Faraday Soc. 45, 224–230. https://doi.org/10.1039/TF9494500224
[47] Fasina, O.O., Colley, Z., 2008. Viscosity and Specific Heat of Vegetable Oils as a Function of Temperature: 35°C to 180°C. Int. J. Food Prop. 11, 738–746. https://doi.org/10.1080/10942910701586273
[48] Fasina, O.O., Hallman, H., Craig ‐ Schmidt, M., Clements, C., 2006. Predicting
temperature-dependence viscosity of vegetable oils from fatty acid composition. J. Am. Oil Chem. Soc. 83, 899–903. https://doi.org/10.1007/s11746-006-5044-8
[49] Fernandes, F.C., Kirwan, K., Wilson, P.R., Coles, S.R., 2018. Optimisation of waste vegetable oil-based thermoset polymers. Green Mater. 6, 38–46. https://doi.org/10.1680/jgrma.17.00036
[50] Fox, N.J., Stachowiak, G.W., 2007. Vegetable oil-based lubricants—A review of oxidation. Tribol. Int. 40, 1035–1046. https://doi.org/10.1016/j.triboint.2006.10.001
[51] Freitas, S.V.D., e Silva, F.A., Pastoriza-Gallego, M.J., Piñeiro, M.M., Lima, Á.S., Coutinho, J.A.P., 2013. Measurement and Prediction of Densities of Vegetable Oils at Pressures up to 45 MPa. J. Chem. Eng. Data 58, 3046–3053. https://doi.org/10.1021/je400474w
[52] French, W.H., 1967. In situ epoxidation process. 3.360.531. [53] Fukuda, H., Kondo, A., Noda, H., 2001. Biodiesel fuel production by transesterification
of oils. J. Biosci. Bioeng. 92, 405–416. https://doi.org/10.1016/S1389-1723(01)80288-7 [54] Goldstein, I.S., 2018. Organic Chemicals From Biomass. CRC Press. [55] Goud, V.V., Patwardhan, A.V., Dinda, S., Pradhan, N.C., 2007. Kinetics of epoxidation
of jatropha oil with peroxyacetic and peroxyformic acid catalysed by acidic ion exchange resin. Chem. Eng. Sci. 62, 4065–4076. https://doi.org/10.1016/j.ces.2007.04.038
[56] Goud, V.V., Patwardhan, A.V., Pradhan, N.C., 2006. Studies on the epoxidation of mahua oil (Madhumica indica) by hydrogen peroxide. Bioresour. Technol. 97, 1365–1371. https://doi.org/10.1016/j.biortech.2005.07.004
[57] Greenspan, F.P., Mackellar, D.G., 1948. Analysis of aliphatic per acids. Anal. Chem. 20, 1061–1063. https://doi.org/10.1021/ac60023a0
[58] Hancock, C.K., 1961. A Hammett-Taft Polar-Steric Equation for the Saponification Rates of m-and p-Substituted Alkyl Benzoates. J. Am. Chem. Soc. 83, 4214–4216.
[59] H. Haario, 2001. MODEST-User’s Guide. Profmath Oy, Helsinki. [60] Hita, I., Heeres, H.J., Deuss, P.J., 2018. Insight into structure–reactivity relationships for
the iron-catalyzed hydrotreatment of technical lignins. Bioresour. Technol. 267, 93–101. https://doi.org/10.1016/j.biortech.2018.07.028
[61] Hosney, H., Nadiem, B., Ashour, I., Mustafa, I., El‐Shibiny, A., 2018. Epoxidized
vegetable oil and bio-based materials as PVC plasticizer. J. Appl. Polym. Sci. 135, 46270. https://doi.org/10.1002/app.46270
[62] Hossain, K.M.Z., Patel, U., Ahmed, I., 2015. Development of microspheres for biomedical applications: a review. Prog. Biomater. 4, 1–19. https://doi.org/10.1007/s40204-014-0033-8
[63] Hu, Y.L., Zhang, R.L., Fang, D., 2018. Quaternary phosphonium cationic ionic liquid/porous metal–organic framework as an efficient catalytic system for cycloaddition of carbon dioxide into cyclic carbonates. Environ. Chem. Lett. https://doi.org/10.1007/s10311-018-0793-9
155
[64] Hu, Z., Fan, G., Wang, Y., Li, J., Song, G., 2018. Synthesis of cyclic carbonate via the coupling reaction of carbon dioxide with epoxide at ambient pressure. Greenh. Gases Sci. Technol. 8, 570–579. https://doi.org/10.1002/ghg.1766
[65] Huang, Y.B., Yao, M.Y., Xin, P.P., Zhou, M. chao, Yang, T., Pan, H., 2015. Influence of alkenyl structures on the epoxidation of unsaturated fatty acid methyl esters and vegetable oils. RSC Adv. 5, 74783–74789. https://doi.org/10.1039/C5RA11035A
[66] Huber, G.W., Corma, A., 2007. Synergies between Bio- and Oil Refineries for the Production of Fuels from Biomass. Angew. Chem. Int. Ed. 46, 7184–7201. https://doi.org/10.1002/anie.200604504
[67] Ishimura, T., Yoshida, T., 2015. Polymerization of Oriental Lacquer (Urushi) with Epoxidized Linseed Oil as a New Reactive Diluent. Int. J. Polym. Sci. 2015. https://doi.org/10.1155/2015/782843
[68] Islam, M.R., Beg, M.D.H., Jamari, S.S., 2014. Development of vegetable-oil-based polymers: ARTICLE. J. Appl. Polym. Sci. 131, n/a-n/a. https://doi.org/10.1002/app.40787
[69] Jalilian, M., Yeganeh, H., Haghighi, M.N., 2010. Preparation and characterization of polyurethane electrical insulating coatings derived from novel soybean oil-based polyol. Polym. Adv. Technol. 21, 118–127. https://doi.org/10.1002/pat.1406
[70] Javni, I., Hong, D.P., Petrović, Z.S., 2008. Soy-based polyurethanes by nonisocyanate route. J. Appl. Polym. Sci. 108, 3867–3875. https://doi.org/10.1002/app.27995
[71] Jin, F.L., Park, S.-J., 2007. Thermal and Rheological Properties of Vegetable Oil-based Epoxy Resins Cured with Thermally Latent Initiator. J. Ind. Eng. Chem. 13, 808–814.
[72] Jones, C.R., Radford, R.L., Armstrong, K., Styring, P., 2014. What a waste! Assessing public perceptions of Carbon Dioxide Utilisation technology. J. CO2 Util. 7, 51–54. https://doi.org/10.1016/j.jcou.2014.05.001
[73] Karmakar, G., Ghosh, P., Sharma, B., Karmakar, G., Ghosh, P., Sharma, B.K., 2017. Chemically Modifying Vegetable Oils to Prepare Green Lubricants. Lubricants 5, 44. https://doi.org/10.3390/lubricants5040044
[74] Kawase, Y., 1988. Volumetric Mass Transfer Coefficients in Aerated Stirred Tank Reactors with Newtonian and Non-Newtonian Media. Chem. Eng. Res. Des. 66, 284–288.
[75] Kikuchi, J., Komatsu, T., 2017. CHAPTER 17:Polysaccharides as Major Carbon Sources in Environmental Biodiversity, in: NMR in Glycoscience and Glycotechnology. pp. 369–395. https://doi.org/10.1039/9781782623946-00369
[76] Kim, H.J., Kang, B.S., Kim, M.J., Park, Y.M., Kim, D.K., Lee, J.S., Lee, K.Y., 2004. Transesterification of vegetable oil to biodiesel using heterogeneous base catalyst. Catal. Today, Selections from the presentations of the 3rd Asia-Pacific Congress on Catalysis 93–95, 315–320. https://doi.org/10.1016/j.cattod.2004.06.007
[77] Knopf, D.A., Luo, B.P., Krieger, U.K., Koop, T., 2003. Thermodynamic Dissociation Constant of the Bisulfate Ion from Raman and Ion Interaction Modeling Studies of Aqueous Sulfuric Acid at Low Temperatures. J. Phys. Chem. A 107, 4322–4332. https://doi.org/10.1021/jp027775+
[78] Kolanthai, E., Sarkar, K., Meka, S.R.K., Madras, G., Chatterjee, K., 2015. Copolyesters from Soybean Oil for Use as Resorbable Biomaterials. ACS Sustain. Chem. Eng. 3, 880–891. https://doi.org/10.1021/acssuschemeng.5b00001
[79] Körbitz, W., 1999. Biodiesel production in Europe and North America, an encouraging prospect. Renew. Energy, Renewable Energy Energy Efficiency, Policy and the Environment 16, 1078–1083. https://doi.org/10.1016/S0960-1481(98)00406-6
156
[80] Kowalski, B., 1988. Determination of specific heats of some edible oils and fats by differential scanning calorimetry. J. Therm. Anal. Calorim. 34, 1321–1326. https://doi.org/10.1007/BF01914356
[81] Lang, X.D., 2016. Green Catalytic Process for Cyclic Carbonate Synthesis from Carbon Dioxide under Mild Conditions. Chem. Rec. 16, 1337–1352. https://doi.org/10.1002/tcr.201500293
[82] Langanke, J., Greiner, L., Leitner, W., 2013. Substrate dependent synergetic and antagonistic interaction of ammonium halide and polyoxometalate catalysts in the synthesis of cyclic carbonates from oleochemical epoxides and CO2. Green Chem. 15, 1173–1182. https://doi.org/10.1039/C3GC36710J
[83] Lathi, P., Mattiasson, B., 2007. Green approach for the preparation of biodegradable lubricant base stock from epoxidized vegetable oil. Appl. Catal. B Environ. 69, 207–212. https://doi.org/10.1016/j.apcatb.2006.06.016
[84] Lee, D.S., Noh, B.S., Bae, S.Y., Kim, K., 1998. Characterization of fatty acids composition in vegetable oils by gas chromatography and chemometrics. Anal. Chim. Acta 358, 163–175. https://doi.org/10.1016/S0003-2670(97)00574-6
[85] Leis, J.R., Kramer, M.A., 1988. Algorithm 658: ODESSA–an Ordinary Differential Equation Solver with Explicit Simultaneous Sensitivity Analysis. ACM Trans Math Softw 14, 61–67. https://doi.org/10.1145/42288.214371
[86] Leung, D.Y.C., Wu, X., Leung, M.K.H., 2010. A review on biodiesel production using catalyzed transesterification. Appl. Energy 87, 1083–1095. https://doi.org/10.1016/j.apenergy.2009.10.006
[87] Leveneur, S., 2017. Thermal Safety Assessment through the Concept of Structure–Reactivity: Application to Vegetable Oil Valorization. Org. Process Res. Dev. 21, 543–550. https://doi.org/10.1021/acs.oprd.6b00405
[88] Leveneur, S., Estel, L., Crua, C., 2015. Thermal risk assessment of vegetable oil epoxidation. J. Therm. Anal. Calorim. 122, 795–804. https://doi.org/10.1007/s10973-015-4793-8
[89] Leveneur, S., Salmi, T., Murzin, D.Y., Estel, L., Wärnå, J., Musakka, N., 2008. Kinetic Study and Modeling of Peroxypropionic Acid Synthesis from Propionic Acid and Hydrogen Peroxide Using Homogeneous Catalysts. Ind. Eng. Chem. Res. 47, 656–664. https://doi.org/10.1021/ie070670e
[90] Leveneur, S., Wärnå, J., Salmi, T., Murzin, D.Y., Estel, L., 2009. Interaction of intrinsic kinetics and internal mass transfer in porous ion-exchange catalysts: Green synthesis of peroxycarboxylic acids. Chem. Eng. Sci. 64, 4101–4114. https://doi.org/10.1016/j.ces.2009.05.055
[91] Leveneur, S., Zheng, J., Taouk, B., Burel, F., Wärnå, J., Salmi, T., 2014. Interaction of thermal and kinetic parameters for a liquid–liquid reaction system: Application to vegetable oils epoxidation by peroxycarboxylic acid. J. Taiwan Inst. Chem. Eng. 45, 1449–1458. https://doi.org/10.1016/j.jtice.2014.01.015
[92] Li, Z., Zhao, Y., Yan, S., Wang, X., Kang, M., Wang, J., Xiang, H., 2008. Catalytic Synthesis of Carbonated Soybean Oil. Catal. Lett. 123, 246–251. https://doi.org/10.1007/s10562-008-9414-8
[93] Lilja, J., Murzin, D.Y., Salmi, T., Aumo, J., Mäki-Arvela, P., Sundell, M., 2002. Esterification of different acids over heterogeneous and homogeneous catalysts and correlation with the Taft equation. J. Mol. Catal. Chem. 182–183, 555–563. https://doi.org/10.1016/S1381-1169(01)00495-2
157
[94] Liu, W., Lu, G., Xiao, B., Xie, C., 2018. Potassium iodide–polyethylene glycol catalyzed cycloaddition reaction of epoxidized soybean oil fatty acid methyl esters with CO2. RSC Adv. 8, 30860–30867. https://doi.org/10.1039/C8RA05947K
[95] Maerker, G., 1965. Determination of oxirane content of derivatives of fats. J. Am. Oil Chem. Soc. 42, 329–332.
[96] Maisonneuve, L., Lamarzelle, O., Rix, E., Grau, E., Cramail, H., 2015. Isocyanate-Free Routes to Polyurethanes and Poly(hydroxy Urethane)s. Chem. Rev. 115, 12407–12439. https://doi.org/10.1021/acs.chemrev.5b00355
[97] Mann, N., Mendon, S.K., Rawlins, J.W., Thames, S.F., 2008. Synthesis of Carbonated Vernonia Oil. J. Am. Oil Chem. Soc. 85, 791–796. https://doi.org/10.1007/s11746-008-1249-3
[98] Mardhiah, H.H., Ong, H.C., Masjuki, H.H., Lim, S., Lee, H.V., 2017. A review on latest developments and future prospects of heterogeneous catalyst in biodiesel production from non-edible oils. Renew. Sustain. Energy Rev. 67, 1225–1236. https://doi.org/10.1016/j.rser.2016.09.036
[99] Markewitz, P., Kuckshinrichs, W., Leitner, W., Linssen, J., Zapp, P., Bongartz, R., Schreiber, A., Müller, T.E., 2012. Worldwide innovations in the development of carbon capture technologies and the utilization of CO2. Energy Environ. Sci. 5, 7281–7305. https://doi.org/10.1039/C2EE03403D
[100] Marquardt, D., 1963. An Algorithm for Least-Squares Estimation of Nonlinear Parameters. J. Soc. Ind. Appl. Math. 11, 431–441. https://doi.org/10.1137/0111030
[101] Martens, J.A., Bogaerts, A., De Kimpe, N., Jacobs, P.A., Marin, G.B., Rabaey, K., Saeys, M., Verhelst, S., 2017. The Chemical Route to a Carbon Dioxide Neutral World. ChemSusChem. https://doi.org/10.1002/cssc.201601051
[102] Mazo, P., Rios, L., 2013. Carbonation of Epoxidized Soybean Oil Improved by the Addition of Water. J. Am. Oil Chem. Soc. 90, 725–730. https://doi.org/10.1007/s11746-013-2214-3
[103] M. Doll, K., Z. Erhan, S., 2005. The improved synthesis of carbonated soybean oil using supercritical carbon dioxide at a reduced reaction time. Green Chem. 7, 849–854. https://doi.org/10.1039/B511014A
[104] Mehta, B., Kathalewar, M., Sabnis, A., 2015. Cyclic Carbonated Soyabean Oil as Plasticizer for PVC for Replacing Di-octyl Phthalate. J. Polym. Mater. 32, 17–29.
[105] Meier, M.A.R., 2009. Metathesis with Oleochemicals: New Approaches for the Utilization of Plant Oils as Renewable Resources in Polymer Science. Macromol. Chem. Phys. 210, 1073–1079. https://doi.org/10.1002/macp.200900168
[106] Meléndez, J., North, M., Pasquale, R., 2007. Synthesis of Cyclic Carbonates from Atmospheric Pressure Carbon Dioxide Using Exceptionally Active Aluminium(salen) Complexes as Catalysts. Eur. J. Inorg. Chem. 2007, 3323–3326. https://doi.org/10.1002/ejic.200700521
[107] Meylan, F.D., Moreau, V., Erkman, S., 2015. CO2 utilization in the perspective of industrial ecology, an overview. J. CO2 Util. 12, 101–108. https://doi.org/10.1016/j.jcou.2015.05.003
[108] Mikkelsen, M., Jørgensen, M., C. Krebs, F., 2010. The teraton challenge. A review of fixation and transformation of carbon dioxide. Energy Environ. Sci. 3, 43–81. https://doi.org/10.1039/B912904A
[109] Miloslavskiy, D., Gotlib, E., Figovsky, O., Pashin, D., 2014. Cyclic carbonates based on vegetable oils. Int. Lett. Chem. Phys. Astron. 8, 20. https://doi.org/10.18052/www.scipress.com/ILCPA.27.20.
158
[110] Murawski, A., Quirino, R.L., 2018. Vegetable Oils as a Chemical Platform, in: Thakur, V.K., Thakur, M.K., Voicu, S.I. (Eds.), Polymer Gels: Perspectives and Applications, Gels Horizons: From Science to Smart Materials. Springer Singapore, Singapore, pp. 125–152. https://doi.org/10.1007/978-981-10-6080-9_6
[111] Narra, N., Rachapudi, B.N.P., Vemulapalli, S.P.B., Korlipara, P.V., 2016. Lewis-acid catalyzed synthesis and characterization of novel castor fatty acid-based cyclic carbonates. RSC Adv. 6, 25703–25712. https://doi.org/10.1039/C6RA00880A
[112] North, M., Pasquale, R., 2009. Mechanism of Cyclic Carbonate Synthesis from Epoxides and CO2. Angew. Chem. 121, 2990–2992. https://doi.org/10.1002/ange.200805451
[113] Ogunniyi, D.S., 2006. Castor oil: A vital industrial raw material. Bioresour. Technol. 97, 1086–1091. https://doi.org/10.1016/j.biortech.2005.03.028
[114] Omonov, T.S., Kharraz, E., Curtis, J.M., 2016. The epoxidation of canola oil and its derivatives. RSC Adv. 6, 92874–92886. https://doi.org/10.1039/C6RA17732H
[115] Onyenkeadi, V., Aboelazayem, O., Kellici, S., Saha, B., 2018. Greener synthesis of butylene carbonate via CO2 utilisation using graphene-inorganic nanocomposite catalysts. Presented at the GPE 2018 – 6th International Congress on Green Process Engineering, Toulouse, France.
[116] Orsavova, J., Misurcova, L., Ambrozova, J., Vicha, R., Mlcek, J., Orsavova, J., Misurcova, L., Ambrozova, J.V., Vicha, R., Mlcek, J., 2015. Fatty Acids Composition of Vegetable Oils and Its Contribution to Dietary Energy Intake and Dependence of Cardiovascular Mortality on Dietary Intake of Fatty Acids. Int. J. Mol. Sci. 16, 12871–12890. https://doi.org/10.3390/ijms160612871
[117] Otto, S., Botha, E., Roodt, A., 2018. Structure and Reactivity Relationships in Methyl and Hydrido Complexes of Platinum(II) by Group 15 Donor Atom Ligands. Croat. Chem. Acta 91, 265–279. https://doi.org/10.5562/cca3344
[118] Panchal, T.M., Patel, A., Chauhan, D.D., Thomas, M., Patel, J.V., 2017. A methodological review on bio-lubricants from vegetable oil based resources. Renew. Sustain. Energy Rev. 70, 65–70. https://doi.org/10.1016/j.rser.2016.11.105
[119] Paquot, C., 2013. Standard Methods for the Analysis of Oils, Fats and Derivatives. Elsevier.
[120] Parzuchowski, P.G., Jurczyk‐Kowalska, M., Ryszkowska, J., Rokicki, G., 2006. Epoxy resin modified with soybean oil containing cyclic carbonate groups. J. Appl. Polym. Sci. 102, 2904–2914. https://doi.org/10.1002/app.24795
[121] Petrović, Z.S., 2008. Polyurethanes from Vegetable Oils. Polym. Rev. 48, 109–155. https://doi.org/10.1080/15583720701834224
[122] Petrović, Z.S., Zlatanić, A., Lava, C.C., Sinadinović‐Fišer, S., 2002. Epoxidation of
soybean oil in toluene with peroxoacetic and peroxoformic acids -kinetics and side reactions. Eur. J. Lipid Sci. Technol. 104, 293–299. https://doi.org/10.1002/1438-9312(200205)104:5<293::AID-JLT293>3.0.CO;2-W
[123] Pfister, D.P., Xia, Y., Larock, R.C., 2011. Recent Advances in Vegetable Oil-Based Polyurethanes. ChemSusChem 4, 703–717. https://doi.org/10.1002/cssc.201000378
[124] Pinzi, S., Garcia, I.L., Lopez-Gimenez, F.J., Luque de Castro, M.D., Dorado, G., Dorado, M.P., 2009. The Ideal Vegetable Oil-based Biodiesel Composition: A Review of Social, Economical and Technical Implications. Energy Fuels 23, 2325–2341. https://doi.org/10.1021/ef801098a
[125] Poussard, L., Mariage, J., Grignard, B., Detrembleur, C., Jérôme, C., Calberg, C., Heinrichs, B., De Winter, J., Gerbaux, P., Raquez, J.M., Bonnaud, L., Dubois, P., 2016.
159
Non-Isocyanate Polyurethanes from Carbonated Soybean Oil Using Monomeric or Oligomeric Diamines To Achieve Thermosets or Thermoplastics. Macromolecules 49, 2162–2171. https://doi.org/10.1021/acs.macromol.5b02467
[126] Ramesh, M., Palanikumar, K., Reddy, K.H., 2017. Plant fibre based bio-composites: Sustainable and renewable green materials. Renew. Sustain. Energy Rev. 79, 558–584. https://doi.org/10.1016/j.rser.2017.05.094
[127] Ramírez Verduzco, L.F., 2013. Density and viscosity of biodiesel as a function of temperature: Empirical models. Renew. Sustain. Energy Rev. 19, 652–665. https://doi.org/10.1016/j.rser.2012.11.022
[128] Ramos, M.J., Fernández, C.M., Casas, A., Rodríguez, L., Pérez, Á., 2009. Influence of fatty acid composition of raw materials on biodiesel properties. Bioresour. Technol. 100, 261–268. https://doi.org/10.1016/j.biortech.2008.06.039
[129] Rasal, K.B., Yadav, G.D., Koskinen, R., Keiski, R., 2018. Solventless synthesis of cyclic carbonates by direct utilization of CO2 using nanocrystalline lithium promoted magnesia. Mol. Catal., Metal Oxides in Catalysis - Professor Benjaram M. Reddy Festschrift 451, 200–208. https://doi.org/10.1016/j.mcat.2018.01.012
[130] Rastogi, N.K., Raghavarao, K.S.M.S., Niranjan, K., Knorr, D., 2002. Recent developments in osmotic dehydration: methods to enhance mass transfer. Trends Food Sci. Technol. 13, 48–59. https://doi.org/10.1016/S0924-2244(02)00032-8
[131] Rodis, P.S., Karathanos, V.T., Mantzavinou, A., 2002. Partitioning of Olive Oil Antioxidants between Oil and Water Phases. J. Agric. Food Chem. 50, 596–601. https://doi.org/10.1021/jf010864j
[132] Rokicki, G., Parzuchowski, P.G., Mazurek, M., 2015. Non-isocyanate polyurethanes: synthesis, properties, and applications: Non-Isocyanate Polyurethanes: Synthesis, Properties, and Applications. Polym. Adv. Technol. 26, 707–761. https://doi.org/10.1002/pat.3522
[133] Santacesaria, E., Tesser, R., Di Serio, M., Turco, R., Russo, V., Verde, D., 2011. A biphasic model describing soybean oil epoxidation with H2O2 in a fed-batch reactor. Chem. Eng. J. 173, 198–209. https://doi.org/10.1016/j.cej.2011.05.018
[134] Saurabh, T., Patnaik, M., Bhagt, S., Renge, V., 2011. Epoxidation of vegetable oils: a review. Int. J. Adv. Eng. Technol. 2, 491–501.
[135] Sawpan, M.A., 2018. Polyurethanes from vegetable oils and applications: a review. J. Polym. Res. 25, 184. https://doi.org/10.1007/s10965-018-1578-3
[136] Scala, J.L., Wool, R.P., 2005. Rheology of chemically modified triglycerides. J. Appl. Polym. Sci. 95, 774–783. https://doi.org/10.1002/app.20846
[137] Sepulveda, J., Teixeira, S., Schuchardt, U., 2007. Alumina-catalyzed epoxidation of unsaturated fatty esters with hydrogen peroxide. Appl. Catal. Gen. 318, 213–217. https://doi.org/10.1016/j.apcata.2006.11.004
[138] Sheldon, R.A., Van Doorn, J.A., 1973. Metal-catalyzed epoxidation of olefins with organic hydroperoxides: I. A comparison of various metal catalysts. J. Catal. 31, 427–437. https://doi.org/10.1016/0021-9517(73)90314-X
[139] Singh, H.K.A.G., Yusup, S., Wai, C.K., 2016. Physicochemical Properties of Crude Rubber Seed Oil for Biogasoline Production. Procedia Eng., Proceeding of 4th International Conference on Process Engineering and Advanced Materials (ICPEAM 2016) 148, 426–431. https://doi.org/10.1016/j.proeng.2016.06.441
[140] Singh, S.P., Singh, D., 2010. Biodiesel production through the use of different sources and characterization of oils and their esters as the substitute of diesel: A review. Renew. Sustain. Energy Rev. 14, 200–216. https://doi.org/10.1016/j.rser.2009.07.017
160
[141] Souza, L.F.S., Ferreira, P.R.R., de Medeiros, J.L., Alves, R.M.B., Araújo, O.Q.F., 2014. Production of DMC from CO2 via Indirect Route: Technical–Economical–Environmental Assessment and Analysis. ACS Sustain. Chem. Eng. 2, 62–69. https://doi.org/10.1021/sc400279n
[142] Spendley, W., Hext, G.R., Himsworth, F.R., 1962. Sequential Application of Simplex Designs in Optimisation and Evolutionary Operation. Technometrics 4, 441–461. https://doi.org/10.1080/00401706.1962.10490033
[143] Stoessel, F., 2008. Thermal Safety of Chemical Processes: Risk Assessment and Process Design. John Wiley & Sons.
[144] Sue, K., Ouchi, F., Minami, K., Arai, K., 2004. Determination of Carboxylic Acid Dissociation Constants to 350°C at 23 MPa by Potentiometric pH Measurements. J. Chem. Eng. Data 49, 1359–1363. https://doi.org/10.1021/je049923q
[145] Tamami, B., Sohn, S., Wilkes, G.L., 2004. Incorporation of carbon dioxide into soybean oil and subsequent preparation and studies of nonisocyanate polyurethane networks. J. Appl. Polym. Sci. 92, 883–891. https://doi.org/10.1002/app.20049
[146] Tan, S.G., Chow, W.S., 2010. Biobased Epoxidized Vegetable Oils and Its Greener Epoxy Blends: A Review. Polym.-Plast. Technol. Eng. 49, 1581–1590. https://doi.org/10.1080/03602559.2010.512338
[147] Thakur, V.K., Thakur, M.K., Kessler, M.R., 2017. Handbook of Composites from Renewable Materials, Polymeric Composites. John Wiley & Sons.
[148] Tiran, C., Lecomte, J., Dubreucq, E., Villeneuve, P., 2008. Chemo-enzymatic epoxidation of fatty compounds - Focus on processes involving a lipase-catalyzed perhydrolysis step. OCL Ol. Corps Gras Lipides 15, 179–183.
[149] Turco, R., 2011. Industrial catalytic processes intensification through the use of microreactors. https://doi.org/10.6092/UNINA/FEDOA/8776
[150] USDA, F., 2010. Oilseeds: world markets and trade. [151] Vahteristo, K., Laari, A., Haario, H., Solonen, A., 2008. Estimation of kinetic parameters
in neopentyl glycol esterification with propionic acid. Chem. Eng. Sci. 63, 587–598. https://doi.org/10.1016/j.ces.2007.09.023
[152] Wang, J., Zhao, Y., Li, Q., Yin, N., Feng, Y., Kang, M., Wang, X., 2012. Pt doped H3PW12O40/ZrO2 as a heterogeneous and recyclable catalyst for the synthesis of carbonated soybean oil. J. Appl. Polym. Sci. 124, 4298–4306. https://doi.org/10.1002/app.35418
[153] Warwel, S., Rüsch gen. Klaas, M., 1995. Chemo-enzymatic epoxidation of unsaturated carboxylic acids. J. Mol. Catal. B Enzym. 1, 29–35. https://doi.org/10.1016/1381-1177(95)00004-6
[154] Wilke, C.R., Chang, P., 1955. Correlation of diffusion coefficients in dilute solutions. AIChE J. 1, 264–270.
[155] Wu, Q., Hu, Y., Tang, J., Zhang, J., Wang, C., Shang, Q., Feng, G., Liu, C., Zhou, Y., Lei, W., 2018. High-Performance Soybean-Oil-Based Epoxy Acrylate Resins: “Green” Synthesis and Application in UV-Curable Coatings. ACS Sustain. Chem. Eng. 6, 8340–8349. https://doi.org/10.1021/acssuschemeng.8b00388
[156] Wu, X., Wang, M., Xie, Y., Chen, C., Li, K., Yuan, M., Zhao, X., Hou, Z., 2016. Carboxymethyl cellulose supported ionic liquid as a heterogeneous catalyst for the cycloaddition of CO2 to cyclic carbonate. Appl. Catal. Gen. 519, 146–154. https://doi.org/10.1016/j.apcata.2016.04.002
[157] Wu Zhenyu, Nie Yong, Chen Wei, Wu Lihang, Chen Ping, Lu Meizhen, Yu Fengwen, Ji Jianbing, 2016. Mass transfer and reaction kinetics of soybean oil epoxidation in a
161
formic acid‐ autocatalyzed reaction system. Can. J. Chem. Eng. 94, 1576–1582.
https://doi.org/10.1002/cjce.22526 [158] Xia, Y., Larock, R.C., 2010. Vegetable oil-based polymeric materials: synthesis,
properties, and applications. Green Chem. 12, 1893. https://doi.org/10.1039/c0gc00264j [159] Yan, M., Frank, E.M., Cochran, E.W., 2018. Effects of Vegetable Oil Composition on
Epoxidation Kinetics and Physical Properties. J. Am. Oil Chem. Soc. 95, 209–216. https://doi.org/10.1002/aocs.12014
[160] Yang, Z.Z., He, L.N., Gao, J., Liu, A.H., Yu, B., 2012. Carbon dioxide utilization with C–N bond formation: carbon dioxide capture and subsequent conversion. Energy Environ. Sci. 5, 6602–6639. https://doi.org/10.1039/C2EE02774G
[161] Zhang, C., Garrison, T.F., Madbouly, S.A., Kessler, M.R., 2017. Recent advances in vegetable oil-based polymers and their composites. Prog. Polym. Sci., Topical Volume on Polymeric Biomaterials 71, 91–143. https://doi.org/10.1016/j.progpolymsci.2016.12.009
[162] Zhang, L., Luo, Y., Hou, Z., He, Z., Eli, W., 2014. Synthesis of Carbonated Cotton Seed Oil and Its Application as Lubricating Base Oil. J. Am. Oil Chem. Soc. 91, 143–150. https://doi.org/10.1007/s11746-013-2358-1
[163] Zheng, J.L., Burel, F., Salmi, T., Taouk, B., Leveneur, S., 2015. Carbonation of Vegetable Oils: Influence of Mass Transfer on Reaction Kinetics. Ind. Eng. Chem. Res. 54, 10935–10944. https://doi.org/10.1021/acs.iecr.5b02006
[164] Zheng, J.L., Tolvanen, P., Taouk, B., Eränen, K., Leveneur, S., Salmi, T., 2018. Synthesis of carbonated vegetable oils: Investigation of microwave effect in a pressurized continuous-flow recycle batch reactor. Chem. Eng. Res. Des. 132, 9–18. https://doi.org/10.1016/j.cherd.2017.12.037
[165] Zheng, J.L., Wärnå, J., Salmi, T., Burel, F., Taouk, B., Leveneur, S., 2016. Kinetic modeling strategy for an exothermic multiphase reactor system: Application to vegetable oils epoxidation using Prileschajew method. AIChE J. 62, 726–741. https://doi.org/10.1002/aic.15037

162
163
LIST OF TABLES
Table 1.1. Chemical structures of mainly fatty acid species.
Table 1.2. Fatty acid components of common industrial vegetable oils.
Table 1.3. Literature review for the carbonation of epoxidized vegetable oils with catalysts.
Table 3.1. Experimental Matrix with an agitation velocity of 650 rpm.
Table 3.2. Distribution coefficients of acetic acid KAA.
Table 3.3. Estimated kinetic constants and statistical data at Tref = 330 K for epoxidation.
Table 3.4. Matrix of correlation.
Table 3.5. Initial experimental conditions for each configuration.
Table 4.1. Components of vegetable oils in mass fraction.
Table 4.2. Molar fractions: xDB, xEp, xRO, xCarb and iodine number for the different species.
Table 4.3. Evolution of a and b for the refractive index.
Table 4.4. Evolution of a’ and b’ for the density.
Table 4.5. Arrhenius data for Eq. (4.3).
Table 4.6. Evolution of the coefficients A, B and C of Eq. (4.5) for vegetable oils and their
derivatives.
Table 4.7. Solution components.
Table 4.8. OARD of refractive index, density, lnµ and specific heat capacity.
Table 5.1. Experimental Matrix for carbonation reaction with an agitation velocity of 500rpm.
Table 5.2. Mass transfer experimental matrix.
Table 5.3. Estimated and statistical data for modified mass transfer coefficients.
Table 5.4. Correlation matrix.
Table 5.5. Estimated and statistical data at Tref = 403 K for carbonation.
Table 5.6. Correlation matrix.
Table 6.1. Mass transfer experimental matrix.
Table 6.2. Experimental matrix for carbonation experiments with initial concentrations.
Table 6.3. Evolution of a’ and b’ for the density.
Table 6.4. Arrhenius data.
Table 6.5. Estimated and statistical data for modified mass transfer coefficients.

164
165
LIST OF FIGURES
Figure 1.1 General structure of triglyceride of vegetable oil
Figure 1.2 Typical reaction pathways for vegetable oils application (R1, R2, R3 represent
different fatty acids; R4, R5, R6 represent different carbon chains)
Figure 1.3 Typical epoxidized vegetable oil derivatives as additive materials for biolubricants
Figure 1.4 General structure of epoxidized vegetable oil
Figure 1.5 Prileschajew epoxidation mechanisms of vegetable oil
Figure 1.6 Chemoenzymatic epoxidation mechanisms of vegetable oil
Figure 1.7 General structure of carbonated vegetable oil
Figure 1.8 Synthesis of carbonated vegetable oil
Figure 2.1. Experimental apparatus: (a) epoxidation and ring opening reactor (b) schematic
view of epoxidation and ring opening setup.
Figure 2.2. Experimental apparatus: (a) carbonation reactor (b) Schematic view of carbonation
setup
Figure 3.1. Effect of sulfuric acid concentration on the kinetics of ring opening reaction at 70 °C
with [ECSO]org, initial=3.28-3.87 mol L-1, [AA]aq, initial=0.00 mol L-1, [H2O2]aq, initial=0.00 mol L-1
and rotating speed of 650 rpm.
Figure 3.2. Effect of hydrogen peroxide concentration on the kinetics of ring opening reaction
at 70 °C with [ECSO]org, initial=3.19-3.54 mol L-1, [AA]aq =0.00 mol L-1, [H2SO4]aq=0.76-0.82
mol L-1 and rotating speed of 650 rpm.
Figure 3.3. Effect of acetic acid concentration on the kinetics of ring opening reaction at 50 °C
with [ECSO]org, initial=3.79-3.86 mol L-1, [H2O2]aq, initial=5.95-6.07 mol L-1, [H2SO4]aq=0.26 mol
L-1and rotating speed of 650 rpm.
Figure 3.4. Epoxidation and ring opening mechanism for vegetable oil by using acetic acid.
Figure 3.5 Ring opening reaction by nucleophile NuH (water, hydrogen peroxide, acetic or
peracetic acid).
Figure 3.6. Strategy of kinetic modeling.
Figure 3.7A. Fit of the model to the experimental data for Runs 6.
Figure 3.7B. Fit of the model to the experimental data for Runs 9.
Figure 3.7C. Fit of the model to the experimental data for Runs 14.
Figure 3.7D. Fit of the model to the experimental data for Runs 19.
Figure 3.7E. Fit of the model to the experimental data for Runs 27.
Figure 3.7F. Fit of the model to the experimental data for Runs 28.
Figure 3.8. Overall parity plot of experimental versus simulated values for the ring opening of
ECSO.
Figure 3.9. Distribution of compounds in the organic phase for the numerical experiments:
Batch, SemiBatch HP, SemiBatch AA, SemiBatch HP SA and SemiBatch AA SA.
166
Figure 4.1. Measured refractive index versus temperature for cottonseed oil, epoxidized
cottonseed oil and carbonated cottonseed oil. ◆, CSO; ●, ECSO; ○, CCSO.
Figure 4.2. Measured density versus temperature for cottonseed oil, epoxidized cottonseed oil
and carbonated cottonseed oil. ◆, CSO; ●, ECSO; ○, CCSO.
Figure 4.3. Measured dynamic viscosity versus temperature for cottonseed oil, epoxidized
cottonseed oil and carbonated cottonseed oil. ◆, CSO; ●, ECSO; ○, CCSO.
Figure 4.4. Linear correlation between the logarithm of viscosity and 1/RT.
◆, CSO; ●, ECSO; ○, CCSO.
Figure 4.5. Illustration of Cp measurement with C80 for SBO. ●, Temperature_SBO;
▲, Temperature_Blank; ○, Heat_flow_SBO; △, Heat_flow_Blank.
Figure 4.6. Evolution of specific heat capacity of cottonseed oil and its derivatives with
temperature. ◆, LSO; ●, ELSO; ○, CLSO.
Figure 4.7. Polynomial fitting for Cp(T) / Cp(313.15 K) for cottonseed oil and its derivatives.
◆, CSO; ●, ECSO; ○, CCSO.
Figure 4.8. Fit of the model to the refractive index experimental data of solution S1.
●, Experimental data; ━, Model data.
Figure 4.9. Fit of the model to the density experimental data of solution S3.
●, Experimental data; ━, Model data.
Figure 4.10. Fit of the model to the viscosity experimental data of solution S1.
●, Experimental data; ━, Model data.
Figure 4.11. Fit of the model to the specific heat capacity experimental data of solution S2.
●, Experimental data; ━, Model data.
Figure 5.1. Effect of the CO2 pressure on the kinetics of carbonation at 120 °C, [TBABr] = 0.13
mol.L-1, [ECSO]0= 3.4-3.5 mol.L-1 and rotating speed of 500 rpm.
Figure 5.2. Effect of temperature on the kinetics of carbonation at [TBABr] = 0.13 mol.L-1,
[ECSO]0= 3.4-3.5 mol.L-1, 50 bar and rotating speed of 500 rpm.
Figure 5.3. Effect of initial concentration of ECSO on the kinetics of carbonation at [TBABr]
= 0.13 mol.L-1, 110°C and rotating speed of 500 rpm.
Figure 5.4. Effect of catalyst concentration on the kinetics of carbonation at [ECSO]0 = 3.2-3.4
mol.L-1, 50 bar, 140 °C and agitation speed of 500 rpm.
Figure 5.5. ln(RCarbonation,0) versus ln([TBABr]) at [ECSO]0= 3.2-3.4 mol.L-1, 50 bar, 140 °C
with agitation speed of 500 rpm.
Figure 5.6. Simplified mechanism of carbonation of epoxidized vegetable oils by TBABr.
Figure 5.7. Effect of CO2 pressure on the kinetics of CO2 absorption in the ECSO solution at
130 °C and rotating speed of 500 rpm.
167
Figure 5.8. Effect of temperature on the kinetics of CO2 absorption in the epoxidized cottonseed
oil solution at 20 bar and rotating speed of 500 rpm.
Figure 5.9. Effect of the components on the kinetics of CO2 absorption in the liquid phase at 20
bar, 120 °C and rotating speed of 500 rpm.
Figure 5.10. Evolution of the Henry’s constant at different temperatures for ECSO.
Figure 5.11. Evolution of the Henry’s constant at different temperatures for CCSO.
Figure 5.12. Evolution of the Henry’s constant at different temperature for CSO.
Figure 5.13. Evolution of the Henry’s constant versus temperature.
Figure 5.14. Van’t Hoff curve for Henry’s constants for cottonseed oil (CSO), epoxidized
cottonseed oil (ECSO) and carbonated cottonseed oil (CCSO).
Figure 5.15. A Fit of the model to the the mass transfer experimental observation for Run 25.
Figure 5.15. B Fit of the model to the mass transfer experimental observation for Run 38.
Figure 5.15. C Fit of the model to the the mass transfer experimental observation for Run 49.
Figure 5.15. D Fit of the model to the the mass transfer experimental observation for Run 53.
Figure 5.16. A Fit of the model to the experiments and simulation of [CO2]liq for Run 1.
Figure 5.16. B Fit of the model to the experiments and simulation of [CO2]liq for Run 3.
Figure 5.16. C Fit of the model to the experiments and simulation of [CO2]liq for Run 4.
Figure 5.17. Plots of the parameter sensitivity analysis (MCMC).
Figure 5.18. A Evolution of mass transfer coefficient for Run 1.
Figure 5.18. B Evolution of mass transfer coefficient for Run 4.
Figure 5.18. C Evolution of mass transfer coefficient for Run 12.
Figure 6.1 Ratio of FAME
CSO
ρρ ,
EFAME
ECSO
ρρ and
CFAME
CCSO
ρρ versus temperature
Figure 6.2 Ratio of îÞ÷3îø�ùú,
îúÞ÷3îúø�ùú and îÞÞ÷3îÞø�ùú versus temperature
Figure 6.3. Effect of CO2 pressure on the kinetics of CO2 absorption in the EFAME solution at
130 °C and rotating speed of 500 rpm
Figure 6.4. Effect of temperature on the kinetics of CO2 absorption in the EFAME solution at
20 bar and rotating speed of 500 rpm
Figure 6.5. Effect of the components on the kinetics of CO2 absorption in the EFAME solution
at 20 bar, 120°C and rotating speed of 500 rpm.
Figure 6.6 Evolution of the solubility of CO2 at different CO2 pressure for EFAME
Figure 6.7. Ratio of FAME
CSO
He
He,
EFAME
ECSO
He
Heand
CFAME
CCSO
He
Heversus temperature
Figure 6.8 Van’t Hoff curve for Henry’s constants
Figure 6.9. Fitting of the model to the experimental observation for CO2 absorption in the
FAME solution at 20 bar, 110 °C and rotating speed of 500 rpm for Run 9.
168
Figure 6.10. The carbonation kinetic model fitting of ECSO and EFAME at 110°C, 30bar,
[TBABr]= 0.13 mol.L-1and rotating speed of 500 rpm for Runs 53 and 61.
Figure 6.11. The carbonation kinetic model fitting of ECSO and EFAME at 130°C, 30bar,
[TBABr]= 0.13 mol.L-1 and rotating speed of 500 rpm for Runs 52 and 63.
Figure 6.12. The variation of M��^����^����O\�M��^����^����O\�� \ with different reaction temperature.
Figure I- 19. Measured density index versus temperature for linseed oil, epoxidized linseed oil
and carbonated linseed oil. ◆, LSO; ●, ELSO; ○, CLSO.
Figure I- 20. Measured density index versus temperature for soybean oil, epoxidized soybean
oil and carbonated soybean oil. ◆, SBO; ●, ESBO; ○, CSBO.
Figure I- 3. Measured dynamic viscosity versus temperature for linseed oil, epoxidized linseed
oil and carbonated linseed oil. ◆, LSO; ●, ELSO; ○, CLSO.
Figure I- 4. Measured dynamic viscosity versus temperature for soybean oil, epoxidized
soybean oil and carbonated soybean oil. ◆, SBO; ●, ESBO; ○, CSBO.
Figure I- 5.Linear correlation between the logarithm of viscosity and 1/RT.
◆, LSO; ●, ELSO; ○, CLSO.
Figure I- 621. Linear correlation between the logarithm of viscosity and 1/RT.
◆, SBO; ●, ESBO; ○, CSBO.
Figure I- 22. Evolution of specific heat capacity of cottonseed oil and its derivatives with
temperature. ◆, CSO; ●, ECSO; ○, CCSO.
Figure I- 8. Evolution of specific heat capacity of cottonseed oil and its derivatives with
temperature. ◆, SBO; ●, ESBO; ○, CSBO.
Figure I- 9. Polynomial fitting for Cp(T) / Cp(313.15 K) for cottonseed oil and its derivatives.
◆, LSO; ●, ELSO; ○, CLSO.
Figure I- 10. Polynomial fitting for Cp(T) / Cp(313.15 K) for cottonseed oil and its derivatives.
◆, SBO; ●, ESBO; ○, CSBO.
Figure I- 11. Fit of the model to the refractive index experimental data of solution S2.
●, Exiperiment data; ━,Model data.
Figure I- 12. Fit of the model to the refractive index experimental data of solution S3.
●, Exiperiment data; ━, Model data.
Figure I- 13. Fit of the model to the density experimental data of solution S1.
●, Exiperiment data; ━, Model data.
Figure I- 14. Fit of the model to the density experimental data of solution S2.
●, Exiperiment data; ━, Model data.
Figure I- 15. Fit of the model to the viscosity experimental data of solution S2.
●, Exiperiment data; ━, Model data.
169
Figure I- 16. Fit of the model to the viscosity experimental data of solution S3.
●, Exiperiment data; ━, Model data.
Figure I- 17. Fit of the model to the specific heat capacity experimental data of solution S1.
●, Experimental data; ━, Model data.
Figure I- 18. Fit of the model to the specific heat capacity experimental data of solution S3.
●, Experimental data; ━, Model data.
Figure II- 1. Contour plot of modified mass transfer coefficient (kL.a)’CCSO versus (kL.a)’ECSO.
Figure II- 2. Contour plot of modified mass transfer coefficient (kL.a)’CSO versus (kL.a)’CCSO.
Figure II- 3. Contour plot of modified mass transfer coefficient kL.a)’CSO versus (kL.a)’ECSO.
Figure III- 1. Effect of temperature on the kinetics of CO2 absorption in the FAME solution at
20 bar and rotating speed of 500 rpm.
Figure III- 2. Effect of temperature on the kinetics of CO2 absorption in the CFAME solution
at 20 bar and rotating speed of 500 rpm.
Figure III- 3. Evolution of the solubility of CO2 at different CO2 pressure for FAME.
Figure III- 4. Evolution of the solubility of CO2 at different CO2 pressure for CFAME.
Figure III- 5. Evolution of the Henry’s constant versus temperature
Figure III- 6. Fitting of the model to the experimental observation for Run 19
Figure III- 7. Fitting of the model to the experimental observation Run 44
Figure III- 8. Overall parity plot of experimental versus simulated values for the mass transfer
study
Figure III- 9. Overall parity plot of experimental versus simulated values for the epoxide
concentration for the carbonation of EFAME and ECSO.