prioritising the elements in historic - journal of engineering
TRANSCRIPT
JOURNAL OF ENGINEERING AND APPLIED SCIENCE, VOL. 66, NO. 6, DEC. 2019, PP. 749-769
FACULTY OF ENGINEERING, CAIRO UNIVERSITY
IMAGE OF THE CITY: PRIORITISING THE ELEMENTS IN HISTORIC
AND NEW URBAN SETTLEMENETS OF CAIRO, EGYPT
S. ELFIKI1
ABSTRACT
“Image of the city” is a commonly used term that structures people’s perception
of the spatial organisation and visual form of cities. In the nineteen-fifties, Lynch
developed a model of five objective elements that collectively shape people’s
perception to the image of cities, which is still widely acknowledged in recent
research. The main concluded elements are paths, edges, districts, nodes and
landmarks. The image of a city is dynamic and ever-changing. The present study
investigates the way people prioritise the role of these five elements in shaping the
mental images of old and new urban settlement in Cairo, Egypt. After setting the
theoretical framework, the study employs a survey that involved 74 participants, to
investigate their perception of the elements that characterise the image of ‘Historic
Cairo’ and ‘New Cairo’. The outcome of the survey is quantitatively analysed by 2descriptive analyses, cross tabulations and analyses of variance, to identify the most
influential elements in both contexts, and their relations to the studied sample.
Landmarks were most influential upon people’s perception to the image in both
contexts. Edges were the least important in ‘Historic Cairo’, while nodes were the least
in ‘New Cairo’. This should help local architects, urban designers and city planners to
develop the built environment in a way that better responds to people’s priorities.
KEYWORDS: Image of the city; Paths; Edges; Districts; Nodes; Landmarks; Cairo –
Egypt.
1. INTRODUCTION
Kevin Lynch is one of the twentieth century key-figures in environmental
design and behavioural studies, particularly as applied to the field of urban design and
city planning [1]. In the nineteen-fifties, he developed extended studies about central
areas in Los Angeles, Boston and Jersey City, USA. These studies aimed at
understanding the way people perceive the image of cities, and what may promote
cities’ imageability.
1 Department of Architectural Engineering and Environmental Design Arab Academy for Science, Technology
and Maritime Transport, Cairo – Egypt, [email protected]
S. ELFIKI
750
He concluded that environmental images link people to places, and give them a
sense of identity and emotional security. The outcome of his studies was primarily
manifested in five objective elements that formulate a city’s image, as explained in
detail under the subsequent section ‘3. The Model’ hereunder.
This model gains extended recognition for that it addresses the image of the city
as a combination between objective elements in the city and the individual perception
of its residents. It suggests that a well-designed city image can improve the sense of
identity and security, as well as helping easier navigation around the urban landscape
of the cities [2, 3].
Although Lynch’s model was developed more than fifty years ago, it remains
highly credible to the extent that a large number of recent research papers, books and
academic theses build on it, covering a wide spectrum of specialties like environment
and behaviour, cognitive psychology, urban design, tourism development, computer
applications, cinematography, and many more.
It is interesting that the Journal of the American Planning Association is
dedicating its entire autumn 2018 issue to “Envisioning City Design: The Legacy of
Kevin Lynch” [4].
Some researchers studied Lynch’s theory itself, its origins, validity and possible
means of development. For example, Sidanin’s paper has undertaken extended
analyses to the Lynchian and post-Lynchian theories in urban design [5]. While
Ashmore concluded that Lynch’s approach and methodology are valid for application
in New Urbanist environments [6]. Yet, Damayanti has developed an extension to
Lynch’s theory by introducing social interpretations to his five elements [3].
On another hand, some studies applied Lynch’s model to different case studies
around the world, e.g. India, Korea, Malysia, UK and many others [7 - 10].
Nevertheless, other scholars have examined the application of Lynch’s model to
different disciplines. For example, Quercia and his partners took Lynch’s work to
examine the reflections of city image upon mental health [11]. In a different sense,
Nasar also built on the work of Kevin Lynch to explore the role of human evaluations
to cityscape upon creating more pleasant cities to the residents [12]. Where Topcu’s
IMAGE OF THE CITY: PRIORITISING THE ELEMENTS IN HISTORIC ….
751
study addressed the visual representation of mental images in urban design, following
Lynch’s work [13]. At a methodological and conceptual level, Pearce and Fagence
outlined the potential contribution of Lynch’s model in tourism development [14].
When it comes to arts, Raynsford explored the origins of Lynch’s model from
the perspective of civic arts [15]. Likewise, in filmmaking and cinematography, Liu
analysed the characteristics of Chinese films and TV plays using Lynch’s model [16].
In terms of technology and computer applications, Al-Ghamdi and Al-Harigi
used Lynch’s model to track the impact of technology on the observer and the
observed within contemporary cities [17]. More interestingly, Jiang has developed a
process by which the image of the city can be quantitatively derived automatically
using computer technology and its geo-spatial databases [18]. Seitinger used Lynch’s
model to explore the possible impact of using programmable and responsive LED-
based lighting and displays upon social communication and urban aesthetics [19].
By all means, this is not meant to be a comprehensive review of the literature
about Lynch’s work. It is rather a brief journey around some recent and interesting
pieces of work in diverse disciplines to confirm that Lynch’s model is being widely
used until present time, and can therefore be adopted in the present study.
However, due to the nature of today’s cities, people’s perception of their city
images can be depicted as a dynamic ever-evolving process. Nowadays cities keep
transforming and changing in a complex fashion, to accommodate the changes in
functions and meanings, as well as the poetic and symbolic imagery Lynch highlighted
[2, 6, 20, 21].
2. METHODOLOGY
The present study is meant to explore empirically how people prioritise the
elements of city image in historic and modern urban settlements – as applied to Cairo,
Egypt. It builds on the five elements outlined by Lynch and subsequent studies;
namely paths, edges, districts, nodes and landmarks [2]. After introducing the model
in-study briefly, the empirical part starts by explaining the process of questionnaire
design, sampling, pilot testing, means of communication and methods for quantitative
S. ELFIKI
752
analyses. This includes descriptive statistics “frequencies”, cross tabulations and
analyses of variance – ANOVA. The outcome of the survey analyses is then discussed
in the light of preceding literature to learn about the most influential elements that
shape people’s perception to the image of Cairo in both contexts, and with reference to
different participant groups.
3. THE MODEL
Lynch has developed a profound approach to analyse and improve the visual
forms of cities. He describes the city as an interrelated connection of paths, edges,
districts, nodes and landmarks. He defines paths as continuous, identifiable and
directional elements with clear starting and ending points, like streets, sidewalks, trails
and other channels in which people may travel. On the other hand, edges are
continuous visible boundaries that separate two districts, and may be exemplified in by
highways, rivers or lines along which two regions are joined together. The same model
defines districts as fairly large sections of a city, which share a common identity or
character. Where nodes are strategic focal points that people may pass through, like
squares, piazza and junctions. They should not necessarily be defined by a strict
physical form but may sometimes be represented by concentrations of some use, as a
street-corner hangout. At last, landmarks are unique characteristic reference points,
such as buildings, signs, stores that are memorable in the urban context [2]. The
forthcoming analyses will build on the same definitions.
4. SCOPE OF THE STUDY
The study is based on exploring how people prioritise the elements of city
image in historic and modern urban settlements in Cairo, Egypt. Therefore, it was
decided to set ‘Historic Cairo’ and ‘New Cairo’ as two main foci for the present study.
Due to its significance, ‘Historic Cairo’ is defined in detail by Law 119/2008.
Its northern boundaries are Ramsis square, Kamel Sedki street, El-Khalig El-Masri
street, Azab Pasha street, El-Dhaher square, Tour Sinai street, Port Said street, El-
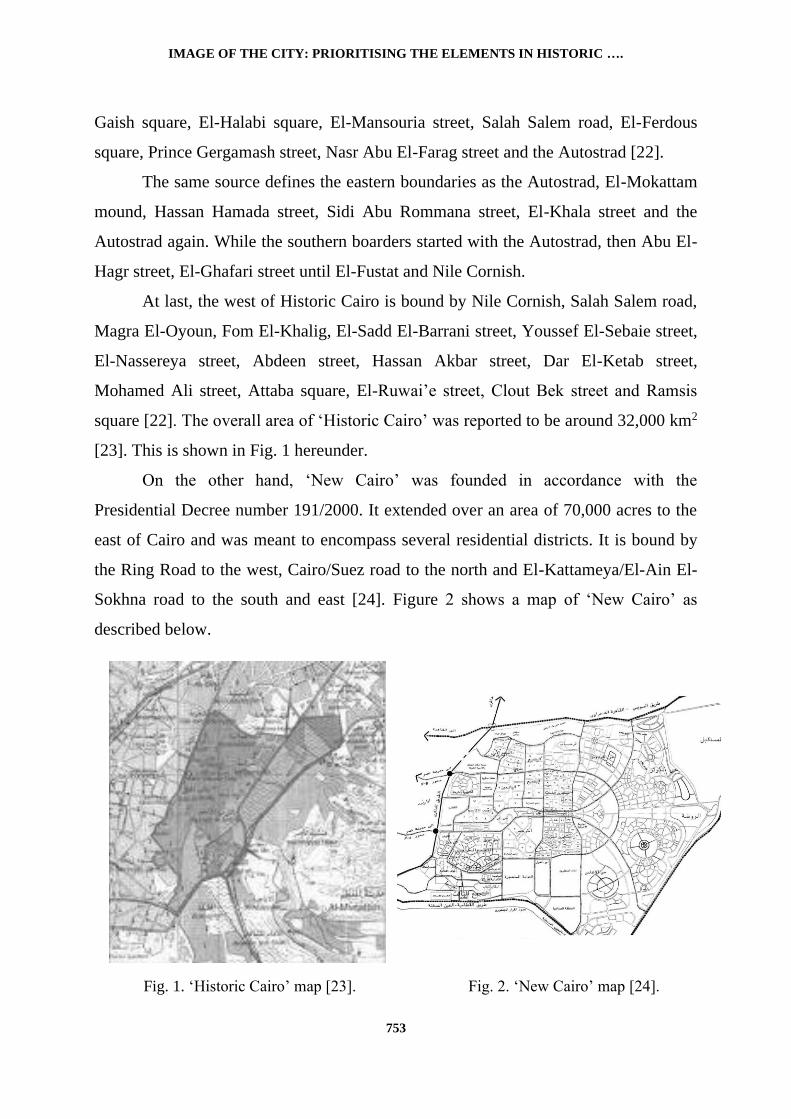
IMAGE OF THE CITY: PRIORITISING THE ELEMENTS IN HISTORIC ….
753
Gaish square, El-Halabi square, El-Mansouria street, Salah Salem road, El-Ferdous
square, Prince Gergamash street, Nasr Abu El-Farag street and the Autostrad [22].
The same source defines the eastern boundaries as the Autostrad, El-Mokattam
mound, Hassan Hamada street, Sidi Abu Rommana street, El-Khala street and the
Autostrad again. While the southern boarders started with the Autostrad, then Abu El-
Hagr street, El-Ghafari street until El-Fustat and Nile Cornish.
At last, the west of Historic Cairo is bound by Nile Cornish, Salah Salem road,
Magra El-Oyoun, Fom El-Khalig, El-Sadd El-Barrani street, Youssef El-Sebaie street,
El-Nassereya street, Abdeen street, Hassan Akbar street, Dar El-Ketab street,
Mohamed Ali street, Attaba square, El-Ruwai’e street, Clout Bek street and Ramsis
square [22]. The overall area of ‘Historic Cairo’ was reported to be around 32,000 km2
[23]. This is shown in Fig. 1 hereunder.
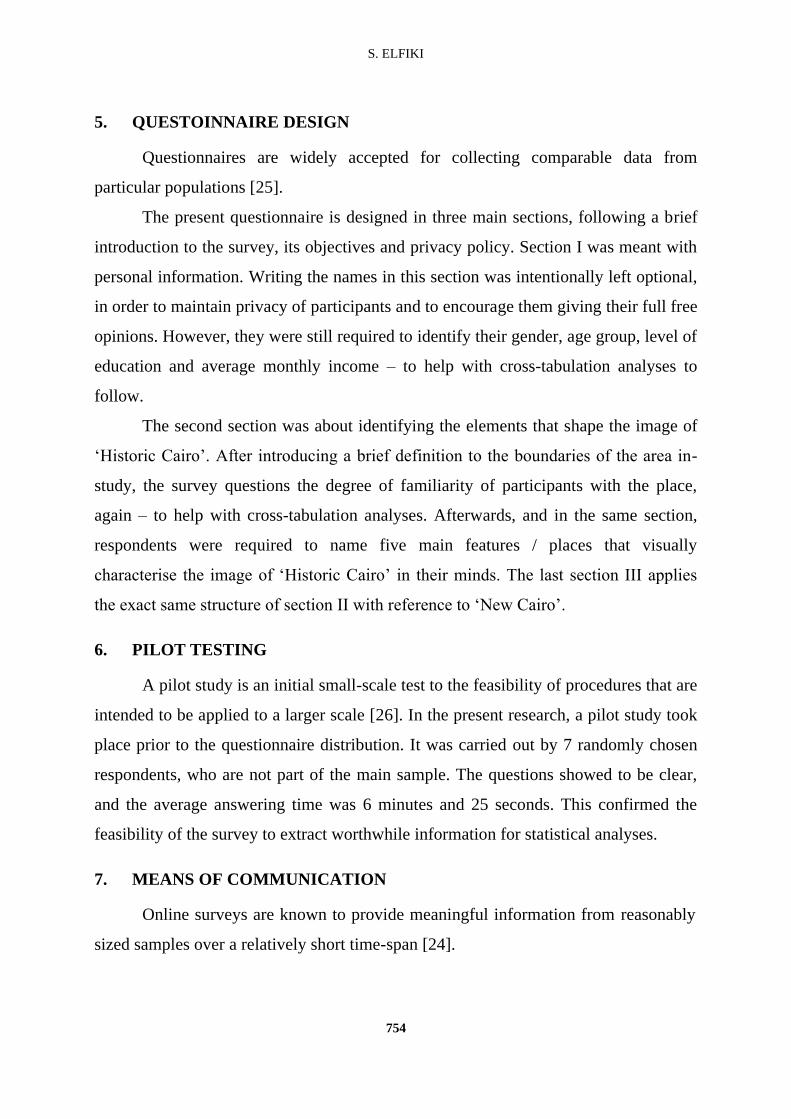
On the other hand, ‘New Cairo’ was founded in accordance with the
Presidential Decree number 191/2000. It extended over an area of 70,000 acres to the
east of Cairo and was meant to encompass several residential districts. It is bound by
the Ring Road to the west, Cairo/Suez road to the north and El-Kattameya/El-Ain El-
Sokhna road to the south and east [24]. Figure 2 shows a map of ‘New Cairo’ as
described below.
Fig. 1. ‘Historic Cairo’ map [23]. Fig. 2. ‘New Cairo’ map [24].
S. ELFIKI
754
5. QUESTOINNAIRE DESIGN
Questionnaires are widely accepted for collecting comparable data from
particular populations [25].
The present questionnaire is designed in three main sections, following a brief
introduction to the survey, its objectives and privacy policy. Section I was meant with
personal information. Writing the names in this section was intentionally left optional,
in order to maintain privacy of participants and to encourage them giving their full free
opinions. However, they were still required to identify their gender, age group, level of
education and average monthly income – to help with cross-tabulation analyses to
follow.
The second section was about identifying the elements that shape the image of
‘Historic Cairo’. After introducing a brief definition to the boundaries of the area in-
study, the survey questions the degree of familiarity of participants with the place,
again – to help with cross-tabulation analyses. Afterwards, and in the same section,
respondents were required to name five main features / places that visually
characterise the image of ‘Historic Cairo’ in their minds. The last section III applies
the exact same structure of section II with reference to ‘New Cairo’.
6. PILOT TESTING
A pilot study is an initial small-scale test to the feasibility of procedures that are
intended to be applied to a larger scale [26]. In the present research, a pilot study took
place prior to the questionnaire distribution. It was carried out by 7 randomly chosen
respondents, who are not part of the main sample. The questions showed to be clear,
and the average answering time was 6 minutes and 25 seconds. This confirmed the
feasibility of the survey to extract worthwhile information for statistical analyses.
7. MEANS OF COMMUNICATION
Online surveys are known to provide meaningful information from reasonably
sized samples over a relatively short time-span [24].
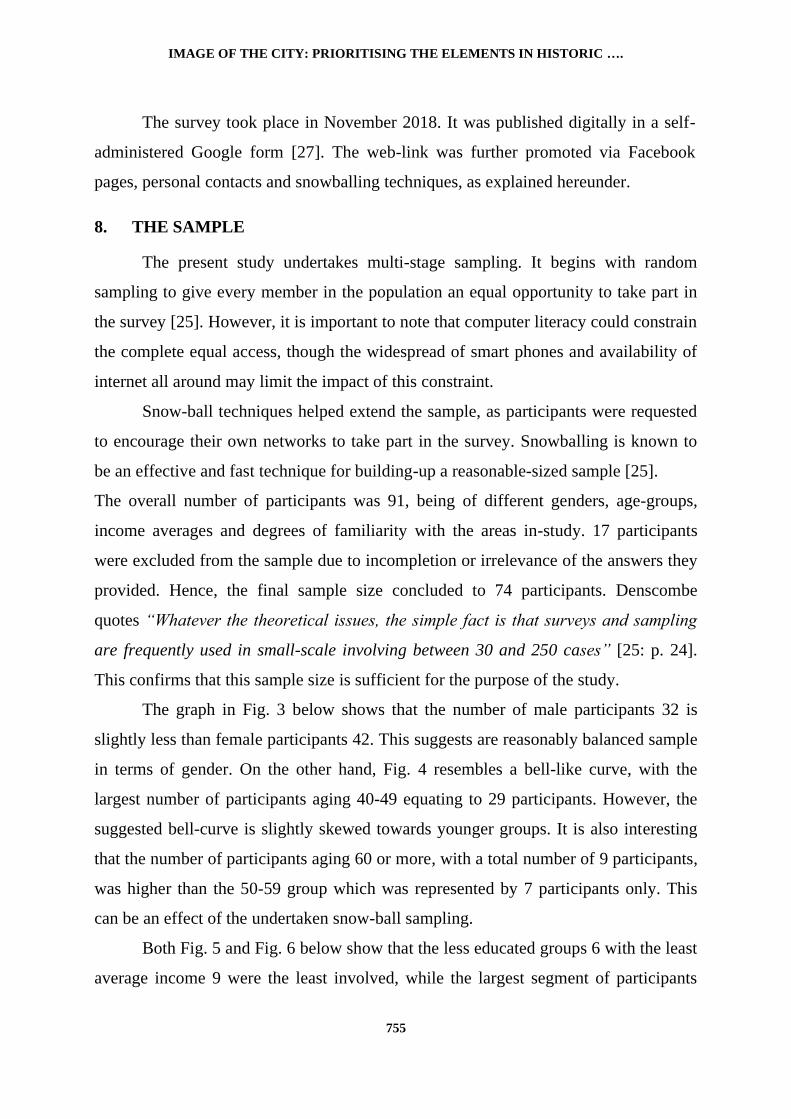
IMAGE OF THE CITY: PRIORITISING THE ELEMENTS IN HISTORIC ….
755
The survey took place in November 2018. It was published digitally in a self-
administered Google form [27]. The web-link was further promoted via Facebook
pages, personal contacts and snowballing techniques, as explained hereunder.
8. THE SAMPLE
The present study undertakes multi-stage sampling. It begins with random
sampling to give every member in the population an equal opportunity to take part in
the survey [25]. However, it is important to note that computer literacy could constrain
the complete equal access, though the widespread of smart phones and availability of
internet all around may limit the impact of this constraint.
Snow-ball techniques helped extend the sample, as participants were requested
to encourage their own networks to take part in the survey. Snowballing is known to
be an effective and fast technique for building-up a reasonable-sized sample [25].
The overall number of participants was 91, being of different genders, age-groups,
income averages and degrees of familiarity with the areas in-study. 17 participants
were excluded from the sample due to incompletion or irrelevance of the answers they
provided. Hence, the final sample size concluded to 74 participants. Denscombe
quotes “Whatever the theoretical issues, the simple fact is that surveys and sampling
are frequently used in small-scale involving between 30 and 250 cases” [25: p. 24].
This confirms that this sample size is sufficient for the purpose of the study.
The graph in Fig. 3 below shows that the number of male participants 32 is
slightly less than female participants 42. This suggests are reasonably balanced sample
in terms of gender. On the other hand, Fig. 4 resembles a bell-like curve, with the
largest number of participants aging 40-49 equating to 29 participants. However, the
suggested bell-curve is slightly skewed towards younger groups. It is also interesting
that the number of participants aging 60 or more, with a total number of 9 participants,
was higher than the 50-59 group which was represented by 7 participants only. This
can be an effect of the undertaken snow-ball sampling.
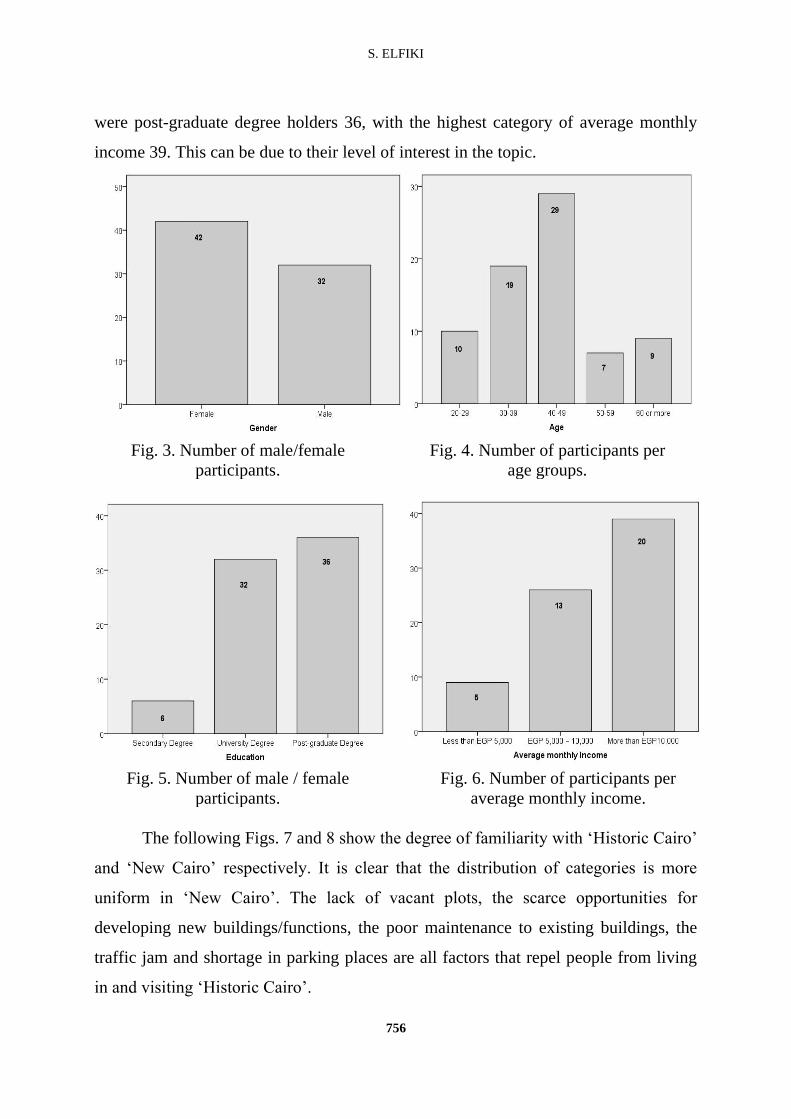
Both Fig. 5 and Fig. 6 below show that the less educated groups 6 with the least
average income 9 were the least involved, while the largest segment of participants
S. ELFIKI
756
were post-graduate degree holders 36, with the highest category of average monthly
income 39. This can be due to their level of interest in the topic.
Fig. 3. Number of male/female
participants.
Fig. 4. Number of participants per
age groups.
Fig. 5. Number of male / female
participants.
Fig. 6. Number of participants per
average monthly income.
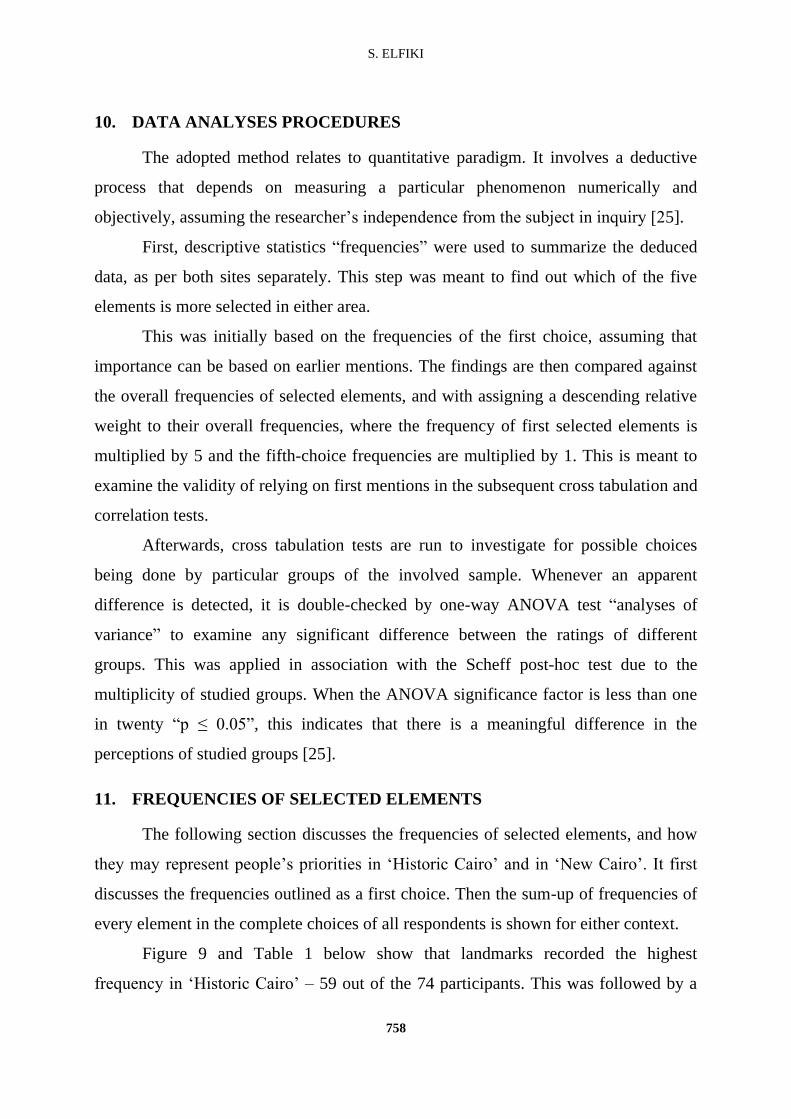
The following Figs. 7 and 8 show the degree of familiarity with ‘Historic Cairo’
and ‘New Cairo’ respectively. It is clear that the distribution of categories is more
uniform in ‘New Cairo’. The lack of vacant plots, the scarce opportunities for
developing new buildings/functions, the poor maintenance to existing buildings, the
traffic jam and shortage in parking places are all factors that repel people from living
in and visiting ‘Historic Cairo’.
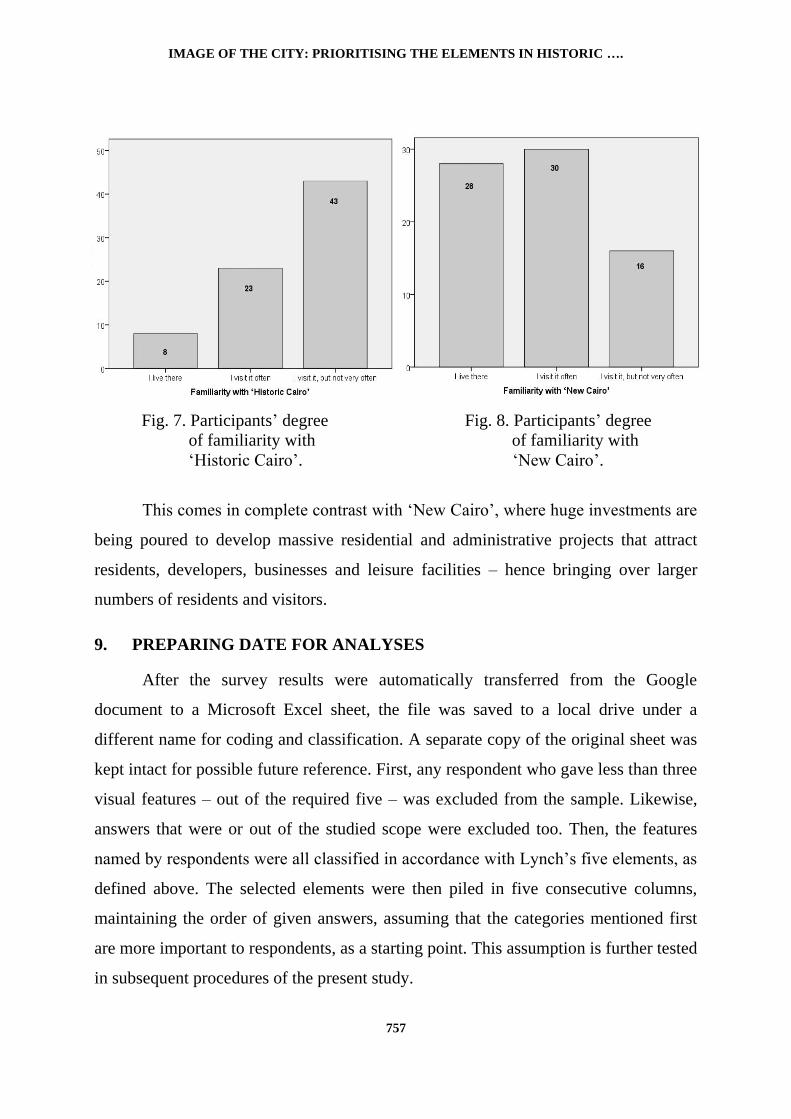
IMAGE OF THE CITY: PRIORITISING THE ELEMENTS IN HISTORIC ….
757
Fig. 7. Participants’ degree
of familiarity with
‘Historic Cairo’.
Fig. 8. Participants’ degree
of familiarity with
‘New Cairo’.
This comes in complete contrast with ‘New Cairo’, where huge investments are
being poured to develop massive residential and administrative projects that attract
residents, developers, businesses and leisure facilities – hence bringing over larger
numbers of residents and visitors.
9. PREPARING DATE FOR ANALYSES
After the survey results were automatically transferred from the Google
document to a Microsoft Excel sheet, the file was saved to a local drive under a
different name for coding and classification. A separate copy of the original sheet was
kept intact for possible future reference. First, any respondent who gave less than three
visual features – out of the required five – was excluded from the sample. Likewise,
answers that were or out of the studied scope were excluded too. Then, the features
named by respondents were all classified in accordance with Lynch’s five elements, as
defined above. The selected elements were then piled in five consecutive columns,
maintaining the order of given answers, assuming that the categories mentioned first
are more important to respondents, as a starting point. This assumption is further tested
in subsequent procedures of the present study.
S. ELFIKI
758
10. DATA ANALYSES PROCEDURES
The adopted method relates to quantitative paradigm. It involves a deductive
process that depends on measuring a particular phenomenon numerically and
objectively, assuming the researcher’s independence from the subject in inquiry [25].
First, descriptive statistics “frequencies” were used to summarize the deduced
data, as per both sites separately. This step was meant to find out which of the five
elements is more selected in either area.
This was initially based on the frequencies of the first choice, assuming that
importance can be based on earlier mentions. The findings are then compared against
the overall frequencies of selected elements, and with assigning a descending relative
weight to their overall frequencies, where the frequency of first selected elements is
multiplied by 5 and the fifth-choice frequencies are multiplied by 1. This is meant to
examine the validity of relying on first mentions in the subsequent cross tabulation and
correlation tests.
Afterwards, cross tabulation tests are run to investigate for possible choices
being done by particular groups of the involved sample. Whenever an apparent
difference is detected, it is double-checked by one-way ANOVA test “analyses of
variance” to examine any significant difference between the ratings of different
groups. This was applied in association with the Scheff post-hoc test due to the
multiplicity of studied groups. When the ANOVA significance factor is less than one
in twenty “p ≤ 0.05”, this indicates that there is a meaningful difference in the
perceptions of studied groups [25].
11. FREQUENCIES OF SELECTED ELEMENTS
The following section discusses the frequencies of selected elements, and how
they may represent people’s priorities in ‘Historic Cairo’ and in ‘New Cairo’. It first
discusses the frequencies outlined as a first choice. Then the sum-up of frequencies of
every element in the complete choices of all respondents is shown for either context.
Figure 9 and Table 1 below show that landmarks recorded the highest
frequency in ‘Historic Cairo’ – 59 out of the 74 participants. This was followed by a
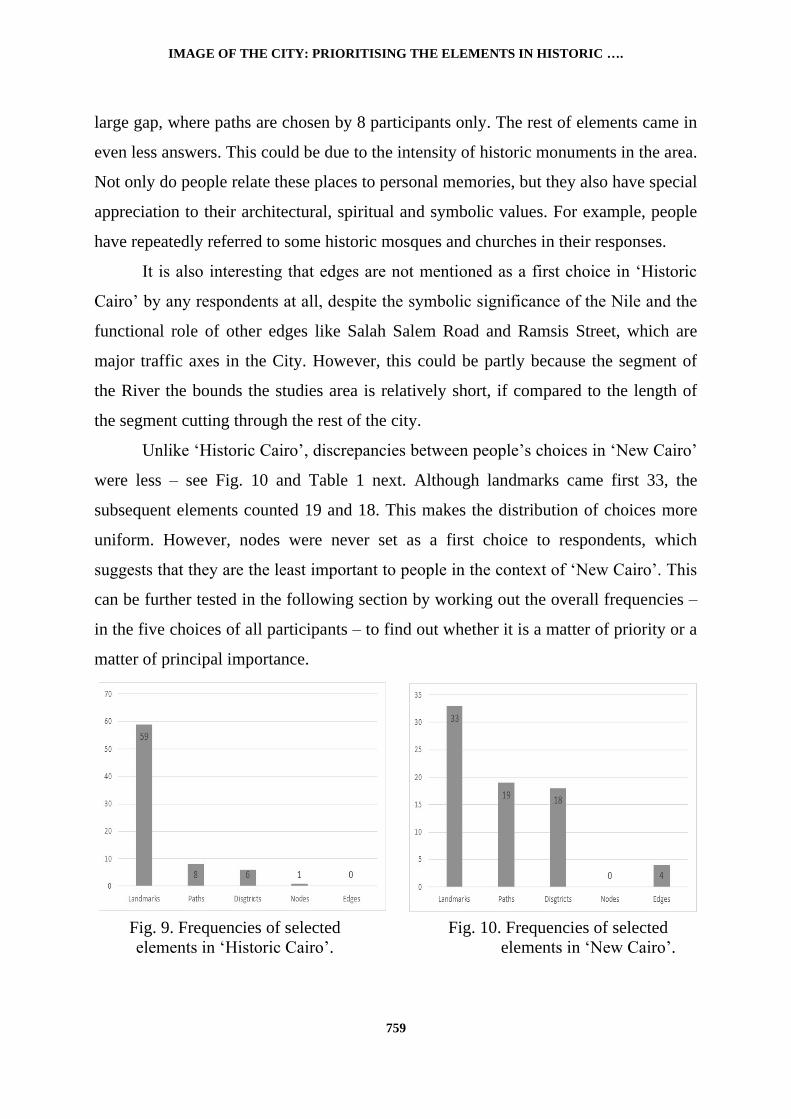
IMAGE OF THE CITY: PRIORITISING THE ELEMENTS IN HISTORIC ….
759
large gap, where paths are chosen by 8 participants only. The rest of elements came in
even less answers. This could be due to the intensity of historic monuments in the area.
Not only do people relate these places to personal memories, but they also have special
appreciation to their architectural, spiritual and symbolic values. For example, people
have repeatedly referred to some historic mosques and churches in their responses.
It is also interesting that edges are not mentioned as a first choice in ‘Historic
Cairo’ by any respondents at all, despite the symbolic significance of the Nile and the
functional role of other edges like Salah Salem Road and Ramsis Street, which are
major traffic axes in the City. However, this could be partly because the segment of
the River the bounds the studies area is relatively short, if compared to the length of
the segment cutting through the rest of the city.
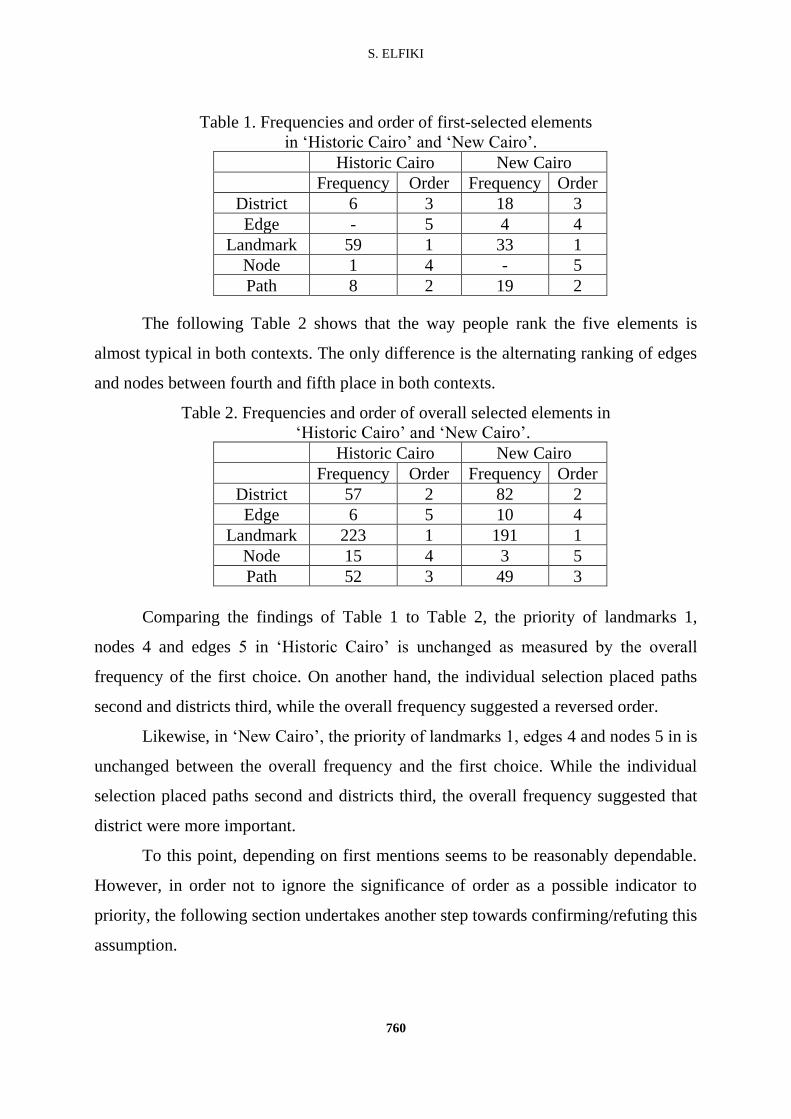
Unlike ‘Historic Cairo’, discrepancies between people’s choices in ‘New Cairo’
were less – see Fig. 10 and Table 1 next. Although landmarks came first 33, the
subsequent elements counted 19 and 18. This makes the distribution of choices more
uniform. However, nodes were never set as a first choice to respondents, which
suggests that they are the least important to people in the context of ‘New Cairo’. This
can be further tested in the following section by working out the overall frequencies –
in the five choices of all participants – to find out whether it is a matter of priority or a
matter of principal importance.
Fig. 9. Frequencies of selected
elements in ‘Historic Cairo’.
Fig. 10. Frequencies of selected
elements in ‘New Cairo’.
S. ELFIKI
760
Table 1. Frequencies and order of first-selected elements
in ‘Historic Cairo’ and ‘New Cairo’.
Historic Cairo New Cairo
Frequency Order Frequency Order
District 6 3 18 3
Edge - 5 4 4
Landmark 59 1 33 1
Node 1 4 - 5
Path 8 2 19 2
The following Table 2 shows that the way people rank the five elements is
almost typical in both contexts. The only difference is the alternating ranking of edges
and nodes between fourth and fifth place in both contexts.
Table 2. Frequencies and order of overall selected elements in
‘Historic Cairo’ and ‘New Cairo’.
Historic Cairo New Cairo
Frequency Order Frequency Order
District 57 2 82 2
Edge 6 5 10 4
Landmark 223 1 191 1
Node 15 4 3 5
Path 52 3 49 3
Comparing the findings of Table 1 to Table 2, the priority of landmarks 1,
nodes 4 and edges 5 in ‘Historic Cairo’ is unchanged as measured by the overall
frequency of the first choice. On another hand, the individual selection placed paths
second and districts third, while the overall frequency suggested a reversed order.
Likewise, in ‘New Cairo’, the priority of landmarks 1, edges 4 and nodes 5 in is
unchanged between the overall frequency and the first choice. While the individual
selection placed paths second and districts third, the overall frequency suggested that
district were more important.
To this point, depending on first mentions seems to be reasonably dependable.
However, in order not to ignore the significance of order as a possible indicator to
priority, the following section undertakes another step towards confirming/refuting this
assumption.
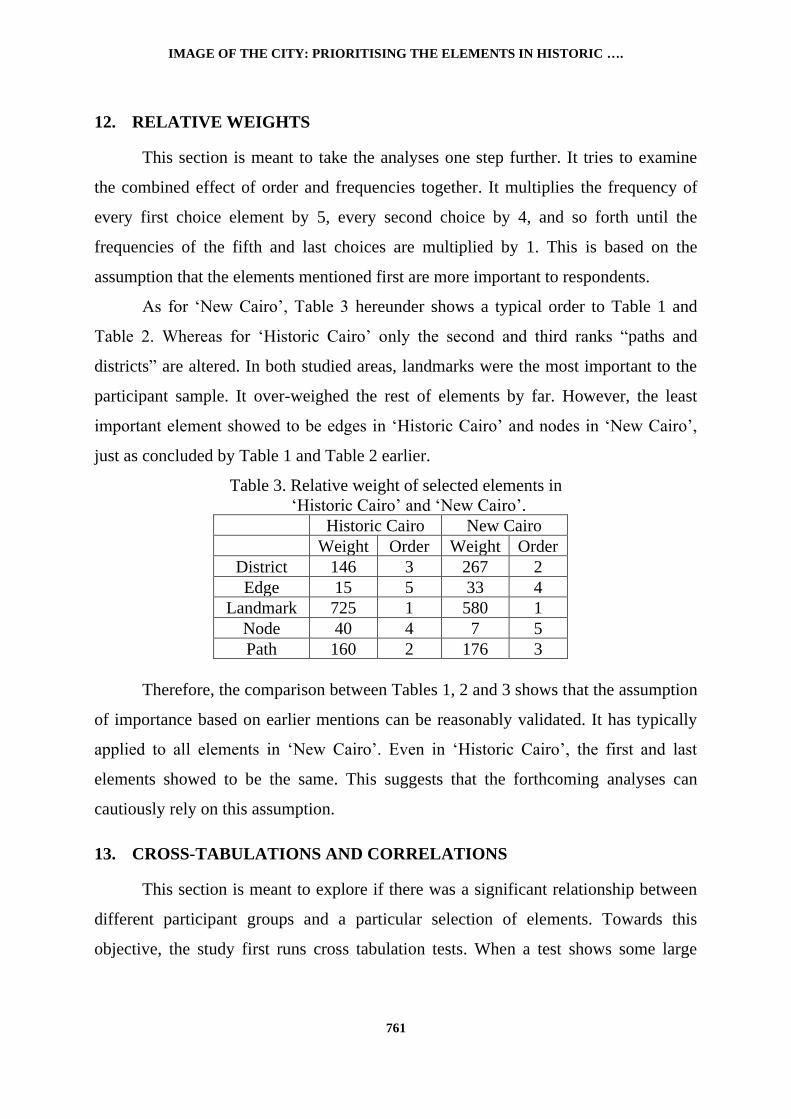
IMAGE OF THE CITY: PRIORITISING THE ELEMENTS IN HISTORIC ….
761
12. RELATIVE WEIGHTS
This section is meant to take the analyses one step further. It tries to examine
the combined effect of order and frequencies together. It multiplies the frequency of
every first choice element by 5, every second choice by 4, and so forth until the
frequencies of the fifth and last choices are multiplied by 1. This is based on the
assumption that the elements mentioned first are more important to respondents.
As for ‘New Cairo’, Table 3 hereunder shows a typical order to Table 1 and
Table 2. Whereas for ‘Historic Cairo’ only the second and third ranks “paths and
districts” are altered. In both studied areas, landmarks were the most important to the
participant sample. It over-weighed the rest of elements by far. However, the least
important element showed to be edges in ‘Historic Cairo’ and nodes in ‘New Cairo’,
just as concluded by Table 1 and Table 2 earlier.
Table 3. Relative weight of selected elements in
‘Historic Cairo’ and ‘New Cairo’.
Historic Cairo New Cairo
Weight Order Weight Order
District 146 3 267 2
Edge 15 5 33 4
Landmark 725 1 580 1
Node 40 4 7 5
Path 160 2 176 3
Therefore, the comparison between Tables 1, 2 and 3 shows that the assumption
of importance based on earlier mentions can be reasonably validated. It has typically
applied to all elements in ‘New Cairo’. Even in ‘Historic Cairo’, the first and last
elements showed to be the same. This suggests that the forthcoming analyses can
cautiously rely on this assumption.
13. CROSS-TABULATIONS AND CORRELATIONS
This section is meant to explore if there was a significant relationship between
different participant groups and a particular selection of elements. Towards this
objective, the study first runs cross tabulation tests. When a test shows some large
S. ELFIKI
762
differences in the distribution of elements amongst the tested groups, one-way
ANOVA tests – with Scheff post-hoc – are applied to check for statistical significance.
Although Fig. 11 below implies more selection of landmarks by females than
males in ‘Historic Cairo’, this apparent difference showed to be insignificant 0.53 in
the ANOVA test. Likewise, in ‘New Cairo’, Fig. 12, differences in male/female
selection comes highest in paths. Yet, the ANOVA test showed no significance 0.137
of such difference.
Fig. 11. Cross-tabulations for gender
vs. selected elements
in ‘Historic Cairo’.
Fig. 12. Cross-tabulations for gender
vs. selected elements in
‘New Cairo’.
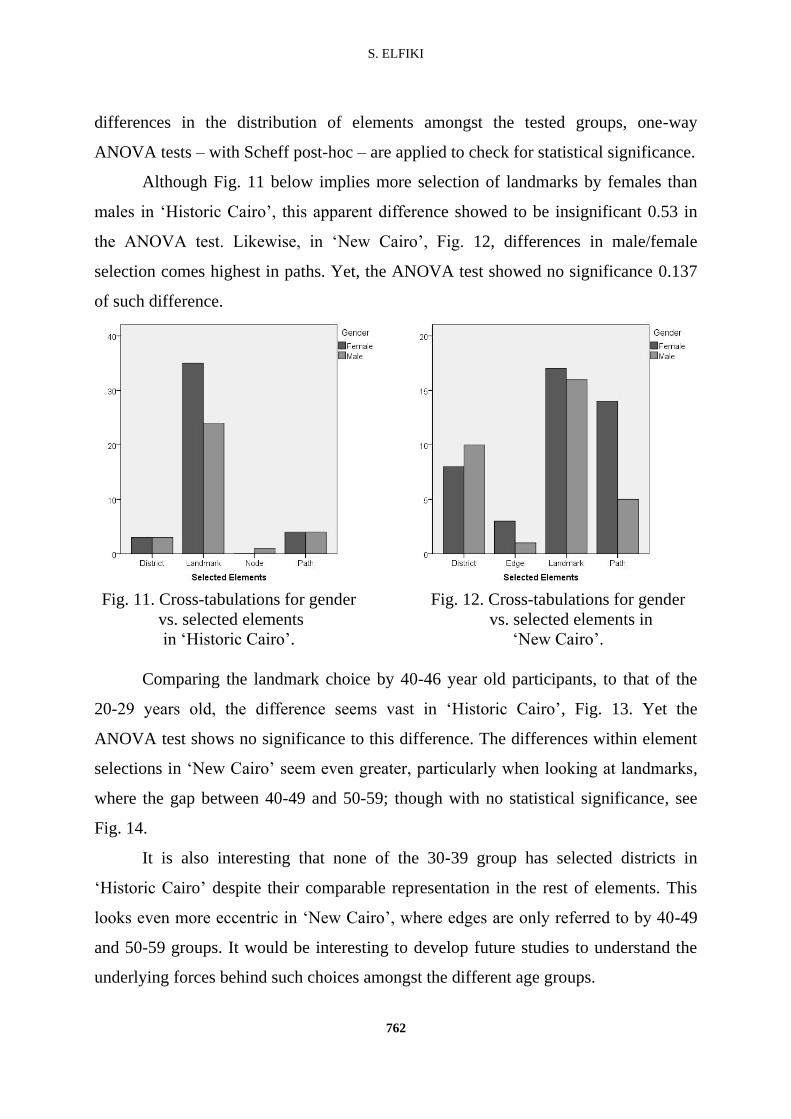
Comparing the landmark choice by 40-46 year old participants, to that of the
20-29 years old, the difference seems vast in ‘Historic Cairo’, Fig. 13. Yet the
ANOVA test shows no significance to this difference. The differences within element
selections in ‘New Cairo’ seem even greater, particularly when looking at landmarks,
where the gap between 40-49 and 50-59; though with no statistical significance, see
Fig. 14.
It is also interesting that none of the 30-39 group has selected districts in
‘Historic Cairo’ despite their comparable representation in the rest of elements. This
looks even more eccentric in ‘New Cairo’, where edges are only referred to by 40-49
and 50-59 groups. It would be interesting to develop future studies to understand the
underlying forces behind such choices amongst the different age groups.
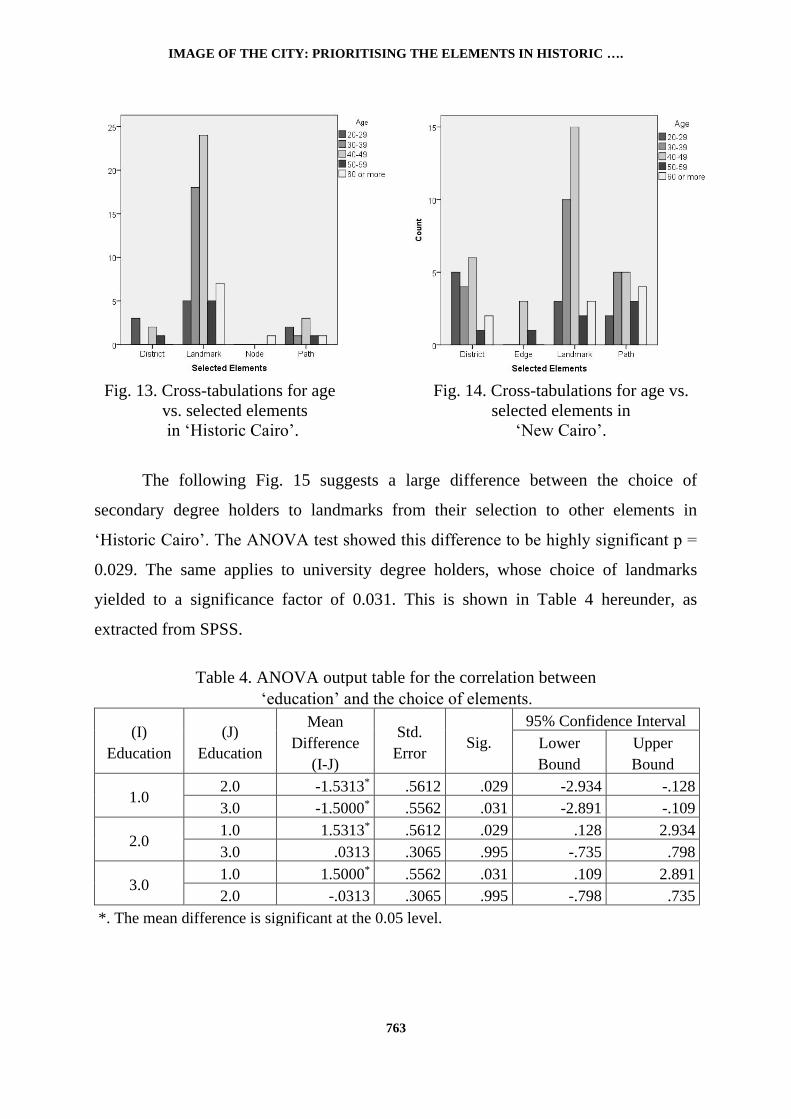
IMAGE OF THE CITY: PRIORITISING THE ELEMENTS IN HISTORIC ….
763
Fig. 13. Cross-tabulations for age
vs. selected elements
in ‘Historic Cairo’.
Fig. 14. Cross-tabulations for age vs.
selected elements in
‘New Cairo’.
The following Fig. 15 suggests a large difference between the choice of
secondary degree holders to landmarks from their selection to other elements in
‘Historic Cairo’. The ANOVA test showed this difference to be highly significant p =
0.029. The same applies to university degree holders, whose choice of landmarks
yielded to a significance factor of 0.031. This is shown in Table 4 hereunder, as
extracted from SPSS.
Table 4. ANOVA output table for the correlation between
‘education’ and the choice of elements.
(I)
Education
(J)
Education
Mean
Difference
(I-J)
Std.
Error Sig.
95% Confidence Interval
Lower
Bound
Upper
Bound
1.0 2.0 -1.5313* .5612 .029 -2.934 -.128
3.0 -1.5000* .5562 .031 -2.891 -.109
2.0 1.0 1.5313* .5612 .029 .128 2.934
3.0 .0313 .3065 .995 -.735 .798
3.0 1.0 1.5000* .5562 .031 .109 2.891
2.0 -.0313 .3065 .995 -.798 .735
*. The mean difference is significant at the 0.05 level.
S. ELFIKI
764
The author refers this discrepancy to the likely broader exposure of
postgraduate participants, as compared to other educational categories. Such exposure
has possibly extended their awareness of the role of other elements towards the city’s
imageability, which has contributed to diversifying their choices more evenly.
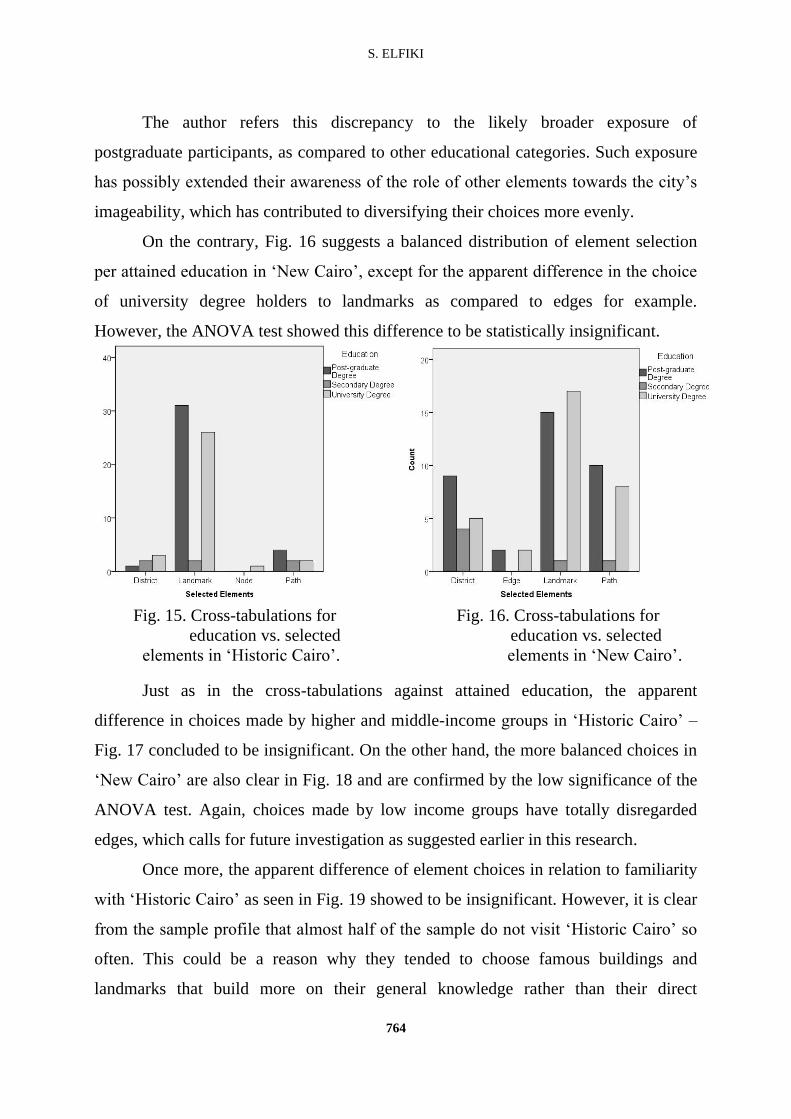
On the contrary, Fig. 16 suggests a balanced distribution of element selection
per attained education in ‘New Cairo’, except for the apparent difference in the choice
of university degree holders to landmarks as compared to edges for example.
However, the ANOVA test showed this difference to be statistically insignificant.
Fig. 15. Cross-tabulations for
education vs. selected
elements in ‘Historic Cairo’.
Fig. 16. Cross-tabulations for
education vs. selected
elements in ‘New Cairo’.
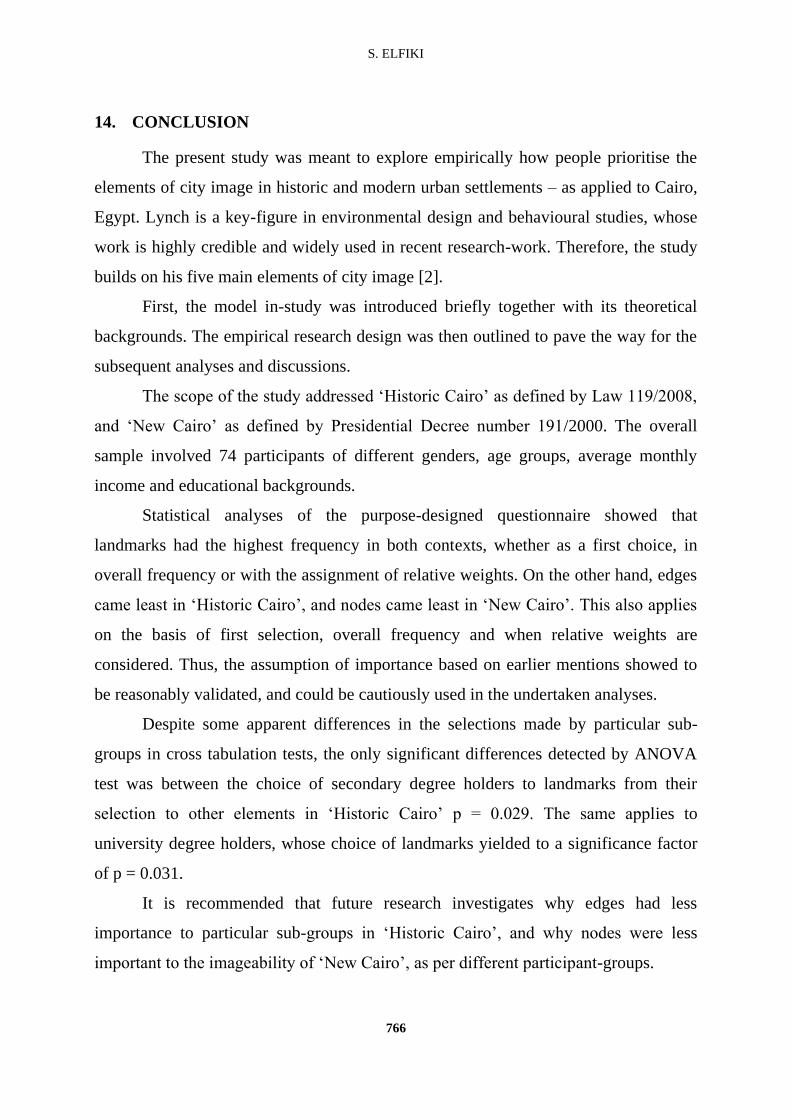
Just as in the cross-tabulations against attained education, the apparent
difference in choices made by higher and middle-income groups in ‘Historic Cairo’ –
Fig. 17 concluded to be insignificant. On the other hand, the more balanced choices in
‘New Cairo’ are also clear in Fig. 18 and are confirmed by the low significance of the
ANOVA test. Again, choices made by low income groups have totally disregarded
edges, which calls for future investigation as suggested earlier in this research.
Once more, the apparent difference of element choices in relation to familiarity
with ‘Historic Cairo’ as seen in Fig. 19 showed to be insignificant. However, it is clear
from the sample profile that almost half of the sample do not visit ‘Historic Cairo’ so
often. This could be a reason why they tended to choose famous buildings and
landmarks that build more on their general knowledge rather than their direct
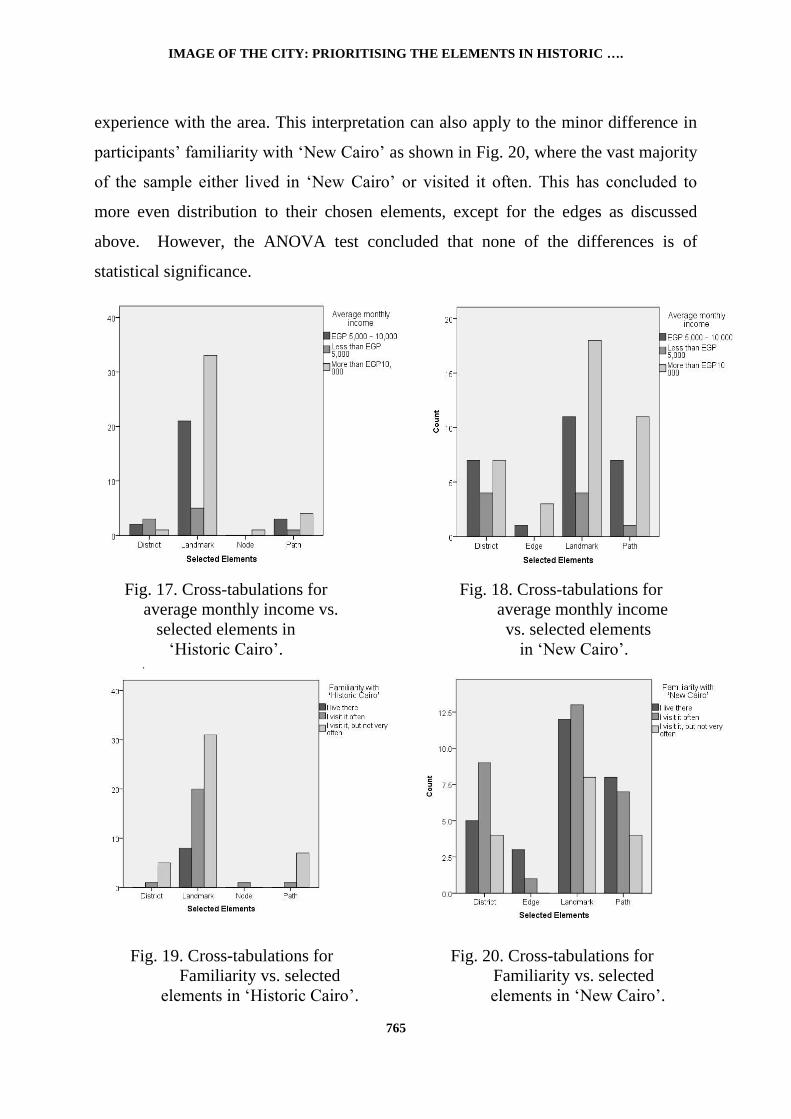
IMAGE OF THE CITY: PRIORITISING THE ELEMENTS IN HISTORIC ….
765
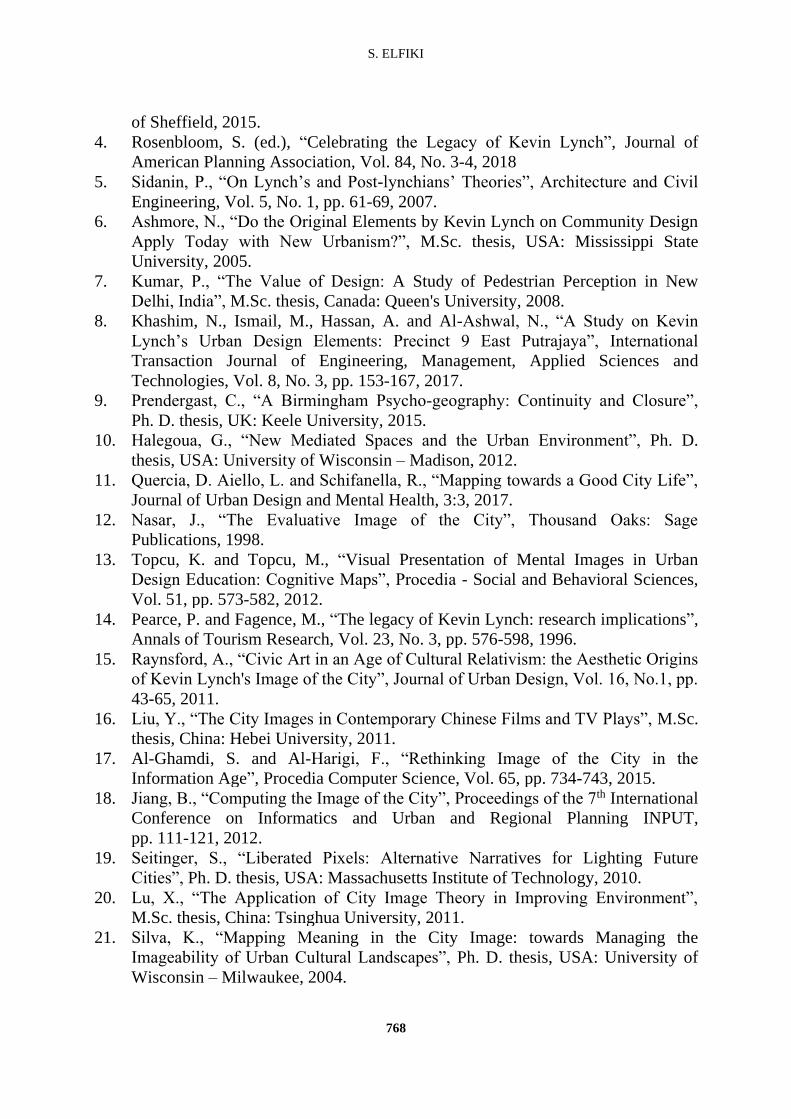
experience with the area. This interpretation can also apply to the minor difference in
participants’ familiarity with ‘New Cairo’ as shown in Fig. 20, where the vast majority
of the sample either lived in ‘New Cairo’ or visited it often. This has concluded to
more even distribution to their chosen elements, except for the edges as discussed
above. However, the ANOVA test concluded that none of the differences is of
statistical significance.
Fig. 17. Cross-tabulations for
average monthly income vs.
selected elements in
‘Historic Cairo’.
Fig. 18. Cross-tabulations for
average monthly income
vs. selected elements
in ‘New Cairo’. .
Fig. 19. Cross-tabulations for
Familiarity vs. selected
elements in ‘Historic Cairo’.
Fig. 20. Cross-tabulations for
Familiarity vs. selected
elements in ‘New Cairo’.
S. ELFIKI
766
14. CONCLUSION
The present study was meant to explore empirically how people prioritise the
elements of city image in historic and modern urban settlements – as applied to Cairo,
Egypt. Lynch is a key-figure in environmental design and behavioural studies, whose
work is highly credible and widely used in recent research-work. Therefore, the study
builds on his five main elements of city image [2].
First, the model in-study was introduced briefly together with its theoretical
backgrounds. The empirical research design was then outlined to pave the way for the
subsequent analyses and discussions.
The scope of the study addressed ‘Historic Cairo’ as defined by Law 119/2008,
and ‘New Cairo’ as defined by Presidential Decree number 191/2000. The overall
sample involved 74 participants of different genders, age groups, average monthly
income and educational backgrounds.
Statistical analyses of the purpose-designed questionnaire showed that
landmarks had the highest frequency in both contexts, whether as a first choice, in
overall frequency or with the assignment of relative weights. On the other hand, edges
came least in ‘Historic Cairo’, and nodes came least in ‘New Cairo’. This also applies
on the basis of first selection, overall frequency and when relative weights are
considered. Thus, the assumption of importance based on earlier mentions showed to
be reasonably validated, and could be cautiously used in the undertaken analyses.
Despite some apparent differences in the selections made by particular sub-
groups in cross tabulation tests, the only significant differences detected by ANOVA
test was between the choice of secondary degree holders to landmarks from their
selection to other elements in ‘Historic Cairo’ p = 0.029. The same applies to
university degree holders, whose choice of landmarks yielded to a significance factor
of p = 0.031.
It is recommended that future research investigates why edges had less
importance to particular sub-groups in ‘Historic Cairo’, and why nodes were less
important to the imageability of ‘New Cairo’, as per different participant-groups.
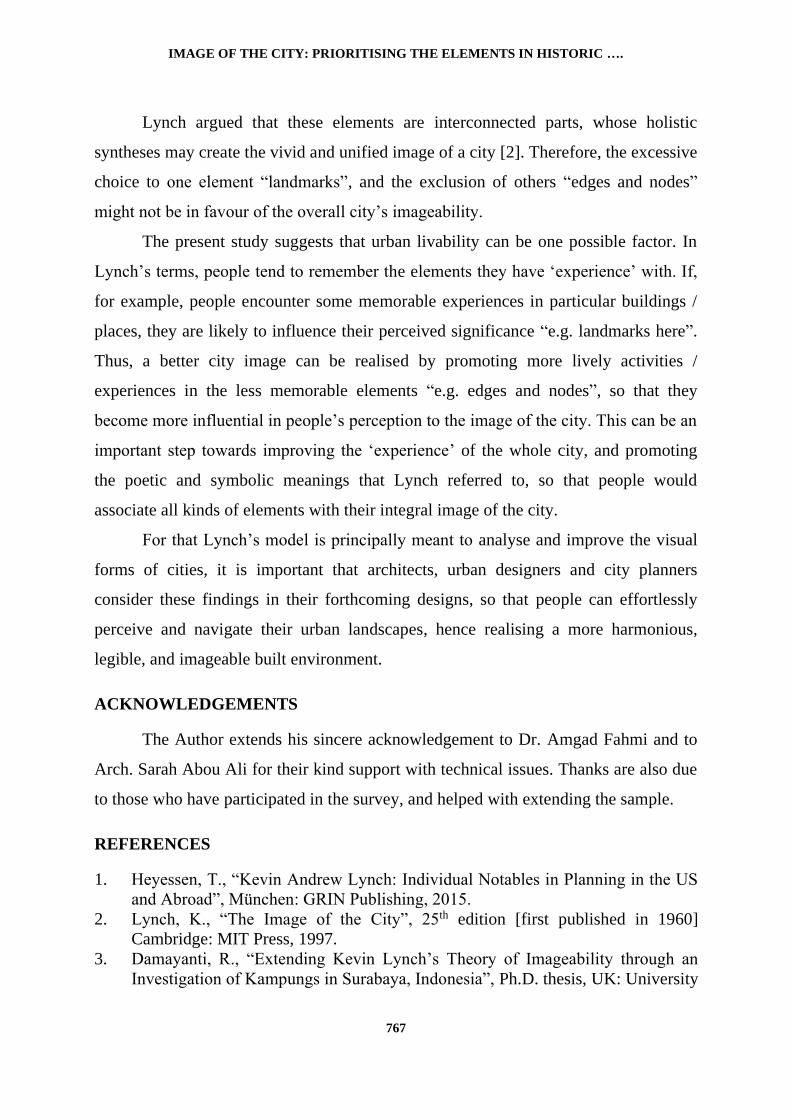
IMAGE OF THE CITY: PRIORITISING THE ELEMENTS IN HISTORIC ….
767
Lynch argued that these elements are interconnected parts, whose holistic
syntheses may create the vivid and unified image of a city [2]. Therefore, the excessive
choice to one element “landmarks”, and the exclusion of others “edges and nodes”
might not be in favour of the overall city’s imageability.
The present study suggests that urban livability can be one possible factor. In
Lynch’s terms, people tend to remember the elements they have ‘experience’ with. If,
for example, people encounter some memorable experiences in particular buildings /
places, they are likely to influence their perceived significance “e.g. landmarks here”.
Thus, a better city image can be realised by promoting more lively activities /
experiences in the less memorable elements “e.g. edges and nodes”, so that they
become more influential in people’s perception to the image of the city. This can be an
important step towards improving the ‘experience’ of the whole city, and promoting
the poetic and symbolic meanings that Lynch referred to, so that people would
associate all kinds of elements with their integral image of the city.
For that Lynch’s model is principally meant to analyse and improve the visual
forms of cities, it is important that architects, urban designers and city planners
consider these findings in their forthcoming designs, so that people can effortlessly
perceive and navigate their urban landscapes, hence realising a more harmonious,
legible, and imageable built environment.
ACKNOWLEDGEMENTS
The Author extends his sincere acknowledgement to Dr. Amgad Fahmi and to
Arch. Sarah Abou Ali for their kind support with technical issues. Thanks are also due
to those who have participated in the survey, and helped with extending the sample.
REFERENCES
1. Heyessen, T., “Kevin Andrew Lynch: Individual Notables in Planning in the US
and Abroad”, München: GRIN Publishing, 2015.
2. Lynch, K., “The Image of the City”, 25th edition [first published in 1960]
Cambridge: MIT Press, 1997.
3. Damayanti, R., “Extending Kevin Lynch’s Theory of Imageability through an
Investigation of Kampungs in Surabaya, Indonesia”, Ph.D. thesis, UK: University
S. ELFIKI
768
of Sheffield, 2015.
4. Rosenbloom, S. (ed.), “Celebrating the Legacy of Kevin Lynch”, Journal of
American Planning Association, Vol. 84, No. 3-4, 2018
5. Sidanin, P., “On Lynch’s and Post-lynchians’ Theories”, Architecture and Civil
Engineering, Vol. 5, No. 1, pp. 61-69, 2007.
6. Ashmore, N., “Do the Original Elements by Kevin Lynch on Community Design
Apply Today with New Urbanism?”, M.Sc. thesis, USA: Mississippi State
University, 2005.
7. Kumar, P., “The Value of Design: A Study of Pedestrian Perception in New
Delhi, India”, M.Sc. thesis, Canada: Queen's University, 2008.
8. Khashim, N., Ismail, M., Hassan, A. and Al-Ashwal, N., “A Study on Kevin
Lynch’s Urban Design Elements: Precinct 9 East Putrajaya”, International
Transaction Journal of Engineering, Management, Applied Sciences and
Technologies, Vol. 8, No. 3, pp. 153-167, 2017.
9. Prendergast, C., “A Birmingham Psycho-geography: Continuity and Closure”,
Ph. D. thesis, UK: Keele University, 2015.
10. Halegoua, G., “New Mediated Spaces and the Urban Environment”, Ph. D.
thesis, USA: University of Wisconsin – Madison, 2012.
11. Quercia, D. Aiello, L. and Schifanella, R., “Mapping towards a Good City Life”,
Journal of Urban Design and Mental Health, 3:3, 2017.
12. Nasar, J., “The Evaluative Image of the City”, Thousand Oaks: Sage
Publications, 1998.
13. Topcu, K. and Topcu, M., “Visual Presentation of Mental Images in Urban
Design Education: Cognitive Maps”, Procedia - Social and Behavioral Sciences,
Vol. 51, pp. 573-582, 2012.
14. Pearce, P. and Fagence, M., “The legacy of Kevin Lynch: research implications”,
Annals of Tourism Research, Vol. 23, No. 3, pp. 576-598, 1996.
15. Raynsford, A., “Civic Art in an Age of Cultural Relativism: the Aesthetic Origins
of Kevin Lynch's Image of the City”, Journal of Urban Design, Vol. 16, No.1, pp.
43-65, 2011.
16. Liu, Y., “The City Images in Contemporary Chinese Films and TV Plays”, M.Sc.
thesis, China: Hebei University, 2011.
17. Al-Ghamdi, S. and Al-Harigi, F., “Rethinking Image of the City in the
Information Age”, Procedia Computer Science, Vol. 65, pp. 734-743, 2015.
18. Jiang, B., “Computing the Image of the City”, Proceedings of the 7th International
Conference on Informatics and Urban and Regional Planning INPUT,
pp. 111-121, 2012.
19. Seitinger, S., “Liberated Pixels: Alternative Narratives for Lighting Future
Cities”, Ph. D. thesis, USA: Massachusetts Institute of Technology, 2010.
20. Lu, X., “The Application of City Image Theory in Improving Environment”,
M.Sc. thesis, China: Tsinghua University, 2011.
21. Silva, K., “Mapping Meaning in the City Image: towards Managing the
Imageability of Urban Cultural Landscapes”, Ph. D. thesis, USA: University of
Wisconsin – Milwaukee, 2004.

IMAGE OF THE CITY: PRIORITISING THE ELEMENTS IN HISTORIC ….
769
22. National Organisation for Urban Harmony. Law 119/2008, available at:
http://urbanharmony.org/download/pdf/SLAMIC%20CAIRO%20boundries%201
9-1-2011.pdf, (Accessed 10 November 2018), 2008.
23. United Nations Educational, Scientific and Cultural Organization – World
Heritage Centre and Cairo, “Urban Regeneration of Historic Cairo Project
Report”, available at: https://whc.unesco.org/document/120189, (Accessed 10
November 2018), 2012.
24. New Urban Communities Authority, “Presidential Decree 191/2000”, available
at: http://www.newcities.gov.eg/know_cities/New_Cairo/default.aspx, (Accessed
10 November 2018), 2000.
25. Denscombe, M., “The Good Research Guide for Small-scale Research Projects”,
Open University Press, Philadelphia, 2000.
26. Groat, L. and Wang, D., “Architectural Research Methods”, Wiley, Hoboken,
2013.
27. Link to the Online Questionnaire Survey used in the study:
https://docs.google.com/forms/d/e/1FAIpQLSecZ1PB1F0AysSoGsSCa89Q6exv
5fPzV8YyVLBQn1PkO6lwA/viewform?usp=sf_link
دينة : تدقيق األولوية بين القاهرة التاريخية والقاهرة الجديدةللم هنيةعناصر الصورة الذ
يقدم البحث استطالع أولويات السكان فى ترتيب عناصر الصورة الذهنية للمدينة كما حددها كيفن من سكان القاهرة حيث تم 74الينش، بالنسبة لكل من القاهرة التاريخية والقاهرة الجديدة بعينه من
هى األولوية األولى فى ادراك الناس لصورة landmarks ) (لإلجابات وتبين أن المعالمكمى ل الالتحليهى األقل تأثيرا في الصورة الذهنية للقاهرة التارخية ، ) edges (المنطقتين وفى حين كانت الحواف
بالنسبة لصورة القاهرة الجديدة ، وبهذا فإن تلك النتائج هى األقل تأثيرا ) nodes (وكانت نقاط االلتقاء والمطورين المحليين فى تطوير البيئة العمرانية بشكل أكثر تناسبا مع أولويات السكان.تفيد المصممين