priorities for treatment, care and information if faced with serious illness: a comparative...
TRANSCRIPT
Palliative Medicine2014, Vol 28(2) 101 –110© The Author(s) 2013Reprints and permissions: sagepub.co.uk/journalsPermissions.navDOI: 10.1177/0269216313488989pmj.sagepub.com
Priorities for treatment, care and information if faced with serious illness: A comparative population- based survey in seven European countries
Irene J Higginson1, Barbara Gomes1, Natalia Calanzani1, Wei Gao1, Claudia Bausewein1,2,Barbara A Daveson1, Luc Deliens3,4,5, Pedro L Ferreira6, Franco Toscani7, Marjolein Gysels8, Lucas Ceulemans9, Steffen T Simon10,11, Joachim Cohen4,5 and Richard Harding1 on behalf of Project PRISMA
AbstractBackground: Health-care costs are growing, with little population-based data about people’s priorities for end-of-life care, to guide service development and aid discussions.Aim: We examined variations in people’s priorities for treatment, care and information across seven European countries.Design: Telephone survey of a random sample of households; we asked respondents their priorities if ‘faced with a serious illness, like cancer, with limited time to live’ and used multivariable logistic regressions to identify associated factors.Setting/participants: Members of the general public aged ≥16 years residing in England, Flanders, Germany, Italy, the Netherlands, Portugal and Spain.Results: In total, 9344 individuals were interviewed. Most people chose ‘improve quality of life for the time they had left’, ranging from 57% (95% confidence interval: 55%–60%, Italy) to 81% (95% confidence interval: 79%–83%, Spain). Only 2% (95% confidence interval: 1%–3%, England) to 6% (95% confidence interval: 4%–7%, Flanders) said extending life was most important, and 15% (95% confidence interval: 13%–17%, Spain) to 40% (95% confidence interval: 37%–43%, Italy) said quality and extension were equally important. Prioritising quality of life was associated with higher education in all countries (odds ratio = 1.3 (Flanders) to 7.9 (Italy)), experience of caregiving or bereavement (England, Germany, Portugal), prioritising pain/symptom control over having a positive attitude and preferring death in a hospice/palliative care unit. Those prioritising extending life had the highest home death preference of all groups. Health status did not affect priorities.Conclusions: Across all countries, extending life was prioritised by a minority, regardless of health status. Treatment and care needs to be reoriented with patient education and palliative care becoming mainstream for serious conditions such as cancer.
KeywordsDecision making, cross-cultural comparison, life extension, palliative care, quality of life
1 King’s College London, Cicely Saunders Institute, Department of Palliative Care, Policy and Rehabilitation, London, UK
2 Interdisciplinary Centre for Palliative Medicine, Munich University Hospital, Munich, Germany
3 EMGO Institute for Health and Care Research, Palliative Care Center of Expertise and Department of Public and Occupational Health, VU University Medical Center, Amsterdam, the Netherlands
4End-of-Life Care Research Group, Ghent University, Ghent, Belgium 5 End-of-Life Care Research Group, Vrije Universiteit Brussel, Brussels, Belgium
6 Centre for Health Studies and Research, University of Coimbra (CEISUC), Coimbra, Portugal
7 Istituto di Ricerca in Medicina Palliativa, Fondazione Lino Maestroni - ONLUS, Cremona, Italy
8 Barcelona Centre for International Health Research (CRESIB - Hospital Clínic), Universitat de Barcelona, Barcelona, Spain
9Campus Drie Eiken, University of Antwerp, Antwerp, Belgium 10 Center for Palliative Medicine and Center for Integrative Oncology
(CIO), University Hospital Cologne, Cologne, Germany11Institute of Palliative Care (ipac), Oldenburg, Germany
Corresponding author:Irene J Higginson, King’s College London, Cicely Saunders Institute, Department of Palliative Care, Policy and Rehabilitation, Bessemer Road, London SE5 9PJ, UK. Email: [email protected]
488989 PMJ28210.1177/0269216313488989Palliative MedicineHigginson et al.2013
Original Article
by guest on May 9, 2016pmj.sagepub.comDownloaded from
102 Palliative Medicine 28(2)
Introduction
Innovations and new treatments mean that intensive treatments are increasingly offered in advanced illness. As a result, about a quarter of health-care expenditure is incurred for people in the last year of life.1,2 The costs of cancer treatment and care are predicted to increase in the United States to over US$173 billion in 2020 and beyond, increasing by 600% in 30 years.3 This rise in costs is ech-oed in most countries and across many diseases, driven by the growing prevalence of cancer and chronic conditions in ageing populations and the high costs of new intensive treatments. Recent criticism proposes that a shift is needed to limit intensive second- and third-line chemotherapies with little proven benefit on survival, accompanied by change of attitudes and practices.4,5
Intensive treatment in advanced illness is often given in the belief that patients and their families wish for sur-vival to preserve hope. However, what are the actual patient and public views? Current evidence is conflicting, ranging from 40 out of 95 patients attending a London cancer centre believing that they would choose intensive treatment for a 3-month increase in survival or symptom relief6 to 84% of 147 older adults attending centres in the United States, preferring medical care focused on comfort rather than focused on extending life.7 Data from specific centres are unlikely to represent general opinion and vary by setting and question format. While some intensive treatments are given primarily for symptom relief, some have profound side effects or restrict patients’ interactions or activities, affecting quality of life.4,6 To ensure appro-priate future health-care delivery in the face of rising costs, robust information on public priorities and prefer-ences is pressing. Furthermore, we need to understand how priorities are influenced by individual characteristics and by country, where cultures, religious beliefs, provision of palliative care services and legal frameworks vary.8,9 This study aimed to examine citizens’ priorities if faced with a serious illness, like cancer, and limited time to live, across seven European countries, and to identify overall and country-specific influencing factors.
Subjects and methods
This study followed the Strengthening the Reporting of Observational Studies in Epidemiology (STROBE) guide-lines,10 and the completed checklist for cross-sectional studies is available online (Table A in supplementary data).
Design and participants
This population-based telephone survey covered England, Flanders (the Dutch-speaking part of Belgium), Germany, Italy, the Netherlands, Spain and Portugal. These countries
were chosen as they took part in a European collaborative (PRISMA) that had the aim to co-ordinate research into end-of-life care in cancer.11 Each country/region has between 10 and 81 million inhabitants, diverse sociodemographic pro-files and palliative care services9 (Table B in supplementary data). Portugal, Italy and Spain have a strong influence of the Catholic Church, a common tendency for partial disclo-sure of diagnosis and low use of advance directives com-pared to north European countries.12 In Flanders and the Netherlands, there is a culture of full disclosure and eutha-nasia is legal since 2002.13,14 In England, specialist pallia-tive care services are most strongly established, and there is a national end-of-life care strategy aiming to raise public awareness and challenge taboos about death.8,15 In Germany, there is an attitude of full disclosure regarding diagnosis, and non-compliance with advance directives has recently become a legal offence.16
Individuals aged ≥16 years residing in a household were invited to participate in a computer-assisted telephone inter-view (CATI) by a random selection of households using ran-dom digit dialling (RDD). Exclusion criteria were incapacity to hear or understand the information and provide informed consent (assessed by the interviewers) and poor language skills that precluded them from participating in the survey in the dominant language in each respective country.
Procedures
To ensure standardisation and high-quality data, we devel-oped comprehensive manuals and trained 149 interviewers (95% native speakers) with experience in telephone sur-veys on social and health issues to administer our question-naire. Interviews were conducted from May to December 2010 with at least four call attempts (at least one made after 6 p.m. to capture working adults).17
The questionnaire was developed and revised following review of studies and questions on preferences and priori-ties for end-of-life care18 and three consultation rounds of individual feedback and group discussions with 27 experts who were partners in the study.11 The questionnaire had 28 questions (available online as supplementary data) and could be completed in 15 min on the telephone. It was piloted using cognitive interviewing, a well-established approach when developing surveys19,20 with a purposeful sample of 30 volunteers in England and Germany.21 The questionnaire was translated into each country’s dominant language by forward translations by two independent native speakers, backward professional translation and harmoni-sation of all versions, following European Organisation for Research and Treatment of Cancer (EORTC) translation procedures.22 Three questions addressed priorities (Box 1) regarding treatment, personal care and information/deci-sion-making. Other questions included social and demo-graphic backgrounds (with questions adapted from the
by guest on May 9, 2016pmj.sagepub.comDownloaded from
Higginson et al. 103
European Social Survey9) and also end-of-life experiences. Publications on other topics covered by the questionnaire are available.17,23–26
Telephone surveys have been helping public health research and practice for decades;27 this method was also the most cost-effective to obtain a random sample of house-holds. The interviews were carried out using CATI; this involves the use of software that allows the questionnaire to be displayed on the screen in a standardised way. Households were selected via RDD; telephone numbers were generated by adding random numbers to real area dialling codes in each country. No quotas (geographic or sociodemographic) were applied. The questionnaires were piloted over the telephone in all the countries (485 inter-views in 16 days) to test the feasibility and acceptability of methods; no changes were made after piloting.
Ethical approval
King’s College London Research Ethics Committee approved the study (ref: BDM/08/09-48). We obtained local ethics approvals and notified data protection agencies in all participating countries. Participants gave verbal con-sent to interview and could stop at any time. Local support was offered if individuals became distressed, following a protocol for managing respondent distress.
Statistical analysis
We described and compared responses using percentages with 95% confidence intervals (CIs). We tested for differ-ences using Mann–Whitney U tests, t-tests, Pearson and Cochran–Mantel–Haenszel χ2 tests as appropriate. Logistic
regression was used to verify the relationship between potential explanatory demographic variables and respond-ent preference at the end of life (dependent variable in binary scale, coded as 1 = improve quality of life for the time left; 0 = extend life or both equally important). All available explanatory variables were forced to stay in the model. The overall model fit was assessed by using Likelihood ratio test. The Max-rescaled R2 was derived to assess the total variation explained by the model. We fitted separate models for each individual country. Descriptive analyses used SPSS 17 for Windows, modelling analyses SAS statistical software, version 9.2. Cases with missing data were excluded. Tests were two-tailed and p ≤ 0.05 was deemed significant. We aimed for a minimum of 1278 com-pleted interviews in each country to allow us to detect a 9% difference (power = 0.90, significance = 0.05) in prefer-ences or priorities between groups.17
Results
Response rates and sample characteristics
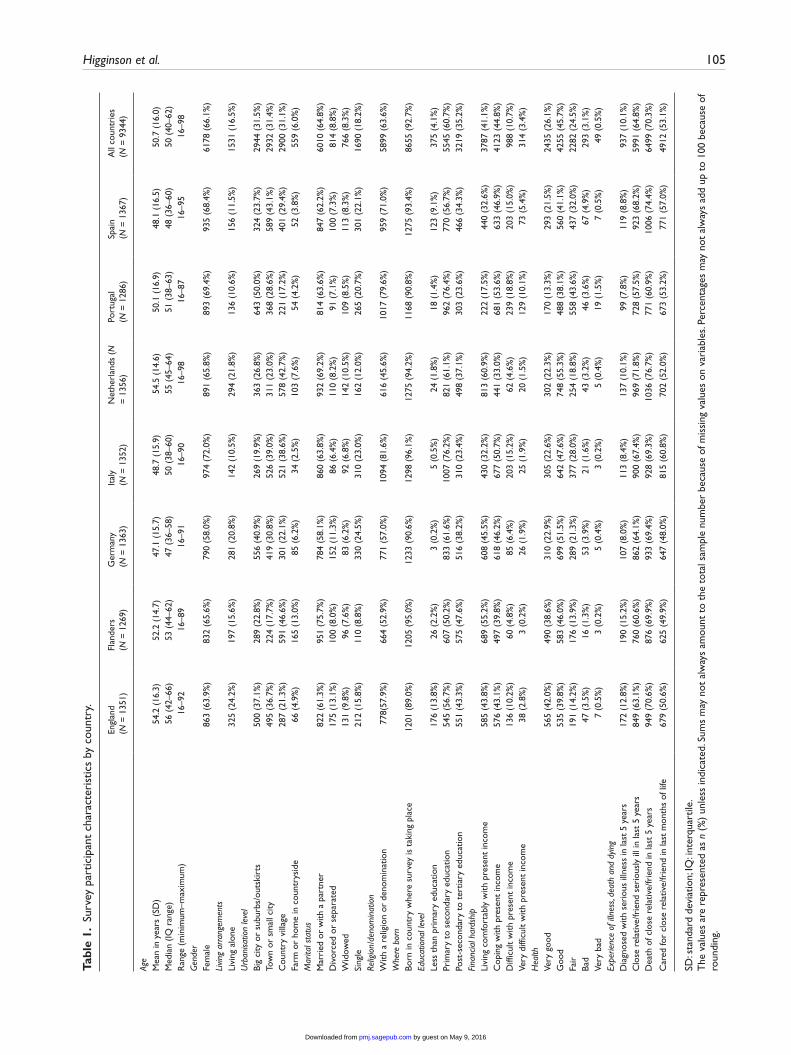
From 45,242 randomly selected households with a known eligible person, 9344 people (21%) agreed to participate in the study. The response rate was highest in Germany (29%), followed by Portugal (28%), Spain (21%), Italy (21%), England (21%), Flanders (16%) and the Netherlands (16%). Our samples were broadly representative of each country in terms of age, gender and social situation (Table 1), although there was a high proportion of women responding. Main reasons for refusing to participate were lack of interest (59%) and lack of time (17%); further information on refusal reasons is available elsewhere.17
Box 1. Questions about treatment, care and information/decision-making priorities in the PRISMA survey.
1. When people are faced with a serious illness like cancer with limited time to live, they may have to make difficult decisions and prioritise some things over others. In this situation, would it be more important to extend your life or to improve the quality of life for the time you had left? READ OUT AND CODE ONLY ONE.□ To extend life□ To improve the quality of life for the time you had left□ Both are equally important
2. When people are faced with a serious illness like cancer with limited time to live, they may have to make difficult decisions and prioritise some things over others. In this situation, how would you order the following four aspects by their level of importance to you, the first being the most important (1) and the last being the least important (4)?Aspects RANK 1 = MOST IMPORTANT/4 = LEAST IMPORTANTA – Keeping a positive attitudeB – Having pain and discomfort relievedC – Having practical matters resolvedD – Making sure relatives and friends are not worried or distressed
(Box1 Continued)
by guest on May 9, 2016pmj.sagepub.comDownloaded from
104 Palliative Medicine 28(2)
Public priorities for treatment, cancer and information
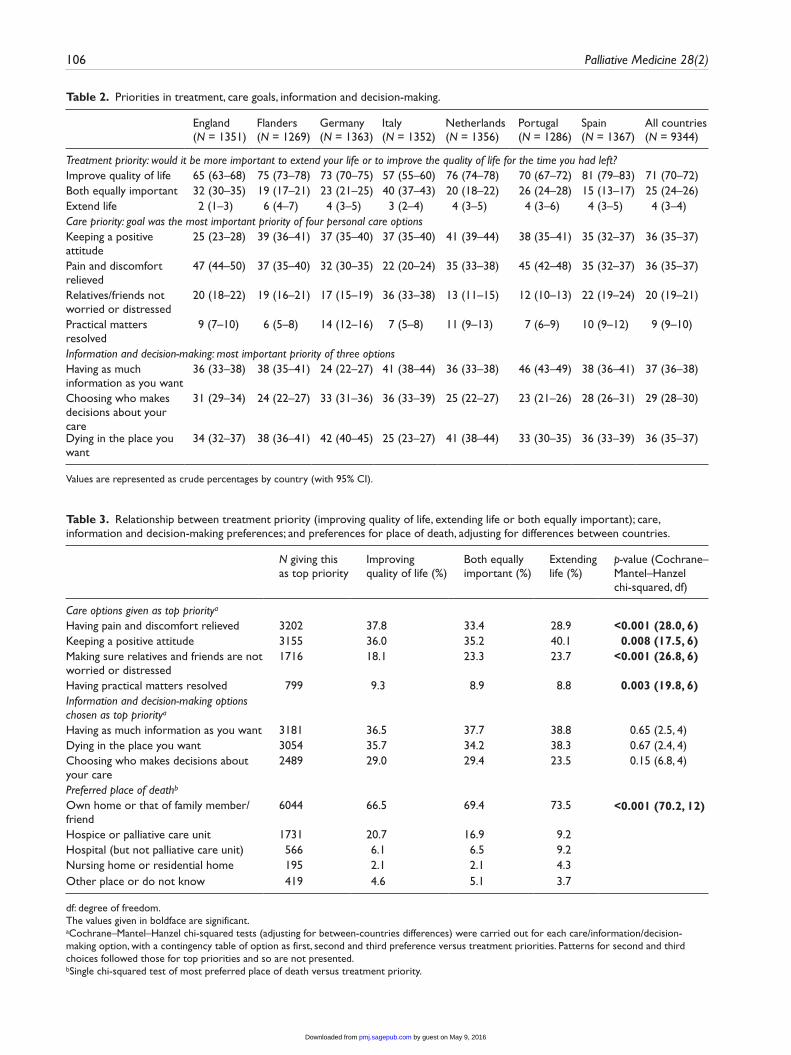
In all countries, the treatment priority was for improving the quality of life for the time left rather than extending life (Table 2). This ranged from 81% (95% CI: 79–83) in Spain to 57% (95% CI: 55–60) in Italy. In all countries, only a small proportion wanted to extend life, ranging from 2% (95% CI: 1–3) in England to 6% (95% CI: 4–7) in Flanders. Overall, one in four respondents thought that extending life and quality were equally important; this varied between countries from 15% (95% CI: 13–17) in Spain to 40% (95% CI: 37–43) in Italy.
Of the four possible care choices, across the seven coun-tries, having pain and discomfort relieved and keeping a positive attitude were equally prioritised the highest (36%, 95% CI: 35–37), followed by relatives/friends not being worried or distressed (20%, 95% CI: 19–21) and practical matters resolved (9%, 95% CI: 9–10). However, the prior-ity of these goals varied by country, with keeping a positive attitude rated as highest priority in Flanders, Germany, Italy and the Netherlands, and pain and discomfort relieved rated highest in England and Portugal. In Italy, 36% (95% CI: 33–38) chose family/friends not being worried or distressed (Table 2).
These personal care choices were significantly associ-ated with prioritising life extension or life quality. After adjusting for country differences, those who prioritised extending life were more likely to rank keeping a positive attitude and making sure friends and relatives are not dis-tressed as most important (Table 3). Conversely, those who prioritised quality of life were more likely to rank having pain and discomfort relieved and having practical matters resolved as most important. Home death was the most pre-ferred option overall (69% of respondents), and it was more common in those prioritising extending life (74%) versus those choosing quality of life (67%). Preference for hospice or palliative care unit was much higher in those choosing quality of life (21%) versus those choosing life extension (9%) (Table 3). Overall, the highest priorities for informa-tion and decision-making were almost equal for having as much information as wanted (37%, 95% CI: 36–38) and dying in the preferred place (36%, 95% CI: 35–37), slightly lower was choosing who should make decisions about care (29%, 95% CI: 28–30). Germany and the Netherlands
ranked dying in the preferred place (42% and 41%, respec-tively) the highest, and Germany ranked having as much information as wanted (24%) lowest (Table 2). There was no relationship between these options and whether the respondent preferred life extension or improving quality of life (Table 3).
Factors associated with treatment priorities
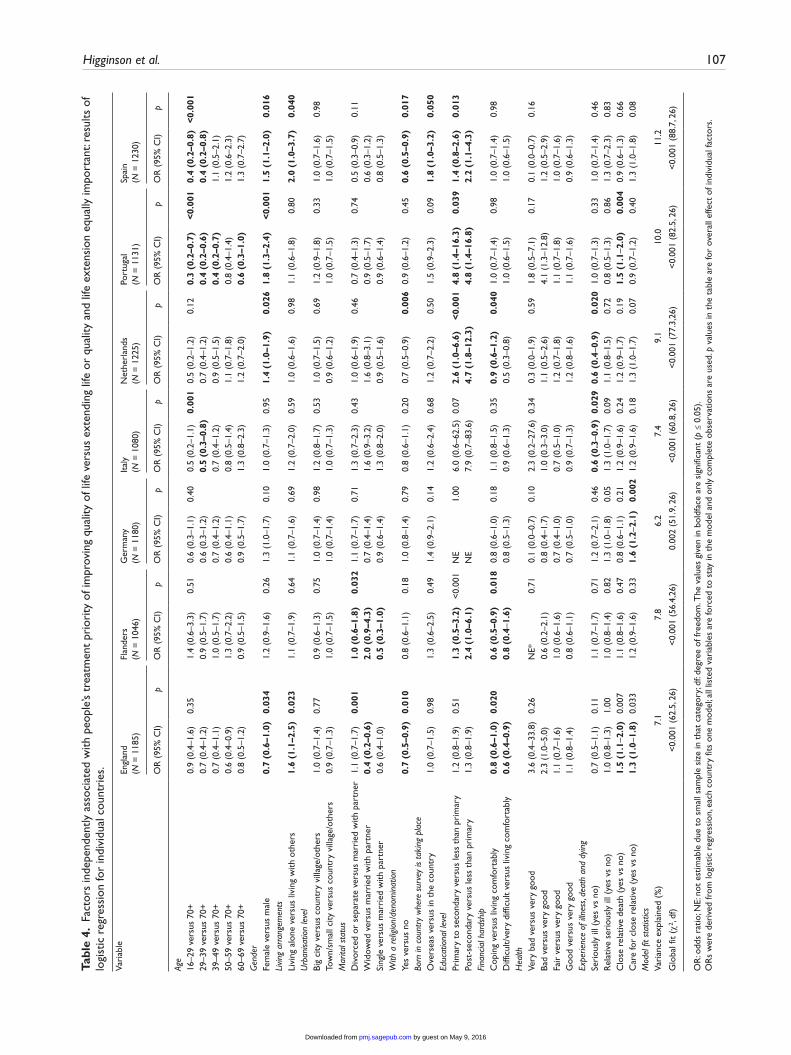
Logistic regression analysis found variation between coun-tries in demographic factors associated with respondents’ treatment priority of improving quality of life (Table 4). Therefore, it was not appropriate to develop an overall model across countries. In England, seven characteristics (men, married rather than widowed, living alone, no reli-gious belief, good financial status, the experience of close relative’s death and the experience of caring for a relative in the past 5 years) were independently associated with prior-itising quality of life; while in Germany, only the experi-ence of caring for a close relative in the past 5 years mattered (odds ratio (OR)yes vs no = 1.6; 95% CI: 0.2–2.1). In Italy, Portugal and Spain, older age was a significant pre-dictor of prioritising quality of life. A higher education level was associated with prioritising quality of life in all countries (ORs range: 1.3–7.9) and reached a statistically significant level in Flanders, the Netherlands, Portugal and Spain. In all countries, the respondent’s health status or country of birth were not independent predictors of treat-ment priority.
Discussion
Common across all countries was the public’s low priority for extending life (less than 6% of respondents) if faced with advanced cancer. The most popular priority was qual-ity of life (57% or more of respondents). The largest varia-tion between countries was observed in whether respondents felt that both quality and life extension were equally impor-tant, with 40% in Italy compared to 15% in Spain choosing this option. The consistent emphasis on quality of life, either alone or with life extension, has implications for can-cer treatment and care. Survival rates remain low even from diagnosis for some common cancers (such as lung and pan-creas), especially when metastatic disease is present.4,28 Asking patients, soon after diagnosis, about their treatment
3. What would matter most to you in the care available? Please choose from the following three aspects the one that would matter most to you. And in second place?
• Having as much information as you want• Choosing who makes decisions about your care• Dying in the place you want
Box 1. Continued
by guest on May 9, 2016pmj.sagepub.comDownloaded from
Higginson et al. 105
Tabl
e 1.
Sur
vey
part
icip
ant
char
acte
rist
ics
by c
ount
ry.
Engl
and
(N
= 1
351)
Flan
ders
(N
= 1
269)
Ger
man
y
(N =
136
3)It
aly
(N
= 1
352)
Net
herl
ands
(N
=
135
6)Po
rtug
al
(N =
128
6)Sp
ain
(N
= 1
367)
All
coun
trie
s
(N =
934
4)
Age
Mea
n in
yea
rs (
SD)
54.2
(16
.3)
52.2
(14
.7)
47.1
(15
.7)
48.7
(15
.9)
54.5
(14
.6)
50.1
(16
.9)
48.1
(16
.5)
50.7
(16
.0)
Med
ian
(IQ r
ange
)56
(42
–66)
53 (
44–6
2)47
(36
–58)
50 (
38–6
0)55
(45
–64)
51 (
38–6
3)48
(36
–60)
50 (
40–6
2)R
ange
(m
inim
um–m
axim
um)
16–9
216
–89
16–9
116
–90
16–9
816
–87
16–9
516
–98
Gen
der
Fem
ale
863
(63.
9%)
832
(65.
6%)
790
(58.
0%)
974
(72.
0%)
891
(65.
8%)
893
(69.
4%)
935
(68.
4%)
6178
(66
.1%
)Li
ving
arra
ngem
ents
Livi
ng a
lone
325
(24.
2%)
197
(15.
6%)
281
(20.
8%)
142
(10.
5%)
294
(21.
8%)
136
(10.
6%)
156
(11.
5%)
1531
(16
.5%
)U
rban
isatio
n le
vel
Big
city
or
subu
rbs/
outs
kirt
s50
0 (3
7.1%
)28
9 (2
2.8%
)55
6 (4
0.9%
)26
9 (1
9.9%
)36
3 (2
6.8%
)64
3 (5
0.0%
)32
4 (2
3.7%
)29
44 (
31.5
%)
Tow
n or
sm
all c
ity49
5 (3
6.7%
)22
4 (1
7.7%
)41
9 (3
0.8%
)52
6 (3
9.0%
)31
1 (2
3.0%
)36
8 (2
8.6%
)58
9 (4
3.1%
)29
32 (
31.4
%)
Cou
ntry
vill
age
287
(21.
3%)
591
(46.
6%)
301
(22.
1%)
521
(38.
6%)
578
(42.
7%)
221
(17.
2%)
401
(29.
4%)
2900
(31
.1%
)Fa
rm o
r ho
me
in c
ount
rysi
de66
(4.
9%)
165
(13.
0%)
85 (
6.2%
)34
(2.
5%)
103
(7.6
%)
54 (
4.2%
)52
(3.
8%)
559
(6.0
%)
Mar
ital s
tatu
sM
arri
ed o
r w
ith a
par
tner
822
(61.
3%)
951
(75.
7%)
784
(58.
1%)
860
(63.
8%)
932
(69.
2%)
814
(63.
6%)
847
(62.
2%)
6010
(64
.8%
)D
ivor
ced
or s
epar
ated
175
(13.
1%)
100
(8.0
%)
152
(11.
3%)
86 (
6.4%
)11
0 (8
.2%
)91
(7.
1%)
100
(7.3
%)
814
(8.8
%)
Wid
owed
131
(9.8
%)
96 (
7.6%
)83
(6.
2%)
92 (
6.8%
)14
2 (1
0.5%
)10
9 (8
.5%
)11
3 (8
.3%
)76
6 (8
.3%
)Si
ngle
212
(15.
8%)
110
(8.8
%)
330
(24.
5%)
310
(23.
0%)
162
(12.
0%)
265
(20.
7%)
301
(22.
1%)
1690
(18
.2%
)Re
ligio
n/de
nom
inat
ion
With
a r
elig
ion
or d
enom
inat
ion
778(
57.9
%)
664
(52.
9%)
771
(57.
0%)
1094
(81
.6%
)61
6 (4
5.6%
)10
17 (
79.6
%)
959
(71.
0%)
5899
(63
.6%
)W
here
bor
nBo
rn in
cou
ntry
whe
re s
urve
y is
tak
ing
plac
e12
01 (
89.0
%)
1205
(95
.0%
)12
33 (
90.6
%)
1298
(96
.1%
)12
75 (
94.2
%)
1168
(90
.8%
)12
75 (
93.4
%)
8655
(92
.7%
)Ed
ucat
iona
l lev
elLe
ss t
han
prim
ary
educ
atio
n17
6 (1
3.8%
)26
(2.
2%)
3 (0
.2%
)5
(0.5
%)
24 (
1.8%
)18
(1.
4%)
123
(9.1
%)
375
(4.1
%)
Prim
ary
to s
econ
dary
edu
catio
n54
5 (5
6.7%
)60
7 (5
0.2%
)83
3 (6
1.6%
)10
07 (
76.2
%)
821
(61.
1%)
962
(76.
4%)
770
(56.
7%)
5545
(60
.7%
)Po
st-s
econ
dary
to
tert
iary
edu
catio
n55
1 (4
3.3%
)57
5 (4
7.6%
)51
6 (3
8.2%
)31
0 (2
3.4%
)49
8 (3
7.1%
)30
3 (2
3.6%
)46
6 (3
4.3%
)32
19 (
35.2
%)
Fina
ncia
l har
dshi
pLi
ving
com
fort
ably
with
pre
sent
inco
me
585
(43.
8%)
689
(55.
2%)
608
(45.
5%)
430
(32.
2%)
813
(60.
9%)
222
(17.
5%)
440
(32.
6%)
3787
(41
.1%
)C
opin
g w
ith p
rese
nt in
com
e57
6 (4
3.1%
)49
7 (3
9.8%
)61
8 (4
6.2%
)67
7 (5
0.7%
)44
1 (3
3.0%
)68
1 (5
3.6%
)63
3 (4
6.9%
)41
23 (
44.8
%)
Diff
icul
t w
ith p
rese
nt in
com
e13
6 (1
0.2%
)60
(4.
8%)
85 (
6.4%
)20
3 (1
5.2%
)62
(4.
6%)
239
(18.
8%)
203
(15.
0%)
988
(10.
7%)
Very
diff
icul
t w
ith p
rese
nt in
com
e38
(2.
8%)
3 (0
.2%
)26
(1.
9%)
25 (
1.9%
)20
(1.
5%)
129
(10.
1%)
73 (
5.4%
)31
4 (3
.4%
)H
ealth
Very
goo
d56
5 (4
2.0%
)49
0 (3
8.6%
)31
0 (2
2.9%
)30
5 (2
2.6%
)30
2 (2
2.3%
)17
0 (1
3.3%
)29
3 (2
1.5%
)24
35 (
26.1
%)
Goo
d53
5 (3
9.8%
)58
3 (4
6.0%
)69
9 (5
1.5%
)64
2 (4
7.6%
)74
8 (5
5.3%
)48
8 (3
8.1%
)56
0 (4
1.1%
)42
55 (
45.7
%)
Fair
191
(14.
2%)
176
(13.
9%)
289
(21.
3%)
377
(28.
0%)
254
(18.
8%)
558
(43.
6%)
437
(32.
0%)
2282
(24
.5%
)Ba
d47
(3.
5%)
16 (
1.3%
)53
(3.
9%)
21 (
1.6%
)43
(3.
2%)
46 (
3.6%
)67
(4.
9%)
293
(3.1
%)
Very
bad
7 (0
.5%
)3
(0.2
%)
5 (0
.4%
)3
(0.2
%)
5 (0
.4%
)19
(1.
5%)
7 (0
.5%
)49
(0.
5%)
Expe
rienc
e of
illn
ess,
deat
h an
d dy
ing
Dia
gnos
ed w
ith s
erio
us il
lnes
s in
last
5 y
ears
172
(12.
8%)
190
(15.
2%)
107
(8.0
%)
113
(8.4
%)
137
(10.
1%)
99 (
7.8%
)11
9 (8
.8%
)93
7 (1
0.1%
)C
lose
rel
ativ
e/fr
iend
ser
ious
ly il
l in
last
5 y
ears
849
(63.
1%)
760
(60.
6%)
862
(64.
1%)
900
(67.
4%)
969
(71.
8%)
728
(57.
5%)
923
(68.
2%)
5991
(64
.8%
)D
eath
of c
lose
rel
ativ
e/fr
iend
in la
st 5
yea
rs94
9 (7
0.6%
)87
6 (6
9.9%
)93
3 (6
9.4%
)92
8 (6
9.3%
)10
36 (
76.7
%)
771
(60.
9%)
1006
(74
.4%
)64
99 (
70.3
%)
Car
ed fo
r cl
ose
rela
tive/
frie
nd in
last
mon
ths
of li
fe67
9 (5
0.6%
)62
5 (4
9.9%
)64
7 (4
8.0%
)81
5 (6
0.8%
)70
2 (5
2.0%
)67
3 (5
3.2%
)77
1 (5
7.0%
)49
12 (
53.1
%)
SD: s
tand
ard
devi
atio
n; IQ
: int
erqu
artil
e.T
he v
alue
s ar
e re
pres
ente
d as
n (
%)
unle
ss in
dica
ted.
Sum
s m
ay n
ot a
lway
s am
ount
to
the
tota
l sam
ple
num
ber
beca
use
of m
issi
ng v
alue
s on
var
iabl
es. P
erce
ntag
es m
ay n
ot a
lway
s ad
d up
to
100
beca
use
of
roun
ding
.
by guest on May 9, 2016pmj.sagepub.comDownloaded from
106 Palliative Medicine 28(2)
Table 2. Priorities in treatment, care goals, information and decision-making.
England (N = 1351)
Flanders (N = 1269)
Germany (N = 1363)
Italy (N = 1352)
Netherlands (N = 1356)
Portugal (N = 1286)
Spain (N = 1367)
All countries (N = 9344)
Treatment priority: would it be more important to extend your life or to improve the quality of life for the time you had left?Improve quality of life 65 (63–68) 75 (73–78) 73 (70–75) 57 (55–60) 76 (74–78) 70 (67–72) 81 (79–83) 71 (70–72)Both equally important 32 (30–35) 19 (17–21) 23 (21–25) 40 (37–43) 20 (18–22) 26 (24–28) 15 (13–17) 25 (24–26)Extend life 2 (1–3) 6 (4–7) 4 (3–5) 3 (2–4) 4 (3–5) 4 (3–6) 4 (3–5) 4 (3–4)Care priority: goal was the most important priority of four personal care optionsKeeping a positive attitude
25 (23–28) 39 (36–41) 37 (35–40) 37 (35–40) 41 (39–44) 38 (35–41) 35 (32–37) 36 (35–37)
Pain and discomfort relieved
47 (44–50) 37 (35–40) 32 (30–35) 22 (20–24) 35 (33–38) 45 (42–48) 35 (32–37) 36 (35–37)
Relatives/friends not worried or distressed
20 (18–22) 19 (16–21) 17 (15–19) 36 (33–38) 13 (11–15) 12 (10–13) 22 (19–24) 20 (19–21)
Practical matters resolved
9 (7–10) 6 (5–8) 14 (12–16) 7 (5–8) 11 (9–13) 7 (6–9) 10 (9–12) 9 (9–10)
Information and decision-making: most important priority of three optionsHaving as much information as you want
36 (33–38) 38 (35–41) 24 (22–27) 41 (38–44) 36 (33–38) 46 (43–49) 38 (36–41) 37 (36–38)
Choosing who makes decisions about your care
31 (29–34) 24 (22–27) 33 (31–36) 36 (33–39) 25 (22–27) 23 (21–26) 28 (26–31) 29 (28–30)
Dying in the place you want
34 (32–37) 38 (36–41) 42 (40–45) 25 (23–27) 41 (38–44) 33 (30–35) 36 (33–39) 36 (35–37)
Values are represented as crude percentages by country (with 95% CI).
Table 3. Relationship between treatment priority (improving quality of life, extending life or both equally important); care, information and decision-making preferences; and preferences for place of death, adjusting for differences between countries.
N giving this as top priority
Improving quality of life (%)
Both equally important (%)
Extending life (%)
p-value (Cochrane–Mantel–Hanzel chi-squared, df)
Care options given as top prioritya
Having pain and discomfort relieved 3202 37.8 33.4 28.9 <0.001 (28.0, 6)Keeping a positive attitude 3155 36.0 35.2 40.1 0.008 (17.5, 6)Making sure relatives and friends are not worried or distressed
1716 18.1 23.3 23.7 <0.001 (26.8, 6)
Having practical matters resolved 799 9.3 8.9 8.8 0.003 (19.8, 6)Information and decision-making options chosen as top prioritya
Having as much information as you want 3181 36.5 37.7 38.8 0.65 (2.5, 4)Dying in the place you want 3054 35.7 34.2 38.3 0.67 (2.4, 4)Choosing who makes decisions about your care
2489 29.0 29.4 23.5 0.15 (6.8, 4)
Preferred place of deathb
Own home or that of family member/friend
6044 66.5 69.4 73.5 <0.001 (70.2, 12)
Hospice or palliative care unit 1731 20.7 16.9 9.2Hospital (but not palliative care unit) 566 6.1 6.5 9.2Nursing home or residential home 195 2.1 2.1 4.3Other place or do not know 419 4.6 5.1 3.7
df: degree of freedom.The values given in boldface are significant.aCochrane–Mantel–Hanzel chi-squared tests (adjusting for between-countries differences) were carried out for each care/information/decision-making option, with a contingency table of option as first, second and third preference versus treatment priorities. Patterns for second and third choices followed those for top priorities and so are not presented.bSingle chi-squared test of most preferred place of death versus treatment priority.
by guest on May 9, 2016pmj.sagepub.comDownloaded from
Higginson et al. 107
Tabl
e 4.
Fac
tors
inde
pend
ently
ass
ocia
ted
with
peo
ple’
s tr
eatm
ent
prio
rity
of i
mpr
ovin
g qu
ality
of l
ife v
ersu
s ex
tend
ing
life
or q
ualit
y an
d lif
e ex
tens
ion
equa
lly im
port
ant:
resu
lts o
f lo
gist
ic r
egre
ssio
n fo
r in
divi
dual
cou
ntri
es.
Vari
able
Engl
and
(N
= 1
185)
Flan
ders
(N
= 1
046)
Ger
man
y
(N =
118
0)It
aly
(N
= 1
080)
Net
herl
ands
(N
= 1
225)
Port
ugal
(N
= 1
131)
Spai
n
(N =
123
0)
OR
(95
% C
I)p
OR
(95
% C
I)p
OR
(95
% C
I)p
OR
(95
% C
I)p
OR
(95
% C
I)p
OR
(95
% C
I)p
OR
(95
% C
I)p
Age
16–2
9 ve
rsus
70+
0.9
(0.4
–1.6
)0.
351.
4 (0
.6–3
.3)
0.51
0.6
(0.3
–1.1
)0.
400.
5 (0
.2–1
.1)
0.00
10.
5 (0
.2–1
.2)
0.12
0.3
(0.2
–0.7
)<0
.001
0.4
(0.2
–0.8
)<0
.001
29–3
9 ve
rsus
70+
0.7
(0.4
–1.2
)0.
9 (0
.5–1
.7)
0.6
(0.3
–1.2
)0.
5 (0
.3–0
.8)
0.7
(0.4
–1.2
)0.
4 (0
.2–0
.6)
0.4
(0.2
–0.8
)39
–49
vers
us 7
0+0.
7 (0
.4–1
.1)
1.0
(0.5
–1.7
)0.
7 (0
.4–1
.2)
0.7
(0.4
–1.2
)0.
9 (0
.5–1
.5)
0.4
(0.2
–0.7
)1.
1 (0
.5–2
.1)
50–5
9 ve
rsus
70+
0.6
(0.4
–0.9
)1.
3 (0
.7–2
.2)
0.6
(0.4
–1.1
)0.
8 (0
.5–1
.4)
1.1
(0.7
–1.8
)0.
8 (0
.4–1
.4)
1.2
(0.6
–2.3
)60
–69
vers
us 7
0+0.
8 (0
.5–1
.2)
0.9
(0.5
–1.5
)0.
9 (0
.5–1
.7)
1.3
(0.8
–2.3
)1.
2 (0
.7–2
.0)
0.6
(0.3
–1.0
)1.
3 (0
.7–2
.7)
Gen
der
Fem
ale
vers
us m
ale
0.7
(0.6
–1.0
)0.
034
1.2
(0.9
–1.6
)0.
261.
3 (1
.0–1
.7)
0.10
1.0
(0.7
–1.3
)0.
951.
4 (1
.0–1
.9)
0.02
61.
8 (1
.3–2
.4)
<0.0
011.
5 (1
.1–2
.0)
0.01
6Li
ving
arra
ngem
ents
Livi
ng a
lone
ver
sus
livin
g w
ith o
ther
s1.
6 (1
.1–2
.5)
0.02
31.
1 (0
.7–1
.9)
0.64
1.1
(0.7
–1.6
)0.
691.
2 (0
.7–2
.0)
0.59
1.0
(0.6
–1.6
)0.
981.
1 (0
.6–1
.8)
0.80
2.0
(1.0
–3.7
)0.
040
Urb
anisa
tion
leve
lBi
g ci
ty v
ersu
s co
untr
y vi
llage
/oth
ers
1.0
(0.7
–1.4
)0.
770.
9 (0
.6–1
.3)
0.75
1.0
(0.7
–1.4
)0.
981.
2 (0
.8–1
.7)
0.53
1.0
(0.7
–1.5
)0.
691.
2 (0
.9–1
.8)
0.33
1.0
(0.7
–1.6
)0.
98To
wn/
smal
l city
ver
sus
coun
try
villa
ge/o
ther
s0.
9 (0
.7–1
.3)
1.0
(0.7
–1.5
)1.
0 (0
.7–1
.4)
1.0
(0.7
–1.3
)0.
9 (0
.6–1
.2)
1.0
(0.7
–1.5
)1.
0 (0
.7–1
.5)
Mar
ital s
tatu
sD
ivor
ced
or s
epar
ate
vers
us m
arri
ed w
ith p
artn
er1.
1 (0
.7–1
.7)
0.00
11.
0 (0
.6–1
.8)
0.03
21.
1 (0
.7–1
.7)
0.71
1.3
(0.7
–2.3
)0.
431.
0 (0
.6–1
.9)
0.46
0.7
(0.4
–1.3
)0.
740.
5 (0
.3–0
.9)
0.11
Wid
owed
ver
sus
mar
ried
with
par
tner
0.4
(0.2
–0.6
)2.
0 (0
.9–4
.3)
0.7
(0.4
–1.4
)1.
6 (0
.9–3
.2)
1.6
(0.8
–3.1
)0.
9 (0
.5–1
.7)
0.6
(0.3
–1.2
)Si
ngle
ver
sus
mar
ried
with
par
tner
0.6
(0.4
–1.0
)0.
5 (0
.3–1
.0)
0.9
(0.6
–1.4
)1.
3 (0
.8–2
.0)
0.9
(0.5
–1.6
)0.
9 (0
.6–1
.4)
0.8
(0.5
–1.3
)W
ith a
rel
igio
n/de
nom
inat
ion
Yes
vers
us n
o0.
7 (0
.5–0
.9)
0.01
00.
8 (0
.6–1
.1)
0.18
1.0
(0.8
–1.4
)0.
790.
8 (0
.6–1
.1)
0.20
0.7
(0.5
–0.9
)0.
006
0.9
(0.6
–1.2
)0.
450.
6 (0
.5–0
.9)
0.01
7Bo
rn in
cou
ntry
whe
re s
urve
y is
taki
ng p
lace
Ove
rsea
s ve
rsus
in t
he c
ount
ry1.
0 (0
.7–1
.5)
0.98
1.3
(0.6
–2.5
)0.
491.
4 (0
.9–2
.1)
0.14
1.2
(0.6
–2.4
)0.
681.
2 (0
.7–2
.2)
0.50
1.5
(0.9
–2.3
)0.
091.
8 (1
.0–3
.2)
0.05
0Ed
ucat
iona
l lev
elPr
imar
y to
sec
onda
ry v
ersu
s le
ss t
han
prim
ary
1.2
(0.8
–1.9
)0.
511.
3 (0
.5–3
.2)
<0.
001
NE
1.00
6.0
(0.6
–62.
5)0.
072.
6 (1
.0–6
.6)
<0.0
014.
8 (1
.4–1
6.3)
0.03
91.
4 (0
.8–2
.6)
0.01
3Po
st-s
econ
dary
ver
sus
less
tha
n pr
imar
y1.
3 (0
.8–1
.9)
2.4
(1.0
–6.1
)N
E7.
9 (0
.7–8
3.6)
4.7
(1.8
–12.
3)4.
8 (1
.4–1
6.8)
2.2
(1.1
–4.3
)Fi
nanc
ial h
ards
hip
Cop
ing
vers
us li
ving
com
fort
ably
0.8
(0.6
–1.0
)0.
020
0.6
(0.5
–0.9
)0.
018
0.8
(0.6
–1.0
)0.
181.
1 (0
.8–1
.5)
0.35
0.9
(0.6
–1.2
)0.
040
1.0
(0.7
–1.4
)0.
981.
0 (0
.7–1
.4)
0.98
Diff
icul
t/ve
ry d
iffic
ult
vers
us li
ving
com
fort
ably
0.6
(0.4
–0.9
)0.
8 (0
.4–1
.6)
0.8
(0.5
–1.3
)0.
9 (0
.6–1
.3)
0.5
(0.3
–0.8
)1.
0 (0
.6–1
.5)
1.0
(0.6
–1.5
)H
ealth
Very
bad
ver
sus
very
goo
d3.
6 (0
.4–3
3.8)
0.26
NE*
0.71
0.1
(0.0
–0.7
)0.
102.
3 (0
.2–2
7.6)
0.34
0.3
(0.0
–1.9
)0.
591.
8 (0
.5–7
.1)
0.17
0.1
(0.0
–0.7
)0.
16Ba
d ve
rsus
ver
y go
od2.
3 (1
.0–5
.0)
0.6
(0.2
–2.1
)0.
8 (0
.4–1
.7)
1.0
(0.3
–3.0
)1.
1 (0
.5–2
.6)
4.1
(1.3
–12.
8)1.
2 (0
.5–2
.9)
Fair
ver
sus
very
goo
d1.
1 (0
.7–1
.6)
1.0
(0.6
–1.6
)0.
7 (0
.4–1
.0)
0.7
(0.5
–1.0
)1.
2 (0
.7–1
.8)
1.1
(0.7
–1.8
)1.
0 (0
.7–1
.6)
Goo
d ve
rsus
ver
y go
od1.
1 (0
.8–1
.4)
0.8
(0.6
–1.1
)0.
7 (0
.5–1
.0)
0.9
(0.7
–1.3
)1.
2 (0
.8–1
.6)
1.1
(0.7
–1.6
)0.
9 (0
.6–1
.3)
Expe
rienc
e of
illn
ess,
deat
h an
d dy
ing
Seri
ousl
y ill
(ye
s vs
no)
0.7
(0.5
–1.1
)0.
111.
1 (0
.7–1
.7)
0.71
1.2
(0.7
–2.1
)0.
460.
6 (0
.3–0
.9)
0.02
90.
6 (0
.4–0
.9)
0.02
01.
0 (0
.7–1
.3)
0.33
1.0
(0.7
–1.4
)0.
46R
elat
ive
seri
ousl
y ill
(ye
s vs
no)
1.0
(0.8
–1.3
)1.
001.
0 (0
.8–1
.4)
0.82
1.3
(1.0
–1.8
)0.
051.
3 (1
.0–1
.7)
0.09
1.1
(0.8
–1.5
)0.
720.
8 (0
.5–1
.3)
0.86
1.3
(0.7
–2.3
)0.
83C
lose
rel
ativ
e de
ath
(yes
vs
no)
1.5
(1.1
–2.0
)0.
007
1.1
(0.8
–1.6
)0.
470.
8 (0
.6–1
.1)
0.21
1.2
(0.9
–1.6
)0.
241.
2 (0
.9–1
.7)
0.19
1.5
(1.1
–2.0
)0.
004
0.9
(0.6
–1.3
)0.
66C
are
for
clos
e re
lativ
e (y
es v
s no
)1.
3 (1
.0–1
.8)
0.03
31.
2 (0
.9–1
.6)
0.33
1.6
(1.2
–2.1
)0.
002
1.2
(0.9
–1.6
)0.
181.
3 (1
.0–1
.7)
0.07
0.9
(0.7
–1.2
)0.
401.
3 (1
.0–1
.8)
0.08
Mod
el fi
t sta
tistic
sVa
rian
ce e
xpla
ined
(%
)7.
17.
86.
27.
49.
110
.011
.2
Glo
bal f
it (χ
2 , df
)<
0.00
1 (6
2.5,
26)
<0.
001
(56.
4,26
)0.
002
(51.
9, 2
6)<
0.00
1 (6
0.8,
26)
<0.
001
(77.
3,26
)<
0.00
1 (8
2.5,
26)
<0.
001
(88.
7, 2
6)
OR
: odd
s ra
tio; N
E: n
ot e
stim
able
due
to
smal
l sam
ple
size
in t
hat
cate
gory
; df:
degr
ee o
f fre
edom
. The
val
ues
give
n in
bol
dfac
e ar
e si
gnifi
cant
(p
≤ 0.
05).
OR
s w
ere
deri
ved
from
logi
stic
reg
ress
ion,
eac
h co
untr
y fit
s on
e m
odel
; all
liste
d va
riab
les
are
forc
ed t
o st
ay in
the
mod
el a
nd o
nly
com
plet
e ob
serv
atio
ns a
re u
sed.
p v
alue
s in
the
tab
le a
re fo
r ov
eral
l effe
ct o
f ind
ivid
ual f
acto
rs.
by guest on May 9, 2016pmj.sagepub.comDownloaded from
108 Palliative Medicine 28(2)
priorities, in terms of life extension and/or quality, would be a valuable first step that could help to optimise treatment and care.29 Such an approach could be included in clinical guidelines, to standardise practice.
Our results suggest that treatment in cancer and other conditions will need to shift focus to greater emphasis on life quality improvement. Clinicians will also need honed skills in symptom management and communication. Patients with advanced disease have on average 11 physical symptoms30 and complex psychological symptoms.31 Patients with advanced disease and their relatives fre-quently report concerns about communication regarding diagnosis and treatment.32,33 Our results found that respond-ents consistently placed a high priority on information and decision-making, irrespective of their wish for life exten-sion or life quality. Single-country studies in Ireland and Italy have found similar priorities.34,35 Discussions regard-ing prognosis and ending treatment can be especially chal-lenging,33 especially since there may be an association between non-acceptance and feelings of hopelessness, a sense of suffering, depression and anxiety, along with dif-ficulties in social relations.36 Thus, achieving a shift towards greater emphasis on quality of life will take considerable development, including training, with changes in attitude, practice and behaviour.4 Better integration of palliative care services might also help to achieve this, along with public education, because in many countries awareness about pal-liative care services is low.34,35,37
As might be expected, those respondents prioritising treatment to improve quality of life also more often priori-tised pain and symptom control and less often keeping a positive attitude. However, some associations were coun-ter-intuitive. Those patients most interested in life exten-sion had the highest preference for home death. This seems paradoxical and may be difficult to achieve in practice. Intensive treatments to extend life will make home care and subsequently achieving home death difficult because often treatment will occur in hospital. However, asking about preference for place of death of patients and caregivers,17 plus rapid response home support services, may enable patients to be cared for at home.38,39
A higher education level was consistently associated with a greater prioritisation of quality of life. Across European countries, high levels of education are associ-ated with longer life expectancy.40 Consequently, those with lower levels of education may place greater empha-sis on life extension. Alternatively, quality of life may be a less common concept for individuals with a lower edu-cational background, and they are less likely to choose something they do not understand. However, our finding is the opposite of a Dutch public survey, where respond-ents with lower educational levels preferred quality over length of life.41
Despite consistency in general patterns, there were dif-ferences between countries and little consistency in the
influencing factors. The two countries that lie in North Europe and have legalised euthanasia, Belgium (Flanders part) and the Netherlands, were similar to or higher than others in prioritising life extension (although it was still low – 6% and 4%, respectively). These countries might have been expected to place a high priority on who makes decisions about care but in fact were at the lower end of prioritising this (only 24% and 25%, respectively) com-pared to England (31%), Germany (33%) and Italy (35%) nor were the factors that influenced treatment choices, apart from education, similar across these two countries. The three south European countries – Italy, Portugal and Spain – have been found in other research to show similar low expectations of palliative care service provision,12 but we found more differences than similarities between these countries. In terms of prioritising life quality alone, Italy and Spain lay at opposite ends of the spectrum. Religious affiliation was associated with a lower prioritisation of quality of life in Spain (and also England and the Netherlands), but not Italy or Portugal. The prioritisation of decision-making was not similar between these countries – indeed the opposite – as Italy and Portugal lay at either end of the spectrum of views. The common assumption of regional similarities in Southern/Latin European countries versus Northern/Anglo-Saxon Europe therefore does not do justice to patent differences between countries and pop-ulations. This has implications when caring for patients from different parts of Europe in any country or setting and highlights the need for both country-specific and individu-alised approaches to care.
Our study has several strengths. We believe that it is the largest assessment of public priorities for treatment if faced with advanced illness to date. The study is across seven countries, is population based and used standard questions in all countries. However, limitations include our response rate – 21%. Response rates to telephone health surveys are falling and are often similar to ours, affected by technologies such as caller identification27 and telemarketing fraud and telephone scams.42 We attempted to increase our response rate using recommended approaches of interviewer training, establishment of researcher credentials, increasing call attempts and tar-geted call times.43 The representativeness of our sample is supported by its similarity to the national populations. Although it is possible that they had different views, Kristal et al.44 found no difference between the health behaviours and attitudes of respondents and non-respondents to a telephone survey. We do not believe that this limitation affects the clear low preference for life extension or the associated factors. Unfortunately, we could not compare respondents and non-respondents (since we randomly selected household numbers).
A further limitation is that treatment, care and informa-tion choices were based on hypothetical choices. Although decisions made in real situations can be different from
by guest on May 9, 2016pmj.sagepub.comDownloaded from
Higginson et al. 109
those proposed in hypothetical situations,45 providing con-textual information (as in our study) considerably improves the agreements between choices made in real and hypothet-ical situations.45 Furthermore, 50% of our sample had cared for a close relative or friend at the end-of-life; 28% described their own health as fair, bad or very bad. In the last five years, one in 10 had been diagnosed with a serious illness and 70% had experienced bereavement. Thus, many of those sampled had direct experience of the scenarios considered, which helped to place the scenario in context. In no country was health status associated with priorities. Experiences of bereavement and illness were more often associated with prioritising quality of life rather than exten-sion. Therefore, patients might prioritise life extension even less than the low values found in our study.
In conclusion, in all seven countries, few adults (less than 6%) believe that when faced with advanced illness, such as cancer, extending life is most important and 57% or more prioritised quality of life. Cancer treatment and care needs to be reoriented towards these views and should address top priorities including providing informa-tion, dying in place of choice, relief of symptoms and sup-porting relatives and friends. Future guidelines should include these priorities, to enable more appropriate treat-ment choices for patients. The findings indicate a need in cancer care for education and palliative care to become mainstream.
AcknowledgementsWe are most grateful to all the survey participants. We thank the European Commission for providing the financial support needed to undertake this study; BMG Research and ZEM University of Bonn for assistance in survey administration and data collection and Joana Cadima for statistical advice. We also thank our col-leagues from PRISMA including the scientific committee who contributed to the discussions and scientific review of the survey, namely, Gwenda Albers, Barbara Antunes, Ana Barros Pinto, Dorothee Bechinger-English, Hamid Benalia, Emma Bennett, Lucy Bradley, Noël Derycke, Martine de Vlieger, Let Dillen, Julia Downing, Michael Echteld, Natalie Evans, Dagny Faksvåg Haugen, Nancy Gikaara, Sue Hall, Stein Kaasa, Jonathan Koffman, Arantza Meñaca, Johan Menten, Fliss Murtagh, Bregje Onwuteaka-Philipsen, Roeline Pasman, Francesca Pettenati, Robert Pool, Richard A. Powell, Miel Ribbe, Katrin Sigurdardottir, Bart Van den Eynden, Paul Vanden Berghe and Trudie van Iersel. We thank Susana Bento, Carolina Comabella, Filomena Ferreira, Grethe Iversen, Carmen López-Dóriga, Constanze Rémi, Christian Schulz and Wessex Translations for their work in translating and back translating the questionnaires. The invaluable work of Ron Irwin, Sian Best and Mike Gover at King’s College London is also highly appreciated.
This survey was undertaken as part of one of the work pack-ages of PRISMA. PRISMA aims to provide evidence and guid-ance on best practice to ensure that research can measure and improve outcomes for patients and families. PRISMA activities aimed to reflect the preferences and cultural diversities of citizens
and the clinical priorities of clinicians and appropriately measure multidimensional outcomes across settings where EoLC is deliv-ered. Principal Investigator: Richard Harding. Scientific Director: Irene J Higginson.
Declaration of conflicting interestsThe authors declare that there is no conflict of interest.
FundingThis work was supported by the European Commission’s Seventh Framework Programme (grant number Health-F2-2008-201655) as part of the PRISMA project to co-ordinate research into EoLC in cancer.
References 1. Menec V, Lix C, Steinbach E, et al. Patterns of health care
use and cost at the end of life, http://mchp-appserv.cpe.uman-itoba.ca/reference/end_of_life.pdf (2004, accessed March 2013).
2. Riley GF and Lubitz JD. Long-term trends in Medicare payments in the last year of life. Health Serv Res 2010; 45: 565–576.
3. Mariotto AB, Yabroff KR, Shao Y, et al. Projections of the cost of cancer care in the United States: 2010–2020. J Natl Cancer Inst 2011; 103: 117–128.
4. Smith TJ and Hillner BE. Bending the cost curve in cancer care. N Engl J Med 2011; 364: 2060–2065.
5. Sullivan R, Peppercorn J, Sikora K, et al. Delivering afforda-ble cancer care in high-income countries. Lancet Oncol 2011; 12: 933–980.
6. Slevin ML, Stubbs L and Plant HJ. Attitudes to chemother-apy: comparing views of patients with cancer with those of doctors, nurses and general public. BMJ 1990; 300: 1458–1460.
7. Kelly AS, Wenger NS and Sarkisian CA. Opiniones: end-of-life care preferences and planning of older Latinos. J Am Geriatr Soc 2010; 58: 1109–1116.
8. Centeno C, Clark D, Lynch T, et al. Facts and indicators on palliative care development in 52 countries of the WHO European region: results of an EAPC Task Force. Palliat Med 2007; 21: 463–471.
9. Jowell R Centre for Comparative Social Surveys. Measuring attitudes cross-nationally: lessons from the European Social Survey. Los Angeles, CA; London: SAGE, 2007.
10. Von Elm E, Altman DG, Egger M, et al. The Strengthen-ing the Reporting of Observational Studies in Epidemiology (STROBE) Statement: guidelines for reporting observational studies. PLoS Med 2007; 4: e296.
11. Harding R and Higginson I. PRISMA: a pan-European co-ordinating action to advance the science in end-of-life cancer care. Eur J Cancer 2010; 46: 1496–1501.
12. Meñaca, Evans N, Andrew EV, et al. End-of-life care across Southern Europe: a critical review of cultural similarities and differences between Italy, Spain and Portugal. Crit Rev Oncol Hematol 2012; 82: 387–401.
13. Andrew EV, Cohen J, Evans N, et al. Social-cultural factors in end-of-life care in Belgium: a scoping of the research lit-erature. Palliat Med 2013; 27: 131–143.
by guest on May 9, 2016pmj.sagepub.comDownloaded from
110 Palliative Medicine 28(2)
14. Rurup ML, Smets T, Cohen J, et al. The first five years of euthanasia legislation in Belgium and the Netherlands: description and comparison of cases. Palliat Med 2012; 26: 43–49.
15. Evans N, Meñaca A, Andrew EV, et al. Appraisal of literature reviews on end-of-life care for minority ethnic groups in the UK and a critical comparison with policy recommendations from the UK end-of-life care strategy. BMC Health Serv Res 2011; 11: 141.
16. Evans N, Bausewein C, Meñaca A, et al. A critical review of advance directives in Germany: attitudes, use and healthcare professionals’ compliance. Patient Educ Couns 2012; 87: 277–288.
17. Gomes B, Higginson IJ, Calanzani N, et al. Preferences for place of death if faced with advanced cancer: a population survey in England, Flanders, Italy, Germany, the Netherlands, Portugal and Spain. Ann Oncol 2012; 23: 2006–2015.
18. Gomes B, Calanzani N, Gysels M, et al. Heterogeneity and changes in preferences for dying at home: a systematic review. BMC Palliat Care 2013; 12: 7.
19. Beatty P and Willis G. Research synthesis: the practice of cognitive interviewing. Public Opin Q 2007; 71: 287–311.
20. Willis B. Cognitive interviewing: a tool for improving ques-tionnaire design. Thousand Oaks, CA: SAGE, 2005.
21. Daveson BA, Bechinger-English D, Bausewein C, et al. Constructing understandings of end-of-life care in Europe: a qualitative study involving cognitive interviewing with implications for cross-national surveys. J Palliat Med 2011; 14: 343–349.
22. Cull A, Sprangers M, Bjordal K, et al. EORTC quality of life group translation procedure. Available at: http://www.ipenproject.org/documents/methods_docs/Surveys/EORTC_translation.pdf (2002, accessed April 2013).
23. Daveson B, Bausewein C, Murtagh F, et al. To be involved or not to be involved: a survey of public preferences for self-involvement in decision making involving mental capacity (competency) within Europe. Palliat Med. Epub ahead of print 20 February 2013. DOI: 10.1177/0269216312471883.
24. Daveson B, Alonso J, Calanzani N, et al. Learning from the public: citizens describe the need to improve end-of-life care in Europe. Eur J Public Health 2013. Epub ahead of print 13 March 2013.DOI: 10.1093/eurpub/ckt029.
25. Bausewein C, Calanzani N, Daveson B, et al. ‘Burden to others’ as a public concern in advanced cancer: a compara-tive survey in seven European countries. BMC Cancer 2013; 13: 105.
26. Harding R, Simms V, Calanzani N, et al. If you had less than a year to live, would you want to know? A seven-country Euro-pean population survey of public preferences for disclosure of poor prognosis. Psychooncology 2013. Epub ahead of print 18 March 2013. DOI: 10.1002/pon.3283.
27. Kempf AM and Remington PL. New challenges for telephone survey research in the twenty-first century. Annu Rev Public Health 2007; 28: 113–126.
28. Vogelzang NJ, Benowitz SI, Adams S, et al. Clinical cancer advances 2011: annual report on progress against cancer from the American Society of Clinical Oncology. J Clin Oncol 2012; 30: 88–109.
29. Saraiya B, Bodnar-Deren S, Leventhal E, et al. End-of-life planning and its relevance for patients’ and oncologists’
decisions in choosing cancer therapy. Cancer 2008; 113: 3540–3547.
30. Solano JP, Gomes B and Higginson IJ. A comparison of symptom prevalence in far advanced cancer, AIDS, heart disease, chronic obstructive pulmonary disease and renal dis-ease. J Pain Symptom Manage 2006; 31: 58–69.
31. Lo C, Zimmermann C, Rydall A, et al. Longitudinal study of depressive symptoms in patients with metastatic gastrointes-tinal and lung cancer. J Clin Oncol 2010; 28: 3084–3089.
32. Teno JM, Lima JC and Lyons KD. Cancer patient assessment and reports of excellence: reliability and validity of advanced cancer patient perceptions of the quality of care. J Clin Oncol 2009; 27: 1621–1626.
33. Morita T, Akechi T, Ikenaga M, et al. Communication about the ending of anticancer treatment and transition to palliative care. Ann Oncol 2004; 15: 1551–1557.
34. Benini F, Fabris M, Pace DS, et al. Awareness, understand-ing and attitudes of Italians regarding palliative care. Ann Ist Super Sanita 2011; 47: 253–259.
35. McCarthy J, Weafer J and Loughrey M. Irish views on death and dying: a national survey. J Med Ethics 2010; 36: 454–458.
36. Thompson GN, Chochinov HM, Wilson KG, et al. Prognostic acceptance and the well-being of patients receiving palliative care for cancer. J Clin Oncol 2009; 27: 5757–5762.
37. Hirai K, Kudo T, Akiyama M, et al. Public awareness, knowl-edge of availability, and readiness for cancer palliative care services: a population-based survey across four regions in Japan. J Palliat Med 2011; 14: 918–922.
38. Alonso-Babarro A, Bruera E, Varela-Cerdeira M, et al. Can this patient be discharged home? Factors associated with at-home death among patients with cancer. J Clin Oncol 2011; 29: 1159–1167.
39. Gomes B and Higginson IJ. Factors influencing death at home in terminally ill patients with cancer: systematic review. BMJ 2006; 332: 515–521.
40. Corsini V. Highly educated men and women likely to live longer. Eurostat.Statistics in Focus. Population and Social Con-ditions, http://epp.eurostat.ec.europa.eu/cache/ITY_OFFPUB/KS-SF-10-024/EN/KS-SF-10-024-EN.PDF (2010, accessed March 2013).
41. Rietjens JAC, Van der Heide A, Onwuteaka-Philipsen BD, et al. Striving for quality or length at the end-of-life: attitudes of the Dutch general public. Patient Educ Couns 2005; 59: 158–163.
42. Federal Bureau of Investigation. Federal and local officials warn Americans of rise in telephone scams targeting U.S. citi-zens from within and outside of the U.S., http://www.fbi.gov/losangeles/press-releases/2011/federal-and-local-officials-warn-americans-of-rise-in-telephone-scams-targeting-u.s.-citizens-from-within-and-outside-of-the-u.s (2011, accessed March 2013).
43. O’Toole J, Sinclair M and Leder K. Maximising response rates in household telephone surveys. BMC Med Res Meth-odol 2008; 8: 71.
44. Kristal AR, White E, Davis JR, et al. Effects of enhanced call-ing efforts on response rates, estimates of health behavior, and costs in a telephone health survey using random-digit dialing. Public Health Rep 1993; 108: 372–379.
45. Feldman-Hall O, Mobbs D, Evans D, et al. What we say and what we do: the relationship between real and hypothetical moral choices. Cognition 2012; 123: 434–441.
by guest on May 9, 2016pmj.sagepub.comDownloaded from