power ramping, cycling and load following
TRANSCRIPT
Internotionol Atomic Energy Agency TWGFPT/28
INtERNATIONAL WORKING GROUP ON WATER REACTOR FUEL PERFORMANCE AND TECHNOLOGY
POWER RAMPING, CYCLING AND LOAD FOLLOWING BEHAVIOUR
OF WATER REACTOR FUEL
PROCEEDINGS OF A TECHNICAL COMMI'iTEE MEETING ORGANIZED BY THE
INTERNATIONAL ATOMIC ENERGY AGENCY AND HELD IN LYON, FRANCE, 18-21 MAY 1987
INTERNATIONAL ATOMIC ENERGY AGENCY, VIENNA, 1988
POWER RAMPING, CYCLING AND LOAD FOLLOWING BEHAVIOUR
OF WATER REACTOR FUEL
PROCEEDINGS OF A TECHNICAL COMMITTEE MEETING ORGANIZED BY THE
INTERNATIONAL ATOMIC ENERGY AGENCY AND HELD IN LYON, FRANCE, 18-21 MAY 1987
INTERNATIONAL ATOMIC ENERGY AGENCY, VIENNA, 1988

POWER RAMPING, CYCUNG AND LOAD FOLLOWING BEHAVIOUR OF WATER REACTOR FUEL
IAEA, VIENNA, 1988 IWGFTP/28
Printed by the IAEA in Austria May 1988
FOREWORD
The present meeting was scheduled by the International Atomic Energy Agency upon proposal of the Members of the International Working Group on Water Reactor Fuel Performance and Technology.
At the invitation by Government of France, the meeting was held in Lyon, and organized jointly by the Commissariat a l'Energie Atomique, Electricite de France and Framatome - Division du Combustible.
Sixty-three participants representing 15 countries and one international organization attended the meeting. Twenty papers were presented d>ring three technical sessions, followed by panel discussions which allowed to formulate the conclusions of the meeting and recommendations to the Agency,
Special acknowledgement is due ta the local organizing committee and to the session chairmen, for their excellent contribution.
EDITORIAL NOTE
In preparing this material for the press, staff of the International Atomic Energy Agency have mounted and paginated the original manuscripts as submitted by the authors and given some attention to the presentation.
Tiie views expressed in the papers, the statements made and the gcne'al style adopted are the responsibility of the named authors. The views do not necessarily reflect those of the governments of the Member States or organizations under whose auspices the manuscripts were produced.
The use in this book of particular designations of countries or territories does not imply any judgement by the publisher, the IAEA, as to the legal status of such countries or territories, of their authorities and institutions or of the delimitation of their boundaries.
The mention of specific companies or of their products or brand names docs not imply any endorsement or recommendation on the part of the IAEA.
Authors are themselves responsible for obtaining the necessary permission to reproduce copyright material from other sources.
CONTENTS
Summary
MECHANICAL BEHAVIOUR AND FISSION GAS RELEASE (Session I)
Generation maneuvering at BRUCE NGS-B: fuel fission gas release results (Summary) (IAEA-TC-624/11) 17 P.T. Truant, A.J. Hams, J.H. I/nt
Release of volatile fission products in the PWR primary coolant during power transienu (IAEA-TC-624/12) 19 C. Leuthrot, P. Beslu
Comparative studies of axial gas mixing in fuel rods with standard and rifled cladding (IAEA-TC-624/13) 25 N. Kjaer-Pedersen, M. Kinoshita, H. Mogard
Fission gas release during power transients at high burnup (IAEA-TC-624/14) 32 E. Porrot, C. Lemaignan. A. Raybaud, D. Baron
Investigation of parameters affecting WER-type fuel behaviour under transient conditions (IAEA-TC-624/15) 37 V.V.Novikov, Yu.K. Bibilashvitij. I.S. Golovnin, KM. Shchavelin. Yu.V. Bozhko, A.M. Bolobolichev
Mechanical behaviour of LWR fuel rod cladding during load follow at high burnup (Summary) (IAEA-TC-624/16) 44 J. Van Vtiet, D. Haas
Sustained fatigue of Zircaloy-4 claddings — Non-irradiated material (IAEA-TC-624/18) 45 P. Lemoine. L. Darchis, J. Pelchat, J.-P. Mardon, M. Grosgeorge
POWER RAMPING AND POWER CYCLING DEMONSTRATION PROGRAMMES IN RESEARCH REACTORS (Session II)
Combined utilization of BR3 and BR2 reactors for power ramping and cycling tests of high bumup fuel rods (IAEA-TC-624/21) 57 F. Motte, D. Haas
Irradiation facilities of the CEA'DERPE for power ramping and power cycling experiments (IAEA-TC-624/22) 64 C. Friboulet, M. Roche
Investigation of multi-ramp and load following behaviour of LWR fuel rods at the HFR Petten (IAEA-TC-624/23) 77 J.F.W. Markgraf, D.J. Perry, I.A. Ruyter, G. Fischer, F. Sonlheimer
KWU's experimental basis for power ramping and cycling performance of LWR fuel (IAEA-TC-624/25) 84 H. Knaab, M. Gartner, F. Sontheimer
Power ramping test programme on Fragema fuel rods during the years 1984 to 1986 (IAEA-TC-624/26) 93 F. Lefebvre, J. Joseph, J. Royer
FUEL BEHAVIOUR IN POWER REACTORS (Session ID)
A survey of load follow experience in US light water reactors (IAEA-TC-624/24) IDS L Goldstein, K.D. Sheppard
Strategy and experience of PCI protection and load following operation in KWU LWR plants (IAEA-TC-624/31) 110 R. von Jan
Impact of ioad modulation on fuel behaviour (IAEA-TC-624/32) 116 M. G'osgeorge
Load follow impact on fuel behaviour experimental results (IAEA-TC-624/34) 125 M. Morel, P. Melin, M. Gamier, B. HoudaiUe
An update on the burnup dependence of pellet cladding interaction (IAEA-TC-624/35) 131 M.G. Andrews, J.C. LaVake
Trapped stack related PCI fuel failures (IAEA-TC-624/36) 137 N.E. Hoppe
Load follow and frequency control operating experience of Fraglma fuel in EDF reactors (IAEA-TC-624/37) 145 A. Dumont, P. Boumay
Operational experience of the WER-1000 reactor fuel elements and fuel assembly for the Novo-Voronezh fifth power unit with a three-year fuel life cycle (IAEA-TC-624/38).. 151 V.N. Proselkov, A.S. Dukhovenskij, N.L. Fatieva, Yu. A. Zakharko, B.A. Zoletnykh, M.I. Miroshnichenko, G.S. Kiryukhin, V.D. Shmelev, B.D. Dentin
The Japanese power ramping and load following programme since the Petten meeting (Summary) (IAEA-TC-624/39) 161 Y. Mishima
Chairmen and Organizing Committee 164
List of Participants % 164
SUMMARY
1.0 IHTKODUCTION
Important progress has been achieved during an IAEA Specialists' Meeting on the same topic which was held in Pet ten, Netherlands, from 8-9 September 1982 (Ref. IWGFPT/14). During the past five years so much progress has been accomplished that load follow has been implemented as a regular operating mode in some countries. Thus, a consistent feed-back from industrial experience is becoming available.
The objective of this Technical Committee Meeting is to review the "State-of-the-Art", make critical comments and recommendations with the aim of improving fuel reliability and assure integrity of the cladding and core materials when subjected to ramping and cycling sequences.
SUBJECTS COVERED
The Meeting was organized in three sessions :
. Session I "Mechanical Behaviour and Pission Gas Release"
. Session II "Power Ramping and Power Cycling Demonstration Programmes in Research Reactors"
. Session III "Fuel Behaviour in Power Reactors"
Between the sessions, the session chairmen, together with the speakers, prepared and presented reports with summary, conclusions and recommendations of the individual sessions. These reports are added to this summary report.
2.0 SESSION SUMMARIES AMD RECOMMENDATIONS
2.1 Session I
Title : "Mechanical behaviour and fission gas release"
Chairmen : MM. T.J. CARTER and C. LEMAIGNAN
7
Summary ;
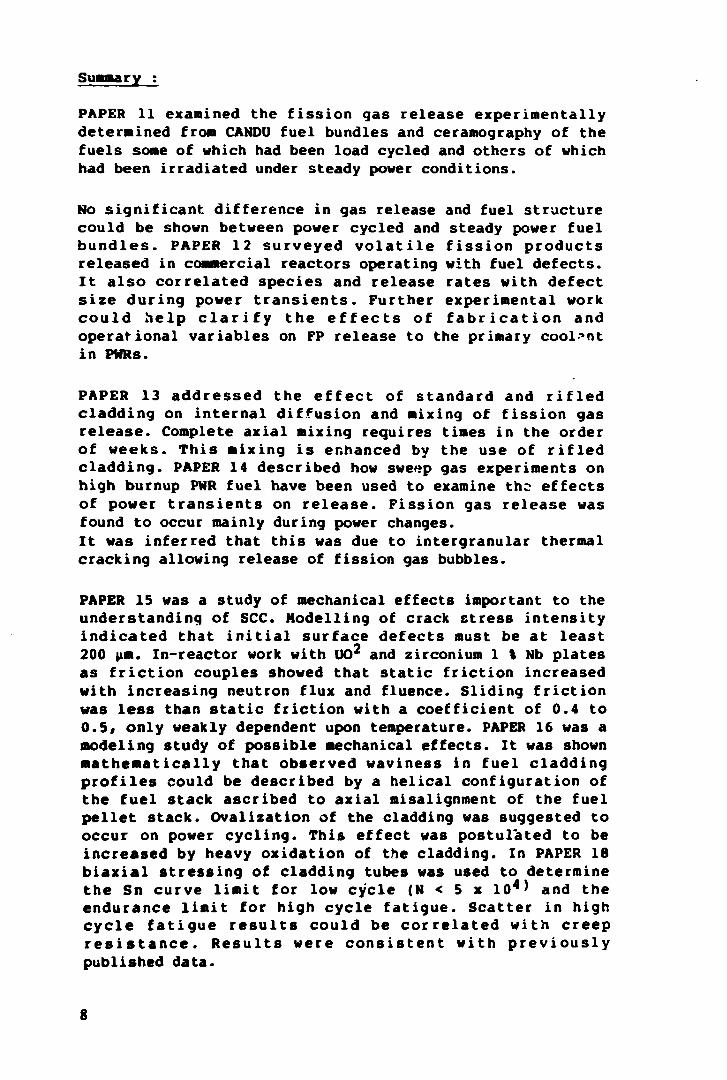
PAPER 11 examined the f i s s i o n gas r e l e a s e e x p e r i m e n t a l l y determined from CANDU fue l bundles and ceramography of the f u e l s some of which had been load cycled and others of which had been irradiated under steady power condi t ions .
No s i g n i f i c a n t d i f f e r e n c e in gas re lease and fuel s tructure could be shown between power cyc led and steady power fue l b u n d l e s . PAPER 12 s u r v e y e d v o l a t i l e f i s s i o n p r o d u c t s re leased in commercial reactors operating with fue l d e f e c t s . I t a l s o c o r r e l a t e d s p e c i e s and r e l e a s e r a t e s with d e f e c t s i z e dur ing power t r a n s i e n t s . Further experimental work c o u l d h e l p c l a r i f y t h e e f f e c t s o f f a b r i c a t i o n and operat iona l v a r i a b l e s on PP r e l e a s e to the primary coolant in PWRs.
PAPER 13 a d d r e s s e d t h e e f f e c t of s tandard and r i f l e d c l a d d i n g on i n t e r n a l d i f f u s i o n and mixing of f i s s i o n gas r e l e a s e . Complete a x i a l mixing requires times in the order of w e e k s . T h i s mixing i s enhanced by the use of r i f l e d c l a d d i n g . PAPER 14 descr ibed how sweep gas experiments on high burnup PWR fue l have been used to examine the e f f e c t s of power t r a n s i e n t s on r e l e a s e . F i s s i o n gas r e l e a s e was found t o occur mainly during power changes. I t was inferred that t h i s was due to intergranular thermal cracking allowing re lease of f i s s i o n gas bubbles.
PAPER 15 was a study of mechanical e f f e c t s important to the understanding of SCC. Modell ing of crack s t r e s s i n t e n s i t y i n d i c a t e d tha t i n i t i a l s u r f a c e d e f e c t s must be a t l e a s t 200 |im. In-reactor work with UO2 and zirconium 1 % Nb p l a t e s a s f r i c t i o n couples showed that s t a t i c f r i c t i o n increased with increas ing neutron f lux and f luence . S l id ing f r i c t i o n was l e s s than s t a t i c f r i c t i o n with a c o e f f i c i e n t of 0.4 t o 0 . 5 , on ly weakly dependent upon temperature. PAPER 16 was a modeling study of p o s s i b l e mechanical e f f e c t s . I t was shown m a t h e m a t i c a l l y t h a t observed wav iness in f u e l c l a d d i n g p r o f i l e s could be descr ibed by a h e l i c a l conf igurat ion of the f u e l s tack ascr ibed to a x i a l misalignment of the f u e l p e l l e t s tack . Oval izat ion of the cladding was suggested t o occur on power c y c l i n g . This e f f e c t was p o s t u l a t e d to be i n c r e a s e d by heavy o x i d a t i o n of the c ladding . In PAPER 18 b i a x i a l s t r e s s i n g of c ladding tubes was used to determine t h e Sn curve l i m i t for low c y c l e (N < 5 x 1 0 4 ) and the endurance l i m i t for high c y c l e f a t i g u e . S c a t t e r in high c y c l e f a t i g u e r e s u l t s c o u l d be c o r r e l a t e d w i t h c r e e p r e s i s t a n c e . R e s u l t s were c o n s i s t e n t w i t h p r e v i o u s l y published data.
8
RECOMMENDATIONS
It is suggested :
1. to have a detailed examination of fuel mechanical behaviour using in pile experiments in order to improve the models. This should include stress-strain state of the cladding and friction between pellet and cladding at high B.U.
2. to have information on fatigue behaviour of irradiated cladding materials with or without neutron flux, and also in corrosive environment.
3. to clarify the situation regarding the gap conductance with respect to gap gas composition in closed gap conditions. Experimental data are needed in this area.
4. to do further work to correlate defect sizes with release of F.P. in the primary coolant for various power histories.
2.2 Session II
Tit le : "Power ramping and power cycl ing demonstration programmes in research reactors"
Chairmen : MM. GROUNES and MOREL
Summary :
The session contained six papers : two describing f a c i l i t i e s and the a s s o c i a t e d techniques, three mainly describing resul ts from experimental investigations and one describing the associated experience from power reactors.
MM. MOTTE « HAAS (paper 2 1 ) described the Belgian BR3 PWR and BR2 MTR reactors at the Mol Nuclear Research Centre, their operational and technical characterist ics and their mode of operat ion for power ramping and power c y c l i n g e x p e r i m e n t s in s e v e r a l n a t i o n a l and i n t e r n a t i o n a l programmes.
MM. FRIBOULET fc ROCHE (paper 22) described the extensive French f a c i l i t i e s at the Saclay and Grenoble Nuclear Research Centers (the OSIRIS and STLOE MTR reactors and assoc iated f a c i l i t i e s ) and their modes of operation for power ramping and power cycling experiments. Different types of experimental programmes performed in the f a c i l i t i e s described were also described.
9
MM. MARKGRAF, PERRY, RUYTER, FISCHER a n d SONTHEIMER ( p a p e r 23) described the background to and the re su l t s from a jo in t German inves t iga t ion at the HFR Petten of the multi-ramp and load f o l l o w i n g behaviour of BWR and PWR f u e l rods p r e -i rradia ted in power reactors to burnups of 9-19 GWd/tU (BWR rods) and 25-32 GWd/tU (PWR rods) . Ramp t e s t s were performed a f t e r a b r i e f c o n d i t i o n i n g and a g a i n a f t e r a f u r t h e r constant power i r r a d i a t i o n g iv ing an add i t i ona l burnup of about 10 GWd/tO. In one case a f u e l rod was i r r a d i a t e d further and then exposed to a third ramp t e s t . The r e s u l t s indicated the condi t ions ( in terms of constant power l e v e l and power increments during ramp t e s t s ) under which the fue l rods are multi-ramp r e s i s t a n t , confirmed the ramp res i s tance of PWR f u e l rods a f t e r a burnup of up to 40 GWd/tU and showed the following findings :
a) Operation in the load fo l lowing mode did not lead t o any a d d i t i o n a l r e s t r i c t i v e e f f e c t s as compared t o steady s t a t e operation.
b) The d i m e n s i o n a l c h a n g e s of t h e f u e l r o d s were n e g l i g i b l e ; thus the dimensional s t a b i l i t y of the rods was f u l l y confirmed.
c) The f i s s i o n gas r e l e a s e corresponded t o the maximum power experienced.
MM. KNAAB, GARTNER fc SONTHEIMER (paper 25) described KWU's experimental b a s i s , accumulated s ince 1970, for the power ramping and power cyc l ing performance of PWR and BWR f u e l r o d s . Power ramping experiments , performed wi th KWU f u e l r o d s i n n a t i o n a l and i n t e r n a t i o n a l programmes w e r e summarized and analyzed in the framework of the RSST ( s a f e range, safe s t e p , sa fe speed, safe time) approach :
F a i l u r e t h r e s h o l d s were de termined for f u e l r o d s i rrad ia ted t o burnups of up to 45 GWd/tU (PWR) and 35 GWd/tU (BWR).
The s a f e power s t e p above t h e t h r e s h o l d c o u l d be derived for BWR rods with burnups up to 20 GWd/tU.
The sa fe power ramp rate for passing the threshold was determined for BWR fue l rods with burnups up to 30 GWd/tU.
The s a f e t ime was determined to be in the range o f minutes , that i s wel l above the duration of r e a c t i v i t y induced t r a n s i e n t s .
10
Power cycling tests performed in different reactors showed a fuel rod performance that compared well with fuel rods under steady operating conditions at comparable power levels.
Results from multi-ramp tests and tests on MOX fuel and UO2-Gd2<>3 fuel were also described. The MOX fuel and Gd2(>3 fuel did not fail up to ramp terminal levels of 500 W/cm in the burnup range up to 35 GWd/tU.
Me LEFEBVRE, MM. JOSEPH t ROYER (paper 26) described the results from a power ramp test programme on Pragema fuel rods from a power reactor, refabricated into shorter fuel rodlets and then irradiated in the SILOE MTR at Grenoble.
Power transients were performed on 8 high burn up fuel rods (30 - 60 GWd/tO) in order to study their behaviour under load following conditions.
After high power holds (50 kW/m) and large power steps (30 kW/m) no failure was detected.
Large average diametral expansions were measured (around 0.5 %, ip to 1.35 I) and two kinds of ridges were observed, at pellet interfaces, and at midpellet locations.
The good resistance to P.C.I, seems to be enhanced by fuel creep. This phenomenon also seems responsible for the midpellet permanent ridges and the filled up dishes.
MM. GOLDSTEIN & SHEPPARD (paper 24) presented a survey of the load follow experience in US LHRs. The major commercial load follow experience has been obtained in 7 PWRs and 4 BHRs. Early demonstration tests were performed in 5 BWRs.
Summary of the "State of the Art * .
The use of materials test ing reactors for investigation of the power ramp res is tance and power cycling resistance i s the most e f f e c t i v e way of performing R & D work in th i s area although large scale power cycling experiments can be performed in power reactors. Such large scale experiments can be ujed to confirm the resul t s in materials test ing reactors. However, such experiments in materials test ing reactors are preferable in cases where very well defined experimental conditions are needed or where the condi t ions are so severe that there i s a large risk of fuel fa i lure .
11
The t e s t r e s u l t s a v a i l a b l e show t h a t no f a i l u r e s have been observed in power ramp t e s t s on fue l rods with a burnup above about 40 GWd/tU. There might be a changed fuel behaviour when the burnup i s above about 50 GWd/tU but there are s t i l l no f a i l u r e s and t h i s phenomenon requires further i n v e s t i g a t i o n s .
Power ramp t e s t s performed in d i f f e r e n t research reactors g i v e approximately the same resu l t s in a "fai led/not fa i l ed" mode.
The t e s t r e s u l t s a v a i l a b l e fiom power c y c l i n g experiments show that the f i s s i o n gas r e l e a s e i s not in f luenced and there have been no s igns of damage due to fa t igue , ratchett ing e t c .
RECOMMENDATIONS TO THE IAEA
a) Experiments with improved in-pile instrumentation (such as temperature measurements with thermocouples, length measurements and diameter measurements) should be performed to a larger extent in materials testing reactors complementary to "failed/not failed" type of experiments.
b) More work is required on fuel irradiated at higher burnup, above 40 GWd/tU, in order to understand the differences in behaviour between different types of fuel.
c) Conditions during pre-rarop irradiations, such as the level of the pre-ramp power, may have an influence on power ramp test results, and should be investigated further.
d) The chemical reactions between the cladding and the fission products should be studied as a function of burnup. There might be a decrease in the susceptibility to stress corrosion cracking at higher burnup and the correlation between fission gas release and fission product availability requires further investigations.
e) More work is required to understand the "conditioning" and "deconditioning" phenomena.
f) The influence of waterside corrosion on the ramp behaviour (such as the effects of ZrC«2) should be investigated.
g) Further data are needed on MOX fuel and on UO2 - Gd203 fuel.
12
2.3 Sess ion III
T i t l e : "Fuel behaviour in power reactors"
Chairmen : MM. KNAAB and GAUTIER
Summary, conlusions and recommendations ;
Exper i ence with load f o l l o w i n g o p e r a t i o n and with power ramping condi t ions i s accumulating rapidly in both BWRS AND PWRs. T h i s e x p e r i e n c e has been g e n e r a l l y s u c c e s s f u l in avoiding fuel f a i l u r e s .
The i n t r i n s i c o p e r a t i o n of BWP.s has prov ided a n a t u r a l s o u r c e o f e x p e r i e n c e i n power v a r i a t i o n s w i t h o u t d i f f i c u l t i e s . The a c c u m u l a t i o n of s i m i l a r s t a t i s t i c a l evidence in the PWR w i l l require more time. Fuel f a i l u r e s in BWRs or PWRs re la ted to the accumulation of damage e f f e c t s due to cycl ing have yet to be observed. P o t e n t i a l m e c h a n i s m s , h o w e v e r , based on t h e o r e t i c a l p r i n c i p l e s , a r e r e a s o n s t o c o n t i n u e e v a l u a t i n g t h e s e e f f e c t s .
Despite d i f ferences in cladding material , the fuel rods used in VVER r e a c t o r s with o p e r a t i o n at v a r i a b l e powers are e x p e r i e n c i n g and are expected to cont inue operat ing with high r e l i a b i l i t y .
Ra&p T e s t s w i t h modern d e s i g n s of PWR f u e l have shown i n c r e a s i n g r e s i s t a n c e to f a i l u r e by PCI at burnup l e v e l s above about 36 GWd/MtU.
PCI in PWRs was reported to be a f f e c t e d by many v a r i a b l e including power h i s tory , gas r i s e and p e l l e t propert ies . Those applying the r e s u l t s of t e s t reactor programs to power reactors should be careful to account for these d i f f e r e n c e s .
In the case of the BWR, the s o l u t i o n to PCI has apparently r e s u l t e d from 1) o p e r a t i n g l i m i t a t i o n s on the r a t e s of power increase , 2) the introduction of barr ier-c lad f u e l , 3) the reduction of l inear heat rat ings through 9x9 f u e l , and perhaps a few other changes such as pressurised fuel rods.
A d d i t i o n a l d i a g n o s t i c work r e l a t e d to e a r l y f a i l u r e s at Barsebeck have further e x p l a i n e d the rod of a "trapped stack" and the occurrence of thermal i n s t a b i l i t y .
During subsequent removal of a c o n t r o l rod, the r a d i a l s t r e s s e s were apparently aggravated by the locking of the p e l l e t column.
13
Load following operation appears to be proceeding with due c a u t i o n . Fu tu re meet ings in t h e a r e a s of PCI and load following can be held in connection with meetings on other fuel performance t o p i c s . Full meetings may not be necessary unless the experience becomes problematic.
GENERAL CONCLUSIONS
Experimental r e s u l t s obtained in research reactors and models based on them have demonst ra ted t h a t power ramping, cycling and load following could be performed in power reactors under normal operating condi t ions .
Over the l a s t few y e a r s , a l a r g e number of such o p e r a t i o n s have been performed in commercial power p l a n t s so t h a t a t p r e s e n t e x t e n s i v e exper i ence i s a v a i l a b l e . I t shows c l e a r l y tha t there i s no adverse impact on fuel .
The r e s u l t s yielded by high burnup programs showed no negative consequence on pe l l e t -clad in t e rac t ion - . This wi l l have to be confirmed and further extended t o the higher burn ups tha t u t i l i t i e s a re aiming for in the near future.
However some of the bas ic phenomena are not completely understood or l inked and in order to get even more e c o n o m i c a l and f l e x i b l e o p e r a t i n g c o n d i t i o n s , c o n t i n u a t i o n of e x p e r i m e n t a l work i s f e l t t o be necessa ry , s p e c i a l l y on the i tems mentioned in the recommendations for each session.
No o t h e r s p e c i f i c m e e t i n g on t h i s s u b j e c t i s recommended in the future. The subject should be rather dea l t with e i the r in a future top ica l meeting on fuel behaviour or in a more general meeting which wil l cover both reactcr system operation and fuel behaviour under cycling and ramping condit ions.

, S / | *
MECHANICAL BEHAVIOUR AND FISSION GAS RELEASE
(Session I) Chairmen
T.J. CARTER Canada
C. LEMAIGNAN France
IAKA-TC414/11 GENERATION MANEUVERING AT BRUCE NGS*-B: FUEL FISSION GAS RELEASE RESULTS (Summary)
P.T. TRUANT, A.J. HA1NS, J.H. LAU Ontario Hydro, Toronto, Ontario, Canada
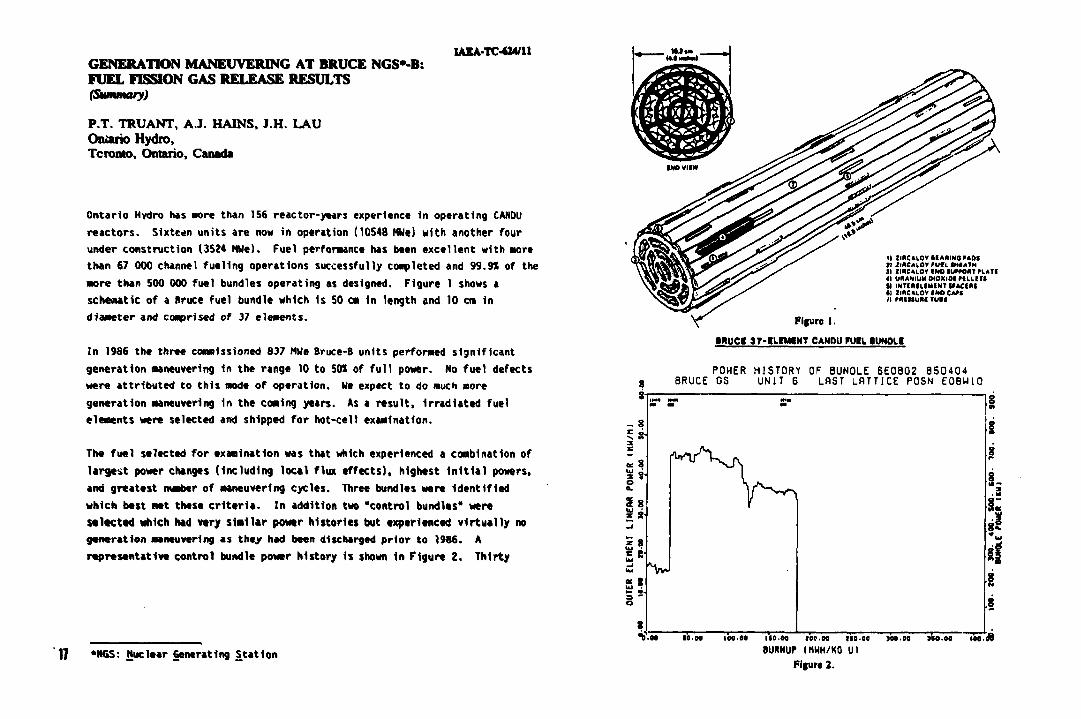
Ontario Hydro has wore than 156 reactor-years experience in operating CANOU reactors. Sixteen units are now In operation (10548 MWe) with another four under construction (3524 HWe). Fuel performance has been excellent with more than 67 000 channel fueling operations successfully completed and 99.91 of the more than 500 000 fuel bundles operating as designed. Figure 1 shows a schematic of a Bruce fuel bundle which 1s 50 cm In length and 10 cm in diameter and comprised of 37 elements.
In 1986 the three commissioned 837 MWe Bruce-B units performed significant generation maneuvering in the range 10 to 501 of fu l l power. No fuel defects were attributed to this mode of operation. We expect to do much more generation maneuvering in the coming years. As a result, Irradiated fuel elements were selected and shipped for hot-cell examination.
The fuel selected for examination was that which experienced a combination of largest power changes (Including local flux effects), highest i n i t i a l powers, and greatest number of maneuvering cycles. Three bundles were identif ied which best met these c r i t e r i a . In addition two "control bundles" were selected which had very similar power histories but experienced vir tual ly no generation maneuvering as they had been discharged prior to 1986. A representative control bundle power history is shown in Figure 2. Thirty
17 *NGS: Nuclear Generating Station
n imc»tov U*»INO mat 1> i l *CAlOy HJlL SMiATH I I ZIUCAIOV (NO IOWOKT H.ATI 41 URANIUM OIOXIOI m i i T i « I N T I M U M I N T i f ACf M <| IIRCAIOV 1 * 0 CAM ;i PMUUM run
Figure 1.
•HUCI 37-fLEMtNT CANOU HJIl •UWOH
POWER HISTORY OF BUNOLE 6E0802 8 5 0 4 0 4 BRUCE OS UNIT 6 LAST LATTICE POSN E0BW10
110.00 »0t.00 110.00 8URNUP IHHH/KO UI
Figure 2.
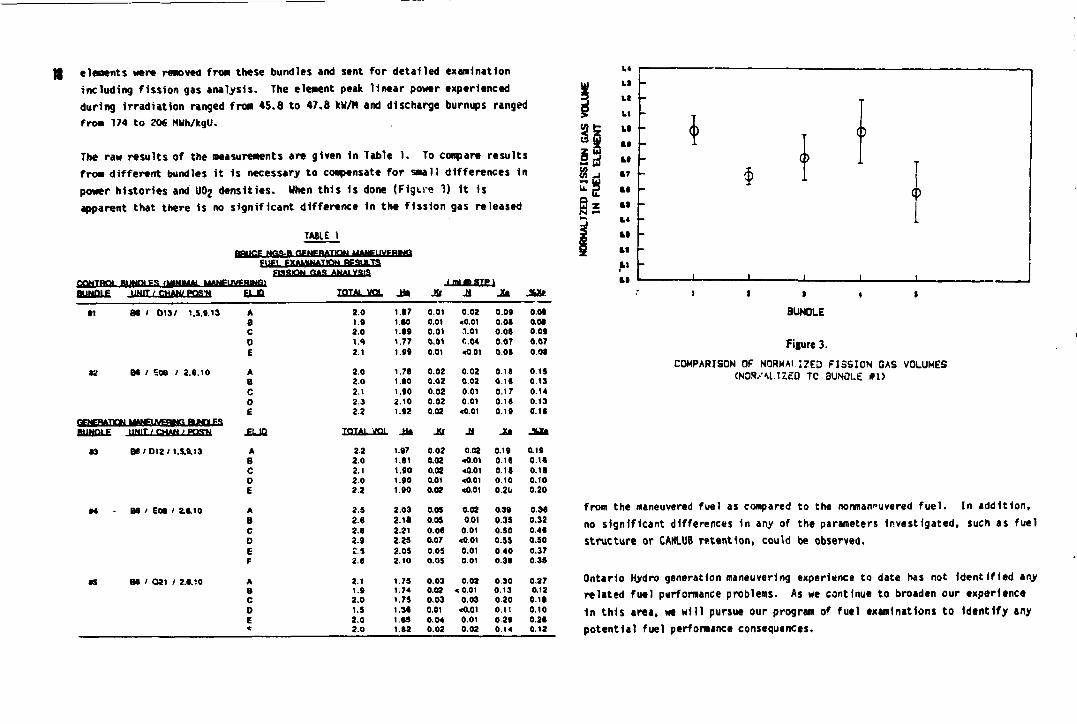
eleaents were removed f ro* these bundles and sent for detailed examination including fission gas analysis. The element peak linear power experienced during Irradiation ranged froa 45.8 to 47.8 kW/M and discharge burnups ranged from 174 to 206 MWh/kgU.
The raw results of the neasureaents are given in Table 1. To compare results froat different bundles i t is necessary to compensate for small differences In power histories and U0Z densities. When this Is done (Figure 3) i t Is apparent that there is no significant difference In the fission gas released
TABLE 1 BBIICF NflS-B GENERATION MAMEUVFRWG
FUFl EXAMINATION BESULT3 FISSION BAS ANALYSIS
reviTPni R I M I > F S .UINIMA. UANFI IWMMCI I ml 6) STP t BUbDlE IIWT ; CHAW PQS-W OJH TOTAL VOL J l JSl i l i l J»S>
81 8t ' 013/ 1.5.9.13
Kt B6 I =08 / 2 .6 .10
fifNCBATttM UANFLNFHX-, SUMIES
BUHQLE UNIT/CHW/POSH
•3 8 6 / 012 / 1.5,9.13
•4 B6 ' EOS / ZS.10
•5 B6 / Q21 / 2.8.10
A a c o E
A a c o E
JEUQ
A 2 2 a 2o C 2.1 O 2 0 E 2 2
A 2.5 B 2 6 C 2.8 D 2 9 E 2 5 F 2.6
A 2.1 B 1.9 C 2.0 0 1 5 E 2 0 « 2.0
0.01 0.02 0.09 0.09 0.01 <0.01 o.os 0.06 0.01 3.01 0.08 0.09 0.01 e.M 0.07 0.07 0.01 <O01 0.01 0 06
0.02 0.02 O H 0 15 0.02 0.02 0.16 0.13 0.02 0.01 0.17 0.14 0.02 0.01 0.16 0.13 0.02 <0.01 0.19 0.16
-H* M Jl Jul j y u
1.97 0.02 0.02 0.19 019 1.61 0.32 «0.01 0.16 0.16 1.90 0.02 <0.01 0.11 0.18 1.90 0.01 <0.01 0.10 0.10 1.90 0.02 <001 0.20 0.20
2.03 0.05 0.02 0.39 0.96 2.18 0.05 0.01 0.35 0.32 2.21 0.06 0.01 0.50 0.46 2 25 0.07 <0.01 0.55 0.50 2.03 O.OS 0.01 0.40 0.37 2 .10 0.05 0.01 0.36 0.35
1.79 0.03 0.02 0.30 0.27 1.74 0.02 «0.01 0.13 0.12 1.75 0.03 0.03 0 2 0 0.19 1.36 0.01 <0.01 0.11 0.10 1.63 0.04 0.01 0.29 0.26 1.62 0.02 0.02 0.14 0.12
2.0 1.87 1.9 1.80 2.0 1.69 \A 1.77 2.1 1.99
2.0 1.78 2 0 1.60 2.1 1.90 2 3 2.10 2.2 1.92
)TAL VOL .a*
VOLUME LI
«.» LI
ION GAS
ELEMENT LI
ai at
FISS
FUEL 6,7
ai 2 z IM f>
8 1
BUNDLE
Figure 3. COMPARISON OF NORMALIZED FISSION GAS VOLUMES
(NOS/MIZeO TC 3UN0LE #1>
from the maneuvered fuel as compared to the nonmawuvered fue l . In addition, no significant differences in any of the parameters Investigated, such as fuel structure or CANLUB retention, could be observed.
Ontario Hydro generation maneuvering experience to date has not Identif ied any related fuel performance problems. As we continue to broaden our experience in this area, we wi l l pursue our program of fuel examinations to identify any potential fuel performance consequences.
IAEATC-624/12 RELEASE OF VOLATILE FISSION PRODUCTS IN THE PWR PRIMARY COOLANT DURING POWER TRANSIENTS
C. LEUTHROT, P. BESLU Commissariat a lYnergie atomique, Centre d'etudes nucleaires de Cadarache, Saint-Paul-lez-Durance, France
Abstract
Since several years, activities of short-lived fission products have been measured by CD? and CEA on french commercial PWR's running with cladding defects. More recently, investigations have been performed in order to understand the behaviour and to determine the release rate of volatile fission products In load follow conditions.
These studies are mainly related to volatile fission products such as 133xe. 135 X e, 1311. 133!, I3»cs, 13? C s.
It has been shown that several parameters have an effect on the transient release rate :
- power increase/decrease rates - power levels • size and localization of the defect - repetition of the transients.
At the Moment, no comprehensive gap to primary circuit release model has been set up and data available for various experimental conditions do not allow to distinguish the separate effects of each parameters on the transient release rate. Nevertheless for a typical load follow transient, tht affect of the defect size and repetition of the transient hove been studied and values of the transient release r 4 l e M w t 0 0 e n obtained for gases. Iodines and cesiums.
- The Increase of gases activities during load follow Is less than 20* whatever the defects sizes are.
0
- For small defects the iodine release 1s very low and not enhanced by power transient. For larger defects, the Iodine transient release may b» enhanced up to 50% compared with steady stitt release.
- Cesium release is negligible during load follow transients oxcept for very large defects where SI of the gap Inventory has bien released in tho primary coolant.
INTRODUCTION
The measurements of the fission products activities In tht primary water of the French commercial PUR running with cladding defects have been performed for several years both oy EOF and CEA ; they relate to steady state conditions and shutdowns transients ; more recently Investigations have been carried out during 'oad follow transients. These measurements have allowed to understand the release mechanisms for volatile fission products such as gases, Iodines and caesiums and to correlate the Increase of the fission products release rates during load follow transients with the cladding defects sizes.
RELEASE FRACTIONS OF VOLATILE FISSION PRODUCTS IN STEADY STATE C0N0ITI0NS AND 0URIN6 SHUTDOWN TRANSIENTS
Tht mechanisms Involved in fission products release from defected fuel In the primary coolant of commercial PUR have been displayed through gamma spectrometry measurements on tht primary water In steady state conditions and during shutdowns transients. These measurements allowed us to determine the release rates of a large quantity of volatile fission products with various half lives (from 3 mn to stvtral years) and thtrtfort to quantify tht kinetics of release and to determine the release mechanisms.
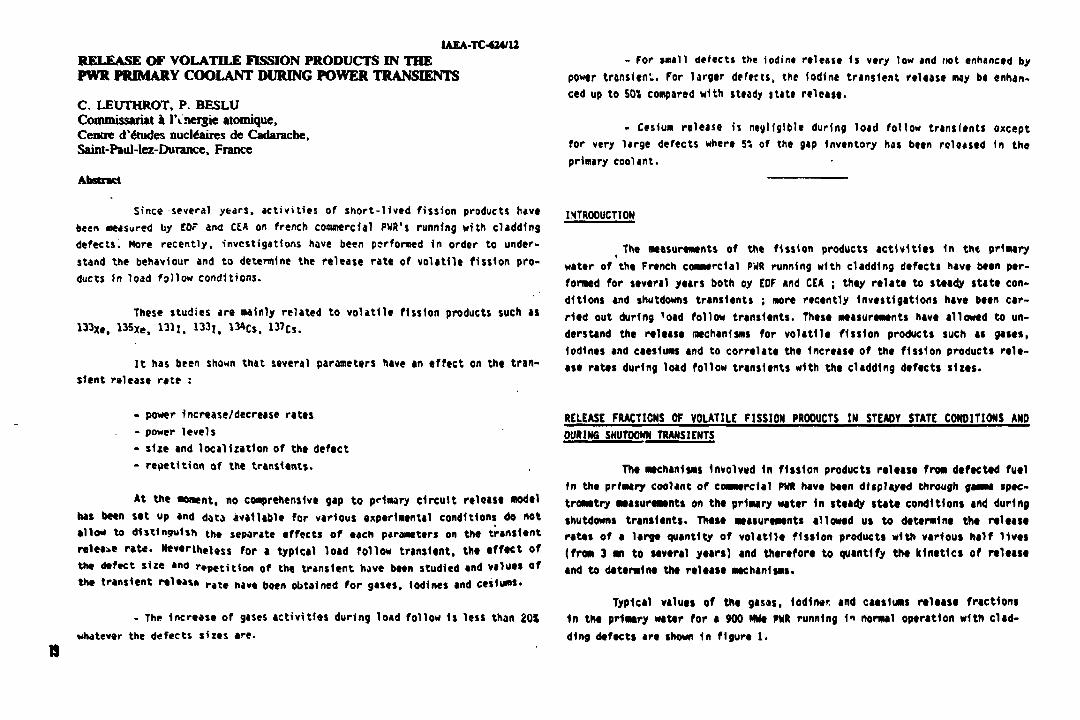
Typical values of the gasas, iodine', and caesiums release fractions 1n tht primary water for a 900 MWe PUR running In normal operation with cladding defects are shown In figure 1.
The instantaneous release fractions in the primary Mater of these fission products versus their radioactive decay constant are roughly distributed al ong 3 separate curves F • k X n
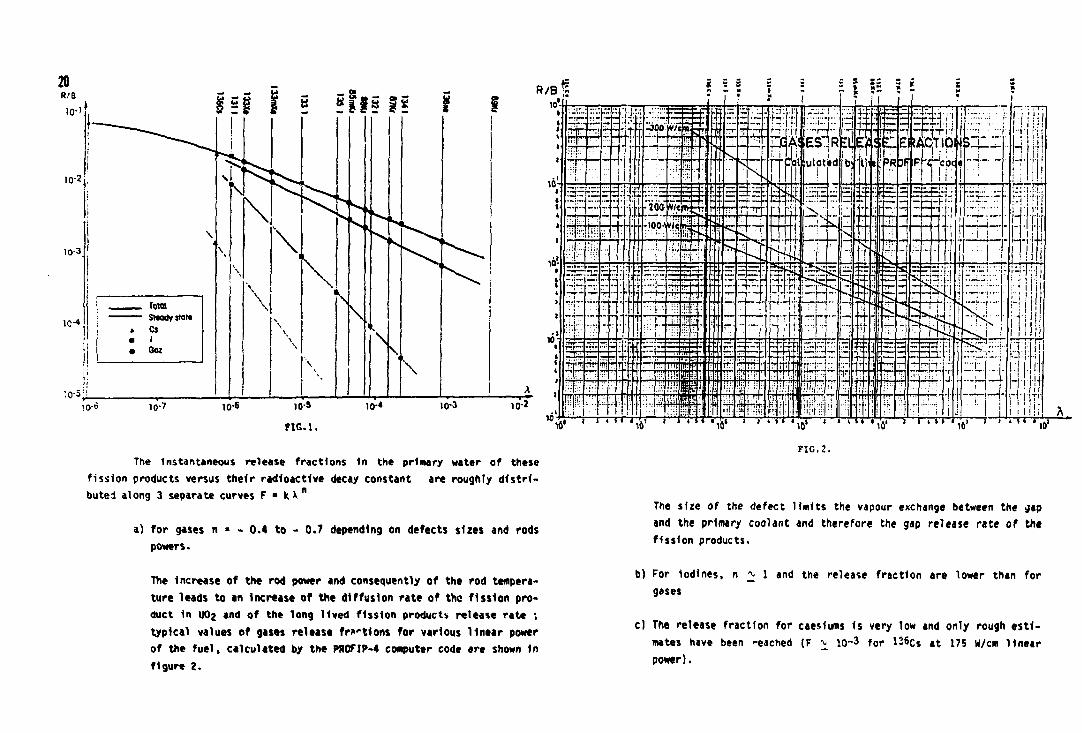
a) for gases n * - 0.4 to - 0.7 depending on defects sizes and rods powers.
The Increase of the rod power and consequently of the rod temperature leads to an Increase of the diffusion rate of the fission product in UOj and of the long lived fission product* release rate ; typical values of gases release frations for various linear power of the fuel, calculated by the PRCFIP-4 computer code are shown in figure 2.
FIC.2.
The size of the defect limits the vapour exchange between the jap and the primary coolant and therefore the gap release rate of the fission products.
b) For iodines, n ^ 1 « n d the release fraction are lower than for gases
c) The release fraction for caesiums is vtry low and only rough estimates have been 'eached (F ^ 10-3 f o r 136cs at 175 W/cm linear power).
The total release fractions Measured in the primary water after a shutdown transient Is also shown 1n figure 1 ; the 3 chemical species are distributed along the sane curve with - 0.4 to - 0.6 typical values of n.
This behaviour of the volatile fission products during the shutdown transients has been observed In nearly all the studied casts ; 1t allowed us to set up a release model for the defected fuel rods taking Into account the following experimental evidences :
1) gases. Iodines and caesiums have similar release rates from the UOj pellets.
2) the total gap Inventory of volatile fission products Is practically released into primary coolant during a shutdown transient such as a scram.
3} in steady state conditions, iodines and caesiums released from the oxide are trapped in the cold part of the fuel and on the cladding. Only a small quantity Is released Into the primary water. When there are only very small defects, rare gases are also partly kept 1n the gap and In the plenum.
4) during a power decrease, the pressure drop in the fuel to cladding gap, due to the decrease of the fuel temperature, allowed a primary water Ingress into the gap, inducing solubilization of iodine and caesium (the chemical forms of these species are probably Csl and Cs(0H) 2 which are very soluble). During a power Increase, or a pressure drop of the primary circuit, the gas Included in the plenum may be released into the primary circuit.
RELEASE FRACTIONS DURING LOW) FOLLOW TRANSIENTS
The aim of this study Is to correlate the release fractions of volatile fission products In the primary coolant during Itud follow transients tj the release fractions 1n steady state conditions and to the size of the
21 defect.
A special attention has been brought by CEA and EdF 1n fission products activities evolution both during single transients and load follow transients ; it has been sho*n that several parameters have an effect on the transient release rate :
- Power increase/decrease rates - Power levels - Size and localization of the defect - Repetition of transients.
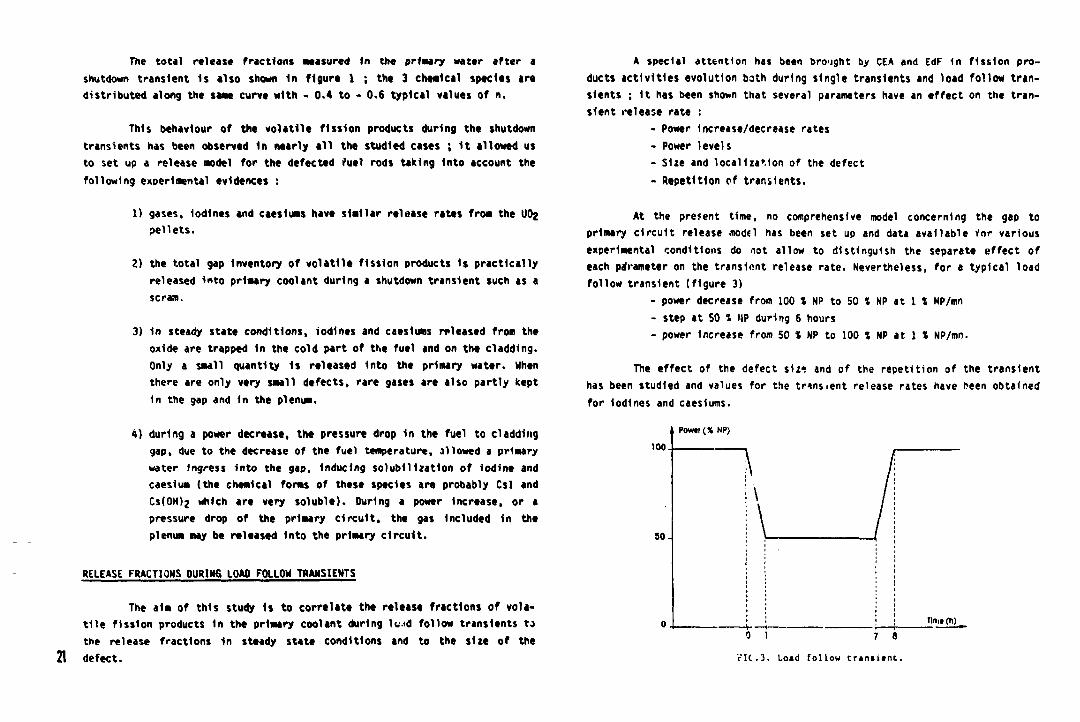
At the present time, no comprehensive model concerning the gap to primary circuit release model has been set up and data available for various experimental conditions do not allow to distinguish the separate effect of each parameter on the transient release rate. Nevertheless, for a typical load follow transient (figure 3)
- power decrease from 100 t NP to 50 X NP at 1 * NP/mn - step at 50 1 NP during 6 hours - power increase from 50 * NP to 100 S NP at 1 I NP/mn.
The effect of the defect siz"s and of the repetition of the transient has been studied and values for the transient release rates have l>een obtained for Iodines and caesiums.
Powtr(% NP)
100
0 1 7 8
F K . 3 , Load fol low c r a m l e n t .
22 EFFECT OF THE DEFECT SIZE
Me are not able to determine the defects sizes during Irradiation ; futhenwre, 1n nost cases the direct determination of these sizes during the end of cycle visual examinations Is not possible.
An indirect method of defects sizes determination has been elaborated by CEA/OMG at EdF request, based on gases release kinetics during the sipping test which is used in the French power plants. This method allows to determine roughly the size of the cladding defects during the cold shutdown, 1n the range of 5 to SO urn equivalent diameter. For larger defects, only the visual examinations are used when they are possible.
6ASES RELEASE DURIN6 A LOAD F0UCJ TRAHSIEHT
The transient release of rare gases Is lo* during a shutdown transient because of the continuous release of these species 1n normal operation. It will be even lower during load follow transients, and <n all the studied cases (defects sizes from 10 urn to sever-1 cm 2), the Increase of gas activities during the transient Is less than 20 % ; the transitory release takes place during the power Increase.
IOOINES RELEASE DURING A LOAD FOLLOW TRANSIENT
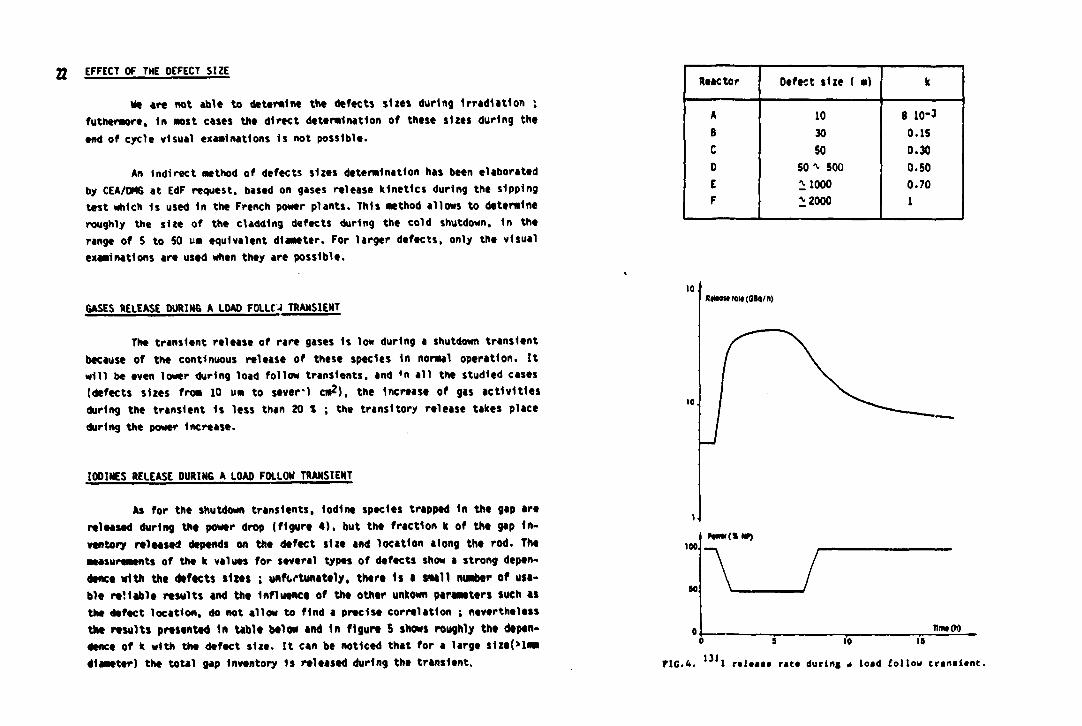
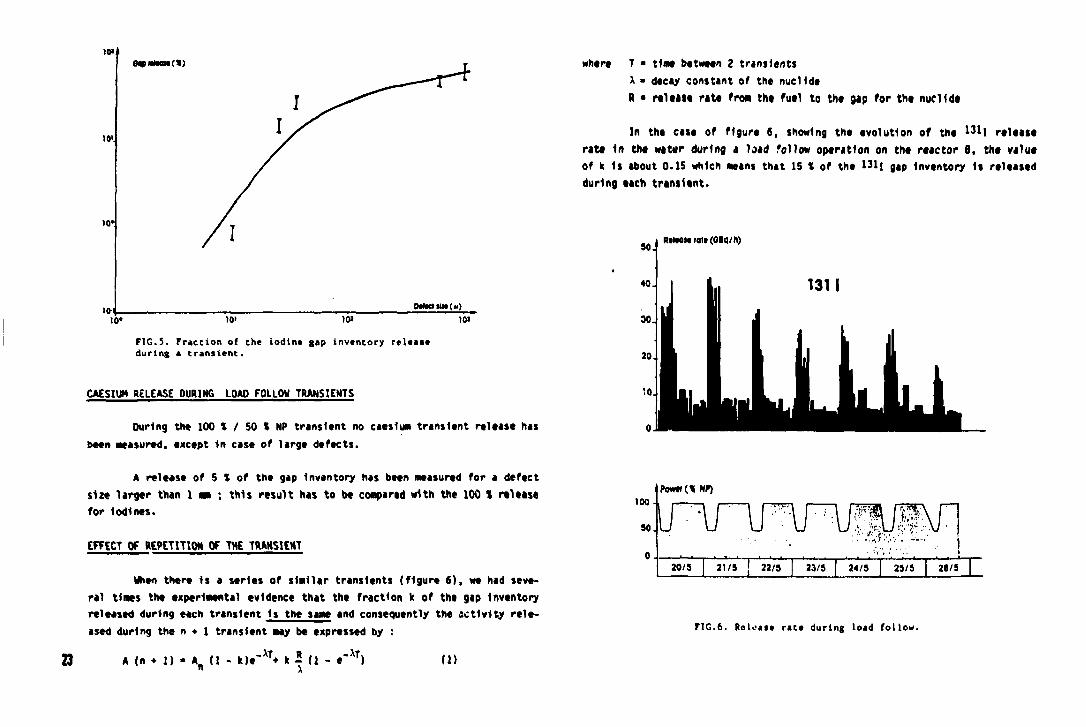
As for the shutdown transients, Iodine species trapped In the gap are released during the power drop (figure 4), but the fraction k of the gap Inventory released depends on the defect size and location along the rod. The measurements of the k values for several types of defects show a strong dependence with the defects sizes ; unfortunately, there Is a small number of usable reliable results and the Influence of the other unkown parameters such as the defect location, do not allow to find a precise correlation ; nevertheless the results presented in table below and In figure 5 shows roughly the dependence of k with the defect size. It can be noticed that for a large size(>lmm diameter) the total gap Inventory Is released during the transient.
Reactor Defect size ( m) k
A 10 8 10-3 B 30 0.15 C 50 0.30 0 50 * 500 0.50 E 11000 0.70 F 12000 I
10.
10.
fitiMMrait(aiq/h)
100.
ol
HrmUXHf)
10
131
Tl!M(h) IS
F IG .4 . I n t M M r a t * during A load fe l low t r a n i l t n t .
10»1 Oop *•>»(»)
10'J
10*
10* pmcmit(M)
io» I0» I0»
FIG.5. Fraction of the iodine gap inventory release during a transient.
CAESIUM RELEASE DURING LOAD FOLLOW TRANSIENTS
During the 100 X I 50 * NP transient no caesium transient release has been Measured, except 1n case of large defects.
A release of 5 X of the gap Inventory has been measured for a defect size larger than 1 m ; this result has to be compared with the 100 X release for iodines.
EFFECT OF REPETITION JJFJTHE TRANSIENT
when there Is a series of similar transients (figure 6), we had several times the experimental evidence that the fraction k of the gap Inventory released during each transient Is the same and consequently the activity released during the n • 1 transient may be expressed by :
A (n • I) - A„ (I k)e' X T+ k-5 (i e- X T) (1)
where T * time between 2 transients X » decay constant of the nuclide R • release rate from the fuel to the gap for the nuclide
In the case of figure 6, showing the evolution of the 1 3 1 I release rate In the water during a load follow operation on the reactor 8, the value of k Is about 0.15 which means that 15 X of the 131i gap inventory Is released during each transient.
RtMoteroli(OBq/h)
fpewtf(U NP) 100
SO
0
'\F\T\F\F\JWMPi 20/5 | 21/5 j 22/5 | 23/5 | 24/5 | 25/5 | 28/5
FIG.6. RoU'ase rate during load fol low.
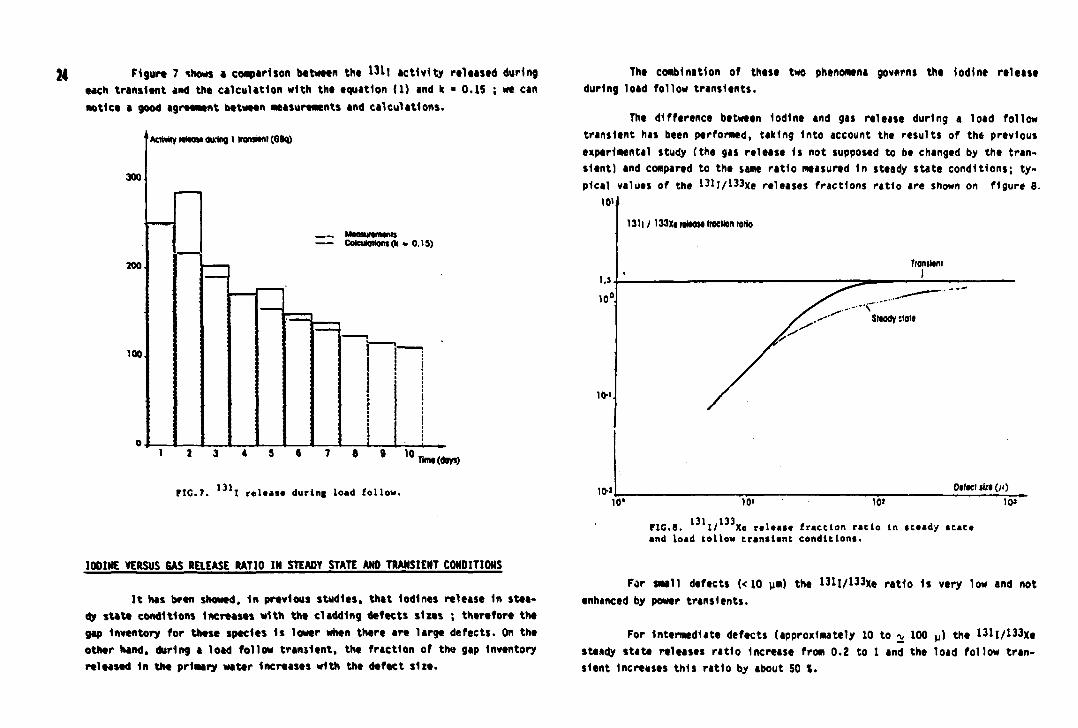
24 Figure 7 shows a comparison between the 13*1 activity released during each transient and the calculation with the equation (1) and k • 0.15 ; we can notice a good agreement between Measurements and calculations.
Activity M m * diving 1 Itonstnl (GBq)
300
^ _ * » MaQSUftflMfttl Calculations (K «. 0.15)
200 R 100.
•
~
0 . 1 2 3 * 5 6 7 8 9 10 Tlflw(doyi)
FIC.7. , 3 1 I reliiia during load follow.
IODIME VERSUS GAS RELEASE RATIO IN STEADY STATE ANO TRANSIENT CONDITIONS
It has been showed. In previous studies, that Iodines release In steady state conditions Increases with the cladding defects sixes ; therefore the gap Inventory for these species 1s lower when there are large defects. On the other hand, during a load follow transient, the fraction of the gap Inventory released In the primary water Increases with the defect size.
The combination of these two phenomena governs the Iodine release during load follow transients.
The difference between Iodine and gas release during a load follow transient has been performed, taking Into account the results of the previous experimental study (the gas release Is not supposed to be changed by the transient) and compared to the same ratio measured 1n steady state conditions; typical values of the 1 3lj/133xe releases fractions ratio are shown on figure 8.
10V 13)1 / 133x« nwoMlrocilon ratio
l.i
lO-i
Tronsltnt
10-*
Sitody stole
Dsfaei »i» (/<) 10* 10' )0» 10'
riG.8. 1/ Xe raleas* fraction raclo in scaady icata and load tollow transient conditions.
For small defects (< 10 pm) the I3li/133xe ratio Is very low and not enhanced by power transients.
For Intermediate defects (approximately 10 to ;v 100 v ) the I31i/133xe steady state releases ratio Increase from 0.2 to 1 and the load follow transient Increases this ratio by about 50 %.
For larger defects, the total In gap Iodine Inventory Is released In steady state conditions and obviously the transient cannot Increase the Iodine release rate.
The M X I M U M theoretical 131i/133 X e release rate ratio (R) Is given by
CONCLUSION
The volatile fission products release rates from defected fuel have been Investigated In steady state and transient conditions
- For a typical load follow transient (100 X / 50 I MP) the Increase of gases release Is negligible
- Iodine release is enhanced up to 50 % by the power transient when there are Intermediate defects size (roughly between 10 to 100pm) It can be noticed that the existing occurence of such defects size on the French commercial PURs Is less than 20 % of the total defects number.
- Caesium release Is not enhanced by power transients except for very large defects sizes.
2
1AEA-TC-4247I3
COMPARATIVE STUDIES OF AXIAL GAS MIXING IN FUEL RODS WITH STANDARD AND RIFLED CLADDING
N. KJAER-PEDERSEN Studsvik of America, Inc., Richland, Washington, United States of America
M. KINOSHITA CRIEPI, Japan H. MOGARD Studsvik Energiteknik AB, Nykdping, Sweden
'Abstract
The fiasion gas released ftea the tual to the internal volume of an operating LWR fual rod doaa not instantly mil with tha gas miiture already present in that volume.
Upon tha aiially dlatributad release af a given amount o( (laaion gas, changee will occur in tha tiaaion gaa eoncantration of tha local fraa volumes, along with a dlatrlbutad overpressure tranaiant.
After praoaura aquilibriwm, tha dlatributlen along tha rod of the local (iaaion gaa coneantration will have changad bacauaa of tho aachanga of gaa inventories aaong aslal locationa.
Further dloaipation of tha released fission gaa will take place through aaial diffusion.
If the heat rating of the rod. and/or ita aaial dlatribution, should subsequently change • corresponding changes of the local free voluaes and temperatures will force additional aslal flow, which will then tend to enhance the gas ailing throughout tha rod internal volume
The duration of the initial overpressure transient depends on the firmness of the fuel-cladding contact. For soft contact it may be short compared to the gas release time and tha thermal time constant of the rod. Therefore, the Importance of the transient nature of the pressure equilibration for the thermal performance of the rod Is variable.
The diffusion, however, may be very slow and therefore have a etrong influence on the red performance by locally enhancing the thermal feed-back relative to that corresponding to instant ailing.
Tha enhancement of tha gas miainq duo to tha pumping action o( tha volume and temperature ehangaa aaaociatad with haat rating changaa is of tho aaaa natura as tha initial ovetpressure transient, i . e . , it constitutaa a relatively quick redistribution ol tho local fission gas concontration
Tha dittustona.1 dalay is strongly dependent on tha langth ot tha path that tha gas atoas aust travel to effectuate oquilibriua. For a rod with a doaad gap, this path govs through tha intarnal fual cracks. which, dua to tho lack ot alignaant, provide significant diffusional resistance
Tha ritlad cladding dasign, developed by Studsvik, ansuras tha praaanca of a wall-aliqnad rasidual gap, a«an aftar fins pellet-cladding contact This residual gap kaaps tha diffusional ret'stance to a a in iaua , thus enhancing gas flow and aaial gas aiaing and ainiaii ing thermal feed-back. Since the rasidual gap is distributed in pockets around the perifery, separated by lones of fine contact, it is thermally bypaasad by tha low thermal resistance ot the contact points Thus, it causes no significant increase of tha fuel temperature
This paper presents a Joint numerical study ot aaial gas mining by CR1EP1 and Studa»ik Tha codes EIMU3 and INTCRPIN are used to analyse tha above described phenomena The study focuses on the relative influence ot the dtttuaional delay in cases of open gap and closed gap tor standard cladding, and illustrates the effectiveness of the rifled design in enhancing gaa aiaing. The study also concludes that the pumping action resulting from heat rating changes is an important factor in achieving fission gas concentration equilibrium ,
1 Introduct ion and Summary
Through the years of large scale operation of power producing light water reactors, a large data base of end of life fission gas rslease measurements on full-site fuel rods has bsen obtained The results may be grouped on the basis of burn up, reactor type, and operating conditions. Even so, a large scatter in the observed fission gas release results is evident within groups. The scatter seems to be most pronounced tor BWR's at burnups between 20 and 30 HVd/kgU.
It has been speculated that one reason tor the observed scatter could be thermal feedback, enhanced through resistance to or delay of the mlsing of the locally released fission gases with the fill gas through the free volume of the fuel rod. It is obvious that such resistances and delays, it present, could greatly enhance the local fission gas concentration in the fuel-cladding gap and in the fuel cracks, thus causing local overheating and fission gas release enhancement in eacess of that corresponding to perfect aising.
Theoretical models have been proposed (References 1,2,4) that would deal with incomplete miaing >n a quantitative manner, based on aaial gradients in both absolute gas pressure and fission gas pattlal pressure. These efforts have led to the eaistence today of computer codes that are capable of handling incomplete aaial gas aiaing on the basis of asial diffusion alone (Reference 3.3.8.?) The inclusion ot pressure gradient effects abides eaperimantal results that will enable the distinction between pressurs effects and duffusion effects in the measurements
Experimental work is in ptogrsss to investigate the relative roles of pressure effects and diffusion effects in experimental fuel rods (Reference a).
On the design side, a new cladding concept has been proposed by Studsvik to offset the resistance to aaial gas miaing in an operating LVR fuel rod This design, the "rifled" cladding, has bean tested in Studsvik (Reference ?) to show a aignificant reduction in overall fission gas rslsass compared to reference rods of convsntional design
This paper reports theoretical work performed Jointly by CRIEPI and Studsvik to paraaetricaily investigate the sensitivity of the gas miaing process to a sslectlon of operating conditions, including small and Urge local ga* release, large and small fuel rod design gap, and tha use of the specially designed rifled cladding. The codes ElMUS (CRIEPI) and 1NTERPIN/FRPS (Studsvik) were used in the study. Both codes apply classical two-component diffusion theory, although in somewhat different mathematical implementation Although the codes do not model transient overpressure effects, they both take into aceount the displacement of gas inventories resulting from the equilibration ot local overpressures. This equilibration is assuaed to be instant and complete, abiding an asperimental basis for an altsrnative approach.
It has been substantiated troa the use of both codes that the unimpeded (large gap) aaial aising by diffusion requires a tiaa span ot a few days to play out computet?, and that a diminishing gap site may significantly prolong this time span The quantitative modeling of the gap effect is subfsct to eventual adjustmsnt to esperimental results.
The study has also indicated that a rifled cladding rod with a small gap is expected to show aiial gas mixing somewhat slower than that of a large gap red, but much faster than that ot a conventional rod with the same small gap.
Furthermore, from studying the effects of a large versus a small burst ot gas release, it has been observed that the initial pressure equilibration causes a more effective instant gas communication along ths rod if the gap is small than if the gap is large. This trivial, but rathsr important observation underscores the complexity of axial gas mixing, and the importance ol any mechanism that would prevent the tnet»nt pressurs equilibration from happening, e . g . , by sustaining axial pressure gradients.
Altogether, the pressnt study is reported as a first step in quantitativsly describing asial gas mixing in response to design parameters, design type and operating conditions.
JL &co»a ot tha Parametric Study
The intent of the calculations! exercise was dual: partly to study ths pursly dlttustonal axial migration of locally rsleased fission gases tn a full-slse LVR rod, and partly to study the effects of assumed instant equilibration of local overpressures on the miaing process.
A typical BWR design, including several options for the cladding design, was selected tor the purpose. A pre-burtt power history was used to bring the rod to a burnup of 25-30 MWd/kgU without significant fission gas release. Then, an overpower was applied for a few hours at tha bottom part of the rod. The local
g«a ralaaaa following tha holding at elevated powar waa calculated, and tha subsequent change of local liaaion g»» concentration in tha gap aa a (unction of u i a l position waa monitored (or several hundrad houra a(tar tha powar reduction
In ordar to aaparata tha di((uaionaI a((act froa tha praaaura equilibrium a((act, two types of bursts wara studiad: A limit ad burat, ralaaaing only a small mount e( gaa, so that tha equilibrium praasura of tha rod would not ba significantly changed aa a raault of tha burat. and a much largar burat, giving risa to a significant changa of aguilibriua pressure.
Tha raaulta of tho paraaatric investigations ara reported in tha following sac t ion
3 Rasul ts of tha Paraaatr i c Studir
.3—1 Pit fnaional Caa Migration
? 1 ! S t v v M l wit.li t,hg E t r V S Sill
Tha burst of fission gas releasr was liaitad to a vary small amount by adjusting tha aagnituda of tha ovarpowar.
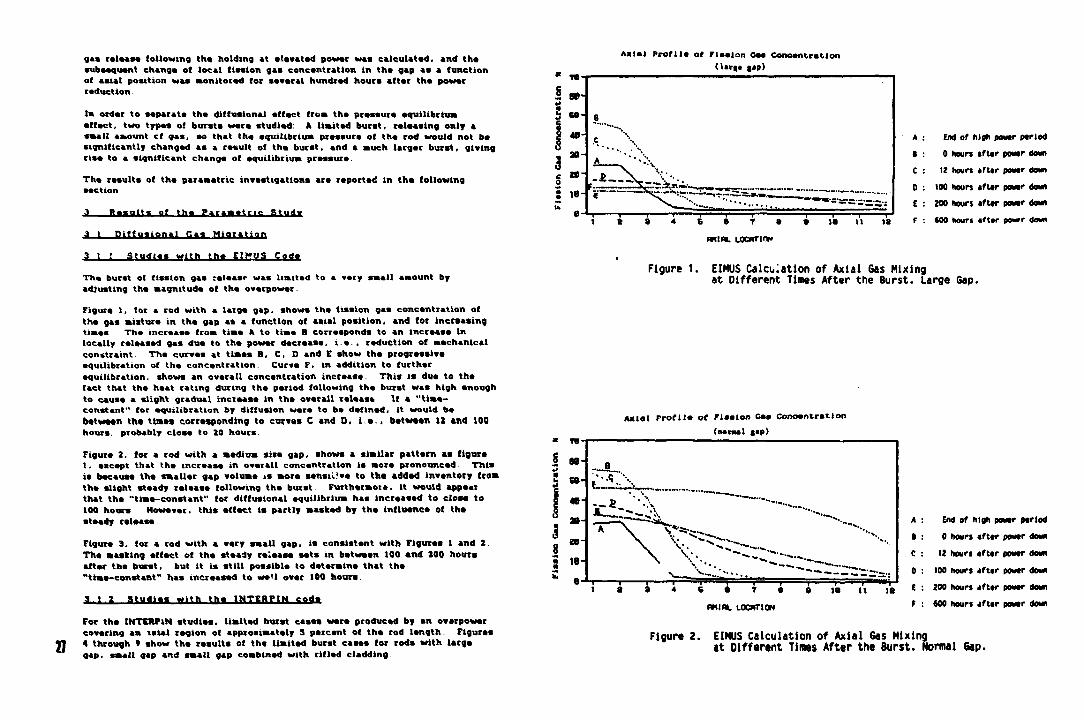
Figure 1. (or a rod with a larga gap, ahowa tha fission gas concantration of tha gas miatura in tha gap aa a (unction of aaial position, and (or incraaaing times Tha incraasa from tiaa A to tima B corraaponda to an incraasa in locally rolaasad gas dua to tha powar dacraasa, i . e . . raduction of machanical constraint. Tha curves at timas B, C, 0 and E show tha progressiva aquilibration of tha concantration. Curva F. in addition to (urthar aquilibration • shows an ovarall concontration incraasa This is dua to tha (act that tha haat rating during tha pariod following tha burst was high anough to causa a slight gradual incraasa in tha overall ralaaaa If a "time-conatant" (or aquilibration by diffusion wara to ba dafinad, it would ba batwaan tha tiaas corresponding to curias C and 0, i . a . , batween 12 and 100 hours, probably cloaa to 20 hours.
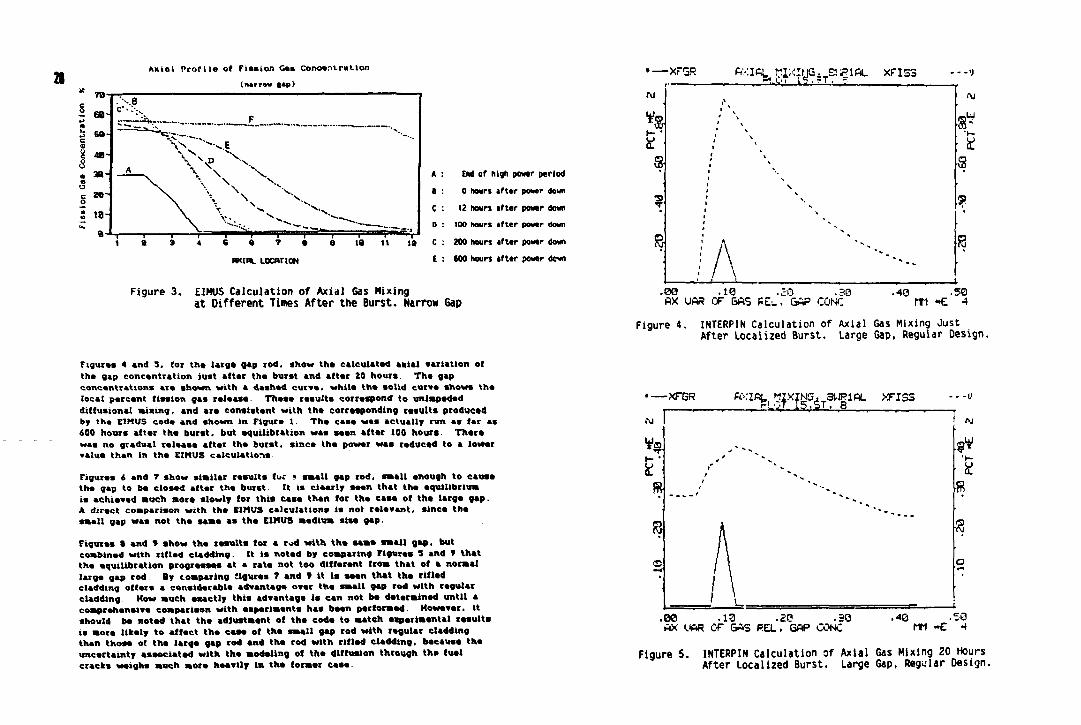
Figura 2. (or a rod with a aediua sita gap, shows a similar pattam as (igura i . aacapt that tha incraasa in ovarall concontration ia mora pronounced. This is because tha smaller gap volume is more sansiv'va to tha added inventory from the alight steady releaaa following the buret Furthermore, it would appear that the "time-constant" (or di((usional equilibrium has increased to close to 100 hours However, this effect is partly masked by the induence o( the steady release
Figure 3, (or a rod with a vary small gap. Is consistent with Figures 1 and 2. The masking affect of tha steady release sets in between 100 and 200 hours after tha burst, but it ia still possible to determine that tha "time-constant" has increased to we't over 100 hours.
3 1 2 Studies with tha 1NTERP1N code
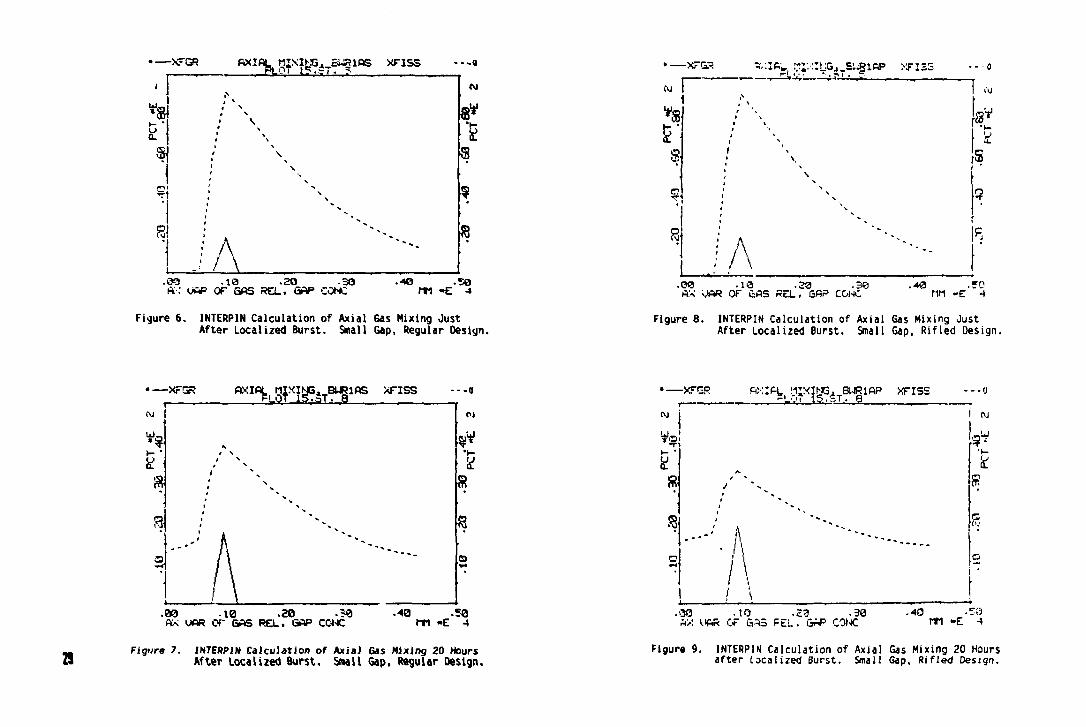
For the INTERPlN studies, limited burst caaas were produced by an overpower covering an taial region of approaimataly 3 percent o( the rod length. Figures «. through * show the results of the limited burst cases (or rods with large gap, small gap and small gap combined with rifled cladding
Axial Profi le of rtaelon Caa Concentration Oarga gap)
SO
40
aa-
T * 6 • T •
F K I M . Locnnnp
A : End of high power pariod
B : 0 hours after power down
C : 12 hours after poser down
D : tOO hours after powtr down
E : 200 hours after power down
F : 600 hours af ter powrr down
Figure 1. EIMUS Calculation of Axial Gas Mixing at Different Times After the Burst. Large Gap.
Axlel Prof i le of f ieeion Gas Concentration (naraal gap)
ten se-
.. B
40-
aa-
2 0 -
t0-
"A" \
\ v.
l • a * e e T e e is tt te ftKlf*. LOCUTION
End of high power period
0 hours af ter power down
12 hours after power down
100 hours after powar down
200 hours after power down
600 hours after power down
Figure 2. EIMUS Calculation of Axial Gas Mixing at Dif ferent Times After the Burst. Normal Gap.
Axial Prof i le of Fission Gas concentration (narrow t*p)
End of high powtr period
0 hours <ft«r power down
12 hours iftar power down
100 hours tfter povvr down
200 hours i fUr povtr down
600 hours tf t tr powar dewn
Figure 3. EIMUS Calculation of Axial Gas Nixing at Different Times After the Burst. Narrow Gap
Figuras 4 and 5, tor tha larga gap rod. show tha calculated aiial variation of tha gap concantration just after tha burst and altar 20 hours. Tha gap concentrations ara shown with a dashad curve, whila tha solid curve shows the local percent tission gas release. These results correspond to unimpeded diffusional miaing, and are consistent with the corresponding results produced by tha EIMUS coda and shown in Figure 1 The case was actually run as (ar as 400 hours alter the burst, but equilibration was seen alter 100 hours. There was no gradual release alter the burst, since the power was reduced to a lower value than in tha EIMUS calculations
Figuras a and 7 show similar results toe * small gap rod. small enough to cause tha gap to be closed after the burst. It is claarly seen that the equilibrium is achieved much more slowly tor this case than tor the case ot the large gap. A direct comparison with the EIMUS calculations is not relevant, since the small gap was not the same as the EIMUS medium sise gap.
Figuras » and 9 show the results lor a *»d with the same small gap, but combined with rifled cladding. It is noted by comparing Figuras 3 and * that the equilibration progresses at a rata not too different Irom that ol a normal large gap rod By comparing figures 1 and * it is seen that the rilled cladding offers a considerable advantage over the small gap rod with regular cladding How much oaactly this advantage is can not be determined until a comprehensive comparison with eaperiments has been performed. However, it should be noted that the adjustment ot the code to match eaperimental results is more likely to affect the case ol the small gap rod with regular cladding than those of the larqe gap rod and the rod with rilled cladding, because the uncertainty associated with the modeling ot the diffusion through th» fuel cracks weighs much more heavily in the former ease.
«—XfGR AXIAL, MIXING, EIJPIAL. XFIS3
.00 .10 .ZQ .30 fix UAR OF GAS PE<_, GAP COW
.40 .50 ITI »E 4
Figure 4. INTERPIN Calculation of Axial Gas Mixing Just After Localized Burst. Large Gap, Regular Design.
-XFGR AXIAL,, FIXING. 9WR1AL XTIS ^ L v t I57ST, B
.00 .13 .20 .30 AX L"AR Cf GAS PEL, GAP CONC
-ii
.40 .50 m -E 4
Figure 5. INTERPIN Calculation of Axial Gas Mixing 20 Hours After Localized Burst. Large Gap, Regular Design.
• XFGR «XIAL WNIHG^BURIAS XFISS CIAL MJXIJJG., BUR . . .«
.03 .19 .20 .30 A:-; UAP OF GAS PEL. GAP CONC
.40 .50 MT1 »E 4
Figure 6. INTERP1N Calculation of Axial Gas Mixing Just After Localized Burst. Small Gap, Regular Design.
• XFGR AXIAL, MIXING. BUR1AS XFISS ^ L o t is.ST. a
-a
.00 .10 .20 -SO AX UAR OT GAS REL. GBP CONC .40 .50 Mfl *E 4
„ Figure 7. INTEftPIN Calculation of Axial Gas Mixing 20 Hours a After Localized Burst. Small Gap, Regular Design.
E s
a
• — x r a = ¥' ; I R»i vi"."-'J3jTsi^iftp X F I S S ---o CVJ 1 ' f (0
/ A '- I .08 .10 .23 .30 .40 .50 AX OAR OF £AS PEL, GAP CGNC T1M -E 4
Figure 8. INTERPIN Calculation of Axial Gas Mixing Just Af ter Localized Burst. Small Gap, R i f led Oesign.
•—XFGR AXIAL I-IIXING.BURIAP XFISS -- -O w l ^.gy < ig?aT^ i f l p y f l 5 S
Vol
I
- ' . A
I CM
"E
/ . i
J \ .30 .10 .23 .39 -40 .5!3 HX UAR OF S3S PEL. GAP CONC MM «E -4
Figure 9. INTERPIN Calculation of Axial Gas Mixing 20 Hours after Localized Burst. Small Gap, Rifled Design.
• f -LJ Caa Hiaratton by Proaaura Eauil ibration
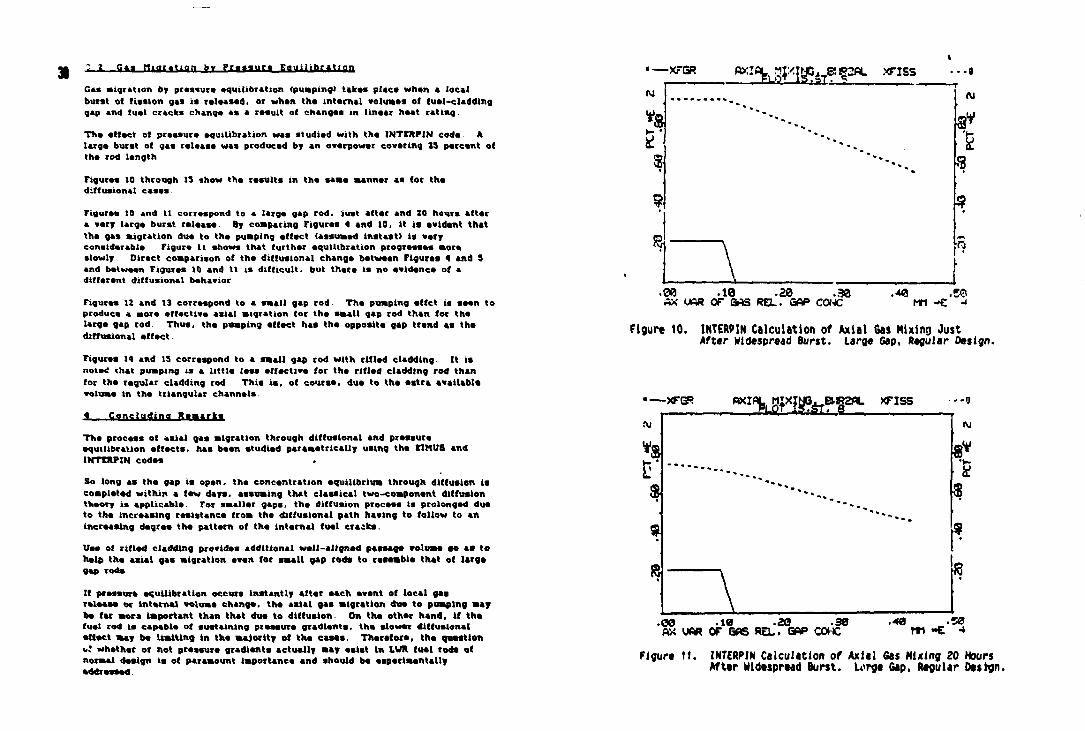
Caa migration by pressure equilibration (pumping) takoa placa whan a local burst ol fission gas is ralaasad. or whan the intarnal volumes of fuel-cladding gap and fuel cracks change a* a roault o( changaa in linaar haat rating
Tha effect of praasura equilibration waa atudiad with tha INTIRPIN coda. A larga burat of gaa ralaaaa was producad by an overpower covering 23 parcant of tha rod langth
Figuras to through 13 show tha rasults in tha same manner as tor tha diftusional cases.
Figuras 10 and 11 correspond to a larga gap rod. iuat attar and 20 hours attar a vary larga burst ralaasa. By comparing Figuras 4 and 10, it is avidant that tha gas migration dua to tho pumping affact (assumed instast) is vary considerable Figura 11 shows that furthar equilibration progresses more slowly Direct comparison of the diffusional Changs between Figuras 4 and 3 and between Figures 10 and 11 ia difficult, but there ia no evidence of a different diffuaional behavior
Figures 12 and 13 correspond to a small gap rod. The pumping effct ia seen to produce a more effective asial migration for the email gap rod than for the larga gap rod Thus, tha pumping effect has the opposite gap trend as tha ditfusional effect.
Figures 14 and 13 correspond to a small gap rod with rifled cladding. It is noteti that pumping is a little less effective for the rifled cladding rod than tor the regular cladding rod This i s , of course, due to tha aatra available volume in the triangular channels
4.—C?nsi»;Ung l l n t r l i Tha process of asial gas migration through diffusional and pressure equilibration effects, has been studied parametrically using tha EIMUS and INTOPIN codes
So long as the gap is open, the concentration equilibrium through diffusion is completed within a few days, assuming that classical two-component diffusion theory is applicable. For smaller gapa. the diffusion process is prolonged due to the increasing resistance from the diftusional path having to follow to an increasing degree the pattern of the internal fuel cracks.
Use of rifled cladding provides additional wall-aligned passage volume so as ta help the aaial gas migration even tor small gap rods to resemble that of large gap rods
It pressure equilibration occurs instantly after each event of local gas ralaasa or internal volume change, the asial gas migratien dua to pumping say be far mora important than that dua to diffusion. On tha ether hand, if the fuel rod is capable of sustaining pi assure gradients, tha slower diffusional effect may be limiting in the majority of the cases. Therefore, the question u! whether or not pressure gradients actually may asist in IVR fuel rods of normal design is of paramount importance and should ba experimentally addressed
•—XTGR B > : I < V f f / i f c & T ? ! l g 2 f l L • < F I S S
.00 .10 .20 .30 AX UftR OF GAS RBL. GAP C0NC
.40 .50 MM -E J
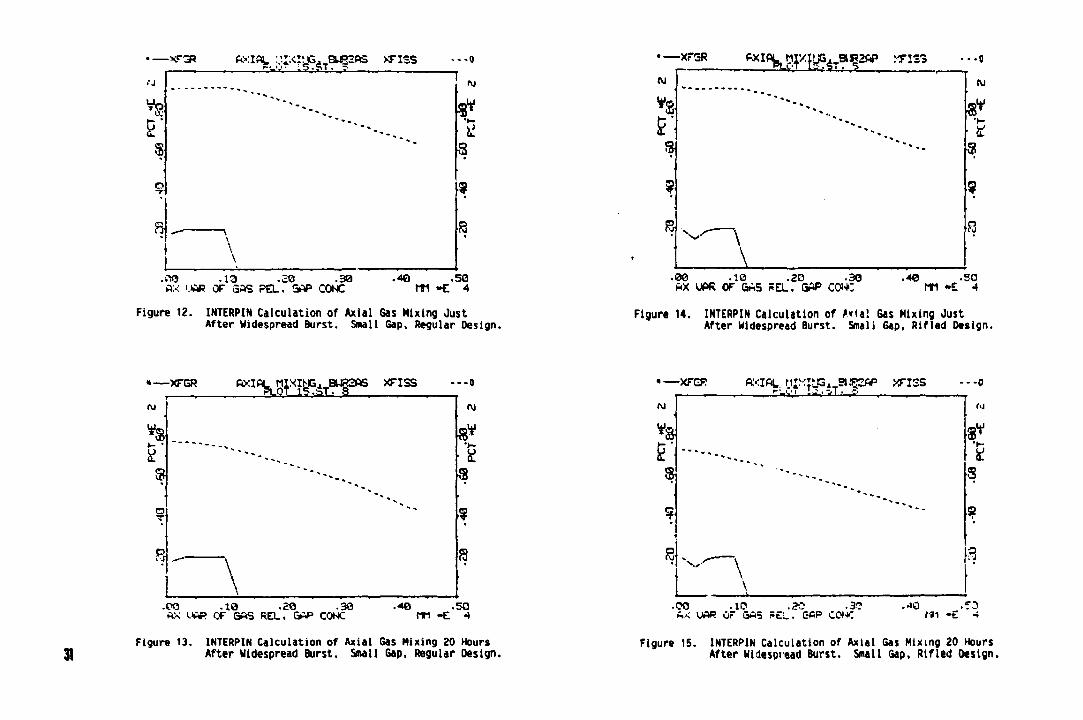
Figure 10. INTERPIH Calculation of Axial Gas Mixing Just After Widespread Burst. Large Gap, Regular Design.
•—XFGR AXIAL. 0IXING.. Bl wav xriss
.00 .10 .20 .30 AXUAR0F6I6 REL. GAP COtC
.40 .50 rli *E •*
Figure 11. INTERPIN Calculation of Axial Gas Nixing 20 Hours After Widespread Burst. Urge Gap, Regular Design.
' XT3R AXIAL :;J.:<:MG. BuRaftS X F I S S "" " • - 5 . S T • ^
..TO .13 .20 .30 AX UAR OF GAS PEL. SAP CONC .40 .50 MM -E 4
Figure 12. INTERPIN Calculation of Axial Gas Mixing Just After Widespread Burst. Small Gap, Regular Design.
«—XFGR AXIAL MIXIbG. BURSAS XFISS >.OT 15.ST. 9
-P0 .10 .20 .30 AX UAR OF QAS REL. GAP CONC
--0
.4© .50 m »E 4
31 Figure 13. INTERPIN Calculation of Axial Gas Mixing 20 Hours After Widespread Burst. Small Gap, Regular Design.
• — X F S R <*l\ms*w ^
.00 .10 .20 .30 AX UPR OF GAS FEL. GAP CONC
.40 .50 MM »E 4
Figure 14. INTERPIN Calculation of AvlaJ Gas Mixing Just After Widespread Burst. Small Gap, Rifled Design.
• • • ^ -XFGR ^ W ^ T 5 1 ^ ^ I £ S • (vJ
*3 * * * • *
s
? ** * * „
8 N , ^
\
--0 (U
hi S
•CO .10 .20 .3? A* UAP OF GA5 PEL. C-AP COK .40 .50 rm -E 4
Figure 15. INTERPIN Calculation of Axial Gas Mixing 20 Hours After Widespread Burst. Small Gap, Rifled Design.
32 The rifled cladding design prapoaad by Studevik nat only aaaaa tha conditions (or tho asial diffusion procaaa to their optimum, but alaa aaauras that pressure gradients cannot ba sustained. Tharaby. tha rifled cladding design allows tha procoaa of praaaura equilibration (pumping) to aecalarata tha aaial gas migration beyond the alow rata ei diffusion
In tha praaant study it waa aaplicitly assumed that axial praaaure gradients cannot occur. e»en with regular design cladding. Without the aaial pressure gradients, the pumping effect i s always allowed to unfold without restrictions far both types ot design, and one would not eapect a significant difference in fission gas release performance between fuel with rifled and regular design cladding Sinca, however, such performance difference has been observed, there is indication that pressure gradients can be sustained in fuel with regular design cladding. This assumption should therefore be considered In further studies.
REFERENCES
1 Klnoshita. H "Aaial Transport of Fission Gas in IVR fuel Nads". IAEA Specialists' Meeting on Water Reactor Fuel Clement Performance Computer Modelling. Freston. UX, l»e2.
2 Kjaer-Pedorsen, N : "Kffect of Aaial Dlffusional Delays on the Overall Fission Gaa Release" , IAEA Specialists' Mseting on Water Reactor Fuel Clement Performance Computer Modelling. Preaton. UK, IM2.
3 Nakajima. T : "FEMAXI-IV: A Computer Code tor the Analysis of Fuel Rod Behavior under Transient Conditions'*. Nuclear Engineering and Design M UTC» «•-•«
a. Kinoshita. H.: "Evaluation of Aaial Fission Gas Transport In Power Ramping Experiments". Rea Mechanica. If (3>. IHe.
3 Blomberg. P S . KJaer-Pedersen. M "FRPS - Tho Fuel Rod Process Simulator". Studsvik Technical Note No. Nl - ae/123. Nov, I tea.
«. OECO Maiden Reactsr Project. Private Communication.
7. Hogard. H , at. al "Irradiation Tasting of an Advanced Fuel Cladding Designed tor load-Follow and Eatended turnup Operation", Studsvik Report No. Be/1. Published in part at tha IAEA Symposium on Improvements in Water Reactor tual Technology and Utilisation, Stockholm. Sweden. September l*sa
«. Klnoshita. M "Development of High turnup Fuel Analysis Code EIMUS", CRIEPI Reeearch Report No. TeeOM. January INT.
• Kjaer-Pedersen. N : "A Novel Fuel Rod Performance Simulation Methodology for Predictive. Interpretative and Educational Purposes". fth International Conference on Structural Mechanics in Raacter Technology. Lausanne, Swittarland. August Iff*.
IAEA-TC-e24/M
FISSION GAS RELEASE DURING POWER TRANSIENTS AT HIGH BURNUP
E. PORROT, C. LEMAIGNAN Institut de recherche technologique et de
developpement industries Commissariat a l'lnergie atomique, Centre d'-ftudes nudeaires de Grenoble, Grenoble
A. RAYBAUD Service Etudes et projets thermiques
et nucleaires, Electriciti de France, Lyon <
D. BARON Fragema (Framatome Division Combustible), Lyon
France
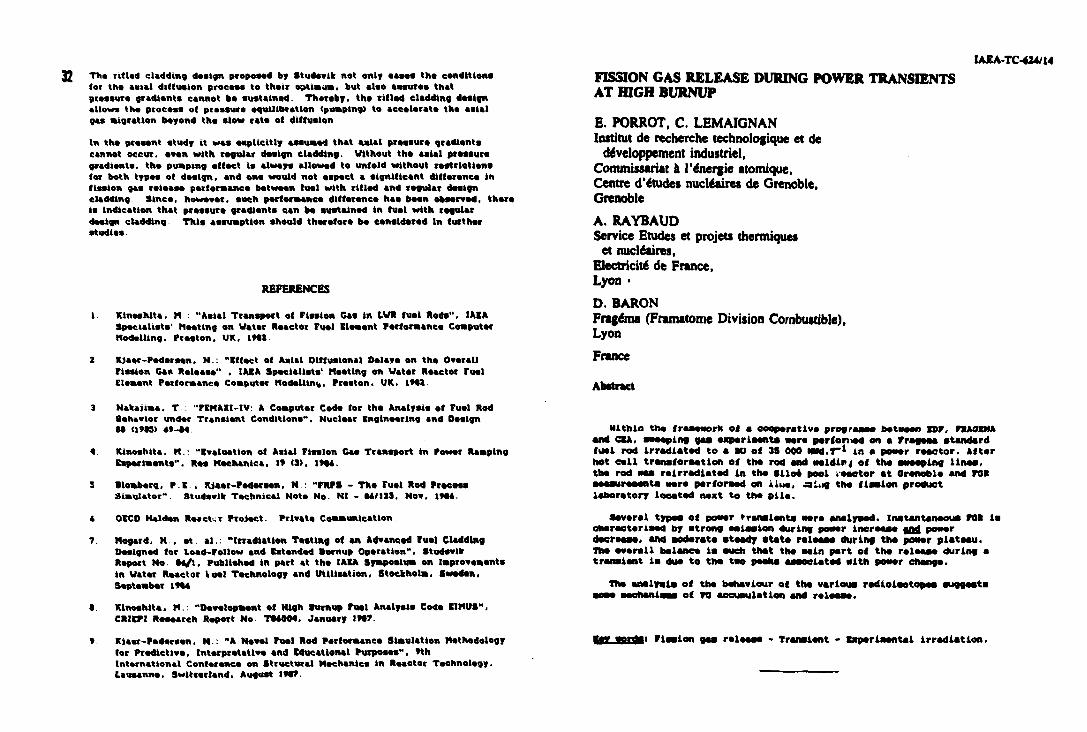
Abstract
within the framework ot a cooperative programs* betmsen EOT, FRAOEMA and CXA, sweeping gas experleant* ware porfonied on • Frageaa standard fuel rod Irradiated to a BU of IS 000 wjkJ.T~* in « poser reactor. After hot cell tranafernetIon of the rod and weldli>j of the sweeping lines, the rod w w rail-radiated in the siloe pool .sector at Orenoble and FOB seasureeenta were performed on Hum, .«i..g the fission product laboratory located next to the pile.
Several types; of power transients ware analysed. Instantaneous FOR is characterised by strong eslsslon during power increase and, power decrease), and soderate steady state rsleaas during tha power plateau. Toe overall balance la such that the sain part of the release) during s transient is due to the two psalm associated with power change.
The analysis of the behaviour of the various radioisotopes suggests aeae sschsnla— of ya accuaulatlon and ralsass.
Bar anrdsi Fission gas release - Transient - Experlaental irradiation.
l. wiMjcmcrioH The developaaot of high burn up In M M fual eleaents. associated with
tha extension of load following oparatlona has lad to tha naad for detailed knoaladga of tha aachant— of fission gag ralaaaa (rai) during poaar transients at high burn ups.
Tha uaual proeadura to gain such lnforaatlon la to punetura a rod In a hot call aftar a poaar reap parforaed la a taat reactor, and eoapara It alth a alatar rod 11-2 I . Tha only lnforaatlon ohtalnad by thla taehnlqua la tba total aaeuat of roe,, without any lnfomatlon on tha datailad klnatlca and. tharafora. on tha atrliaiil—a involved.
on tha otbar band, analytical experiaenta have baan parforaad in which aaall lrradlatad fual aaapiaa bawa baan tharaally cyclad In laotharaal furnacaa. In ordor to alaulata tba taaparatura history of tha fual during a poaar tranalant, and tha alcroatructura was subsequently analyaad by optical or olactron aicreacopy. Seaa lnforaatlon on tha aarhani—a lnwolvad In POP. during tha tranalant can ba Infarrad frea thla typa of analyata 13 I.
In ordar to fill tba gap between thoaa two approachaa. an experiaent with awaaplng gaa ralaaaa aaaauraaanta wan parforaad on a high burn up fual rod during staady state irradiation and power tranalanta. This eaperiaeat, celled IUTAC. was iaplaaantad within tha fraaework of a cooparatlwa prograaaa bataaan o r , nuaBtt and C U , on high burn up fual behaviour.
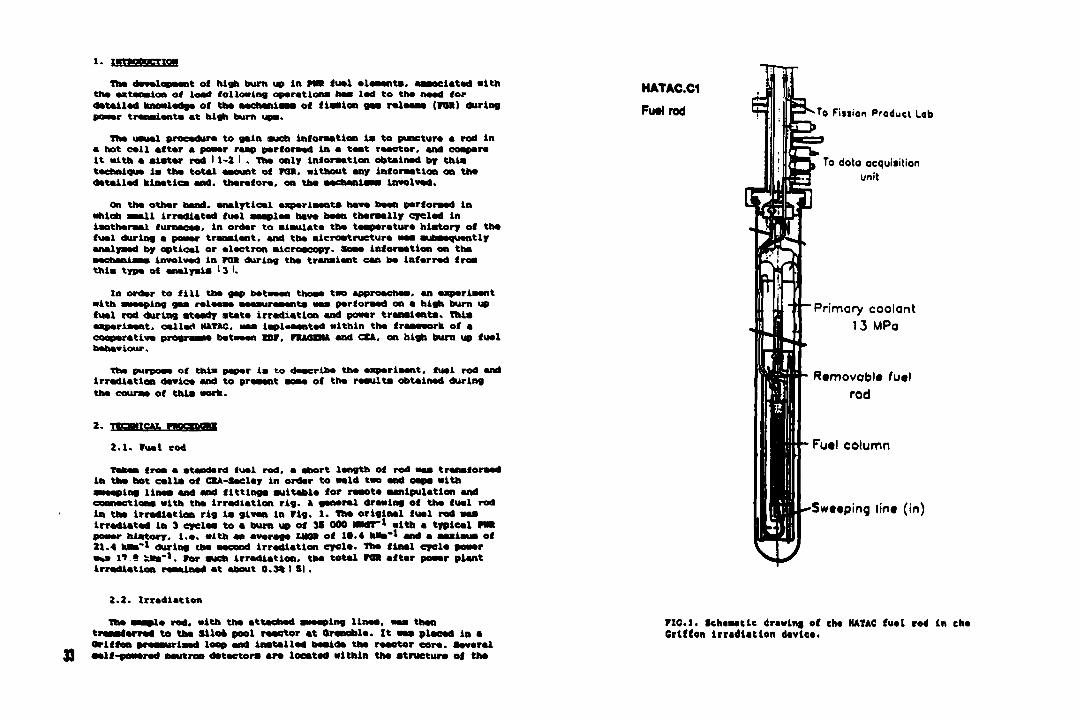
Tba purpoaa of this papar la to describe tha experiaent, fual rod and Irradiation device and to praaant aoaa of tha raaulta obtainad during tha eeuraa of this work.
2. Ttaqncju. wmxEtmm
2.1. fuel rod
Takan froa a atandard fual rod. a abort langth of rod was tranaforaad in tha hot calls of CSA-Saclay in ordar to wold two and caps with swaaplag Unas and and fittings suitabla for raaota aanlpulatlon and coanactlona alth tha irradiation rig. ft ganaral drawing of tha fual rod in tha Irradiation rig la givan in rig. 1. Tha original fual rod was lrradlatad In 3 eyclas to a burn up of 38 000 MM*-* with a typical Pw* poaar history, l.a. with an average U k » of 10.4 Has'* and a aaxiaua of 21.4 W i " ' during tba aacond irradiation cyela. Tha final cyela poaar w»s H ! Ma** 1. Par such irradiation, tba total ros aftar powar plant irradiation raaalnad at about 0.3% I SI.
2.2. Irradiation
Tha aaapla rod, with tha attachad awaaplng Unas, was than transfarrad to tha Silo* pool raaetor at Oranobla. It was placad in a Orlffon pii—uiiaad loop and installad baalda tha raaetor eore. Several self-powered neutron detectors ere located within the structure of the
KH/a
August September 1989
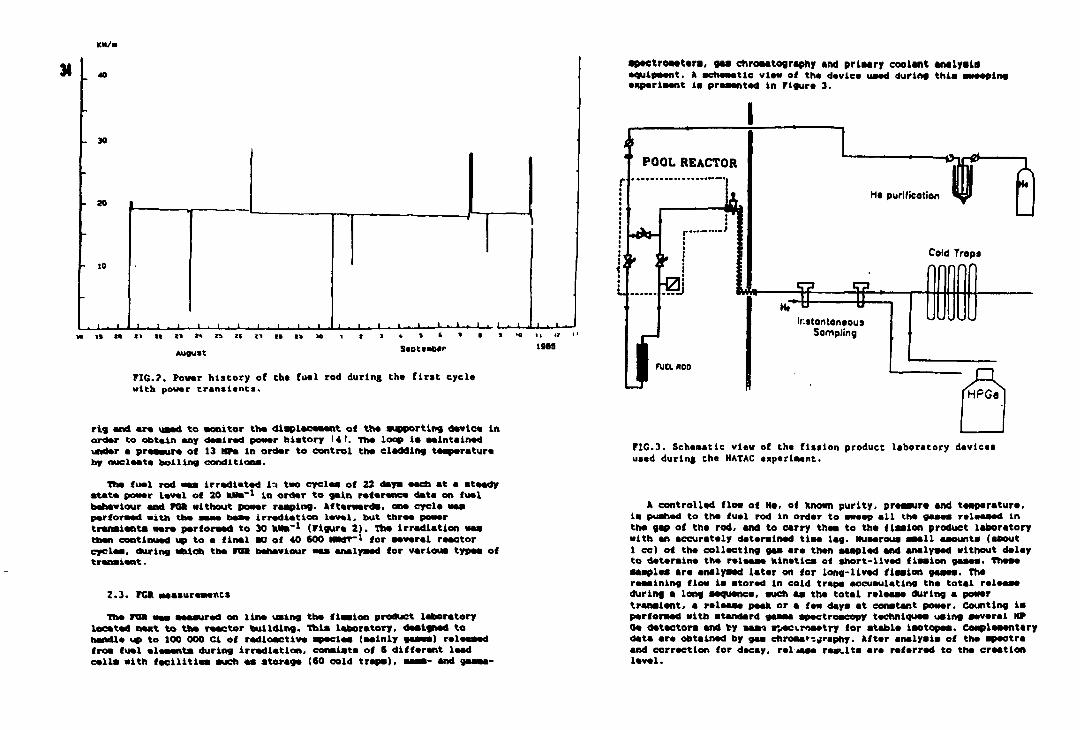
FIG.?. Power history of the fuel rod during th* first cycle with power transients.
rtg and ara used to oonitor tha displacement of tha supporting davlea in ordar to obtain any desired power history 14 1. The loop is aaintainad undar a praaaura of 13 NPa In ordar to control tha cladding taaparatvira by nucleate boiling conditions.
Tha fuel rod was irradiated In two cycles of 22 days each at a steady state power level of 20 Ma~l in ordar to gain reference data on fuel behaviour and F8» without power rasping, afterwards, one cycle was performed with the saae base irradiation level, but three power transients were perforaed to 30 hwa" 1 (Figure 2). Tha Irradiation was than continued up to a final MI of 40 600 MMT-1 for several reactor cycles, during which tha FOX behaviour was analysed for various types of transient.
2.3.. FCR measureawnts The FS> was aaasured on line using tha fission product laboratory
located neat to tha reactor building. This laboratory, designed to handle up to 100 000 cl of radioactive species (aalnly gases) released troa fuel eleaenta during Irradiation, consists of 6 different lead calls with facilities such as storage (60 cold traps). Bass- and gaaaa-
apactroasters, g u chromatography and primary coolant analysis' equipment. A schesatic view of the device used during this sweeping experlaent is presented in Figure 3.
POOL REACTOR
1* f I , > i
H« purilicotion
7k
Cold Trap* n
* >-g—S-f • FUClftOO
Instantaneous Sampling
FIG.3. Schasatle view of the fission product laboratory devices used during the HATAC experiment.
A controlled flow of Ha, of known purity, pressure and temperature, la pushed to the fuel rod in order to sweep all the gases released In tha gap of th* rod, and to carry thee to tha fission product laboratory with an accurately determined tiaa lag. Nuaerous saall aaounts (about 1 cc) of tha collecting gas ara then sampled and analysed without delay to determine the releese kinetics of short-lived fission gases. These aaaplea ar* analysed later on for long-lived fission gases. Th* remaining flow Is stored in cold traps accumulating the total release during a long sequence, such as the total release during a power transient, a release peak or a few days at constant power. Counting is performed with standard gamma spectroscopy techniques using several HP Oe detectors and by mas* s>acvroaetry lor stable Isotopes. Complementary data mrm obtained by gas chromatography. After analysis of tha spectra and correction for decay, release results are referred to the creation level.
3 . MSW.TS AMP DISCUSSION
3.1 . Gas flow
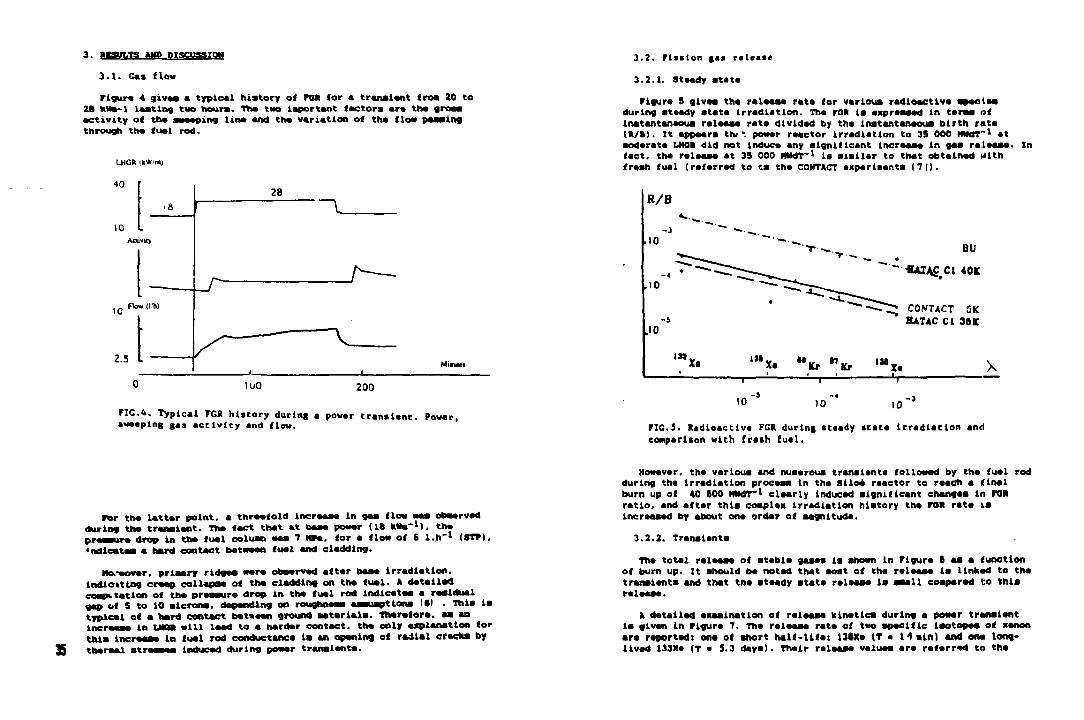
Figure 4 gives • typical history of FOR for a transient froa 20 to 2a kitm-1 lasting two hours. Tha two laportant factors ar% tha gross activity of tha sweeping Una and tha variation of tha flow passing through ths fual rod.
LHCR ikW/m)
40
\0
10 Flow (111)
2.5
28 "l_
1U0 200
FIG.4. Typical FGR history during a povar tranalant. Power, sweeping gas activity and flow.
For tha lattor point a thraafold incraasa in gas flow was observed (STP).
during tha transient. The fact that at base power (IS kits'*). tha tussim drop in ths fual coluan was 7 MPs. for a flow of 6 l.h"1 (S 'odicatea • hard contact between fual and cladding.
Ha-aovsr, prlssry rldgss wars observed after baas irradiation, indlctting creep collapse of ths cladding on tha fual. * datailed cospttatlon of the pressure drop in ths fual rod indicates a residual gap of 5 to 10 sicrona. depending on roughness aaauaptlona 161 . This is typical of a hard contact batvean ground materials. Therefore, aa an increase in u n a will lead to a harder contact, tha only explanation for this Increase In fual rod conductance la an opening of radial cracks by thersal stresses induced during power transients.
3.2. Fission gas rslaas*
3.2.1. Steady state Figura S givaa tha release rata for various radioactive species
during steady state Irradiation. The FOR la expreassd In taraa of Instantaneous release rata divided by tha instantaneous birth rata (»/»). It appears th/ *. power reactor Irradiation to 35 000 HwdT" 1 at moderate LHQR did not induce any significant Incraasa in gas release, in fact, tha release at 35 000 HNdT-1 i, eiaiiar to that obtained Mlth fresh fual (referred to es the C0KTACT axparlaants 17 1).
R/B
CONTACT GK BATAC CI 35K
, M X . J » v . UKr "U, ' » , -v. «,£, w,^ , M X t X
' 0 " ) 0 _ < io~*
FIG.3. Radioactive FGR during scsady state irradiation and comparison with frash fual.
However, the various and nuaarous transients followed by tha fual rod during tha Irradiation process In the Slloe reactor to roach a final burn up of 40 (00 HNdT~l clearly induced significant changes in FOR ratio, and after this complex irradiation hiatory tha FOR rata la increased by about one order of magnitude.
3.2.2. Transients The total release of stable gasaa is shown In Figure 6 as a function
of burn up. It should be noted that most of tha release la linked to tha transients and that tne steady state release Is ssall coaparad to this rals
* detailed axaainatlon of release kinetics during a power transient Is given in Figure 7. The release rata of two specific isotopes of xenon are reported: one of short half-Ufa: 13«Xe (T • M a i n ) and ens long-lived 133Xe (T • S.3 days). Their release valuaa are referred to the
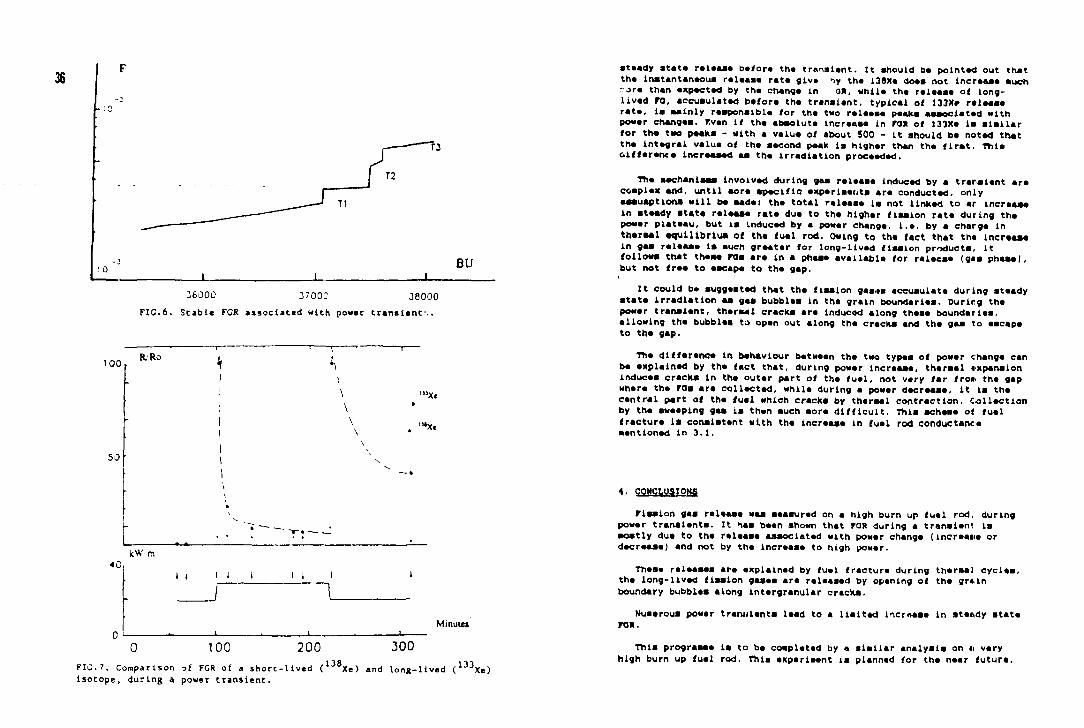
steady stata ralaasa before tha transient. It should ba pointed out that tha Instantaneous ralaaaa rata give >>y tha 138Xa does not increeae auch -ore than expected by tha change tn an, while tha ralaaaa of long-lived ro, accuaulated bafora tha tranaiant, typical of I33X* ralaaaa rata, la mainly raaponaibla for tha two ralaaaa peaks associated with powar changes. r.ven If tha abaoluta lncraaaa in ran at 133Xe la alallar for tha two paaka - with a valua of about 500 - it should ba noted that tha lntagral valua of tha second peak la highar ttvan tha first. Thia difference increased aa tha irradiation procaadad.
Tha aechanisaa lnvolvad during gaa ralaaaa lnducad by a traralent ara coaplax and, until aora apaclfic experlaer.ta ara conductad, only aaauaptlona Hill ba aadai tha total ralaaaa la not linked to ar incraaaa in ataady atata ralaaaa rata dua to tha highar flaalon rata during the power plataau, but la lnducad by a power changa, i.a. by a charga in theraal aquillbrlua of tha fual rod. Owing to tha fact that tha incraaaa In gaa ralaaaa la auch graatar for long-llvad flaalon products, it follows that thaaa raa ara in a phaaa available for ralaeaa (gaa phaaa), but not free to escape to the gap,
It could be auggasted that tha fiaalon gasus accuaulate during steady stata irradiation aa gaa bubbles in the grain boundariea. During the power tranaiant, thereat cracka are Induced along thaaa boundaries, allowing the bubblea to open out along the cracka and tha gaa to eacapa to tha gap.
Tha difference In behaviour between tha two types of power changa can ba explained by tha fact that, during powar lncreaaa, tharaal ixpanalon lnducea cracka in tha outer part of tha fuel, not very far fro* tha gap where tha FOe ara collected, while during a powar decreaae, it Is tha central part of tha fuel which cracka by tharaal contraction. Collection by tha sweeping gaa la then such sore difficult, This acheae of fuel fracture la consistent with tha Incraaaa in fual rod conductance •entioned in 3.1.
4. COHCLUSIONS
riasion gaa releaaa waa aeasured on a high burn up fuel rod, during power transients. It has been shown that FOR during a transient is aoatly due to the release aaaoclatad with powar change (lncreane or decrease) and not by the increase to high power.
These releases ara explained by fuel fracture during thersal cycles, tha long-lived fission gaaas ara released by opening of the gra.in boundary bubblaa along lntergranular cracka.
Nuaerous power transients lead to a Halted iocrnaae In atendy stata ran.
This prograaaa la to ba coapleted by a sisllar analysis on 11 vary high burn up fual rod. This experleant is planned for the near future.
ACKNOWLEDGEMENTS
Spacial thanks art givan to C. Bauduaaaau. C. rriboulat and J.J. Abassin for tachnical assiatance during tha couraa of thla HorK.
REFERENCES
1 J.R.C. KTTIN - IAEA specialists' easting on ponar raaplng and cycling bahaviour of uatar r+actor fuals. 8-9 Sapt. 1982 -INGFQT/U
2 IAEA tachnical coaaittaa aaating on <ual rod internal chaalatry and fiaaion products bahaviour. KFK Karlaruha. 11-15 Nov. 198S -IHGTTT/25
3 IAEA tachnical coaaittaa aaating on fual rod intarnal cheeiatry and fisaion products bahaviour. KFK Karlaruha. 11-15 Nov. 198S -pp 89, 108. 131.
4 Praaant aaating. Papar by FRIBOULET £ ROCHX.
5 0. BARON. B. NOUDAIIXE. H. TROTABAS, A. RAYBAUD. Exparianca on fission gas relase in high burn up fual rods oparatirvg in po«ar plants.121 p. 82.
6 0. PARRAT. Ecoulaaant dans las dafauts da gainaqa das coabuatiblas REP. INPG Thasis. Granobla, Franca. Oct. 1983.
7 M. CHARLES. J.J. ABASSIN. D. BARON. H. BRUET. P. MELIN. Utilization of 'CONTACT" axpariaants to iaprova tha fission gas ralaasa knowladga in PVR fual rods, IAEA spacialita' aaating on aatar raactor fual alaaant parforaanca coaputar aodalling, Praston, UK. (March 15-19, 1982) IAEA Raport, IWGTPT/13, 441.
37
1AEA-TC-424/13
INVESTIGATION OF PARAMETERS AFFECTING WER-TVPE FUEL BEHAVIOUR UNDER TRANSIENT CONDITIONS
V.V. NOVIKOV, Yu.K. BIBILASHVIUJ. IS. GOLOVNIN All-Union Scientific Research Institute of Inorganic Materials
V.M. SHCHAVELIN, Yu.V. BOZHKO, A.M. BOLOBOLICHEV Moscow Engineering and Physical Institute
Moscow, Unions of Soviet Socialist Republics
Abstract
The experience gained from the operation of water cooled reactor oorea and studies into the problems related to their reliability made it possible to •etabllah that the gravest cause limiting the fuel serviceability la a thermal-mechanical interaction between dioxide fuel and zirconium alloy clad. Thla problem has long been urgent due to the steady quest for increased burn-up, increased fuel cycle and NFP operation under load follow conditions. The studies established the main regularities of fu*l failure due to a fuel-clud interaction involving a simultaneous effect of tensile stresses and agreaaive fission productu on a clad. In addition to the rate of a power rise and the amount of a power ramp tensile stresses are also affected by the extent of a friotional interaction between fuel pellets and cladding. The paper presents the results of the study into the fuel-cladding friction, as well as the data on the iodine induced .tmbritt-lement of t. olad uaed to validate the fuel serviceability.
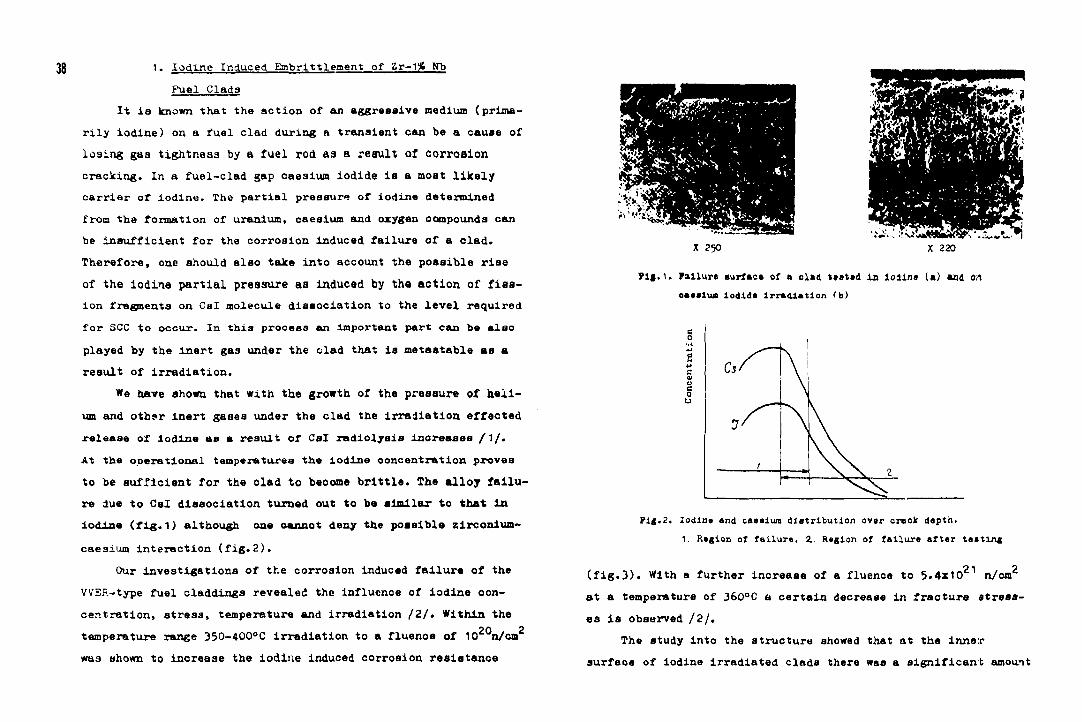
38 1. Iodine Induced Embrlttlement of Zr-1% Kb
Puel Clada It is known that the action of an aggressive medium (prima
rily iodine) on a fuel clad during a transient can be a cause of losing gaa tightness by a fuel rod as a result of corrosion cracking. In a fuel-clad gap caesium iodide is a most likely carrier of iodine. The partial pressure of iodine determined from the formation of uranium, caesium and oxygen compounds can be Insufficient for the corrosion induced failure of a clad. Therefore, one should also take into account the possible rise of the iodine partial pressure as induced by the action of fission fragments on Csl molecule dissociation to the level required for SCC to occur. In tola process an Important part can be also played by the inert gas under the clad that is metastable as a result of irradiation.
We have shown that with the growth of the pressure of helium and othsr inert gases under the clad the irradiation effected release of iodine as a result of Cel radiolyeia Increases / 1 / . At the operational temperatures the iodine concentration proves to be sufficient for the clad to become brittle. The alloy failure due to Csl dissociation turned out to be similar to that in iodine (fig.1) although one oannot deny the possible zirconium-caesium interaction (fig.2).
Our investigations of the corrosion Induced failure of the VVSR-type fuel claddings revealed the influence of iodine concentration, stress, temperature and irradiation / 2 / . Within the temperature range 350-40O°C irradiation to a fluence of 10 n/ca was shown to increase the iodine induced corrosion resistance
X 250 X 220
rig.i. Failure surface of n ol»d ttated In loilna (a) and on ceealun Iodide Irradiation <b)
!
C$f \
7 '
1 V. V i x ^ "
fig.2. Iodine and oaeaiura dis tr ibut ion over crack dapth. 1. Region of f a i l u r e . Z. Region of fa i lure a f ter taating
( f i g . 3 ) . With a further increase of a fluence to 5 .4x10 2 1 n/cm2
at a temperature of 360°C a certain decrease in fracture s tresses i s observed / 2 / .
The study into the structure showed that at the inner surface of iodine irradiated clada there was a s igni f icant amount
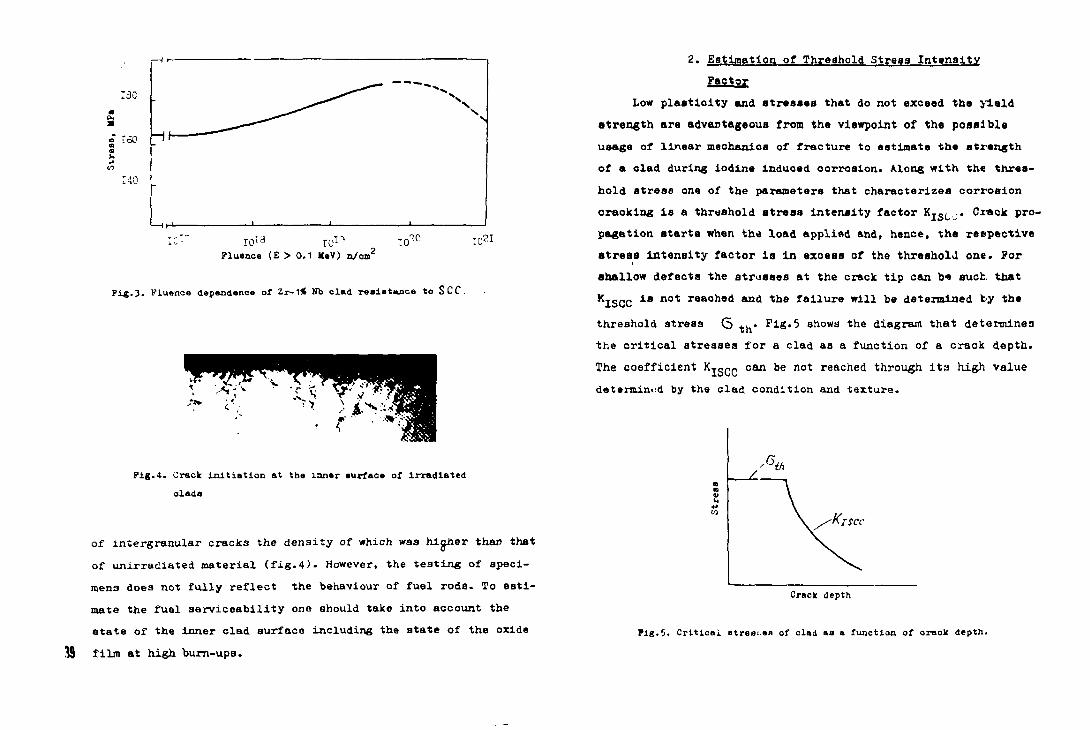
I3C
a ISO
Pluence <E > 0.1 MeV) n/cn
Pig.3. Fluence dependence of Zr-1< No clad resistance to SCC.
Pig.4. Crack Initiation at the inner aurface of Irradiated oleda
of intergranular cracks the density of which waa hiaher than that of unirradiated material (fig.4). However, the testing of specimens does not fully reflect the behaviour of fuel rode. To estimate the fuel serviceability one should take into account the atate of the inner clad surface including the state of the oxide
39 film at high burn-upa.
2. Estimation, of Threshold Stress Intensity Factor
Low plasticity and stresses that do not exceed the yield strength are advantageous from the viewpoint of the possible usage of linear meohanlos of fracture to estimate the strength of a olad during iodine Induced oorroaion. Along with the threshold stress one of the parameters that characterizes corrosion oraoking is a threshold stress intensity factor K i s t .. Crack propagation starts when the load applied and, hence, the respective stress intensity factor is in exoeas of the threshold one. For shallow defects the stresses at the crack tip can be such that KISCC i s n o t r 8 a c n e d a n d the failure will be determined by the threshold stress G ..v.* Fig.5 shows the diagram that determines the critical stresses for a clad as a function of a crack depth. The coefficient K ^ ™ can be not reached through its high value determined by the clad condition and texture.
Crack depth
Pig.5. Critical atresi.en of clad aa a function of oraok depth.
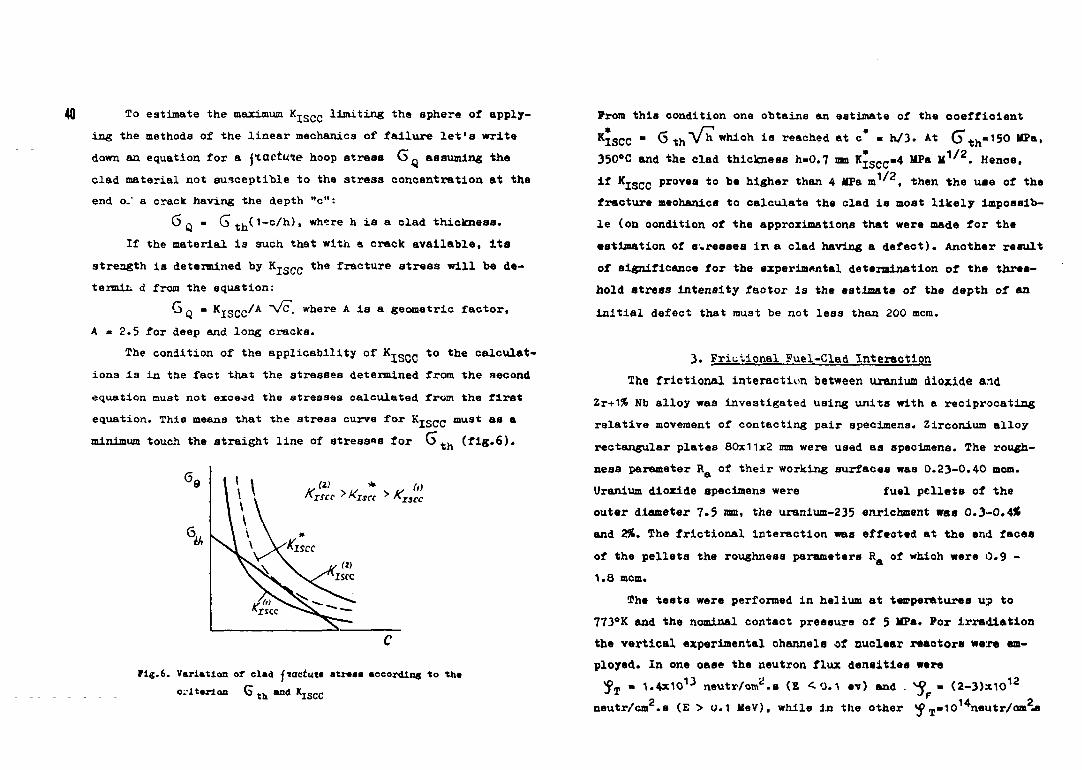
4Q To estimate the maximum K I S C C limiting the sphere of applying the methods of the linear mechanics of failure let's write down an equation for a jxacttne hoop stress G „ assuming the clad material not susceptible to the stress concentration at the end o ' a crack having the depth "c":
(3 Q » G ^yX^-o/h), where h is a clad thickness. If the material is such that with a crack available, its
strength is determined by K I S C C the fracture stress will be de-termix. d from the equation:
G •,/A vC. where A is a geometric factor. ' Q " "MSCC A = 2.5 for deep and long cracks.
The condition of the applicability of K.... to the calculations la in the fact that the stresses determined from the second equation must not exceed the stresses calculated from the first equation. This means that the stress curve for K ISCC must as a minimum touch the straight l ine of stresses for 6 t h ( f i g . 6 ) .
Pig .6 . Variation of clad jtactui* atraaa according t o tha
o.M tartan G t h and K I S C C
Prom this condition one obtains an estimate of the coe f f i c i ent KISCC " 6 th
which is reached at c - h/3. At G\ n«150 ID?*. 350°C and the clad thickness h=0.7 mm Kj S C C-4 MPa M 1^ 2. Hence, If K I S C C proves to be higher than 4 MPa m ' , then the use of the fracture mechanics to calculate the clad is most likely impossible (on condition of the approximations that were made for the estimation of a.reases I D a clad having a defect). Another result of significance for the experimental determination of the threshold stress intensity faotor is the estimate of the depth of an initial defect that must be not less than 200 mem.
3. Friutional Fuel-Clad Interaction The frictional interaction between uranium dioxide and
Zr+1% Nb alloy was investigated using units with a reciprocating relative movement of contacting pair specimens. Zirconium alloy rectangular plates 80x11x2 mm were used as specimens. The roughness parameter R of their working surfaces was 0.23-0.40 mom. Uranium dioxide specimens were fuel pellets of the outer diameter 7.5 mm, the uranium-235 enrichment was 0.3-0.4% and 2%. The frictional interaction was effected at the end faces of the pellets the roughness parameters R of which were 0.9 -1.8 mem.
The tests were performed in helium at temperatures u,? to 773°K and the nominal contact pressure of 5 MPa. For irradiation the vertical experimental channels of nuclear reactors ware employed. In one oaee the neutron flux densities were ^>T . 1.4X10¹³ neutr/cm2.s (E <0.1 ev) and . - (2-3)x1012
neutr/cm2.s (E > 0.1 MeV), while in the other ^ T"l014neutr/om2.B
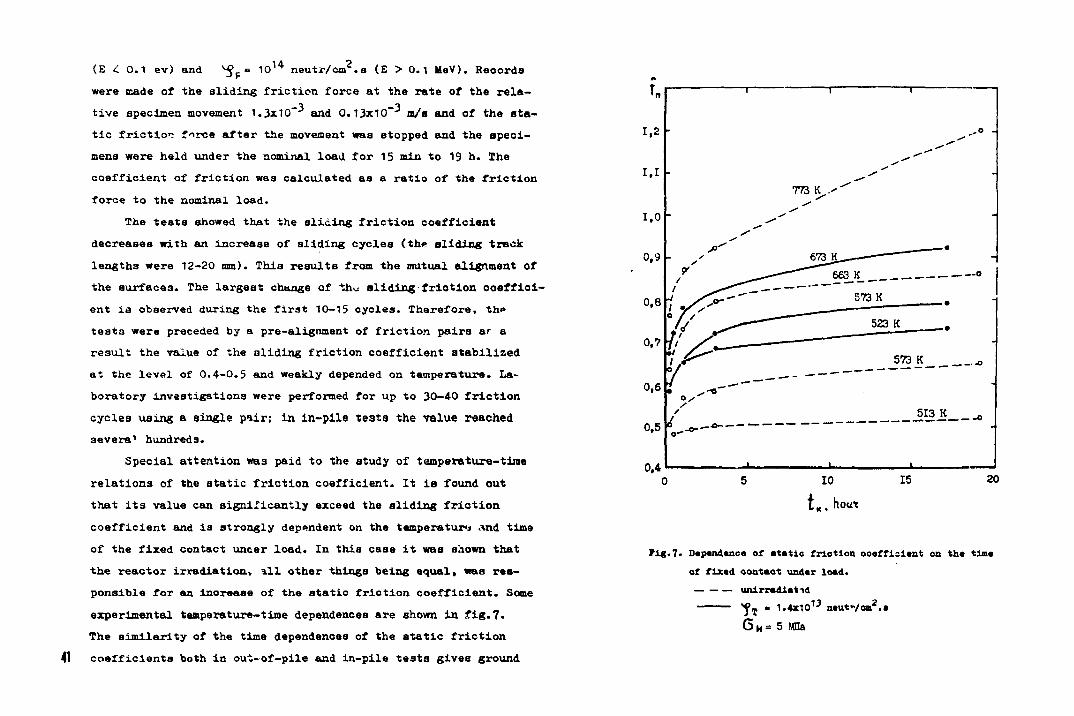
(E <C 0. 1 ev) and ^ p = 1 0 neutr/cm .a (E > 0. 1 MeV). Records were made of the sliding friction force at the rate of the rela-
—3 —3 tive specimen movement 1.3x10 and 0.13x10 m/s and of the static friction force after the movement waa stopped and the specimens were held under the nominal load for 15 mln to 19 h. Ihe coefficient of friction waa calculated as a ratio of the friction force to the nominal load.
The tests showed that the sliding friction coefficient decreases with an increase of sliding cycles (the sliding track lengths were 12-20 mm). This results from the mutual alignment of the surfaces. The largest change of *.ii^ sliding friction coeffioi ent ia observed during the first 10-15 cycles. Therefore, th«» testa were preceded by a pre-alignment of friction pairs ar a result the value of the sliding friction coefficient stabilized at the level of 0.4-0.5 and weakly depended on temperature. Laboratory investigations were performed for up to 30—40 friction cycles using a single piir; in in-pile testa the value reached severs1 hundreds.
Special attention waa paid to the study of temperature-time relations of the static friction coefficient. It ia found out that its value can significantly exceed the sliding friction coefficient and is strongly dependent on the temperature .uid time of the fixed contact uncer load. In this case it was shown that the reactor irradiation, all other things being equal, was responsible for an increase of tha static friction coefficient. Some experimental temperature-time dependences are shown in fig.7. The similarity of the time dependences of the static friction
41 coefficients both in out-of-pile and in-pile teats gives ground
Fig.7. Dapandance of atatic friction ooeffisient on tha tina of fixed contact undar load.
unirradiated "Jx - 1.4x10¹³ neuWo»*.« 6 H = 5 MOa
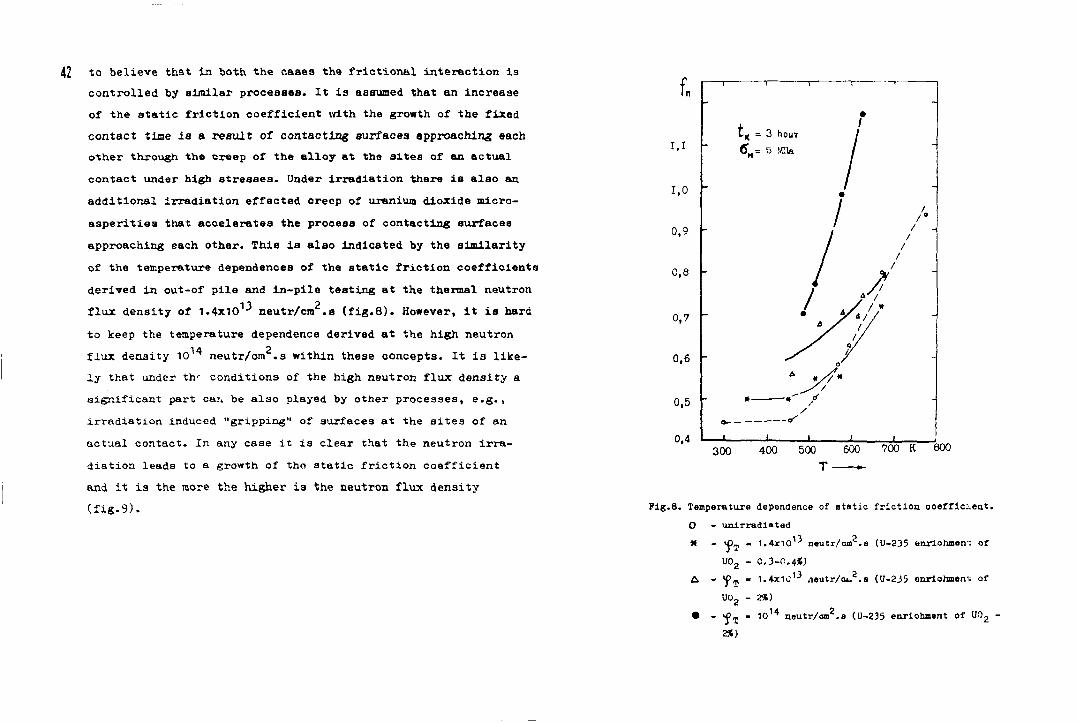
42 to believe that in both the cases the frictional interaction is controlled by similar proceases. It is assumed that an increase of the static friction coefficient with the growth of the fixed contact time is a result of contacting surfaces approaching each other through the creep of the alloy at the sites of an actual contact under high stresses. Under irradiation there is also an additional irradiation effected creep of uranium dioxide micro-asperities that accelerates the process of contacting surfaces approaching each other. This is also indicated by the similarity of the temperature dependences of the static friction coefficient
derived in out-of pile and in-pile testing at the thermal neutron 11 2 flux density of 1.4x10 J neutr/cm .8 (fig.8). However, it is hard
to keep the temperature dependence derived at the high neutron flux density 10 * neutr/om .a within these concepts. It is likely that under th r conditions of the high neutron flux density a significant part can be also played by other proceases, e.g. , irradiation induced "gripping" of surfaces at the sites of an actual contact. In any case it is clear that the neutron irradiation leads to a growth of the static friction coefficient and it is the more the higher is the neutron flux density Cfig.9).
I.I
1,0
0,9 f
0,8
0,7
0,6
0,5
0,4
L^ = 3 hout
300 400 500 600 700 K 800 T -
Fig.8. Temperature dependence of static friction coefficient. O - unirradiated M - <£„, . 1.4x10,•3 neutr/ca2.e (U-235 enriohmerr: of ?T
U0 2 - 0 .3-0.4*)
A - f q, - 1.4JCIC1-3 neutr/ow 2 .a (U-235 enrichmenn of
U0 2 - 2*)
• - «£ T . i o 1 4 neutr/cm 2 .a (U-235 enrichment of U0 2
2%)
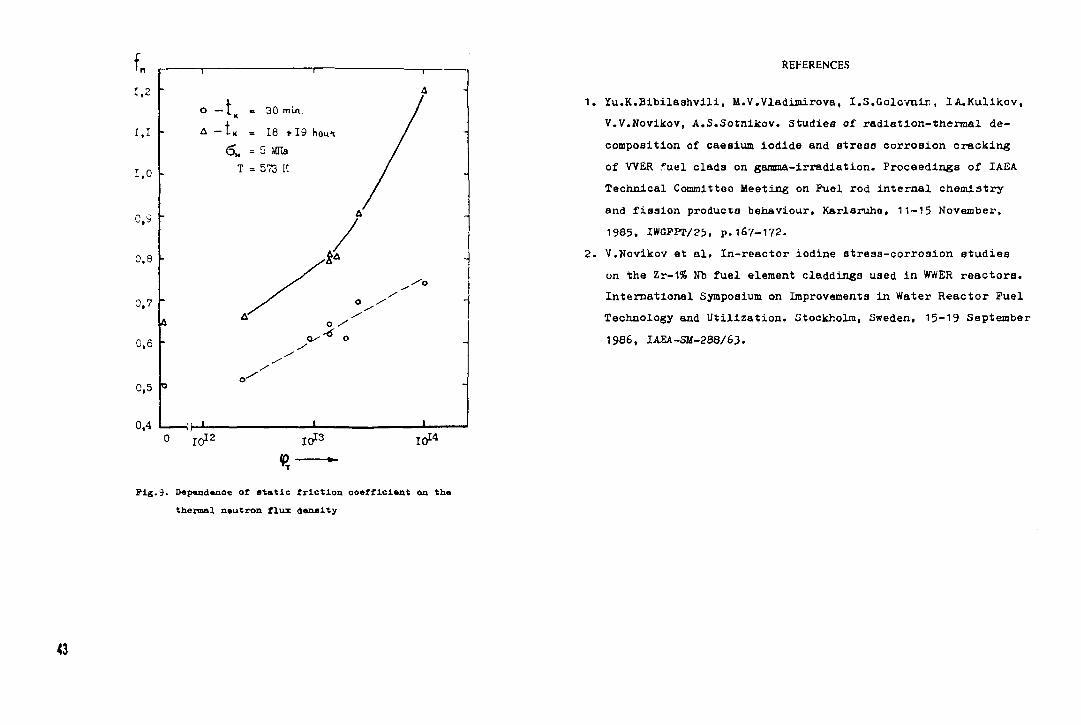
• n
1.2 o
1
—1„ - 30 mln.
1
A -
I . I A - t K = 18 1-19 houi <5„ = 5 JGIa
-
1,0 - T = 573 K -
0,9 A
/ -
0,8 / -
0.7
0,6
0,5
&
o
0 -"
s / ^°
-
0,4 - fh , • l . _
0 1 0I2 IO 1 3 IO 1 4
Pig.9. D«p«nd«noe of atatic friction coefficient on th« thermal neutron flux density
43
REFERENCES
1. Yu.K.Bibilaahvill, M.V.Vladimirova, I.S.Golovnlrj, IA,Kulikov, V.V.Novikov, A.S.Sotnikov. Studies of radiation-thermal decomposition of caesium iodide and stress corrosion cracking of WER fuel clads on gamma-irradiation. Proceedings of IAEA Technical Committee Meeting on Fuel rod internal chemistry and fission products behaviour, Karlsruhe, 11-15 November, 1985, IWGFPT/25, p.167-172.
2. V.Novikov at a l . In - reac to r iodine a t resa-cor ros ion s t u d i e s
on the Zr-1% Nb fuel element claddings used in WWER r e a c t o r s .
In te rna t iona l Symposium on Improvements in Water Reactor Fuel
Technology and U t i l i z a t i o n . Stockholm, Sweden, 15-19 September
1986, IAEA-SM-288/63.
lAEA-TC-«4/16
44 MECHANICAL BEHAVIOUR OF LWR FUEL ROD CLADDING DURING LOAD FOLLOW AT HIGH BURNUP (Summary)
J. VAN VLIET, D. HAAS Belgonucleaire SA, Brussels, Belgium
In various countries like Belgium, the nuclear electricity generation I3 characterized by two basic trends : 1. due to their substantial share in the overall electricity
production, the nuclear units are Increasingly used In the load follow mode : this is practically the case when the nuclear share exceeds 35 to 40 7, as It ts the case In Sweden (40 3!), In Japan (25 X but more than 40 X In some regions of the country), la Finland (40 X) , and obviously In Belgium (65 J) or in France (70 X) ;
2 . in order to reduce the uncertainties associated with fuel disposal and to take benefit of the low uranium and enrichment costs, the discharge burnup and the residence time of the fuel elements are sceadlly increasing : the present R&D programmes for LWR fuel are aiming at Increasing reload burnup from 30 - 35 GWd/t up to 4S - 55 GWd/t within the next 10 years.
This Increase in fuel performance requirements leaus to the reconsideration of some past reliability problems and to the need of answering new questions raised mainly by the higher burnup.
1. pellet-cladding mechanical interaction (PCMI) was observed in the past to be the major contribution to fuel rod failures ; as the pellet-cladding contact pressure continuously increases with burnup due to the fuel swelling, higher burnup is expected to enhance the PCMI phenomena which are presently attenuated to a large extent by fuel element reshuffling policy ;
2. the cladding properties are significantly modified by the Irradiation ; a major concern in that respect is the cladding outer corrosion. Under the Influence of temperature and fast neutron irradiation, the Zircaloy becomes Increasingly sensitive to waterside oxidation : the relatively low thermal conductivity of the resulting zirconia layer increases the cladding temperature, thereby catalyzing further oxidation ; the sound cladding thickness reduction is mainly expected to modify Its bending properties ;
3. further modifications ore expected in the uranium oxide itself, mainly the progressive degradation of thermal conductivity : this corresponds to an Increase of temperature at constant power, so that the effect of power changes on fvjel thermal expansion is expected to become more pronounced at higher burmip.
These potential problems raise some concern a' out the mechanical behaviour of the fuel elements when the lattfc* are submitted to \ariable loads at high burnup. These varl.'ble loads may be related to various types of load follow operation, depending on the utility electricity production policy. A given reactor unit -nay be operated in e.g. a dally or a weekly load follow. Furthermore, operation for some time at reduced power may result from the availability of some plant components. In that case, the question has to be raised of the rate of return to full power. The Identification of the loading mode of the fuel rod cladding during repeated power changes is therefore considered as a first step for the quantification of the cladding behaviour with respec: to low cycle fatigue.
The first question addressed is that of the stability of the axisymmetrlc configuration of the ceramic pellet stack Inside the cylindrical cladding tube, as a functlor of the linear power. This configuration is predicted to be unstable, and the pellet stack Is thus expected to be in contact with the cladding. The ln-pile strain measurements are found consistent with an helical configuration leading to cladding ovalization.
In a sectnd step, a single cladding cross-section is analysed by means of a thin shell model, taking into account the creep rate of the material. This model is validated against creepdown and ovalization dat«. It shows that the ovalizatlon proceeds much faster then the creepdown, so that significant strains can be accumulated In time scales typical of reactor load follow.
The process of load follow can then be described by an Increase of ovallzatlon after pover reduction, followed by bending stresses when returning to full power : th<; latter stresses which occur at the oval major axis may lead to fatigue crack propagation in presence of corrosive fission products. The influence of load follow is expected to be enhanced by cladding corrosion, as the latter increases ovalization rate through thickness reduction as well as temperature Increase
IAEA-TC-624/18
SUSTAINED FATIGUE OF ZIRCALOY-4 CLADDINGS — NON-IRRADIATED MATERIAL
P. LEMOINE, L. DARCHIS, J. PELCHAT Institut de recherche technologique et de
développement industriel, Commissariat à l'énergie atomique, Lyon
J.-P. MARDON Fragéma (Framatome Division Combustible), Lyon M. GROSGEORGE Service Etudes et projets thermiques
et nucléaires, Electricité de France, Villeurbanne
France
Abstract
Trie adaptation of PWR operating conditions to futur» plant conditions makes it necessary to anticipate the impact of load follow and frequency control on fuel performance. Tftu is why FGA. EOF and CEA nave launched an extensive qualification program covering the fatigue and fatigue-creep characterization of the cladding material (stress-relieved Zyi ) .
A device simulating load cycling of heated cladding portions was developed as part of this program. The claddings were subjected to fatigue at 350"C 6y the repeated action of internal pressure.
The sustained fatigue curve and the endurance limit at 10 cycles were thus determined for the chosen frequency lf=0.5Hz). The results, corrected by the oiaxiality effect, are consistent with those hitherto published for monoaxial fatigue.
A-other important improvement was made in the interpretation of the scatter of fatigue results : the fatigue resistance of the tested claddings can be correlated with tneir creep resistance. This »ans that even a'; this frequency there is interaction between fatigue and creep.
f. INTRODUCTION
The growing share of nuclear power in total French electricity output has called for the adaptation of Pressurized Water Reactors to grid demand variations and accordingly to the load follow and frequency control operating modes.
To evaluate the impact of these new operating modes on fuel behaviour FGA. EOF and CEA have launched a large-scale qualification program featuring :
- design calcula ions for evaluating fuel stress levels under these conditions,
- test programs including overall qualification aiti and different analytical tests,
- cycle campaigns in Power Reactors,
- data acquisition programs on clad material behaviour under load cycling conditions : Materials program.
The main aim of this materials program is to determire the endurance limits and to qualify a cumulative functior in a fatigue-creep interaction situation.
It is based on the performance of standard fatigue and creep tests and cumulative tests combining both damage modes.
It covers several 2ircaloy-t grades Irecrystallized, stress-relieved...) and invnlves the use of solid samples and tubular specimens.
The results obtained with solid samples, especially fcr the recrystallized grade, lave been given elsewhere III.
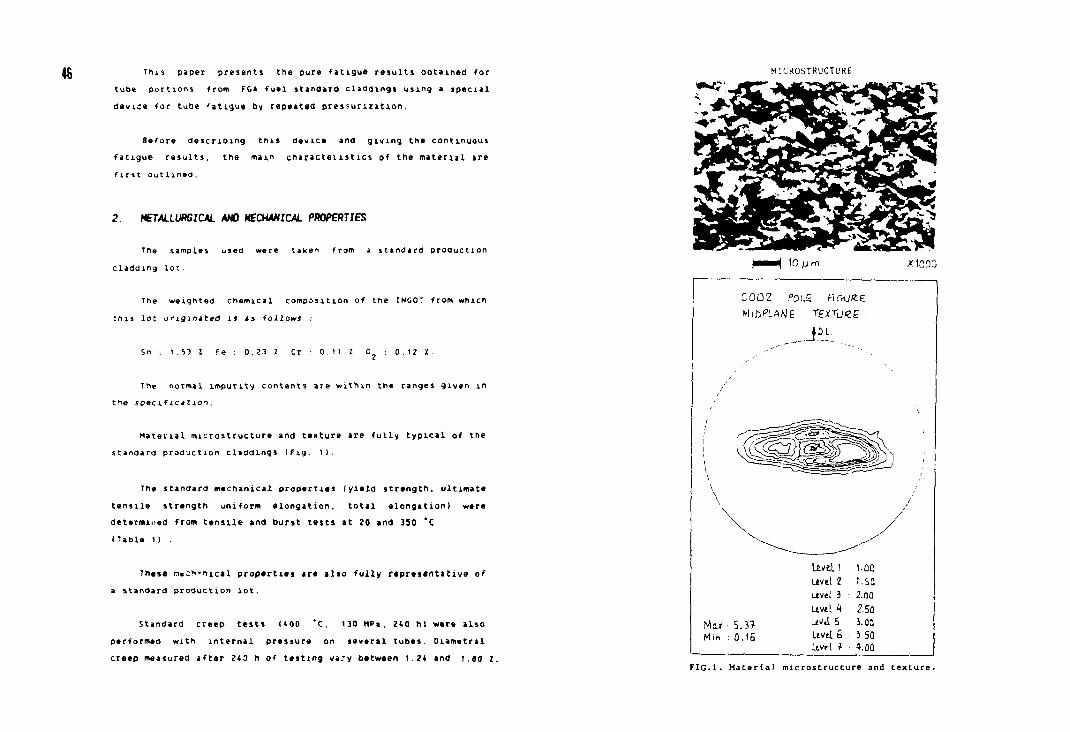
This piper presents the pure fatigue rasults obtained for tube portions from FGA fuel standard claddings using a special device for tube 'atigue by repeated pressurization.
Before describing this device and giving the continuous fatigue results, the main charactei utics of the material are first out lined.
2. METALLURGICAL AND MECHANICAL PROPERTIES
The samples used were taken from a standard production cladding lot.
The weighted chemical composition of the INGOT from which this lot originated n as follows :
Sn : 1.53 Z Fe : 0.23 Z Cr : 0.11 Z 0 i 0.12 1.
The normal impurity contents are within the ranges given in the specification.
Material microstructure and texture are fully typical of the standard production claddings (Fig. 1).
The standard mechanical properties (yield strength, ultimate tensile strength uniform elongation. total elongation) were determined from tensile and burst tests at 20 and 350 *C (Table 1) .
These occ^-nical properties are also fully representative of a standard production lot.
Standard creep tests (400 *C. 130 MPa, 240 hi were also performed with internal pressure on several tubes. Diametral creep measured after 243 h of testing va:y between 1.24 and 1.80
46 MICROSTRUCTURE
10 nm
C0Q2 ,°2L£ FlGUfLE MiSPLAME TEHTUHE .
Max S.J? Mm . O.fS
Level 1 1.0Q Levtl 1 t.SQ Level 3 2.00 Live I k 2.5a UVj 5 3. oa L tM t6 350 Uvel * 4.00
X1Q00
FIG.l. Materia) microstructure and texture.
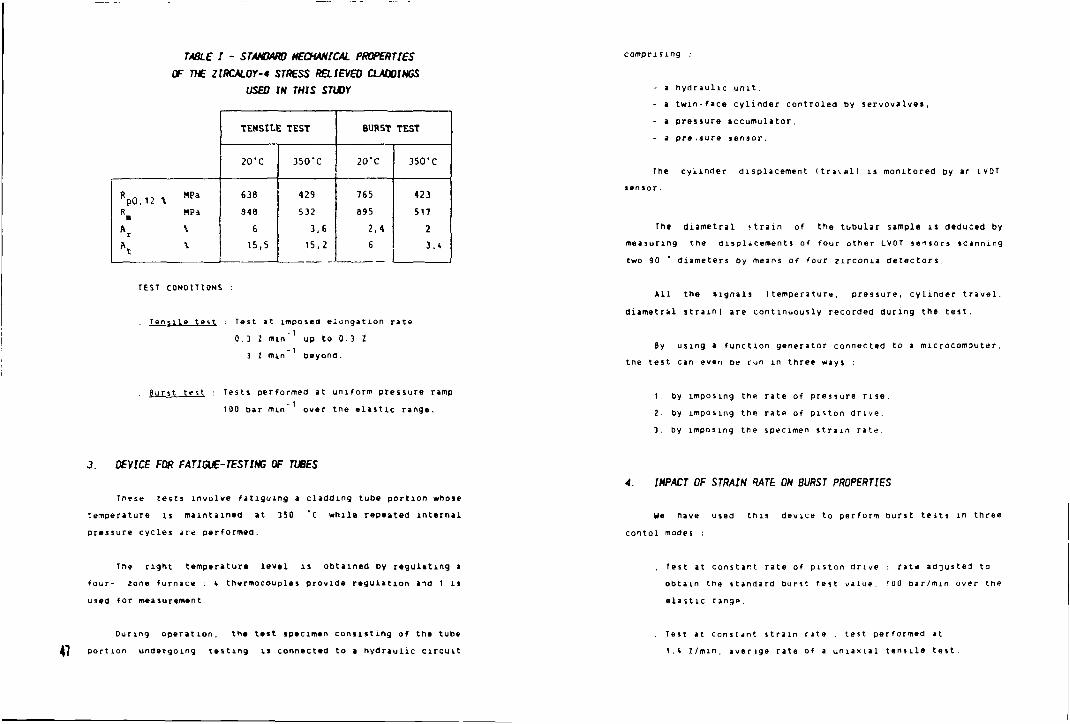
TABLE I - STANDARD MECHANICAL PROPERTIES
OF THE ZlRCALOY-4 STRESS RELIEVED CLADOINGS
USED IN THIS STUDY
TEHSII.E TEST BURST TEST
20'C 35CTC 20"C 350-C
R p O , 1 2 \ M P d
R B NPa
A r \
636
348
6
15 ,5
429
532
3 , 6
1 5 , 2
765
895
2 ,4
6
423
517
2
3 . *
TEST CONDITIONS
Tensile test : Test at imposed elongation rate 0.3 2 nun up to 0.3 2
3 2 m m beyond.
Burst test : Tests performed at uniform pressure ramp 100 Bar rain over the elastic range.
3. DEVICE FOR FATIGUE-TESTING OF TUBES
These tests involve fatiguing a cladding tube portion whose temperature is maintained at 350 *C while repeated internal pressure cycles are performed.
The right temperature level is obtained by regulating a four- zone furnace 4 thermocouples provide regulation and 1 is used for measurement.
During operation. the test specimen consisting of the tube 47 portion undergoing testing is connected to a hydraulic circuit
comprising :
- a hydraulic unit, - a twin-face cylinder controled by servovalves, - a pressure accumulator, - a pre.jure sensor.
The cylinder displacement (travail is monitored by ar LVDT sensor.
The diametral ftrain of the tubular sample is deduced by measuring the displacements of four other LVOT sensors scanning two 90 " diameters by means of four z i r c o m a detectors.
All the signals (temperature, pressure, cylinder travel. diametral strain) are continuously recorded during the test.
8y using a function generator connected to a microcomsuter, the test can even be run in three ways
1. by imposing the rate of pressure rise, Z. by imposing the rate of piston drive, 3. by imposing the specimen strain rate.
A. IMPACT OF STRAIN RATE ON BURST PROPERTIES
We have used this device to perform Burst tests in three contol modes :
. Test at constant rate of piston drive : rate adjusted to obtain the standard burst test value, 100 b a r / m m over the elastic range.
Test at constant strain rjte ; test performed at 1.4 7./min, averige rate of a uniaxial tensile test.
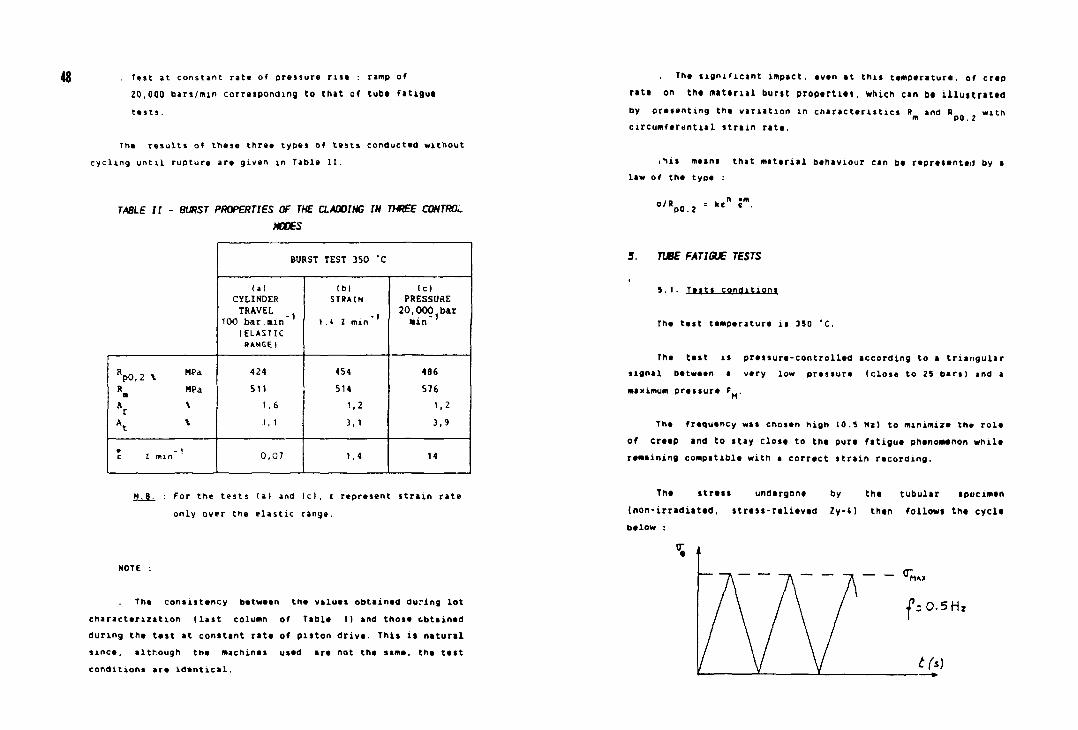
48 Test at constant rate of pressure rise : ramp of 20,000 oars/min corresponding to that of tub* fatigue tests.
The results of these three types of tests conducted without cycling until rupture are given in Table II.
TABLE II - BURST PROPERTIES OF THE CLAMING IN TWEE CONTROL
MOOES
BURST TEST 350 *C
(a) CYLINDER TRAVEL
100 bar.»in (ELASTIC RANGE)
(t>) STRAIN
1.V Z min
(c) PRESSURE 20,000 bar •in
RDO,2 \ "»*
A \ r
424 511
1,6 J. 1
454 514
1,2 3,1
406 576
1,2 3,9
e I min 0,07 1.4 14
N. 8. : For the tests (a) and Id, e represent strain rate only over the elastic range.
NOTE :
The consistency between the values obtained during lot characterization (last column of Table I) and those obtained during the test at constant rata of piston drive. This ii natural since, although the machines used are not the same, the test conditions are identical.
The significant impact, even at this temperature, of crep rate on the material burst properties, which can bt illustrated by presenting the variation in characteristics R and R with
m po. 2 circumfernntial strain rate.
.'iis means that material behaviour can be represented by a law of the type :
5. TUBE FATIGUE TESTS
5.1. Tests conditions
The test temperature is 350 *C.
The test is pressure-controlled according to a triangular signal between a very low pressure (close to 25 bars) and a maximum pressure F .
The frequency was chosen high 10.5 Mi) to minimize the role of creep and to stay close to the pure fatigue phenomenon while remaining compatible with a correct strain recording.
The strait undergone by the tubular ipucimen (non-irradnted, stress-relieved Zy-4) than follow* the cycle below :
%
^MA,
f:0.5Hi
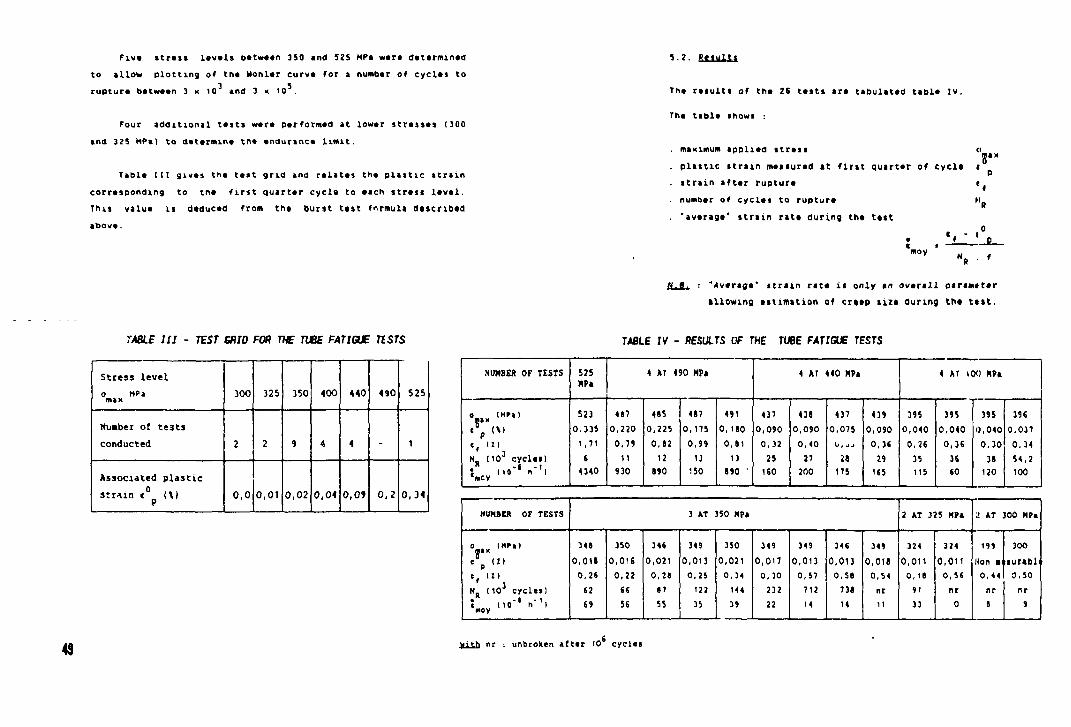
Five atrass lavals between 350 and 525 MPa were determined to allow plotting of the Wohler curve for a number of cycles to rupture between 3 x 10 and 3 x 1 0 .
Four additional tests were performed at lower stresses 1300 and 325 HP*) to determine the endurance limit.
Table lit gives the test grid and relates the plastic strain corresponding to the first quarter cycla to each stress level. This value is deduced from the burst test formula described above.
5.2. Results
The results of the 26 tests are tabulated table IV.
The table shows :
. maximum applied stress
. plastic strain measured at first quarter of cycla
. strain after rupture
. number of cycles to rupture 'average* strain rata during the test
c, -
moy
N.8. : "Average' strain rat* is only an overall parameter allowing estimation of creep siz* during th* ttst.
TABLE III - TEST GRID FOR THE TUBE FATIGUE TISTS TABLE IV - RESULTS OF THE TUBE FATIGUE TESTS
Stress level 0 HP a max 300 325 350 400 440 490 525
Number of tests conducted 2 2 9 4 4 - 1
Associated plastic strain c° (\) P 0,0 0,01 0,02 0,04 0,09 0,2 0,34
NUMBER OF TESTS 525 KPa
4 AT 490 HPa 4 AT 140 Hrl 4 AT 100 MPa
«, II)
523 447 415 417 491 437 438 437 439 395 395 395 39(
«, II) 0,335 0,220 0,225 0,175 o.ieo 0,090 0,090 0,075 0,090 0,040 0,040 0,040 0,037
«, II) 1,71 0,79 0,82 0,99 0,81 0,32 0,40 0, JJ 0,38 0,26 0,36 0,30 0,34 H R M O 3 cycles) 6 11 12 13 13 25 27 28 29 35 36 38 54,2 { no' 5 n"'l '|»CV
4340 930 S90 150 690 ' 160 200 175 KS 115 (0 120 100
NUMBER OF TESTS 3 AT 350 MPa 2 AT 325 MPa 2 AT 300 MPa
348 350 346 349 350 349 349 346 349 324 324 199 300 0,018 0,016 0,021 0,013 0,021 0,017 0,013 0,013 0,016 0,011 0,011 Hon •• surabl
« f II) 0,26 0,22 0,28 0,25 0,34 0,30 0,57 0,56 0,54 0, 18 0,56 0,44 0,50 N R (10 3 cycles) (2 66 87 122 144 232 712 738 nr 91 nr nr nr t no'" h'\ moy
69 56 55 35 39 22 14 14 11 33 0 8 9
uith nr : unbroken after 10 cycles
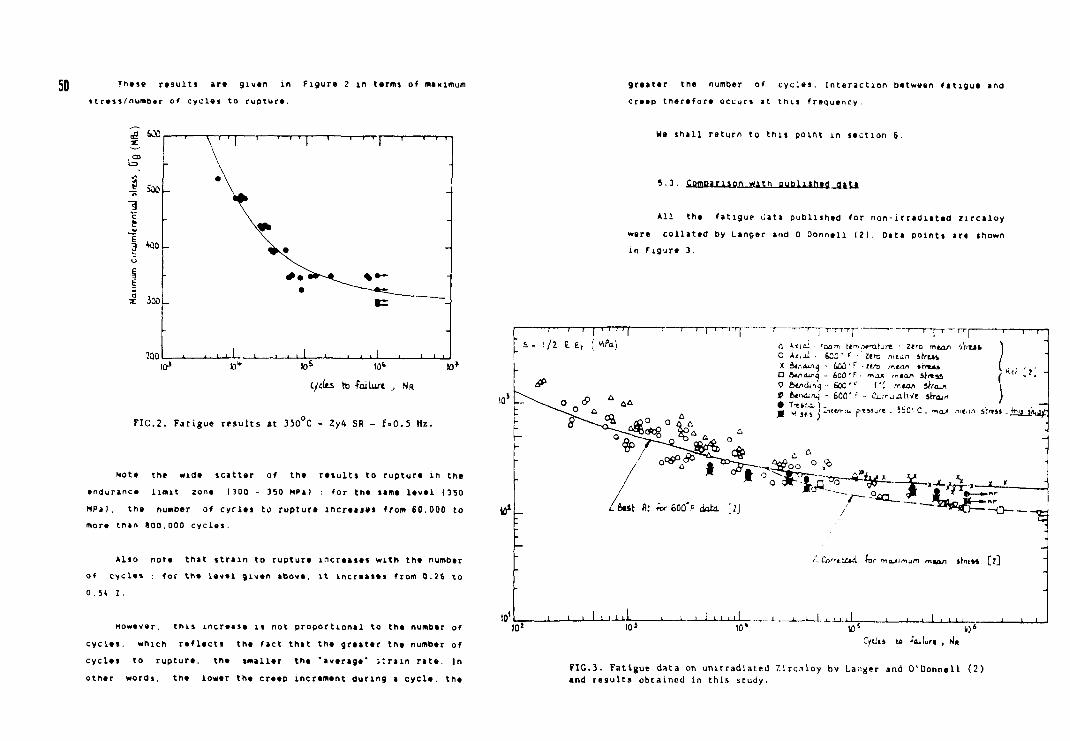
JQ These results are given in Figure 2 in terms of maximum stress/number of cycles to rupture.
"SE V T ' I > 1 1 —i—r r i - i — •! i—r—r-
_? - \ -
•1 • \
11 x^ -
| *Q0 K » -U
§ #«TW-4 L_ %«~ -
1 ioo -•
• r ~~~-
too , , , : . . 1 , , l . ... i i 11 i i i i I03
C/c(t_ to -Failure , rJ*
FIG.2. Fatigue results at 350 C - 2y4 SR - f=0.5 Hz.
Note the wide scatter of the results to rupture in the endurance limit zone 1300 - 350 MPa) : for the same level (350 HPil. the nueiber of cycles to rupture increases from 60.000 to more than 800,000 cycles.
Also note that strain to rupture increases with the number of cycles . for the level given above, it increases from 0.26 to 0.5* I.
However. this increase is not proportional to the number of cycles, which reflects the fact that the greater the number of cycles to rupture, the smaller the "average" strain rate. In other words, the lower the creep increment during a cycle, the
greater the number of cycles. Interaction between fatigue and creep therefore occurs at this frequency.
We shall return to this point in section 6.
5.3. Companion
All the fatigue >;ata published for non-irradiated zircaloy were collated by Langer and 0 Oonnell (21. Data points ar« shown in figure 3.
"TTT-T "1 ! '| 1 """Tri
_ A*i_i - rao.-n t*m,-)#ro>jre • zero mea/i sr/rss O A,ii_l - i S _ - f •' UT> nie_n i h - u i X 2*f,dmq - _ _ 0 , r - llfn mt-ui irttMA
• &_n_uiq - 600 ' F - max mta/y Strtaa 9 __-i_i*ij - U/O'" \;'. -nta* 3rr_ui \ t -_rx_ruj - 600' r .. (__.-n_ia.ive strain ) • T _&„_ ) . . . , , , ,
o 5-
*«' it'.
_>-!£
__"'«.___. ht<" maximum mtan strit__. [.J
- — 1 — L ~ i _ . l _ i - . i l _______ W 1 H«
Cftlti to -failure , >1»
FIG.3. Fatigue data on unirradiated Zlrcaloy by Langer and O'Donnell (2) and results obtained in this study.
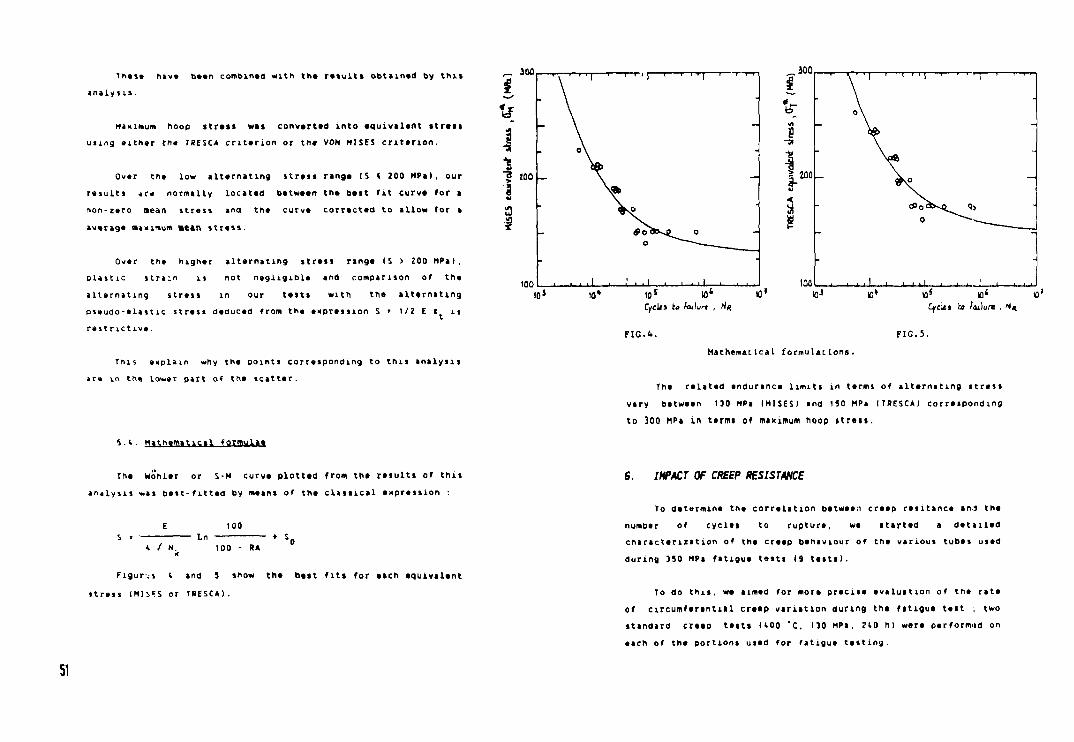
Thai* haw* been combined with tha results obtainad by thi» analysis -
Maximum hoop stress was convartad into equivalent stress using aithar tna TSESC* criterion or the VON MISES critanon.
300..
tf
Ovar tha low alternating strata rang* (S < 200 HPa), our results are normally located between the best fit curve for a non-zero aean stress and the curve corrected to allow for a average maximum Mean stress.
"3 100
I a
Over the higher alternating stress range IS > 200 MPaI, plastic strain is not negligible and comparison of the alternating stress in our tests with the alternating pseudo-elastic stress deduced from the expression S = 1/2 E « is restrictive.
Tnis explain why the points corresponding to this analysis ar« in tha lower part of the scatter.
1001 t.
•>.<.. Mathematical formulae
The wohler or S-M curve plotted from the results of this analysis was best-fitted by means of the classical expression :
E 100 Ln + S„
* / N. 100 - RA
Figur.s l and 5 show the best fits for each equivalent stress (His?s or TRESCA).
51
300 V r—r-r-rj—r- ' ' ' I r 1 1 1
- °\ -
200 — w\° _
CSoctKJJ <>> -0
=
too
"
I 1 , 1 1 1 1 . 1 .-L..J-, 1 . . i — — i . _ j . a .
10 s 10* CvcUs k« Jailut , tin
ta-> LfCiit to failure , H*
F I G . 4 . F I C . 5 .
Mathematical formulations.
The related endurance limits in terms of alternating stress vary between 130 MPa IHISESI and ISO MPa ITRESCA) corresponding to 300 MPa in terms of maximum hoop stress.
6. IMPACT OF CREEP RESISTANCE
To determine the correlation between creep resitance anj the number of cycles to rupture, we started a detailed characterization of the creep behaviour of the various tubes used during 350 MPa fatigue tests 19 tests).
To do this, we aimed for more precise evaluation of the rate of circumferential creep variation during the fatigue test ; two standard creep tests U 0 0 'C, 130 MPa. 2*0 h) were performed on each of the portions used for fatigue testing
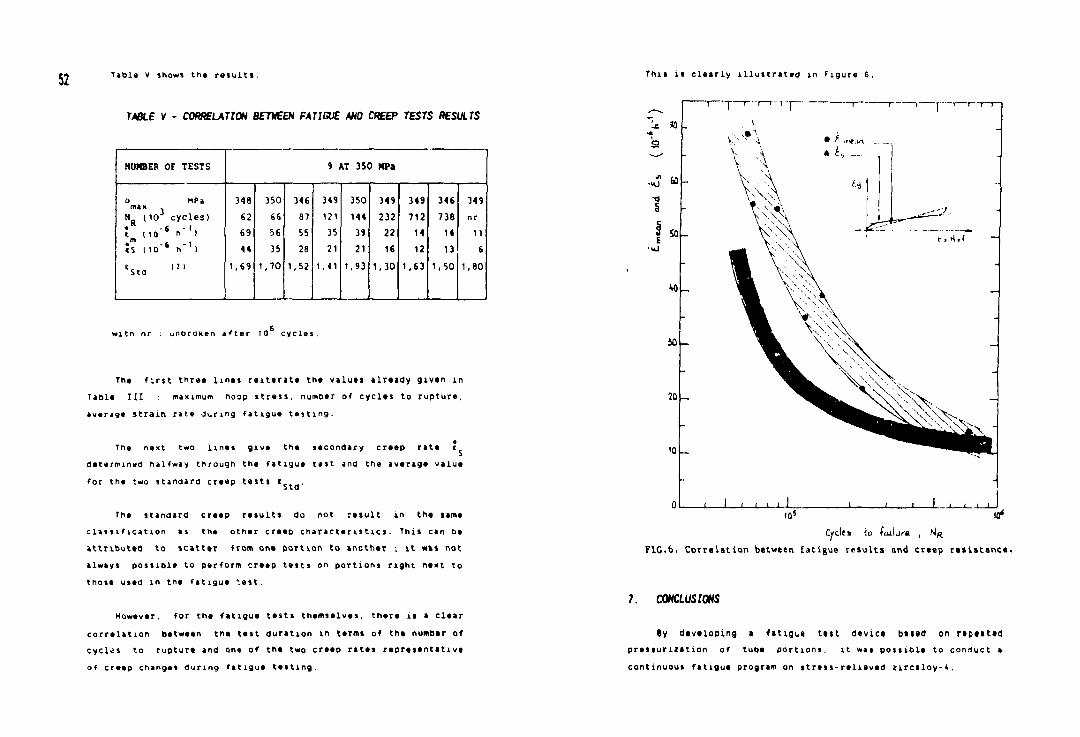
52 Table v shows the results.
TABLE V - CORRELATION BETWEEN FATIGUE AND CREEP TESTS RESULTS
NUMBER Of TESTS 9 AT 350 MPs
o MPa max . N (10 cycles)
348 350 346 349 350 349 349 346 349 o MPa max . N (10 cycles) 62 66 87 121 144 232 712 738 nr t n o » i
-S -K tS 110 h ) 69 44
56 35
55 28
35 21
39 21
22 16
14 12
14 13
11 6
*s«d , n 1,69 1,70 1,52 1,41 1,93 1,30 1,63 1,50 1,80
with nr unbroken after 10 cycles.
The first three lines reiterate the values already given in Table H I maximum hoop stress, number of cycles to rupture, average strain rate during fatigue testing.
The next two lines give the secondary creep rate c determined halfway through the fatigue test and the average value for the two standard creep tests c Std
The standard creep results do not result in the same classification as the other creep characteristics. This can be attributed to scatter from one portion to another -, it was not always possible to perform creep tests on portions right next to those used in the fatigue '.est.
However. for the fatigue tests themselves, there is a clear correlation between the test duration in terms of the number of cycles to rupture and one of the two creep rates representative of creep changes during fatigue testing.
This is clearly illustrated in Figure 6.
a
§
j so •uj
<t0
~1 i—r-r—r- r i r~—i- _ r _ T -
10
20
(0 s 10* (Vcltl to failure. , hiK
FIG.6. Correlation between fa t igue r e s u l t s and creep r e s i s t a n c e .
7. CONCLUSIONS
ty developing a fa t igue test device based on repeated
p r e s i u r i z a t i o n of tube port ions. i t was possible to connuct a
continuous fa t igue program on s t ress - re l i eved z i r c a l o y - t .
These tasts. performed at 350 *C and a frequency of 0.5 HZ, made it p o m b l i to determine tha andurance limit and S-N curve for non-irradiatad notarial.
the results, which ara close together for cycla numbers lass than 5 x 1 0 . are more scattered in the endurance limit zone.
However, they are consistent with the results published to date. It was possible to correlata this scatter with the creep resistance of the different clad portions.
This means that even at this frequency there is interaction between fatigue and creep.
REFERENCnS
1. C. RRUN - J. PELCHAT - J.C. FLOZE - M. GALIMBERTI Cumulative Fatigue and creep Fatigue daaage at 3S0 'C on recrystallized V, 4 7th Zirconium in Nuclear Industry Syvposiua STRASBOURG Juin 1985 USTM STP 939]
2, O'DONNEL w.j. and LANCER B.F. Fatigue Design basis for Zircaloy Components Nuclear Science and Engineering 20, 1964. p 1 -12

POWER RAMPING AND POWER CYCLING DEMONSTRATION PROGRAMMES IN RESEARCH RE/ CTORS
(Session II)
Chairmen
M. GROUNES Sweden
M. MOREL France
5 5 / 5 f c
IAEA-TC-624/21
COMBINED UTILIZATION OF BR3 AND BR2 REACTORS FOR POWER RAMPING AND CYCLING TESTS OF HIGH BURNUP FUEL RODS
F. MOTTE Centre d'etude de l'energie nucleaire (CEN/SCK), Mol D. HAAS Belgonucteaire SA. Brussels
Belgium
Abstract
The BR3 pressurized water reactor and the BR2 material testing reactor are both located on the site of the Belgian Nuclear Research Centre at Mol (Belgium).
Because of this favourable feature and due to the great technical flexibility of both irradiation facilities as far as irradiation performance is concerned, many experimental prograi^es aimed at the qualification of advanced PWR fual are being conducted. They are either performed on a national basis or sponsored by foreign organizations including fuel vendors, utilities and research laboratories, in the frame of international collaborations or bilateral agreements.
The report presents the main characteristics of BR3 and 3R2: the first reactor is used for testing in a broad spectrum of irradiation conditions ana histories the fuel behaviour up to high burn-up and the latter for performing power ramping and cycling experiments on some representative fuel pins at increasing burn-uo levels, as made available at the end of each BR3 irradiation campaign. More emphasis will be put on the objectives and experimental features of the most recently performed ramp tests and on
57 the cycling tests.
1 . INTRODUCTION
The BR3 p r e s s u r i z e d w a t e r r e a c t o r and t h e BR2 m a t e r i a l t e s t i n g r e a c t o r a r e b o t h l o c a t e d on t h e s i t e of t h e B e l g i a n N u c l e a r R e s e a r c h C e n t r e a t Mol ( B e l g i u m ) .
B e c a u s e of t h i s f a v o u r a b l e f e a t u r e and due t o t h e g r e a t t e c h n i c a l f l e x i b i l i t y of b o t h i r r a d i a t i o n f a c i l i t i e s a s f a r a s I r r a d i a t i o n p e r f orraar.-e i s c o n c e r n e d , many e x p e r i m e n t a l p rogrammes a i m i n g a t t h e q u a l i f i c a t i o n of a d v a n c e d PWR f u e l a r e b e i n g c o n d u c t e d . '. ^ y a r e e i t h e r pe r fo rmed on a n a t i o n a l b a s i s o r s p o n s o r e d by f o r e i g n o r g a n i z a t i o n s i n c l u d i n g f u e l v e n d o r s , u t i l i t i e s and r e s e a r c h l a b o r a t o r i e s , i n che f rame of I n t e r n a t i o n a l c o l l a b o r a t i o n s or b i l a t e r a l a g r e e m e n t s -
The r e s p e c t i v e c h a r a c t e r i s t i c s of BR3 and BR2 a r e s u c h t h a t t h e combined u t i l i z a t i o n of b o t h r e a c t o r s i s a q u i t e u n i q u e t o o l f o r p e r f o r m i n g power ramping and c y c l i n g t e s t s of ' f u e l r o d s a t h i g h b u r n u p . The BR3 i s used f o r h i g h b u r n u p f u e l b e h a v i o u r t e s t i n g In a broad s p e c t r u m of I r r a d i a t i o n c o n d i t i o n s and h i s t o r i e s w h i l e the 'BR2 I s used f o r p e r f o r m i n g power r a m p i n g and c y c l i n g e x p e r i m e n t s on some r e p r e s e n t a t i v e f u e l r o d s a t I n c r e a s i n g burr.up l e v e l s , as made a v a i l a b l e a t t h e end of e a c h BR3 i r r a d i a t i o n campa ign .
2 . BR3 PWR PLANT
2 . 1 . D e s c r i p t i o n
BR3 i s t h e f i r s t European PWR power p l a n t . I t was o r d e r e d from t h e W e s t i n g h o u s e Company i n J a n u a r y 1 9 5 6 , put i n s e r v i c e in 1957 and c o u p l e d t o the e l e c t r i c a l n e t w o r k fo r t h e f i r s t t i m e on O c t . 1 0 , 1962 .
E l e v e n i r r a d i a t i o n campaigns ( T a b l e I ) h a v e been s p r e a d o v e r t h e a l m o s t 2,5 y e a r s o p e r a t i o n p e r i o d , from t h e f i r s t c o u p l i n g 1.0 t h e g r i d up t o now. In t h e f i r s t few y e a r s of o p e r a t i o n , t h e BR3 power p l a n t was a l m o s t e x c l u s i v e l y usee' a s a t r a i n i n g t o o l f o r e x p l o i t a t i o n p e r s o n n e l , bu t g r a d u a l l y c h a n g e d i n t o a t e s t s t a t i o n for p r o t o t y p e or a d v a n c e d f u e l w h i c h t o d a y c o n s t i t u t e s I t s pr ime j u s t i f i c a t i o n .
The i n t r o d u c t i o n of a P u - e n r i c h e d f u e l a s s e m b l y In t h e f i r s t r e l o a d i n g of t h e r e a c t o r In Dec. 1963 was a w o r l d p r e m i e r e t c t h e c r e d i t of the Be lg i a . i f u e l m a n u f a c t u r i n g i n d u s t r y .
The r e a c t o r c o r e t e s t e d In BR3 between 1966 and t h e end of 1 9 6 8 , c a l l e d t h e VOLCAIN p r o j e c t , seemd p a r t i c u l a r l y p r o m i s i n g f o r s h i p p r o p u l s i o n and r e s u l t e d from B e l g i a n -B r i t i s h c o c ^ e n t I o n . T h i s was a f r u i t f u l e x p e r i m e n t from a t e c h n i c a l p t . l n . of v iew but had u n f o r t u n a t e l y no f u t u r e In t h e e c o n o m i c a l f i e l d .
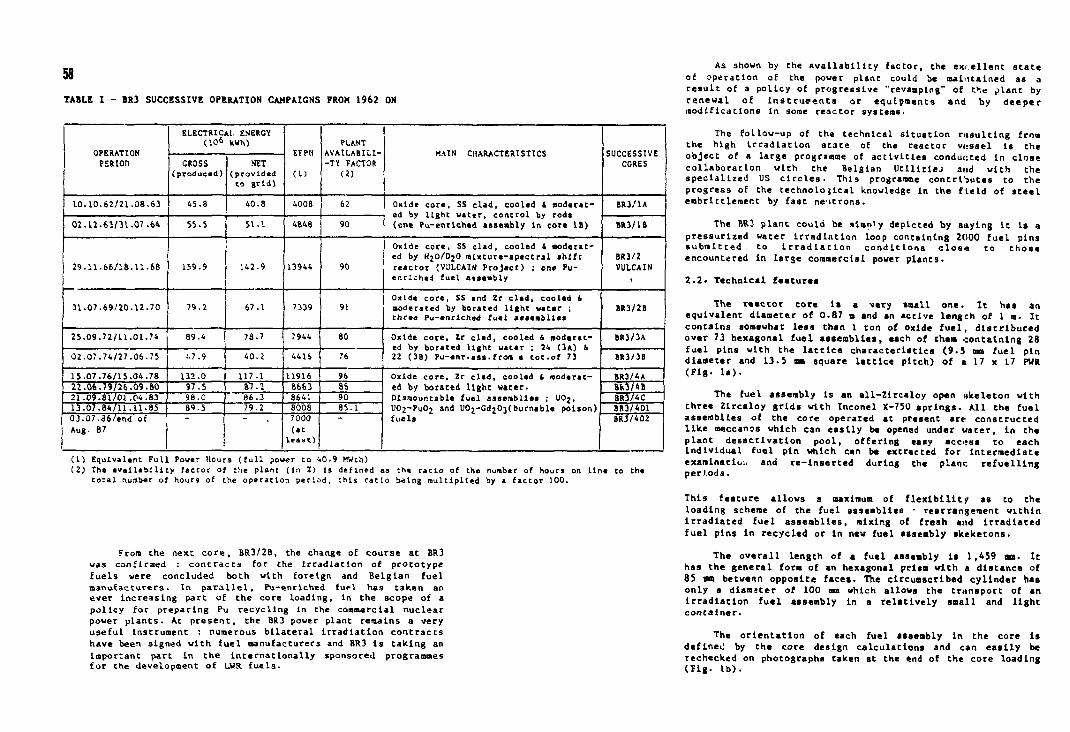
58 TABLE I - BR3 SUCCESSIVE OPERATION CAMPAIGNS FROM 1962 ON
OPERATION PERIOn
ELECTRICAL ENERGY (1Q6 kWh)
EFPH
(1)
PLANT AVAILABILIT Y FACTOR
(2)
HAIN CHARACTERISTICS SUCCESSIVE CORES
OPERATION PERIOn GROSS
(produced) NET
(provided to grid)
EFPH
(1)
PLANT AVAILABILIT Y FACTOR
(2)
HAIN CHARACTERISTICS SUCCESSIVE CORES
10.10.62/21.08.63 45.8 40.8 4008 62 Oxide core, SS clad, cooled 4 moderated by light water, control by rods (one ?u-enrlchtd assembly In core IB)
BR3/1A
02.II.62/31.07.64 55.5 51.1 4848 90
Oxide core, SS clad, cooled 4 moderated by light water, control by rods (one ?u-enrlchtd assembly In core IB) BR3/1S
29.IV.56/18.11.68 159.9 142.9 13944 90
Oxide core, SS clad, cooled & aoderae-ed by HjO^O mixture-spectral shift reactor (VULCA1N Project) ; on* Pu-enrlched fuel assembly
BR3/2 VULCAIN
t
31.07.69/20.12.70 79.2 67.1 7339 91 Oxide core, SS and Zr clad, cooled & moderated by borated light water ; three Fu-anrlched fuel assemblies
BR3/2B
25.09.72/11.01.74 89.4 78.7 7944 80 Oxide core, Zr clad, cooled 4 moderated by borated light water ; 24 (3A) 4 22 (3B) Pu-enr.ass.from a tot.of 73
BR3/3A
02.07.74/27.06.75 47.9 40.2 4416 76 Oxide core, Zr clad, cooled 4 moderated by borated light water ; 24 (3A) 4 22 (3B) Pu-enr.ass.from a tot.of 73 BR3/3B
15.07.76/15.04.78 132.0 117.1 11916 96 Oxide core, Zr clad, cooled 4 moderated by borated light water. Discountable fuel assemblies ; U0j, UO2-PUO2 and UOj-CdjOjfburnable poison) fuels
BR3/4A 22.06.79/26.09.80 97.5 87.2 8663 86
Oxide core, Zr clad, cooled 4 moderated by borated light water. Discountable fuel assemblies ; U0j, UO2-PUO2 and UOj-CdjOjfburnable poison) fuels
8K3/4B 21.09.81/01.04.83 98.0 86.3 8641 90
Oxide core, Zr clad, cooled 4 moderated by borated light water. Discountable fuel assemblies ; U0j, UO2-PUO2 and UOj-CdjOjfburnable poison) fuels
BR3/4C 13.07.84/11.11.85 89.5 79.2 8008 85.1
Oxide core, Zr clad, cooled 4 moderated by borated light water. Discountable fuel assemblies ; U0j, UO2-PUO2 and UOj-CdjOjfburnable poison) fuels
BR3/4D1 03.07.36/end of Aug. 87
7000 (at least)
Oxide core, Zr clad, cooled 4 moderated by borated light water. Discountable fuel assemblies ; U0j, UO2-PUO2 and UOj-CdjOjfburnable poison) fuels BR3/4D2
(1) Equivalent Ful l Power Hours ( f u l l power to 40.9 NUth) (2) The availability factor of the plant (in I) is defined as the ratio of the number of hours on line to the
total number of hours of the operation period, this ratio being multiplied by a factor 100.
From Che nexc core , BR3/2B, the change of course ac BR3 was confirmed contrac t s for the irradiation of prototype fue l s were concluded both with foreign and Belgian fuel manufacturers. In p a r a l l e l , Pu-enrlched fuel has taken an ever Increasing pare of the core loading, in the scope of a pol icy for preparing Pu recycling in the commercial nuclear power plants . At present , the BR3 power plant remains a very useful Instrument : numerous bi lateral Irradiation contracts have been signed with fuel manufacturers and BR3 Is taking an Important part In the Internationally sponsored programmes for Che development of LWR fue l s .
As shown by the a v a i l a b i l i t y factor, the exce l l en t s ta te of operation of the power plane could be maintained as a resulc of a pol icy of progressive "revamping" of Che plant by renewal of Instruments oc equipments and by deeper modifications in some reactor systems.
The follow-up of the technical s i tuat ion rasul t lng from the high Irradiat ion s t a t e of the reactor vesse l Is the object of a large programme of a c t i v i t i e s conducted In c lose col laborat ion with the Belgian U t U l t l e j and with the spec ia l i s ed US c i r c l e s . This programme contributes to the progress of the technoloj ica l knowledge In the fleLd of s t e e l erabrlttleraenc by fast neicrons.
The BR3 plant could be slmnly depicted by saying It Is a pressurized water Irradiation loop containing 2000 fuel pins submitted to I r r a d i a t i o n c o n d i t i o n s c l o s e to those encountered in large commercial power plants .
2 . 2 . Technical features
The reactor core la a very small one. It has an equivalent diameter of 0.87 m and an active length of 1 m. It contains somewhat l e s s than 1 ton of oxide f u e l , d i s tr ibuted over 73 hexagonal fuel assemblies , each of them containing 28 fuel pins with the l a t t i c e character is t ics (9 .5 mm fuel pin diameter and 13.5 on square l a t t i c e pitch) of a 17 x 17 PWR (Fig . l a ) .
The fuel assembly Is an al l -Zircaloy open nkeleton with three Zircaloy grids with Inconel X-750 spr ings . All the fuel assemblies of the core operated at present are constructed l i k e meccanos which can e a s i l y be opened under water, In the plane desact lvat lon pool , offering easy accost to each Individual fuel pin which can be extracted for Intermediate examination and re-Inserted during the plant r e f u e l l i n g periods .
This feature allows a maximum of f l e x i b i l i t y as to the loading scheme of the fuel assemblies - rearrangement within Irradiated fuel assemblies , mixing of fresh and Irradiated fuel pins in recycled or In new fuel assembly skeketons.
The overa l l length of a fuel assembly Is 1,459 on. It has the general form of an hexagonal prism with a distance of 85 mm between opposite faces . The circumscribed cyl inder has only a diameter of 100 mm which allows the transport of an Irradiat ion fuel assembly In a r e l a t i v e l y small and l i gh t container.
The or ienta t ion of each fuel assembly In the core i s defined by the core design calculat ions and can e a s i l y be rechecked on photographs taken at the end of the core loading (F ig . l b ) .
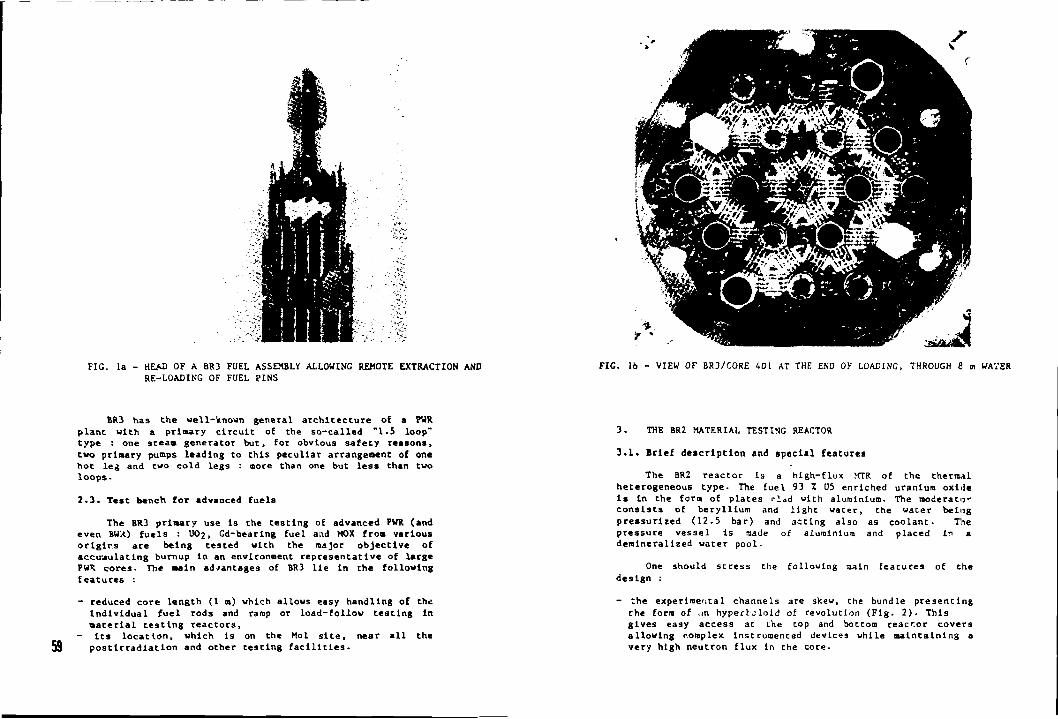
FIG. la - HEAD OF A BR3 FUEL ASSEMBLY ALLOWING REMOTE EXTRACTION AND RE-LOADING OF FUEL PINS
BR3 has t h e w e l l - k n o w n g e n e r a l a r c h i t e c t u r e of a PUR p l a n t w i t h a pr imary c i r c u i t of the s o - c a l l e d "1 .5 l oop" t y p e : one s t eam g e n e r a t o r b u t , for obv ious s a f e t y r e a s o n s , two primary pumps l e a d i n g to t h i s p e c u l i a r arrangement of one h o t l e g and two c o l d l e g s : more than one but l e s s than two l o o p s -
2 . 3 . T e s t bench f o r advanced f u e l s
The BR3 pr imary use I s the t e s t i n g of advanced PWR (and e v e n BU.<) f u e l s : UOj, Gd-bearlng f u e l and MOX from v a r i o u s o r l g l r . s a r e b e i n g t e s t e d w i t h the major o b j e c t i v e of a c c u m u l a t i n g burnup In an environment r e p r e s e n t a t i v e of l a r g e PWR c o r e s . The main a d v a n t a g e s of BR3 l i e In the f o l l o w i n g f e a t u r e s :
59
- reduced core length (1 m) which allows easy handling of the individual fuel rods and rarap or load-follow testing in material testing reactors,
- Its location, which is on the Mol site, near all the postlrradiatlon and other testing facilities-
FIC. lb - VIEW OF BR3/C0RE 4D1 AT THE END OK LOADING, THROUGH 8 tn WAVER
3. THE BR2 MATERIAL TESTING REACTOR
3.1. Brief description and special features
The BR2 reactor Is a high-flux MTR of the therm.il heterogeneous type. The fuel 93 X U5 enriched uranium oxide is in the form of plates cl^d with aluminium. The moderatu' consists of beryllium and light water, the water being pressurized (12.5 bar) and acting also as coolant. The pressure vessel is made of aluminium and placed in a demlneralized water pool.
One should stress the following main features of the design :
- the experimental channels are skew, the bundle presenting the form of .in hypertcloid of revolution (Fig. 2). This gives easy access at the cop and bottom reactor covers allowing complex Instrumented devices while maintaining a very high neutron flux in the core.
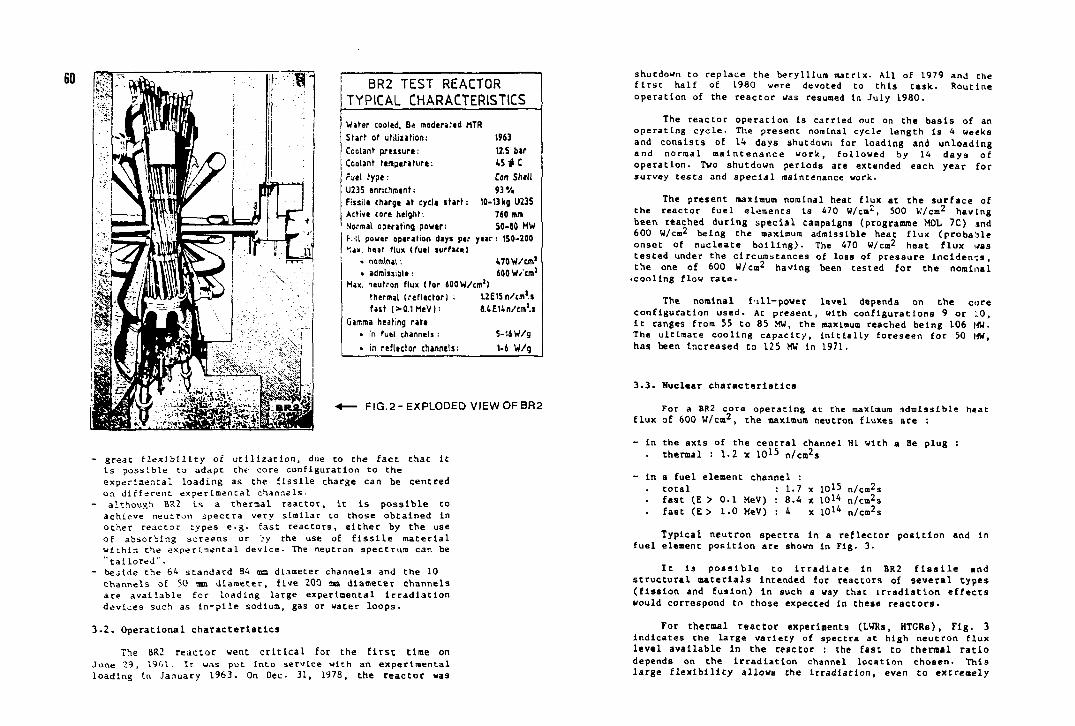
60 BR2 TEST REACTOR TYPICAL CHARACTERISTICS
Wafer cooled, Bis moderi.'td MTU Starr of utilization: 1963 Coolant pressure: 12.5 bar Coolant temperature: 45 # C Fuel type: Con Shell U235 enrichment: 93V. Fissile charge at cycle start: 10-13kg U235 Active core height: 760 mm Normal operating power: 50-80 HW F.'ll power operation days per year: 150-200 Max. heat flu* (fuel surface)
• nominal : UOW/cm 1
• admissible: 600 W/cm 1
Max. neutron flux (for dOOW/cm') thermal (reflector! : UEISn/cm'.s fast ( > 0.1 MeV): e .Ul in/cm' .s
Gamma heating rate • in fuel channels •- 5-16 W/g
• in reflector channels: 1-6 W/g
F I G . 2 - E X P L O D E D V IEW OF BR;
- great f l e x i b i l i t y of u t i l i z a t i o n , due to the fact that It Is possible to adapt che core configuration to the experimental loading as Che f i s s i l e charge can be centred on different experimental channels.
- although BS.2 i s a theraal reactor, It i s p o s s i b l e to achieve neutron spectra very similar to those obtained In other reactor types e . g . fast reactors, e i t h e r by the use of absorbing screens or by the use of f i s s i l e material within the experimental device . The neutron spectrum can be "tai lored".
- beside the 64 standard 84 mm diameter channels and the 10 channels of 50 mm diameter, f ive 200 no diameter channels are avai lable for loading large experimental Irradiat ion devices such as i n - p i l e sodium, gas or water loops .
3 . 2 . Operational c h a r a c t e r i s t i c s
The BR2 reactor went c r i t i c a l for the f i r s t time on June 29, 19>>l . It was put into service with an experimental loading In January 1963. On Dec 31, 1978, the reactor was
shutdown to replace the beryllium matrix. All of 1979 and the f i r s t half of 1980 were devoted to this task. Routine operation of the reactor was resumed in July 1980.
The reactor operation Is carried out on Che basis of an operating c y c l e . The present nominal cycle length i s 4 weeks and consis ts of 14 days shutdown for loading and unloading and normal maintenance work, fol lowed by 14 days of operation. Two shutdown periods are extended each year for survey t e s t s and s p e c i a l maintenance work.
The present maximum nominal heac flux at the surface of the reactor fuel elements i s 470 W/cm2, 500 W/cm2 having been reached during spec ia l campaigns (programme MOL 7C) jnd 600 W/cm2 being the maximum admissible heac flux (probable onset of nucleate b o i l i n g ) . The 470 W/cm2 heac f lux was tested under the circumstances of loss of pressure i n c i d e n t s , the one of 600 W/cm2 having been tested for the nominal
•cooling flow rate .
The nominal f>ill-power level depends on the core configuration used. At present, with configurations 9 or i.0, 1c ranges from 55 to 85 MW, Che maximum reached being 106 ! « . The ultimate cool ing capacity , i n i t i a l l y foreseen for 50 MW, has been Increased to 125 MW In 1971.
3 . 3 . Nuclear c h a r a c t e r i s t i c s
For a BR2 core operating at the maximum idmlss ib le heat f lux of 600 W/cm2, the maximum neutron fluxes are :
- In Che axis of Che central channel HI with a Be plug : . thermal : 1.2 x 1 0 1 5 n/cm 2s
- In a fuel elemenc channel : . to ta l : 1.7 x 1 0 1 5 n/cm 2s . fast (E > 0.1 MeV) : 8.4 x 1 0 1 4 n/cm 2s . fast (E> 1.0 MeV) : 4 x lOl* n/cm 2s
Typical neutron spectra In a ref lector p o s i t i o n and In fuel element pos i t ion are shown in Fig. 3.
I t i s p o s s i b l e to i r r a d i a t e in BR2 f i s s i l e and structural materia ls Intended for reactors of several types ( f i s s i o n and fusion) In such a way that i rrad ia t ion e f f e c t s would correspond to those expected In these reac tors .
For thernal reactor experiments (LWTts, HTGRs), Fig. 3 indicates the large variety of spectra at high neutron flux l eve l avai lable In the reactor : the fast to chental ra t io depends on the i rradiat ion channel locat ion chosen. This large f l e x i b i l i t y allows the irradiat ion, even Co extremely
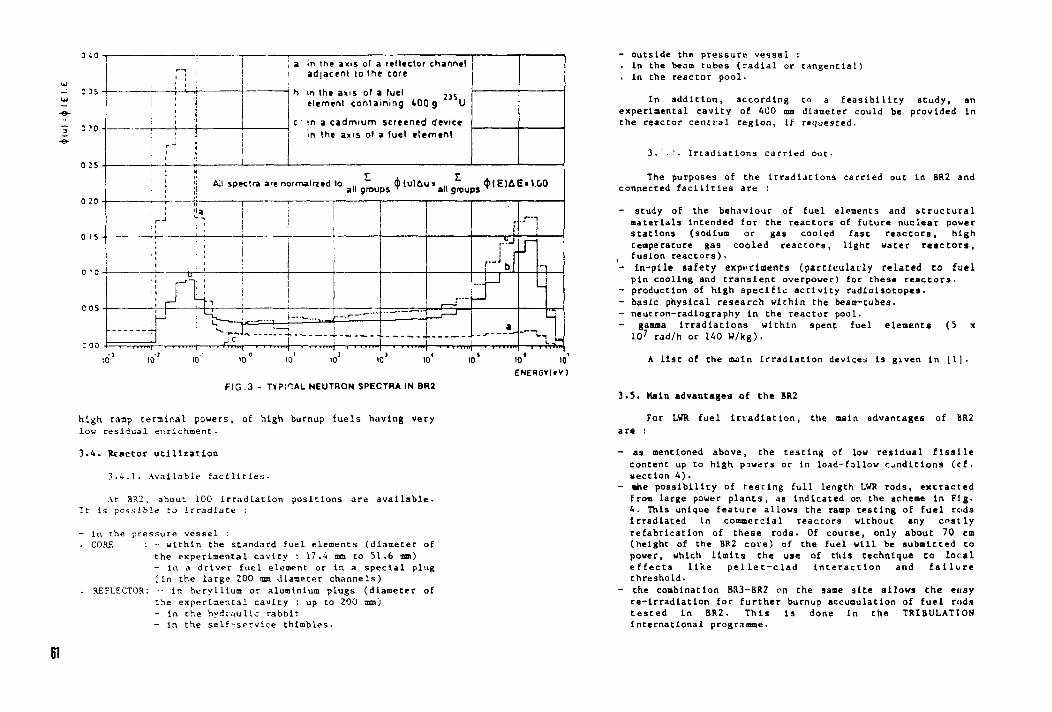
035
C?0
025
0 20
10 10 10 10 10"
F I G . 3 - TYPICAL NEUTRON SPECTRA IN BR2
i 111HI 1 i n r
io' io' ENERGr(«V)
high ramp cerainal powers, of high burnup fuels having very low residual enrichment.
3.4. Reactor utilization
3-4.1. Available facilities-
Ac 3R2 , about 100 irradiation positions are available-It is possible to irradiate ;
- in the pressure vessel : . CORE : - within the standard fuel elements (diameter of
the experimental cavity : 17.4 mm to SI.6 mm) - in a driver fuel element or in a special plug (in the large 200 mo diameter channels)
. REFLECTOR: • in bvrylllum or aluminium plugs (diameter of the experimental cavity : up to 200 mm) - In the hydraulic rabbit - In the s e l f - s e r v i c e thimbles.
- outside the pressure vesse l : . in the beam tubes (radial or tangential) . in the reactor pool.
In addit ion, according to a f e a s i b i l i t y study, an experimental cav i ty of 400 mm diameter could be provided In the reactor central region, if requested.
3. '• I r iad ia t ions carried out.
The purposes of the irradiat ions carried out In BR2 and connected f a c i l i t i e s are :
- study of the behaviour of fuel elements and s t ruc tura l materials intended for the reactors of future nuclear power s tat ions (sodium or gas cooled fast reac tors , high temperature gas cooled reactors , l ight water r e a c t o r s , fusion reactors) .
- In-pl le safety experiments (part icular ly related to fuel pin cooling and trans ient overpower) for these reactors-
- production of high s p e c i f i c a c t i v i t y radioisotopes . - basic physical research within the beam-tubes. - neutron-radiography In the reactor pool.
gamma Irradiat ions within spent fuel elements (3 x 10 7 rad/h or 140 W/kg).
A l i s t of the main Irradiation devices Is given In [ V ] .
3 . 5 . Main advantaged of the BR2
For LtfR fuel I rrad ia t ion , the main advantages of ER2 are :
- as mentioned above, the t e s t ing of low residual f i s s i l e content up to high powers or In load-follow condit ions (c f . sect ion 4 ) .
- the p o s s i b i l i t y of rest ing fu l l length LWR rods, extracted from large power p lant s , as Indicated on the scheme in Fig. 4 . This unique feature allows the ramp tes t ing of fuel rods irradiated In commercial reactors without any c o s t l y refabrlcatlon of these rods. Of course, only about 70 en (height of the BR2 core) of the fuel w i l l be submitted to power, which H a l t s the use of this technique to loca l e f f e c t s l i k e p e l l e t - c l a d I n t e r a c t i o n and f a i l u r e threshold.
- the combination BH3-BR2 on the same s i t e allows the eusy re- lrradlat lon for further burnup accumulation of fue l rods t e s t e d In BR2. This Is done In the TRIBULATION International programme.
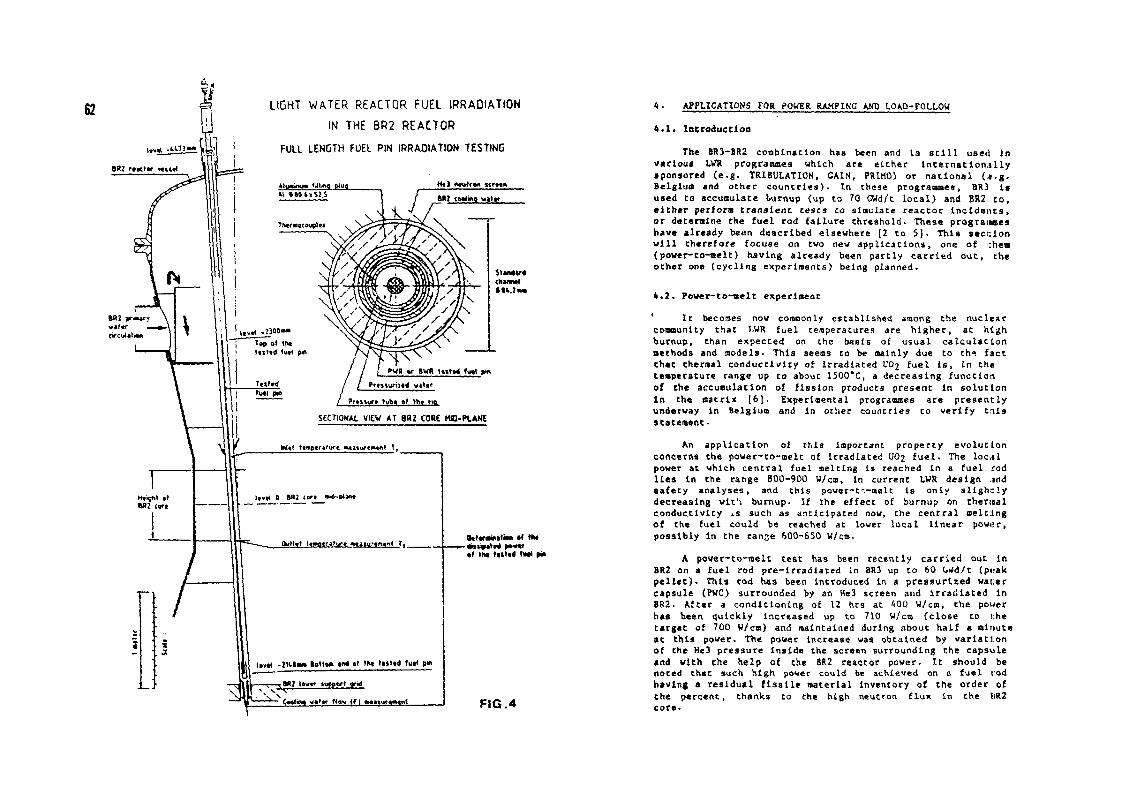
E? LIGHT WATER REACTOR FUEL IRRADIATION
IN THE BR2 REACTOR
FULL LENGTH FUEL PIN IRRAOIATION TESTING
OaltraautiM •< »«
FIG.4
4 . APPLICATIONS FOR POWER RAMPING AND LOAD-FOLLOW
4 . 1 . Introduction
The BR3-BR2 combination has been and la s t i l l used In various LUR programmes which are e i ther I n t e r n a t i o n a l l y sponsored ( e . g . TRIBULATION, GAIN, PRIHO) or nat ional (i.g. Belgium and other c o u n t r i e s ) . In these programmes, BR3 I s used to accumulate turnup (up to 70 CWd/t l o c a l ) and BR2 t o , e i t h e r perform trans ient t e s t s co simulate reactor I n c i d e n t s , or determine the fue l rod fa i lure threshold. These programmes have already been described elsewhere [2 to 5J. This s e c t i o n w i l l therefore focuse on two new appl icat ions , one of then (pover- to -ae l t ) having already been partly carried o u t , the other one (cyc l ing experiments) being planned.
4 . 2 . Power-to-melt experiment
' I t becomes now commonly established among the nuclear community that I.WR fuel temperatures are h igher , at high burnup, than expected on the basis of usual ca l cu la t ion methods and models. This seems to be mainly due to th« fact that thermal conduct iv i ty of Irradiated UOj fue l i s , in the temperature range up to about 1500°C, a decreasing function of (he accumulation of f i s s ion products present In so lut ion In the matrix [6J. Experimental programmes are present ly underway In Belgium and in other countries to ver i fy tn l s statement•
An appl icat ion of this Important property evolut ion concerns the power-to-melt of Irradiated UO2 f u e l . The l o c i l power at which central fuel melting Is reached In a fuel rod l i e s in the range 800-900 W/em, In current LWR design jnd safe ty analyses , and this power-t-.-aelt Is only s l i g h t l y decreasing wit!) bumup. If the effect of burnup on thenaal conductivity ±s such as anticipated now, the centra l melting of the fuel could be reached at lower loca l l inear power, poss ibly In the ranje 600-650 W/cm-
A power-to-raelt cest has been recently carried out in BR2 on a fuel rod pre-irradlated In BR3 up to 60 W d / t (puak p e l l e t ) . This rod has been introduced In a pressurized waller capsule (PWC) surrounded by an He3 screen and irradiated in BR2. After a condit ioning of 12 hrs at 400 W/cm, the power has been quickly Increased up to 710 W/cm ( c l o s e to i;he target of 700 W/cm) and maintained during about hal f a minute at this power. The power increase was obtained by var iat ion of the He3 pressure inside the screen surrounding the capsule and with the help of the BR2 reactor power. I t should be noted that such high power could be achieved on a fue l rod having a residual f i s s i l e material inventory of the order of the percent, thanks to the high neutron f lux in the EiR2 core.
Dismantling and post lrradiadon examinations are now underway ac CEN/SCK. Because of the higher ax ia l form factor (fz — 1.7) in BR2 i t w i l l be possible to determine the power ac which melting s t a r t s by ei ther non-destructive (neutron radiography) or destruct ive (ceramography) techniques . The resu l t s of the t e s t w i l l be incorporated in the frame of a new '.nternat tonal programme called HBC" (High Burnup Chemistry programme) ro be launched by BN and CEN/SCK during the seconu half of 1987. Other t e s t s wi l l be carried out as well they w i l l concern Gd-bearlng fuel rods for which s imilar questions may be raised, because of the cumulative e f f ec t of Che presence of Gd and of f i ss ion products on the chermal conduct iv i ty .
4 . 3 . Load follow experiment
The use of ;ouer plants In load follow modes of operation requests the accumulation of experimental data necessary for design ••urposes and for j u s t i f i c a t i o n cowards the l icens ing a u t h o r i t i e s -
Experimental programmes ex i s t but they are general ly e i ther l imited to Intermediate burnups ( e . g . Halden Instrumented e x p e r i m e n t s ) or focused on obta in ing data for code benchmarking ( e . g . ELF). However, the parameter "burnup" may be of extreme Importance In case of load fol low. Indeed f i s s i o n gas release and gaseous swelling phenomena are, at high burnup, extremely s e n s i t i v e to power h i s tory . Moreover, the cyc l i c s t res ses imposed on the highly Irradiated cladding may Induce Increased risk of cladding fai lures during load fol low operation.
To keep an eye on these Important phenomena, It i s planned at CEN/SCK to carry out an experimental programme on UO2 f u e l r o d s , c a l l e d CtfCLOPE, focusing on two main features : - fuel rods with 60 GVd/t burnup (peak p e l l e t ) w i l l be
chosen ; - a large number of da l ly power cyclings (about 160) w i l l be
performed, under conJlt lon of a closed gap (Inducing p e l l e t - c l a d in terac t ion) during the high power phase of the c y c l e .
The evolution of Che rod behaviour (Internal gas pressure, cladding deformation, cladding Integri ty) w i l l be f o l l o w e d by the performance of severa l I n t e r m e d i a t e measurements. At the end of the programme, des truct ive examination wi l l emphasize the mechanical properties of the cladding as compared with those of a reference rod, not submitted to power ramps. The minimal sad maximal l inear powers (Pmln. and Pmax.) during load follow w i l l be defined
63
a f t e r ca lcu la t ion , in such a way that : - Pain, be the highest power for which the p e l l e t - c l a d gag i s
open, i n d u c i n g c lad ova l l zac lon a'ld bending s t r e s s e s ,
- Paax . be a power a t which t h i s gap Is c l o s e d and ac which t h e c o n t a c t p r e s s u r e of t h i s p e l l e t be s i g n i f i c a n t .
The power v a r i a t i o n w i l l be obta ined a u t o m a t i c a l l y w i t h t h e He3 d e v i c e .
The programme w i l l l a s t f o r two years a f t e r t h e f i n a l d e c i s i o n for g o i n g on has been taken .
5 . CONCLUSION
The BR3 and B*2 r e a c t o r s are both used in s e v e r a l n a t i o n a l and i n t e r n a t i o n a l programmes. The s u c c e s s o f t h e i r u s e comes from t h e i r p a r t i c u l a r i t i e s which are m a i n l y t h e i r l o c a t i o n on one s i n g e s i t e ( a v o i d i n g t r a n s p o r t of I r r a d i a t e d m a t e r i a l s ) , the l a r g • f l e x i b i l i t y of use of both e x p e r i m e n t a l f a c i l i t i e s and some u n i q u e f e a t u r e s l i k e the h i g h f l u x of BR2 o r i t s a b i l i t y to t e ^ t v a r i o u s geometr ie s or c o n c e p t s o f f u e l e l e m e n t s or m a t e r i a l s .
REFERENCES
( 1 } BAUCNET, J . M . , C o n t r i b u t i o n of the Mol Research R e a c t o r s t o N a t i o n a l and I n t e r n a t i o n a l Nuc lear Programmes, IAEA T e c h n i c a l Conn. Mtg, Budapest (Hungary) , D e c . 1 0 - 1 3 , H5
[ 2 ] BAIRIOT, H. & » ' . . , TRIBULATION I n t e r n a t i o n a l Programme -O b j e c t i v e s and S t a t u s , ANS T o p i c a l H e e c l n g , W i l l i a m s b u r g , V.-,., A p r i l 4 - 8 , 8 2 .
( 3 ] HAAS, D. & a l . , I n f l u e n c e of Power P lant O p e r a t i o n on F u e l Behav iour : the TRIBULATION and ELF I n t e r n a t l o n . i l Programmes, KTC, Karlsruhe (W.Germany), Nov. 2 8 - 2 9 , 35
[ 4 ] HAAS, D. and MOTTE, F . , Exper imenta l Programmes on Cado l in lum Fuel U t i l i z a t i o n In LWRs In Be lg ium, IAEA S p e c l a l i s t s ' H t g , Hoi ( B e l g i u m ) , May 7 - 1 1 , 84
(5J BAIRIOT, H. & a l . , LWR MOX Fuel Exper i ence In B e l g l u a and France w i t h S p e c i a l Emphasis on R e s u l t s o b t a i n e d In BR3, IAEA I n t e r n . Symp., Stockholm ( S w e d e n ) , S e p t . 1 5 - 1 9 , 86
[ 6 ] van VLIET, J . , P r i v a t e Communication, BELCONUCLEAIRE, B r u s s e l s , Be lg ium.
IAEA-TC-624/22
64 IRRADIATION FACILITIES OF THE CEA/DERPE FOR POWER RAMPING AND POWER CYCLING EXPERIMENTS
C. FRIBOULET, M. ROCHE Division d'exploitation des reacteurs
prototypes et experimentaux, CEA. Institut de recherche technologique
et de developpemeru industriel, Grenoble, F'ance
Abstract
Power ramping sod power cycling experiments are performed in the DERPE reactors in GRENOBLE (SEOTI) and in SACLAY (SERI).
Irradiations can be done with fresh or pre-irradiated fuel rods, long (2m) or short ones, instrumented or not, witn normal uranium oxyde, gadolinium oxyde, or mox fuels.
The devices used for these experiments operate in FWR range of pressure and temperature. They are :
- one fuel rod capsules : - AQUllON (long rods} - BOSS (short ones) - GRIFFON (superposed instrumented short rods)
- one fuel rod loops : - ISABELIE 1 (short or long rods) - JET PUMP (short rods with leak clad)
- Multi fuel rod loops : - ISABELLE 4 (4 short or long rods) - IRENE (9 short or long rods, can operate with void ratio until 25 I)
- OPERA loop, in design (36 long fuel rods).
Power variations are carried out by mechanical displacement devices or gaze-ous neutron absorbers. The ramps can be monitored by computers from one irradiation parameter (usual h the power/.
Instrumentation is distributed on the devices thermocouple;., pressure gauge, SPNO, and on the samples : high temperature thermocouples in the fuel or the clad, fission gas pressure gauges, diameter and longitudinal section measurement, thermal noise, accelerometer.
Out of the irradiation time, non destructive examinations can be done : metrology - neutronradiography - gamma scanning - eddy current.
Various types of power ramping and cycling will be shown as well as non destructive testing results.
1. INfRODUCTION
Major developments have been achieved in the area of iiradiation devices to reproduce as closely as possible the normal and incidental operating conditions characteristic of power reactors. Simultaneously, specific instrumentation was developed to obtain precise and extensive data on the behaviour and changes in the properties of. lightwater reactor fuel rods.
The research topics are intended to improve the reliability of the fuel rod components, in order to enhance the safety of nuclear installations, and to optimize the operating costs. The strength and behaviour of the rods subjected to power rampings and cyclings, to load following and load regulation, form part of the major objectives.
With this in view, the CEA/DERPE has developed irradiation devices in the past fifteen years in the Saclay and Grenoble Nuclear Research Centres. These devices are designed to reproduce, in a manner as representative as possible, the normal and incidental conditions encountered in nuclear power stations, while offering a wider range of kinetics and power variations than those allowed in the power plant. Their flexibility of use und their associated instrumentation help to understand and to quantify the influence of the parameters that generate or cause the processes encountered during the life of the fuel.
The experiments are conducted in locations provided for the purpose, in the core or at the periphery of the OSI"IS and SILOE reactors, where the thermal neutron fluxes are in the neighbourhood of 2 to 2.5.10 n/cm .s.
2. TYPES OF FUEL ROD SUBJECTED TO POWER RAMPINCS
Experience shows that rods subjected to irradiations such as power rampings, cyclings, load regulation and various transients, originate in many sources. The essential differences in geometry concern the rod lengths, because the diameters are those of the PWR 17 x 17 type or very close to them. The rods are supplied bare or instrumented.
Two categories of rods are essentially distinguished:
. new rods:
short rods comparable in length to the height of the experimental reactor core (600 mm) long rods of the BR3 type (1200 mm) or CAP type (1800 mm).
. pre-irradiated rods:
short rods from: . pre-irradiation in a device . pre-irradiation in a power plant and reconditioning in hot cells to reduce their length and possibly to instrument them (FABRICE process)
long rods from experimental PWR reactors of the BR3 or CAP type, to be re-irradiated in their median part or in a predetermined zone.
The burnup may reach 55,000 MWd/tl), indicating low residual enrichment for rods from power plants. Nevertheless, the design of the irradiation
devices employing low neutron absorption materials and higt thermal neutron flux values in the experimental reactors allow the development of linear powers close to 500 W/cm.
235 The fuel may je uranium oxide enriched with U, gadoliniated, or mixed oxide (U0 - PuO ).
All these rods can be irradiated:
singly, in pairs: very short rods superimposed or long rods in a basket, in bundles of 4 rods, in assemblies of 9 rods, 'in assemblies of 36 rods.
3. IN-CORE DEVICES AND CHARACTERISTICS
An irradiation device consists of the following:
an in-core part placed near or inside the reactor core, an out-of-core part installed in the experimental areas, in the reactor containment, hydraulic, pneumatic and electric connections connecting these two parts.
The out-of-core part comprises the monitoring-control systems, hydraulic and pneumatic systems to maintain the physico-chemical and thermo-hydraulic conditions required for the operation of the experiments. The.se systems may be common to several in-core devices.
Auxiliary laboratories are used to condition the primary circuit water (additions of lithine, hydrogenation, CRUD injection, continuous fluid analysis etc) to degasify and purify the water, and for the sampling and analysis of the radio-active fission products released by the rods during irradiation. Also assembled out-of-core are the measurement acquisitions systems and the control systems.
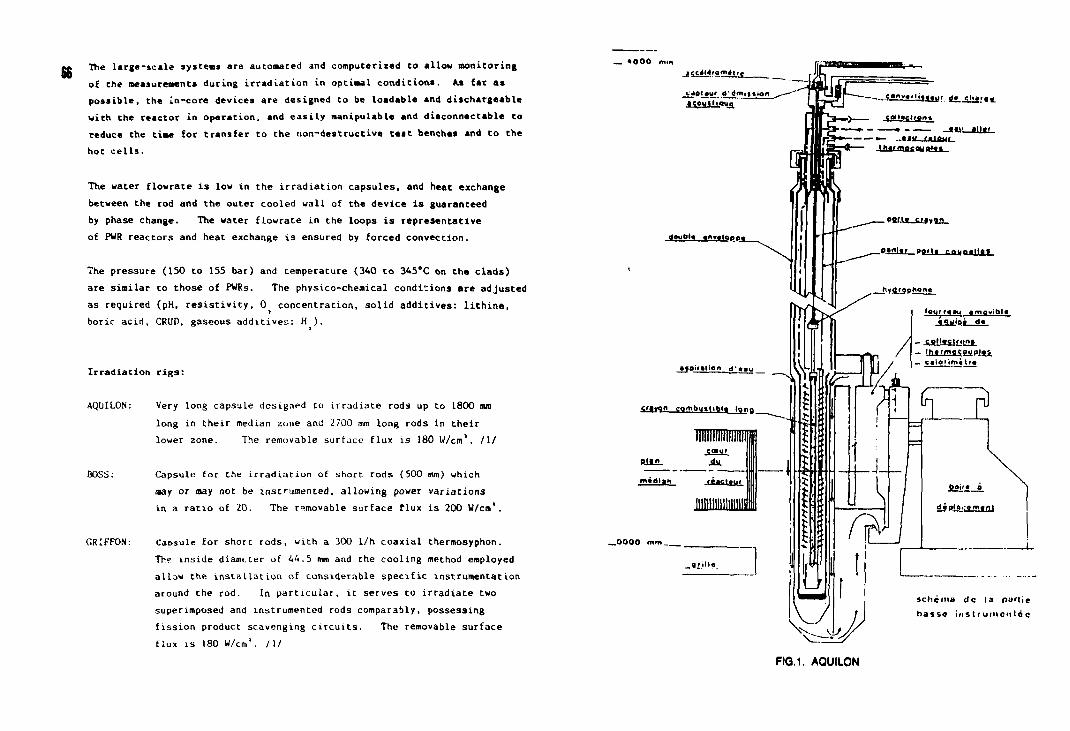
66 The large-scale systems are automated and computerized to allow monitoring of the measurements during irradiation in optimal conditions. As. far a* possible, the in-core devices are designed to be loadable and dischargeable with the reactor in operation, and easily manipulable and diaconnectable to reduce the time for transfer to the non-destructive teat benches and to the hot cells.
The water flowrate is low in the irradiation capsules, and heat exchange between the rod and the outer cooled wall of the device is guaranteed by phase change. The water flowrate in the loops is representative of PWR reactors and heat exchange is ensured by forced convection.
The pressure (150 to 155 bar) and temperature (340 to 345°C on the clads) are similar to those of PWRs. The physico-chemical conditions are adjusted as required (pH, resistivity, 0 concentration, solid additives: lithine, boric acid, CRUD, gaseous additives: H ).
Irradiation rigs:
AQUILON: Very long capsule designed to irradiate rods up to 1800 mra long in their median zone and 2700 mm long rods in their lower zone. The removable surface flux is 180 IV/cm'. /I/
BOSS: Capsule for the irradiation of short rods (500 mm) which may or may not be instrumented, allowing power variations in a ratio of 20. The removable surface flux is 200 W/cm".
GRIFFON: Caosule for short rods, with a 300 1/h coaxial thermosyphon. Th» inside diamtter of 44.5 mm and the cooling method employed allow the installation of considerable specific instrumentation around the rod. In particular, it serves to irradiate two superimposed and instrumented rods comparably, possessing fission product scavenging circuits. The removable surface flux is 180 W/cm'. /!/
4 0 0 0 mm jCC^Urom^iry
collmctton*
doub*« «n»«loop l
»lpi»slion d ' o i u
osvon c o m b u H i ^ Iqng
mvdian
lllllllllllllllllll <;«tu>
AM.
juniiiii
0 m m -
_9i ' "« .
schema dc la p j ' l i c basse i n s t r u m e n t s
FIG.1. AQUILON
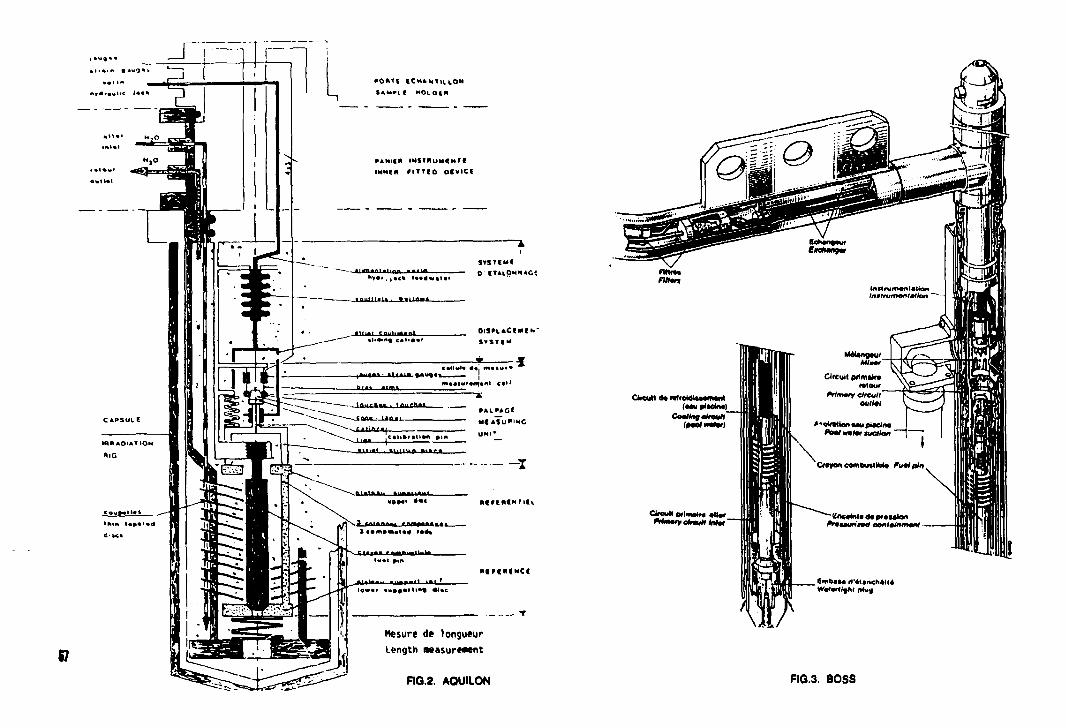
J « ! • * • • « * 4 u < ] «
hfitaultc lack
w
»0»Tt €C»»Hll l l .OM
PAHIER INSTMUUCHTC INHCK » I T T « O ocvicc
SVSTCUi
OlS»(.*C(«C»<~
c«MuJ« tf«j mitu<*
m««iu^«M«nl c«tl
PAIMGI MCASU'IMC UNI*
~x
M n a t m i l i
« f r c x i N C i
Hesure de longueur Length measurement
FIG.2. AQUILON FIQ.3. BOSS
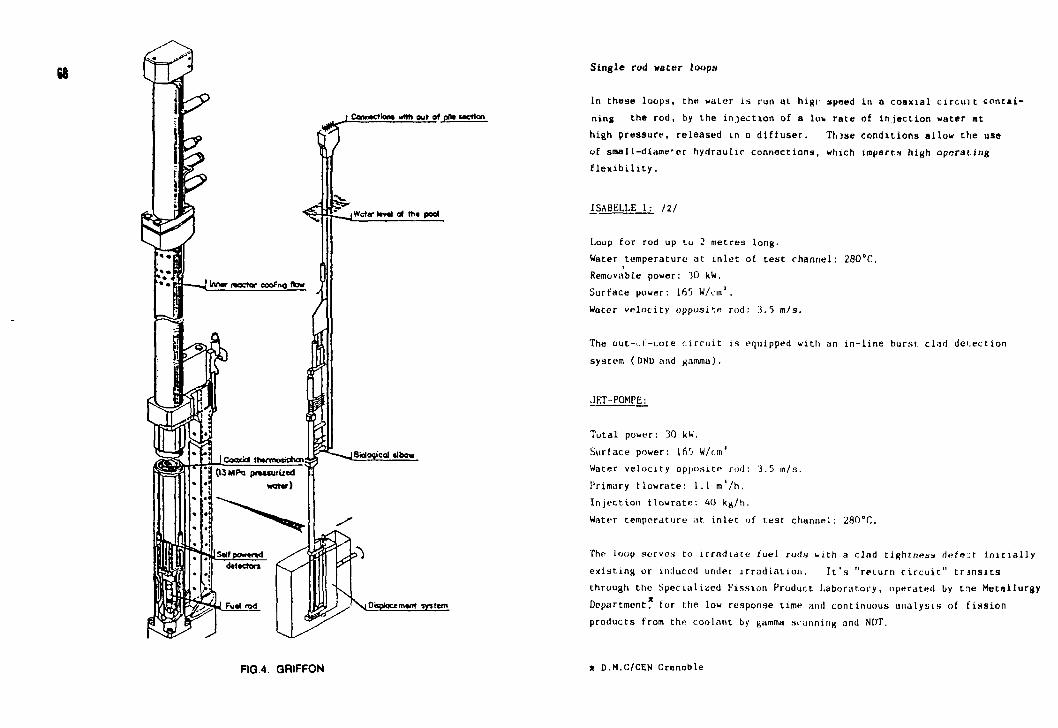
j CowoOiom wtlh out of pfli action
< ^ : ! ^ j W r t t r trwl o< fh« pod
Biological «lbow
OaploctmwT system
FIG4. GRIFFON
Single rod water loops
In these loops, the waLer is run at higi speed in a coaxial circuit containing the rod, by the injection of a low rate of injection water at high pressure, released in a diffuser. Thjse conditions allow the use of small-diame'er hydraulic connections, which imparts high operating flexibility.
ISABKLLE 1: /2/
Loop for rod up to 2 metres long. Water temperature at inlet of test channel: 280°C, Removable power: 30 kW. Surface power: 165 W/cm', Water velocity opposite rod: 3.5 m/s.
The out-i-l-coie circuit is equipped with an in-line burst clad denection system (DND and xamma).
JET-POHPE:
Total power: 30 kW, Surface power: 165 W/r:m' Water velocity opposite rod: 3.5 in/s. Primary tlowrate: 1.1 m'/h. Injection tlowrate: 40 kg/h. Water temperature at inlet of rest channel: 2S0°C.
The loop serves to irradiate fuel rods with a clad tightness defeat initially existing or induced under irradiation. It's "return circuit" transits through the Specialized Fission Product Laboratory, operated by tne Metallurgy Department, for the low response time and continuous analysis of fission products from the coolant by gamma scanning and NOT.
* D.M.C/CEN Grenoble
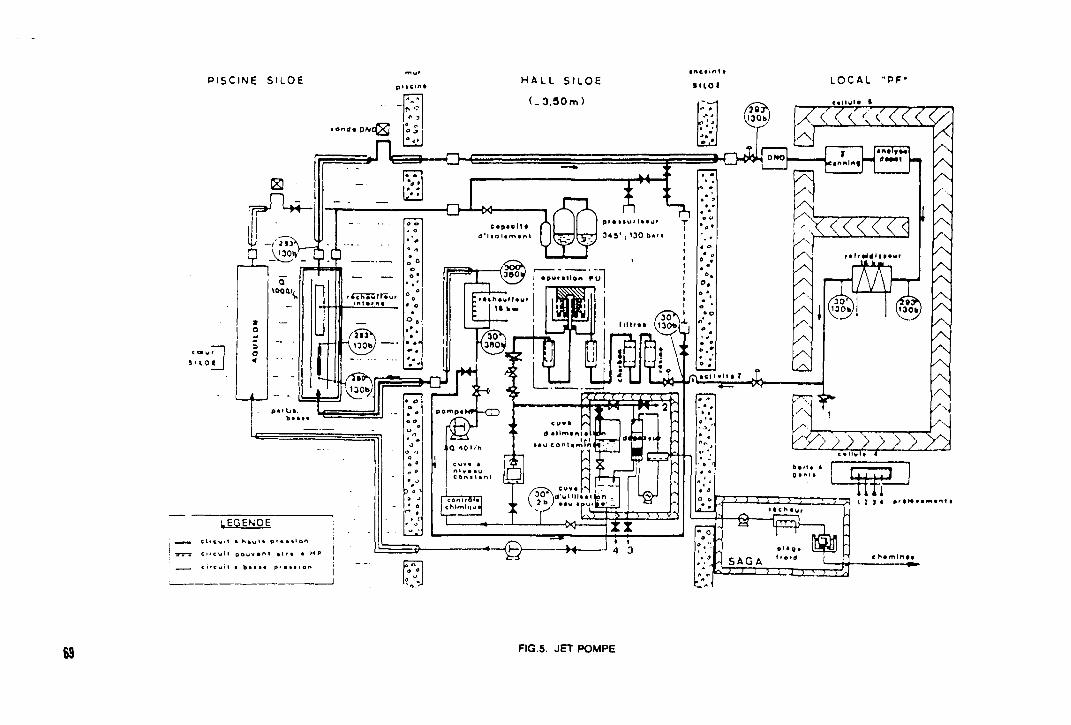
PISCINE SHOE
C h « m l n * «
! i i > ; i > < ' 1 1
69 FIG.5. JET POMPE
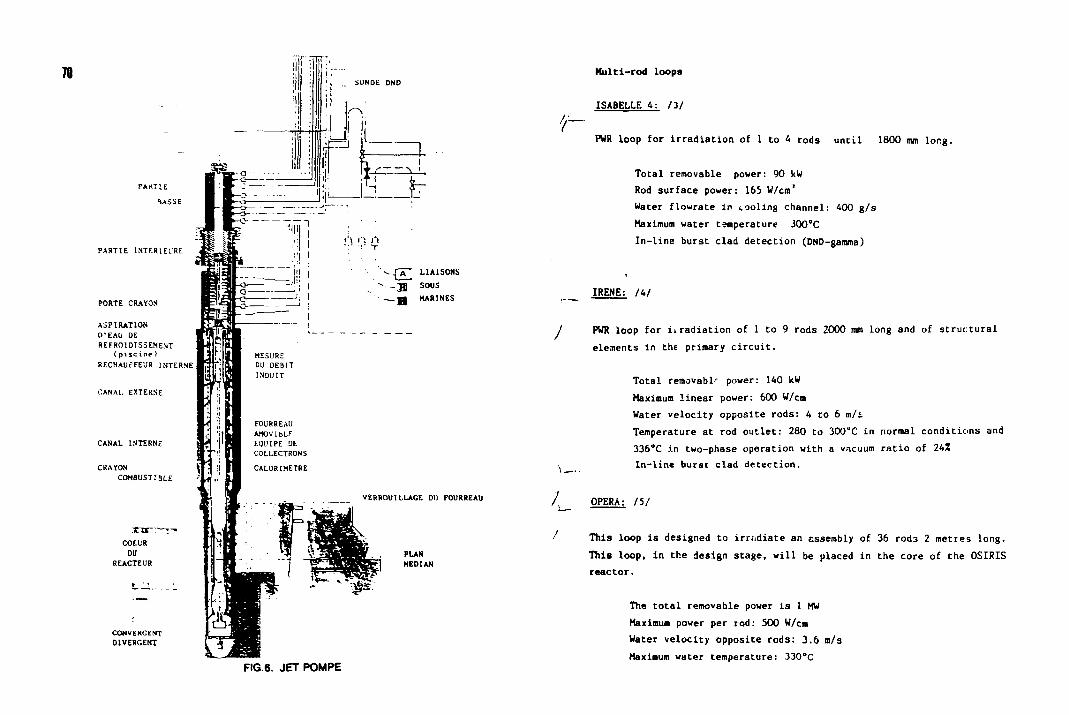
PAKTIE •USSE
PARTIE 1NTFRIEURE
PORTE CRAYON
ASPIRATION D'EAU DE REFROIDISSEMENT
(pi seine)
RECHAUfFEUR INTERNE
CANAL EXTERSE
CANAL INTERNE
CRAYON COMBUSTIBLE
COEUR DU
REACTEUR
CONVERGENT DIVERGENT
i
["Tf.
i i i
1 2 " i i » _ - —— •
v^\
zd
A LIAISONS H SOUS g HARINES
VERROUILLACE Oil FOURREAU
FIG.6. JET POMPE
Multi-rod loops
ISABELLE 4: /3/
PWR loop for irradiation of 1 to A rods until 1800 mm long.
Total removable power: 90 kW Rod surface power: 165 W/cm' Water flowrate in cooling channel: 400 g/s Maximum water temperature J00°C In-line burst clad detection (DND-gamma)
IRENE: /4/
PWR loop for iiradiation of 1 to 9 rods 2000 mm long and of structural elements in the primary circuit.
Total removable power: 140 kW Maximum linear power: 600 W/cm Water velocity opposite rods: 4 to 6 m/i Temperature at rod outlet: 280 to 300°C in normal conditions and 336°C in two-phase operation with a vacuum ratio of 24Z In-line burst clad detection.
OPERA: 111
This loop is designed to irradiate an assembly of 36 rod3 2 metres long. This loop, in the design stage, will be placed in the core of the OSIRIS reactor.
The total removable power is 1 MW Maximum power per rod: 500 W/cm Water velocity opposite rods: 3.6 m/s Maximum water temperature: 330°C
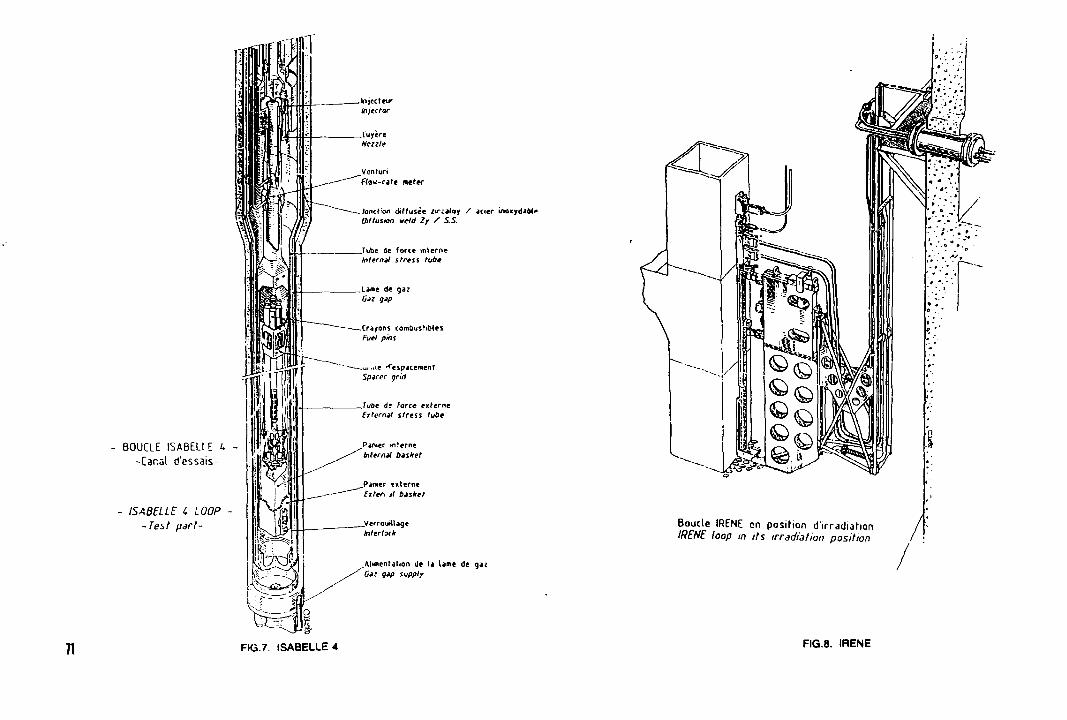
80UCLE ISABEL! E U -Canal d'essais-
ISABELLE i LOOP -Test part-
^
.Inject eur in fee tar
_Vuyere Nczzle
_Venturt ftov-rtte meter
-Janetion dif fusee zircatoy / acier tnoxydabl* Diffusion weid Zf / S.S.
_Tube de force interne Internal stress tube
_lafl»e de gaz
-Crayons combustibles Fuel pins
-,M..ue H'espacemenf Spicer grid
-.Tube d* force externe Extern*! stress tube
^Panier interne (nternti bisket
_Panier externe exter, jl basket
_Verroui*taqe Interlock
Alimentation de la lame de qn G*z q*p supply
71 RG.7. ISABELLE 4
Boucle IRENE en posifion d'irradiation IRENE loop m its irradiation position A
FIG.8. IRENE
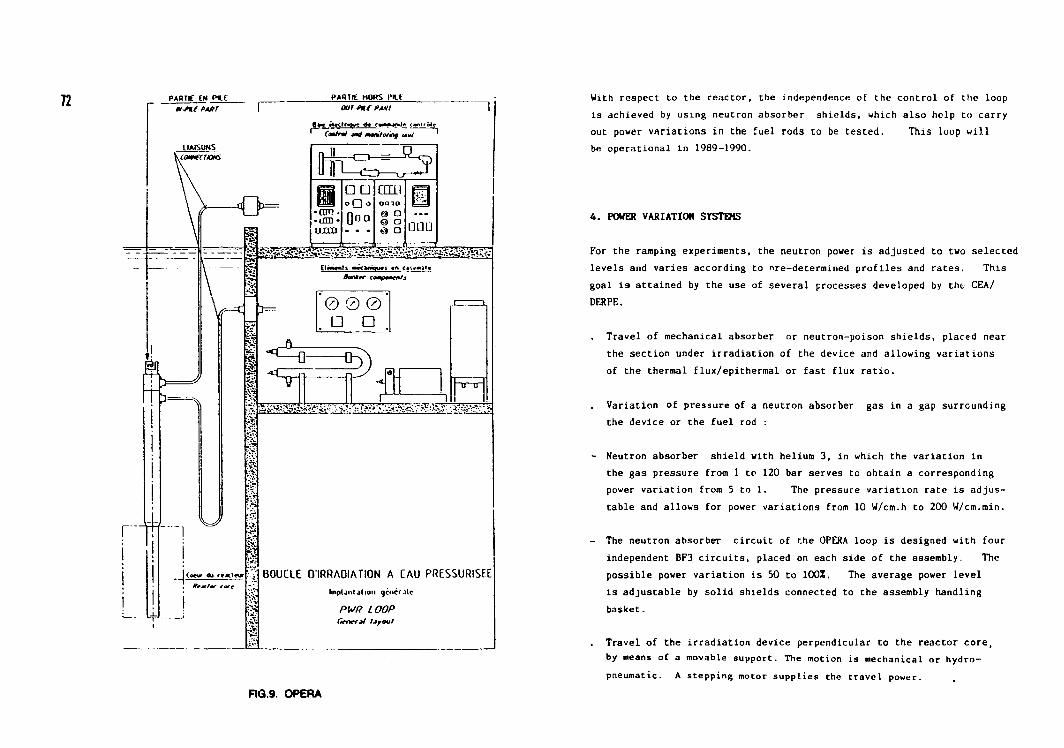
PABTg EN PltC i~ne PARI
LIAISONS
PAWIE HOWS IMU OOt Ptf PA.V1
6 » » «l«<lriou» d« y « w . w J » contro l Cmtrtl jnj montotinq tmut
r
$1
4>=
V^
^ - \
i
w (aeurfe r*JCt«ur
*rjr/#»- f»rr
i
a. lfCS=^? •CDTJ -• urn-ami
QD
noa
CLTLI OOIO @ a © a O a 0 0 U
A*i*<r components
0 0 0 G a
£=£) „., , , . I . 1
BOUCLE OIRRAOIATION A EAU PRESSUR1SF.E Implantation gcocrjlc
PWR LOOP Genefit layout
F1G.9. OPERA
With respect to the reactor, the independence of the control of the loop is achieved by using neutron absorber shields, which also help to carry out power variations in the fuel rods to be tested. This loop will be operational in 1989-1990.
4. POWER VARIATION SYSTEMS
For the ramping experiments, the neutron power is adjusted to two selected levels and varies according to nre-determined profiles and rates. This goal i9 attained by the use of several processes developed by the CEA/ DERPE.
Travel of mechanical absorber or neutron-poison shields, placed near the section under irradiation of the device and allowing variations of the thermal flux/epithermal or fast flux ratio.
Variation of pressure of a neutron absorber gas in a gap surrounding the device or the fuel rod :
- Neutron absorber shield with helium 3, in which the variation in the gas pressure from 1 to 120 bar serves to obtain a corresponding power variation from 5 to 1. The pressure variation rate is adjustable and allows for power variations from 10 W/cm.h to 200 W/cm.rain.
- The neutron absorber circuit of the OPERA loop is designed with four independent BF3 circuits, placed on each side of the assembly. The possible power variation is 50 to 100%. The average power level is adjustable by solid shields connected to the assembly handling basket.
Travel of the irradiation device perpendicular to the reactor core, by means of a movable support. The motion is mechanical or hydro-pneumatic. A stepping motor supplies the travel power.
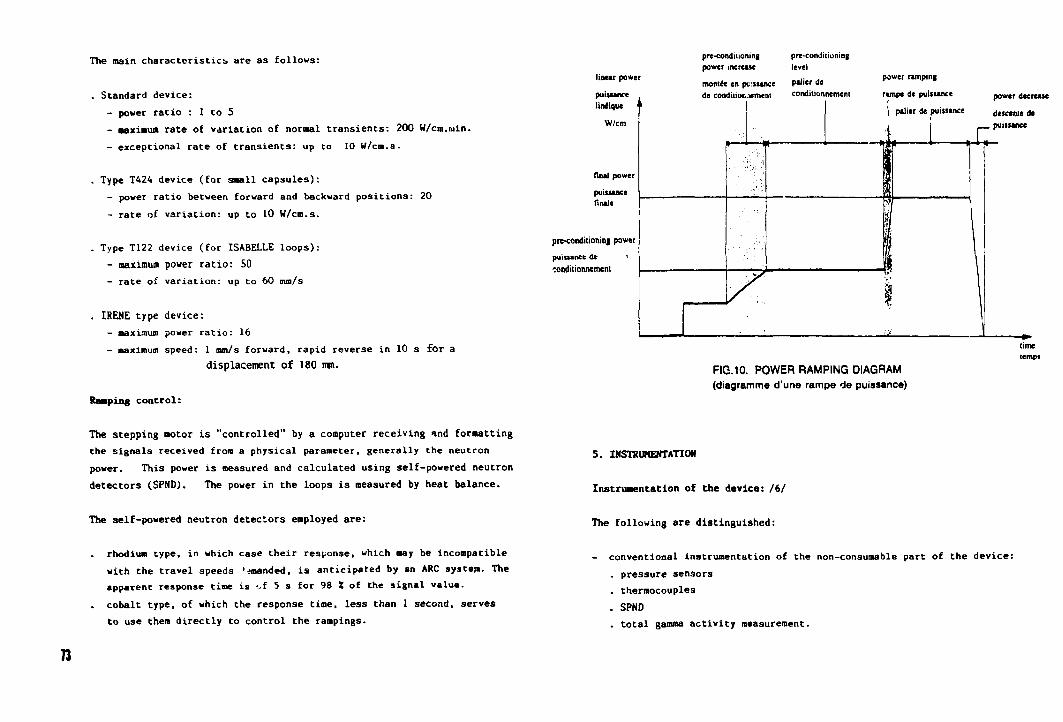
The main characteristics, are as follows:
. Standard device: - power ratio : 1 to 5 - maximum rate of variation of normal transients: 200 W/cm.rain. - exceptional rate of transients: up co 10 W/cm.s.
. Type T424 device (for small capsules): - power ratio between forward and backward positions: 20 - rate of variation: up to 10 W/cm.s.
. Type T122 device (for ISABELLE loops): - maximum power ratio: SO - rate of variation: up to 60 mm/s
. IRENE type device: - maximum power ratio: 16 - maximum speed: 1 mm/s forward, rapid reverse in 10 s for a
displacement of 180 urn.
Ramping control:
The stepping motor is "controlled" by a computer receiving and formatting the signals received from a physical parameter, generally the neutron power. This power is measured and calculated using self-powered neutron detectors (SPND). The power in the loops is measured by heat balance.
The self-powered neutron detectors employed are:
rhodium type, in which case their response, which may be incompatible with the travel speeds ' jmanded, is anticipated by an ARC system. The apparent response time is -A 5 s for 98 X of the signal value.
. cobalt type, of which the response time, less than 1 second, serves to use them directly to control the rampings.
13
linear power
puiuance lintique f
W/cm
final power
puissance finale
pre-conditioning power
puissance de ' -:ondiiionnement
pre-conditioning pre-conditioning power increase level
montee en pc:ssance patier de de condiiior..iement conditionnemem
power ramping
rampe de puissance p ^ , , decrease
palier de puissance <jesc*nie de
puissance I I
FIG.10. POWER RAMPING DIAGRAM (diagramme d'une rampe de puissance)
5. INSTRUMENTATION
Instrumentation of the device: /6/
The following are distinguished:
- conventional instrumentation of the non-consumable part of the device: . pressure sensors . thermocouples . SPND . total gamma activity measurement.
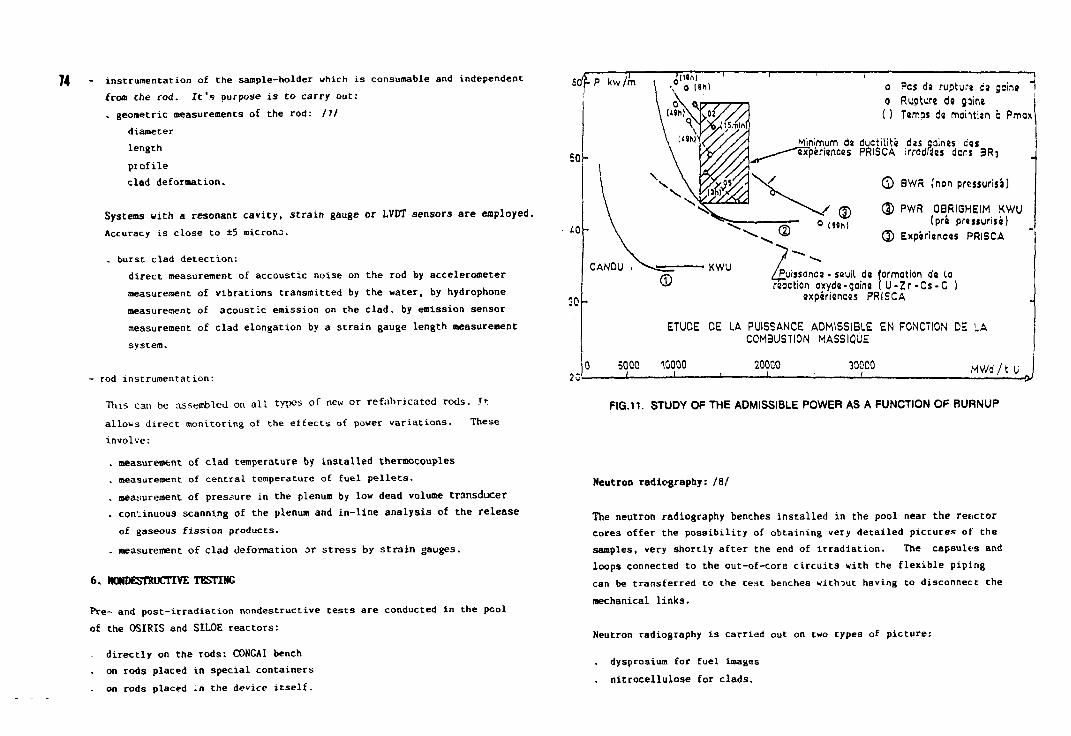
- instrumentation of the sample-holder which is consumable and independent from the rod. It's purpose is to carry out: , geometric measurements of the rod: HI
diameter length profile clad deformation.
Systems with a resonant cavity, strain gauge or LVDT sensors are employed. Accuracy is close to ±5 micronc.
. burst clad detection: direct measurement of accoustic noise on the rod by accelerometer measurement of vibrations transmitted by the water, by hydrophone measurement of acoustic emission on the clad, by emission sensor measurement of clad elongation by a strain gauge length measurement system.
- rod instrumentation:
This can be assembled on all types of new or refabricated rods. Tt allows direct monitoring of the effects of power variations. These involve: . measurement of clad temperature by installed thermocouples . measurement of central temperature of fuel pellets. . measurement of pressure in the plenum by low dead volume transducer . continuous scanning of the plenum and in-line analysis of the release of gaseous fission products.
. measurement of clad deformation or stress by strain gauges.
6. HOMDESTOUCTIVE TESTI1IG
Pre- and post-irradiation nondestructive tests are conducted in the pcol of the OSIRIS and SILOE reactors:
directly on the rods: CONGAI bench on rods placed in special containers on rods placed _n the device itself.
SO'pPkw/m
iO
20
CANOU
o Pes de rupture e'e gsine > o Rupture de gjine ( ) Temps de mohtien e Pmox
Minimum da ductitite des comes ess experiences PRISCA irrodfjes dors 3Rj
^ 0 BWR (non pressurise)
@ PWR OBRIGHEIM KWU (pre pressurise)
(|) Experiences PRISCA
Puissance • seuil de formation de to reoction oxyde-gaine ( U - Z r - C s - G )
experiences PRISCA
ETUDE OE LA PUISSANCE ADMISSIBLE EN FONCTION DS LA C0M3USTI0N MASSIQUE
5000 1G000 _ J I —
200C0 30000 MWd/ t U
F1G.11. STUDY OF THE ADMISSIBLE POWER AS A FUNCTION OF BURNUP
Neutron radiography: IS!
The neutron radiography benches installed in the pool near the reactor cores offer the possibility of obtaining very detailed pictures of the samples, very shortly after the end of irradiation. The capsules and loops connected to the out-of-core circuits with the flexible piping can be transferred to the test benches without having to disconnect the mechanical links.
Neutron radiography is carried out on two types of picture:
dysprosium for fuel images . nitrocellulose for clads.
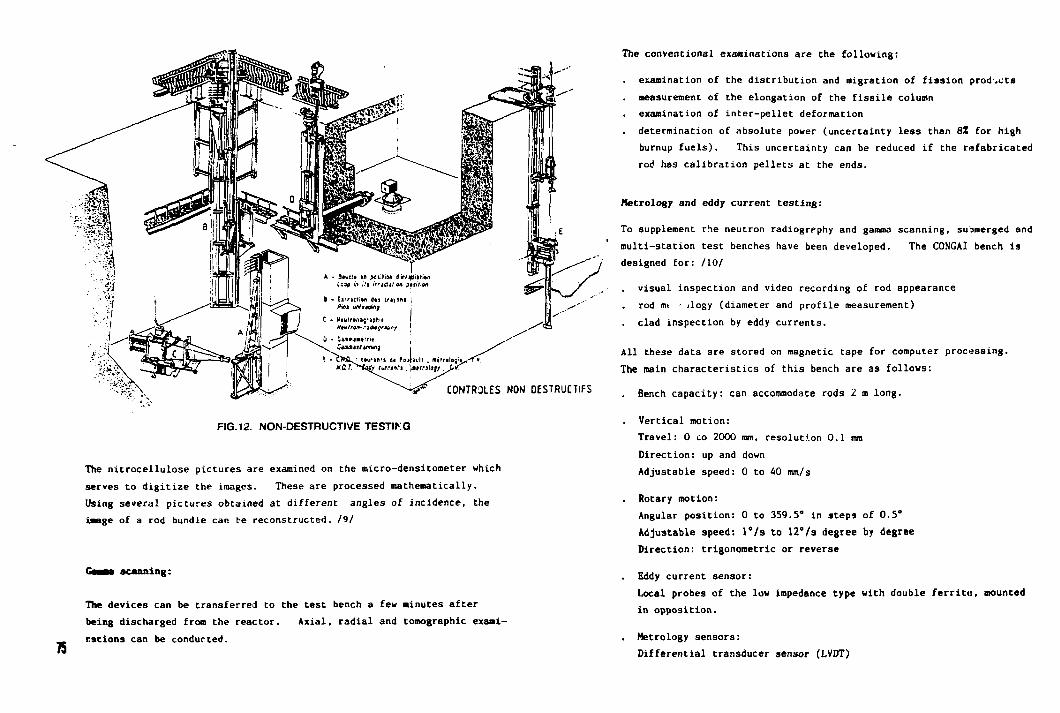
FIG. 12. NON-DESTRUCTIVE TESTIKG
The nitrocellulose pictures are examined on the micro-densitometer which serves to digitize the images. These are processed mathematically. Using several pictures obtained at different angles of incidence, the iaage of a rod bundle can be reconstructed. /9/
Gaaaa scanning:
The devices can be transferred to the test bench a few minutes after being discharged from the reactor. Axial, radial and tomographic exami-nations can be conducted.
75
The conventional examinations are the following:
examination of the distribution and migration of fission products . measurement of the elongation of the fissile column
examination of inter-pellet deformation determination of absolute power (uncertainty less than 8X for high burnup fuels). This uncertainty can be reduced if the refabricated rod has calibration pellets at the ends.
Metrology and eddy current testing:
To supplement the neutron radiography and gamma scanning, submerged and multi-station test benches have been developed. The CONCAI bench is designed for: 1101
visual inspection and video recording of rod appearance rod nu • jlogy (diameter and profile measurement) clad inspection by eddy currents.
All these data are stored on magnetic tape for computer processing. The main characteristics of this bench are as follows:
Bench capacity: can accommodate rods 2 m long.
Vertical motion: Travel: 0 co 2000 mm, resolution 0.1 mm Direction: up and down Adjustable speed: 0 to 40 mm/s
Rotary motion: Angular position: 0 to 359.5° in steps of 0.5" Adjustable speed: l°/s to 12°/s degree by degree Direction: trigonometric or reverse
Eddy current sensor: Local probes of the low impedance type with double ferrite, mounted in opposition.
. Metrology sensors: Differential transducer sensor (LVDT)
76 7. MAIN EXPERIMENTS
Three series of experiments can be distinguished:
experiments conducted under mul' partite French programmes (CEA, FRAMATOME or CEA-Electricite de France or CEA-FRAMATOME-Electricite de France)
those carried out for foreign clients
. those specific to C£A for the analysis of fuel behaviour during slow or fast transients (rampings and cyclings).
The multipartite programmes were aimed at: /ll/
. determination of the operating limits in variable conditions of spent rods with burnups ranging from 20,000 to 50,000 MWd/tU and discharged from experimental or power reactors (about 60 experiments in the AQUIL0N and JET-POMPE devices).
. clad-pellet interaction investigations with power history with a succession of high and low levels (GRIFFON capsule. ISABELLE 1 loop).
fission product release investigations on high burnup fuels (GRIFFON cap:, le)
feasibility of fertile rods for advanced reactors in the ISABELLE 4 loop
. effects of load adjustment on rod behaviour during a power excursion (ISABELLE 1 loop)
analysis of operating margins on a bundle of four pre-irradiated rods
(ISABELLE 4 loop)
Experiments for foreign customers were aimed at the study of the thermal response of instrumented fuel rods at the core and periphery of the pellet in the BOSS capsule during fast power excursions ( > 10 W/cm.s).
Specific investigations related to the release of solid and volatile fission products at various power levels on fuel rods, with an initial defect or induced during irradiation, were conducted in the JET-POMPE loop. The effects of load following by power cycling of 0.5 P to P were investigated in the IRENE loop (more than 3600 cyclings for the same experiment).
8. CONCLUSIONS
The CEA/DERPE has the resources and the knowhow to carry out irradiations of new and spent fuel rods, in variable power conditions, and to supply precise information on their behaviour, especially concerning the important mechanism of clad-fuel interaction.
The demands of the experimental workers concerning the quality of the measurements, the many and accurate data acquired under irradiation, and the speed of analysis of the experiments, are guiding our efforts towards a level of automation aimed to improve measurement acquisition and to synthesize the results rapidly.
REFERENCES
/ 1 / FRIBOULET C. - REY G. - CLEIZES B - B0URBOUSS0N P. Disposltlts d'irradiatlon pour les aiguilles coabustlbles de la fl-liere a eau legere 26eme Plenary Meeting - IDWG - GKSS - GEESTHACHT 1980
12/ LUC0T M. - VIDAL H. La boucle ISABELLE dans le rSacteur experimental OSIRIS International Colloquium on Irradiation tests for reactor safety programs - PET1EN - juln 1979
/ LUCOT H. La boucle ISABELLE 4, boucle d'essai PWR dechargeable et rechargeable dins la piscine du rSacteur OSIRIS International Topical Meeting on Irradiation Technology IDWG - GRENOBLE 1932
/ 4 / LUCOT M. - OBIS N. Coaaande-contrSle de la boucle d'esssal IRENE dans le rSacteur experimental OSIRIS 26Sne Croupe de Travail Euratoa - PETTEN 1980
/ 5 / LUCOT M. - ROCHE M. La boucle OPERA dans le coeur du rSacteur OSIRIS 29eoe Plenary Meeting of the European Working Group on Irradiation Technology - KARLSRUHE - septeabre 1986
/ 6 / JECAT A. - VULLIE2 P. - FRIBOULET C. - B0URB0USS0N P. u' Instrumentation des experiences KAMPES pour la flliere a eau pres-surlsee International Topical Meeting on Irradiation Technology IDWC - GRENOBLE 1982
1 1 1 FRIBOULET C. - VOITURIEE B. Mesure de longueur d'un crayon combustible en cours d'Irradiation IDWC - BRASIMONE 1984
/ 8 / PERSON J.L. - DUCROS G. and all Neutron Radiography In CEA Research Centers 2nd International Meeting of Neutron Ridioj'-'-hy - PARIS - June 86
/ 9 / RI20 P. Tonography using neutron radiography photographs for a beaa of several fjsls pins 2nd International Meeting of Neutron Radiography - PARIS - June 86
/10 / FAURE M. - MARCHAND L. Coot roles non destructlfs de crayons combustibles par courant de Foucault et oetrologle dans la piscine OSIRIS ?eae Conference Internationale sur les Controles non destructlfa GRENOBLE 1985
/ll / LEF2BRE F. (DMG) - JOSEPH J. (FRA) - ROYER J. (D.TECH/CEA) Power camping test programme on CEA fuel rods during the years 1984 to 1986
IAEA-TC-624/23 INVESTIGATION OF MULTI-RAMP AND LOAD FOLLOWING BEHAVIOUR OF LWR FUEL RODS AT THE HFR PETTEN
J.F.W. MARKGRAF, D.J. PERRY Joint Nuclear Research Centre, Commission of the European Communities, Petten I.A. RUYTER Zentralabteilung Rrennelement- und
Bestrahlungstechnologie, Kernforschungsanlage Jiilich GmbH,
, Jiilich, Federal Republic of Germany G. FISCHER, F. SONTHEIMER Kraftwerk Union AG, Erlangen, Federal Republic of Germany
Abstract
Experimental programmes addressing the multi-ramp and load following behaviour of LWR fuel rods have been carried out at the HFR Petten as a joint undertaking of KFA JUlich, KWU Erlangen and JRC Petten.
The aim of both programmes was to demonstrate that LWR fuel provides the necessary operational flexibility with regard to fuel management and modern power control strategies.
The multi-ramp behaviour of fuel rods with a pre-irradlatlon burnup of 9 to 19 GWd/t(U) for the BWR rods and 25 to 32 GWd/t(U) for the PWR rods was Investigated. The prelrradlatlons In all cases were performed in commercial power reactors. Ramp tests were executed after a brief conditioning period at the HFR and again after a burnup Increment of max. 10 GWd/t(U) had been retched. One fuel rod was exposed to a third ramp test after an additional burnup Increment. In general, these tests yielded the following results :
Fuel rods are multi-ramp resistant
* if the power ramp history at incremental burnupa of up to 10 GWd/t(U) is comparable as to power level and
* if the successive power ramps exceed the previous power ramp level by leas than SO W/cm LHGR.
The load following tests with PWR fuel rods having a burnup level up to 40 GWd/tCU) has further confirmed the excellent
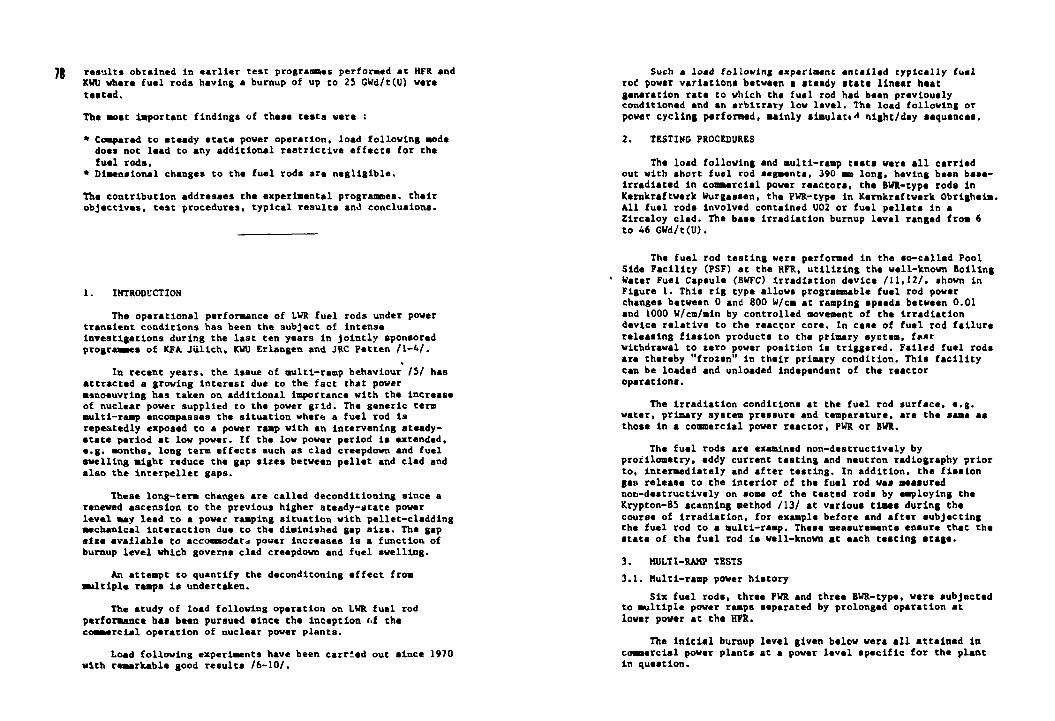
results obtained in earlier test progrannes perforaed at HFR and KWU what* fuel rods having a burnup of up to 25 GWd/t(U) war* tasted. The aoat important findings of thai* tests were :
* Compared to ateady atate power operation, load following soda does not lead to any additional restrictive effects for the fuel rods,
* Dlaenalonal changes to the fuel rods are negligible.
The contribution addresses the experimental programmes, their objectives, test procedures, typical results and conclusions.
1. INTRODUCTION
The operational performance of LWR fuel rods under power transient conditions has been the subject of Intense investigations during the last ten years in Jointly sponsored programmes of KFA Jiillch, KWU Erlangen and JRC Petten /1-A/.
« In recent years, the issue of atulti-ramp behaviour /5/ has
attracted a growing Interest due to the fact that power •anoeuvring has taken on additional importance with the increase of nuclear power supplied to the power grid. The generic term multi-ramp encompasses the situation where a fuel rod is repeatedly exposed to a power raap with an intervening steady-state period at low power. If the low power period is extended, e.g. months, long term effects such as clad creepdown and fuel swelling might reduce the gap sizes between pellet and clad and also the interpellet gaps.
These long-term changes are called deconditioning since a renewed ascension to the previous higher steady-state power level may lead to a power ramping situation with pellet-cladding mechanical interaction due to the diminished gap size. The gap size available to accoanodar* power increases Is a function of burnup level which governs clad creepdown and fuel swelling.
An attempt to quantify the decondltoning effect from multiple ramps is undertaken.
The study of load following operation on LWR fuel rod performance has been pursued since the Inception <>f the commercial operation of nuclear power plants.
Load following experiments have been carried out since 1970 with remarkable good results /6-10/.
Such a load following experiment entailed typically fuel rod power variations between a steady state linear heat generation rate to which the fuel rod had been previously conditioned and an arbitrary low level. The load following or power cycling performed, mainly simulate* night/day sequences.
2. TESTING PROCEDURES
The load following and multi-ramp tests were all carried out with short fuel rod segments, 390 mm long, having been baae-Irradiated in commercial power reactors, the BWR-type rods In Kernkraftwark Wurgassen, the PWR-type in Kernkraftwerk Obrlghelm. All fuel rods Involved contained U02 or fuel pellets in a Zircaloy clad. The base irradiation burnup level ranged from 6 to 46 GWd/t(U).
The fuel rod testing were performed in the so-called Pool Side Facility (PSF) at the HFR, utilizing the well-known Boiling Water Fuel Capsule (BWFC) irradiation device /I1,12/, shown in Figure 1. This rig type allows programmable fuel rod power changes between 0 and 800 W/cm at ramping speeds between 0.01 and 1000 W/cm/mln by controlled movement of the irradiation device relative to the reactor core. In case of fuel rod failure releasing fission products to the primary syctem, fast withdrawal to zero power position is triggered. Failed fuel rods are thereby "frozen" in their primary condition. This facility can be loaded and unloaded independent of the reactor operations.
The irradiation conditions at the fuel rod surface, e.g. water, primary system pressure and temperature, are the same as those in a commercial power reactor, PWR or BWR.
The fuel rods sre examined non-destructlvely by proiilometry, eddy current testing and neutron radiography prior to. Intermediately and after testing. In addition, the fission gas release to the interior of the fuel rod was measured non-deatructlvely on some of the tested rods by employing the Krypton-85 scanning method /13/ at various times during the course of irradiation, for example before and after subjecting the fuel rod Co a multi-ramp. These measurements ensure thac the state of the fuel rod is veil-known at each testing stage.
3 . MULTI-RAM? TESTS
3.1. Multi-ramp power history Six fuel rods, thrse PWR and three BWR-type, were subjected
to multiple power ramps separated by prolonged operation at lower power at the HFR.
The initial burnup level given below were all attained in commercial power planta at a power level specific for the plant In question.
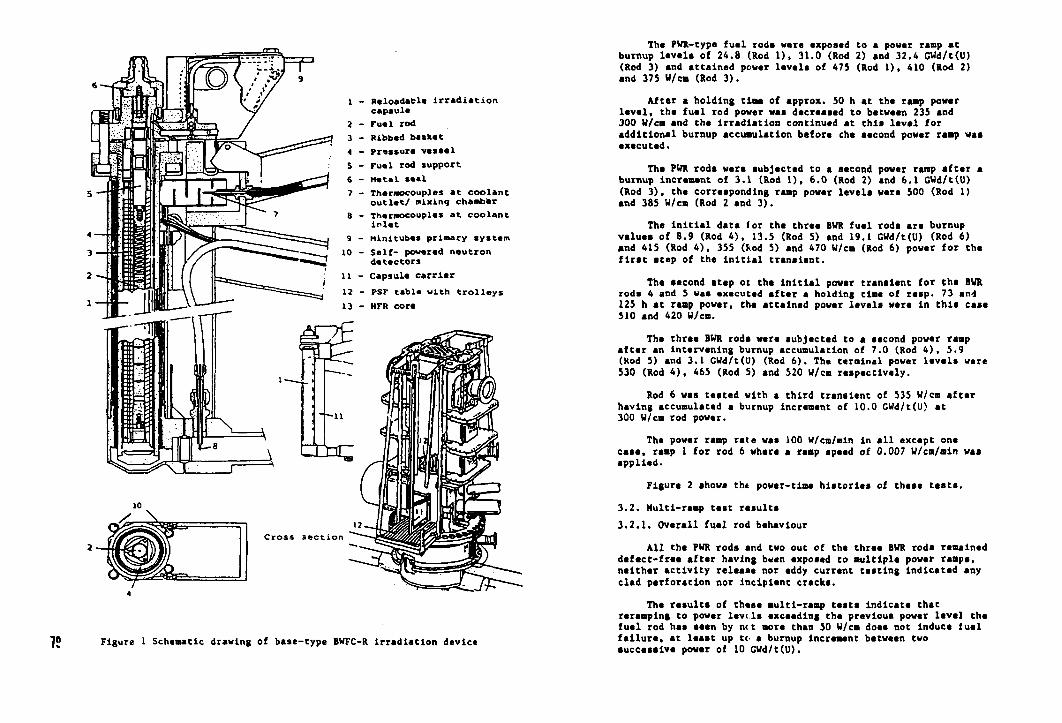
1 - Reloadable irradiation capsule
2 - Fuel rod 3 - Ribbed basket 4 - Pressure vessel 5 - Fuel rod support 6 - Hetal seal 7 - Thermocouples at coolant
o u t l e t / nixing chamber 8 - Thermocouples a t coolant
i n l e t 9 - Minitubes primary system
10 - Self- powered neutron detectors
11 - Capsule carrier 12 - PSF table with t r o l l e y s 13 - HFR core
Cross section
75 Figure 1 Schematic drawing of base-type BWFC-R Irradiation device
The PWR-type fuel rode were exposed to a power ramp at burnup levels of 24.8 (Rod 1), 31.0 (Rod 2) and 32.4 CWd/t(U) (Rod 3) and attained power levels of 475 (Rod 1), 410 (Rod 2) and 375 W/cm (Rod 3).
After a holding tine of approx. 50 h at the ramp power level, the fuel rod power waa decreased to between 235 and 300 W/cm and the Irradiation continued at this level for additional burnup accumulation before che second power ramp was executed.
The PWR rod* were subjected to a second power ramp after a butnup Increment of 3.1 (Rod 1), 6.0 (Rod 2) and 6.1 GWd/t(U) (Rod 3), the corresponding ramp power levels were 500 (Rod 1) and 385 W/cm (Rod 2 and 3).
The Initial data for the three BWR fuel rods are burnup values of 8.9 (Rod 4), 13.5 (Rod 5) and 19.1 GUd/t(U) (Rod 6) and 415 (Rod 4), 355 (Rod 5) and 470 W/cm (Rod 6) power for the first step of the initial transient.
The second step ot the initial power transient for the BWR rods 4 and 5 was executed after a holding time of resp. 73 and 125 h at ramp power, the attained power levels were in this case 510 and 420 W/cm.
The three BWR rods were subjected to a second power ramp after an intervening burnup accumulation of 7.0 (Rod 4), 5.9 (Rod 5) and 3.1 CWd/t(U) (Rod 6). The terminal power levels were 530 (Rod 4), 465 (Rod 5) and 520 W/cm respectively.
Rod 6 was tested with a third transient of 535 W/cm after having accumulated a burnup increment of 10.0 CWd/t(U) at 300 W/cm rod power.
The power ramp rate was 100 W/cm/mln In all except one case, ramp 1 for rod 6 where a ramp speed of 0.007 W/cm/mln was applied.
Figure 2 shows thi power-time histories of these tests.
3.2. Multi-ramp test results 3.2.1. Overall fuel rod behaviour
All the PWR rods and two out of the three BWR rods remained defect-free after having bwcn exposed to multiple power ramps, neither activity release nor eddy current testing Indicated any clad perforation nor incipient cracks.
The results of these multl-ramp tests indicate that reramping to power levt.ls exceeding the previous power level the fuel rod has seen by net more than 50 W/cm does not Induce (uel failure, at least up tc a burnup Increment between two successive power of 10 CWd/t(U).
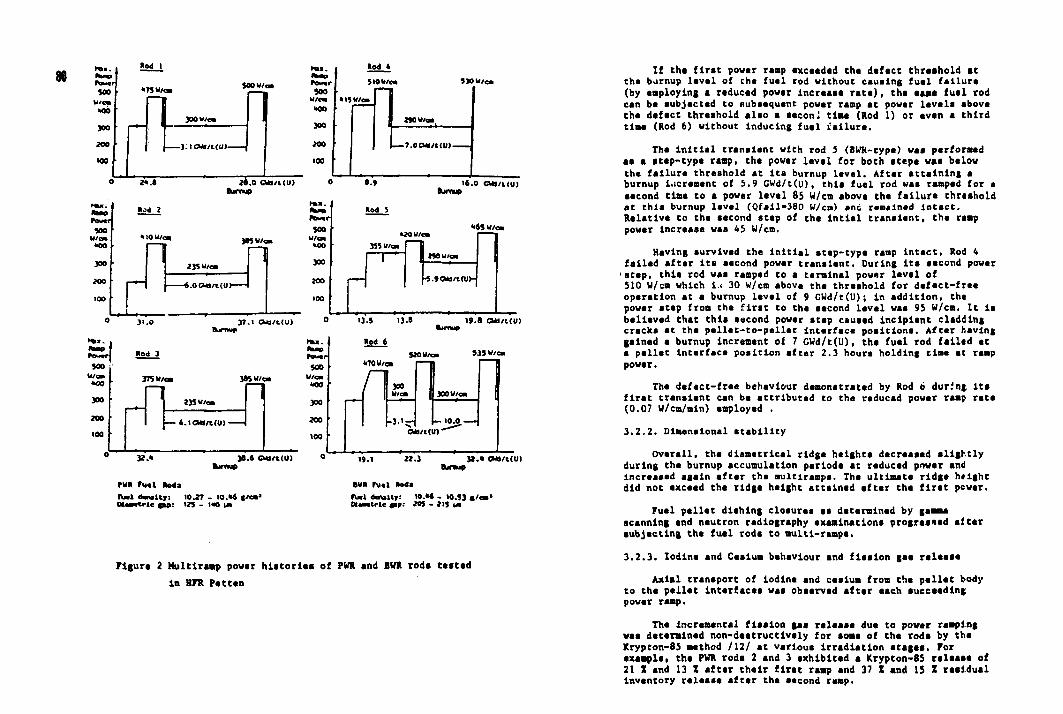
80 m«.
y/<
»o4 I
*T5W/ei SCOw/a
n I 300U/OI L— ( 3.ICVU/KI
K l « . <*«0 l>umr WO
U/M •00
300
M O
100
>od *
510 W / « I R V / a i
l l t W o
now/ca
- 7 . 0 C U I / t < U > -
o 2».a
Power V »
W/CB
«oo 300
200 •
too •
ii.o cum(u) o ».» Burnup Bjcnuo
14 .0 C V B / K U )
235 W/a
3*5 u/w
1
0 3 1 . 0
rSr| «0<1 3 500
W/GH *00
300
200
100
3T5W/CB
3 7 . 1 CUJJt(U)
3WX/Q
Pow«r SCO
U/OM
• 0 0
300
200
100
0
* « S H/o
35SM/c» | |
I I ' I **""° — J [-5.SCWH 5 .9CUd/ t (U>
13.5 13.B 19 . • O k J / M U ) a jmup
1 235 u / a
I — 6 . 1 0 U / 1
».«
rwa rw«i nods
anna 3S.6 CU)/C<U) 0
ill Hod 6 S » u u 535 u/ ON
500 U/CB •00
«70U/«a
H/t<
300W/ea 300
200
100
- 3 . 1 -CU H/t<
_ I O J O . — -
I W l d e n s i t y : 10.27 - 1 0 . » * l / c n " D U M t r l c ( * p : 125 - M 0 i a
l » . l 22 .3 3 2 . « CVU/C<U) turnup
awn r u i l aaaa
f u e l ocft t l ty: I0 .«4 - 10.53 « / € • > O M a e t r l c * *» • ' 20S - 2 1 ) u i
Figure 2 Hultlramp powar hlatorlaa of PWR and BWR rod* tastad In HFR Pattan
If tha first powar ramp axcaadad tha dafact threshold at tha burnup laval of the fual rod without earning fuel failure (by employing a reduced power Increase rate), the I I U fuel rod can be aubjacted to subsequent power ranp at powar leveli above tha defect threshold also a second time (Rod 1) or even a third time (Rod 6) without Inducing fuel failure.
The Initial transient with rod 5 (BWK-eypc) was performed aa a step-type ramp, the power level for both eteps was below the failure threshold at lta burnup level. After attaining a burnup increment of 5.9 GWd/t(u), thla fuel rod wes ramped for a second time to a power level 85 U/cm above the failura thrtshold at thla burnup level (Qfsil-380 W/cn) and remained Intact. Relative to the second step of the intlal transient, the ramp power Increase waa 45 U/cm.
Having survived the Initial atap-type ramp Intact, Rod 4 failed after its aacond power tranaiant. During its second power 'step, this rod waa ramped to a terminal powar level of 510 U/cm which i.« 30 U/cm above the threahold for defect-free operation at a burnup level of 9 CUd/t(U); in addition, the power atep from tha first to tha aecond level was 95 W/cm. It is believed that this second powar step caused incipient cladding cracks at the pellec-to-pellet Interface position*. After having gained a burnup increment of 7 GWd/t(U), the fuel rod fallad at a pallet interface position after 2.3 hours holding time at ramp power.
The defect-free behaviour demonstrated by Rod o during its first tranaient can be attributed to the reduced power ramp rate (0.07 U/cm/min) employed .
3.2.2. Dimensional stability
Overall, tha diametrical ridge heighta decreased slightly during tha burnup accumulation periods at reduced power and increased again after the multlrampa. Tha ultimate ridge height did not exceed the ridge height attained after the first power.
Fuel pellet dishing closurea as determined by gamma scanning and neutron radiography examinations progressed after subjecting the fuel rode to multi-ramps,
3.2.3. Iodine and Caaium behaviour and fission gaa release
Axial transport of iodlna and caaium from the pellet body to the pellet interfacaa was observed after each eucceedlng powar ramp.
Tha Incremental fission gas release due to power ramping was determined non-deetructlvely for some of the rods by the Krypton-85 method /12/ at varloua irradiation atages. Por example, the PWR rode 2 and 3 exhibited a Krypton-85 release of 21 X and 13 X after their flrat ramp and 37 X and IS X residual inventory releaae after the eecond ramp.
The equivalent figures for rod 5 (BWR-typ^) were 4 X and 7 Z for the two steps of the Initial ramp and iO Z Kr-85 release for the second power ramp. Rod 4 reached 40 Z 1 r-85 release after Its second step of the initial rasp.
3.3 Multi-ramp conclusions
The tests performed have shown the multi-ramp behaviour of both PWR and BWR fuel rot's to be quite satisfactory.
None of the rasped rods that were operated below the PCI failure threshold showed any deconditloning trends.
Burnup increaents of up to 10 BWd/t(U) attained at reduced LHGR (235 to 300 W/ca) had no detrimental effect on the reliability of the tested fuel rods having been subjected to multiple power ramps lasting for approx. SO hours.
The tests even demonstrated that the power levels of successive transient tests may exceed the previous one by SO W/ca without inducing fuel failure.
If, howevei> the failure threshold or safe power step rule is violated, this may cause incipient cracks in the cladding to develop vhlch may lead to a penetrating crack when the fuel rod is subjected to a similar power ramp later in life. It is postulated that this caused rod 4 to fail.
Power ramps expose the fuel rod to various physical effects. During the first power ramp, the fuel pellet fragments which tend to relocate during base Irradiation ate partially fused together into their original pellet geometry due to the mechanical interaction between fuel fragments and the cladding. At the subsequent reduced power level after the ramp, the overall thermal contraction of the fuel pellet forms a gap between pellet and cladding. This gap formation and the incremental fission gaa release caused by the power ramp, the gap conductance between pellet and cladding is reduced, causing the fuel to run at a higher temperature and as a result of this, the fission gas release is enhanced.
In general, the conditions for fission gaa release at successive power raapa are different from those prevailing during the first power ramp. This is due to the fact that the major part of the flsaion gases which had accumulated at the fuel grain boundaries during base irradiation has been drained during the first power ramp, at least in the hot centre pellet region and grain growth tends to delay further fission gas diffusion to grain boundaries.
81
During subsequent power ramps the existing residual gap between pellet and cladding as well as the Increased fuel temperature and plasticity would tend to abate the mechanical PCI and hence prevent the fuel rod failure.
This mechanistic approach might help to explain the experimental results. The low fuel rod failure probability and overall reduced ridge height format .ten Indicate the reduced PCI caused by multiple power ramps. However, the enhanced fission gas release would also cause the fuel temperature to Increase, moreover, fuel micro-cracking and fission gas channels at grain boundaries remaining after previous power raaps would also contribute to enhanced fission gas releaia.
The burnup-dependent fuel swelling would have an opposite effect, by reducing the pellet-cladding gap, the fuel temperature is reduced and hence the fission gaa release alto.
4. LOAD FOLLOWING TESTS 4.1. Load following behaviour of PWR fuel rods
For the present load following experiasnts, two PWR-type fuel rods were pre-irradlated in a commercial power reactor for respectively two and three reactor cycles to burnup levels of 25 and 35 GWd/t(U) respectively.
The fuel rods were thoroughly checked at the hot cells in Karlstein and their faultless conditions were confirmed.
At the HFR Petten, these fuel rods were subjected to 54 and 60 simulated day/night power cyclings respectively.
Figure 3 shows schematically the power/time relationship valid for the two load following experiments.
The fuel rod power was increased from the pre-lrradlatlon power level <Qpre»250 W/cm) to the maximum power level (100 Z) of between 320 and 360 W/cm and then carled between this value and 70 Z thereof. Within 24 hours, the fuel rods were kept for 16 hours at full power, 7.5 hours at 70 X thereof and 0.5 hours at the so-called power overshoot level (Qxa»370-400 W/cm).
This power overshoot simulates Xenon depletion effects which can occur under certain operating conditions, and ths power level Is close to the fuel failure threahold which has been deteralned by power reap experiments. See Figure 4.
Both fuel rods were examined during and after the tests as well as between individual power cycles, with special emphasis on the dimensional behaviour of the fuel rods.
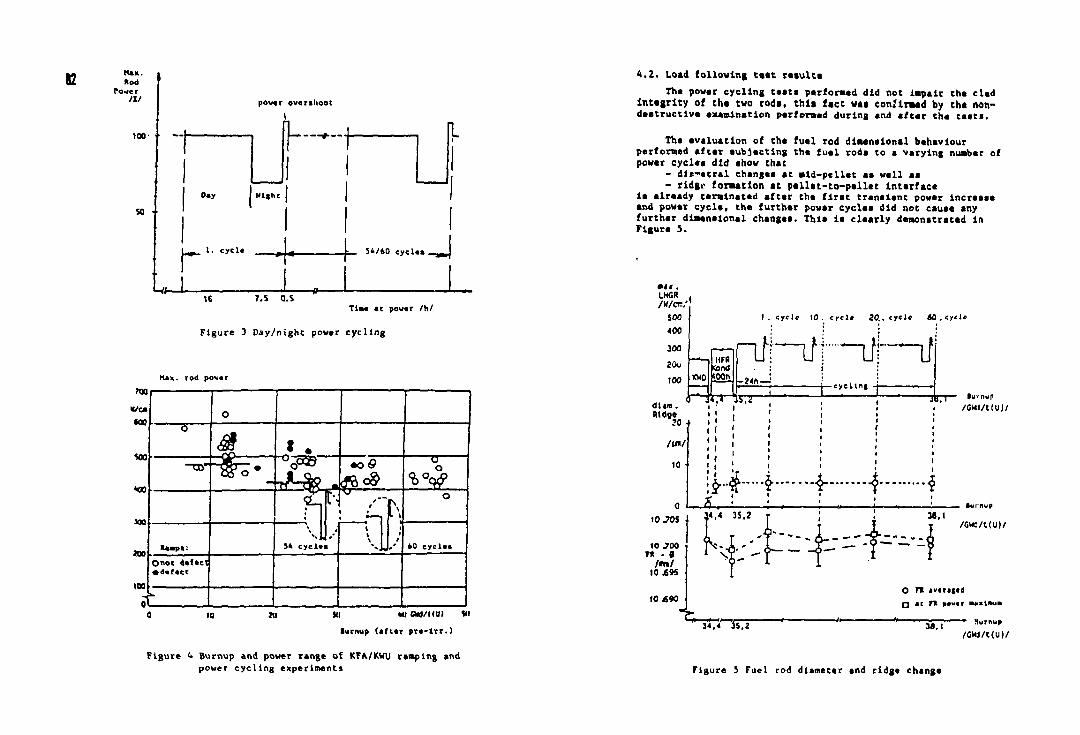
82 Red Power
m
too
pov«r overshoot
SO
l-tf-
Dey
1. cycle
t-f |L
Nl»hc
54/60 cycle* .
IS 7,5 0.S Time at power / h /
F i g u r e 3 D a y / n i g h t power c y c l i n g
Max. rod power TOO
soo
VM
•00
X »
^ " Z ^ " « . rj5©~ "TT"
o
zsfcfe
no
100
Reap*:
F $
• O C ?
^9£_
54 cyclee 60 cycle* Onot a*(ect • defecc
oL 10 lu VI Ml OHJ/UUt VI
lurnup (after p r e - l r r . )
Figure 4 Burnup and power range of KFA./KWU ramping and power cycling experiments
4,2. Load following teat results Th* power cycling taata performed did not Impair cha clad
integrity of the two rods, this fact was confirmed by tht nondestructive examination performed during and after the testa.
The evaluation of the fuel rod dimensional behaviour performed after subjecting the fuel rods to a varying number of power cycles did show that
- dis-acral changes at Bid-pellet as wsll as - rldgi' formation at pallet-to-pallet Interface
Is already terminated after the flrat translsnt power lncreaae and power cycle, the further power cycles did not cause any further dimensional changes. This Is clearly demonstrated In Figure 5.
•4« . IHGR /V/C5, SOO 400 300 20u too KW0
dUm. Ridge
?0 4
/u»/
10
Jr-j*
0 10.705
10 J00 r*. . a /m/ IOJBW
10 £90
•fc
HFR tend toon
1. cycle 10 . eye la 20 . .cyc le 60 .cyc le
piJt—LT'I ~ r f !—Lf -24h—i -cyc l ing
•srr / G K I / t t U ) /
j : ! ' i i §•••$ i 4- •$ i
~4-4» 38,1 lurnup
/CMC/t(U|/
«» It ' 11 34.4 iS,2
o in tfttft O *c F*. eever euiitlAuM
—• Hurnup /GW/t(U)/
34.1
Figure 5 Fuel rod diameter and ridge change
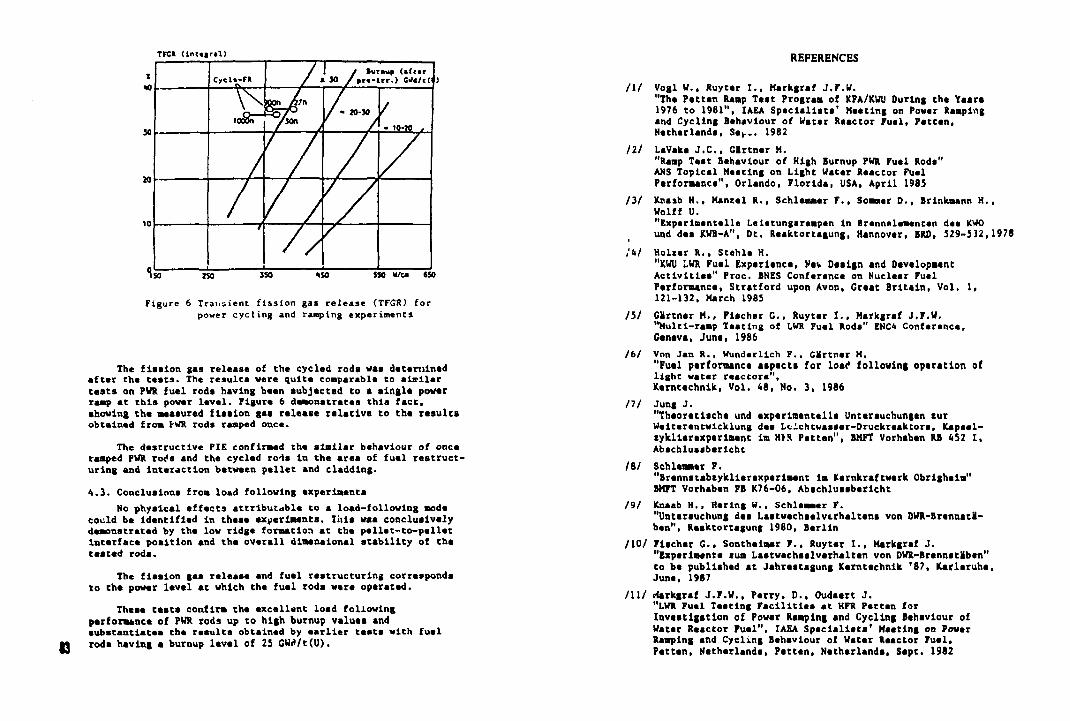
TFCR (lnt«jr«l)
10
»
CyclWR / 1 1 7 tutnup (afcvr . 30 / pra-lrr.) G»f4/c<' )
»0o0n /son . / • 20-30
• 10-» ,
/ /
/ i
ISO $50 V/ca «S0
Figure 6 Transient fission gas release (TFGR) for power cycling and ramping experiments
The fission gas release of the cycled rods was determined after the tests. The results vere quite comparable to sisilar tests on PUR fuel rods having been subjected to a single power reap at this power level. Figure 6 demonstrates this fact, ahowing the measured fission gas release relative to the results obtained from rWR rods ramped once.
The destructive PIE confirmed the similar behaviour of once ramped PUR rods and the cycled ro-is In the area of fuel restruct uring and interaction between pellet and cladding.
4.3. Conclusions from load following experiments No physical effects attributable to a load-following mode
could be identified in theae experiments. Ihls was conclusively demonstrated by the low ridge formation at the pellet-to-pellet interface poaitlon and the overall dimensional stability of the tasted rods.
The fission gas release and fuel restructuring corresponds to the power level at which the fuel rods were operated.
These tests confirm the excellent load following performance of PWR rods up to high burnup values and substantiate* the results obtained by earlier tests with fuel
M rods having a burnup level of 25 CW<Vt(U).
REFERENCES
l\l Vogl W., Ruyter I., Markgraf J.F.W. "The Petten Ramp Test Program of KFA/KWU During the Years 1976 to 1981", IAEA Specialists' Meeting on Power Ramping and Cycling Behaviour of Water Reactor Fuel, Petten, Netherlands, S*»... 1982
111 LaVaka J.C., Gartner M. "Ramp Test Behaviour of High Burnup PWR Fuel Rods" ANS Topical Meeting on Light Water Reactor Fuel Performance", Orlando, Florida, USA, April 1983
/3/ ICnasb H., Mantel R., Schlemmer F., Sooner D., Brinkmann H., Wolff U. "Experimantelle Lelatungarsmpsn in Brannelementen des KWO und dea KWB-A", Dt. Rssktortagung, Hannover, BRD, 329-332,1978
;i>l Holier R., Stehle H. "KWU LWR Fuel Experience, Nev Design and Development Activities" Proc. BNES Conference on Nuclear Fuel Performance, Stratford upon Avon, Great Britain, Vol. 1, 121-132, March 1985
III Gartner M., Fischer G., Ruyter I.. Markgraf J.F.W. "Multi-ramp Teatlng of LWR Fuel Rods" ENC4 Conference, Geneva, June, 1986
/6/ Von Jan R., Wunderllch F.. Gartner M. "Fuel performance aspects for loa<* following operation of light water reactors", Kerntechnlk, Vol. 48, No. 3, 1986
111 Jung J. "Theoretische und experlmentella Unterauchungan tur Weiterentwlcklung dea Ltichtwassar-Druckreakcors, Kapsel-sykllarexperiment im HIR Patten", BMFT Vorhaben RB 452 I, Absehlussbericht
HI Schlemmer F. "Brennstabiykllerexperlment im Kernkraftwerk Obrighelm" BMFT Vorhaben FB K76-06. Abschlussberlcht
/9/ Knaab H., Hering W., Schlemmcr F. "Untersuchung des Laetwechaalvirhaltens von DWR-BrennstV-ben". Resktortagung 1980, Berlin
/10/ Fischer G., Sontheimer F., Ruyter I., Markgref J. "Experiments sua Lastwschsslverhalten von DWR-BrsnnstMbsn" to be published at Jahrsstagung Kerntechnik '87, Karlsruhe, June, 1987
/U / rlarkgraf J.F.W.. Parry. D., Oudaert J. "LWR Fuel Teating Facilities at HFR Petten for Investigstion of Power Ramping and Cycling Behaviour of Water Reactor Fuel", IAEA Specialists' Meeting on Powsr Ramping and Cycling Behaviour of Water Reactor Fuel. Petten, Netherlands, Pstten, Netherlands, Sept. 1982
A 2 / Harkgraf J.F.U. "HFR irradiation Testing of light water (LWR) fu«l". EUR 9654 EN. 1985
IXJI Markgraf J.F.W., Da»s«l G., Fischer C , Ruyter I., Wlrti R. "Non-destructive determination of *'.salon gas release In rasp-tasted LWR fuel rods", IAEA Specialists' Meeting on Light Water Fuel Performance and Technology, Tokyo, Japan, November 26-30, 1984.
IAKA-TC-624/25
KWU'S EXPERIMENTAL BASIS FOR POWER RAMPING AND CYCLING PERFORMANCE OF LWR FUEL
H. KNAAB, M. GARTNER, F. SONTHEIMER Kraftwerk Union AG, Erlangen, Federal Republic of Germany
Abstract
Right from the beginning of commercial operation of nuclear power plants KWU has studied the consequences of load follow operation for the fuel performance. The first power cycling experim«nts were started in 1970 in KWO and HFR Petten. Altogether four power cycling tests h a v been performed at various power and burnup levels. The fuel rod performance compares well with fuel rods und«r steady operating conditions at comparable power levels, demonstrating the excellent load follow capability of Zry/U02 fuel rods. After recognition of the PCI failure mechanism KWU initiated also an experimental power ramping programme on the basis of pre-iiradiating segmented rods in power reactors and subsequent ramp testing in the HFR Petten. These tests were hacked by ramping of KWU rest rods in many international power ramp p-.ojects conducted by Studsvik Energiteknik. Additionally, integral power ramp tests were performed in KWO and KWB-A to verify the applicalility of the results gained in the research reactors to the power reactcrs on a broader statistical scale. The paper provides a synopsis of the power ramp tesc results and an analysis in the frame of the RSST*'-approach:
- Failure thresholds (safe range) were determined for PViR rods up to 45 GWd/t(U) and BUR roa; up te 35 GWd/t(U); pellet density and pellet to clad gup were important variables
- The safe power step above the threshold from a conditioned power level could be derived for BWR rods up to 20 GWd/t(U)
- Power ramp speeds for safely passing the threshold were determined with BWR rods up to 30 GVJd/t(U)
- The safe time was determined to be in the range of minutes, a time span well above the duration of reactivity induced transients
Multiple ramp tests were performed to study the de-conditioning during further irradiation. The above experimental data together with the operational experience from power reactors form the basis for defining operating guidelines and control system set points for KWU power plants.
*") RSST - Safe Range, safe £tep, safe Speed, safe Jime
1. Introduction
The consequences of load follow operation for the fuel performance have always obt 'ir.ed much acteucion by KWU. Already during the planning phase of the first nuclear plants, the utilities requested the same load follow capabilities to be realized as in conventional plants. This prompted theoretical evaluations on the basis of the early fuel rod design models which led to the fear that the differential thermal expansion between the UO2 pellets and Zircaloy clad could lead to fatigue of the clad due to cyclic plastic st rain.
In 1970 two cycling experiments were started to study the real in-reactor behaviour in simulated dav-and-night power cycles. A single rod test was performed in a newly designed and built boiling-capsule in the HFR at Petten. During the first refueling of the Ohrigheim power reactor (KWO) a specially designed cycling rig together with a host fuel assembly was installed in the centre position of the reactor core. Eight fuel rods weie assembled like a vod-controi-cluster and were axiaily moved by the control rod drive mechanism in appropriate guide tubes of the fuel assembly between high and low power positions. The results of these tests have clearly shown that power cycling does not impede the fuel rod performance.
Shorty thereafter, fuel failures occurred in power reactors which could be attributed Co power increases above previous levels. Such defects were first experimentally verified in the !;«li»n test reactor and the pellet-clad-interact ion (PCI) failure mechanism was identified. KWU initiated already in 1973 a power ramping programme by pre-irradiation of segmented fuel rods in the power reactors KWO and KWW (Ketnkraftwerk Wiirgassen). After appropriate burnup accumulation, these rods were ramp tested in the same test facilities in the HFR Petten, which were originally installed for the cycling test. About 200 ramp tests have been performed up to now cid the programme is still going on with a reduced number of experiments with MOX rods and some UCH rods using special test schemes.
In parallel KWU test rods were ramp tested in many of Che international power ramp projects conducted by Studsvik Energiteknik in Sweden. These tests complemented and confirmed the Petten programme and gave also valuable information on the ramping performance of the test rods supplied by other vendors.
Additionally, in-core power ramp tests were performed in K.WO and KWB-A (Kernkraftwerk Biblis-A) to verify the applicability of the research reactor results to the power reactors.
2. Definition of "power cycling" and "power enping"
Both "power cycling" and "power ramping" refer to local power changes of the nuclear fuel.
Power changes 01 cue cycling type are periodic and repetitive with respect to amplitude and duration, starting always from an upper power level to a reduced one and returning to the previous power.
Pellet clad mechanical interaction (PCMI) during periodic power cycling is very mild because the fuel rod is in a mechanical equilibrium condition prior to reducing the power level and returns to this equilibrium condition when the power is increased again.
Power changes of the ramp type on the other hand are sporadic and variable in amplitude and duration and are characterized as a power increase above a previous operating power level, refered to as "conditioned" linear heat generation rate (LHGR).
The concept of a conditioned LHGk is used for some time by KWU in the formulation of power reactor operating rules l\l and is
'described in details elsewhere /2/; it applies to a sicuation where tensile stresses in the cladding aue to PCMI have been reduced by fuel creep and stress relaxation of the clad u.itil the low steady state (compressive) clad stress is reached again.
When the rod power goes beyond the conditioned T.HGR, PCMI occurs due to the differential thermal expansion between pelle:s and clad, and also due to fuel swelling caused by fission gas oubble precipitation at high fuel temperature.
The destinction between power cycling and power rampirg is illustrated in Fig. la) and lb). Intermediate situations are shjwn in Fig. Ic) and Id).
Power over-shootings during load follow (Fig. lc)) have to be considered as power ramps until the fuel rod is conditioned 1:0 the peak LHGR. In multiple power ramps (Fig. fd), deconditioning caused by fuel swelling and clad creep down con become important, when the low power period between the ramps lasts several months.
3. Experiaental strategy for raup testing
The most important task of KWU's power ramping test programmes was to find out the limits for safe operation of fuel rods. Safe operation caans defect-free operation without any fission product release to the coolant.
Power ramping may lead to perforation of the clad by the chemically assisted stress ccr-osion cracking process. From early in-pile experiments in conjunction with iodine stress corrosion tests (ISCC) in the laboratory it was concluded that these minimum conditions had to be fulfilled simultaneously to produce ISCC in the Zry clad of a fuel rod:
i) a critical stress or strain, and ii) a critical iodine concentration for iii) a minimum cf time.
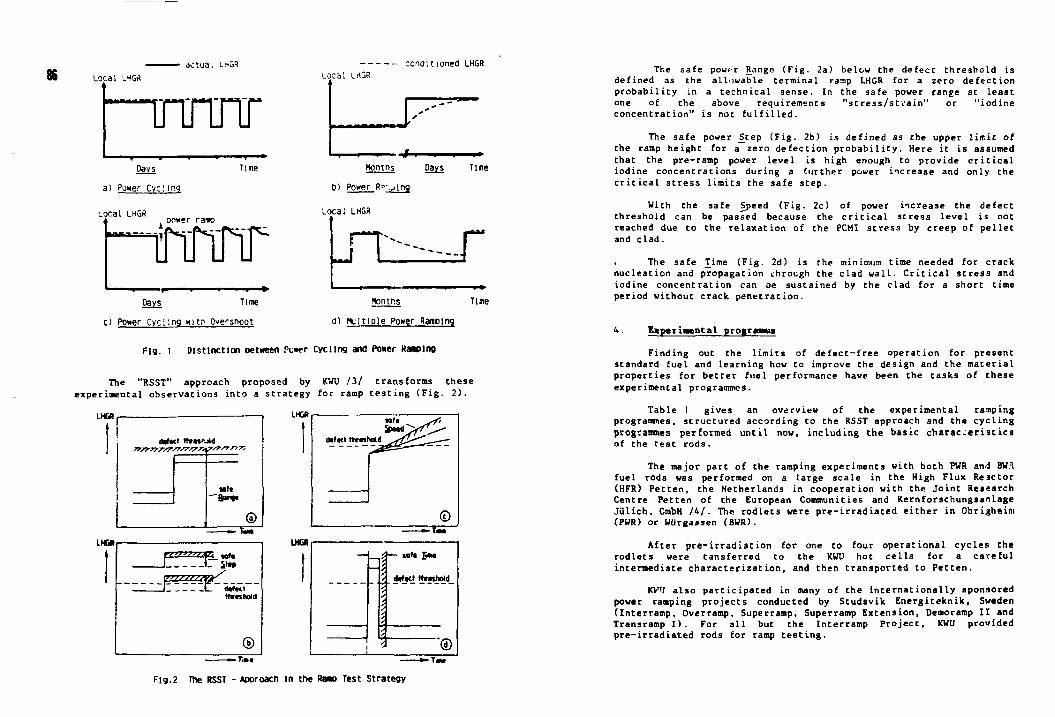
actual LHGR
Local LrtGR
"innnr Days
a) Power Cycling
Local LHGR
i ' Time
nower ranic
Til 11 11 M
Days Time
c) Power Cycling witn Overshoot
conditioned LHGR Local LHGR
*mum*tm^mmmmr
Months Days Tine
D) Power B^-.jlng
Local LHGR
rti^r Months Time
d) MiltiDle Power Ramping
Fig. l Distinction oetween Ptwer Cycling and Power Rawing
The "RSST" approach proposed by KWTJ / 3 / transforms these experimental observations into a strategy for ramp t e s t i n g (Fig . 2 ) .
LHGR,
M K I WMtfcjtd
Q -~tm.
LHGR EZZ222ZaS_ «f .
1_ S>*P >t/fj/s.
dtf«t IhrnMd
© -T..t
LHGR
— r*«
1 J— soft !••# *
*
00
Fig.2 The RSST - Aeoroach in the Raw Test Strategy
The safe povf r Range (Fig. 2a) below the defect threshold is defined as the allowable terminal ramp LHGR for a zero defection probability in a technical sense. In the safe power range at least one of the above requirements "stress/strain" or "iodine concentration" is not fulfilled.
The safe power jStep (Fig. 2b) is defined as the upper limit of the ramp height for a zero defection probability. Here it is assumed that the pre-ramp power level is high enough to provide critical iodine concentrations during a further power increase and only the critical stress limits the safe step.
With the safe Sj>eed (Fig. 2c) of power increase the defect threshold can be passed because the critical stress level is not reached due to the relaxation of the PCMI stress by creep of pellet and clad.
, The safe Time (Fig. 2d) is the minimum time needed for crack nucleation and propagation through the clad wall. Critical stress and iodine concentration can oe sustained by the clad for a short time period without crack penetration.
4 . Experimental prograia
Finding out the limits of defect-free operation for present standard fuel and learning how to improve the design and the material properties for better fuel performance have been the tasks of these experimental programmes.
Table 1 gives an overview of the experimental ramping programmes, structured according to the RSST approach and Che cycling programmes performed until now, including the basic characteristics of the test rods.
The major part of the ramping experiments with both PWR and BWJI fuel rods was performed on a large scale in the High Flux Reactor (HFR) Petten, the Netherlands in cooperation with the Joint Research Centre Petten of the European Communities and Kemforschungsanlage JUlich, GmbH /*/. The rodlets were pre-irradiated either in Obrigheim (PWR) or Wiirgassen (BWR).
After pre-irradiation for one to four operational cycles! the rodlets were tansferred to the KWU hot cells for a careful intermediate characterization, and then transported to Petten.
KV'J also participated in many of the internationally sponsored power ramping projects conducted by Studsvik Energiteknik, Sweden (Interramp, Overramp, Superramp, Superramp Extension, Demoramp IX and Transramp I). For all but the Interramp Project, KWU provided pre-irradiated rods for ramp testing.
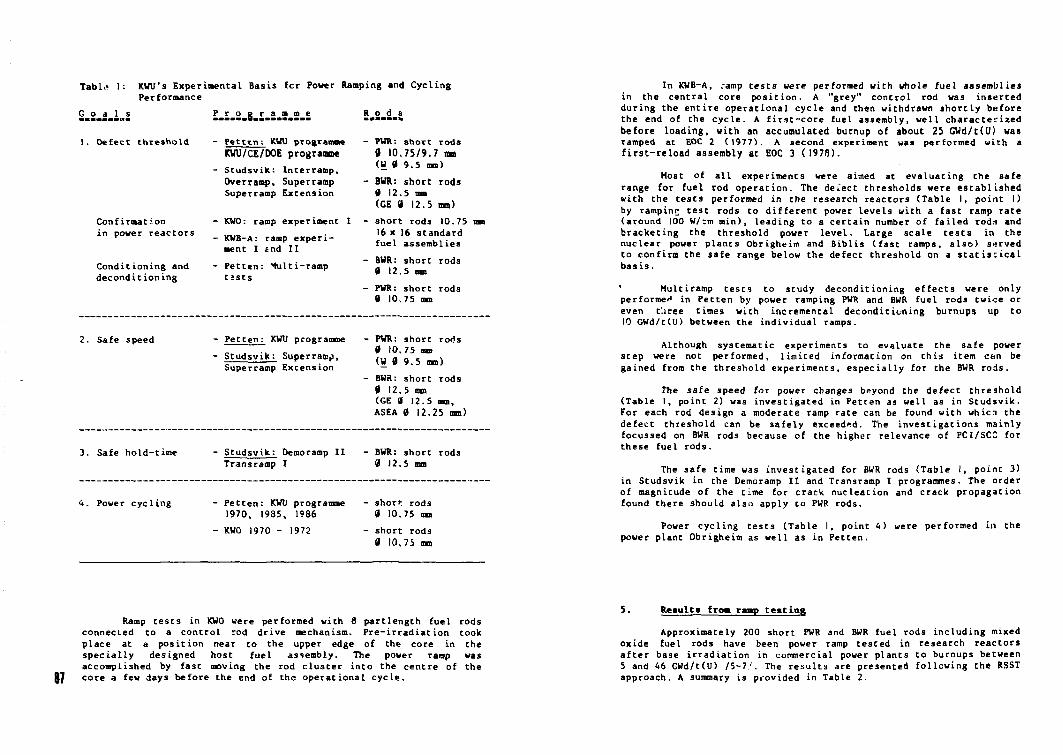
Tabl«» 1:
G o a l s
1. Defect threshold
KWU's Experimental Basis fcr Power Ramping and Cycling Performance
Confirmation in power reactors
Conditioning and deconditioning
P r o r a m m e
- Petten: KWU programme KWU/CE/DOE programme
- Studsvik: Interraap, Overramp, Superramp Superraop Extension
- KWO: ramp experiment I - KWB-A: ramp experi
ment I 2nd II - Petten: Multi-ramp
tjsts
R o_d_s
- PWR: short rods 0 10.75/9.7 am (W 0 9.S mm)
- BWR: short rods 0 12.5 mm (GE 0 12.5 mm)
- short rods 10.75 16 x 16 standard fuel assemblies
- BUR: short rods 0 12.5 mm
- PWR: short rods 0 10.75 mm
2. Safe speed - Petten: KWU pcogr - Studsvik: Superramp,
Superramp Extension
PWR: short rods 0 10.75 mB (W 0 9.5 ran) BWR: short rods 0 12.5 mm (GE 8 12.5 mm, ASEA 0 12.25 mm)
3. Safe hold-time Studsvik: Deraorarap II Transramp I
BWR: short rods 0 12.5 mm
4. Power cycling Petten: KWU programme 1970, 1985, 1986 KWO 1970 - 1972
shorf rods 0 10.75 mm short rods 0 10.75 ran
87
Ramp tests in KWO were performed with 8 partlength fuel rods connected to a control rod drive mechanism. Pre-irradiation took place at a position near to the upper edge of the core in the specially designed host fuel assembly. The power ramp was accomplished by fast moving the rod cluster into the centre of the core a few days before the end of the operational cycle.
In KWB-A, .-amp tests were performed with whole fuel assemblies in the central core position. A "grey" control rod was inserted during the entire operational cycle and then withdrawn shortly before the end of the cycle. A first-core fuel assembly, well characterized before loading, with an accumulated burnup of about 25 GWd/t(U) was ramped at EOC 2 (1977). A second experiment was performed with a first-reload assembly at EOC 3 (1978).
Host of all experiments were aimed at evaluating the safe range for fuel rod operation. The defect thresholds were established with the tests performed in the research reactors (Table 1, point I) by ramping test rods to different power levels with a fast ramp rate (around 100 W/;m min), leading to a certain number of failed rod J and bracketing the threshold power level. Large scale tests in the nuclear power plants Obrigheim and Biblis (fast ramps, also) served to confirm the safe range below the defect threshold on a statistical basis.
' Multiramp tests to study deconditioning effects were only performed in Petten by power ramping PWR and BWR fuel rods twice or even t'.iree times with incremental decondit icning burnups up to 10 GWd/t(U) between the individual ramps.
Although systematic experiments to evaluate the safe power step were not performed, limited information on this item can be gained from the threshold experiments, especially for the BWR rods.
The safe speed for power changes beyond the defect threshold (Table I, point 2) was investigated in Petten as well as in Studsvik. For each rod design a moderate ramp rate can be found with which the defect threshold can be safely exceeded. The investigations mainly focussed on BWR rods because of the higher relevance of PCI/SCC for these fuel rods.
The safe time was investigated for BWR rods (Table I, point 3) in Studsvik in the Demoramp II and Transramp I programmes. The order of magnitude of the time for crack nucleation and crack propagation found there should also apply to PWR rods.
Power cycling tests (Table I, point 4) were performed in the power plant Obrigheim as well as in Petten.
5. Results from ram? testing
Approximately 200 short PWR and BWR fuel rods including mixed oxide fuel rods have been power ramp tested in research reactors after base irradiation in commercial power plants to burnups between 5 and 46 GWd/t(U) /5-7'. The results are presented following the RSST approach. A summary is provided in Table 2.
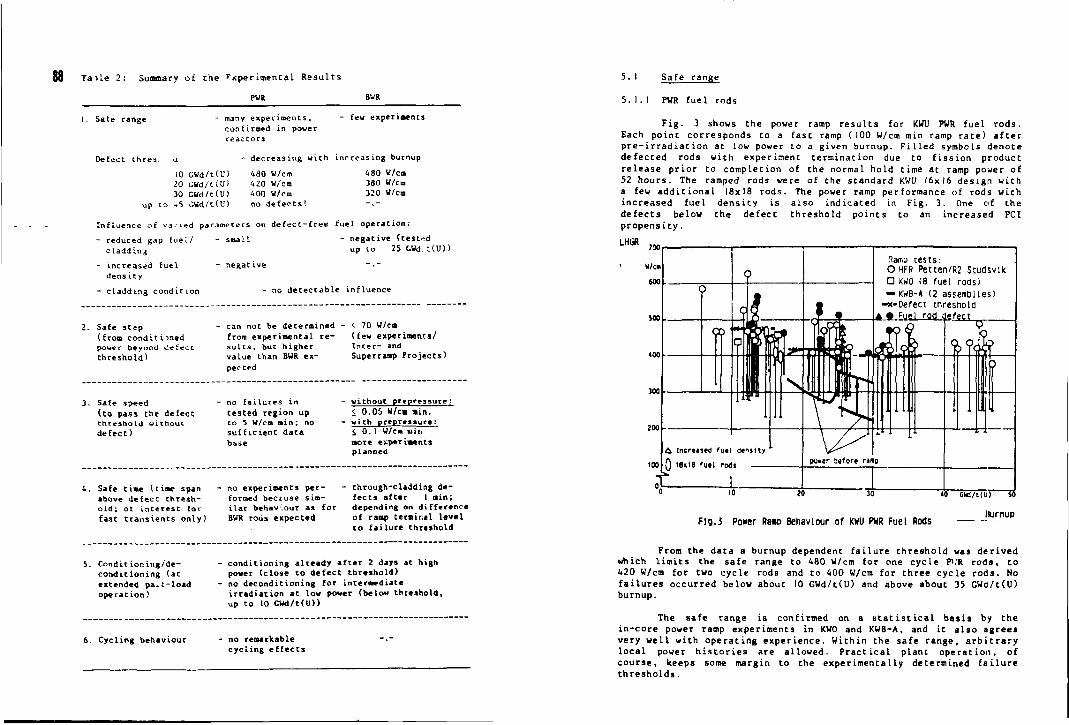
8 8 T a i l e 2 : Summary o f t h e E x p e r i m e n t a l R e s u l t s
PUR BUR
I. Safe range
Defect thres.
- many expeviments, confirmed in pouer reactors
few experiments
10 GUd/t(U) 20 CUd/tClI) 30 GUd/t(U)
up to 45 GUd/t(U)
decreasing with increasing burnup 480 U/cm 480 W/cm 420 U/cm 380 WYcm 400 U/cm 320 U/cm no d e f e c t s ! - . -
Influence oi varied parameters on d e f e c t - f r e e fuel operation:
- reduced gap fue l / - small cladding
- increased fuel - negative dens i ty
- cladding condit ion
negative (tested up to 25 &Ud t(U))
no detectable influence
Safe stap (from conditioned power beyond defect threshold)
can not be determined from experimental r e s u l t s , but higher value than BUR expected
< 70 U/cm (few experiments/ Inter- and Superramp Projects)
3. Safe speed (to pass the defect threshold without defect)
- no failures in tested region up to 5 w/c. . sufficient data base
- without prepressure: < 0.05 W/cm a in .
no - with prepressure: S 0. 1 U/cm tuiti more experiments planned
Safe time (time span above defect threshold; of in teres t for fast t rans i en t s only)
no experiments performed becjuse simi l a r behav'.our as for BUR rods expected
through-cladding def e c t s after I a i n ; depending on difference of ramp terminal l eve l to fa i lure threshold
5. Condirioning/de-condi t ioning (at extended pa*, c-load operation)
condit ioning already a f ter 2 days at high power ( c l o s e to de fec t threshold) no decondit ioning for intermediate irradiat ion at low power (below threshold, up to 10 GUd/t(U))
6. Cycling behaviour no remarkable cyc l ing e f f e c t s
5. I Sa fe range
5 . 1 . 1 PWR f u e l rods
F i g . 3 shows the power Each p o i n t c o r r e s p o n d s to a fa s p r e - i r r a d i a t i o n at low power t o d e f e c t e d rods wi th exper iment r e l e a s e p r i o r to c o m p l e t i o n of 52 h o u r s . The ramped rods were a few a d d i t i o n a l 18x18 r o d s . Th i n c r e a s e d f u e l d e n s i t y i s a l s d e f e c t s be low the d e f e c t thr p r o p e n s i t y
LHGR
ramp results for KWU PWR fuel rods, t ramp (100 W/cm min ramp rate) after a given burnup. Filled symbols denote termination due to fission product the normal hold time at ramp power of of the standard KWU 16x16 design with e power ramp performance of rods with
indicated in Fig. 3. One of the eshold points to an increased PCI
Fig.3 Power Raw Behaviour of KWU FUR Fuel Rods
«0 GUd/tll/j So
Ikjrnup
From the data a burnup dependent failure threshold was derived which limits the safe range to 480 W/cm for one cycle P',R rods, to 420 W/cm for two cycle rods and to 400 W/cm for three cycle rods. No failures occurred below about 10 GWd/t(U) and above about 35 CWc/t(U) burnup.
The safe range is confirmed on a statistical basis by the in-core power ramp experiments in KW0 and KWB-A, and it also agrees very well with operating experience. Within the safe range, arbitrary local power histories are allowed. Practical plant operation, of course, keeps some margin to the experimentally determined failure thresholds.
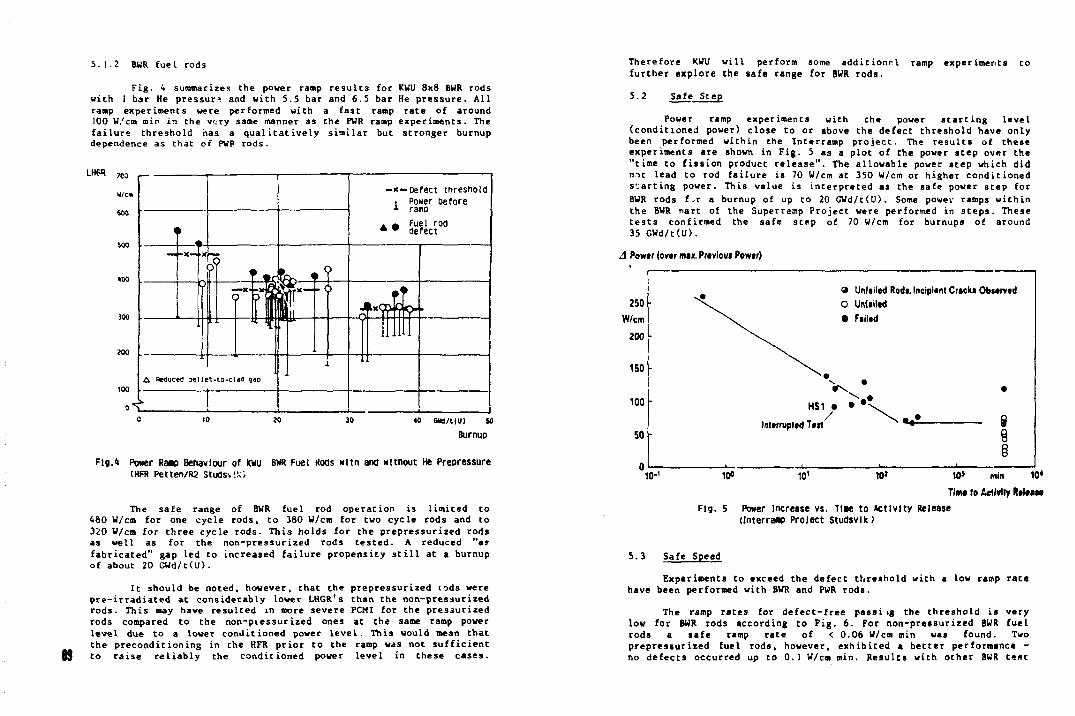
5.1.2 BWR fuel rods
Fig. 4 summarizes the power ramp results for KWU 8x8 BWR rods with I bar He pressure and with 5.5 bar and 6.5 bar He pressure. All ramp experiments were performed with a fast ramp rate of around 100 W/cm min in the very same manner as the PWR ramp experiments. The failure threshold has a qualitatively similar but stronger burnup dependence as that of PWP rods.
Fig.4 Power R a w Behaviour of W U BWR Fuel Rods witn and wltnout He Prepressure (HFR Petten/R2 studs*!!;)
The safe range of BWR fuel rod operation is limited to 480 W/cm for one cycle rods, to 380 W/cra for two cycle rods and to 320 W/cm for three cycle rods. This holds for the prepressurized rods as well as for the non-pressurized rods tested. A reduced "as fabricated" gap led to increased failure propensity still at a burnup of about 20 GWd/c(U).
89
It should be noted, however, that the prepressurized tods were pre-irradiated at considerably lower LHGR's than the non-pressurized rods. This may have resulted in more severe PCM I for the pressurized rods compared to the non-ptessurized ones at the same ramp power level due to a lower conditioned power level. This would mean that the preconditioning in the HFR prior to the ramp was not sufficient to raise reliably the conditioned power level in these cases.
Therefore KWU will perform some additional ramp experiments to further explore the safe range for BWR rods.
5.2 Safe Step
Power ramp experiments with the power starting level (conditioned power) close to or above the defect threshold have only been performed within the Interramp project. The results of these experiments are shown in Fig. 5 as a plot of the power step over the "time to fission product release". The allowable power step which did n->t lead to rod failure is 70 W/cm at 350 W/cm or higher conditioned smarting power. This value is interpreted as Che safe power step for BWR rods f.r a burnup of up co 20 GWd/t(U). Some power ramps within the BUR nart of the Superramp Projecc were performed in steps. These tests confirmed the safe step of 70 W/cm for burnups of around 35 GWd/t(U).
J Powtr (ovtr max. Previous Powtr)
9 Unfilled Rsdi. Incipient Cracks Observed 250 C UnUiltd
W/cm v • Failed
200 -
ISO
" > \ #
100 HS1 • • * \ 1 . . J T / ^ " ^ * • * fi Interrupted Test " • - •
50
0
8 8
- • ' - — J —
10-' 10° 10' 10' 10' min 10* Tim* to Activity Release
Fig. 5 Power Increase vs. Tie* to Activity Release (Interraep Project Studsvlk)
5.3 Safe Speed
Experiments to exceed the defect threshold with a low ramp rate have been performed with BWR and PWR rods.
The ramp rates for defect-free passi ig the threshold is very low for BWR rods according to Fig. 6. For non-pressurized BWR fuel rods a safe ramp rate of < 0.06 W/cm min was found. Two prepressurized fuel rods, however, exhibited a better performance -no defects occurred up Co 0. I W/cm min. Results with other BWR tent
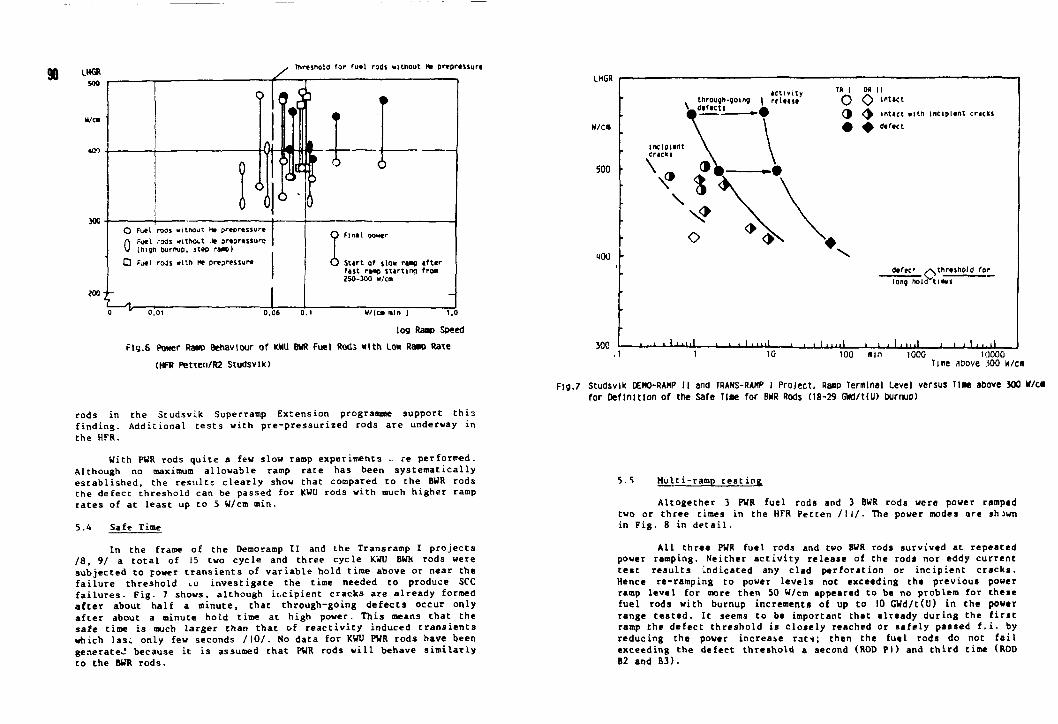
LHGR soo
Threshold for fuel rods vitnout He prepressure
300
200
O Fuel rods without he prepressui-e
O Fuel .-Ms without . * ortoressure (high burnup, step ra«p)
• Fuei roJs wltn r» prepressure
u o.oi
Final power
Start of slow ra«o after fast ranp start Inq fro* 250-300 u/c.
0.06 0.1 U/(ca nln J 1,0
log Raap Speed
Fig.6 Power Raw Behaviour of KWU BWR Fuel Rods with Low Raw Rate
(HFR Petten/R2 Studsvlk)
rods in the Studsvik Superramp Extension programme support th i s f inding. Additional t e s t s with pre-pressurized rods are underway in the HFR.
With PUR rods quite a few slow ramp experiments .. re performed. Although no maximum allowable ramp rate has been sys temat ica l ly e s tab l i shed , the resu l t s c l ear ly show that compared to the BWR rods the defect threshold can be passed for KWU rods with much higher ramp rates of at l east up to 5 W/cm min.
5.4 Safe Time
In the frame of the Demoramp II and the Transramp I projects /8, 9/ a total of 15 two cycle and three cycle KWU BWK rods were subjected to power transients of variable hold time above or near the failure threshold LO investigate the time needed to produce SCC failures. Fig. 7 shows, although ij.cipient cracks are already formed after about half a minute, that through-going defects occur only after about a minute hold time at high power. This means that the safe time is much larger Chan that of reactivity induced transients which las: only few seconds /10/. No data for KWU PWR rods have been generated because it is assumed that PWR rods will behave similarly to the BWR rods.
LMGR
W / C B
500
too
J00
activity , through-joing I rrlease \_.<l«f»Ct! ^
T« i oa II
O O '""" (J < ^ intact witn Incipient cracks 0 + defect
I i I " I I I I i i I i m l • 1 • I • m l
defec' , / \ threshold for & long hoKTtliees
1 • I • •••! I I I I i n i l 10 100 Rln 1000 11)000
Time aoove :soo H /C I
F19.7 Studsvlk DEH0-RAHP I I and TRANS-RAHP I Project. Ramp Terminal Level versus Tine above JOO wYca for Definition of the Safe Time for BNR Rods (18-29 GWd/MU) burnup)
5.5 Multi-ramp t e s t ing
Altogether 3 PWR fuel rods and 3 BWR rods were power ramped two or three times in the HFR Petten /I I / . The power modes are shown in Fig. 8 in d e t a i l .
All three PWR fuel rods and two BWR rods survived at repeated power ramping. Neither a c t i v i t y release of the rods nor eddy current t e s t resu l t s indicated any clad perforation or incipient cracks. Hence re-ramping to power l eve l s not exceeding the previous power ramp leve l for more then 50 W/cm appeared to be no problem for these fuel rods with burnup increments of up to 10 GWd/tCU) in Che power range t e s ted . It seems to be important that already during the f i r s t ramp Che defect threshold is c l o s e l y reached or safe ly passed f . i . by reducing che power increase rat-i; then the fuel rods do noc fa i l exceeding the defect threshold a second (ROD PI) and third time (ROD B2 and B3).
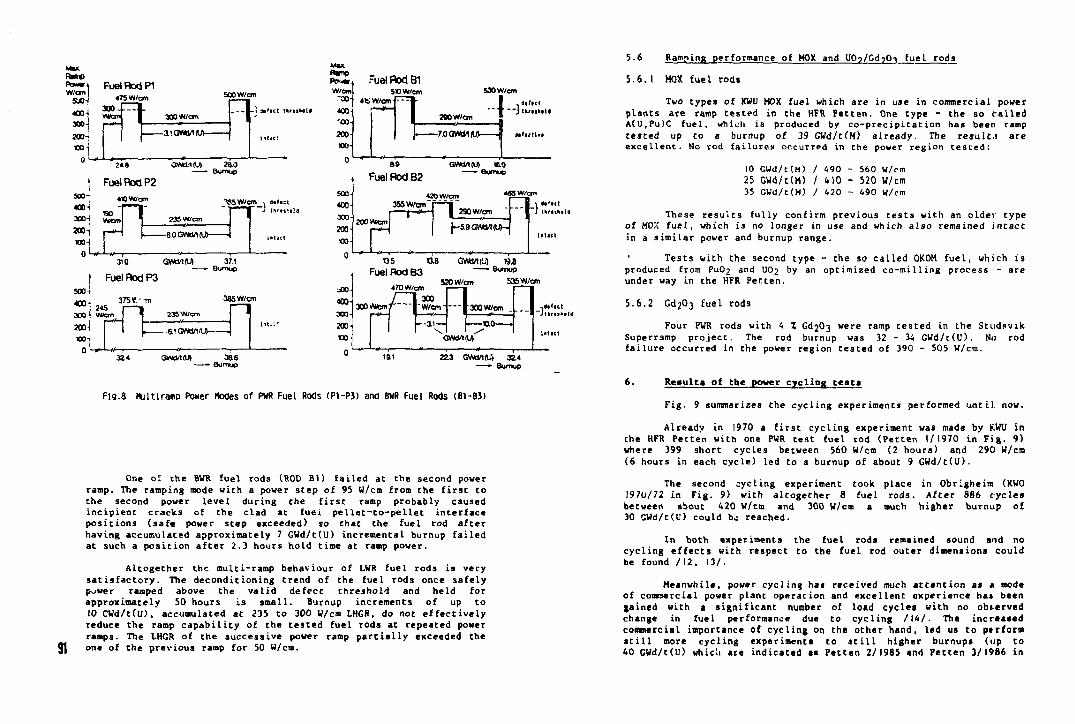
feno tautt w/cml
5J0-) 400-1 300 -j 200-j
Fuel Rod P i 47S_W/cm
300 X T ~ VWan Won I aoOW/cm
r~ i ^
u g w c m
Ri at'ict IMrtiholtf
500
400
300-
200-
100
0
2 * 8
Fuel Rod P2 4»W/cm
GVNttrtM 28.0 Bumup
*>"PV vttm T 23SW ~H |. 6.0 GV\ GV*M(U) 4
' - } '
310 GWdrtM
Fuel Rod P3 500-1 400J 300-i J00-I 100-1
24S Won
375 V ' m
371 Bumup
365W/OT
Q>-*-
n -6.1GWttnlU)-
awaiM • eumup
Max Ramo Pcvw. Fuel Rod B1 w/em S»W/an
400 "CO 200-100-
I 223 ( — 7.0 GV
530 W/cm
t . a i f tc t
" J tknilaltf
7 . 0 G W M M l l ' tCt lv l
500
400-
300-
200-
w>-
»9 Fuel Rod B2
O M M M «.0 Bumuo
355W/OP
ZOO Wtm -r~- n 290 W/cm |—s.9 Gwa/t<uy-
J tbr«tK«t4
a00
400
300
200-100
0 5 O.B Gwd/IIU) ftg Fuel Ftod 8 3 — B u m u 0
_ , „ 520 Wan 535 Wan 470 w/an I |
3 0 0 V W 3 n r — I ' W / o n IsCQW/an
i R3 h^°-223 GWUrt(U> 32.4
— - Bomuc
Fig.8 KjltlranD Poxer Nodes of PWR Fuel Rods (P1-P3) and BMR Fuel Rods (B1-B3)
91
One of the BWR fuel rods (ROD Bl) failed at the second power ramp. The ramping mode with a power step of 95 W/cm from the first to the second power level during the first ramp probably caused incipient cracVcs of the clad at fuei pellet-to-pellet interface positions (safe power step exceeded) so that the fuel rod after having accumulated approximately 7 GWd/t(U) incremental burnup failed at such a position after 2.3 hours hold time at ramp power.
Altogether the multi-ramp behaviour of LWR fuel rods is very satisfactory. The deconditioning trend of the fuel rods once safely power ramped above the valid defect threshold and held for approximately 50 hours is small. Burnup increments of up to 10 CVd/t(U), accumulated at 235 to 300 W/cm LHGR, do not effectively reduce the ramp capability of the tested fuel rods at repeated power rasps. The LHGR of the successive power ramp partially exceeded the one of the previous ramp for 50 w/cm.
5.6 Ramping performance of MOX and UO^/Gd^Oi fuel rods
5.6. I MOX fuel rods
Two types of KWU MOX fuel which are in use in commercial power plants are ramp tested in the HFR Petten. One type - the so called A(U,Pu)C fuel, whii:h is produced by co-precipitation has been ramp tested up to a burnup of 39 GWd/t(M) already. The result;! are excellent. No rod failures occurred in the power region tested:
10 GWd/c(M) / 490 - 560 W/cm 25 GWd/t(M) / 4)0 - 520 W/cm 35 GWd/t(M) / 420 - 490 W/cm
These results fully confirm previous tests with an older type of MOX fuei, which is no longer in use and which also remained intact in a similar power and burnup range.
' Tests with the second type - the so called 0K0M fuel, which is produced from Pu02 and UO2 by an optimized co-milling process - are under way in the HFR Per.ten.
5.6.2 Gd203 fuel rods
Four PWR rods with 4 X Gd203 were ramp tested in Che Studsvik Superramp project. The rod burnup was 32 - 34 GWd/t(U). No rod failure occurred in Che power region tested of 390 - 505 W/cm.
6. Results of the power cycling teats
Fig. 9 summarizes the cycling experiments performed until now.
Already in 1970 a first cycling experiment was made by KWU in the HFR Pecten with one PWR test fuel rod (Petten 1/1970 in Fig. 9) where 399 short cycles between 560 W/cm (2 hours) and 290 W/cm (6 hours in each cycle) led to a burnup of abouc 9 GWd/t(U).
The second cycling experiment took place in Obrigheim (KW0 1970/72 in Fig. 9) with altogether 8 fuei rods. After 886 cycles between about 420 W/cra and 300 W/cm a much higher burnup of 30 GWd/t(U) could bo reached.
In both experiments the fuel rods remained sound and no cycling effects with respect to the fuel rod outer dimensions could be found /I2, 13/.
Meanwhile, power cycling has received much attention at a mode of commercial power plant operation and excellent experience hai been gained with a significant number of load cycles with no observed change in fuel performance due to cycling /I4/. The increased commercial importance of cycling on the other hand, led us to perform still more cycling experiments to still higher burnups (up to 40 GWd/t(U) whic'.i are indicated as Petten 2/1985 and Petten 3/1986 in
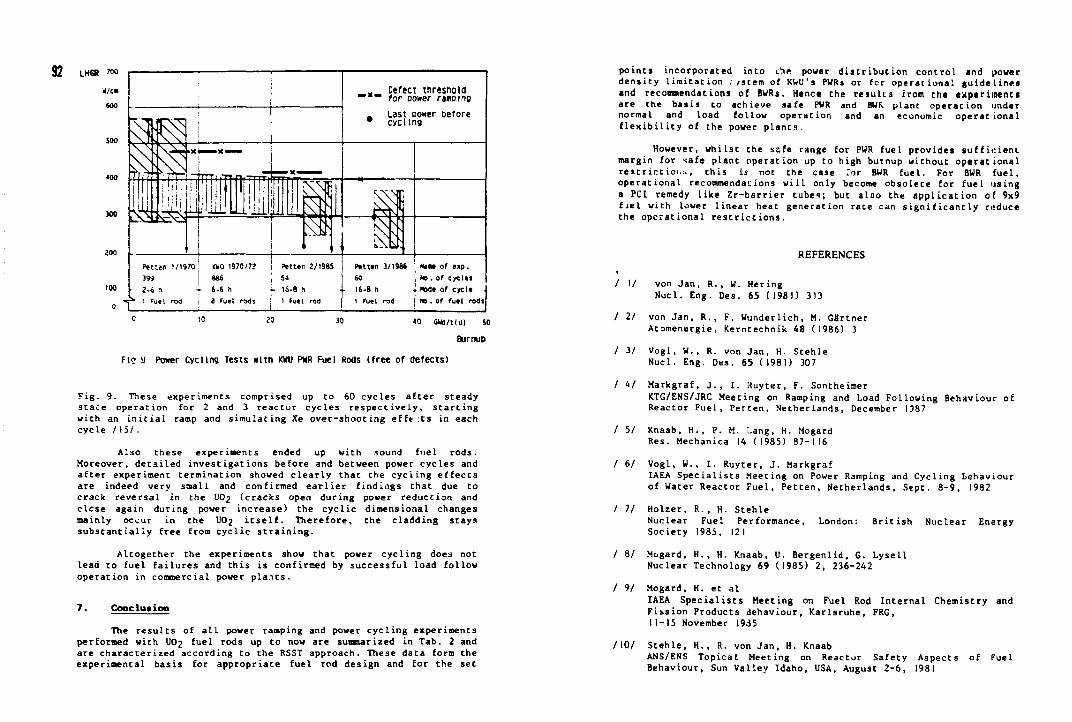
82 LH€R MO
600
500
300
too
0
P*tten 2/1985 54
i- 15-8 h Fuel rods 1 Fuel rod
Pelten 3/198* 60
. . 16-8 n i Fue L rod
New of eip . No. of cycles
• Mode of cycle No . of fuel rods
JO 30 40 aua/uu) so BurnuD
Fie-U Power Cycling Tests with KtflJ PwR Fuel Rods (free of defects)
Fig. 9. These experiments comprised up to 60 cycles after steady stace operation for 2 and 3 reactor cycles respectively, starting with an initial ramp and simulating Xe over-shooting ef ft :ts in each cycle /I5/.
Also these experiments ended up with sound fuel rods. Moreover, detailed investigations before and between power cycles and after experiment termination showed clearly that the cycling effects are indeed very small and confirmed earlier findings that due to crack reversal in the UO2 (cracks open during power reduction and close again during power increase) the cyclic dimensional changes mainly occur in the UO2 itself. Therefore, the cladding stays substantially free from cyclic straining.
Altogether the experiments show that power cycling does not lead to fuel failures and this is confirmed by successful load follow operation in commercial power plaits.
7. Conclusion
The results of all power ramping and power cycling experiments performed with UO2 fuel rods up to now are summarized in Tab. 2 and are characterized according to the RSST approach. These data form the experimental basis for appropriate fuel rod design and for the set
points incorporated into ih* power distribution control and power density limitation ./stem of KV«U's PWRj or for operational guidelines and recommendations of BWRs. Hence the results rrom the experiments are the basis to achieve safe PVR and BWR. plant operation under normal and load follow operation and an economic operational flexibility of the power plants.
However, whilst the safe range for PWR fuel provides sufficient margin for safe plant operation up to high burnup without operational restriction, this is not the case Tor BWR fuel. For BWR fuel, operational recommendacions will only become obsolete for fuel using a PCI remedy like Zr-barrier tubes; but also the application of 9x9 fuel with lower linear heat generation rate can significantly ri'duce the operational restrictions.
REFERENCES
/ 1/ von Jan, R., W. Hering Nucl. Eng. Des. 65 ( I960 313
/ 2/ von Jan, R., F. Wunderlich, M. Gartner Atomenergie, Kerntechnik 48 (1986) 3
/ 3/ Vogl, W., R. von Jan, H. Stehle Nucl. Eng. Des. 65 (1981) 307
/ 4/ Markgraf, J., I. Huyter, F. Sontheimer KTG/ENS/JRC Meeting on Ramping and Load Following Behaviour of Reactor Fuel, Perten, Netherlands, December 1987
/ 5/ Knaab, H., P. M. Lang, H. Mogard Res. Mechanica 14 (1985) 87-116
/ 6/ Vogl, W., I. Ruyter, J. Markgraf IAEA Specialists Meeting on Power Ramping and Cycling behaviour of Water Reactor Fuel, Petten, Netherlands, Sept. 8-9, 1982
/ 7/ Holzer, R., H. Stehle Nuclear Fuel Performance, London: British Nuclear Energy Society 1985, 121
/ 8/ Mogard, H., H. Knaab, U. Bergenlid, G. Lysell Nuclear Technology 69 (1985) 2, 236-242
/ 9/ Mogard, H. et al IAEA Specialists Meeting on Fuel Rod Internal Chemistry and Fission Products Behaviour, Karlsruhe, FRG, 11-15 November 1935
/10/ Stehle, H., R. von Jan, H. Knaab ANS/ENS Topical Meeting on Reactor Safety Aspects of Fuel Behaviour, Sun Valley Idaho, USA, August 2-6, 1981
/I!/ Gartner, M., G. Fischer, I. Ruyter, J. Markgraf ENC '86, ENC 4, Foratom IX Transactions, Geneva, Switzerland, June 1-6, 1986
/12/ Knaab, H-, W. Hering, F. Schlemmer Reaktortagung, Berlin, FRG, 1980
/I3/ wunderlich F., F. Schlemmer ANS Trans. 47 ( 1984) 199
/14/ Lisdat. R. Atomenergie, Kerntechnik 48 (1986) 3
/15/ Fischer, G., F. Sontheiraer, I. Ruyter, J. Markgraf Reaktortagung. Karlsruhe, FRG, June 2-4, 1987, to be published
93
IAEA-TC424/26
POWER RAMPING TEST PROGRAMME ON FRAGEMA FUEL RODS DURING THE YEARS 1984 TO 1986
F. LEFEBVRE D^partement de m&allurgie. Commissariat a l'^nergie atomique, Centre d'eTudes nucteaires de Grenoble, Grenoble J. JOSEPH Frageina (Framatome Division Combustible), Lyon J. ROYER
tD6partement de technologic Commissariat a l'dnergi^ atomique, Centre d'dtudes nucldaires de Saclay, Gif-sur-Yvette
France
Abstract
FRAGEMA and CEA have carried out a large-scale R & D progranme
to study the effect of transients on fi-el bohaviour, especially
with regard to PCI. The FABRICS technique h.ts been used to study
portions of fuel rods p-eviously irradiated in commercial
reactors.
The tested fuel rods were of FRAGEMA design and cut from long
rods, which were previously irradiated in the CAP reactor and/or
the FESSENHEIM UNIT 2 power plant.
Before ramping, those coming from CAP were subjected to dally
load follow and frequency control in conditions representative of
power reactors. The pea; bjrnups ranged between 20 MWd/kg U and
35 MWd/kg U. The rods w.'re precisely characterized before ramp
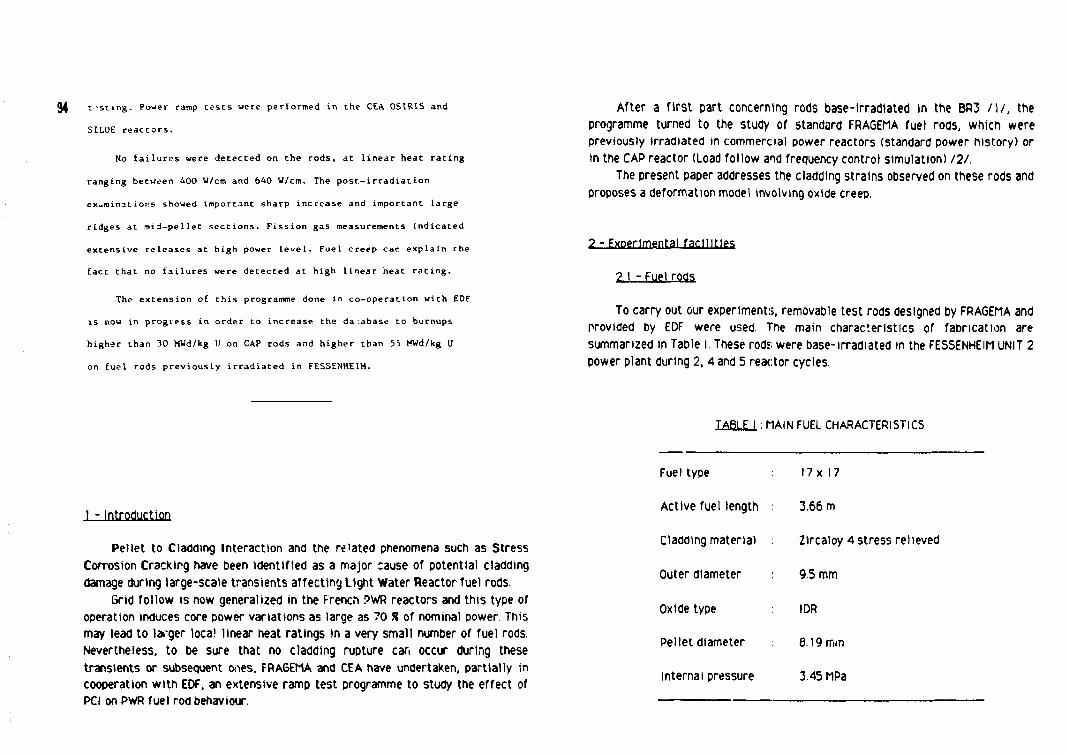
94 c-sting. Power ramp cests were performed in the CEA OSIRIS and
SILOE reactors.
No failures were detected on the rods, at linear heat rating
ranging between 400 W/cm and 640 W/cm. The post-irradiation
examinations showed important sharp increase and important large
ridges at mid-pellet sections. Fission gas measurements indicated
extensive releases at high power level. Fuel creep car explain the
fact that no failures were detected at high linear heat rating.
The extension of this programme done in co-operation with EDF
is now in progress in order to increase the da .abase to burnups
higher than 30 MWd/kg U on CAP rods and higher than 55 MWd/kg U
on fuel rods previously irradiated in FESSENHEIM.
I - Introduction
Pellet to Cladding interaction and the re'ated phenomena such as Stress Corrosion Crackirg have been identified as a major cause of potential cladding damage during large-scale transients affecting Light Water Reactor fuel rods.
Grid follow is now generalized in the French PWR reactors and this type of operation induces core power variations as large as 70 % of nominal power This may lead to larger local linear heat ratings in a very small number of fuel rods. Nevertheless, to be sure that no cladding rupture can occur during these transients or subsequent ones, FRA6EMA and CEA have undertaken, partially in cooperation with EDF, an extensive ramp test programme to study the effect of PCI on PWR fuel rod behaviour.
After a first part concerning rods base-Irradiated In the BR3 l\l, the programme turned to the study of standard FRAGEMA fuel rods, which were previously irradiated in commercial power reactors (standard power history) or in the CAP reactor (Load follow and frequency control simulation) 121.
The present paper addresses the cladding strains observed on these rods and proposes a deformation model involving oxide creep.
2 - Experimental facilities
2,1 - Fuel rods
To carry out our experiments, removable test rods designed by FRAGEMA and provided by EDF were used. The main characteristics of fabrication are summarized in Table I. These rods were base-irradiated in the FESSENHEIM UNIT 2 power plant during 2, 4 and 5 reactor cycles.
TABLE I : MAIN FUEL CHARACTERISTICS
Fuel type 17x17
Active fuel length : 3.66 m
Cladding material Zlrcaloy A stress relieved
Outer diameter 9.5 mm
Oxide type IDR
Pellet diameter 8.19mm
Internal pressure 3.45 MPa
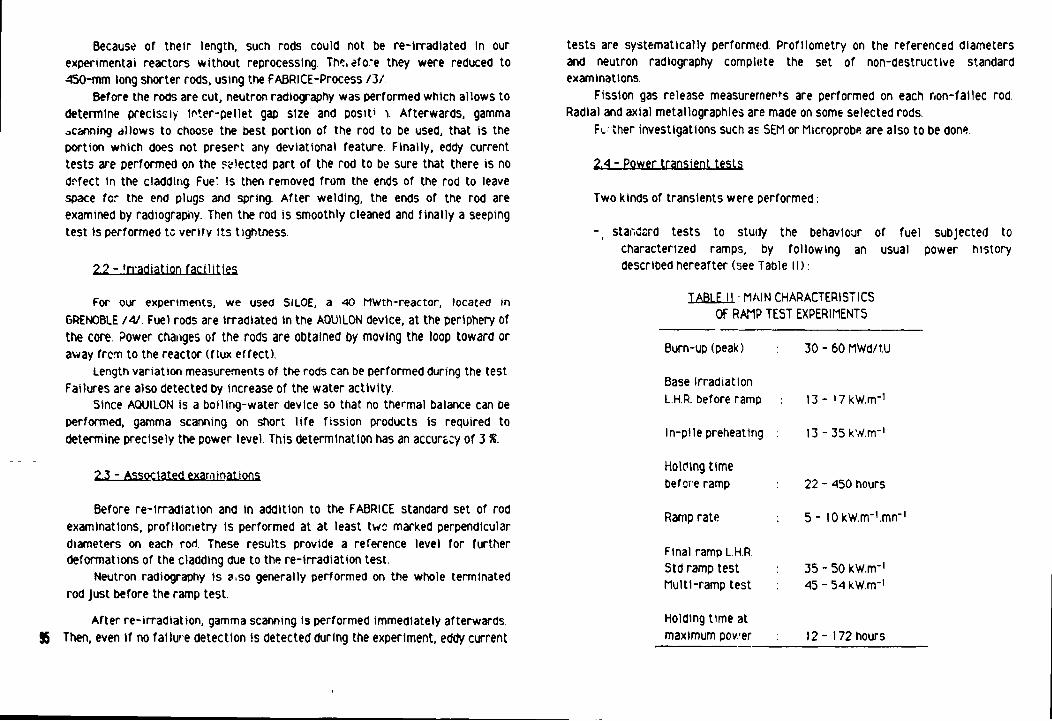
Because of their length, such rods could not be re-Irradiated in our experimental reactors without reprocessing. Therefore they were reduced to 450-mm long shorter rods, using the FABRICE-Process /3A
Before the rods are cut, neutron radiography was performed which allows to determine precisely inter-pellet gap size and posit* i. Afterwards, gamma ^canning allows to choose the best portion of the rod to be used, that is the portion which does not presert any deviational feature. Finally, eddy current tests are performed on the Felected part of the rod to be sure that there is no defect in the cladding. Fue! is then removed from the ends of the rod to leave space for the end plugs and spring. After welding, the ends of the rod are examined by radiography. Then the rod is smoothly cleaned and finally a seeping test is performed tc verify its tightness.
22 -irradiation facilities
For our experiments, we used SHOE, a 40 MWth-reactor, located in GRENOBLE /4A Fuel rods are irradiated in the AOUILON device, at the periphery of the core. Power changes of the rods are obtained by moving the loop toward or away from to the reactor (flux effect).
Length variation measurements of the rods can be performed during the test Failures are also detected by increase of the water activity.
Since AQUILON is a boiling-water device so that no thermal balance can be performed, gamma scanning on short life fission products is required to determine precisely the power level This determination has an accuracy of 3 %.
2.3 - Associated examinations
Before re-irradiation and in addition to the FABRICE standard set of rod examinations, profilorietry is performed at at least two marked perpendicular diameters on each rod These results provide a reference level for further deformations of the cladding due to the re-Irradiation test.
Neutron radiography is a.so generally performed on the whole terminated rod Just before the ramp test.
After re-irradiation, gamma scanning is performed immediately afterwards 95 Then, even if no fallu'-e detection is detected during the experiment, eddy current
tests are systematically performed. Profllometry on the referenced diameters and neutron radiography complete the set of non-destructive standard examinations.
Fission gas release measurements are performed on each non-fallec rod. Radial and axial metallographies are made on some selected rods.
Fc ther investigations such as SEM or Microprobe are also to be done.
2.4 - Power transient tests
Two kinds of transients were performed:
- , standard tests to study the behaviour of fuel subjected to characterized ramps, by following an usual power history described hereafter (see Table ID:
TARIFIi : MAIN CHARACTERISTICS OF RAMP TEST EXPERIMENTS
Burn-up(peak) 30 - 60 MWd/tU
Base irradiation L.H.R. before ramp
In-pi le preheating
13- !7kW.m-'
13-35kw\rrr'
Holding time before ramp
Ramp rate
22 - 450 hours
5 - lOkW.m-'.mn-'
Final ramp L.H.R. Std ramp test Multl-ramp test
35-50kW.m-' 45 - 54 kW.m"'
Holding time at maximum pover 12 - 172 hours
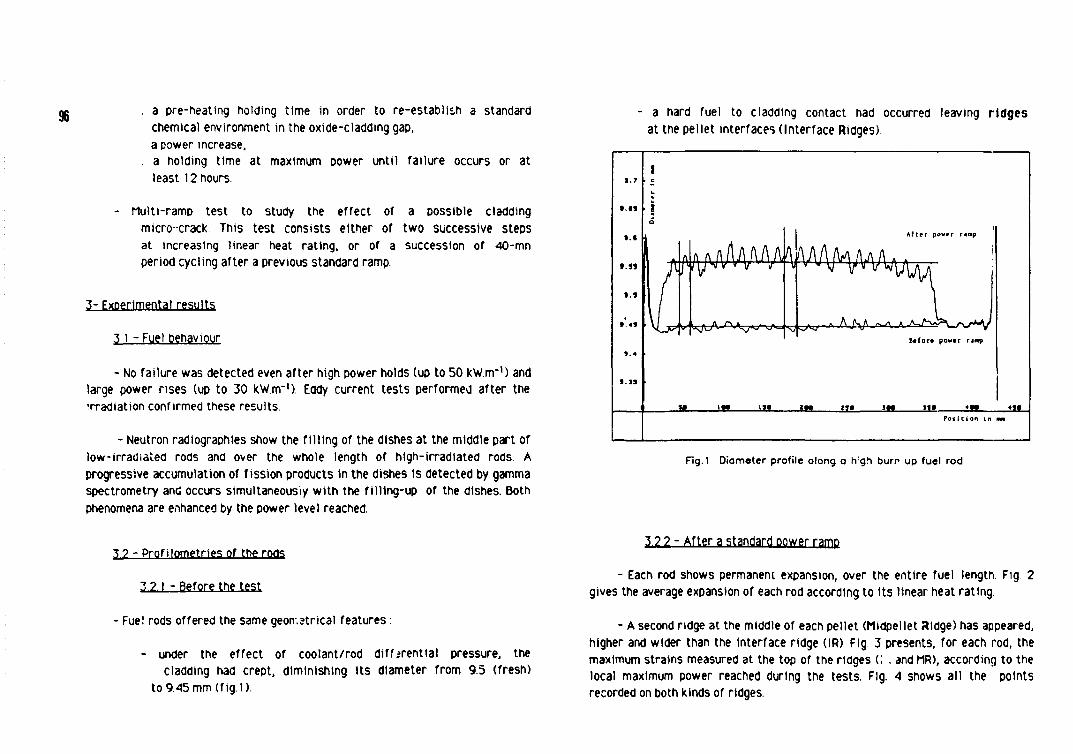
. a pre-heatlng holding time in order to re-establish a standard chemical environment in the oxide-cladding gap, a power increase,
. a holding time at maximum power until failure occurs or at least 12 hours.
- Multi-ramp test to study the effect of a possible cladding micro-crack. This test consists either of two successive steps at increasing linear heat rating, or of a succession of 40-mn period cycling after a previous standard ramp.
3- Experimental results
3 1 - Fuel behaviour
- No failure was detected even after high power holds (up to 50 kW.m*1) and large power rises (up to 30 kW.m~'). Eddy current tests performed after the *rradiation confirmed these results.
- Neutron radiographics show the filling of the dishes at the middle part of low-irradiated rods and over the whole length of high-irradiated rods. A progressive accumulation of fission products in the dishes is detected by gamma spectrometry and occurs simultaneously with the filling-up of the dishes. Both phenomena are enhanced by the power level reached.
3 ? - Prof ilometries of the rods
3 2 I - Before the test
- Fuel rods offered the same geon.atrical features :
- under the effect of coolant/rod differential pressure, the cladding had crept, diminishing its diameter from 9.5 (fresh)
to 9.45 mm (fig. I).
a hard fuel to cladding contact had occurred leaving ridges at the pellet interfaces (Interface Ridges)
*.»
Btfor* powtr rjnp
_ias «— »»« '— » • «— «»• P o s i t i o n Ln
Fig. 1 Diometer profile olong o h ;gh burn up fuel rod
3.2.2 - After a standard power ramp
- Each rod shows permanent expansion, over the entire fuel length. Fig 2 gives the average expansion of each rod according to its linear heat rating
- A second ridge at the middle of each pellet (Midpellet Ridge) has appeared, higher and wider than the interface ridge (IR). Fig 3 presents, for each rod, the maximum strains measured at the top of the ridges C . and MR), according to the local maximum power reached during the tests. Fig. A shows all the points recorded on both kinds of ridges.
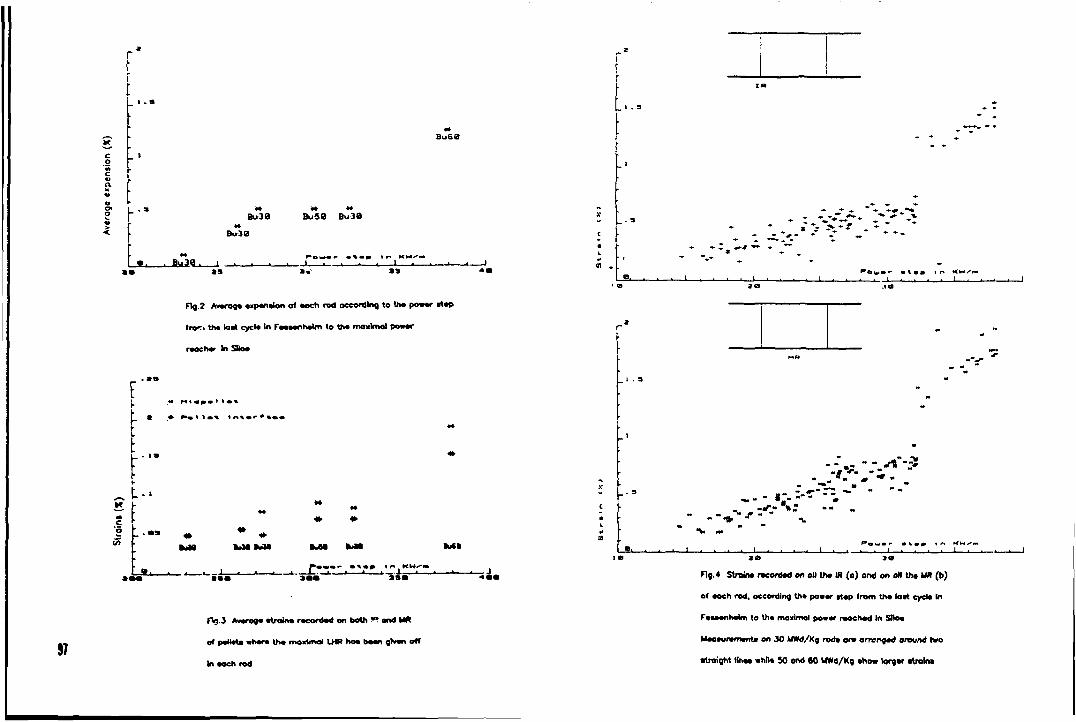
r r
c > o ^
Bu30
Bo 30
Bu5B Bu30
» © * * • • • • % • * > i n K M ' '
flg.2 Avarogo axpanalon of aoch rod according to tha powar otap
frori tha loat cycla In Faaaanhalm to tha moxlmol powar
raoehar In SUoa
fciMfeK
P.*. . , * - . A -
| y 6 l M l IbCt)
. _* 1 * L — X 1 1 -* 1 J > • • » » • « • •
97
Po.3 Avaroga atraina rocordad on both "» and MR
of paHaU wbara tha maximal LHR hoa baan groan off
In aoch rod
Fig. 4 Straina racordad or) oil tha IR (o) ond on oil tha MR (b)
o( aoch rod. occordlng tha powar ttap from tha loat cyda In
Faaaanhalm to tha maximal powar raochad In SDoa
Maoauramanta on X MWd/Kg roda ora orrengad oround two
rtroight linaa whtla SO and 60 UWd/Kg ahow lorgor rtrolna

- All the 30 MWd/kg rods have the same behaviour : strain measurements are scattered along two straight lines whose slopes are approximatively 0025 K/kWrrr' (IR) and 0.035 X/kW.frr' (MR). These values tend to increase with increasing Pmax (maximum power reached In SHOE during the test). Unless a power step of 15 kW.nrr' and a power hold of 40 kw.frr1 are reached, the midpellet ridges are unobservable or remain small. In this case, there is no fiss.on product accumulation 1n the dishes which are not filled up. Above these values, midpellet ridges arise and become higher than IR. The dishes are then filled up and generate a peak of activity.
- A 50 MWd/kg rod and a 60 MW/kg rod have undergone a standard power ramp too. On both rods, a large permanent expansion is measured and MR have clearely appeared, large and wide
- A 30 MWd/kg rod. after a standard power ramp, has undergone a second power cycling with three fast power rises from 0 to 50 kW.m"1 and then a power nolo at 45 kw.nrr1. Profilometries show that the IR were not affected by this secono re-i.Tadiation. On the other hand, MR have significantly developed (*20X) and the tiishes have been filled up.
- A 30 MWd/kg rod, after a long hold at 35 kW.nr' underwent a power rise up to 50 kwm"'. Wishes are filled up. MR are much higher and wider than IR The average expansion of the rod seems unaffected by the hold at 50 kW.m"' and is only affected by the one at 35 kW.m*'.
3,3 - Fission gas re^ase andjuel structure
The fission gas measurements indicate released fractions ranging between 14 « to 18 8 during standard tests, and between 18 JS to 34 % during multi-ramp tests. The results corresponding to the standard test are quite similar to those observed at comparable burn-up on other types of oxide / I / . A power cycling history, even at high level does not Increase the fission gas release rate, since the power holds remain limited
As mentioned before, the test rods were cut off from 4m-long rods. Micrographies performed on other parts of these rods snow between 6 and 10 cracks, a number slightly increasing with the maximum power reached during the base irradiation In FESSENHEIM.
Metallographies carried out after reirradiation show very extensive additional fracturation of the oerlphery of the fuel (outer quarter of the periphery of the radius , Fig. 5). The number of these radiai cracks varies from 30 to 50, but the dependence on the ra'ip terminal level is not yet clear.
t tFOPE THE TEST AFTER POWERRAMP
Fig 5: ASPECT Of THE FUEL

Furthermore, an large circumferential crack appears, In the inner part o* which the earlier cacks are replaced by a new network of cracks The fud structure is here completely different from the initial one: the grains are almost completely free of fine intragranular bubbles, while the number of Intergranular bubbles has increased. It seems that grain boundaries which are oriented perpendicularly to the thermal gradient are preferentially filled
A large swelling is observed, much greater than a classical thermal dilatation, which could hardly explain half of the measured plastic strains. Fission gas, trapped in the pellets may explain such a phenomenon. as the central temperature increases, the pressure of the fission gas bubbles Increases too and the resistance of the oxide decreases allowing easier bubbles growth. This phenomenon induces additional pellet swelling.
4 - Discussion
41 - Cladding deformation
The results of post-trradiation examination show very large deformation of the cladding. The plastic strains measured after tests on these rods offer two interesting aspects:
- Two kinds of ridges exist, at the pellet interface plane and at tha midpellet plane Both are irreversible and midpellet ridges look wider and higher than interpellet ridges
- The strain increments measured are very large: up to 130 urn (1.353?) for the average expansion of the rods, up to 200 urn (2. IX) on the midpellet ridges.
Stress corrosion doesn't seem to spread out. Indeed, these results may be compared with out-of-plle experiments performed on fresh Zlrcaloy tubes by pressurization under iodine atmosphere at 350*C, In which failures happen before the strain reaches 0.1 % of plastic deformation /5/. Such a comparison I -is to the following hypothesis : the SCC failure threshold is overtaken, but for a holding time not sufficient to compete with the cladding relaxation and the fuel creep. The presence of an oxide layer (5 to 30 »im) may enhance Stress Corrosion
99 Cracking Resistance by increasing the cladding and the oxide creep.
42 - Rtdoes: a formation pattern
42.1 - Interface ridges
When the oxide Is sintered, an axial density gradient is induced in each pellet. During the irradiation In FESSENHEIM, slight additional denslflcatlon occurs. Moreover, the power given off Induces a radial thermal qradlent in the pellet, stressing the fuel and then straining it (hourglassing shape). At the same time, the retention of fission products makes the fuel swell. In addition, irradiation induces elongation of the cladding, while the coolant-rod differential pressure induces a decrease of the cladding diameter. Fuel to cladding contact is then established and Zircaloy creep causes the primary ridges to build up.
42.2-Midpellet ridges
Fig. 6 proposes a scheme of formation of these secondary ridges.
'. - During the irradiation tei'.. In an experimental reactor, all the phenomena already described for the interface ridge formation are again combined.
2 - Because high powers are Involved In such tests, high central temperatures increase significantly the intensity of thermal expansion and internal fuel stresses.
3 - The empty dishes at the ends of each nellet may allow a redistribution of the internal stresses : Pressure would be higher in the midpeltet location, wnere no accommodation is possible, while it would decrease at the pellet ends
Various irradiation tests have been conducted on fresh rods without any midpellet ridge observed /6-9A The different results, nevertheless, strenghen the assumption of a transformation of elastic strain Into irreversible strain by creep and relaxation of zlrcaloy during ^ower holds.
The formation of midpellet ridges seems to be a high burn-up r'uel rod phenomena, Involving the tendency of Irradiated oxide to creep.
A - During the power hold, the f llllng-up of the dishes, by fuel creefi, causes a shrink of primary ridges which leave In mtdpellet locations a secondary wide
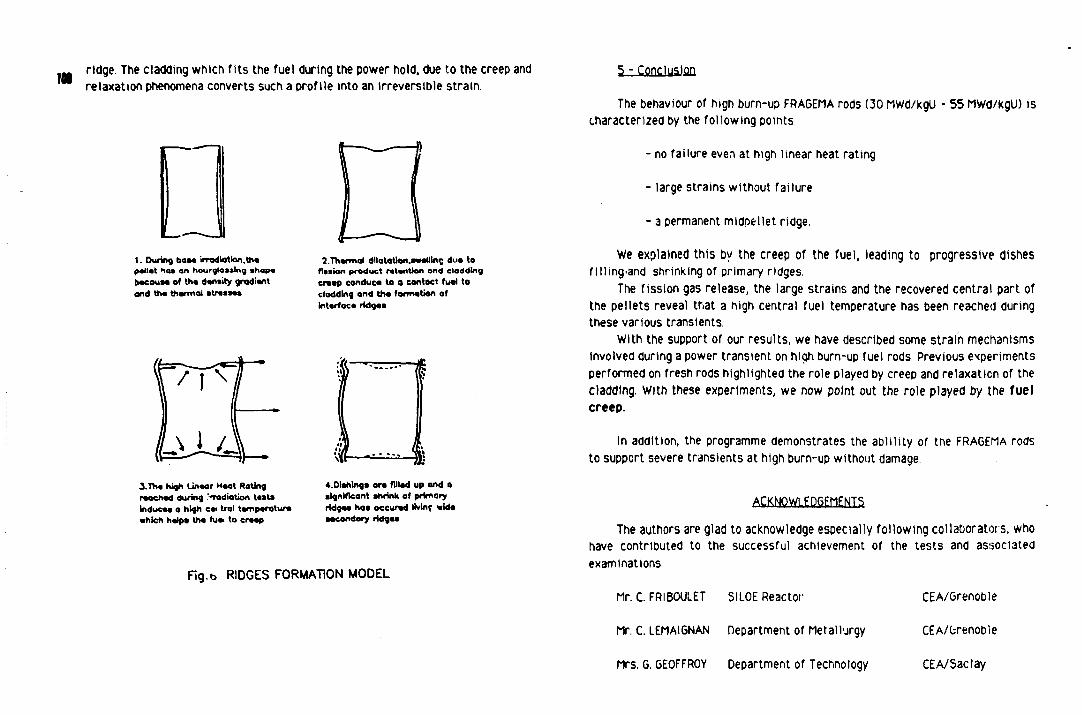
ridge. The cladding which fits the fuel during the power hold, due to the creep and relaxation phenomena converts such a profile into an irreversible strain.
I 1
1. During base iiTodlotlan.the pellet hoe on hourglaaalng shape because ol the density gradient and the thermal stresses
2.Thermal dllatatlon.avelllnr; due to fission product retention and cladding CPMP eonduea to a contact luaJ to clodding ond Uw formation of Intarfaca ridgaa
£
J.Tho high Linear Hoot Rating reached during 'TOdiotion tests Induce* a high cei tral temperature •hich help* the fue> to creep
e.Dlehtnga ore filled up and a significant shrink of primary ridges has occured IMnc wide secondary ridges
Fig.b RIDGES FORMATION MODEL
The behaviour of high burn-up FRAGEMA rods (30 MWd/kgU - 55 MWd/kgU) is characterized by the following points:
- no failure even at high linear heat rating
- large strains without failure
- a permanent mldpellet ridge.
We explained this by the creep of the fuel, leading to progressive dishes filling^and shrinking of primary ridges.
The fission gas release, the large strains and the recovered central part of the pellets reveal that a high central fuel temperature has been reached during these various transients.
With the support of our results, we have described some strain mechanisms involved during a power transient on high burn-up fuel rods. Previous experiments performed on fresh rods highlighted the role played by creep and relaxation of the cladding. With these experiments, we now point out the role played by the fuel creep.
In addition, the programme demonstrates the ablility of the FRAGEMA rods to support severe transients at high burn-up without damage.
ACKNOWLEDGMENTS
The authors are glad to acknowledge especially following collaborators, who have contributed to the successful achievement of the tests and associated examinations
Mr. C. FRIBOULET 5ILOE Reactor CEA/Grenoble
Mr. C. LEMAIGNAN Department of Metallurgy CEA/fcrenoble
Mrs. G. GEOFFROY Department of Technology CEA/Saclay
REFERENCES
/1 / J. JOSEPH - R. ATA8EK - M TROT ABAS The CEA-FRAGEMA Ramp-test Programme for the Study of the Effect of Power Cycling on PCI at High Burn-up Res Mechanics 13(1985) pp. 129-153
,'2/ A. PUILL - C. FREMIOT - M. HABILE - P MELIN - M. PONTICQ Irradiation In the CAP reactor of Fragema fuel assemblies under power transients representative of super Imposed load follow and remote control regimes. IAEA Specialists Meeting Petten, Sept. 8-9, 1982
IZi N. VIGNESOULT - R. ATABEK - J. DUCAS in cell refabrication of experiment fuel rods using rods pre-irradiated in a power reactor. international ConrccK.' Post ,'rradfalien Examination of the British Nuclear Society The Lake District (England) - May 13-15 ,1980
I At C. FRIBOULET - M. ROCHE CEA Experimental facilities for power ramping and power cycling experiments IAEA Technical Commitee Meeting on Power ramping; Cycling and , load following Behaviour of Water Reactor Fuel I yon, France, May 18-21,1987
151 L BRUNISHOLZ - C. LEMAIGNAN Iodine induced Stress Corrosion Cracking of Zlrca!oy Fuel Cladding. Initiation and growth. Zirconium in Mxlear industry - 7th International Symposium Strasbourg, France - June 24-27, 1985 (in ASTM STP 939)
n/
161 UCHIDA - ICHIKAWA Pellet Cladding Mechanical Interaction Nuclear Technology Vol. 51 Nov 80
111 P. J. FEHRENBACH & al. Cladding strain Nuclear Technology Vol. 56 Jan. 82
161 M. J. G. NOTLEY - M. J. PETTIGREW - H. VIDAI Circumferential Strains of the Sheatmg of U02 fuel elements during reactor operations. Chalk River Jan. 1982-EACL ^072
/9 / M. ICHIKAWA - YANAGISAWA - E. KOSLTAT IAEA Pellet Cladding interaction in Water Reactor Fuel, Seattle, USA Oct. 3-7, )953
I0l/f \oH
FUEL BEHAVIOUR IN POWER REACTORS (Session HI) Chairmen
H. KNAAB Federal Republic of Germany
B. GAUTIER France
IAEA-TC-624/24
A SURVEY OF LOAD FOLLOW EXPERIENCE IN US LIGHT WATER REACTORS
L. GOLDSTEIN, K.D. SHEPPARD S.M. Stoller Corporation, New York, N.Y., United States of America
Abstract
Load follow experience in U.S LURs 1s Increasing and, while s t i l l not widespread, a number of units have accumulated significant experience. In this paper load follow experience in U.S. PURs and BWRs 1s discussed, Including both load follow demonstration tests and commercial load follow experience.
Load follow demonstration tests have been performed at a number of units. 'The objectives and results of such test; are discussed, including:
Testing the ab i l i t y of various computer codes to predict load follow behavior.
Testing the ab i l i t y of the operating staff to perform load follow maneuvers within the vendor's power recovery guidelines.
Tests of remote dispatching systems.
Determining the margins to safety l imits required for load follow f l e x i b i l i t y .
Commercial load follow operations have been performed not only because of grid load demands, but also for reasons such as the need to husband the reactor until a scheduled outage and to comply with environmental requirements on cooling water discharge temperatures.
An unusual benefit of load follow occurred In one BUR which load followed during an end of cycle coastdown. In this case, an energy generation Increase occurred because of a power overshoot on return to power. This overshoot was ti.e result of xenon depletion during the period of low power operation.
Load follow testing in the U.S. wi l l be reviewed, and U.S. commercial daily load follow experience wi l l be discussed for several PURs and BWRs with the most extensive experience, incuding:
Number of load follow cycles
Range of power changes
- Impact on fuel performance as indicated by primary coolant act iv i ty I K (PURs) or off-gas act iv i ty (BWRs)
Impact on the performance of non-fuel core components
Capacity factor losses due to restrictions on the rate of return to power
GENERAL
As the fraction of e lectr ic i ty produced from nuclear plants Increases, eff icient and economic operation of the e'.ectrlcal grid system requires that nuclear units participate actively 1n daily or weekly load following.
Meeting system load demands 1r an eff icient manner 1i but one reason for considering lotd following. Other reasons are to extend the length (In time) of a fuel cycle, and to comply with environmental l imits .
As the term implies, load follow refers to the ab i l i ty of the NSSS to respond to variations In system load. Generally, the following four types of load follow operations are conc'dered:
o Daily or weekend load cycles. o Load regulation (automatic or remote generation control). o Frequency regulation. o Contingency operations.
In this paper we present a survey of experience with dally and weekend load cycles In U.S. LURs.
A typical dally system load cycle Is ilmost sinusoidal over a 24-hour period. The magnitude of peak to average load will vary from u t i l i t y to u t i l i t y , depending on system makeup (e .g . , residential versus commercial usage). Similarly, the rate of load pickup and decrease before and after the period of hlqh demand wi l l also vary. Typical values for one U.S. southern system are 1n the range of 0.1SX to 0.2t of system load per minute.
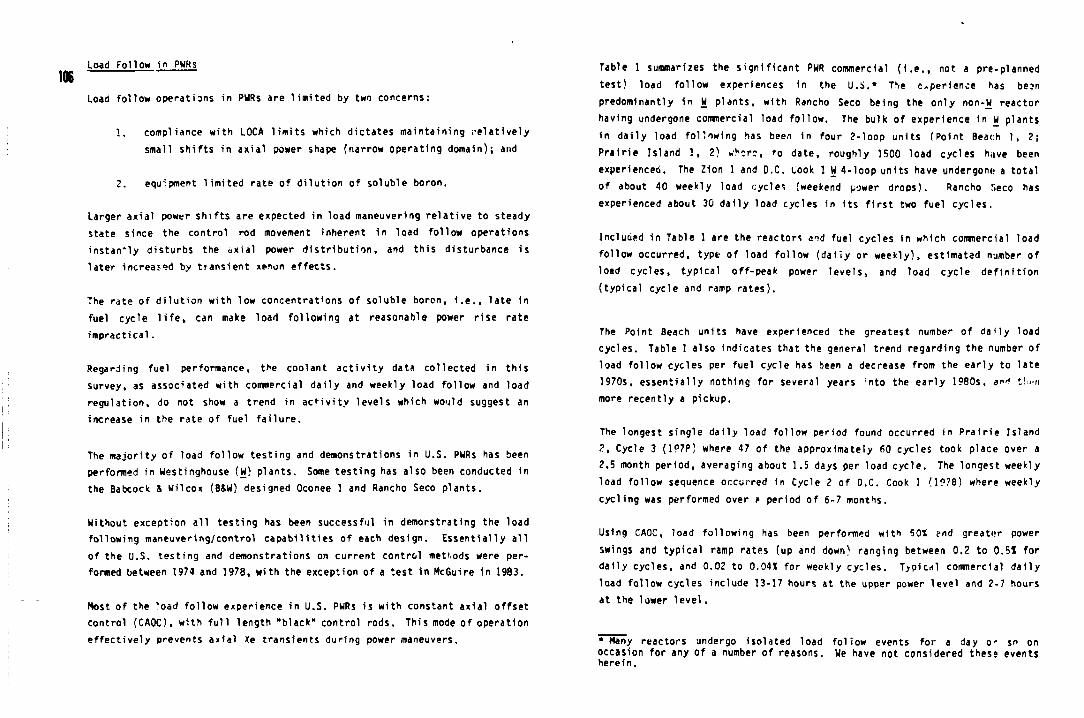
Load Follow in PWRs
Load follow operations in PWRs are limited by two concerns:
1. compliance with LOCA limits which dictates maintaining relatively small shifts in axial power shape {narrow operating domain); and
2. equipment limited rate of dilution of soluble boron.
Larger axial power shifts are expected in load maneuvering relative to steady state since the control rod movement inherent in load follow operations instan"ly disturbs the axial power distribution, and this disturbance is later increased by transient xenon effects.
The rate of dilution with low concentrations of soluble boron, i.e., late in fuel cycle life, can make load following at reasonable power rise rate impractical .
Regarding fuel performance, the coolant activity data collected in this survey, as associated with commercial daily and weekly load follow and load regulation, do not show a trend in activity levels which would suggest an increase in the rate of fuel failure.
The majority of load follow testing and demonstrations in U.S. PWRs has been performed in Westinghouse (W) plants. Some testing has also been conducted in the Babcock 4 Wilcox (B&W) designed Oconee 1 and Rancho Seco plants.
Without exception all testing has been successful in demonstrating the load following maneuvering/control capabilities of each design. Essentially all of the U.S. testing and demonstrations on current control meUods were performed between 1974 and 1978, with the exception of a test in McGuire in 1983.
Most of the 'oad follow experience in U.S. PWRs is with constant axial offset control (CA0C), with full length "black" control rods. This mode of operation effectively prevents axial Xe transients during power maneuvers.
Table 1 summarizes the significant PWR commercial (i.e., not a pre-planned test) load follow experiences in the U.S.* The CAperience has b e m predominantly in W plants, with Rancho Seco being the only non-W reactor having undergone commercial load follow. The bulk of experience in W plants in dally load following has been in four 2-loop units (Point Beach 1, 2; Prairie Island 1, 2) where, to date, roughly 1500 load cycles have been experienced. The Z1on 1 and D.C. Cook 1 W 4-loop units have undergone a total of about 40 weekly load cycles (weekend power drops). Rancho Seco has experienced about 30 daily load cycles In Its first two fuel cycles.
Included in Table 1 are the reactors and fuel cycles in which commercial load follow occurred, type of load follow (dally or weekly), estimated number of load cycles, typical off-peak power levels, and load cycle definition (typical cycle and ramp rates).
The Point Beach units have experienced the greatest number of daily load cycles. Table 1 also Indicates that the general trend regarding the number of load follow cycles per fuel cycle has been a decrease from the early to late 1970s, essentially nothing for several years :nto the early 1980s, a"^ t! i-n more recently a pickup.
The longest single dally load follow period found occurred in Prairie Island ?, Cycle 3 (1?7P) where 47 of the approximately 60 cycles took place over a 2.5 month period, averaging about 1.5 days per load cycle. The longest weekly load follow sequence occurred 1n Cycle 2 of D.C. Cook 1 (1978) where weekly cycling was performed over ? period of 6-7 months.
Using CAOC, load following has been performed with 50* ?nd greater power swings and typical ramp rates (up and down) ranging between 0.2 to 0.51 for dally cycles, and 0.02 to 0.04X for weekly cycles. Typical commercial daily load follow cycles include 13-17 hours at the upper power level and 2-7 hours at the lower level.
•Many reactors undergo Isolated load follow events for a day 0' sn on occasion for any of a number of reasons. We have not considered these events herein.
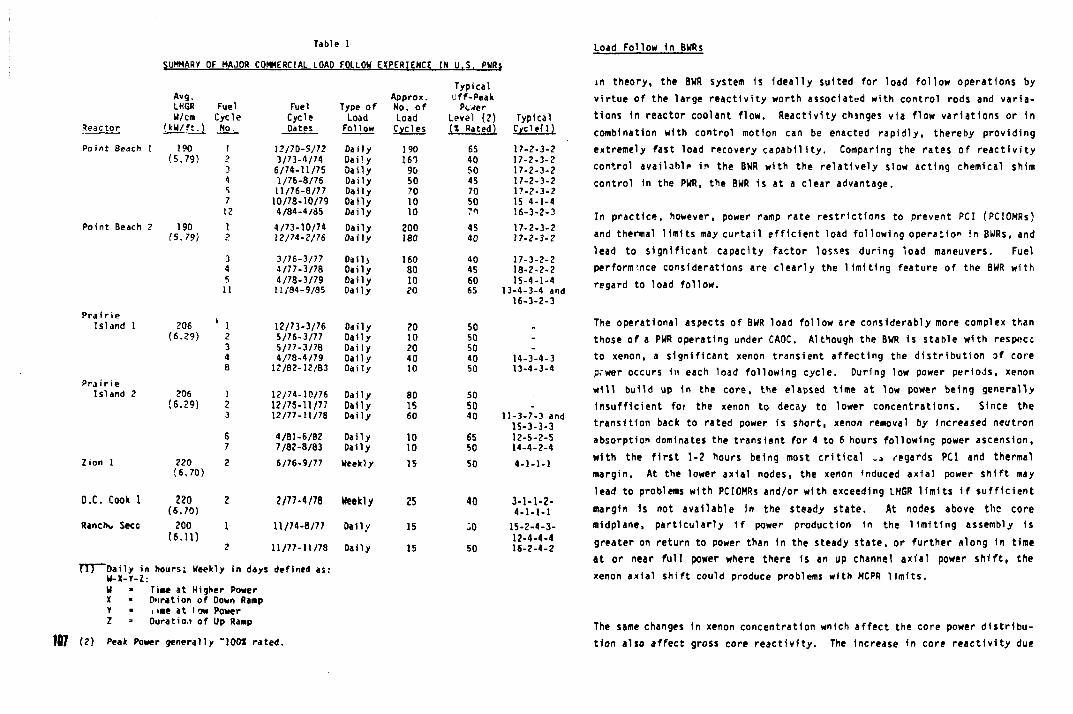
Table 1 SUHHARY OF MAJOR COMMERCIAL LOAO FOLLOW EXPERIENCE IN U.S. PWRs
Avq. Approx. Typical 'Jff-Peak
LHGR Fuel Fuel Type of No. of Power U/cm Cycle Cycle Load Load Level (2) Typical
Reactor ( m / f t . ) No. Dates Fo11ow Cycles (X Rated) Cycle) 1)
Point Beach 1 190 ! 12/70-S/72 Oaily 190 65 17-2-3-2 (5.79) 2 3/73-4/74 Daily 161 40 17-2-3-2
3 6/74-11/75 Oaily 90 50 17-2-3-2 4 1/76-8/75 Oaily 50 45 17-2-3-2 5 11/76-8/77 Daily 70 70 17-2-3-2 7 10/78-10/79 Daily 10 50 15 4-1-4 12 4/84-4/85 Daily 10 71 16-3-2-3
Point Beach 2 190 1 4/73-10/74 Daily 200 45 17-2-3-2 (5.79) 2 12/74-2/76 Daily 180 40 17-2-3-2
3 3/76-3/77 Daily 160 40 17-3-2-2 4 4/77-3/78 Daily 80 4S 18-2-2-2 5 4/78-3/79 Daily 10 60 15-4-1-4 11 11/84-9/85 Oaily 20 65 13-4-3-4 and
16-3-2-3 Pra i r i e
Island 1 206 1 1 12/73-3/76 Daily 20 50 . (6.29) 2 5/76-3/77 Daily 10 50 .
3 5/77-3/7B Daily 20 50 -4 4/78-4/79 Daily 40 40 14-3-4-3 8 12/82-12/83 Daily 10 50 13-4-3-4
Pra i r ie Island 2 206 1 12/74-10/76 Daily 80 50
(6.29) 2 12/75-11/77 Daily 15 50 -3 12/77-11/78 Daily 60 40 11-3-7-3 and
15-3-3-3 6 4/81-6/82 Daily 10 65 12-5-2-5 7 7/82-8/83 Daily 10 50 14-4-2-4
Zion 1 220 (6,70)
2 6/76-9/77 Weekly 15 SO 4-1-1-1
O.C. Cook 1 220 (6.70)
2 2/77-4/78 Weekly 25 40 3-1-1-2-4-1-1-1
Rancho Secc 200 (6.11)
1 11/74-8/77 Dally 15 :o 15-2-4-3-12-4-4-4
2 11/77-11/78 Oaily 15 50 16-2-4-2
TTJ Daily in hours; Weekly in days defined as: W-X-Y-Z: U * Tine at Higher Power X • Duration of Down Ramp Y » i lae at l ow Power Z » Duratio.i of Up Ramp
187 (2) Peak Power generally "lOOt rated.
Load Follow in BWRs
in theory, the BUR system is ideally suited for load follow operations by virtue of the large reactivity worth associated with control rods and variations in reactor coolant flow. Reactivity chinges via flow variations or in combination with control motion can be enacted rapidly, thereby providing extremely fast load recovery capability. Comparing the rates of reactivity control available 1n the BWR with the relatively slow acting chemical shim control In the PUR, the BWR is at a clear advantage.
In practice, however, power ramp rate restrictions to prevent PCI (PCIOHRs) and thermal limits may curtail efficient load following operation In BWRs, and lead to significant capacity factor losses during load maneuvers. Fuel performance considerations are clearly the limiting feature of the BWR with regard to load follow.
The operational aspects of BWR load follow are considerably more complex than those of a PWR operating under CAOC. Although the BWR Is stable with respocc to xenon, a significant xenon transient affecting the distribution of core p.'wer occurs in each load following cycle. During low power periods, xenon will build up In the core, the elapsed time at low power being generally insufficient for the xenon to decay to lower concentrations. Since the transition back to rated power is short, xenon removal by increased neutron absorption dominates the transient for 4 to 6 hours following power ascension, with the first 1-2 hours being most critical .» regards PCI and thermal margin. At the lower axial nodes, the xenon *nduced axial power shift may lead to problems with PCIOMRs and/or with exceeding LHGR limits if sufficient margin is not available In the steady state. At nodes above the core mldplane, particularly 1f power production in the limiting assembly Is greater on return to power than In the steady state, or further along in time at or near full power where there is an up channel axial power shift, the xenon axial shift could produce problems with MCPR limits.
The same changes in xenon concentration wnich affect the core power distribution also affect gross core reactivity. The Increase in core reactivity due
to xenon concentration levels below that of equilibrium steady-state operation can be partially offset by core recirculation flow reduction. The amount of flow reduction possible is limited by the restrictions in the power/flow operating nap for each core. From this point, control rods must be inserted to reduce core reactivity further. As a rule, core power reductions below 70X of rated power for load following would require some control rod insertion, although this is not always the case. This is not a significant problem for most of the fuel cycle since there are rods available for insertion which can compensate for the increased reactivity with minimal movement. However, subsequent control rod withdrawal after the xenon transient subsides may be limited by fuel preconditioning constraints.
The core-wide Xe transient can be an advantage. At Monticello during end of cycle coastdowr. with all rods out and maximum flow, power was decreasing at about 0.3X per day due to reactivity depletion. As shown in Figure 1 (taken from the operating log), the Xe depletion on retiirn to power actually increased the reactor power level which could ae obtained.
Table 2 offers an overview of the BWR load following experience presented herein. The Table is divided into two categories:
A. Testing and Demonstrations in the U.S.A. 3. U.S. Utility Commercial Load Follow Experience.
Load follow testing and demonstration programs are generally characterized by being preplanned to some degree, and closely monitored with many more process computer runs than normally taken. In this regard, the Brunswick-1 daily load follow period, although considered commercial in response to system demands, has been categorized herein as a demonstration.
The first commercial U.S. BUR to perform daily load follow testing was Duane Arnold in 1974 with all 7x7 fuel. The purpose of the test was to evaluate the ability to respond to system load demands. In general, the testing was successful; however, 6E recommended PCIOMRs were exceeded on several occasions. Nevertheless, there was only a slight indication of fuel failure from off-gas activity. The test was made during the first reactor cycle on
low burnup fuel which contributed to the resistance of fuel to PCI. This is the only occasion we have come across In the U.S. where there was any fuel failure indication due to load following operation, or as a matter of fact, any load maneuvering.
The first demonstration of do'ly load following with 8x8 fuel was performed in Brunswick-1. This demonstration involved an irregular load following schedule without extensive preplanning. A unique feature of this demonstration was the prior expansion of the preconditioning envelope to reduci; and/or eliminate administrative restrictions on rises to full power.
The 1979 Browns Ferry 3 daily load follow demonstration was perhaps the most severe test of this type of operation in a U.S. BWR to date. This was a demonstration of preplanned load maneuvers with initial steady state conditions close to preconditioning and thermal limits. No prior additional preconditioning was performed and little or no administrative restrictions were imposed on return to full power. The near limit conditions in the steady state i?ad to problems in maintaining operation within limits after return to full power, and it appears from the available data that TVA power operating guidelines were violated for short periods of time on several occasions. Two series of tests were performed, the first involving 100t-70X-100t power swings on flow control only, and the second having 100S-50X-100X swings utilizing both flow and control rods. In general, these tests were successful, and allowed determination of the magnitude of the steady state margins which would be required in this type uf plant (BWR-4) to provide efficient, unencumbered dally load following.
The Dresden 2 and Quad Cities 2 testing of EGC (a remote dispatching system) was successful in that the tests demonstrated that this type of load management can be readily accomplished with the BWR control systems.
As regards U.S. BWR comrr -i_ial daily load follow, by far the most extensive experience has been at Monticello. There have been two extended daily load follow periods in response to system demand in the spring of 1979 and 1982. For both, the load swings were about lOCZ-SSt-lOOt on flow control only. The first period occurred mid cycle, and some degree of administrative restric-
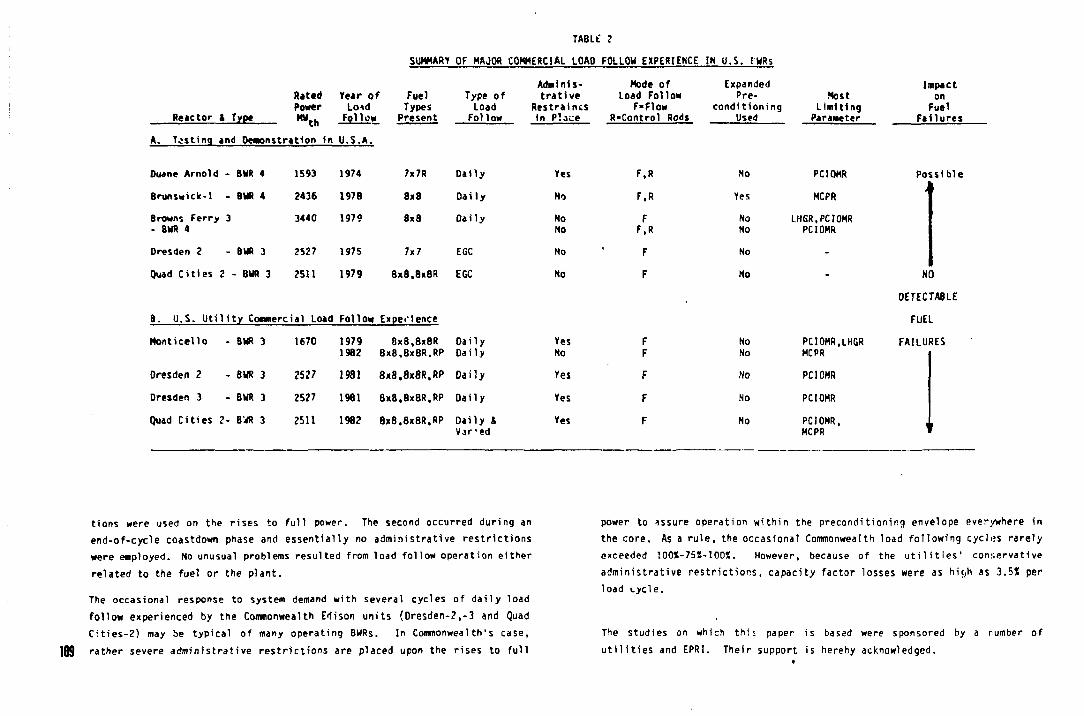
TABLE 2
Reactor t Type
Rated Power
Ye*r of Lo*d
Follow
A. Testing and Demonstration In U.S.h.
SUHHARY OF MAJOR COMMERCIAL LOAO FOLtOM EXPERIENCE IN U.S. IWRs
Fuel Types
Present
Type of Load
Follow
Administrative
Restraincs In Place
Mode of Load Follow
F-Flow R-Control Rods
Expanded Pre
condi t ioning Used
Most Limit ing
Parameter
Impact on
Fuel F a i l u r e s
Duane Arnold - BUR 4
8runswick-l - BUS 4
Browns Ferry 3 - 8UR 4
Dresden 2 - BUR 3
Quad Cities 2 - BWR 3
B. U.S. Utility Commercial Load Follow Experience
1593 1974 7x7R Daily
2436 1978 8x8 Daily
3440 1979 8x8 Oaily
2527 1975 7x7 EGC
2511 1979 8x8,8x8R EGC
Yes F.R
No F.R
No F No r.R No F
No F
Monti cello - BUR 3 1670 1979 1982
8x8,8x8R 8x8.8x8R.RP
Daily Daily
Yes No
F F
Oresden 2 - BWR 3 2527 1981 8x8.8x8R,RP Oaily Yes F
Dresden 3 - BUR 3 2527 1981 8x8.8x8R.RP Dai ly Yes F
Quad Cities 2- BlrfR 3 2511 1982 8x8.8x8R,RP Dai ly & Var-ed
Yes F
No PCIOMR Possible
Yes MCPR t >
No No
LHGR,PCIOMR PCIOMR
No -
No NO
DETECTABLE
FUEL
No No
PCIOMR.LHGR MCPR
FAILURES
No PCIOMR
No PCIOMR
No PCIOMR, MCPR "
tions were used on the rises to full power. The second occurred during an end-of-cycle coastdown phase and essentially no administrative restrictions were employed. No unusual problems resulted from load follow operation either related to the fuel or the plant.
The occasional response to system demand with several cycles of daily load follow experienced by the Commonwealth Edison units (Oresden-2,-3 and Quad Cities-2) may be typical of many operating BWRs. In Commonwealth's case, rather severe administrative restrictions are placed upon the rises to full
power to assure operation within the preconditioning envelope everywhere in the core. As a rule, the occasional Commonwealth load following cyclus rarely exceeded 100t-75!-100S. However, because of the utilities' conservative administrative restrictions, capacity factor losses were as hic,h as 3.5X per load Lycle.
The studies on which thi> paper is based were sponsored by a number of utilities and EPRI. Their support is hereby acknowledged.
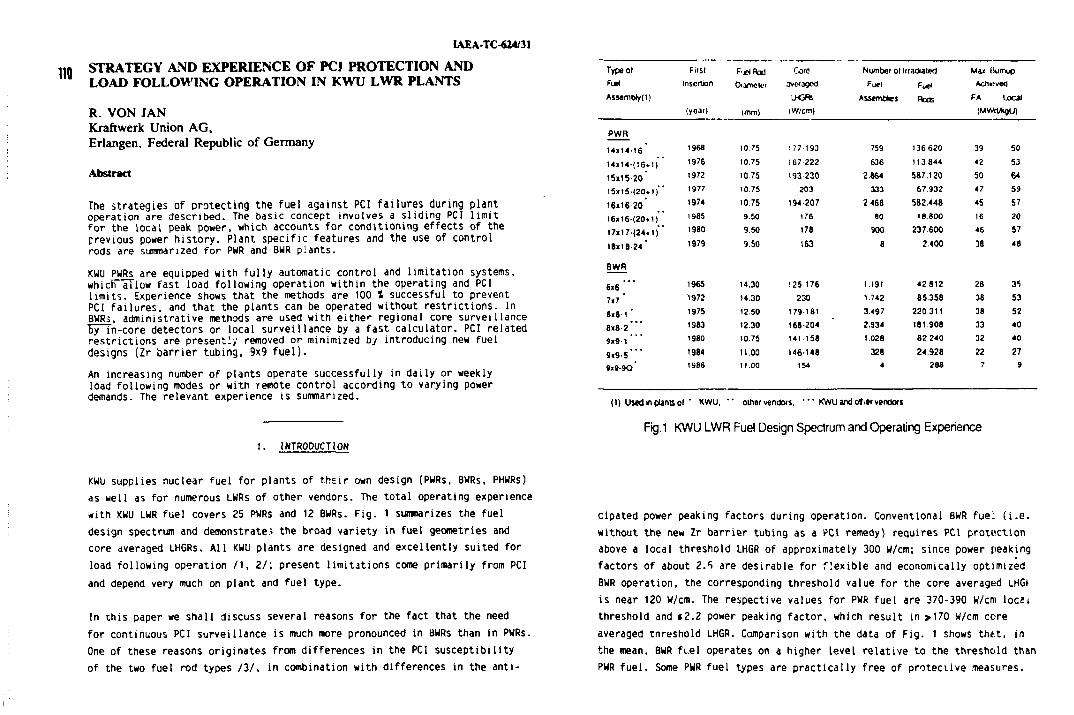
1AEA-TC-624/31
STRATEGY AND EXPERIENCE OF PCI PROTECTION AND LOAD FOLLOWING OPERATION IN KWU LWR PLANTS
R. VON JAN Kraftwerk Union AG, Erlangen, Federal Republic of Germany
Abstract
The strategies of protecting the fuel against PCI failures during plant operation are described. The basic concept involves a sliding PCI limit for the local peak power, which accounts for conditioning effects of the previous power history. Plant specific features and the use of control rods are summarized for PWR and BWR plants. KWU PWRs are equipped with fully automatic control and limitation systems, whicTTaTlow fast load following operation within the operating and PCI limits. Experience shows that the methods are 100 X successful to prevent PCI failures, and that the plants can be operated without restrictions. In BWRs, administrative methods are used with either regional core surveillance byTn-core detectors or local surveillance by a fast calculator. PCI related restrictions are presently removed or minimized by introducing new fuel designs (Zr barrier tubing, 9x9 fuel). An increasing number of plants operate successfully in daily or weekly load following modes or with remote control according to varying power demands. The relevant experience is summarized.
1. INTRODUCTION
KWU supplies nuclear fuel for plants of their own design (PWRs, BWRs, PHWRs) as well as for numerous LWRs of other vendors. The total operating experience with KWU LWR fuel covers 25 PWRs and 12 BWRs. Fig. 1 summarizes the fuel design spectrum and demonstrates the broad variety in fuel geometries and core dveraged LHGRs. All KWU plants are designed and excellently suited for load following operation /I, 2/; present limitations come primarily from PCI and depend very much on plant and fuel type.
In this paper we shall discuss several reasons for the fact that the need for continuous PCI surveillance is much more pronounced in BWRs than in PWRs. One of these reasons originates from differences in the PCI susceptibility of the two fuel rod types /3/, in combination with differences in the anti-
Type ot First F id Rod Core Number of IrraOaied Max fiumup Fuel Insertion Oiamcior averaged Fuel p ^ Acnmved
Assembly! 1) lyQft Assemblies Rons F A Local (year) ( m m ) (W/cm) (MWdAgU)
PWR 177193 759 136.620 39 50 167222 636 113.844 42 53
193230 2.864 587.120 50 64
203 333 67932 47 59 194-207 2468 582.448 45 57
176 80 18 800 16 20 178 900 237600 46 57
163 8 2.400 38 48
125 176 1.191 42812 28 35
230 1.742 85.358 38 53 179 181 3.497 220 311 38 52 168-204 2.934 181.908 33 40 141158 1.028 82240 32 40
146-148 328 24.928 22 27 154 4 288 7 9
(1) Used m plans ol " KWU, • ' oihef vendors, ' " KWU and on.er vendors
Fig.1 K W U L W R Fuel Design Spectrum and Operating Experience
cipated power peaking factors during operation. Conventional BWR fuel (i.e. without the new Zr barrier tubing as a PCI remedy) requires PCI protection above a local threshold LHGR of approximately 300 W/cm; since power peaking factors of about Z.*> are desirable for flexible and economically optimized BWR operation, the corresponding threshold value for the core averaged LHGi is near 120 W/cm. The respective values for PWR fuel are 370-390 W/cm loesi threshold and s2.2 power peaking factor, which result in > 170 W/cm core averaged tnreshold LHGR. Comparison with the data of Fig. 1 shows that, in the mean, BWR fi.el operates on a higher level relative to the threshold than PWR fuel. Some PWR fuel types are practically free of protective measures.
14114-16 1968 tO 75
I4i l4-(1G.1) 1976 1075
15*15-20 1972 1075
15x15(20.1) 1977 10.75
16x1620 1974 10.75
I6x16-<20.1) 1985 9.50
17*17-124-. 1) 1980 9.50
18x18-24 1979 9.50
BWR
6x6 ' " 1965 14.30
7«7 '1972 14.30
8x8-1 ' 1975 12.50
8 x 8 - 2 ' " 1983 12.30
9x9 1 1980 10.75
9 x 9 - 5 " ' 1984 11.00
9x9-9Q 1986 11.00
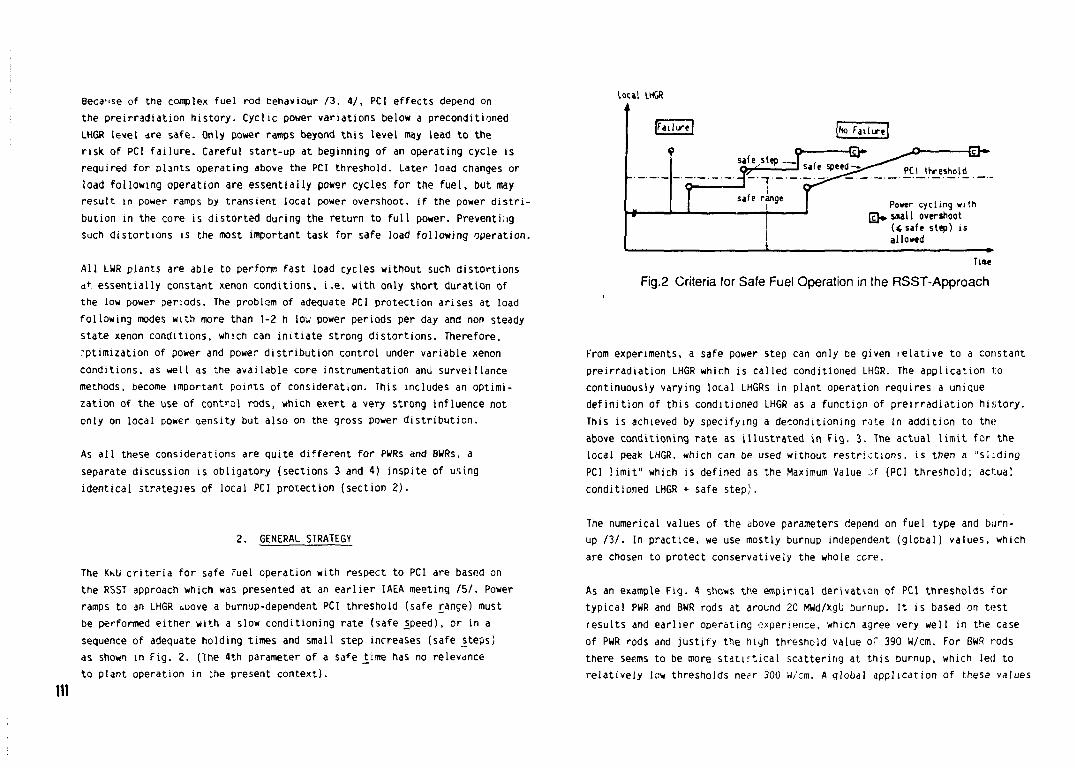
Because of the complex fuel rod behaviour /3, 4/, PCI effects depend on the preirradiation history. Cyclic power variations below a preconditioned LHGR level are safe. Only power ramps beyond this level may lead to the risk of PCI failure. Careful start-up at beginning of an operating cycle is required for plants operating above the PCI threshold. Later load changes or load following operation are essentially power cycles for the fuel, but may result in power ramps by transient local power overshoot, if the power distribution in the core is distorted during the return to full power. Preventing such distortions is the most important task for safe load following operation.
All LWR plants are able to perform fast load cycles without such distortions at essentially constant xenon conditions, i.e. with only short duration of the low power periods. The problem of adequate PCI protection arises at load following modes with more than 1-2 h low power periods per day and non steady state xenon conditions, which can initiate strong distortions. Therefore, optimization of power and power distribution control under variable xenon conditions, as well as the available core instrumentation and surveillance methods, become important points of consideration. This includes an optimization of the use of control rods, which exert a very strong influence not only on local power oensity but also on the gross power distribution.
As all these considerations are quite different for PWRs and BWRs, a separate discussion is obligatory (sections 3 and 4) inspite of using identical strategies of local PCI protection (section 2 ) .
2. GENERAL STRATEGY
The KhU criteria for safe fuel operation with respect to PCI are based on the RSST approach which was presented at an earlier IAEA meeting /5/. Power ramps to an LHGR cuove a burnup-dependent PCI threshold (safe £ance) must be performed either with a slow conditioning rate (safe jspeed), or in a sequence of adequate holding times and small step increases (safe _steps) as shown in Fig. 2. (The 4th parameter of a sa fe U m e has no relevance to plant operation in :he present context).
111
Local LHGR . i
Tine Fig.2 Criteria for Safe Fuel Operation in the RSST-Approach
From experiments, a safe power step can only be given relative to a constant preirradiation LHGR which is called conditioned LHGR. The application to continuously varying local LHGRs in plant operation requires a unique definition of this conditioned LHGR as a function of preirradiation history. This is achieved by specifying a deconditioning rate in addition to the above conditioning rate as illustrated in Fig. 3. The actual limit for the local peak LHGR, which can be used without restrictions, is then a "sl;ding PCI limit" which is defined as the Maximum Value of (PCI threshold; actual conditioned LHGR + safe step).
The numerical values of the above parameters depend on fuel type and burn-up /3/. In practice, we use mostly burnup independent (global) values, which are chosen to protect conservatively the whole cere.
As an example Fig. 4 shows the empirical derivation of PCI thresholds for typical PWR and BWR rods at around 20 MWd/kgu burnup. It is based on test results and earlier operating experience, which agree very well in the case of PWR rods and justify the high threshold value or 390 W/cm. For BWR rods there seems to be more statirtical scattering at this burnup, which led to relatively low thresholds neer 300 W/cm. A global application of these values
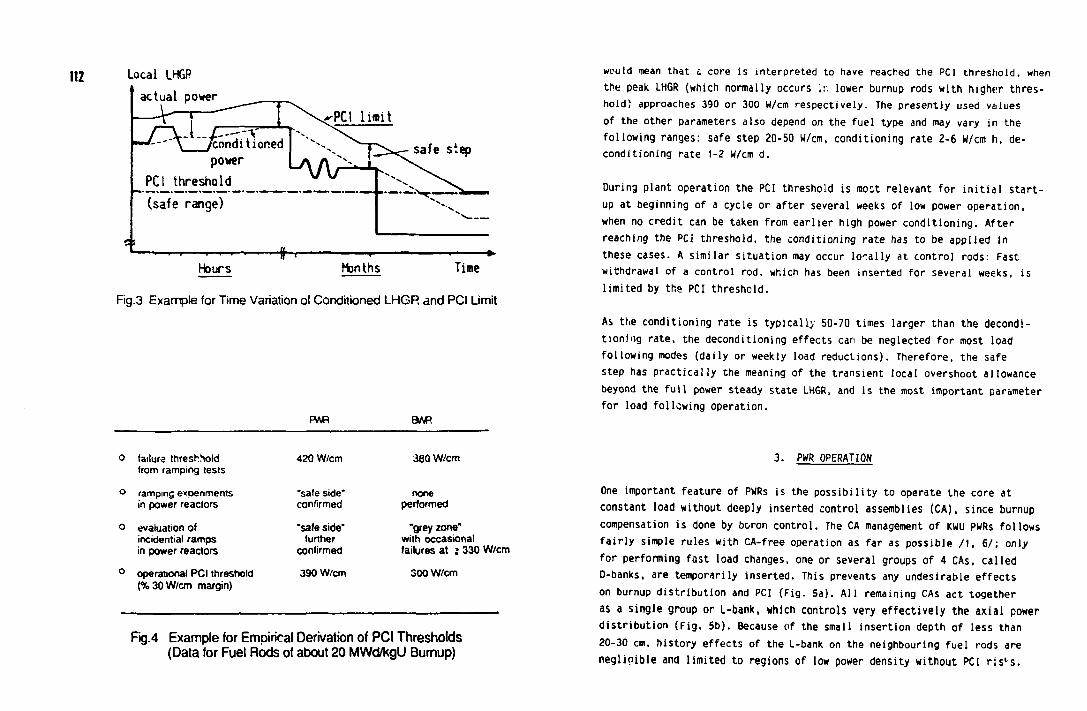
112 Local LHGP actual power
/conditioned power
PCj_ threshold (safe range)
safe step
i i i i i
Hours Months Time
Ftg.3 Example for Time Variation of Conditioned LHGR and PCI Limit
BAR BA/R
0 failure threshold from ramping tests
420 W/cm 380 W/cm
o ramping experiments in power reactors
"safe side" confirmed
none performed
0 evaluation of incidental ramps in power reactors
"safe side" further
confirmed
"grey zone* with occasional failures at j 330 W/cm
o operational PCI threshold (%30W/cm margin)
390 W/cm 300 W/cm
Rg.4 Example for Empirical Derivation of PCI Thresholds (Data for Fuel Rods of about 20 MWd/kgU Bumup)
would mean that c core is interpreted to have reached the PCI threshold, when the peak LHGR (which normally occurs \v. lower burnup rods with higher threshold) approaches 390 or 300 W/cm respectively. The presently used values of the other parameters also depend on the fuel type and may vary in the following ranges: safe step 20-50 W/cm, conditioning rate 2-6 W/cm h, de-conditioning rate 1-2 W/cm d.
During plant operation the PCI threshold is most relevant for initial startup at beginning of a cycle or after several weeks of low power operation, when no credit can be taken from earlier high power conditioning. After reaching the PCI threshold, the conditioning rate has to be applied in these cases. A similar situation may occur loyally at control rods: Fast withdrawal of a control rod, which has been inserted for several weeks, is limited by the PCI threshold.
As the conditioning rate is typically 50-70 times larger than the decondi-tioning rate, the deconditioning effects can be neglected for most load following modes (daily or weekly load reductions). Therefore, the safe step has practically the meaning of the transient local overshoot allowance beyond the full power steady state LHGR, and is the most important parameter for load following operation.
3. PWR OPERATION
One important feature of PWRs is the possibility to operate the core at constant load without deeply inserted control assemblies (CA), since burnup compensation is done by boron control. The CA management of KWU PWRs follows fairly simple rules with CA-free operation as far as possible /1, 6/; only for performing fast load changes, one or several groups of 4 CAs, called D-banks, are temporarily inserted. This prevents any undesirable effects on burnup distribution and PCI (Fig. 5a). All remaining CAs act together as a single group or L-bank, which controls very effectively the axial power distribution (Fig. 5b). Because of the small insertion depth of less than 20-30 cm, history effects of the L-bank on the neighbouring fuel rods are negligible and limited to regions of low power density without PCI ris^s.
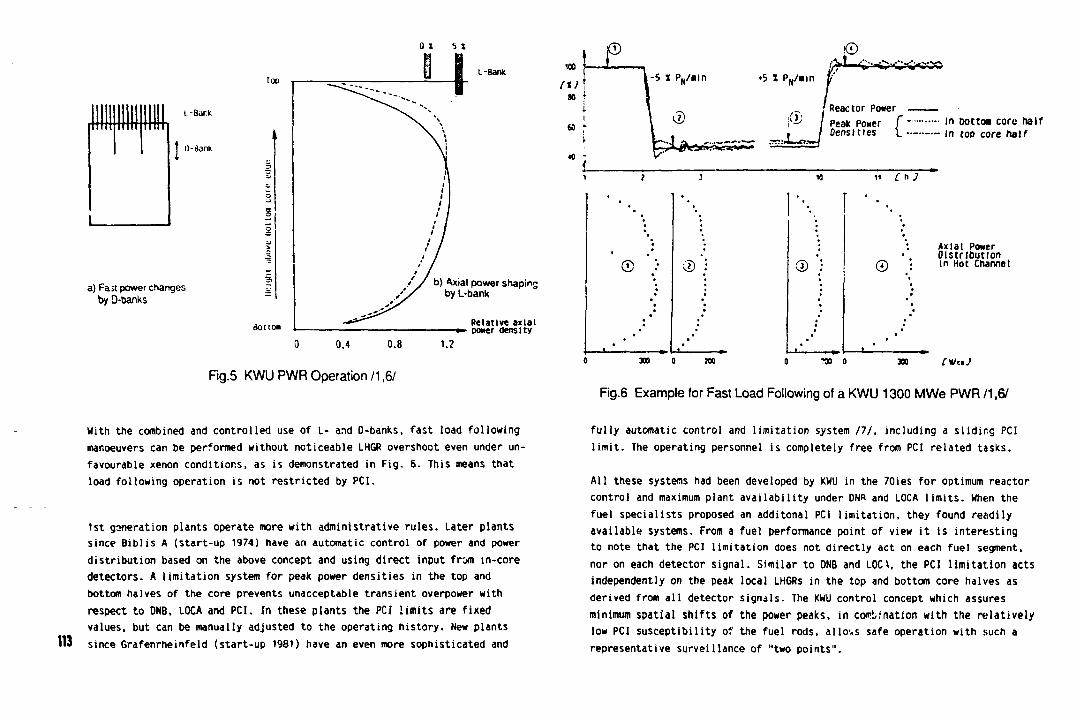
OX S X
[OP
I-Bar*
Hank
a) Fast power changes by O-banks
dottoa
I-Bank
b) Axial power shaping by L-bank
Relative axial »• power density
Fig.5 K W U P W R Operation /1,6/
With the combined and controlled use of L- and O-banks, fast load following manoeuvers can be performed without noticeable LHGR overshoot even under unfavourable xenon conditions, as is demonstrated in Fig. 6. This means that load following operation is not restricted by PCI.
113
1st goneration plants operate more with administrative rules. Later plants since Biblis A (start-up 1974) have an automatic control of power and power distribution based on the above concept and using direct input from in-core detectors. A limitation system for peak power densities in the top and bottom halves of the core prevents unacceptable transient overpower with respect to DNB, LOCA and PCI. In these plants the PCI limits are fixed values, but can be manually adjusted to the operating history. New plants since Grafenrheinfeld (start-up 1981) have an even more sophisticated and
•5 X P N/nn P
Reactor Power '^ / Peak Power f - • "» . / Densities i_ m
bottoa core naif too core half
5tttr**«r"«»»»
'•.
•
•
11 C n-7 • (
• (
®'. ©
• ,
•
— 1 ' . «»
Axial Power Distribution in Hot Channel
300 200 r» o 300 {VfJ
Fig.6 Example for Fast Load Following of a K W U 1300 M W e P W R /1,6/
fully automatic control and limitation system 111, including a sliding PCI limit. The operating personnel is completely free from PCI related tasks.
All these systems had been developed by KWU in the 70ies for optimum reactor control and maximum plant availability under 0NR and LOCA limits. When the fuel specialists proposed an additonal PCI limitation, they found readily available systems. From a fuel performance point of view it is interesting to note that the PCI limitation does not directly act on each fuel segment, nor on each detector signal. Similar to DNB and L0CV, the PCI limitation acts independently on the peak local LHGRs in the top and bottom core halves as derived from all detector signals. The KWU control concept which assures minimum spatial shifts of the power peaks, in combination with the relatively low PCI susceptibility of the fuel rods, allocs safe operation with such a representative surveillance of "two points".
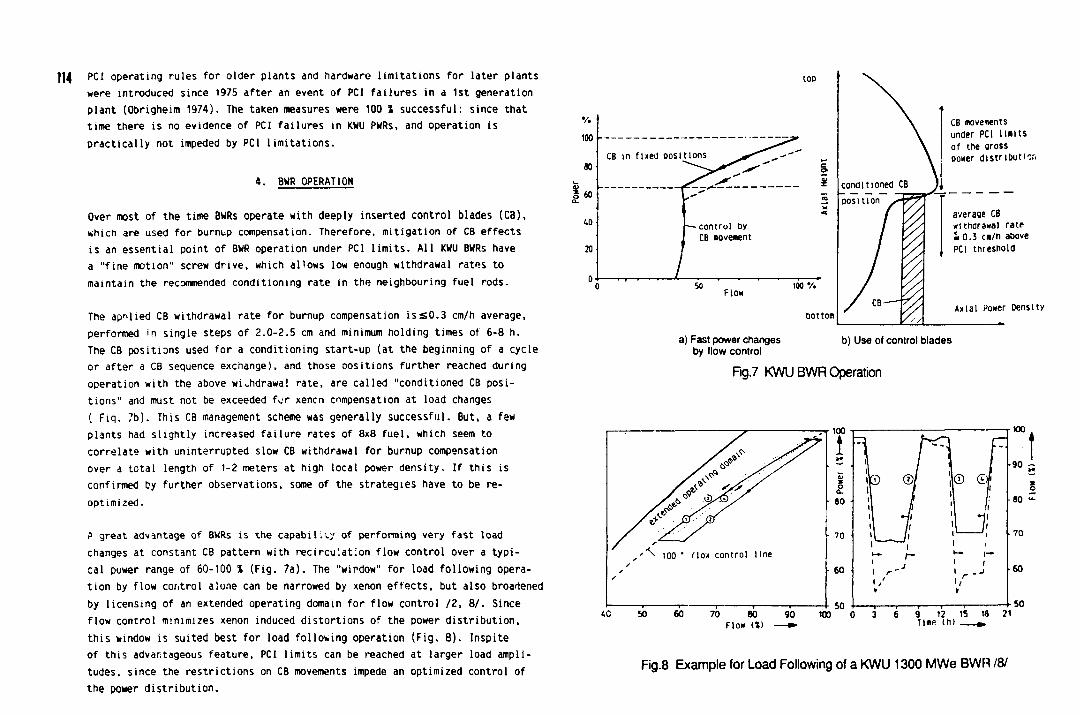
||4 PCI operating rules for older plants and hardware limitations for later plants were introduced since 1975 after an event of PCI failures in a 1st generation plant (Obrigheim 1974). The taken measures were 100 % successful: since that time there is no evidence of PCI failures in KWU PWRs, and operation is practically not impeded by PCI limitations.
4. BWR OPERATION
Over most of the time BWRs operate with deeply inserted control blades (CB), *hich are used for burnup compensation. Therefore, mitigation of CB effects is an essential point of BWR operation under PCI limits. All KWU BWRs have a "fine motion" screw drive, which al'ows low enough withdrawal rates to maintain the recommended conditioning rate in the neighbouring fuel rods.
The applied CB withdrawal rate for burnup compensation iss0.3 cm/h average, performed >n single steps of 2.0-2.5 cm and minimum holding times of 6-8 h. The CB positions used for a conditioning start-up (at the beginning of a cycle or after a CB sequence exchange), and those oositions further reached during operation with the above withdrawal rate, are called "conditioned CB positions" and must not be exceeded for xencn compensation at load changes ( Fiq. 7b). This CB management scheme was generally successful. But, a few plants had slightly increased failure rates of 8x8 fuel, which seem to correlate with uninterrupted slow CB withdrawal for burnup compensation over a total length of 1-2 meters at high local power density. If this is confirmed by further observations, some of the strategies have to be re-optimized.
P great advantage of BWRs is the capability of performing very fast load changes at constant CB pattern with recirculation flow control over a typical power range of 60-100 X (Fig. 7a). The "window" for load following operation by flow control alone can be narrowed by xenon effects, but also broartened by licensing of an extended operating domain for flow control /2, 8/. Since flow control minimizes xenon induced distortions of the power distribution, this window is suited best for load following operation (Fig. 8). Inspite of this advantageous feature, PCI limits can be reached at larger load amplitudes, since the restrictions on CB movements impede an optimized control of the power distribution.
CB movements under PCI U«lts of the gross power distribution
average CB withdrawal rate • 0.3 cn/n above PCI threshold
Axial Power Density
a) Fast power changes by (low control
b) Use ol control blades
Fig.7 K W U B W R Operation
II t^~] F~
rKXJ
•90
ib) ii ii ii \\ ii \\
fl -jl jl
1® jl
i SO
• 7 0
i -» 1 1-* i -
1 r- , j . r
T™
. J 60
• 5 0 70 80 90
Flow (X) »• 0 3 6 9 12 15
Time (h) 18 21
Fig.8 Example for Load Following of a KWU 1300 MWe BWFl 18/
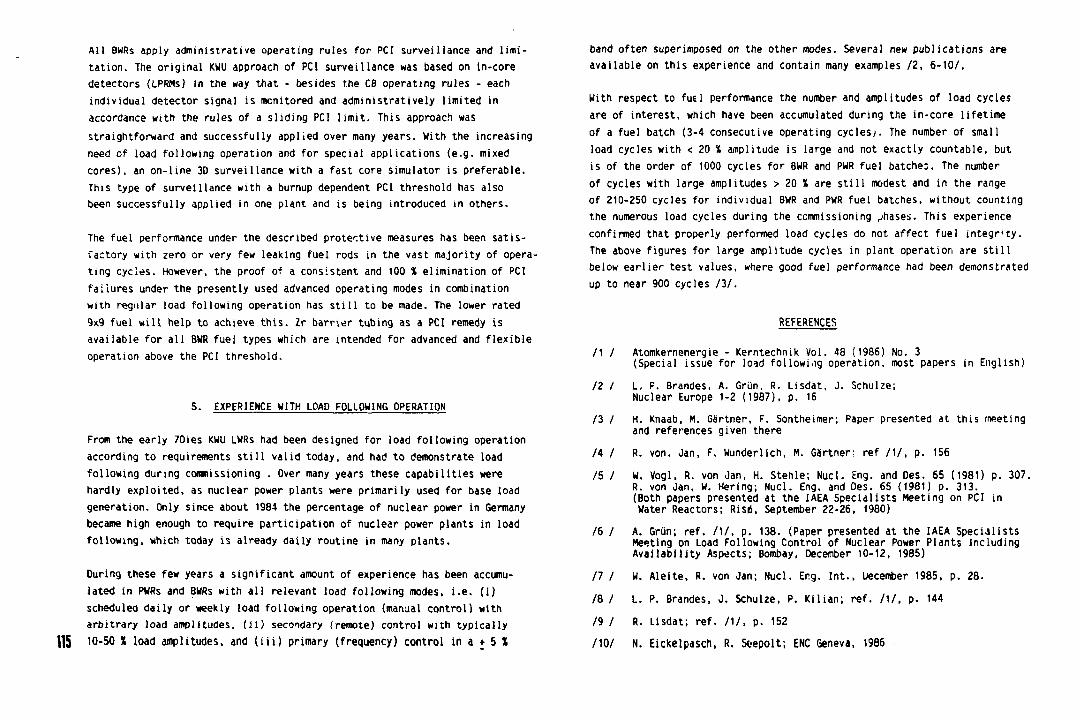
All BWRs apply administrative operating rules for PCI surveillance and limitation. The original KWU approach of PCI surveillance was based on in-core detectors (LPRMs) in the way that - besides the CB operating rules - each individual detector signal is monitored and administratively limited in accordance with the rules of a sliding PCI limit. This approach was straightforward and successfully applied over many years. With the increasing need of load following operation and for special applications (e.g. mixed cores), an on-line 3D surveillance with a fast core simulator is preferable. This type of surveillance with a burnup dependent PCI threshold has also been successfully applied in one plant and is being introduced in others.
The fuel performance under the described protective measures has been satisfactory with zero or very few leaking fuel rods in the vast majority of opera ting cycles. However, the proof of a consistent and 100 X elimination of PCI failures under the presently used advanced operating modes in combination with regular load following operation has still to be made. The lower rated 9x9 fuel will help to achieve this. Zr barrier tubing as a PCI remedy is available for all BWfi fuel types which are intended for advanced and flexible operation above the PCI threshold.
5. EXPERIENCE WITH LOAD FOLLOWING OPERATION
From the early 70ies KWU LWRs had been designed for load following operation according to requirements still valid today, and had to demonstrate load following during commissioning . Over many years these capabilities were hardly exploited, as nuclear power plants were primarily used for base load generation. Only since about 1984 the percentage of nuclear power in Germany became high enough to require participation of nuclear power plants in load following, which today is already daily routine in many plants.
During these few years a significant amount of experience has been accumulated in PWRs and BWRs with all relevant load following modes, i.e. (i) scheduled daily or weekly load following operation (manual control) with arbitrary load amplitudes, (ii) secondary (remote) control with typically
115 10-50 X load amplitudes, and (iii) primary (frequency) control in a + 5 X
band often superimposed on the other modes. Several new publications are available on this experience and contain many examples 12, 6-10/.
With respect to fuel performance the number and amplitudes of load cycles are of interest, which have been accumulated during the in-core lifetime of a fuel batch (3-4 consecutive operating cyclesj. The number of small load cycles with < 20 % amplitude is large and not exactly countable, but is of the order of 1000 cycles for BWR and PWR fuel batches. The number of cycles with large amplitudes > 20 % are still modest and in the range of 210-250 cycles for individual BWR and PWR fuel batches, without counting the numerous load cycles during the commissioning phases. This experience confirmed that properly performed load cycles do not affect fuel integr'ty. The above figures for large amplitude cycles in plant operation are still below earlier test values, where good fuel performance had been demonstrated up to near 900 cycles /3/.
REFERENCES
l\ I Atomkernenergie - Kerntechnik Vol. 48 (1986) No. 3 (Special issue for load following operation, most papers in English)
/2 / L. P. Brandes, A. Griin, R. Lisdat, J. Schulze; Nuclear Europe 1-2 (1987), p. 16
/3 / H. Knaab, M. Gartner, F. Sontheimer; Paper presented at this meeting and references given there
/4 / R. von. Jan, F. Wunderlich, M. Gartner; ref /1/, p. 156 /5 / W. Vogl, R. von Jan, H. Stehle; Nucl. Eng. and Des. 65 (1981) p. 307.
R. von Jan. W. Hering; Nucl. Eng. and Des. 65 (1981) p. 313. (Both papers presented at the IAEA Specialists Meeting on PCI in Water Reactors; Risri, September 22-26. 1980)
/6 / A. Griin; ref. /1/, p. 138. (Paper presented at the IAEA Specialists Meeting on Load Following Control of Nuclear Power Plants Including Availability Aspects; Bombay, December 10-12, 1985)
II I W. Aleite, R. von Jan; Nucl. Eng, Int., Uecember 1985, p. 28. /8 / L. P. Brandes, J. Schulze, P. Kilian; ref. hi, p. 144 /9 / R. Lisdat; ref. /I/, p. 152 /10/ N. Eickelpasch, R. Seepolt; ENC Geneva, 1986
IAEA-TC-624/32
116 IMPACT OF LOAD MODULATION ON FUEL BEHAVIOUR
M. GROSGEORGE Service Etudes et projets thermiques
et nucl&tires, Electricite" de France, Villeurbanne, France
Abstract
In 1986, the share of nuclear energy reaches 70 Z of the french electricity production. In order to accomodate consumption fluctuations, nose nuclear plants have been adapted to load modulation.
EOF has developped fuel studies to ensure that present design can sustain these operating conditions without any loss of reliability. These studies were backed by experimental programs, led In cooperation with FRAMATOME and CEA.
ID this paper, the main potential effects of load modulation operation on fuel behaviour are identified : increase of Internal rod pressure, cladding fatigue damage, modification in the cladding mechanical equilibrium and subsequent increase of the stress level during a given transient.
The magnitude of these effects depends notably on local rod power history. Unfortunately, the ex-core Instrumentation system does not allow local power evaluation in the core ; consequently, on-line evaluation of the impact of load modulation is not possible.
Therefore a conservative method has been developpcd for load modulation simulation.
Fuel management, reactor control and load modulation neutronlcal calculations are first carried out.
Based on these hypothesises, fuel thernomechanical. studies yield the maximum values of criterion-limited parameters. For example, in the case of 3,7 Z enriched fuel operating for 3 cycles, the rod pressure does not exceed 150 bar (155 bar for external coolant pressure) ; cladding fatigue damage remains in the 30-40 Z range.
Evolutions of penalizing rod condltionning power art-calculated during low power (< 92 Z NP) and high power periods.
As long as It exceeds a minimum value (i.e., rupture-initiating LHGR must remain above the maximum possible power rate in (P-Delta I) diagram), low power operation is allowed. Otherwise, a return to full power operation is necessnr) .
For 3,7 Z FRACEHA fuel management (900 HWe units), after an initial 75-day period (first cycle excluded), an initial "credit" of 66 days is available, decreasing or being restored according to unit power level.
Equivalent specifications have to be etablished for other fuel designs and other plant series (M3, 1300 MWe units, etc . . . ) •
New fuel designs and/or new fuel managements will be also treated. Corresponding fuel studies will be improved, especially with experimental programs contribution.
1. INTRODUCTION
In order to accomodate the increased share of nuclear plants in electricity production (70 Z in 1986), EDF's FVTF. units have been adapted to load-following and frequency control operation.
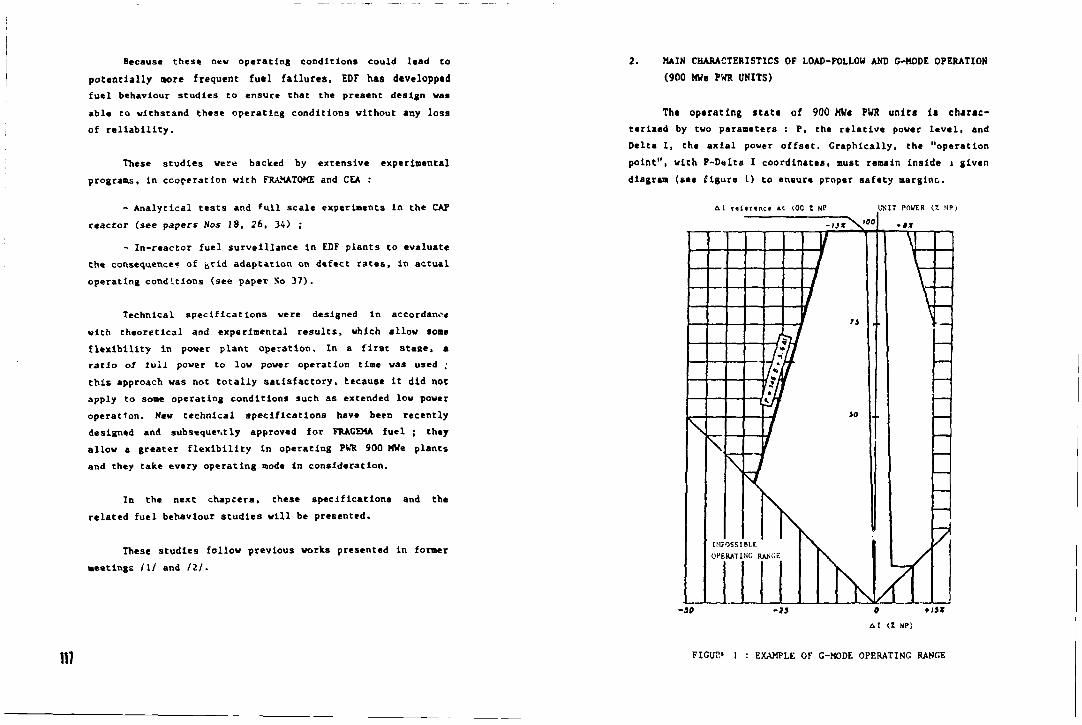
Because these new operating conditions could lead to potentially acre frequent fuel failures. EDF has developped fuel behaviour studies to ensure that the present design was able to withstand these operaticg conditions without any loss of reliability.
These studies were backed by extensive experimental programs, in cooperation with FRAMATOME and CEA :
- Analytical tests and *ull scale experiments In the CAP reactor (see papers Nos 18, 26, 34) ;
- In-reactor fuel surveillance in EDF plants to evaluate the consequence? of arid adaptation on defect rates, in actual operating conditions (see paper So 37).
technical specifications were designed In accordance with theoretical and experimental results, which allow some flexibility in pover plant operation. In a first stage, a ratio of full power to low power operation time was used ; this approach was not totally satisfactory, because it did not apply to some operating conditions such as extended low power ope radon. New technical specifications have been recently designed and subsequently approved for FRAGEMA fuel ; they allow a greater flexibility in operating PWR 900 Mwe plants and they take every operating mode in consideration.
In the next chapters, these specifications and the related fuel behaviour studies will be presented.
These studies follow previous works presented In former meetings III and ill-
11)
2. MAIN CHARACTERISTICS OF LOAD-FOLLOW AND G-MODE OPERATION (900 MWe PWR UNITS)
The operating state of 900 MW< PWR units Is characterized by two parameters : P, the relative power level, and Delta I, the axial power offset. Graphically, the "operation point", with P-Delca I coordinates, oust remain inside I given diagram (see figure 1) to ensure proper safety margins.
fit cettrcivce »'- 100 Z H? WCIT POVER U HP)
FIGUW I : EXAMPLE OF C-MODE OPERATING RANGE
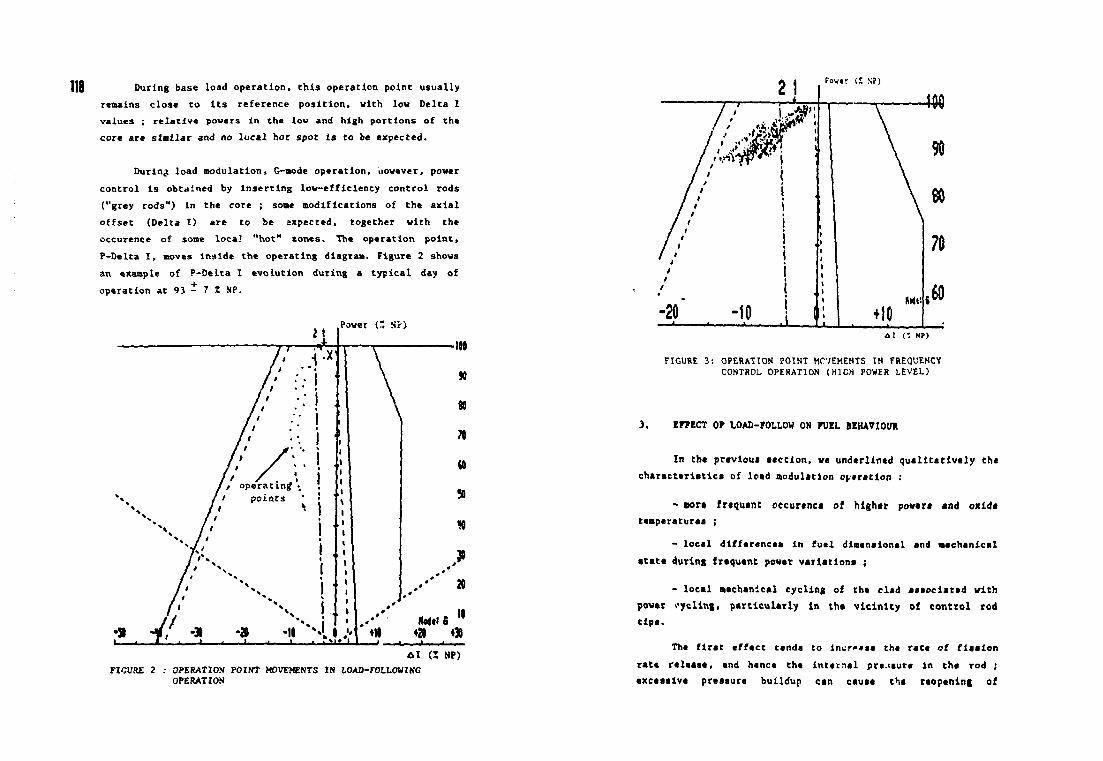
ill During base load operation, this operation point usually remains close to its reference position, with low Delta I values ; relative powers In the low and high portions of the core are similar and no local hot spot is to be expected.
During load modulation, G-mode operation, uowever, power control is obtained by Inserting low-efficiency control rods ("grey rods") In the core ; some modifications of Che axial offset (Delta I) are to be sxpected, together with the occurence of some locaJ "hot" tones. The operation point, P-Delca I, moves inside the operating diagram. Figure 2 shows an example of F-Delta I evolution during a typical day of operation at 93 - 7 i UP.
FIOTRE 2 : OPERATION POINT MOVEMENTS IN LOAD-FOLLOWING OPERATION
2 1 Power ( I X?)
tflfl
A#C / > i
i "TVV
90
f : \ • \ 80
/ 1 I 1 j 1
/ I 1 1 ! 70
I t
1
• -20"
i : * ! •>
-10 | ( +10
g60
4J ('. HP)
FIGURE 3: OPERATION POINT MOVEMENTS IN FREQUENCV CONTROL OPERATION (HICH POWER LEVEL)
3, EFFECT OF LOAD-FOLLOW ON FUEL BEHAVIOUR
In the previous section, we underlined qualitatively the characteristic* of load modulation operation :
- mors fraqusnt occurence of higher power* and oxide temperatures ;
- local differences In fuel dimensional and mechanical •tat* during frequent power variations ;
- local mechanical cycling of the clad associated with power rycling, particularly In the vicinity of control rod tips.
The first effect tends to increase the rate of fission rate release, and hence the Internal pre.isure in the rod ; excessive pressure buildup can cause the reopening of
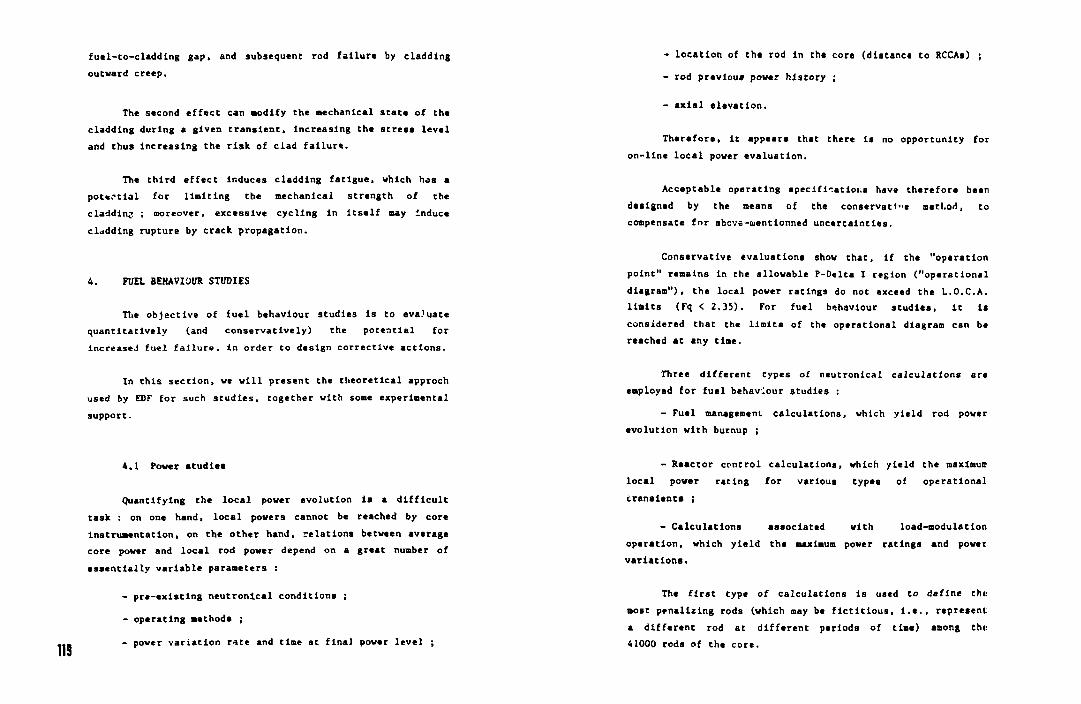
fuel-to-claddlng gap, and subsequent rod failure by cladding outward creep.
The second effect can modify the mechanical state of the cladding during a given transient, Increasing the stress level and thus Increasing the risk of clad fallur«.
The third effect Induces cladding fatigue, which has a potential for limiting the mechanical strength of the cladding ; moreover, excessive cycling In Itself may Induce cladding rupture by crack propagation.
4. FUEL BEHAVIOUR STUDIES
The objective of fuel behaviour studies Is to evaluate quantitatively (and conservatively) the potential for Increased fuel failure, in order to design corrective actions.
In this section, ve will present the theoretical approch used by EDF for such studies, together with some experimental support.
4.1 Power studies
Quantifying the local power evolution la a difficult task : on one hand, local powers cannot be reached by core instrumentation, on the other hand, relations between average core power and local rod power depend on a great number of essentially variable parameters :
- pre-existing neutronlcal conditions ;
- operating methods ;
- power variation rate and time at final power level ;
- location of the rod In Che core (distance to RCCAs) ;
- rod previous power history ;
- axial elevation.
Therefore, It appears that there Is no opportunity for on-line local power evaluation.
Acceptable operating specifi".atioi,a have therefore been designed by the means of the conservat1"e method, to compensate for above-mentionned uncertainties.
Conservative evaluations show that, if the "operation point" remains In the allowable P-Delta I region ("operational diagram"), the local power ratings do not exceed the L.O.C.A. limits (Fq < 2.35). For fuel buhavlour studies, it Is considered that the limits of the operational diagram can be reached at any time.
Three different cypes of neutronlcal calculations are employed for fuel behaviour studies :
- Fuel management calculations, which yield rod power evolution with burnup ;
- Reactor control calculations, which yield the maximum local power rating for various types of operational transients ;
- Calculations associated with load-modulation operation, which yield the maximum power ratings and power variations.
The first type of calculations Is used to define the most penalizing rods (which may be fictitious, i.e., represent a different rod at different periods of time) among the 41000 rods of the core.
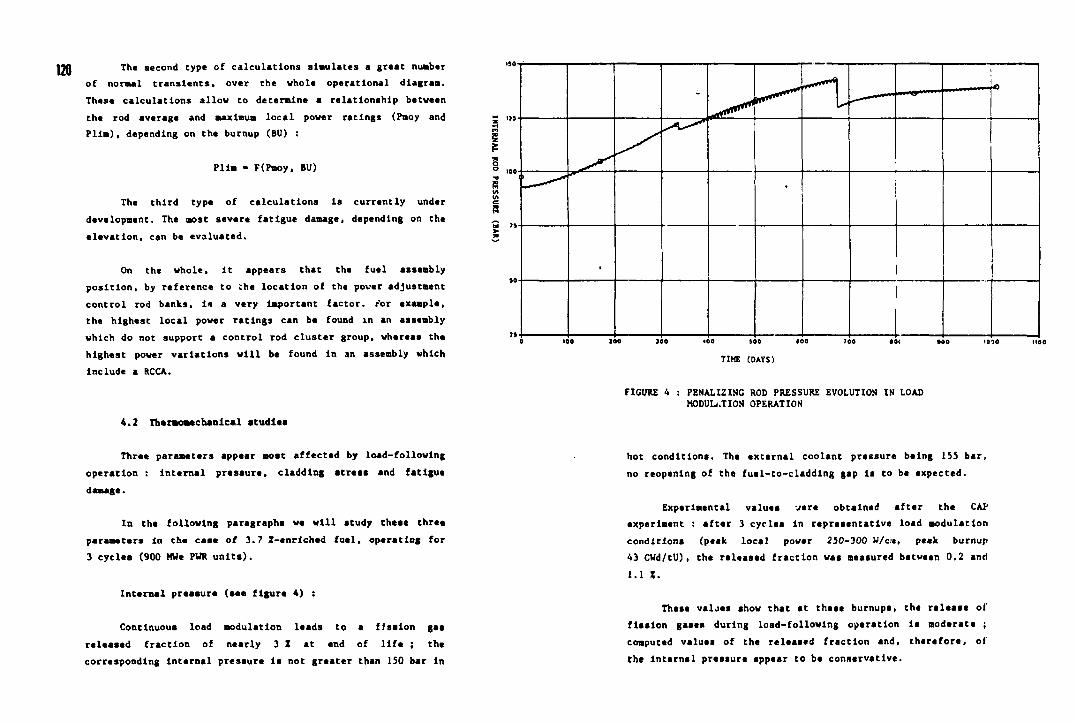
The second type of calculations slaulates a great number of normal transients, over the whole operational diagram. These calculations allow to determine a relationship between the rod average and maximum local power ratings (Pnoy and Plim), depending on the burnup (BU) :
Plim - F(Pmoy, BU)
The third type of calculations Is currently under development. The most severe fatigue damage, depending on the elevation, can be evaluated.
On the whole, it appears that the fuel assembly position, by reference to Che location of the pover adjustment control rod banks, is a very Important factor, r'or example, the highest local power ratings can be found in an assembly which do not support a control rod cluster group, whereas the highest power variations will be found in an assembly which include a RCCA.
4.2 Thermomechanlcal atudiea
Three parameters appear most affected by load-following operation : internal pressure, cladding stress and fatigue damage.
In the following paragraphs we will study these three parameters in the caae of 3.7 Z-enrlched fuel, operating for 3 cycles (900 MWe PWR units).
Internal pressure (see figure 4) :
Continuous load modulation leads to a fission gas released fraction of nearly 3 X at end of life ; the corresponding Internal pressure Is not greater than 150 bar In
» 300 «00 »00 «00 700 00<
TIME (DAYS)
FIGURE 4 : PENALIZING ROD PRESSURE EVOLUTION IN LOAD MODULATION OPERATION
hot conditions. The external coolant pressure being 155 bar, no reopening of the fuel-to-cladding gap la to be expected.
Experimental values vere obtained after the CAP experiment : after 3 cycles in representative load modulation conditions (peak local pover 250-300 U/em, peak burnup 43 CWd/tU), tha released fraction was measured between 0.2 and 1 . 1 X .
These valjes show that at these burnups, the release of fission gases during load-following operation is moderate ; computed values of the released fraction and, therefore, of the Internal pressure appear to be conservative.
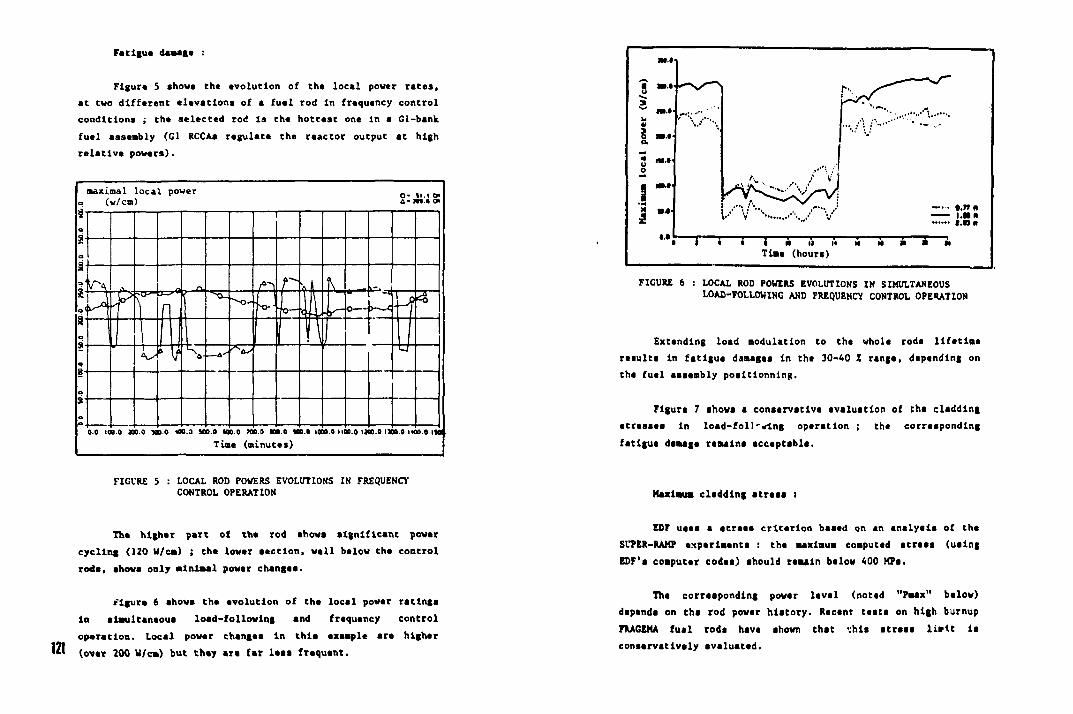
Fatigue damage :
Figure 5 shows the evolution of the local power rates, at two different elevations of a fuel rod in frequancy control conditions ; the selected rod la the hottest one in a Gl-bank fuel asseably (Gl RCCAs regulate the reactor output at high relative powers).
a maximal l o c a l power c . „ , „
( V / C S ) A -JwI iO l
4 a
t a 3-=
o 2"1
o 8-
si-
4 a
t a 3-=
o 2"1
o 8-
si-
4 a
t a 3-=
o 2"1
o 8-
si-
SDv A «- F\ r w f> ^*-4
4 a
t a 3-=
o 2"1
o 8-
si-
3 P OTH
n - - O ' Y f V o — )- *< \1 4
4 a
t a 3-=
o 2"1
o 8-
si-
^ \ I 1 1 r T\ P 1 J
4 a
t a 3-=
o 2"1
o 8-
si-
ks 0 \f \ . _ 4 ' ^ u
4 a
t a 3-=
o 2"1
o 8-
si-
4 a
t a 3-=
o 2"1
o 8-
si-
0.0 100.0 KB 0 300.0 100.3 JOO.O HO.O 700.0 HO.O WOO 1000.0 1100.0 IJOO.O IJOO.O IWO.O I M
Time (minutes)
FIGURE 5 : LOCAL ROD POWERS EVOLUTIONS IN FREQUENCY CONTROL OPERATION
The higher part of the rod ahows significant power cycling (120 W/ca) ; the lower section, well below the control rods, shows only minimal power changea.
r'lgure 6 shows the evolution of the local powar ratings in slaultanaous load-following and frequency control operation. Local powar changes In this exaapla ara higher (over 200 W/ca) but they ara far lata frequent.
Time (hours)
FIGURE 6 : LOCAL ROD POWERS EVOLUTIONS IN SIMULTANEOUS LOAD-FOLLOWING AND FREQUENCY CONTROL OPERATION
Extsndlng load modulation to the whole rods lifetime results in fatigue damages In the 30-40 X range, depending on the fuel assembly positlonnlng.
Flgurt 7 shows a conservative evaluation of the cladding stresses in load-foll'*ing operation ; the corresponding fatigue damage remains acceptable.
Maximum cladding stress »
EDF usss a stress criterion baaed on an analyals of ths SUPER-RAMP experiments : the maximum computed stress (using EDF'i computer codas) should remain below 400 KFa.
The corresponding power level (noted "Pmax" below) depends on the rod powsr history. Racant tests on high burnup FKAGEMA fuel rods have shown that shls stress licit Is conservatively evaluated.
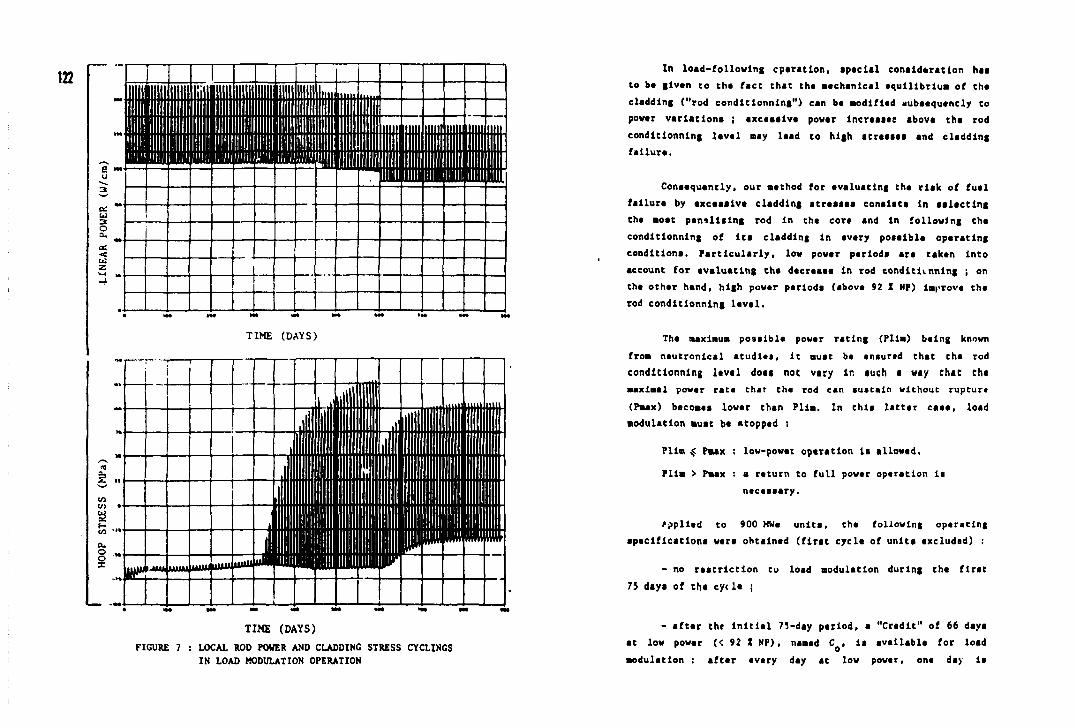
1 IIIIIIIIIIIIIIIIIIIIH
' : : ' - • ; ! ' : , ! •• i - ^ i ; ' ; , : ; ! i l l ! I l i i l l , Hill urn ' : : ' - • ; ! ' : , ! •• i - ^ i ; ' ; , : ; ! i l l ! I l i i l l , mi l urn nun inn Hill urn " • " " . , . - - : ; ; I 1 ' 1 mini Hill nun nun mil; [•''I'ui'tiiiniiiiiiui!! i i : i i i i i i i i i i r u i n milll l l l l •••in 23UIU11M Mini u rn
TIME (DAYS)
t o -•••
a. 8 -X ,.m JUUU u u u lUtUJ UltUl
WHIUHIIIIlllllllhi
WSgg"
TIME (DAYS)
FIGURE 7 : LOCAL ROD POWER AND CLADDING STRESS CYCLINGS IN LOAD MODULATION OPERATION
In load-following cparatlon, spaclal consideration hai to ba glvan to tha fact that tha aachanlcal equilibrium of tha cladding ("rod condltlonnlng") can ba aodlflad aubaequently to povar variation* ; excasalva powar Increases abova tha rod condltlonnlng laval nay laad to high aeraatat and cladding failure.
Conaequently, our mathod for avaluatlng tha rlak of fual fallura by axcaaalva cladding atraaaaa conalata In aaltcting tha aoat penalising rod In tha cora and In following tha condltlonnlng of lta cladding In avary poaalbla oparatlng condition!. Particularly, low powar parloda ara takan Into account for avaluatlng tha dacraaaa In rod conditioning ; on tha othar hand, high powar parloda (abova 92 Z NP) Improve tha rod condltlonnlng laval.
Tha maximum poselble powar rating (Film) balng known from nautronlcal atudlet, it mult ba aniurtd that tha rod conditioning laval doti not vary lr. such a way that tha maximal povar rata char tha rod can auataln without rupture (Pmax) bacomaa lowar than Plim. In thla lattar caaa, load modulation must ba atoppad ;
Film Pmax ; low-power oparatlon la aUowad.
Film > Pmax : a raturn to full powar oparatlon la nacaaaary.
>ppllad to 900 HWa unita, tha following oparaclng apaclflcatlona wara ohtalnad (firat cycla of unlta axcludad) :
- no raatrlction to load modulation during tha flrat 75 days of tha cycle ;
- aftar the Initial 7!-day period, a "Cradlt" of 66 daya at low powar (< 92 Z NP), namad C , la available for load modulation : after every day at low power, one day la
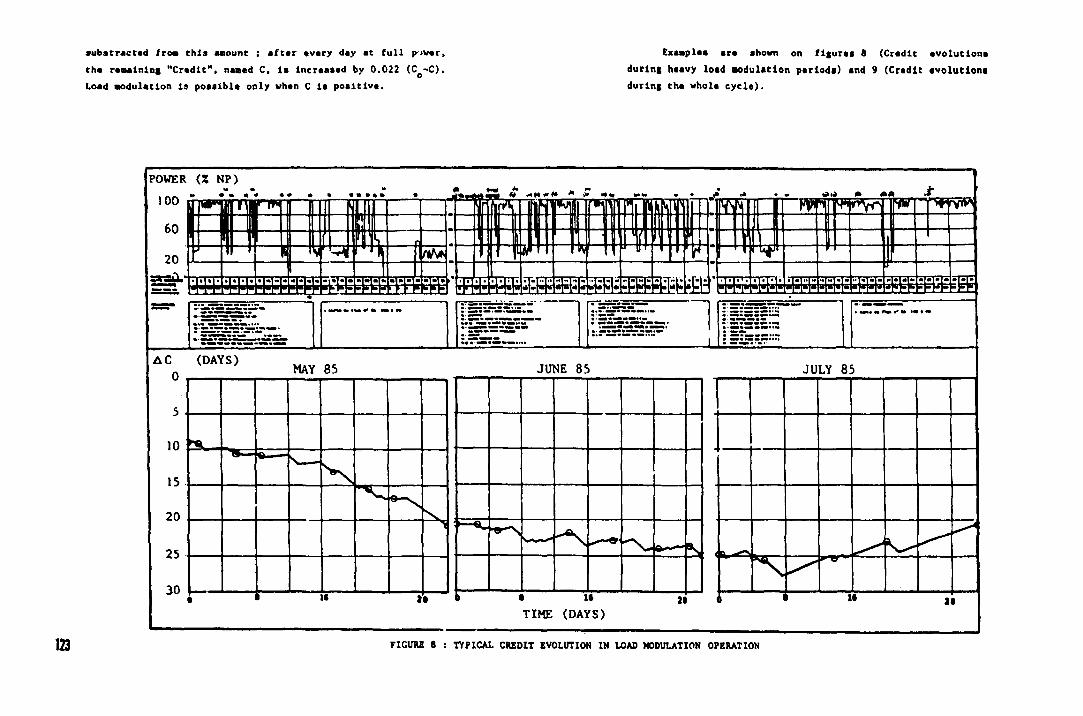
aubatractad fro» this aaiount ; aftar avary day at full povar, tha raaalnlng "Cradlt". naaad C, la Increaaad by 0.022 (C Q-C). Load Modulation 1» poaalbla only vhan C Is positive.
Exaaplaa ara ahown on flguraa 8 (Cradlt avolutlona during haavy load aodulatlon parloda) and 9 (Cradle avolutlona during tha whola eycla).
POWER (Z NP) 100
AC (DAYS) n MAY 85
5 .
in ^
is
?n
25
30 i 1 M 2 •
JUNE 85 JULY 85
I ( 1 II 21 II 21 TIME (DAYS)
123 FIGURE 8 : TYPICAL CREDIT EVOLUTION IN LOAD MODULATION OPERATION
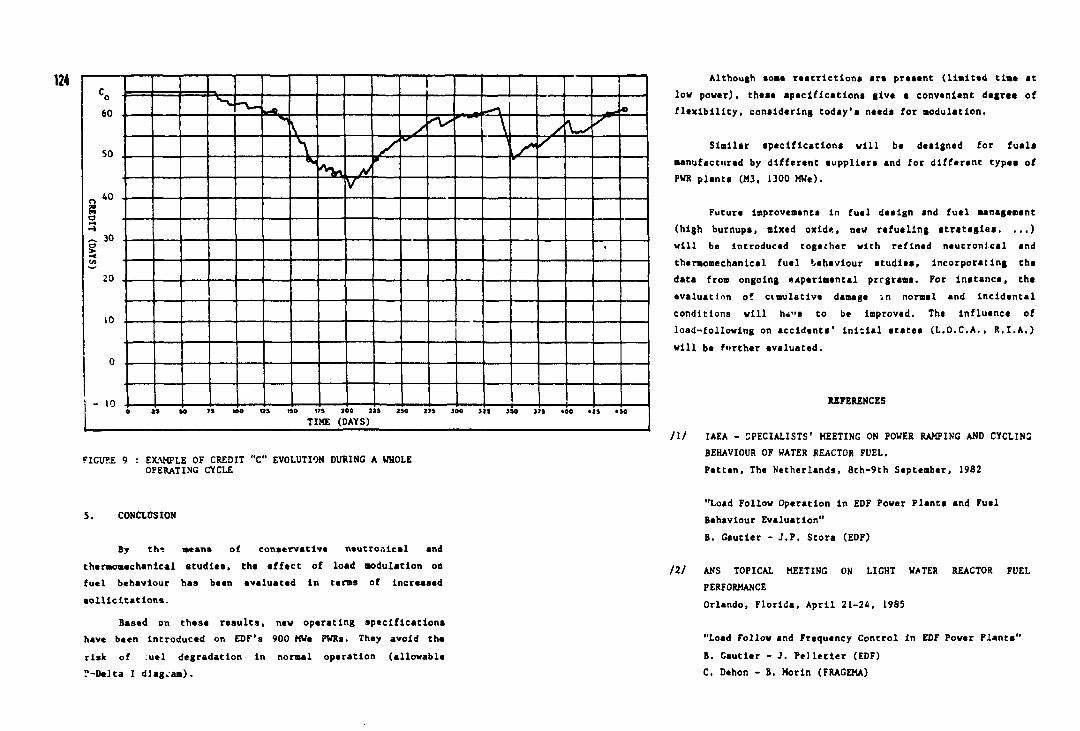
C o 60 .
50
o 4 0 " S o - . 30 . a > •<
20
10 J
0
- 10
1 — i C o 60 .
50
o 4 0 " S o - . 30 . a > •<
20
10 J
0
- 10
*"*.. C o 60 .
50
o 4 0 " S o - . 30 . a > •<
20
10 J
0
- 10
V \ S ^ " \ 1 . _ - _ ~ '
C o 60 .
50
o 4 0 " S o - . 30 . a > •<
20
10 J
0
- 10
\ V k*'
C o 60 .
50
o 4 0 " S o - . 30 . a > •<
20
10 J
0
- 10
\ . £_\--- T —
C o 60 .
50
o 4 0 " S o - . 30 . a > •<
20
10 J
0
- 10
C o 60 .
50
o 4 0 " S o - . 30 . a > •<
20
10 J
0
- 10
C o 60 .
50
o 4 0 " S o - . 30 . a > •<
20
10 J
0
- 10
C o 60 .
50
o 4 0 " S o - . 30 . a > •<
20
10 J
0
- 10
•
C o 60 .
50
o 4 0 " S o - . 30 . a > •<
20
10 J
0
- 10
C o 60 .
50
o 4 0 " S o - . 30 . a > •<
20
10 J
0
- 10
C o 60 .
50
o 4 0 " S o - . 30 . a > •<
20
10 J
0
- 10
C o 60 .
50
o 4 0 " S o - . 30 . a > •<
20
10 J
0
- 10
C o 60 .
50
o 4 0 " S o - . 30 . a > •<
20
10 J
0
- 10
C o 60 .
50
o 4 0 " S o - . 30 . a > •<
20
10 J
0
- 10
C o 60 .
50
o 4 0 " S o - . 30 . a > •<
20
10 J
0
- 10 i — I I I I 1 I I I I I 1 I I I I I I I I
o »» » n we as no ITS IOO j u iso i?» JOO JJJ JJO >?j 400 o s 0 0 TIME (DAYS)
FIGU" 9 : EXAMPLE OF CREDIT "C" EVOLUTION DURING A WHOLE OPERATING CYCLE
5. CONCLUSION
By t M means of conservative neutrcaical and thermomechanlcal studies, the affect of load modulation on fuel behaviour has been evaluated In terms of Increased solicitations.
Based on these results, new operating specifications have been Introduced on EDF's 900 MWe PWRs. They avoid the risk of uel degradation In normal operation (allowable ?-Delta I diagram).
Although some restrictions are present (limited time at low power), these specifications give a convenient degree of flexibility, considering today's needs for modulation.
Similar specifications will be designed for fuels manufactured by different suppliers and for different types of PWR plants (M3, 1300 MWe).
Future Improvements In fuel design and fuel management (high burnups, mixed oxide, new refueling strategies. ...) will be Introduced togecher with refined neutronlcal and thermomechanlcal fuel behaviour studies, incorporating the data from ongoing experimental prrgrams. For Instance, the •valuation of cumulative damage in normal and Incidental conditions will h«"e to be Improved. The Influence of load-following on accidents' initial states (L.O.C.A., R.I.A.) will be further evaluated.
REFERENCES
111 IAEA - SPECIALISTS' MEETING ON POWER RAMPING AND CYCLINS BEHAVIOUR OF WATER REACTOR FUEL. Petten, The Netherlands, 8th-9th September, 1982
"Load Follow Operation In EDF Power Plants and Fuel Behaviour Evaluation" B. Gautier - J.P. Stora (EDF)
III ANS TOPICAL MEETING ON LIGHT WATER REACTOR FUEL PERFORMANCE Orlando, Florida, April 21-24, 1985
"Load Follow and Frequency Control In EDF Power Plants" B. Gautier - J. Pelletler (EDF) C. Dehon - B. Morin (FRAGEMA)
IA£A-TC-«24/34
LOAD FOLLOW IMPACT ON FUEL BEHAVIOUR EXPERIMENTAL RESULTS
M. MOREL, P. MELIN Fragema (Framatome Division Combustible), Lyon M. GAUTIER Service Etudes et projets thermiques
et nucleaires, Electricity de France. Villeurbanne B HOUDAILLE Commissariat a I'energie atomique, Centre d'erudes nucleaires de Saclay, Gif-suv-fvette
France
Abstract
The size ->f the French nuclear plant installed capacity has
led EDF to optimize plant unit operating conditions. In particular,
an increasing number of power plants now operate on grid follow
(load variation); these more severe fuel utilization conditions
justify the scale of the experimental programme set up jointly
by CEA, EDF and FRAGEhA.
The aims of this programme are to:
. determine the maximum loads the fuel can sustain without
damage;
. gain wider knowledge of the loadings and other phenomena
inflicted on the fuel when it is subjected to grid follow;
. demonstrate that overall fuel behaviour is unchanged by
grid follow.
The programme provides identification of the phenomena
potentially limiting fuel performance.
t. 1HW0OUCT10N
The si2* of French nuclear plant installed capacity hat led EDF to optimize plant unit operating condition!. In particular, almost ill French power plants now operate on grid follow (load variation) (1). These more severe fuel utilization conditions justify the scale of the experimental program set up jointly by the CEA. EDF and FRAGEMA.
The aims of this program are to :
. determine the maximum loads the fuel can sustain without damage,
. gain wider knoweldge of the loadings and other phenomena inflicted on the fuel when it is subjected to grid follow,
. demonstrate that overall fuel behavior is unchanged by grid follow.
The program provides identification of the phenomnna potentially limiting fuel performance.
2. MAIN PHENOMENA
Due to tr.e large number of resulting power variation:, grid follow subjects the fuel to severe operating conditions. As a result two phenomena must be closely analyzed at the outset :
. pellet/cladding interaction,
. clad fatigue.
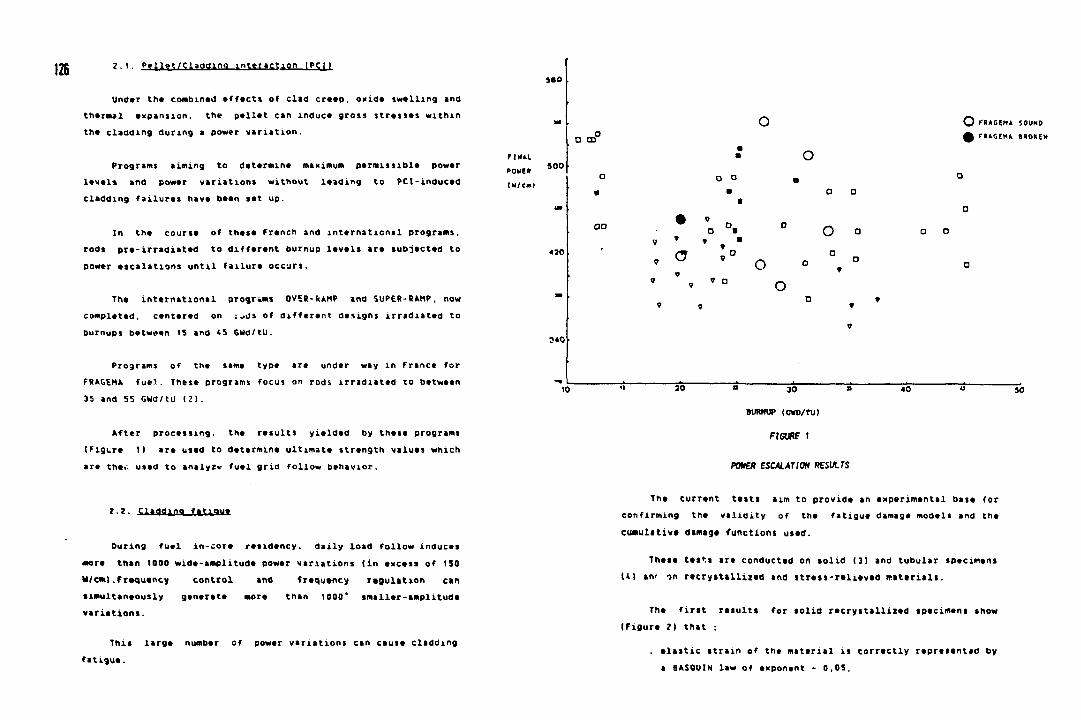
2.1. Pellet/Cladding interaction IPCI1 580
Under tha combined affacts of clad craap. oxide swelling and tharmal expansion, the pallet can induce gross stresses within tha cladding during a power variation.
FIM1L Programs aiming to determine maximum permissible power
POWER levels and power variations without leading to PC I-induced (u/cm cladding failures have been set up.
In the course of these French and international programs, rods pre-irradiated to different eurnup levels are subjected to power escalations until failure occurs.
The international programs OVER-ftAHP and SUPER-RAMP, now completed, centered on ;jjs of different designs irradiated to burnups between IS and 45 GUd/tU.
Programs of the same type are under way in France for FRAGEHA fue5.. These programs focus on rods irradiated to between 35 and SS GWa/tU (2).
After processing, the results yielded by these programs (Figure 1) are used to determine ultimate strength values which are the,, used to analyze fuel grid follow behavior.
1.2. Cladding fatigue
During fuel in-core residency, daily load follow induces •rare than 1000 wide-amplitude power variations (in excess of ISO w/cm).Frequency control and frequency legulation can simultaneously generate more than 1000* smaller-amplitude variations.
This large number of power variations can cause cladding fatigue.
O m O FS»GCMA SOUND A FI1GCH1 MOKEH
o o O D
• • V
7 o
O o a
o o
7
) • 30 »
BimifOP (CVD/TU)
FIGURE 1
POHEH ESCALAT10H RESULTS
SO
The current tests aim to provide an experimental base for confirming the validity of the fatigue damage models and the cumulative damage functions used.
These tests are conducted on solid (3) and tubular specimens U> an' on recrystallized and stress-relieved materials.
The first results for solid recrystallized specimens show (Figure 2) that :
. elastic strain of the material is correctly representad by a BAS0UIN law of exponent - 0.05.
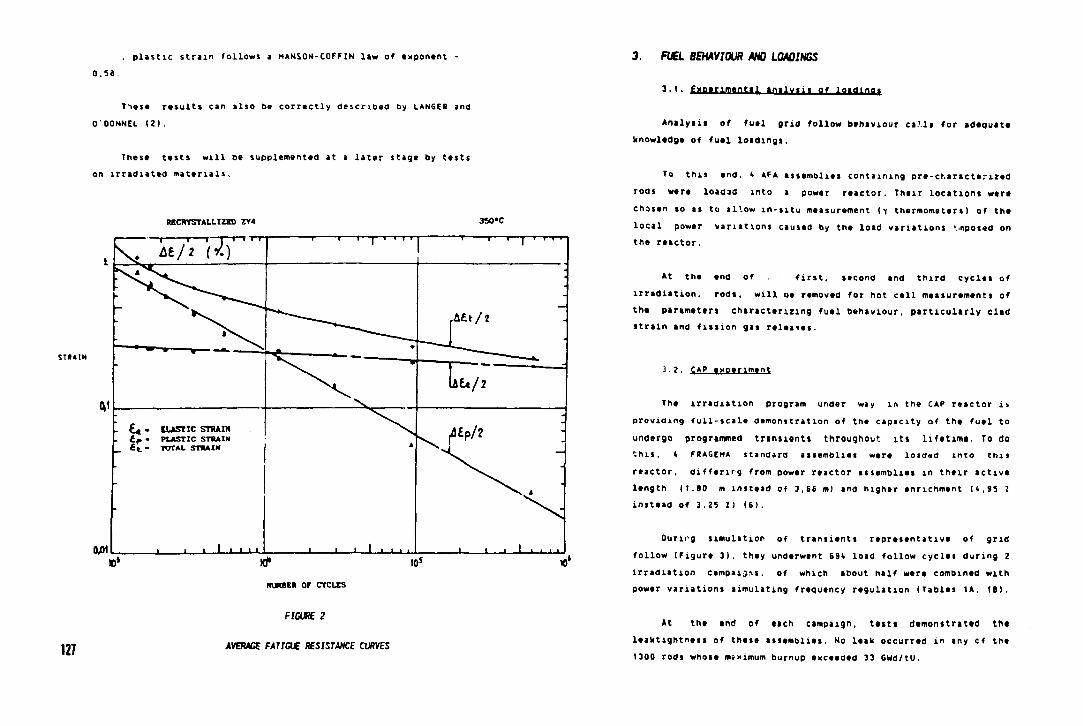
plastic strain follows a HANSON-COFFIN law of exponent 0.S8.
Tnese results can also be correctly described by LANGER and O'OONNEL (2).
These tests will be supplemented at a later stage by tests on irradiated materials.
RECRYSTALLIZED ZY4 3S0«C
STRAIN
V
6ft\
1 1 — r i i i T T " ' ' ' I ' T T T T - " T 1 1 1— i i i i
^ > \ .
: * \ ^ " A£t/2 A ^ ^
—*— t •
" •
Le*/2 \
1 £ « • ELASTIC STRAIN £ r • PLASTIC STRAIN
_ £ t • TOTAL STIAIM a \ I"P/?
" ^"V a
-
I I 1 1 1 1 l_i 1 I I I . > i i. 1 I I I . i i i
NUMBER OF CYCLES
I0J
127
FIGURE?
AVERACf FATIGUE RESISTANCE CURVES
3. FUEL BEHAVIOUR AND LOADINGS
3.1. Experimental analysis of loadings
Analysis of fuel grid follow behaviour ci'li for adequate knowledge of fuel loadings.
To this end. i AFA assemblies containing pre-cr.araetenzed rods were loaded into a power reactor. Their locations were chosen so as to allow in-situ measurement If thermometers I of the local power variations caused by the load variations '..nposed on the reactor.
At the end of first, second and third cycles of irradiation, rods, will oe removed for hot cell measurements of the parameters characterizing fuel behaviour, particularly clad strain and fission gas releases.
3.2. CAP experiment
The irradiation program under way in the CAP reactor n providing full-scale demonstration of the capacity of the fuel to undergo programmed transients throughout its lifetime. To do '.his. « FRAGEHA standard assemblies were loaded into this reactor, diffenrg from power reactor assemblies in their active length It.80 m instead of 3,66 m) and higher enrichment U,95 I
instead of 3.25 Z) (6).
Ourii'g simulation of transients representative of grid follow (Figure 3), they underwent 694 load follow cycles during 2
irradiation campaijris. of which about half were combined with power variations simulating frequency regulation (Tables 1A, 18).
At the end of each campaign, tests demonstrated the leaktightness of these assemblies. No leak occurred in any of the 1300 rods whose maximum burnup exceeded 33 GWd/tU.
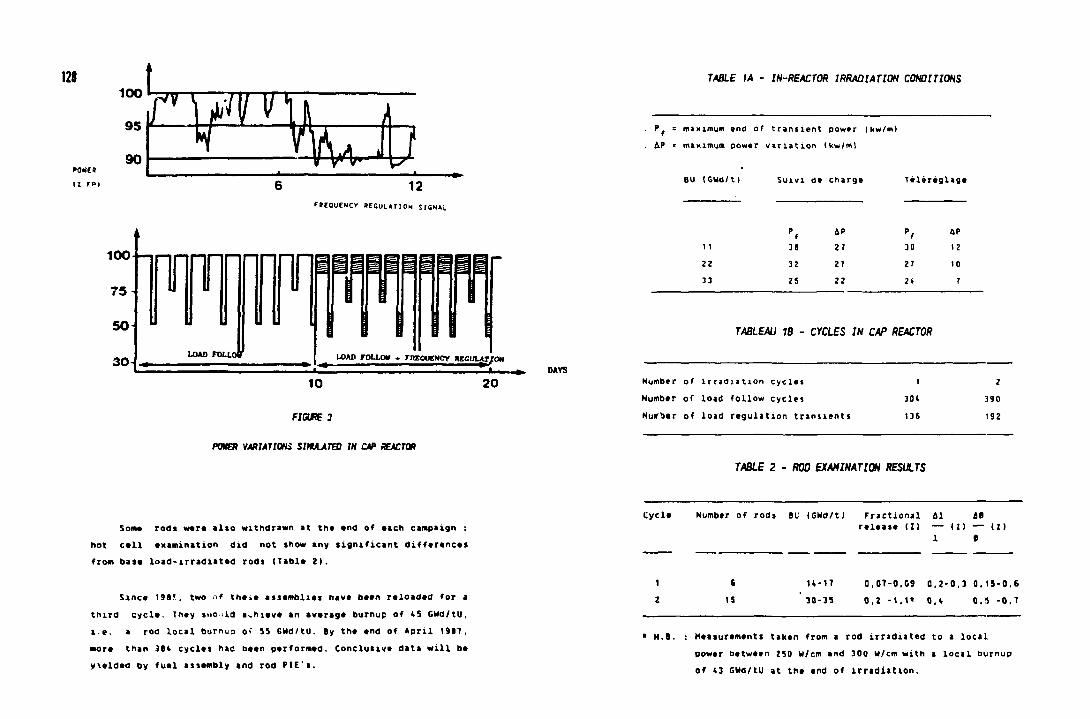
100
95
90
c POWEB
HE 12
FBEDUENCY BEGUIAMON SIGNAL
100
7 5 -
50
30-
nnnn LOAD FOLLOT LOAD FOLLOW * FnTOUENCY WECULATfOM
DAYS
10
FIGURE 3
POKER VARIATIONS SIMULATW IN CAP rJEACTOR
20
fABLE M - IN-REACTOR IRRADIATION CONDITIONS
P = maximum end of transient power (kw/m) &.P = maximum power variation (kw/ml
BU (GUd/t) Suivi de charge Telereglage
Pf &P "< HP
11 39 27 30 12 22 32 27 27 to 33 25 22 2* 7
TABLEAU IB - CYCLES IN CAP REACTOR
Number of irradiation cycles Number of load follow cycles Hunger of load regulation transients
30* 136
2 :i90 192
TABLE 2 - ROD EXAMINATION RESULTS
Some rods were also withdrawn at the end of each campaign ; hot cell examination did not show any significant differences from base load-irradiated rods (Table 2 ) .
Since 1985. two of the.e assemblies have been reloaded for a third cycle. They s.io Id achieve an average burnup of IS GUd/tU, i.e. a rod local burnuo o- 55 GUd/tU. By the end of April 1987, •ore than 384 cycles had been performed. Conclusive data will be y\elded by fuel assembly and rod PIE's.
Cycle Number of rods BU IGWd/t) Fractional ol it release (Z) — (Zl — (Z)
i e
6 IS
n - 1 7 30-35
0,07-0.09 0.2-0,3 0.15-0.6 0.2 -1.1« 0.4 0.5 -0,7
• N.B. : Measurements taken from a rod irradiated to a local power between 250 W/cm and 300 U/cm with a local burnup of 43 GWd/tU at the end of irradiation.
3.3. Fuel behaviour
. F n u o n gas release The CAP rod measurements (Table 2) did not show any impact of power variations on overall fusion gas release inside the rods.
Transient behavior Two rods burnt during tt\e first CAP irradiation cycle (burnup ZO GWd/tU) were subjected to power transients. Comparison of the results (failure at 150 W/cm. non-failure at l?0 w/cm) with those for basj load showed tnat grid follow had no impact.
The same type of test is now under way for rods from the second irradiation cycle (burnup J5 GWd/tU) -, initial results confirm the afove conclusions.
. LOCA behavior Claddings from the first CAP cycle were suboected to tests simulating LOCA-induced loadings. The test device EDGAR installed in a hot cell was used to test these claddings under pressure and temperature conditions representative of those calculated for a LOCA.
These tests did not indicate any grid follow impact. Similar tests will be conducted on cladding tubes from the second irradiatio-i cycle.
4. UNDERSTANDING OF PHENOMENA
This experimental program also aims to enhance understanding of phenovent through :
. T*»ts performed in test loops. Parameters such as fission gas release and clad strain are monitored during power variations.
. Tests performed without irradiation on irradiated or non-irradiated materials. The aim is to evaluate the impact of fuel rod corrosion products on transient or fatigue limits.
4.1. Ftiiivn m n l « m
A program currently in progress is yielding data on fission gas release kinetics at elevated burnups (T) under steady state and transient conditions. 2 rods pre-irradiated for 3 and 4 cycles in a power reactor are reirradiated in the SHOE reactor at GRENOBLE, where fission gas releases are continuously measured at a range of power levels.
4.2. Clad strain
Tests are now being run as part of the international program ELF. Rods pre-irradiated in the BR3 reactor are instrumented by a cladding diameter measurement system. They are reirradiated in the OSIRIS reactor at SACLAY and measured for clad creepdown during power variations.
Another program is now under way at the ISABELLE 4 l.-op of the OSIRIS reactor. Inside this test device, 4 pre-irradiated rods are undergoing a series of ISO wide-amplitude transients I in excess of ISO W/cm). Every SO transients, clad soundness is examined by eddy current and clad creepdown is checked by profilometry. To date, these rods have sustained more thin 90 transients without damage.
5. STATUS AND RESEARCH
S.I. Stltui
These programs hive provided designers with :
. a data base confirming the models used to predict fuel rod grid follow behaviour up to high burnups,
. greater insxgnt into tha phenomena limiting fuel performance,
. results pointing towards the best ways to increase performance.
5.2. Research
The need to increase clad capability to sustain mora severe operating conditions (larger and more frequent power variations) has led FRAGEHA identify the fabrication parameters which push back cracking damage limits induced by corrosive elements tiiodine. caesium...). Cladding research tikes the following forms :
. analysis of the role of internal surface finish in crack initiation.
. search for a more favorable precipitation state.
. reduction of crack-initiating precipitates by the use of ne» alloys.
. confirmation of the role of texture in the crack propagation process.
6. CONCLUSION
The results of the joint EDF/FRAGEMA/CEA programs fully demonstrate tha capacity of FRAGEHA fuel to operate in the grid follow mode up to elevated burnups. These programs indicate reseatm approach*^ for further improving product performance in an increasingly severe environment (larger and mora frequent power variations).
Some of these approaches involve straightforward fabrication adjustments, while others call for wide-ranging modifications to cladding materials and the extension of R and D programs.
To this end. FRAGEHA and FRAMATOME, in conjunction with their partners CEA, FBFC and ZIRCOTUBE. have also set up a project with a combined design, manufacturing and testing capability for research into innovations. The future operational constraints on the new product are set By the French utility EDF and used as a basis for defining the directions in which development will be made.
REFERENCES
til Load Follow and Frequency Control Operating Experience of FRAGEHA Fuel in EDF Reactors A. DUMONT - P. BOURNAY - IAEA LYON - Hai 87
(2) Power Ramping Test P.-ogramme on FRAGEGHA Fuel Rods, during the years 1982 to 1966 J. JOSEPH - J. ROYEB - F. LEFEBVRE - IAEA LYON - Hai B7
(3) Cumulative fatigue and creep-fatigue damage at 350'C on recrystallized zircaloy-t G. BRUN at Al. ASTM Strasbourg - 27 Juin '*!•>
U> Substained Fatigue of Zircaloy-4 Claddings non Irradiated Material J.P. MAROON - P. LEMOINE - L. OARCHIS - J. PELCHAT - M. GROSGEORGE IAEA LYON - Hai 87
IS) Fatigue design bins for zircaloy componants U.J. O'DONNEL et Al. Nuclear Science and Engineering. 20. 1-12 (1964!
IS) Irradiation in tha CAP reactor of FRAGEHA Fuel Assemblies under Power Transients Representative of Superimposed Load Follow and Remote Control Regimes A. PUIL et Al. IAEA Petten - September 1912
(?) Fission Gas Release during Power Transient at High Burnup D. BARON - C. LEMAIGNAN - E. PORROT - A. RAYBAUD IAEA LYON - Mai 87
131
IAEA-TC-624/35
AN UPDATE ON THE BURNUP DEPENDENCE OF PELLET CLADDING INTERACTION
M.G. ANDREWS, J.C. LAVAKE Combustion Engineering, Inc., Windsor, Connecticut, United States of America
Abstract
Severe1 pipers presented at the 1982 and 1983 meetings of the Fuel's Working Group reported the results of test reactor program on pellet cladding interaction (PCI), In addition, a few models treating these results for application to power reactors were offered. The completion of two of these test reactor programs will be discussed and the data compared with previous results at lower burnup levels. The semi-empirical model correlating PCI test results previously presented by C-E will be used as a basis for examining the results and to identify a few remaining questions related to burnup dependence.
A series of relatively standard PWR rodlets Irradiated 1n the Obrlghelm Reactor to burnups of 30 to 46 GWd/MTU were tested 1n the HFR Petten Reactor 1n tha Netherlands as part of a program sponsored by the U.S. Department of Energy. The results showed three failures it 405, 430, and 470 U/cm wltli 8 rodlets surviving to powers In the range of 315 to 430 W/cm. These results also tended to confirm the relationship of failure potential with power change, that Is, the Increase 1n power level 'bove the conditioning level or the highest power 1n the base Irradiation. An additional pair of fuel rodlets from this series did not fall after being subjected to a second ramp 1n power after 6 GVd/MTU additional burnup.
Reap testing conducted at Studsvlk's R-2 Reactor on rodlets of the same design resulted In no failures In ten tests with bumups In the range of 33 to 45 BWd/MTU. Although the combination of the Studsvlk and Petten tests Is encouraging to »ny utility operating fuel rods of this type m PWRs, they t r t few 1n number and leave open the following two questions, among others. Is there anything unique to the design of these rodlets that provides the resistance to PCI, or 1$ It the additional burnup that was responsible for
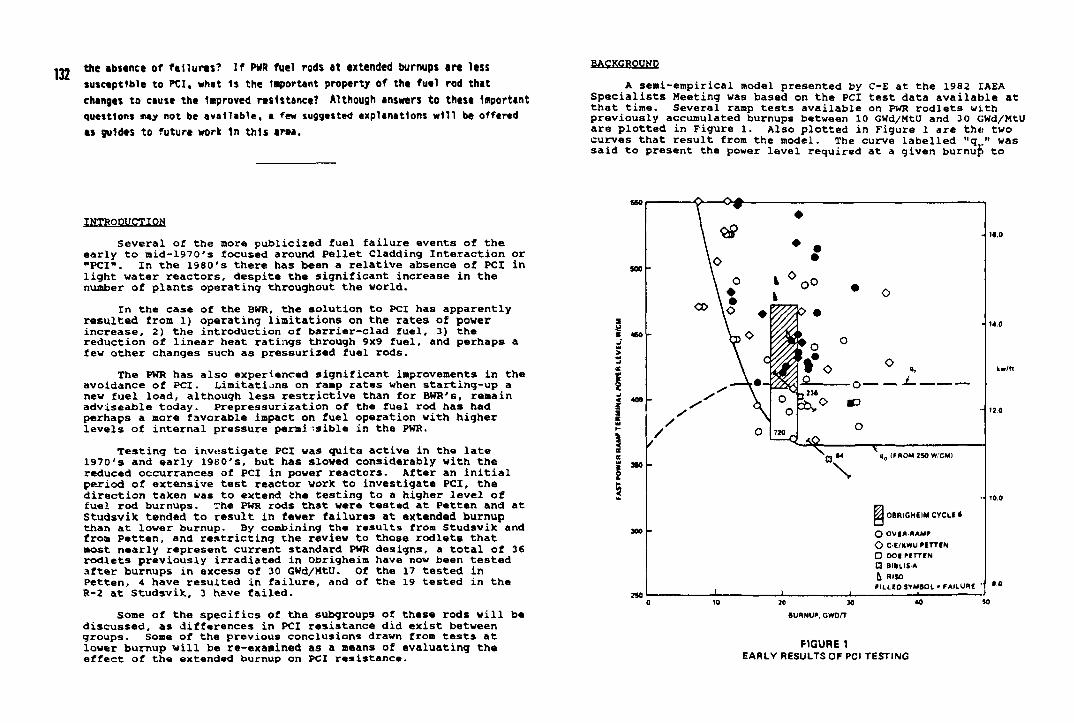
the absence of failures? If PWR fuel rods at extended burnups are less susceptible to PCI. what 1s the Important property of the fuel rod that changes to cause the Improved resistance? Although answers to these Important questions may not be available, a few suggested explanations will be offered as guides to future work 1n this area.
INTRODUCTION Several of the more publicized fuel failure events of the
early to mid-1970's focused around Pellet Cladding Interaction or "PCI". In the 1980's there has been a relative absence of PCI in light water reactors, despite the significant increase in the number of plants operating throughout the world.
In the case of the BWR, the solution to PCI has apparently resulted from 1) operating limitations on the rates of power increase, 2) the introduction of barrier-clad fuel, 3) the reduction of linear heat ratings through 9x9 fuel, and perhaps a few other changes such as pressurized fuel rods.
The PWR has also experienced significant improvements in the avoidance of PCI. Limitations on ramp rates when starting-up a new fuel load, although less restrictive than for BWH's, remain adviseable today. Prepressurization of the fuel rod has had perhaps a more favorable impact on fuel operation with higher levels of internal pressure permissible in the PWR.
Testing to investigate PCI was quite active in the late 1970's and early 1980's, but has slowed considerably with the reduced occurrances of PCI in power reactors. After an initial period of extensive test reactor work to investigate PCI, the direction taken was to extend the testing to a higher level of fuel rod burnups. The PWR rods that were tested at Petten and at Studsvik tended to result in fewer failures at extended burnup than at lower burnup. By combining the results from Studsvik and from petten, and restricting the review to those rodlets that most nearly represent current standard PWR designs, a total of 36 rodlets previously irradiated in Obrigheim have now been tested after burnups in excess of 30 GWd/MtU. Of the 17 tested in Petten, 4 have resulted in failure, and of the 19 tested in the R-2 at Studsvik, 3 have failed.
some of the specifics of the subgroups of these rods will be discussed, as differences in PCI resistance did exist between groups. Some of the previous conclusions drawn from tests at lower burnup will be re-examined as a means ot evaluating the effect of the extended burnup on PCI resistance.
BACKGROUND A semi-empirical model presented by C-E at the 1982 IAEA
Specialists Meeting was based on the PCI test data available at that time. Several ramp tests available on PWR rodlets with previously accumulated burnups between 10 GWd/MtU and 30 GWd/MtU are plotted in Figure 1. Also plotted in Figure 1 are the two curves that result from the model. The curve labelled "q ." was said to present the power level required at a given burnup" to
- 140
20 30
euRNur anon
FIGURE 1 EARLY RESULTS OF PCI TESTING
bring the fuel to a temperature where significant releases of volatile fission products occur during the ramp. The curved labelled "q " was said to represent the minimum power level required to stress the cladding of a fuel rod that had operated at a power level of 250 w/cm, or below, during base irradiation or during a preconditionina ./cle of a test. The premise was that a rodlet would survive che rasp if the ramp terminated at a level below either one of the two curves.
If a minimum power level and a minimum change in power are both required to cause PCI, the questions become how much and how do those values change with turnup? The data in Figure 1 suggest that 410 w/cm was sufficient to fail several rodlets in the burnup interval tested. The early data were also used to derive a minimum value for the change in power of lis w/cm. TESTS IN HFR PETTEN
A series of 10 rodlets tested at Petten have a common design and span a range of burnups. The results of ramp testing these rodlets are tabulated in Table 1 and can be used to derive values for the minimum power and change in power required.
Table 1
Ramp Test Results from PWR Rodlets Tested in Petten
Ramp Precond. Terminal Change
Rodlet Burnup Max. Power Power Power in Power Ident. {GWd/MtU) Base Irrad. (w/cra) (w/cra,) (w/cml Result
V30/1 32.0 230 250 470 220 F V30/2 31.9 230 245 430 185 NF V30/3 31.6 230 195 430 200 F V30/4 29.7 215 190 405 190 F V30/5 31.3 230 225 395 165 NF
V40/1 46.3 260 250 385 125 NF V40 '2 46.3 260 255 430 170 NF V40/3 45.8 260 . ?95 425 165 NF V40/4 42.4 230 200 420 190 NF V40/5 44.6 240 195 425 185 NF
Four values of power are listed in Table 1 for each of the ten rodlets tested in this series: The maximum power achieved during the base irradiation in Obrigheim; the power level used in the preconditioning cycle of the ramp test; the ramp terminal level; and the change in power level. The change in power level is calculated by subtracting the higher of the preconditioning or base irradiation powers from the ramp terminal level.
The first five rodlets listed have burnups of approximately 30 GWd/MtU and three of the five tested failed. The three that failed all experienced changes in power level of 190 /cm or greater, and the survivors experienced considerably less change in power level. Particular significance can be derived from a comparison of V30/4 to V30/2. Rodlet V30/2 achieved a ramp terminal level of 430 /cm and survived. In contrast, Rodlet V30/4 achieved only 4 05 /cm and failed. Because of the lower power during base irradiation, the change in V30/4 was 190 /cm, vs. a change of only 185 /cm in the survivor. This also indicates that at a power level of 405 /cm is high enough to cause failure, if the change in power level is higrt enough (>190 /cm).
Rodlets of the same design, but with approximately 50% more burnup, were tested in Petten as part of the same program. Unfortunately, the depletion of these rods made it impossible to achieve powers higher than 430 /cm in Petten. All five of the rodlets survived the ramp without failure as shown in Table 1. Since the values of power change do not exceed the 190 /cm value shown for failure at the lower burnup, an improvement due to higher burnup can not be shown by these results alone. That the increased burnup did not render the rodlets more susceptible to PCI is, however, significant.
TESTS AT STUDSVIK
Another set of PWR rodlets with a design similar to those tested in Petten were tested in the R-2 Reactor in Studnvik, Sweden. The results of these tests are r.hown in Table 2. Five
Table 2 Ramp Test Results from PWR Rodluts Tested in Studsvik
Ramp Precond. Terminal Change
Rodlet Burnup Max. Power Power Power in Power Ident. (GWd/MtU) Base Irrad. (w/cra) (w/cm (w/cn) Resul
PK 1/1 PK 1/2 PK 1/3 PK 1/4 PK 1/5 PK 2/1 PK 2/2 PK 2/3 PK 2/4 PK 2/5
35.4 35.6 35.2 33.1 34.4 45.2 45.1 44.6 41.4 43.4
261 270 268 243 248 255 262 259 234 246
250 250 250 250 250 250 250 250 250 250
415 440 475 475 420
410 460 490 440 440
154 170 207 22!> 170
155 190 231 190 190
NF NF NF NF NF NF NF NF NF NF

)34 °f the rodlets started with an initial gap of 197 microns and achieved approximately 35 GWd/MtU in Obrigheim prior to ramping, and the other five had initial gaps of 145 microns and were irradiated to approximately 45 GWd/MtU before ramping.
Despite six of the ramp tests exceeding the minimum values . of power change and ramp terminal level (190 w/cm and 405 w/ci, respectively) all survived without PCI failure. Post-irradiation examinations were conducted on representative rodlets from this group and all of the features expected for these power levels were found. Dish-filling was complete, fission product redistribution was extensive, i/idges were significant, and fission gas release values were comparable to reported values for these power levels.
Rodlet PK2/3 was tested after 44.6 GWd/MtU and and achieved 490 w/cm; the highest power level of any of the tests in this series. Fission gas release was measured to be 44.9%, the diameter of the rodlet increased by 101 microns between ridges, and the maximum ridge height increased by 55 microns due to the ramp. Additional discussion on the fission gas release values is found below and details of the other post irradiation measurements are in Reference 2. HO , PET.T.KTS WITH TARGE GRAIN SI2E
The grain sizes associated with the ramp tests discussed above generally Averaged 6 microns in diameter. The potential for improved fission gas release from larger grain sizes was the basis for a series of rodlets in Table 3 where the UO. was made with a grain size of 22 microns. The base irradiation in Obrigheim and ramp testing at Studsvix and at Petten were conducted in a manner similar to those previously listed in Tables 1 and 2. Although the anticipated improvement in the retention of fission gas was achieved, the PCI resistance of these rodlets at 30 GWd/MtU was very similar to the values
Table 3 Tests with Large Grain Size
Precond. Ramp Change Rodlet Test Burnup Max.Power Power
T/crn) Terminal in Power ( /cm) Ident. Reactor (GWd/MtU) Base Irr.
Power T/crn) Power
in Power ( /cm) Result
PK */l R-2 36.7 274 250 4S0 176 F PK 6/i' R-2 36.8 274 255 400 126 NP PK 6/3 R-2 36.5 270 250 430 160 NF PK 6/<. R-2 33.6 245 2SS 440 185 F PK 6/i R-2 35.2 254 240 410 156 KF X 30/1 Petten 35.9 260 245 470 210 F X 30/2 Petten 35.4 260 245 410 150 F X 30/3 Petten 32.3 240 240 375 135 NF
previously obtained at lower burnups as shown in Figure 1. A change in power level of 150-160 /cm and a ramp terminal level of 410 /cm was sufficient to cause failure by PCI.
The pellets for these rods were sintered to a high matrix density using poreformer to produce a relatively stable and non-deformable pellet. In combination with the small initial gap size (140-146 micron) these pellets caused more cladding deformation during the base irradiation and during the ramps. ADDITIONAL TESTS OH SIMILAR PWR RODLETS
A total of eight additional ramp tests were included in the Petten and StudsviK programs where the burnup levels exceeded 30 GWd/MtU. The results of these tests are included in Table 4. The only additional feature of these tests is the testing of rodlets in StudsviK using a coolant temperature depressed by 50 C. Rodlet PKIX/S failed with a power change of 210 /cm and a remp terminal level of 460 /cm. These parameter* also caused failures in similar rods without the depressed coolant temperature, and the two rodlets that survived would also be expected to survive without the change in coolant temperature. If, therefore, a change of this magnitude in the coolant temperature affects PCI resistance, it is not evident from this series of tests.
Table 4 Other Tests on pwn Rodlets in R-2 and in j>etten
Rodlet Ident.
Test Reactor
Burnup (GWd/MtU)
Max.Power Baae Irr.
Precond. Power (w/ca)
Ramp Terminal Power
Change in Power (w/cm) 210 157 156 160
Result PK IX/S PK IX/l PK IX/2 PK IX/3
R-2 R-2 R-2 R-2
30.5 33.0 34.8 35.6
218 253 264 275
250 250 225 250
460 410 420 435
Change in Power (w/cm) 210 157 156 160
F* NF* NF NF*
1/23 1/24
Petten Petten
35.2 35.8
210 220
280 290
480 430
200 140
NF NF
A3 0/3 A3 0/4
Petten Petten
31.0 32.6
230 255
190 190
410 410
1»0 155
NF NF
*These rodlets were tested with the coolant inlet temperatura reduced by 50 C relative to other ramp tests in the Studsvik series.
REPEATED RAMPS ON TWO RODLETS The possible consequences of a second ramp were investigated
in Petten using one rodlet made from poreformer fuel (X30/3) and one from nonporeformer fuel (A30/3). After surviving the first ramp listed in Table 3 for the X30 and in Table 4 for M0, these

rods ware further irradiated at 235 W/CB for an additional burnup of 6 GWd/MtU. Rodlet A30/3 had bear, ramped to 410 w/c» on the first test and 385 w/cm on the raranp. Rodlet X30/3 was ramped to 375 v/ca the first tiae and 385 w/cm wii the se-cnd. Neither of these rodlets failed and no evidence of failure was observed upon destructive examination after testing. F I S S I O N GAS REIJSASt;
The rodlets that were tested for PCI ani survived were all measured for fission gas release. The fission gas released during the base irradiation in Obrigheia has been found in other programs to be low f , and therefore the release values found after the ramp test can be assumed to have released during the ramp test. Several of the ramp tests were run with altered test
Table 5
Rodlet Identification
Burnup (GWd/MtU)
initial Gap (microns)
Ramp Terminal Level (w/cm)
tFission Gas Release
Xfts£ed_ at Studsv ik PKl/1 PKl/2 PK1/3 PKl/4 PKIX/2
35.4 35.6 35.2 33.1 34.8
197 197 197 197 191
415 440 475 475 420
8.5 13.6 21.1 13.0 6.7
PK2/1 PK2/2 PK2/3
45.2 45.1 44.6
145 145 145
410 460 490
28.0 32.1 44.9
PK6/2 PK6/3 PX6/5
36.8 36.5 35.2
146 146 146
400 430 410
3.5 4.7 6.1
Tested at Petten 1/23 1/24 A3 0/4
35.2 35.8 32.6
140 140 138
480 430 410
40.8 33.6 27.6
V30/2 V30/5
31.9 31.3
177 170
430 395
35.1 25.6
V40/1 V40/2
46.3 46.3
170 170
385 130
26.6 42.2
parameters that may have affected the amount of fission gait released, such as repeated ramps, reduced coolant temperatures oi reduced hold times at power. These results were not included in the listing shown in Table 5 so as *"o examine the effects of burnup, gap size, and other variab^ 3 without synthesizing questionable adjustments. The remaining eighteen test values are grouped according to design type a.id prior burnups. Unfortunately, a clean separation of variables is not possible in every case. A plot of the 18 values is shown in Figure 2 where the measured fission gas release after the ramp test is plotted against the ramp terminal power level. Each subgroup of data shows relatively good consistency within its own group and burnup level. The gas released increases with increasing power level and this, of course, is an expected result of the temperature reached during the ramp test. The overall plot shows a separation into two general populations. One population includes rodlet groups in the lower region of the plot and is separated froa another population of rodlet groups in the upper region of the plot. A line has been drawn through each of the sets representing a linear regression calculated from the gas rnlease vs. power in each set. The two regression lines are not exactly parallel, but there is about 20% higher release on the upper line than on the lower line for any given value of power.
T 1 1 1 1 1 r
240 260 320 *<0 400 440 « 0 620 5*0
R„MP TERMINAL LEVEL mm
FIGURE 2 FISSION >3AS RELEASE vi RAMP TERMINAL LEVEL
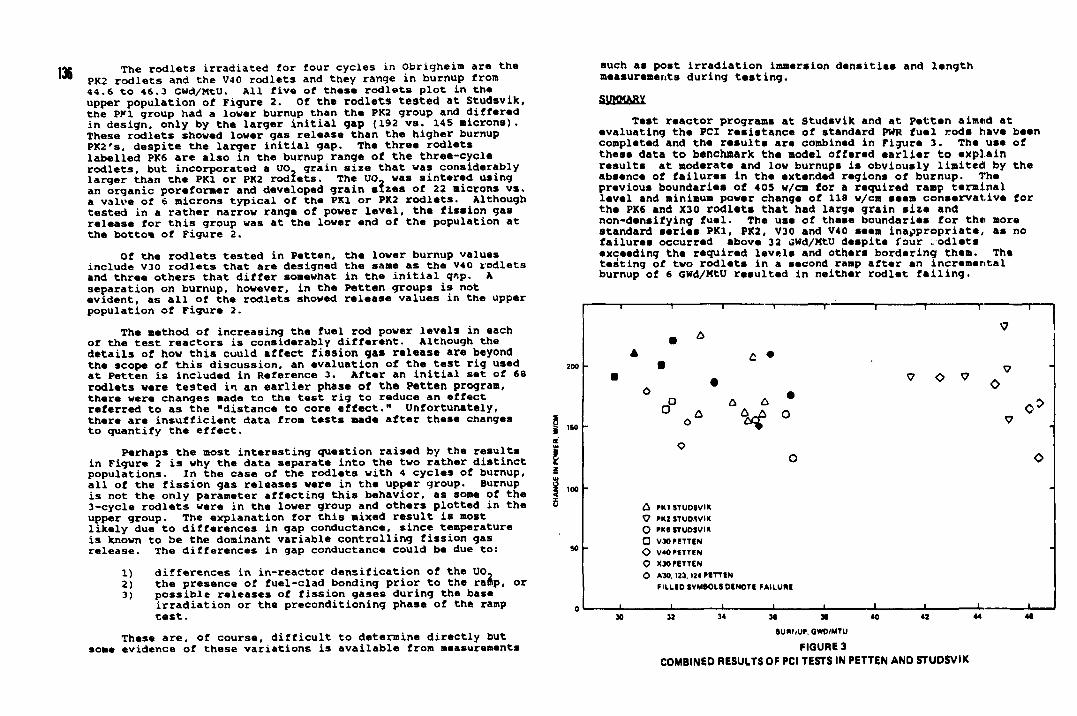
The rodlets irradiated for four cycles in Obrigheim are the PK2 rodlets and the V40 rodlets and they range in burnup from 44.6 to 46.3 Gwd/MtU. All five of these rodlets plot in the upper population of Figure 2. Of the rodlets tested at Studsvik, the PKl group had a lower burnup than the PK2 group and differed in design, only by the larger initial gap (192 vs. 145 microns). These rodlets showed lower gas release than the higher burnup PK2's, despite the larger initial gap. The three rodlets labelled PK6 are also in the burnup range of the three-cycle rodlets, but incorporated a UO_ grain size that was considerably larger than the PKl or PK2 rodlets. The UO, was sintered using an organic poreformer and developed grain sizes of 22 microns vs. a value of 6 microns typical of the PKl or PK2 rodlets. Although tested in a rather narrow range of power level, the fission gas release for this group was at the lower end of the population at the bottom of Figure 2.
Of the rodlets tested in Petten, the lower burnup values include V30 rodlets that are designed the same as the V40 rodlets and three others that differ somewhat in the initial gr,p. A separation on burnup, however, in the Petten groups is not evident, as all of the rodlets showed release values in the upper population of Figure 2.
The method of increasing the fuel rod power levels in each of the test reactors is considerably different. Although the details of how this cuuld affect fission gas release are beyond the scope of this discussion, an evaluation of the test rig used at Petten is included in Reference 3. After an initial set of 68 rodlets were tested in an earlier phase of the Petten program, there were changes made to the test rig to reduce an effect referred to as the "distance to core effect." Unfortunately, there are insufficient data from tests made after these changes to quantify the effect.
Perhaps the most interesting question raised by the results in Figure 2 is why the data separate into the two rather distinct populations. In the case of the rodlets with 4 cycles of burnup, all of the fission gas releases were in the upper group. Burnup is not the only parameter affecting this behavior, as some of the 3-cycle rodlets were in the lower group and others plotted in the upper group. The explanation for this mixed result is most likely due to differences in gap conductance, since temperature is known to be the dominant variable controlling fission gas release. The differences in gap conductance could be due to:
1) differences in in-reactor densification of the UO, 2) the presence of fuel-clad bonding prior to the raftp, or 3) possible releases of fission gases during the base
irradiation or the preconditioning phase of the ramp test.
These are, of course, difficult to determine directly but some evidence of these variations is available from measurements
such as post irradiation immersion densities and length measurements during testing.
Test reactor programs at Studsvik and at Petten aimed at evaluating the PCI resistance of standard PWR fuel rods have been completed and the results are combined in Figure 3. The use of these data to benchmark the model offered earlier to explain results at moderate and low burnups is obviously limited by the absence of failures in the extended regions of burnup. The previous boundaries of 405 w/ca for a required ramp terminal level and minimum power change of 118 w/cm seem conservative for the PK6 and X30 rodlets that had large grain size and non-densifying fuel. The use of these boundaries for the more standard series PKl, PK2, V30 and V40 seem inappropriate, as no failures occurred above 32 GWd/KtU despite four .odlets exceeding the required levels and others bordering them. The testing of two rodlets in a second ramp after an incremental burnup of 6 GWd/MtU resulted in neither rodlet failing.
r ——i 1
• *
1 - - 1 r • 1 - l r v"
—r-
A • £ •
^ . •
O •
J3 a A •
v" O ? 0
0 > -
0 A O %f ° ?
0 >
o 0 o
v" o a
PKl STUDSVIK PK2 STUDSVIK PKISTUOSVIK VMPETTEN
o 0
V40PETTEN XM PETTEN
o AM, 123. 124 PETTEN FIULED SYMBOLS DENOTE FAILURE
,. i - ,_. 1 1 1 l i - i 1 M 32 34 M M 40 42 44 4*
Bunriup, awo'MTu FIGURE 3
COMBINED RESULTS OF PCI TESTS IN PETTEN AND STUDSVIK
The issue of lower cladding temperatures was addressed by testing three of the rodlets in Studsvik with coolant temperature depressed by 50°C. The results of three tests proved to be quite similar to those tested at the standard temperature.
The fission gas release measured on the non-failed rodlets showed the expected dependence on power level and a somewhat mixed dependence on burnup. Rodlets tested at Studsvik after burnups of about 45 GWd/MtU showed significantly higher releases than similar rodlets with only 35 GWd/MtU. For rodlets tasted in Fetten, the fission gas results from 3-cycle rodlets could not be distinguished from the results from 4-cycle rodlets.
In general, the effect of initial gaps from 145 to 190 microns, seemed to play a smaller role in PCI and in fission gas release than variations in densification, creepdown, and other changes that took place during the extended base irradiations of these rodlets.
REFERENCES 1. LaVake, J.c. and Gaertner, M., High Burnup PWR Ramp Test
Program - Final Report, DOE/ET/34030-10, December, 1984. 2. Djurle, S., The Studsvik Super-Ramp project - Final Report,
STSR-32, October, 1983. 3. LaVake, J.C. and Gaertner. M.. High Burnup PVR Ramp Test
Program, Topical Report, Background Ramp Test Results, DOE/ET/34030-4, December, 1982.
IAKA-TC-434/M TRAPPED STACK RELATED PCI FUEL FAILURES
N.E. HOPPE Advanced Nuclear Fuels Corporation, Richland, Washington, United States of America
Abstract
A total of elqht ANF fuel rods failed In Barsebeck Unit 1 over the years 1980 to 1982. An extensive program, Includlnq hot cell examination, was conducted to determine the cause of these failures and to avoid a recurrence of the problem. The results of the Investigation showed that:
1. The fuel pellet characteristics were not a factor. 2. The fuel rod design was characterised by a large pellet cladding gap (10
mil), and a fill gas pressurlzatlon of one atmosphere absolute. These features played a major role In the failures through a thermal Instability process.
3. The method of operation of Barsebeck Unit 1, characterized by slow control rod withdrawals at full power, can lead to a "trapped stack" condition. The slow uncovering of the lower part of the fuel rod provided adequate time for the thermal Instability condition and associated fuel swelling effects to propagate down the rod, while stress relaxation of the cladding was prevented by the biaxial stress state created under the trapped stack condition. In addition, volatile fission products were released from the fuel at the tip of the control rod, and were deposited on the Inner cladding surface. This occurred on the nearby cold region just below the control rod tip which caused the formation of "coins" which enhanced the PCI.
4. Recommendations were Issued which avoided a recurrence of failures with this fuel design and this mode of operation.
5. The problem Is not likely to occur with current fuel designs which have higher pressurlzatlon and smaller gaps.
SUMMARY A total of eight ANF fuel rods failed in Barsebeck Unit 1 over the years
1980 to 1982. An extensive program, including hot cell examination, was conducted to determine the cause of these failures and to avoid a recurrence o.c the problem. Evaluation of the fuel characteristics, power histories, and destructive examination data suDports the conclusion that pellet cladding interaction (PCI) with stress corrosion cracking (SCC) caused the fuel rod failures.
The fuel pellet characteristics were not a factor. However, the fuel rod desiqn was characterized by a larae pellet cladding gap (10 m i l ) , and a fill gas pressurization of one atmosphere absolute. These features played a major role in the failures through a thermal instability process.
The method of operation of Barsebeck Unit 1, characterized by slow control blade withdrawals at full power, can lead to a "trapped stack" condition. The slow uncovering of the lower part of the fuel rod provided adequate time for the thermal instability condition and associated fuel swelling effects to propagate down the rod, while stress relaxation of the cladding was prevented by the biaxial stress state created u.ider the trapped stack condition. In addition, volatile fission products were released from the fuel at the tip of the control rod, and were deposited on the inner cladding surface. This occurred on the nearby cold region just below the control rod tip which caused the formation of "coins" which further contributed to pellet clad interaction (PCI).
Recommendations were Issued which avoided a recurrence of failures with this fuel design and this mode of operation. The problem 1s not likely to occur with current fuel designs which are pressurized and have a smaller pellet-to-clad gap.
1. FUEL ROD CHARACTERISTICS
The eight failures occurred during three different irradiation cycles: three rods failed in Cycle 5, three in Cycle 6, and two in Cycle 7. The failed rods were oriainally contained in three reloads, representing different
fuel and cladding lots, different fuel fabrication processes, and two different Advanced Nuclear Fuels fabrication plants (Richland, Washington and Lingen, West Germany). As a result of the different fabrication routes involved, the fuel exhibited a certain variation in microstructural characteristics. However, since the observed failures involved a variety of microstructural characteristics, no inference could be made as to any possible influence of the microstructure on the failure propensity.
The fuel rods from the three reloads were of identical design characterized by a relatively large pellet o-claddlng gap (10 mil d ametral) and a fill gas pressurization of one atn sphere absolute.
2. POWER HISTORIES
The power histories of the failed rods which are typical of RWP operation were determined by both Sydkraft and ANF, their peak LHGR's are in the range of 180 to 330 W/cm 1n normal operation, as shown in Table 1. Six rods failed in their second cycle, the two others In tr.»1r third cycle.
The mode of operation of Barseheck Unit 1 is characterized by control cells 1n which control blades are removed at full power. The first time that a blade is pulled In a cycle, it is done very slowly over 10 to 15 days, supposedly to condition the fuel to its effects. The followinq control blade withdrawals are performed faster. Some blades remain Inserted for most of the cycle, they are called "deep"; while others are Inserted only partially, they are called "shallow".
Most of the rods failed while they were affected by shallow control blades and failed immediately after one of the first fast withdrawals. The effects of the control blade withdrawals on the power history, either directly or with the associated Xenon transient, can be larqe. Local LHGR's can reach 380 W/cm; they are not Included in Table 1.
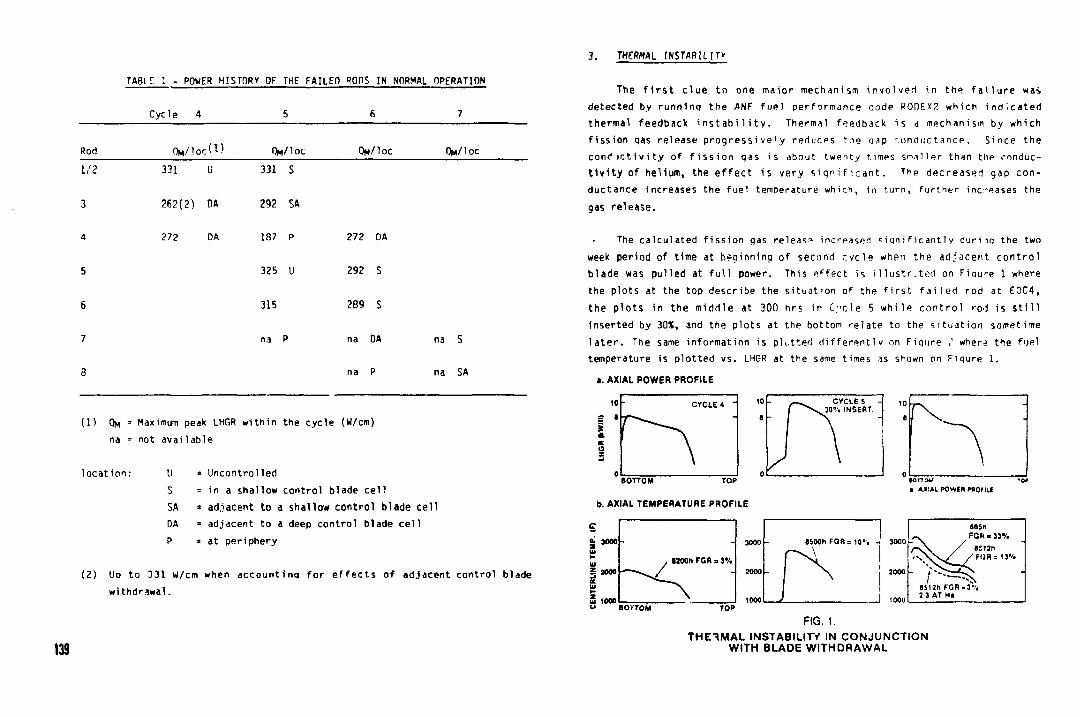
TABl: 1 - POWER HISTORY OF THE FAILED ROPS IN NORMAL OPERATION
Cycle 4 5 6 7
Rod On/ locd) OM/IOC QM/IOC OM/1OC
1/2 331 U 331 S
3 262(2) DA 292 SA
4 272 DA 187 P 272 DA
5 325 U 292 S
6 315 289 S
na P na OA na S
na P na SA
(1) QM = Maximum peak LHGR within the cycle (W/cm) na = not available
location: II = Uncontrolled S = in a shallow control blade cell SA = adjacent to a shallow control blade cell DA = adjacent to a deep control blade cell P = at periphery
(2) U D to 331 W/cm when accounting for effects of adjacent control blade withdrawal.
139
3. THERMAL INSTABILITY
The first clue to one major mechanism involved in the failure was detected by running the ANF fuel performance code R0DEX2 which indicated thermal feedback instability. Thermal feedback is a mechanism by which fission gas release progressively reduces tie aap conductance. Since the condictivity of fission qas is about twenty times smaller than the conductivity of helium, the effect is very significant. The decreased gap conductance increases the fuel temperature which, in turn, further increases the gas release.
The calculated fission gas release increased =iqniFicant1v duriiq the two week period of time at beginning of second cycle when the adjacent control blade was pulled at full power. This effect is illustr.ted on Figu-e 1 where the plots at the top describe the situation of the first failed rod at E0C4, the plots in the middle at 300 hrs in Cycle 5 while control rod is still inserted by 30%, and the plots at the bottom relate to the situation sometime later. The same information is plotted differently on Fiqure t' wherJ the fuel temperature is plotted vs. LHGR at the same times as shown on Fiqure 1. *. AXIAL POWER PROFILE
BOTTOM TOP
b. AXIAL TEMPERATURE PROFILE
•orro* a. AXIAL POWER PKOMI.I
3000-
S 2000
3 IOOO W BOTTOM
- 3000 OSOOh FOR =10 " \
J
ttln
3000 FGIl .33%
«!120 ' \ V v / / F O B = 13%
2000
«S12h FOR = 3% 1000 2 3 AT Ht
TOP FIG. 1.
THERMAL INSTABILITY IN CONJUNCTION WITH BLADE WITHDRAWAL
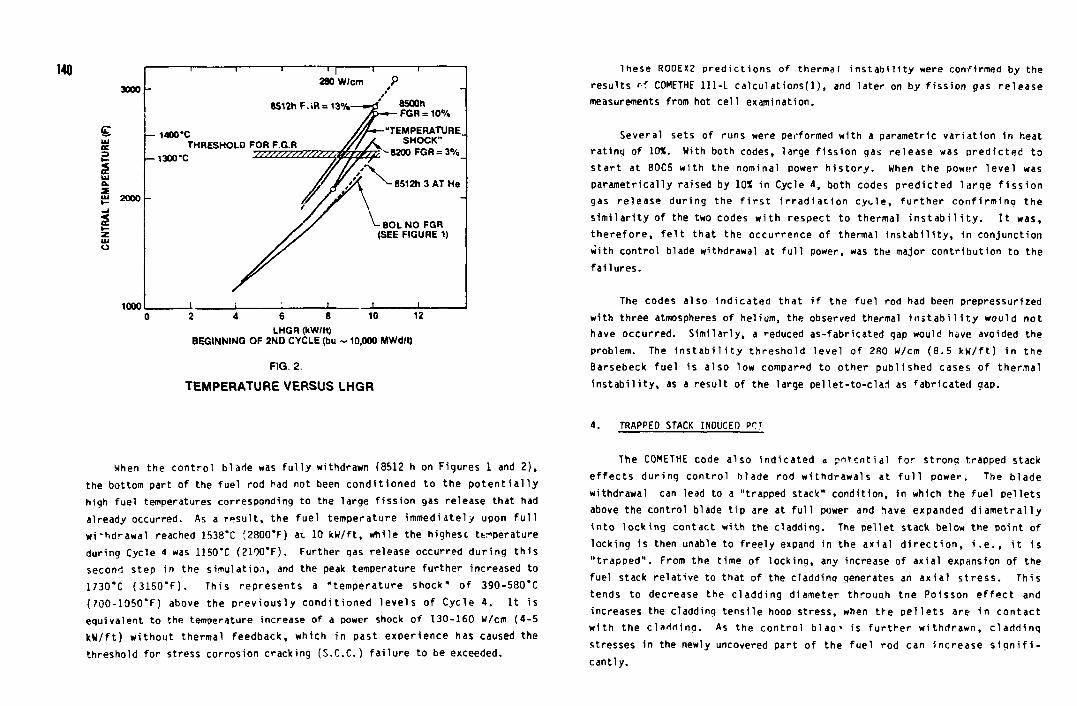
I
3000
I 1 1 . 1
280 W/cm • i
P / — * B5l2hF.»R = 1 3 % — » 4 8500h
p~»- FGR = 10%
— 1400*C iff-THRESHOLD FOR F G R Jfc//
_ 1 3 0 0 . c YtY/M/sf//Z£&0M£t/i
--"TEMPERATURE / SHOCK" E S -8200FGR = 3%_
2000
// // '-// 1/ *S // w *A
\ - 8 5 1 2 h 3 A T H e
/ /f \ \ - B O L N O FGR
(SEE FIGURE 1)
1000 i i : . I I i 2 4 6 8 10 12
LHGR (kW/lt) BEGINNING OF 2ND CYCLE (bu ~ 10,000 MWd/t)
FIG. 2.
TEMPERATURE VERSUS LHGR
When the con t ro l blade was f u l l y withdrawn (8512 h on Figures 1 and 2 ) , the bottom part of the fuel rod had not been cond i t i oned to the p o t e n t i a l l y high fue l temperatures corresponding to the large f i ss ion gas release that had already occurred. As a r e s u l t , the fue l temperature immediate ly upon f u l l wi thdrawal reached 1538*C ;2800*F) ax 10 kw / f t , while the highest ttmperature during Cycle 4 was 1150*C (2100"F). Further gas release occurred du r i ng t h i s second step in the s imulat ion, and the peak temperature fur ther increased to 1730*C (3150"F) . This represents a " temperature shock" of 390-580*C (700-1050*F) above the p r e v i o u s l y cond i t ioned l e v e l s of Cycle 4 . I t i s equivalent to the temperature increase of a power shock o f 130-160 W/cm (4-5 kW/ f t ) w i thout thermal feedback, which in past exper ience has caused the threshold for stress corrosion cracking (S.C.C.) f a i l u r e to be exceeded.
These R0DEX2 p r e d i c t i o n s of thermal i n s t a b i l i t y were confirmed by the resu l ts r-f COMETHE 111-L ca l cu l a t i ons ( l ) , and later on by f i s s i on gas re lease measurements from hot ce l l examination.
Several sets of runs were performed with a parametric va r ia t ion in heat ra t ing of 10%. With both codes, large f i s s i on gas re lease was p r e d i c t e d to s t a r t at 80C5 w i th the nominal power h i s t o r y . When the power l eve l was parametr ical ly raised by 10* in Cycle 4, both codes p red i c ted l a rqe f i s s i o n gas re lease dur ing the f i r s t i r r a d i a t i o n c y c l e , f u r t h e r con f i rm ina the s i m i l a r i t y of the two codes w i t h respect to thermal i n s t a b i l i t y . I t was, t h e r e f o r e , f e l t tha t the occurrence of thermal I n s t a b i l i t y , in conjunction with control blade withdrawal at f u l l power, was the major cont r ibu t ion to the f a i l u r e s .
The codes also i nd i ca ted tha t i f the fue l rod had been prepressurized wi th three atmospheres of helium, the observed thermal i n s t a b i l i t y would not have occurred. S imi la r l y , a reduced as-fabricated gap would have avoided the problem. The i n s t a b i l i t y th resho ld l eve l of 280 W/cm (8.5 kW/ f t ) i n the Barsebeck fue l is a lso low compared to other publ ished cases of thermal i n s t a b i l i t y , as a resu l t of the large pe l le t - to -c la r l as fabr icated gap.
4. TRAPPED STACK INDUCEO PC?
The COMETHE code also ind ica ted a p o t e n t i a l f o r strong trapped stack e f f e c t s dur ing con t ro l blade rod wi thdrawals at f u l l power. The blade withdrawal can lead to a "trapped stack" condi t ion, in which the fuel pe l le ts above the control blade t i p are at f u l l power and have expanded d i a m e t r a l l y i n t o l ock ing contact with the cladding. The pe l le t stack below the point of locking is then unable to f ree ly expand in the ax ia l d i r e c t i o n , i . e . , i t 1s " t r a p p e d " . From the t ime of lock ing , any increase of axial expansion of the fuel stack re la t i ve to that of the cladding generates an a x i a l s t r e s s . This tends to decrease the c ladd ing diameter through tne Polsson e f f e c t and increases the cladding tens i le hoop stress, when t r e p e l l e t s are i n contac t w i t h the c ladd ing . As the con t ro l blao-> is f u r t h e r w i thdrawn, c l add inq stresses in the newly uncovered part of the fue l rod can increase s i g n i f i cant ly .
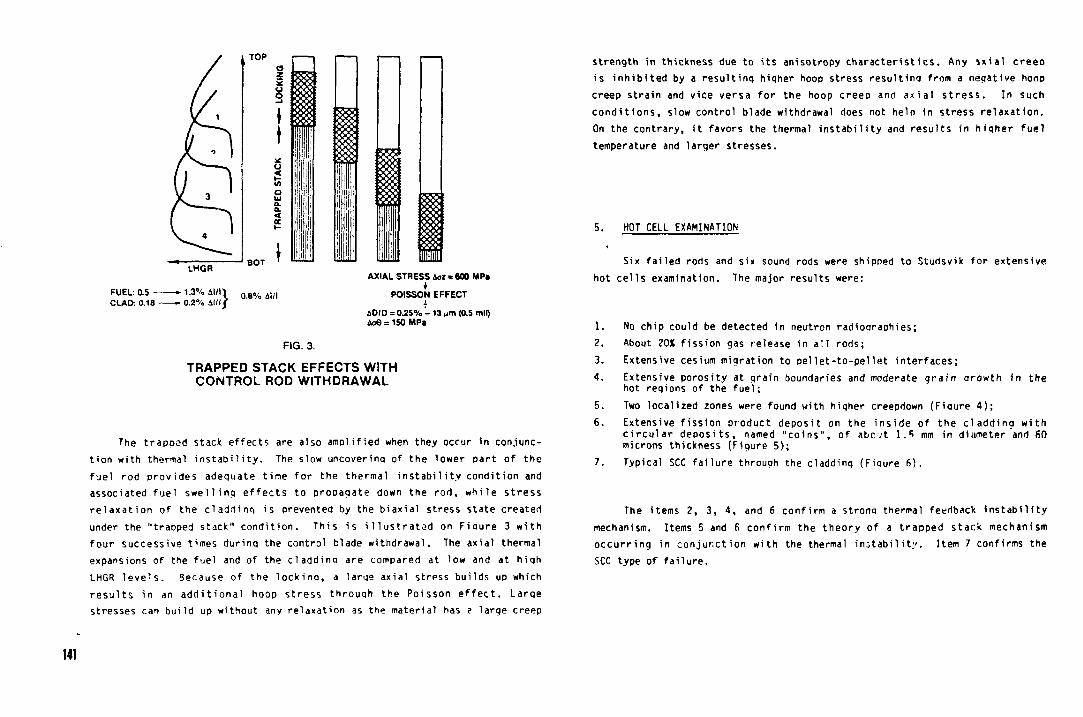
LHGR
FUEL: 0.5 -CLAD: 0.18-
-1.3% Al/I •0.2'
TOP
BOT
>/o A l / I /
AXIAL STRESS A<* = 600 MPa •
POISSON EFFECT i
&OIO = 0.25% -13 »m (0.5 mil) Ao6 = 150MP»
FIG. 3.
TRAPPED STACK EFFECTS WITH CONTROL ROD WITHDRAWAL
The trapped stack effects are also amplified when they occur in conjunction with thermal instability. The slow uncoverinq of the lower part of the fuel rod provides adequate time for the thermal instability condition and associated fuel swelling effects to propagate down the rod, while stress relaxation of the cladtlintj is prevented by the biaxial stress state created under the "traoped stack" condition. This is illustrated on Fiaure 3 with four successive times durinq the control blade withdrawal. The axial thermal expansions of the fuel and of the claddina are compared at low and at hiqh LHGR levels. Because of the lockina, a large axial stress builds up which results in an additional hoop stress through the Poisson effect. Larqe stresses can build up without any relaxation as the material has ? large creep
141
strength in thickness due to its anisotropy characteristics. Any ixial creeo is inhibited by a resultlnq higher hoop stress resultinq from a negative hoop creep strain and vice versa for the hoop creep and axial stress. In such conditions, slow control blade withdrawal does not heln in stress relaxation. On the contrary, it favors the thermal instability and results in higher fuel temperature and larger stresses.
5. HOT CELL EXAMINATION
Six failed rods and six sound rods were shipped to Studsvik for extensive hot cells examination. The major results were:
1. No chip could be detected in neutron radiooraphies; 2. About 20X fission gas release in all rods; 3. Extensive cesium migration to pellet-to-pellet interfaces; 4. Extensive porosity at grain boundaries and moderate grain arowth in the
hot regions of the fuel; 5. Two localized zones were found with hiqher creepdown (Fiaure 4 ) ; 6. Extensive fission product deposit on the inside of the cladding with
circular deposits, named "coins", of abcvjt 1.5 mm in diameter and 60 microns thickness (Figure 5);
7. Typical SCC failure through the cladding (Fiqure 6 ) .
The items 2, 3, 4, and 6 confirm a strong thermal feedback instability mechanism. Items 5 and 6 confirm the theory of a trapped stack mechanism occurring in conjunction with the thermal instability. Item 7 confirms the SCC type of failure.
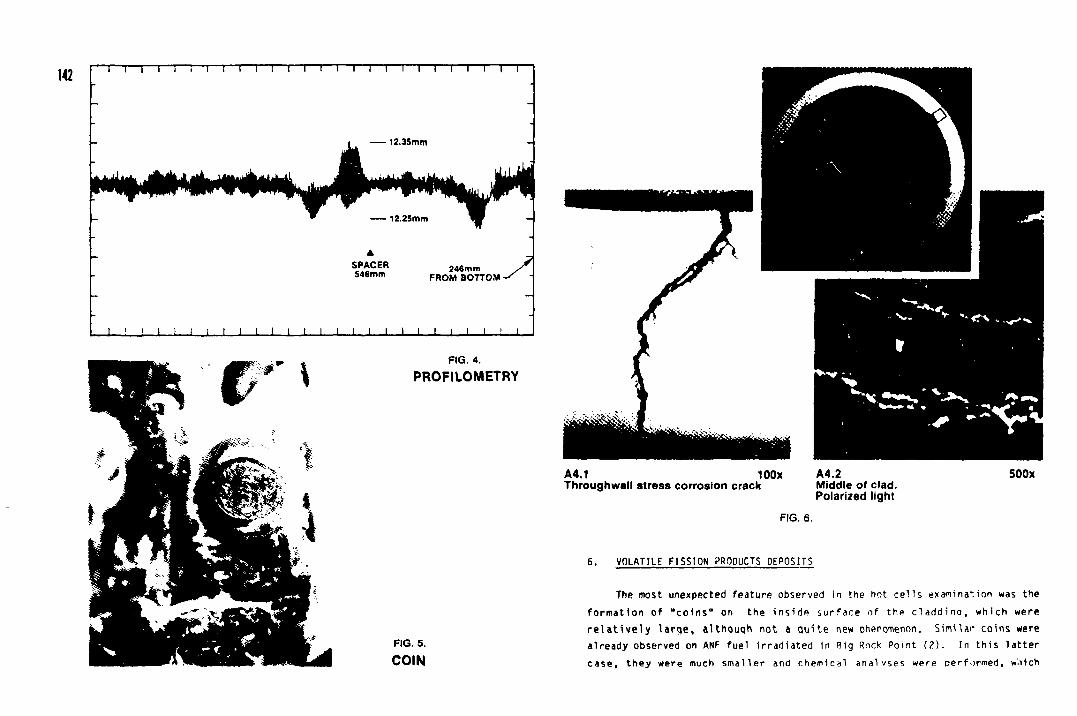
142 i—i—i—i—i—i—i—i—i—i—i—i—i—i—i—i—i—i—i—i—i—i—i—i—r
12.35 mm
A SPACER 546 mm 246mm
FROM BOTTOM y. J L_! l_J—L__JL I i I I I L_l I I i l i I I I L
FIG. 4. PROFILOMETRY
FIG. 5.
COIN
A4.1 100x Throughwall stress corrosion crack
A4.2 Middle of clad. Polarized light
500x
FIG. 6.
6. VOLATILE FISSION PRODUCTS DEPOSITS
The most unexpected feature observed in the hot cells examination was the formation of "coins" on the inside surface of the claddina, which were relatively large, althouqh not a quite new Dhenomenon. Similar coins were already observed on ANF fuel irradiated in Big Rnck Point (2). In this latter case, they were much smaller and chemical analyses were performed, w'.iich
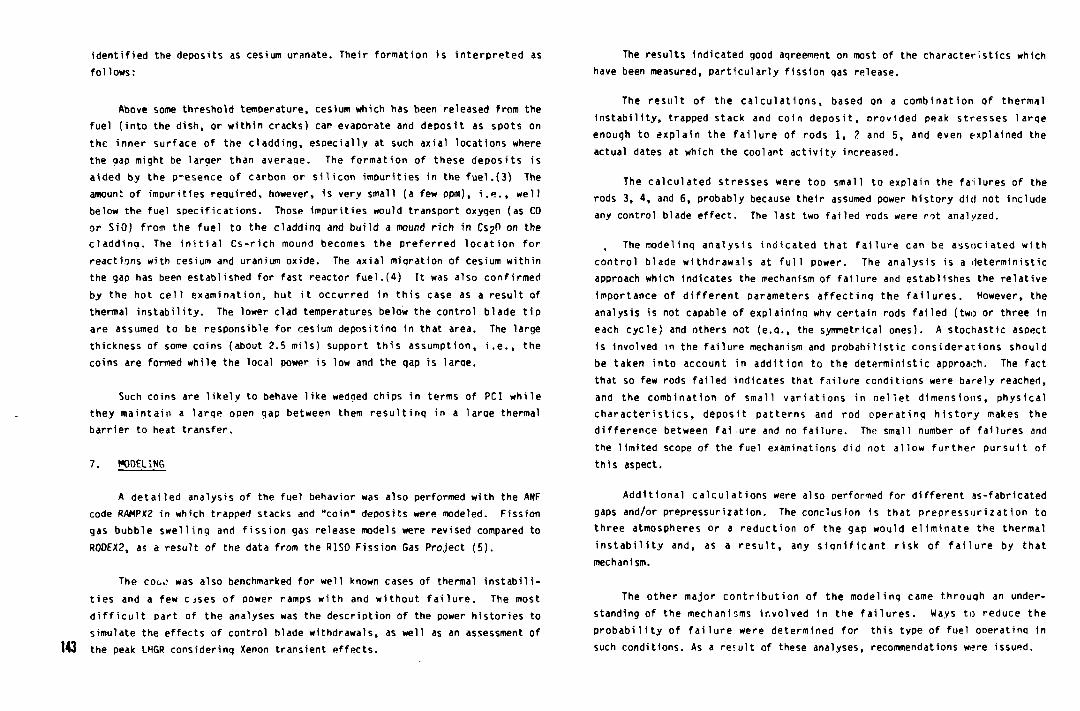
identified the deposits as cesium uranate. Their formation is interpreted as follows:
Above some threshold temperature, cesium which has been released from the fuel (into the dish, or within cracks) can evaporate and deposit as spots on the inner surface of the cladding, especially at such axial locations where the qap might be larger than average. The formation of these deposits is aided by the presence of carbon or silicon impurities in the fuel.(3) The amount of impurities required, however, is \iery small (a few ppm), i.e., well below the fuel specifications. Those impurities would transport oxygen (as CO or SiO) from the fuel to the claddinq and build a mound rich in Cs^O on the cladding. The initial Cs-rich mound becomes the preferred location for reactions with cesium and uranium oxide. The axial migration of cesium within the gap has been established for fast reactor fuel.(4) It was also confirmed by the hot cell examination, but it occurred in this case as a result of thermal instability. The lower clad temperatures below the control blade tip are assumed to be responsible for cesium depositina in that area. The large thickness of some coins (about 2.5 mils) support this assumption, i.e., the coins are formed while the local power is low and the qap is laroe.
Such coins are likely to behave like wedged chips in terms of PCI while they maintain a larqe open gap between them resulting in a 1arqe thermal barrier to heat transfer.
7. MODELING
A detailed analysis of the fuel behavior was also performed with the ANF code RAMPX2 in which trapped stacks and "coin" deposits were modeled. Fission gas bubble swelling and fission gas release models were revised compared to R0DEX2, as a result of the data from the R1S0 Fission Gas Project (5).
The cooe was also benchmarked for well known cases of thermal instabilities and a few cjses of power ramps with and without failure. The most difficult part of the analyses was the description of the power histories to simulate the effects of control blade withdrawals, as well as an assessment of the peak LHGR considering Xenon transient effects.
The results indicated good agreement on most of the characteristics which have been measured, particularly fission gas release.
The result of the calculations, based on a combination of thermal instability, trapped stack and coin deposit, provided peak stresses larqe enough to explain the failure of rods 1, 2 and 5, and even explained the actual dates at which the coolant activity increased.
The calculated stresses were too small to explain the failures of the rods 3, 4, and 6, probably because their assumed power history did not include any control blade effect. The last two failed rods were rot analyzed.
, The modelinq analysis indicated that failure can be associated with control blade withdrawals at full power. The analysis is a deterministic approach which indicates the mechanism of failure and establishes the relative importance of different parameters affecting the failures. However, the analysis is not capable of explaining why certain rods failed (two or three in each cycle) and others not (e.q., the symmetrical ones). A stochastic aspect is involved in the failure mechanism and probabilistic considerations should be taken into account in addition to the deterministic approach. The fact that so few rods failed indicates that failure conditions were barely reached, and the combination of small variations in nellet dimensions, physical characteristics, deposit patterns and rod operating history makes the difference between failure and no failure. The small number of failures and the limited scope of the fuel examinations did not allow further pursuit of this aspect.
Additional calculations were also performed for different as-fabricated gaps and/or prepressurization. The conclusion is that prepressurizatIon to three atmospheres or a reduction of the gap would eliminate the thermal instability and, as a result, any slqnificant risk of failure by that mechanism.
The other major contribution of the modelinq came through an understanding of the mechanisms involved In the failures. Ways to reduce the probability of failure were determined for this tvpe of fuel oDeratinq in such conditions. As a result of these analyses, recommendations were issued.
8. RECOMMENDATIONS AND CONCLUSIONS
In light of the hot cell examination results and with the helo of the modeling analyses, ANF made a number of recommendations with priorities in order to protect the fuel from failures, e.g., no once-burned fuel in control cells, and hiding any twice burned fuel which was in a control cell in its second cycle. Since then, no more failures have been detected.
The conclusions from the overall fuel failure evaluation are as follows:
The fuel failures were caused by a combination of fuel design and reactor operation. The non-pressurized fuel design allowed thermal instability to occur, and the mode of reactor operation caused a trapped stack effect during control rod withdrawal at full power. These two effects created cladding stresses which exceeded the threshold for SCC-PCI failures.
The following parameters did not appear to contribute to the fuel failures: fabrication auality, fabrication process, or fuel microstructure.
Analysis indicated that the failures would have been avoided if the fuel rods had been preDressurized with helium to a minimum of three atmospheres.
9. ACKNOWLEDGMENTS
ANF appreciates the support of Sydkraft and Studsvik in the evaluation of the fuel rod failures, particularly S. E. Larsson and S. Lundberg from Sydkraft.
REFERENCES
1. N. E. Hoppe, M. Billaux and J. vanVliet, COMETHE Ul-L, General Oescrio-tion 8N8201-04, Jan. 1982.
2. C. E. Johnson, et al, Characterization of Low Burnup Rods (J-l) from Bin Rock Point Reactor - (ANL personal communication.)
3. D. Cubioccioti, et al. EPRI R455-1, Nov. 1976.
4. D. C. Fee and C. E. Johnson. J of Nucl. Mat. 99 (1981) 107-11*.
5. P. Knudsen, et al, Final Report on the RISO Fission Gas Project, RISO-FGP-R17 Rev., June 1983.
IAEA-TC-424/37
LOAD FOLLOW AND FREQUENCY CONTROL OPERATING EXPERIENCE OF FRAGEMA FUEL IN EDF REACTORS
A. DUMONT Fraglma (Framatome Division Combustible), Lyon P. BOURNAY Electricity de France, Paris
France
Abstract
In France, by 1990. tha electrical power production producad by Nuclaar Power, should reach lit, it already wet ?0I in 1966 ; this meant that matt EOF nuclaar reactors muat oparata on load follow and frequency control to allow tn« production ef electricity to follow variation in consumption.
So tha experience aequirad In powar raaetort it now vary extensive and is uniqua in tha world.
A faw batches hava undargona 3 cyclai of irradiation whila oparatlng on load follow and hava cumulated up to 260 power eyelet.
Equally. • faw batches of fuel assemblies have eyelet totalling 520 days operation on frequency control.
Some cycles of irradiation had up %* 110 lead follow eyelet or up to 300 diyt operation on
fraquancy control. As of Dactmbar 1186, nearly 2(00 load follow cycles hava baan rsaliied in 63 irradiation eyelet tnd nearly T 600 day* operating on frequency control have bean accumulated in 6* irradiation cyelea.
In each case, the fuel behaviour during load fellow operation or fraquency control operation was satlafactory no bad influence of this type of operation on the fuel behaviour was observed and in particular there waa no influence on the occurence frequency of leakages.
The excellent behaviour of FRAGEHA fuel already observed during bate load operation it thus confirmed for operating modes sueh as load follow and frequency control.
1. INTRODUCTION
Tn France, the share of nucleaT energy in the total electric energy generation has been quickly increasing : 55Z in 1964, 6SZ in 1965 and 70Z in 1966. It should reach 75Z in 1990. In order to reach a production-consumption grid balance with an incretsing rate of nuclear production, most of the nuclear power plants have to be operated with increased flexibility allowing daily load follow and grid frequency control.
Analytical atudies and experimental teats, including an overall qualification test in the CAP reactor, showed that there is no potential cause of fuel dam je due to load follow and
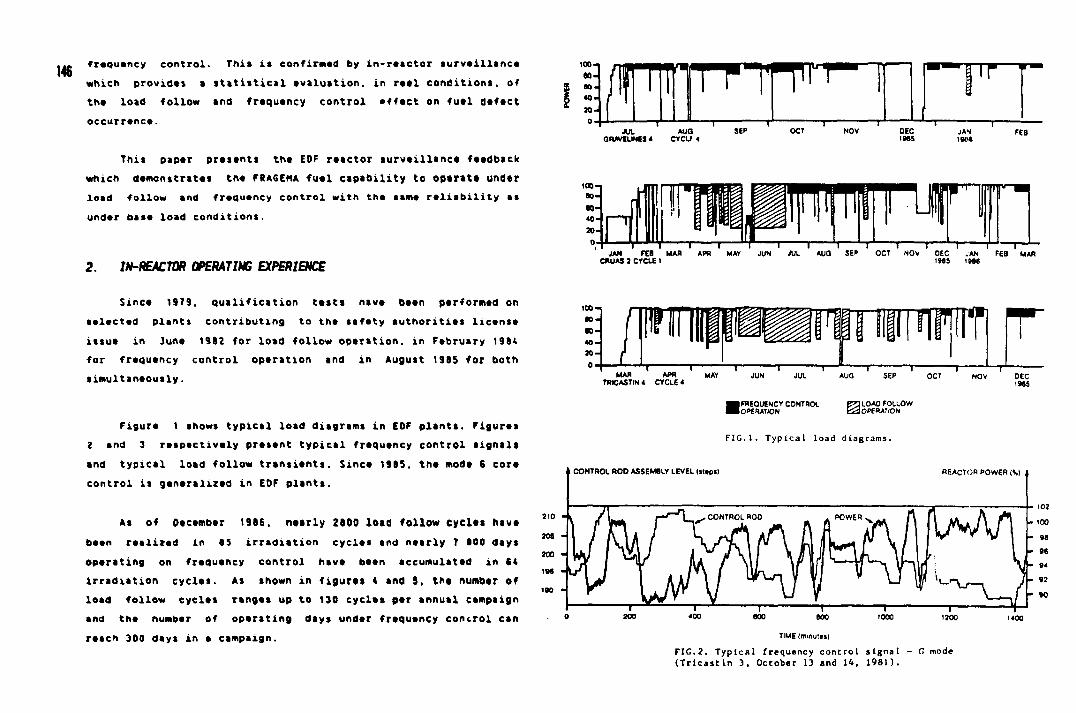
frequency control. This is confirmed by in-reactor surveillance which provides a statistical evaluation, in reel conditions, of the load follow and frequency control effect on fuel defect occurrence.
This paper presents the EOF reactor surveillance feedback which demonstrates the F8ASEMA fuel capability to operate under load follow and frequency control with the same reliability as under base load conditions.
2. IN-REACTOR OPERATING EXPERIENCE
Since 19T9. qualification tests nave been performed on selected plants contributing to the safety authorities license issue in June 1982 for load follow operation, in February 1984 for frequency control operation and in August 1985 for both simultaneously.
Figure 1 shows typical load diagrams in EOF plants. Figures 2 and 3 respectively present typical frequency control signals and typical load follow transients. Since 1985, the mode 6 core control is generalized in EOF plants.
As of December 1986. nearly 2800 load follow cycles have been realized in 85 irradiation cycles and nearly 7 800 days operating on frequency control have been accumulated in 84 irradiation cycles. As shown in figures * and S, the number of load follow cycles ranges up to 130 cycles per annual campaign and the number of operating days under frequency concrol can reach 300 days in a campaign.
WK T~7~
JUL AUG ORAVEUNES 4 CYCU 4
SEP OCT NOV DEC I M S
JAN 1SVC
FEB
T 1—"T i 1 ' i—*r—i 1—n r -—r JAN FEB MAR APR MAY JUN JUL AUG SEP OCT NOV DEC .AN FEB MAR
CRUAS2CYCLEI 1985 I B M
1 0 0 -
8 0 -e o -4 0 -3 0 -
wiwwii.iinriiTi . 1 1 1 1—" 1 1 1 r
MAR APR MAY JUN JUL AUG SEP OCT NOV OEC TRICASTIN4 CYCLE 4 l 9 e i
(FREQUENCY CONTROL OPERATION
3 LOAD FOLLOW i OPERATION
F I G . l . T y p i c a l l o a d d i a g r a m s .
. CONTROL ROD ASSEMBLY LEVEL Imps) REACTOR POWER (V
TIME (minuttj)
F1C.2. Typical frequency control signal - G mode (Trlcastln 3, October 13 and 14, 1981).
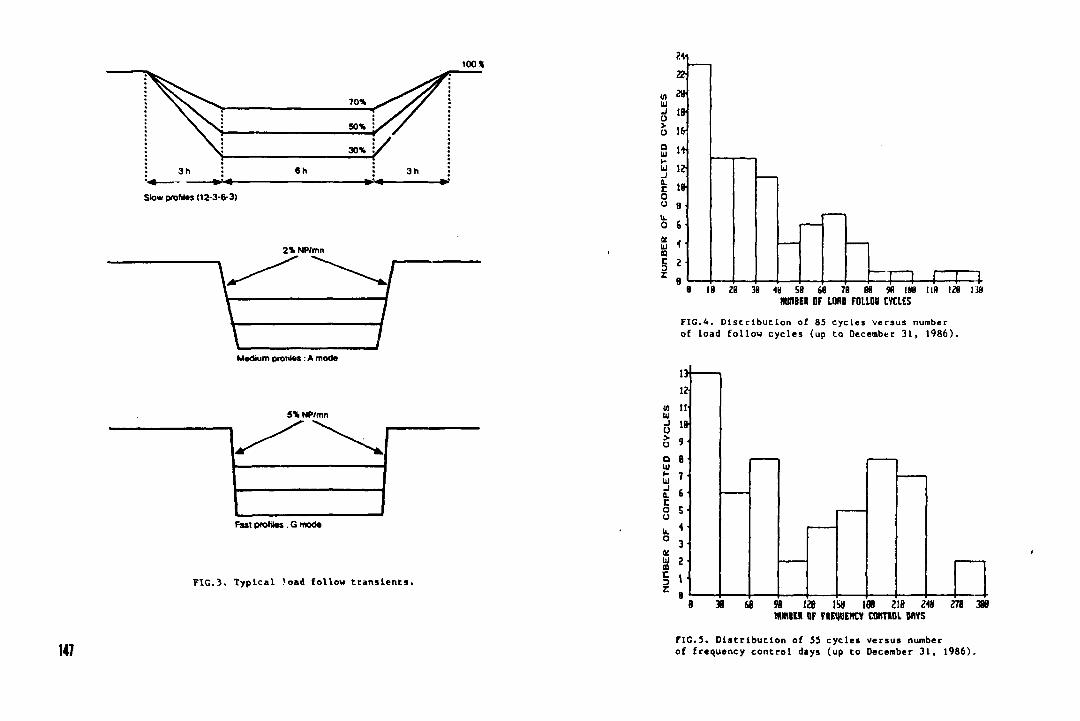
100*
** • -Slow profiles 02-3-6-3)
70%
50% :
30%
«h
2%NP/mn
Medium proiiles : A mode
5% NP/mn
Fast profilas : G mode
FIG.3. Typical Voad follow transients.
147
TZ
г» 19
и 1г î»
8
б
тп гтг a is га за «i si ( i : i tu w IHD ua I H Ш
IMIIEI OF LOAD FOLLQU CYCLES
FIG.4. Dis tr ibut ion of 85 cyc les versus number of load fol low cyc le s (up to December 31 , 1986).
1Э
w II ш d «и 5 9
68 9B va i w i n 218 гад HUME« OF FIEWlEHtV С0КТМИ. BAYS
• 278 380
FIG.5. Distribution of 33 cycles versus number of frequency control days (up to December 31, 1986).
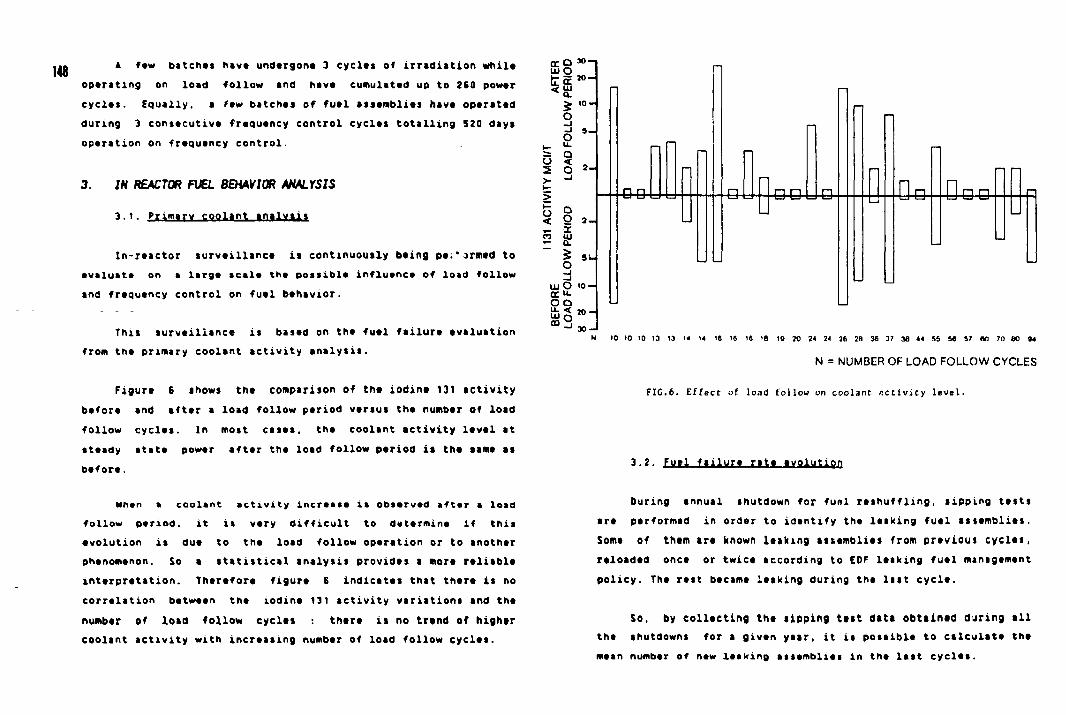
A faw batches hava undargona 3 cycles of irradiation while oparating on load -follow and hava cumulated up to 260 powar cycles. Equally, a few batches of fuel assemblies have operated during 3 consecutive frequency control cycles totalling 520 days operation on frequency control.
3. IN REACTOR FUEL BEHAVIOR ANALYSIS
3.1. Primary coolant analysis
In-raactor surveillance is continuously being pe."armed to evaluate on a large scale the possible influence of load follow and frequency control on fuel behavior.
This surveillance is based on the fuel failure evaluation from the primary coolant activity analysis.
Figure 6 shows the comparison of the iodine 131 activity before and after a load follow period versus the number of load follow cycles. In most cases, the coolant activity level at steady state power after the load follow period is the same as before.
When a coolant activity increase i* observed aftar a load follow period. it is very difficult to determine if this evolution is due to the load follow operation or to another phenomenon. So a statistical analysis provides a more reliable interpretation. Therefore figure 6 indicates that there is no correlation between the iodine 131 activity variations and the number of load follow cycles there is no trend of higher coolant activity with increasing number of load follow cycles.
t r O M UJ O fctt10-
5 i o -o J-1
s o o o
< .- X o UJ — Q.
o - J _J
uj O i o -cr u. O Q
- 1 30-
e-& u o o U e a & a O-B
10 10 10 13 13 u 14 IS IS 16 IS 19 20 34 24 36 3B 36 37 38 44 S5 56 57 60 70 60 94
N = NUMBER OF LOAD FOLLOW CYCLES
FIC.6. Effect of load follow on coolant activity level.
3.2. fuej, ftalWTf H i t tV°lvUgO
During annual shutdown for fuol reshuffling, sipping tests are performed in order to identify the leaking fuel assemblies. Some of tham ire known leaking assemblies from previous cycles, reloaded once or twice according to EOF leaking fuel management policy. The rest became leaking during the last cycle.
So. by collecting the sipping test data obtained daring all the shutdowns for a given year, it is possible to calculate the mean number of new leaking assemblies in the last cycles.
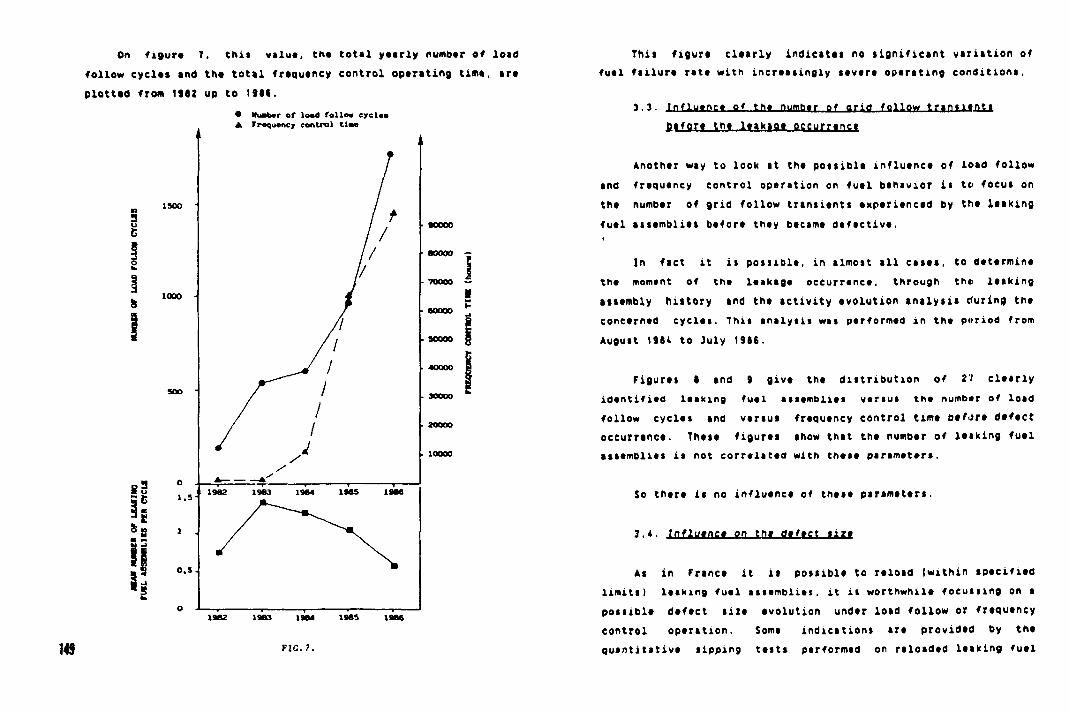
On figure T, this value, the total yearly number of load follow cycles and the total frequency control operating time, are plotted from 1992 up to 1966°.
• Nuabcr of load follow cycles • Frequency control tlae
I 1000
149 FIG.7.
This figure clearly indicates no significant variation of fuel failure rate with increasingly severe operating conditions.
3.3. Influence of the number of arid follow transients before the leakage occurrence
Another way to look at the possible influence of load follow and frequency control operation on fuel behavior is to focus on the number of grid follow transients experienced by the leaking fuel assemblies before they became defective.
In fact it is possible, in almost all cases, to determine the moment of the leakage occurrence, through th« leaking assembly history and the activity evolution analysis during the concerned cycles. This analysis was performed in the poriod from August 1994 to July 19SS.
Figures I and 9 give the distribution of 21 clearly identified leaking fuel assemblies versus the number of load follow cycles and versus frequency control time before defect occurrence. These figures show that the number of leaking fuel assemblies is not correlated with these parameters.
So there is no influence of these parameters.
3.4. Influinc* on the defect size
As in France it is possible to reload (within specified limits) leaking fuel assemblies, it is worthwhile focussing on a possible defect size evolution under load follow or frequency control operation. Some indications are provided by the quantitative sipping tests performed on reloaded leaking fuel
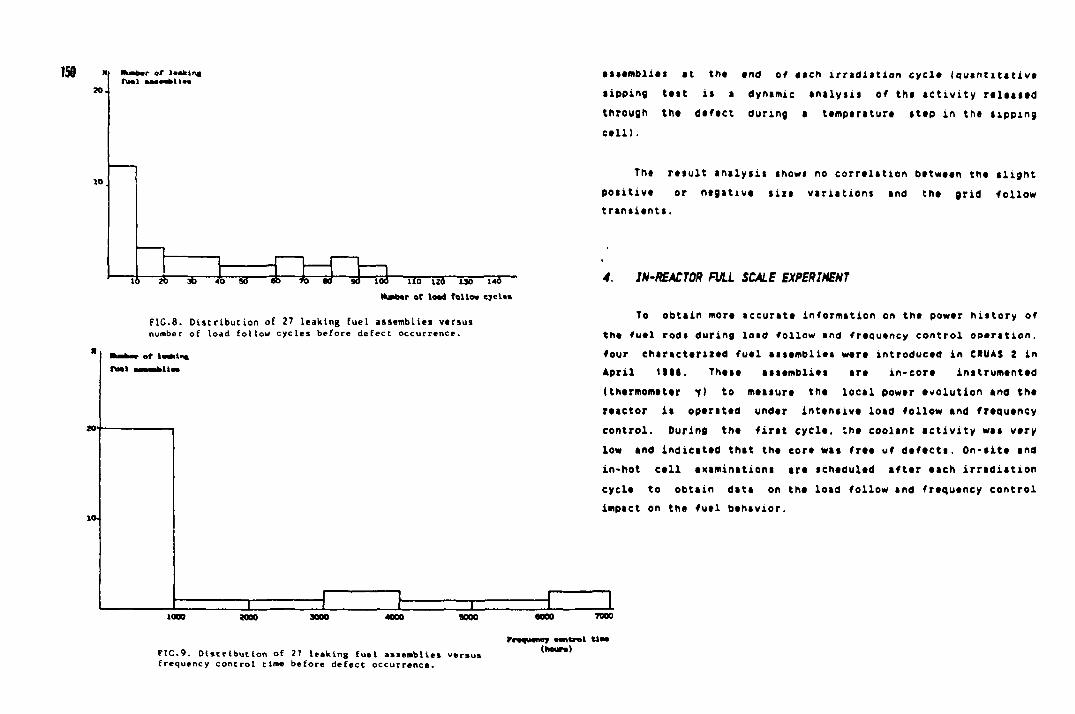
150
10
•r of leafclnf
15 ~«fe 53 « » So 53 I5a Tod TT5 Till 135 wS Ifcabar of load fo l io* cycle*
FIG.8 . D i s t r i b u t i o n of 27 l e a k i n g f u e l a s s e m b l i e s v e r s u s number of l oad f o l l o w c y c l e s b e f o r e d e f e c t o c c u r r e n c e .
2000 3000
F I C . 9 . D i s t r i b u t i o n of 27 l e a k i n g f u e l a s s e m b l i e s v e r s u s f requency c o n t r o l t ime b e f o r e d e f e c t o c c u r r e n c e .
Proo^Mncy contpot (hour.)
asaamblits at tht and of «*ch irradiation cyclt Iquantitativt tipping tatt is a dynamic analysis of the activity released through tht defect during a ttmparaturt sttp in the sipping call).
Tht result analysis shows no corrtlation between tht alight poiitivt or ntgativt tizt variations and tht grid follow transitnts.
4. 1N-REACT0R FULL SCALE EXPERIMENT
To obtain mora accurate information on the power history of tht fuel rods during load follow and frequency control oparation, four characterised fuel assemblies were introductd in CftlMS 2 in April 1118. Thtst assemblies art in-cort inatrumtnttd (thtrmomtttr y) to mtaaurt tht local powtr tvolution and tht rtactor it operated under inttntiva load follow and frtqutncy control. During tht firtt cyclt, tht coolant activity was V»TV low and indicattd that tht cort wat frtt of defects. On-titt and in-hot ctll txaminations art tchtdultd afttr aach irradiation cyclt to obtain data on tht load follow and frtqutncy control impact on the fuel bthtvior.
7000
U a
5. CONCLUSION
The FRAGEHA fuel behavior during load follow operation or frequency control operation in EOF plantt it satisfactory : no bad influence of this typo of operation on the fuel behavior is observed and in particular there is no influence on the occurrence frequency of leakages.
REFERENCES
Load Follow Impact on Fuel Behavior Expenmetal Results M. MOREL - P. MELIN - B. GAUTIER - B. HOU0A1LLE IAEA LYON Hay 1987
2 Fuel Operating Experience Under Load Follow And Frequency Control Conditions P. BOURNAY - 3. PELLEUER - X. TMIBAULT - A. DUMONT - 3. JOSEPH - J. ROYER ENC 66 - GENEVE - June 1966
Load Follow And Frequency Control In EOF Power Plants 6. GAUTIER - J. PELLETIER - C. OEHON - 6. HORIN ANS ORLANOO - April 1965
151
IAEA-TC-024/J8
OPERATIONAL EXPERIENCE OF THE VVER-1000 REACTOR FUEL ELEMENTS AND FUEL ASSEMBLY FOR THE NOVO-VORONEZH FIFTH POWER UNIT WITH A THREE-YEAR FUEL LIFE CYCLE
V.N. PROSELKOV, A.S. DUKHOVENSKIJ, N.L. FATIEVA, Yu.A. ZAKHARKO, B.A. ZALETNYKH, M.I. MIROSHNICHENKO, G.S. KIRYUKHIN, V.D. SHMELEV, E D . DEMIN I.V. Kurchatov Institute of Atomic Energy, Moscow, Unions of Soviet Socialist Republics
Abstract
The operational experience of the WER-1OO0 reactor fuel for the Hovo-Voronezh NPP f i f t h powei unit for the whole period of operation including passing to the three-year fuel l i f e - c y c l e with the use of 4.4% enrichment PA, la considered in the paper. The PA and fuel elements were shown to keep the ir operability in operating for three fuel loads and in attaining th* bumup depth up to 37.4 MW.day/kgU.
The f i f t h power unit of the Movo-Voronezh »?P with t i e WBfl-1000 reactor was placed at a rated power in February 20, 19<30.
By Hay, 9. 1985 the power unit has operated five fuel cycl e s : the f i r s t fuel loading from May 20, 1980 t i l l October 12. 1981 (258.2 effective days); the second loading from November 23. 1981 to July 7, 1982 (167,7 ett. days); the third one - from September 12. 1982 to September 21.1983 (334 eff . days); the fourth one - from October 31. 1983 t i l l May 20. 1984 (191.6 eff . days); the f i f t h one - from June 20. 1984 to May 9. 1985 (298. 1 eff . days).
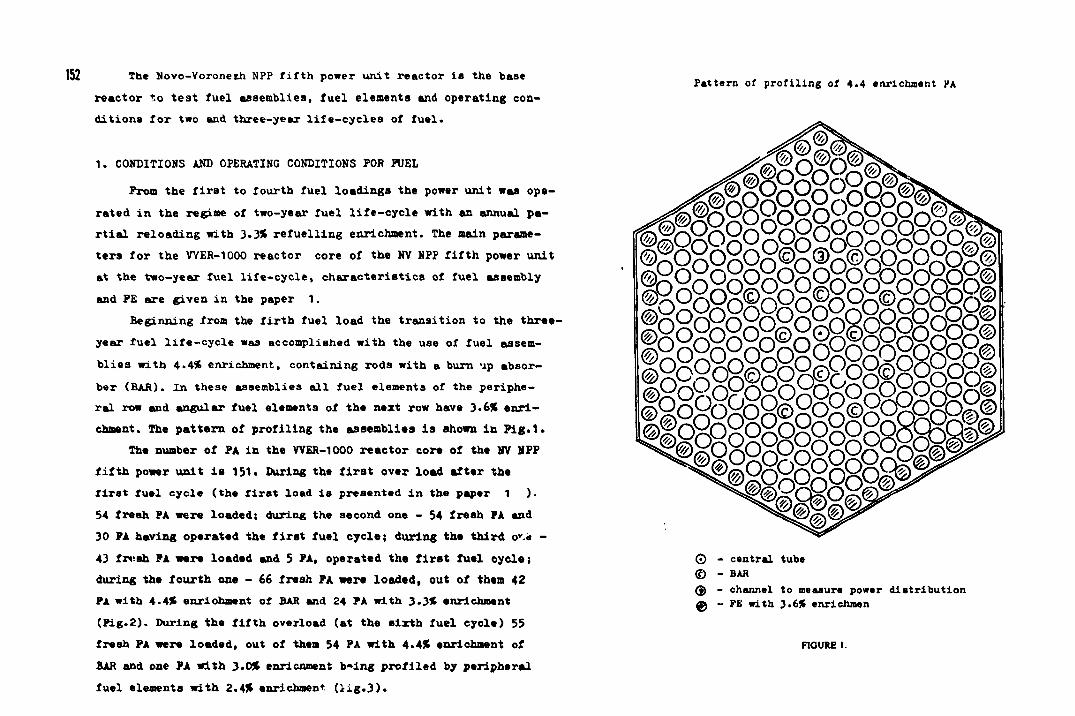
152 The Novo-Voronezh NPP f i f t h power u n i t reac tor i a the base
r e a c t o r t.o t e s t fue l a s sembl i e s , f u e l e lements and operat ing con
d i t i o n s f o r two and three -year l i f e - c y c l e s of f u e l .
1 . CONDITIONS AND OPERATING CONDITIONS FOR FUEL
From the f i r s t to fourth fue l l o a d i n g s the power u n i t was o p e
rated i n the regime of two-year f u e l l i f e - c y c l e with an annual p a
r t i a l r e l o a d i n g with 3 . 3 * r e f u e l l i n g enrichment. The main parame
t e r s f o r the WER-1000 reac tor core of the NV NPP f i f t h power u n i t
at the two-year f u e l l i f e - c y c l e , c h a r a c t e r i s t i c s of f u e l assembly
and FE are g iven i n the paper 1.
Beginning from the f i r t h f u e l l o a d the t r a n s i t i o n to the t h r e e
year f u e l l i f e - c y c l e was accomplished wi th the use of f u e l assem
b l i e s w i t h 4 . 4 * enrichment, conta in ing rods with a burn up absor
ber (BAR). In these assemblies a l l f u e l e lements of the p e r i p h e
r a l row and angular f u e l elements of the next row have 3.6ft e n r i
chment. The p a t t e r n of p r o f i l i n g the as sembl i e s i s shown i n P i g . 1 .
The number of FA i n the WER-1000 r e a c t o r core of the NV NFP
f i f t h power u n i t i s 131 . During the f i r s t over load a f t e r the
f i r s t fue l c y c l e ( the f i r s t load i s presented i n the paper 1 ) .
54 f r e s h FA were loaded; during the second one - 54 f r e s h FA and
30 FA having operated the f i r s t f u e l c y c l e ; during the t h i r d c.«i -
43 fntah FA were loaded and 5 FA, operated the f i r s t f u e l c y c l e ;
during the f o u r t h one - 66 fresh FA were l oaded , out of them 42
FA with 4 . 4 * enrichment of BAR and 24 FA wi th 3.3ft enrichment
( F i g . 2 ) . During the f i f t h overload (at the s i x t h f u e l c y o l e ) 55
f resh FA were l oaded , out of them 54 FA wi th 4.4ft enrichment of
BAR and one FA wi th 3.0ft enricnment b«ing p r o f i l e d by per ipheral
fue l elements w i t h 2.4ft enrichment ( i i g . 3 ) .
Pattern of prof i l ing of 4.4 enrichment УЛ
@>
тФ oxo m® ©RoRo2oxogo2oRoRo9pg© ©RoRoRoRoRoRoRoRoRoo® ©RoRoRoR©R©g©£ogogog® ©°o°o°o°oRoRoRoRoRoR©
@©oRoRoR©RoR©RöbbHD^© ® iogogogogogog 8 gh°^
^©OROXOROROQO®* 2oRogogo^^
0 - central tube © - BAR ® - channel to measure power d is tr ibut ion ф ~ FE with 3.6% enrichmen
FIGURE I.
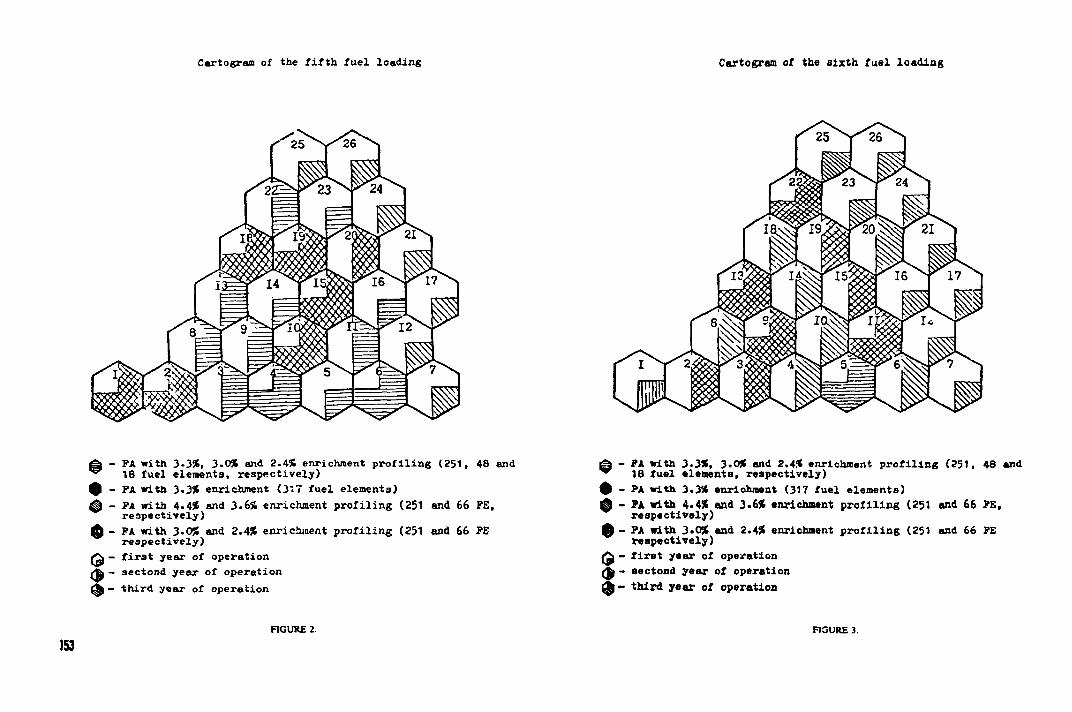
Cartogram of the fifth fuel loading
g| - PA with 3-3%, 3.0% and 2.4% enrichment profiling (251, 48 and " 18 fuel elements, respectively) Q - FA with 3.3% enrichment (317 fuel elements) ^ - FA with 4-4% and 3.6% enrichment profiling (251 and 66 FE,
respectively) 0 - FA with 3*0% and 2.4% enrichment profiling (251 and 66 FE
respectively) Q - first year of operation £t| - sectond year of operation A - third year of operation
153 FIGURE 2.
Cartogram of the sixth fuel loading
^ - FA with 3.3%, 3.0% and 2.4% enrichment profiling (251, 48 and ~ 18 fuel elements, respectively) $ - PA with 3.3% enrichment (317 fuel elements) 0 - FA with 4.4% and 3.6% enrichment profiling (251 and 66 FE,
respectively) £ - FA with 3.0% end 2.4% enrichment profiling (251 and 66 FE
respectively) Q - first year of operation (% - aectond year of operation (J- third year of operation
FIGURE 3.
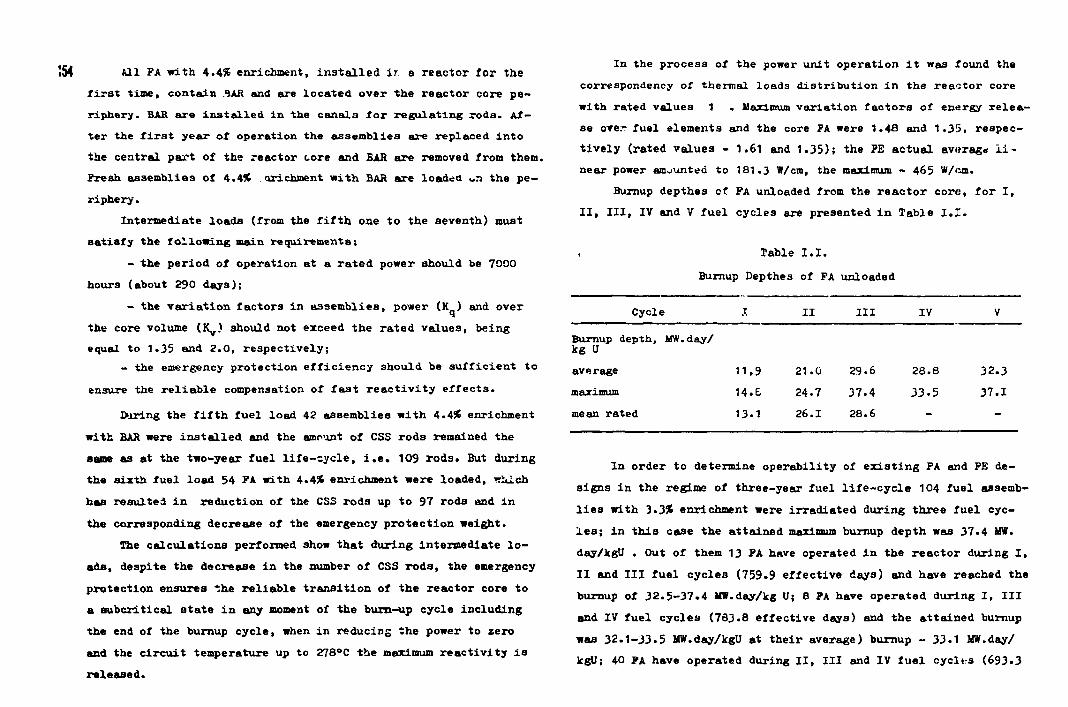
•54 All FA with 4.4% enrichment, installed ir a reactor for the first time, contain 3AR and are located over the reactor core periphery. BAR are installed in the canals for regulating rods. After the first year of operation the assemblies are replaced into the central part of the reactor core and BAR are removed from them Fresh assemblies of 4.4ft arichment with BAR are loaded on the periphery.
Intermediate loads (from the fifth one to the seventh) must satisfy the following main requirements;
- the period of operation at a rated power should be 7000 hours (about 290 days);
- the variation factors in assemblies, power (K ) and over the core volume (Ky) should not exceed the rated values, being equal to 1.35 and 2.0, respectively;
- the emergency protection efficiency should be sufficient to ensure the reliable compensation of fast reactivity effects.
During the fifth fuel load 42 assemblies with 4.4$ enrichment with BAR were installed and the amount of CSS rods remained the same as at the two-year fuel life-cycle, i.e. 109 rods. But during the sixth fuel load 54 FA with 4.4% enrichment were loaded, -hich has resulted in reduction of the CSS rods up to 97 rods and in the corresponding decrease of the emergency protection weight.
The calculations performed show that during intermediate loads, despite the decrease in the number of CSS rods, the emergency protection ensures the reliable transition of the reactor core to a aubcritical state in any moment of the burn-up cycle including the end of the burnup cycle, when in reducing the power to zero and the circuit temperature up to 278°C the maximum reactivity is released.
In the process of the power unit operation it was found the correspondency of thermal loads distribution in the reactor core with rated values 1 . Maximum variation factors of energy release over fuel elements and the core FA were 1.48 and 1.35, respectively (rated values - 1.61 and 1.35); the FE actual average ii~ near power amounted to 181.3 W/cm, the maximum - 465 W/cm.
Burnup depthes ct FA unloaded from the reactor core, for I, II, III, IV and V fuel cycles are presented in Table I.I.
Table I.I. Burnup Depthes of FA unloaded
Cycle .T II III IV V
Burnup depth, MW.day/ kg U
average 11,9 21.0 29.6 28 .8 32 .3
maximum 14.& 24.7 3 7 . 4 3 3 . 5 3 7 . 1
mean rated 13*1 26.1 28.6
In order to determine o p e r a b i l i t y of e x i s t i n g FA and FB de
s i g n s i n the regime of three-year f u e l l i f e - c y c l e 104 f u e l assemb
l i e s with 3 . 3 * enrichment were i r r a d i a t e d during three fue l cyc
l e s ; i n t h i s case the a t t a i n e d maximum burnup depth was 37 .4 MW.
day/kgU . Out of them 13 FA have operated i n the r e a c t o r during I ,
I I and I I I f u e l c y c l e s (759.9 e f f e c t i v e days) and have reached the
burnup of 3 2 . 5 - 3 7 . 4 1IW.day/kg U; 8 FA have operated during I , I I I
and IV f u e l c y c l e s (783 .8 e f f e c t i v e days) and the a t t a i n e d burnup
was 3 2 . 1 - 3 3 . 5 MW.day/kgU at t h e i r average) burnup - 33.1 MW.day/
kgU; 40 FA have operated during I I , I I I and IV f u e l c y c l e s (693 .3
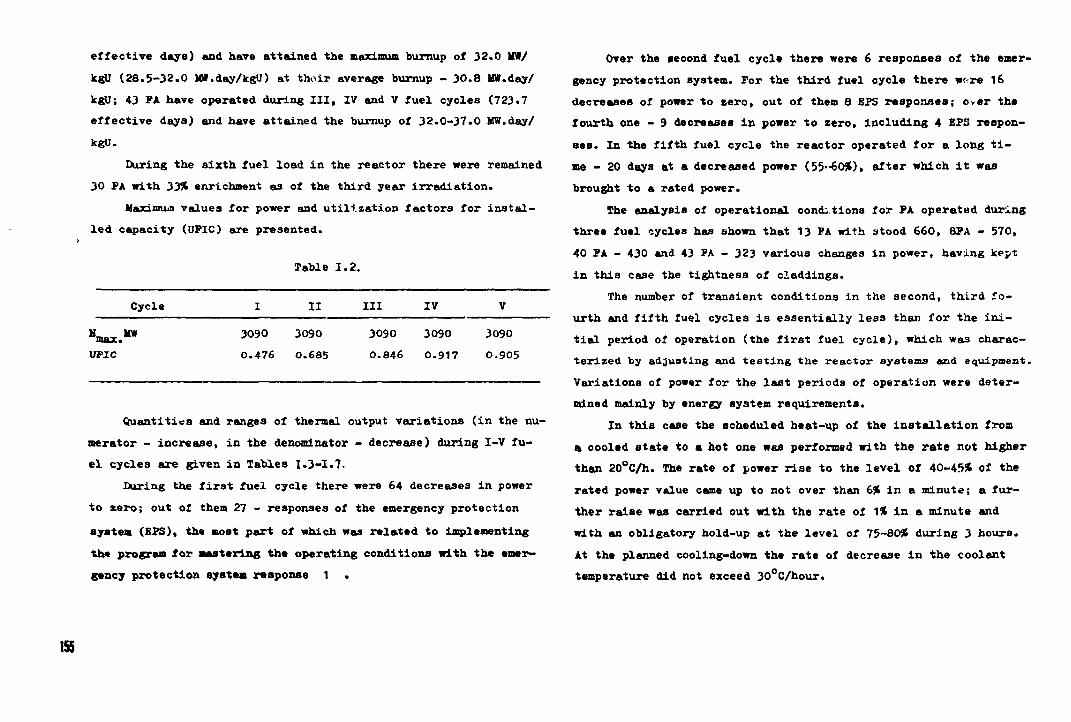
e f f e c t i v e days) and have a t t a i n e d the maximum burnup of 32 .0 MW/
kgU ( 2 8 . 5 - 3 2 . 0 MW.day/kgU) at t h e i r average burnup - 3 0 . 8 MW.day/
kgU; 43 FA have operated during I I I , IV and V f u e l c y c l e s (723 .7
e f f e c t i v e days) and have a t t a i n e d the burnup of 3 2 . 0 - 3 7 . 0 MW.day/
kgU.
During the s i x t h f u e l load i n the r e a c t o r there were remained
30 FA wi th 33% enrichment as of the th ird year i r r a d i a t i o n .
Maximum v a l u e s f o r power and u t i l i z a t i o n f a c t o r s for i n s t a l
l e d c a p a c i t y (UFIC) are presented .
Table 1 . 2 .
Cycle I I I I I I IV V
H „ „ MW 3090 3090 3090 3090 3090
UFIC 0.476 0.685 0.846 0.917 O.905
Q u a n t i t i e s and ranges of thermal output v a r i a t i o n s ( i n the nu
merator - i n c r e a s e , i n the denominator - decrease ) during I-V f u
e l c y c l e s are g iven i n Tables I . 3 - 1 . 7 .
During the f i r s t f u e l cyc l e there were 64 decreases i n power
t o aero; out of them 27 - responses of the emergency p r o t e c t i o n
system (EPS), the most part of which was r e l a t e d to Implementing
the program f o r mastering the opera t ing cond i t i ons w i t h the emer
gency p r o t e c t i o n system response 1
155
Over the second fuel cycle there were 6 responses of the emergency protection Bystem. For the third fuel cycle there were 16 decreases of power to zero, out of them 8 EPS responses; over the fourth one - 9 decreases in power to zero, including 4 EPS responses. In the fifth fuel cycle the reactor operated for a long time - 20 days at a decreased power (.55••60%), after which it was brought to a rated power.
The analysis of operational conditions for FA operated during three fuel cycles has shown that 13 PA with stood 660, 8PA - 570, 40 PA - 430 and 43 PA - 323 various changes in power, having kept in this case the tightness of claddings.
The number of transient conditions in the second, third fourth and fifth fuel cycles is essentially less than for the initial period of operation (the first fuel cycle), which was characterized by adjusting and testing the reactor systems and equipment. Variations of power for the last periods of operation were determined mainly by energy system requirements.
In this case the scheduled heat-up of the installation from a cooled state to a hot one was performed with the rate not higher than 20°C/h. The rate of power rise to the level of 40-45* of the rated power value came up to not over than 6$ in a minute; a further raise was carried out with the rate of 1% in a minute and with an obligatory hold-up at the level of 75-80% during 3 hours. At the planned cooling-down the rate of decrease in the coolant temperature did not exceed 30°C/hour.
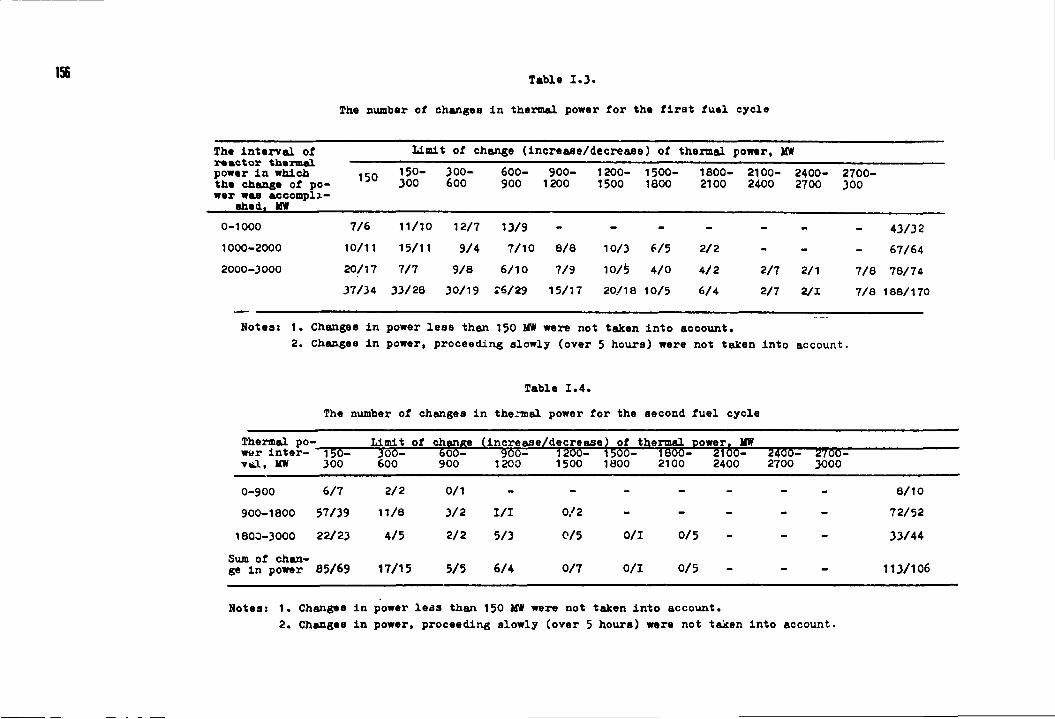
Table 1.3.
The number ox changes in thermal power for the first fuel cycle
The i n t e r v a l of reac tor thermal power i n which the change of p o wer was accompli
shed. MW
Limit of change ( i n c r e a s e / d e c r e a s e ) of thermal power, MW The i n t e r v a l of reac tor thermal power i n which the change of p o wer was accompli
shed. MW
150 150-300
3 0 0 -600
600-900
9 0 0 -1200
1200-1500
1500-1800
1800- 2100-2100 2400
2400-2700
2700-300
0-1000 7 /6 11/10 12/7 13/9 - - - - - - - 43/32 1000-2000 10/11 15/11 9 /4 7 /10 8 /8 10/3 6/5 2/2 - - - 67/64 2000-3000 20/17 7/7 9 /8 6/10 7/9 10/5 4 /0 4 / 2 2/7 2/1 7 /8 78/74
37/34 33 /28 30/19 26/29 15/17 20/18 10/5 6 /4 2/7 2/1 7 /8 188/170
Notes: 1. Changes in power less than 150 MW were not talcen into account. 2. Changes in power, proceeding slowly (over 5 hours) were not talcen into account.
Table 1.4. The number of changes in thermal power for the second fuel cycle
Thermal po-wer inter- 150-v*l, MW 300
Limit of change (increase/decrease) of thermal power. MW -Joo^ 606- 3o6- 1206- 1566- 1500- 2 loo- 2400- 2700-"J6T5T" 600
600-900
"900=" 1200
1200 1500 1800 2100 2400 2700 3000
0-900 6/7 2/2 0/1 - - - -900-1800 57/39 11/8 3 / 2 I / I 0 /2 - -
1800-3000 22/23 4/5 2 /2 5/3 0/5 0 /1 0 /5
Sum of change i n power 85 /69 17/15 5/5 6 / 4 0/7 0 /1 0 /5
8/10 72/52 33/44
113/106
Notes: 1. Changes in power leas than 150 MW were not taken into account. 2. Changes in power, proceeding slowly (over 5 hours) were not talcen into account.
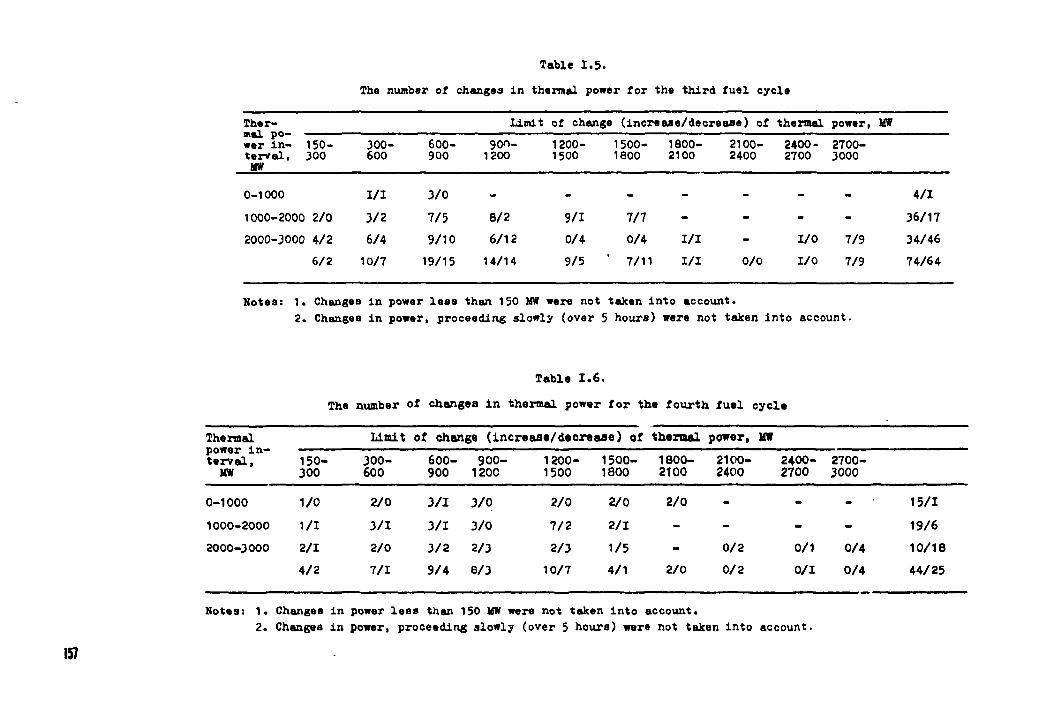
Table 1.5. The number or changes in thermal power for the third fuel cycle
Ther- Limit of change > ( incre aae /decrease ) of thermal power, MW
wer i n - 150-t e r v a l , 300
MW
300-600
600-900
90O-1200
1200-1500
1500-1800
1800-2100
2100-2400
2400-2700
2700-3000
0-1000 I / I 3 / 0 - - - - - - - 4 /1
1000-2000 2/0 3 / 2 7 /5 8 / 2 9 /1 7/7 - - - - 36/17
2000-3000 4 / 2 6 /4 9 /10 6/12 0 /4 0 /4 I / I - 1/0 7/9 34/46
6 /2 10/7 19/15 14/14 9/5 ' 7/11 I / I 0 /0 I/O 7/9 74 /64
Notes: 1. Changea in power leaa than 150 HW were not taken into account. 2. Changea in power, proceeding slowly (over 5 hours) were not taken into account.
Table 1.6. The number of changea in thermal power for the fourth fuel cycle
Thermal power i n t e r v a l ,
HW
Unit of change (increase/decrease) of thermal power, HW Thermal power i n t e r v a l ,
HW 1 5 0 -300
3 0 0 -600
6 0 0 - 9 0 0 - 1 2 0 0 - 1 5 0 0 -900 120C 1500 1800
1 8 0 0 -2100
2 1 0 0 -2400
2 4 0 0 -2700
2700-3000
0-1000 1/0 2 / 0 3 / 1 3 / 0 2 / 0 2 / 0 2 /0 - - - 1 5 / 1
1000-2000 1/1 3 / 1 3 / 1 3 / 0 7 / 2 2 / 1 - - - - 1 9 / 6
2000-3000 2 /1 2 /0 3 / 2 2 /3 2 / 3 1 /5 - 0 / 2 0 /1 0 / 4 1 0 / 1 8
4 / 2 7 / 1 9 / 4 8 / 3 10 /7 4 /1 2 /0 0 / 2 0 / 1 0 / 4 4 4 / 2 5
Notes: 1. Changea in power leas than 150 HW were not taken into account. 2. Changea in power, proceeding slowly (over 5 hours) were not taken into account.
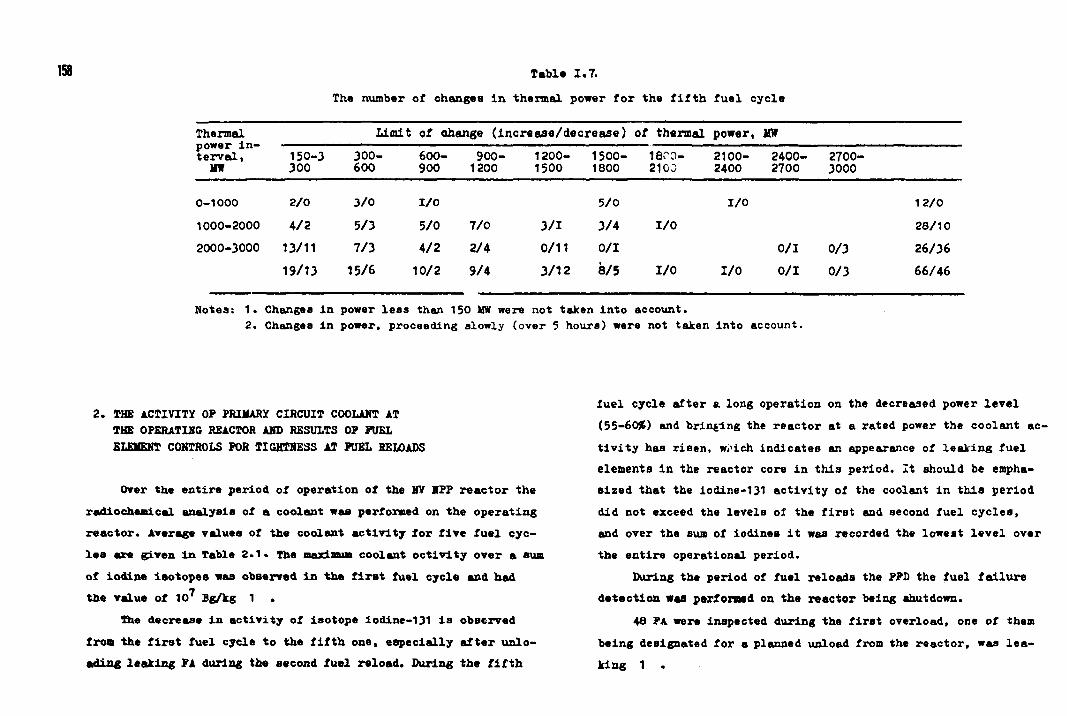
158 Table 1.7. The number of changes in thermal power for the fifth fuel cycle
Thermal power i n terva l ,
MW
Limit of change (increasfl/de< crease) of thermal power, MW Thermal power i n terva l ,
MW 150-3 300
300- 600- 900- 1200-600 900 1200 1500
1500-1800
18C0-2100
2100-2400
2400-2700
2700-3000
0-1000 2 /0 3/0 I/O 5 / 0 I/O 12/0
1000-2000 4 / 2 5/3 5/0 7/0 3/1 3 / 4 I /O 28/10 2000-3000 13/11 7/3 4/2 2/4 0/11 0 / 1 0 / 1 0 /3 26/36
19/13 15/6 10/2 9/4 3/12 8 / 5 I/O I/O 0 / 1 0 / 3 66/46
Notes: 1. Changes in power less than 150 MW were not taken into account. 2. Changes in power, proceeding slowly (over 5 hours) were not taken into account.
2. THE ACTIVITY OP PRIMARY CIRCUIT COOLANT AT THE OPERATING REACTOR AND RESULTS OP PUEL ELEMENT CONTROLS FOR TIGHTNESS AT PUEL RELOADS
Over the entire period of operation of the NV HPP reactor the radiochemical analysis of a coolant was performed on the operating reactor. Average values of the coolant activity for five fuel cycles are given in Table 2.1. The maTl mom coolant octivity over a sum of iodine isotopes was observed in the first fuel cycle and had the value of 10 7 Bg/kg 1 .
The decrease in activity of isotope iodine-131 is observed from the first fuel cycle to the fifth one, especially after unloading leaking PA during the second fuel reload. During the fifth
fuel cycle after a long operation on the decreased power level (55-60%) and bringing the reactor at a rated power the coolant activity has risen, w^ich indicates an appearance of leaking fuel elements in the reactor core in this period. It should be emphasized that the iodine-131 activity of the coolant in this period did not exceed the levels of the first and second fuel cycles, and over the sum of iodines it was recorded the lowest level over the entire operational period.
During the period of fuel reloads the PPD the fuel failure detection was performed on the reactor being shutdown.
48 PA were inspected during the first overload, one of them being designated for a planned unload from the reactor, was leaking 1 .
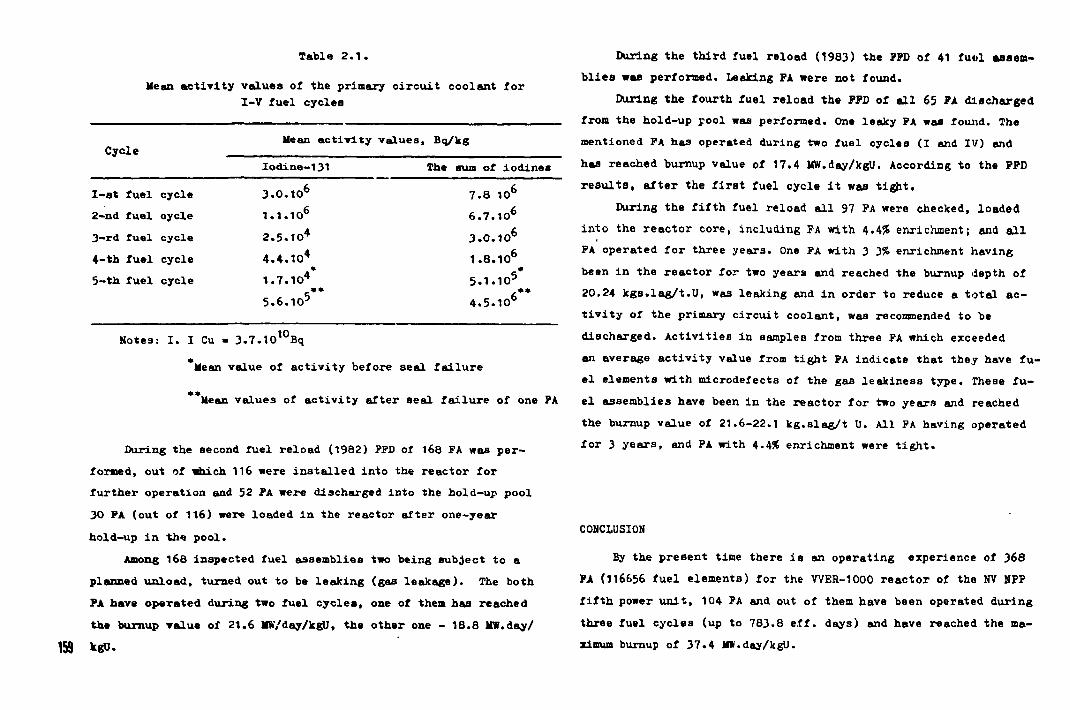
Table 2 . 1 .
Mean act iv i ty values of the primary c ircui t coolant for I-V fuel cycles
lie an act iv i ty values, Bq/kg Cycle _ _
Iodine-131 The sum of iodines
I-at fuel cycle 3 . 0 . 1 0 6
2-nd fuel oycle 1 .1 .10 6
3-rd fuel cycle 2.5.10* 4-th fuel cycle 4.4.10* 5-th fuel cycle 1.7.10*
5 .6 .10 3
Notes: I . I Cu > 3 .7 .10 l 0 Bq
Uean value of act iv i ty before seal fa i lure
Uean values of act iv i ty after seal fa i lure of one PA
During the second fuel reload (1982) PFD of 168 FA was performed, out of which 116 were ins ta l led into the reactor for further operation and 52 FA were discharged into the hold-up pool 30 PA (out of 116) were loaded in the reactor after one-year hold-up i n th«s pool.
Among 168 inspected fuel assemblies two being subject to a planned unload, turned out to be leaking (gas leakage). The both PA have operated during two fuel cycles , one of them has reached the bumup value of 21.6 MW/day/kgU, the other one - 18.8 MW.day/ kgU.
7.8 10 6
6 . 7 . 1 0 6
3 . 0 . 1 0 6
1 .8 .10 6
5 .1 .10 5
4 .5 -10 6
During the third fuel reload (1983) the PPD of 41 fuol assemb l i e s was performed. Leaking FA were not found.
During the fourth fuel reload the ?FD of a l l 65 FA discharged from the hold-up Fool was performed. One leaky FA was found. The mentioned FA has operated during two fuel cycles (I and IV) and has reached bumup value of 17.4 JlW.day/kgU. According to the FFD resu l t s , after the f i r s t fuel cycle i t was t ight .
During the f i f th fuel reload a l l 97 FA were checked, loaded into the reactor core, including FA with 4.4% enrichment; and a l l FA operated for three years. One FA with 3 3% enrichment having been in the reactor for two years and reached the burnup depth of 20.24 kgs . lag/ t .U, was leaking and in order to reduce a total act i v i t y of the primary circuit coolant, was recommended to be discharged. Act iv i t ies in samples from three FA which exceeded an average act iv i ty value from tight FA indicate that they have f u el elements with microdefects of the gas leakiness type. These fu e l assemblies have been in the reactor for two years and reached the burnup value of 21.6-22.1 kg .s lag/ t U. All PA having operated for 3 years, and FA with 4.4% enrichment were t ight .
CONCLUSION
By the present time there i s an operating experience of 368 FA (116656 fuel elements) for the WER-1000 reactor of the NV NPP f i f th power uni t , 104 FA and out of them have been operated during three fuel cycles (up to 783.8 eff . days) and have reached the maximum burnup of 37.4 MW.day/kgU.
As is seen from Table 1.1 the average and maximum values of fuel burnup In passing to the three-year fuel life-cycle grow essentially and In this case the fuel elements' operability is retained.
Prom the presented data is seen that the total activity of iodine isotopes in the coolant at the period of operation of five fuel loads did not exceed 10 Bq/kg. From the first to the fifth fuel cycle it was observed the reduction of activity over the sum of iodines and iodine-131 isotope, especially after the unload of leaky PA during the second fuel reload. In the course of operation of the fifth fuel loading, after the reactor has operated during 20 days at the decreased power (55-60% of the rated power) and reached the rated power (February 1985) the iodine-131 activity of the coolant has been increased by one order of magnitude, which was due to the appearance of leaky fuel elements in the reactor core.
The analysis of radionuclide composition of fission products in the primary circuit coolant of the operating reactor during the entire period of exploitation of five fuel loadings and the FPD results on the shutdown reactor show that no fuel elements with large failures of claddings are in the reactor core. During the cen tral period of fuel operation 5 FA out of 368 were found leaky, which amounts to 1.35% of the total quantity of FA irradiated in the reactor. Besides, it should be emphasized that none of FA has reached the criterion of unloading ahead of schedule. The analysis of fission products' activity data makes it possible to oonclude that the main number of leaky fuel elements was formed during the
first fuel loading at the period of bringing the reactor to the rated power.
All fuel elements from fuel assemblies having operated during three fuel cycles (104 FA), and fuel elements from FA with 4.4% enrichment kept their claddings' tightness. In this case it should be noted that operating conditions of fuel assemblies for the NV NFP fifth power unit was characterized by the appreciable number of transient conditions.
The operating experience of the fifth power unit of the NV NFF demonstrated the high reliability of FA and fuel elements having operated for two and three fuel cycles at the presence of a wide variety of changes in the reactor power.
REFERENCES
1. Vikhrev Yu.V. et al. AE (Atomic Energy), v. 54, 983, p. 163-166.
2. Bibilashvili Yu.K., Golovnin I.S., Goncharov V.V. et al. The operating experience of fuel for the WER-1000 reactor of the NV NFF fifth power unit. Report at the French-Bussian Seminar, Sacle, 1985.
IAEA-TC424/39
THE JAPANESE POWER RAMPING AND LOAD FOLLOWING PROGRAMME SINCE THE PETTEN MEETING (Summary)
Y. MISHIMA University of Tokyo, Tokyo, Japan
Since our IWG-FPT Meeting in Sep.'82 at Petten Establishment, Netherland, some modifications have been made in the Japanese Program from what I reported there. The current program, for both BWR and PWR fuels therefore, are shown in the following two tables.
In BWR Program, Boiling Water Capsule (BOCA) has been developed by Japan Atomic Energy Research Institute (JAERI) at its oharai Establishment and power-ramp test using helium-3 screen can be carried out in Japanese Material Testing Reactor (JMTR). Segmented fuel rods of various fuel designs, including zirconium-liner rod have been irradiated at FUKUSHIMA Power Plant as contemplated, and the first spesimen rods discharged at the end of 1st cycle were carried to JMTR. Power ramping up to 600 w/cm has been done on fuel rods of two designs {current-design and zirconium-liner tube) without indication of any release of fission gas, early this year.
The specimen taken from the end of 2nd cycle will be ramp-tested at JMTR-BOCA during the fiscal year of Showa 62 (up to Mar.'88).Post irradiation examination tests will follow on these specimen fuel rods. And also 8 specimen rods have been decided to be sent to R-2 at STODSVIK and power-ramp test will be carried out early '88.
In PWR PRD (Power Ramp Demonstration) tests for current-design fuels have been carried out along with the planed schedule but the PRD-4 was ommitted. Four stages of
tests have been completed and PIE for the specimen fuel rods began in '86. Some additional out-pile tests such as .stress corrosion crucking test on cladding tube have been performed. Development of test dlvices were also carried out at the hot laboratory. As it is at present necessary to re-assemble the PIE'd fuel rods into an assemble of the same geometry as the original spent fuel assembly in order to be accepted at the Japanese reprocessing plant, the development of the necessary device for the work has been made at the PIE facilities. Prof Home try under water at the site fuel storage pool was carried out, too. , Improved design fuels for PWR will be irradiated at Ohi Power Plant. Two types of fuel assemblies; Mitsubishi and Nuclear Fuel Industries will be irradiated and PIE'd in this program.
The results of those tests will be published and be reported here after they are completed.
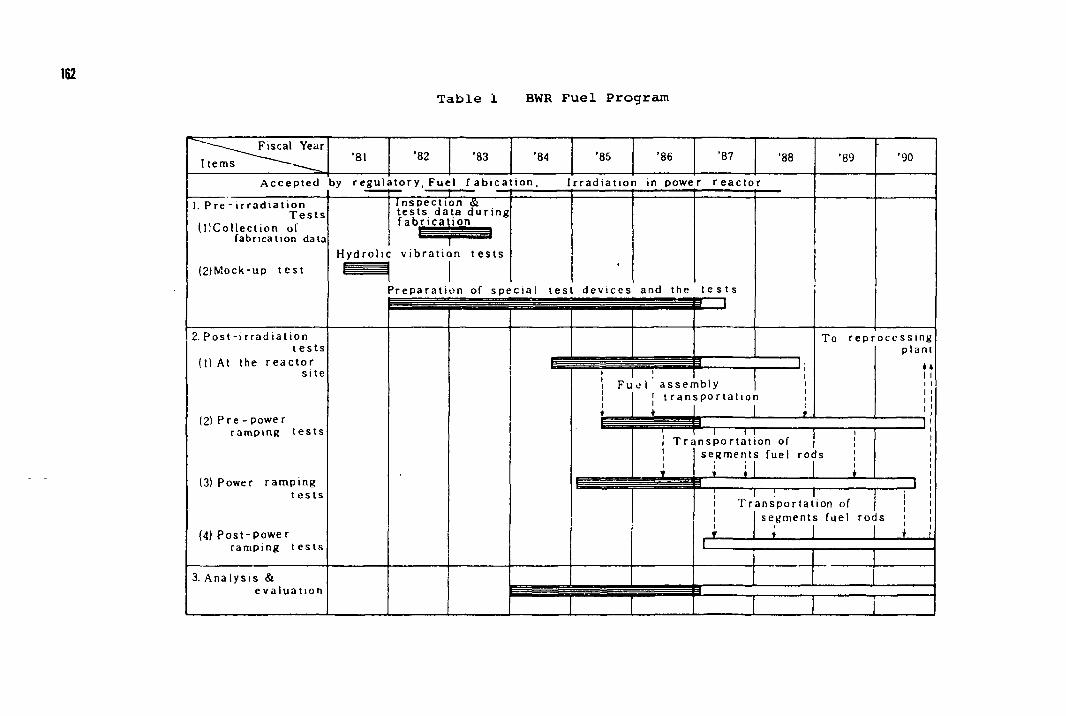
T a b l e 1 BWR F u e l P rogram
Fiscal Year I terns '81 •82 '83 "84 '85 '86 '87 '88 '89 '90
A c c e p t e d by r e g u l a t o r y , Fue l f a b i c a t i o n , I r r a d i a t i o n in power r e a c t o r I n s p e c t i o n & t e s t s da t a d u r i n g f a b r i c a t i o n
H y d r o l i c v i b r a t i o n t e s t s
1. P r e - i r r a d i a t i o n T e s t s
( l )Col lec t ion of fabrication data
(2)Mock-up t e s t P r e p a r a t i o n of s p e c i a l t e s t d e v i c e s and the t e s t s
— H Z ] 2. P o s t - i r r a d i a t i o n
t e s t s (1) At the r e a c t o r
s i t e
(2) P r e -power ramping t e s t s
(3) Power r a m p i n g t e s t s
(4) P o s t - P o w e r ramping t e s t s
3. A n a l y s i s & e v a l u a t i o n
F u e l a s s e m b l y [ t r a n s p o r t a t i o n
_i_
To r e p r o c e s s i n g plant
»4
T r a n s p o r t a t i o n of s e g m e n t s fuel rods
-JL _ i _
T r a n s p o r t a t i o n of |
( segmen t s fuel rods t I L_ J L
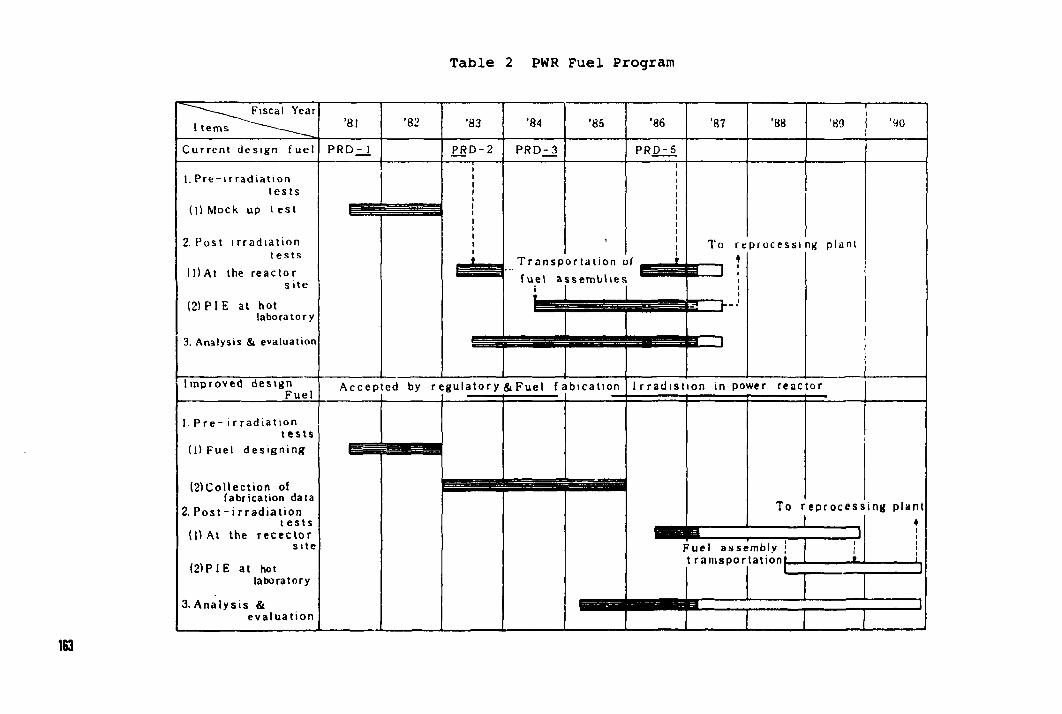
Table 2 PWR Fuel Program
Fiscal Year I terns '81 "82 '83 "84 '85 "86 '87 '88 '89 '90
Current design fuel PRD- 1 PRD-2 PRD-3 PRD-5
1. Pre-i r radiation t e s t s
i\) Mock up t est
2 .Post irradiation t e s t s
(1)At the reactor s ite
(2) PIE at hot laboratory
3. Analysis & evaluation
Improved des ign Fuel
Transporta t ion of fuel a s s e m b l i e s
i
To reprocess ing plant t
Accepted by r egulatory & Fuel fabicat ion Irrad i s t ion in power reactor
1. P r e - irradiation t e s t s
(1) Fuel des ign ing
(2)Collection of fabrication data
2. P o s t - i r r a d i a t i o n t e s t s
(I) At the reccc tor s i t e
(2)PIE at hot laboratory
3 .Analys i s & evaluat ion
To r e p r o c e s s i n g plant
Fuel assembly ; t rainsportationt.
CHAIRMEN AND ORGANIZING COMMITTEE
Meeting Chairman : Mr. F. BOULOT EDF / DER 6 Quai Watier B.P. 49 78401 CRATOU Cedex
Co-Chairmen : Mr. R. TRACCUCCI FRAGEMA (Framatome Division Combustible) 10 rue Juliette Recamier 69398 LYON Cedex 3 / FRANCE
Mr. J-F. MARIN CEA - CEN SACLAY 91191 GIF SUR YVETTE Cedex / FRANCE
Local Organising Committee : Mr. H. BELLAICHE
FRAGEMA (Framatome Division Combustible) 10 rue Juliette Recamier 69398 LYON Cedex 3 / FRANCE
Mr. C. LEMAIGNAN CEA - CEN / GRENOBLE 38041 GRENOBLE Cedex / FRANCE
Scientific Secretary : Mr. M NOE International Atomic Energy Agency Wagramerstrasse 5 P.O. Box 100 A-1400 VIENNA / AUSTRIA
LIST OF PARTICIPANTS
SSfcSIiffl
Mr. P. Hotta
Hi. N.A. Hollaaky
Mr. D. Hi««
Mr. C. Frani
Kr. Van dan Barg
CKN/SCK Boaratang 200 B-2400 Hoi
Association Vlncotta Avanua du Rol 157 B-1060 Bruiallas
Balgonuclaalra S.A. rua du Champ da M a n 25 B-10S0 Bruxallei
Dapartamant Inargla Nuclaalra da Tractabal Placa du Tr&na 1 B-1000 Bruxallai
Balgonuclailra S.A. rua du Chanp da H a n 25 B-10S0 Bruxallai
CAHADA Mr. T.J. Cartar
Hr. P.T. Truant
Atoalc Enargy of Canada Llaltad Chalk Rlvar Nuclaar Laboratorlaa Chalk Rlvar Ontario KOJ 1J0
Ontario Hydro Tachnlcal and Training Sarvlcai Dlvlilon 700 Unlvartlty Avanua Toronto, Ontario HS61X6
EKHMM Mr. P. Knudian Rlitf National Laboratory
Hatallurgy Dapartmant DK-4000 Rotkllda
rmuutp
Mr. S. Kelppe
Mr. J.V. Sandberg
PBAHCE
Mr. C.L. L uthrot
Mr. H.V. Viallet
Mr. C. Prlboulet
Ms. P. Lefebvre
Mr. C. Leataignan
Mr. T. Forgeron
Ms. G. Ceoffroy Ghlt»
Mr. P. Leaoine
Mr. J.P. Marin
Mr. M. Roche Mr. Royer
Mr. P. Bouffioux
Mr. P. Boulot
Technical Research Centra of Finland Vuorlalehentle S SP-02150 Espoo
Flnnlih Cantra for Radiation and Nuclaar Safaty Kalevankatu 44 SF-00181 Helsinki
Coaaissarlat 1 l'Energle Atoaique CEN-Cadaracha P-13108 St. Paul-laz-Durance a* above
Coaminariat a l'Energie Atoaique CEN-Crenoble F-38041 Granobla Cedes
as abova
as abova
Conaissariat a l'Energle Atoniqua CEN-Saclay F-91191 Gif-sur-Yvatta
as abova
as abova
as above
as above as above Electric U e de France/OSS 2, rue Louis Murat F-7S384 Paris Cedes 08 Electrlclte de France/SBPTBN 12-14, Avenue Dutrlevoi P-69628 Villeurbanne Cedes
Mr. B. Gautler as above
Mr. M. Grosgeorge
Mr. H. Bellalche
Mr. A. Duaont
Mr. J. Joseph
Mr. J-P Kardon
Mr. P. Helin
Mr. M. Morel
Mr. R. Traccucci
Electrlclte de Frenee/SSPTBK 12-14, Avenue Dutrlevot 69628 Villeurbanne Cedes
FRACEHA (FRAMATOHE Division Combustible) 10, rue Juliette Reeamler F-69006 Lyon
as above
as above
ts above
ai above
cfwwY, r p t m «fvgi«c or
Mr. R. von Jan
Mr. H. Knaab
Mr. Krug
Mr. F. Sondheliaer
Kraftwerk Union AG Hammerbacherstr, 12 • 14 D-8520 Erlangen
Kraftwerk Union AG Hammerbacherstr. 12 + 14 D-8520 Erlangen
Kernforschungsanlage Jlillch GabH Poatfach 1913 D-S170 Jilllch
Kraftwerk Union AG Haamarbacherstr. 12 + 14 D-8520 Brlangen
JAfAW Mr. S. Fuel Reliability Lab. Ill
Department of Fuel Safety Research JAERI 2-4 Shlrakata Shirans, Tokal-aiura Naka-gun, Ibarakl-kan 319-11
Mr. K. Ito
Mr. K. Morita
Nippon Nuclear Fuel Development Company Ltd. 2163 Narita-cho, Oarai-machi Higaihi, Ibaraki-Gun Ibaraki-ken 311-13
Nuclear Fuel Industries Ltd. 950 Node, Kumatorlcho, Sennangun. Osaka
Mr. If. Yamaguchi Mitsubishi Heavy Industries 1-4 Chibakouen 2 chroma Hinakotu 10S Tokyo
KOREA. REPUBLIC OF
Mr. Karp Soon Rheem Korea Advanced Energy Research Institute 11-402, Gong Dong Gwanrl Apt. Dorong Dong* Joong Gu Dae Jun
Mr. Younghwa Shin Korea Advanced Energy Research Institute P.O. Box 7, Daedukdanji Daejon 300-31
THE NETHERLANDS
Mr. A.R. Krahe Netherlands Energy Research Foundation ECN Westerduinweg 3 Petten 1755 2G The Netherlands
SWEDEN
Mr. M. Grounes
Mr. J. Mattson
Studsvik Energitaknlk AB S-611 82 Nykoping
Swedish Nuclear Power Inspectorate Box 27106 S-102 52 Stockholm
Mr. J. Hogard
Mr. M. Palmgren
Studsvik Energlteknlk AB S-611 82 Nykopln*
Southern Sweden Power Supply Box 524 S-240 21 Loddekopinge
SWITZERLAND
Mr. H.K. Kohl
Mr. R.W. Stratton
Swiss Federal Institute for Reactor Research CH-S303 Wu'renllngen
S'vtn Federal Institute for Reactor Research CH-5303 Wurenlingen
USSR
Mr. V.V. Novikov
Mr. V.N. Prosjolkov
State Committee on the Utilization of Atomic Energy Staromonetny pereulok 26 Moscow 109180
I.V. ri'":hatov Institute of Atomic Energy 42 Ulitsa Kurchatova P.O. Box 3402 123182 Moscow
USA Mr. M.G. Andrews
Mc. M.S. Hoppe
Mr. N. Kjaer- Pedersen
Mr. K.D. Sheppard
Combustion Engineering, Inc. 1000 Prospect Hill Road Windsor, CT 06095
Advanced Nuclear Fuels Corp. 2101 Horn Rapids Road Richland, WA 99352
STUDSVIK 2200 Davison Avenue Richland, WA 99352
The S.M. Stoller Corporation 1250 Broadway - 29th Floor New York, NY 10001
UK
Mr. E.D. Hindlc
Mr. D.A. Howl
Mr. D.A. Mac Innes
UKAEA Springfieids Laboratories Northern Division Salwick Preston, Lancashire PR4 OXJ
British Nuclear Fuel pic Springfieids Works Salwick Preston, Lancashire PSA OXJ
UKAEA Safety and Reliability Directorate Wigshaw Lane Culcheth Warrington WA2 ODW
CSC
Mr. K. Lassmann
Mr. D.J. Perry
European Institute for Transuranium Elements Karlsruhe Establishment Joint Research Centre Postfach 2266 Federal Republic of Germany
JRC Postbox 2 17SSZG Petten The Netherlands
Mr. I.A. Ruytei JRC Postboz 2 1755ZG Petten The Netherlands
167

88-02093