poverty in edwardian britain
TRANSCRIPT
Poverty in Edwardian Britain1
By IAN GAZELEY and ANDREW NEWELL
This article introduces a newly discovered household budget data set for 1904. Weuse these data to estimate urban poverty among working families in the British Isles.Applying Bowley’s poverty line, we estimate that at least 23 per cent of people inurban working households and 18 per cent of working households had incomeinsufficient to meet minimum needs. This is well above Rowntree’s estimate ofprimary poverty forYork in 1899 and high in the range that Bowley found in northerntowns in 1912–13.The skill gradient of poverty is steep; for instance, among labour-ers’ households, the poverty rates are close to 50 per cent. Measures of the depth ofpoverty are relatively low in the data, suggesting that most poor male-headed workinghouseholds were close to meeting Bowley’s new standard.ehr_523 52..71
According to Feinstein, ‘The first clear indication that something had occurredto interrupt the onward march of Victorian prosperity emerged early in the
twentieth century’.2 Contemporary estimates of money wages and prices indicateda slowing down, or modest decline, in real wages in the years following the tradecycle peak of 1899.3 This decline in real wages seemed to provide an explanationfor the widespread increase in industrial unrest that affected a range of importantindustries in the decade or so preceding the FirstWorldWar.4 These concerns werefuelled by the well-publicized results of poverty investigations carried out bypioneer social investigators and the revelation that a substantial proportion of menwho volunteered for the army during the South African War (1899–1902) wererejected as unfit to serve.5 As a consequence, the government appointed anInter-Departmental Committee on Physical Deterioration to investigate the healthand physique of working people. In 1904 the Report of this Committee concludedthat although the case for physical deterioration was not proven, standards ofworking-class nutrition and hygiene gave cause for concern.6 As the productivitygap between Britain and its economic rivals was perceived to narrow, and thethreat of war with Germany increased, the Edwardian campaign for ‘nationalefficiency’ chimed with the language adopted by Rowntree in his famous studies of
1 The data that are discussed in this article were found by the Archivist of the Library of the University ofBangor, Mr E.W.Thomas, in response to our questions about another of his holdings.We thank him and his teamfor all their help with this project. We also thank Gemma Mills and Theresa Jennings for invaluable researchassistance and the Nuffield Foundation for their Social Science Small Grant SGS/1220, which funded thetranslation of the data into spreadsheet form.
2 Feinstein, ‘What really happened to real wages?’, p. 329.3 Feinstein’s own work suggests a somewhat different pattern of real wage growth than that provided by Arthur
Bowley and George Wood at the time. Feinstein’s estimates suggest that real wages were growing less stronglythan had been thought in the lateVictorian period, but growing modestly, rather than declining, in the Edwardianperiod. Thus, Feinstein calculates that real wages were growing 1.58% per annum in the period 1882–99 and0.29% per annum in the period 1899–1913; ibid., tab. 4, p. 344.
4 Ibid., p. 329.5 Of the 20,000 recruits, only 14,000 were considered sufficiently fit to join. See Bourke, Dismembering the male,
pp. 13–14.6 Report of the Inter-Departmental Committee (P.P. 1904, XXXII), p. v, and ibid., pt. I, p. 1, para. 5.
Economic History Review, 64, 1 (2011), pp. 52–71
© Economic History Society 2010. Published by Blackwell Publishing, 9600 Garsington Road, Oxford OX4 2DQ, UK and 350 MainStreet, Malden, MA 02148, USA.
poverty in York in 1899, in which he claimed that substantial sections of theworking class lacked the means to maintain ‘bare physical efficiency’.7This enquirywas followed by a number of similar studies that found high levels of abject povertyin other parts of the British Isles.
What is known about the extent of poverty across urban Britain at the turn of thetwentieth century? On the face of it, the well-known results of Charles Booth’sLondon enquiry of 1886–9 and Seebohm Rowntree’s 1899–1900 study of Yorkprovided suggestively similar estimates of poverty.8 However, Bowley and Burnett-Hurst’s 1912–13 research in northern towns showed significant local variation.Their poverty rates varied between 4.5 per cent of the population of Stanley and19 per cent in Reading.9 Even before the publication of Bowley’s work, contem-porary analysis of Rowntree and Booth’s results showed that their similarity wassuperficial. MacGregor pointed out that inference on the national picture fromthese local enquiries was rendered highly imprecise because the poverty lines hadnot been formulated in the same way.10 Using the published data of the twoenquiries, MacGregor estimated how much of Booth’s poverty there was in Yorkand how much of Rowntree’s poverty there was in London. He concluded thatthere was 3 per cent poverty in York using Booth’s standard and 50 per centpoverty in London using Rowntree’s standard.11
Despite a lack of uniformity in the extent of measured poverty, contemporaryenquiries revealed marked similarity in the analysis of the economic causes ofpoverty.12 Bowley attributed the principal cause of poverty to low wages (relative tothe size of the family), followed by death of the main wage-earner, sickness, andold age.13 Similar conclusions had been reached by Rowntree, who reckoned thatlow wages were the immediate cause of poverty in the majority of cases ofhouseholds he classified as being in primary poverty (51.96 per cent), followed bylargeness of family (22.16 per cent), death of a wage earner (15.63 per cent),illness or old age of a wage-earner (5.11 per cent), and unemployment andirregular employment (5.14 per cent).14 Moreover, it was Rowntree’s enduringinsight that household income varied systematically with life-cycle stage, withpoverty being more likely in childhood, in early middle life when there were smallchildren in the family, and again in old age.15
The low importance assigned to unemployment and irregular employment isdue to the timing of Rowntree’s enquiry.York was a prosperous market town and
7 Rowntree, Poverty, p. 133.8 Booth found just over 30% of the population in poverty in London. Rowntree has a number of measures of
poverty. His total poverty estimate for the population ofYork was about 27%. Booth, Life and labour, vol. 1, tab. 1,pp. 34–5, gives a figure of 35.24% of the population of East London in the ‘Very Poor’ and ‘Poor’ classes. Theproportion in these two classes in the whole of London was less than this. In Booth, Life and labour . . . notes(1903), vol. XVII, p. 9, Booth gives the overall proportions for London as 8.4% ‘Very Poor’ and 22.3% ‘Poor’,giving a figure of 30.7% overall.
9 Bowley and Burnett-Hurst, Livelihood and poverty, pp. 38–9, 42–3.10 MacGregor, ‘Poverty figures’, p. 570.11 Ibid., p. 572.12 With the notable exception of Bowley, most investigators of this period also attribute poverty to ‘bad
character’ or ‘fecklessness’ in varying degrees (see Gazeley, Poverty in Britain, pp. 34–64, for a review).13 Bowley and Burnett-Hurst, Livelihood and poverty, tab. IX, p. 40.14 Rowntree, Poverty, p. 121.15 Ibid., p. 137.
POVERTY IN EDWARDIAN BRITAIN 53
© Economic History Society 2010 Economic History Review, 64, 1 (2011)
the survey was undertaken at the top of the trade cycle.16 Southall has shown thatin regions dominated by staple industries, unemployment varied counter-cyclically, so it seems likely that it would have a greater causal role in townsdominated by export industries and at different points of the trade cycle.17 Indeed,Rowntree and Lasker’s study of unemployment in York in 1908, a recession year,revealed that it was an important cause of primary poverty.18
These early social investigators employed a measure of absolute poverty basedupon minimum needs and it is this concept, rather than relative poverty, based onthe shape of the size distribution of income, that we are interested in here.19 As wewill discuss in section I, Booth, Rowntree, and Bowley were all aiming to define thepoor as those living in extreme hardship. This article estimates absolute povertyincidence among working households in the British Isles using a newly discoveredset of data for just over 1,000 working-class families in 1904 and compares thesefindings with those of the early social investigators.
The original enquiry, involving nearly 2,000 working-class families, was carriedout by the Labour Department of the Board of Trade. The summary results andanalysis of this enquiry were published in British Parliamentary Papers in 1905.20
This was the first large-scale official national survey of household expenditures inBritain and was the largest single enquiry of the late Victorian and Edwardianperiod. Prior to this, the Board of Trade had collected household budgets from36 working men in 1887 and 286 households in 1903.21 The only other large-scale expenditure survey carried out before the First World War was that con-ducted by the US Commissioner of Labor in 1890–1, but that survey was ofskilled workers in export trades and contains relatively few poor households.22
The summary results of the 1904 survey have been widely cited by both con-temporaries and historians working on a range of issues, varying from nutritionalattainment and the physical deterioration debate to the derivation of appropriateexpenditure weights for the construction of a cost-of-living index for working-class households.23
Until now it has been assumed that the original returns of this enquiry had beendestroyed. In fact, a significant sub-sample is extant and we provide an introduc-tion to these data in section II and compare summary statistics from them with thepublished summary statistics from the full survey.24 Section III uses these new datato investigate the incidence of poverty, using poverty lines devised by Booth,
16 Briggs, Social thought, p. 25.17 Southall, ‘Origins’.18 Rowntree and Lasker, Unemployment, pp. 61–8.19 We recognize that all measures of poverty, including minimum needs standards, are socially determined to
varying degrees.20 Consumption and the Cost of Food (P.P. 1905, LXXXIV).21 Returns of Expenditure by Working Men (P.P. 1889, LXXXIV); Consumption of Food and Cost of Living (P.P.
1903, LXVII).22 Sixth annual report; Seventh annual report.23 See, for example, Oddy, ‘Nutritional analysis’; Williamson, Did British capitalism breed inequality?, app. A,
pp. 207–23; Feinstein, ‘New look’, pp. 151–79.24 The extant budgets are at Archives and Special Collections, University of Wales, Bangor (Bangor General
Collection boxes 26413–26418.).The budgets were earmarked for destruction by the Public Records Office, butwere reprieved as a result of a request by Frank Price Jones, who was editor of the Transactions of the DenbighshireHistorical Society at the time. The Ministry of Labour sent the budgets to Jones in Oct. 1962 (see TNA, LAB17/231 ‘Expenditure Enquiries Retention and Destruction’).
54 IAN GAZELEY AND ANDREW NEWELL
© Economic History Society 2010 Economic History Review, 64, 1 (2011)
Rowntree, and Bowley. Section IV takes the survey results on poverty and adjuststhem to make them nationally representative. Employing these data, but adjustingthem by the 1906 Earning Enquiry’s wage distribution for adult men, our bestestimate of absolute poverty in urban Britain in 1904 using Bowley’s poverty lineis about 18 per cent of working households. Our key finding is that poverty waswell above Rowntree’s estimate for York and in the upper part of the range thatBowley found in northern towns before the FirstWorldWar.This major revision isdue to the inclusion in our calculations of lower wage regions, such as Scotland,Ireland, and the south of England. Not surprisingly, skill and poverty are stronglyinversely related, so that poverty is concentrated among the unskilled, but thegradient of this relationship is very steep. For instance, poverty rates for labourers’households are around 50 per cent. Lastly, we find a very low depth of poverty,given poverty incidence, which demonstrates that most poor male-headed workinghouseholds were close to Bowley’s poverty line.
I
Booth is generally credited as being the first British investigator to use a povertyline that compared household income with the cost of a minimum needs basketof goods. For Booth, the minimum needs of households varied due to differencesin household structure. The minimum income necessary to meet his poverty linewas between 18s. and 21s. per week. According to Booth’s classification of house-holds in London, all those that he defined as ‘very poor’ or ‘poor’ did not havesufficient income to meet his minimum needs standards and were therefore inpoverty.25 He defined the poor as those households ‘whose means may be suffi-cient, but barely sufficient, for decent independent life’ and the very poor as ‘thosewhose means are insufficient for this according to the usual standard of life in thecountry’. He went on to describe the poor as ‘living under a struggle to obtain thenecessities of life and make both ends meet’, in contrast to the very poor who ‘livein a state of chronic want’.26 Booth believed that he had uncovered in Londonevidence of lives ‘cursed by drink, brutality and vice, and loaded down withignorance and poverty’.27
A decade or so later Rowntree found that 27.8 per cent of the population ofYorkwas in total poverty. This included all those families ‘whose total earnings areinsufficient to obtain the minimum necessities for the maintenance of merelyphysical efficiency’ and families ‘whose total earnings would be sufficient for themaintenance of merely physical efficiency were it not that some portion of it isabsorbed by other expenditures, either useful or wasteful’.28 Rowntree termedthese categories primary poverty and secondary poverty.29 These accounted for9.91 per cent and 17.93 per cent of the population of York, respectively.30 Totalpoverty was evaluated on the basis of Rowntree’s assessment of the circumstancesof families derived from his house-to-house survey of all working-class households.
25 Booth, Life and labour, vol. 1, p. 62.26 Ibid., vol. 1, p. 33.27 Booth, Life and labour . . . notes, vol. XVII, p. 200.28 Rowntree, Poverty, pp. 86–7.29 Secondary poverty was not measured directly, but the result of subtraction (total poverty minus primary
poverty).30 Rowntree, Poverty, pp. 111, 117.
POVERTY IN EDWARDIAN BRITAIN 55
© Economic History Society 2010 Economic History Review, 64, 1 (2011)
It was an impressionistic measure that relied upon investigators noting evidence of‘obvious want and squalor’, intemperance, or thriftlessness.31 Primary poverty wasmeasured similarly to Booth’s poverty, by defining a set of minimum needs andthen comparing household income to this poverty line. Like Booth, his definitionof minimum needs varied according to household structure. Rowntree’s descrip-tion of what ‘merely physical efficiency’ meant leaves no room for doubt about theseverity of his primary poverty standard:
A family living upon the scale allowed for in this estimate must never spend a penny onrailway fare or omnibus. They must never go into the country unless they walk. Theymust never purchase a halfpenny newspaper or spend a penny to buy a ticket for apopular concert.They must write no letters to absent children, for they cannot afford topay the postage.They must never contribute anything to their church or chapel, or giveany help to a neighbour which costs money. They cannot save, nor can they join a sickclub orTrade Union, because they cannot pay the necessary subscriptions.The childrenmust have no pocket money for dolls, marbles or sweets. The father must smoke notobacco, and must drink no beer. The mother must never buy any pretty clothes forherself or for her children, the character of the family wardrobe as for the family dietbeing governed by the regulation, ‘nothing must be bought but that which is absolutelynecessary for the maintenance of physical health, and what is bought must be of theplainest and most economical description’. Should a child fall ill, it must be attended bythe parish doctor; should it die, it must be buried by the parish. Finally, the wage-earnermust never be absent from his work for a single day.32
Bowley modified Rowntree’s primary poverty measure in his analysis of povertyamong northern towns just before the First World War. Bowley believed thatRowntree’s standard was too harsh, as it included no allowance for the consump-tion of meat in the diet. Bowley’s new standard also revised Rowntree’s standardby adjusting for price changes between 1899 and 1912 and revising the relativecosts of children, whom Bowley believed Rowntree had treated too generously.33
The net result of these changes is to make Bowley’s poverty line more generous forsmall families, but harsher than Rowntree’s for larger families. When analysingpoverty in the new 1904 data set, we initially employ all three poverty lines, butthen concentrate on Bowley’s new standard since it stands as the culmination ofthese early studies.34
II
In 1903 the Board of Trade conducted an enquiry into the consumption and costof food to working-class families in certain urban districts of Great Britain.35 The
31 Rowntree, Poverty, pp. 116–17. See also Williams, From pauperism to poverty, pp. 345–68, and Veit-Wilson,‘Paradigms of poverty’, for a discussion of the treatment of Rowntree’s concepts of poverty in the secondaryliterature.
32 Rowntree, Poverty, pp. 133–4.33 See also Gazeley and Newell, ‘Rowntree revisited’, pp. 174–88.34 Bowley and Burnett-Hurst, Livelihood, pp. 79–84.35 The published report of this survey provides details of the consumption of food of 114 agricultural labourers’
families collected by Wilson Fox in 1902. Only mean quantities of food consumed each week are given. Inaddition, the Labour Department of the Board of Trade undertook a survey of about 400 urban working familiesin 1903. Of these families, 268 provided returns, 88 of which were sufficiently detailed to provide for the analysisof food expenditures. Sixty-eight of these were from London and the suburbs. Consumption of Food and the Costof Living (P.P. 1903, LXVII), pp. 212–14.
56 IAN GAZELEY AND ANDREW NEWELL
© Economic History Society 2010 Economic History Review, 64, 1 (2011)
results of this enquiry were published as Consumption of Food and Cost of Living(P.P. 1903, LXVII), but many of the returns for urban districts were incompleteand London was over-sampled.36 The 1904 enquiry was designed to rectify thesedeficiencies. For this enquiry, details of income, rent, and items of food expendi-ture were collected from workmen and their families for one week during July-–September 1904, from all parts of the British Isles, including southern Ireland. Intotal 2,283 returns were collected via workmen’s organizations, cooperative soci-eties, and individuals, who in some cases were asked to obtain information from‘fellow-workmen’.37 This makes the sample anything but random. It cannot beassumed to be representative of the urban population.
Most of the original survey returns were attributed to named investigators,among whom Clara Collet is the best known.38 Since the intention was to estimateworking men’s families’ cost of living, these investigators did not try to collectsamples that represented the full range of incomes among working households.Wefind Collet’s sample of households has an average poverty incidence. For Glasgow,Mr Burgess collected the vast majority of survey returns. In contrast to Collet, heinterviewed only three families that we categorize as poor. Mr Mallinson, whocollected most of the records from households in Edinburgh, had a similar samplewith low poverty incidence, as did Mr Richardson, who collected returns inDublin.
The results of the 1904 enquiry were published in 1905 under the headingConsumption and the Cost of Food in Workmen’s Families in Urban Districts in theUnited Kingdom (hereafter CCF).39 The enquiry made use of a fixed formatquestionnaire. The forms provide information on locality (often given very pre-cisely); number and age of children; occupation of the head of household; house-hold weekly income, including earnings of the head of household and averageadditional weekly family income; weekly house rent; and number of rooms occu-pied. Fully half the questionnaire is concerned with expenditure on and quantityof food consumed by the family, but no details of non-food expenditures wererequested other than rent.40
36 Consumption and the Cost of Food inWorkmen’s Families (P.P. 1905, LXXXIV), p. 3.37 Ibid., p. 3.38 Collet had previously been an Assistant Commissioner to the Royal Commission on Labour in 1892 and had
worked for the Board of Trade since 1893. She was to become heavily involved in the 1906 Wage Census. Colletis the named investigator on 110 of the extant returns from the 1904 Board of Trade enquiry (mainly fromIreland). Of the other named investigators that accounted for more than five returns, 186 were carried out by MrBurgess, 110 by Mr Johnston, 57 by Mr Mallinson, 38 by G. L. Richardson, 35 by Mr Mann, 36 by Mr Tyler(several in conjunction with those previously named), 15 by Mr Kay, 12 by Mr T. Smith, 10 by Mr Cleverley, 8byW. Gillett, 8 by Mr Millington, and 7 by MrWhite Deacon. Full names are rarely recorded, so it is not possibleto identify these individuals.
39 Consumption and the Cost of Food (P.P. 1905, LXXXIV). Of the 2,283 returns, 1,808 were considered usable.These were combined with 136 returns collected from London and the surrounding suburbs during the 1903enquiry.
40 The original returns reveal that other useful expenditure information was recorded, though not alwayssystematically. Several respondents used the comment space on the form to provide valuable qualitative descrip-tions of working-class life at the beginning of the century. These comments often also contain quantitativeexpenditure information relating to non-food items, particularly expenditure on fuel and lighting. Some familiesalso use the comments section to record their total family expenditure. As importantly, a number of respondentsdiscuss the extent to which family members living outside the home were supported, while others note the extentto which households were able to supplement their diets with produce from gardens and allotments. Anothertopic that is frequently commented upon is the difficulty of making ends meet. We intend to document andpublish these comments separately.
POVERTY IN EDWARDIAN BRITAIN 57
© Economic History Society 2010 Economic History Review, 64, 1 (2011)
These data were used extensively at the time. For instance, the Labour Depart-ment of the Board of Trade used the returns to derive expenditure weights for thefood component of their official cost-of-living index.41 Bowley’s own cost-of-livingindex is also based upon expenditure weights derived from CCF, taken in con-junction with information from other contemporaneous sources.42
Hereafter the recovered returns from the survey will be referred to as the BoTRsurvey. The full BoTR sample consists of 1,033 returns, but this is not a simplesub-sample of the 1,944 used in CCF. It contains, as far as we can tell, most of theScottish and Irish returns, as well as 37 from Wales. It also contains a relativelysmall number of English returns. A subset of the returns that we have found wereannotated by Board of Trade officials, most commonly as either ‘late’ or ‘reject’and, occasionally, corrections have been made to the recorded details for incomeor rent.We have no evidence on whether these annotated returns were used for theanalysis in CCF. Many of the returns marked ‘reject’ by the Board of Trade areuseable in various ways. The Board of Trade was only interested in returns thatgave detailed breakdowns of food expenditures and quantities of food itemspurchased. The set of rejected returns contains a range of responses, from a verysmall number who did not engage at all, to people who aggregated some expen-ditures, or gave expenditure details without reporting quantities purchased.
Table 1 illustrates the strong presence of returns from Scotland and Ireland inthe BoTR sample relative to the original. The fifth and sixth columns give theregional distribution of what we call the useable BoTR sample.These are selectedon the basis of having reliable income and total food expenditure data. In particu-lar, we only included cases with zero head of household income if the head wasreported as not working. We also only include cases where total food expenditureis at least remotely plausible given family structure and income.
Table 2 gives numbers of children and food expenditures by income group.Theuseable BoTR sample has slightly more children per household and slightly higher
41 Cost of Living of theWorking Classes (P.P. 1912/13, LXVI), pp. 299–303.42 Bowley, Wages and income, pp. 119–21.
Table 1. Regional distributions of households
As used inConsumption andthe Cost of Food
(P.P. 1905,LXXXIV)
Full BoTRsample
Useable BoTRsample
No. % No. % No. %
North of England 439 22.6 142 13.7 123 12.4Midlands 262 13.5 90 8.7 82 8.3London and suburbs 347 17.8 40 3.9 41 4.1Rest of England and Wales 318 16.4 113 10.9 106 10.7Scotland 455 23.4 502 48.6 501 50.6Ireland 123 6.3 138 13.4 132 13.3Region not given 8 0.8 5 0.5Total 1,944 100 1,033 100 990 100
Sources: Consumption and the Cost of Food inWorkmen’s Families (P.P. 1905, LXXXIV), p. 5, and calculated by authors from BoTRdata.
58 IAN GAZELEY AND ANDREW NEWELL
© Economic History Society 2010 Economic History Review, 64, 1 (2011)
average food expenditure.43 Overall, the households in the BoTR sample have anaverage of 3.8 children. This compares with the average figure of 3.4 childrenquoted by Cox, for all marriages started in the period 1900–9.The larger (uncom-pleted) family size evident in the BoTR data is almost certainly explained byhigher working-class fertility, compared to the national average, and the inclusionof Ireland in the BoTR data.44
The weekly household income distributions of CCF (P.P. 1905, LXXXIV) andthe useable BoTR samples are compared in Table 3.The BoTR sample has a fewmore families in both extremes of the distribution, but otherwise the matchbetween the two samples is very close. We will compare our sample with thepopulation income distribution in section IV.
43 In order to explore the extent of the biases in the BoTR sample, compared with the published returns, wemade careful comparison with the subset of budgets for Scotland.The Scottish BoTR sample is not identical tothat used in Consumption and the Cost of Food (P.P. 1905, LXXXIV). From the 501 usable BoTR budgets forScotland, we filtered out those that were marked as rejected or received late. After this 454 budgets remained,compared with 455 in Consumption and the Cost of Food (P.P. 1905, LXXXIV). Despite the closeness in the totalnumber of budgets, some small differences remain between Consumption and the Cost of Food (P.P. 1905,LXXXIV) and the filtered BoTR samples for Scotland.
44 Cox, Demography, tab. 6.2, p. 89.
Table 2. Number of children and weekly food expenditure by income class
Income in shillings
As used inConsumption andthe Cost of Food
(P.P. 1905, LXXXIV) Useable BoTR sample
Average no.of children
Total foodexpenditure (pence)
No. ofchildren
Total foodexpenditure (pence)
<25 s. 3.1 172.75 3.4 187.5925 s. and <30 s. 3.3 214.25 3.5 222.1630 s. and <35 s. 3.2 249.25 3.5 255.7335 s. and <40 s. 3.4 267.5 3.4 270.22Over 40 s. 4.4 356.0 4.6 376.40Total 3.6 270.0 3.8 280.98
Source: As for tab. 1.
Table 3. Distributions of families by income
Income in shillings
As used inConsumption andthe Cost of Food
(P.P. 1905, LXXXIV)Useable BoTR
sample
No. % No. %
<25 s. 261 13.4 152 15.425 s. and <30 s. 289 14.8 143 14.430 s. and <35 s. 416 21.4 210 21.235 s. and <40 s. 382 19.7 173 17.5over 40 s. 596 30.6 312 31.5Total 1,944 100 990 100
Source: As for tab. 1.
POVERTY IN EDWARDIAN BRITAIN 59
© Economic History Society 2010 Economic History Review, 64, 1 (2011)
III
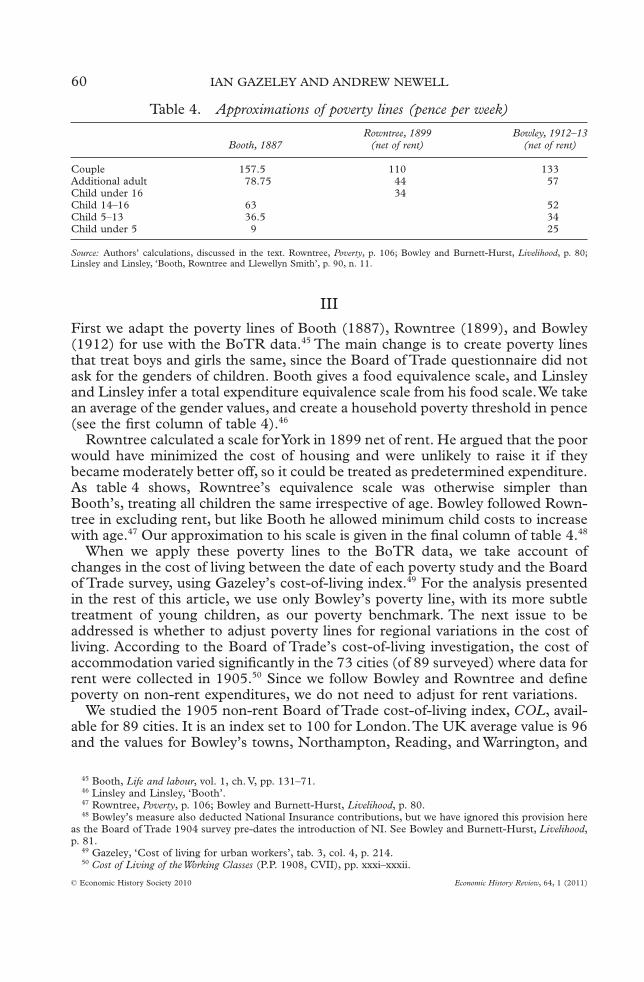
First we adapt the poverty lines of Booth (1887), Rowntree (1899), and Bowley(1912) for use with the BoTR data.45 The main change is to create poverty linesthat treat boys and girls the same, since the Board of Trade questionnaire did notask for the genders of children. Booth gives a food equivalence scale, and Linsleyand Linsley infer a total expenditure equivalence scale from his food scale.We takean average of the gender values, and create a household poverty threshold in pence(see the first column of table 4).46
Rowntree calculated a scale forYork in 1899 net of rent. He argued that the poorwould have minimized the cost of housing and were unlikely to raise it if theybecame moderately better off, so it could be treated as predetermined expenditure.As table 4 shows, Rowntree’s equivalence scale was otherwise simpler thanBooth’s, treating all children the same irrespective of age. Bowley followed Rown-tree in excluding rent, but like Booth he allowed minimum child costs to increasewith age.47 Our approximation to his scale is given in the final column of table 4.48
When we apply these poverty lines to the BoTR data, we take account ofchanges in the cost of living between the date of each poverty study and the Boardof Trade survey, using Gazeley’s cost-of-living index.49 For the analysis presentedin the rest of this article, we use only Bowley’s poverty line, with its more subtletreatment of young children, as our poverty benchmark. The next issue to beaddressed is whether to adjust poverty lines for regional variations in the cost ofliving. According to the Board of Trade’s cost-of-living investigation, the cost ofaccommodation varied significantly in the 73 cities (of 89 surveyed) where data forrent were collected in 1905.50 Since we follow Bowley and Rowntree and definepoverty on non-rent expenditures, we do not need to adjust for rent variations.
We studied the 1905 non-rent Board of Trade cost-of-living index, COL, avail-able for 89 cities. It is an index set to 100 for London.The UK average value is 96and the values for Bowley’s towns, Northampton, Reading, and Warrington, and
45 Booth, Life and labour, vol. 1, ch. V, pp. 131–71.46 Linsley and Linsley, ‘Booth’.47 Rowntree, Poverty, p. 106; Bowley and Burnett-Hurst, Livelihood, p. 80.48 Bowley’s measure also deducted National Insurance contributions, but we have ignored this provision here
as the Board of Trade 1904 survey pre-dates the introduction of NI. See Bowley and Burnett-Hurst, Livelihood,p. 81.
49 Gazeley, ‘Cost of living for urban workers’, tab. 3, col. 4, p. 214.50 Cost of Living of theWorking Classes (P.P. 1908, CVII), pp. xxxi–xxxii.
Table 4. Approximations of poverty lines (pence per week)
Booth, 1887Rowntree, 1899
(net of rent)Bowley, 1912–13
(net of rent)
Couple 157.5 110 133Additional adult 78.75 44 57Child under 16 34Child 14–16 63 52Child 5–13 36.5 34Child under 5 9 25
Source: Authors’ calculations, discussed in the text. Rowntree, Poverty, p. 106; Bowley and Burnett-Hurst, Livelihood, p. 80;Linsley and Linsley, ‘Booth, Rowntree and Llewellyn Smith’, p. 90, n. 11.
60 IAN GAZELEY AND ANDREW NEWELL
© Economic History Society 2010 Economic History Review, 64, 1 (2011)
Rowntree’s York are 95, 101, 92, and 96, respectively.51 Thus it turns out thatRowntree picked a city with a UK average level of prices. While there is somevariation in the price levels of Bowley’s chosen towns, they are within a standarddeviation of the UK mean.52 However, there is systematic regional variation. Toshow this, a regression of log COL on a set of regional dummy variables producesthe following result:
Log COL constant 0.06Scotland 0.05south 0.05Lancs5.3 5.2
= + + − −( ) (( ) ( )
+( )
=
5.20.04midlands error
3.9Adj. R standard error 2 0 59. , oof the equation N
t-statistics in brackets .= =(
)0 03 89. , ,
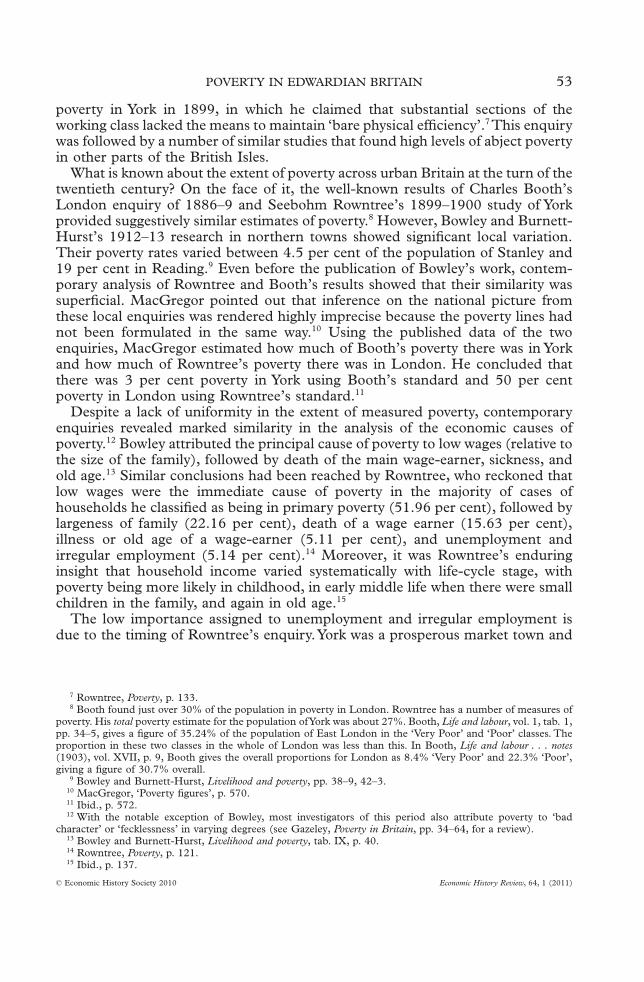
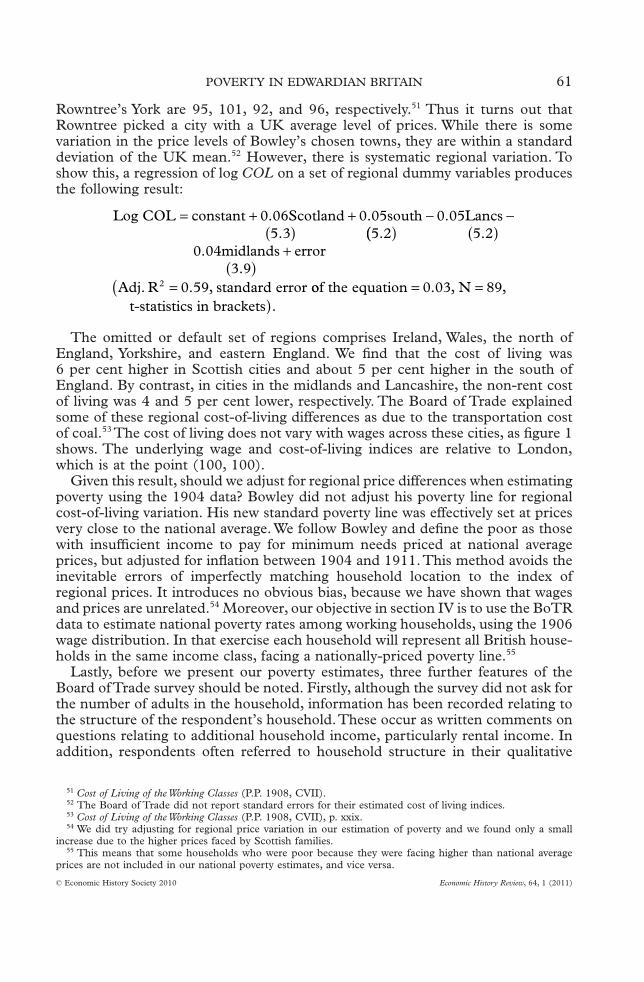
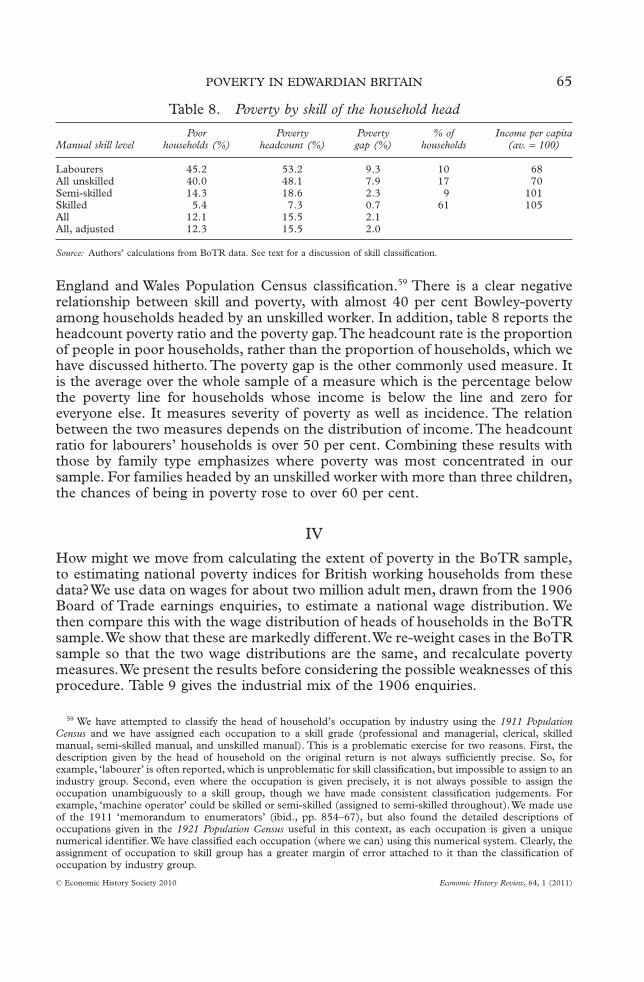
The omitted or default set of regions comprises Ireland, Wales, the north ofEngland, Yorkshire, and eastern England. We find that the cost of living was6 per cent higher in Scottish cities and about 5 per cent higher in the south ofEngland. By contrast, in cities in the midlands and Lancashire, the non-rent costof living was 4 and 5 per cent lower, respectively. The Board of Trade explainedsome of these regional cost-of-living differences as due to the transportation costof coal.53 The cost of living does not vary with wages across these cities, as figure 1shows. The underlying wage and cost-of-living indices are relative to London,which is at the point (100, 100).
Given this result, should we adjust for regional price differences when estimatingpoverty using the 1904 data? Bowley did not adjust his poverty line for regionalcost-of-living variation. His new standard poverty line was effectively set at pricesvery close to the national average. We follow Bowley and define the poor as thosewith insufficient income to pay for minimum needs priced at national averageprices, but adjusted for inflation between 1904 and 1911.This method avoids theinevitable errors of imperfectly matching household location to the index ofregional prices. It introduces no obvious bias, because we have shown that wagesand prices are unrelated.54 Moreover, our objective in section IV is to use the BoTRdata to estimate national poverty rates among working households, using the 1906wage distribution. In that exercise each household will represent all British house-holds in the same income class, facing a nationally-priced poverty line.55
Lastly, before we present our poverty estimates, three further features of theBoard ofTrade survey should be noted. Firstly, although the survey did not ask forthe number of adults in the household, information has been recorded relating tothe structure of the respondent’s household.These occur as written comments onquestions relating to additional household income, particularly rental income. Inaddition, respondents often referred to household structure in their qualitative
51 Cost of Living of theWorking Classes (P.P. 1908, CVII).52 The Board of Trade did not report standard errors for their estimated cost of living indices.53 Cost of Living of theWorking Classes (P.P. 1908, CVII), p. xxix.54 We did try adjusting for regional price variation in our estimation of poverty and we found only a small
increase due to the higher prices faced by Scottish families.55 This means that some households who were poor because they were facing higher than national average
prices are not included in our national poverty estimates, and vice versa.
POVERTY IN EDWARDIAN BRITAIN 61
© Economic History Society 2010 Economic History Review, 64, 1 (2011)
comments at the end of the enquiry form. We have carefully extracted this infor-mation and adjusted our estimated household size to reflect lodgers (but only ifboarding with the family), widows/widowers, spouses, and children boarding awayfrom home. Almost all respondents with children listed their ages, so adult (aged16 or over) children can be accounted for.We estimate the number of adults as twoplus adult children and the other recorded amendments, as listed above.56 Itremains possible that the number of adults is under-recorded for some cases, butgiven the diligence of respondents on other issues, we think it unlikely that this isa serious problem. The second notable issue is the definition of income. Thequestionnaire asks for average weekly earnings of the head of household and foraverage weekly earnings from other sources.57 We have no information on how theword ‘average’ was to be interpreted, but most respondents clearly understoodthey should report their regular earnings.Thirdly, the questionnaire was designed
56 Within the BoTR sample there are 31 cases where the household head recorded an additional adult present,in the form of a lodger or other family member. There are only 11 recorded single-headed households. Weestimate mean household size by skill as follows: unskilled, 5.1; semi-skilled, 4.6; skilled, 4.8; clerical 5.2. Weassigned skill on the basis of recorded occupation.
57 The sources of additional income are not recorded. Additional income was reported by 44.4% of households.
Waterford
Londonderry
Limerick
Dublin
Cork
Belfast
Perth
Paisley
Kilmarnock
Greenock
Glasgow
Galashiels
Falkirk
Edinburgh
Dundee
Aberdeen
York
WolverhamptonWigan
Warrington
Walsall
Taunton
Swindon
Stoke
Stockton
Stockport
South Shields
Southampton
Sheffield
Sheerness
Rochdale
Reading
Preston
Portsmouth
Plymouth
PeterboroughOldham
Nottingham
Norwich
Northampton
NormantonNewport
Newcastle
Middlesbrough
Merthyr
Manchester
Macclesfield
Luton
London
Liverpool
Lincoln
LeicesterLeedsKidderminster
Keighley
Jarrow
Ipswich
Hull
Huddersfield
Hanley
Halifax
GrimsbyGloucester
Gateshead
Dover
Derby
Darlington
Croydon
Crewe
Coventry
Chester
Chatham
Castleford
Carlisle
Cardiff
Burton
BurnleyBristol
Bradford
BoltonBlackburn
Birmingham
Bedford Barrow
Building labourer's weekly wage index
101
96938986838076696148
Cos
t of
livi
ng in
dex
106
103
100
97
94
91
88
Figure 1. Wages and the cost of living in 89 British cities in 1905Source: Derived from Cost of Living of theWorking Classes (P.P. 1908, CVII), tab. E, pp. l–lii.
62 IAN GAZELEY AND ANDREW NEWELL
© Economic History Society 2010 Economic History Review, 64, 1 (2011)
for households headed by men. Only a handful of households in the sample wereheaded by women. Since female-headed households were very likely to have beenpoorer on average than male-headed households, this sampling bias will lower ourestimates of poverty.
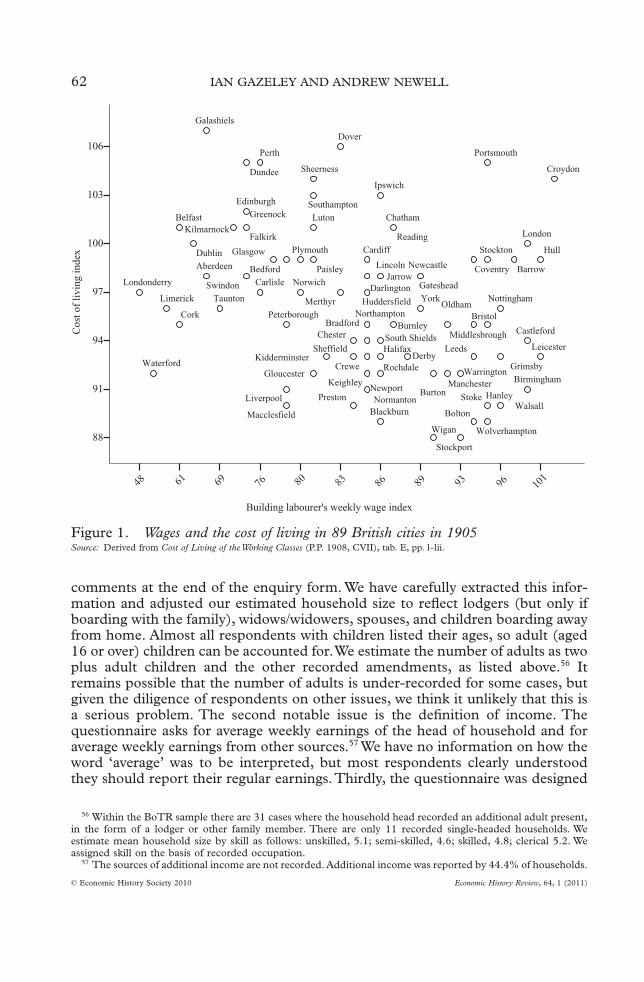
Tables 5 and 6 give estimates of poverty in the BoTR sample and compare ourfindings with those of the original investigators. It should be remembered, at thisstage, that the BoTR data is a non-random sample of urban working householdsin Britain and Ireland, whereas Rowntree’s calculation was based upon an inves-tigation of the entire working-class population ofYork. Bowley and Burnett-Hurstused a randomized sample equivalent to 1 in 20 of all working-class householdsresident in the towns they studied.58 With this caveat in mind, we find povertyheadcount rates in the BoTR sample of between 15.5 and 18.4 per cent, depend-ing on the poverty line employed.These sit within the range of Bowley’s four townsand are close to Rowntree’s estimate. Within the BoTR sample, we also find ahousehold primary poverty rate of between 12.1 and 16.1 per cent.The householdrates are lower because large households, almost by definition, are more likely tobe poor. In each case the conventionally calculated standard error of the estimateis about 1.2 percentage points.
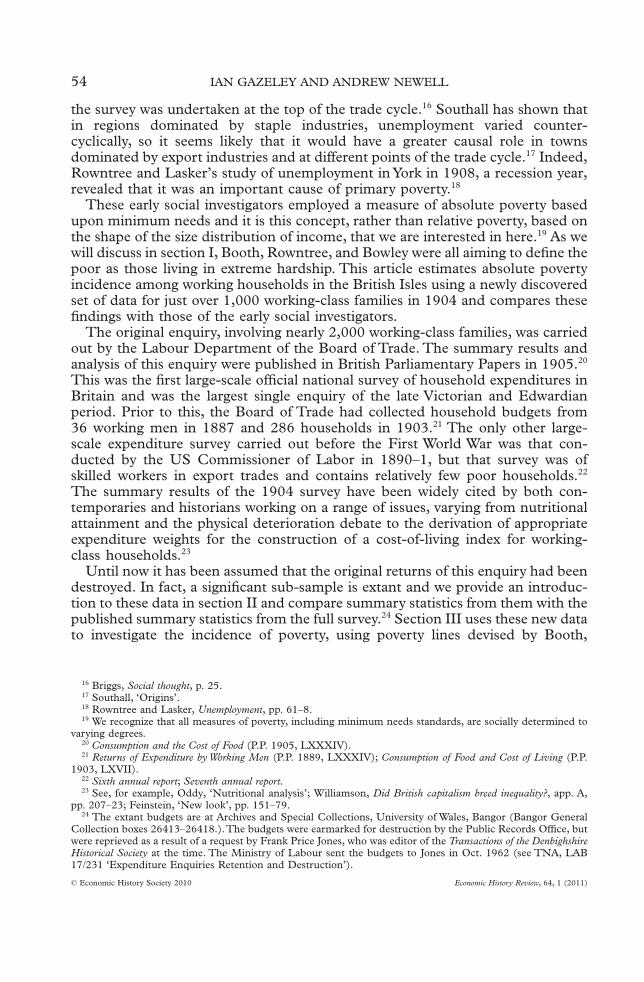
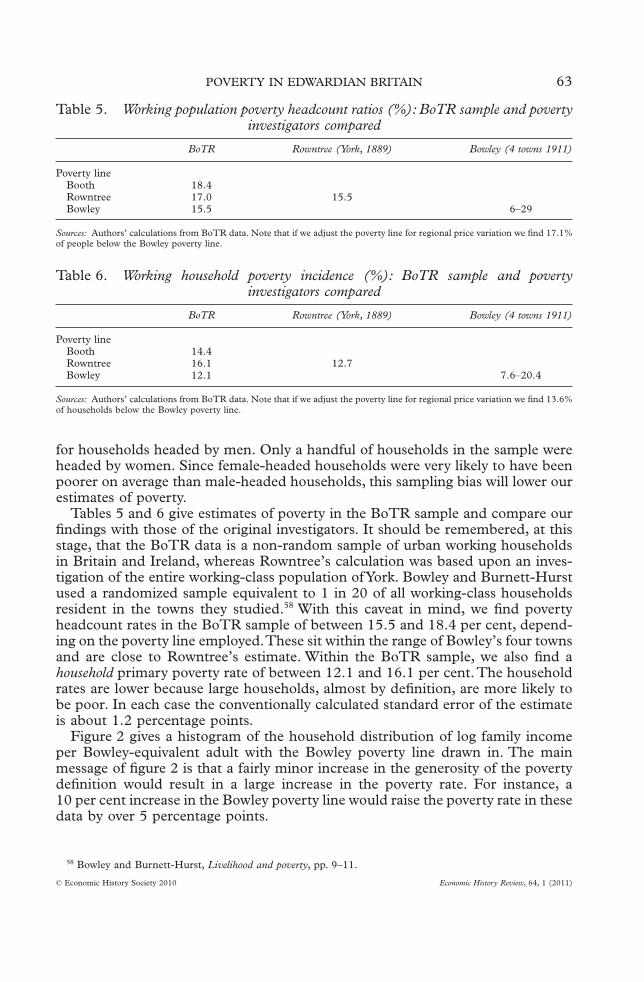
Figure 2 gives a histogram of the household distribution of log family incomeper Bowley-equivalent adult with the Bowley poverty line drawn in. The mainmessage of figure 2 is that a fairly minor increase in the generosity of the povertydefinition would result in a large increase in the poverty rate. For instance, a10 per cent increase in the Bowley poverty line would raise the poverty rate in thesedata by over 5 percentage points.
58 Bowley and Burnett-Hurst, Livelihood and poverty, pp. 9–11.
Table 5. Working population poverty headcount ratios (%): BoTR sample and povertyinvestigators compared
BoTR Rowntree (York, 1889) Bowley (4 towns 1911)
Poverty lineBooth 18.4Rowntree 17.0 15.5Bowley 15.5 6–29
Sources: Authors’ calculations from BoTR data. Note that if we adjust the poverty line for regional price variation we find 17.1%of people below the Bowley poverty line.
Table 6. Working household poverty incidence (%): BoTR sample and povertyinvestigators compared
BoTR Rowntree (York, 1889) Bowley (4 towns 1911)
Poverty lineBooth 14.4Rowntree 16.1 12.7Bowley 12.1 7.6–20.4
Sources: Authors’ calculations from BoTR data. Note that if we adjust the poverty line for regional price variation we find 13.6%of households below the Bowley poverty line.
POVERTY IN EDWARDIAN BRITAIN 63
© Economic History Society 2010 Economic History Review, 64, 1 (2011)
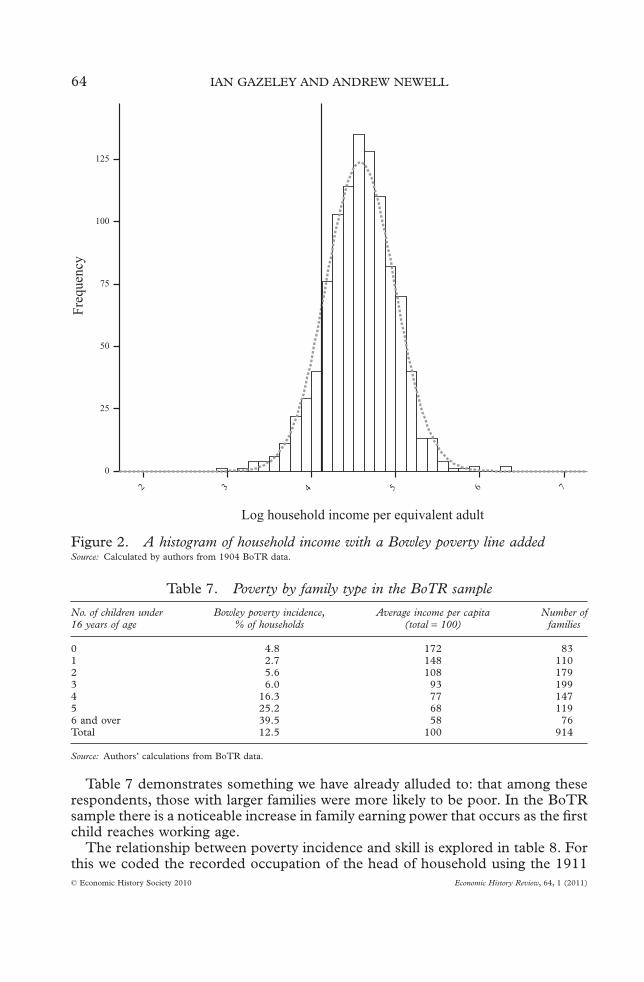
Table 7 demonstrates something we have already alluded to: that among theserespondents, those with larger families were more likely to be poor. In the BoTRsample there is a noticeable increase in family earning power that occurs as the firstchild reaches working age.
The relationship between poverty incidence and skill is explored in table 8. Forthis we coded the recorded occupation of the head of household using the 1911
Log household income per equivalent adult
765432
Fre
quen
cy
125
100
75
50
25
0
Figure 2. A histogram of household income with a Bowley poverty line addedSource: Calculated by authors from 1904 BoTR data.
Table 7. Poverty by family type in the BoTR sample
No. of children under16 years of age
Bowley poverty incidence,% of households
Average income per capita(total = 100)
Number offamilies
0 4.8 172 831 2.7 148 1102 5.6 108 1793 6.0 93 1994 16.3 77 1475 25.2 68 1196 and over 39.5 58 76Total 12.5 100 914
Source: Authors’ calculations from BoTR data.
64 IAN GAZELEY AND ANDREW NEWELL
© Economic History Society 2010 Economic History Review, 64, 1 (2011)
England and Wales Population Census classification.59 There is a clear negativerelationship between skill and poverty, with almost 40 per cent Bowley-povertyamong households headed by an unskilled worker. In addition, table 8 reports theheadcount poverty ratio and the poverty gap.The headcount rate is the proportionof people in poor households, rather than the proportion of households, which wehave discussed hitherto. The poverty gap is the other commonly used measure. Itis the average over the whole sample of a measure which is the percentage belowthe poverty line for households whose income is below the line and zero foreveryone else. It measures severity of poverty as well as incidence. The relationbetween the two measures depends on the distribution of income.The headcountratio for labourers’ households is over 50 per cent. Combining these results withthose by family type emphasizes where poverty was most concentrated in oursample. For families headed by an unskilled worker with more than three children,the chances of being in poverty rose to over 60 per cent.
IV
How might we move from calculating the extent of poverty in the BoTR sample,to estimating national poverty indices for British working households from thesedata?We use data on wages for about two million adult men, drawn from the 1906Board of Trade earnings enquiries, to estimate a national wage distribution. Wethen compare this with the wage distribution of heads of households in the BoTRsample.We show that these are markedly different.We re-weight cases in the BoTRsample so that the two wage distributions are the same, and recalculate povertymeasures.We present the results before considering the possible weaknesses of thisprocedure. Table 9 gives the industrial mix of the 1906 enquiries.
59 We have attempted to classify the head of household’s occupation by industry using the 1911 PopulationCensus and we have assigned each occupation to a skill grade (professional and managerial, clerical, skilledmanual, semi-skilled manual, and unskilled manual). This is a problematic exercise for two reasons. First, thedescription given by the head of household on the original return is not always sufficiently precise. So, forexample, ‘labourer’ is often reported, which is unproblematic for skill classification, but impossible to assign to anindustry group. Second, even where the occupation is given precisely, it is not always possible to assign theoccupation unambiguously to a skill group, though we have made consistent classification judgements. Forexample, ‘machine operator’ could be skilled or semi-skilled (assigned to semi-skilled throughout).We made useof the 1911 ‘memorandum to enumerators’ (ibid., pp. 854–67), but also found the detailed descriptions ofoccupations given in the 1921 Population Census useful in this context, as each occupation is given a uniquenumerical identifier.We have classified each occupation (where we can) using this numerical system. Clearly, theassignment of occupation to skill group has a greater margin of error attached to it than the classification ofoccupation by industry group.
Table 8. Poverty by skill of the household head
Manual skill levelPoor
households (%)Poverty
headcount (%)Povertygap (%)
% ofhouseholds
Income per capita(av. = 100)
Labourers 45.2 53.2 9.3 10 68All unskilled 40.0 48.1 7.9 17 70Semi-skilled 14.3 18.6 2.3 9 101Skilled 5.4 7.3 0.7 61 105All 12.1 15.5 2.1All, adjusted 12.3 15.5 2.0
Source: Authors’ calculations from BoTR data. See text for a discussion of skill classification.
POVERTY IN EDWARDIAN BRITAIN 65
© Economic History Society 2010 Economic History Review, 64, 1 (2011)
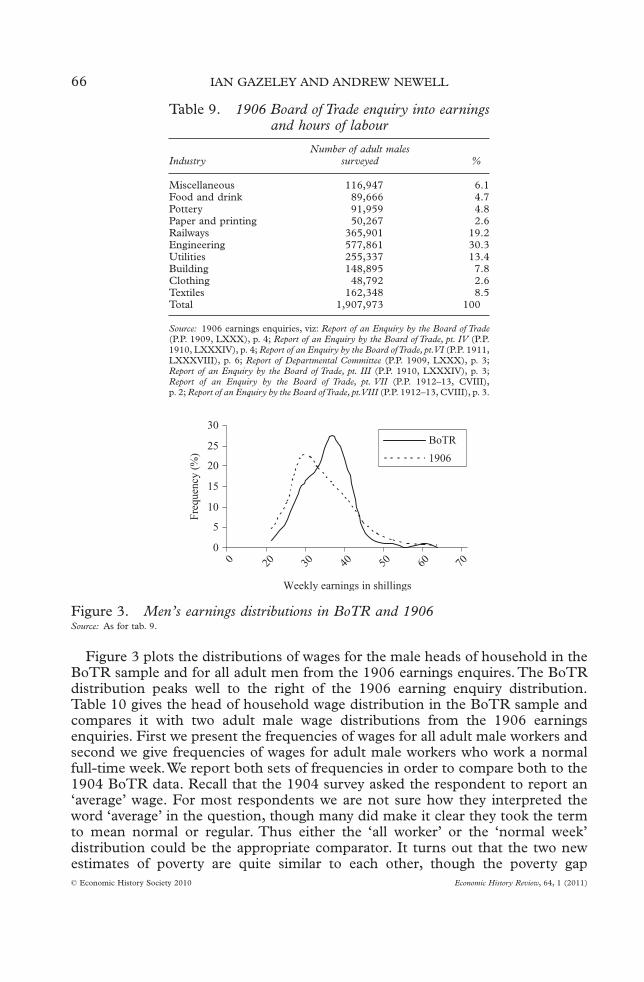
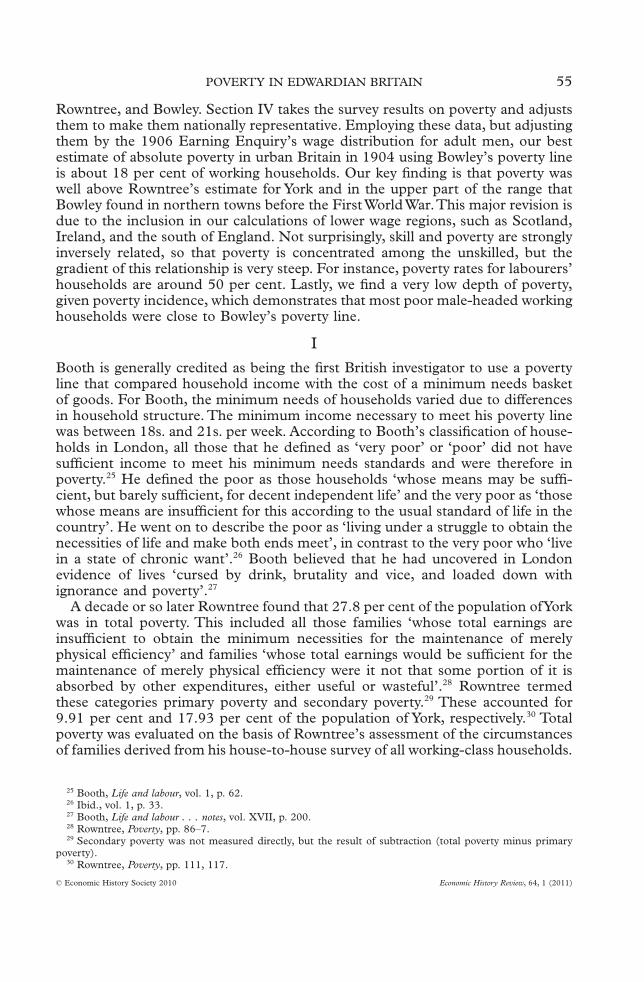
Figure 3 plots the distributions of wages for the male heads of household in theBoTR sample and for all adult men from the 1906 earnings enquires. The BoTRdistribution peaks well to the right of the 1906 earning enquiry distribution.Table 10 gives the head of household wage distribution in the BoTR sample andcompares it with two adult male wage distributions from the 1906 earningsenquiries. First we present the frequencies of wages for all adult male workers andsecond we give frequencies of wages for adult male workers who work a normalfull-time week.We report both sets of frequencies in order to compare both to the1904 BoTR data. Recall that the 1904 survey asked the respondent to report an‘average’ wage. For most respondents we are not sure how they interpreted theword ‘average’ in the question, though many did make it clear they took the termto mean normal or regular. Thus either the ‘all worker’ or the ‘normal week’distribution could be the appropriate comparator. It turns out that the two newestimates of poverty are quite similar to each other, though the poverty gap
Table 9. 1906 Board of Trade enquiry into earningsand hours of labour
IndustryNumber of adult males
surveyed %
Miscellaneous 116,947 6.1Food and drink 89,666 4.7Pottery 91,959 4.8Paper and printing 50,267 2.6Railways 365,901 19.2Engineering 577,861 30.3Utilities 255,337 13.4Building 148,895 7.8Clothing 48,792 2.6Textiles 162,348 8.5Total 1,907,973 100
Source: 1906 earnings enquiries, viz: Report of an Enquiry by the Board of Trade(P.P. 1909, LXXX), p. 4; Report of an Enquiry by the Board of Trade, pt. IV (P.P.1910, LXXXIV), p. 4; Report of an Enquiry by the Board ofTrade, pt.VI (P.P. 1911,LXXXVIII), p. 6; Report of Departmental Committee (P.P. 1909, LXXX), p. 3;Report of an Enquiry by the Board of Trade, pt. III (P.P. 1910, LXXXIV), p. 3;Report of an Enquiry by the Board of Trade, pt. VII (P.P. 1912–13, CVIII),p. 2; Report of an Enquiry by the Board ofTrade,pt.VIII (P.P. 1912–13, CVIII), p. 3.
0
5
10
15
20
25
30
70
Weekly earnings in shillings
Fre
quen
cy (
%)
BoTR
1906
0 20 30 40 50 60
Figure 3. Men’s earnings distributions in BoTR and 1906Source: As for tab. 9.
66 IAN GAZELEY AND ANDREW NEWELL
© Economic History Society 2010 Economic History Review, 64, 1 (2011)
measures are significantly different in the predictable direction. Note there is amuch greater frequency of lower wages in the 1906 data.
Using the poverty rates for each wage group, we re-estimate Bowley povertyrates and gaps by household and per capita. We find that all poverty rates rise byover 40 per cent. The poverty gap estimates in table 10 are low, relative to theheadcount rates.60 It should be remembered that these BoTR estimated povertygaps are for wage-earning households. If non-working households had beenincluded, then possibly the poverty gaps would have been higher. But these lowestimates of poverty gaps tell us that there were few households in the BoTRsample that were a long way below Bowley’s new standard.
What are the potential pitfalls of this method? We are assuming that householdcharacteristics, number of children, and so on, for workers in these wage bracketsin the BoTR sample are representative of national household characteristics.Thisis an untestable assumption, but since households were not selected, as far as weknow, for their structural characteristics, then we do not have any reason to expecta bias from this.61 The second potential problem is the use of an adult male wagedistribution to represent the unknown wage distribution of heads of households.These may differ for systematic reasons. For instance, there is evidence fromMincerian earnings equations that married men earn more than unmarried menon average. If this is the case for Britain in the Edwardian period, then the wagedistribution of heads of households is likely to be shifted to the right a little incomparison with the adult male wage distribution. The size of that shift dependsupon the numbers of unmarried working men. Since working-class men typicallymarried in their early twenties, this may not be too large.
60 See Chen and Ravallion, ‘How did the world’s poorest fare in the 1990s?’, for contemporary estimates ofpoverty headcounts and gaps for developing countries.
61 We checked to see if family size and the wage of the head of household were related, and there was noassociation.
Table 10. 1904 poverty rate adjusted using 1906 earnings distribution
Wage in shillings
% frequency amongmale heads of
households in 1904
% frequency amongall adult male
workers in 1906
% frequency among adultmale workers working anormal week in 1906
1904 povertyrates (%)
<15 1.9 4.7 2.0 5315 and <20 6.9 11.5 13.2 5720 and <25 15.3 22.7 27.3 2725 and <30 19.7 19.6 19.3 1130 and <35 27.5 15.7 13.0 335 and <40 19.3 11.6 10.7 140 and <45 5.0 6.3 5.7 045 and <50 1.4 3.3 3.1 050 and <55 1.1 1.9 1.5 055 and <60 0.3 1.0 0.6 060 and <65 1.1 0.7 0.6 0>65 0.6 1.1 1.2 0Headcount rate (%) 15.5 21.7 22.9Headcount gap (%) 2.6 4.0 1.6Household rate (%) 12.1 17.9 18.6Household gap (%) 2.1 3.1 1.4
Source: As for tab. 9.
POVERTY IN EDWARDIAN BRITAIN 67
© Economic History Society 2010 Economic History Review, 64, 1 (2011)
These are our best estimates of Bowley poverty among working households inBritain at the beginning of the twentieth century, though we recognize that theinclusion of households headed by women would be likely to raise them further.What about the non-working working-class households? How much extra wouldthey add to our estimate of working-class poverty? This is rather speculative, but itis better to give an estimate than leave the reader to guess. We observe that theshare of the poor who were without work was estimated to be 31 per cent inReading, 35 per cent in Northampton (by Bowley), and 43 per cent in York (byRowntree).62 We also know that construction labourers’ real wage indices (Lon-don = 100, UK = 97) for the three towns are 95 for Reading, 98 for Northampton,and 102 forYork.Via a regression on these three data points we predict a share ofthe workless among the poor of 34 per cent for the UK.63 From Hakim wecalculate an economic activity rate of 57 per cent.64 Using this proportion, and stillnot adjusting for female-headed households, we estimate a maximum Bowleyhousehold poverty rate of 26 per cent in 1904.65
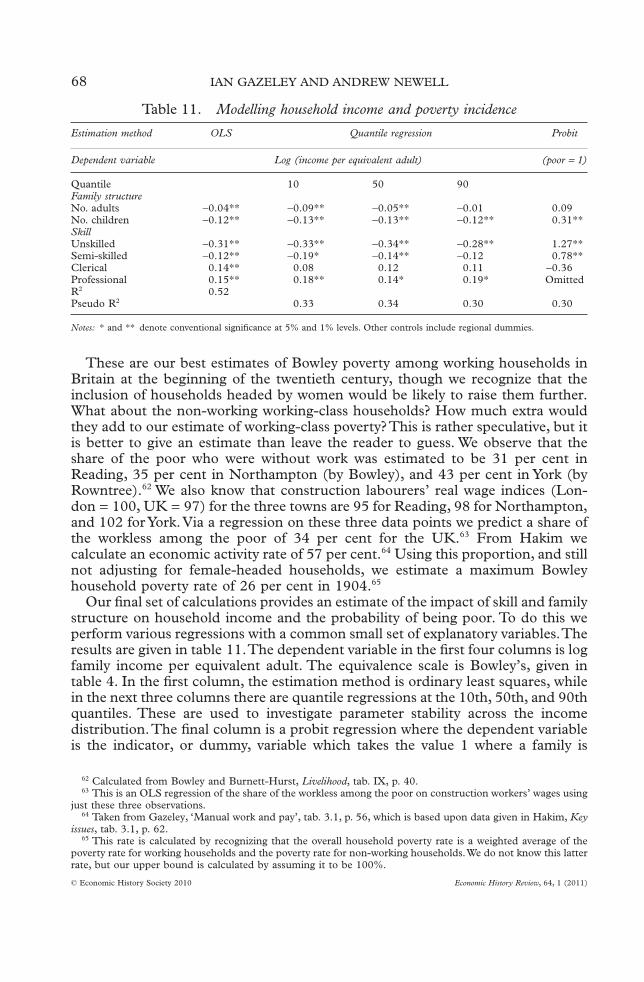
Our final set of calculations provides an estimate of the impact of skill and familystructure on household income and the probability of being poor. To do this weperform various regressions with a common small set of explanatory variables.Theresults are given in table 11.The dependent variable in the first four columns is logfamily income per equivalent adult. The equivalence scale is Bowley’s, given intable 4. In the first column, the estimation method is ordinary least squares, whilein the next three columns there are quantile regressions at the 10th, 50th, and 90thquantiles. These are used to investigate parameter stability across the incomedistribution.The final column is a probit regression where the dependent variableis the indicator, or dummy, variable which takes the value 1 where a family is
62 Calculated from Bowley and Burnett-Hurst, Livelihood, tab. IX, p. 40.63 This is an OLS regression of the share of the workless among the poor on construction workers’ wages using
just these three observations.64 Taken from Gazeley, ‘Manual work and pay’, tab. 3.1, p. 56, which is based upon data given in Hakim, Key
issues, tab. 3.1, p. 62.65 This rate is calculated by recognizing that the overall household poverty rate is a weighted average of the
poverty rate for working households and the poverty rate for non-working households.We do not know this latterrate, but our upper bound is calculated by assuming it to be 100%.
Table 11. Modelling household income and poverty incidence
Estimation method OLS Quantile regression Probit
Dependent variable Log (income per equivalent adult) (poor = 1)
Quantile 10 50 90Family structureNo. adults -0.04** -0.09** -0.05** -0.01 0.09No. children -0.12** -0.13** -0.13** -0.12** 0.31**SkillUnskilled -0.31** -0.33** -0.34** -0.28** 1.27**Semi-skilled -0.12** -0.19* -0.14** -0.12 0.78**Clerical 0.14** 0.08 0.12 0.11 -0.36Professional 0.15** 0.18** 0.14* 0.19* OmittedR2 0.52Pseudo R2 0.33 0.34 0.30 0.30
Notes: * and ** denote conventional significance at 5% and 1% levels. Other controls include regional dummies.
68 IAN GAZELEY AND ANDREW NEWELL
© Economic History Society 2010 Economic History Review, 64, 1 (2011)
estimated to be poor on Bowley’s measure. The results for children and skills arepredictable and consistent across the columns. For adults, the results are perhapsa little more subtle. An additional adult lowers income at the 10th quantile and onaverage, and also (insignificantly) raises the chances of being poor, but has noimpact at the 90th quantile. In words, in households with high per capita incomes,given their skill levels, additional adults are more likely to be working.
Unpacking the marginal effects from the probit regression, we find, conditionalupon family structure and region, a household with an unskilled head is 26percentage points more likely to be poor than one with a skilled head. Also, anextra child raises the probability of being poor by 4 percentage points.66 If wecompare the skill result with the poverty incidence by skill in table 10, where anunskilled worker is 35.6 per cent more likely to be poor than a skilled worker, thenjust about 10 percentage points of that raw gap are related to family structure andregion.
V
This article has introduced a new and valuable source of household budget datafor Britain at the beginning of the twentieth century. Employing these data, butadjusting them by the 1906 earning enquiry’s wage distribution for adult men, ourbest lower-bound estimate of absolute poverty in urban Britain in 1904, usingBowley’s poverty line, is about 23 per cent of people in urban working householdsand 18 per cent of households. More speculatively, we estimate that at least 26 percent of all male-headed working-class urban households in Britain (both workingand non-working) were in poverty at the beginning of the twentieth century, usingBowley’s definition. Our key finding is that poverty among male-headed workinghouseholds in urban Britain was well above Rowntree’s estimate forYork and in theupper part of the range that Bowley found in northern towns before the FirstWorld War.This major revision is due to the inclusion in our calculations of lowerwage regions, such as Scotland, Ireland, and the south of England. The resultreminds us that in 1904 regular work was not sufficient to protect families againstpoverty and confirms Rowntree’s conclusion that low wages were the most impor-tant cause of poverty in the period.We find household poverty rates of over 60 percent for households with unskilled heads and more than three children. Tellingly,poverty rates for labourers were about 50 per cent. However, among male-headedworking households we find relatively little depth of poverty. In 1904, before theintroduction of the welfare state, paid work seems to have stopped the poor fromdropping too far below subsistence.
University of Sussex
Date submitted 29 April 2008Revised version submitted 11 June 2009Accepted 8 September 2009
DOI: 10.1111/j.1468-0289.2009.00523.x
66 We tested whether children of different ages have different effects in these regressions. We found nosignificant differences.
POVERTY IN EDWARDIAN BRITAIN 69
© Economic History Society 2010 Economic History Review, 64, 1 (2011)
Footnote referencesBooth, C., Life and labour of the people in London, vol. 1 (1892).Booth, C., Life and labour of the people in London, final volume, notes on social influences and conclusions, vol. XVII
(1903).Bourke, J., Dismembering the male (1996).Bowley, A. L., Wages and income in the United Kingdom since 1860 (Cambridge, 1937).Bowley, A. L. and Burnett-Hurst, A. R., Livelihood and poverty (1915).Briggs, A., Social thought and social action: a study of the work of Seebohm Rowntree (1961).Chen, S. and Ravallion, M., ‘How did the world’s poorest fare in the 1990s?’, Review of Income andWealth, 47, 3
(2001), pp. 283–300.Cox, P., Demography (Cambridge, 5th edn. 1976).Feinstein, C., ‘What really happened to real wages?: trends in wages, prices, and productivity in the United
Kingdom, 1880–1913’, Economic History Review, 2nd ser., XLVIII, (1990), pp. 329–55.Feinstein, C. H., ‘A new look at the cost of living 1870–1914’, in J. S. Foreman-Peck, ed., New perspectives on the
lateVictorian economy (Cambridge, 1991), pp. 151–79.Gazeley, I., ‘The cost of living for urban workers in late Victorian and Edwardian Britain’, Economic History
Review, XLII (1989), pp. 207–21.Gazeley, I., Poverty in Britain 1900–65 (Basingstoke, 2003).Gazeley, I. and Newell, A., ‘Rowntree revisited: poverty in Britain, 1900’, Explorations in Economic History, 37, 2
(2000), pp. 174–88.Gazeley, I., ‘Manual work and pay, 1900–70’, in N. Crafts, I. Gazeley, and A. Newell, eds., Work and pay in 20th
century Britain (Oxford, 2007), pp. 55–79.Hakim, C., Key issues in women’s work (2004).Linsley, C. A. and Linsley, C. L., ‘Booth, Rowntree and Llewelyn-Smith, a reassessment of interwar poverty’,
Economic History Review, XLVI (1993), pp. 88–104.MacGregor, D. H., ‘The poverty figures’, Economic Journal, 20, 80 (1910), pp. 569–72.Oddy, D. J., ‘A nutritional analysis of historical evidence: the working class diet, 1880–1914’, in D. J. Oddy and
D. S. Miller, eds., The making of the modern British diet (1976), pp. 214–31.Rowntree, B. S., Poverty: a study of town life (1901).Rowntree, B. S. and Lasker, B., Unemployment: a social study (1911).Seventh annual report of the United States Commissioner of Labor, Washington, Government Printing Office (1891,
1892).Sixth annual report of the United States Commissioner of Labor, Washington, Government Printing Office (1890,
1891).Southall, H. R., ‘The origins of the depressed areas: unemployment, growth, and regional economic structure in
Britain before 1914’, Economic History Review, 2nd ser., XLI (1988), pp. 236–58.Veit-Wilson, J., ‘Paradigms of poverty: a rehabilitation of B. S. Rowntree’, in D. Englander and R. O’Day, eds.,
Retrieved riches: social investigation in Britain 1840–1914 (Aldershot, 1995), pp. 201–37.Williams, K., From pauperism to poverty (1981).Williamson, J. G., Did British capitalism breed inequality? (Winchester, Mass., 1985).
Official publicationsReturns of Expenditure byWorking Men (P.P. 1889, LXXXIV).Consumption of Food and Cost of Living of Working Classes in the United Kingdom and Certain Foreign Countries.
Memoranda Statistical Tables and Charts prepared in the Board of Trade with reference to various matters bearing onBritish and foreign trade and industrial conditions (P.P. 1903, LXVII).
Report of the Inter-Departmental Committee on Physical Deterioration (P.P. 1904, XXXII).Consumption and the Cost of Food inWorkmen’s Families in Urban Districts of the United Kingdom (P.P. 1905, LXXXIV).Cost of Living of theWorking Classes. Report of an Enquiry by the Board of Trade intoWorking-Class Rents, Housing and
Retail Prices Together with Standard Rates ofWages Prevailing in Certain Occupations in Principal Industrial Towns inthe United Kingdom (P.P. 1908, CVII).
Report of an Enquiry by the Board ofTrade into the Earnings and Hours of Labour ofWorkpeople of the United Kingdom,Textile Trades in 1906 (P.P. 1909, LXXX).
Report of Departmental Committee on the Checking of Piece-workWages in Dock Labour, pt. II: Clothing Trades in 1906(P.P. 1909, LXXX).
Report of an Enquiry by the Board ofTrade into the Earnings and Hours of Labour ofWorkpeople of the United Kingdom,pt. III: Building andWoodworking Trades in 1906 (P.P. 1910, LXXXIV).
Report of an Enquiry by the Board ofTrade into the Earnings and Hours of Labour ofWorkpeople of the United Kingdom,pt. IV: Public Utility Services in 1906 (P.P. 1910, LXXXIV).
Report of an Enquiry by the Board ofTrade into the Earnings and Hours of Labour ofWorkpeople of the United Kingdom,pt.VI: Metal Engineering and Shipbuilding Trades in 1906 (P.P. 1911, LXXXVIII).
Cost of Living of theWorking Classes. Report of an Enquiry by the Board of Trade intoWorking-Class Rents and RetailPrices Together with the Rates of Wages in Certain Occupations in Industrial Towns in the United Kingdom (P.P.1912–13, LXVI).
70 IAN GAZELEY AND ANDREW NEWELL
© Economic History Society 2010 Economic History Review, 64, 1 (2011)
Report of an Enquiry by the Board ofTrade into the Earnings and Hours of Labour ofWorkpeople of the United Kingdom,pt.VII: Railway Service in 1907 (P.P. 1912–13, CVIII).
Report of an Enquiry by the Board ofTrade into the Earnings and Hours of Labour ofWorkpeople of the United Kingdom,pt.VIII: Paper, Printing, & c., Pottery, Brick, Glass and Chemicals; Food, Drink andTobacco; and MiscellaneousTrades(P.P. 1912–13, CVIII).
1911 Population Census of England andWales (Occupations and Industries) (1914).1921 Population Census of England andWales (Classification of Occupations) (1924).
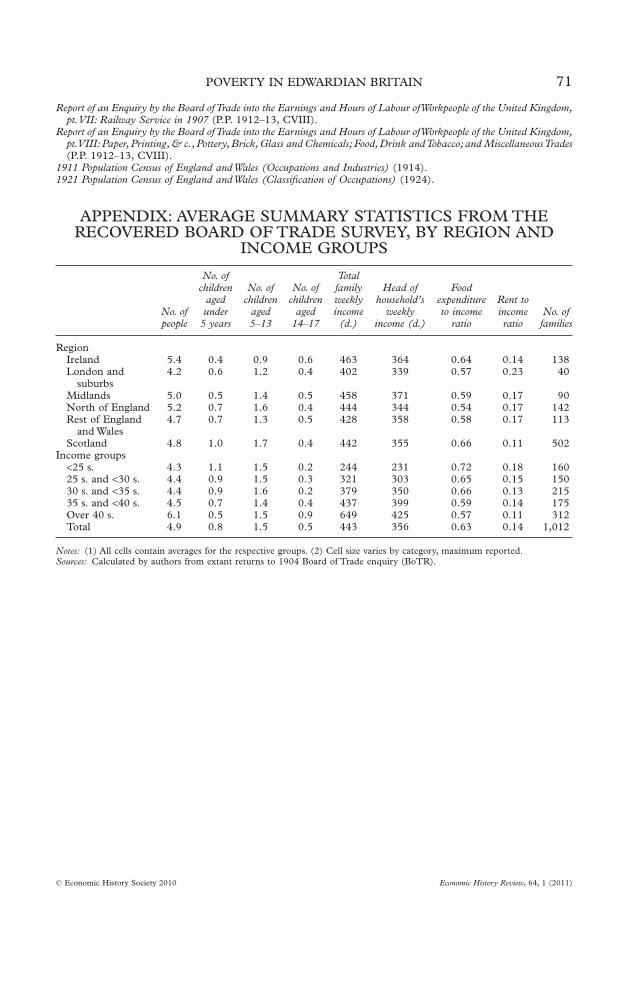
APPENDIX: AVERAGE SUMMARY STATISTICS FROM THERECOVERED BOARD OF TRADE SURVEY, BY REGION AND
INCOME GROUPS
No. ofpeople
No. ofchildren
agedunder
5 years
No. ofchildren
aged5–13
No. ofchildren
aged14–17
Totalfamilyweeklyincome(d.)
Head ofhousehold’s
weeklyincome (d.)
Foodexpenditureto income
ratio
Rent toincomeratio
No. offamilies
RegionIreland 5.4 0.4 0.9 0.6 463 364 0.64 0.14 138London and
suburbs4.2 0.6 1.2 0.4 402 339 0.57 0.23 40
Midlands 5.0 0.5 1.4 0.5 458 371 0.59 0.17 90North of England 5.2 0.7 1.6 0.4 444 344 0.54 0.17 142Rest of England
and Wales4.7 0.7 1.3 0.5 428 358 0.58 0.17 113
Scotland 4.8 1.0 1.7 0.4 442 355 0.66 0.11 502Income groups
<25 s. 4.3 1.1 1.5 0.2 244 231 0.72 0.18 16025 s. and <30 s. 4.4 0.9 1.5 0.3 321 303 0.65 0.15 15030 s. and <35 s. 4.4 0.9 1.6 0.2 379 350 0.66 0.13 21535 s. and <40 s. 4.5 0.7 1.4 0.4 437 399 0.59 0.14 175Over 40 s. 6.1 0.5 1.5 0.9 649 425 0.57 0.11 312Total 4.9 0.8 1.5 0.5 443 356 0.63 0.14 1,012
Notes: (1) All cells contain averages for the respective groups. (2) Cell size varies by category, maximum reported.Sources: Calculated by authors from extant returns to 1904 Board of Trade enquiry (BoTR).
POVERTY IN EDWARDIAN BRITAIN 71
© Economic History Society 2010 Economic History Review, 64, 1 (2011)