potentiation of pomegranate rind extract (pre) bactericidal
TRANSCRIPT
Potentiation of pomegranate rind
extract (PRE) bactericidal
activity by ZnSO4 combination
A thesis submitted for the degree of
Doctor of Philosophy (Ph.D)
By
Amal Abdullah Alrashidi
School of Pharmacy and Pharmaceutical Sciences
Cardiff University
February 2020

i
ACKNOWLEDGEMENT
First and foremost, I would like to Thank Allah Almighty the Most Gracious Most
Merciful for blessing me with the opportunity to complete my Phd surrounded by the
utmost supportive educators in the most astounding university.
I would like to recognize and thank all the people whose assistance played a major role
in the success of my journey. First and for most I would like to thank my supervisor Dr.
Charles Heard, who I am greatly indebted to for his constant support and advice.
I must also thank Dr. Ryan Moseley and Dr Rae Moses for facilitating the work with cell
culture and confocal microscopy at his laboratory at dentistry school. Thanks go to all
my lab colleagues and the entire academic team that crossed my path during my
educational experience. I would like to recognize the invaluable assistance provided by
Princess Noura University which granted me the chance to achieve my educational
aspirations.
I wish to acknowledge the endless support and great love of my husband Nader who
stood by me every step of the way. My daughters Dayala, Sadeem, and Rawan for being
the greatest daughters one could ask for. Your patience and love helped me overcome
all obstacles that I came across. I would like to dedicate this thesis to my father soul, my
mother who kept me in her prayers and thoughts throughout the years. My deepest
gratitude to my friend, Maria for her presence, assistance and kindness that I never failed
to find.
I also like to place on record my genuine appreciation to anyone and everyone who
directly and indirectly have lent me their time, wise words and encouragement in this
adventure.
ii
ABBREVIATIONS
24 WP 24 well plate
96 WP 96 well plate
AMR Antimicrobial resistance
ANOVA One way analysis of variance
CFU Colony-forming units
COX Cyclooxygenase
CRBC chicken red blood cells
DI Deionised
DMEM Dulbecco's Modified Eagle Medium
DMSO Dimethyl sulfoxide
ECM Extracellular matrix
EGF Epidermal growth factor epidermal
EtOH Ethanol
FACS Fluorescence-activated cell sorting
FBS Foetal bovine serum
FDA Fluorescein diacetate
FDC Franz diffusion cell
FeSO4 Ferrous sulphate
FGF Fibroblast growth factor
HaCat Immortalized human skin keratinocytes
FIC fractional inhibitory concentration index
HPLC High performance liquid chromatography
HSE Heat separated epidermis
HSV Herpes simplex virus
IC50 Inhibitory concentration 50
ICP MS Inductively Coupled Plasma Mass Spectrometry
IL-1 Interleukin-1
LC-MS Liquid chromatography–mass spectrometry
iii
LDH Lactate dehydrogenase
MBC Minimum bactericidal concentration
MDCK Madin-Darby canine kidney
MHA Mueller Hinton agar
MHB Mueller Hinton broth
MHB Mueller Hinton broth
MIC Minimum inhibitory concentration
MMP Mixed metalloproteinase
MRSA Methicillin-resistant Staphylococcus aureus
MSSA Methicillin-sensitive Staphylococcus aureus
MTT Thiazolyl blue tetrazolium bromide
MTT 3-(4, 5-dimethylthiazol-2yl)-2,5-diphenyl tetra bromide
NADH Nicotinamide adenine dinucleotide
NCTC National Collection of Type Cultures
Pb Phthalate buffer
PBS Phosphate buffered saline
PDGF Platelet-derived growth factor
PI Propidium iodide
PRE
PRE/Zn
Pomegranate rind extract
Combination of PRE and Zn(II), as zinc sulphate (ZnSO4)
ROS Reactive oxygen species
SD Standard deviation
SSTI Skin and soft-tissue infections
TGF-α Transforming growth factor-alfa
TGF-β Transforming growth factor-beta
TSA Tryptone soya agar
TSB Tryptone soya broth
VEGF
Zn(II)
Vascular endothelial growth factor
Zinc in oxidation state II (synonymous with Zn2+
)
ZOI Zone of inhibition
iv
SUMMARY
The addition of Zn(II) to PRE was previously found to increase virucidal activity of PRE
by seven log reduction in plaque forming units against Herpes simplex virus. This thesis
tested the same system for antibacterial and bactericidal activity against bacteria that are
often associated with skin and wound infections. Antibacterial synergistic activity of
PRE + Zn(II) was tested using a checkerboard test and showed synergy with MRSA and
S. epidermidis with FIC index ≤0.5 and MIC level of PRE in the combination at (62.5,
31.25 μg/mL) and Zn(II) at (1600, 400 μM). In addition, suspension time-kill testing
showed synergistic bactericidal activity with PRE 1 mg/mL + ZnSO4 (0.125 and 0.25M).
The cytotoxicity of PRE ± Zn(II) was investigated using MTT and FACS analyses, short
term exposure showed that PRE (5-50 μg/mL) was tolerated and no significant toxicity
on HaCaT cell line was observed. In vitro scratch wound model was investigated and
showed that PRE at lower levels mediates HaCaT cell migration compared to untreated
group. Significant cell migration mediation was observed with PRE 10 μg/mL and
Zn(II) (25-100 μM), as did the combination that contained PRE (5, 10 μg/mL) with
ZnSO4 50 μM. Optimization of topical hydrogel formulations resulted in three
formulations that showed promising permeation and penetration profiles using in vitro
porcine epidermis. Formulations applied to inoculated porcine in simulated in-use
conditions again demonstrated syndergistic bactericidal activity of PRE + Zn(II) with >5
log reduction in MRSA inoculated porcine kin after 20 minutes contact time compared
to ~1 log reduction for the control.
v
TABLE OF CONTENTS
AKNOWLEDGEMENTS..................................................................................................i
ABBREVIATIONS............................................................................................................ii
SUMMARY......................................................................................................................iv
LIST OF FIGURES.........................................................................................................xiv
LIST OF TABLES........................................................................................................xxiv
Chapter 1: General introduction .................................................................................... 1
1.1 Overview ............................................................................................................. 2
1.2 Pomegranate uses in traditional medicine .......................................................... 2
1.3 General health benefits of pomegranates ............................................................ 4
1.4 Phytochemical properties of pomegranates ........................................................ 4
1.5 Antioxidant activity of pomegranates ................................................................. 7
1.6 Antimicrobial activity of pomegranates ............................................................. 8
1.6.1 E. coli ........................................................................................................... 8
1.6.2 Staphylococcus aureus and MRSA ............................................................. 9
1.6.3 Other bacteria ............................................................................................ 10
1.6.4 Antiviral activity of pomegranate .............................................................. 13
1.6.5 Antifungal activity of pomegranate ........................................................... 14
1.7 PRE and metal ion combination ....................................................................... 15
1.8 The Skin ............................................................................................................ 18
1.8.1 Skin and soft tissue infections (SSTIs) ...................................................... 18
1.8.1.1 Current Treatment for SSTI ................................................................... 22
1.8.2 Wounds ...................................................................................................... 24
1.8.3 Wound-healing process ............................................................................. 24
1.8.3.1 Haemostasis ........................................................................................... 24
1.8.3.2 Inflammation .......................................................................................... 25
1.8.3.3 Proliferation ........................................................................................... 26
1.8.3.3.1 Angiogenesis .................................................................................... 26
1.8.3.3.2 Fibroblast migration ......................................................................... 27
1.8.3.3.3 Epithelialisation/ re-epithelialisation ............................................... 27
vi
1.8.3.4 Remodelling ........................................................................................... 28
1.8.4 Acute and chronic wounds ........................................................................ 28
1.8.5 Effect of bacteria on wound healing .......................................................... 29
1.8.5.1 Impact of wound infection on different stage of wound healing ........... 31
1.8.5.1.1 Impact of wound infection on inflammation phase: ........................ 31
1.8.5.1.2 Impact of wound infection on the formation of granulation tissue and
angiogenesis: ..................................................................................................... 31
1.8.5.1.3 Impact of wound infection on epithelialisation ................................ 32
1.8.5.1.4 Impact of wound infection on the production of collagen: .............. 32
1.8.6 Current wound treatment ........................................................................... 32
1.8.7 Antibacterial and antiseptic agents ............................................................ 32
1.8.7.1 Wound cleaning, irrigation and disinfection ......................................... 35
1.8.8 Antimicrobial resistance ............................................................................ 36
1.9 Research question and aims .............................................................................. 37
Chapter 2: Materials and general methods .................................................................. 38
2.1 Materials ........................................................................................................... 39
2.2 General methods ............................................................................................... 42
2.2.1 Solution preparation .................................................................................. 42
2.2.1.1 Pomegranate rind extract (PRE) ............................................................ 42
2.2.1.2 Reconstitution of freeze-dried PRE ....................................................... 42
2.2.1.3 Phthalate buffer pH4.5 ........................................................................... 43
2.2.1.4 Zinc sulphate (ZnSO4) ........................................................................... 44
2.2.1.5 Preparation of PRE and ZnSO4 combined solutions .............................. 44
2.2.1.6 Phosphorous buffered saline (PBS) ....................................................... 44
2.2.1.7 Punicalagin solution ............................................................................... 44
2.2.2 Analytical methods .................................................................................... 45
2.2.2.1 Quantitative analysis of PRE and punicalagin by reverse-phase HPLC 45
2.2.2.1.1 Standard punicalagin and construction of calibration curve ............ 46
2.2.2.2 Zinc detection using Inductively Coupled Plasma Mass Spectrometry
(ICP-MS) .............................................................................................................. 48
2.2.3 Skin preparation methods .......................................................................... 49
vii
2.2.3.1 Porcine ear skin preparation .................................................................. 49
2.2.3.2 Heat-Separated Epidermis (HSE) .......................................................... 49
2.2.4 Microbiological methods ........................................................................... 49
2.2.4.1 Aseptic technique ................................................................................... 49
2.2.4.2 Preparation of Mueller Hinton Agar (MHA) and Tryptone Soy Agar
(TSA) 50
2.2.4.3 Preparation of Mueller Hinton Broth (MHB) and Tryptone Soy Broth
(TSB) 50
2.2.4.4 Preparation of bacterial cultures ............................................................ 51
2.2.4.5 Preparation of fresh bacterial culture ..................................................... 51
2.2.4.6 Preparation of working culture .............................................................. 51
2.2.4.7 Preparation of 0.5 McFarland (108 CFU/mL) bacterial culture ............. 52
2.2.4.8 Broth dilution method to determine MIC .............................................. 52
2.2.4.9 Universal quenching agent (UQA) ........................................................ 53
2.2.4.10 Streak plate method ............................................................................ 53
2.2.4.11 Gram staining of tested bacteria ......................................................... 54
2.2.5 Cell culture general methods ..................................................................... 56
2.2.5.1 Aseptic technique ................................................................................... 56
2.2.5.2 Human adult, spontaneously immortalized, epidermal keratinocytes
(HaCaT cells) ....................................................................................................... 57
2.2.5.3 Culture media preparation ..................................................................... 57
2.2.5.4 Trypan blue cell staining ....................................................................... 57
2.2.5.5 Cell sub culturing and counting ............................................................. 58
2.2.5.6 Cell Freezing and cell thawing .............................................................. 59
Chapter 3: Antibacterial and bactericidal activity of PRE alone and in combination
with Zn(II) 61
3.1 Introduction ....................................................................................................... 62
3.1.1 Pomegranate use in wound treatment ........................................................ 64
3.1.2 Bacteria resistance in biofilm .................................................................... 65
3.2 Objective and aims ........................................................................................... 66
3.3 Materials and methods ...................................................................................... 66
3.3.1 Materials .................................................................................................... 66
viii
3.3.2 Solution preparation .................................................................................. 67
3.3.3 Aseptic technique ...................................................................................... 67
3.3.4 Microbiology culture preparation .............................................................. 67
3.3.5 Determination of minimum inhibitory concentration (MIC) .................... 67
3.3.6 Checkerboard test ...................................................................................... 68
3.3.7 Fractional inhibitory concentration index ................................................. 72
3.3.8 Time kill (log reduction) assay .................................................................. 72
3.3.9 Calculation of log reduction value ............................................................ 73
3.3.10 Effects of PRE and Zn(II), alone and in combination, against pre-formed
biofilm-embedded S. aureus .................................................................................... 73
3.3.11 Statistical analysis ..................................................................................... 74
3.4 Results ............................................................................................................... 75
3.4.1 Determination of minimum inhibitory concentration (MIC) .................... 75
3.4.2 Checkerboard test ...................................................................................... 76
3.4.3 Bactericidal time kill test ........................................................................... 78
3.4.3.1 Methicillin resistant Staphylococcus aureus MRSA (NCTC 12493), ... 78
3.4.3.2 Pseudomonas aeruginosa (P. aeruginosa) (NCTC 6750)....................... 82
3.4.3.3 Staphylococcus epidermidis (S. epidermidis) (NCTC 11047) .............. 84
3.4.3.4 Methicillin sensitive Staphylococcus aureus MSSA (NCTC 10788) .... 85
3.4.3.5 Escherichia coli (E. coli) (NCTC 12923) .............................................. 89
3.4.4 Effects of the PRE and Zn(II) alone and in combination against pre-
formed biofilms embedded S. aureus ...................................................................... 91
3.5 Discussion ......................................................................................................... 92
3.6 Conclusion ........................................................................................................ 99
Chapter 4: In vitro cytotoxicity and anti-proliferative effects of PRE and Zn(II) .... 101
4.1 Introduction ..................................................................................................... 102
4.1.1 Cell viability ............................................................................................ 102
4.1.1.1 Trypan blue .......................................................................................... 103
4.1.1.2 MTT assay ........................................................................................... 103
4.1.1.3 MTS ..................................................................................................... 104
4.1.1.4 LDH ..................................................................................................... 105
ix
4.1.1.5 FACS ................................................................................................... 105
4.1.2 HaCaT cell line ........................................................................................ 106
4.2 Objective and Aims ........................................................................................ 107
4.3 Material and methods ..................................................................................... 107
4.3.1 Materials .................................................................................................. 107
4.3.2 Sample preparation .................................................................................. 107
4.3.3 Aseptic techniques ................................................................................... 108
4.3.4 Cell culture general methods ................................................................... 108
4.3.5 Culture media preparation ....................................................................... 108
4.3.6 Cell sub culturing and counting ............................................................... 108
4.3.7 Cell Freezing and cell thawing ................................................................ 108
4.3.8 Cell growth study .................................................................................... 109
4.3.9 MTT assay ............................................................................................... 109
4.3.10 FACS analysis using (PI) propidium iodide and (FDA) fluorescein
diacetate 112
4.3.11 Data analysis ............................................................................................ 114
4.4 Results ............................................................................................................. 115
4.4.1 Cell growth study .................................................................................... 115
4.4.2 MTT assay ............................................................................................... 117
4.4.3 FACS analysis ......................................................................................... 121
4.5 Discussion ....................................................................................................... 124
4.6 Conclusion ...................................................................................................... 127
Chapter 5: Effect of PRE and Zn(II) on cell migration and wound closure in HaCaT
cell cultures 129
5.1 Introduction ..................................................................................................... 130
5.1.1 Wound healing processes ........................................................................ 130
5.1.2 Wounds and chronic wounds .................................................................. 131
5.1.3 Infected chronic wounds ......................................................................... 132
5.1.4 Modulation of wound healing time ......................................................... 133
5.1.5 Wound healing models ............................................................................ 134
5.1.6 Scratch testing model of wound healing ................................................. 135
x
5.2 Objective and aims ......................................................................................... 136
5.3 Materials and methods .................................................................................... 137
5.3.1 Materials .................................................................................................. 137
5.3.2 Aseptic technique .................................................................................... 137
5.3.3 Human adult, spontaneously immortalized, epidermal keratinocytes
(HaCaT cells) ......................................................................................................... 137
5.3.4 Culture media preparation ....................................................................... 137
5.3.5 Cell sub culturing and counting ............................................................... 138
5.3.6 Cell Freezing and cell thawing ................................................................ 138
5.3.7 Cell Migration Assay ............................................................................... 138
5.3.8 Data analysis ............................................................................................ 140
5.4 Results ............................................................................................................. 140
5.4.1 Cell migration assay ................................................................................ 140
5.5 Discussion ....................................................................................................... 151
5.6 Conclusion ...................................................................................................... 155
Chapter 6: Stability of PRE solution with and without ZnSO4 under different pH and
temperature conditions .................................................................................................. 157
6.1 Introduction ..................................................................................................... 158
6.2 Objective and aims ......................................................................................... 161
6.3 Materials and methods .................................................................................... 162
6.3.1 Materials .................................................................................................. 162
6.3.2 Sample preparation .................................................................................. 162
6.3.3 Real time stability study .......................................................................... 162
6.3.4 Accelerated storage stability testing ........................................................ 163
6.3.5 Data Processing ....................................................................................... 164
6.4 Results ............................................................................................................. 164
6.4.1 Real time stability determination ............................................................ 164
6.4.2 Accelerated stability testing .................................................................... 175
6.5 Discussion ....................................................................................................... 180
6.6 Conclusion ...................................................................................................... 183
xi
Chapter 7: Preparation of topical hydrogel formulations containing PRE and ZnSO4
185
7.1 Introduction ..................................................................................................... 186
7.1.1 Thickening agents .................................................................................... 188
7.1.2 Rheology ................................................................................................. 190
7.1.2.1 Cone and plate ..................................................................................... 191
7.1.3 Viscosity .................................................................................................. 192
7.1.4.1 Vibrational viscometer ......................................................................... 193
7.1.5 Contact angle measurement and topical drug delivery ........................... 194
7.1.5.1 Contact angle measurement and topical drug delivery ........................ 196
7.2 Objective and Aims ........................................................................................ 196
7.3 Materials and methods .................................................................................... 197
7.3.1 Materials .................................................................................................. 197
7.3.2 Preparation of Zinc and PRE solutions ................................................... 197
7.3.3 Hydrogel formulation using Methocel 856 ............................................. 197
7.3.4 Hydrogel formulation using Carbopol 974 ............................................. 198
7.3.5 Topical gel formulation using carrageenan ............................................. 198
7.3.6 Viscosity .................................................................................................. 198
7.3.7 Determination of formulation/skin wettability by contact angle
measurement .......................................................................................................... 199
7.3.8 Formulation stability ............................................................................... 201
7.3.9 Confirming the bactericidal activity of formulations and solution
containing PRE and Zn(II) against planktonic S. aureus ....................................... 201
7.4 Results ............................................................................................................. 203
7.4.1 Hydrogel formulation using Methocel 856N .......................................... 203
7.4.2 Hydrogel formulation using Carbopol 974 ............................................. 204
7.4.3 Topical gel formulation using carrageenan ............................................. 205
7.4.4 Viscometry .............................................................................................. 206
7.4.5 Contact angle on skin .............................................................................. 208
7.4.6 Stability and percentage drug content ..................................................... 210
7.4.7 Conformation of bactericidal activity of formulations and solution
containing PRE and Zn(II) against planktonic S. aureus ...................................... 211
xii
7.5 Discussion ....................................................................................................... 212
7.6 Conclusion ...................................................................................................... 215
Chapter 8: In vitro skin penetration and permeation of punicalagin and Zn(II) from
solution and hydrogel formulations containing PRE and ZnSO4 .................................. 217
8.1 Introduction ..................................................................................................... 218
8.1.1 In vitro porcine skin model ..................................................................... 219
8.1.2 Franz Diffusion Cell (FDC) .................................................................... 220
8.1.3 Skin Tape stripping ................................................................................. 221
8.2 Objectives and aims ........................................................................................ 222
8.3 Materials and methods .................................................................................... 223
8.3.1 Materials .................................................................................................. 223
8.3.2 Preparation of formulation and solution contain PRE and ZnSO4 ......... 223
8.3.3 Full thickness porcine ear skin preparation ............................................. 223
8.3.4 In vitro depth profile using tape stripping technique and skin remaining 224
8.3.5 Permeation of punicalagin and zinc through Heat Separated Epidermis
(HSE) 225
8.3.6 Data analysis ............................................................................................ 225
8.4 Results ............................................................................................................. 226
8.4.1 In vitro depth profile using Tape stripping technique and skin remaining
226
8.4.2 Permeation release of punicalagin and zinc through HSE ...................... 231
8.4.2.1 Punicalagin .......................................................................................... 231
8.4.2.2 Zinc ...................................................................................................... 233
8.5 Discussion ....................................................................................................... 233
8.6 Conclusion ...................................................................................................... 237
Chapter 9: In vitro ‘in-use’ skin sanitation potential of PRE and Zn(II) solution and
formulations 238
9.1 Introduction ..................................................................................................... 239
9.2 Objective and aims ......................................................................................... 240
9.3 Materials and methods .................................................................................... 240
9.3.1 Materials .................................................................................................. 240
9.3.2 Preparation of PRE and ZnSO4 solutions ................................................ 240
xiii
9.3.3 Aseptic technique .................................................................................... 240
9.3.4 Preparation of microbiology agar media and broth ................................. 241
9.3.5 Preparation of bacterial culture ............................................................... 241
9.3.6 Preparation of formulations ..................................................................... 241
9.3.7 Full thickness porcine ear skin preparation and skin sterilization prior to
the experiment ........................................................................................................ 241
9.3.8 Bacterial recovery from inoculated porcine skin following application of
PRE formulations and solution .............................................................................. 243
9.3.9 Statistical analysis ................................................................................... 244
9.4 Results ............................................................................................................. 244
9.4.1 Full thickness porcine ear skin preparation and skin sterilisation prior to
the experiment ........................................................................................................ 244
9.4.2 Bacterial recovery from inoculated porcine skin following application of
PRE formulations and solution .............................................................................. 245
9.5 Discussion ....................................................................................................... 247
9.6 Conclusion ...................................................................................................... 250
Chapter 10: General discussion ................................................................................... 251
10.1 General Discussion ......................................................................................... 252
References ..................................................................................................................... 259
xiv
LIST OF FIGURES
Figure 1-1 Pomegranate fruit (A) and its anatomical components, pomegranate peel
powder (B) pomegranate arils (C) and sun-dried pomegranate peel or rind (D) (Ismail et
al. 2012). ............................................................................................................................ 5
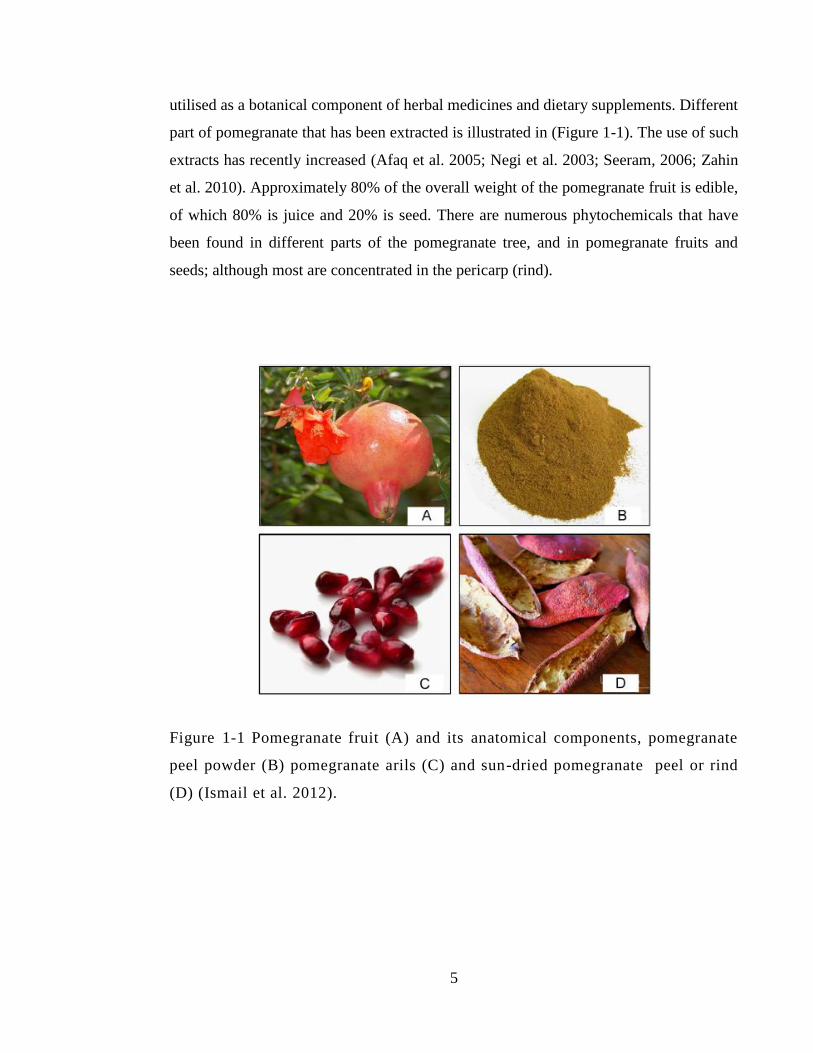
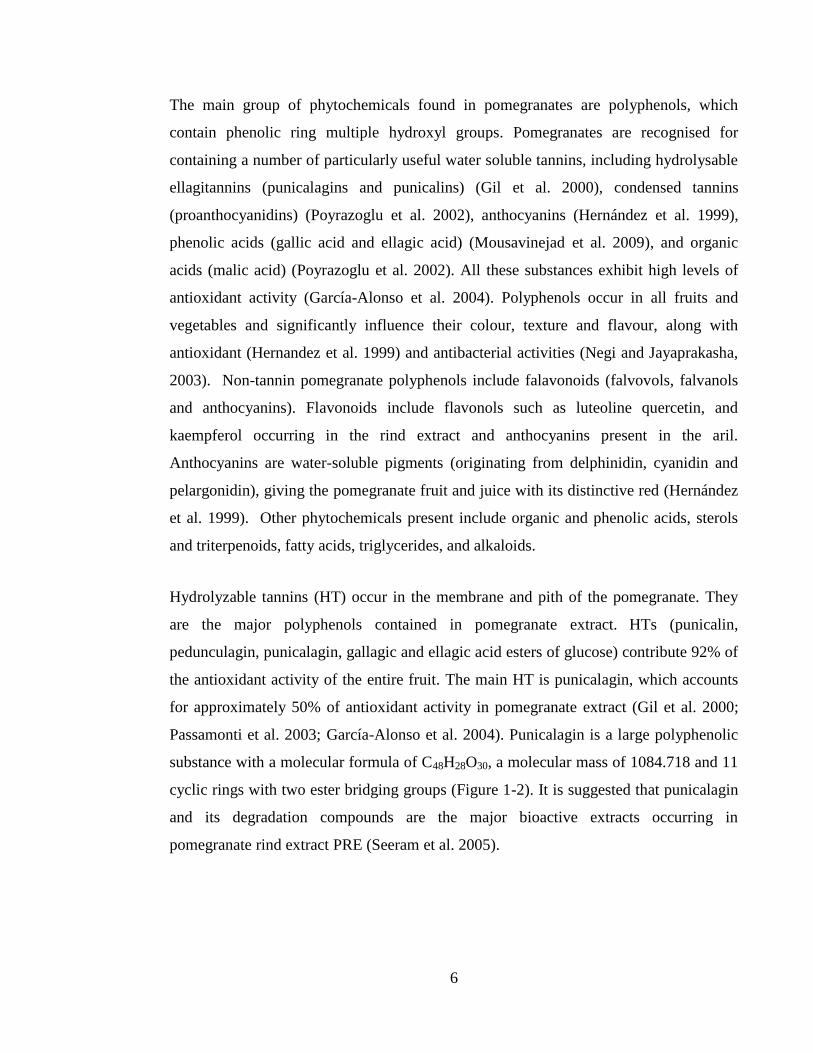
Figure 1-2 Chemical structures of punicalagin (top), the main polyphenol in
pomegranate extract, and its constituent moieties punicalin (lower left) and ellagic acid
(lower right) that resulted when degradation of punicalagin occur . ............................... 7
Figure 1-3 DiaGram shows human skin’s three layers: epidermis, dermis and
hypodermis. (www.webmd.com/skin-problems-and-treatments, 2020) . ....................... 18
Figure 1-4Impetigo skin infection clinical presentations. (Left) Typical crusting lesions
of nonbullous impetigo. (Right) Blistering lesions characteristic of non-bullous impetigo
(Williamson et al. 2017) ................................................................................................. 19
Figure 1-5 clinical presentation of Scarlet fever ............................................................. 20
Figure 1-6 Stages of peri-oral cold-sore development from tingling throughcrusting and
finally healing, at whcih stage the virus returns to its latenst stage within the body ...... 21
Figure 1-7 The clinical spectrum of bacterial affect on wound from colonisation to
infection (Edwards and Harding, 2004). ......................................................................... 30
Figure 1-8 Povidone iodine treatment on infected skin. ................................................. 34
Figure 2-1 Summary of the steps involved in pomegranate rind extraction, where (a)
pomegranates as purchased from local store, (b) excised pomegranate rind, (c) boiling
for 10 minutes, (d) centrifugation at5980 g (e) vacuum filtration though 0.45 µm nylon
filter (f) freeze drying. ..................................................................................................... 43
Figure 2-2 HPLC chromatogram of PRE showing α and β punicalagin in typical 1:2
ratio .................................................................................................................................. 46
Figure 2-3 Calibration curves of standard α and β punicalagin showing relationship
between punicalagin concentration and area under curve produced by HPLC analysis. 47
xv
Figure 2-4 The relationship between total mass of PRE extracted and β-punicalagin
within the freeze-dried PRE. ........................................................................................... 48
Figure 2-5 Schematic figure shows streak plate method to isolate bacterial colonies. ... 54
Figure 2-6 Gram stain of S. epidermidis (NCTC 11047) ................................................ 55
Figure 2-7 Gram stain shows Staphylococcus aureus (NCTC 10788) ........................... 55
Figure 2-8 Gram stain shows methicillin resistant Staphylococcus aureus MRSA (NCTC
12493) .............................................................................................................................. 55
Figure 2-9 Gram stain shows of Escherichia coli (NCTC 12923) .................................. 56
Figure 2-10 Gram stain showing Pseudomonas aeruginosa (NCTC 6750) ................... 56
Figure 2-11 Schematic figure showing the 9 gridded squares of haemocytometer ........ 59
Figure 3-1 Checkerboard representation of 96 well plate where an opaque well means
bacterial growth and clear one represents no growth for: (a) MRSA (NCTC 12493), (b)
S. epidermidis (NCTC 11047), (c) MSSA (NCTC 10788) and (d) P. aeruginosa (NCTC
6750) (n=3). ..................................................................................................................... 77
Figure 3-2 Bar chart showing log reduction in the colony forming unit (CFU) of MRSA
(12493) by ZnSO4 (M) alone in comparison to control (phthalate buffer pH 4.5) (n=3 ±
SD). .................................................................................................................................. 79
Figure 3-3 Bar chart showing log reduction in the colony forming unit (CFU) of MRSA
by PRE alone and in a combination with ZnSO4 in comparison to control (phthalate
buffer pH 4.5) (n=3 ± SD). .............................................................................................. 80
Figure 3-4 Bar chart showing log reduction in the number of CFU of P. aeruginosa by
PRE 1 mg/mL alone, ZnSO4 alone and in combination in comparison to control
(phthalate buffer pH 4.5) (n=3 ± SD). ............................................................................. 83
Figure 3-5 Bar chart showing log reduction in the number of CFU of S. epidermidis by
PRE 1 mg/mL alone, ZnSO4 alone and in a combination in comparison to a control
(phthalate buffer pH4.5) (n=3 ± SD). .............................................................................. 84
xvi
Figure 3-6Bar chart showing log reduction in the number of colony forming units (CFU)
of S. aureus by PRE 1 mg/mL alone, ZnSO4 alone and in combination in comparison to
control (phthalate buffer pH 4.5) (n=3 ± SD)................................................................. 86
Figure 3-7 Bar chart showing log reduction in the number of colony forming units
(CFU) of S. aureus MSSA by PRE 5 mg/mL alone, ZnSO4 alone and in combination in
comparison to control (phthalate buffer pH4.5) (n=3 ± SD). .......................................... 88
Figure 3-8 Bar chart showing log reduction in the number of CFU of E. coli by PRE 1
mg/mL alone, ZnSO4 alone and in combination in comparison to a control (phthalate
buffer pH 4.5) (n=3 ± SD). .............................................................................................. 91
Figure 3-9 Effects of the PRE ± Zn(II) against pre-formed biofilm-embedded S. aureus
after 24 hours incubation in the presence and absence of compounds. Results are shown
as mean absorbance of bacteria (indicates growth) ± SD at 570 nm from single replicate
from 6 experimental replicates. ....................................................................................... 92
Figure 3-10 Hypothesized meachanism of antibacterial action of polyphenol and
interactions cell wall components and plasma membrane of Gram-negative and Gram-
positive bacteria (Papuc et al. 2017) ............................................................................... 98
Figure 4-1 Schematic of cellular reduction of MTT to formazan ................................. 104
Figure 4-2 Cell growth curve of HaCaT cells against time in hours with lag, log and
plateau stage presented. Representative of 2 determinations. ....................................... 116
Figure 4-3 Linear regression of the log stage of HaCaT cell growth cycle. ................. 116
Figure 4-4 Dose dependent cytotoxicity curve of PRE in concentrations (5,10,20,50,100
mg/mL) over 24h, 72h, 124h, 168h. Data are expressed as three separated replicates with
6 experimental replicates each time (n=3±SD) ............................................................. 118
Figure 4-5 MTT assay results shows percentage of HaCaT cell viability compared to
control after treatment with different PRE concentration (5 μg/mL, 10 μg/mL, 20μg/mL,
50μg/mL and 100 μg/mL) over 168. Data are expressed as mean of three separate
replicates with 6 experimental replicates each time (n=3±SD). .................................... 119
Figure 4-6 MTT assay results showing percentage of HaCaT cell viability compared to
control after treatment with different ZnSO4 concentration (12.5µM, 25µM, 50 µM,
xvii
100µM) over 168. Data are expressed as mean of three separate replicates with 6
experimental replicates each time (n=3±SD). ............................................................... 120
Figure 4-7 MTT assay results shows percentage of HaCaT cell viability compared to
control after treatment with PRE+ZnSO4 combination at different concentrations. Data
are expressed as mean of three separate replicates with 6 experimental replicates each
time (n=3±SD). .............................................................................................................. 121
Figure 4-8 cells of intrest selection and gate setting in dot plot, using non treated and non
stained cell control which appear as red dot population (P1) as shown in Figure a) dot
plot of FSC vs. SSC, b) PI-H dot plot position when plotted against FDA-H in which
non stained cells shows at the corner left of the plot. .................................................... 122
Figure 4-9 FACS analysis setting the region of PI stained cells. The PI dye will be taken
up by dead cells and will accumulate with show of red florescence colour as shown in a)
the dead cell florescent in the upper left corner b) PI-H histoGram. ............................ 122
Figure 4-10 FACS analysis results using dual staining of HaCaT cells with PI and FDA
after 24h incubation with PRE ± ZnSO4. Data are expressed as percentage of PI stained
cells to PI stained control of three separate replicates with two experimental replicates
(n=2). ............................................................................................................................. 124
Figure 5-1 Normal progression and timescales of wound healing ............................... 130
Figure 5-2 Chronic wounds can be considered as stuck in-between the inflammatory and
proliferative stages of healing. ...................................................................................... 132
Figure 5-3 HaCaT cell line taken by Leica TCS SP5 Confocal Microscope. ............... 136
Figure 5-4 HaCaT Cell migration under Leica TCS SP5 Confocal Microscope in
presence of 1% FCS media containing control buffer at (a) 0h, (b) 24h and (c) at 48h
time point. ...................................................................................................................... 141
Figure 5-5 HaCaT Cell migration under Leica TCS SP5 Confocal Microscope in
presence of 1% FCS media containing PRE 2.5 µg/mL at (a) 0h, (b) 24h and (c) at 48h
time point. ...................................................................................................................... 141
xviii
Figure 5-6 HaCaT Cell migration under Leica TCS SP5 Confocal Microscope in
presence of 1% FCS media containing PRE 5 µg/mL at (a) 0h, (b) 24h and (c) at 48h
time point. ...................................................................................................................... 141
Figure 5-7 HaCaT Cell migration under Leica TCS SP5 Confocal Microscope in
presence of 1% FCS media containing PRE 10 µg/mL at (a) 0h, (b) 24h and (c) at 48h
time point. ...................................................................................................................... 142
Figure 5-8 HaCaT Cell migration under Leica TCS SP5 Confocal Microscope in
presence of 1% FCS media containing PRE 20 µg/mL at (a) 0h, (b) 24h and (c) at 48h
time point. ...................................................................................................................... 142
Figure 5-9 HaCaT Cell migration under Leica TCS SP5 Confocal Microscope in
presence of 1% FCS media containing PRE 50 µg/mL at (a) 0h, (b) 24h and (c) at 48h
time point. ...................................................................................................................... 143
Figure 5-10HaCaT Cell migration under Leica TCS SP5 Confocal Microscope in
presence of 1% FCS media containing PRE 100 µg/mL at (a) 0h, (b) 24h and (c) at 48h
time point. ...................................................................................................................... 143
Figure 5-11 Effect of pomegranate rind extract on wound closure percentage in scratch
test at 24 and 48 h (37 °C; 5% CO2) in DMEM medium containing 1% FBS: (1) Control
buffer, (2) PRE 2.5 µg/mL, (3) PRE 5 µg/mL, (4) PRE 10 µg/mL, (5) PRE 20 µg/mL,
(6) PRE 50 µg/mL, (7) PRE 100 µg/mL. Data are expressed as percent wound area
closure in comparison to the original scratch area at 0h (n=3±SD). ............................. 144
Figure 5-12 Cell migration under Leica TCS SP5 Confocal Microscope in presence of
1% FCS media containing ZnSO4 25 μM at (a) 0h, (b) 24h and (c) at 48h time point. 145
Figure 5-13 Cell migration under Leica TCS SP5 Confocal Microscope in presence of
1% FCS media containing ZnSO4 50 μM at (a) 0h, (b) 24h and (c) at 48h time point. 145
Figure 5-14 Cell migration under Leica TCS SP5 Confocal Microscope in presence of
1% FCS media containing ZnSO4 100 μM at (a) 0h, (b) 24h and (c) at 48h time point.
....................................................................................................................................... 145
Figure 5-15 Effect of ZnSO4 on the wound closure percentage in scratch test at 24 and
48 h (37 °C; 5% CO2) in DMEM medium containing 1% FBS: (1) ZnSO4, (2) 25 μM
xix
ZnSO4 (3) 50 μM, (4) ZnSO4 100μM. Data are expressed as percent wound area closure
in comparison to the original area at 0h (n=3±SD). ...................................................... 146
Figure 5-16 Cell migration under Leica TCS SP5 Confocal Microscope in presence of
1% FCS media containing combination 1 (PRE5 μg/mL+ZnSO4 25 µM) at (a) 0h, (b)
24h and (c) at 48h time point. ........................................................................................ 147
Figure 5-17 Cell migration under Leica TCS SP5 Confocal Microscope in presence of
1% FCS media containing combination 1 (PRE5 μg/mL+ZnSO4 50 µM) at (a) 0h, (b)
24h and (c) at 48h time point. ........................................................................................ 147
Figure 5-18 Cell migration under Leica TCS SP5 Confocal Microscope in presence of
1% FCS media containing combination 1 (PRE5 μg/mL+ZnSO4 100 µM) at (a) 0h, (b)
24h and (c) at 48h time point. ........................................................................................ 147
Figure 5-19 Cell migration under Leica TCS SP5 Confocal Microscope in presence of
1% FCS media containing combination 1 (PRE 10 μg/mL+ZnSO4 25 µM) at (a) 0h, (b)
24h d (c) at 48h time point. ........................................................................................... 149
Figure 5-20 Cell migration under Leica TCS SP5 Confocal Microscope in presence of
1% FCS media containing combination 1 (PRE 10 μg/mL+ZnSO4 50 µM) at (a) 0h, (b)
24h and (c) at 48h time point. ........................................................................................ 149
Figure 5-21 Cell migration under Leica TCS SP5 Confocal Microscope in presence of
1% FCS media containing combination 1 (PRE 10 μg/mL + ZnSO4 100 µM) at (a) 0h,
(b) 24h and (c) at 48h time point. .................................................................................. 149
Figure 5-22 Effect of 6 different PRE +ZnSO4 combination on the wound closure
percentage at 24 and 48 h using scratch test performed on of HaCaT keratinocyte
monolayer (37 °C; 5% CO2) DMEM medium containing 1% FBS compared to control
untreated cells. Data are expressed as percent wound area closure in comparison to the
original area at 0h (n=3±SD). ........................................................................................ 150
Figure 6-1 Total α and β punicalagin concentration (mg/mL) in PRE with and without
ZnSO4 in pH4.5 and pH 7 at (-20˚C) after 180 days storage time (n=3 ± SD). This shows
stable concentration of punicalagin recovered over 6 months (-20 °C). ....................... 169
Figure 6-2 HPLC chromatogram showing α and β punicalagin peaks in PRE individual
sample (right chromatogram) and PRE+ZnSO4 (left chromatogram). Blue line shows
xx
peaks at initial concentration at time zero, red line shows peaks after 6 months storage in
pH4.5 at -20 °C. Punicalagin α and β peaks show same areas under peak after 6 months
storage). ......................................................................................................................... 170
Figure 6-3 HPLC chromatogram showing α and β punicalagin peaks in PRE individual
sample (right chromatogram) and PRE+ZnSO4 (left chromatogram). Blue line shows
peaks at initial concentration at time zero, red line shows peaks after 6 month storage in
pH7 at -20 °C. Punicalagin α and β peaks show same area under peak after 6 months
storage. .......................................................................................................................... 170
Figure 6-4 Total α and β punicalagin concentration (mg/mL) in PRE with and without
ZnSO4 in pH 4.5 and pH 7 at (2-4 °C) (n=3 ± SD) the plot shows >93% of punicalagin
was kept at pH 4.5 and > 84% at pH 7 after 180 days storage time. ............................. 171
Figure 6-5 HPLC chromatograms showing α and β Punicalagin peaks in PRE individual
sample (right chromatogram) and PRE+ZnSO4 (left chromatogram). Blue line shows
peaks at initial concentration at time zero, red line shows peaks after 6 month storage in
pH 4.5 at 2-4 ˚C. The plot shows that punicalagin α and β peaks gave 94 % (left) and
93.2 % (right) of original area under peak after 6 months storage. ............................... 172
Figure 6-6 HPLC chromatograms showing α and β Punicalagin peaks in PRE individual
sample (right chromatogram) and PRE+ZnSO4 (left chromatogram). Blue line shows
peaks at initial concentration at time zero, red line shows peaks after 6 month storage in
pH 7 at 2-4 °C. The plot shows that punicalagin α and β peaks gave 85.2 % (left) and
84.7 % (right) of original area under peak after 6 months storage. ............................... 172
Figure 6-7 Total α and β punicalagin concentration (mg/mL) in PRE with and without
ZnSO4 in pH 4.5 and pH 7 at (20 ˚C) after 180 days storage time (n=3 ± SD). Plot shows
significant loss in punicalagin content at both pH 4.5 and pH7. ................................... 173
Figure 6-8 HPLC chromatogram showing α and β punicalagin peaks in PRE individual
sample (right chromatogram) and PRE+ZnSO4 (left chromatogram). Blue line shows
peaks at initial concentration at time zero, red line shows peaks after 6 months storage in
pH 4.5 at 20 °C. The chromatograms show that punicalagin α and β peaks gave 75.2 %
(left) and 75.9 % (right) of original area under peak and increase in ellagic acid peak at
22 minutes after 6 months storage. ................................................................................ 174
Figure 6-9 HPLC chromatogram showing α and β punicalagin peaks in PRE individual
sample (right chromatogram) and PRE+ZnSO4 (left chromatogram). Blue line shows
xxi
peaks at initial concentration at time zero, red line shows peaks after 6 months storage in
pH 7 at 20 °C. The chromatograms show punicalagin α and β peaks gave 70.8 % and
(left) and 69.3% (right) of original area under peak and increase in ellagic acid peak at
22 minutes after 6 months storage. ................................................................................ 174
Figure 6-10 Accelerated stability profiles showing total α and β-punicalagin percentage
in PRE samples in the absence and presence of Zn(II), pH 4.5 phthalate buffer at three
temperatures: 40 °C and 50 °C over a 4 week period ................................................... 176
Figure 6-11 Arrhenius plot for PRE solution in pH4.5 (n=2, ± SD). ln k value of 50 °C,
40 °C and extrapolation was made to predict the k value at 20 °C and 4 °C plot against
1/T (Kelvin). .................................................................................................................. 178
Figure 6-12 Arrhenius plot for PRE/ZnSO4 solution in pH 4.5 (n=3, ± SD). ln k value of
50 °C, 40 °C and extrapolation was made to predict the k value at 20 °C and 4 °C plot
against 1/T (kelvin). ...................................................................................................... 179
Figure 6-13 HPLC chromatogram showing α and β punicalagin of PRE alone (blue line)
and PRE with ZnSO4 (red line). The chromatogram shows no new peak introduction
and no alteration of the original peaks of PRE chromatogram after adding Zn(II). ..... 183
Figure 7-1 Commercially available chlorhexidine-based sanitisers at concentrations of
0.05% (Baxter antiseptic solution) and 4% (Hibiscrub skin cleanser). ......................... 188
Figure 7-2 Shear stress as function of shear rate in different flow profile (George and
Qureshi 2013) ................................................................................................................ 190
Figure 7-3 Left: A&D SV10 Vibro Viscometer; Right: schematic of the vibrational
viscometer sensor. ......................................................................................................... 193
Figure 7-4 contact angle measurement of different material with different contact angles.
....................................................................................................................................... 194
Figure 7-5 Contact angle camera set up for capturing side-on images of 50 μL quots of
formulation on porcine skin. ......................................................................................... 200
Figure 7-6HPMC formulation showing at room temperature (left) and at 32 °C inside the
viscometer sample well (right). ..................................................................................... 207
xxii
Figure 7-7 Side-on images of porcine full thickness skin. Upper: untreated. Middle:
added 50 μL of PRE/Zn formulations (L-R) aqueous (θ1), Carbopol (θ2), carrageenan
(θ3) and HPMC (θ4) at 32 °C. Lower: Formulation/ skin contact angles, θ for each
formulation. ................................................................................................................... 209
Figure 7-8 stability data showing punicalagin content in (μg/mL), the three formulations
all contain (PRE 1 mg/mL + ZnSO4 0.25M): Carbopol 974, carrageenan and HPMC over
six month storage at 2-4 °C. Data are expressed as mean punicalagin concentration
(n=3±SD). ...................................................................................................................... 211
Figure 7-9 Effect of the PRE ± Zn(II) in solution form and formulations against
planktonic S. aureus after 24 hours incubation in the presence and absence of tested
compounds. Results are shown as mean absorbance of bacteria (indicate growth) ±SD
from a (single replicate and 6 experimental replicates)................................................. 212
Figure 7-10Scanning electronic microscope SEM image of human skin stratum corneum
(Sciencephoto.com) ....................................................................................................... 214
Figure 8-1 All glass Franz diffusion cell (FDC). .......................................................... 221
Figure 8-2 General steps shows the tape stripping method using porcine skin............. 222
Figure 8-3 Punicalagin penetration profile through HSE recovered from tape stripping
after application of 1g of three topical formulations at 24h: blue, HPMC 856
formulation; orange, carrageenan formulation; grey, Carbopol formulation and yellow,
solution. All formulations contained same concentration of PRE/ZnSO4 (PRE
1mg/mL+ZnSO4 0.25M) (n=3±SD). .............................................................................. 227
Figure 8-4 Bar chart showing average mass of punicalagin recovered from remaining
skin after tape stripping method, after application of 1 g of three formulations and
solution that contained same concentration of PRE/ZnSO4 (PRE 1mg/mL+ZnSO4
0.25M) compared to control (vehicle only no PRE or ZnSO4) at 24 hours (n=3 ±SD).
....................................................................................................................................... 228
Figure 8-5 Bar chart showing the depth permeation profile of punicalagin through HSE
recovered from tape stripping and skin remaining of after application of 1g of three
formulation and solution that contained same concentration of PRE/ZnSO4 (PRE
1mg/mL + ZnSO4 0.25M ) compared to control (vehicle only no PRE or zinc) at 24
hours, (n=3±SD). ........................................................................................................... 229
xxiii
Figure 8-6 Average mass of zinc recovered from tape stripping of HSE membrane,
showing epidermis and (skin remaining) after application of 1g of three formulation and
solution that contained same concentration of PRE/zinc (PRE 1mg/mL + ZnSO4 0.25M
), compared to control (vehicle only no PRE or zinc) at 24 hours (n=3 ±SD). ............. 230
Figure 8-7 Cumulative permeation of punicalagin through Heat Separated Epidermis
HSE (receptor phase content), over 24 hours after application of 1g of three formulation
and solution that contained same concentration of PRE/ZnSO4 (PRE 1mg/mL + ZnSO4
0.25M), HPMC 856 formulation (orange line), carrageenan formulation (blue line), PRE
1mg/mL + ZnSO4 0.25 M in phthalate buffer pH4.5 (gray line) and blank control
(vehicle only, no PRE or ZnSO4) (yellow line) (n=3±SD). .......................................... 232
Figure 8-8 Zinc permeation through Heat Separated Epidermis (HSE) (receptor phase
content) at 24 hours after application of 1g of three formulation and solution that
contained same concentration of PRE/ZnSO4 (PRE 1mg/mL + ZnSO4 0.25M) compared
to control (vehicle only no PRE or zinc) at 24h, (n=3 ±SD (n=2±SD). ........................ 233
Figure 9-1 Sterilisation of porcine skin samples by treatment with UV lamp to ensure
skin microbes had been eradicated prior to the inoculating with bacteria. ................... 242
Figure 9-2 Muller Hinton agar plate showing microorganism growth from swab taking
from porcine skin after 70% ethanol sterilization (left) and sterilization with UV for 10
minutes pulses was employed to each side (right). ....................................................... 245
Figure 9-3 Viable cell number (log10 CFU/mL) of MRSA recovered from skin after
incubation for 0 and 3 hours (n=2±SD). ........................................................................ 246
Figure 9-4 log reduction value of MRSA inoculated in vitro skin after 20 minutes
exposure timeto (100 µL) of test formulations: HPMC856, carrageenan and Carbopol
974 PRE 1mg/mL + ZnSO4 0.25 M (pH4.5) and chlorhexidine 4% after application .
Results are shown as mean log redcution value compared to control untreated group
(n=2±SD). ...................................................................................................................... 247
xxiv
LIST OF TABLES
Table 2-1 Gradient elution timetable used for punicalagin and pomegranate rind extract.
......................................................................................................................................... 45
Table 3-1FIC index interpretation (Bonapace et al. 2002) .............................................. 63
Table 3-2 Concentration range of PRE and ZnSO4 tested using the checkerboard test .. 71
Table 3-3 MIC values of PRE and ZnSO4 against five bacterial strains: MRSA (NCTC
12493), E. coli (NCTC 12923), P. aeruginosa (NCTC 6750), S. epidermidis (NCTC
11047) and S. aureus (NCTC 10788) (n=3). ................................................................... 75
Table 3-4 FIC index results from checkerboard test, with MIC level of PRE and ZnSO4
at: MRSA (NCTC 12493), E. coli (NCTC 12923), P. aeruginosa ( NCTC 6750), S.
epidermidis (NCTC 11047) and S. aureus (NCTC 10788). ........................................... 78
Table 3-5 Log reduction value in the colony forming unit (CFU) of MRSA by PRE
alone, ZnSO4 alone and combination in comparison to control (phthalate buffer pH 4.5)
(n=3). ............................................................................................................................... 81
Table 3-6 Log reduction in the number of CFU of P. aeruginosa by PRE 1 mg/mL
alone, ZnSO4 alone and in a combination in comparison to control (phthalate buffer pH
4.5) (n=3). ........................................................................................................................ 83
Table 3-7 Log reduction in the number of CFU of S. epidermidis by PRE 1mg/mL alone,
ZnSO4 alone and in a combination in comparison to control (phthalate buffer pH 4.5)
(n=3). ............................................................................................................................... 85
Table 3-8 Log reduction in the number of colony forming units (CFU) of S. aureus by
PRE 1 mg/mL alone, ZnSO4 alone and in combination in comparison to control
(phthalate buffer pH 4.5). ................................................................................................ 87
Table 3-9 Log reduction in the number of colony forming units (CFU) of S. aureus
MSSA by PRE 5 mg/mL alone, ZnSO4 alone and in combination in comparison to
control (phthalate buffer pH 4.5). .................................................................................... 88
xxv
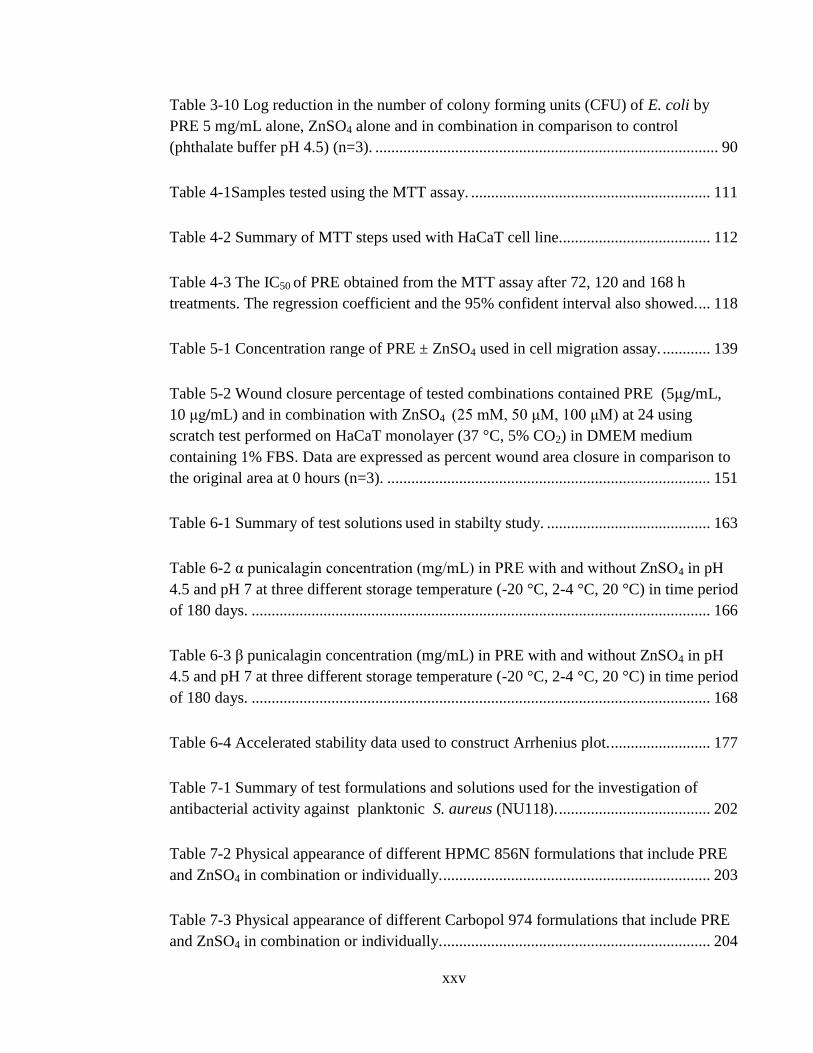
Table 3-10 Log reduction in the number of colony forming units (CFU) of E. coli by
PRE 5 mg/mL alone, ZnSO4 alone and in combination in comparison to control
(phthalate buffer pH 4.5) (n=3). ...................................................................................... 90
Table 4-1Samples tested using the MTT assay. ............................................................ 111
Table 4-2 Summary of MTT steps used with HaCaT cell line...................................... 112
Table 4-3 The IC50 of PRE obtained from the MTT assay after 72, 120 and 168 h
treatments. The regression coefficient and the 95% confident interval also showed. ... 118
Table 5-1 Concentration range of PRE ± ZnSO4 used in cell migration assay. ............ 139
Table 5-2 Wound closure percentage of tested combinations contained PRE (5μg/mL,
10 μg/mL) and in combination with ZnSO4 (25 mM, 50 μM, 100 μM) at 24 using
scratch test performed on HaCaT monolayer (37 °C, 5% CO2) in DMEM medium
containing 1% FBS. Data are expressed as percent wound area closure in comparison to
the original area at 0 hours (n=3). ................................................................................. 151
Table 6-1 Summary of test solutions used in stabilty study. ......................................... 163
Table 6-2 α punicalagin concentration (mg/mL) in PRE with and without ZnSO4 in pH
4.5 and pH 7 at three different storage temperature (-20 °C, 2-4 °C, 20 °C) in time period
of 180 days. ................................................................................................................... 166
Table 6-3 β punicalagin concentration (mg/mL) in PRE with and without ZnSO4 in pH
4.5 and pH 7 at three different storage temperature (-20 °C, 2-4 °C, 20 °C) in time period
of 180 days. ................................................................................................................... 168
Table 6-4 Accelerated stability data used to construct Arrhenius plot. ......................... 177
Table 7-1 Summary of test formulations and solutions used for the investigation of
antibacterial activity against planktonic S. aureus (NU118). ...................................... 202
Table 7-2 Physical appearance of different HPMC 856N formulations that include PRE
and ZnSO4 in combination or individually. ................................................................... 203
Table 7-3 Physical appearance of different Carbopol 974 formulations that include PRE
and ZnSO4 in combination or individually. ................................................................... 204
xxvi
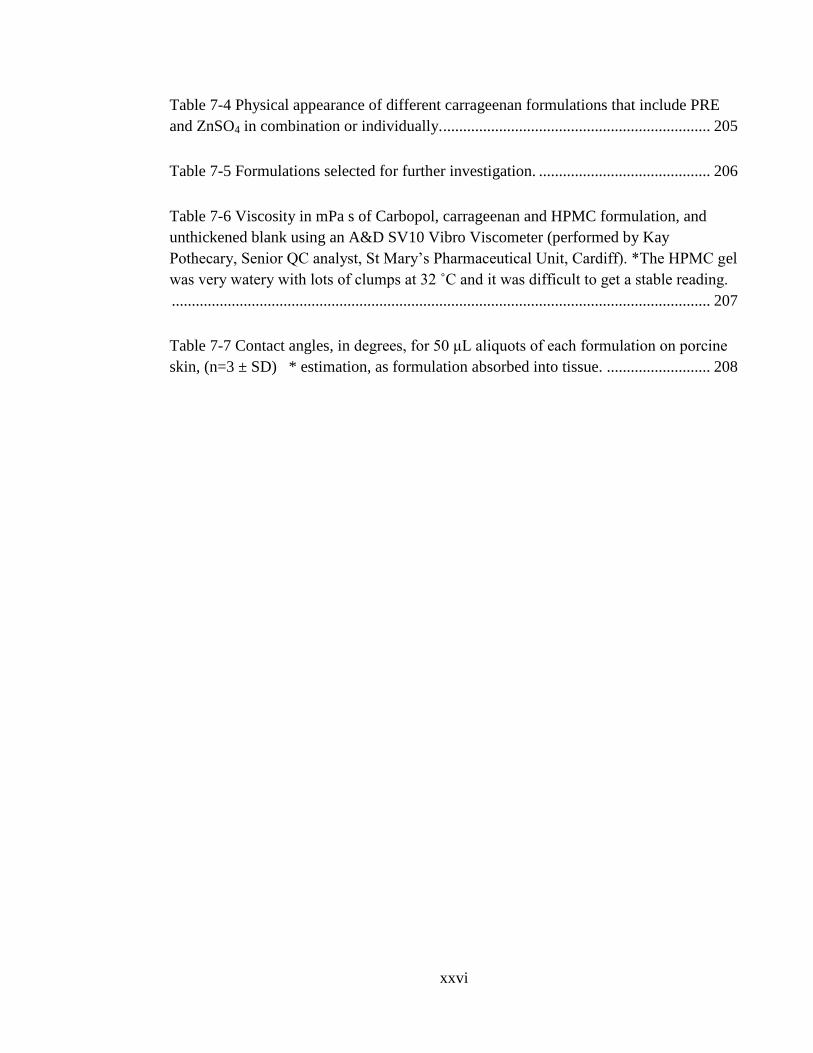
Table 7-4 Physical appearance of different carrageenan formulations that include PRE
and ZnSO4 in combination or individually. ................................................................... 205
Table 7-5 Formulations selected for further investigation. ........................................... 206
Table 7-6 Viscosity in mPa s of Carbopol, carrageenan and HPMC formulation, and
unthickened blank using an A&D SV10 Vibro Viscometer (performed by Kay
Pothecary, Senior QC analyst, St Mary’s Pharmaceutical Unit, Cardiff). *The HPMC gel
was very watery with lots of clumps at 32 ˚C and it was difficult to get a stable reading.
....................................................................................................................................... 207
Table 7-7 Contact angles, in degrees, for 50 μL aliquots of each formulation on porcine
skin, (n=3 ± SD) * estimation, as formulation absorbed into tissue. .......................... 208

1
Chapter 1: General introduction
2
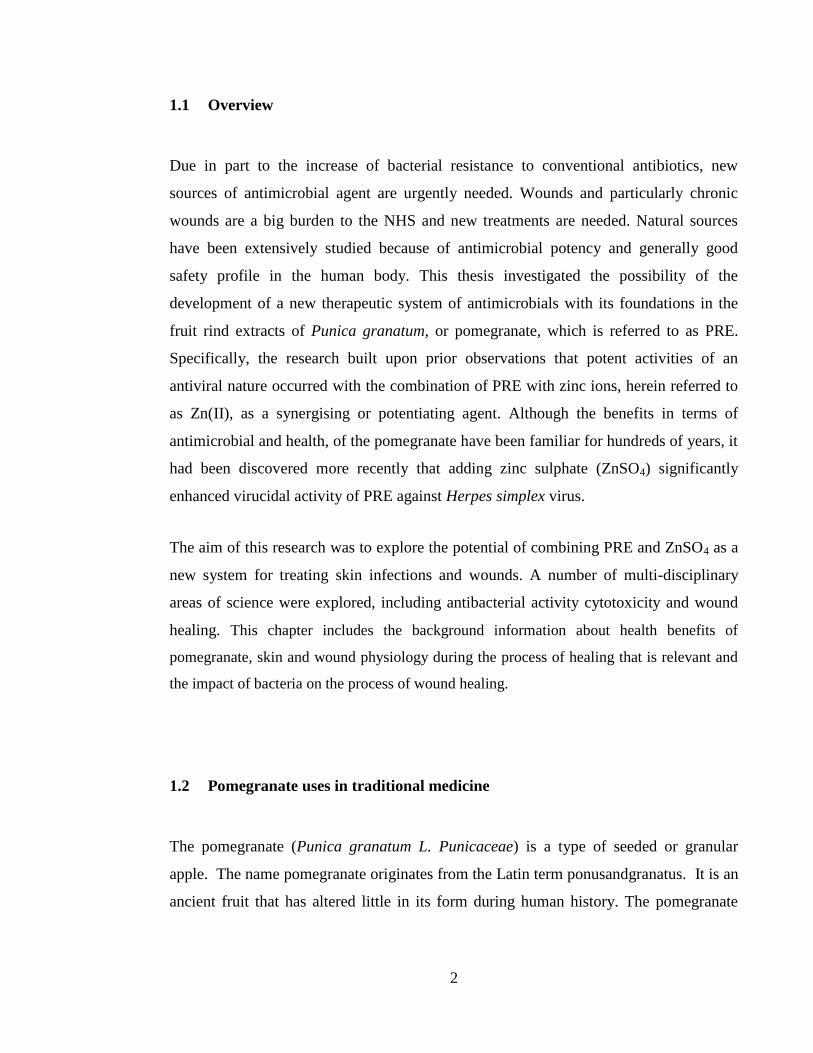
1.1 Overview
Due in part to the increase of bacterial resistance to conventional antibiotics, new
sources of antimicrobial agent are urgently needed. Wounds and particularly chronic
wounds are a big burden to the NHS and new treatments are needed. Natural sources
have been extensively studied because of antimicrobial potency and generally good
safety profile in the human body. This thesis investigated the possibility of the
development of a new therapeutic system of antimicrobials with its foundations in the
fruit rind extracts of Punica granatum, or pomegranate, which is referred to as PRE.
Specifically, the research built upon prior observations that potent activities of an
antiviral nature occurred with the combination of PRE with zinc ions, herein referred to
as Zn(II), as a synergising or potentiating agent. Although the benefits in terms of
antimicrobial and health, of the pomegranate have been familiar for hundreds of years, it
had been discovered more recently that adding zinc sulphate (ZnSO4) significantly
enhanced virucidal activity of PRE against Herpes simplex virus.
The aim of this research was to explore the potential of combining PRE and ZnSO4 as a
new system for treating skin infections and wounds. A number of multi-disciplinary
areas of science were explored, including antibacterial activity cytotoxicity and wound
healing. This chapter includes the background information about health benefits of
pomegranate, skin and wound physiology during the process of healing that is relevant and
the impact of bacteria on the process of wound healing.
1.2 Pomegranate uses in traditional medicine
The pomegranate (Punica granatum L. Punicaceae) is a type of seeded or granular
apple. The name pomegranate originates from the Latin term ponusandgranatus. It is an
ancient fruit that has altered little in its form during human history. The pomegranate
3
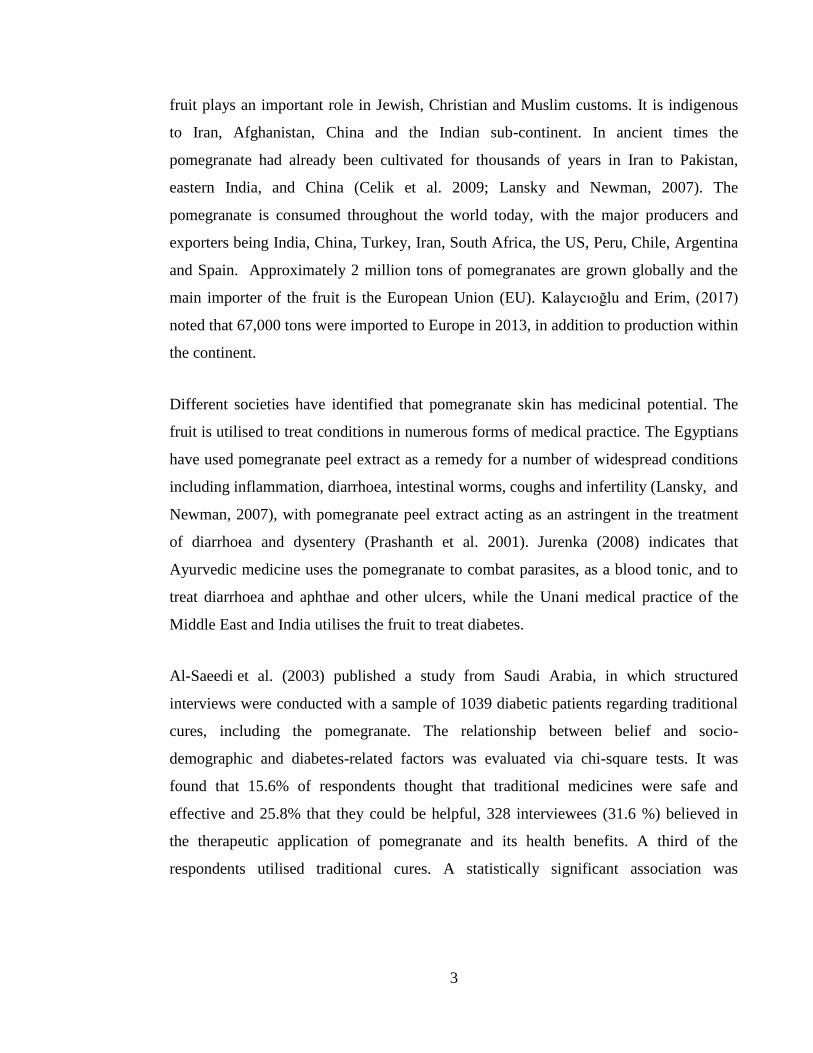
fruit plays an important role in Jewish, Christian and Muslim customs. It is indigenous
to Iran, Afghanistan, China and the Indian sub-continent. In ancient times the
pomegranate had already been cultivated for thousands of years in Iran to Pakistan,
eastern India, and China (Celik et al. 2009; Lansky and Newman, 2007). The
pomegranate is consumed throughout the world today, with the major producers and
exporters being India, China, Turkey, Iran, South Africa, the US, Peru, Chile, Argentina
and Spain. Approximately 2 million tons of pomegranates are grown globally and the
main importer of the fruit is the European Union (EU). Kalaycıoğlu and Erim, (2017)
noted that 67,000 tons were imported to Europe in 2013, in addition to production within
the continent.
Different societies have identified that pomegranate skin has medicinal potential. The
fruit is utilised to treat conditions in numerous forms of medical practice. The Egyptians
have used pomegranate peel extract as a remedy for a number of widespread conditions
including inflammation, diarrhoea, intestinal worms, coughs and infertility (Lansky, and
Newman, 2007), with pomegranate peel extract acting as an astringent in the treatment
of diarrhoea and dysentery (Prashanth et al. 2001). Jurenka (2008) indicates that
Ayurvedic medicine uses the pomegranate to combat parasites, as a blood tonic, and to
treat diarrhoea and aphthae and other ulcers, while the Unani medical practice of the
Middle East and India utilises the fruit to treat diabetes.
Al-Saeedi et al. (2003) published a study from Saudi Arabia, in which structured
interviews were conducted with a sample of 1039 diabetic patients regarding traditional
cures, including the pomegranate. The relationship between belief and socio-
demographic and diabetes-related factors was evaluated via chi-square tests. It was
found that 15.6% of respondents thought that traditional medicines were safe and
effective and 25.8% that they could be helpful, 328 interviewees (31.6 %) believed in
the therapeutic application of pomegranate and its health benefits. A third of the
respondents utilised traditional cures. A statistically significant association was
4
demonstrated between belief in traditional medicine and variables including female
gender, family history of diabetes, duration of this illness and dietary factors.
1.3 General health benefits of pomegranates
Various studies have demonstrated the therapeutic effects of pomegranate on a number
of conditions; for example cancer prevention and therapy (Turrini et al. 2015) and
prostate cancer more specifically (Wang and Martins-Green 2014), chronic
inflammatory conditions (Viladomiu et al. 2013), cardiovascular diseases (Vlachojannis
et al. 2015), spoilage and pathogenic microorganisms (Tanveer et al. 2015), obesity (Al-
Muammar and Khan 2012) and as an anti-inflammatory agent (Houston et al. 2017a).
Miguel et al. (2010) referred to a number of ongoing clinical trials that investigated the
therapeutic benefits of pomegranate extract. It was noted that a number of applications
of pomegranate, among other species, had been patented recently, demonstrating their
usefulness: skin treatments (Gross and Gross 2009) and, more specifically, to enhance
skin appearance (Jacobs 2010), to maintain and enhance skin moisture levels (Vilinsky
2010), to prevent skin dryness and aging (Cho et al. 2010); to inhibit the impact of
mental stress on the hair (Briese et al. 2010) and to combat alopecia via external
application (Jo et al. 2009); to tone the waist and abdomen (Khan and Zaidi 2009); to
prevent dental conditions such as plaque (Babu et al. 2009); and to treat sickle cell
disease (Desai and Desai 2009; Desai 2010). There are also patents relating to aspects of
the health benefits of pomegranate.
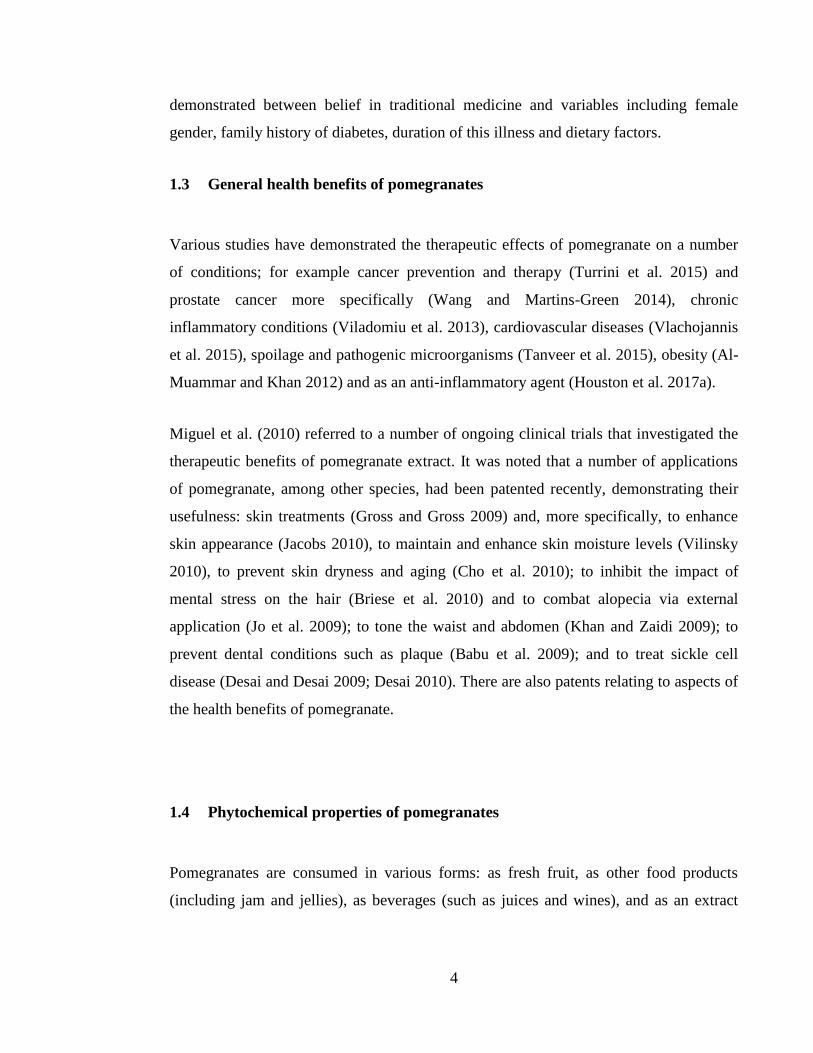
1.4 Phytochemical properties of pomegranates
Pomegranates are consumed in various forms: as fresh fruit, as other food products
(including jam and jellies), as beverages (such as juices and wines), and as an extract
5
utilised as a botanical component of herbal medicines and dietary supplements. Different
part of pomegranate that has been extracted is illustrated in (Figure 1-1). The use of such
extracts has recently increased (Afaq et al. 2005; Negi et al. 2003; Seeram, 2006; Zahin
et al. 2010). Approximately 80% of the overall weight of the pomegranate fruit is edible,
of which 80% is juice and 20% is seed. There are numerous phytochemicals that have
been found in different parts of the pomegranate tree, and in pomegranate fruits and
seeds; although most are concentrated in the pericarp (rind).
Figure 1-1 Pomegranate fruit (A) and its anatomical components, pomegranate
peel powder (B) pomegranate arils (C) and sun-dried pomegranate peel or rind
(D) (Ismail et al. 2012).
6
The main group of phytochemicals found in pomegranates are polyphenols, which
contain phenolic ring multiple hydroxyl groups. Pomegranates are recognised for
containing a number of particularly useful water soluble tannins, including hydrolysable
ellagitannins (punicalagins and punicalins) (Gil et al. 2000), condensed tannins
(proanthocyanidins) (Poyrazoglu et al. 2002), anthocyanins (Hernández et al. 1999),
phenolic acids (gallic acid and ellagic acid) (Mousavinejad et al. 2009), and organic
acids (malic acid) (Poyrazoglu et al. 2002). All these substances exhibit high levels of
antioxidant activity (García-Alonso et al. 2004). Polyphenols occur in all fruits and
vegetables and significantly influence their colour, texture and flavour, along with
antioxidant (Hernandez et al. 1999) and antibacterial activities (Negi and Jayaprakasha,
2003). Non-tannin pomegranate polyphenols include falavonoids (falvovols, falvanols
and anthocyanins). Flavonoids include flavonols such as luteoline quercetin, and
kaempferol occurring in the rind extract and anthocyanins present in the aril.
Anthocyanins are water-soluble pigments (originating from delphinidin, cyanidin and
pelargonidin), giving the pomegranate fruit and juice with its distinctive red (Hernández
et al. 1999). Other phytochemicals present include organic and phenolic acids, sterols
and triterpenoids, fatty acids, triglycerides, and alkaloids.
Hydrolyzable tannins (HT) occur in the membrane and pith of the pomegranate. They
are the major polyphenols contained in pomegranate extract. HTs (punicalin,
pedunculagin, punicalagin, gallagic and ellagic acid esters of glucose) contribute 92% of
the antioxidant activity of the entire fruit. The main HT is punicalagin, which accounts
for approximately 50% of antioxidant activity in pomegranate extract (Gil et al. 2000;
Passamonti et al. 2003; García-Alonso et al. 2004). Punicalagin is a large polyphenolic
substance with a molecular formula of C48H28O30, a molecular mass of 1084.718 and 11
cyclic rings with two ester bridging groups (Figure 1-2). It is suggested that punicalagin
and its degradation compounds are the major bioactive extracts occurring in
pomegranate rind extract PRE (Seeram et al. 2005).
7
Figure 1-2 Chemical structures of punicalagin (top), the main polyphenol in
pomegranate extract, and its constituent moieties punicalin (lower left) and
ellagic acid (lower right) that resulted when degradation of punicalagin occur .
1.5 Antioxidant activity of pomegranates
The free radical reactive oxygen species (ROS) such as hydrogen peroxide has been
linked to many diseases and their presence in high level will increase the oxidative stress
on cell leading to its damage. Elevated levels of ROS and impaired mechanism of
detoxification of the free radical ROS, has been found in non-healing wound site (Cano
Sanchez et al. 2018). Antioxidant activity conferred by polyphenolic substances is
known to provide health benefits via free radical scavenging activity, which leads to
reduced oxidative stress and limit their damaging effect. These include hydrolysable
tannins, which are mostly found in the peel and mesocarp of pomegranates. Polyphenols
contribute significantly to the organoleptic properties of pomegranate arils and juices, as
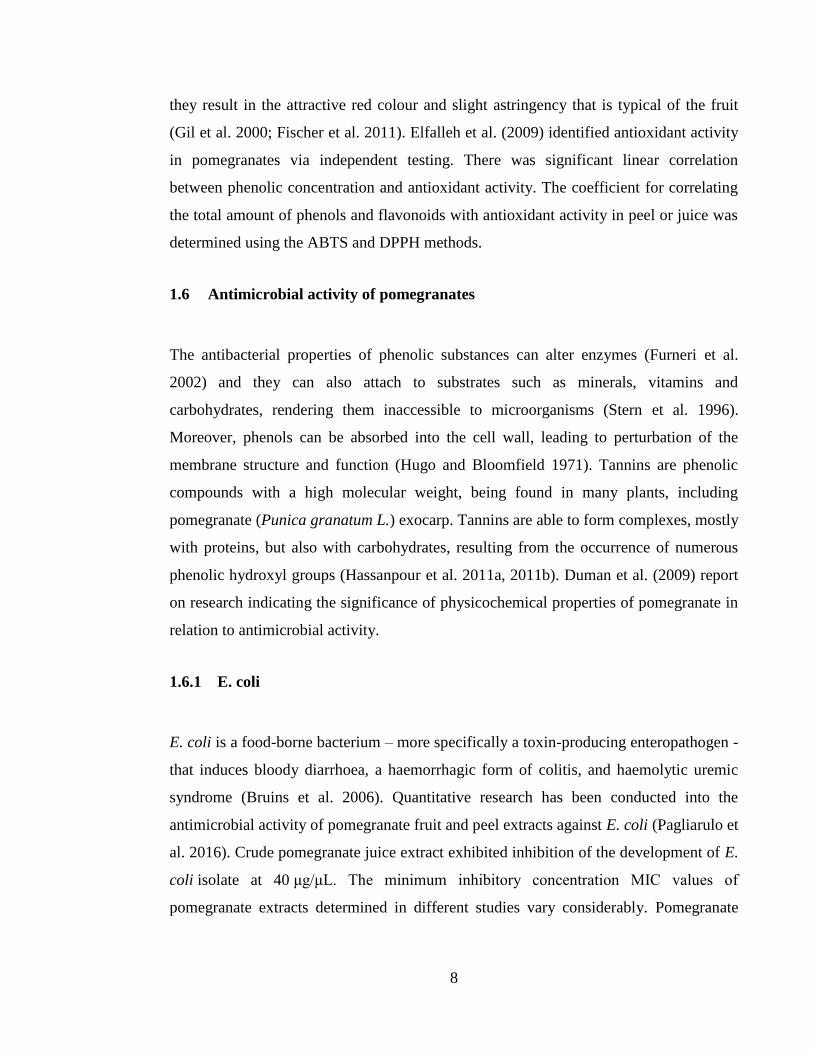
8
they result in the attractive red colour and slight astringency that is typical of the fruit
(Gil et al. 2000; Fischer et al. 2011). Elfalleh et al. (2009) identified antioxidant activity
in pomegranates via independent testing. There was significant linear correlation
between phenolic concentration and antioxidant activity. The coefficient for correlating
the total amount of phenols and flavonoids with antioxidant activity in peel or juice was
determined using the ABTS and DPPH methods.
1.6 Antimicrobial activity of pomegranates
The antibacterial properties of phenolic substances can alter enzymes (Furneri et al.
2002) and they can also attach to substrates such as minerals, vitamins and
carbohydrates, rendering them inaccessible to microorganisms (Stern et al. 1996).
Moreover, phenols can be absorbed into the cell wall, leading to perturbation of the
membrane structure and function (Hugo and Bloomfield 1971). Tannins are phenolic
compounds with a high molecular weight, being found in many plants, including
pomegranate (Punica granatum L.) exocarp. Tannins are able to form complexes, mostly
with proteins, but also with carbohydrates, resulting from the occurrence of numerous
phenolic hydroxyl groups (Hassanpour et al. 2011a, 2011b). Duman et al. (2009) report
on research indicating the significance of physicochemical properties of pomegranate in
relation to antimicrobial activity.
1.6.1 E. coli
E. coli is a food-borne bacterium – more specifically a toxin-producing enteropathogen -
that induces bloody diarrhoea, a haemorrhagic form of colitis, and haemolytic uremic
syndrome (Bruins et al. 2006). Quantitative research has been conducted into the
antimicrobial activity of pomegranate fruit and peel extracts against E. coli (Pagliarulo et
al. 2016). Crude pomegranate juice extract exhibited inhibition of the development of E.
coli isolate at 40 μg/μL. The minimum inhibitory concentration MIC values of
pomegranate extracts determined in different studies vary considerably. Pomegranate
9
peel extracts revealed the following antimicrobial activity against E. coli: MIC 30 µg/µL
and MBC 70 µg/µL. It may be concluded from the findings from microbiological testing
that the antimicrobial capacity of crude peel extracts is higher than that of purified
extracts and crude peel extracts are especially effective at opposing the development and
survival of clinical isolates. The development, survival and resilience of the E. coli
isolates were also studied. A concentration of 160 μg/μL in crude pomegranate juice
extract had a complete bactericidal effect on E. coli and the bactericidal level was 70/μL
in crude pomegranate peel extracts.
The antimicrobial properties of a several tropical plants from Puerto Rico were
investigated utilising the disc diffusion method in relation to E. coli and S. aureus
(Melendez and Capriles 2006). It was found that pomegranate extract generated
inhibition zone sizes of 11 for E. coli. MIC levels have been determined in a number of
studies, extending from 0.62 to 10 mg/mL antagonizing E. coli (Navarro et al. 1996).
1.6.2 Staphylococcus aureus and MRSA
A study by Biedenbach et al. (2004) into Staphylococcus aureus declared that it is one of
the major sources of infections in hospitals, and it is the second most responsible
microorganism causing bacteraemia, and is a major factor in many sepsis cases on a
global scale. Over the past two decades, S. aureus and MRSA have emerged as two of
the most resistant and dangerous bacteria strains. Both strains are particularly strong
against a variety of antibiotics, few of which – including macrolides, fluoroquinolones,
or β-lactams – can have an effect on these pathogens (Klugman and Koornhof 1989).
Cosgrove et al. (2003) identified that MRSA infections are harder to combat than those
caused by S. aureus, which is more susceptible to methicillin, and that the former tend to
have a higher mortality rate. A Brazilian study investigated the impact of pomegranate
extract on Staphylococcus aureus development and subsequent generation of enterotoxin
(Braga et al. 2016). The interaction of a P. granatum methanolic extract with five
antibiotics was observed in relation to 30 clinical isolates of Methicillin-Resistant
10
Staphylococcus aureus (MRSA) and methicillin-sensitive S. aureus. The relevant
antibiotics were chloramphenicol, gentamicin, ampicillin, tetracycline and oxacillin. A
synergistic effect of the pomegranate extract and all five antibiotics was identified
against the S. aureus isolates, with the synergy with ampicillin being the most notable.
This interaction extended the time before bacterial growth occurred by three hours
(compared with that of ampicillin in isolation). It was also bactericidal, demonstrated by
a 72.5 % decrease in methicillin-sensitive organisms and a 99.9% decrease in MRSA.
The findings from this research and previous studies indicate that the ellagitannin,
punicalagin, is the main component resulting in the reported antibacterial activity.
Quantitative research was conducted into the antimicrobial activity of pomegranate fruit
and peel extracts opposing S. aureus (Pagliarulo et al. 2016). The development of S.
aureus isolate was blocked by a concentration of 65 μg/μL of juice extract. Pomegranate
peel extracts revealed the following antimicrobial activity in relation to S. aureus: MIC
20 µg/µl and MBC 50 µg/µL. The effects of crude pomegranate juice and rind extracts
were determined on the development, survival and resilience of S. aureus. A complete
bactericidal effect on S. aureus was exhibited by the juice extract at 160 μg/μL and the
peel extract at 50 μg/μL. Melendez and Capriles (2006) studied the antimicrobial
activity of various tropical plants from Puerto Rico that antagonising E. coli and S.
aureus. The disc diffusion technique was utilised. It was established that pomegranate
extract resulted in inhibition zone sizes of 20 mm in relation to S. aureus.
1.6.3 Other bacteria
Choi et al. (2011) report on a study of in vitro and in vivo antimicrobial activity of P.
granatum peel ethanol extract (PGPE) opposing 16 varieties of Salmonella enteritidis.
The disc diffusion method produced Zones of Inhibition ranging from 13.3 to 18.6 mm
against tested bacteria. Each disc was loaded with 500 µg of PGPE per disc. The study
also relates the increase in dose loading per disc had led to increase in zones of
inhibition in dose-dependent manner. The minimum inhibitory levels MIC of PGPE
11
ranged from 62.5–1000 µg/mL. The in vivo antibacterial function of the PGPE extract
was also evaluated in relation to S. typhimurium. Mice were infected with S.
typhimurium and subsequently with PGPE. It was shown that PGPE had considerable
impact on mortality and the amount of viable S. typhimurium extracted from faeces.
Although clinical effects and histological damage were infrequently found in these mice,
untreated controls exhibited signs of sluggishness and histological damage of the liver
and spleen. The collated findings of the research suggest that PGPE has the capacity to
deliver successful treatment for salmonellosis.
Another study was undertaken on the antimicrobial activity of extracts from
pomegranate skins antagonising certain food-borne pathogens, deploying both in vitro
(agar diffusion) and in situ (food) techniques (Al-Zoreky 2009). The MIC of 80%
methanol extract (WME) in relation to Salmonella enteritidis was the highest, at 4
mg/mL. Phytochemical examination indicated the occurrence of active inhibitors in
peels, such as phenolics and flavonoids.
While the prevalence of gastric cancer has systematically reduced in the last half-
century, Watanabe et al. (1998) reiterate that it is still the second most common cancer
globally and continues to pose a major threat to health. Helicobacter pylori was first
identified by Warren and Marshall (1983), and its actions in the development of gastric
carcinogenesis have been widely researched since. Watanabe et al. (1998) note that
during 1994, at a Working Group of the World Health Organisation’s International
Agency for Research on Cancer, H. pylori was categorised as a group 1 carcinogen for
humans. There is increasing prevalence of Helicobacter pylori (H. pylori), which is
resistant to many antibiotics and a primary cause of gastric cancer. P. granatum extracts
were analysed opposing multiple antibiotic-resistant Helicobacter pylori, as reported by
Voravuthikunchai and Mitchell (2008). MIC was established via the agar dilution
technique in Petri dishes with a Millipore filter membrane. Minimal bactericidal
concentrations (MBC) were identified with the extract that generated a significant MIC
in relation to each variety of bacteria, by positioning the Millipore filter membrane on a
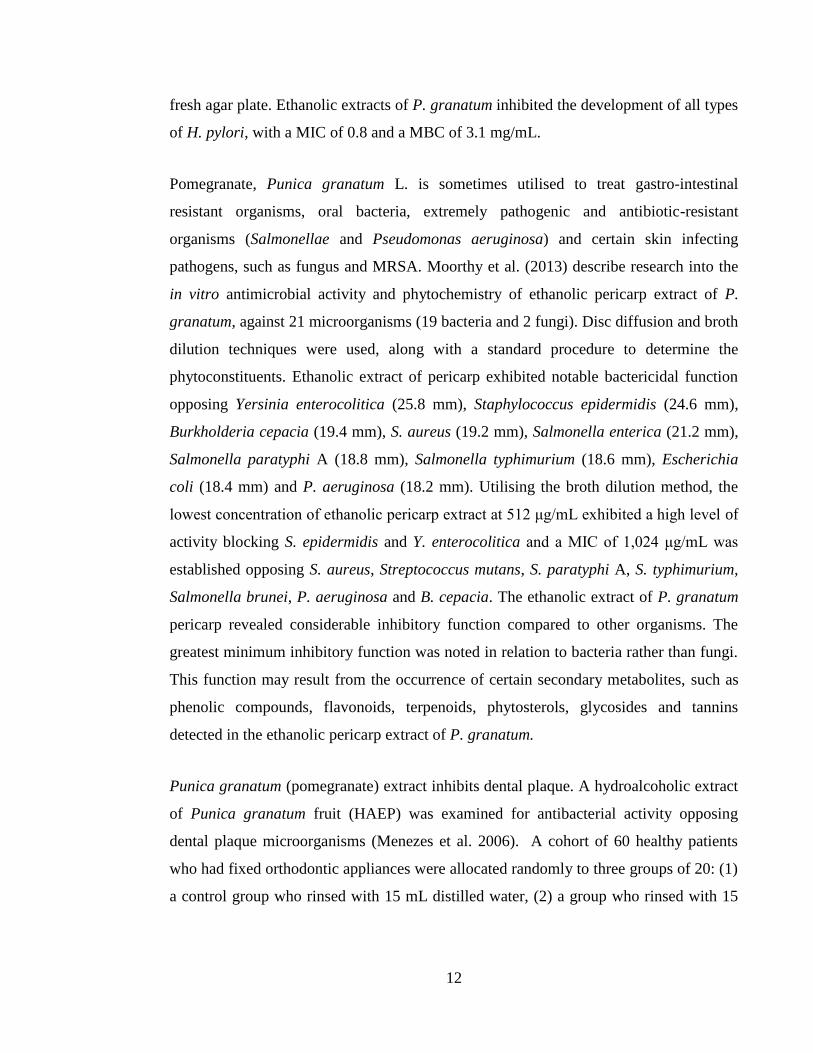
12
fresh agar plate. Ethanolic extracts of P. granatum inhibited the development of all types
of H. pylori, with a MIC of 0.8 and a MBC of 3.1 mg/mL.
Pomegranate, Punica granatum L. is sometimes utilised to treat gastro-intestinal
resistant organisms, oral bacteria, extremely pathogenic and antibiotic-resistant
organisms (Salmonellae and Pseudomonas aeruginosa) and certain skin infecting
pathogens, such as fungus and MRSA. Moorthy et al. (2013) describe research into the
in vitro antimicrobial activity and phytochemistry of ethanolic pericarp extract of P.
granatum, against 21 microorganisms (19 bacteria and 2 fungi). Disc diffusion and broth
dilution techniques were used, along with a standard procedure to determine the
phytoconstituents. Ethanolic extract of pericarp exhibited notable bactericidal function
opposing Yersinia enterocolitica (25.8 mm), Staphylococcus epidermidis (24.6 mm),
Burkholderia cepacia (19.4 mm), S. aureus (19.2 mm), Salmonella enterica (21.2 mm),
Salmonella paratyphi A (18.8 mm), Salmonella typhimurium (18.6 mm), Escherichia
coli (18.4 mm) and P. aeruginosa (18.2 mm). Utilising the broth dilution method, the
lowest concentration of ethanolic pericarp extract at 512 μg/mL exhibited a high level of
activity blocking S. epidermidis and Y. enterocolitica and a MIC of 1,024 μg/mL was
established opposing S. aureus, Streptococcus mutans, S. paratyphi A, S. typhimurium,
Salmonella brunei, P. aeruginosa and B. cepacia. The ethanolic extract of P. granatum
pericarp revealed considerable inhibitory function compared to other organisms. The
greatest minimum inhibitory function was noted in relation to bacteria rather than fungi.
This function may result from the occurrence of certain secondary metabolites, such as
phenolic compounds, flavonoids, terpenoids, phytosterols, glycosides and tannins
detected in the ethanolic pericarp extract of P. granatum.
Punica granatum (pomegranate) extract inhibits dental plaque. A hydroalcoholic extract
of Punica granatum fruit (HAEP) was examined for antibacterial activity opposing
dental plaque microorganisms (Menezes et al. 2006). A cohort of 60 healthy patients
who had fixed orthodontic appliances were allocated randomly to three groups of 20: (1)
a control group who rinsed with 15 mL distilled water, (2) a group who rinsed with 15
13
mL chlorhexidine, a standard antiplaque mouth wash; and (3) a group who rinsed with a
15 mL HAEP solution. Rinsing lasted for one minute and dental plaque was gathered
from each patient before and afterwards. Samples were diluted and placed on Meuller-
Hinton agar and incubated at 37 °C for 48 hours. HAEP reduced the amount of colony
forming units (CFU) of dental plaque bacteria by 84%, similar to chlorhexidine (79 %
reduction) but considerably outperforming the control rinse which was associated with a
decrease of 11 %. Both HAEP and chlorhexidine successfully inhibited Staphylococcus,
Streptococcus, Klebsiella, and Proteus species, as well as E. coli. The ellagitannin,
punicalagin, is considered to be the component driving the pomegranate’s antibacterial
activity.
Ahmad and Beg (2001) report on research involving ethanolic extracts of 45 plants from
India that were traditionally utilised in medicine. The antimicrobial functions of these
extracts were analysed in relation to certain drug-resistant bacteria. It was observed that
alcohol extracts of pomegranate fruits exhibited wide ranging antibacterial function
opposing S. aureus, E. coli and Shigella dysentriae.
1.6.4 Antiviral activity of pomegranate
Pomegranate has been a common remedy in traditional medicine for a broad range of
conditions such as upper respiratory tract infections and influenza (Nonaka et al. 1990).
Haidari et al. (2009) reported a study into how pomegranate purified polyphenol extract
(PPE) suppressed the influenza virus and also exhibited a synergistic effect with
oseltamivir. The research showed that PPE constrained the agglutination of chicken red
blood cells (CRBC) by the influenza virus and that it was virucidal. Single-cycle growth
conditions revealed that, separate from this virucidal effect, PPE inhibited viral RNA
replication as well. PPE did not modify virus ribonucleoprotein (RNP) entry into nucleus
or translocation of virus RNP from nucleus to cytoplasm in Madin-Darby canine kidney
(MDCK) cells. Four main polyphenols in PPE were investigated: ellagic acid, caffeic
acid, luteolin, and punicalagin. It was found that punicalagin is the effective, anti-
14
influenza constituent of PPE. Punicalagin prevented replication of the virus RNA,
blocked agglutination of CRBCs by the virus and was virucidal. It was also
demonstrated how PPE worked in combination with oseltamivir. This was beneficial
since it can result in a potentially higher potency, improved clinical efficiency and
reduced dosage, reduced toxicity and side effects, and increased cost-effectiveness.
Su et al. (2010) observe that polyphenols in pomegranate juice have also effectively
combated food borne viral infections. In the absence of culturable human noroviruses,
feline calicivirus (FCV/F9), murine norovirus (MNV/1), and MS2 positive-sense single-
stranded RNA (ssRNA) bacteriophage were utilised as food borne viral substitutes.
Different concentration of pomegranate juice (8, 16, and 32 mg/mL of polyphenols)
were added to two types of viruses in high titers (∼7 log10 PFU/mL) and
(∼5 log10 PFU/mL). This combination was incubated for 1 hour at room temperature.
The low titer of FCV-F9, MNV-1, and MS2 were decreased by 2.56, 1.32, and
0.32 log10 PFU/mL, respectively, and 1.20, 0.06, and 0.63 log10 PFU/mL, respectively,
for high titers. The study concluded that pomegranate juice was able to reduce the food
borne viral substitutes FCV-F9, MNV-1 and MS2 (particularly for low titers). It was
suggested that these samples had good potential as natural means of suppressing or
mitigating human norovirus infections.
It has recently been shown that the innate antimicrobial activity of PRE is considerably
enhanced by the co-application of zinc sulphate, or Zn(II) ions. Up to 7-log reduction
potency was identified in relation to the Herpes simplex virus (HSV), which is the
microorganism responsible for anogenital herpes and oral cold sores (Houston, 2017b).
1.6.5 Antifungal activity of pomegranate
Both Beck-Sagué and Jarvis (1993) and Nguyen et al. (1996) referred to the greater
prevalence of opportunistic fungal infections, as well as the problems raised by drug-
resistant strands, especially those of the Candida strain, in the last few decades. Santos
15
et al. (2009) refer to punicalagin isolated from pomegranate skin being effective in
combatting Candida albicans and Candida parapsilosis and also interacting favourably
with fluconazole. Transmission electron microscopy revealed that cells treated with
punicalagin exhibited a thickened wall, altered space between the wall and the plasma
membrane, vacuoles, and decreased cytoplasmic content. Denture stomatitis is often
connected to C. albicans although other Candida species have been extracted from
lesions. Ethnobotanical research carried out in Brazil has proven the application of
pomegranate in oral health (Santos et al. 2009).
Tayel and El-Tras (2009) established that methanol, ethanol and water extracts of
pomegranate rinds successfully reduced C. albicans growth. Additionally, it was found
that aerosol extracted from pomegranate rind effectively and comprehensively sanitised
semi-closed sites from C. albicans growth. Therefore, it could play a role in preventing
C. albicans contamination and growth in susceptible locations.
1.7 PRE and metal ion combination
When PRE and Cu2+
or Cu(II) ions interact, they show increased antimicrobial activity
opposing E. coli, Ps. aeruginosa and P. mirabilis and moderate activity opposing S.
aureus, compared to the individual activity of PRE and of Cu(II) ions. Adding large
volumes of vitamin C significantly increased the function of both PRE/Fe(II) and
PRE/Cu(II) combinations opposing S. aureus. Further research was being undertaken
into the effect of PRE/ Cu(II) amalgamations on clinical isolates of Ps. Aeruginosa and
S. aureus (McCarrell et al. 2008).
Yehia et al. (2011) analysed antibacterial activity opposing Gram positive bacteria
Staphylococcus spp., B. subtilis, Bacillus indicus and Gram negative bacteria E. coli,
Enterobacter aerogenes, Serratia marcescens and Brucella spp. Mixtures of PRE with
metal and PRE with vitamin c and metals were investigated using Zone of Inhibition test
ZOI. The three metals that had been used in this study were CuSO4, MnSO4 and ZnSO4.
16
Tested mixture prepared by adding 330 µL of PRE was added to 700 µL of each metal
salts used (CuSO4, MnSO4 and ZnSO4) and each salt was prepared in concentration of 4.8
mM. Among these mixtures tow mixtures of PRE: vitamin C and PRE: ZnSO4were with
highest antibacterial activity than the rest of mixtures. A combination of PRE and ZnSO4
showed increased antimicrobial activity opposing B. subtilis, Staphylococcus spp. and
Brucella spp., each at 15 mm with 15, 15 and 15 mm zones of inhibition respectively. A
combination of PRE and vitamin C (1:1) had greater inhibitory effect on E. coli and B.
indicus than the three metal mixtures that reached 20 and 18 mm zones of inhibition
respectively. Additional research was being conducted to determine how this functioned,
as well as the process of enhancement by metal salts and vitamin C. This study showed
also that the mixture of PRE and MnSO4 only inhibited the yeast Saccharomyces
cerevisiae at10 mm. Moderate antimicrobial activity was observed when combining
PRE, vitamin C and metal salts against the various microorganisms. It was determined
that an combination of PRE, vitamin C and MnSO4, whereas a mixture of PRE/vitamin
C/ CuSO4 suppressed Brucella spp. at 10 mm. A PRE - vitamin C - ZnSO4 combination
did not impact on any of the tested types of bacteria. The PRE in isolation in this study
did not show antimicrobial function opposing any of the tested isolates (Yehia et al.
2011). It is noticeable that the extraction method in this study was done by blending 50 g
of the seed with 100 ml of distilled water for 10 min. The final extract underwent
filtration through muslin Whatman No. 1 filter paper and then autoclaved for 15 minutes
at 121 °C before storage at – 20 °C.
A patent disclosed by Stewart et al. (1995), showed that PRE and iron sulphate produces
a potent phagicidal activity. They showed that addition of FeSO4 to pomegranate rind
extract gave 11 log reduction of plaque forming within 3 minutes with no effect on the
host cell. However, the stability of ferrous sulphate and PRE combination was low (30
min) due to rapid oxidation to ferric sulphate to a blackened material – this also
coincided with a loss of antimicrobial activity.
17
Recent work done by Houston (2011) at Cardiff University, showed that addition of
ferrous sulphate to PRE was a potent virucidal against Herpes simplex virus, although
the stability was an issue with ferrous salt because of the short window of activity and
black by product, reflecting the low stability of the combination as observed by Stewart
et al. (1998). However, it was noticed that the formation of black by product did not
occur when ferrous sulphate was replaced with zinc sulphate – Zn(II) is far more stable
than Fe(II). His work showed that that a potentiation of antimicrobial and microbicidal
activity of pomegranate extract can be established by the addition of zinc sulphate
(ZnSO4). The activities increased by 7log reduction against Herpes simplex virus. It was
also stated that Zn2+
ions (hereafter referred to as Zn(II)) remained stable after addition
of ZnSO4 to pomegranate rind extract (PRE). No change in colour or redox change upon
the addition of ZnSO4 to PRE and no new compound yielded by the combination
because of the zinc ion stability. Preliminary work also carried out in CSPPS noted the
same combination also shows potentiated activity against a number of bacteria including
E. coli, MRSA and Ps aeruginosa. Thus the combination is stable in terms of microbial
activity, and both PRE and ZnSO4 have good safety profiles for the human body. The
precise mechanism of potentiated activity, which has a clear optimum ratio of PRE/Zn,
has not yet been clearly established; but the high tannin content of pomegranate extract
is believed to be associated with destabilization of microbial membrane, allowing the
entry of toxic levels of zinc ions.
Considering the previous work on the antimicrobial activity of PRE in relation to
potentiation of virucidal and bactericidal activity by Zn(II) ions, it is proposed that PRE
could demonstrate similar levels of bactericidal activity which could be exploited as
novel topical broadspectrum antimicrobial therapeutic systems. Consequently, this
project set out to investigate such a possibility in relation to skin and wound infections.
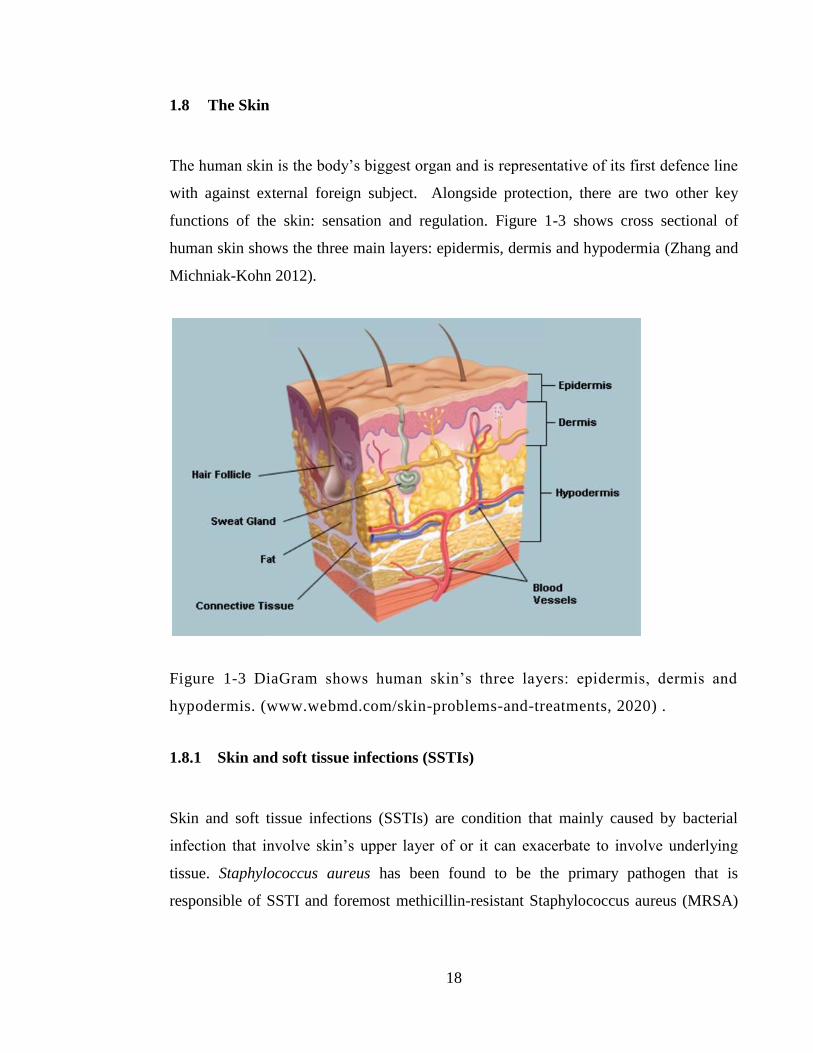
18
1.8 The Skin
The human skin is the body’s biggest organ and is representative of its first defence line
with against external foreign subject. Alongside protection, there are two other key
functions of the skin: sensation and regulation. Figure 1-3 shows cross sectional of
human skin shows the three main layers: epidermis, dermis and hypodermia (Zhang and
Michniak-Kohn 2012).
Figure 1-3 DiaGram shows human skin’s three layers: epidermis, dermis and
hypodermis. (www.webmd.com/skin-problems-and-treatments, 2020) .
1.8.1 Skin and soft tissue infections (SSTIs)
Skin and soft tissue infections (SSTIs) are condition that mainly caused by bacterial
infection that involve skin’s upper layer of or it can exacerbate to involve underlying
tissue. Staphylococcus aureus has been found to be the primary pathogen that is
responsible of SSTI and foremost methicillin-resistant Staphylococcus aureus (MRSA)
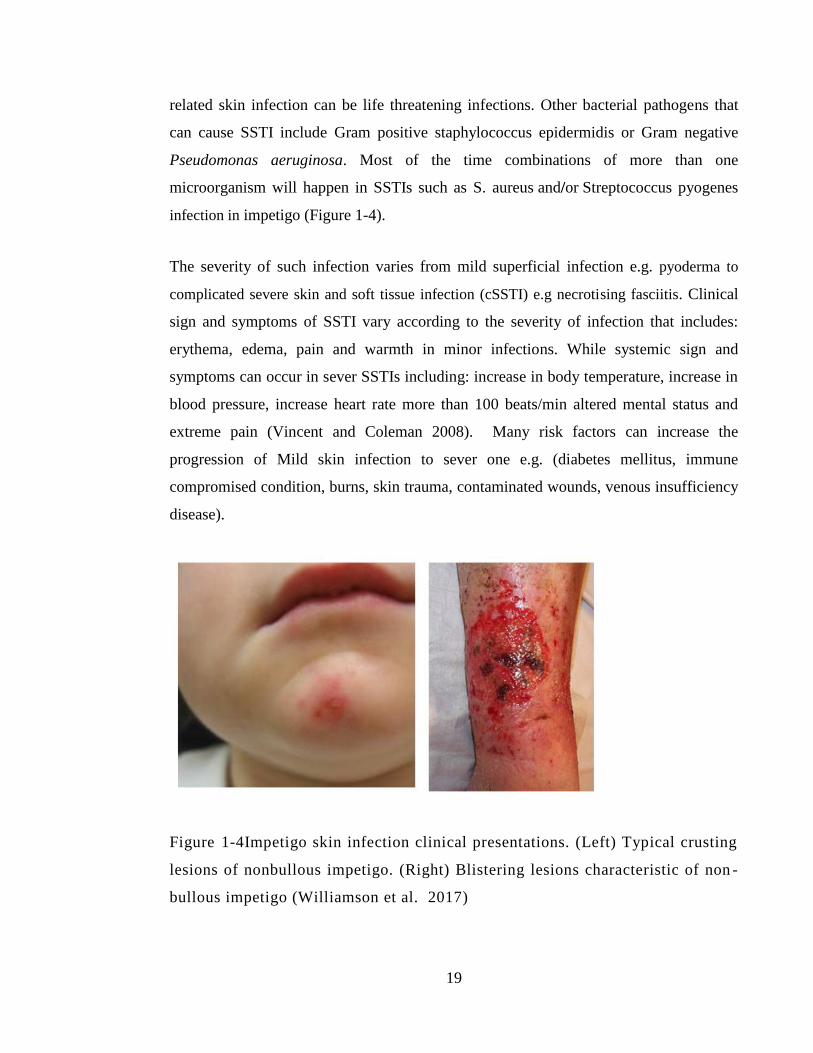
19
related skin infection can be life threatening infections. Other bacterial pathogens that
can cause SSTI include Gram positive staphylococcus epidermidis or Gram negative
Pseudomonas aeruginosa. Most of the time combinations of more than one
microorganism will happen in SSTIs such as S. aureus and/or Streptococcus pyogenes
infection in impetigo (Figure 1-4).
The severity of such infection varies from mild superficial infection e.g. pyoderma to
complicated severe skin and soft tissue infection (cSSTI) e.g necrotising fasciitis. Clinical
sign and symptoms of SSTI vary according to the severity of infection that includes:
erythema, edema, pain and warmth in minor infections. While systemic sign and
symptoms can occur in sever SSTIs including: increase in body temperature, increase in
blood pressure, increase heart rate more than 100 beats/min altered mental status and
extreme pain (Vincent and Coleman 2008). Many risk factors can increase the
progression of Mild skin infection to sever one e.g. (diabetes mellitus, immune
compromised condition, burns, skin trauma, contaminated wounds, venous insufficiency
disease).
Figure 1-4Impetigo skin infection clinical presentations. (Left) Typical crusting
lesions of nonbullous impetigo. (Right) Blistering lesions characteristic of non -
bullous impetigo (Williamson et al. 2017)
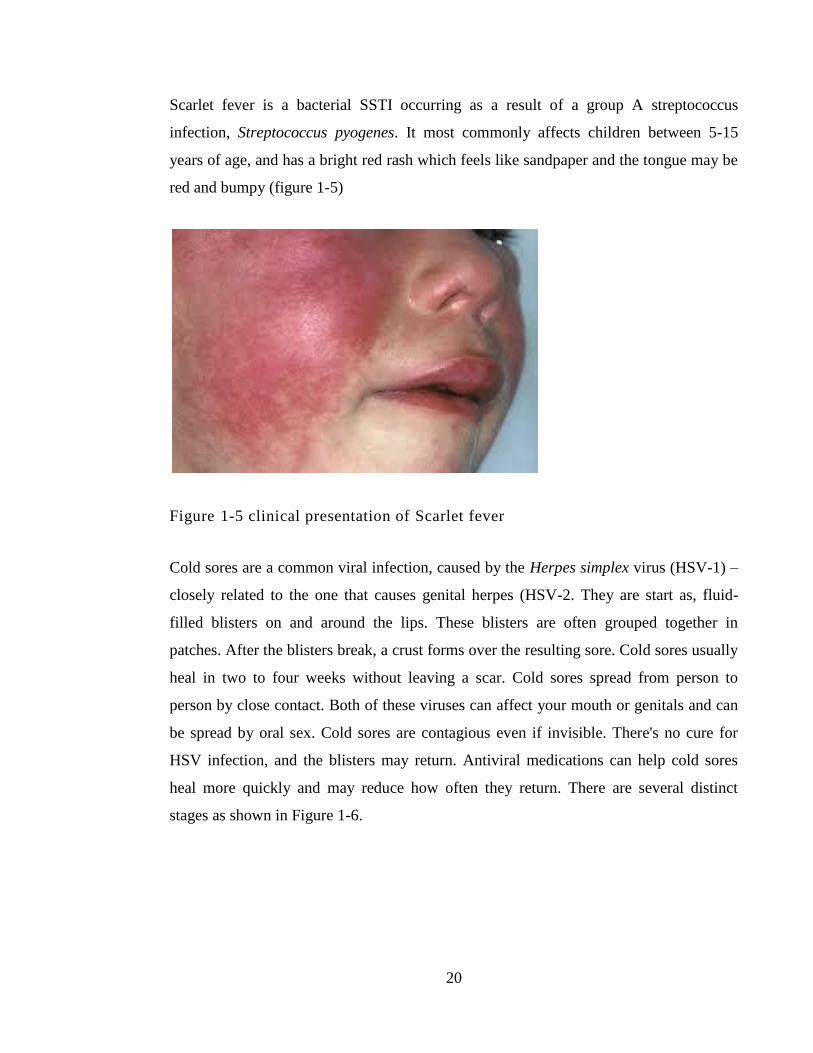
20
Scarlet fever is a bacterial SSTI occurring as a result of a group A streptococcus
infection, Streptococcus pyogenes. It most commonly affects children between 5-15
years of age, and has a bright red rash which feels like sandpaper and the tongue may be
red and bumpy (figure 1-5)
Figure 1-5 clinical presentation of Scarlet fever
Cold sores are a common viral infection, caused by the Herpes simplex virus (HSV-1) –
closely related to the one that causes genital herpes (HSV-2. They are start as, fluid-
filled blisters on and around the lips. These blisters are often grouped together in
patches. After the blisters break, a crust forms over the resulting sore. Cold sores usually
heal in two to four weeks without leaving a scar. Cold sores spread from person to
person by close contact. Both of these viruses can affect your mouth or genitals and can
be spread by oral sex. Cold sores are contagious even if invisible. There's no cure for
HSV infection, and the blisters may return. Antiviral medications can help cold sores
heal more quickly and may reduce how often they return. There are several distinct
stages as shown in Figure 1-6.
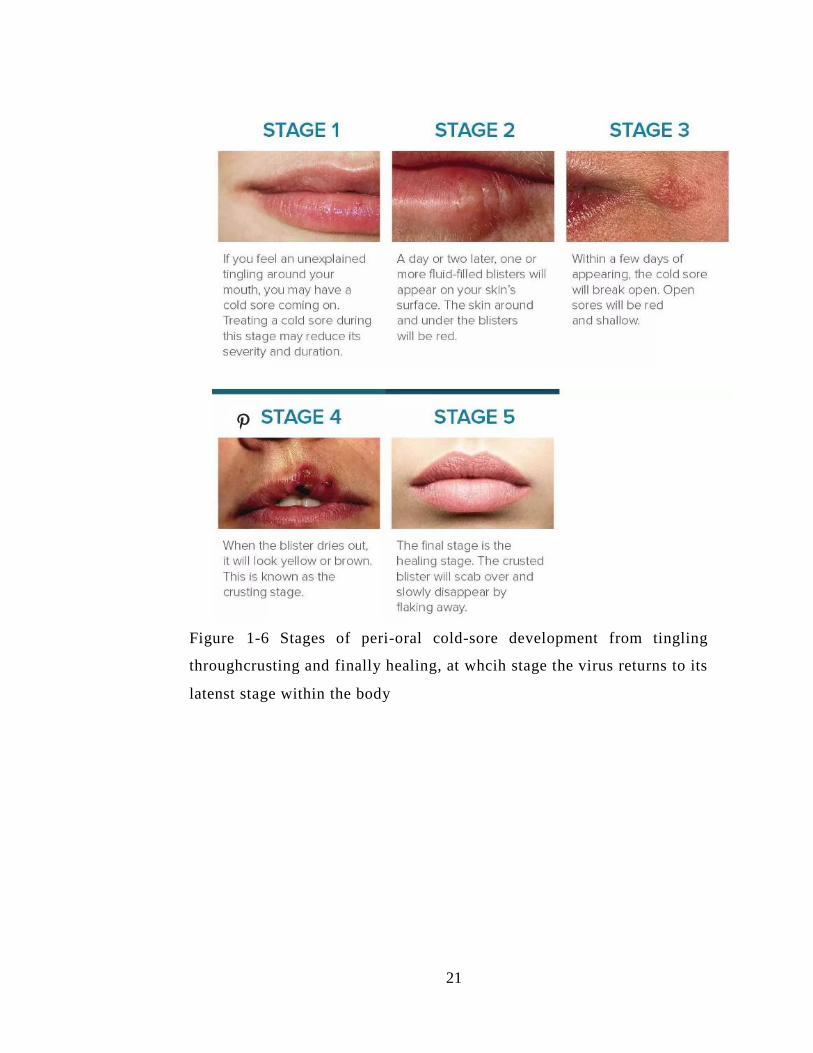
21
Figure 1-6 Stages of peri-oral cold-sore development from tingling
throughcrusting and finally healing, at whcih stage the virus returns to its
latenst stage within the body
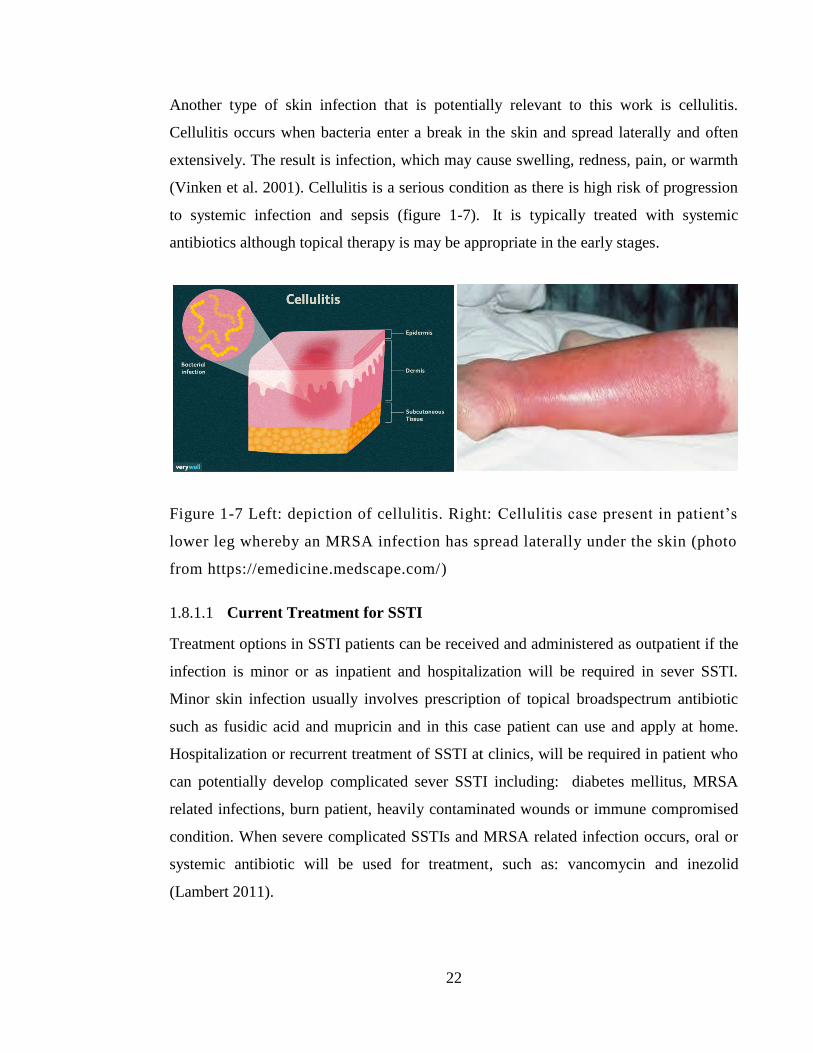
22
Another type of skin infection that is potentially relevant to this work is cellulitis.
Cellulitis occurs when bacteria enter a break in the skin and spread laterally and often
extensively. The result is infection, which may cause swelling, redness, pain, or warmth
(Vinken et al. 2001). Cellulitis is a serious condition as there is high risk of progression
to systemic infection and sepsis (figure 1-7). It is typically treated with systemic
antibiotics although topical therapy is may be appropriate in the early stages.
Figure 1-7 Left: depiction of cellulitis. Right: Cellulitis case present in patient’s
lower leg whereby an MRSA infection has spread laterally under the skin (photo
from https://emedicine.medscape.com/)
1.8.1.1 Current Treatment for SSTI
Treatment options in SSTI patients can be received and administered as outpatient if the
infection is minor or as inpatient and hospitalization will be required in sever SSTI.
Minor skin infection usually involves prescription of topical broadspectrum antibiotic
such as fusidic acid and mupricin and in this case patient can use and apply at home.
Hospitalization or recurrent treatment of SSTI at clinics, will be required in patient who
can potentially develop complicated sever SSTI including: diabetes mellitus, MRSA
related infections, burn patient, heavily contaminated wounds or immune compromised
condition. When severe complicated SSTIs and MRSA related infection occurs, oral or
systemic antibiotic will be used for treatment, such as: vancomycin and inezolid
(Lambert 2011).
23
Additionally, prophylactic therapy is considered highly important to prevent skin and
wound related infections especially after surgery to reduce surgical site infections SSIs
and usually includes treatment with oral antibiotic such as clindamycin and application
of topical antibacterial or antiseptic agents such as chlorhexidine, povidine iodie (Lambert
2011; Williamson et al. 2017).
Topical and oral antibacterial drug therapy is a growing approach. A combined regimen
of both systemic and topical antibiotics can provide an additive, more potent effect that
can exceed the benefit of using one drug alone (Scher and Peoples 1991).
The combination of topical and oral antibiotics have been found to be a successful
approach to eradicate the resistance type of bacteria methicillin-resistant Staphylococcus
aureus (MRSA) colonisation in hospitalized patients. Combined topical and oral
antimicrobial therapy for the eradication of MRSA was investigated in a retrospective
chart study that included 207 adults in patient with MRSA colonisation, at Sunnybrook
Health Sciences Centre hospital affiliated with the University of Toronto, Canada. The
study was set for MRSA eradication treatment using topical 4% chlorhexidine soap for
bathing and washing, 2% mupirocin ointment topically applied to interior nostril three
times per day and oral antibacterial rifampin (300 mg twice daily) and either
trimethoprim/ sulfamethoxazole (160 mg/800 mg twice daily) or doxycycline
combination treatment for seven days. The study found that combination of topical and
systemic antibacterial agent was effective to eradicate MRSA from selected patient 98%
and 94% and of treated patient with combined therapy showed culture negative MRSA
after completion of therapy and 90 % of those after 3, and 6 month follow up showed
successful decolonisation (Fung and Simor 2002).
24
1.8.2 Wounds
The definition of a wound is that it is the disruption of the continuity of a tissue in both
anatomic and cellular terms and may happen due to trauma, either with thermal,
chemical, physical microbial or immunological tissue. Wounds can compromise the self-
image of a patient as well as well-being, independence and working capacity. According
to Maver et al. (2015) and Leach (2004) wound management that is effective is thus
necessary on both the individual and the community level.
1.8.3 Wound-healing process
At the insult time, multiple pathways both cellular and extracellular are activated, in a
stringently coordinated and regulated manner, with the target to restore the integrity of
the tissue. Orthodox wound-healing processes comprise four specific phases:
haemostasis, inflammation, proliferation, and tissue remodelling (Harper et al. 2014).
1.8.3.1 Haemostasis
Homeostasis phase, which involves the constriction of blood vessels to prevent flow of
blood. The decreased blood flow to that tissue results in hypoxia and acidosis which
trigger nitric oxide production and other vasodilator. Then after that, platelet aggregation
happened on blood vessels wall and finally formation of blood clot at the site which will
prevent extra bleeding (Harper et al. 2014). At early stage, when the skin is injured,
there is disruption to the epidermal barrier and a release by keratinocytes of prestored
interleukin-1 (IL-1). IL-1 is the initial signal alerting the cells that are surrounding of
barrier damage. Additionally, components of blood are released into the site of the
wound which activates the clotting flow. The subsequent clot provokes haemostasis,
providing a matrix of inflammatory cells to invade the area (Barrientos et al. 2008).
There is a degranulation of platelets that release alpha granules and these secrete factors
of growth such as platelet-derived growth factor (PDGF), epidermal growth factor
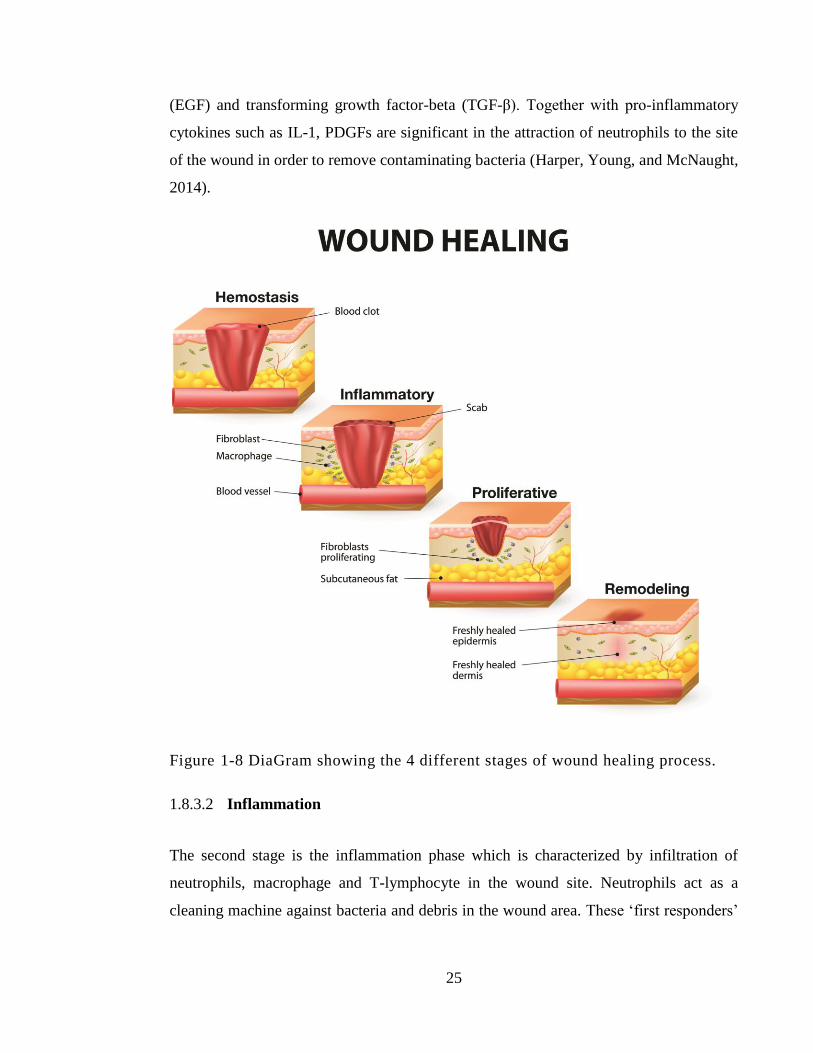
25
(EGF) and transforming growth factor-beta (TGF-β). Together with pro-inflammatory
cytokines such as IL-1, PDGFs are significant in the attraction of neutrophils to the site
of the wound in order to remove contaminating bacteria (Harper, Young, and McNaught,
2014).
Figure 1-8 DiaGram showing the 4 different stages of wound healing process.
1.8.3.2 Inflammation
The second stage is the inflammation phase which is characterized by infiltration of
neutrophils, macrophage and T-lymphocyte in the wound site. Neutrophils act as a
cleaning machine against bacteria and debris in the wound area. These ‘first responders’
26
are known as neutrophils and are highly ambulatory cells. According to George et al.
(2006), within an hour of the insult, these cells infiltrate the wound, migrating in
constant levels for the initial 48 hours. This is arbitrated through different signalling
methods that are chemically based, which includes the complement cascade, interleukin
activation and the signalling of transforming growth factor-beta (TGF-b), leading to
neutrophils travelling down a chemical slope towards the wound. This process is known
as chemotaxis. Neutrophils clean wound debris by phagocytosis process or release of
oxygen free radicals, reactive oxygen species (ROS), or by release of toxins and
proteases that destroy bacteria such as chromatin protease, lactoferrin and cathepsin.
Neutrophils after that go under apoptosis or phagosytosis by macrophage cells. The core
aim of this phase in wound healing is the prevention of infection at the injury site. No
matter the wound’s aetiology, the mechanical obstruction which was at the forefront
against the invasion of microorganisms is broken. Macrophages usually reach the
sustained concentrations at wound area at 48 to 72 hours after injury time. With TGF-b’s
assistance, monocytes are transformed into macrophages which play a crucial role in the
augmentation of the response of inflammation and the debridement of tissue (Barrientos
et al. 2008). There is a large amount of growth factors harboured in macrophages, such
as EGF and TGF-b, which are significant in the regulation of inflammatory response. In
addition, they help with the stimulation of angiogenesis and the augmentation of
granulation tissue formation (George et al. 2006; Harper et al. 2014). Macrophages
implement the tissue granulation development through the release of a number of pro-
inflammatory cytokines (IL-1 and IL-6) and growth factors (EGF, fibroblast growth
factor [FGF], PDGF and TGF-b) (Barrientos et al. 2008).
1.8.3.3 Proliferation
This complicated procedure incorporates angiogenesis, the deposition of collagen,
granulation tissue formation and re-epithelialisation which happens at the same time
(Harper et al. 2014).
1.8.3.3.1 Angiogenesis
27
The triggering of angiogenesis happens at the point of the formation of the haemostatic
plug, with platelets releasing PDGF, TGF-b and FGF. Vascular endothelial growth
factor (VEGF) is released in reply to hypoxia. Together with the other cytokines, this
process induces endothelial cells to activate neovascularisation and repair blood vessels
that have been damaged. Mixed metalloproteinase (MMP) are a set of enzymes triggered
by the invasion in the hypoxic tissue of neutrophils. Through liberating VEGF, they
promote angiogenesis and extracellular matrix (ECM) remodelling (Harper et al. 2014;
Siefert and Sarkar 2012).
According to Barrientos et al. (2008), with the help of FGF and platelet-released VEGF,
there is a proliferation of endothelial cells and ensuing angiogenesis, an essential process
for the deposition, synthesis and organisation of a new ECM.
1.8.3.3.2 Fibroblast migration
There is a stimulation of fibroblasts after the wound insult to reproduce by growth
factors which the haemostatic clot release predominantly by PDGF and TGF-b and then
it migrates to the wound. By day three, fibroblasts enrich the wound which lay down
ECM proteins (hyaluronan, proteoglycans and fibronectins) and subsequently
fibronectin and collagen are produced. Harper et al. (2014) explain that the result is a
vascular pink, fibrous tissue called granulation tissue, formed as a replacement for the
clot at the wound site. PDGF and TGF-b also cause phenotypic alterations in these cells
through the conversion into myofibroblasts of fibroblasts which arrange themselves as a
generated constructive power along the ECM’s borders, which facilitates the closure of
the wound (Barrientos et al. 2008; Hantash et al. 2008).
1.8.3.3.3 Epithelialisation/ re-epithelialisation
Epithelialisation is initiated within hours of the wound and EGF, FGF and TGF-a are
released which act as a stimulant for the migration and proliferation of the epithelial
cells. This procedure starts with the dissolution of the contacts of cell-substratum and
28
cell-cell with the migration and polarisation of keratinocytes following over the ECM
that is provisional. With the achievement of the closure of the wound (100%
epithelialisation), the differentiation and stratification of keratinocytes occur for the
restoration of the barrier. Removing the granulation tissue via revascularisation is
required for the formation of the matrix. Elastin and collagen fibres form a framework as
a replacement for the granulation tissue, which according to Barrientos et al. (2008) is
then saturated with glycoproteins and proteoglycans.
1.8.3.4 Remodelling
It can take up to 24 months for the final stage of healing for a wound, culminating in the
scar tissue’s normal maturation developing (Harper et al. 2014). This entails new
collagen synthesis mediated by TGF-b, and old collagen breakdown by PDGF. The end
product of this procedure is scar tissue.
1.8.4 Acute and chronic wounds
Disregarding the wound’s aetiology, the processes of repair are similar. The result of a
wound is tissue damage and this stimulates a physiological response that is coordinated
for the provision of haemostasis and the initiation of the proliferation of the
inflammation and remodelling processes. Acute wounds generally pass through these
stages comparatively quickly. Wounds that display healing that is delayed three months
after the first insult are referred to as ‘chronic wounds (Harper et al. 2014; George et al.
2006), frequently as a result of pathological inflammation that is prolonged and
maturation phase delayed or not attained.
According to Gottrup (2004), it is estimated that, during their lifetime between 1% and
2% of the population within countries that are developing will experience a chronic
wounds. Chronic wounds are a significant cause of morbidity, with over 1% of the
population of the UK affected at a cost in terms of treatment of at least £1 billion
annually (Thomas and Harding, 2002). The chronicity of wounds has a tendency to
29
happen to individuals with a heightened risk of bacterial incursion or due to local factors
that are poor such as venous hypertension, arterial insufficiency and trauma, or because
of systemic disease including rheumatoid arthritis or diabetes mellitus (Falanga, 1993).
1.8.5 Effect of bacteria on wound healing
The healing of wounds is complex with a number of possible factors delaying the
healing process. There is a growing interest in the impacts of bacteria on different
wound healing phase. Bacteria colonises all wounds, with low bacterial levels being of
benefit to the process of wound healing. Injury infection is damaging to wound healing,
however, according to Edwards and Harding (2004), the management and diagnosis
infection to a wound is controversial and varies among clinicians.
Bacteria from the skin surrounding contaminate all wounds as well as bacteria from the
regional environment and endogenous sources of patients. For patients that are
hospitalised, the local surroundings are particularly relevant. Wound’s simple
contamination and colonisation can be serious when the colonisation exacerbates to be
critical colonisation until it reaches infection stage (Frank et al. 2005). The definition of
colonisation is that of the existence of bacteria that proliferate without a perceptible host
response. Wound colonisation may augment or impede the healing of a wound,
depending upon the bacterial encumbrance. Loads of bacteria up to 105 organisms/g of
tissue is considered equivalent to normal flora load and in case of injuries, it can help in
wound healing process, although as Kingsley (2003) points out, this threshold may
change through the immune system of the host’s status and the number and sorts of
species of bacteria present. An intermediate phase in the continuum of wound infection
is increasingly being recognised and defined as ‘critical colonisation’ or local infection.
This makes reference to a transitional stage between the wound simple colonisation and
invasive infection as shown in Figure 1-7 (Edwards and Harding, 2004).
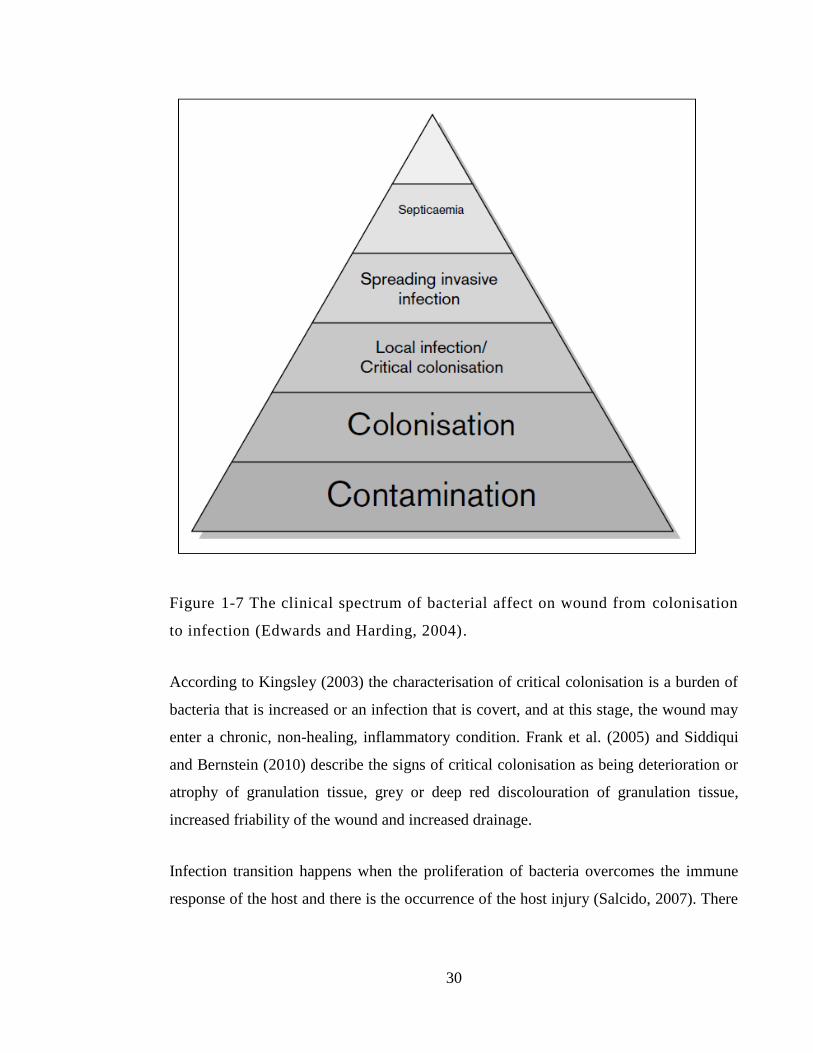
30
Figure 1-7 The clinical spectrum of bacterial affect on wound from colonisation
to infection (Edwards and Harding, 2004).
According to Kingsley (2003) the characterisation of critical colonisation is a burden of
bacteria that is increased or an infection that is covert, and at this stage, the wound may
enter a chronic, non-healing, inflammatory condition. Frank et al. (2005) and Siddiqui
and Bernstein (2010) describe the signs of critical colonisation as being deterioration or
atrophy of granulation tissue, grey or deep red discolouration of granulation tissue,
increased friability of the wound and increased drainage.
Infection transition happens when the proliferation of bacteria overcomes the immune
response of the host and there is the occurrence of the host injury (Salcido, 2007). There
31
are several factors determining the transition to infection from colonisation: according to
Wysocki (2002), these are the bioburden itself, the bacterial virulence, differing species’
synergistic action, and the host’s capability to mount an immune response. Malnutrition,
diabetes, obesity, steroid use over the long-term and advanced age changes the immune
system’s efficacy and thereby increases the risk of infection progression. There are a
number of other factors potentially preventing the body from preparing an efficient
immune response such as foreign bodies, poor perfusion, necrosis, tunneling and
undermining (Bowler 2001; Siddiqui and Bernstein 2010).
1.8.5.1 Impact of wound infection on different stage of wound healing
1.8.5.1.1 Impact of wound infection on inflammation phase:
The general impact of infection is heightened complement of protein consumption,
which according to Robson et al. (1990) results in a reduction of chemotaxis as well as
platelet depletion. Cellular response, in particular activity that is chemotactic and
bactericidal, neutrophils, enhanced accumulation of white cell and macrophages. The
function of white cells is impaired when infection is present, which includes short chain
products of fatty acid by bacteria that is anaerobic (Wall et al. 2002). According to
Edwards and Harding (2004), tissue damage is increased through heightened cytotoxic
enzyme production and free oxygen radicals. Thrombosis that is localised and the
release of metabolites that are vasoconstrictive increase the hypoxia of tissue and
promote the proliferation of bacteria and the destruction of tissue (Robson et al. 1990).
1.8.5.1.2 Impact of wound infection on the formation of granulation tissue and
angiogenesis:
The turnover increases more, due in part to bacterial enzymes’ production, which results
in haemorrhagic, oedematous, friable granulation bed and the formation of scarring that
is excessive. Interleukin production is stimulated by endotoxins in wounds as well as
TNF, which induces MMP production (Konturek et al. 2001; Power et al. 2001). There
32
is an imbalance between MMPs and their inhibitors of tissue and a decline in the
production of growth factor results.
1.8.5.1.3 Impact of wound infection on epithelialisation
This will decline if the load of the bacteria is over 105 because bacterial metabolites
restrain epithelium migration and digest proteins that are dermal as well as
polysaccharides (Edwards and Harding, 2004; Lawrence 1983; Lawrence 1987). Orgill
and Demling (1988) state that at state of infection, increased production neutrophil’s
proteases enzymes of damages epithelium that is vulnerable.
1.8.5.1.4 Impact of wound infection on the production of collagen:
This results in fewer numbers and fibroblast proliferation, with the production of
collagen being disorganised. Both the production increase and the collagen breakdown
have the overall impact of decreasing the strength of the wound (Robson, Stenberg and
Heggers, 1990). Metzger et al. (2002) stated that cross linking and deposition of
collagen is decreased by endotoxins and is connected to infection resulted from surgical
dehiscence. Moreover, wound contraction can be significantly delayed by wound
infection (Robson et al. 1990).
1.8.6 Current wound treatment
1.8.7 Antibacterial and antiseptic agents
As in skin infection wound care and antibacterial treatment is highly dependent on the
severity of the infection and underlying patient’s risk factors that could deteriorate the
wound healing process. Bacterial colonisation in wound can be managed by healthy
immune system and that depend on many factors including the bacterial load itself, type
33
of bacteria and many other factors that compromise human immune system to
opportunistic infection. If colonisation has developed to cause local infection in wound
site the therapy of an initial nature is normally empiric and should be assessed by the
infection’s severity and on any data of a microbiological nature that is available, such as
types of bacteria that causing the infection. Agents that are of a broad spectrum should
start therapy for infections that are severe as well as moderately chronic, more extensive
infections. These observed antibiotics should be active against cocci that is Gram-
positive (which includes MRSA in locations where it is common to find this pathogen),
as well as obligate anaerobic and Gram-negative organisms. Topical antibacterial
pharmaceutical product are intended to work on the wound site and have the advantage
of eliminating or decreasing systemic toxicity when used in clinical dosage.
The majority of mild infections and a number of moderate ones can be treated through
the use of agents which have a comparatively narrow spectrum, such as those applicable
only to aerobic cocci that are Gram-positive point out Although organisms that are
anaerobic are isolated from a number of serious infections, they are not very frequent
infections that are mild to moderate (Lipsky et al. 1990).
Topical antiseptic agents have high antibacterial or bactericidal effect on microorganism
that will act on the external surface of the skin. Antiseptics work against resident and
transient type of flora on the surface of the skin. Most of antiseptic agents have non-
selective mechanism of action which makes them broadly active against several types of
bacteria, viruses and fungi. These high activities and no selectivity make them work
even on wound healing skin cells that could counter act normal healing process. Most
commonly types of antiseptics that have been used on wound managements including:
chlorhexidine, alcohol, povidone-iodine acetate (Figure 1-8), sodium hypochlorite,
hydrogen peroxide (H2O2), silver nitrate and silver sulfadiazine (Drosou et al. 2003;
Atiyeh et al. 2009; Edlich et al. 2010).
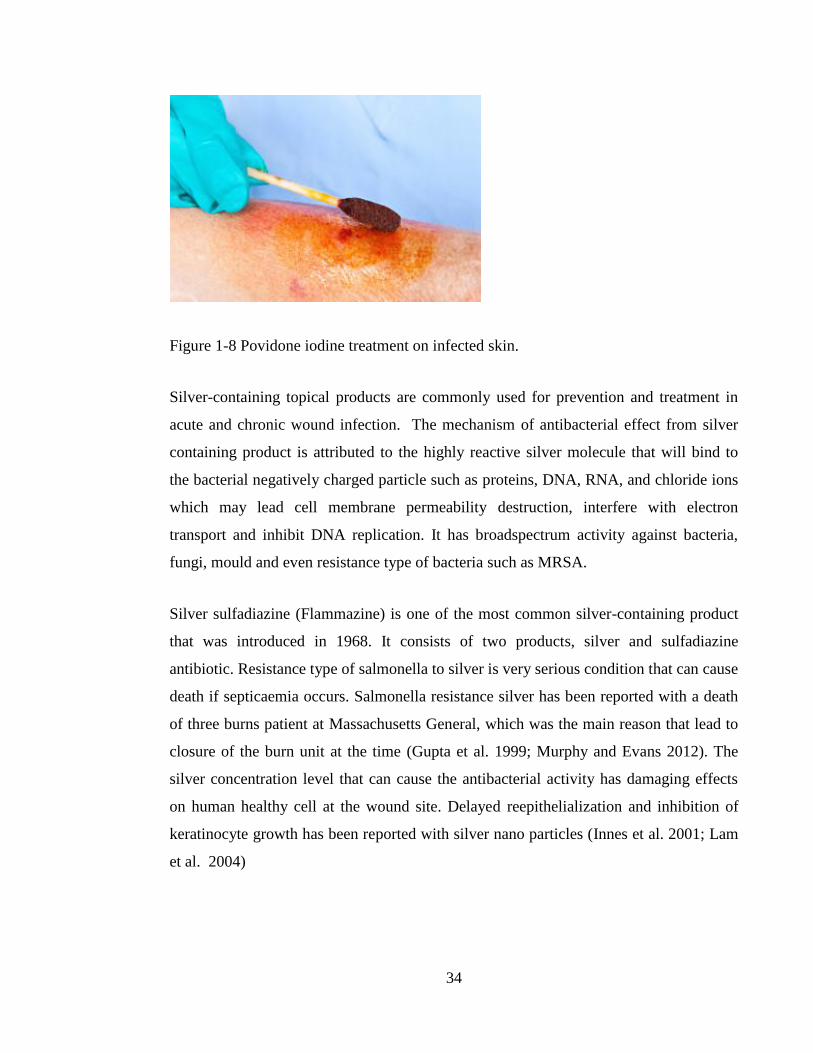
34
Figure 1-8 Povidone iodine treatment on infected skin.
Silver-containing topical products are commonly used for prevention and treatment in
acute and chronic wound infection. The mechanism of antibacterial effect from silver
containing product is attributed to the highly reactive silver molecule that will bind to
the bacterial negatively charged particle such as proteins, DNA, RNA, and chloride ions
which may lead cell membrane permeability destruction, interfere with electron
transport and inhibit DNA replication. It has broadspectrum activity against bacteria,
fungi, mould and even resistance type of bacteria such as MRSA.
Silver sulfadiazine (Flammazine) is one of the most common silver-containing product
that was introduced in 1968. It consists of two products, silver and sulfadiazine
antibiotic. Resistance type of salmonella to silver is very serious condition that can cause
death if septicaemia occurs. Salmonella resistance silver has been reported with a death
of three burns patient at Massachusetts General, which was the main reason that lead to
closure of the burn unit at the time (Gupta et al. 1999; Murphy and Evans 2012). The
silver concentration level that can cause the antibacterial activity has damaging effects
on human healthy cell at the wound site. Delayed reepithelialization and inhibition of
keratinocyte growth has been reported with silver nano particles (Innes et al. 2001; Lam
et al. 2004)
35
1.8.7.1 Wound cleaning, irrigation and disinfection
As previously mentioned, all wounds acute and chronic will be colonised with bacteria
either from the surrounding skin normal flora or from external environment such as
nosocomial infection. In chronic wounds, cleaning and disinfection plays very important
role in preventing any exacerbation of bacterial colonisation towards critical or local
infection level. In cleaning procedure, the risk benefit balance to the wound should be
considered ahead. The bacterial load at infected wound can be significantly decreased by
debridement and can be defined as the removal of dead tissue and plaque from the
wound site.
Wound cleaning solution can be described as the use of fluid to take off any
inflammatory contaminant that present on the surface of wound and it can be with or
without antiseptic activity (Rodeheaver and Ratliff 1997). The topical Antiseptic agent
can slow or stop the growth of microorganism on external surface of the skin. In
previous study, wound cleanser of with and without antiseptic activity were compared in
terms of toxicity index to show that the combined antiseptic with wound cleanser
showed higher level of toxicity indices than the cleanser that don’t have any antiseptic
activity (Hellewell et al. 1997).
Wound irrigation is a constant flow of cleaning solution on open wound and pressure
applied by the hydraulic forces that removes debris from wound site. The pressure force
from continuous flow of fluid should be more than the adhesion force that holds the
debris to the wound site in order to be logically effective (Rodeheaver and Ratliff 1997).
The pressure applied in irrigation has been reported to enhance the removal of bacterial
at wound site. Higher pressure up to 25 pounds per square inch (psi) showed more
efficient than the low-pressure irrigation produced by e.g. bulb syringe (Rodeheaver et
al. 1975; Rodeheaver and Ratliff 1997). Most commonly and practical irrigation method
is perform is using syringe filled with wound cleanser and flush the wound with
continuous pressure and to attaches the syringe with needle or catheter to increase the
pressure of irrigation. According to Longmire et al. (1987) the pressurised irrigation
36
using a 35-mL syringe attached to 19-gauge needle showed a significantly enhancement
of bacterial removal from wound site and a subsequent decrease in incidence of wound
infection than the irrigation with low pressure using a bulb syringe. Several methods and
techniques of irrigation vary from complex pulsatile lavage methods to simple use of 1 L
bag of sterile normal saline. The flow rate and time needed for irrigation can vary from
0.05 L/min when use 60 mL syringe with 19-gauge needle up to 2 L/min irrigation
method described by Karuppasamy et al. (2004) with using of one liter normal saline
bag and full cutting of the outer port to produce a nozzle.
1.8.8 Antimicrobial resistance
Antimicrobial resistance (AMR) happens when microorganisms (such as bacteria, fungi,
viruses, and parasites) change when they are exposed to antimicrobial drugs (such as
antibiotics, antifungals, antivirals, antimalarials and antihelminthics). Microorganisms
that develop antimicrobial resistance are sometimes referred to as “superbugs”.
Antimicrobial resistance (AMR) threatens the effective prevention and treatment of an
ever-increasing range of infections caused by bacteria, parasites, viruses and fungi. As a
result, the medicines become increasing less effective and infections persist, increasing
the risk of spread to others; and in increasing cases to the point the infection becomes
untreatable. One of the most aggressive types of bacteria is MRSA - it can cause topical
infection and if untreated or treated unsuccessfully it can progress to cause systemic life-
threading infection. Hospital acquired or nosocomial bacterial infection in wound is
commonly caused by MRSA (Köck et al. 2010). The high risk of developing local or
generalized systemic MRSA bacterial infection caused by surgical wound or pressure
ulcer was addressed in a cohort study that involved 479 hospital patients who were
initially colonized with MRSA. This study took 2 years to complete and showed that
almost 53 % of the patients in the cohort actually developed MRSA infection in surgical
wounds and pressure ulcer. The epithelial discontinuity in a wound can make the access
of MRSA to the underlying tissue far more likely than intact skin (Coello et al. 1997).
37
The lack of new antibiotics threatens global efforts to contain drug-resistant infections.
Therefore, there is an urgent need for the development of new treatment products to treat
infections. In his previous work, Houston (2011) showed that PRE/Zn have synergistic
or potentiated antiviral activity against HSV and acyclovir-resistant HSV-1 and HSV-2.
1.9 Research question and aims
Given the need for new products to treat infected wounds, along with previous
observations of the synergised antimicrobial activity of PRE combined with Zn(II), the
research question in this thesis is “Does PRE and Zn(II) have potential as a novel
therapeutic system to treat skin infections and wounds?”
1. To determine the antibacterial and bactericidal activity of PRE alone and in
combination with Zn(II) against a panel of bacteria associated with skin and wound
infections.
2. To determine the stability PRE alone and in combination with Zn(II) under different
pH and temperature conditions
3. To determine the in vitro cytotoxicity and anti-proliferative effects of PRE and Zn(II)
on the HaCaT keratinocyte cell line.
4. To determine the effects of PRE and Zn(II) on the scratch-test wound closure model
5. The preparation of topical formulation contains PRE and Zn(II)
6. To determine the in vitro skin permeation and penetration of punicalagin and Zn(II)
into skin
7. To determine activity of topical formulation contains PRE and Zn on inoculated ex
vivo skin model.
38
Chapter 2: Materials and general methods
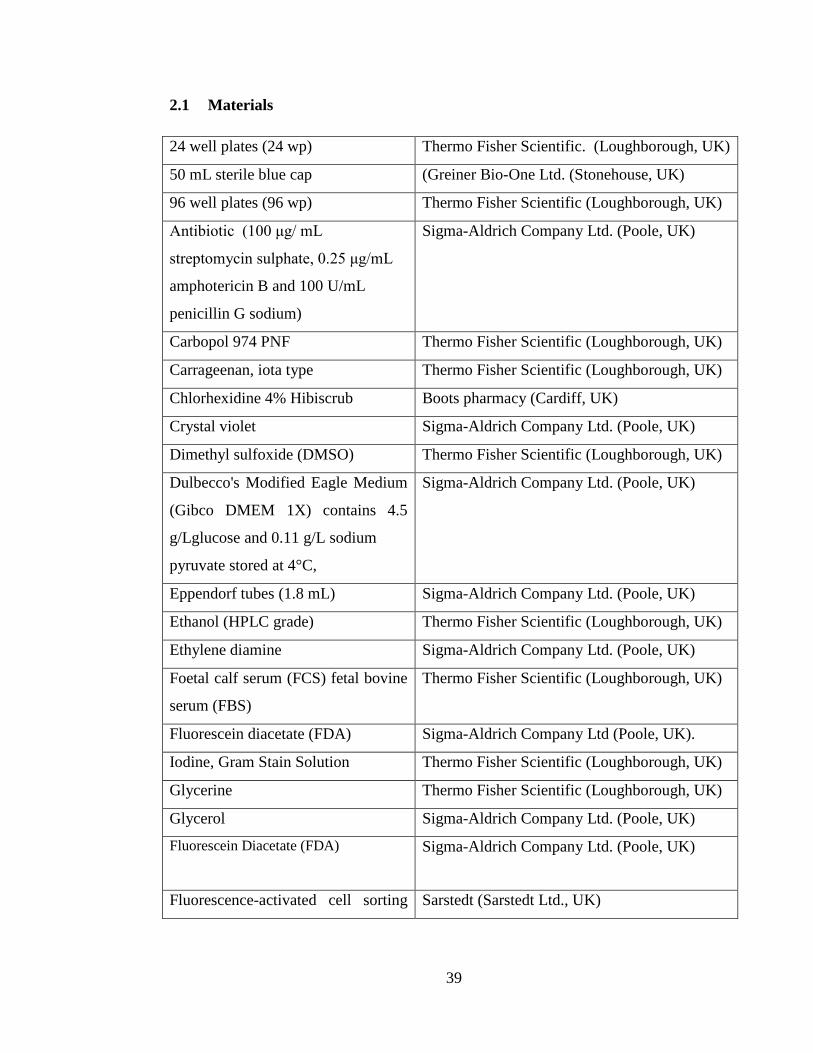
39
2.1 Materials
24 well plates (24 wp) Thermo Fisher Scientific. (Loughborough, UK)
50 mL sterile blue cap (Greiner Bio-One Ltd. (Stonehouse, UK)
96 well plates (96 wp) Thermo Fisher Scientific (Loughborough, UK)
Antibiotic (100 μg/ mL
streptomycin sulphate, 0.25 μg/mL
amphotericin B and 100 U/mL
penicillin G sodium)
Sigma-Aldrich Company Ltd. (Poole, UK)
Carbopol 974 PNF Thermo Fisher Scientific (Loughborough, UK)
Carrageenan, iota type Thermo Fisher Scientific (Loughborough, UK)
Chlorhexidine 4% Hibiscrub Boots pharmacy (Cardiff, UK)
Crystal violet Sigma-Aldrich Company Ltd. (Poole, UK)
Dimethyl sulfoxide (DMSO) Thermo Fisher Scientific (Loughborough, UK)
Dulbecco's Modified Eagle Medium
(Gibco DMEM 1X) contains 4.5
g/Lglucose and 0.11 g/L sodium
pyruvate stored at 4°C,
Sigma-Aldrich Company Ltd. (Poole, UK)
Eppendorf tubes (1.8 mL) Sigma-Aldrich Company Ltd. (Poole, UK)
Ethanol (HPLC grade) Thermo Fisher Scientific (Loughborough, UK)
Ethylene diamine Sigma-Aldrich Company Ltd. (Poole, UK)
Foetal calf serum (FCS) fetal bovine
serum (FBS)
Thermo Fisher Scientific (Loughborough, UK)
Fluorescein diacetate (FDA) Sigma-Aldrich Company Ltd (Poole, UK).
Iodine, Gram Stain Solution Thermo Fisher Scientific (Loughborough, UK)
Glycerine Thermo Fisher Scientific (Loughborough, UK)
Glycerol Sigma-Aldrich Company Ltd. (Poole, UK)
Fluorescein Diacetate (FDA)
Sigma-Aldrich Company Ltd. (Poole, UK)
Fluorescence-activated cell sorting Sarstedt (Sarstedt Ltd., UK)
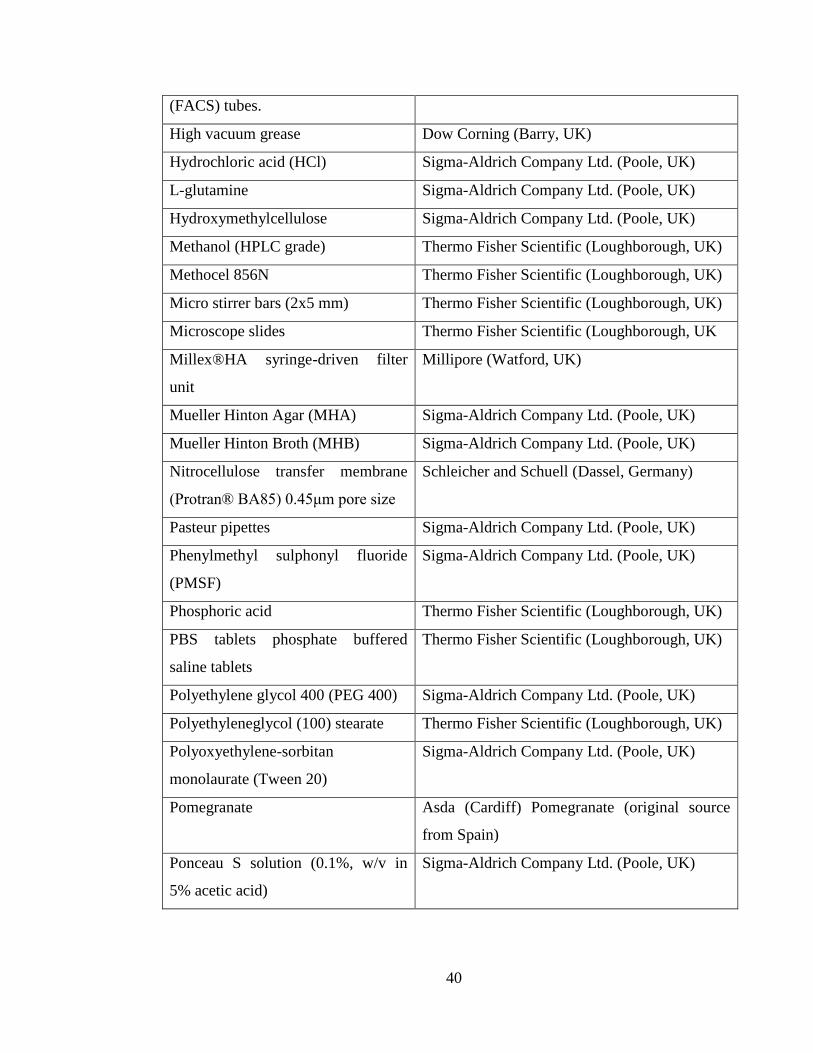
40
(FACS) tubes.
High vacuum grease Dow Corning (Barry, UK)
Hydrochloric acid (HCl) Sigma-Aldrich Company Ltd. (Poole, UK)
L-glutamine Sigma-Aldrich Company Ltd. (Poole, UK)
Hydroxymethylcellulose Sigma-Aldrich Company Ltd. (Poole, UK)
Methanol (HPLC grade) Thermo Fisher Scientific (Loughborough, UK)
Methocel 856N Thermo Fisher Scientific (Loughborough, UK)
Micro stirrer bars (2x5 mm) Thermo Fisher Scientific (Loughborough, UK)
Microscope slides Thermo Fisher Scientific (Loughborough, UK
Millex®HA syringe-driven filter
unit
Millipore (Watford, UK)
Mueller Hinton Agar (MHA) Sigma-Aldrich Company Ltd. (Poole, UK)
Mueller Hinton Broth (MHB) Sigma-Aldrich Company Ltd. (Poole, UK)
Nitrocellulose transfer membrane
(Protran® BA85) 0.45μm pore size
Schleicher and Schuell (Dassel, Germany)
Pasteur pipettes Sigma-Aldrich Company Ltd. (Poole, UK)
Phenylmethyl sulphonyl fluoride
(PMSF)
Sigma-Aldrich Company Ltd. (Poole, UK)
Phosphoric acid Thermo Fisher Scientific (Loughborough, UK)
PBS tablets phosphate buffered
saline tablets
Thermo Fisher Scientific (Loughborough, UK)
Polyethylene glycol 400 (PEG 400) Sigma-Aldrich Company Ltd. (Poole, UK)
Polyethyleneglycol (100) stearate Thermo Fisher Scientific (Loughborough, UK)
Polyoxyethylene-sorbitan
monolaurate (Tween 20)
Sigma-Aldrich Company Ltd. (Poole, UK)
Pomegranate Asda (Cardiff) Pomegranate (original source
from Spain)
Ponceau S solution (0.1%, w/v in
5% acetic acid)
Sigma-Aldrich Company Ltd. (Poole, UK)
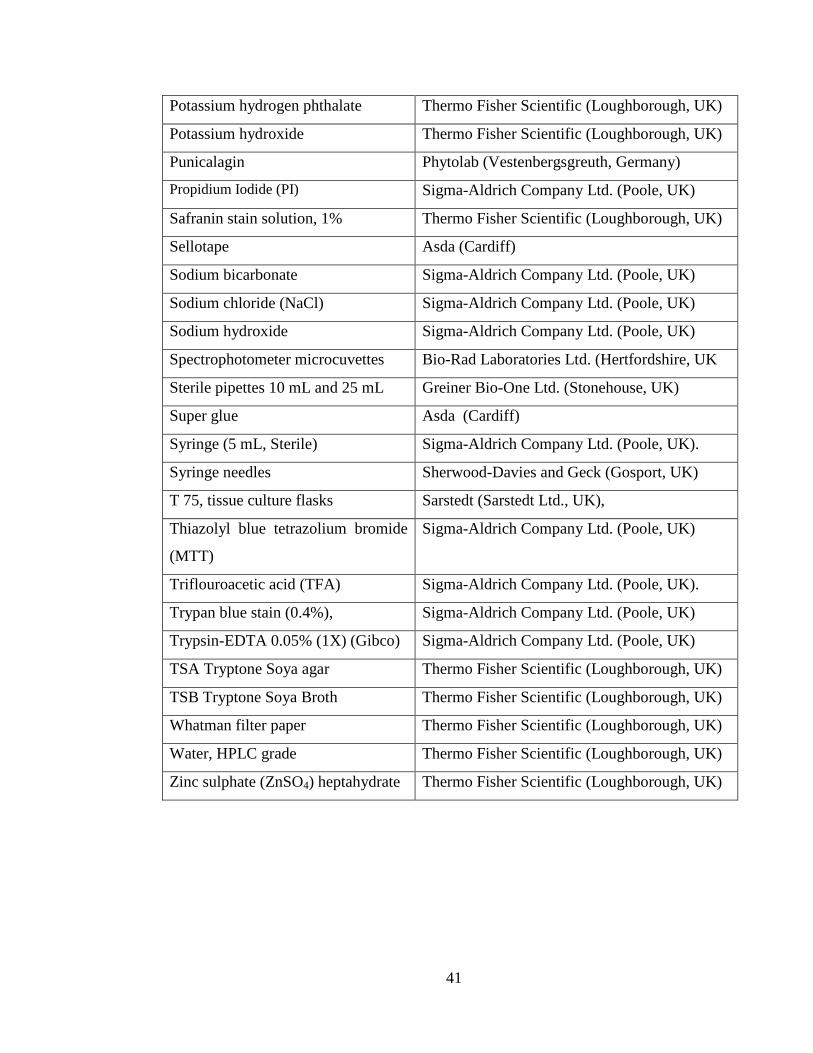
41
Potassium hydrogen phthalate Thermo Fisher Scientific (Loughborough, UK)
Potassium hydroxide Thermo Fisher Scientific (Loughborough, UK)
Punicalagin Phytolab (Vestenbergsgreuth, Germany)
Propidium Iodide (PI) Sigma-Aldrich Company Ltd. (Poole, UK)
Safranin stain solution, 1% Thermo Fisher Scientific (Loughborough, UK)
Sellotape Asda (Cardiff)
Sodium bicarbonate Sigma-Aldrich Company Ltd. (Poole, UK)
Sodium chloride (NaCl) Sigma-Aldrich Company Ltd. (Poole, UK)
Sodium hydroxide Sigma-Aldrich Company Ltd. (Poole, UK)
Spectrophotometer microcuvettes Bio-Rad Laboratories Ltd. (Hertfordshire, UK
Sterile pipettes 10 mL and 25 mL Greiner Bio-One Ltd. (Stonehouse, UK)
Super glue Asda (Cardiff)
Syringe (5 mL, Sterile) Sigma-Aldrich Company Ltd. (Poole, UK).
Syringe needles Sherwood-Davies and Geck (Gosport, UK)
T 75, tissue culture flasks Sarstedt (Sarstedt Ltd., UK),
Thiazolyl blue tetrazolium bromide
(MTT)
Sigma-Aldrich Company Ltd. (Poole, UK)
Triflouroacetic acid (TFA) Sigma-Aldrich Company Ltd. (Poole, UK).
Trypan blue stain (0.4%), Sigma-Aldrich Company Ltd. (Poole, UK)
Trypsin-EDTA 0.05% (1X) (Gibco) Sigma-Aldrich Company Ltd. (Poole, UK)
TSA Tryptone Soya agar Thermo Fisher Scientific (Loughborough, UK)
TSB Tryptone Soya Broth Thermo Fisher Scientific (Loughborough, UK)
Whatman filter paper Thermo Fisher Scientific (Loughborough, UK)
Water, HPLC grade Thermo Fisher Scientific (Loughborough, UK)
Zinc sulphate (ZnSO4) heptahydrate Thermo Fisher Scientific (Loughborough, UK)
42
2.2 General methods
2.2.1 Solution preparation
2.2.1.1 Pomegranate rind extract (PRE)
Pomegranate rind extract was prepared using the method of Stewart et al., 1998. Four
pomegranates were bought from the local market, and the source was from Spain.
Pomegranate rind was cut into thin long strips and then blended with deionized water
25% w/v. Then, the solution was boiled for 10 minutes in order to extract tannins from
the rind. Centrifuging of the solution was done for 40 minutes (6 x) using Heraeus™
Multifuge 3 S-R centrifuge at 5980 g. After that, the solution was vacuum filtered
through 0.45 µm nylon membrane filter. The total volume of the filtrate was 289.5 mL.
Part of the solution was freeze-dried using a Scanivac™ freeze drier and the rest was
stored at -20˚C. The extraction steps are summarised in Figure (2-1).
2.2.1.2 Reconstitution of freeze-dried PRE
When needed, freeze dried PRE was reconstituted with phthalate buffer (pH 4.5) to a
known concentration. Several concentrations of PRE were used during this project, for
example to prepare 2 mg/mL concentration of PRE, a 20 mg of freeze dried PRE was
added to 10 mL phthalate buffer (pH 4.5). In the same manner, if 5 mg/mL stock
solution of PRE was needed, a 25 mg of freeze dried PRE was added to 5 mL phthalate
buffer (pH 4.5). After preparation, sonication for 10 min at 50-60 Hz of solution then
filtered through 0.45 μm Millex-FG syringe driven filter unit. Finally, the solution was
protected from light. In the stability study water were used as solvent for PRE samples
with pH 7.
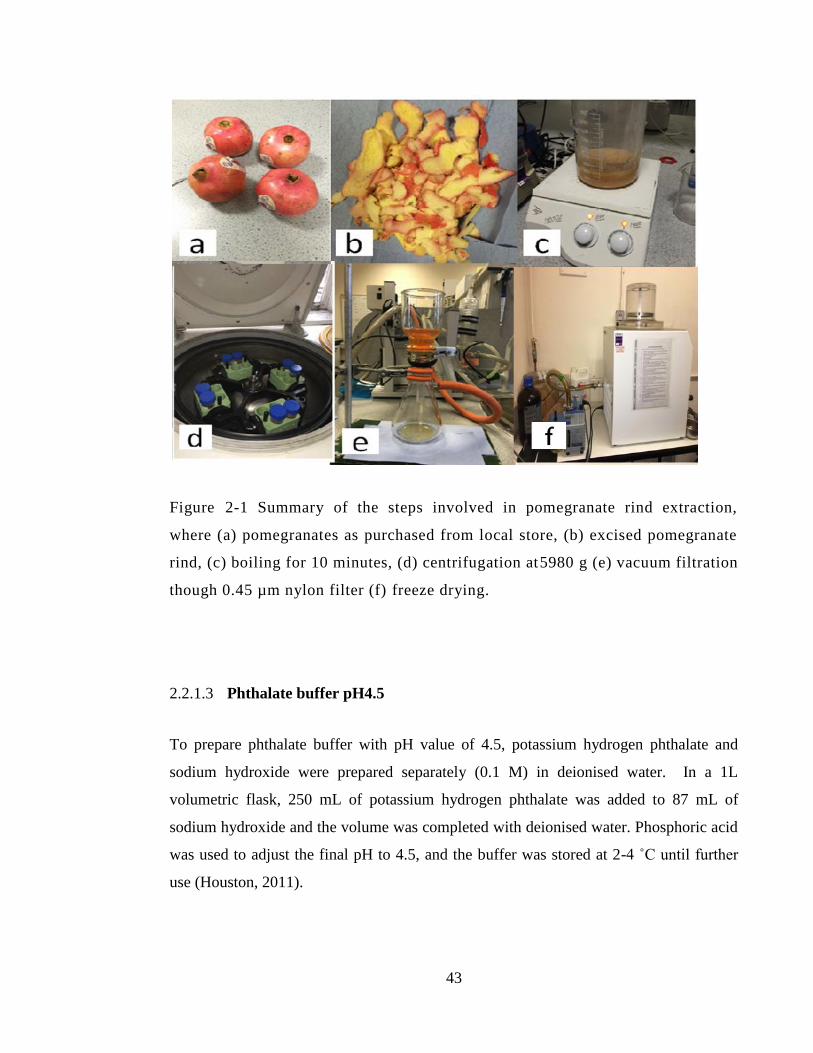
43
Figure 2-1 Summary of the steps involved in pomegranate rind extraction,
where (a) pomegranates as purchased from local store, (b) excised pomegranate
rind, (c) boiling for 10 minutes, (d) centrifugation at5980 g (e) vacuum filtration
though 0.45 µm nylon filter (f) freeze drying.
2.2.1.3 Phthalate buffer pH4.5
To prepare phthalate buffer with pH value of 4.5, potassium hydrogen phthalate and
sodium hydroxide were prepared separately (0.1 M) in deionised water. In a 1L
volumetric flask, 250 mL of potassium hydrogen phthalate was added to 87 mL of
sodium hydroxide and the volume was completed with deionised water. Phosphoric acid
was used to adjust the final pH to 4.5, and the buffer was stored at 2-4 ˚C until further
use (Houston, 2011).
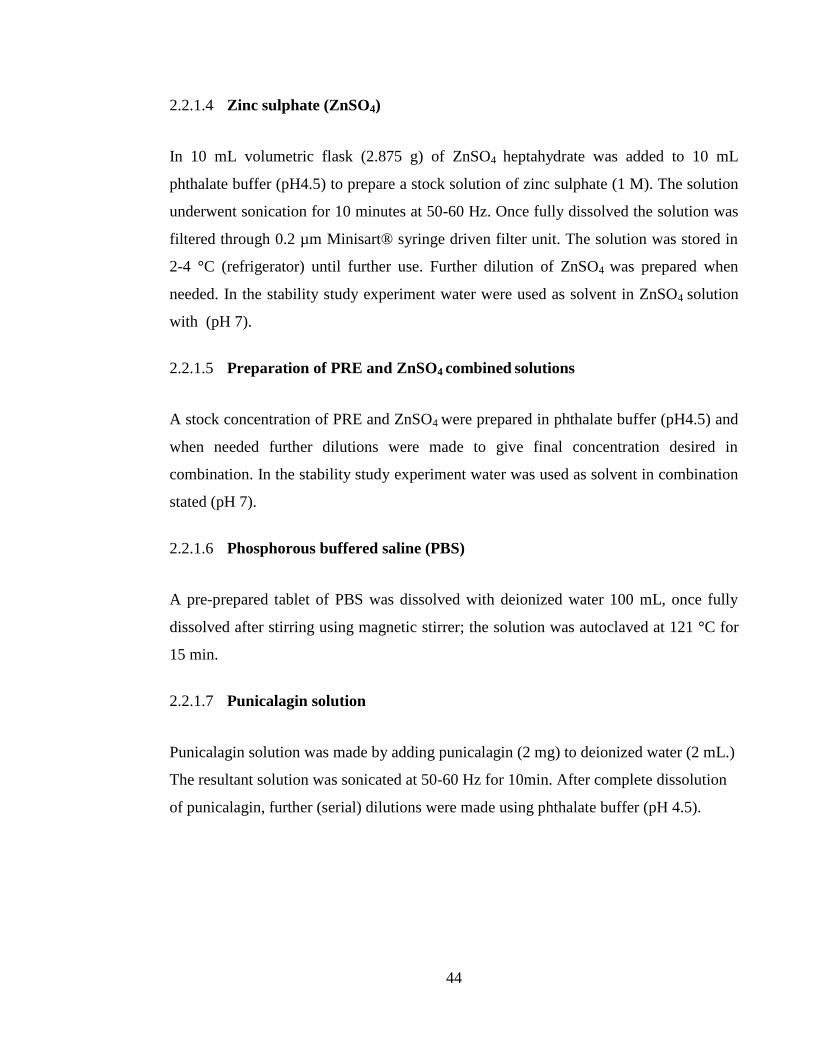
44
2.2.1.4 Zinc sulphate (ZnSO4)
In 10 mL volumetric flask (2.875 g) of ZnSO4 heptahydrate was added to 10 mL
phthalate buffer (pH4.5) to prepare a stock solution of zinc sulphate (1 M). The solution
underwent sonication for 10 minutes at 50-60 Hz. Once fully dissolved the solution was
filtered through 0.2 µm Minisart® syringe driven filter unit. The solution was stored in
2-4 °C (refrigerator) until further use. Further dilution of ZnSO4 was prepared when
needed. In the stability study experiment water were used as solvent in ZnSO4 solution
with (pH 7).
2.2.1.5 Preparation of PRE and ZnSO4 combined solutions
A stock concentration of PRE and ZnSO4 were prepared in phthalate buffer (pH4.5) and
when needed further dilutions were made to give final concentration desired in
combination. In the stability study experiment water was used as solvent in combination
stated (pH 7).
2.2.1.6 Phosphorous buffered saline (PBS)
A pre-prepared tablet of PBS was dissolved with deionized water 100 mL, once fully
dissolved after stirring using magnetic stirrer; the solution was autoclaved at 121 °C for
15 min.
2.2.1.7 Punicalagin solution
Punicalagin solution was made by adding punicalagin (2 mg) to deionized water (2 mL.)
The resultant solution was sonicated at 50-60 Hz for 10min. After complete dissolution
of punicalagin, further (serial) dilutions were made using phthalate buffer (pH 4.5).
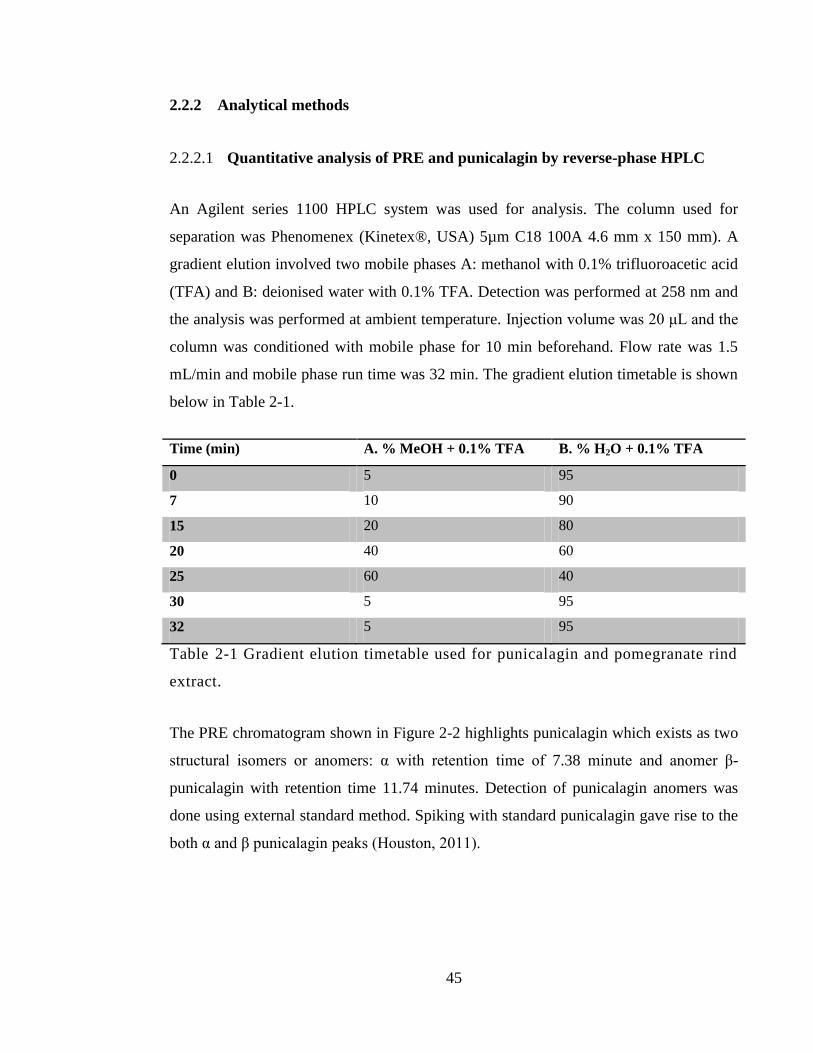
45
2.2.2 Analytical methods
2.2.2.1 Quantitative analysis of PRE and punicalagin by reverse-phase HPLC
An Agilent series 1100 HPLC system was used for analysis. The column used for
separation was Phenomenex (Kinetex®, USA) 5µm C18 100A 4.6 mm x 150 mm). A
gradient elution involved two mobile phases A: methanol with 0.1% trifluoroacetic acid
(TFA) and B: deionised water with 0.1% TFA. Detection was performed at 258 nm and
the analysis was performed at ambient temperature. Injection volume was 20 μL and the
column was conditioned with mobile phase for 10 min beforehand. Flow rate was 1.5
mL/min and mobile phase run time was 32 min. The gradient elution timetable is shown
below in Table 2-1.
Time (min) A. % MeOH + 0.1% TFA B. % H2O + 0.1% TFA
0 5 95
7 10 90
15 20 80
20 40 60
25 60 40
30 5 95
32 5 95
Table 2-1 Gradient elution timetable used for punicalagin and pomegranate rind
extract.
The PRE chromatogram shown in Figure 2-2 highlights punicalagin which exists as two
structural isomers or anomers: α with retention time of 7.38 minute and anomer β-
punicalagin with retention time 11.74 minutes. Detection of punicalagin anomers was
done using external standard method. Spiking with standard punicalagin gave rise to the
both α and β punicalagin peaks (Houston, 2011).
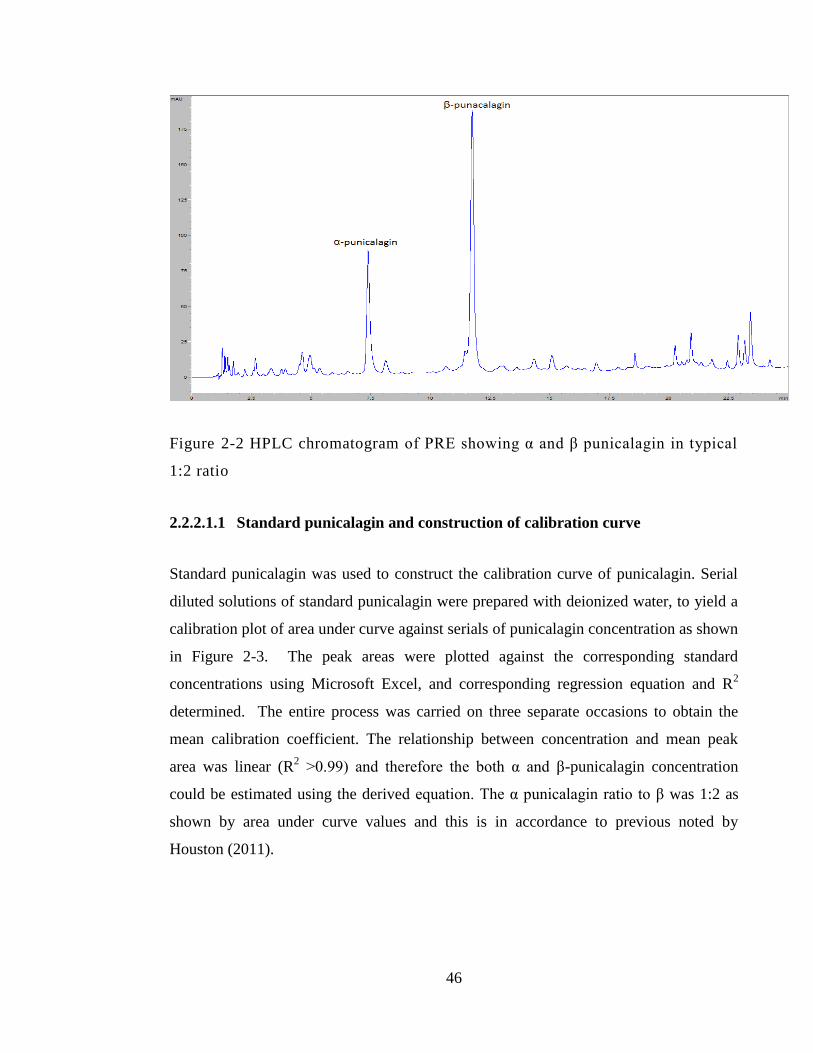
46
Figure 2-2 HPLC chromatogram of PRE showing α and β punicalagin in typical
1:2 ratio
2.2.2.1.1 Standard punicalagin and construction of calibration curve
Standard punicalagin was used to construct the calibration curve of punicalagin. Serial
diluted solutions of standard punicalagin were prepared with deionized water, to yield a
calibration plot of area under curve against serials of punicalagin concentration as shown
in Figure 2-3. The peak areas were plotted against the corresponding standard
concentrations using Microsoft Excel, and corresponding regression equation and R2
determined. The entire process was carried on three separate occasions to obtain the
mean calibration coefficient. The relationship between concentration and mean peak
area was linear (R2 >0.99) and therefore the both α and β-punicalagin concentration
could be estimated using the derived equation. The α punicalagin ratio to β was 1:2 as
shown by area under curve values and this is in accordance to previous noted by
Houston (2011).
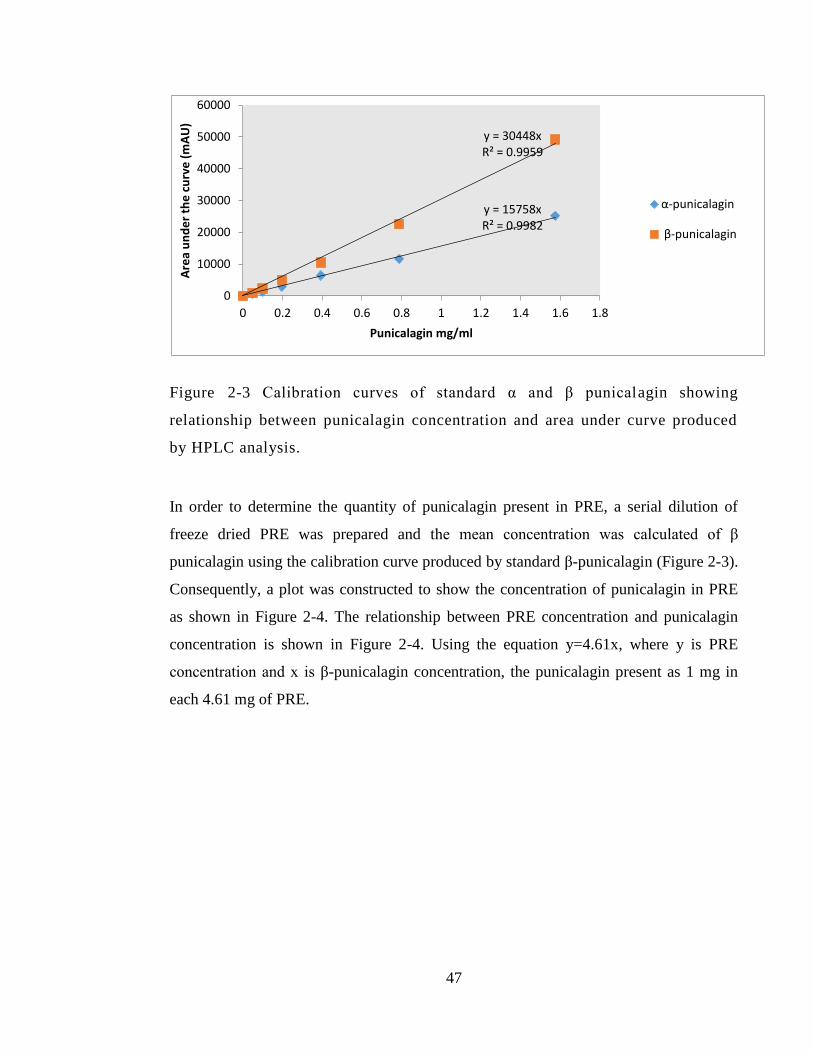
47
Figure 2-3 Calibration curves of standard α and β punicalagin showing
relationship between punicalagin concentration and area under curve produced
by HPLC analysis.
In order to determine the quantity of punicalagin present in PRE, a serial dilution of
freeze dried PRE was prepared and the mean concentration was calculated of β
punicalagin using the calibration curve produced by standard β-punicalagin (Figure 2-3).
Consequently, a plot was constructed to show the concentration of punicalagin in PRE
as shown in Figure 2-4. The relationship between PRE concentration and punicalagin
concentration is shown in Figure 2-4. Using the equation y=4.61x, where y is PRE
concentration and x is β-punicalagin concentration, the punicalagin present as 1 mg in
each 4.61 mg of PRE.
y = 15758x R² = 0.9982
y = 30448x R² = 0.9959
0
10000
20000
30000
40000
50000
60000
0 0.2 0.4 0.6 0.8 1 1.2 1.4 1.6 1.8
Are
a u
nd
er
the
cu
rve
(m
AU
)
Punicalagin mg/ml
α-punicalagin
β-punicalagin
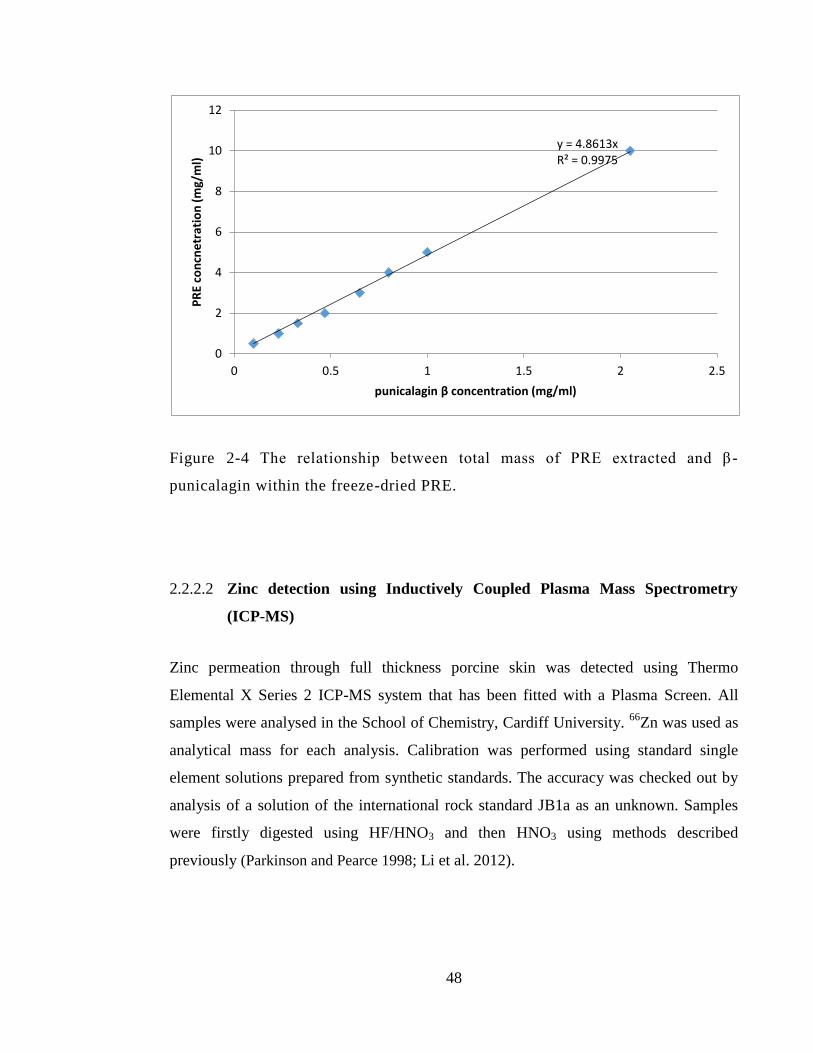
48
Figure 2-4 The relationship between total mass of PRE extracted and β -
punicalagin within the freeze-dried PRE.
2.2.2.2 Zinc detection using Inductively Coupled Plasma Mass Spectrometry
(ICP-MS)
Zinc permeation through full thickness porcine skin was detected using Thermo
Elemental X Series 2 ICP-MS system that has been fitted with a Plasma Screen. All
samples were analysed in the School of Chemistry, Cardiff University. 66
Zn was used as
analytical mass for each analysis. Calibration was performed using standard single
element solutions prepared from synthetic standards. The accuracy was checked out by
analysis of a solution of the international rock standard JB1a as an unknown. Samples
were firstly digested using HF/HNO3 and then HNO3 using methods described
previously (Parkinson and Pearce 1998; Li et al. 2012).
y = 4.8613x R² = 0.9975
0
2
4
6
8
10
12
0 0.5 1 1.5 2 2.5
PR
E co
ncn
etr
atio
n (
mg/
ml)
punicalagin β concentration (mg/ml)
49
2.2.3 Skin preparation methods
2.2.3.1 Porcine ear skin preparation
Porcine ear skin was provided by a local slaughterhouse. The ears were cut immediately
after slaughter and washed and transferred in cooled container to the laboratory. At the
lab the skin was cleaned using running tap water at cool temperature and any excess hair
was removed using electric clippers. Then the full thickness skin was carefully separated
from the dorsal cartilage site by blunt dissection using a sterile scalpel using and excess
subcutaneous fat layer was removed. Then the skin was divided into small sections area
with (2 x 2 cm) and of 0.5–0.8 mm thickness used.
2.2.3.2 Heat-Separated Epidermis (HSE)
Some of the previously prepared porcine skin in Section 2.2.3.1 underwent a further step
to isolate the epidermis layer when needed. According to the published method by
Kligman and Christophers (1963), epidermis layer can be isolated from the dermis by
soaking the extracted skin in deionized water at high temperature (55 °C) for 1-2
minutes. The epidermis layer was removed by hand using gloves and carefully taking
the outer layer from the underlying dermis. Any abnormality or holes were observed in
skin samples were excluded. The epidermis samples to be used were cut into (2cm x
2cm) squares.
2.2.4 Microbiological methods
2.2.4.1 Aseptic technique
Aseptic technique was employed at all stages in microbiology methods using
microbiology safety cabinets and routinely cleaning with 70% ethanol. To maintain
sterility, all solutions and some plastics that have been used as phosphate buffered saline
(PBS), water and pH 4.5 phthalate buffer were autoclaved at 123 °C, 15 lb/m2 for 15
50
minutes. Water baths, incubator and cabinets were routinely cleaned using water and 70
% ethanol.
2.2.4.2 Preparation of Mueller Hinton Agar (MHA) and Tryptone Soy Agar
(TSA)
Mueller Hinton Agar (MHA) was prepared as instructed on the bottle (Sigma-Aldrich
Company Ltd, Poole, UK) by adding 38 g to 1 litre of deionised water. After mixing and
completely dissolved autoclave at 121 °C for 15 min and stored at 60 °C before pouring
into sterilized plates. Tryptone Soy Agar (TSA) was prepared by adding 40 g of TSA
(CM0131) to 1 L deionised water. The mixture was placed on hot plate until boiling and
fully dissolved. Then mixture then underwent sterilization by autoclave at 121 °C for 15
min and stored at 60 °C until pouring to sterilized plates.
2.2.4.3 Preparation of Mueller Hinton Broth (MHB) and Tryptone Soy Broth
(TSB)
MHB prepared as instructed on the bottle (Sigma-Aldrich Company Ltd, Poole, UK) by
placing 21.0 g in 1 L of deionized water then mix to dissolve completely. After that, the
mixture was autoclaved at 121 °C for 15 min and stored at 60 °C before pouring into
sterilized plates. Tryptone Soy Broth (TSB) was prepared as instructed on the bottle. 30
g TSB (CM0129) was added to one litre deionised water. After mixing well, the broth
was sterilized by autoclave at 121 °C, then stored at 2-4 °C until further use. Fresh
nutrient broth was prepared every 2 weeks.
51
2.2.4.4 Preparation of bacterial cultures
Five bacterial strains were used for investigation used in this study:
1. Methicillin resistant Staphylococcus aureus (MRSA) (NCTC 12493)
2. Escherichia coli (E. coli) (NCTC 12923)
3. Pseudomonas aeruginosa (P. aeruginosa) (NCTC 6750)
4. Staphylococcus epidermidis (NCTC 11047)
5. Methicillin sensitive Staphylococcus aureus (MSSA) (NCTC 10788)
All bacterial strains were provided by CSPPS, Cardiff University. The bacterial stock
was stored in Microbank™ cryo-protective beads (Pro-Lab Diagnostics Ltd., UK) at -
80° C until further use. Culture preparation of each bacterium followed the working
culture preparation method. When needed fresh bacterial culture was prepared every 2
weeks and stored at 2-4 ˚C until further use.
2.2.4.5 Preparation of fresh bacterial culture
To prepare fresh bacterial cultures, fresh inoculations of tested bacteria were made onto
agar plates using a 10 µL inoculation loop. The streak plate method was used for
inoculation in order to spread the concentrated bacteria as solution on agar plate, as
shown in Figure 2-2. Incubation was at 37 °C for 24 h and stored at 2-4 °C until
needed. Fresh bacteria were prepared every 2 weeks.
2.2.4.6 Preparation of working culture
Inoculate bacteria from freshly prepared bacterial culture stock onto agar plate using 10
µL loop and then incubate at 37 ˚C for 24 h. A single colony of bacterial growth was
transferred into sterile universal tubes containing 10 mL of broth and incubated at 37 ˚C
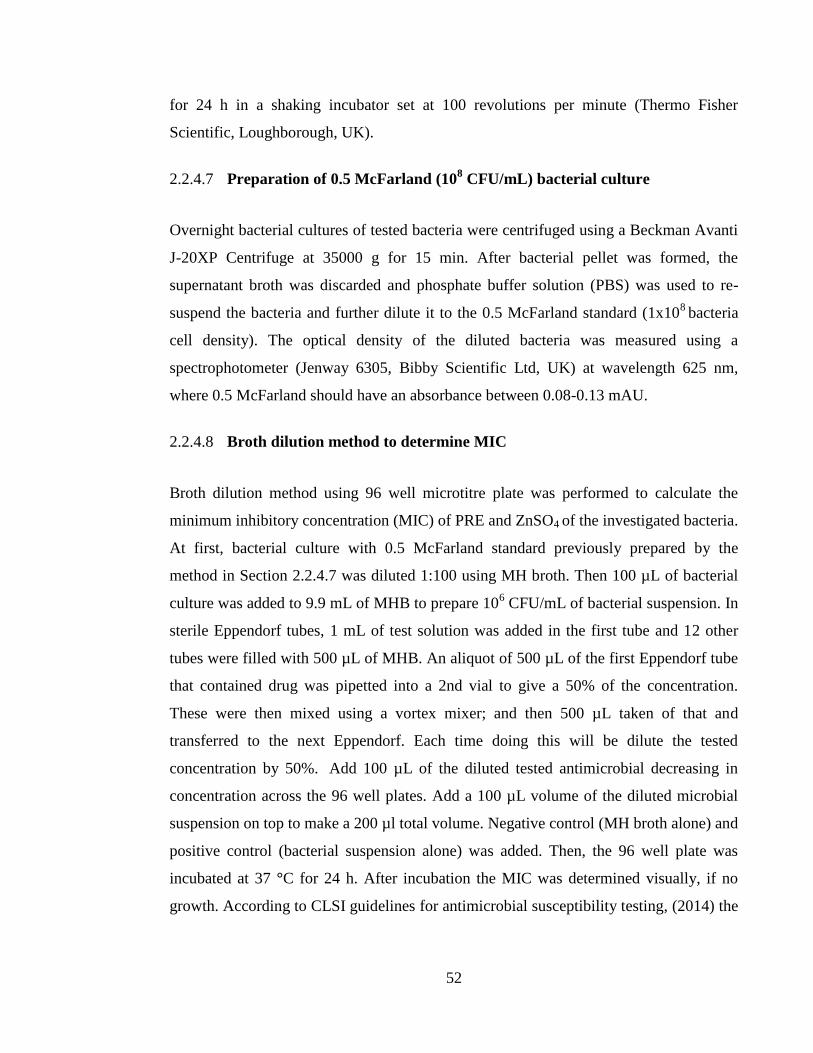
52
for 24 h in a shaking incubator set at 100 revolutions per minute (Thermo Fisher
Scientific, Loughborough, UK).
2.2.4.7 Preparation of 0.5 McFarland (108 CFU/mL) bacterial culture
Overnight bacterial cultures of tested bacteria were centrifuged using a Beckman Avanti
J-20XP Centrifuge at 35000 g for 15 min. After bacterial pellet was formed, the
supernatant broth was discarded and phosphate buffer solution (PBS) was used to re-
suspend the bacteria and further dilute it to the 0.5 McFarland standard (1x10⁸
bacteria
cell density). The optical density of the diluted bacteria was measured using a
spectrophotometer (Jenway 6305, Bibby Scientific Ltd, UK) at wavelength 625 nm,
where 0.5 McFarland should have an absorbance between 0.08-0.13 mAU.
2.2.4.8 Broth dilution method to determine MIC
Broth dilution method using 96 well microtitre plate was performed to calculate the
minimum inhibitory concentration (MIC) of PRE and ZnSO4 of the investigated bacteria.
At first, bacterial culture with 0.5 McFarland standard previously prepared by the
method in Section 2.2.4.7 was diluted 1:100 using MH broth. Then 100 µL of bacterial
culture was added to 9.9 mL of MHB to prepare 106 CFU/mL of bacterial suspension. In
sterile Eppendorf tubes, 1 mL of test solution was added in the first tube and 12 other
tubes were filled with 500 µL of MHB. An aliquot of 500 µL of the first Eppendorf tube
that contained drug was pipetted into a 2nd vial to give a 50% of the concentration.
These were then mixed using a vortex mixer; and then 500 µL taken of that and
transferred to the next Eppendorf. Each time doing this will be dilute the tested
concentration by 50%. Add 100 µL of the diluted tested antimicrobial decreasing in
concentration across the 96 well plates. Add a 100 µL volume of the diluted microbial
suspension on top to make a 200 µl total volume. Negative control (MH broth alone) and
positive control (bacterial suspension alone) was added. Then, the 96 well plate was
incubated at 37 °C for 24 h. After incubation the MIC was determined visually, if no
growth. According to CLSI guidelines for antimicrobial susceptibility testing, (2014) the
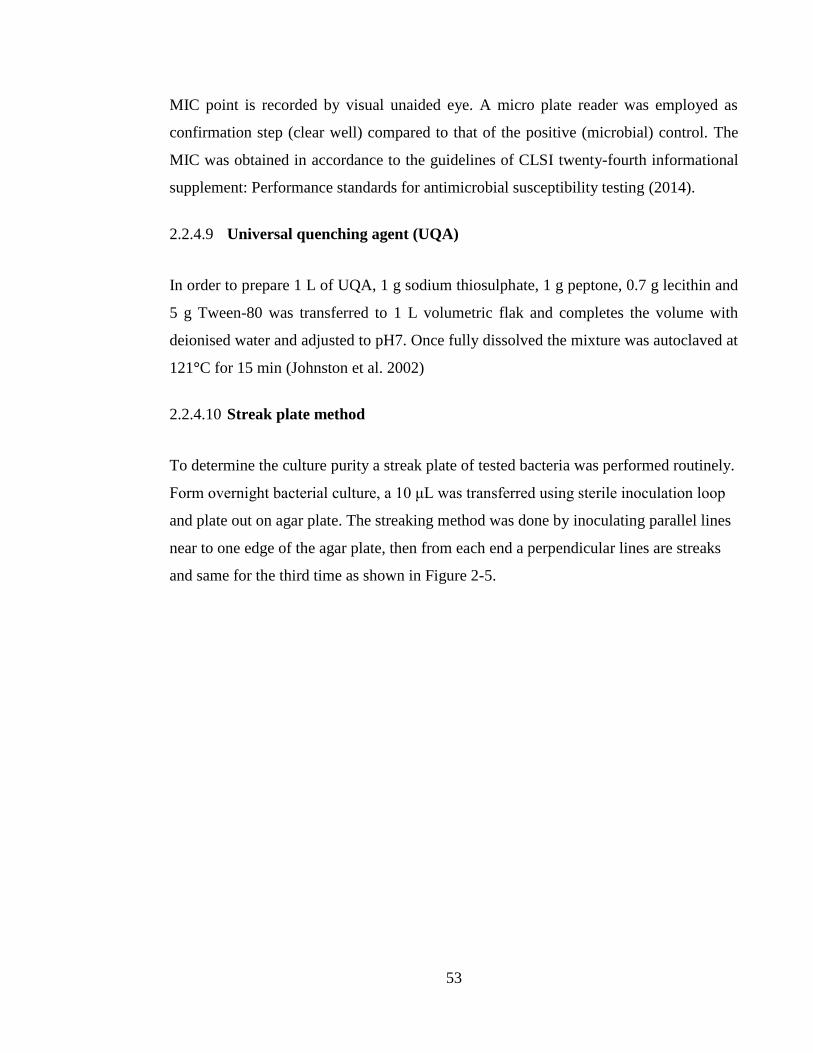
53
MIC point is recorded by visual unaided eye. A micro plate reader was employed as
confirmation step (clear well) compared to that of the positive (microbial) control. The
MIC was obtained in accordance to the guidelines of CLSI twenty-fourth informational
supplement: Performance standards for antimicrobial susceptibility testing (2014).
2.2.4.9 Universal quenching agent (UQA)
In order to prepare 1 L of UQA, 1 g sodium thiosulphate, 1 g peptone, 0.7 g lecithin and
5 g Tween-80 was transferred to 1 L volumetric flak and completes the volume with
deionised water and adjusted to pH7. Once fully dissolved the mixture was autoclaved at
121°C for 15 min (Johnston et al. 2002)
2.2.4.10 Streak plate method
To determine the culture purity a streak plate of tested bacteria was performed routinely.
Form overnight bacterial culture, a 10 μL was transferred using sterile inoculation loop
and plate out on agar plate. The streaking method was done by inoculating parallel lines
near to one edge of the agar plate, then from each end a perpendicular lines are streaks
and same for the third time as shown in Figure 2-5.
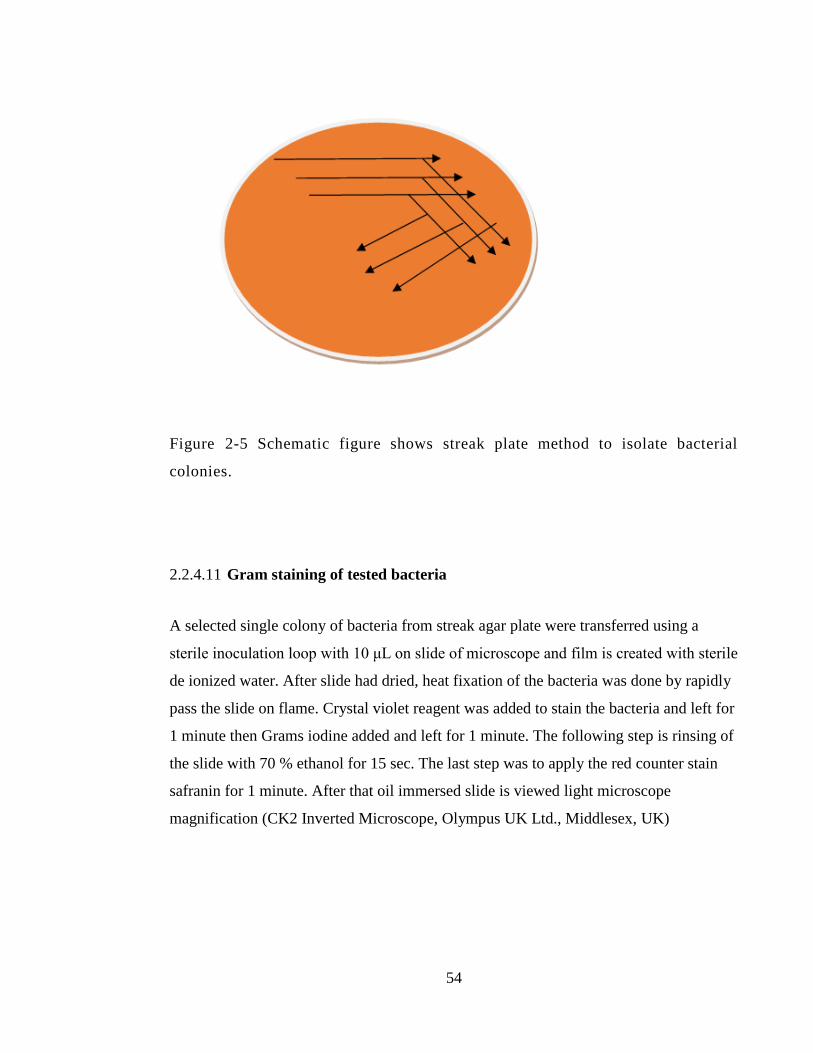
54
Figure 2-5 Schematic figure shows streak plate method to isolate bacterial
colonies.
2.2.4.11 Gram staining of tested bacteria
A selected single colony of bacteria from streak agar plate were transferred using a
sterile inoculation loop with 10 μL on slide of microscope and film is created with sterile
de ionized water. After slide had dried, heat fixation of the bacteria was done by rapidly
pass the slide on flame. Crystal violet reagent was added to stain the bacteria and left for
1 minute then Grams iodine added and left for 1 minute. The following step is rinsing of
the slide with 70 % ethanol for 15 sec. The last step was to apply the red counter stain
safranin for 1 minute. After that oil immersed slide is viewed light microscope
magnification (CK2 Inverted Microscope, Olympus UK Ltd., Middlesex, UK)
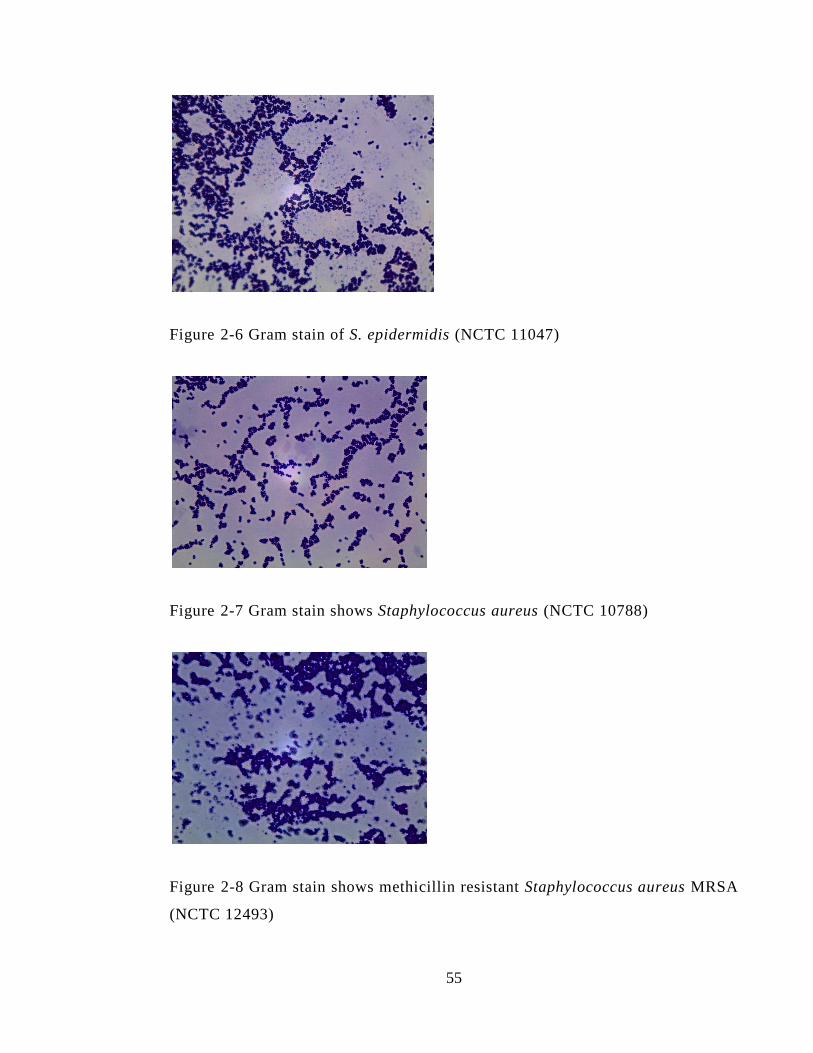
55
Figure 2-6 Gram stain of S. epidermidis (NCTC 11047)
Figure 2-7 Gram stain shows Staphylococcus aureus (NCTC 10788)
Figure 2-8 Gram stain shows methicillin resistant Staphylococcus aureus MRSA
(NCTC 12493)
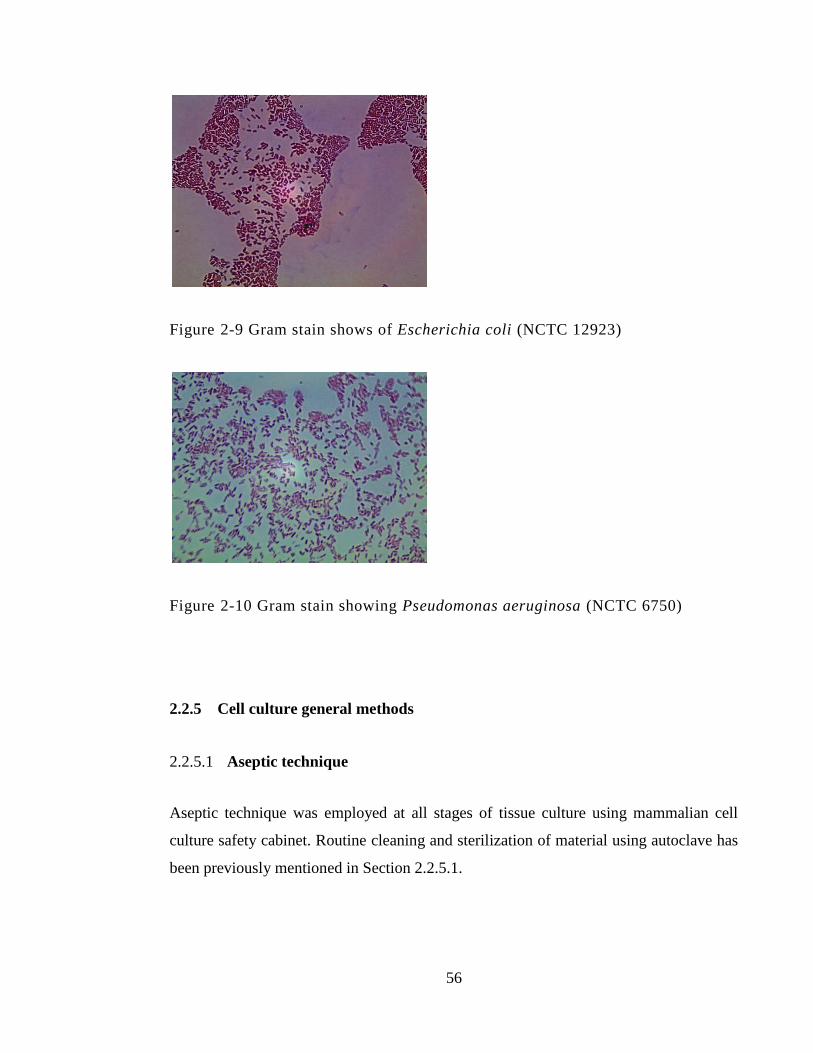
56
Figure 2-9 Gram stain shows of Escherichia coli (NCTC 12923)
Figure 2-10 Gram stain showing Pseudomonas aeruginosa (NCTC 6750)
2.2.5 Cell culture general methods
2.2.5.1 Aseptic technique
Aseptic technique was employed at all stages of tissue culture using mammalian cell
culture safety cabinet. Routine cleaning and sterilization of material using autoclave has
been previously mentioned in Section 2.2.5.1.
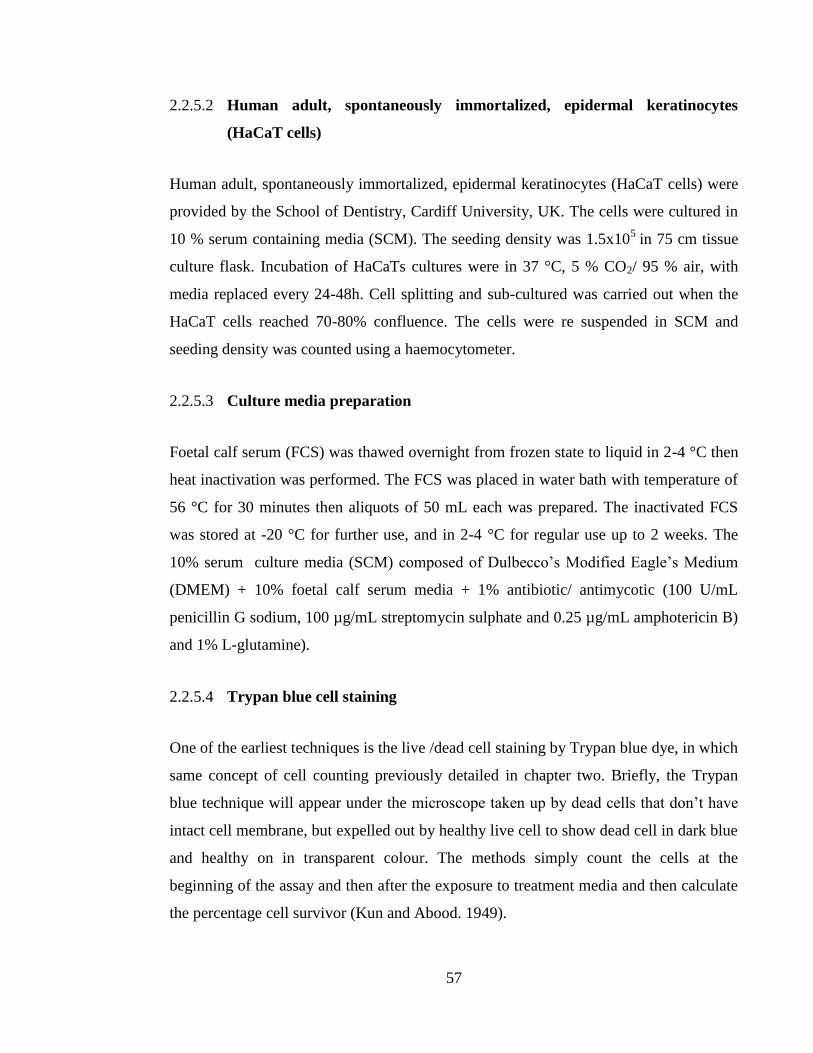
57
2.2.5.2 Human adult, spontaneously immortalized, epidermal keratinocytes
(HaCaT cells)
Human adult, spontaneously immortalized, epidermal keratinocytes (HaCaT cells) were
provided by the School of Dentistry, Cardiff University, UK. The cells were cultured in
10 % serum containing media (SCM). The seeding density was 1.5x10⁵
in 75 cm tissue
culture flask. Incubation of HaCaTs cultures were in 37 °C, 5 % CO2/ 95 % air, with
media replaced every 24-48h. Cell splitting and sub-cultured was carried out when the
HaCaT cells reached 70-80% confluence. The cells were re suspended in SCM and
seeding density was counted using a haemocytometer.
2.2.5.3 Culture media preparation
Foetal calf serum (FCS) was thawed overnight from frozen state to liquid in 2-4 °C then
heat inactivation was performed. The FCS was placed in water bath with temperature of
56 °C for 30 minutes then aliquots of 50 mL each was prepared. The inactivated FCS
was stored at -20 °C for further use, and in 2-4 °C for regular use up to 2 weeks. The
10% serum culture media (SCM) composed of Dulbecco’s Modified Eagle’s Medium
(DMEM) + 10% foetal calf serum media + 1% antibiotic/ antimycotic (100 U/mL
penicillin G sodium, 100 µg/mL streptomycin sulphate and 0.25 µg/mL amphotericin B)
and 1% L-glutamine).
2.2.5.4 Trypan blue cell staining
One of the earliest techniques is the live /dead cell staining by Trypan blue dye, in which
same concept of cell counting previously detailed in chapter two. Briefly, the Trypan
blue technique will appear under the microscope taken up by dead cells that don’t have
intact cell membrane, but expelled out by healthy live cell to show dead cell in dark blue
and healthy on in transparent colour. The methods simply count the cells at the
beginning of the assay and then after the exposure to treatment media and then calculate
the percentage cell survivor (Kun and Abood. 1949).
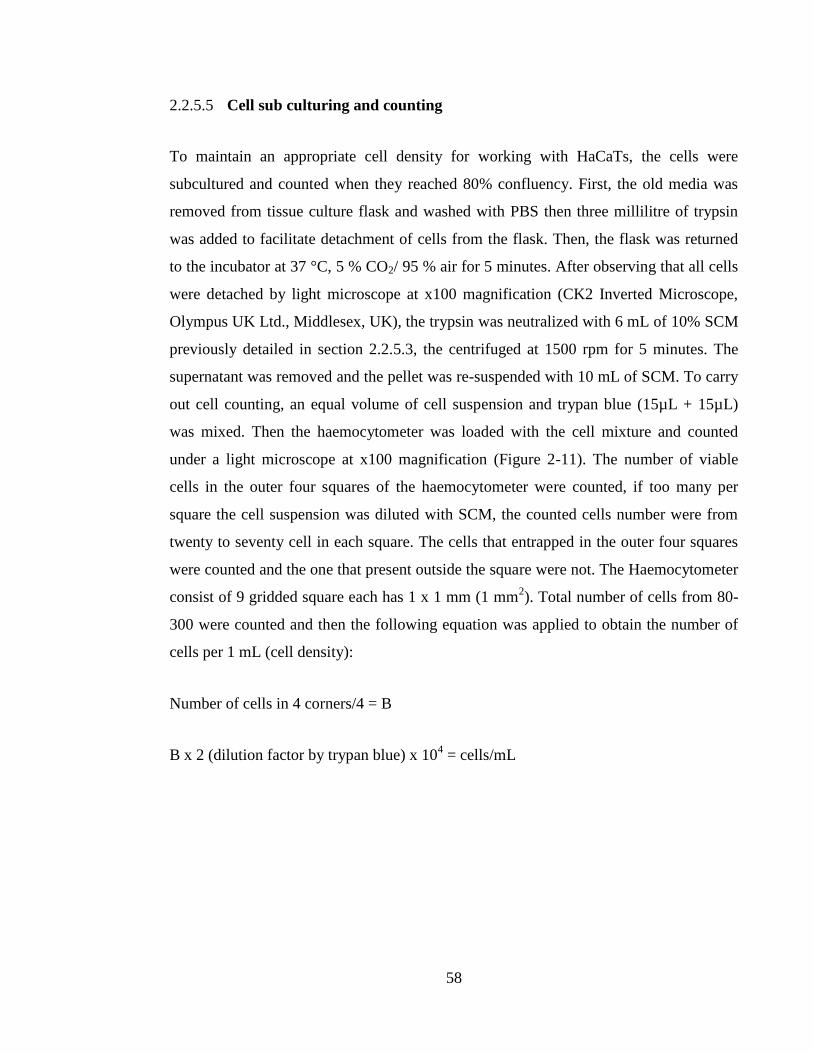
58
2.2.5.5 Cell sub culturing and counting
To maintain an appropriate cell density for working with HaCaTs, the cells were
subcultured and counted when they reached 80% confluency. First, the old media was
removed from tissue culture flask and washed with PBS then three millilitre of trypsin
was added to facilitate detachment of cells from the flask. Then, the flask was returned
to the incubator at 37 °C, 5 % CO2/ 95 % air for 5 minutes. After observing that all cells
were detached by light microscope at x100 magnification (CK2 Inverted Microscope,
Olympus UK Ltd., Middlesex, UK), the trypsin was neutralized with 6 mL of 10% SCM
previously detailed in section 2.2.5.3, the centrifuged at 1500 rpm for 5 minutes. The
supernatant was removed and the pellet was re-suspended with 10 mL of SCM. To carry
out cell counting, an equal volume of cell suspension and trypan blue (15µL + 15µL)
was mixed. Then the haemocytometer was loaded with the cell mixture and counted
under a light microscope at x100 magnification (Figure 2-11). The number of viable
cells in the outer four squares of the haemocytometer were counted, if too many per
square the cell suspension was diluted with SCM, the counted cells number were from
twenty to seventy cell in each square. The cells that entrapped in the outer four squares
were counted and the one that present outside the square were not. The Haemocytometer
consist of 9 gridded square each has 1 x 1 mm (1 mm2). Total number of cells from 80-
300 were counted and then the following equation was applied to obtain the number of
cells per 1 mL (cell density):
Number of cells in 4 corners/4 = B
B x 2 (dilution factor by trypan blue) x 104 = cells/mL
59
Figure 2-11 Schematic figure showing the 9 gridded squares of haemocytometer
Trypan blue will be taken in by all cells, live and dead. The live cells will pump the dye
out and appear with clear cytoplasm, bright in the middle, while dead ones will retain the
dye in and appear in dark blue cytoplasm with irregular shape. Viable cells arecounted to
obtain density. Following cell counting, the cells were subcultured in 10 mL K-SCM at
density of 1.5x10⁵/75 cm
2 tissue culture flask.
2.2.5.6 Cell Freezing and cell thawing
After sub-culturing the cells from the tissue culture flask, the pellets produced were re
suspended in 1mL of freezing mix (90% foetal calf serum and FCS +10% DMSO). The
desired cell density to be stored is from 1 - 2 x10⁶
cells/mL in pre-cooled cryovials. The
cryovial that contained the cell mixture was then placed in afreezing pot (Mr. FROSTY,
Sigma-Aldrich Company) and stored at -80 ˚C for 24 hours. The Mr. FROSTY freezing
container contains isopropanol that is designed to control the rate of cooling of cells by -
1 °C per minute, which is the optimal condition that is desired for preserving cells. After
overnight storing at -80 °C, the cryovials were transferred to liquid nitrogen foir storage
at -196°C.
60
When needed, the cells were retrieved from liquid nitrogen store by rapidly placing the
cryovials in 37 °C water bath. Then, 9 mL of 10% SCM previously detailed in section
2.2.5.3, was added to the cells and then mixed and centrifuged at 1500 rpm for 5
minutes. The supernatant was removed and the pellets were mixed thoroughly with 10
mL of SCM and transferred to 75 cm2 tissue culture flasks to be incubated.
61
Chapter 3: Antibacterial and bactericidal
activity of PRE alone and in combination
with Zn(II)
62
3.1 Introduction
It is of increasing interest to treat a range of conditions using >1 drug in combination. It
is possible that combined use allows drugs to treat a single disease or target more
efficaciously by taking advantage of the most applicable functions of the different drugs.
There are four main motivations for using drugs in combination. First, such
methodology may make the therapeutic effect more impactful. Second, it allows for a
reduced dosage of each drug without compromising efficacy of treatment, this mitigates
against toxicity. Third, drug combinations diminish the likelihood of the evolution of
drug resistance. Finally, it allows for selective synergism, whether against the host
(toxicity antagonism) or the target (efficacy synergism) (Chou, 2006).
To understand drug combination outcomes, it is useful to examine some examples. One
example of potentiation or enhancement is if Drug A (which has a therapeutic effect) is
combined with Drug B (which has little or no therapeutic effect), and produces a greater
impact than if Drug A is used in isolation. This potentiation or enhancement is described
in terms of –fold of potentiation or percent enhancement. Should Drug A and Drug B
both have a treatment effect, their combination may result in an effect described as
additive, synergistic or antagonistic. An additive effect is somewhat less impactful than
synergism, and antagonistic effect is even lesser still (Chou 2006; Williamson 2001).
For antibacterial (inhibiting growth or replication) and bactericidal (killing) synergy
testing, several methods have been established to evaluate the synergy activity for in
vitro experiments. Reviewing the literature, two major methods for the synergy testing
were the checkerboard test and the bacterial suspension test or time kill assy. Many
researchers have utilized the checkerboard test because it can give an accurate prediction
of any synergy in inhibition of bacterial growth. Historically the dilution methods used
to be in macro level in test tubes but in checkerboard test it is done on 96 well plates and
the dilution goes in micro level, which saves any un necessary loss of the tested
antibacterial agent. Mathematical representation of the results is done by calculation the
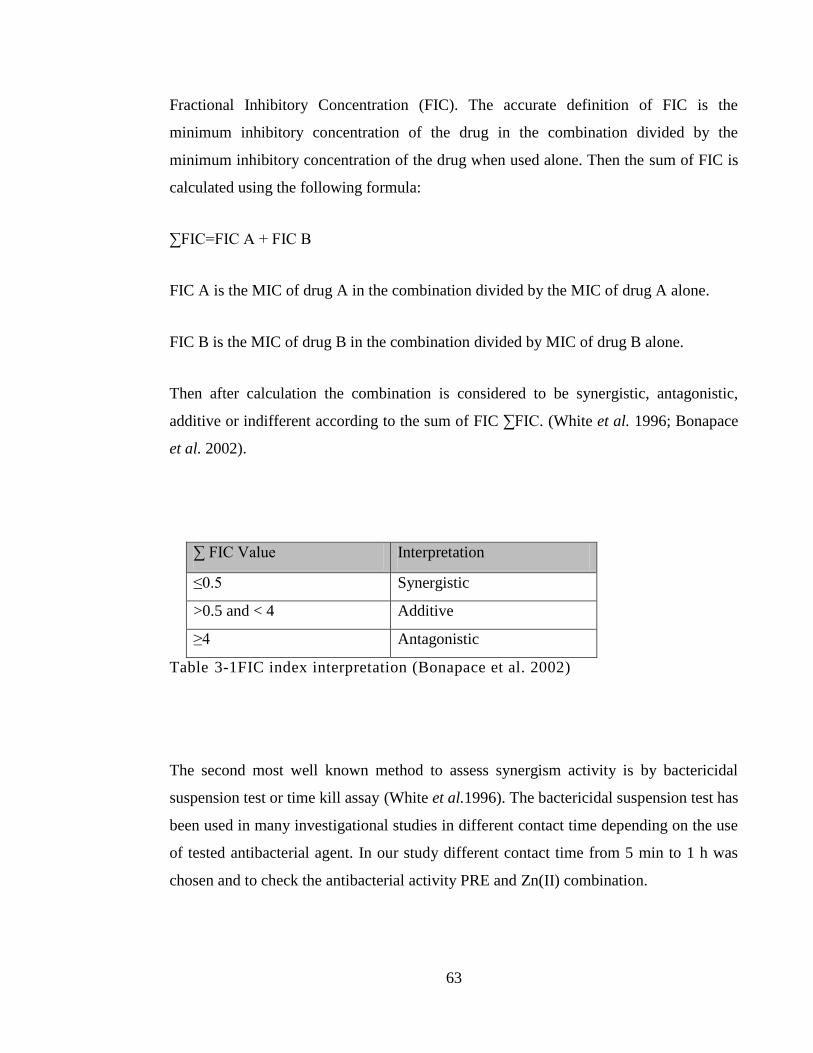
63
Fractional Inhibitory Concentration (FIC). The accurate definition of FIC is the
minimum inhibitory concentration of the drug in the combination divided by the
minimum inhibitory concentration of the drug when used alone. Then the sum of FIC is
calculated using the following formula:
∑FIC=FIC A + FIC B
FIC A is the MIC of drug A in the combination divided by the MIC of drug A alone.
FIC B is the MIC of drug B in the combination divided by MIC of drug B alone.
Then after calculation the combination is considered to be synergistic, antagonistic,
additive or indifferent according to the sum of FIC ∑FIC. (White et al. 1996; Bonapace
et al. 2002).
∑ FIC Value Interpretation
≤0.5 Synergistic
>0.5 and < 4 Additive
≥4 Antagonistic
Table 3-1FIC index interpretation (Bonapace et al. 2002)
The second most well known method to assess synergism activity is by bactericidal
suspension test or time kill assay (White et al.1996). The bactericidal suspension test has
been used in many investigational studies in different contact time depending on the use
of tested antibacterial agent. In our study different contact time from 5 min to 1 h was
chosen and to check the antibacterial activity PRE and Zn(II) combination.
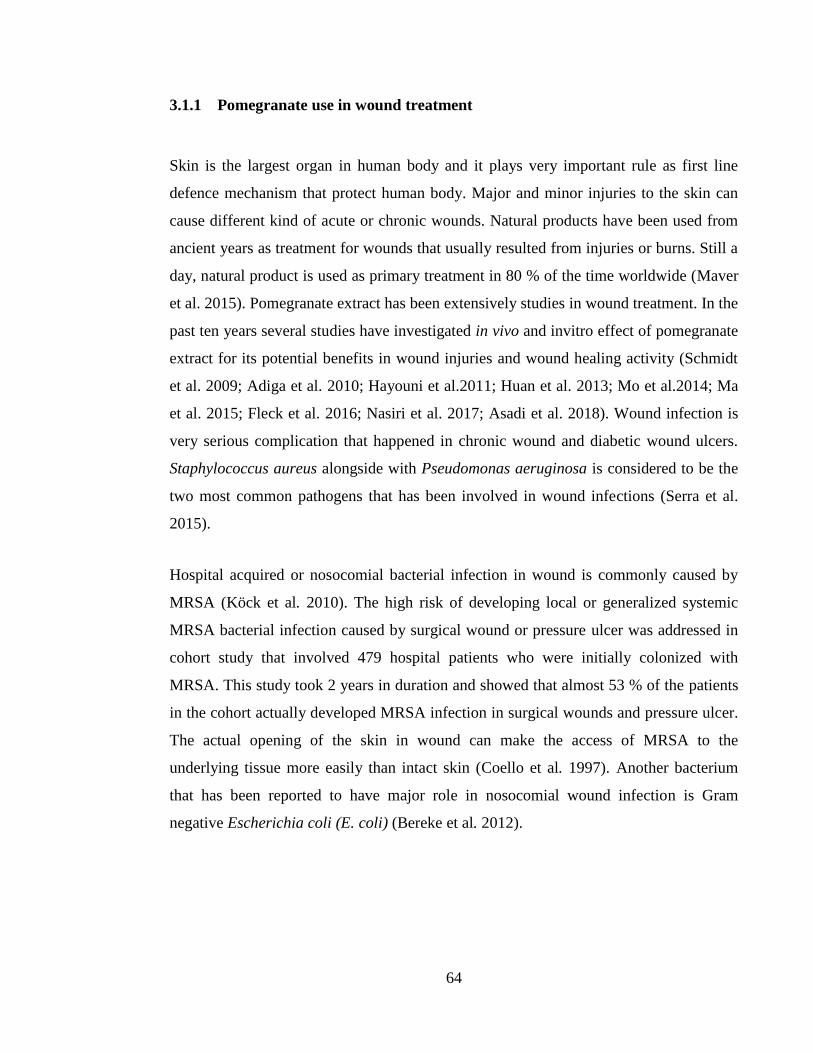
64
3.1.1 Pomegranate use in wound treatment
Skin is the largest organ in human body and it plays very important rule as first line
defence mechanism that protect human body. Major and minor injuries to the skin can
cause different kind of acute or chronic wounds. Natural products have been used from
ancient years as treatment for wounds that usually resulted from injuries or burns. Still a
day, natural product is used as primary treatment in 80 % of the time worldwide (Maver
et al. 2015). Pomegranate extract has been extensively studies in wound treatment. In the
past ten years several studies have investigated in vivo and invitro effect of pomegranate
extract for its potential benefits in wound injuries and wound healing activity (Schmidt
et al. 2009; Adiga et al. 2010; Hayouni et al.2011; Huan et al. 2013; Mo et al.2014; Ma
et al. 2015; Fleck et al. 2016; Nasiri et al. 2017; Asadi et al. 2018). Wound infection is
very serious complication that happened in chronic wound and diabetic wound ulcers.
Staphylococcus aureus alongside with Pseudomonas aeruginosa is considered to be the
two most common pathogens that has been involved in wound infections (Serra et al.
2015).
Hospital acquired or nosocomial bacterial infection in wound is commonly caused by
MRSA (Köck et al. 2010). The high risk of developing local or generalized systemic
MRSA bacterial infection caused by surgical wound or pressure ulcer was addressed in
cohort study that involved 479 hospital patients who were initially colonized with
MRSA. This study took 2 years in duration and showed that almost 53 % of the patients
in the cohort actually developed MRSA infection in surgical wounds and pressure ulcer.
The actual opening of the skin in wound can make the access of MRSA to the
underlying tissue more easily than intact skin (Coello et al. 1997). Another bacterium
that has been reported to have major role in nosocomial wound infection is Gram
negative Escherichia coli (E. coli) (Bereke et al. 2012).
65
3.1.2 Bacteria resistance in biofilm
A very important factor that can decrease the antibacterial activity is location of these
bacteria inside a protective biofilm, which is known to represent a serious complication
of chronic wound infection. Biofilm and its related infections account for ~80% of total
nosocomial infection in particular involving S. aureus chronic biofilm infections
(Reffuveille et al. 2017) and are present in cases of impetigo and furuncle (Akiyama et
al. 1997) and are also believed to be involved in other skin disorders such as acne or
psoriasis (Gannesen et al. 2018). Biofilm is a complicated environment that consists of
the attachment of bacterial cells to either biological or non-biological surfaces. Inside the
biofilm interface the bacteria forms microcolonies implanted in ‘slimy’ liquid
extracellular matrix (ECM) of hydrated extrapolymeric substances (EPS). Water
channels are dispersed inside EPS that act as circulatory system providing nutrition
needed and removal of metabolic waste products. Biofilm provides an excellent
environment for bacterial growth because of the physical protection by EPS that prevent
and inhibit permeation of antibacterial agents and for bacteria microcolonies to
communicate to each other which result in more virulence and propensity to cause
infections (Davis et al. 2008; Siddiqui and Bernstein 2010). A recent review indicated
that bacterial presence inside a multi-structured biofilm is considered 10 to 1000 times
more resistant to traditional treatment by antibacterial agents than free un-attached
floating bacteria or ‘planktonic’ bacteria (Reffuveille et al. 2017).
Considering the previous work on the antimicrobial activity of PRE in relation to
potentiation of virucidal and bactericidal activity by Zn(II), here we tested the
hypothesis that PRE/Zn(II) might also demonstrate bactericidal activity, which could be
exploited as novel broadspectrum antimicrobial therapeutic systems for wound infection.
In this chapter, antibacterial and bactericidal activity is investigated based on a panel of
bacteria that are commonly involved in skin and wound infections.
66
3.2 Objective and aims
To investigate the antibacterial activity of PRE and ZnSO4 against a range of Gram
positive and Gram negative bacteria.
To determine antibacterial and bactericidal activity of PRE with and without
Zn(II) against 5 relevant bacterial strains: methicillin sensitive Staphylococcus
aureus MSSA, methicillin resistant Staphylococcus aureus MRSA,
Staphylococcus epidermidis, Pseudomonas aeruginosa and Escherichia coli .
To investigate the synergistic effects between different combination.
Measure the fractional inhibitory concentration index of several combinations
against tested bacteria.
To determine the activity of PRE and Zn(II) containing combination against S.
aureus embedded in a single-specie biofilm.
3.3 Materials and methods
3.3.1 Materials
All materials used in this chapter previously detailed in Chapter 2, Section 2.1.
67
3.3.2 Solution preparation
Preparation of PRE and ZnSO4 was carried out according to the previously detailed
solution preparation detailed in Chapter 2, Section 2.2.1 all prepared samples used
phthalate buffer pH4.5.
3.3.3 Aseptic technique
Aseptic technique was employed at all stages in microbiology studies using
microbiology safety cabinets and aseptic technique previously described in Chapter 2,
Section 2.2.4.1.
3.3.4 Microbiology culture preparation
Five bacterial were used for investigation used in this study, methicillin resistant S.
aureus MRSA (NCTC 12493), E. coli (NCTC 12923), P. aeruginosa (NCTC 6750), S.
epidermidis ATCC 14990 (NCTC 11047) methicillin sensitive S. aureus (NCTC 10788),
all bacteria strains were provided by CSPPS, Cardiff University. Standards and storing
conditions were previously detailed in Chapter 2, Section 2.2.5.
3.3.5 Determination of minimum inhibitory concentration (MIC)
Broth dilution method was use in accordance to the method detailed in Chapter 2,
Section 2.2.4.8 for broth dilution method to obtain PRE and ZnSO4 MIC values against
the tested microorganism. Individual drug MICs were obtained in accordance to the
guidelines of CLSI twenty-fourth informational supplement: ‘Performance standards for
antimicrobial susceptibility testing (2014)’. At higher concentrations PRE showed
problems of turbidity at first we tried to solve it by dissolving PRE at 2.5% DMSO, but
still the turbidity remained. Another approach to eliminate turbidity was to decrease the
amount of broth that has been used in each well. Finally, 50 μL of double strength MHB
68
was used and water was used the final volume was 100 μL of tested substance and 50μL
of tested bacteria.
3.3.6 Checkerboard test
To determine antibacterial synergy, a checkerboard assay was performed using different
concentrations of two antibacterials in a 96 well plate. One drug (drug A) is diluted
against the abscissa and the other (drug B) is diluted along the ordinates. The starting
concentration for each one should be at least double the MIC value as recommended by
CLSI guidelines. MIC values were tested for PRE and ZnSO4 in separate against five
bacterial strains. In the checkerboard test each concentration of PRE and ZnSO4 was
made initial 4 times the concentration to be tested. For example, if PRE concentration to
be tested is 1000 μg/mL then the initial concentration will be 4000 μg/mL. Using 2mL
Eppendorf vials, PRE was serilly diluted to 9 times to give the concentration range of
(15.625-4000 μg/mL). At first 50 μL was added from each eppindorf to its
representative concentration starting from column no. 10 for the highest concentration of
PRE and serially diluted along the abscissa to column no. 2 with lowest PRE
concentration. Columns 1, 11 and 12 were kept as PRE-free wells. The same for the
ZnSO4 if the wanted concentration was 6400 μM so, 25600 μM was made in 2 mL
Eppendorf and serial dilution was made up to 8 times from each Eppendorf, 50 μL was
added to its representative concentration of ZnSO4 serial dilution along the ordinate in
the 96 well plate, starting from A1-A10 for the higher concentration going down to G1-
G10 for the lower concentration and leaving H1-H10 and column 11,12 zinc-free wells.
Column11 represented positive control drug-free wells and column 12 was negative
control for sterility test. A 50 μL aliquot of bacterial suspension was added to all wells
except column no.12. MHB at 50 μL was added to the following wells H2-10, column 1
and column 12. Finally, 50 μL of double strength MHB was added to all wells. Separate
duplicate a 96 well plate with same serial dilution except its bacteria free media which
represent negative control to be used in calculation as negative control. The turbidity
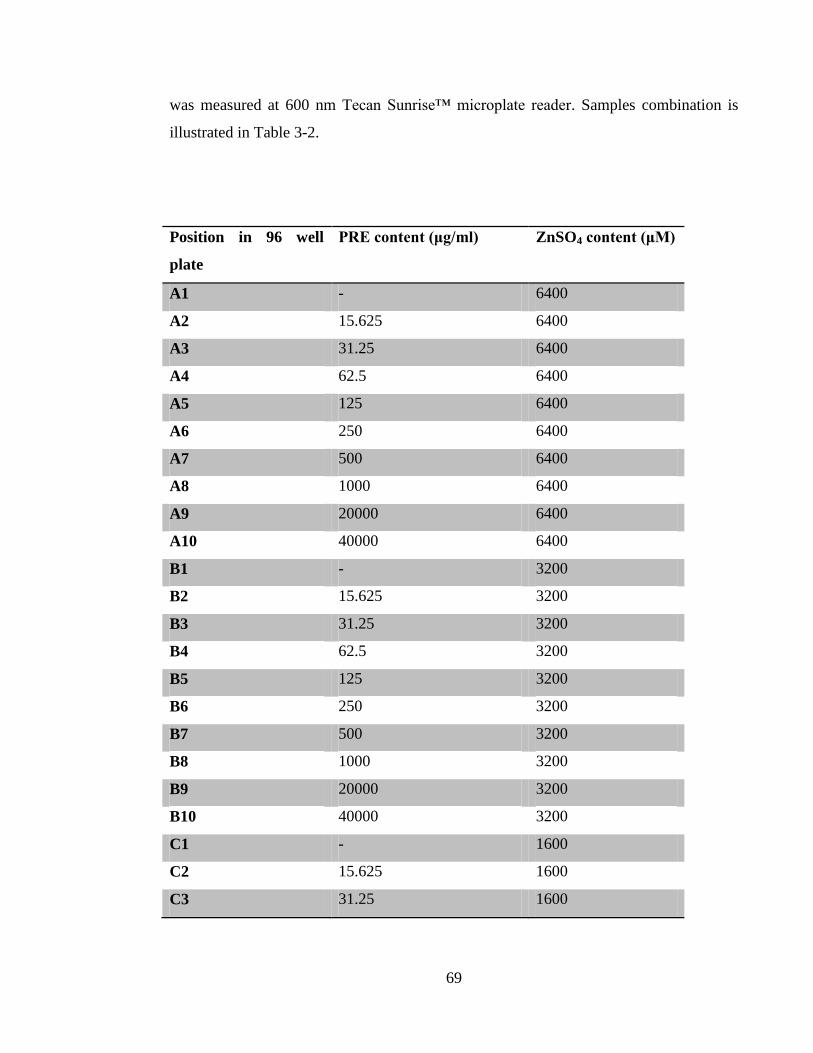
69
was measured at 600 nm Tecan Sunrise™ microplate reader. Samples combination is
illustrated in Table 3-2.
Position in 96 well
plate
PRE content (μg/ml) ZnSO4 content (μM)
A1 - 6400
A2 15.625 6400
A3 31.25 6400
A4 62.5 6400
A5 125 6400
A6 250 6400
A7 500 6400
A8 1000 6400
A9 20000 6400
A10 40000 6400
B1 - 3200
B2 15.625 3200
B3 31.25 3200
B4 62.5 3200
B5 125 3200
B6 250 3200
B7 500 3200
B8 1000 3200
B9 20000 3200
B10 40000 3200
C1 - 1600
C2 15.625 1600
C3 31.25 1600
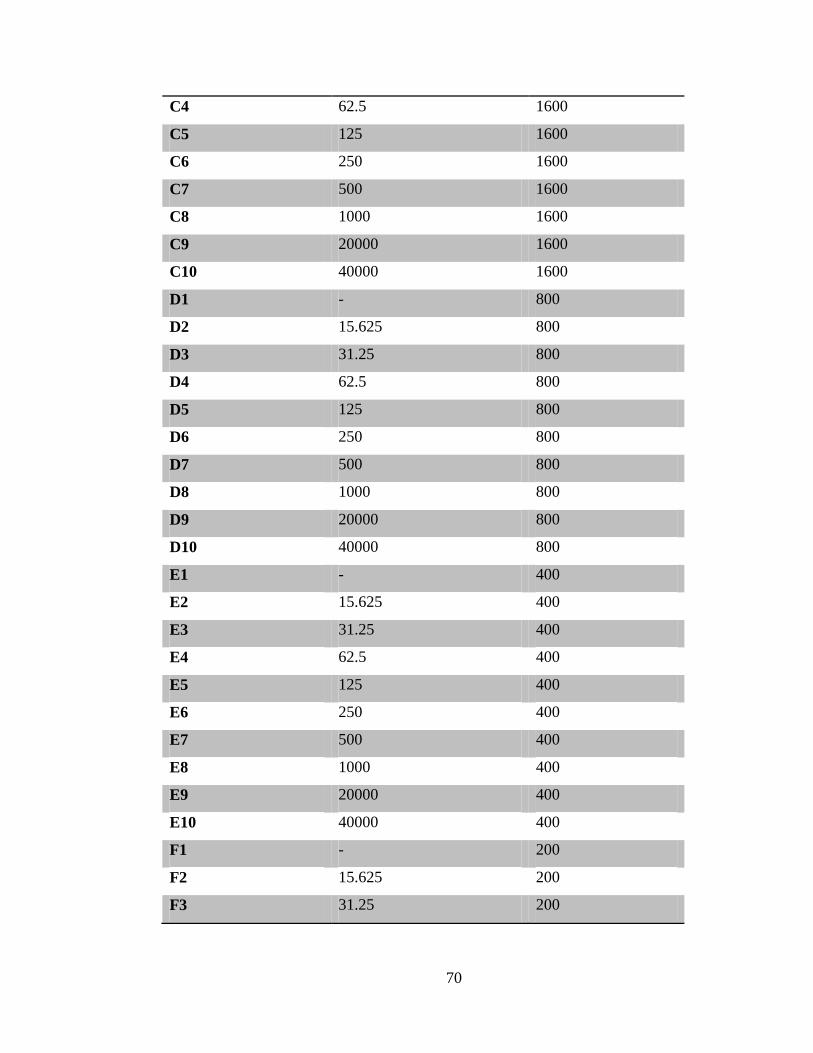
70
C4 62.5 1600
C5 125 1600
C6 250 1600
C7 500 1600
C8 1000 1600
C9 20000 1600
C10 40000 1600
D1 - 800
D2 15.625 800
D3 31.25 800
D4 62.5 800
D5 125 800
D6 250 800
D7 500 800
D8 1000 800
D9 20000 800
D10 40000 800
E1 - 400
E2 15.625 400
E3 31.25 400
E4 62.5 400
E5 125 400
E6 250 400
E7 500 400
E8 1000 400
E9 20000 400
E10 40000 400
F1 - 200
F2 15.625 200
F3 31.25 200
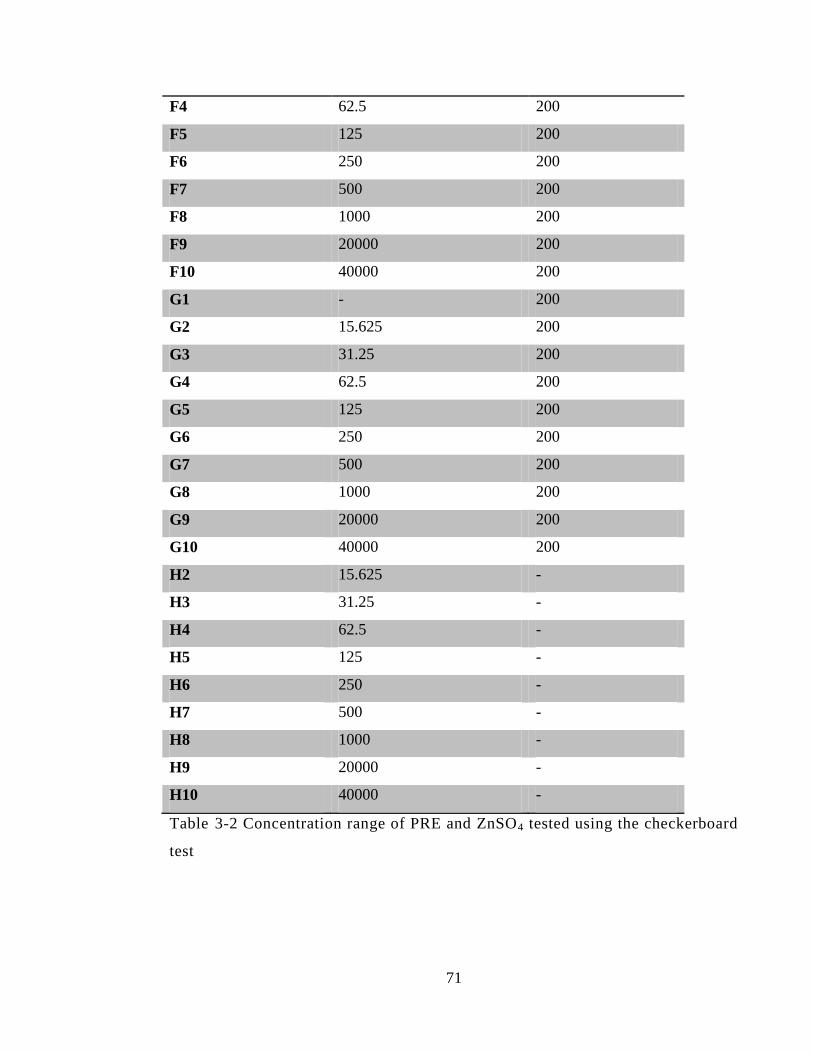
71
F4 62.5 200
F5 125 200
F6 250 200
F7 500 200
F8 1000 200
F9 20000 200
F10 40000 200
G1 - 200
G2 15.625 200
G3 31.25 200
G4 62.5 200
G5 125 200
G6 250 200
G7 500 200
G8 1000 200
G9 20000 200
G10 40000 200
H2 15.625 -
H3 31.25 -
H4 62.5 -
H5 125 -
H6 250 -
H7 500 -
H8 1000 -
H9 20000 -
H10 40000 -
Table 3-2 Concentration range of PRE and ZnSO4 tested using the checkerboard
test
72
3.3.7 Fractional inhibitory concentration index
The fractional inhibitory concentration index (FICI) of PRE and ZnSO4 from
checkerboard test were calculated according to the following formula:
∑FIC=FIC A + FIC B
FIC A is the MIC of drug A (PRE) in the combination/MIC of drug A (PRE) alone.
FIC B is the MIC of drug B (ZnSO4) in the combination/MIC of drug B (ZnSO4) alone.
Then after calculation the combination is considered to be synergistic, antagonistic,
additive according to the sum of FIC according to Table 3-1.
3.3.8 Time kill (log reduction) assay
Bactericidal activity of PRE and ZnSO4 alone and in combination was tested using time
kill assay.The tested substance in volume of 990 μL was added to a 10 µL aliquot of 0.5
McFarland standard of tested bacteria in a 2 mL Eppendorf vial and allowed to incubate
for different time points: 5, 10, 20, 60 minutes (for S. aureus MSSA an extended period
of up to 6 hours). After each timepoint, 100 µL was transferred to 900 µL of neutralizing
agent (UQA) and allowed to set for 60 min. Next, serial dilution of the neutralized
mixture was made up to 8 times. The Miles and Misra technique was used for the
enumeration viable cell colonies; briefly, 3 drops in 10 µL volume of each dilution was
transferred on dried Muller Hinton Agar and incubated under aerobic condition at 37 ˚C
for 24 h. then, counted colony and calculate the value results were expressed as colony
forming unit (CFU) per 1 mL (CFU/mL) (Miles et al. 1938).
73
3.3.9 Calculation of log reduction value
After incubation for 24 hours at 37 ˚C under aerobic condition, the number of surviving
colonies were counted then the following formula was used to calculate the colony
forming unites per one millilitre (CFU/mL):
The Log10 reduction in colony forming units per 1 mL was calculated against control
(phthalate buffer pH) using the following formula:
(A) - (B)
Where A is CFU/mL of the control (phthalate buffer) and B is CFU/mL of test sample.
3.3.10 Effects of PRE and Zn(II), alone and in combination, against pre-formed
biofilm-embedded S. aureus
A major proposed application for the combination of PRE and Zn(II) is for use on
chronic wounds, samples of PRE that contained (1 and 2.5 mg/mL) ± ZnSO4 at 0.25 M
was eval;uated on preformed biofilm-embedded S. aureus. The work in this section was
performed in the laboratory of Dr. Wing Man Lau (School of Pharmacy, Faculty of
Medical Sciences, Newcastle University, UK.). S. aureus (NU118) was obtained and
isolated in Newcastle University, UK. The effects of the PRE on pre-formed biofilms
were evaluated in 96 well plates - briefly, S. aureus was cultured in tryptic soy broth
(TSB, Formedium, England) supplemented with 2% glucose at 1x 10⁸ CFU/mL with
optical density at 600 nm (OD 600nm) of 0.1, 200 μL per well. The culture was
74
incubated at 37 °C for 48 h to allow biofilm formation. After 48 h, the planktonic phase
was removed, and the biofilm was washed once with 200 μL PBS. TSB (90 μL) was
added in each of the well with 10 μL of the formulation added on top. S. aureus cultured
in TSB alone was served as positive control, TSB alone without bacterial was served as
negative control to ensure the experiment was not contaminated and the extraction
formulation without PRE as background control to minimise the effects of the solvent
used. The plates were then incubated for 20 h at 37 °C. After 20h, the supernatants were
removed and the plate was washed once with 100 μL PBS. 100 mL of 0.1 % crystal
violet (CV) solution was added to all wells and incubated for 15 min at room temp. After
15 min, the excess CV was removed by washing three times with 100 μL PBS. 100 µL
of 7% acetic acid was added to dissolve the CV stain. The solution was then transferred
to a new 96-microtiter plate for absorbance detection at 570 nm (BioTek Synergy HT)
after dilution of 1:20 (Stepanović, et al, 2000).
3.3.11 Statistical analysis
The results were determined using Microsoft Excel® proGram of each sample number
of log reduction in CFU/mL in different contact time. In each test, data are expressed as
means ± SD, otherwise stated. Statistical analysis of log reduction value was carried out
using One way analysis of variance (ANOVA) with Tukey‘s post test to compare
statistical significances between groups. PRE and ZnSO4 combinations were compared
to control and individual PRE and ZnSO4 at the same concentration used in that
combination. Results were expressed as significant and very significant with p < 0.05
and p < 0.01 respectively. The analysis was carried out using InStat for Macintosh,
version 3.0 (GraphPad Software Inc, San Diego, CA).
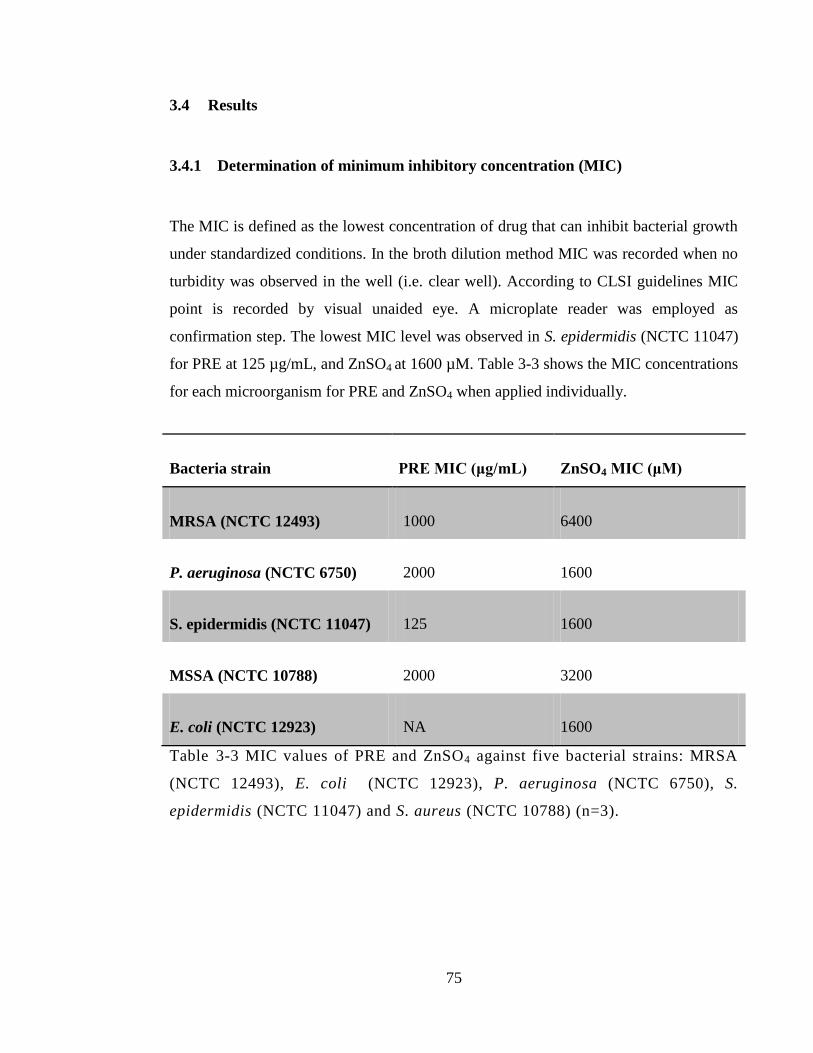
75
3.4 Results
3.4.1 Determination of minimum inhibitory concentration (MIC)
The MIC is defined as the lowest concentration of drug that can inhibit bacterial growth
under standardized conditions. In the broth dilution method MIC was recorded when no
turbidity was observed in the well (i.e. clear well). According to CLSI guidelines MIC
point is recorded by visual unaided eye. A microplate reader was employed as
confirmation step. The lowest MIC level was observed in S. epidermidis (NCTC 11047)
for PRE at 125 µg/mL, and ZnSO4 at 1600 µM. Table 3-3 shows the MIC concentrations
for each microorganism for PRE and ZnSO4 when applied individually.
Bacteria strain PRE MIC (μg/mL) ZnSO4 MIC (μM)
MRSA (NCTC 12493) 1000 6400
P. aeruginosa (NCTC 6750) 2000 1600
S. epidermidis (NCTC 11047) 125 1600
MSSA (NCTC 10788) 2000 3200
E. coli (NCTC 12923) NA 1600
Table 3-3 MIC values of PRE and ZnSO4 against five bacterial strains: MRSA
(NCTC 12493), E. coli (NCTC 12923), P. aeruginosa (NCTC 6750), S.
epidermidis (NCTC 11047) and S. aureus (NCTC 10788) (n=3).
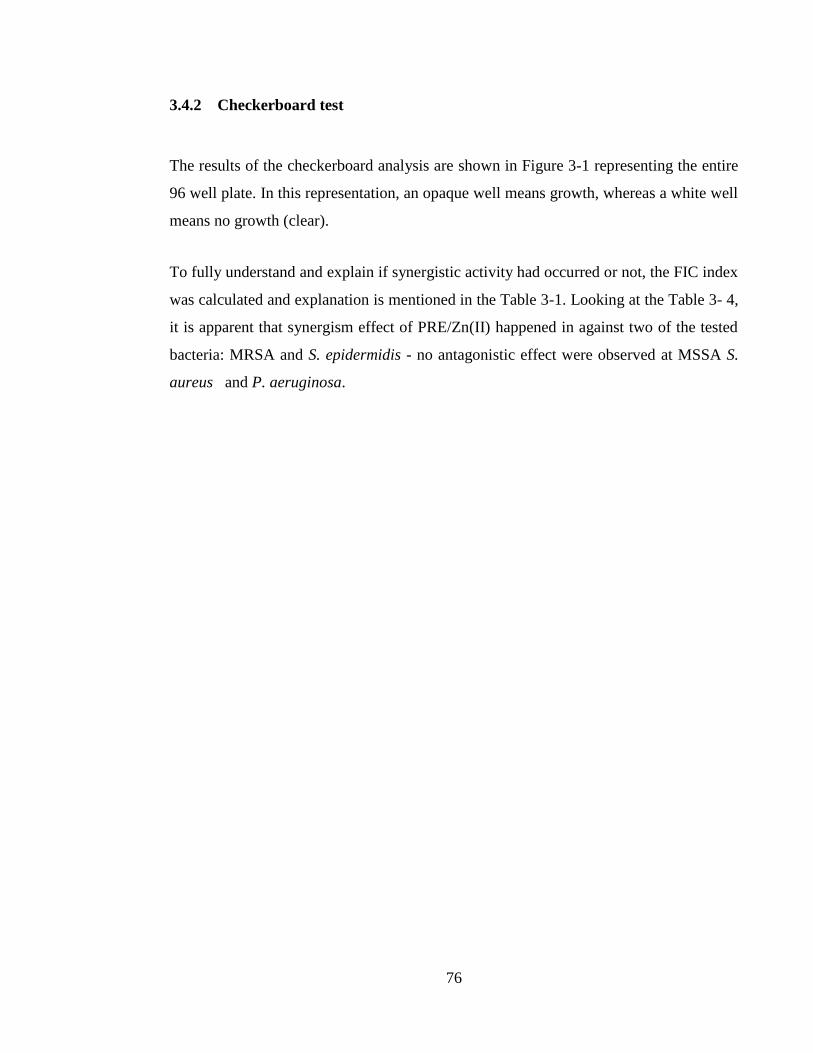
76
3.4.2 Checkerboard test
The results of the checkerboard analysis are shown in Figure 3-1 representing the entire
96 well plate. In this representation, an opaque well means growth, whereas a white well
means no growth (clear).
To fully understand and explain if synergistic activity had occurred or not, the FIC index
was calculated and explanation is mentioned in the Table 3-1. Looking at the Table 3- 4,
it is apparent that synergism effect of PRE/Zn(II) happened in against two of the tested
bacteria: MRSA and S. epidermidis - no antagonistic effect were observed at MSSA S.
aureus and P. aeruginosa.
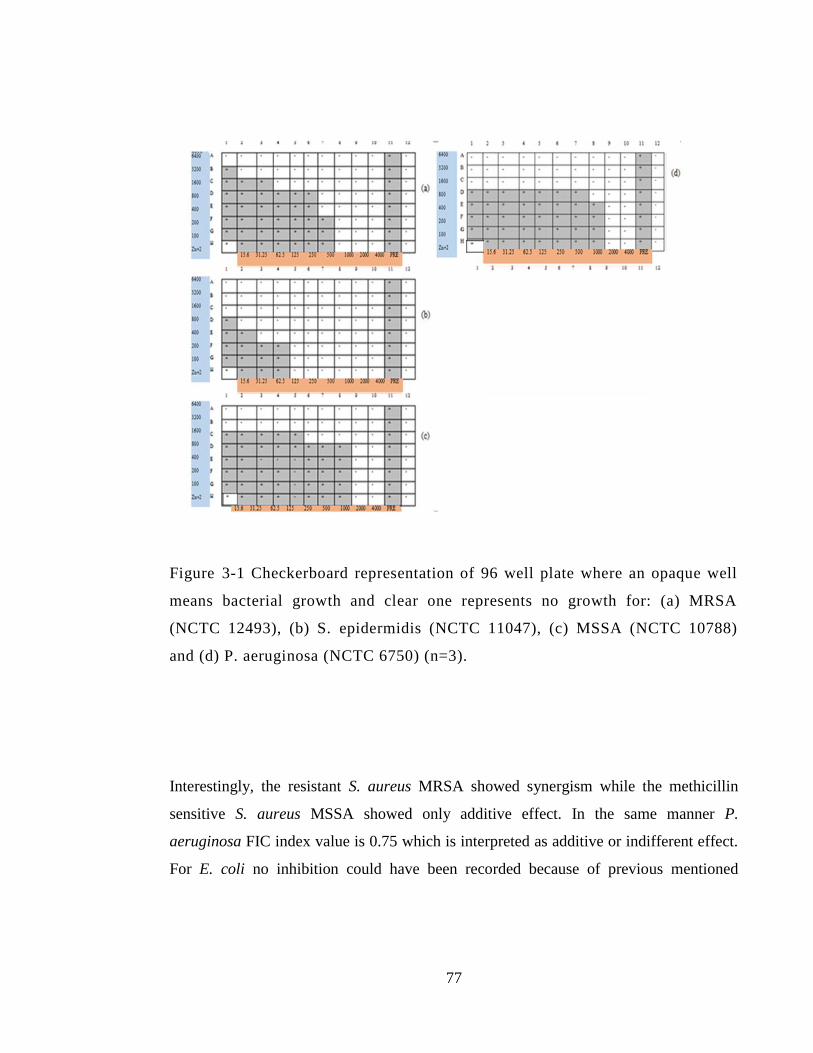
77
Figure 3-1 Checkerboard representation of 96 well plate where an opaque well
means bacterial growth and clear one represents no growth for: (a) MRSA
(NCTC 12493), (b) S. epidermidis (NCTC 11047), (c) MSSA (NCTC 10788)
and (d) P. aeruginosa (NCTC 6750) (n=3).
Interestingly, the resistant S. aureus MRSA showed synergism while the methicillin
sensitive S. aureus MSSA showed only additive effect. In the same manner P.
aeruginosa FIC index value is 0.75 which is interpreted as additive or indifferent effect.
For E. coli no inhibition could have been recorded because of previous mentioned
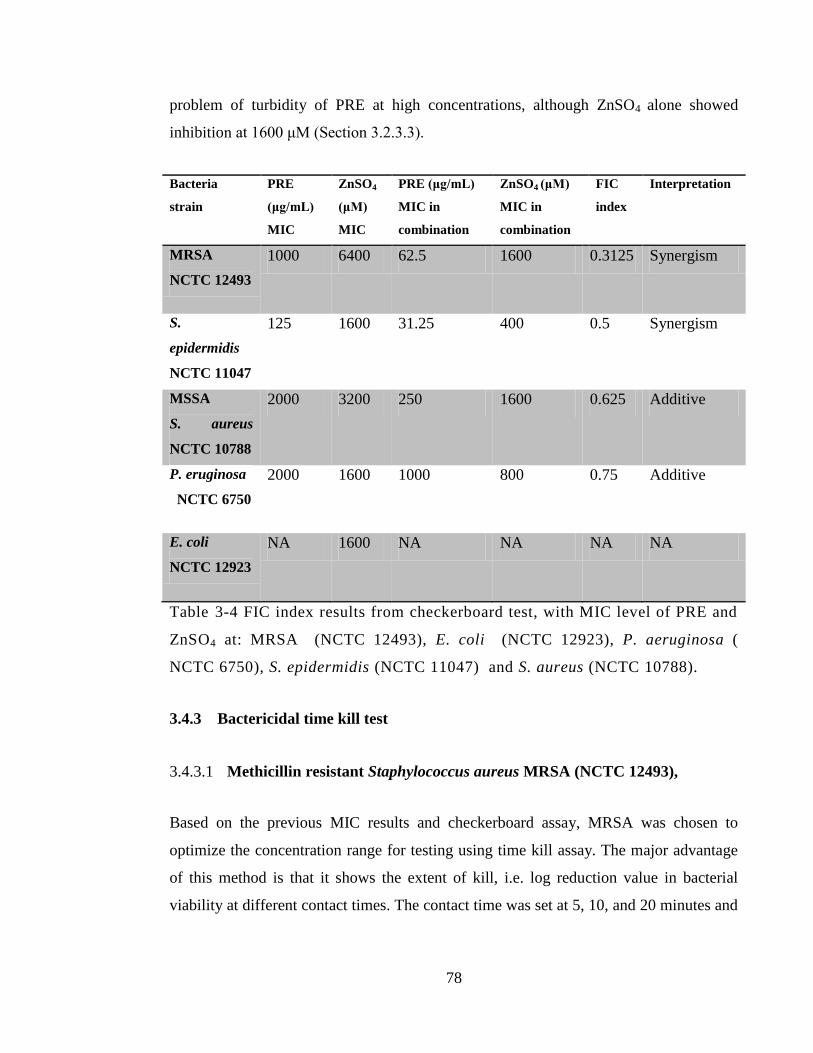
78
problem of turbidity of PRE at high concentrations, although ZnSO4 alone showed
inhibition at 1600 μM (Section 3.2.3.3).
Bacteria
strain
PRE
(μg/mL)
MIC
ZnSO4
(μM)
MIC
PRE (μg/mL)
MIC in
combination
ZnSO4 (μM)
MIC in
combination
FIC
index
Interpretation
MRSA
NCTC 12493
1000 6400 62.5 1600 0.3125 Synergism
S.
epidermidis
NCTC 11047
125 1600 31.25 400 0.5 Synergism
MSSA
S. aureus
NCTC 10788
2000 3200 250 1600 0.625 Additive
P. eruginosa
NCTC 6750
2000 1600 1000 800 0.75 Additive
E. coli
NCTC 12923
NA 1600 NA NA NA NA
Table 3-4 FIC index results from checkerboard test, with MIC level of PRE and
ZnSO4 at: MRSA (NCTC 12493), E. coli (NCTC 12923), P. aeruginosa (
NCTC 6750), S. epidermidis (NCTC 11047) and S. aureus (NCTC 10788).
3.4.3 Bactericidal time kill test
3.4.3.1 Methicillin resistant Staphylococcus aureus MRSA (NCTC 12493),
Based on the previous MIC results and checkerboard assay, MRSA was chosen to
optimize the concentration range for testing using time kill assay. The major advantage
of this method is that it shows the extent of kill, i.e. log reduction value in bacterial
viability at different contact times. The contact time was set at 5, 10, and 20 minutes and
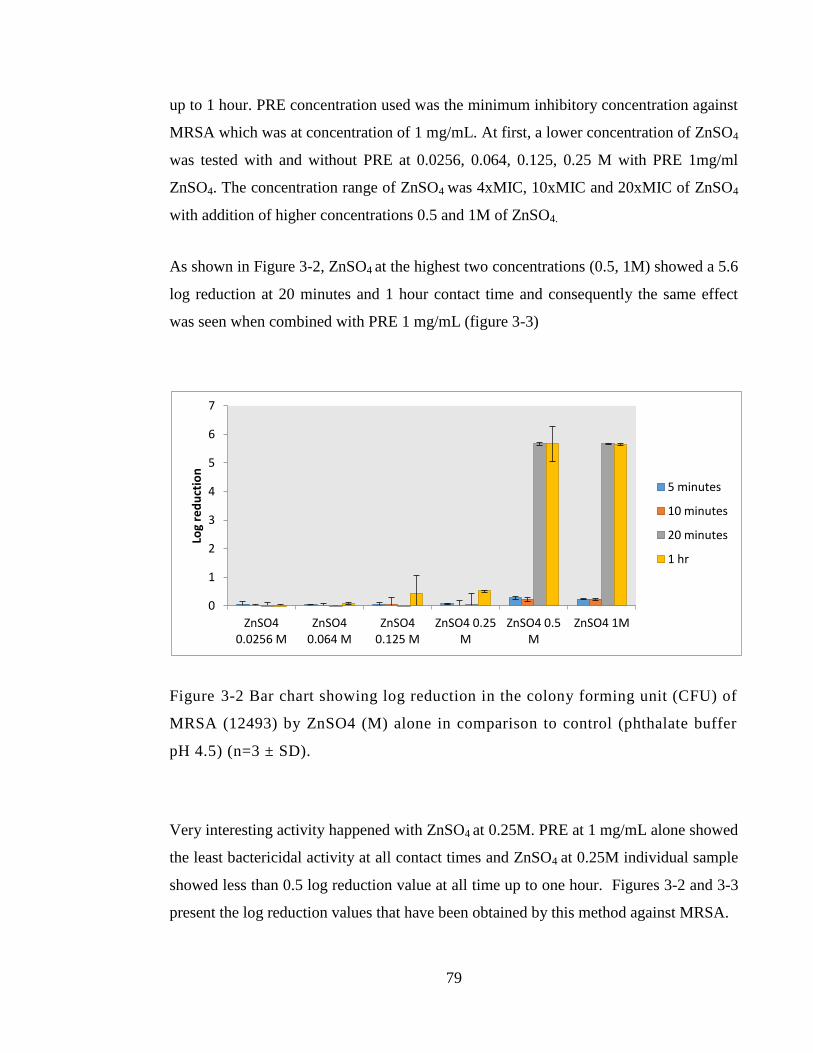
79
up to 1 hour. PRE concentration used was the minimum inhibitory concentration against
MRSA which was at concentration of 1 mg/mL. At first, a lower concentration of ZnSO4
was tested with and without PRE at 0.0256, 0.064, 0.125, 0.25 M with PRE 1mg/ml
ZnSO4. The concentration range of ZnSO4 was 4xMIC, 10xMIC and 20xMIC of ZnSO4
with addition of higher concentrations 0.5 and 1M of ZnSO4.
As shown in Figure 3-2, ZnSO4 at the highest two concentrations (0.5, 1M) showed a 5.6
log reduction at 20 minutes and 1 hour contact time and consequently the same effect
was seen when combined with PRE 1 mg/mL (figure 3-3)
Figure 3-2 Bar chart showing log reduction in the colony forming unit (CFU) of
MRSA (12493) by ZnSO4 (M) alone in comparison to control (phthalate buffer
pH 4.5) (n=3 ± SD).
Very interesting activity happened with ZnSO4 at 0.25M. PRE at 1 mg/mL alone showed
the least bactericidal activity at all contact times and ZnSO4 at 0.25M individual sample
showed less than 0.5 log reduction value at all time up to one hour. Figures 3-2 and 3-3
present the log reduction values that have been obtained by this method against MRSA.
0
1
2
3
4
5
6
7
ZnSO4 0.0256 M
ZnSO4 0.064 M
ZnSO4 0.125 M
ZnSO4 0.25 M
ZnSO4 0.5 M
ZnSO4 1M
Log
red
uct
ion
5 minutes
10 minutes
20 minutes
1 hr
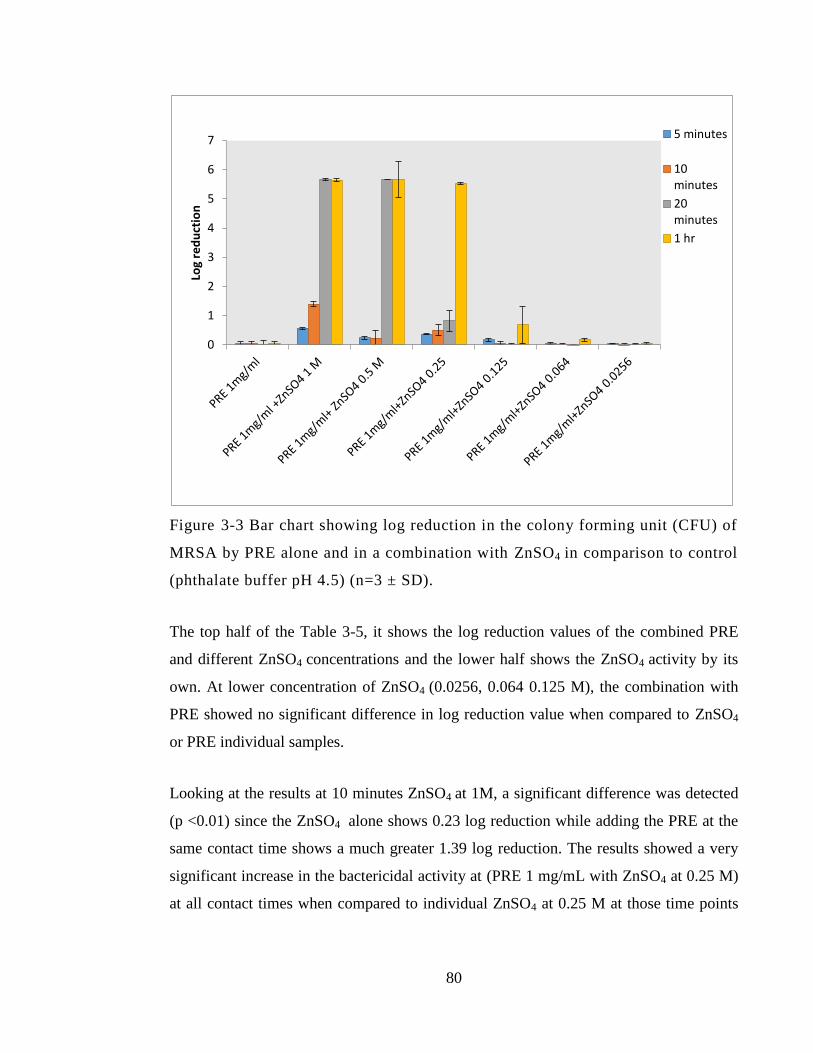
80
Figure 3-3 Bar chart showing log reduction in the colony forming unit (CFU) of
MRSA by PRE alone and in a combination with ZnSO4 in comparison to control
(phthalate buffer pH 4.5) (n=3 ± SD).
The top half of the Table 3-5, it shows the log reduction values of the combined PRE
and different ZnSO4 concentrations and the lower half shows the ZnSO4 activity by its
own. At lower concentration of ZnSO4 (0.0256, 0.064 0.125 M), the combination with
PRE showed no significant difference in log reduction value when compared to ZnSO4
or PRE individual samples.
Looking at the results at 10 minutes ZnSO4 at 1M, a significant difference was detected
(p <0.01) since the ZnSO4 alone shows 0.23 log reduction while adding the PRE at the
same contact time shows a much greater 1.39 log reduction. The results showed a very
significant increase in the bactericidal activity at (PRE 1 mg/mL with ZnSO4 at 0.25 M)
at all contact times when compared to individual ZnSO4 at 0.25 M at those time points
0
1
2
3
4
5
6
7
Log
red
uct
ion
5 minutes
10 minutes
20 minutes
1 hr
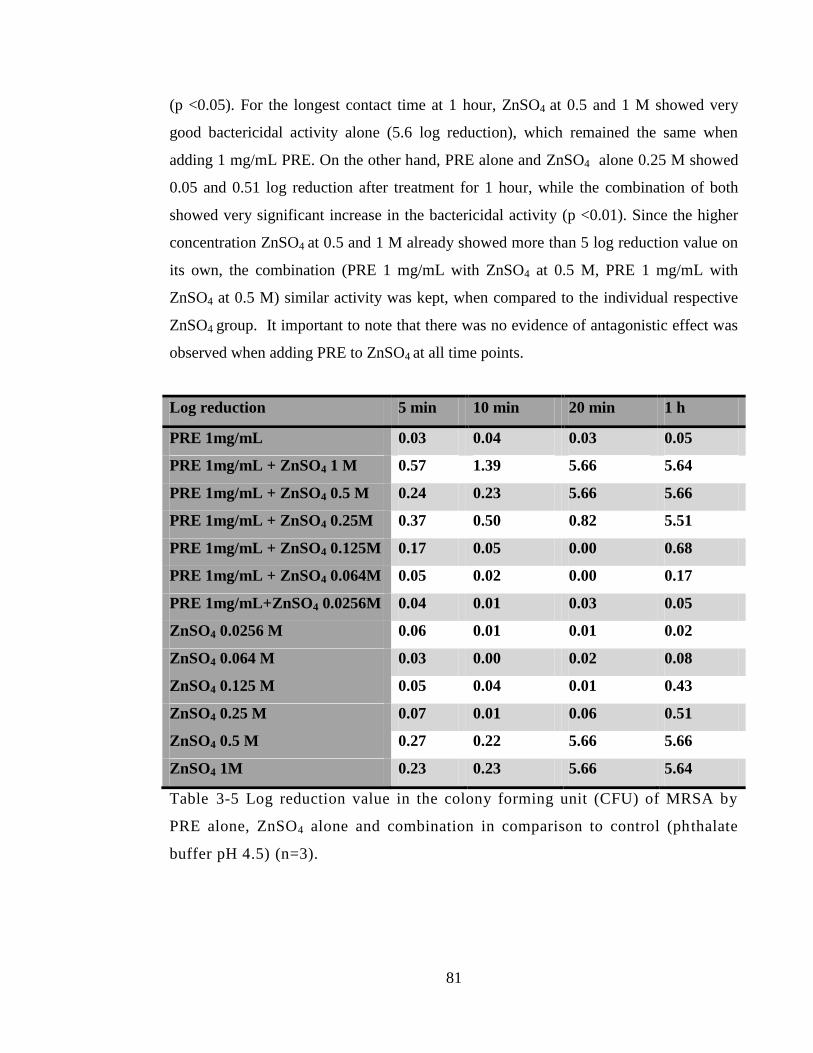
81
(p <0.05). For the longest contact time at 1 hour, ZnSO4 at 0.5 and 1 M showed very
good bactericidal activity alone (5.6 log reduction), which remained the same when
adding 1 mg/mL PRE. On the other hand, PRE alone and ZnSO4 alone 0.25 M showed
0.05 and 0.51 log reduction after treatment for 1 hour, while the combination of both
showed very significant increase in the bactericidal activity (p <0.01). Since the higher
concentration ZnSO4 at 0.5 and 1 M already showed more than 5 log reduction value on
its own, the combination (PRE 1 mg/mL with ZnSO4 at 0.5 M, PRE 1 mg/mL with
ZnSO4 at 0.5 M) similar activity was kept, when compared to the individual respective
ZnSO4 group. It important to note that there was no evidence of antagonistic effect was
observed when adding PRE to ZnSO4 at all time points.
Log reduction 5 min 10 min 20 min 1 h
PRE 1mg/mL 0.03 0.04 0.03 0.05
PRE 1mg/mL + ZnSO4 1 M 0.57 1.39 5.66 5.64
PRE 1mg/mL + ZnSO4 0.5 M 0.24 0.23 5.66 5.66
PRE 1mg/mL + ZnSO4 0.25M 0.37 0.50 0.82 5.51
PRE 1mg/mL + ZnSO4 0.125M 0.17 0.05 0.00 0.68
PRE 1mg/mL + ZnSO4 0.064M 0.05 0.02 0.00 0.17
PRE 1mg/mL+ZnSO4 0.0256M 0.04 0.01 0.03 0.05
ZnSO4 0.0256 M 0.06 0.01 0.01 0.02
ZnSO4 0.064 M 0.03 0.00 0.02 0.08
ZnSO4 0.125 M 0.05 0.04 0.01 0.43
ZnSO4 0.25 M 0.07 0.01 0.06 0.51
ZnSO4 0.5 M 0.27 0.22 5.66 5.66
ZnSO4 1M 0.23 0.23 5.66 5.64
Table 3-5 Log reduction value in the colony forming unit (CFU) of MRSA by
PRE alone, ZnSO4 alone and combination in comparison to control (phthalate
buffer pH 4.5) (n=3).
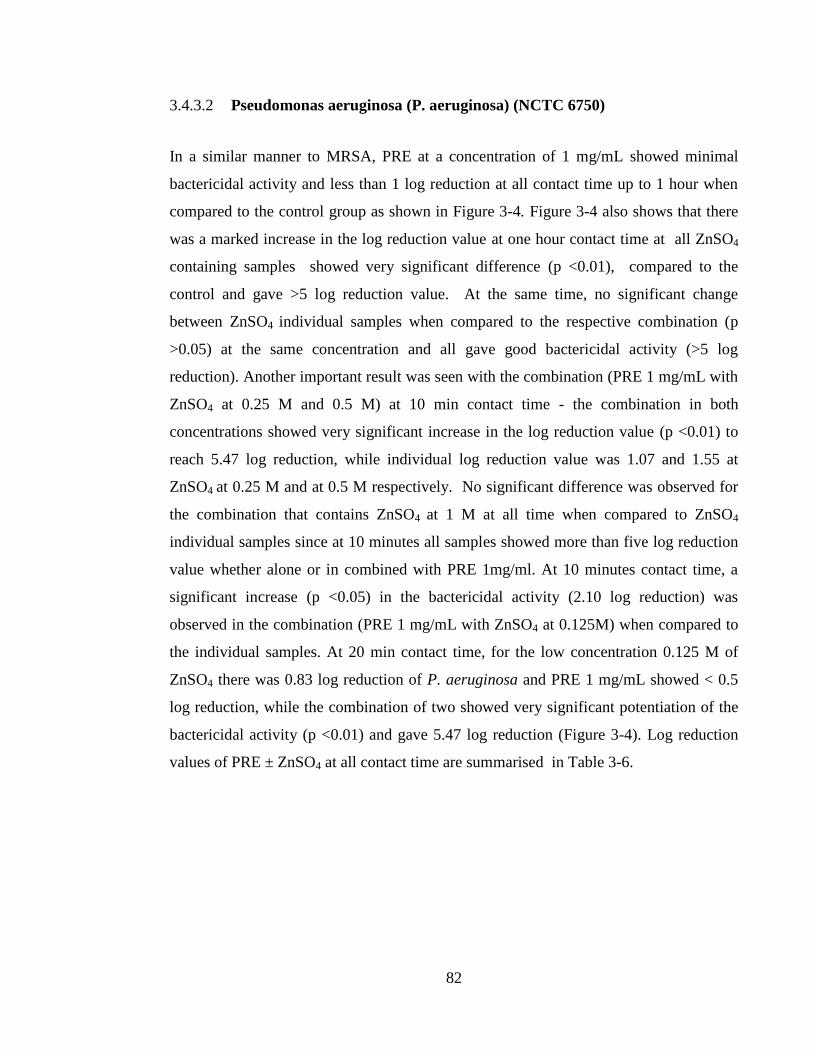
82
3.4.3.2 Pseudomonas aeruginosa (P. aeruginosa) (NCTC 6750)
In a similar manner to MRSA, PRE at a concentration of 1 mg/mL showed minimal
bactericidal activity and less than 1 log reduction at all contact time up to 1 hour when
compared to the control group as shown in Figure 3-4. Figure 3-4 also shows that there
was a marked increase in the log reduction value at one hour contact time at all ZnSO4
containing samples showed very significant difference (p <0.01), compared to the
control and gave >5 log reduction value. At the same time, no significant change
between ZnSO4 individual samples when compared to the respective combination (p
>0.05) at the same concentration and all gave good bactericidal activity (>5 log
reduction). Another important result was seen with the combination (PRE 1 mg/mL with
ZnSO4 at 0.25 M and 0.5 M) at 10 min contact time - the combination in both
concentrations showed very significant increase in the log reduction value (p <0.01) to
reach 5.47 log reduction, while individual log reduction value was 1.07 and 1.55 at
ZnSO4 at 0.25 M and at 0.5 M respectively. No significant difference was observed for
the combination that contains ZnSO4 at 1 M at all time when compared to ZnSO4
individual samples since at 10 minutes all samples showed more than five log reduction
value whether alone or in combined with PRE 1mg/ml. At 10 minutes contact time, a
significant increase (p <0.05) in the bactericidal activity (2.10 log reduction) was
observed in the combination (PRE 1 mg/mL with ZnSO4 at 0.125M) when compared to
the individual samples. At 20 min contact time, for the low concentration 0.125 M of
ZnSO4 there was 0.83 log reduction of P. aeruginosa and PRE 1 mg/mL showed < 0.5
log reduction, while the combination of two showed very significant potentiation of the
bactericidal activity (p <0.01) and gave 5.47 log reduction (Figure 3-4). Log reduction
values of PRE ± ZnSO4 at all contact time are summarised in Table 3-6.
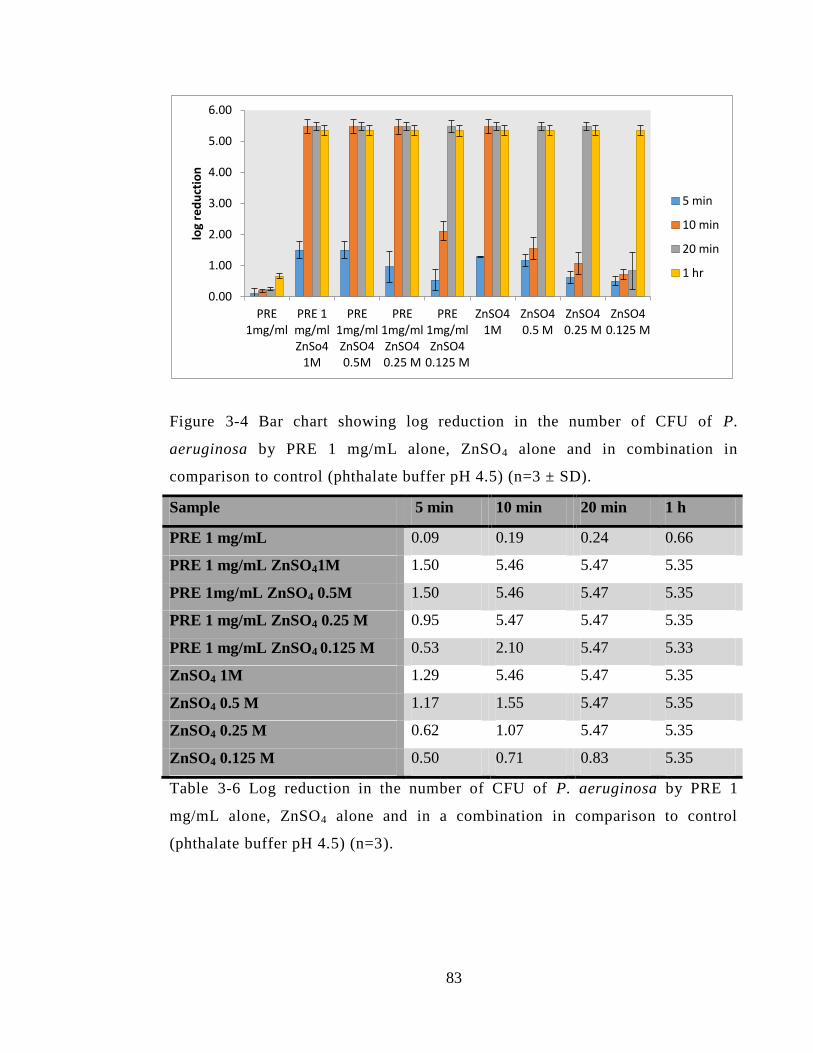
83
Figure 3-4 Bar chart showing log reduction in the number of CFU of P.
aeruginosa by PRE 1 mg/mL alone, ZnSO4 alone and in combination in
comparison to control (phthalate buffer pH 4.5) (n=3 ± SD).
Sample 5 min 10 min 20 min 1 h
PRE 1 mg/mL 0.09 0.19 0.24 0.66
PRE 1 mg/mL ZnSO41M 1.50 5.46 5.47 5.35
PRE 1mg/mL ZnSO4 0.5M 1.50 5.46 5.47 5.35
PRE 1 mg/mL ZnSO4 0.25 M 0.95 5.47 5.47 5.35
PRE 1 mg/mL ZnSO4 0.125 M 0.53 2.10 5.47 5.33
ZnSO4 1M 1.29 5.46 5.47 5.35
ZnSO4 0.5 M 1.17 1.55 5.47 5.35
ZnSO4 0.25 M 0.62 1.07 5.47 5.35
ZnSO4 0.125 M 0.50 0.71 0.83 5.35
Table 3-6 Log reduction in the number of CFU of P. aeruginosa by PRE 1
mg/mL alone, ZnSO4 alone and in a combination in comparison to control
(phthalate buffer pH 4.5) (n=3).
0.00
1.00
2.00
3.00
4.00
5.00
6.00
PRE 1mg/ml
PRE 1 mg/ml ZnSo4
1M
PRE 1mg/ml ZnSO4 0.5M
PRE 1mg/ml ZnSO4 0.25 M
PRE 1mg/ml ZnSO4
0.125 M
ZnSO4 1M
ZnSO4 0.5 M
ZnSO4 0.25 M
ZnSO4 0.125 M
log
red
uct
ion
5 min
10 min
20 min
1 hr
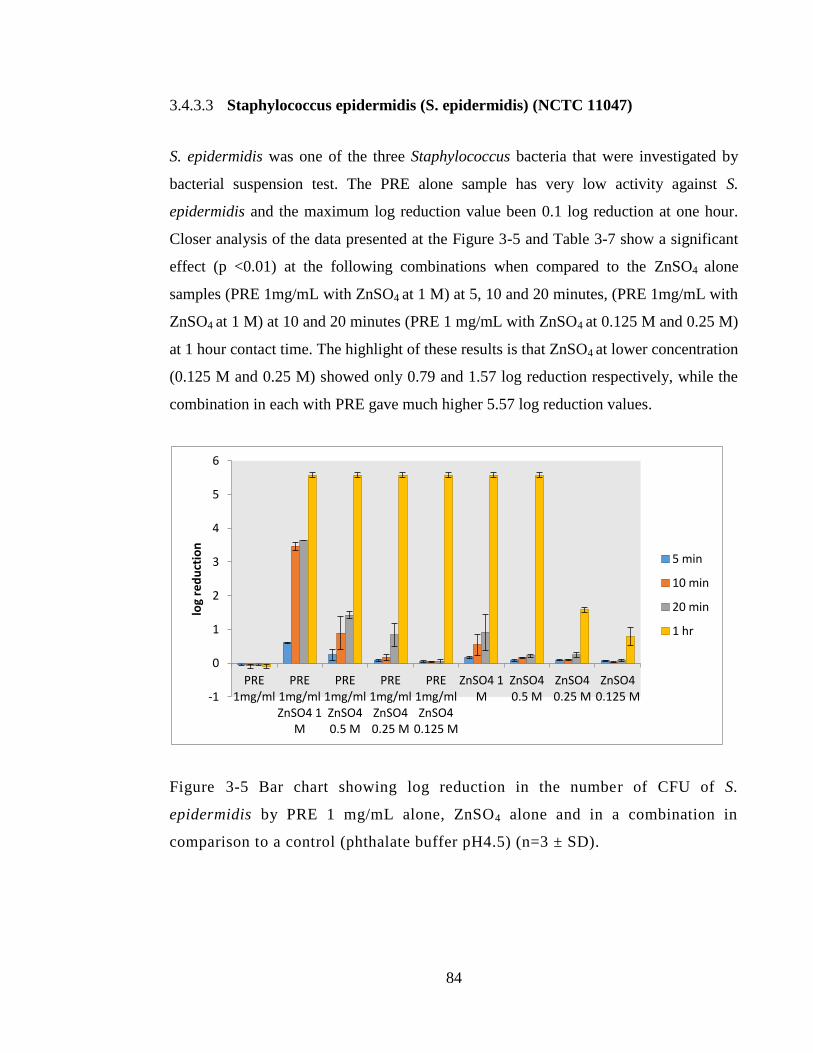
84
3.4.3.3 Staphylococcus epidermidis (S. epidermidis) (NCTC 11047)
S. epidermidis was one of the three Staphylococcus bacteria that were investigated by
bacterial suspension test. The PRE alone sample has very low activity against S.
epidermidis and the maximum log reduction value been 0.1 log reduction at one hour.
Closer analysis of the data presented at the Figure 3-5 and Table 3-7 show a significant
effect (p <0.01) at the following combinations when compared to the ZnSO4 alone
samples (PRE 1mg/mL with ZnSO4 at 1 M) at 5, 10 and 20 minutes, (PRE 1mg/mL with
ZnSO4 at 1 M) at 10 and 20 minutes (PRE 1 mg/mL with ZnSO4 at 0.125 M and 0.25 M)
at 1 hour contact time. The highlight of these results is that ZnSO4 at lower concentration
(0.125 M and 0.25 M) showed only 0.79 and 1.57 log reduction respectively, while the
combination in each with PRE gave much higher 5.57 log reduction values.
Figure 3-5 Bar chart showing log reduction in the number of CFU of S.
epidermidis by PRE 1 mg/mL alone, ZnSO4 alone and in a combination in
comparison to a control (phthalate buffer pH4.5) (n=3 ± SD).
-1
0
1
2
3
4
5
6
PRE 1mg/ml
PRE 1mg/ml ZnSO4 1
M
PRE 1mg/ml ZnSO4 0.5 M
PRE 1mg/ml ZnSO4 0.25 M
PRE 1mg/ml ZnSO4
0.125 M
ZnSO4 1 M
ZnSO4 0.5 M
ZnSO4 0.25 M
ZnSO4 0.125 M
log
red
uct
ion
5 min
10 min
20 min
1 hr
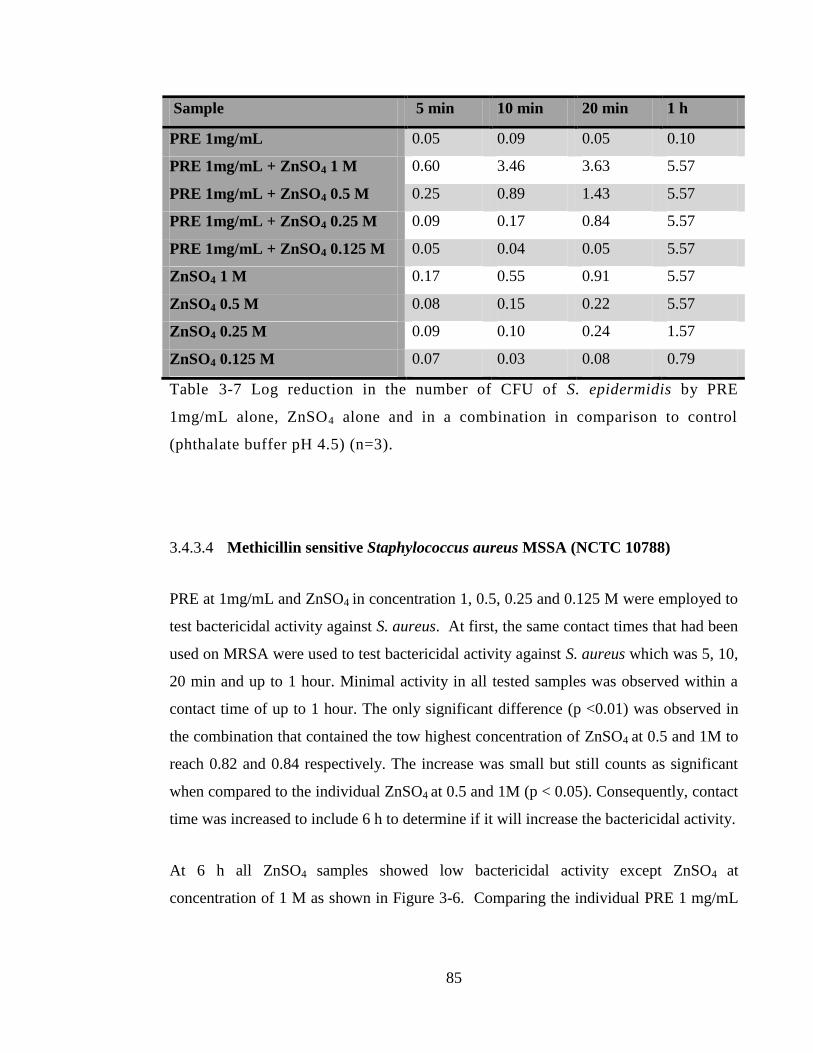
85
Sample 5 min 10 min 20 min 1 h
PRE 1mg/mL 0.05 0.09 0.05 0.10
PRE 1mg/mL + ZnSO4 1 M 0.60 3.46 3.63 5.57
PRE 1mg/mL + ZnSO4 0.5 M 0.25 0.89 1.43 5.57
PRE 1mg/mL + ZnSO4 0.25 M 0.09 0.17 0.84 5.57
PRE 1mg/mL + ZnSO4 0.125 M 0.05 0.04 0.05 5.57
ZnSO4 1 M 0.17 0.55 0.91 5.57
ZnSO4 0.5 M 0.08 0.15 0.22 5.57
ZnSO4 0.25 M 0.09 0.10 0.24 1.57
ZnSO4 0.125 M 0.07 0.03 0.08 0.79
Table 3-7 Log reduction in the number of CFU of S. epidermidis by PRE
1mg/mL alone, ZnSO4 alone and in a combination in comparison to control
(phthalate buffer pH 4.5) (n=3).
3.4.3.4 Methicillin sensitive Staphylococcus aureus MSSA (NCTC 10788)
PRE at 1mg/mL and ZnSO4 in concentration 1, 0.5, 0.25 and 0.125 M were employed to
test bactericidal activity against S. aureus. At first, the same contact times that had been
used on MRSA were used to test bactericidal activity against S. aureus which was 5, 10,
20 min and up to 1 hour. Minimal activity in all tested samples was observed within a
contact time of up to 1 hour. The only significant difference (p <0.01) was observed in
the combination that contained the tow highest concentration of ZnSO4 at 0.5 and 1M to
reach 0.82 and 0.84 respectively. The increase was small but still counts as significant
when compared to the individual ZnSO4 at 0.5 and 1M (p < 0.05). Consequently, contact
time was increased to include 6 h to determine if it will increase the bactericidal activity.
At 6 h all ZnSO4 samples showed low bactericidal activity except ZnSO4 at
concentration of 1 M as shown in Figure 3-6. Comparing the individual PRE 1 mg/mL
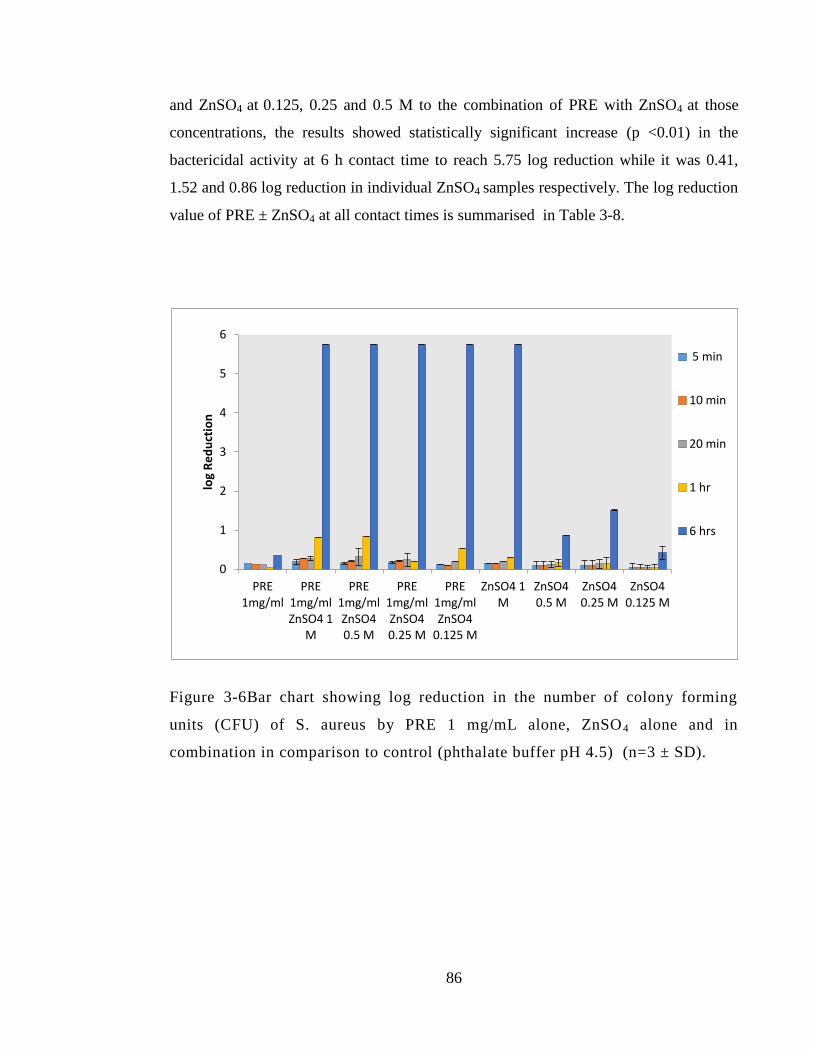
86
and ZnSO4 at 0.125, 0.25 and 0.5 M to the combination of PRE with ZnSO4 at those
concentrations, the results showed statistically significant increase (p <0.01) in the
bactericidal activity at 6 h contact time to reach 5.75 log reduction while it was 0.41,
1.52 and 0.86 log reduction in individual ZnSO4 samples respectively. The log reduction
value of PRE ± ZnSO4 at all contact times is summarised in Table 3-8.
Figure 3-6Bar chart showing log reduction in the number of colony forming
units (CFU) of S. aureus by PRE 1 mg/mL alone, ZnSO4 alone and in
combination in comparison to control (phthalate buffer pH 4.5) (n=3 ± SD).
0
1
2
3
4
5
6
PRE 1mg/ml
PRE 1mg/ml ZnSO4 1
M
PRE 1mg/ml ZnSO4 0.5 M
PRE 1mg/ml ZnSO4 0.25 M
PRE 1mg/ml ZnSO4
0.125 M
ZnSO4 1 M
ZnSO4 0.5 M
ZnSO4 0.25 M
ZnSO4 0.125 M
log
Re
du
ctio
n
5 min
10 min
20 min
1 hr
6 hrs
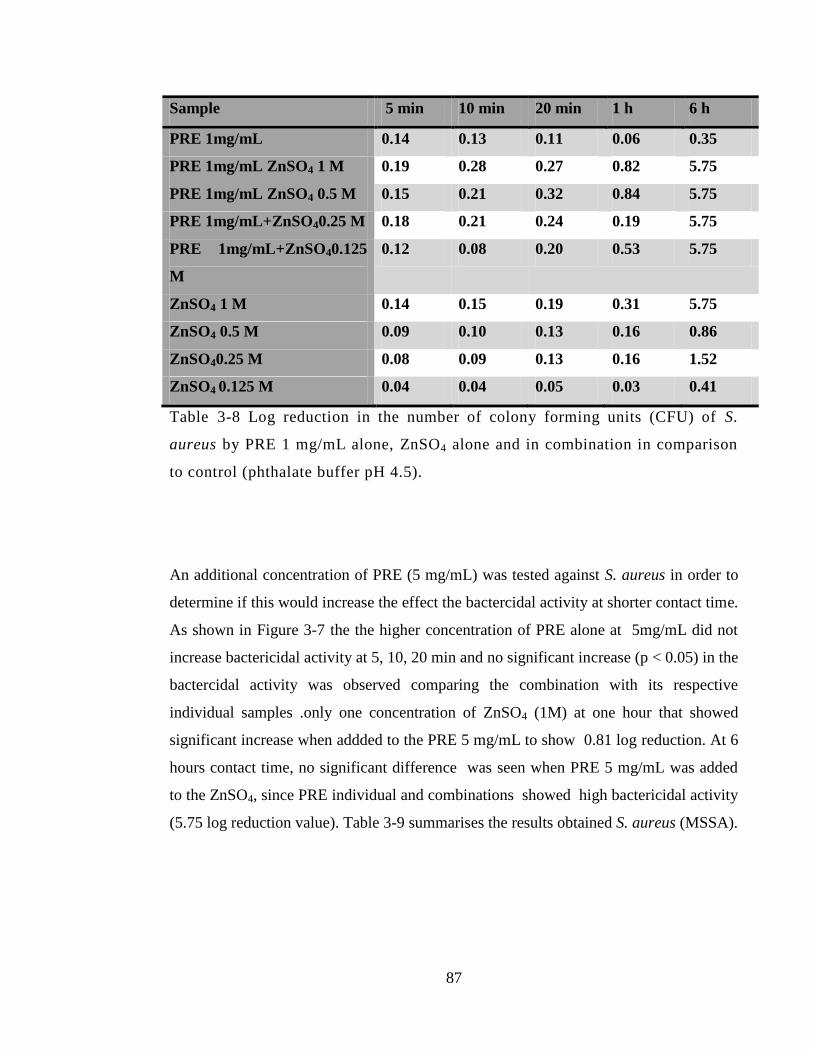
87
Sample 5 min 10 min 20 min 1 h 6 h
PRE 1mg/mL 0.14 0.13 0.11 0.06 0.35
PRE 1mg/mL ZnSO4 1 M 0.19 0.28 0.27 0.82 5.75
PRE 1mg/mL ZnSO4 0.5 M 0.15 0.21 0.32 0.84 5.75
PRE 1mg/mL+ZnSO40.25 M 0.18 0.21 0.24 0.19 5.75
PRE 1mg/mL+ZnSO40.125
M
0.12 0.08 0.20 0.53 5.75
ZnSO4 1 M 0.14 0.15 0.19 0.31 5.75
ZnSO4 0.5 M 0.09 0.10 0.13 0.16 0.86
ZnSO40.25 M 0.08 0.09 0.13 0.16 1.52
ZnSO4 0.125 M 0.04 0.04 0.05 0.03 0.41
Table 3-8 Log reduction in the number of colony forming units (CFU) of S.
aureus by PRE 1 mg/mL alone, ZnSO4 alone and in combination in comparison
to control (phthalate buffer pH 4.5).
An additional concentration of PRE (5 mg/mL) was tested against S. aureus in order to
determine if this would increase the effect the bactercidal activity at shorter contact time.
As shown in Figure 3-7 the the higher concentration of PRE alone at 5mg/mL did not
increase bactericidal activity at 5, 10, 20 min and no significant increase (p < 0.05) in the
bactercidal activity was observed comparing the combination with its respective
individual samples .only one concentration of ZnSO4 (1M) at one hour that showed
significant increase when addded to the PRE 5 mg/mL to show 0.81 log reduction. At 6
hours contact time, no significant difference was seen when PRE 5 mg/mL was added
to the ZnSO4, since PRE individual and combinations showed high bactericidal activity
(5.75 log reduction value). Table 3-9 summarises the results obtained S. aureus (MSSA).
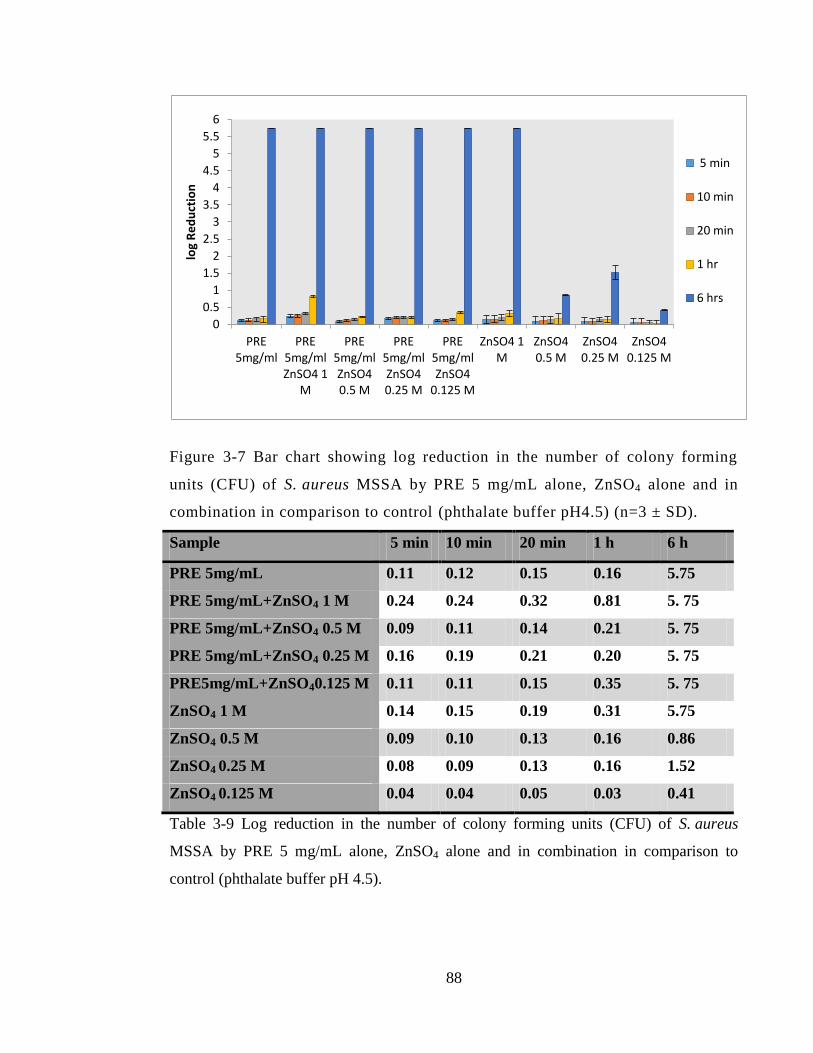
88
Figure 3-7 Bar chart showing log reduction in the number of colony forming
units (CFU) of S. aureus MSSA by PRE 5 mg/mL alone, ZnSO4 alone and in
combination in comparison to control (phthalate buffer pH4.5) (n=3 ± SD).
Sample 5 min 10 min 20 min 1 h 6 h
PRE 5mg/mL 0.11 0.12 0.15 0.16 5.75
PRE 5mg/mL+ZnSO4 1 M 0.24 0.24 0.32 0.81 5. 75
PRE 5mg/mL+ZnSO4 0.5 M 0.09 0.11 0.14 0.21 5. 75
PRE 5mg/mL+ZnSO4 0.25 M 0.16 0.19 0.21 0.20 5. 75
PRE5mg/mL+ZnSO40.125 M 0.11 0.11 0.15 0.35 5. 75
ZnSO4 1 M 0.14 0.15 0.19 0.31 5.75
ZnSO4 0.5 M 0.09 0.10 0.13 0.16 0.86
ZnSO4 0.25 M 0.08 0.09 0.13 0.16 1.52
ZnSO4 0.125 M 0.04 0.04 0.05 0.03 0.41
Table 3-9 Log reduction in the number of colony forming units (CFU) of S. aureus
MSSA by PRE 5 mg/mL alone, ZnSO4 alone and in combination in comparison to
control (phthalate buffer pH 4.5).
0
0.5
1
1.5
2
2.5
3
3.5
4
4.5
5
5.5
6
PRE 5mg/ml
PRE 5mg/ml ZnSO4 1
M
PRE 5mg/ml ZnSO4 0.5 M
PRE 5mg/ml ZnSO4 0.25 M
PRE 5mg/ml ZnSO4
0.125 M
ZnSO4 1 M
ZnSO4 0.5 M
ZnSO4 0.25 M
ZnSO4 0.125 M
log
Re
du
ctio
n
5 min
10 min
20 min
1 hr
6 hrs
89
3.4.3.5 Escherichia coli (E. coli) (NCTC 12923)
PRE at a concentration of 1mg/mL was tested in time kill assay alone and in
combination with ZnSO4 at 1, 0.5, 0.25 and 0.125 M against Gram negative bacteria E.
coli. PRE at all contact time showed no more than one log reduction value, compared to
the control at 5 minutes contact time almost doubled the log reduction value was
observed and significant increase (p <0.01) in the following combination when
compared to the PRE and ZnSO4 individual samples (PRE with ZnSO4 at 1 M, 0,25M
and 0.125 M) to reach 4.41, 2.1 and 1.89 log reduction. At 10 minutes contact time, the
combination of PRE in the same combinations (PRE with ZnSO4 at 1 M, 0,25 and 0.125
M) showed significant (p < 0.01) increase in the log reduction value when compared to
individual ZnSO4 and PRE samples as shown in Table 3-10. All combinations at 1 h
showed high bactericidal activity (6.5 log reduction) as shown in Figure 3-8. Comparing
the combination to its respective ZnSO4 individually, only one combination that
contained ZnSO4 at 0.125 M showed significant increase (p < 0.01) in the log reduction
value when compared to the individual PRE, ZnSO4 to reach 6.5 log reductions. There
was more than 6 log reduction value at all the other combinations and individual ZnSO4,
resulting in no significant difference being observed since all gave good/maximal
bactericidal activity. At 20 minutes contact time, ZnSO4 in concentration of 0.125 and
0.25 M did not show more than 1.35 log reduction, while the combination of containing
PRE at those concentrations showed significant increase in bactericidal activity (p <
0.05) of PRE to reach 2.53 and 2.78 in individual ZnSO4 respectively. Table 3-10 and
Figure 3-8 summarises the log reduction and bactericidal activity against E. coli.
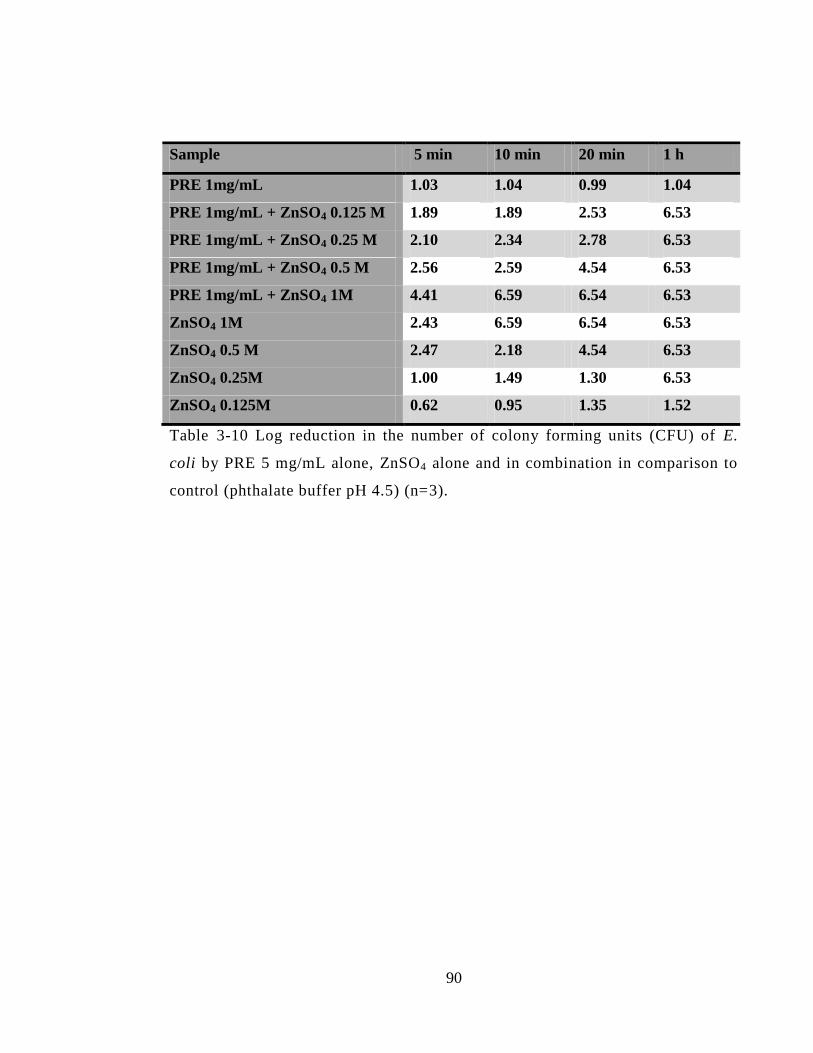
90
Sample 5 min 10 min 20 min 1 h
PRE 1mg/mL 1.03 1.04 0.99 1.04
PRE 1mg/mL + ZnSO4 0.125 M 1.89 1.89 2.53 6.53
PRE 1mg/mL + ZnSO4 0.25 M 2.10 2.34 2.78 6.53
PRE 1mg/mL + ZnSO4 0.5 M 2.56 2.59 4.54 6.53
PRE 1mg/mL + ZnSO4 1M 4.41 6.59 6.54 6.53
ZnSO4 1M 2.43 6.59 6.54 6.53
ZnSO4 0.5 M 2.47 2.18 4.54 6.53
ZnSO4 0.25M 1.00 1.49 1.30 6.53
ZnSO4 0.125M 0.62 0.95 1.35 1.52
Table 3-10 Log reduction in the number of colony forming units (CFU) of E.
coli by PRE 5 mg/mL alone, ZnSO4 alone and in combination in comparison to
control (phthalate buffer pH 4.5) (n=3).
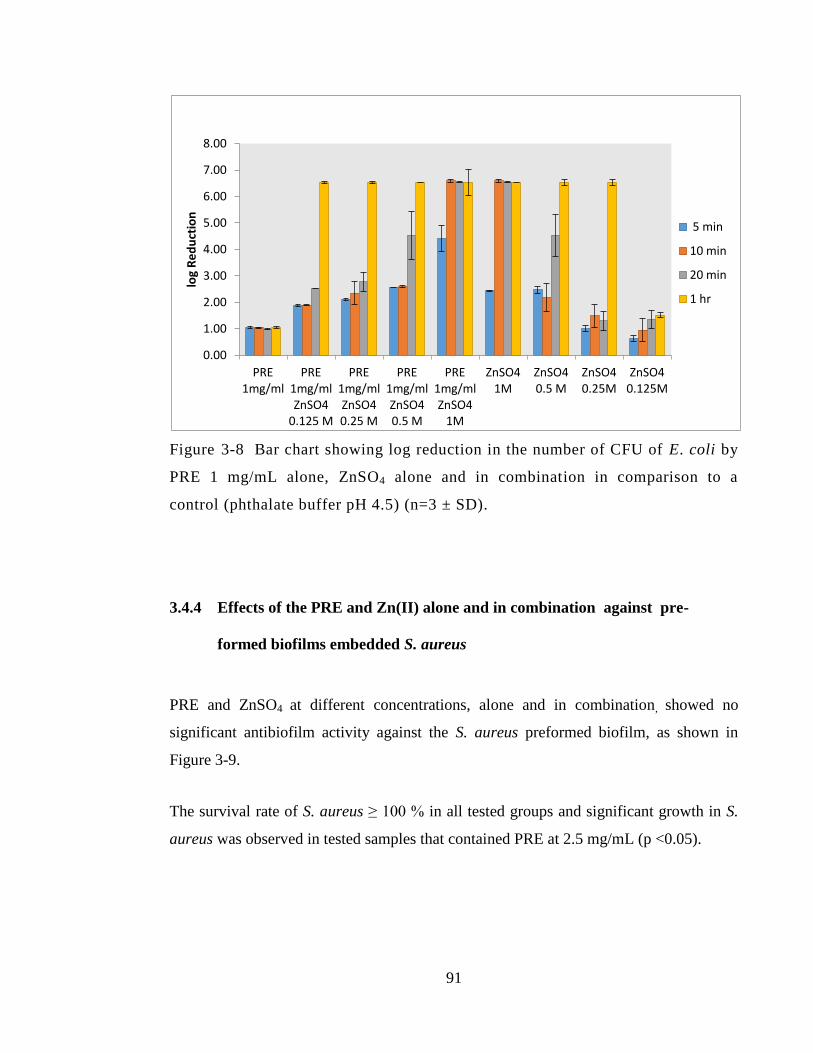
91
Figure 3-8 Bar chart showing log reduction in the number of CFU of E. coli by
PRE 1 mg/mL alone, ZnSO4 alone and in combination in comparison to a
control (phthalate buffer pH 4.5) (n=3 ± SD).
3.4.4 Effects of the PRE and Zn(II) alone and in combination against pre-
formed biofilms embedded S. aureus
PRE and ZnSO4 at different concentrations, alone and in combination, showed no
significant antibiofilm activity against the S. aureus preformed biofilm, as shown in
Figure 3-9.
The survival rate of S. aureus ≥ 100 % in all tested groups and significant growth in S.
aureus was observed in tested samples that contained PRE at 2.5 mg/mL (p <0.05).
0.00
1.00
2.00
3.00
4.00
5.00
6.00
7.00
8.00
PRE 1mg/ml
PRE 1mg/ml ZnSO4
0.125 M
PRE 1mg/ml ZnSO4 0.25 M
PRE 1mg/ml ZnSO4 0.5 M
PRE 1mg/ml ZnSO4
1M
ZnSO4 1M
ZnSO4 0.5 M
ZnSO4 0.25M
ZnSO4 0.125M
log
Re
du
ctio
n
5 min
10 min
20 min
1 hr
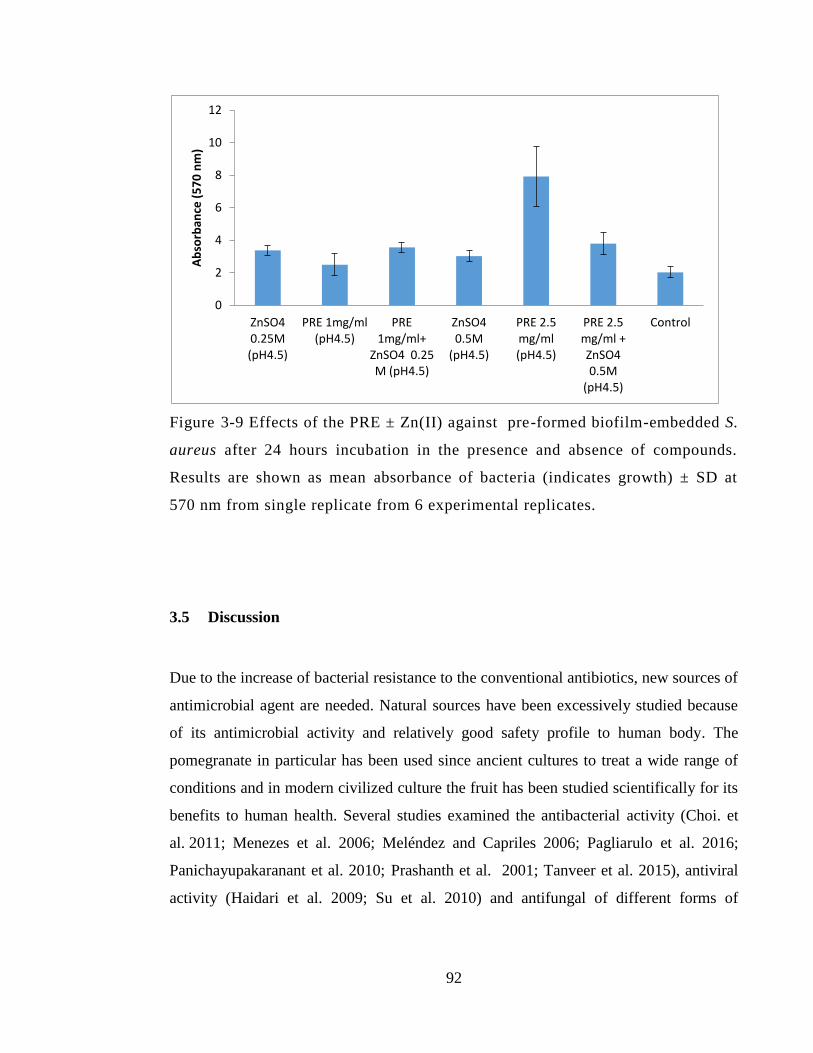
92
Figure 3-9 Effects of the PRE ± Zn(II) against pre-formed biofilm-embedded S.
aureus after 24 hours incubation in the presence and absence of compounds.
Results are shown as mean absorbance of bacteria (indicates growth) ± SD at
570 nm from single replicate from 6 experimental replicates.
3.5 Discussion
Due to the increase of bacterial resistance to the conventional antibiotics, new sources of
antimicrobial agent are needed. Natural sources have been excessively studied because
of its antimicrobial activity and relatively good safety profile to human body. The
pomegranate in particular has been used since ancient cultures to treat a wide range of
conditions and in modern civilized culture the fruit has been studied scientifically for its
benefits to human health. Several studies examined the antibacterial activity (Choi. et
al. 2011; Menezes et al. 2006; Meléndez and Capriles 2006; Pagliarulo et al. 2016;
Panichayupakaranant et al. 2010; Prashanth et al. 2001; Tanveer et al. 2015), antiviral
activity (Haidari et al. 2009; Su et al. 2010) and antifungal of different forms of
0
2
4
6
8
10
12
ZnSO4 0.25M (pH4.5)
PRE 1mg/ml (pH4.5)
PRE 1mg/ml+
ZnSO4 0.25 M (pH4.5)
ZnSO4 0.5M
(pH4.5)
PRE 2.5 mg/ml (pH4.5)
PRE 2.5 mg/ml + ZnSO4 0.5M
(pH4.5)
Control
Ab
sorb
ance
(5
70
nm
)
93
pomegranate extract (Santos et al. 2009; Tayel. and El-Tras 2009). In our research we
examined the combined effect of pomegranate alone and with another agent, Zn(II). The
recent discovery of potentiated antiviral activity of PRE by Zn(II) in this School was the
driving influence for our ongoing research for the antibacterial activity of the
combination (Houston, 2011).
In our study, the effect of adding on antibacterial activity of PRE was investigated by
means of checkerboard test and time kill assay against MRSA, E. coli, P. aeruginosa, S.
epidermidis and MSSA.
There is considerable variation between studies regarding the antibacterial activity of
PRE against S. aureus (sensitive and resistant) as reviewed in the literature. The MIC
levels of pomegranate extracts as established by different studies, ranging from 0.62
μg/μL and up to 10 μg/μL against S. aureus (McCarrell et al. 2008; Prashanth et al.
2001). Machado et al. (2003) reported that the total methanolic extract and water extract
of Punica grantum showed MIC levels > 250 mg/L against Staphylococcus aureus:
methicillin sensitive MSSA and methicillin resistant MRSA and our results showed that
water extract of pomegranate rind showed MIC level of 1 mg/mL and 2 mg/mL against
MRSA and MSSA respectively. Those MIC levels went down when combined with
ZnSO4 to reach 0.0625 mg/mL against MRSA and 0.5 mg/mL against MSSA as shown
in the checkerboard test. Our findings showed the lowest MIC level of PRE alone
against S. epidermidis at 0.125 mg/mL. The published MIC of pomegranate extract
ranged from 9 to 25 μg/μL against E. coli and our results showed that E. coli need higher
concentration than the tested. P. aeruginosa showed the same level of MIC as MSSA (2
mg/mL) as in previous reports (Navarro et al. 1996; Prashanth et al. 2001; Machado et
al. 2003; Melendez and Capriles 2006; Pagliarulo et al. 2016). Such variation in the
level of antibacterial activity may be explained by various factors such as the means of
extraction, tannin (in particular punicalagin) content, seasonality, the cultivation process
where the pomegranate is grown in different geographical areas (Zografou et al. 2013;
McCarrell et al. 2008).
94
As shown by the checkerboard test, the FIC index calculation indicated that MRSA
surprisingly was more sensitive than MSSA strain and synergistic effect was seen in
MRSA and S. epidermidis. Interestingly, this was the reflected in time kill log reduction
assay. This result was very encouraging to show the activity against MRSA bacteria
because of its bad reputation in aggressive wound infection. MRSA is known for its
resistance to beta lactam antibiotics and other antibiotics (Hartmann et al. 1997).
Hospital acquired MRSA wound infection can lead to life threatening generalized
MRSA infection (Coello et al. 1997).
In our study PRE alone at high concentration (5 mg/mL), without Zn(II), gave a high
bactericidal effect against MSSA at 6 hours contact time to reach 5.75 log reduction
values. While in low concentration of PRE (1mg/mL) alone showed minimal
bactericidal effect up to 6 h contact time (0.35 log reduction), it showed a significantly
higher (p <0.01) bactericidal effect (>5 log reduction) against S. aureus (MSSA) when
ZnSO4 was added at 0.125, 0.25 and 0.5 M, but needed 6 hours to give the action.
Furthermore, bactericidal activity against MRSA showed that PRE 1 mg/mL potency
was increased by ZnSO4 0.25 M at all contact times but significant increase was
recorded at one hour contact (p <0.01) a high bactericidal (5.5 log reduction), while this
activity wasn’t seen in the individual samples. The results for S. epidermidis showed that
ZnSO4 at lower concentration (0.125 M and 0.25 M) gave only 0.79 and 1.57 log
reduction respectively while the combination in each with PRE 1 mg/mL gave 5.57 log
reduction values and significant potentiation was observed.
Our results showed that the activity of PRE (1 mg/mL) was increased against Gram
negative bacteria E. Coli and P. aeruginosa when ZnSO4 was introduced. The addition
of ZnSO4 potentiated the bactericidal activity of PRE against E. coli. The results showed
that there was a potentiation and significant increase (p <0.01) in the bactericidal effect
against E. coli was observed with combination of PRE 1 mg/mL and ZnSO4 at 0.125 and
0.25 M at 5, 10 and 20 minutes contact time when compared to individual of PRE 1
mg/mL and ZnSO4. The other Gram negative bacteria P. aeruginosa showed similar
95
potentiation at ZnSO4 in concentration of (ZnSO4 0.125 M at 20 min), (0.25 and 0.5 M at
10 min). In the P. aeruginosa experiment the pomegranate rind extract at 1 mg/mL alone
showed less than one log reduction at all contact time up to 1 h. ZnSO4 alone in all
concentration gave a high bactericidal activity (> 5 log reduction) at 1h but the
potentiation was seen at 20 min contact time with PRE/0.125 M and at 10 min contact
time with PRE/0.25 M ZnSO4 and PRE/0.5 M ZnSO4 in contrast to each one
individually.
The antibacterial activity of ZnSO4 was reported in a previous study that showed the
MIC level of different bacterial strain isolated from rat and human wound. The study
showed MIC levels of Zn(II) in the range (2-4 mmol/L) against MSSA S. aureus and
MIC level of E.coli at (4-8 mmol/L). These findings are in accordance with our results
that showed MIC level of Zn(II) at 3200 μM against MSSA S. aureus while higher MIC
was obtained with MRSA (6400 μM) and lower MIC level was recorded by E.coli (1600
μM). There are several mechanisms proposed in which Zn(II) could act as an
antibacterial agent. Zn(II) ion binding to the bacterial surface and or generation of
hydrogen peroxide which may lead to increase the cell membrane permeability,
intracellular outflow and eventually cell growth inhibition and cell death (Sirelkhatim et
al. 2015).
Most of the pathogens involved in chronic wounds, for instance Pseudomonas spp and
methacillin resistant Staphylococcus aureus (MRSA), are typical producers of biofilm.
These bacteria can develop very high resistance levels to conventional treatment because
of lack of drug permeability through the biofilm itself provided by extrapolymeric
substances (EPS) (Donlan et al. 2001; 2002). Another defense mechanism of bacteria
that is present in biofilm is that this type of bacteria grows less quickly, and this lack of
growth may cause a decrease in antibacterial agent uptake, as well as other changes of a
physiologic nature that could impact on the effectiveness of the drug (Mandell et al.
2005; Siddiqui and Bernstein 2010; Wolcott et al. 2010).
96
The results in this chapter are very encouraging involving planktonic bacteria.
However, chronic wounds and skin infections are typically associated with biofilms and
our results, showed a resistance of the preformed S. aureus biofilm to the PRE/Zn
solutions that contained PRE (1 mg and 2.5 mg) ± ZnSO4 (0.25M). Activity could be
limited by low permeation through the ECM, such that insufficient reaches the bacterial
load to elicit an effect.
Although the results are considered empiric because of low replicate number, it is still an
important observation, revealing data that merits inclusion in this chapter. Additionally
higher PRE concentration showed higher growth and survival of S. aureus biofilm and
that could be result of higher glucose levels in crude extract of PRE (2.5 mg/mL)
(Waldrop, et al. 2014). It is not possible to make further deductions without further work
being done and higher replicates performed. Biofilm bacteria according to Donlan et al
(2001; 2002) have been reported as being 500 times more resistant to antibiotics than
those that are freely living or unattached (planktonic). This results broadly agree with
previous findings in which concluded that planktonic S. aureus study showed more
susceptibility to the antibiotic treatment at first 48h then a tolerance will be developed
after mature biofilm is formed on the wound (Wolcott et al. 2010). The study has
demonstrated a new insight in relation to the resistance of biofilm with young or mature
type biofilm and biofilm susceptibility testing and clinical biofilm maturity experiments,
showed that 1 day planktonic S. aureus is more susceptible to the antibacterial agent
gentamicin and tolerance was produce at mature biofilm after 48h. However, a positive
effect of debridement procedure (i.e. biofilm removal from wound surface) on mature
biofilm was explained, that it will remove the mature biofilm and resulted bacteria in to
planktonic or young biofilm type will be more susceptible to the antibacterial agent. The
study recommended an application time window of antibacterial is first 48-hour after
debridement in order for that treatment to be effective.
In this chapter, we showed that a synergistic and or potentiation effect can be achieved
with PRE/Zn(II) combination. Our findings are in line with other studies that show a
97
synergistic effect could result from combination of metal and pomegranate extract
(McCarrell et al. 2008), although this is the first to show such activity with Zn(II).
Synergistic effects against viruses have been reported by Houston et al (2017b). In his
work, Houston (2011) showed that the addition of ZnSO4 increased microbicidal activity
of PRE from ~1 to 7log reduction against Herpes simplex virus (Houston et al, 2017b).
In another study, McCarrell et al. (2008) indicate that synergistic effect was seen when
Cu(II) was added to PRE, it show increased in antimicrobial activity opposing E. coli,
Ps. aeruginosa and P. mirabilis and opposing S. aureus, compared to the individual
activity of both. Although McCarrell et al. (2008), reported the potentiation of PRE
bactericidal activity upon addition of Cu(II), the study failed to find the same kind of
synergistic effect with Zn(II) ion that showed minimal increase in the antibacterial
activity of PRE against tested microorganisms (Staphylococcus aureus, Bacillus subtilis,
Escherichia coli, Pseudomonas aeruginosa and Proteus mirabilis).
In contrast to McCarrell et al. (2008), our study showed a potentiation of antimicrobial
activity of PRE upon addition Zn(II) obtained by checkerboard synergy test against
methicillin resistant Staphylococcus aureus and Staphylococcus epidermidis and an
additive effect was seen in Staphylococcus aureus and Pseudomonas aeruginosa. There
are several factors to be considered when analyzing the opposing results of the both
studies regarding the antibacterial activity of PRE and zinc, or Zn(II) ion, one of them is
that different salts of zinc were employed in each test while McCarrell et al. (2008) used
zinc oxide (ZnO) and in our study we used ZnSO4. Due to its tight bonding, ZnO is
highly insoluble in aqueous media as noted by Houston et al (2017b) and may not
liberate sufficient free Zn(II) to potentiate PRE adequately. Our results showed a high
bactericidal effect on MSSA S. aureus at 5mg/mL concentration of pomegranate peel
extract, while Pagliarulo (2016) recently reported that PRE should give complete
bactericidal effect at 50 µg/µL.
The mechanism by which pomegranate can induce antibacterial activity is not fully
understood, but a proposed mechanism is that active phenolic/tannin substances can alter
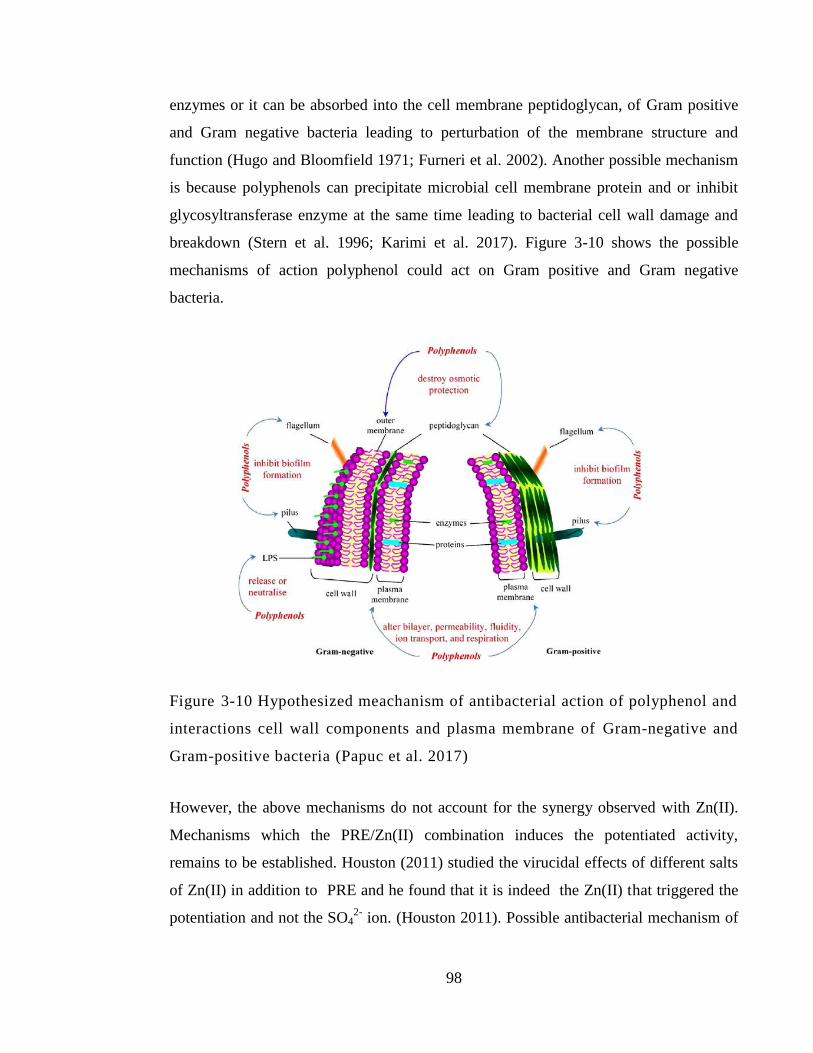
98
enzymes or it can be absorbed into the cell membrane peptidoglycan, of Gram positive
and Gram negative bacteria leading to perturbation of the membrane structure and
function (Hugo and Bloomfield 1971; Furneri et al. 2002). Another possible mechanism
is because polyphenols can precipitate microbial cell membrane protein and or inhibit
glycosyltransferase enzyme at the same time leading to bacterial cell wall damage and
breakdown (Stern et al. 1996; Karimi et al. 2017). Figure 3-10 shows the possible
mechanisms of action polyphenol could act on Gram positive and Gram negative
bacteria.
Figure 3-10 Hypothesized meachanism of antibacterial action of polyphenol and
interactions cell wall components and plasma membrane of Gram-negative and
Gram-positive bacteria (Papuc et al. 2017)
However, the above mechanisms do not account for the synergy observed with Zn(II).
Mechanisms which the PRE/Zn(II) combination induces the potentiated activity,
remains to be established. Houston (2011) studied the virucidal effects of different salts
of Zn(II) in addition to PRE and he found that it is indeed the Zn(II) that triggered the
potentiation and not the SO42-
ion. (Houston 2011). Possible antibacterial mechanism of
99
action of ZnSO4 could be attributed to the Zn(II) ion and this theory could be confirmed
by testing different zinc salts against investigated bacteria. Both PRE and Zn(II)
possess low levels of antibacterial/bactericidal activity but the combination of two gave
more activity as it was revealed in this chapter.
It is feasible that the multiple phenol groups of the tannins (i.e. punicalagin) attach to the
bacterial cell peptidoglycan first and compromise its function and structure of cell wall
enabling toxic levels of Zn(II) to be absorbed causing cell death. Another possible
mechanism is that Zn(II) will act first on the cell wall and compromise its permeability
and function, leading to polyphenol substance to be absorbed or interact with bacterial
resulting in protein denaturation and or destabilization of microbial cell wall leading to
its damage.
3.6 Conclusion
Findings in this chapter demonstrate that there is a synergistic effect of PRE
microbicidal activity upon the addition of Zn(II).
From the checkerboard test the potentiation was seen at PRE/Zn (II)
concentration (62.5 μg/mL + 1600 μM) and (31.25 μg/mL + 400μM) against
MRSA and S. epidermidis respectively. Whereas MSSA and P. aeruginosa
demonstrated an additive effect only. No antagonistic effects were observed at
any time.
From the time kill assay, the concentration level of Zn(II) that has the capability
of working with PRE 1 mg/mL as broadspectrum bactericidal system were
ZnSO4 at 0.125 and 0.25 M. The combination of PRE and Zn(II) are capable in
vitro of effectively killing Gram-positive bacteria, MSSA S. aureus, MRSA and
S. epidermidis and the development of Gram-negative bacteria, E. coli and P.
aeruginosa.
100
On the other hand, based on the limited study we were able to carry out, the
biofilm embedded S. aureus (NU118) results didn’t show susceptibility to
PRE/Zn. However, the formulation may have potential use following biofilm
debridement.
As the antibacterial/bactericidal activity of PRE/Zn system has revealed very
encouraging results, the cytotoxicity of such combination is very important as a
following step. In the next Chapter, the cytotoxicity of PRE ± Zn(II) will be investigated
in vitro using an immortalised epithelium cell line.
101
Chapter 4: In vitro cytotoxicity and
anti-proliferative effects of PRE and Zn(II)
102
4.1 Introduction
The aim of this project was to explore the potential of PRE/Zn as novel treatment for
bacterial skin infections – these can involve intact epidermis or compromised epidermis.
For example, impetigo is a common and contagious skin infection caused when bacteria
such as Staphylococcus aureus, MRSA or Streptococcus pyogenes infect the epidermis;
either intact skin (primary impetigo) and also in broken skin (secondary impetigo).
When infections involve broken skin where the epidermis has been compromised and
there is thus a wound healing aspect that must be considered in the development of any
new topical treatment. Whereas the primary function of a potential new treatment based
upon PRE and Zn(II) is to address the microbial load resident within affected areas of
skin, it is also important that the formulation does not have adverse affects at the cellular
level, which could prevent cell proliferation and re-epithelialisation across the wound
bed in a timely manner or even cause the cells to die.
4.1.1 Cell viability
Determination of cell viability and proliferation activity (cytotoxicity) in cell culture
experiments is thus considered to be the most important assay in the development of
novel pharmaceutical products. In cytotoxicity assays measuring what is defined as
healthy viable cell is the key purpose in these kinds of experiments (Stoddart 2011).
Typically such data involves cell proliferation portrayed relative to an untreated control
which is set at 100% - a test substance that produces a result less than 100% shows
reduced cell proliferation and is deemed cytotoxic, and the lower the percentage the
greater the cytotoxicity. On some occasions, cell proliferation is found to be greater than
control (>100%) indicating the test substance may have stimulated or accelerated cell
proliferation relative to control.
103
There are several methods used to probe cell viability and cell proliferative activity in
mammalian cell cultures. Measuring cell viability by using of metabolic dye that is
present in healthy cells became more sophisticated and complex with time.
4.1.1.1 Trypan blue
One of the earliest techniques is the live /dead cell staining by Trypan blue dye, in which
same concept of cell counting previously detailed in Chapter 2, Section 2.2.5.4 was
employed.
4.1.1.2 MTT assay
Another method very commonly used in cell cytotoxicity assays is the use of metabolic
days and one of the early discover dye is MTT (3-(4,5-dimethylthiazol-2-yl)-2,5-
diphenyltetrazolium bromide). MTT assay is colorimetric in type in which depends on
the presence of live cell metabolic activity that will transform the MTT yellow dye into
purple color when added to the live cell culture. Around the early 1940s, small-scale
research and case studies began to use tetrazolam salts as detective measure of live cell
metabolic activity (Kun and Abood 1949). The mechanism of action of MTT assay
involves quantification of the presence of live cells enzyme called nicotinamide adenine
dinucleotide phosphate NADPH dependent cellular oxidoreductase enzyme that will
reduce the yellow coloured MTT dye to the purple coloured insoluble product,
formazan. The cells are typically exposed to the MTT reagent for 4 hours at least (Kun
and Abood. 1949; Kupcsik 2011).
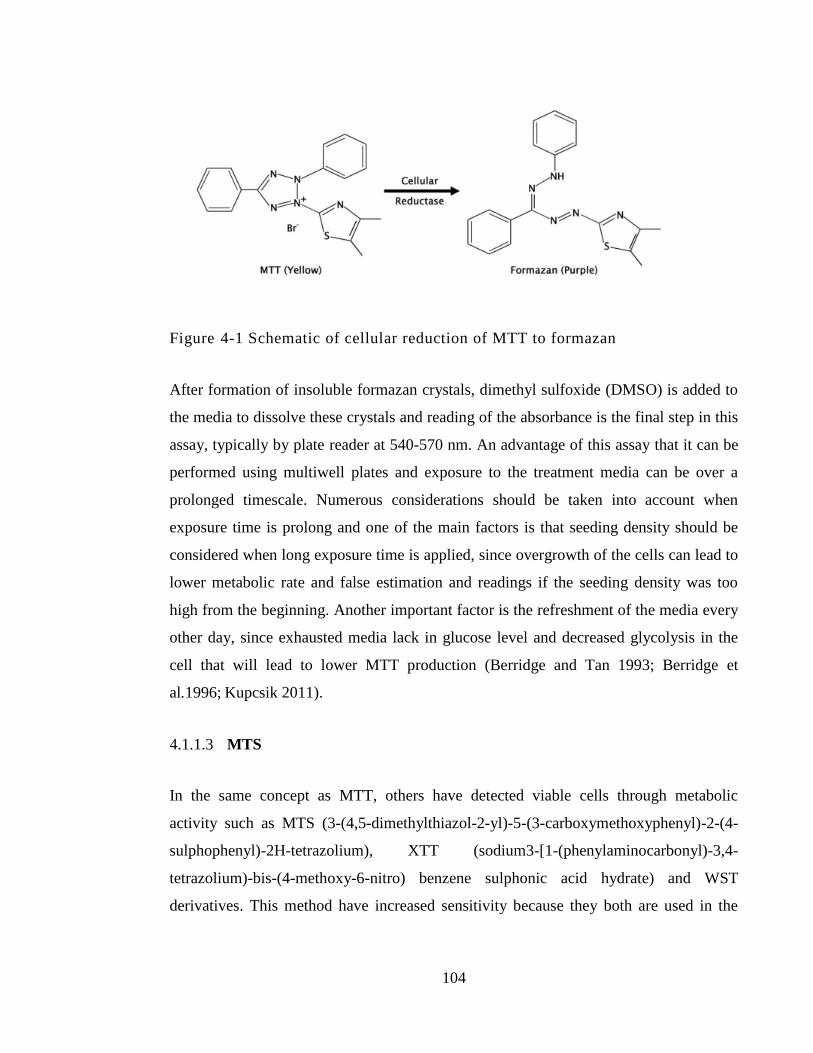
104
Figure 4-1 Schematic of cellular reduction of MTT to formazan
After formation of insoluble formazan crystals, dimethyl sulfoxide (DMSO) is added to
the media to dissolve these crystals and reading of the absorbance is the final step in this
assay, typically by plate reader at 540-570 nm. An advantage of this assay that it can be
performed using multiwell plates and exposure to the treatment media can be over a
prolonged timescale. Numerous considerations should be taken into account when
exposure time is prolong and one of the main factors is that seeding density should be
considered when long exposure time is applied, since overgrowth of the cells can lead to
lower metabolic rate and false estimation and readings if the seeding density was too
high from the beginning. Another important factor is the refreshment of the media every
other day, since exhausted media lack in glucose level and decreased glycolysis in the
cell that will lead to lower MTT production (Berridge and Tan 1993; Berridge et
al.1996; Kupcsik 2011).
4.1.1.3 MTS
In the same concept as MTT, others have detected viable cells through metabolic
activity such as MTS (3-(4,5-dimethylthiazol-2-yl)-5-(3-carboxymethoxyphenyl)-2-(4-
sulphophenyl)-2H-tetrazolium), XTT (sodium3-[1-(phenylaminocarbonyl)-3,4-
tetrazolium)-bis-(4-methoxy-6-nitro) benzene sulphonic acid hydrate) and WST
derivatives. This method have increased sensitivity because they both are used in the

105
presence of an intermediate electron acceptor PMS (phenazine methosulphate) which
make the assay highly stable (Cory et al. 1991; Stoddart 2011).
4.1.1.4 LDH
Measuring cell death in the culture is a more direct technique for detecting cell viability
in response to the presence of a test substance. When death happens to normal cells, the
mechanisms of cell death can be divided into two types: apoptosis and necrosis.
Apoptosis can be defined as proGrammed cell death that can occur inside the healthy
cell to get rid of unwanted cells during normal development of cell growth cycle. It can
also happen when permanent damage beyond the repair of the cell happens due to
infection period or cell undergo stressed conditions. On the other hand, necrosis is non-
proGrammed cell death due to trauma or toxin presence that trigger premature cell
death. When necrosis happens to the cell, a certain enzyme called lactate dehydrogenase
(LDH) is released from the damaged cell membrane into the extracellular medium.
Colorimetric detection of LDH enzyme is widely used as a measure of cytotoxicity and a
number of LDH kits are commercially available. The reading of the end-point coloured
product spectophotometrically can be used to detect and quantify the LDH present. The
LDH enzyme is considered to be stable up to 48h after cell death. The increased LDH
release in the cell culture supernatant is directly proportional to the number of lysed cells
in the culture (Wong et al. 1982; Hipler et al. 2007; Gerets et al. 2011; Stoddart 2011).
4.1.1.5 FACS
Another assay for cell viability is the Fluorescence Activated Cell Sorting system
(FACS). The FACS analysis most routinely used is the ‘dual dye’ method. It depends on
staining the cell culture after treatment with two fluorescent reagents: propidium iodide
(PI) and fluorescein diacetate (FDA). FDA can penetrate the cellular membrane of the
viable cell and the dye transform to the fluorescence green colour. The esterase enzyme
in the cell membrane is responsible for the production of this green fluorescence colour
and higher fluorescence green is a mark of high proliferative cell presence when
106
analyzed under flow cytometry. On the other hand, PI is excluded from viable cells
because of the presence of intact cellular membrane that is not permeable to the PI,
rather it is a DNA binding dye that can bind to dead cells nucleic acid without cell
membrane and turn into red fluorescence state. Cellular fluorescence is measure by flow
cytometer measurement after staining with PI and FDA at the end to estimate the cell
cytotoxicity (Ross et al. 1989; Stoddart 2011).
4.1.2 HaCaT cell line
HaCaT keratinocytes were chosen as the appropriate cell model in this work. HaCaT
cells are a spontaneously immortalised human keratinocyte cell line originally obtained
from histologically normal skin distal to an excised melanoma. The name HaCaT refers
to Human Adult skin keratinocyte origin and because cells were propagated in low
Calcium medium and at an elevated Temperature (Boukamp et al. 1988). Spontaneous
immortalisation of human cells is quite rare but early in the immortalisation process;
HaCaT cells differentiated and stratified under high calcium conditions, but proliferated
as a monolayer under low calcium. Further passages reduced the effects of low calcium
levels and cells that survived increased temperature were able to grow autonomously in
culture. Marker chromosomes resulted which were able to show that the cell line was
monoclonal by karyotyping, showing that HaCaT cells were aneuploid but many cells in
late passages were polyploid. Like normal keratinocytes HaCaT cells develop into a
well-structured epidermis, having the same keratin expression profile, exhibiting normal
differentiation at higher passages. A commonly used technique for cells immortalisation
involves virus infection (e.g. Simian Virus-40), which tends to produce irregular growth,
keratinisation and differentiation (Boukamp et al. 1988).
Since their discovery, HaCaT cells have been widely utilized as a model for determining
cytotoxic effects due to their high ability to differentiate and proliferate in vitro. As a
human keratinocyte model, the cell line is reproducible and overcomes issues such as
short culture lifespan and variations between cell lines. Chu et al. (2017) used HaCaT
107
cells to characterise cytotoxcity of tea tannin, epigallocatechin gallate. Ellagic acid (a
component of PRE) was found to have a protective effect to HaCaT cells against UV
induced oxidative stress and apoptosis (Hseu et al. 2012), and pomegranate phenolics
were found to ameliorate H2O2–induced oxidative stress and cytotoxicity in HaCaT cells
(Liu et al. 2019).
4.2 Objective and Aims
The objective of this chapter was to determine the cytotoxic (cell viability and
proliferation) effects of PRE ± Zn(II) on a standard keratinocyte cell line, HaCaT, using:
MTT colorimetric assay
FACS analysis using propidium iodide (PI) and fluorescein diacetate (FDA).
4.3 Material and methods
4.3.1 Materials
The materials used in this chapter are detailed in Section 2.1
4.3.2 Sample preparation
PRE ± ZnSO4 solutions at pH4.5 were prepared using previously detailed methods in
Chapter 2, Section 2.2.1.
108
4.3.3 Aseptic techniques
Aseptic measures and methods were employed at all stages in cytotoxicity investigation
on HaCaT cells using cell culture safety cabinets and methods previously detailed in
Chapter 2, Section 2.2.5.1.
4.3.4 Cell culture general methods
Human adult, spontaneously immortalized, epidermal keratinocytes (HaCaT cells) were
used in the investigation of cytotoxicity studies. Details of the cell culture techniques
may be found in Chapter 2, Section 2.2.5.
4.3.5 Culture media preparation
The culture media composed of (Dulbecco’s Modified Eagle’s Medium (DMEM) + 10%
foetal calf serum media + 1% antibiotic/ antimycotic (100U/mL penicillin G sodium,
100µg/mL streptomycin sulphate and 0.25µg/mL amphotericin B) and 1% L-glutamine).
All prepared according to previously detailed method in Chapter 2, Section 2.2.5.3.
4.3.6 Cell sub culturing and counting
To maintain appropriate cell density whilst working with HaCaTs, the cells were
subcultured and counted when they reached 80% confluency. Counting and subculturing
methods are detailed in Chapter 2, Section 2.2.5.5.
4.3.7 Cell Freezing and cell thawing
For cell storing and cell retrieval, a previous method is detailed in Chapter 2, Section
2.2.5.6.
109
4.3.8 Cell growth study
HaCaT growth behaviour and pattern was studied under the same laboratory conditions
that were used in the all cell culture assays. Resulted growth curve will demonstrate the
different stages of cell growth in accordance to the time. The experiment was carried out
in duplicate, n=2. An overnight culture of HaCaT cells was detached from the flask
using trypsin (trypsinisation) and a cell suspension with density of to 2 × 10⁴ cells mL
-1
was prepared using haemocytometer counting method. Cells were seeded in three 24-
well plates by adding 1 mL of cell suspension in each well. The plates were incubated in
mammalian culture incubator at 37°C, 5% CO2/95% air for 6 dyes. Cell counting was
firstly performed at 24 h, then twice daily counting was done for the following days.
Cells media within the wells was first removes and washed twice with phosphate buffer
saline (PBS). Trypsinization of the cells was performed by adding 100 µL of trypsin and
incubated for 10 minutes. After that, in order to neutralize the trypsin, fresh culture
media was added (1 mL) to each well and mixed well by pipetting up and down for
several times. At each time point samples were transferred from the 24-well plates to
labelled Eppendorfs and the 24-well plate was returned to the incubator for the following
time points. Cell medium was changed with fresh medium every other day.
4.3.9 MTT assay
In the current work, cell viability test was evaluated by MTT assay. Overall each assay
took ten days long, three day for preparation and 7 day exposure time. Firstly, four 96
well plates was seeded with 5 x 10⁴
HaCaT cells/mL in each well and 100 µL total
volume in culture media. Culture media used contains Dulbecco’s Modified Eagle’s
Medium (DMEM), 1% antibiotic, 1% L-glutamine and 10% FCS. The four plates were
labelled for day one, day three, day five and day seven of contact time. The cells were
suspended in F-SCM and placed in a incubator at 37°C and 5% CO2/95% air for 24
hours. The next day, the medium was replaced with serum-free medium and returned in
the incubator for 24h and this step of serum starvation is done to synchronize the cells to
110
the same cell cycle. The following day the medium was replaced with test compounds
accompanied with Dulbecco’s Modified Eagle’s Medium (DMEM), 1% antibiotic, 1%
L-glutamine and 1% FCS. This medium was used for the rest of the experiment.
The MTT assay was performed on both PRE and ZnSO4 alone and in combination. PRE
concentrations ranged from 5-100 µg/mL, ZnSO4 from 12.5-100 µM/mL. The total test
samples examined by MTT assay in this work are listed in Table 1. After 24 hours of
cell exposure to the test compound media, 25 µL of thiozoly blue tetrazolium bromide
(MTT) reagent was added to each well of the 96 well plate labelled day one and returned
to the incubator for four hours. After that time, the media and MTT dye was removed
and 100 µL of dimethyl sulfoxide DMSO was added to each well in order to solubilise
the formazan crystals, wrapped with clingfilm and incubated for 30 minutes at 37°C and
5% CO2 /95% air. Next, the absorbance of each well was measured by plate reader at a
wavelength of 570 nm (SunriseTM
, Tecan Trading, Switzerland).
The cell’s exposure time was set to 7 days. The MTT assay was performed on day one,
three, five and seven of exposure time. The treatment media was replaced with fresh one
every other day. Each test was done in triplicate. Percentage cell viability was calculated
using the following formula were control well is refereed to well treat with buffer only:
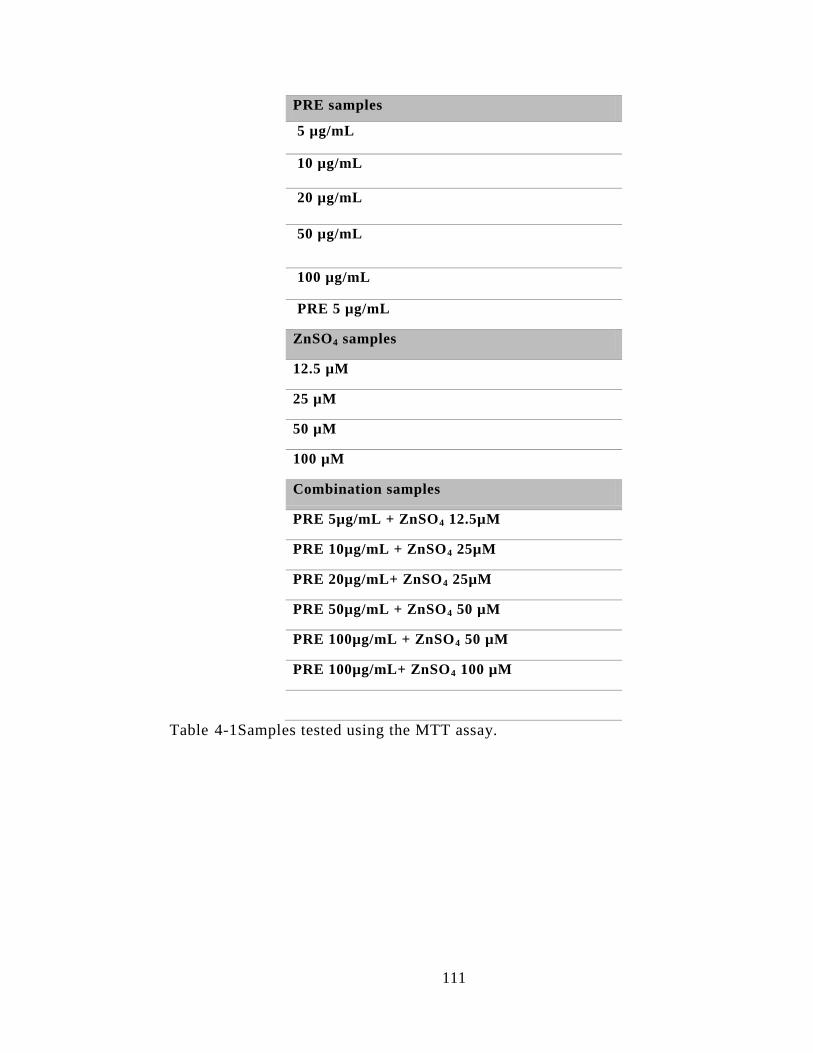
111
PRE samples
5 µg/mL
10 µg/mL
20 µg/mL
50 µg/mL
100 µg/mL
PRE 5 µg/mL
ZnSO4 samples
12.5 µM
25 µM
50 µM
100 µM
Combination samples
PRE 5µg/mL + ZnSO4 12.5µM
PRE 10µg/mL + ZnSO4 25µM
PRE 20µg/mL+ ZnSO4 25µM
PRE 50µg/mL + ZnSO4 50 µM
PRE 100µg/mL + ZnSO4 50 µM
PRE 100µg/mL+ ZnSO4 100 µM
Table 4-1Samples tested using the MTT assay.
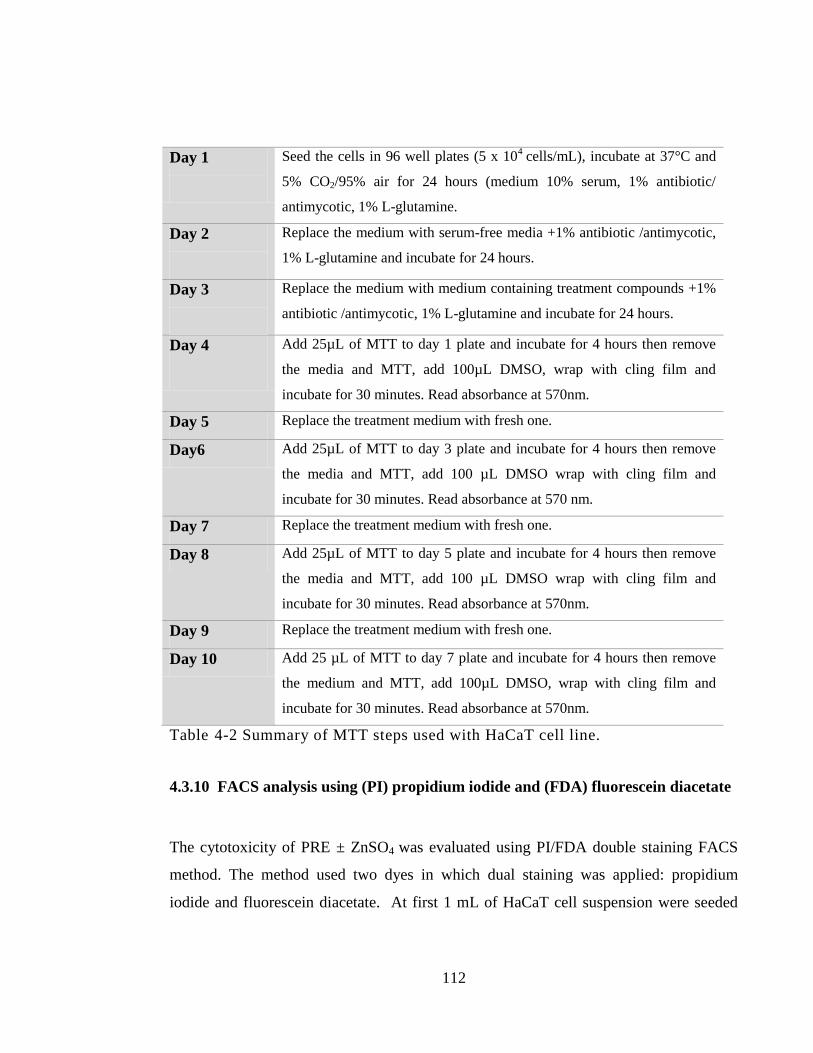
112
Day 1
Seed the cells in 96 well plates (5 x 10⁴
cells/mL), incubate at 37°C and
5% CO2/95% air for 24 hours (medium 10% serum, 1% antibiotic/
antimycotic, 1% L-glutamine.
Day 2
Replace the medium with serum-free media +1% antibiotic /antimycotic,
1% L-glutamine and incubate for 24 hours.
Day 3
Replace the medium with medium containing treatment compounds +1%
antibiotic /antimycotic, 1% L-glutamine and incubate for 24 hours.
Day 4
Add 25µL of MTT to day 1 plate and incubate for 4 hours then remove
the media and MTT, add 100µL DMSO, wrap with cling film and
incubate for 30 minutes. Read absorbance at 570nm.
Day 5 Replace the treatment medium with fresh one.
Day6 Add 25µL of MTT to day 3 plate and incubate for 4 hours then remove
the media and MTT, add 100 µL DMSO wrap with cling film and
incubate for 30 minutes. Read absorbance at 570 nm.
Day 7 Replace the treatment medium with fresh one.
Day 8 Add 25µL of MTT to day 5 plate and incubate for 4 hours then remove
the media and MTT, add 100 µL DMSO wrap with cling film and
incubate for 30 minutes. Read absorbance at 570nm.
Day 9 Replace the treatment medium with fresh one.
Day 10 Add 25 µL of MTT to day 7 plate and incubate for 4 hours then remove
the medium and MTT, add 100µL DMSO, wrap with cling film and
incubate for 30 minutes. Read absorbance at 570nm.
Table 4-2 Summary of MTT steps used with HaCaT cell line.
4.3.10 FACS analysis using (PI) propidium iodide and (FDA) fluorescein diacetate
The cytotoxicity of PRE ± ZnSO4 was evaluated using PI/FDA double staining FACS
method. The method used two dyes in which dual staining was applied: propidium
iodide and fluorescein diacetate. At first 1 mL of HaCaT cell suspension were seeded
113
using 24 well plate with cell density of 5 × 10⁴ cell per well. Culture media contained
Dulbecco’s Modified Eagle’s Medium (DMEM), 1% Antibiotic, 1% L-glutamine and
10% FCS. Then 24 well plate was incubated over night in mammalian culture incubator
at 37°C, 5% CO2/95% air. After 24 h the culture media was replace with culture media
containing tested groups of PRE ± ZnSO4. There were nine groups to be investigated in
this experiment, 6 groups of them are individual in range of concentrations and two
combination samples. Number of control groups used in this method was four including:
control group with non treated unstained cells for FACS calibration, control group with
non treated cell but stain with FDA to calibrate the cell viability, non treated cell in
which fixed with 200 μL of ethanol at first for a duration of ten minutes to cause cell
death and then non-viable cell stained with PI for PI calibration and finally non-treated
cells stained with both PI/FDA to calibrate both staining. An additional control group
was added after calibration as one of the treatment media and it was a control group with
phthalate buffer to determine the vehicle effect, stained with both dyes.
After 24 hours of treatment media exposure the supernatant of each well were collected
in eppendorfs and centrifuged at 500 g for five minute and then supernatant were
discarded. Each well was washed with PBS twice and then 200 µL trypsin/ EDTA was
added for 10 min. Then 800 µL of culture media was added to each well to stop the
trypsinaization process. Each well was collected in the corresponding Eppendorfs and
then centrifugation at 500 g for another 5 minutes. After pellet formation, the
supernatants were discarded then further wash of the cells with 1 mL of PBS and
centrifuge at 500g for 5 minutes. Gentle shaking of each Eppendorf tube with hand was
employed to loosen the formed pellet then addition of PI and FDA to each sample tube.
The dual florescent dyes were as the following; 300 µL of 10 µg/mL FDA in 00.2%
DMSO/PBS and 300 µL of 5 µg/mL PI of in PBS. Gentle mixing was applied and then
the tubes were placed on ice prior to analysis by flow cytometry (FACSCaliburTM
,
Becton Dickinson, Heidelberg, Germany) using the CELLQUESTTM
proGramme.
Analysis took place within one hour after mixing with the dyes with an excitation
114
wavelength of 490 nm and an emission wavelength of 526 nm for FDA. PI excitation
wave length at 535 nm and an emission at 617 nm for PI.
Calibration of the system was done using the four control previously detailed for
calibration purposes. Separate channels were used for the examination of each dye:
fluorescence on with FDA on FL1 channel and PI on FL3 channel; and data were
collected in log mode. Linear mode collection was employed using Forward scatter FCS
and side scatter SSD. To confirm that cell will be detected in the proper location,
adjustment of the following: Voltage, “FACS threshold”, was done in the machine. The
number of events was set to be 20000. Each treatment media and controls were done in
duplicate (n=2). The cell stained percentage with FDA/PI for tested PRE ±ZnSO4 was
calculated using the following equation:
4.3.11 Data analysis
In each test, data are expressed as means ± s.d., otherwise stated. Statistical analysis of
HaCaT cytotoxicity was carried out using One way analysis of variance (ANOVA) with
Tukey‘s post test to compare statistical significances between groups and or One way
analysis of variance (ANOVA) with post-test Dunnett analysis to compare groups
against the control. Results were expressed as significant and very significant with p <
0.05 and p < 0.01 respectively. The analysis was carried out using InStat for windows,
version 7.0 (GraphPad Software Inc, San Diego, CA).
115
4.4 Results
4.4.1 Cell growth study
The cell growth cycle consists of four stages or phases: the first one is the lag phase
where the cells normally grow in size rather than in the number. The second phase is the
log or exponential phase, where cell division actually takes place and cells grow in
number until a certain confluence is reached - normally from 80 to 100 % confluence.
This phase is the typical phase for passaging cells (cell splitting) where cells are highly
proliferative and in a viable state. Cell culture experiments typically take place in the log
phase were 80% of cell confluence is reached. The log phase time period is highly
dependent on the cell culture type and cell seeding density. After the log phase, the
plateau or stationary phase starts and it starts with slowing down of the proliferation rate
because of the overcrowded cell density natural progress of the cell cycle leads to the
final stage which is cell death, where decline number of viable cells happened.
In the cell growth study, Figure 4-2 shows the curve of the log number of cell against the
time in hours. The three stages of cell growth cycle were identified and labelled. The
data obtained from the log phase were plotted in linear regression curve as shown in
Figure 4-3. The lag phase was calculated by the linear regression equation and
extrapolating of the linear regression line to reach the seeding density at the y-axis. The
lag phase took approximately 25 hours and the log phase lasts nearly four days.
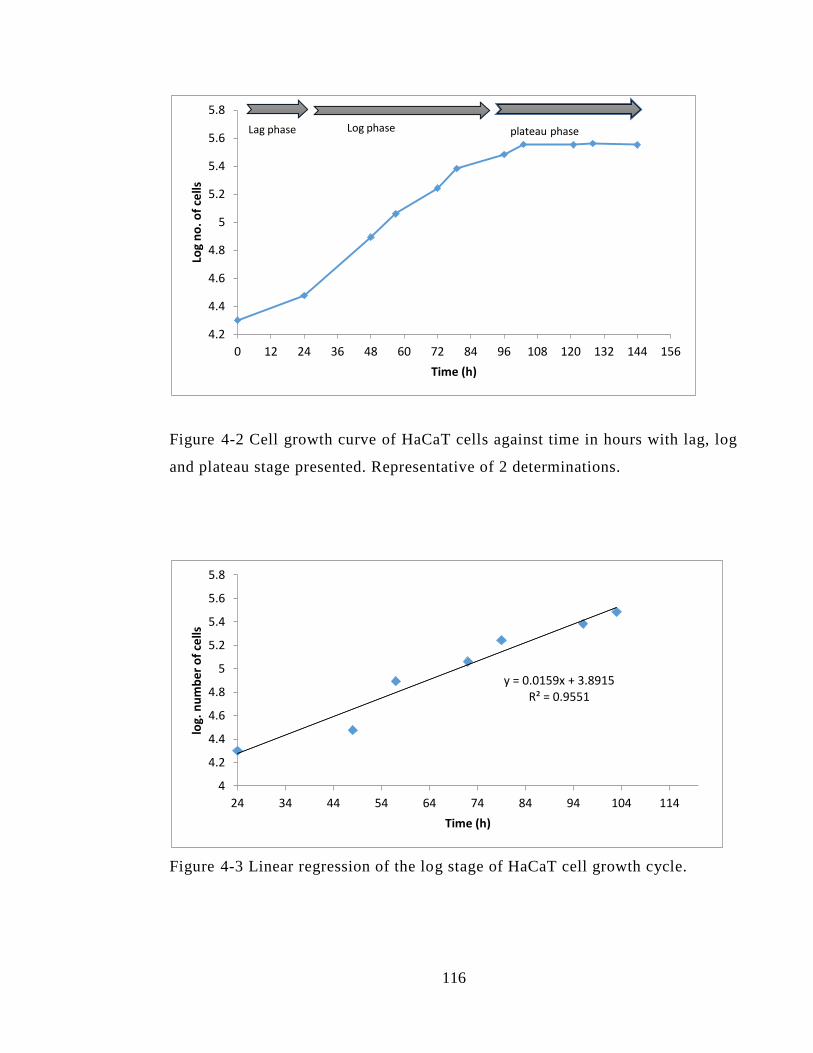
116
Figure 4-2 Cell growth curve of HaCaT cells against time in hours with lag, log
and plateau stage presented. Representative of 2 determinations.
Figure 4-3 Linear regression of the log stage of HaCaT cell growth cycle.
4.2
4.4
4.6
4.8
5
5.2
5.4
5.6
5.8
0 12 24 36 48 60 72 84 96 108 120 132 144 156
Log
no
. of
cells
Time (h)
Lag phase Log phase plateau phase
y = 0.0159x + 3.8915 R² = 0.9551
4
4.2
4.4
4.6
4.8
5
5.2
5.4
5.6
5.8
24 34 44 54 64 74 84 94 104 114
log.
nu
mb
er
of
cells
Time (h)
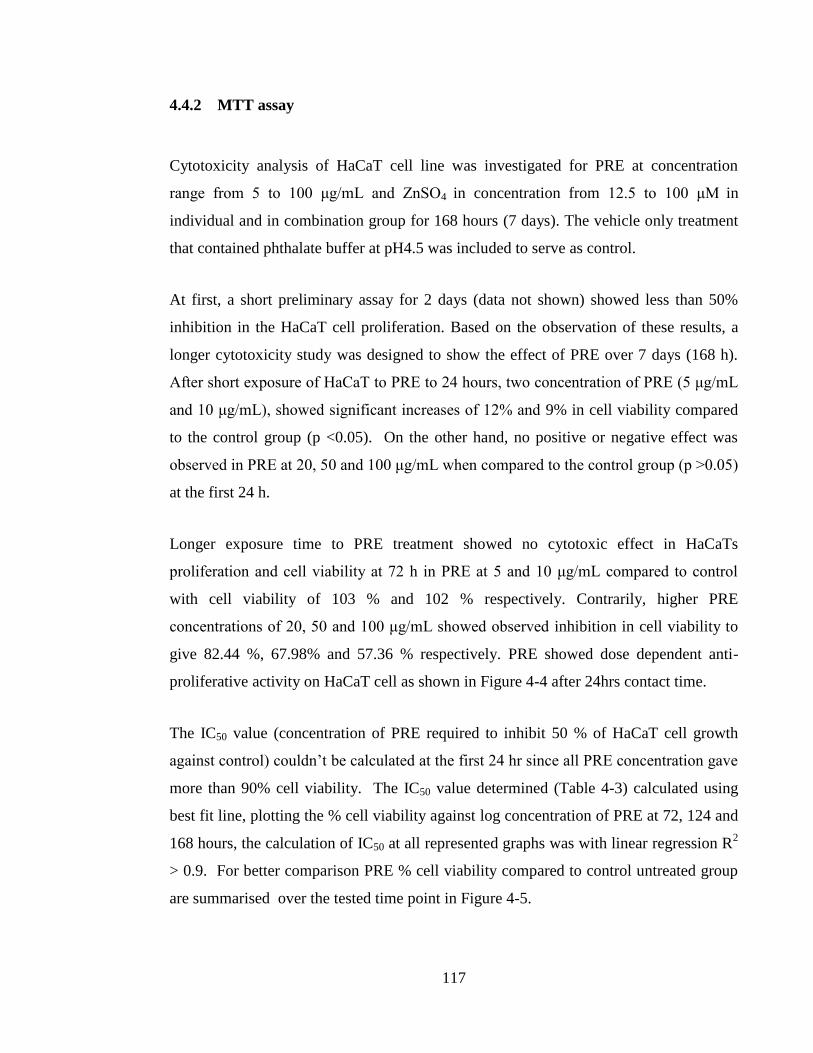
117
4.4.2 MTT assay
Cytotoxicity analysis of HaCaT cell line was investigated for PRE at concentration
range from 5 to 100 μg/mL and ZnSO4 in concentration from 12.5 to 100 μM in
individual and in combination group for 168 hours (7 days). The vehicle only treatment
that contained phthalate buffer at pH4.5 was included to serve as control.
At first, a short preliminary assay for 2 days (data not shown) showed less than 50%
inhibition in the HaCaT cell proliferation. Based on the observation of these results, a
longer cytotoxicity study was designed to show the effect of PRE over 7 days (168 h).
After short exposure of HaCaT to PRE to 24 hours, two concentration of PRE (5 μg/mL
and 10 μg/mL), showed significant increases of 12% and 9% in cell viability compared
to the control group (p <0.05). On the other hand, no positive or negative effect was
observed in PRE at 20, 50 and 100 μg/mL when compared to the control group (p >0.05)
at the first 24 h.
Longer exposure time to PRE treatment showed no cytotoxic effect in HaCaTs
proliferation and cell viability at 72 h in PRE at 5 and 10 μg/mL compared to control
with cell viability of 103 % and 102 % respectively. Contrarily, higher PRE
concentrations of 20, 50 and 100 μg/mL showed observed inhibition in cell viability to
give 82.44 %, 67.98% and 57.36 % respectively. PRE showed dose dependent anti-
proliferative activity on HaCaT cell as shown in Figure 4-4 after 24hrs contact time.
The IC50 value (concentration of PRE required to inhibit 50 % of HaCaT cell growth
against control) couldn’t be calculated at the first 24 hr since all PRE concentration gave
more than 90% cell viability. The IC50 value determined (Table 4-3) calculated using
best fit line, plotting the % cell viability against log concentration of PRE at 72, 124 and
168 hours, the calculation of IC50 at all represented graphs was with linear regression R2
> 0.9. For better comparison PRE % cell viability compared to control untreated group
are summarised over the tested time point in Figure 4-5.
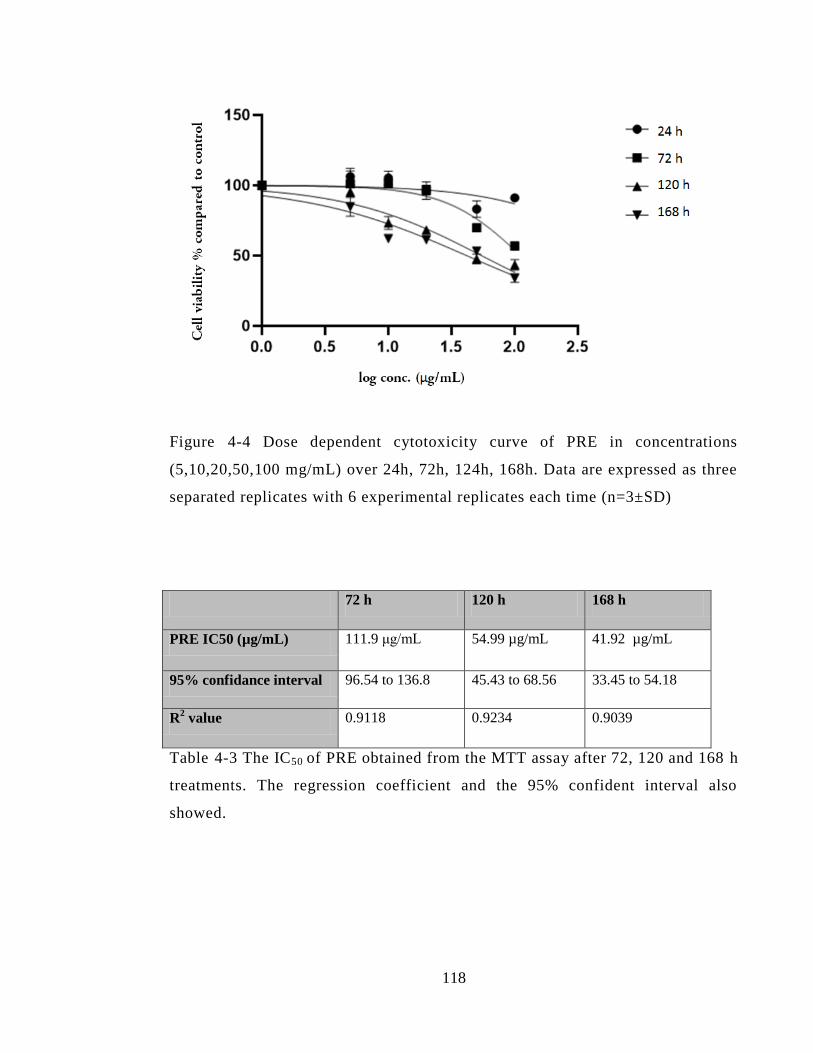
118
Figure 4-4 Dose dependent cytotoxicity curve of PRE in concentrations
(5,10,20,50,100 mg/mL) over 24h, 72h, 124h, 168h. Data are expressed as three
separated replicates with 6 experimental replicates each time (n=3±SD)
72 h 120 h 168 h
PRE IC50 (µg/mL) 111.9 μg/mL 54.99 µg/mL 41.92 µg/mL
95% confidance interval 96.54 to 136.8 45.43 to 68.56 33.45 to 54.18
R2 value 0.9118 0.9234 0.9039
Table 4-3 The IC50 of PRE obtained from the MTT assay after 72, 120 and 168 h
treatments. The regression coefficient and the 95% confident interval also
showed.
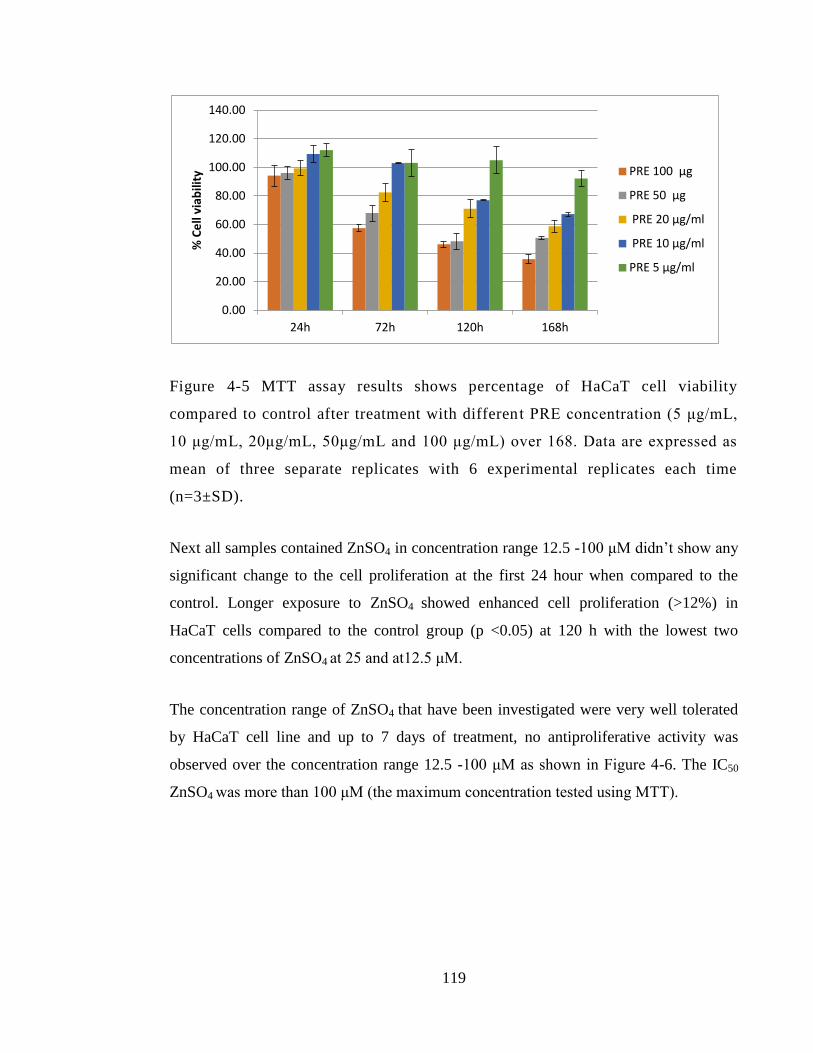
119
Figure 4-5 MTT assay results shows percentage of HaCaT cell viability
compared to control after treatment with differen t PRE concentration (5 μg/mL,
10 μg/mL, 20μg/mL, 50μg/mL and 100 μg/mL) over 168. Data are expressed as
mean of three separate replicates with 6 experimental replicates each time
(n=3±SD).
Next all samples contained ZnSO4 in concentration range 12.5 -100 μM didn’t show any
significant change to the cell proliferation at the first 24 hour when compared to the
control. Longer exposure to ZnSO4 showed enhanced cell proliferation (>12%) in
HaCaT cells compared to the control group (p <0.05) at 120 h with the lowest two
concentrations of ZnSO4 at 25 and at12.5 μM.
The concentration range of ZnSO4 that have been investigated were very well tolerated
by HaCaT cell line and up to 7 days of treatment, no antiproliferative activity was
observed over the concentration range 12.5 -100 μM as shown in Figure 4-6. The IC50
ZnSO4 was more than 100 μM (the maximum concentration tested using MTT).
0.00
20.00
40.00
60.00
80.00
100.00
120.00
140.00
24h 72h 120h 168h
% C
ell
viab
ility
PRE 100 µg
PRE 50 µg
PRE 20 µg/ml
PRE 10 µg/ml
PRE 5 µg/ml
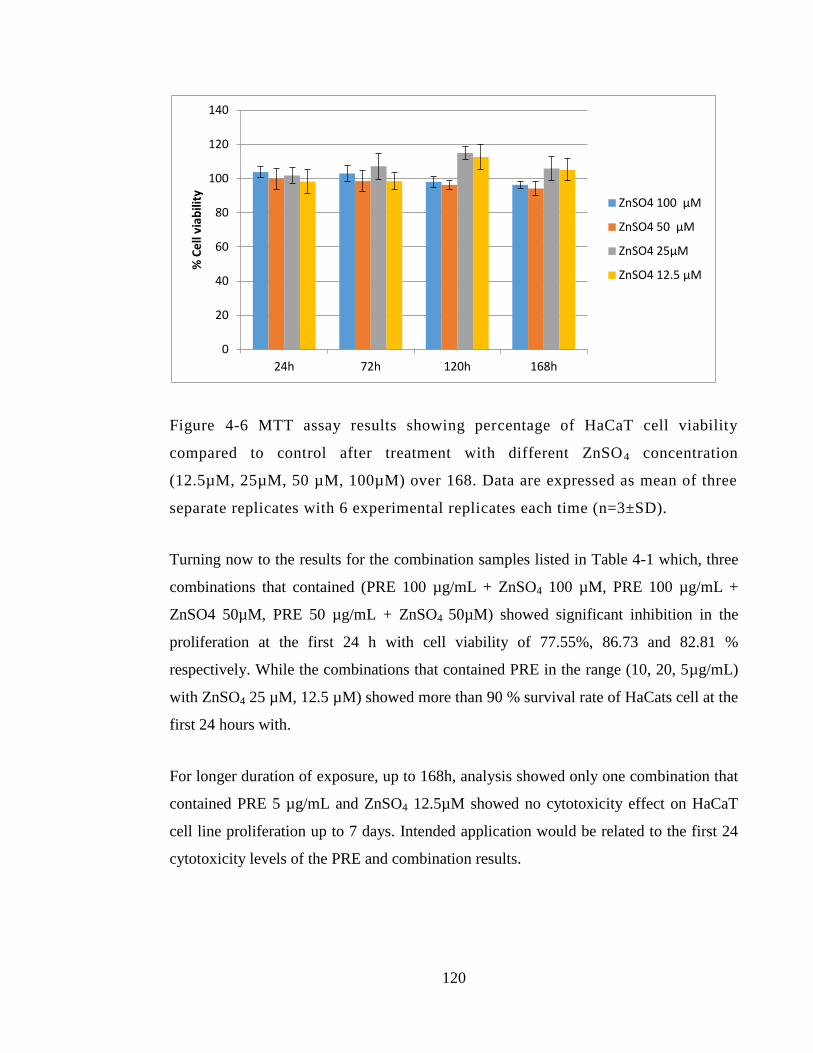
120
Figure 4-6 MTT assay results showing percentage of HaCaT cell viability
compared to control after treatment with different ZnSO4 concentration
(12.5µM, 25µM, 50 µM, 100µM) over 168. Data are expressed as mean of three
separate replicates with 6 experimental replicates each time (n=3±SD).
Turning now to the results for the combination samples listed in Table 4-1 which, three
combinations that contained (PRE 100 µg/mL + ZnSO4 100 µM, PRE 100 µg/mL +
ZnSO4 50µM, PRE 50 µg/mL + ZnSO4 50µM) showed significant inhibition in the
proliferation at the first 24 h with cell viability of 77.55%, 86.73 and 82.81 %
respectively. While the combinations that contained PRE in the range (10, 20, 5µg/mL)
with ZnSO4 25 µM, 12.5 µM) showed more than 90 % survival rate of HaCats cell at the
first 24 hours with.
For longer duration of exposure, up to 168h, analysis showed only one combination that
contained PRE 5 µg/mL and ZnSO4 12.5µM showed no cytotoxicity effect on HaCaT
cell line proliferation up to 7 days. Intended application would be related to the first 24
cytotoxicity levels of the PRE and combination results.
0
20
40
60
80
100
120
140
24h 72h 120h 168h
% C
ell
viab
ility
ZnSO4 100 µM
ZnSO4 50 µM
ZnSO4 25µM
ZnSO4 12.5 µM
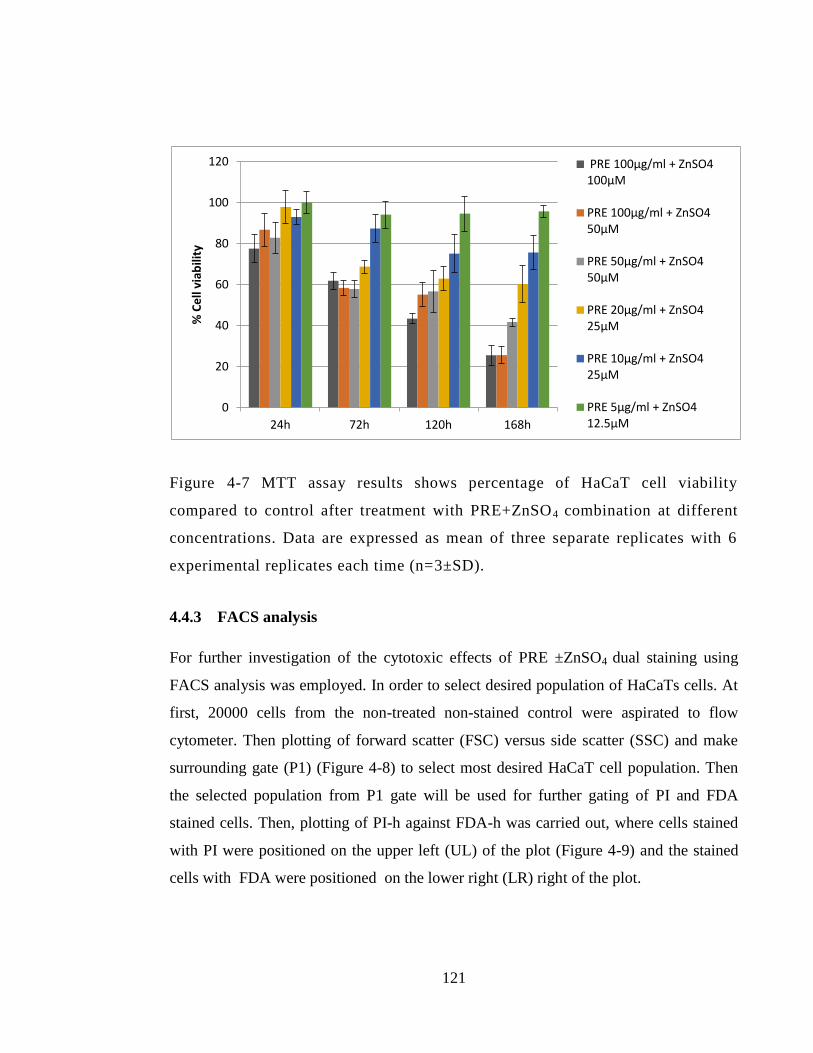
121
Figure 4-7 MTT assay results shows percentage of HaCaT cell viability
compared to control after treatment with PRE+ZnSO4 combination at different
concentrations. Data are expressed as mean of three separate replicates with 6
experimental replicates each time (n=3±SD).
4.4.3 FACS analysis
For further investigation of the cytotoxic effects of PRE ±ZnSO4 dual staining using
FACS analysis was employed. In order to select desired population of HaCaTs cells. At
first, 20000 cells from the non-treated non-stained control were aspirated to flow
cytometer. Then plotting of forward scatter (FSC) versus side scatter (SSC) and make
surrounding gate (P1) (Figure 4-8) to select most desired HaCaT cell population. Then
the selected population from P1 gate will be used for further gating of PI and FDA
stained cells. Then, plotting of PI-h against FDA-h was carried out, where cells stained
with PI were positioned on the upper left (UL) of the plot (Figure 4-9) and the stained
cells with FDA were positioned on the lower right (LR) right of the plot.
0
20
40
60
80
100
120
24h 72h 120h 168h
% C
ell
viab
ility
PRE 100µg/ml + ZnSO4 100µM
PRE 100µg/ml + ZnSO4 50µM
PRE 50µg/ml + ZnSO4 50µM
PRE 20µg/ml + ZnSO4 25µM
PRE 10µg/ml + ZnSO4 25µM
PRE 5µg/ml + ZnSO4 12.5µM
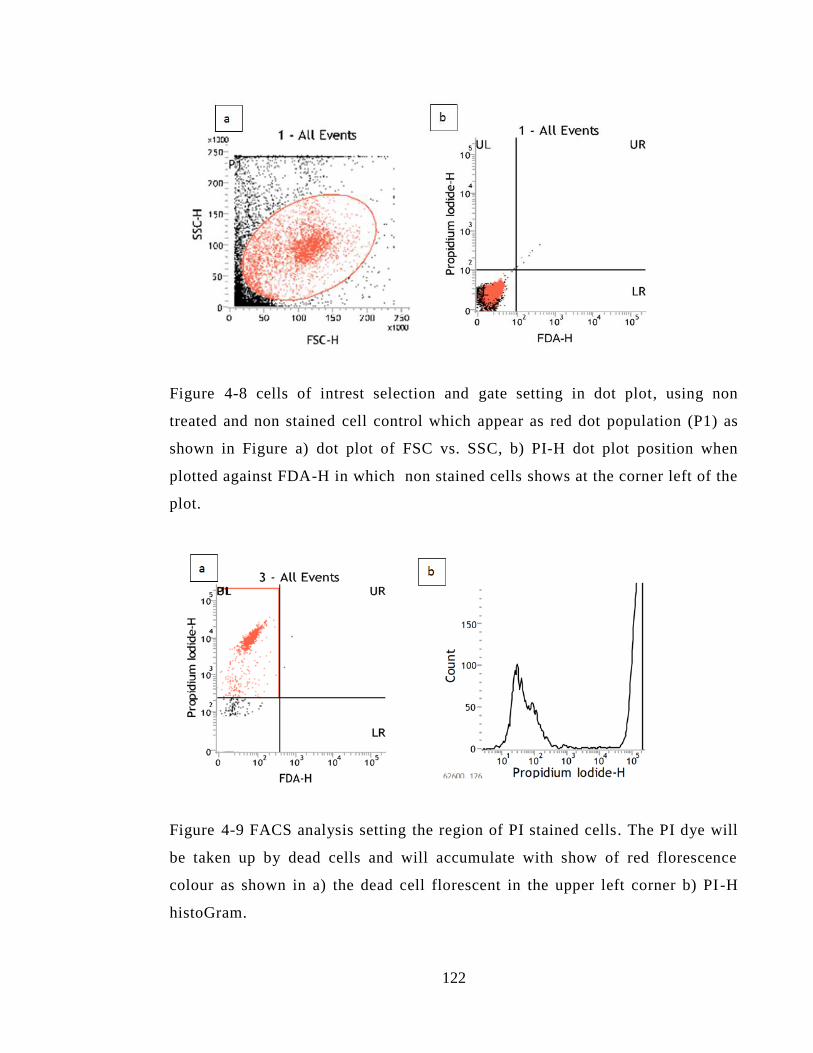
122
Figure 4-8 cells of intrest selection and gate setting in dot plot, using non
treated and non stained cell control which appear as red dot population (P1) as
shown in Figure a) dot plot of FSC vs. SSC, b) PI-H dot plot position when
plotted against FDA-H in which non stained cells shows at the corner left of the
plot.
Figure 4-9 FACS analysis setting the region of PI stained cells. The PI dye will
be taken up by dead cells and will accumulate with show of red florescence
colour as shown in a) the dead cell florescent in the upper left corner b) PI -H
histoGram.
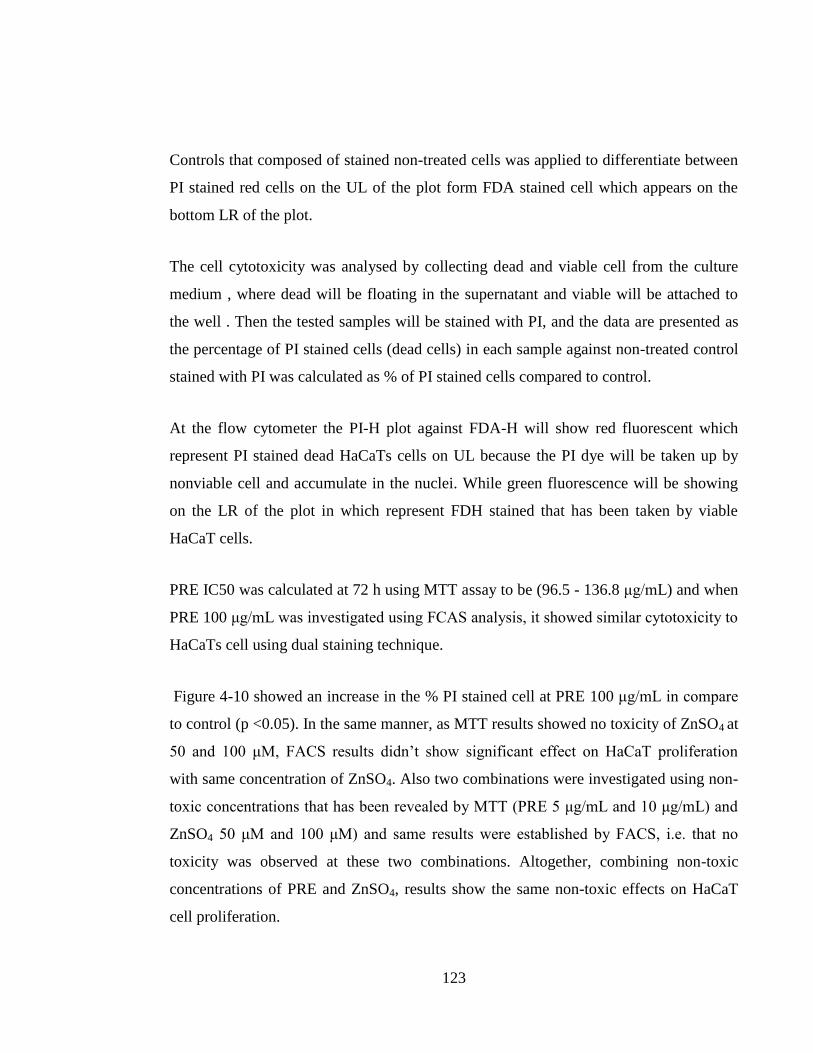
123
Controls that composed of stained non-treated cells was applied to differentiate between
PI stained red cells on the UL of the plot form FDA stained cell which appears on the
bottom LR of the plot.
The cell cytotoxicity was analysed by collecting dead and viable cell from the culture
medium , where dead will be floating in the supernatant and viable will be attached to
the well . Then the tested samples will be stained with PI, and the data are presented as
the percentage of PI stained cells (dead cells) in each sample against non-treated control
stained with PI was calculated as % of PI stained cells compared to control.
At the flow cytometer the PI-H plot against FDA-H will show red fluorescent which
represent PI stained dead HaCaTs cells on UL because the PI dye will be taken up by
nonviable cell and accumulate in the nuclei. While green fluorescence will be showing
on the LR of the plot in which represent FDH stained that has been taken by viable
HaCaT cells.
PRE IC50 was calculated at 72 h using MTT assay to be (96.5 - 136.8 μg/mL) and when
PRE 100 μg/mL was investigated using FCAS analysis, it showed similar cytotoxicity to
HaCaTs cell using dual staining technique.
Figure 4-10 showed an increase in the % PI stained cell at PRE 100 μg/mL in compare
to control (p <0.05). In the same manner, as MTT results showed no toxicity of ZnSO4 at
50 and 100 μM, FACS results didn’t show significant effect on HaCaT proliferation
with same concentration of ZnSO4. Also two combinations were investigated using non-
toxic concentrations that has been revealed by MTT (PRE 5 μg/mL and 10 μg/mL) and
ZnSO4 50 μM and 100 μM) and same results were established by FACS, i.e. that no
toxicity was observed at these two combinations. Altogether, combining non-toxic
concentrations of PRE and ZnSO4, results show the same non-toxic effects on HaCaT
cell proliferation.
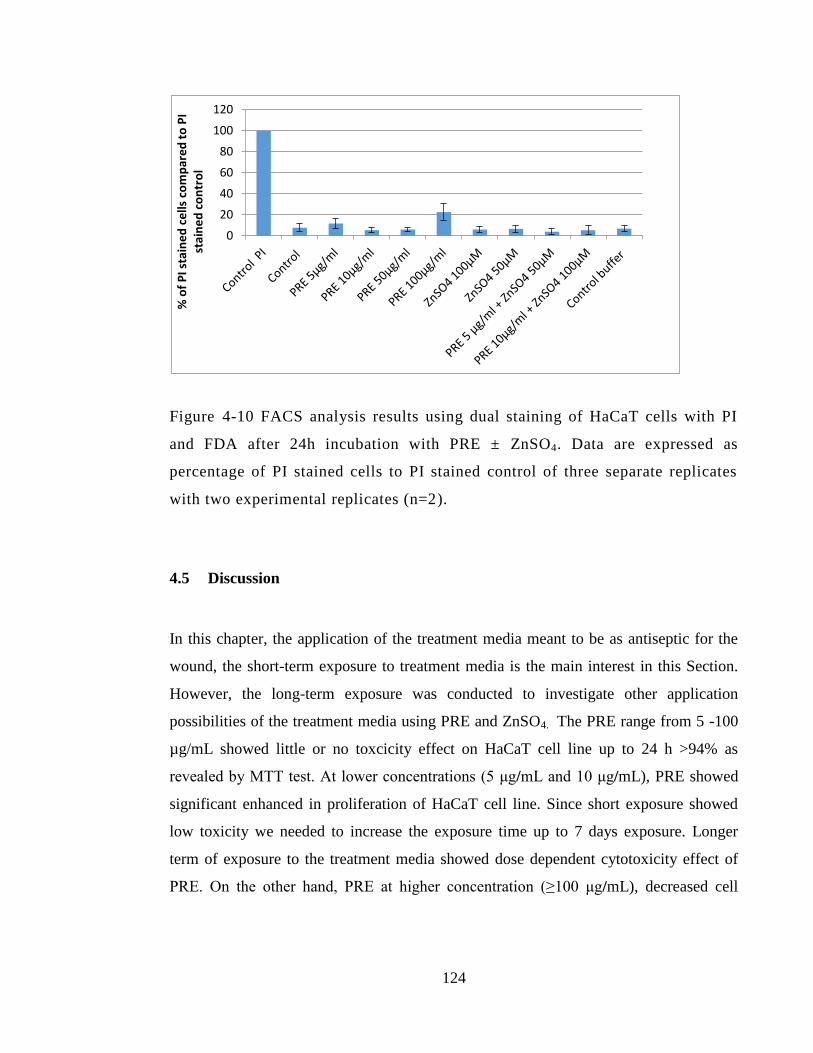
124
Figure 4-10 FACS analysis results using dual staining of HaCaT cells with PI
and FDA after 24h incubation with PRE ± ZnSO4. Data are expressed as
percentage of PI stained cells to PI stained control of three separate replicates
with two experimental replicates (n=2).
4.5 Discussion
In this chapter, the application of the treatment media meant to be as antiseptic for the
wound, the short-term exposure to treatment media is the main interest in this Section.
However, the long-term exposure was conducted to investigate other application
possibilities of the treatment media using PRE and ZnSO4. The PRE range from 5 -100
µg/mL showed little or no toxcicity effect on HaCaT cell line up to 24 h >94% as
revealed by MTT test. At lower concentrations (5 μg/mL and 10 μg/mL), PRE showed
significant enhanced in proliferation of HaCaT cell line. Since short exposure showed
low toxicity we needed to increase the exposure time up to 7 days exposure. Longer
term of exposure to the treatment media showed dose dependent cytotoxicity effect of
PRE. On the other hand, PRE at higher concentration (≥100 μg/mL), decreased cell
0
20
40
60
80
100
120
% o
f P
I sta
ine
d c
ells
co
mp
are
d t
o P
I st
ain
ed
co
ntr
ol
125
viability by as shown by FACS analysis while no toxicity was observed at 50 μg/mL and
lower concentration at 24 hours.
Several studies have investigated the cytotoxicity effect of pomegranate polyphenols
obtained from either juice, leaves, seeds or other extracts. Different pomegranate
extracts showed differences in the cytotoxicity range, depending on cell line tested and
method used. Our results showed that PRE ≥100 μg/mL was cytotoxic to HaCaT cells
and this results broadly supports the work of previous study in this area linking In vitro
antiproliferative effect of pomegranate juice on human oral, and prostate tumor cell line
(Seeram et al. 2005). This study recorded inhibition of cell viability by 30 to 100%
when treated with ‘pomegranate juice’ at concentration range from 12.5 μg/mL to 100
μg/mL on cancer cell line for 48 h. The same study highlighted that the potent effect of
total pomegranate juice showed antiproliferative and antioxidants in higher manner than
separated polyphenols obtained from pomegranate when tested alone such as isolated
punicalagin, ellagic acid and total polyphenol tannins TPT. The study concluded that
such activity could be attributed to the synergistic and or additive effect of multiple
bioactive compounds acting together with total pomegranate extract (Seeram et al.
2005). Pomegranate has been reported with selective toxicity to give >50% inhibition in
proliferation of cancer colon cell at PRE 250 μg/mL with preserved >55% of normal
colon cell viability using the same concentration of PREand exposure time of 72 hours
(Sukri et al. 2019).
Houston (2017) studied the cytotoxicity effect of ZnSO4 and PRE alone and on
combination on Vero cell line (green monkey kidney epithelial), and he found that PRE
from 100 μg /mL didn’t show any toxicity, up to 72h incubation time. Also this study
showed no toxic effect on Vero cell line when treated with ZnSO4 up to 0.1 M
concentration. The short time cytotoxicity results of our study up to 24 hours are
consistent with Houston work; however the long term exposure for the higher PRE
concentration showed significant cytotoxicity on HaCaT cell line. The different types of
cell line could be the reason why keratinocytes showed more cytotoxic effect. On the

126
same manner, recent study showed dose dependant cytotoxicity effect of pomegranate
leaves extract (PLE), concentration < 50 μg/mL was not toxic up to 24 hours contact
time. In that study, PLE was investigated in concentration range from 6.25 and up to 50
μg/mL. After 24 hours, PLE treated samples showed no or little toxicity on three
different cell line: African monkey kidney cell line (Vero), human embryonic cell line
(HEK 293) and human normal liver cell line (LO2) (Li et al. 2016). The higher PLE in
concentration ≥ 100 μg/mL, showed cell death and cytoxicity effect was documented.
The mechanism of action at which high dose of pomegranate rind extract induced
cytotoxicity has not been fully revealed yet. Li et al. (2016) found that pomegranate
leave extract decreased mitochondrial membrane potential and thus induce apoptosis in
cell via mitochondria- mediated apoptic pathway and cell cycle arrest.
In our results, the cytotoxicity study revealed that HaCaT cells tolerated ZnSO4 at
various concentrations (12.5, 20, 50 and 100 µM) and no toxic effect was observed
during 7 days exposure time. ZnSO4 at 25 and 12.5 μM showed significant increase (p
<0.05) in proliferation of HaCaT viability by more than 12% when compared to control
group at 120 h. When comparing the individual results of our study, ZnSO4 individual
samples are in line with a previous study that showed ZnSO4 14 μM showed better
proliferation of HaCaT cells when compared to untreated keratinocytes cells (Deter et al.
2003) which was an in-vitro study to investigate two different salts of zinc and its effect
on the proliferative activity and physiological function on human keratinocytes. The
concentration of zinc was set to be 14 μM of zinc histidine and ZnSO4 which was
selected according to the average serum zinc concentration. Proliferation activity of
HaCaT cells increased in the zinc-containing groups in comparison to the control group
after nine days of incubation. Further investigation, reported no cytotoxic effect was
observed in zinc containing groups when tested by MTT and LDH assay. A previous
study reported by Ågren et al. (1991) revealed that concentrations of ZnSO4 up to
100μM showed no negative effect on the cell proliferation compared to control.
127
For the PRE/Zn combination, our results showed that using combination of non-toxic
level of PRE with non-toxic level of ZnSO4 resulted in non-toxic combined effect on
HaCaT cell line. Enhanced proliferation observed with PRE 5 μg/mL and ZnSO4 12.5
μM in individual samples was maintained within the first 24 hours.
As shown in Chapter 3, antibacterial synergy of PRE/Zn with MIC levels (62.5 μg/mL +
1600 μM) against MRSA and (31.25 μg/mL + 400 μM) against S. epidermidis. At these
levels, no significant toxicity was observed up to 24h. No toxic effect was recorded of
Zn(II) up to 100μM over 7 days exposure time. Previous data was reported by Houston
(2011) also showed that ZnSO4 up to 0.1 M didn’t show significant toxicity on Vero
epithelial cell viability up to 72h.
4.6 Conclusion
PRE with and without ZnSO4 was investigated for cytotoxicity on HaCaT cell line using
2 methods. The results showed:
MTT testing showed that PRE at 5 and up to 100 μg/mL showed no toxic effect
and enhanced cell growth was observed with PRE 5 and 10 μg/mL at 24h
exposure time.
Longer exposure, up to 7 days, showed concentration-dependant cytotoxicity at
PRE > 10 μg/mL.
FACS analysis showed that PRE at 50 μg/mL and lower concentrations, showed
no significant inhibition in cell viability (p <0.05), while PRE ≥100 μg/mL did
show some cytotoxic effects.
Zn(II) in the concentration range 12.5-100 μM showed no cytotoxcity by MTT
and FACS analysis up to 24 h. Longer exposure to ZnSO4 showed enhanced cell
128
proliferation (>12%) in HaCaT cells compared to the control group (p <0.05) at
120 h with the ZnSO4 at 25 and 12.5 μM.
When PRE in the range (10, 20 and 5 µg/mL) was added to ZnSO4 (25µM, 12.5
µM), the survival level was > 90% over the first 24 hours.
These results are highly encouraging and support the development of a formulation of
PRE and Zn(II) to be used as antiseptic application for chronic or acute wounds. In the
next Chapter, in vitro effects of PRE/Zn are investigated in the scratch wound model.
129
Chapter 5: Effect of PRE and Zn(II) on cell
migration and wound closure in HaCaT
cell cultures
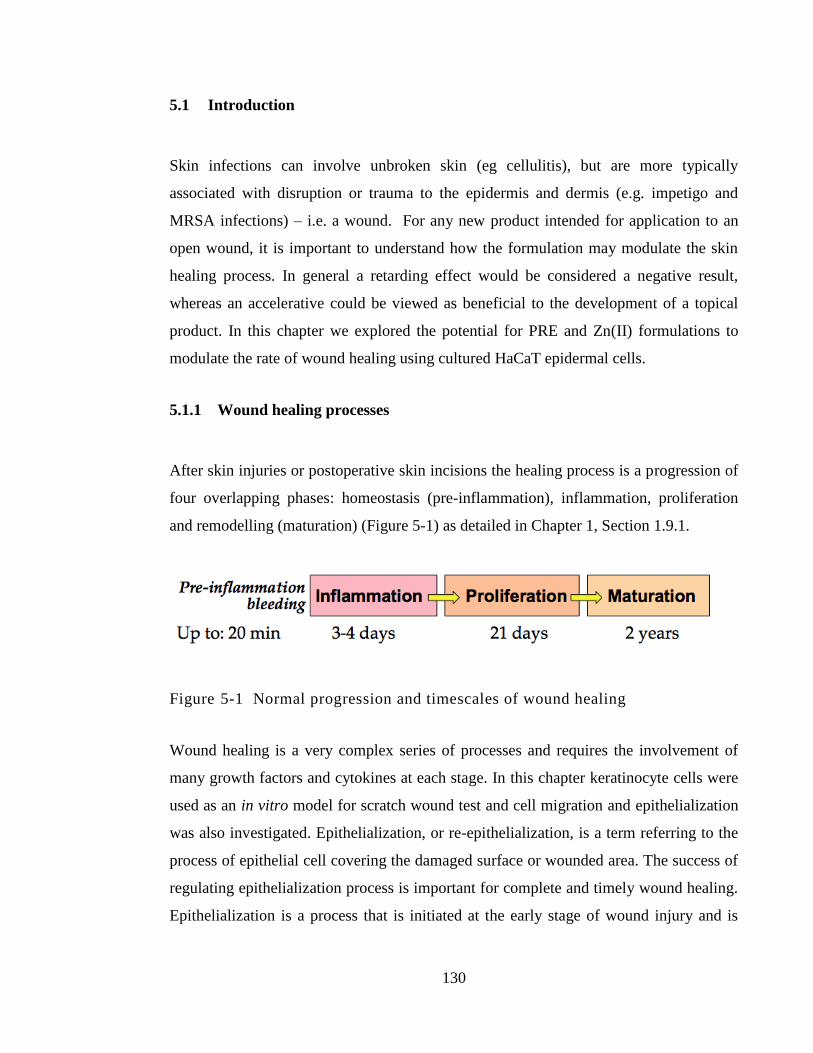
130
5.1 Introduction
Skin infections can involve unbroken skin (eg cellulitis), but are more typically
associated with disruption or trauma to the epidermis and dermis (e.g. impetigo and
MRSA infections) – i.e. a wound. For any new product intended for application to an
open wound, it is important to understand how the formulation may modulate the skin
healing process. In general a retarding effect would be considered a negative result,
whereas an accelerative could be viewed as beneficial to the development of a topical
product. In this chapter we explored the potential for PRE and Zn(II) formulations to
modulate the rate of wound healing using cultured HaCaT epidermal cells.
5.1.1 Wound healing processes
After skin injuries or postoperative skin incisions the healing process is a progression of
four overlapping phases: homeostasis (pre-inflammation), inflammation, proliferation
and remodelling (maturation) (Figure 5-1) as detailed in Chapter 1, Section 1.9.1.
Figure 5-1 Normal progression and timescales of wound healing
Wound healing is a very complex series of processes and requires the involvement of
many growth factors and cytokines at each stage. In this chapter keratinocyte cells were
used as an in vitro model for scratch wound test and cell migration and epithelialization
was also investigated. Epithelialization, or re-epithelialization, is a term referring to the
process of epithelial cell covering the damaged surface or wounded area. The success of
regulating epithelialization process is important for complete and timely wound healing.
Epithelialization is a process that is initiated at the early stage of wound injury and is
131
highly dependent on complicated signal integration that synchronises the cellular
processes, regulated by chemokines, cytokines, growth factors integrins, keratins, matrix
metalloproteinases (MMPs) (Pastar et al. 2014). First cell migration of epidermis
keratinocyte cell in which the cells at the edges of wound will migrate to the inner side
via freshly formed matrix. First, keratinocyte migration process is stimulated and
regulated by epidermal growth factors HB-EGF, EFG and TGF-α that act as direct
stimulants for the migration process. The movement of keratinocytes to the newly
formed extracellular matrix ECM is also promoted by metalloproteinases MMPs
enzyme. Regulation between the MMPs enzymes and tissue inhibitor metalloproteinases
(TIMPs) ratio must be achieved through epithelialization process since imbalance
between those enzymes could lead to chronic wound formation. The second important
cellular activity involved in epithelialization is keratinocyte proliferation. The
proliferation of keratinocytes is directly stimulated by same growth factors mentioned
earlier HB-EGF, EGF and TGF-α in addition to other insulin-like growth factors (IGF)-1
and other factors including components of ECM and integrins. MMPs enzymes that
present in the ECM can release the growth factor from wound site matrix by the
proteolytic activity. In addition MMPs can convert inactive forms of growth factors to
the active form such as (IGF-1). The growth factor receptor pathway can be activated by
the action of ECM and integrins together to give more functional activity of these
growth factors. The stimulation of keratinocyte proliferation by combined effect of
MMPs, ECM, integrins and growth factors will continue till fully epithelial layer is
formed and the activated proliferation state stimulant will be decrease and the pathway
will return to the normal differentiation state (Leigh 1995; Pastar et al. 2014; Barrientos
et al, 2008; Harper et al. 2014; Frykberg and Banks, 2015).
5.1.2 Wounds and chronic wounds
Chronic wounds can be defined as those that fail to progress from the proliferation phase
to the remodelling phase in a timely manner. Overall, acute or chronic wounds can be a
huge economical burden on that affects the health system since it has been estimated that
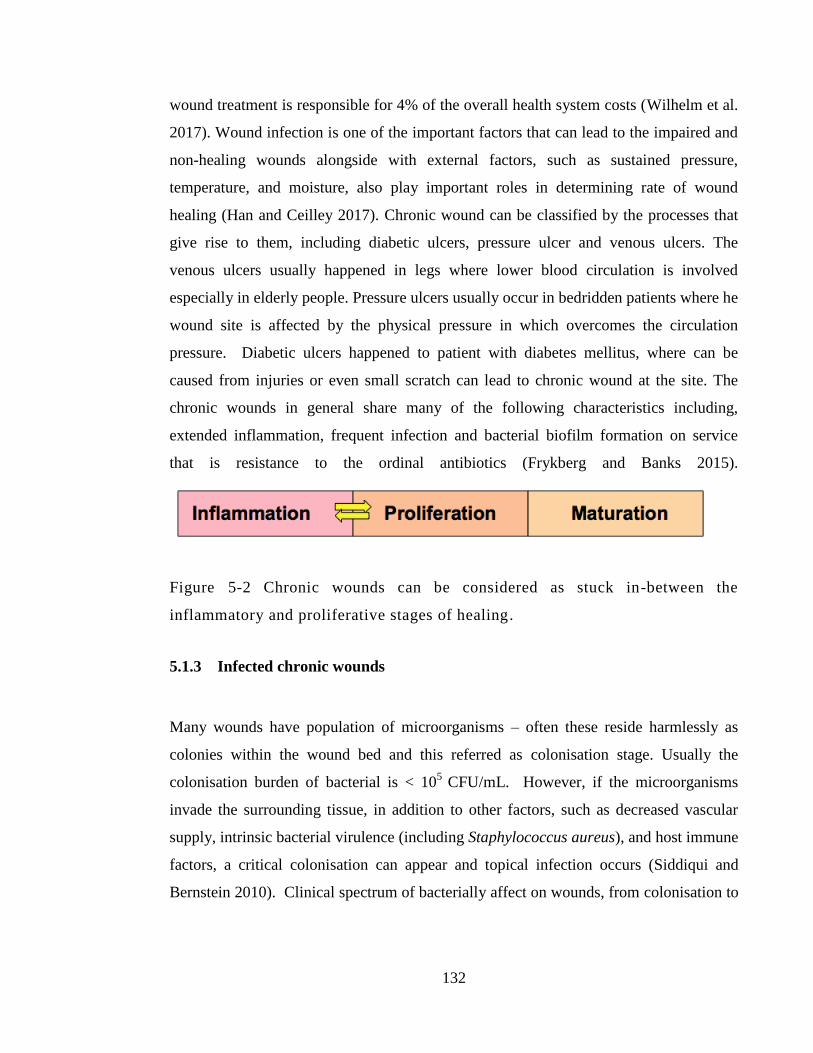
132
wound treatment is responsible for 4% of the overall health system costs (Wilhelm et al.
2017). Wound infection is one of the important factors that can lead to the impaired and
non-healing wounds alongside with external factors, such as sustained pressure,
temperature, and moisture, also play important roles in determining rate of wound
healing (Han and Ceilley 2017). Chronic wound can be classified by the processes that
give rise to them, including diabetic ulcers, pressure ulcer and venous ulcers. The
venous ulcers usually happened in legs where lower blood circulation is involved
especially in elderly people. Pressure ulcers usually occur in bedridden patients where he
wound site is affected by the physical pressure in which overcomes the circulation
pressure. Diabetic ulcers happened to patient with diabetes mellitus, where can be
caused from injuries or even small scratch can lead to chronic wound at the site. The
chronic wounds in general share many of the following characteristics including,
extended inflammation, frequent infection and bacterial biofilm formation on service
that is resistance to the ordinal antibiotics (Frykberg and Banks 2015).
Figure 5-2 Chronic wounds can be considered as stuck in-between the
inflammatory and proliferative stages of healing.
5.1.3 Infected chronic wounds
Many wounds have population of microorganisms – often these reside harmlessly as
colonies within the wound bed and this referred as colonisation stage. Usually the
colonisation burden of bacterial is < 105
CFU/mL. However, if the microorganisms
invade the surrounding tissue, in addition to other factors, such as decreased vascular
supply, intrinsic bacterial virulence (including Staphylococcus aureus), and host immune
factors, a critical colonisation can appear and topical infection occurs (Siddiqui and
Bernstein 2010). Clinical spectrum of bacterially affect on wounds, from colonisation to
133
infection, was previously detailed in chapter 1, Section 1.9.3. Infection of wounds is
known to retard the healing process.
Generally, there has been the suggestion that wound chronicity starts with a persistent
bacterial level in tissue, in particular the production of endotoxins and competing with
normal healing cells on the nutrition and oxygen resourced. According to Konturek et al.
(2001) and Power et al. (2001) this results in the protracted elevation of cytokines that
are pro-inflammatory such as tumour necrosis growth factor-α and interleukin-1).
Robson et al. (1990) assert that this condition subsequently leads to an augmented
amount of matrix MMPs, together with a decreased amount of their inhibitors of tissue
TIMPS, and a reduction in the growth factor production (Tarnuzzer and Schultz 1996).
A normal element of the process of wound healing is inflammation; however the process
of repair is prolonged if there is an excessive inflammatory response (Ladwig et al.
2002; Bucknall, 1980). Wounds infected with antibiotic resistant bacteria pose a
growing threat, in particular ciprofloxacin-resistant Pseudomonas aeruginosa and
Methicillin-resistant Staphylococcus aureus MRSA.
5.1.4 Modulation of wound healing time
Many factors are involved in determining the time it takes for a wound to heal. Adverse
effects and delayed wound healing can happen if the patient suffers from diabetes, renal
failure, immunodeficiency, malnutrition and infection. During the wound healing,
regulation of growth factors, cytokines and MMPs and other cellular components are
essential for successful wound to heal. Wound healing time could be severely altered
when one or more of these components is disrupted (Thiruvoth 2015). Impact of
bacterial infection on different stages of wound healing process including; inflammation,
formation of tissue granulation, production of collagen and epithelialization process has
been previously detailed in Section 1.9.3.1.
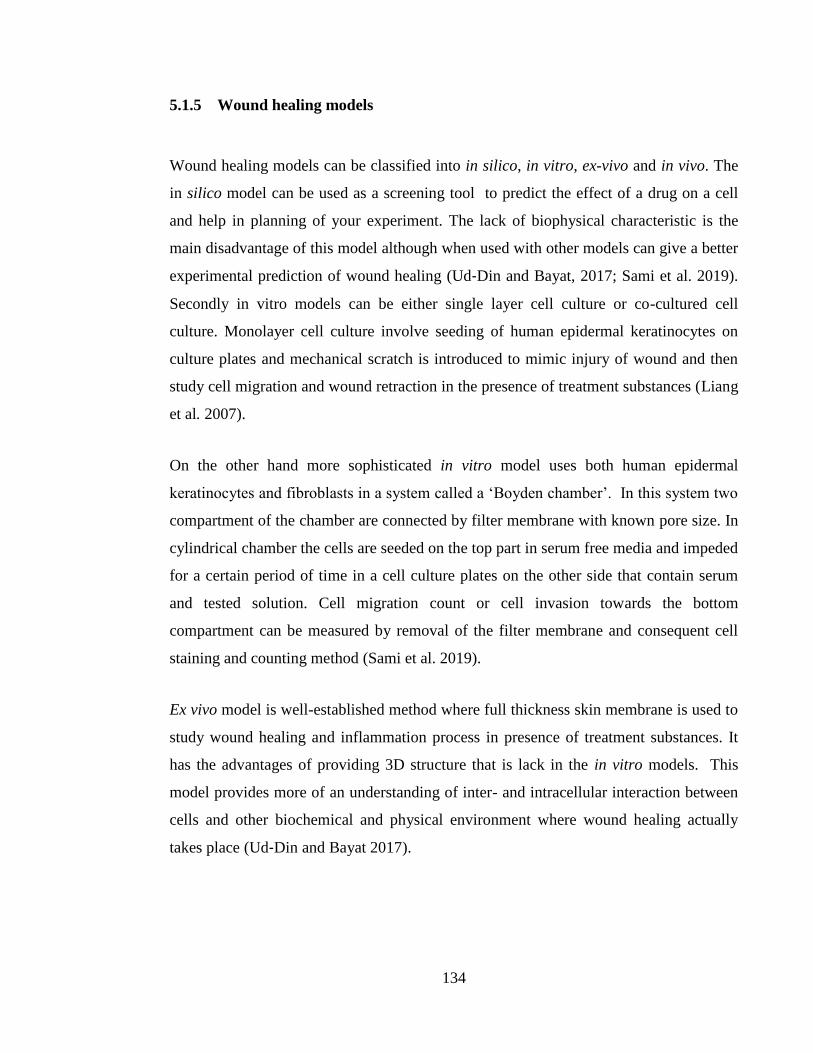
134
5.1.5 Wound healing models
Wound healing models can be classified into in silico, in vitro, ex-vivo and in vivo. The
in silico model can be used as a screening tool to predict the effect of a drug on a cell
and help in planning of your experiment. The lack of biophysical characteristic is the
main disadvantage of this model although when used with other models can give a better
experimental prediction of wound healing (Ud‐Din and Bayat, 2017; Sami et al. 2019).
Secondly in vitro models can be either single layer cell culture or co-cultured cell
culture. Monolayer cell culture involve seeding of human epidermal keratinocytes on
culture plates and mechanical scratch is introduced to mimic injury of wound and then
study cell migration and wound retraction in the presence of treatment substances (Liang
et al. 2007).
On the other hand more sophisticated in vitro model uses both human epidermal
keratinocytes and fibroblasts in a system called a ‘Boyden chamber’. In this system two
compartment of the chamber are connected by filter membrane with known pore size. In
cylindrical chamber the cells are seeded on the top part in serum free media and impeded
for a certain period of time in a cell culture plates on the other side that contain serum
and tested solution. Cell migration count or cell invasion towards the bottom
compartment can be measured by removal of the filter membrane and consequent cell
staining and counting method (Sami et al. 2019).
Ex vivo model is well-established method where full thickness skin membrane is used to
study wound healing and inflammation process in presence of treatment substances. It
has the advantages of providing 3D structure that is lack in the in vitro models. This
model provides more of an understanding of inter- and intracellular interaction between
cells and other biochemical and physical environment where wound healing actually
takes place (Ud‐Din and Bayat 2017).
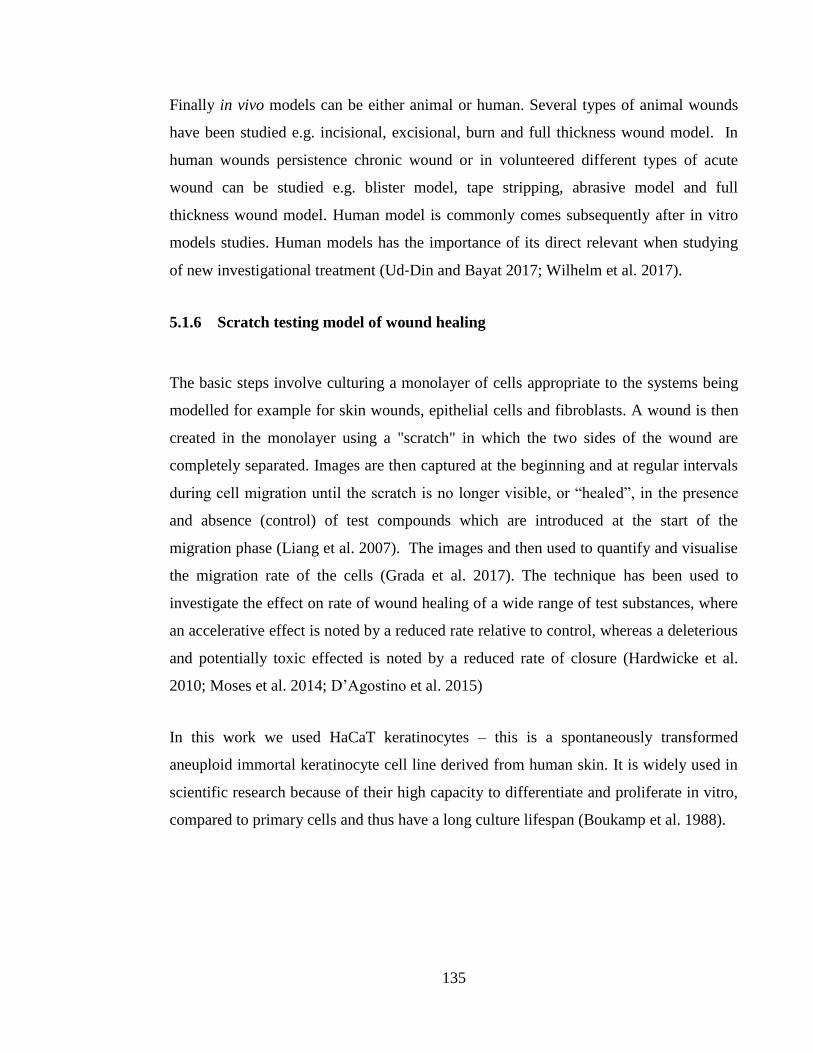
135
Finally in vivo models can be either animal or human. Several types of animal wounds
have been studied e.g. incisional, excisional, burn and full thickness wound model. In
human wounds persistence chronic wound or in volunteered different types of acute
wound can be studied e.g. blister model, tape stripping, abrasive model and full
thickness wound model. Human model is commonly comes subsequently after in vitro
models studies. Human models has the importance of its direct relevant when studying
of new investigational treatment (Ud‐Din and Bayat 2017; Wilhelm et al. 2017).
5.1.6 Scratch testing model of wound healing
The basic steps involve culturing a monolayer of cells appropriate to the systems being
modelled for example for skin wounds, epithelial cells and fibroblasts. A wound is then
created in the monolayer using a "scratch" in which the two sides of the wound are
completely separated. Images are then captured at the beginning and at regular intervals
during cell migration until the scratch is no longer visible, or “healed”, in the presence
and absence (control) of test compounds which are introduced at the start of the
migration phase (Liang et al. 2007). The images and then used to quantify and visualise
the migration rate of the cells (Grada et al. 2017). The technique has been used to
investigate the effect on rate of wound healing of a wide range of test substances, where
an accelerative effect is noted by a reduced rate relative to control, whereas a deleterious
and potentially toxic effected is noted by a reduced rate of closure (Hardwicke et al.
2010; Moses et al. 2014; D’Agostino et al. 2015)
In this work we used HaCaT keratinocytes – this is a spontaneously transformed
aneuploid immortal keratinocyte cell line derived from human skin. It is widely used in
scientific research because of their high capacity to differentiate and proliferate in vitro,
compared to primary cells and thus have a long culture lifespan (Boukamp et al. 1988).
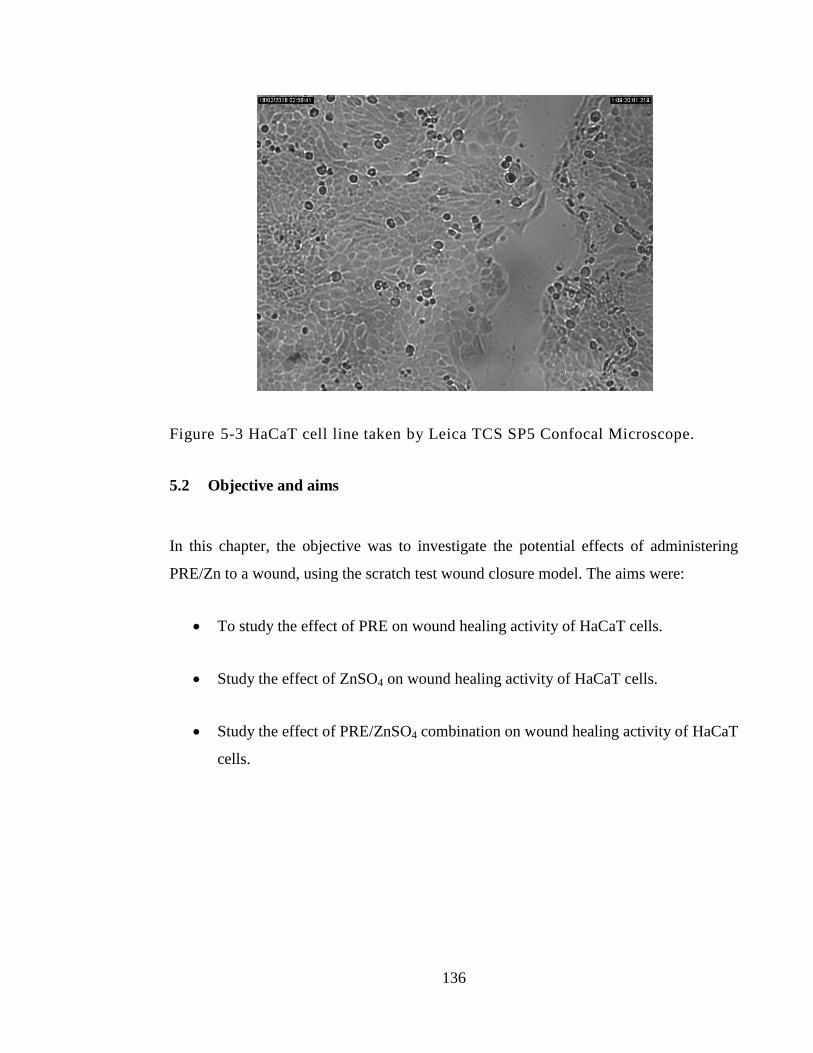
136
Figure 5-3 HaCaT cell line taken by Leica TCS SP5 Confocal Microscope.
5.2 Objective and aims
In this chapter, the objective was to investigate the potential effects of administering
PRE/Zn to a wound, using the scratch test wound closure model. The aims were:
To study the effect of PRE on wound healing activity of HaCaT cells.
Study the effect of ZnSO4 on wound healing activity of HaCaT cells.
Study the effect of PRE/ZnSO4 combination on wound healing activity of HaCaT
cells.
137
5.3 Materials and methods
5.3.1 Materials
All materials used in this chapter are detailed in Chapter 2, Section 2.1.
5.3.2 Aseptic technique
Aseptic technique was employed at all stages in cell culture methods using safety
cabinets using aseptic methods for routinely cleaning and autoclaving of material
previously detailed in Chapter 2, Section 2.2.5.1.
5.3.3 Human adult, spontaneously immortalized, epidermal keratinocytes
(HaCaT cells)
Human adult, spontaneously immortalized, epidermal keratinocytes (HaCaT cells) were
provided by Dr. Ryan Moseley and Rachael Moses (Wound Biology Group, Tissue
Engineering & Reparative Dentistry, School of Dentistry, Cardiff University). Details of
the cell culture techniques may be found in Chapter 2, Section 2.2.5.
5.3.4 Culture media preparation
The culture media composed of (Dulbecco’s Modified Eagle’s Medium (DMEM) + 10%
foetal calf serum media + 1% antibiotic/ antimycotic (100U/mL penicillin G sodium,
100 µg/mL streptomycin sulphate and 0.25 µg/mL amphotericin B) and 1% L-
glutamine) was prepared according to the previously detailed method in Chapter 2,
Section 2.2.5.3.
138
5.3.5 Cell sub culturing and counting
To maintain appropriate cell density through working with HaCaT, the cells were
subculture and counted when they reached 80% confluence. Counting and subculturing
method is detailed in Section 2.2.5.5.
5.3.6 Cell Freezing and cell thawing
For cell storing and cell retrieval a pervious detailed methods in Section 2.2.5.6.
5.3.7 Cell Migration Assay
In vitro scratch wound model was performed using HaCaT cells which were kindly
donated by Dr. Ryan Moseley (School of Dentistry, Cardiff University). HaCaT cells
monolayer was detached from the flask using trypsin (trypsinisation) and a cell
suspension with density of to 7.5 104
cells mL-1
was prepared in cultured DMEM
medium containing 10% FBS. One millilitre of cell suspension was transferred to each
well of a 24 well tissue culture plate and incubated overnight at 37 and 5% CO2 /95%
air for 48 hours. At the 3rd
day of experiment, cell confluence in each well was inspected
under light microscope at x100 magnification. The media in each well were changed to
serum free media and returned to the incubator for 24 hours. The following day, the
serum free medium was removed from the 24 well plate and an artificial gap, or scratch,
was made using a sterile 200 µL plastic pipette tip to produce a vertical straight line in
the middle of each well. The tip was changed for each well. In order to remove any
remaining debris, the cells were washed twice with PBS after wound was induced. Then,
one millilitre of 1% serum cultured media that contained different concentration of PRE
and ZnSO4 were respectively added to each well of the 24 well plate firstly individually
then in different combinations as presented in Table 5-1. For the control 1% FCM with
phthalate buffer (pH 4.5) was used to represent untreated cells.
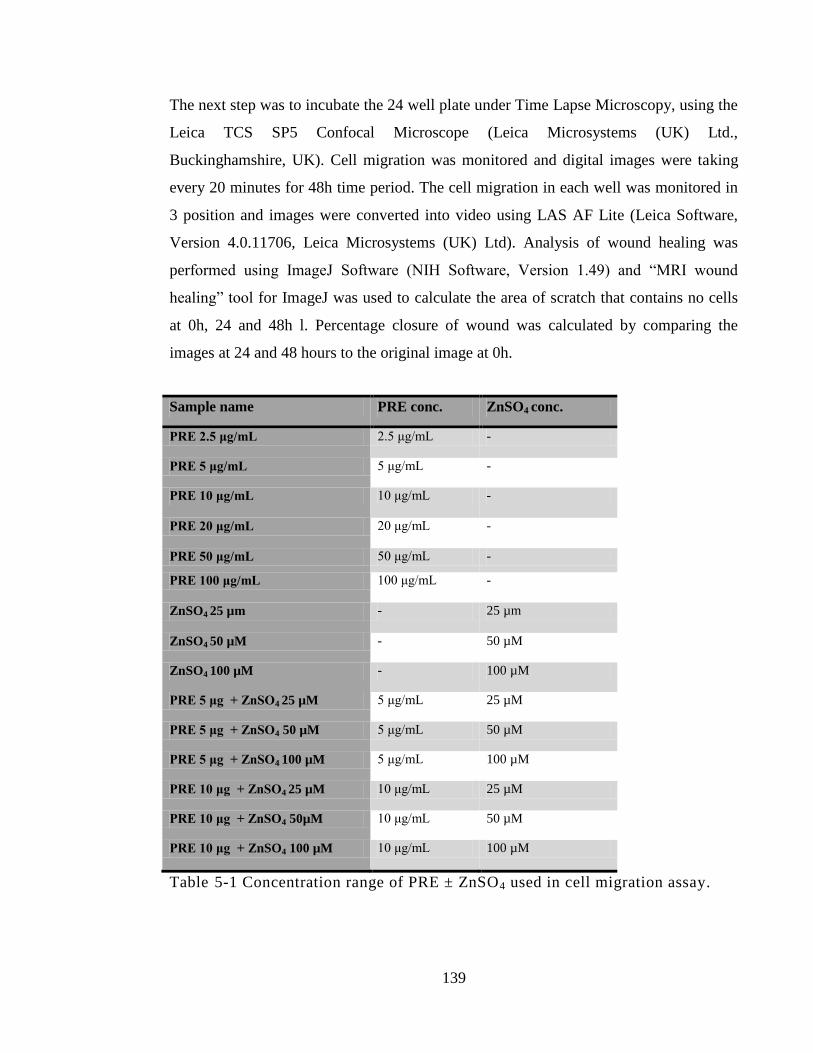
139
The next step was to incubate the 24 well plate under Time Lapse Microscopy, using the
Leica TCS SP5 Confocal Microscope (Leica Microsystems (UK) Ltd.,
Buckinghamshire, UK). Cell migration was monitored and digital images were taking
every 20 minutes for 48h time period. The cell migration in each well was monitored in
3 position and images were converted into video using LAS AF Lite (Leica Software,
Version 4.0.11706, Leica Microsystems (UK) Ltd). Analysis of wound healing was
performed using ImageJ Software (NIH Software, Version 1.49) and “MRI wound
healing” tool for ImageJ was used to calculate the area of scratch that contains no cells
at 0h, 24 and 48h l. Percentage closure of wound was calculated by comparing the
images at 24 and 48 hours to the original image at 0h.
Sample name PRE conc. ZnSO4 conc.
PRE 2.5 μg/mL 2.5 μg/mL -
PRE 5 μg/mL 5 μg/mL -
PRE 10 μg/mL 10 μg/mL -
PRE 20 μg/mL 20 μg/mL -
PRE 50 μg/mL 50 μg/mL -
PRE 100 μg/mL 100 μg/mL -
ZnSO4 25 µm - 25 µm
ZnSO4 50 µM - 50 µM
ZnSO4 100 µM - 100 µM
PRE 5 μg + ZnSO4 25 µM 5 μg/mL 25 µM
PRE 5 μg + ZnSO4 50 µM 5 μg/mL 50 µM
PRE 5 μg + ZnSO4 100 µM 5 μg/mL 100 µM
PRE 10 μg + ZnSO4 25 µM 10 μg/mL 25 µM
PRE 10 μg + ZnSO4 50µM 10 μg/mL 50 µM
PRE 10 μg + ZnSO4 100 µM 10 μg/mL 100 µM
Table 5-1 Concentration range of PRE ± ZnSO4 used in cell migration assay.
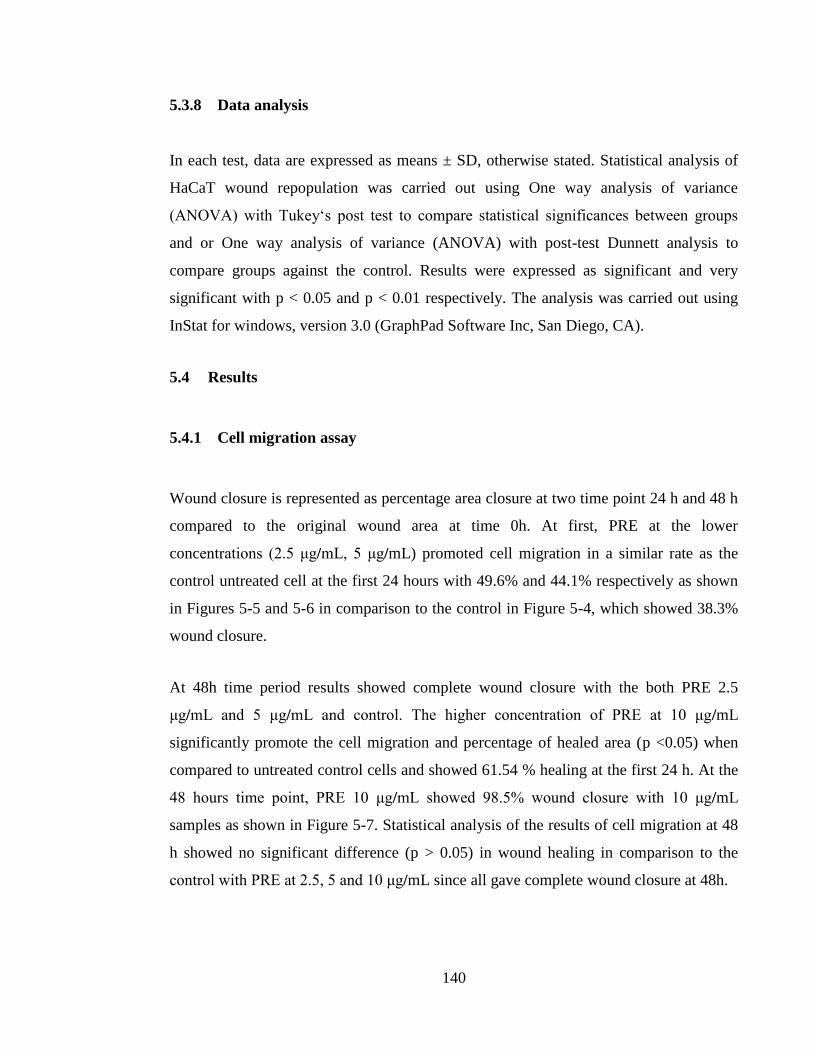
140
5.3.8 Data analysis
In each test, data are expressed as means ± SD, otherwise stated. Statistical analysis of
HaCaT wound repopulation was carried out using One way analysis of variance
(ANOVA) with Tukey‘s post test to compare statistical significances between groups
and or One way analysis of variance (ANOVA) with post-test Dunnett analysis to
compare groups against the control. Results were expressed as significant and very
significant with p < 0.05 and p < 0.01 respectively. The analysis was carried out using
InStat for windows, version 3.0 (GraphPad Software Inc, San Diego, CA).
5.4 Results
5.4.1 Cell migration assay
Wound closure is represented as percentage area closure at two time point 24 h and 48 h
compared to the original wound area at time 0h. At first, PRE at the lower
concentrations (2.5 μg/mL, 5 μg/mL) promoted cell migration in a similar rate as the
control untreated cell at the first 24 hours with 49.6% and 44.1% respectively as shown
in Figures 5-5 and 5-6 in comparison to the control in Figure 5-4, which showed 38.3%
wound closure.
At 48h time period results showed complete wound closure with the both PRE 2.5
μg/mL and 5 μg/mL and control. The higher concentration of PRE at 10 μg/mL
significantly promote the cell migration and percentage of healed area (p <0.05) when
compared to untreated control cells and showed 61.54 % healing at the first 24 h. At the
48 hours time point, PRE 10 μg/mL showed 98.5% wound closure with 10 μg/mL
samples as shown in Figure 5-7. Statistical analysis of the results of cell migration at 48
h showed no significant difference (p > 0.05) in wound healing in comparison to the
control with PRE at 2.5, 5 and 10 μg/mL since all gave complete wound closure at 48h.
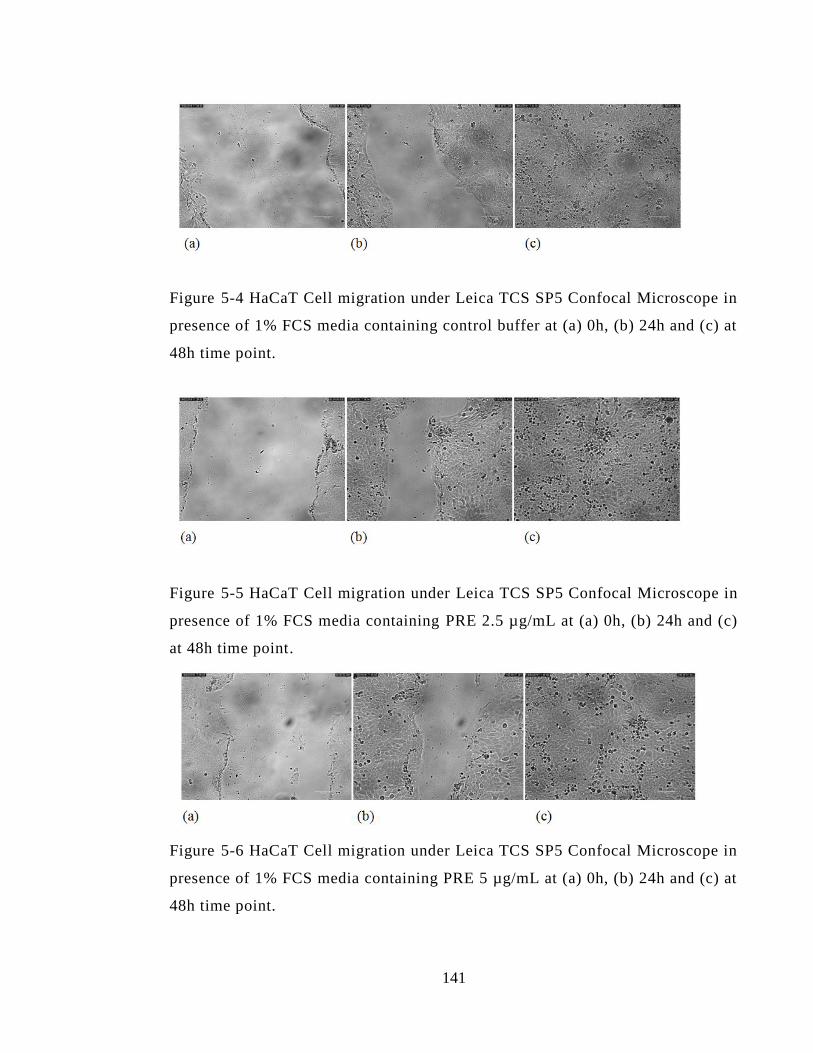
141
Figure 5-4 HaCaT Cell migration under Leica TCS SP5 Confocal Microscope in
presence of 1% FCS media containing control buffer at (a) 0h, (b) 24h and (c) at
48h time point.
Figure 5-5 HaCaT Cell migration under Leica TCS SP5 Confocal Microscope in
presence of 1% FCS media containing PRE 2.5 µg/mL at (a) 0h, (b) 24h and (c)
at 48h time point.
Figure 5-6 HaCaT Cell migration under Leica TCS SP5 Confocal Microscope in
presence of 1% FCS media containing PRE 5 µg/mL at (a) 0h, (b) 24h and (c) at
48h time point.
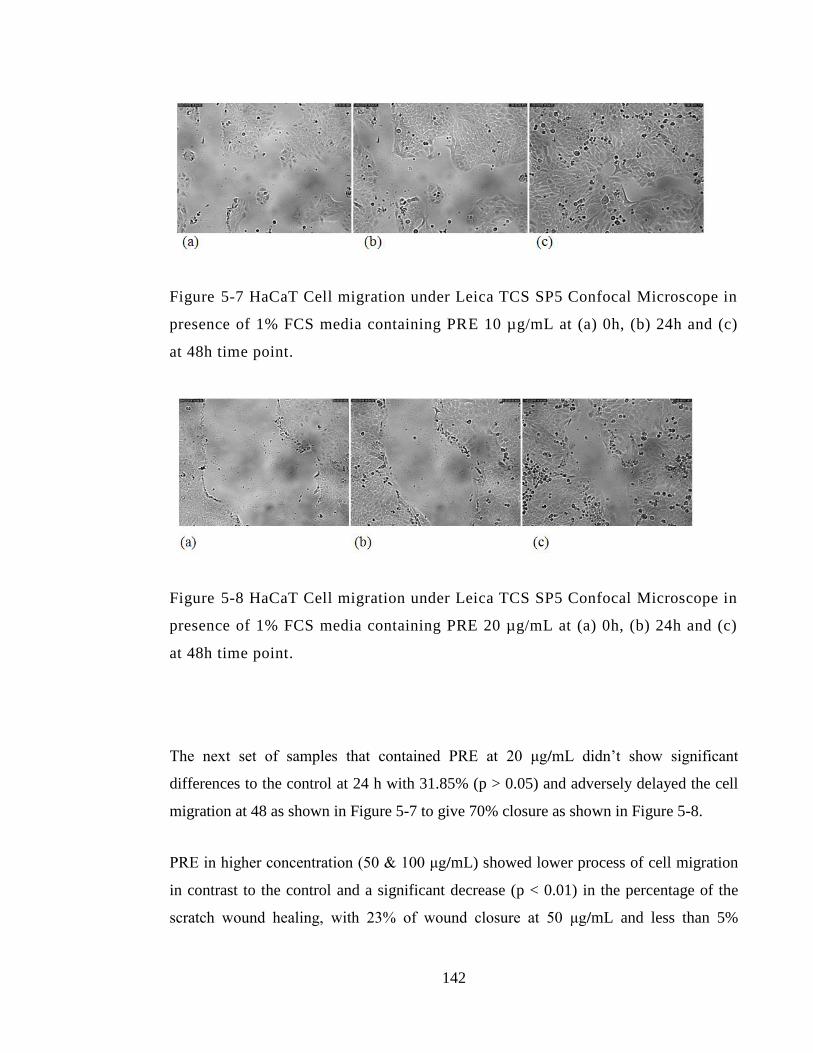
142
Figure 5-7 HaCaT Cell migration under Leica TCS SP5 Confocal Microscope in
presence of 1% FCS media containing PRE 10 µg/mL at (a) 0h, (b) 24h and (c)
at 48h time point.
Figure 5-8 HaCaT Cell migration under Leica TCS SP5 Confocal Microscope in
presence of 1% FCS media containing PRE 20 µg/mL at (a) 0h, (b) 24h and (c)
at 48h time point.
The next set of samples that contained PRE at 20 μg/mL didn’t show significant
differences to the control at 24 h with 31.85% (p > 0.05) and adversely delayed the cell
migration at 48 as shown in Figure 5-7 to give 70% closure as shown in Figure 5-8.
PRE in higher concentration (50 & 100 μg/mL) showed lower process of cell migration
in contrast to the control and a significant decrease (p < 0.01) in the percentage of the
scratch wound healing, with 23% of wound closure at 50 μg/mL and less than 5%
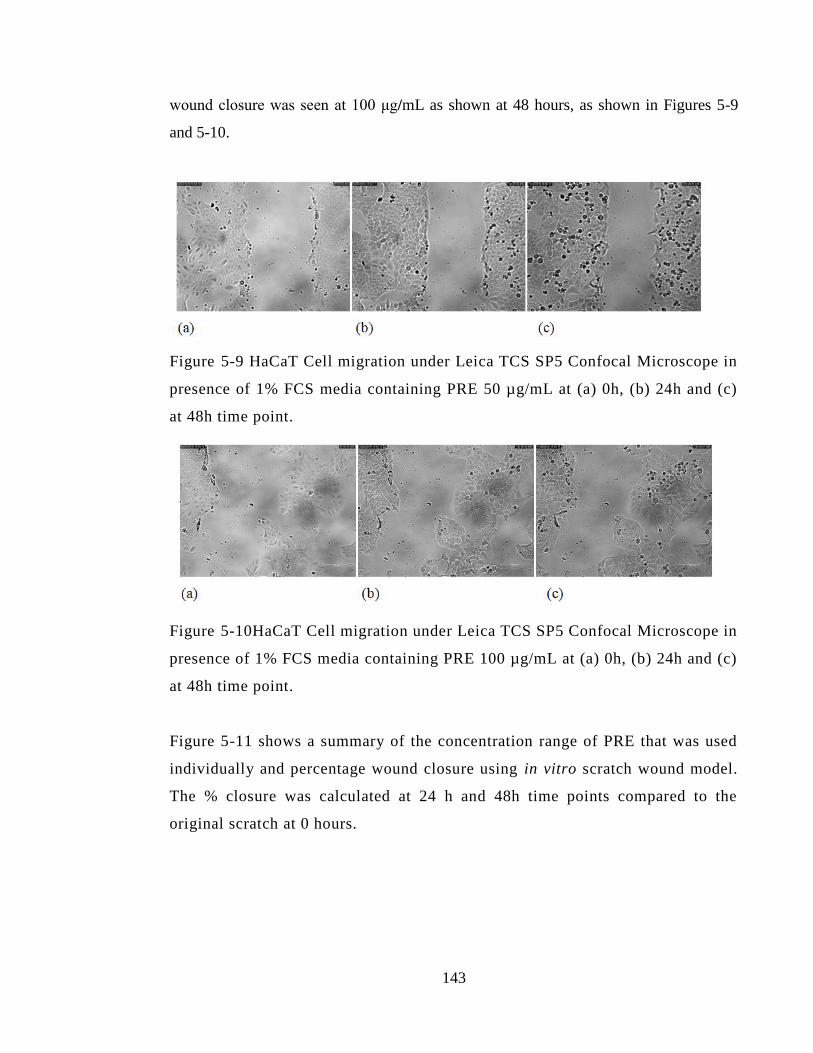
143
wound closure was seen at 100 μg/mL as shown at 48 hours, as shown in Figures 5-9
and 5-10.
Figure 5-9 HaCaT Cell migration under Leica TCS SP5 Confocal Microscope in
presence of 1% FCS media containing PRE 50 µg/mL at (a) 0h, (b) 24h and (c)
at 48h time point.
Figure 5-10HaCaT Cell migration under Leica TCS SP5 Confocal Microscope in
presence of 1% FCS media containing PRE 100 µg/mL at (a) 0h, (b) 24h and (c)
at 48h time point.
Figure 5-11 shows a summary of the concentration range of PRE that was used
individually and percentage wound closure using in vitro scratch wound model.
The % closure was calculated at 24 h and 48h time points compared to the
original scratch at 0 hours.
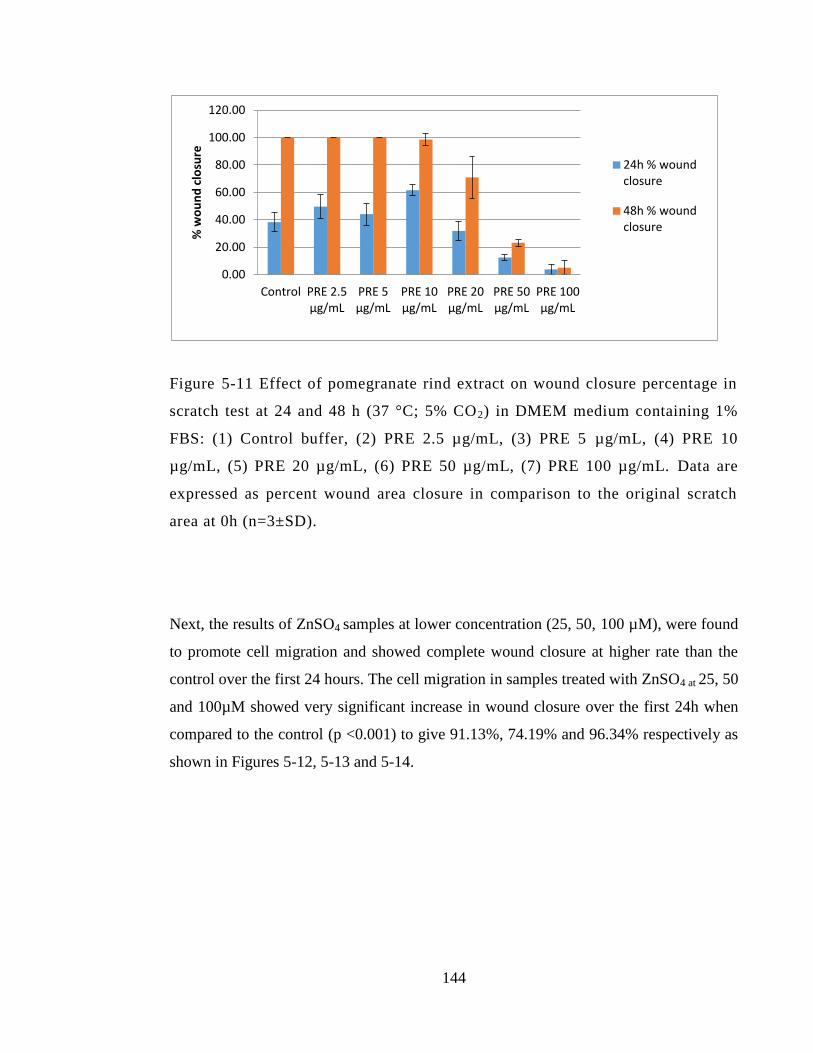
144
Figure 5-11 Effect of pomegranate rind extract on wound closure percentage in
scratch test at 24 and 48 h (37 °C; 5% CO2) in DMEM medium containing 1%
FBS: (1) Control buffer, (2) PRE 2.5 µg/mL, (3) PRE 5 µg/mL, (4) PRE 10
µg/mL, (5) PRE 20 µg/mL, (6) PRE 50 µg/mL, (7) PRE 100 µg/mL. Data are
expressed as percent wound area closure in comparison to the original scratch
area at 0h (n=3±SD).
Next, the results of ZnSO4 samples at lower concentration (25, 50, 100 µM), were found
to promote cell migration and showed complete wound closure at higher rate than the
control over the first 24 hours. The cell migration in samples treated with ZnSO4 at 25, 50
and 100µM showed very significant increase in wound closure over the first 24h when
compared to the control (p <0.001) to give 91.13%, 74.19% and 96.34% respectively as
shown in Figures 5-12, 5-13 and 5-14.
0.00
20.00
40.00
60.00
80.00
100.00
120.00
Control PRE 2.5 µg/mL
PRE 5 µg/mL
PRE 10 µg/mL
PRE 20 µg/mL
PRE 50 µg/mL
PRE 100 µg/mL
% w
ou
nd
clo
sure
24h % wound closure
48h % wound closure
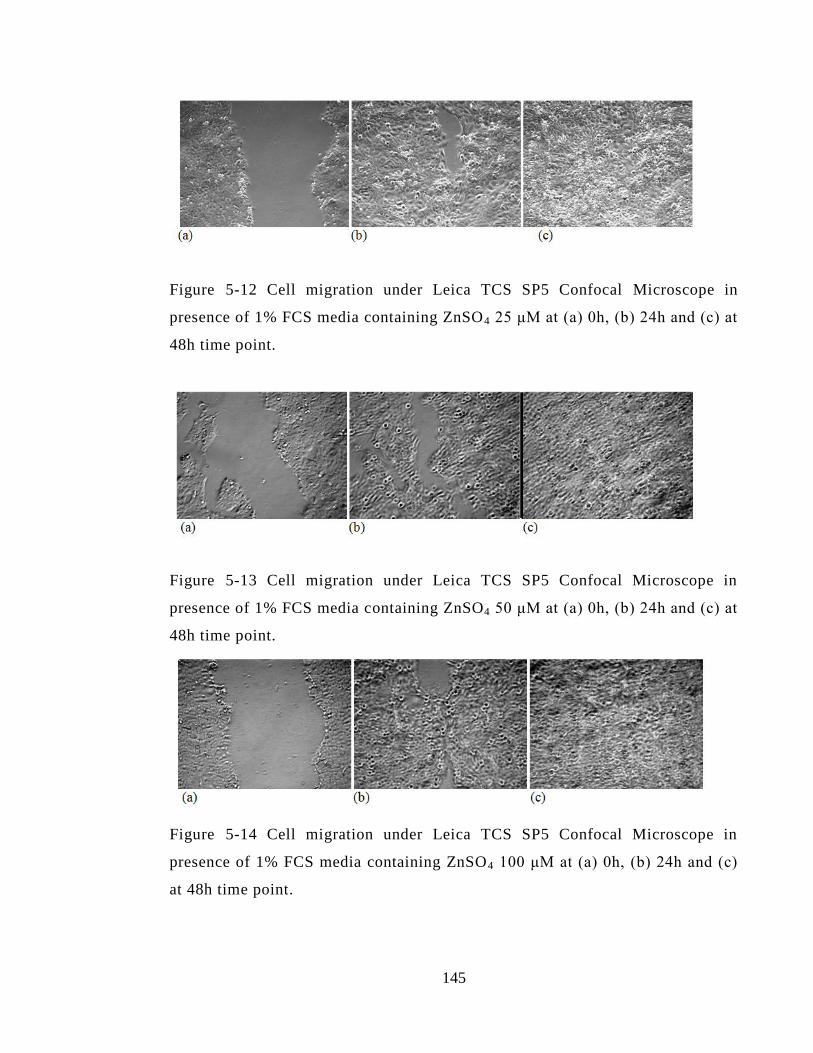
145
Figure 5-12 Cell migration under Leica TCS SP5 Confocal Microscope in
presence of 1% FCS media containing ZnSO4 25 μM at (a) 0h, (b) 24h and (c) at
48h time point.
Figure 5-13 Cell migration under Leica TCS SP5 Confocal Microscope in
presence of 1% FCS media containing ZnSO4 50 μM at (a) 0h, (b) 24h and (c) at
48h time point.
Figure 5-14 Cell migration under Leica TCS SP5 Confocal Microscope in
presence of 1% FCS media containing ZnSO4 100 μM at (a) 0h, (b) 24h and (c)
at 48h time point.
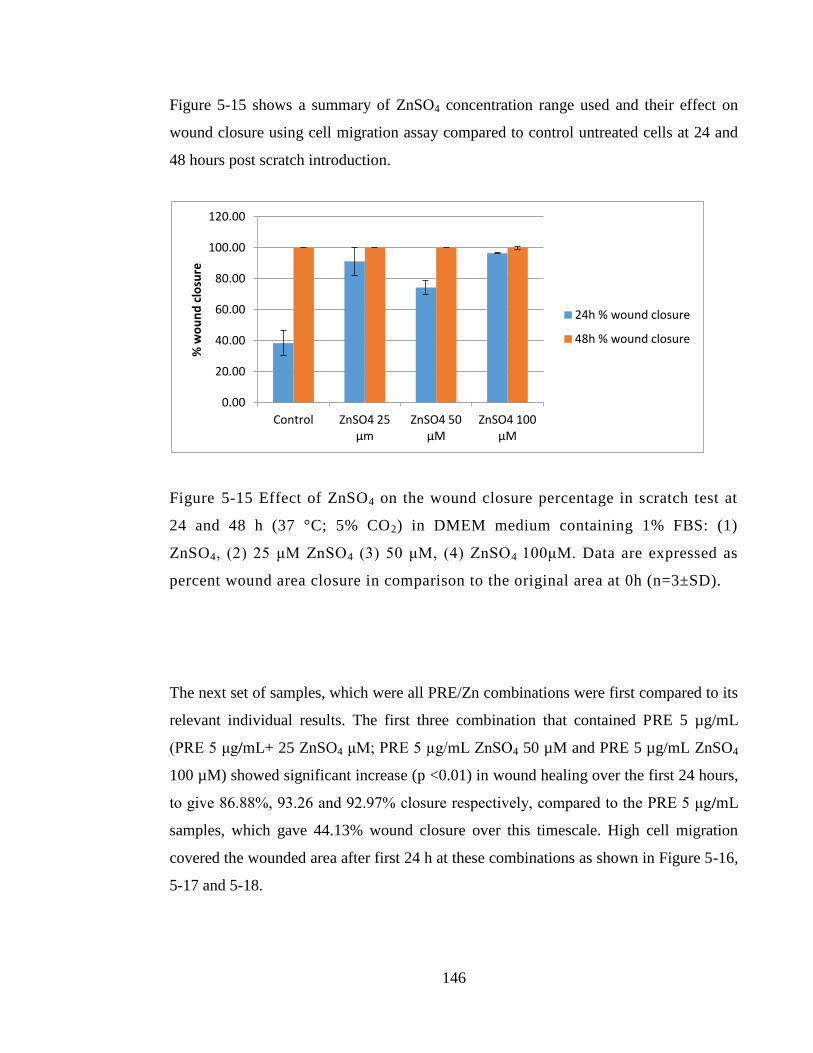
146
Figure 5-15 shows a summary of ZnSO4 concentration range used and their effect on
wound closure using cell migration assay compared to control untreated cells at 24 and
48 hours post scratch introduction.
Figure 5-15 Effect of ZnSO4 on the wound closure percentage in scratch test at
24 and 48 h (37 °C; 5% CO2) in DMEM medium containing 1% FBS: (1)
ZnSO4, (2) 25 μM ZnSO4 (3) 50 μM, (4) ZnSO4 100μM. Data are expressed as
percent wound area closure in comparison to the original area at 0h (n=3±SD).
The next set of samples, which were all PRE/Zn combinations were first compared to its
relevant individual results. The first three combination that contained PRE 5 µg/mL
(PRE 5 μg/mL+ 25 ZnSO4 μM; PRE 5 µg/mL ZnSO4 50 µM and PRE 5 µg/mL ZnSO4
100 µM) showed significant increase (p <0.01) in wound healing over the first 24 hours,
to give 86.88%, 93.26 and 92.97% closure respectively, compared to the PRE 5 μg/mL
samples, which gave 44.13% wound closure over this timescale. High cell migration
covered the wounded area after first 24 h at these combinations as shown in Figure 5-16,
5-17 and 5-18.
0.00
20.00
40.00
60.00
80.00
100.00
120.00
Control ZnSO4 25 µm
ZnSO4 50 µM
ZnSO4 100 µM
% w
ou
nd
clo
sure
24h % wound closure
48h % wound closure
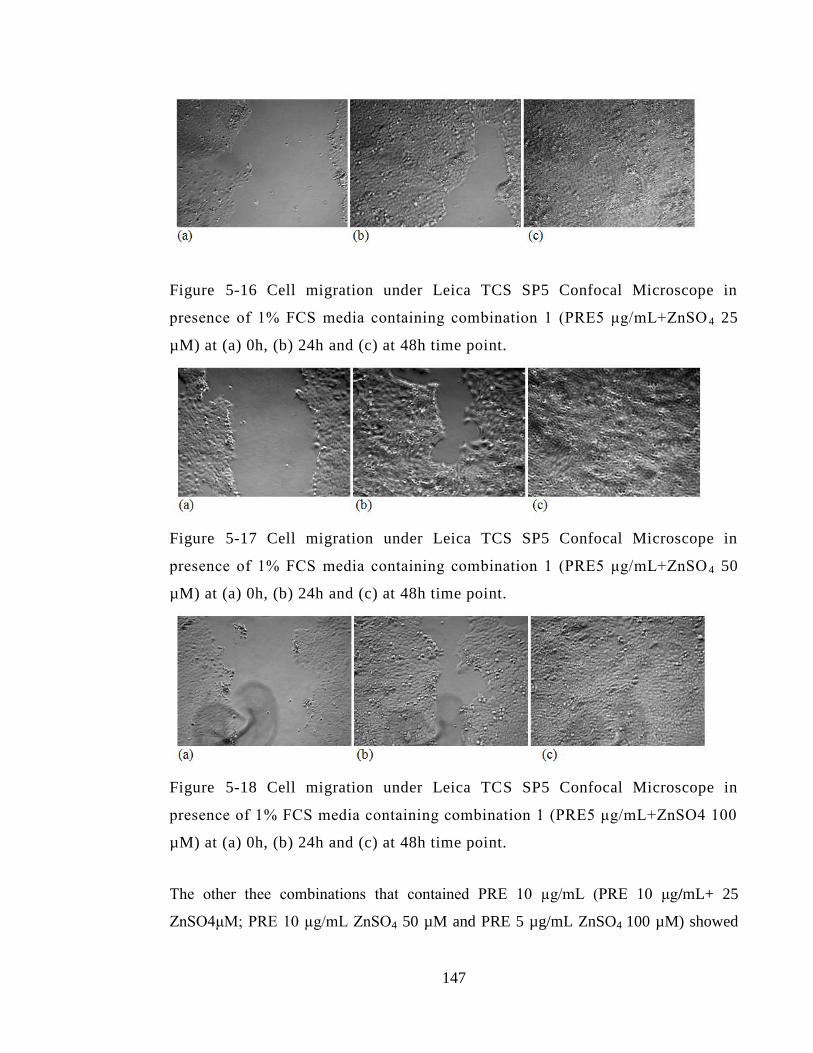
147
Figure 5-16 Cell migration under Leica TCS SP5 Confocal Microscope in
presence of 1% FCS media containing combination 1 (PRE5 μg/mL+ZnSO 4 25
µM) at (a) 0h, (b) 24h and (c) at 48h time point.
Figure 5-17 Cell migration under Leica TCS SP5 Confocal Microscope in
presence of 1% FCS media containing combination 1 (PRE5 μg/mL+ZnSO 4 50
µM) at (a) 0h, (b) 24h and (c) at 48h time point.
Figure 5-18 Cell migration under Leica TCS SP5 Confocal Microscope in
presence of 1% FCS media containing combination 1 (PRE5 μg/mL+ZnSO4 100
µM) at (a) 0h, (b) 24h and (c) at 48h time point.
The other thee combinations that contained PRE 10 µg/mL (PRE 10 μg/mL+ 25
ZnSO4μM; PRE 10 µg/mL ZnSO4 50 µM and PRE 5 µg/mL ZnSO4 100 µM) showed
148
significant increase (p <0.05) in wound healing at the first 24 h to give 89.17%, 94.54
and 100% closure respectively when compared to the PRE 10 μg/mL samples which
gave 61.54% wound closure at the first 24h. HaCaT cell migration results of these
combinations are illustrated in Figures 5-19, 5-20 and 5-21.
Taking together all 6 combinations mentioned above, that contained PRE ranging
concentration from 5-10 µg/mL and ZnSO4 concentration range 25-100 μM, they all
showed very significant increase in the percentage of wound closure at the first 24 hours
when compared to the control (p <0.01) and showed complete wound closure at 48 h.
Next, when comparing the last 6 combinations that showed the positive effect on wound
healing to its respective ZnSO4 level, two combinations (PRE 5 µg/mL ZnSO4 50 µM
and PRE 10 µg/mL ZnSO4 50 µM), showed significant increase (p <0.05) in wound
healing percentage to give 93.26% and 94.54% respectively when compared to the
individual ZnSO4 50 µM which gave 74.19% in wound closure over 24 hours. On the
other hand, no significant differences (p >0.05) were observed when comparing the rest
of the combinations to their relative ZnSO4 concentrations at 25 and 100 μM, since all
gave good healing results but in the same range relative to ZnSO4 alone at 24 h.
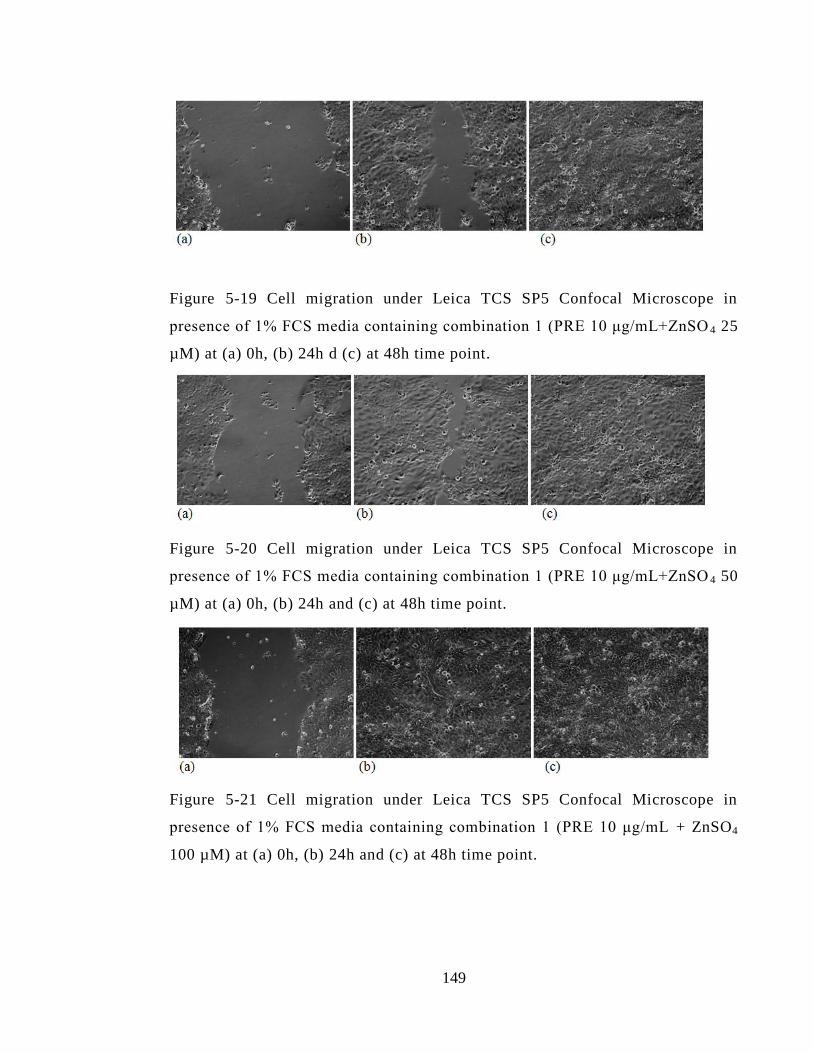
149
Figure 5-19 Cell migration under Leica TCS SP5 Confocal Microscope in
presence of 1% FCS media containing combination 1 (PRE 10 μg/mL+ZnSO 4 25
µM) at (a) 0h, (b) 24h d (c) at 48h time point.
Figure 5-20 Cell migration under Leica TCS SP5 Confocal Microscope in
presence of 1% FCS media containing combination 1 (PRE 10 μg/mL+ZnSO 4 50
µM) at (a) 0h, (b) 24h and (c) at 48h time point.
Figure 5-21 Cell migration under Leica TCS SP5 Confocal Microscope in
presence of 1% FCS media containing combination 1 (PRE 10 μg/mL + ZnSO4
100 µM) at (a) 0h, (b) 24h and (c) at 48h time point.
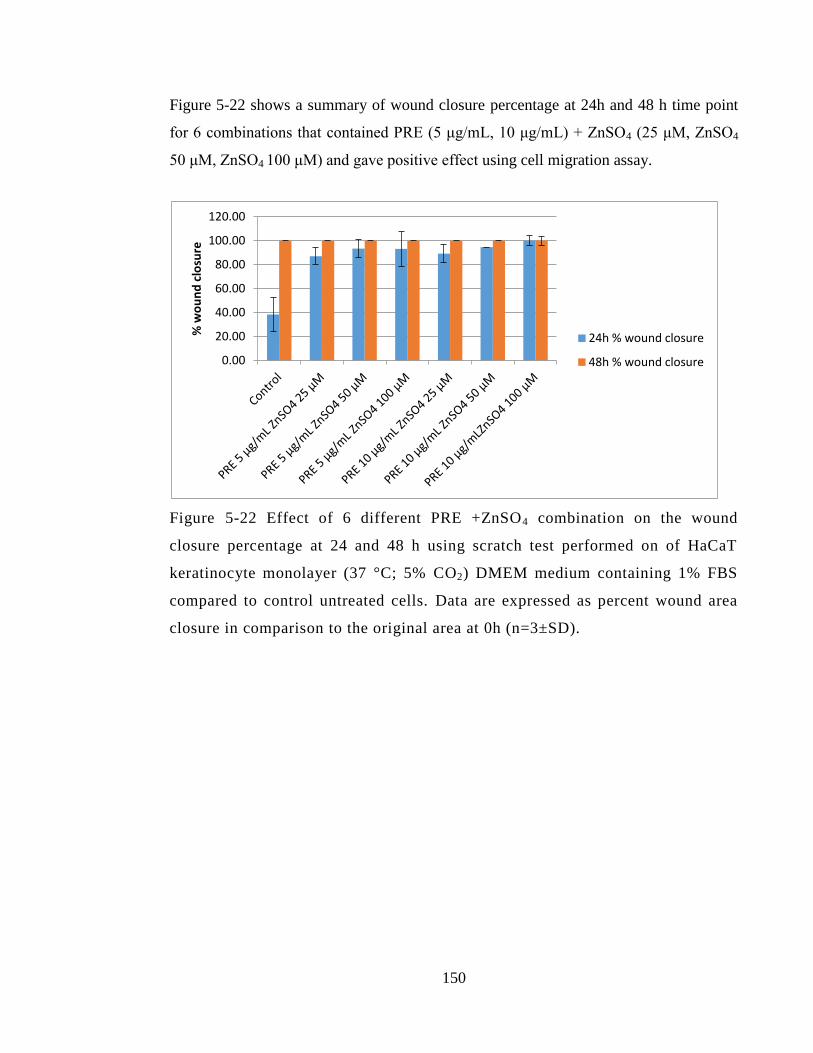
150
Figure 5-22 shows a summary of wound closure percentage at 24h and 48 h time point
for 6 combinations that contained PRE (5 μg/mL, 10 μg/mL) + ZnSO4 (25 μM, ZnSO4
50 μM, ZnSO4 100 μM) and gave positive effect using cell migration assay.
Figure 5-22 Effect of 6 different PRE +ZnSO4 combination on the wound
closure percentage at 24 and 48 h using scratch test performed on of HaCaT
keratinocyte monolayer (37 °C; 5% CO2) DMEM medium containing 1% FBS
compared to control untreated cells. Data are expressed as percent wound area
closure in comparison to the original area at 0h (n=3±SD).
0.00
20.00
40.00
60.00
80.00
100.00
120.00
% w
ou
nd
clo
sure
24h % wound closure
48h % wound closure
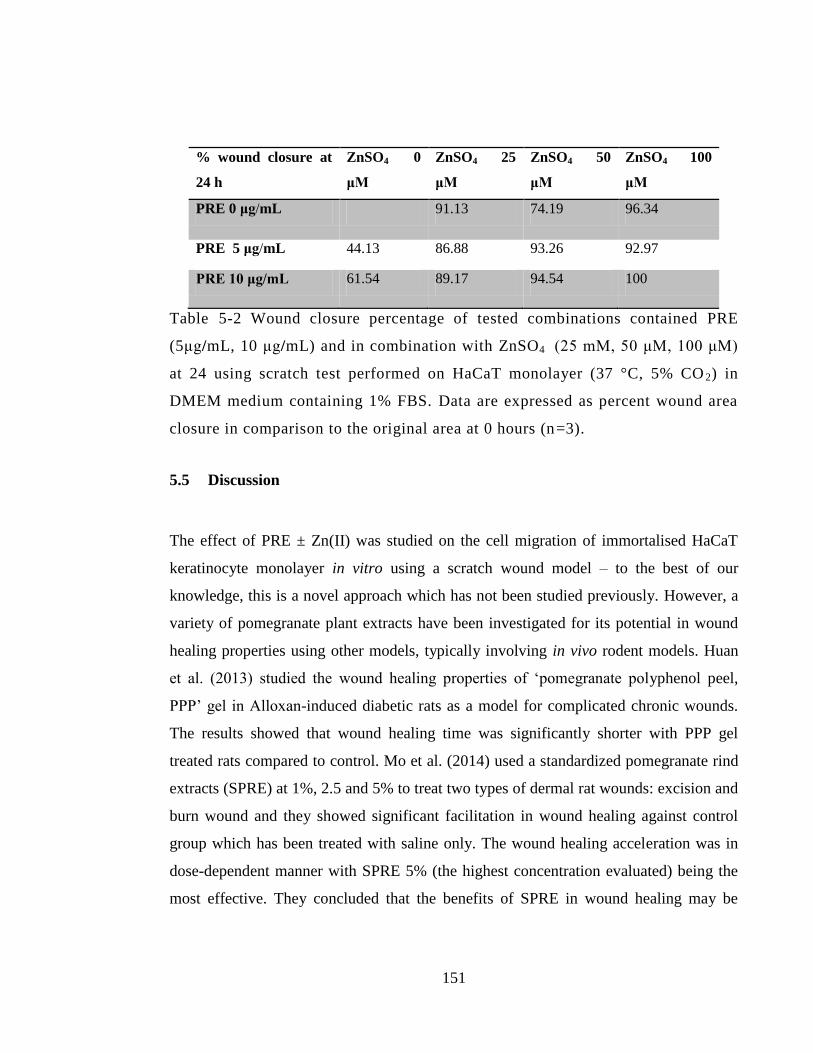
151
% wound closure at
24 h
ZnSO4 0
μM
ZnSO4 25
μM
ZnSO4 50
μM
ZnSO4 100
μM
PRE 0 μg/mL 91.13 74.19 96.34
PRE 5 μg/mL 44.13 86.88 93.26 92.97
PRE 10 μg/mL 61.54 89.17 94.54 100
Table 5-2 Wound closure percentage of tested combinations contained PRE
(5μg/mL, 10 μg/mL) and in combination with ZnSO4 (25 mM, 50 μM, 100 μM)
at 24 using scratch test performed on HaCaT monolayer (37 °C, 5% CO 2) in
DMEM medium containing 1% FBS. Data are expressed as percent wound area
closure in comparison to the original area at 0 hours (n=3).
5.5 Discussion
The effect of PRE ± Zn(II) was studied on the cell migration of immortalised HaCaT
keratinocyte monolayer in vitro using a scratch wound model – to the best of our
knowledge, this is a novel approach which has not been studied previously. However, a
variety of pomegranate plant extracts have been investigated for its potential in wound
healing properties using other models, typically involving in vivo rodent models. Huan
et al. (2013) studied the wound healing properties of ‘pomegranate polyphenol peel,
PPP’ gel in Alloxan-induced diabetic rats as a model for complicated chronic wounds.
The results showed that wound healing time was significantly shorter with PPP gel
treated rats compared to control. Mo et al. (2014) used a standardized pomegranate rind
extracts (SPRE) at 1%, 2.5 and 5% to treat two types of dermal rat wounds: excision and
burn wound and they showed significant facilitation in wound healing against control
group which has been treated with saline only. The wound healing acceleration was in
dose-dependent manner with SPRE 5% (the highest concentration evaluated) being the
most effective. They concluded that the benefits of SPRE in wound healing may be
152
attributed to various factors such as enhancement of collagen synthesis, antibacterial
activity and anti inflammatory activities. Nasiri et al. (2017) used pomegranate flower
extract to investigate in vivo healing potential against burn-induced wounds in rats. The
pomegranate flower extract at 1%, 5% and 10 % was compared to negative normal
saline treatment and positive silver sulfadiazine treatment. The study showed that at day
15, the average size of wounds that were treated with pomegranate flower extract were
significantly smaller than silver sulfadiazine comparator group, 2.8 cm2
against 8.4 cm2
respectively. The wound healing was observed in 10 days earlier with pomegranate
flower extract group than in the other treated groups.
Hayouni et al. (2011) studied the in vivo effect of a 5% methanolic extract of
pomegranate peel extract ointment in Guinea pigs excision wounds compared to a
cetrimide 2% cream and a placebo ointment. The study showed that faster wound
healing and contraction was achieved with both pomegranate peel ointment and
cetrimide group compared to the placebo control group. After complete wound healing a
tensile strength test was carried out in involving the force needed to reopen the wound
by mechanical measured force. Although the mechanism at which 5% pomegranate peel
extract ointment promoted healing and cell proliferation has not been established by his
study (Hayouni et al. 2011).
In our study, higher concentrations of PRE at 50 and 100 μg/mL showed significantly
lower percentage closure compared to control, while lower concentrations of PRE
showed promising results. PRE at concentrations from 2.5 μg/mL - 20µg/mL promoted
wound healing of scratch test on HaCaT cells samples and even higher percentage of
wound closure was observed at the first 24 hours when PRE 5 and 10 µg/mL was
combined with ZnSO4 at 25, 50 and 100 µM concentration range compared to untreated
cell.
Although the mechanism of action of PRE (and indeed PRE/Zn) in wound healing
promotion has not been fully elucidated, Huan et al. (2013) found increased expression
153
of TGF-β1, VEGF and EGF in a diabetic rat wound area treated with gel contained
‘pomegranate polyphenol peel’. The mechanism and important role of these growth
factors, as outlined in Section 1.9.1, is important in collagen regeneration, fibroblast
infiltration, vascularisation and epithelialisation stage at wound healing process.
Vascular endothelial growth factor (VEGF) has an essential role in promotion of
angiogenesis stage of wound healing and induces endothelial cells to activate
neovascularisation and repair blood vessels that have been damaged (Harper et al. 2014).
Epidermal growth factor (EGF) and transforming growth factor-beta (TGF-β) Together
with pro-inflammatory cytokines such as IL-1, PDGFs are significant in the attraction of
neutrophils to the site and activate inflammatory response. In addition, EGF and TGF β
are significant stimulants for the migration and proliferation of the epithelial cells and
responsible for mediation of collagen synthesis and breakdown (Harper et al. 2014;
George et al. 2006).
In a similar manner a previous report has shown the effect of pomegranate rind and seed
extracts on MMP-1 enzymes, which is the main enzymes responsible of collagen
destruction (Aslam et al. 2006). The study showed that pomegranate peel extract
stimulated the proliferation dermal fibroblast and induced type I procollagen synthesis
dermal fibroblasts concomitantly with inhibition of MMP-1 enzymes was observed in
cell treated with pomegranate peel extract. This could explain promotion of skin repair
by inhibiting collagen destruction and synthesis of procollagen. Pitz et al. (2016)
reported the effect cytoprotective properties of jaboticaba fruit peels in wound healing
processes. The study showed the strong cytoprotective of jaboticaba fruit peels extract
treated cells after oxidative stress induced by hydrogen peroxide exposure for 3 h in
murine fibroblasts cell line. The antioxidant activity was attributed to the phenolic
content (anthocyanins) of the fruit in which same group are found in abundance in
pomegranate rind extract PRE.
Zinc formulations have been investigated previously for wound care and many reports
showed that topical zinc therapy can reduce the wound debris and promote
154
epithelialisation process. Zinc oxide topical has been established to treat wound in acute
or chronic wounds including leg ulcers, diabetic ulcers and pressure ulcers (Ågren et al.
2006: Strömberg and Ågren 1984). In our results, cell migration study revealed that
HaCaT cells treated with ZnSO4 at concentration (20, 50 and 100 µM), showed
significant increase with more than 35% wound closure at the first 24h compared to
control untreated cells. It has been reported that zinc oxide topical treatment showed
promotion by more than 30% in wound healing of domestic pigs and stimulate the
epithelialisation phase in wound healing process (Ågren et al. 1991). Although the same
study showed that ZnSO4 at 0.03% and 0.3% concentration showed no positive or
negative effect to the wound healing compared to untreated wounds. Several
mechanisms of action have been proposed to explain the role of Zn(II) in wound healing,
including as being essential for the metalloenzyme synthesis and signalling that is
needed for cell proliferation and division pathway. The mitotic activity of cell involved
in wound healing at the wound site is maximal at the first 24-48 hours and this can
explain the higher zinc demand as its essential for cell replication enzymes including
DNA and RNA polymerase and others which can lead to the increase mitosis and
epithelialisation process (Iwata 1999; Lansdown et al. 2007). Another important action
that it promotes healing in necrotic ulcers which has been reported from in vitro study
that showed zinc oxide promoting the collagen destruction from wound debris by
activate MMPs (Ågren et al. 1993).
While a majority of previous studies showed the effect of either PRE alone or Zn(II)
alone containing formulation on wound healing, our results show effect of combined
PRE ± ZnSO4 on the cell migration of HaCaT cell line using in vitro scratch wound.
Pomegranate extract has been investigated in combined formulation and used in one
case study of chronic wound in form of non-healing leg ulcer. A leg ulcer for 76 years
old woman had failed to heal for over a year, then a pomegranate peel extract 2%
hydrogel was applied once daily with zinc oxide ointment to the wound. It took six
weeks for the ulcer to reduce to one quarter of its original size (6.8 x 4.3 cm) and
complete healing occurred after 90 days responded positively to pomegranate peel
155
ethanolic extract. This case study supports the effect of pomegranate peel extract
accompanied by the metal zinc in form of zinc oxide ointment (Fleck et al., 2016);
however, the Zn(II) as the sulphate salt is a free Zn2+
ion in solution, whereas zinc oxide
is an insoluble salt so the zinc cannot behave in the same way.
The combination of both PRE and Zn (II) showed promotion of cell migration in 6
combinations. The combination that contained ZnSO4 50 µM (PRE 5μg/mL+ ZnSO4 50
µM) and (PRE 10μg/mL+ ZnSO4 50 µM) showed significant increase in wound healing
% at the first 24 h when compared to un treated control group, PRE individual groups
(PRE 5 μg/mL or 10 μg/mL) or ZnSO4 50 µM individual group (p <0.05) with more than
93% wound closure at the first 24 hr. The rest of combinations that contained PRE in (5,
10 μg/mL) or ZnSO4 in (25, 50,100 µM) showed high wound closure percent at the first
24h > 86 % when compared to than the control which gave 38.31 % at the same time.
5.6 Conclusion
This chapter has demonstrated the effect of PRE and ZnSO4 activity upon wound
healing using an in vitro wound model in form of scratch test performed on HaCaT cells.
The results showed that:
PRE at 10 μg/mL and ZnSO4 at (25, 50,100 µM) showed a significant increase in
the cell migration and % wound healing in comparison to the control group (p
>0.05) over 24 hours.
PRE at 20-50 μg/mL showed cell migration and proliferation but in a delayed
matter compared to the control untreated group.
PRE ≥100 μg/mL showed significant delay in cell migration and that was
expected from the Chapter 4 cytotoxicity work of PRE at this concentration.
156
PRE and ZnSO4 at the tested concentrations showed accelerated healing
properties compared to the blank control, and that property was maintained when
combinations of the two were used.
The combination (PRE 5μg/mL+ ZnSO4 50 µM) and (PRE 10 μg/mL+ ZnSO4 50
µM) showed significant increase wound closure (> 93 %) over the first 24 hours
when compared to untreated control group, PRE individual groups (PRE 5
μg/mL or 10 μg/mL) or ZnSO4 50 µM individual group
The rest of combinations that contained PRE (5, 10 μg/mL) or ZnSO4 in (25,
50,100 µM) showed > 86 % wound closure over the first 24 hours, possible due
to mediation action of Zn (II) for those combinations.
The antimicrobial results properties of PRE/Zn along with wound healing properties in
this chapter show that the combination has potential as a product for use in wound repair
and those which have bacterial infection. The next Chapter will investigate stability and
the possible effect of different pH and temperature conditions on individual PRE and
PRE/Zn solutions.
157
Chapter 6: Stability of PRE solution
with and without ZnSO4 under
different pH and temperature
conditions
158
6.1 Introduction
The patent by Stewart et al. (1995) disclosed that the combination of PRE and iron
sulphate produces a potent phagicidal activity, that arises due to a Fenton reaction
whereby Fe(II) oxidises to Fe(III) in the presence of PRE. However, the activity is short-
lived, lasting for up to 30 minutes, and is accompanied by a blackening of the solution.
The work of Houston (2011), found that when Zn(II) was used instead of Fe(II) the
solution did not suffer from solution blackening, and activity that was not limited to 30
minutes. However, the exact timescale for enhanced activity was not determined. In the
previous Chapter of this thesis, the enhanced activity of PRE was found against bacteria,
when combined with Zn(II). Again, no discolouration or blackening of the solution was
observed and time kill assay data indicated stability of microbiological action. This
microbiological stability infers there is also chemical stability when PRE is in solution
along with Zn(II) – this is extremely important, should a product based on this system be
proposed for commercialization.
The purpose of this chapter was therefore to conduct a chemical stability study for PRE
solutions, alone and in the combination with ZnSO4. Thermal stability of pomegranate
either juice or rind extract has been previously studied in the literature. The pH level in
which pomegranate is extracted at or stored, has a major effect on the total phenolic
content of the extract. Low pH level from 5-3.5 and temperature <30˚ C, have been
reported to be best condition in relation to the stability of punicalagin isomer in
pomegranate extract (Houston 2011; Lu et al. 2010; Panichayupakaranant et al. 2010;
Qu et al. 2012; Qu et al. 2014). Very few studies have yet explored the affect of metal
ion on the stability of PRE. Combination of PRE with Fe(III) showed a rapid decline in
the punicalagin’s absorbance although a new compound was not apparent in HPLC
chromatograms (Houston 2011; Lu et al. 2010)- this could be due to low solubility of the
product. Here, we aimed to assess how the pH level and storage temperatures impact on
the stability of punicalagin in PRE solution with and without co-formulated Zn(II).
159
Determination of stability is of key importance in the development of new
pharmaceutical products. The guidelines implemented by the International Council for
Harmonisation (ICH) or other relevant regulatory agencies must be followed during
stability study analysis. Despite typically concerning the capacity to bear chemical
losses throughout decomposition, “stability” in pharmaceutical terms refers to the length
of time for which a drug can be stored in its dosage form before it starts to degrade
and/or becomes inefficacious or dangerous for use. An expiration date of a medical
product must thus be established (Waterman and Adami 2005) – this is the date before
which the quality of the product can be guaranteed. Typically, approaches such as the
direct monitoring of drug loss or observing the appearance of degradants in the
formulation to determine the product’s shelf life. Such tests may be carried out at the
intended storage conditions (real time) or at higher temperatures (stress condition), after
which extrapolation to the intended storage temperature must be performed (Darrington
and Jiao 2004).
It is through accelerated stability analysis that data pertaining to the physicochemical
stability of drugs can be initially assessed, and such data can allow for the product’s
likely decomposition path to be established (Sengupta et al. 2018). Conventionally,
accelerated stability studies subject the drug to elevated temperatures to make reactions
occur more quickly. To estimate ambient stability of drugs, it is important that the
reaction rate is determined at different temperatures in advance, and that the chemicals
are subsequently extrapolated to the intended temperature. Here, it is possible to
establish the reaction rate at a given temperature, as well as the extrapolation process.
Research exploring rates of change for various physicochemical features may be used to
predict the stability and design of drug formulations.
Usually, chemical stability is represented in the form of a rate constant, k, which
signifies either drug degradation or product formation. Arrhenius kinetics typically
determines reaction rates for most products created through the drug degradation
process. Such kinetics are linearly reliant on a reaction rate logarithm against the
160
reciprocal of the absolute temperature T (R represents gas constant and A the entropy of
process (Waterman and Adami 2005).
kT in this equation refers to the degradation rate at temperature T in kelvins, whilst k
represents the degradation rate at temperature T (typically the temperature required to
make the prediction). The rate constant can be calculated as the amount of product
created in the unit time, if low conversions are presumed. Most frequently, rate constants
acquired through experimental data at a given temperature are determined by employing
linear least squares techniques to fit the data. This is particularly common for liquid
dosage forms (Waterman and Adami 2005; Bajaj et al. 2012).
The results of such experiments can indicate the storage conditions under which a
product must be kept over its shelf-life, for example: room temperature, refrigeration at
2-4 ˚C, freezing at -20 ˚C or lyophilization. A solution that may be maintained at room
temperature is ideal as it may be used straight away by a patient. Storage at 2-4 ˚C or -20
˚C are unfavoured, but acceptable although formulation would need to be brought to
room temperature prior to use, and more likely to be single-use, as degradation may
occur once opened. Lyophilised or freeze-dried formulations must be reconstituted prior
to use with an appropriate buffer, which does not lend itself to OTC availability and
more likely to require the involvement of a healthcare professional.
Furthermore, data acquired through stability analysis is crucial in ensuring regulatory
approval for a new formulation or drug (Singh et al. 2000). The shelf-life of a new drug
can be defined as the time required for are pharmacological activity to drop to the lowest
acceptable amount, and ultimately determined in real-time. Although this definition is by
no means universal, an acceptable level of decomposition is determined to be
approximately 10 %, except in cases where product decomposition can be toxic. The
following decomposition routes are the most common ones identified in
161
pharmaceuticals: oxidation, hydrolysis, racemization, photochemical degradations,
thermal decomposition, microbial degradation and chemical interactions (Bajaj et al.
2012). However, in a natural product extract such as PRE, the situation is far more
complex as the hydrolysable ellagitannins could potentially undergo acid- or base-
catalysed ester cleavage. On the other hand, the innate anti-oxidant properties of tannins
and smaller polyphenols, which are also present in PRE may confer protection against
oxidation reactions.
Combining PRE and metal ions in a formulation presents further potential complication
in that metals have the potential to interact with the components of PRE. This can
potentially include: 1) homogeneous catalysis, a catalytic reaction where the catalyst is
in the same phase as the reactants. 2) complex formation. The zinc ion (Zn2+
) or Zn(II)
possesses a filled d orbital (d10
) and therefore does not participate in redox reactions as
with Fe(II), but could function as a Lewis acid in accepting a pair of electrons (Williams
1987). Such processes have the potential to impact on stability and render the product
inefficacious.
6.2 Objective and aims
To determine the stability of PRE (ie punicalagin) in the absence and presence of Zn(II)
over a range of temperature and pH conditions.
1. To seek evidence about the effect of pH 4.5 and pH 7 on the stability of PRE
solution with and without ZnSO4
2. Study the effect of temperature on PRE solution with and without ZnSO4.
3. Seek evidence about the effect of long-term addition of ZnSO4 to PRE and effect
on overall stability compared to PRE individual samples.
4. Compare α and β punicalagin anomers during the degradation process.
162
5. Estimate a shelf life based on the accelerated stability study.
6.3 Materials and methods
6.3.1 Materials
Materials used in this project are detailed in Chapter 2, section 2.1
6.3.2 Sample preparation
PRE individual solution was prepared according to previous method of freeze-dried PRE
Reconstitution in Chapter 2, Section 2.2.1.2. ZnSO4 individual samples were prepared
according to Chapter 2, Section 2.2.1.4. The preparation of combined solution of PRE
and ZnSO4 was prepared according to the detailed method in Chapter 2, Section 2.2.1.5.
The two pH values investigated were: phthalate buffer (pH 4.5) as the optimum
determined for virucidal action (Houston 2011) and neutral water (pH 7).
6.3.3 Real time stability study
In order to demonstrate different storage temperature effect on stability of PRE solution
alone and in combination with ZnSO4, three different temperatures were employed: -
20˚C, 2-4˚C, 20 ˚C representing freezer, fridge and room temperature storage
respectively. In addition, two different pH levels were tested (in phthalate buffer pH 4.5
and water at pH 7) – in total, 12 test solutions were examined as summarised in Table
6.1. Aliquots of each sample were stored in glass vials occluded from light. Data
collection was performed on days 0, 30, 60, 90, 150 and 180, by analyzing for
punicalagin content by HPLC method previously detailed in Chapter 2, Section (2.2.2),
The testing frequency was set to be no more than four weeks apart. Three replicates of
each sample were tested at each time point to give a total analysis count of 36 samples
every occasion.
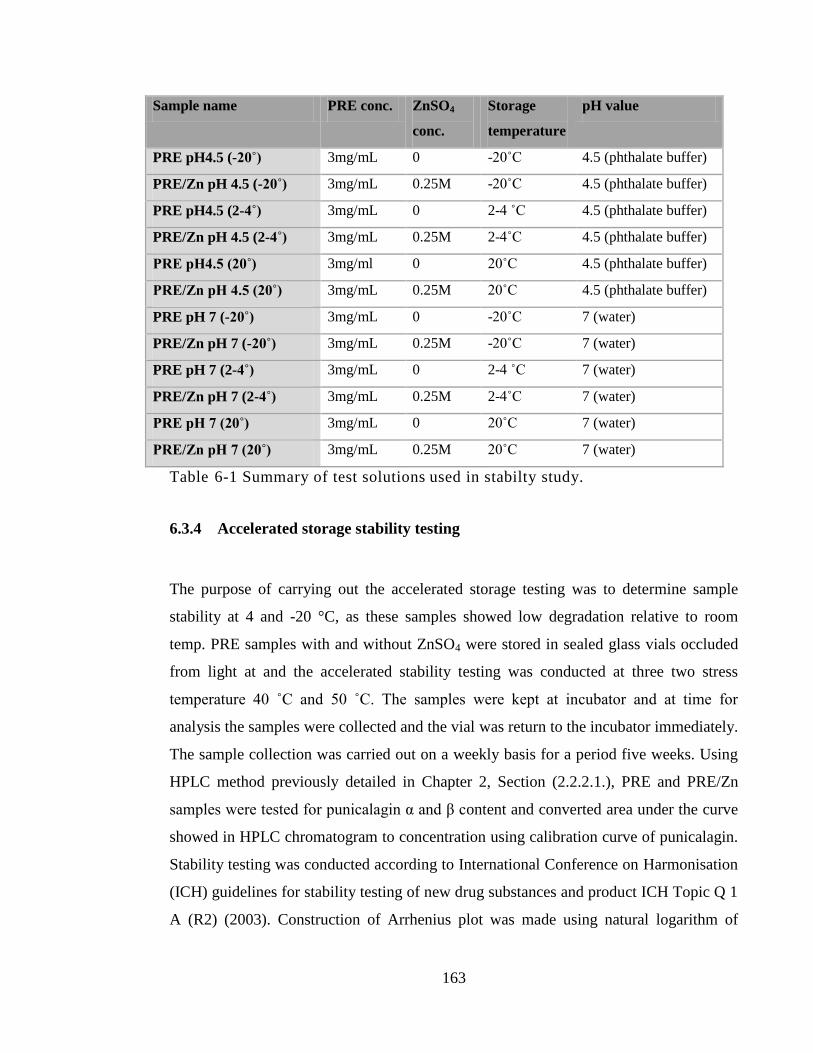
163
Sample name PRE conc. ZnSO4
conc.
Storage
temperature
pH value
PRE pH4.5 (-20˚) 3mg/mL 0 -20˚C 4.5 (phthalate buffer)
PRE/Zn pH 4.5 (-20˚) 3mg/mL 0.25M -20˚C 4.5 (phthalate buffer)
PRE pH4.5 (2-4˚) 3mg/mL 0 2-4 ˚C 4.5 (phthalate buffer)
PRE/Zn pH 4.5 (2-4˚) 3mg/mL 0.25M 2-4˚C 4.5 (phthalate buffer)
PRE pH4.5 (20˚) 3mg/ml 0 20˚C 4.5 (phthalate buffer)
PRE/Zn pH 4.5 (20˚) 3mg/mL 0.25M 20˚C 4.5 (phthalate buffer)
PRE pH 7 (-20˚) 3mg/mL 0 -20˚C 7 (water)
PRE/Zn pH 7 (-20˚) 3mg/mL 0.25M -20˚C 7 (water)
PRE pH 7 (2-4˚) 3mg/mL 0 2-4 ˚C 7 (water)
PRE/Zn pH 7 (2-4˚) 3mg/mL 0.25M 2-4˚C 7 (water)
PRE pH 7 (20˚) 3mg/mL 0 20˚C 7 (water)
PRE/Zn pH 7 (20˚) 3mg/mL 0.25M 20˚C 7 (water)
Table 6-1 Summary of test solutions used in stabilty study.
6.3.4 Accelerated storage stability testing
The purpose of carrying out the accelerated storage testing was to determine sample
stability at 4 and -20 °C, as these samples showed low degradation relative to room
temp. PRE samples with and without ZnSO4 were stored in sealed glass vials occluded
from light at and the accelerated stability testing was conducted at three two stress
temperature 40 ˚C and 50 ˚C. The samples were kept at incubator and at time for
analysis the samples were collected and the vial was return to the incubator immediately.
The sample collection was carried out on a weekly basis for a period five weeks. Using
HPLC method previously detailed in Chapter 2, Section (2.2.2.1.), PRE and PRE/Zn
samples were tested for punicalagin α and β content and converted area under the curve
showed in HPLC chromatogram to concentration using calibration curve of punicalagin.
Stability testing was conducted according to International Conference on Harmonisation
(ICH) guidelines for stability testing of new drug substances and product ICH Topic Q 1
A (R2) (2003). Construction of Arrhenius plot was made using natural logarithm of
164
reaction rate constant k of 40 °C and 50 °C against 1/T (absolute temperature in kelvin).
The prediction of the degradation rate at lower temperature was made by extrapolating
of Arrhenius plot to give ln k at 20 °C and 4 °C which represent room temperature and
fridge storing temperature.
6.3.5 Data Processing
After HPLC analysis of punicalagin α and β anomers in the samples, the concentration
was calculated in accordance to the calibration curve of Punicalagin previously
constructed in Chapter 2, Section 2.2.2.1.1. Punicalagin anomer (α and β)
concentrations were calculated separately and in total and percentage punicalagin
content was calculated in relation to the initial concentration at time zero. In each test,
data were expressed as mean ± SD, otherwise stated. Statistical analysis was carried out
using One way analysis of variance (ANOVA) with Tukey‘s post test to compare
statistical significances between groups. PRE and ZnSO4 combinations were compared
to control and individual PRE. Results were expressed as significant with p < 0.05. The
analysis was carried out using InStat for Macintosh, version 3.0 (GraphPad Software
Inc, San Diego, CA).
6.4 Results
6.4.1 Real time stability determination
The data in the real time stability test revealed that both temperature and pH had a
significant effect on the stability of punicalagin in both PRE and in PRE combined with
ZnSO4 after being stored for 180 days. Table 6-3 shows a summary of α punicalagin
concentration of at different pH and temperature. At first, data analysis at the lower pH
value (pH 4.5) showed that as the temperature increased, the loss in α punicalagin
concentration increased. At the end of the testing period, it was apparent that samples at
the higher temperature (20˚C) showed significantly decrease with 16-18 % loss in α
165
punicalagin concentration in both PRE with ZnSO4 and PRE individual samples (p <
0.05). After 180 days storage time of both PRE and PRE/Zn sample at 20 ˚C and pH 4.5,
the percentage recovery of α punicalagin were 81.8 % and 83.3 % respectively. On the
contrary, no loss in α punicalagin concentration was observed at the lowest tested
temperature -20 °C (p > 0.05) in both PRE samples and PRE with ZnSO4 as shown in
Table 6-3. However, the refrigerated samples which were stored at temperature 2-4 °C
showed reduction of <8% of the original α punicalagin concentration in both PRE and
PRE/Zn samples after stored for 180 days.
Moreover, the higher pH 7 (water) was found to negatively impact on α punicalagin
concentration at both temperatures 2-4 °C and 20 °C to give α punicalagin percent of
84.9 % and 84.8 % at 2-4 ˚C and 74 % and 72.8 % at 20 ˚C in PRE and PRE/Zn
respectively. Comparing the PRE and PRE/Zn samples at same temperature (20 °C), the
pH level significantly affect (p < 0.05) the stability and percentage loss of initial α
punicalagin with pH 4.5 positively added to the stability of both PRE and PRE/Zn. Data
showed that the addition of ZnSO4 to PRE didn’t affect the of punicalagin and that
remained true for all samples tested in this project regardless of the pH or temperature
level (p >0.05).
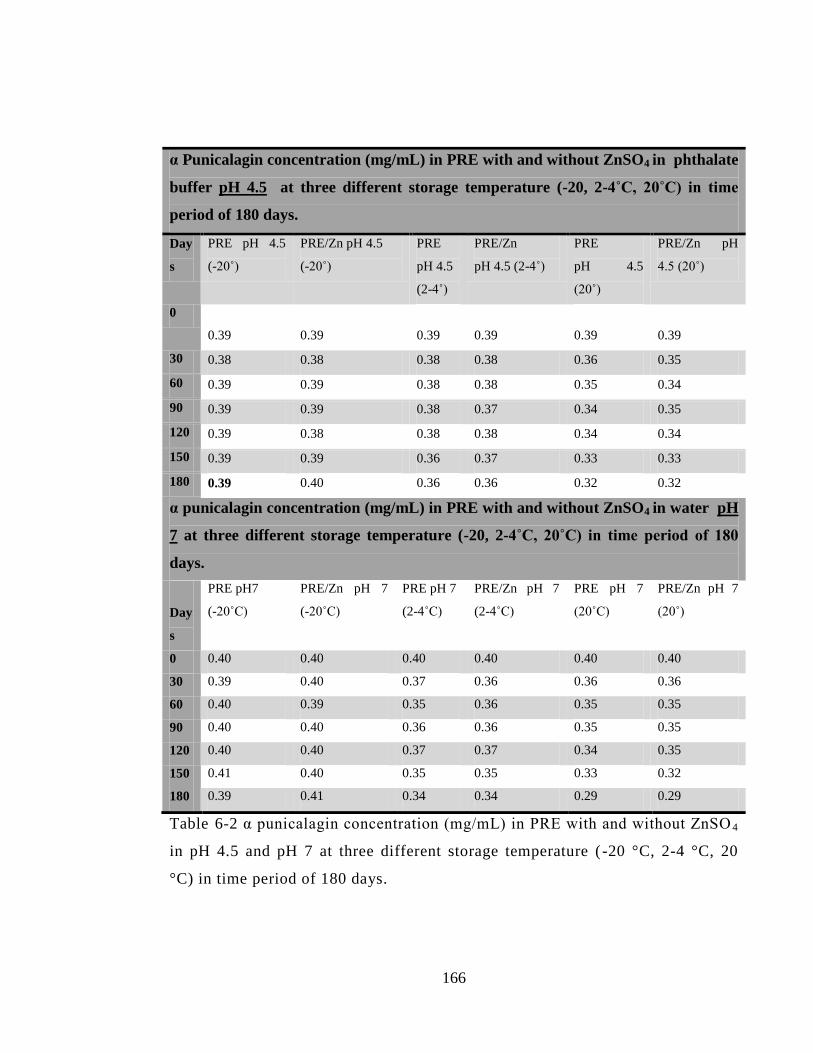
166
α Punicalagin concentration (mg/mL) in PRE with and without ZnSO4 in phthalate
buffer pH 4.5 at three different storage temperature (-20, 2-4˚C, 20˚C) in time
period of 180 days.
Day
s
PRE pH 4.5
(-20˚)
PRE/Zn pH 4.5
(-20˚)
PRE
pH 4.5
(2-4˚)
PRE/Zn
pH 4.5 (2-4˚)
PRE
pH 4.5
(20˚)
PRE/Zn pH
4.5 (20˚)
0
0.39 0.39 0.39 0.39 0.39 0.39
30 0.38 0.38 0.38 0.38 0.36 0.35
60 0.39 0.39 0.38 0.38 0.35 0.34
90 0.39 0.39 0.38 0.37 0.34 0.35
120 0.39 0.38 0.38 0.38 0.34 0.34
150 0.39 0.39 0.36 0.37 0.33 0.33
180 0.39 0.40 0.36 0.36 0.32 0.32
α punicalagin concentration (mg/mL) in PRE with and without ZnSO4 in water pH
7 at three different storage temperature (-20, 2-4˚C, 20˚C) in time period of 180
days.
Day
s
PRE pH7
(-20˚C)
PRE/Zn pH 7
(-20˚C)
PRE pH 7
(2-4˚C)
PRE/Zn pH 7
(2-4˚C)
PRE pH 7
(20˚C)
PRE/Zn pH 7
(20˚)
0 0.40 0.40 0.40 0.40 0.40 0.40
30 0.39 0.40 0.37 0.36 0.36 0.36
60 0.40 0.39 0.35 0.36 0.35 0.35
90 0.40 0.40 0.36 0.36 0.35 0.35
120 0.40 0.40 0.37 0.37 0.34 0.35
150 0.41 0.40 0.35 0.35 0.33 0.32
180 0.39 0.41 0.34 0.34 0.29 0.29
Table 6-2 α punicalagin concentration (mg/mL) in PRE with and without ZnSO 4
in pH 4.5 and pH 7 at three different storage temperature ( -20 °C, 2-4 °C, 20
°C) in time period of 180 days.
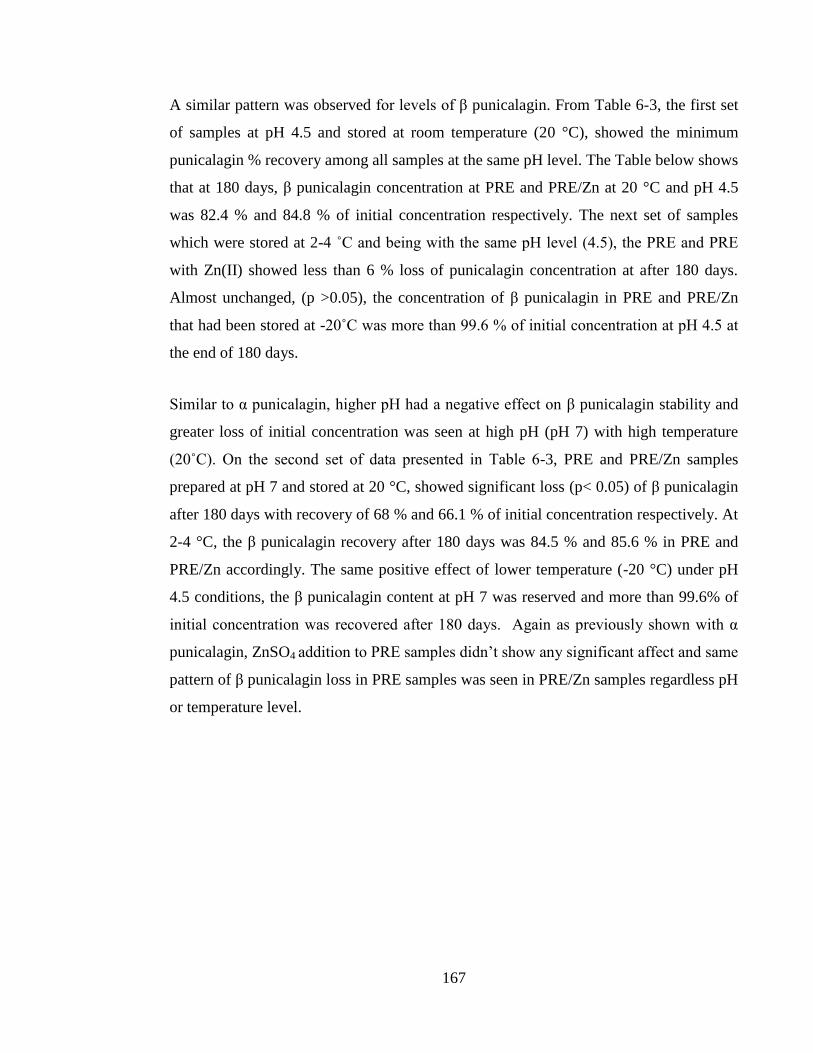
167
A similar pattern was observed for levels of β punicalagin. From Table 6-3, the first set
of samples at pH 4.5 and stored at room temperature (20 °C), showed the minimum
punicalagin % recovery among all samples at the same pH level. The Table below shows
that at 180 days, β punicalagin concentration at PRE and PRE/Zn at 20 °C and pH 4.5
was 82.4 % and 84.8 % of initial concentration respectively. The next set of samples
which were stored at 2-4 ˚C and being with the same pH level (4.5), the PRE and PRE
with Zn(II) showed less than 6 % loss of punicalagin concentration at after 180 days.
Almost unchanged, (p >0.05), the concentration of β punicalagin in PRE and PRE/Zn
that had been stored at -20˚C was more than 99.6 % of initial concentration at pH 4.5 at
the end of 180 days.
Similar to α punicalagin, higher pH had a negative effect on β punicalagin stability and
greater loss of initial concentration was seen at high pH (pH 7) with high temperature
(20˚C). On the second set of data presented in Table 6-3, PRE and PRE/Zn samples
prepared at pH 7 and stored at 20 °C, showed significant loss (p< 0.05) of β punicalagin
after 180 days with recovery of 68 % and 66.1 % of initial concentration respectively. At
2-4 °C, the β punicalagin recovery after 180 days was 84.5 % and 85.6 % in PRE and
PRE/Zn accordingly. The same positive effect of lower temperature (-20 °C) under pH
4.5 conditions, the β punicalagin content at pH 7 was reserved and more than 99.6% of
initial concentration was recovered after 180 days. Again as previously shown with α
punicalagin, ZnSO4 addition to PRE samples didn’t show any significant affect and same
pattern of β punicalagin loss in PRE samples was seen in PRE/Zn samples regardless pH
or temperature level.
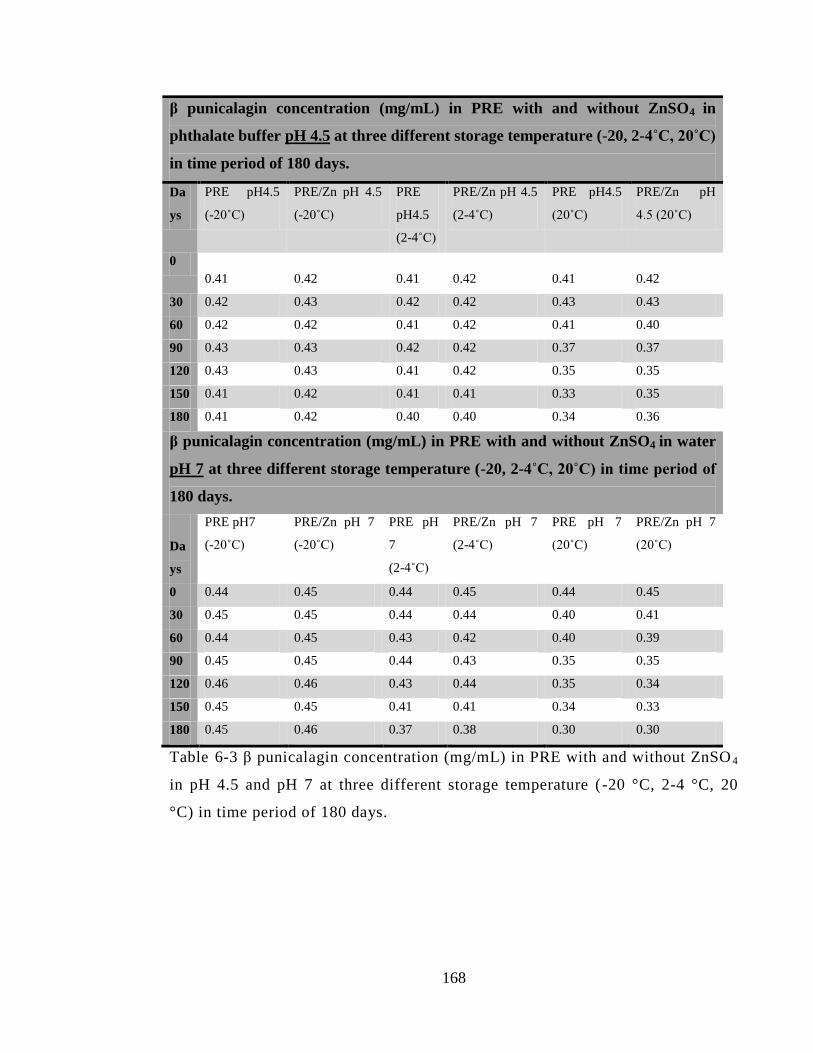
168
β punicalagin concentration (mg/mL) in PRE with and without ZnSO4 in
phthalate buffer pH 4.5 at three different storage temperature (-20, 2-4˚C, 20˚C)
in time period of 180 days.
Da
ys
PRE pH4.5
(-20˚C)
PRE/Zn pH 4.5
(-20˚C)
PRE
pH4.5
(2-4˚C)
PRE/Zn pH 4.5
(2-4˚C)
PRE pH4.5
(20˚C)
PRE/Zn pH
4.5 (20˚C)
0
0.41 0.42 0.41 0.42 0.41 0.42
30 0.42 0.43 0.42 0.42 0.43 0.43
60 0.42 0.42 0.41 0.42 0.41 0.40
90 0.43 0.43 0.42 0.42 0.37 0.37
120 0.43 0.43 0.41 0.42 0.35 0.35
150 0.41 0.42 0.41 0.41 0.33 0.35
180 0.41 0.42 0.40 0.40 0.34 0.36
β punicalagin concentration (mg/mL) in PRE with and without ZnSO4 in water
pH 7 at three different storage temperature (-20, 2-4˚C, 20˚C) in time period of
180 days.
Da
ys
PRE pH7
(-20˚C)
PRE/Zn pH 7
(-20˚C)
PRE pH
7
(2-4˚C)
PRE/Zn pH 7
(2-4˚C)
PRE pH 7
(20˚C)
PRE/Zn pH 7
(20˚C)
0 0.44 0.45 0.44 0.45 0.44 0.45
30 0.45 0.45 0.44 0.44 0.40 0.41
60 0.44 0.45 0.43 0.42 0.40 0.39
90 0.45 0.45 0.44 0.43 0.35 0.35
120 0.46 0.46 0.43 0.44 0.35 0.34
150 0.45 0.45 0.41 0.41 0.34 0.33
180 0.45 0.46 0.37 0.38 0.30 0.30
Table 6-3 β punicalagin concentration (mg/mL) in PRE with and without ZnSO 4
in pH 4.5 and pH 7 at three different storage temperature ( -20 °C, 2-4 °C, 20
°C) in time period of 180 days.
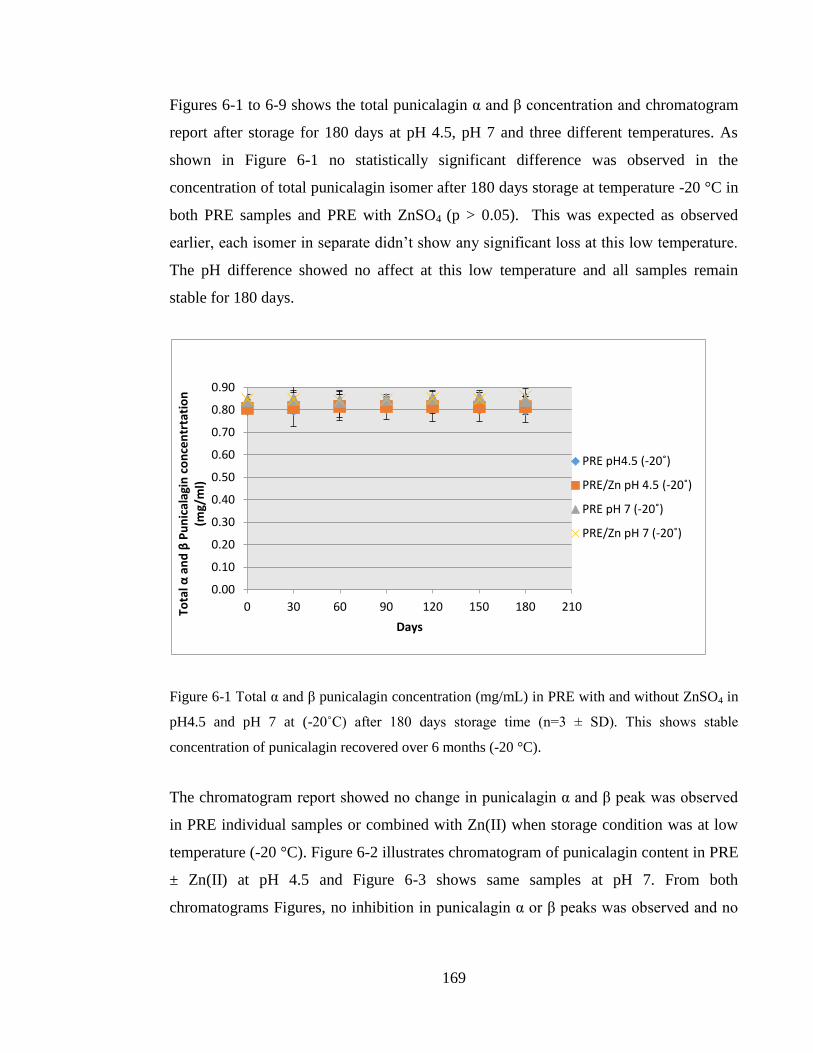
169
Figures 6-1 to 6-9 shows the total punicalagin α and β concentration and chromatogram
report after storage for 180 days at pH 4.5, pH 7 and three different temperatures. As
shown in Figure 6-1 no statistically significant difference was observed in the
concentration of total punicalagin isomer after 180 days storage at temperature -20 °C in
both PRE samples and PRE with ZnSO4 (p > 0.05). This was expected as observed
earlier, each isomer in separate didn’t show any significant loss at this low temperature.
The pH difference showed no affect at this low temperature and all samples remain
stable for 180 days.
Figure 6-1 Total α and β punicalagin concentration (mg/mL) in PRE with and without ZnSO4 in
pH4.5 and pH 7 at (-20˚C) after 180 days storage time (n=3 ± SD). This shows stable
concentration of punicalagin recovered over 6 months (-20 °C).
The chromatogram report showed no change in punicalagin α and β peak was observed
in PRE individual samples or combined with Zn(II) when storage condition was at low
temperature (-20 °C). Figure 6-2 illustrates chromatogram of punicalagin content in PRE
± Zn(II) at pH 4.5 and Figure 6-3 shows same samples at pH 7. From both
chromatograms Figures, no inhibition in punicalagin α or β peaks was observed and no
0.00
0.10
0.20
0.30
0.40
0.50
0.60
0.70
0.80
0.90
0 30 60 90 120 150 180 210 Tota
l α a
nd
β P
un
ical
agin
co
nce
ntr
tati
on
(m
g/m
l)
Days
PRE pH4.5 (-20˚)
PRE/Zn pH 4.5 (-20˚)
PRE pH 7 (-20˚)
PRE/Zn pH 7 (-20˚)
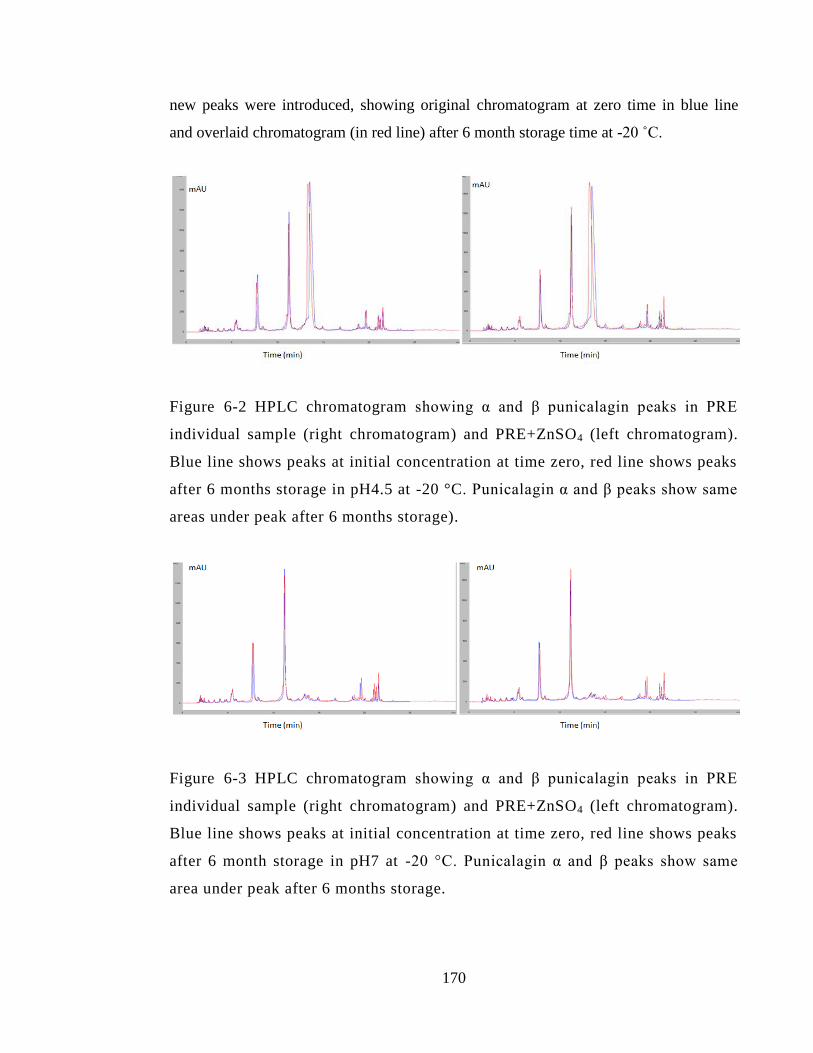
170
new peaks were introduced, showing original chromatogram at zero time in blue line
and overlaid chromatogram (in red line) after 6 month storage time at -20 ˚C.
Figure 6-2 HPLC chromatogram showing α and β punicalagin peaks in PRE
individual sample (right chromatogram) and PRE+ZnSO4 (left chromatogram).
Blue line shows peaks at initial concentration at time zero, red line shows peaks
after 6 months storage in pH4.5 at -20 °C. Punicalagin α and β peaks show same
areas under peak after 6 months storage).
Figure 6-3 HPLC chromatogram showing α and β punicalagin peaks in PRE
individual sample (right chromatogram) and PRE+ZnSO4 (left chromatogram).
Blue line shows peaks at initial concentration at time zero, red line shows peaks
after 6 month storage in pH7 at -20 °C. Punicalagin α and β peaks show same
area under peak after 6 months storage.
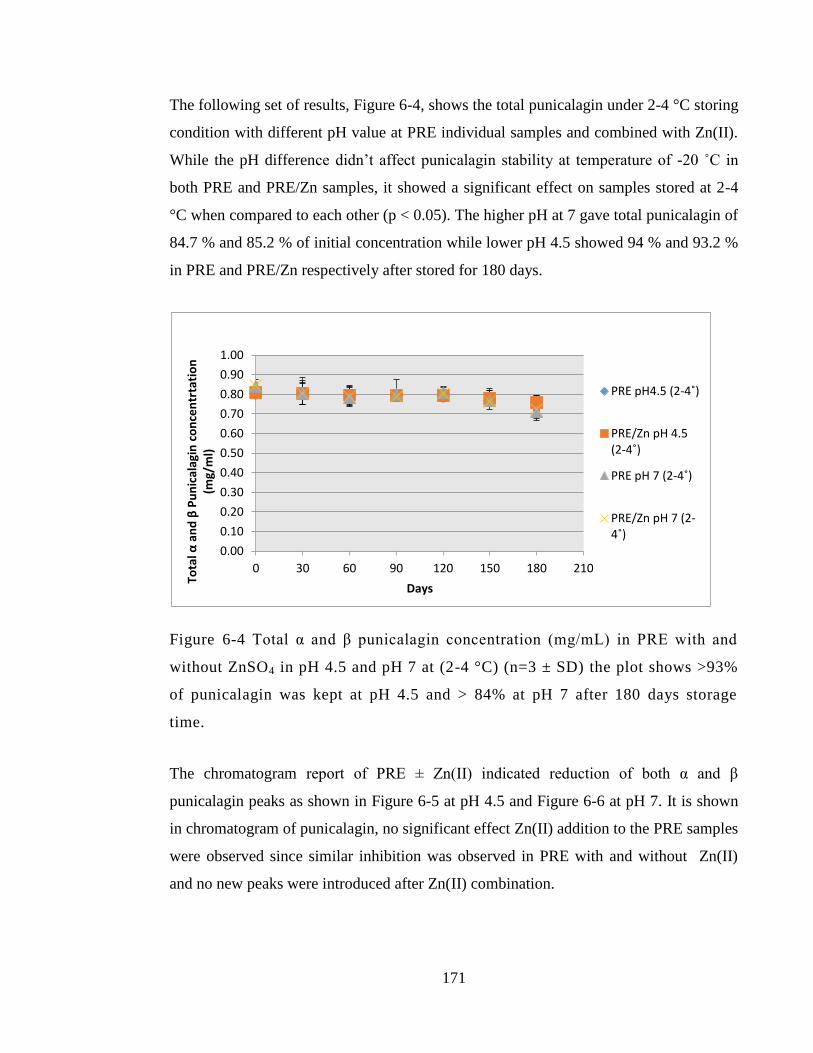
171
The following set of results, Figure 6-4, shows the total punicalagin under 2-4 °C storing
condition with different pH value at PRE individual samples and combined with Zn(II).
While the pH difference didn’t affect punicalagin stability at temperature of -20 ˚C in
both PRE and PRE/Zn samples, it showed a significant effect on samples stored at 2-4
°C when compared to each other (p < 0.05). The higher pH at 7 gave total punicalagin of
84.7 % and 85.2 % of initial concentration while lower pH 4.5 showed 94 % and 93.2 %
in PRE and PRE/Zn respectively after stored for 180 days.
Figure 6-4 Total α and β punicalagin concentration (mg/mL) in PRE with and
without ZnSO4 in pH 4.5 and pH 7 at (2-4 °C) (n=3 ± SD) the plot shows >93%
of punicalagin was kept at pH 4.5 and > 84% at pH 7 after 180 days storage
time.
The chromatogram report of PRE ± Zn(II) indicated reduction of both α and β
punicalagin peaks as shown in Figure 6-5 at pH 4.5 and Figure 6-6 at pH 7. It is shown
in chromatogram of punicalagin, no significant effect Zn(II) addition to the PRE samples
were observed since similar inhibition was observed in PRE with and without Zn(II)
and no new peaks were introduced after Zn(II) combination.
0.00
0.10
0.20
0.30
0.40
0.50
0.60
0.70
0.80
0.90
1.00
0 30 60 90 120 150 180 210
Tota
l α a
nd
β P
un
ical
agin
co
nce
ntr
tati
on
(m
g/m
l)
Days
PRE pH4.5 (2-4˚)
PRE/Zn pH 4.5 (2-4˚)
PRE pH 7 (2-4˚)
PRE/Zn pH 7 (2-4˚)
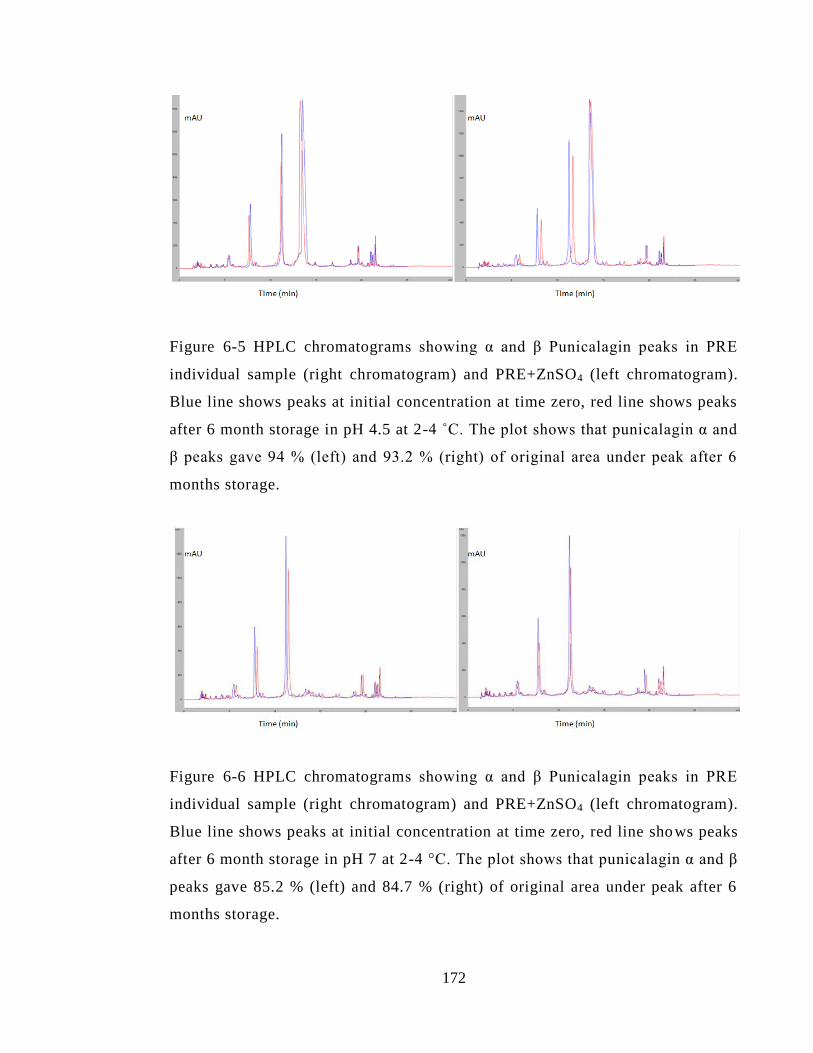
172
Figure 6-5 HPLC chromatograms showing α and β Punicalagin peaks in PRE
individual sample (right chromatogram) and PRE+ZnSO4 (left chromatogram).
Blue line shows peaks at initial concentration at time zero, red line shows peaks
after 6 month storage in pH 4.5 at 2-4 ˚C. The plot shows that punicalagin α and
β peaks gave 94 % (left) and 93.2 % (right) of original area under peak after 6
months storage.
Figure 6-6 HPLC chromatograms showing α and β Punicalagin peaks in PRE
individual sample (right chromatogram) and PRE+ZnSO4 (left chromatogram).
Blue line shows peaks at initial concentration at time zero, red line shows peaks
after 6 month storage in pH 7 at 2-4 °C. The plot shows that punicalagin α and β
peaks gave 85.2 % (left) and 84.7 % (right) of original area under peak after 6
months storage.
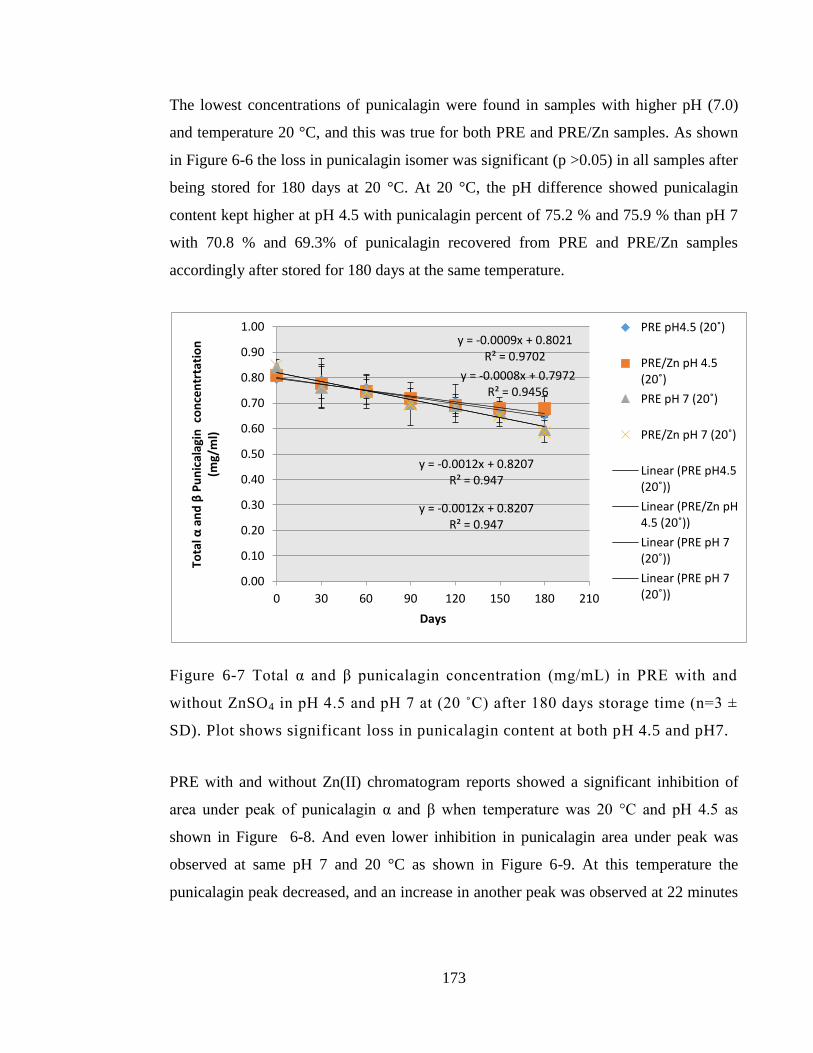
173
The lowest concentrations of punicalagin were found in samples with higher pH (7.0)
and temperature 20 °C, and this was true for both PRE and PRE/Zn samples. As shown
in Figure 6-6 the loss in punicalagin isomer was significant (p >0.05) in all samples after
being stored for 180 days at 20 °C. At 20 °C, the pH difference showed punicalagin
content kept higher at pH 4.5 with punicalagin percent of 75.2 % and 75.9 % than pH 7
with 70.8 % and 69.3% of punicalagin recovered from PRE and PRE/Zn samples
accordingly after stored for 180 days at the same temperature.
Figure 6-7 Total α and β punicalagin concentration (mg/mL) in PRE with and
without ZnSO4 in pH 4.5 and pH 7 at (20 ˚C) after 180 days storage time (n=3 ±
SD). Plot shows significant loss in punicalagin content at both pH 4.5 and pH7.
PRE with and without Zn(II) chromatogram reports showed a significant inhibition of
area under peak of punicalagin α and β when temperature was 20 °C and pH 4.5 as
shown in Figure 6-8. And even lower inhibition in punicalagin area under peak was
observed at same pH 7 and 20 °C as shown in Figure 6-9. At this temperature the
punicalagin peak decreased, and an increase in another peak was observed at 22 minutes
y = -0.0009x + 0.8021 R² = 0.9702
y = -0.0008x + 0.7972 R² = 0.9456
y = -0.0012x + 0.8207 R² = 0.947
y = -0.0012x + 0.8207 R² = 0.947
0.00
0.10
0.20
0.30
0.40
0.50
0.60
0.70
0.80
0.90
1.00
0 30 60 90 120 150 180 210
Tota
l α a
nd
β P
un
ical
agin
co
nce
ntr
tati
on
(m
g/m
l)
Days
PRE pH4.5 (20˚)
PRE/Zn pH 4.5 (20˚)
PRE pH 7 (20˚)
PRE/Zn pH 7 (20˚)
Linear (PRE pH4.5 (20˚))
Linear (PRE/Zn pH 4.5 (20˚))
Linear (PRE pH 7 (20˚))
Linear (PRE pH 7 (20˚))
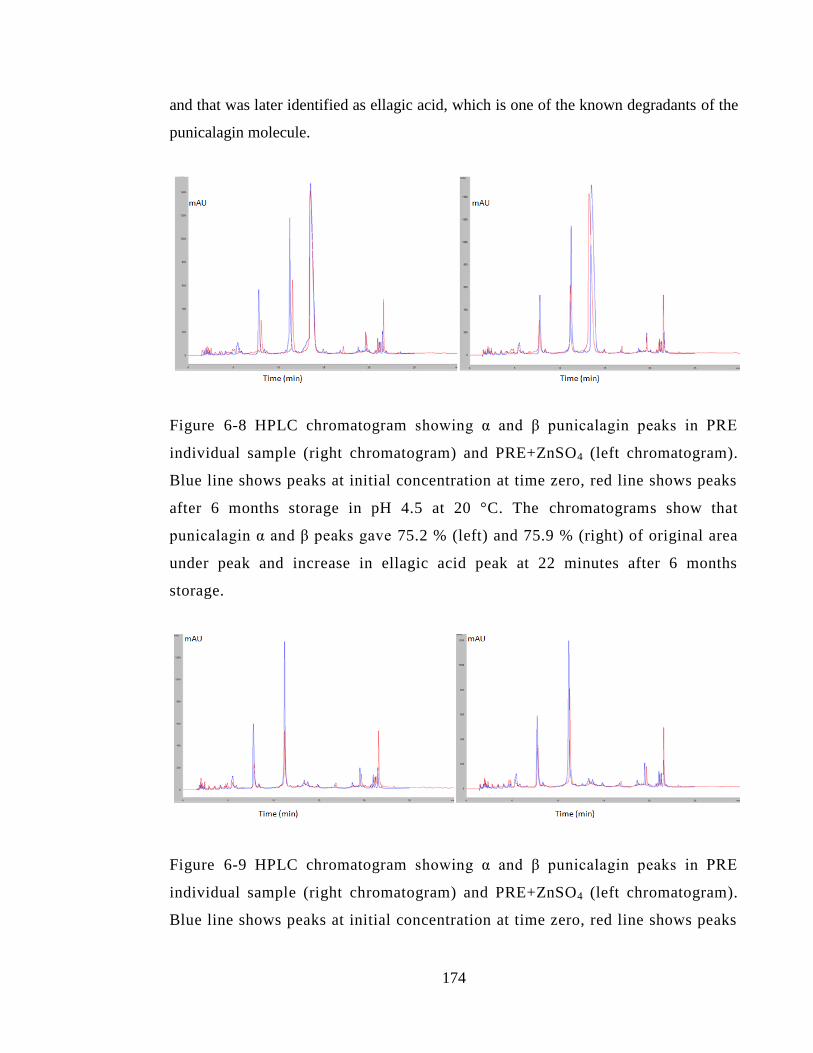
174
and that was later identified as ellagic acid, which is one of the known degradants of the
punicalagin molecule.
Figure 6-8 HPLC chromatogram showing α and β punicalagin peaks in PRE
individual sample (right chromatogram) and PRE+ZnSO4 (left chromatogram).
Blue line shows peaks at initial concentration at time zero, red line shows peaks
after 6 months storage in pH 4.5 at 20 °C. The chromatograms show that
punicalagin α and β peaks gave 75.2 % (left) and 75.9 % (right) of original area
under peak and increase in ellagic acid peak at 22 minutes after 6 months
storage.
Figure 6-9 HPLC chromatogram showing α and β punicalagin peaks in PRE
individual sample (right chromatogram) and PRE+ZnSO4 (left chromatogram).
Blue line shows peaks at initial concentration at time zero, red line shows peaks
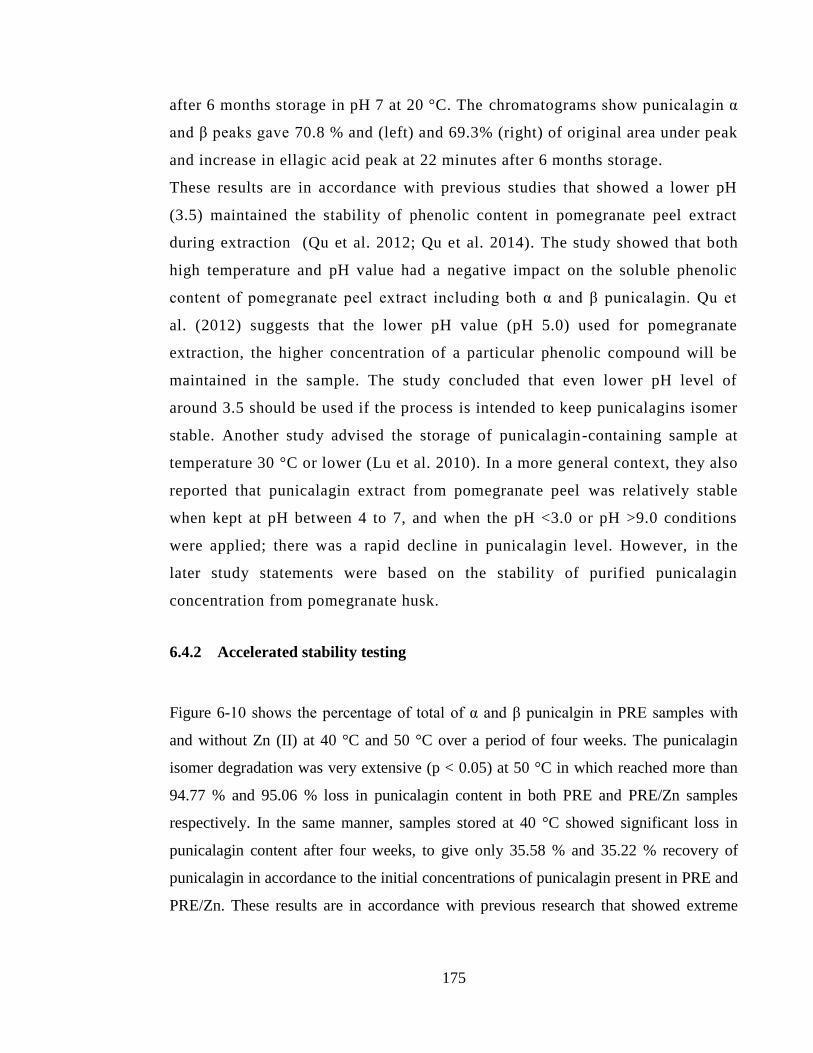
175
after 6 months storage in pH 7 at 20 °C. The chromatograms show punicalagin α
and β peaks gave 70.8 % and (left) and 69.3% (right) of original area under peak
and increase in ellagic acid peak at 22 minutes after 6 months storage.
These results are in accordance with previous studies that showed a lower pH
(3.5) maintained the stability of phenolic content in pomegranate peel extract
during extraction (Qu et al. 2012; Qu et al. 2014). The study showed that both
high temperature and pH value had a negative impact on the soluble phenolic
content of pomegranate peel extract including both α and β punicalagin. Qu et
al. (2012) suggests that the lower pH value (pH 5.0) used for pomegranate
extraction, the higher concentration of a particular phenolic compound will be
maintained in the sample. The study concluded that even lower pH level of
around 3.5 should be used if the process is intended to keep punicalagins isomer
stable. Another study advised the storage of punicalagin-containing sample at
temperature 30 °C or lower (Lu et al. 2010). In a more general context, they also
reported that punicalagin extract from pomegranate peel was relatively stable
when kept at pH between 4 to 7, and when the pH <3.0 or pH >9.0 conditions
were applied; there was a rapid decline in punicalagin level. However, in the
later study statements were based on the stability of purified punicalagin
concentration from pomegranate husk.
6.4.2 Accelerated stability testing
Figure 6-10 shows the percentage of total of α and β punicalgin in PRE samples with
and without Zn (II) at 40 °C and 50 °C over a period of four weeks. The punicalagin
isomer degradation was very extensive (p < 0.05) at 50 °C in which reached more than
94.77 % and 95.06 % loss in punicalagin content in both PRE and PRE/Zn samples
respectively. In the same manner, samples stored at 40 °C showed significant loss in
punicalagin content after four weeks, to give only 35.58 % and 35.22 % recovery of
punicalagin in accordance to the initial concentrations of punicalagin present in PRE and
PRE/Zn. These results are in accordance with previous research that showed extreme
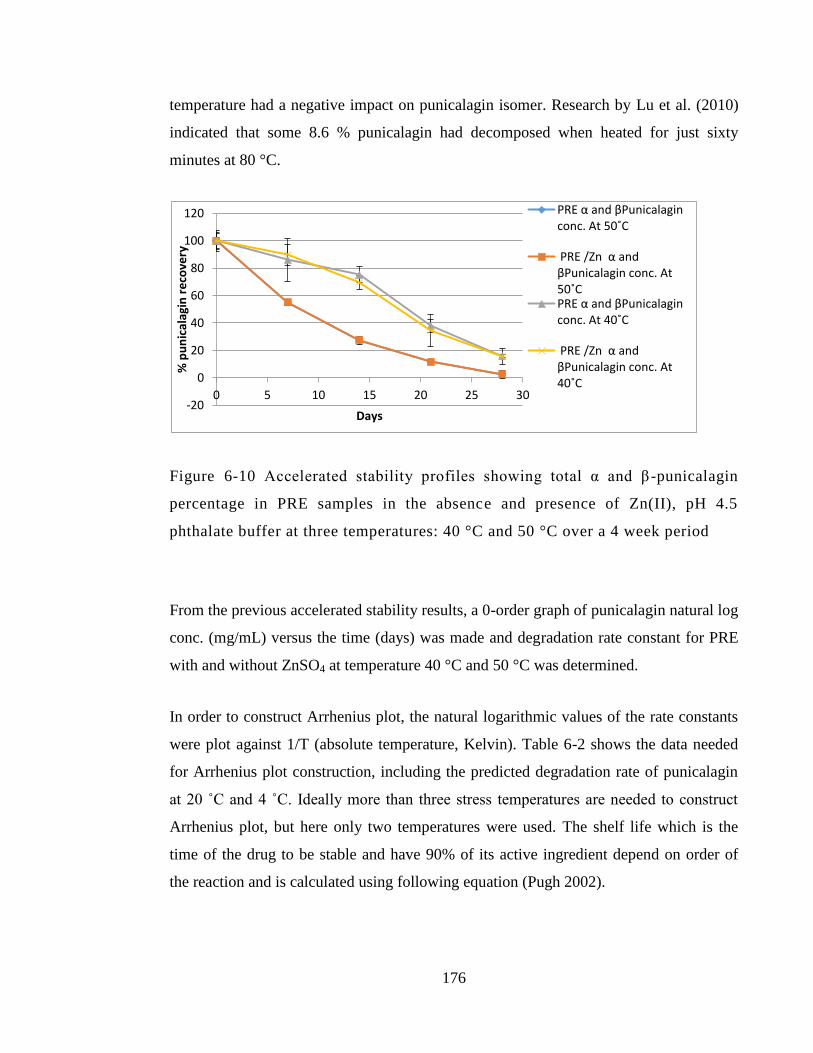
176
temperature had a negative impact on punicalagin isomer. Research by Lu et al. (2010)
indicated that some 8.6 % punicalagin had decomposed when heated for just sixty
minutes at 80 °C.
Figure 6-10 Accelerated stability profiles showing total α and β -punicalagin
percentage in PRE samples in the absence and presence of Zn(II), pH 4.5
phthalate buffer at three temperatures: 40 °C and 50 °C over a 4 week period
From the previous accelerated stability results, a 0-order graph of punicalagin natural log
conc. (mg/mL) versus the time (days) was made and degradation rate constant for PRE
with and without ZnSO4 at temperature 40 °C and 50 °C was determined.
In order to construct Arrhenius plot, the natural logarithmic values of the rate constants
were plot against 1/T (absolute temperature, Kelvin). Table 6-2 shows the data needed
for Arrhenius plot construction, including the predicted degradation rate of punicalagin
at 20 ˚C and 4 ˚C. Ideally more than three stress temperatures are needed to construct
Arrhenius plot, but here only two temperatures were used. The shelf life which is the
time of the drug to be stable and have 90% of its active ingredient depend on order of
the reaction and is calculated using following equation (Pugh 2002).
-20
0
20
40
60
80
100
120
0 5 10 15 20 25 30
% p
un
ical
agin
re
cove
ry
Days
PRE α and βPunicalagin conc. At 50˚C
PRE /Zn α and βPunicalagin conc. At 50˚C PRE α and βPunicalagin conc. At 40˚C
PRE /Zn α and βPunicalagin conc. At 40˚C
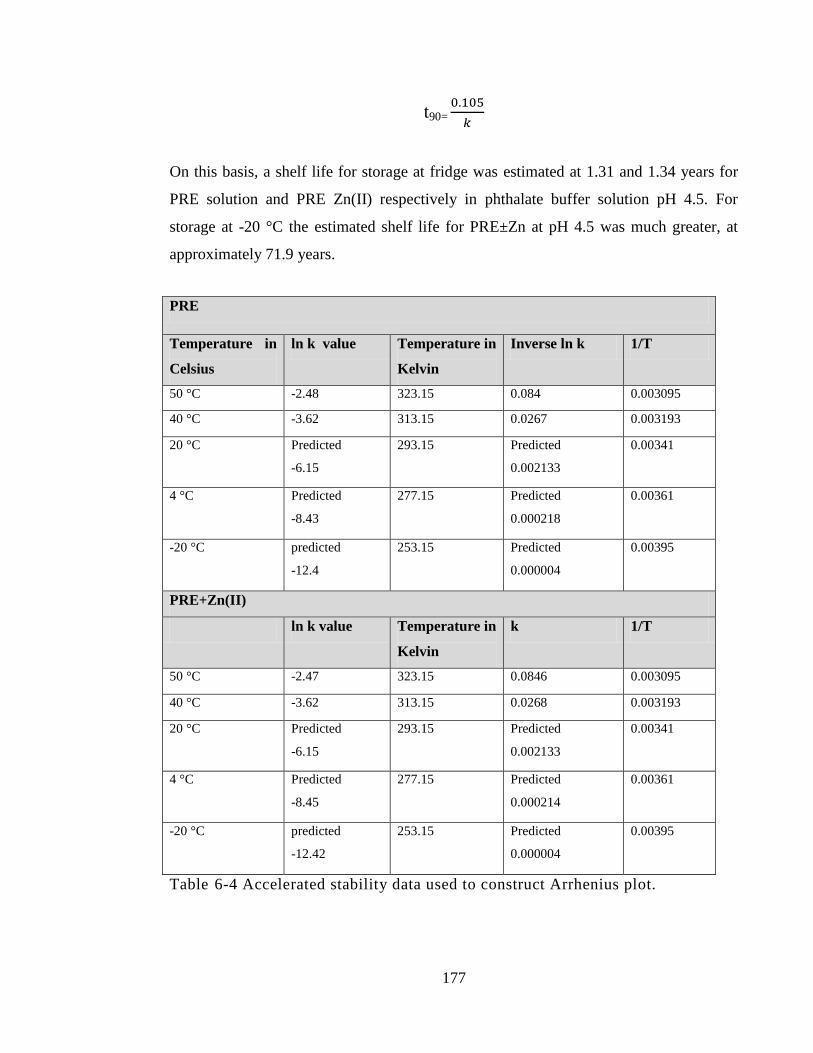
177
t90=
On this basis, a shelf life for storage at fridge was estimated at 1.31 and 1.34 years for
PRE solution and PRE Zn(II) respectively in phthalate buffer solution pH 4.5. For
storage at -20 °C the estimated shelf life for PRE±Zn at pH 4.5 was much greater, at
approximately 71.9 years.
PRE
Temperature in
Celsius
ln k value Temperature in
Kelvin
Inverse ln k 1/T
50 °C -2.48 323.15 0.084 0.003095
40 °C -3.62 313.15 0.0267 0.003193
20 °C Predicted
-6.15
293.15 Predicted
0.002133
0.00341
4 °C Predicted
-8.43
277.15 Predicted
0.000218
0.00361
-20 °C predicted
-12.4
253.15
Predicted
0.000004
0.00395
PRE+Zn(II)
ln k value Temperature in
Kelvin
k 1/T
50 °C -2.47 323.15 0.0846 0.003095
40 °C -3.62 313.15 0.0268 0.003193
20 °C Predicted
-6.15
293.15 Predicted
0.002133
0.00341
4 °C Predicted
-8.45
277.15 Predicted
0.000214
0.00361
-20 °C predicted
-12.42
253.15
Predicted
0.000004
0.00395
Table 6-4 Accelerated stability data used to construct Arrhenius plot.
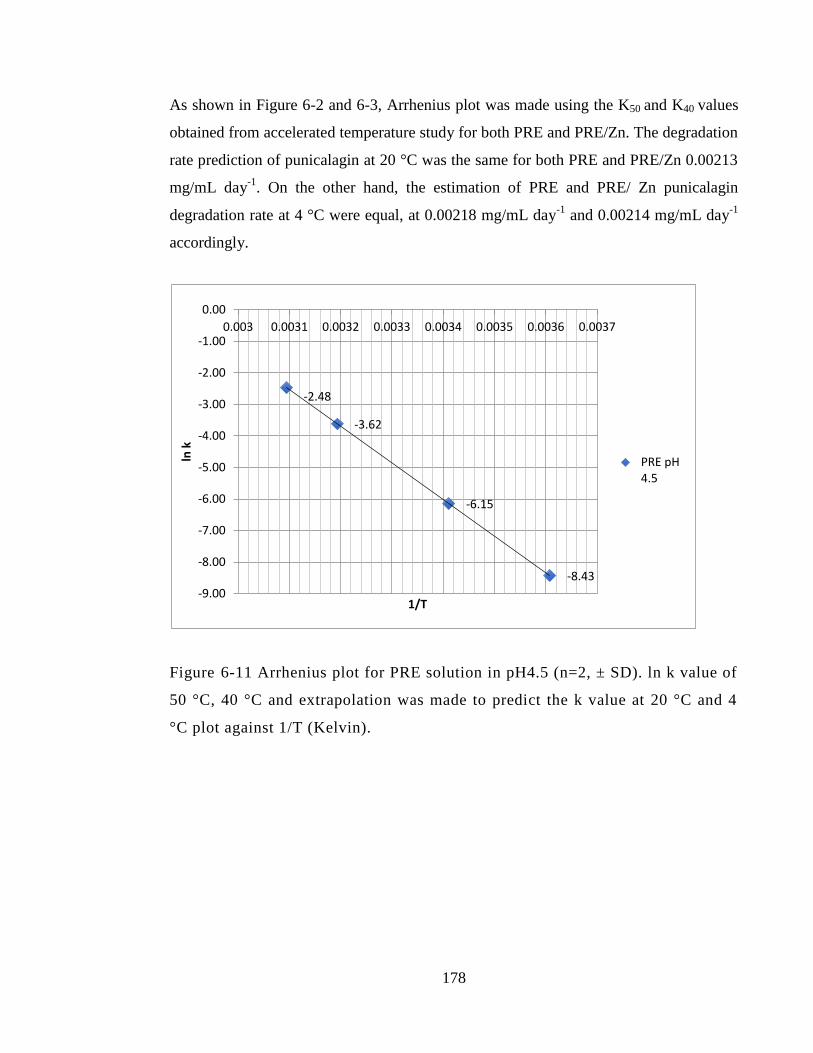
178
As shown in Figure 6-2 and 6-3, Arrhenius plot was made using the K50 and K40 values
obtained from accelerated temperature study for both PRE and PRE/Zn. The degradation
rate prediction of punicalagin at 20 °C was the same for both PRE and PRE/Zn 0.00213
mg/mL day-1
. On the other hand, the estimation of PRE and PRE/ Zn punicalagin
degradation rate at 4 °C were equal, at 0.00218 mg/mL day-1
and 0.00214 mg/mL day-1
accordingly.
Figure 6-11 Arrhenius plot for PRE solution in pH4.5 (n=2, ± SD). ln k value of
50 °C, 40 °C and extrapolation was made to predict the k value at 20 °C and 4
°C plot against 1/T (Kelvin).
-2.48
-3.62
-6.15
-8.43
-9.00
-8.00
-7.00
-6.00
-5.00
-4.00
-3.00
-2.00
-1.00
0.00
0.003 0.0031 0.0032 0.0033 0.0034 0.0035 0.0036 0.0037
ln k
1/T
PRE pH 4.5
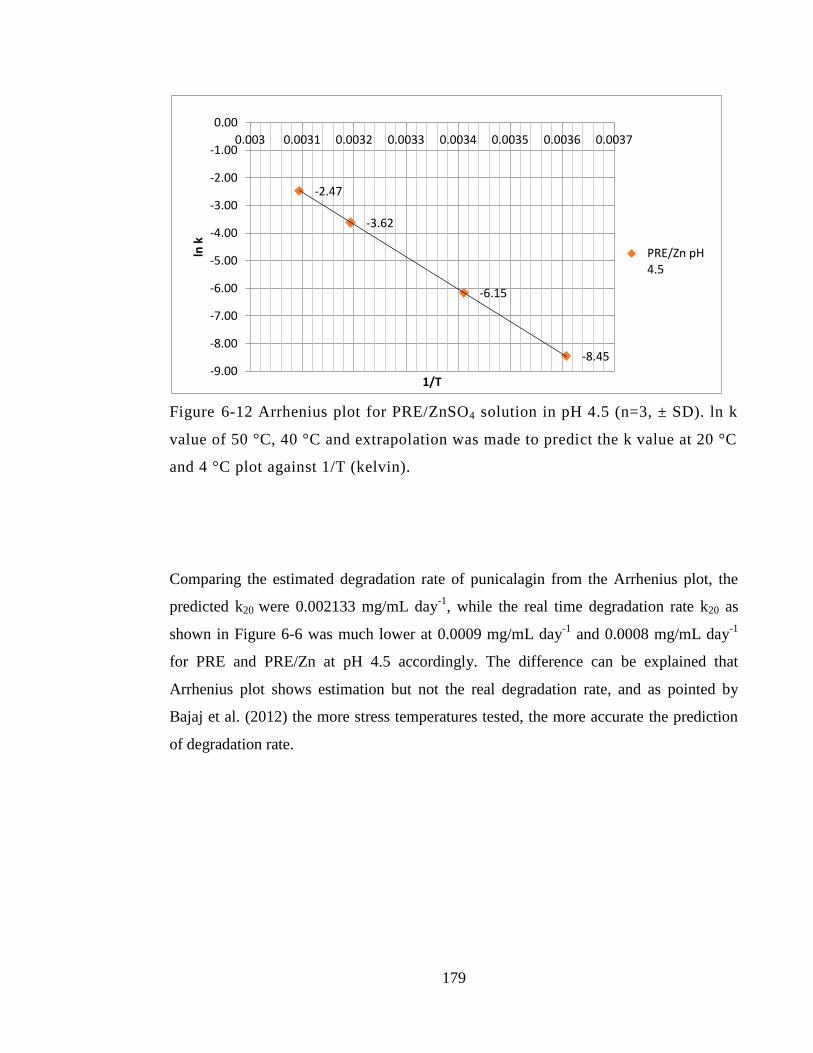
179
Figure 6-12 Arrhenius plot for PRE/ZnSO4 solution in pH 4.5 (n=3, ± SD). ln k
value of 50 °C, 40 °C and extrapolation was made to predict the k value at 20 °C
and 4 °C plot against 1/T (kelvin).
Comparing the estimated degradation rate of punicalagin from the Arrhenius plot, the
predicted k20 were 0.002133 mg/mL day-1
, while the real time degradation rate k20 as
shown in Figure 6-6 was much lower at 0.0009 mg/mL day-1
and 0.0008 mg/mL day-1
for PRE and PRE/Zn at pH 4.5 accordingly. The difference can be explained that
Arrhenius plot shows estimation but not the real degradation rate, and as pointed by
Bajaj et al. (2012) the more stress temperatures tested, the more accurate the prediction
of degradation rate.
-2.47
-3.62
-6.15
-8.45 -9.00
-8.00
-7.00
-6.00
-5.00
-4.00
-3.00
-2.00
-1.00
0.00
0.003 0.0031 0.0032 0.0033 0.0034 0.0035 0.0036 0.0037
ln k
1/T
PRE/Zn pH 4.5
180
6.5 Discussion
In the present study, the effect of temperature and pH value on PRE individual samples
or combined with ZnSO4 were under investigation throughout real time stability study
for 6 month period time. Both variables at high, pH 7 and temperature 20 ˚C, showed a
significant impact on the stability of punicalagin α and β isomer after stored for 180
days. At temperature of -20 °C the effect of pH was diminished since all samples
showed >99% of punicalagin initial concentration after stored for 180 days. The largest
loss in punicalagin content was seen at pH 7 and 20 °C to give 29.2 % and 30.7 % after
180 day, compared to 17.9 % and 16 % loss resulting from punicalagin at pH 4.5 and 20
°C. Comparing the last results together, the pH difference at 20 °C, showed a significant
effect (p <0.05) and the % loss of punicalagin after 6 months, was almost half with
lower pH 4.5. In accordance with the present results, previous studies have demonstrated
the stability of liquid phenolic extracts produced from pomegranate peel over a period of
180 days and under three storage temperatures (4, 20 and 37 °C). The storage at higher
temperature was found to have a negative impact throughout the whole time of storage.
Storing extracts at low temperatures is thus advised to uphold an acceptable level of
quality and stability. In that study, products stored at 4 °C for up to 180 days, retained 67
% of the initial total soluble phenolic content (Qu et al. 2014).
Moreover, other research also investigated the stability of purified punicalagin under a
variety of conditions. Findings indicated that over 8.6 % punicalagin had decomposed
when they were heated for just one hour at 80 °C. However, almost all of the
punicalagin was stable at a constant temperature of 30 °C or lower. During the
punicalagin extraction process, it is thus important to keep temperatures below 30 °C.
This component was found to possess the most elevated absorbance at pH 3.0.
Furthermore, it was relatively stable when stored at pH 4-7, in that a slowly decreased
absorbance was identified. When the pH <3.0 or pH >9.0 conditions were applied
however, there was a significant decrease in its absorbance at 260nm. No reactions were
found between other metal ions and punicalagin, with punicalagin samples possessing
181
the same levels of absorbance when mixed with other metal ions as that of the
punicalagin solution alone. Houston (2011) studied the stability of a prototype hydrogel
which included the PRE and ZnSO4 as active ingredient and he found that total
punicalagin concentration showed no loss after being stored for 12 months occluded
from light and air stored at room temperature and pH 4.5. Furthermore, the positive
effect of lower pH value obtained in our results broadly agreed with the previous
reported study by Akbarpour et al. (2009), that PRE phenolic stability is greater at lower
pH value.
Next, the results are considered regarding to the stability of punicalagin in presence of
metal combination Zn(II). In our results, individual PRE punicalagin content were
compared the combined PRE with ZnSO4 and no negative or positive affect were seen (p
>0.05) at PRE after addition of ZnSO4 and that remain true for all tested pH and
temperature condition. This was pointed out by Houston (2011), when comparing PRE
combinations with either FeSO4 or ZnSO4. Analysis of punicalagin through HPLC,
showed that combining FeSO4 with PRE results in new unidentified peak and as the
FeSO4 concentration increased, the punicalagin peak decreased and the new peak
increased. Redox reaction between the Fe2+
+ punicalagin → Fe3+
, and black by product
resulted from the combination. It was speculated that the new peak must be due to the
formation of a complex between PRE (ie punicalagin) and Fe(III).
From our results, the addition of ZnSO4 to PRE showed no additional new peak in the
HPLC chromatogram of punicalagin and no peak was identified and that could be
attributed to the stability of Zn(II) ion to resist reaction. Another paper investigated the
effect of multiple metal combinations on the punicalagin chromatogram and eight
different metal ion solutions was investigated, including Na+
(NaCl), K+(KCl), Ca
2+
(CaCl2), Cu2+
(CuCl2), Zn2+
(ZnCl2), Mg2+
(MgCl2), Fe3+
(FeCl3), and Al3+
(AlCl3). Only
two metal ions, Cu2+
and Fe3+, showed a rapid decline in the punicalagin’s absorbance
and through alterations to its molecular structure while no such alteration was made with
Zn2+
. The authors (Lu et al., 2010) concluded that it is important not to use iron or
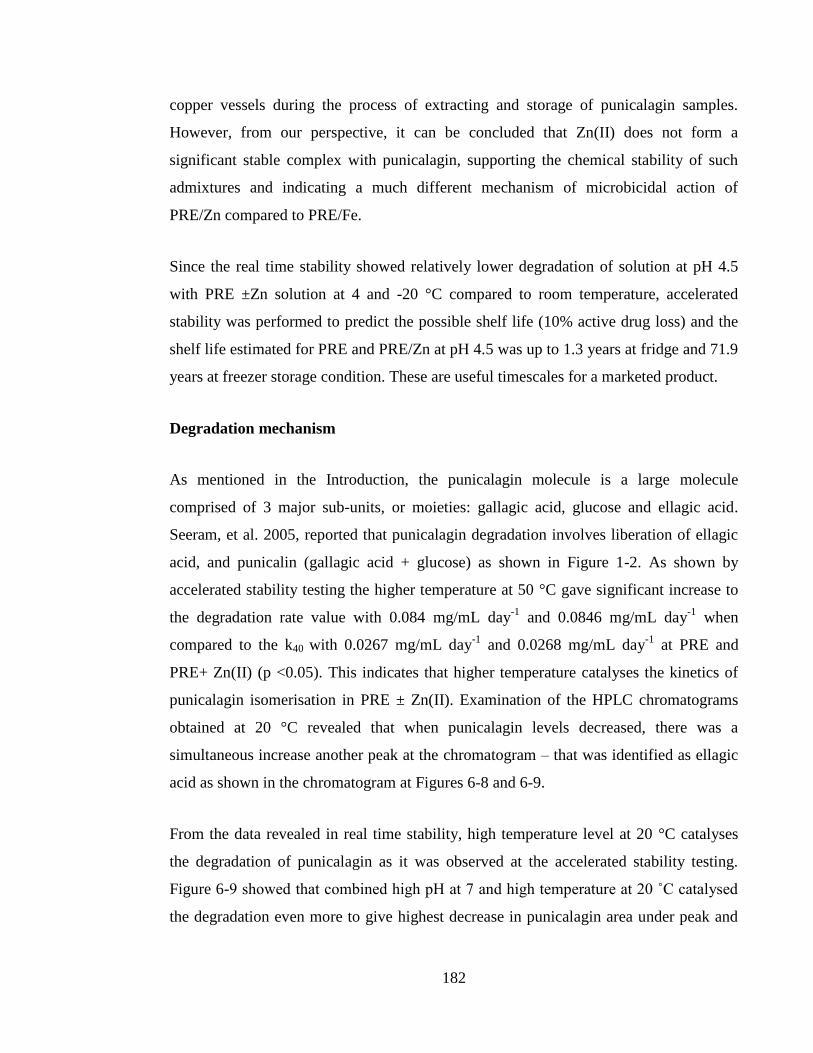
182
copper vessels during the process of extracting and storage of punicalagin samples.
However, from our perspective, it can be concluded that Zn(II) does not form a
significant stable complex with punicalagin, supporting the chemical stability of such
admixtures and indicating a much different mechanism of microbicidal action of
PRE/Zn compared to PRE/Fe.
Since the real time stability showed relatively lower degradation of solution at pH 4.5
with PRE ±Zn solution at 4 and -20 °C compared to room temperature, accelerated
stability was performed to predict the possible shelf life (10% active drug loss) and the
shelf life estimated for PRE and PRE/Zn at pH 4.5 was up to 1.3 years at fridge and 71.9
years at freezer storage condition. These are useful timescales for a marketed product.
Degradation mechanism
As mentioned in the Introduction, the punicalagin molecule is a large molecule
comprised of 3 major sub-units, or moieties: gallagic acid, glucose and ellagic acid.
Seeram, et al. 2005, reported that punicalagin degradation involves liberation of ellagic
acid, and punicalin (gallagic acid + glucose) as shown in Figure 1-2. As shown by
accelerated stability testing the higher temperature at 50 °C gave significant increase to
the degradation rate value with 0.084 mg/mL day-1
and 0.0846 mg/mL day-1
when
compared to the k40 with 0.0267 mg/mL day-1
and 0.0268 mg/mL day-1
at PRE and
PRE+ Zn(II) (p <0.05). This indicates that higher temperature catalyses the kinetics of
punicalagin isomerisation in PRE ± Zn(II). Examination of the HPLC chromatograms
obtained at 20 °C revealed that when punicalagin levels decreased, there was a
simultaneous increase another peak at the chromatogram – that was identified as ellagic
acid as shown in the chromatogram at Figures 6-8 and 6-9.
From the data revealed in real time stability, high temperature level at 20 °C catalyses
the degradation of punicalagin as it was observed at the accelerated stability testing.
Figure 6-9 showed that combined high pH at 7 and high temperature at 20 ˚C catalysed
the degradation even more to give highest decrease in punicalagin area under peak and
183
increased liberation of ellagic acid. Critically, the degradation rate was not affected by
presence of Zn(II), and that was shown by chromatogram after addition of Zn(II). PRE
chromatogram of same concentration shows same punicalagin isomer peaks when
compared to PRE/Zn combination as shown in the Figure 6-13.
Figure 6-13 HPLC chromatogram showing α and β punicalagin of PRE alone
(blue line) and PRE with ZnSO4 (red line). The chromatogram shows no new
peak introduction and no alteration of the original peaks of PRE chromatogram
after adding Zn(II).
6.6 Conclusion
Pomegranate rind extract solution with and without ZnSO4 was examined for stability as
determined by means of punicalagin loss after 6 month storage at two pH value (pH 4.5,
pH 7) and three storage temperature (-20 °C, 2-4 °C, 20 °C). The main conclusions from
this chapter are:
184
1. Both higher temperature and pH value had a significant impact on the
degradation of punicalagin (α and β) content after 180 days storage time period.
2. At temperature ≤ 4 °C , punicalagin was recovered at extent >90 % of initial
concentration at pH 4.5 after 180 days storage time period.
3. Overall PRE and PRE/Zn solution showed acceptable stability and recovery
percent of initial punicalagin when stored at pH 4.5 and stored at fridge or cooler
temperature.
4. The absence of additional peaks in HPLC chromatograms suggest no
complexation between PRE and Zn at both pH 4.5 and pH 7
5. Shelf life estimation (90% of active drug retained) of PRE and PRE/Zn solution
at pH 4.5 was 1.3 and 1.34 years when stored in the fridge (2-4 °C) and more
than 71.9 years when stored at freezer (-20 °C). These are useful timescales for a
commercial product.
185
Chapter 7: Preparation of topical
hydrogel formulations containing PRE
and ZnSO4
186
7.1 Introduction
Wound infection is common problem that occur in wound healing process. If the wound
healing process is prolonged > 12 weeks then it can be defined as chronic wound
(Harper, Young and McNaught, 2014). Treatment of chronic wounds is a process that
consists of multistep. These steps can be known by the TIME acronym. Initially the
damaged non-viable tissues (T) and debris are taken away by scissor or surgical
debridement. Then, infection (I) at the wound site should be treated with antimicrobial
and anti-inflammatory agents. Next, moisturizing (M) the area of the wound can be done
by use of a suitable dressing. Final step is addition of selected therapy such as growth
factors in order to promote the formation of granulation tissue and epithelialization (E)
process (Demidova-Rice et al. 2012).
Skin and wound antiseptics and irrigation treatments are very important to the healing
process itself and mostly importance in non healed or infected wound to sanitize and
remove superficial debris or excessive amount of exudates or any substances and
leftover from previous dressing (Main 2008). The first modern use of wound antiseptic
use was in 1865 by Joseph Lister, when reported the use of carbolic acid on wound
involved in compound fracture (Badoe 1994; Salami et al. 2006). For more than a
century, numerous antiseptics have been introduced for wound cleansing and irrigation
purposes. Recently a considerable literature has grown up around the importance role of
using antiseptic in wounds and some has defined it as a detrimental to the healing
process (Drosou et al. 2003).
For chronic wound, antiseptic and cleansing agents should be used in routinely basis to
decrease the risk of persistence wound infection. Certain properties should be considered
in those agents. First and most important is to decrease the infection risk by decreasing
microbial count at the infection site. Additionally antiseptic agent should be non-toxic to
human and don’t cause any sensitivity reaction. Finally those agent should be in
reasonable coast which will make it easy available an accessible to use (Main 2008). A
187
variety of antiseptic classes has been introduced such as: alcohols, biguanides,
bisphenols, iodine compounds, quaternary ammonium compounds, silver compounds,
chlorine compounds, and peroxygens (Drosou et al. 2003). One of the widely used
antiseptic agents in wound is chlorhexidine from the biguanides class and it is
commercially available in two concentrations 0.05 and 4%.
Among practicing nurses, anecdotal evidence reported by Main (2008) that
chlorhexidine 4% is most often used because of its availability and widely used as hand
sanitizer. Although the main indication of the 0.05% is to irrigate the wound and 4% is
clinically indicated as hand sanitizer and not to be applied on body cavities.
Chlorhexidine use as antiseptic in wounds has been controversial despite its strong
activity as an antimicrobial agent with broad spectrum to kill Gram positive and Gram
negative bacteria, fungi and viruses (Sibbald et al. 2000), the cytotoxicity has been in
question in many of the literature. Chlorhexidine was one in several antiseptics that has
been studies by Brennan et al. (1985) using rabbit ear champers model for wound
healing. The study investigating the effects of several antiseptic agents, including
chlorhexidine 0.05%, on granulation tissue used a rabbit ear chamber which is a
technique for in vivo microscopic studies of cells and tissues including revascularisation
process that appear in wound healing process. Change and toxic effect was seen by laser
Doppler in capillary circulation at all contact time with chlorhexidine from five minute
and up to 60 minutes. The author has come to emphasise that the balance between
antibacterial activity and high toxicity of chlorhexidine is in fine line. Additionally,
wound-healing properties has been an issue with chlorhexidine since the wound healing
was delayed in reported study that compared three antiseptic and irrigation agents effect
on wound healing process (Salami et al. 2006). Wound healing time was longer when
chlorhexidine dressing was used in comparison to tap water and Normal saline
dressings. The in vivo study involved the evaluation of 2cm x 2cm wound healing on
Wister rats. The study showed a significant decrease in wound healing time with
chlorhexidine group with almost 27 days for complete healing while with tap water and
normal saline it was 17 and 16 days respectively.
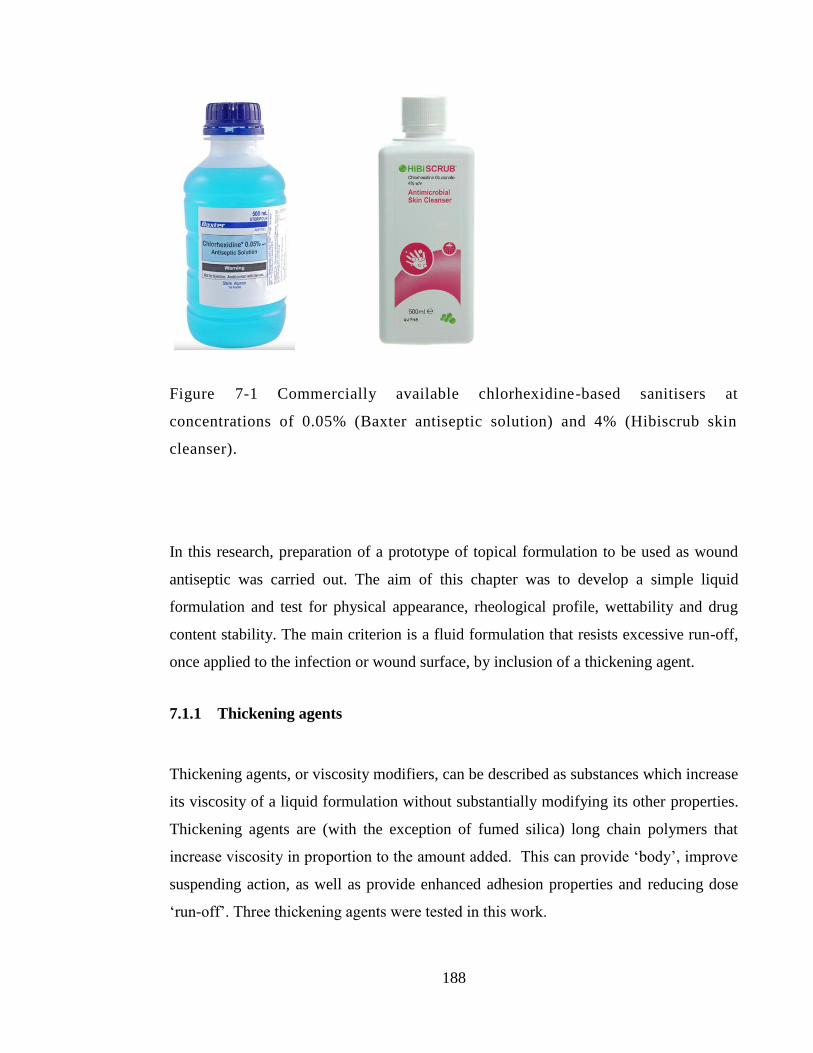
188
Figure 7-1 Commercially available chlorhexidine-based sanitisers at
concentrations of 0.05% (Baxter antiseptic solution) and 4% (Hibiscrub skin
cleanser).
In this research, preparation of a prototype of topical formulation to be used as wound
antiseptic was carried out. The aim of this chapter was to develop a simple liquid
formulation and test for physical appearance, rheological profile, wettability and drug
content stability. The main criterion is a fluid formulation that resists excessive run-off,
once applied to the infection or wound surface, by inclusion of a thickening agent.
7.1.1 Thickening agents
Thickening agents, or viscosity modifiers, can be described as substances which increase
its viscosity of a liquid formulation without substantially modifying its other properties.
Thickening agents are (with the exception of fumed silica) long chain polymers that
increase viscosity in proportion to the amount added. This can provide ‘body’, improve
suspending action, as well as provide enhanced adhesion properties and reducing dose
‘run-off’. Three thickening agents were tested in this work.
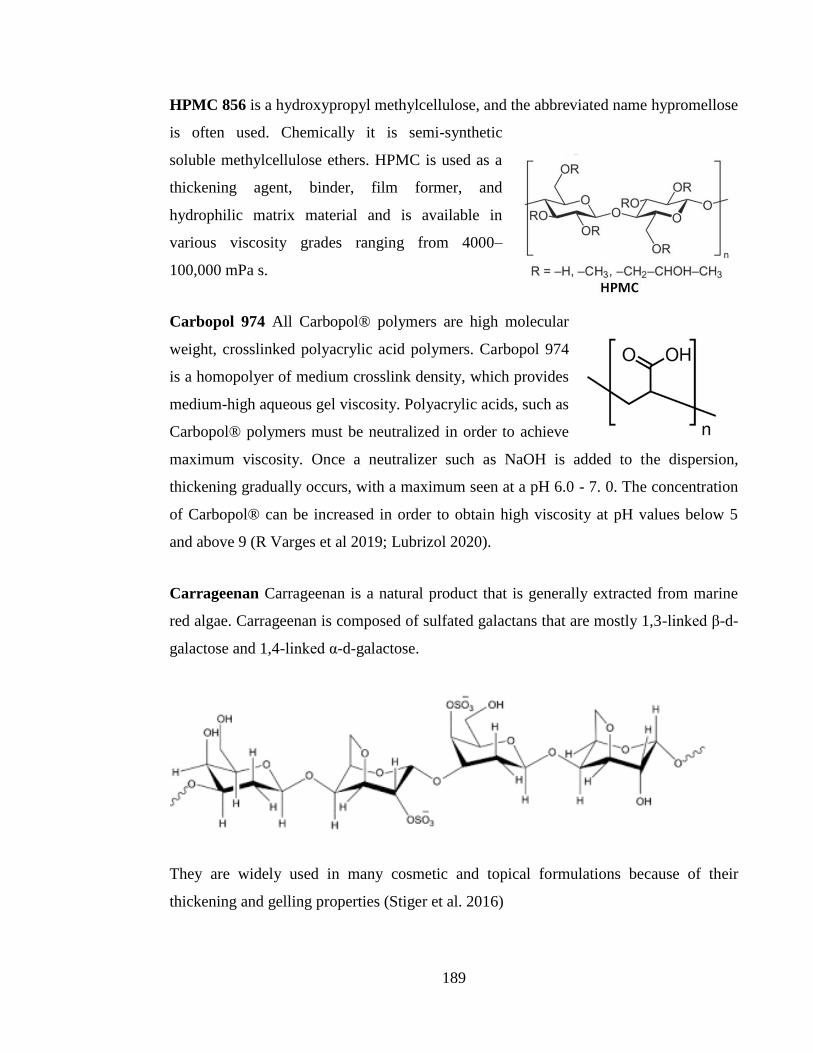
189
HPMC 856 is a hydroxypropyl methylcellulose, and the abbreviated name hypromellose
is often used. Chemically it is semi-synthetic
soluble methylcellulose ethers. HPMC is used as a
thickening agent, binder, film former, and
hydrophilic matrix material and is available in
various viscosity grades ranging from 4000–
100,000 mPa s.
Carbopol 974 All Carbopol® polymers are high molecular
weight, crosslinked polyacrylic acid polymers. Carbopol 974
is a homopolyer of medium crosslink density, which provides
medium-high aqueous gel viscosity. Polyacrylic acids, such as
Carbopol® polymers must be neutralized in order to achieve
maximum viscosity. Once a neutralizer such as NaOH is added to the dispersion,
thickening gradually occurs, with a maximum seen at a pH 6.0 - 7. 0. The concentration
of Carbopol® can be increased in order to obtain high viscosity at pH values below 5
and above 9 (R Varges et al 2019; Lubrizol 2020).
Carrageenan Carrageenan is a natural product that is generally extracted from marine
red algae. Carrageenan is composed of sulfated galactans that are mostly 1,3-linked β-d-
galactose and 1,4-linked α-d-galactose.
They are widely used in many cosmetic and topical formulations because of their
thickening and gelling properties (Stiger et al. 2016)
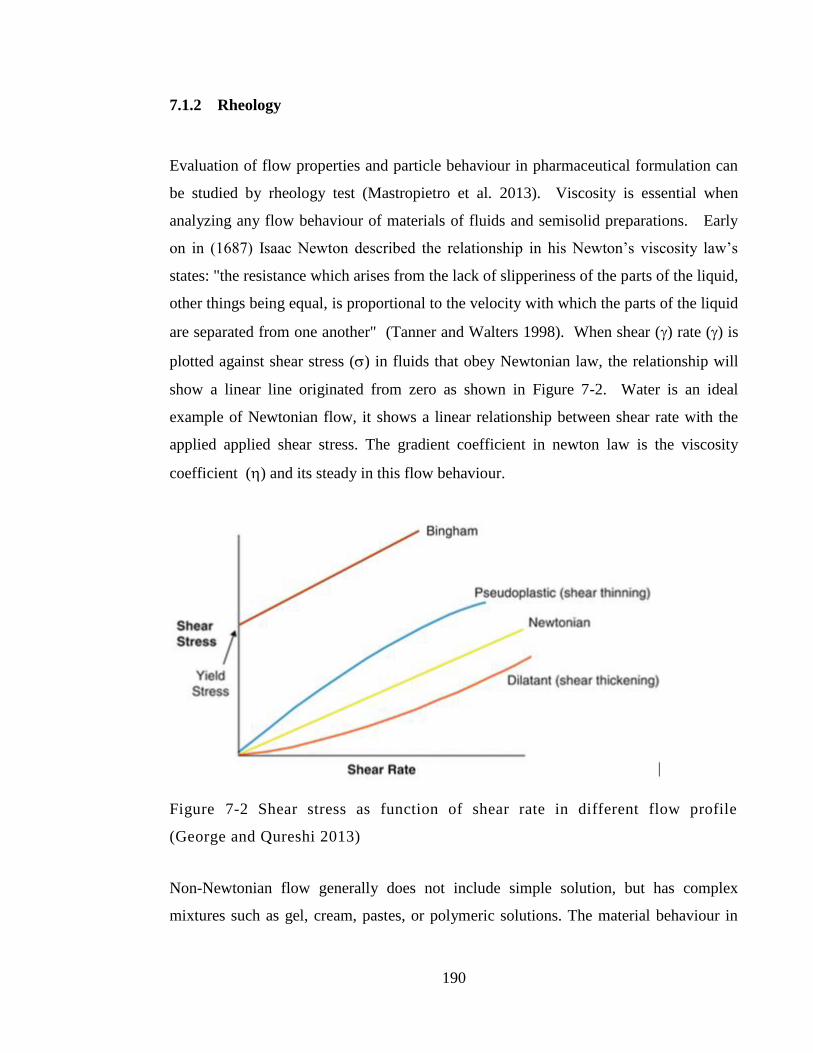
190
7.1.2 Rheology
Evaluation of flow properties and particle behaviour in pharmaceutical formulation can
be studied by rheology test (Mastropietro et al. 2013). Viscosity is essential when
analyzing any flow behaviour of materials of fluids and semisolid preparations. Early
on in (1687) Isaac Newton described the relationship in his Newton’s viscosity law’s
states: "the resistance which arises from the lack of slipperiness of the parts of the liquid,
other things being equal, is proportional to the velocity with which the parts of the liquid
are separated from one another" (Tanner and Walters 1998). When shear () rate () is
plotted against shear stress () in fluids that obey Newtonian law, the relationship will
show a linear line originated from zero as shown in Figure 7-2. Water is an ideal
example of Newtonian flow, it shows a linear relationship between shear rate with the
applied applied shear stress. The gradient coefficient in newton law is the viscosity
coefficient () and its steady in this flow behaviour.
Figure 7-2 Shear stress as function of shear rate in different flow profile
(George and Qureshi 2013)
Non-Newtonian flow generally does not include simple solution, but has complex
mixtures such as gel, cream, pastes, or polymeric solutions. The material behaviour in
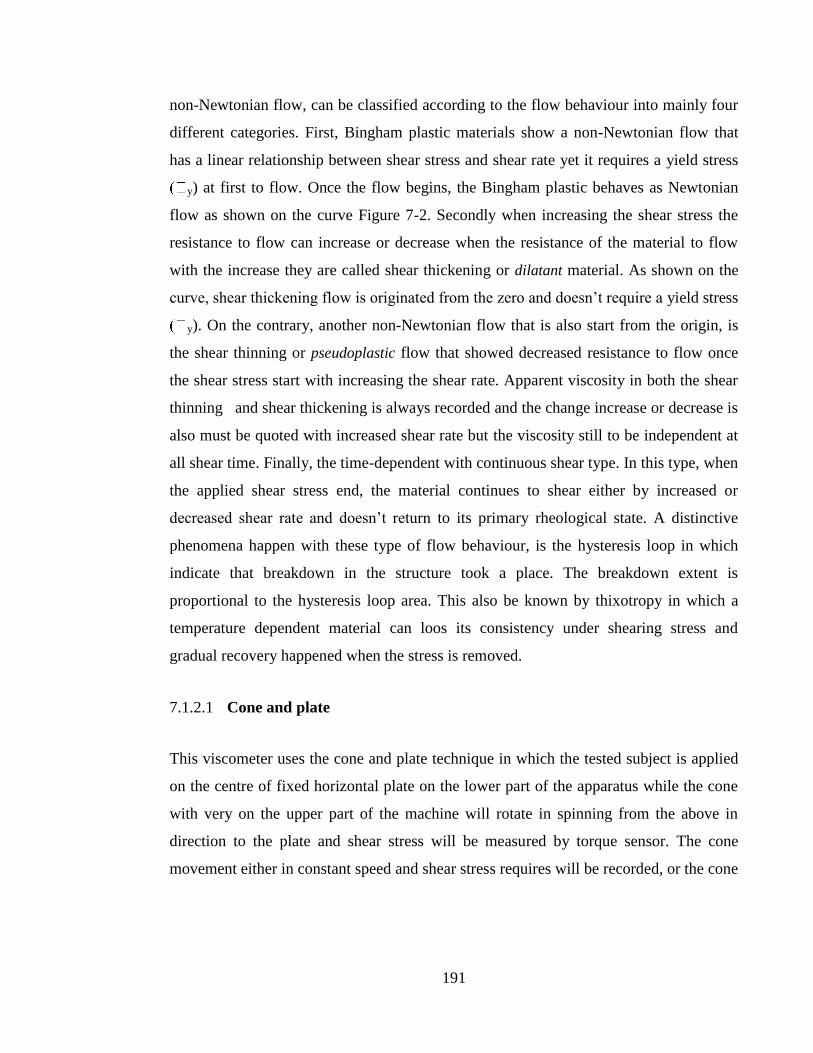
191
non-Newtonian flow, can be classified according to the flow behaviour into mainly four
different categories. First, Bingham plastic materials show a non-Newtonian flow that
has a linear relationship between shear stress and shear rate yet it requires a yield stress
y) at first to flow. Once the flow begins, the Bingham plastic behaves as Newtonian
flow as shown on the curve Figure 7-2. Secondly when increasing the shear stress the
resistance to flow can increase or decrease when the resistance of the material to flow
with the increase they are called shear thickening or dilatant material. As shown on the
curve, shear thickening flow is originated from the zero and doesn’t require a yield stress
y). On the contrary, another non-Newtonian flow that is also start from the origin, is
the shear thinning or pseudoplastic flow that showed decreased resistance to flow once
the shear stress start with increasing the shear rate. Apparent viscosity in both the shear
thinning and shear thickening is always recorded and the change increase or decrease is
also must be quoted with increased shear rate but the viscosity still to be independent at
all shear time. Finally, the time-dependent with continuous shear type. In this type, when
the applied shear stress end, the material continues to shear either by increased or
decreased shear rate and doesn’t return to its primary rheological state. A distinctive
phenomena happen with these type of flow behaviour, is the hysteresis loop in which
indicate that breakdown in the structure took a place. The breakdown extent is
proportional to the hysteresis loop area. This also be known by thixotropy in which a
temperature dependent material can loos its consistency under shearing stress and
gradual recovery happened when the stress is removed.
7.1.2.1 Cone and plate
This viscometer uses the cone and plate technique in which the tested subject is applied
on the centre of fixed horizontal plate on the lower part of the apparatus while the cone
with very on the upper part of the machine will rotate in spinning from the above in
direction to the plate and shear stress will be measured by torque sensor. The cone
movement either in constant speed and shear stress requires will be recorded, or the cone
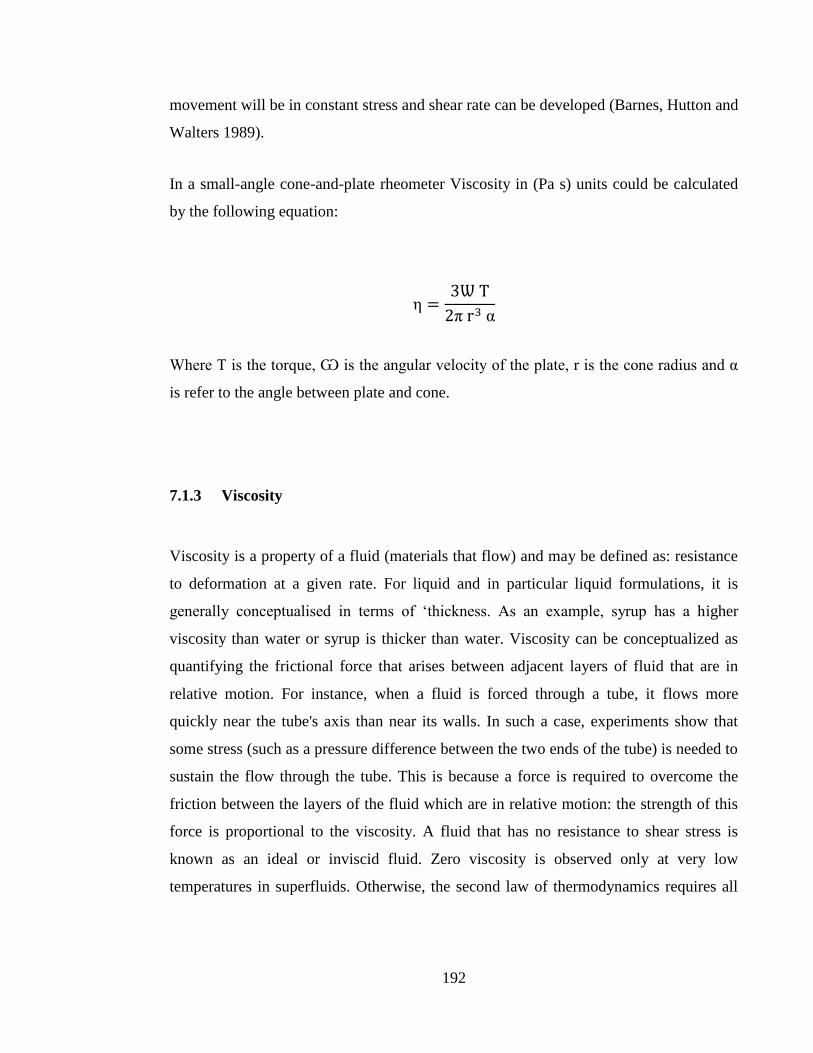
192
movement will be in constant stress and shear rate can be developed (Barnes, Hutton and
Walters 1989).
In a small-angle cone-and-plate rheometer Viscosity in (Pa s) units could be calculated
by the following equation:
α
Where T is the torque, Ѡ is the angular velocity of the plate, r is the cone radius and α
is refer to the angle between plate and cone.
7.1.3 Viscosity
Viscosity is a property of a fluid (materials that flow) and may be defined as: resistance
to deformation at a given rate. For liquid and in particular liquid formulations, it is
generally conceptualised in terms of ‘thickness. As an example, syrup has a higher
viscosity than water or syrup is thicker than water. Viscosity can be conceptualized as
quantifying the frictional force that arises between adjacent layers of fluid that are in
relative motion. For instance, when a fluid is forced through a tube, it flows more
quickly near the tube's axis than near its walls. In such a case, experiments show that
some stress (such as a pressure difference between the two ends of the tube) is needed to
sustain the flow through the tube. This is because a force is required to overcome the
friction between the layers of the fluid which are in relative motion: the strength of this
force is proportional to the viscosity. A fluid that has no resistance to shear stress is
known as an ideal or inviscid fluid. Zero viscosity is observed only at very low
temperatures in superfluids. Otherwise, the second law of thermodynamics requires all
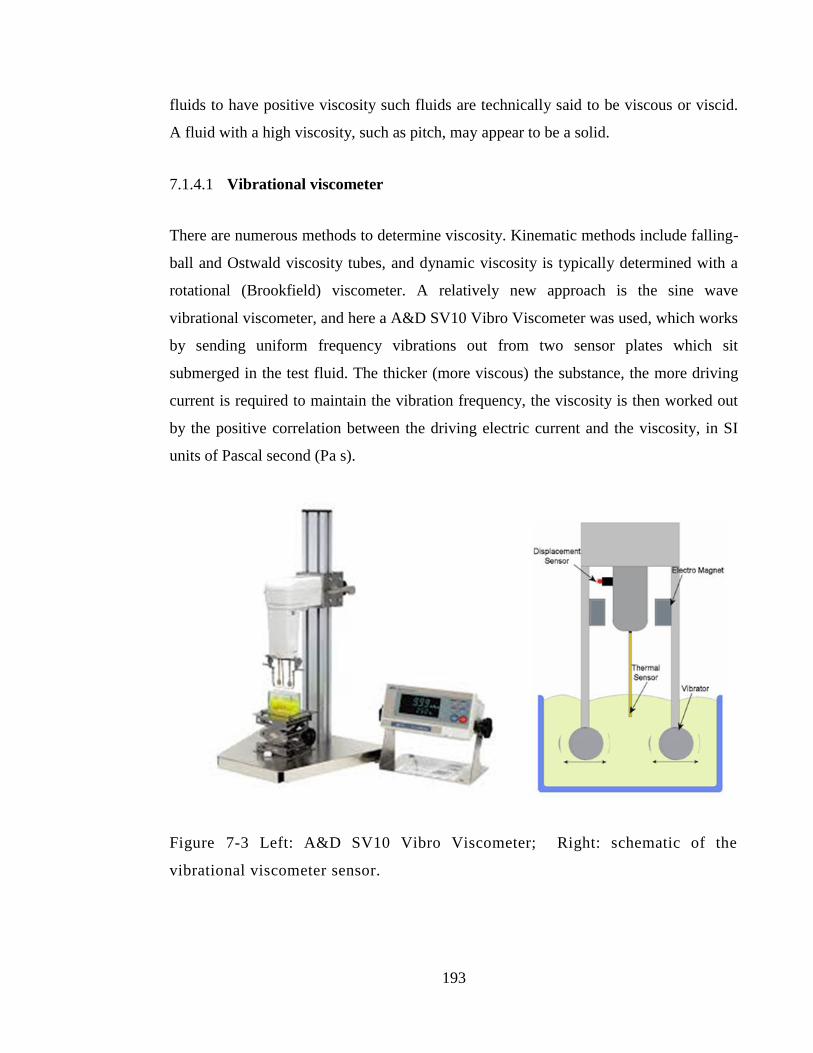
193
fluids to have positive viscosity such fluids are technically said to be viscous or viscid.
A fluid with a high viscosity, such as pitch, may appear to be a solid.
7.1.4.1 Vibrational viscometer
There are numerous methods to determine viscosity. Kinematic methods include falling-
ball and Ostwald viscosity tubes, and dynamic viscosity is typically determined with a
rotational (Brookfield) viscometer. A relatively new approach is the sine wave
vibrational viscometer, and here a A&D SV10 Vibro Viscometer was used, which works
by sending uniform frequency vibrations out from two sensor plates which sit
submerged in the test fluid. The thicker (more viscous) the substance, the more driving
current is required to maintain the vibration frequency, the viscosity is then worked out
by the positive correlation between the driving electric current and the viscosity, in SI
units of Pascal second (Pa s).
Figure 7-3 Left: A&D SV10 Vibro Viscometer; Right: schematic of the
vibrational viscometer sensor.
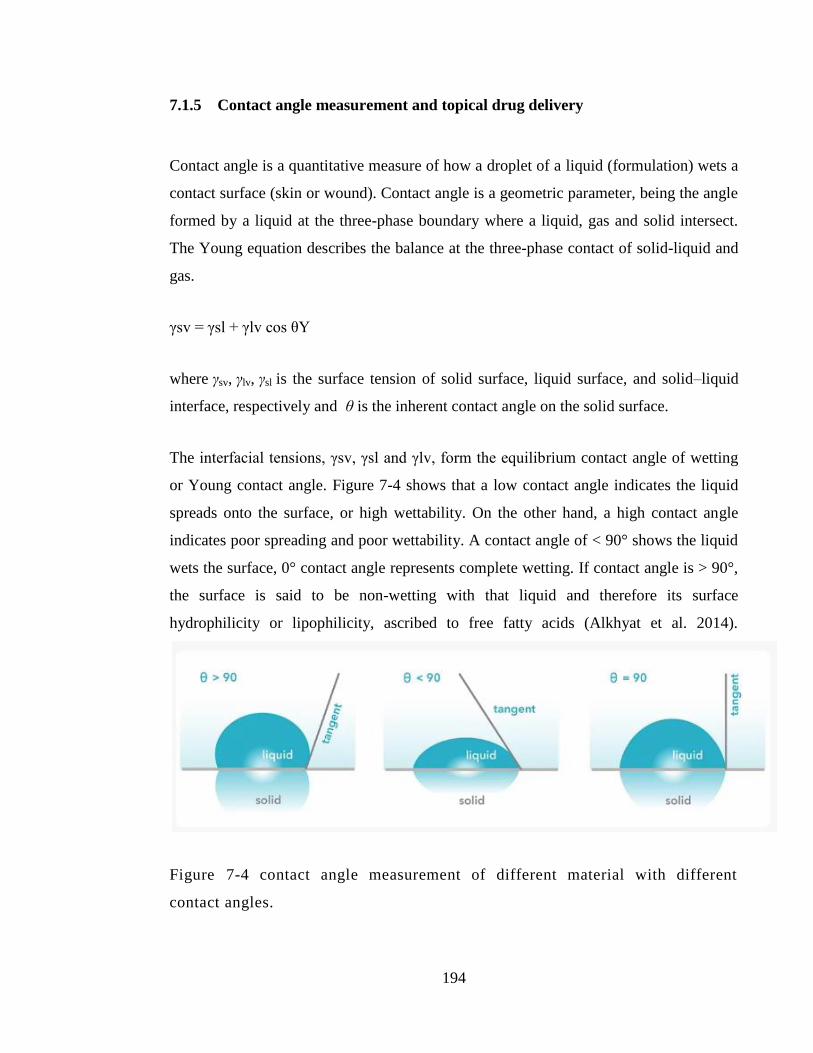
194
7.1.5 Contact angle measurement and topical drug delivery
Contact angle is a quantitative measure of how a droplet of a liquid (formulation) wets a
contact surface (skin or wound). Contact angle is a geometric parameter, being the angle
formed by a liquid at the three-phase boundary where a liquid, gas and solid intersect.
The Young equation describes the balance at the three-phase contact of solid-liquid and
gas.
γsv = γsl + γlv cos θY
where γsv, γlv, γsl is the surface tension of solid surface, liquid surface, and solid–liquid
interface, respectively and θ is the inherent contact angle on the solid surface.
The interfacial tensions, γsv, γsl and γlv, form the equilibrium contact angle of wetting
or Young contact angle. Figure 7-4 shows that a low contact angle indicates the liquid
spreads onto the surface, or high wettability. On the other hand, a high contact angle
indicates poor spreading and poor wettability. A contact angle of < 90° shows the liquid
wets the surface, 0° contact angle represents complete wetting. If contact angle is > 90°,
the surface is said to be non-wetting with that liquid and therefore its surface
hydrophilicity or lipophilicity, ascribed to free fatty acids (Alkhyat et al. 2014).
Figure 7-4 contact angle measurement of different material with different
contact angles.
195
Contact angles can be divided into static and dynamic angles. Static contact angles are
measured when droplet is standing on the surface and the three-phase boundary is not
moving. Static contact angles are utilized in quality control and in research and product
development. When the three-phase boundary is moving, dynamic contact angles can be
measured, and are referred as advancing and receding angles. Contact angle hysteresis is
the difference between the advancing and receding contact angles. Contact angle
hysteresis arises from the chemical and topographical heterogeneity of the surface,
solution impurities absorbing on the surface, or swelling, rearrangement or alteration of
the surface by the solvent. Advancing and receding contact angles give the maximum
and minimum values the static contact angle can have on the surface.
McGinn et al. (1968) performed contact angle analysis for droplets of water on viable
human skin coated with a range of treatments. Clean and degreased skin gave a high
contact angle with water (> 100 °) whereas paraffin, stearic acid, a lanolin derivative, a
quaternary ammonium salt, and hydrophilic and hydrophobic silicone treated skin
reduced the water droplet contact angle when applied to the skin.
Hagens et al. (2007) used contact angle analysis to determine how the substantivity of
sunscreen formulations is affected by the wash-out rate of ultraviolet-absorber and -
reflector compounds in water. It was found that formulations that give CAs above 30
degrees may be categorised as waterproof.
Static and dynamic in vitro contact angle measurements were used to determine the
ability of a polymeric spray formulation sunscreen film to prevent outside water from
reaching the skin-like substrate surface. It was found that acrylates/octylacrylamide
copolymer enhanced the occlusive properties of continuous ethanol-based sunscreen
(EBS) sprays, which was demonstrated via the in vitro static and dynamic contact angle
measurements and confirmed by the in vivo TEWL studies (Dueva-Koganov et al.
2012).
196
Skin tribology (the study of friction) can also be used to monitor changes in skin,
induced by application of exogenous formulations such as moisturisers, in terms of eg
friction coefficient (Alkhyat et al. 2014), and the effect of skin surface roughness on
contact angle has also been studied (Bhushan et al. 2012).
7.1.5.1 Contact angle measurement and topical drug delivery
The higher the wettability of a formulation, the greater the contact area and thus greater
the possibility of a drug being released in order to exert its topical effect (Singh et al.
1968). Azarbayjani et al. (2010) studied the effect of surface tension and contact angle
on the permeation of haloperidol across human skin using cyclodextrin derivatives.
Contact angle measurements showed that vehicles with higher skin wettability decreased
contact angle therefore increased the contact of the drug with the skin surface and
therefore resulted in higher drug permeation across human epidermis.
7.2 Objective and Aims
To prepare and characterise several topical formulations that contain PRE and
ZnSO4.
Formulations containing the following viscosity enhancers: carrageenan, HPMC
and Carbopol.
Determine physical appearance of formulations
Determine viscosity properties at room temperature and 32 °C
Determination of formulation/skin wettability by contact angle measurement and
adhesion by measuring run-off.
Determine drug content and stability profile of selected formulation
197
Confirm the bactericidal activity of the formulations containing PRE and Zn(II)
against planktonic S. aureus.
7.3 Materials and methods
7.3.1 Materials
Materials used in this chapter previously detailed in Chapter 2, Section 2.1.
7.3.2 Preparation of Zinc and PRE solutions
Preparation of PRE and ZnSO4 was carried out according to the previously detailed
solution preparation detailed in Chapter 2, Section 2.2.1 all prepared samples used
phthalate buffer pH4.5.
7.3.3 Hydrogel formulation using Methocel 856
A hot-cold method was used to prepare this hydrogel. 2.5 g of Methocel 856 N
hydroxypropyl methylcellulose (HPMC) was added to 40 mL of hot water at 80 °C with
stirring under magnetic stirrer at 350 rpm until all particles were completely dissolved.
Then, 2 g of polyethylene glycol PEG was added with continuous stirring until
dissolved. Next, 60 mL of cold or iced water was added to the mixture with continuous
stirring. The formulation was then cooled over night at 2-4 °C. The hydrogel was
prepared with PRE and ZnSO4 in combination and in individual formulations. PRE
tested concentrations were as follows: 0.1, 0.5, 1 and 20 mg/mL while ZnSO4
concentrations were: 0.1, 0.25 and 1M.
198
7.3.4 Hydrogel formulation using Carbopol 974
Stock solution of polymer gel was prepared in double concentration to the final desired
one (Dodov et al. 2005). One g of Carbopol 974 was added to 100 mL of deionised
water and mix well under magnetic stirrer at 350 rpm for a 4 hour time period until clear
gel and completely dissolved particles was achieved. The pH of the formulation was
adjusted using 0.1 NaOH.
To prepare the formulations a stock solution of PRE and ZnSO4 prepared in advance in
phthalate buffer solution pH4.5. Then, for example to prepare the polymer ZnSO4
combination, 10 mL of ZnSO4 stock solution was added slowly to 10 mL of the stock
Carbopol 974 gel with continuous stirring at 350 rpm. Each formulation was prepared in
separate by adding 10 mL of stock polymer to 10 mL of PRE and ZnSO4 in different
concentrations and give final Carbopol 974 of 0.5 % (w/w) concentration. PRE tested
concentrations were: 0.1, 0.5, 1 and 5 mg/mL while ZnSO4 concentration: 0.1, 0.25 and
1M. The formulations were stored at 2-4 °C.
7.3.5 Topical gel formulation using carrageenan
Carrageenan gel was prepared by dissolving 1g of carrageenan in 100 mL of deionized
water at temperature of 75 °C under continuous stirring at 350 rpm until complete
dissolution was observed. Next the hot plate was removed and desired amount of zinc
sulphate alone or in combination with PRE was added to the clear gel mixture. The
formulation mixture was cooled to room temperature then stored at 2-4 °C.
7.3.6 Viscosity
Viscosity testing was performed using an A+D Vibro viscometer at St Mary’s
Pharmaceutical Unit, Cardiff. Approximately 35 mL of formulation was placed into the
199
sample well and the equipment switched to the on setting. Viscosity was tested at 32 °C
and room temperature.
7.3.7 Determination of formulation/skin wettability by contact angle
measurement
The instrument of choice to measure contact angles and dynamic contact angles is an
optical tensiometer, however rudimentary measurements can also be made by eye using
a protractor. Full thickness porcine ear skin was liberated from the underlying cartilage
by blunt dissection using a scalpel. The hairs were then trimmed with electric clippers
then shaved gently under running water using a Bic double bladed razor. Some of this
skin was then subjected to heat treatment (55 °C for 1 min) in order to isolate epidermal
sheets and epidermis-free dermis (Kligman and Christophers 1963). On a ceramic plate,
the skin was cut into sections of 1 x 1 or 1 x 4 cm in order to receive 50 μL aliquots of
the 4 test formulations previously detailed in Table 7-5; the skin was dry to the touch.
Formulations were stored at room temperature or 32 °C prior to dosing onto the skin
using a Gilson pipette. Images were then captured using a camera as per the set up in
Figure 7-5, which were then imported into and measured on a computer monitor with a
protractor in order to establish a contact angle as measured by protractor, n=3.
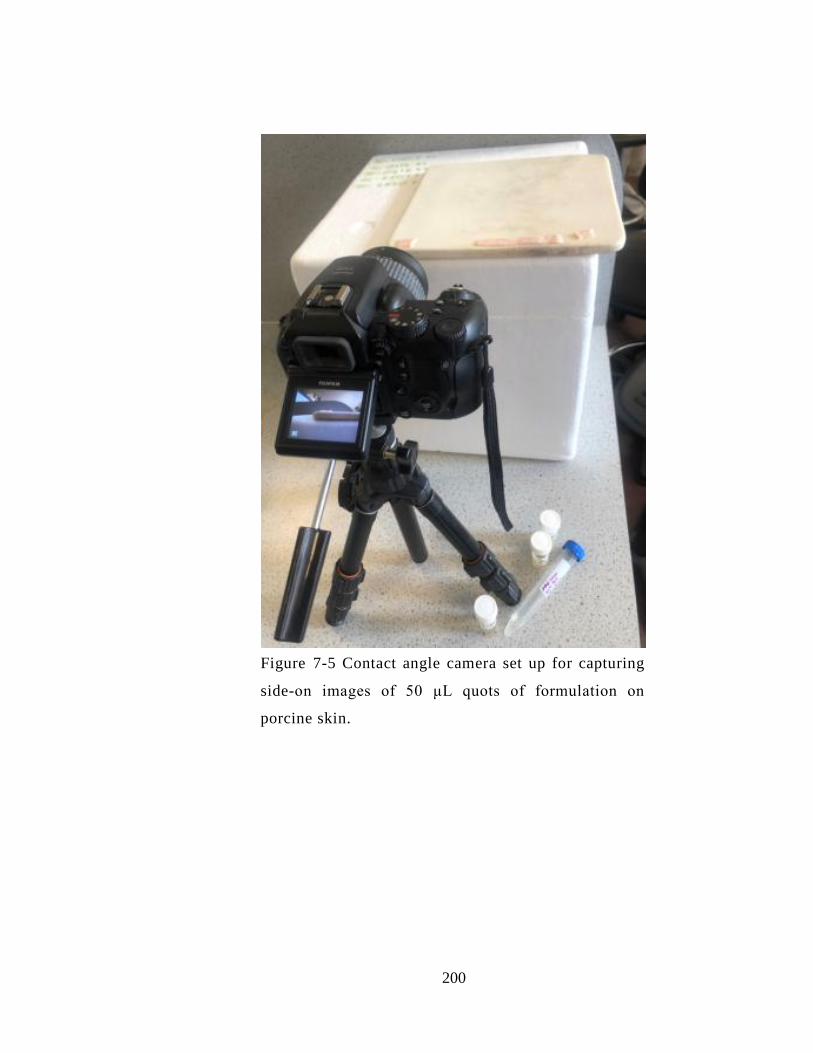
200
Figure 7-5 Contact angle camera set up for capturing
side-on images of 50 μL quots of formulation on
porcine skin.
201
7.3.8 Formulation stability
A stability study investigated the percentage punicalagin content of each formulation
over a six months period. The PRE and ZnSO4 final selected formulations were stored in
sealed light-resistant containers stored at 2-4˚C. Drug content of punicalagin was
quantified using HPLC analytical method described in Chapter 2, Section 2.2.2.1. As
formulations are more viscous in nature than the solution, a dilution step was done at
first and kept the same for all testing samples. Percentage drug punicalagin content was
calculated according to the initial punicalagin concentration calculated using calibration
curve of standard punicalagin Section 2.2.2.1.1 at real time data of 0, 3, and 6 month
storage time. Experiments were conducted in triplicate (n = 3).
7.3.9 Confirming the bactericidal activity of formulations and solution containing
PRE and Zn(II) against planktonic S. aureus
The encouraging microbiological data determined in Chapter 3 was obtained using PRE
and Zn(II) solutions. Here we aimed to establish that synergistic bactericidal activity
would be retained in the presence of the thickening agents, whilst also obtaining
independent confirmation of activity of the solution. This part of the work was
performed using samples sent to the laboratory of Dr. Wing Man Lau (School of
Pharmacy, Faculty of Medical Sciences, Newcastle University, UK.). S. aureus (NU118)
were obtained and isolated in Newcastle University, UK.
The effect of the PRE ± Zn(II) in phthalate buffer and three formulation on planktonic
bacteria was studied against S. aureus. First on 96 well-plates, each well contains 100
µL of 1x 10⁶ CFU/mL of S. aureus in brain heart infusion broth (BHI). 100 μL of the
tested formulation was added in the well. The plate was then incubated at 37 °C for 48 h.
BHI was added as positive control and no bacteria well was used as negative control.
After 48 h, the supernatants were removed; the plate was washed once with 100 μL of
PBS. 100 mL of 0.1 % crystal violet (CV) solution was added to all wells and incubated
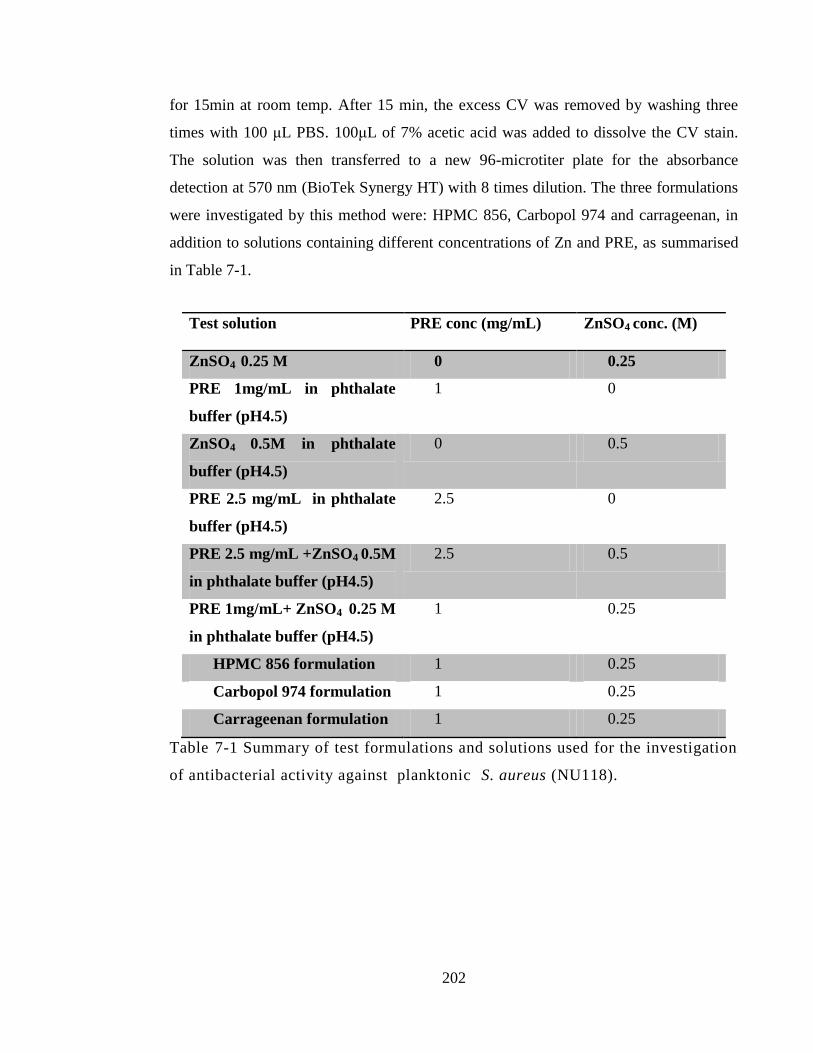
202
for 15min at room temp. After 15 min, the excess CV was removed by washing three
times with 100 μL PBS. 100μL of 7% acetic acid was added to dissolve the CV stain.
The solution was then transferred to a new 96-microtiter plate for the absorbance
detection at 570 nm (BioTek Synergy HT) with 8 times dilution. The three formulations
were investigated by this method were: HPMC 856, Carbopol 974 and carrageenan, in
addition to solutions containing different concentrations of Zn and PRE, as summarised
in Table 7-1.
Test solution PRE conc (mg/mL) ZnSO4 conc. (M)
ZnSO4 0.25 M 0 0.25
PRE 1mg/mL in phthalate
buffer (pH4.5)
1 0
ZnSO4 0.5M in phthalate
buffer (pH4.5)
0 0.5
PRE 2.5 mg/mL in phthalate
buffer (pH4.5)
2.5 0
PRE 2.5 mg/mL +ZnSO4 0.5M
in phthalate buffer (pH4.5)
2.5 0.5
PRE 1mg/mL+ ZnSO4 0.25 M
in phthalate buffer (pH4.5)
1 0.25
HPMC 856 formulation 1 0.25
Carbopol 974 formulation 1 0.25
Carrageenan formulation 1 0.25
Table 7-1 Summary of test formulations and solutions used for the investigation
of antibacterial activity against planktonic S. aureus (NU118).
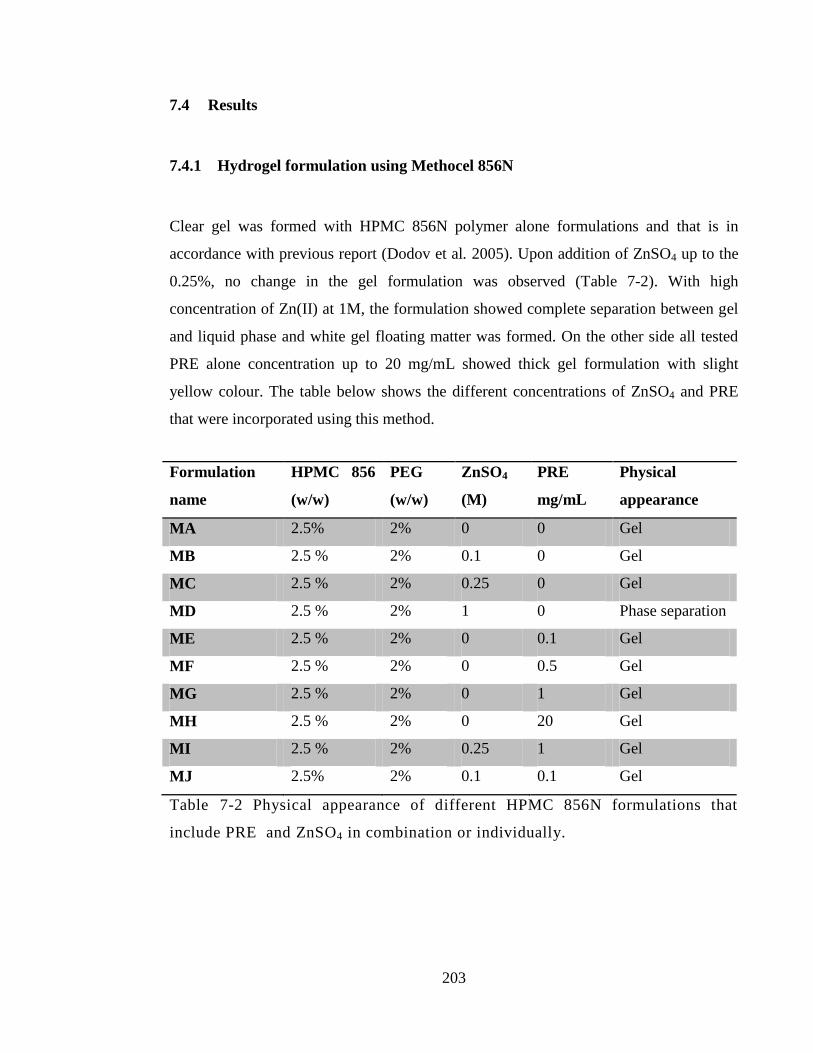
203
7.4 Results
7.4.1 Hydrogel formulation using Methocel 856N
Clear gel was formed with HPMC 856N polymer alone formulations and that is in
accordance with previous report (Dodov et al. 2005). Upon addition of ZnSO4 up to the
0.25%, no change in the gel formulation was observed (Table 7-2). With high
concentration of Zn(II) at 1M, the formulation showed complete separation between gel
and liquid phase and white gel floating matter was formed. On the other side all tested
PRE alone concentration up to 20 mg/mL showed thick gel formulation with slight
yellow colour. The table below shows the different concentrations of ZnSO4 and PRE
that were incorporated using this method.
Formulation
name
HPMC 856
(w/w)
PEG
(w/w)
ZnSO4
(M)
PRE
mg/mL
Physical
appearance
MA 2.5% 2% 0 0 Gel
MB 2.5 % 2% 0.1 0 Gel
MC 2.5 % 2% 0.25 0 Gel
MD 2.5 % 2% 1 0 Phase separation
ME 2.5 % 2% 0 0.1 Gel
MF 2.5 % 2% 0 0.5 Gel
MG 2.5 % 2% 0 1 Gel
MH 2.5 % 2% 0 20 Gel
MI 2.5 % 2% 0.25 1 Gel
MJ 2.5% 2% 0.1 0.1 Gel
Table 7-2 Physical appearance of different HPMC 856N formulations that
include PRE and ZnSO4 in combination or individually.
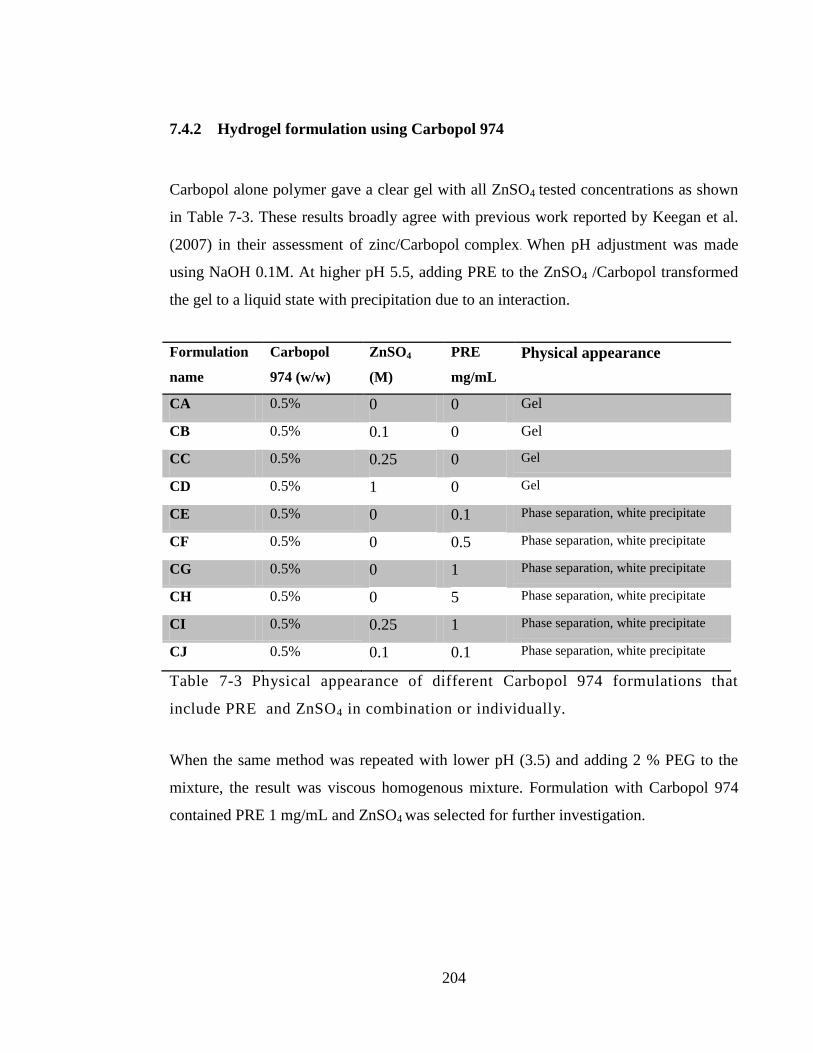
204
7.4.2 Hydrogel formulation using Carbopol 974
Carbopol alone polymer gave a clear gel with all ZnSO4 tested concentrations as shown
in Table 7-3. These results broadly agree with previous work reported by Keegan et al.
(2007) in their assessment of zinc/Carbopol complex. When pH adjustment was made
using NaOH 0.1M. At higher pH 5.5, adding PRE to the ZnSO4 /Carbopol transformed
the gel to a liquid state with precipitation due to an interaction.
Formulation
name
Carbopol
974 (w/w)
ZnSO4
(M)
PRE
mg/mL
Physical appearance
CA 0.5% 0 0 Gel
CB 0.5% 0.1 0 Gel
CC 0.5% 0.25 0 Gel
CD 0.5% 1 0 Gel
CE 0.5% 0 0.1 Phase separation, white precipitate
CF 0.5% 0 0.5 Phase separation, white precipitate
CG 0.5% 0 1 Phase separation, white precipitate
CH 0.5% 0 5 Phase separation, white precipitate
CI 0.5% 0.25 1 Phase separation, white precipitate
CJ 0.5% 0.1 0.1 Phase separation, white precipitate
Table 7-3 Physical appearance of different Carbopol 974 formulations that
include PRE and ZnSO4 in combination or individually.
When the same method was repeated with lower pH (3.5) and adding 2 % PEG to the
mixture, the result was viscous homogenous mixture. Formulation with Carbopol 974
contained PRE 1 mg/mL and ZnSO4 was selected for further investigation.
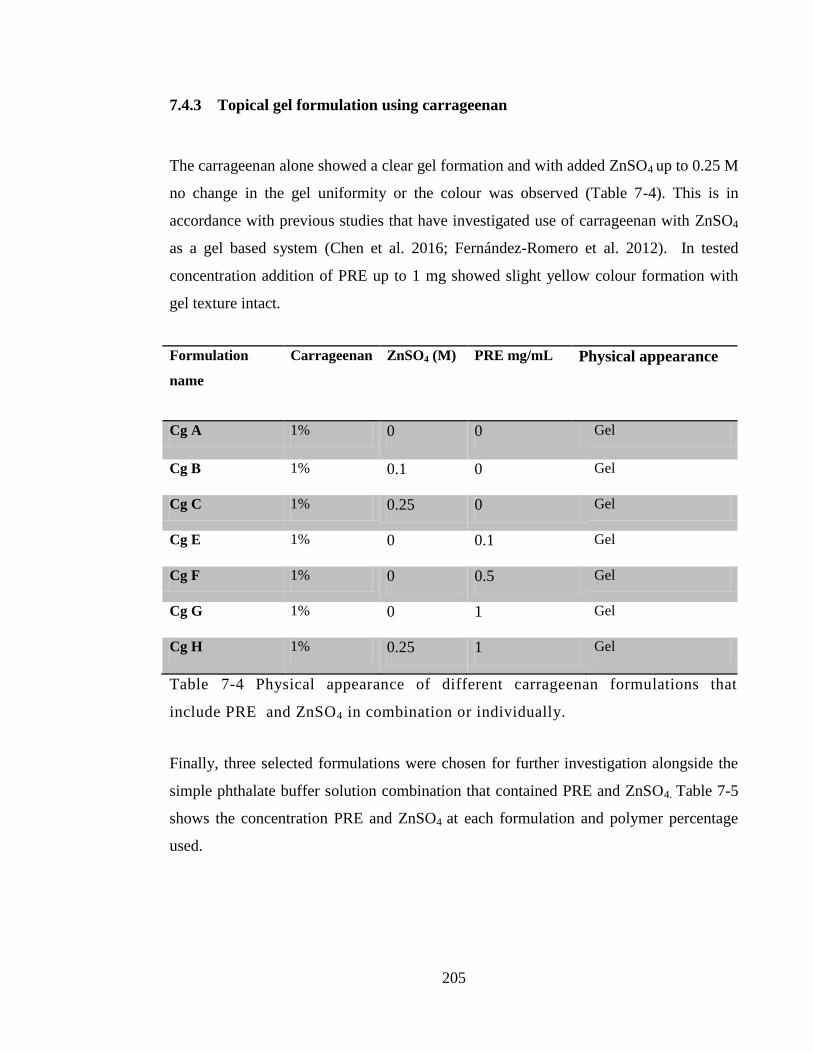
205
7.4.3 Topical gel formulation using carrageenan
The carrageenan alone showed a clear gel formation and with added ZnSO4 up to 0.25 M
no change in the gel uniformity or the colour was observed (Table 7-4). This is in
accordance with previous studies that have investigated use of carrageenan with ZnSO4
as a gel based system (Chen et al. 2016; Fernández-Romero et al. 2012). In tested
concentration addition of PRE up to 1 mg showed slight yellow colour formation with
gel texture intact.
Formulation
name
Carrageenan ZnSO4 (M) PRE mg/mL Physical appearance
Cg A 1% 0 0 Gel
Cg B 1% 0.1 0 Gel
Cg C 1% 0.25 0 Gel
Cg E 1% 0 0.1 Gel
Cg F 1% 0 0.5 Gel
Cg G 1% 0 1 Gel
Cg H 1% 0.25 1 Gel
Table 7-4 Physical appearance of different carrageenan formulations that
include PRE and ZnSO4 in combination or individually.
Finally, three selected formulations were chosen for further investigation alongside the
simple phthalate buffer solution combination that contained PRE and ZnSO4. Table 7-5
shows the concentration PRE and ZnSO4 at each formulation and polymer percentage
used.
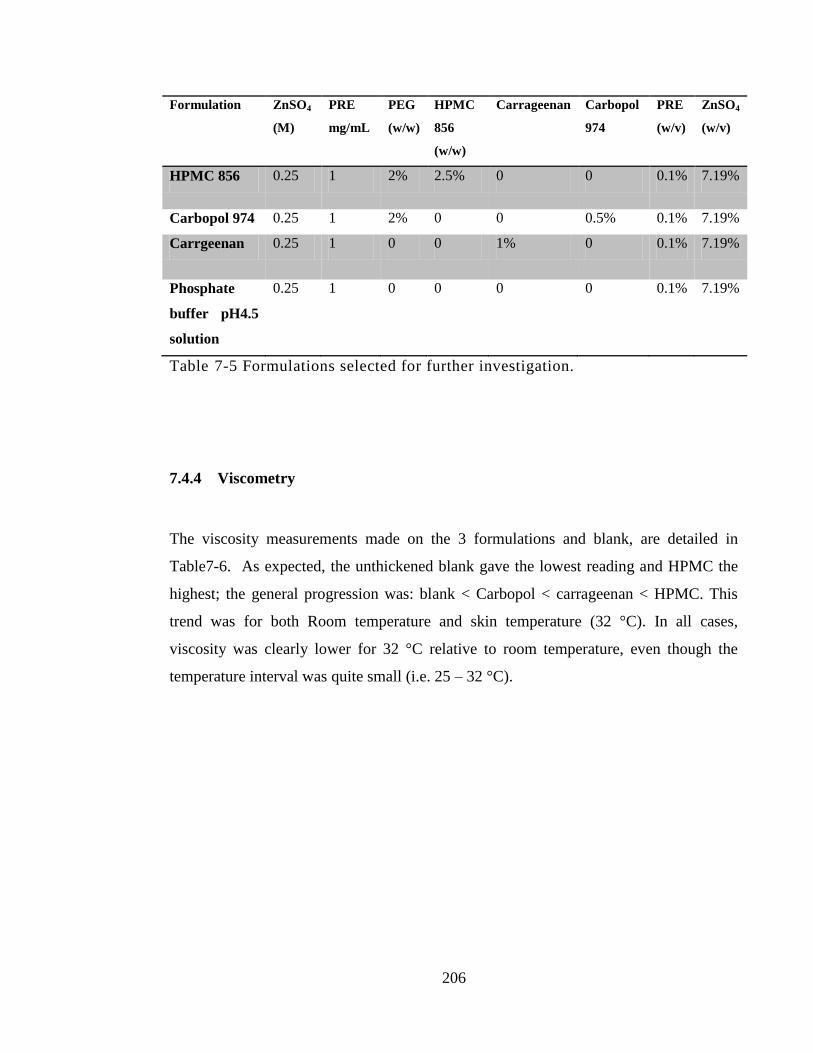
206
Formulation ZnSO4
(M)
PRE
mg/mL
PEG
(w/w)
HPMC
856
(w/w)
Carrageenan Carbopol
974
PRE
(w/v)
ZnSO4
(w/v)
HPMC 856 0.25 1 2% 2.5% 0 0 0.1% 7.19%
Carbopol 974 0.25 1 2% 0 0 0.5% 0.1% 7.19%
Carrgeenan 0.25 1 0 0 1% 0 0.1% 7.19%
Phosphate
buffer pH4.5
solution
0.25 1 0 0 0 0 0.1% 7.19%
Table 7-5 Formulations selected for further investigation.
7.4.4 Viscometry
The viscosity measurements made on the 3 formulations and blank, are detailed in
Table7-6. As expected, the unthickened blank gave the lowest reading and HPMC the
highest; the general progression was: blank < Carbopol < carrageenan < HPMC. This
trend was for both Room temperature and skin temperature (32 °C). In all cases,
viscosity was clearly lower for 32 °C relative to room temperature, even though the
temperature interval was quite small (i.e. 25 – 32 °C).
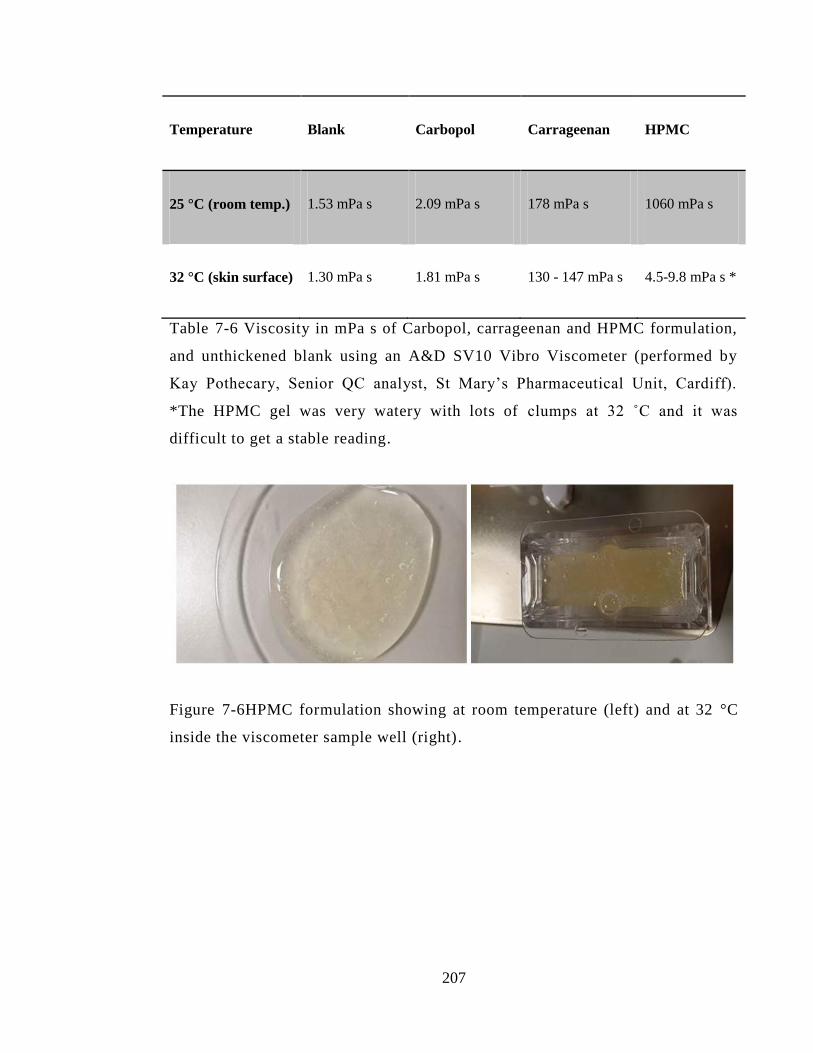
207
Temperature Blank Carbopol Carrageenan HPMC
25 °C (room temp.) 1.53 mPa s 2.09 mPa s 178 mPa s 1060 mPa s
32 °C (skin surface) 1.30 mPa s 1.81 mPa s 130 - 147 mPa s 4.5-9.8 mPa s *
Table 7-6 Viscosity in mPa s of Carbopol, carrageenan and HPMC formulation,
and unthickened blank using an A&D SV10 Vibro Viscometer (performed by
Kay Pothecary, Senior QC analyst, St Mary’s Pharmaceutical Unit, Cardiff).
*The HPMC gel was very watery with lots of clumps at 32 ˚C and it was
difficult to get a stable reading.
Figure 7-6HPMC formulation showing at room temperature (left) and at 32 °C
inside the viscometer sample well (right).
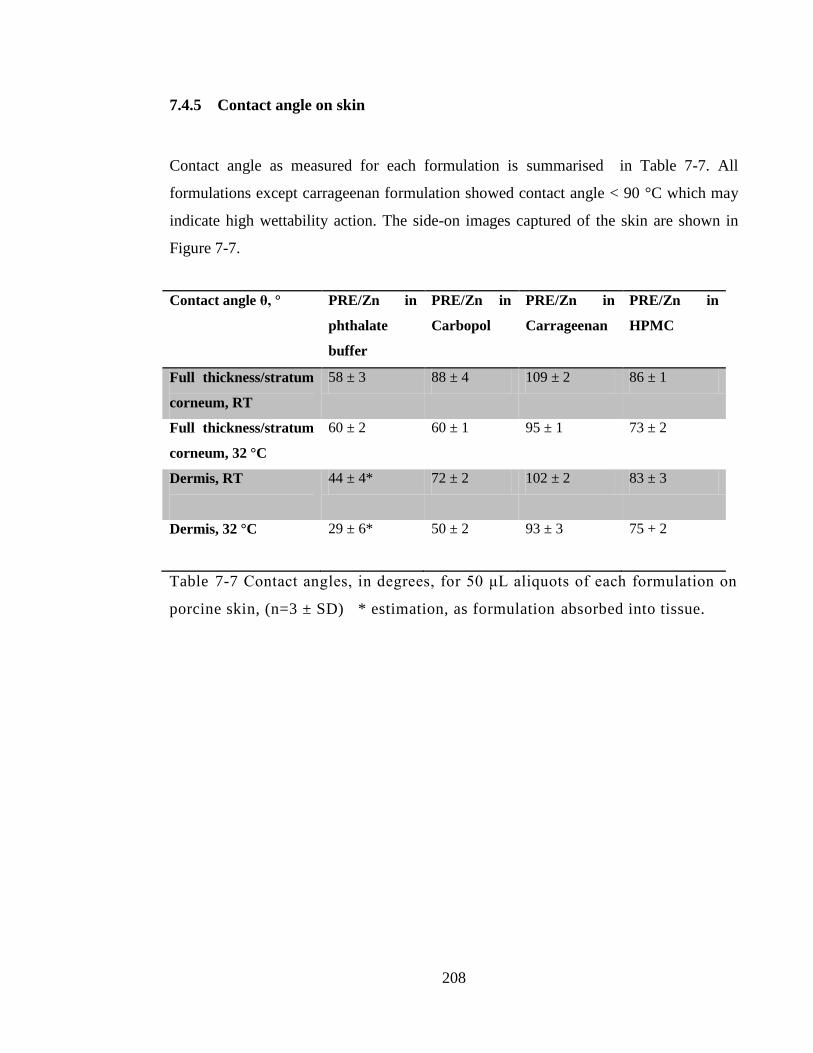
208
7.4.5 Contact angle on skin
Contact angle as measured for each formulation is summarised in Table 7-7. All
formulations except carrageenan formulation showed contact angle < 90 °C which may
indicate high wettability action. The side-on images captured of the skin are shown in
Figure 7-7.
Contact angle θ, ° PRE/Zn in
phthalate
buffer
PRE/Zn in
Carbopol
PRE/Zn in
Carrageenan
PRE/Zn in
HPMC
Full thickness/stratum
corneum, RT
58 ± 3 88 ± 4 109 ± 2 86 ± 1
Full thickness/stratum
corneum, 32 °C
60 ± 2 60 ± 1 95 ± 1 73 ± 2
Dermis, RT
44 ± 4*
72 ± 2 102 ± 2 83 ± 3
Dermis, 32 °C
29 ± 6* 50 ± 2 93 ± 3 75 + 2
Table 7-7 Contact angles, in degrees, for 50 μL aliquots of each formulation on
porcine skin, (n=3 ± SD) * estimation, as formulation absorbed into tissue.
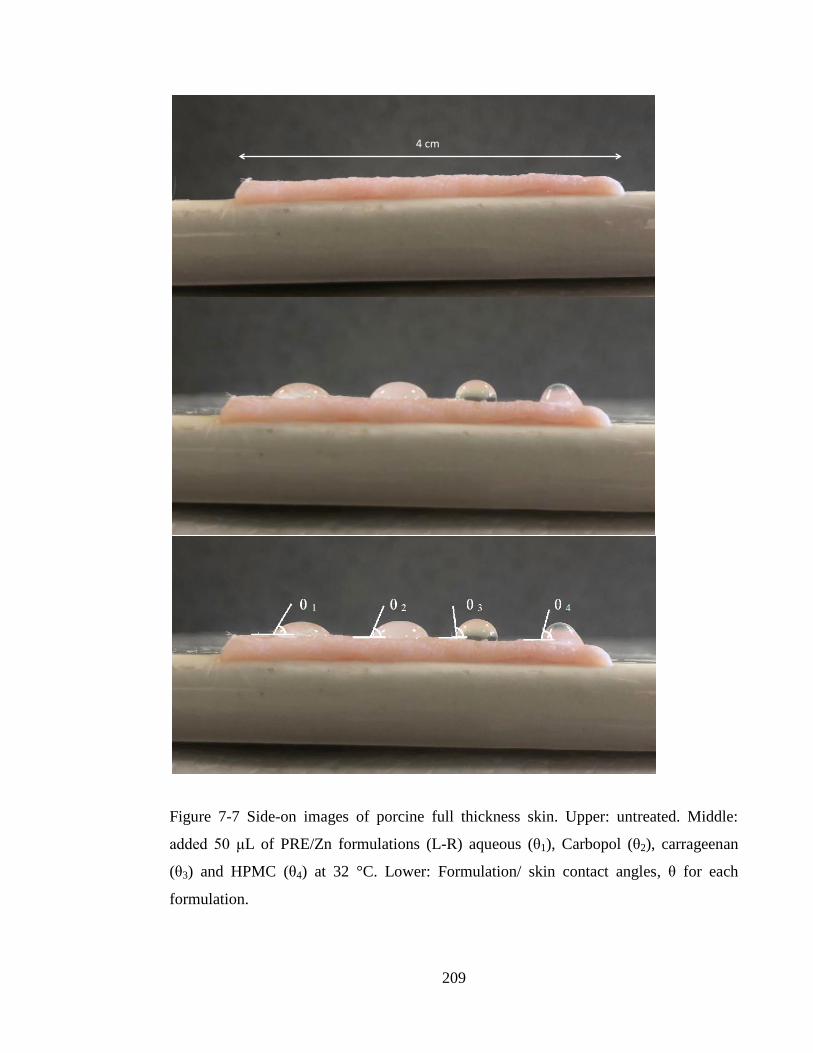
209
Figure 7-7 Side-on images of porcine full thickness skin. Upper: untreated. Middle:
added 50 μL of PRE/Zn formulations (L-R) aqueous (θ1), Carbopol (θ2), carrageenan
(θ3) and HPMC (θ4) at 32 °C. Lower: Formulation/ skin contact angles, θ for each
formulation.
4cm
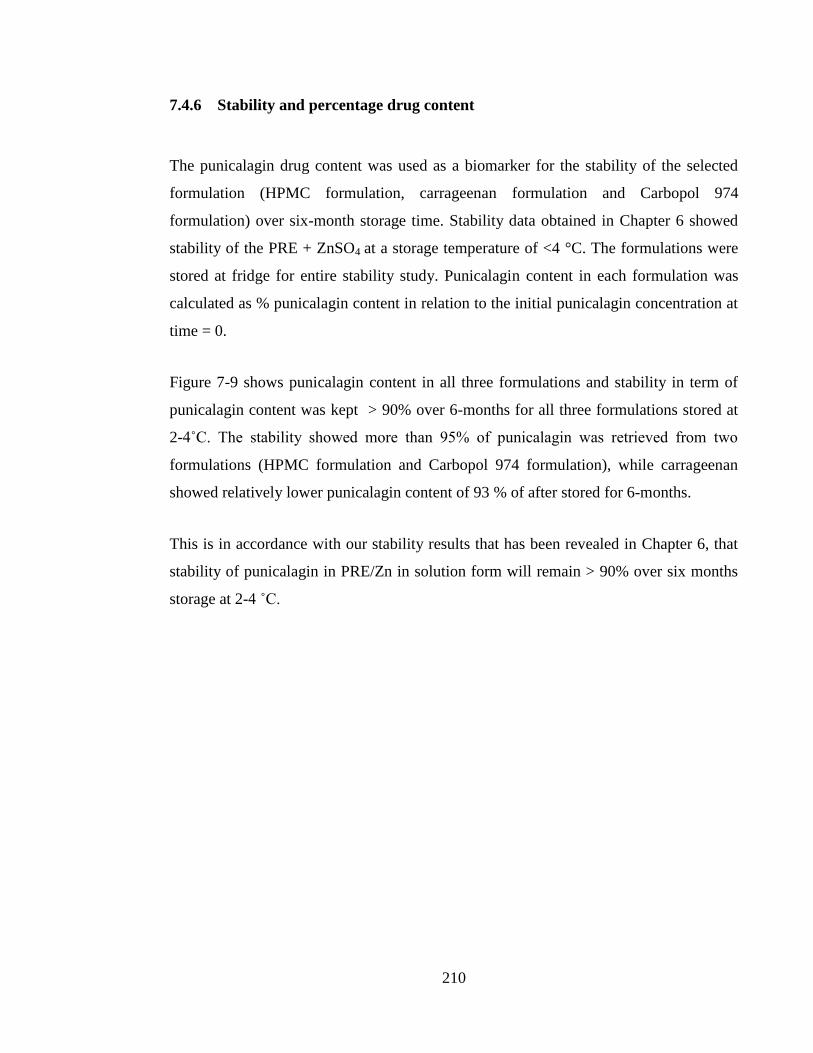
210
7.4.6 Stability and percentage drug content
The punicalagin drug content was used as a biomarker for the stability of the selected
formulation (HPMC formulation, carrageenan formulation and Carbopol 974
formulation) over six-month storage time. Stability data obtained in Chapter 6 showed
stability of the PRE + ZnSO4 at a storage temperature of <4 °C. The formulations were
stored at fridge for entire stability study. Punicalagin content in each formulation was
calculated as % punicalagin content in relation to the initial punicalagin concentration at
time = 0.
Figure 7-9 shows punicalagin content in all three formulations and stability in term of
punicalagin content was kept > 90% over 6-months for all three formulations stored at
2-4˚C. The stability showed more than 95% of punicalagin was retrieved from two
formulations (HPMC formulation and Carbopol 974 formulation), while carrageenan
showed relatively lower punicalagin content of 93 % of after stored for 6-months.
This is in accordance with our stability results that has been revealed in Chapter 6, that
stability of punicalagin in PRE/Zn in solution form will remain > 90% over six months
storage at 2-4 ˚C.
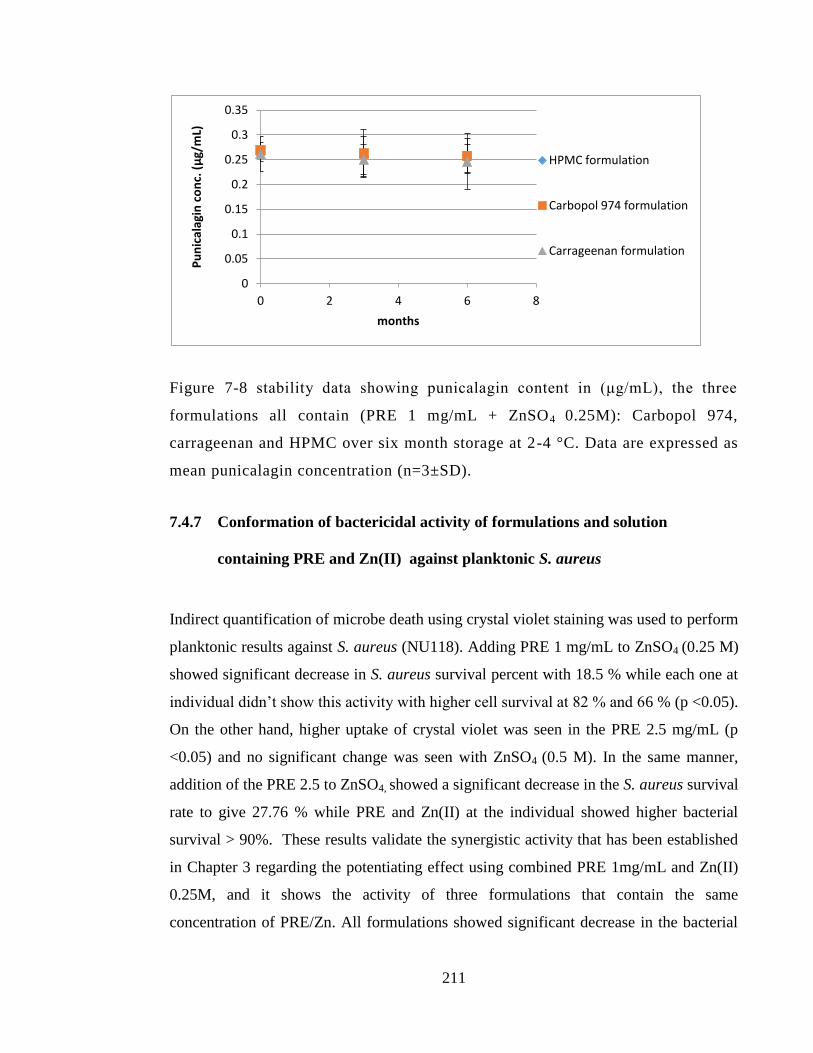
211
Figure 7-8 stability data showing punicalagin content in (μg/mL), the three
formulations all contain (PRE 1 mg/mL + ZnSO4 0.25M): Carbopol 974,
carrageenan and HPMC over six month storage at 2-4 °C. Data are expressed as
mean punicalagin concentration (n=3±SD).
7.4.7 Conformation of bactericidal activity of formulations and solution
containing PRE and Zn(II) against planktonic S. aureus
Indirect quantification of microbe death using crystal violet staining was used to perform
planktonic results against S. aureus (NU118). Adding PRE 1 mg/mL to ZnSO4 (0.25 M)
showed significant decrease in S. aureus survival percent with 18.5 % while each one at
individual didn’t show this activity with higher cell survival at 82 % and 66 % (p <0.05).
On the other hand, higher uptake of crystal violet was seen in the PRE 2.5 mg/mL (p
<0.05) and no significant change was seen with ZnSO4 (0.5 M). In the same manner,
addition of the PRE 2.5 to ZnSO4, showed a significant decrease in the S. aureus survival
rate to give 27.76 % while PRE and Zn(II) at the individual showed higher bacterial
survival > 90%. These results validate the synergistic activity that has been established
in Chapter 3 regarding the potentiating effect using combined PRE 1mg/mL and Zn(II)
0.25M, and it shows the activity of three formulations that contain the same
concentration of PRE/Zn. All formulations showed significant decrease in the bacterial
0
0.05
0.1
0.15
0.2
0.25
0.3
0.35
0 2 4 6 8
Pu
nic
alag
in c
on
c. (μ
g/m
L)
months
HPMC formulation
Carbopol 974 formulation
Carrageenan formulation
212
survival percent to give 55.6 % and 40.10 % and 37.7 % bacterial survival (p <0.05) in
the carrageenan formulation, Carbopol 974 formulation and HPMC 856 formulation
respectively (Figure 7-10).
Figure 7-9 Effect of the PRE ± Zn(II) in solution form and formulations
against planktonic S. aureus after 24 hours incubation in the presence and
absence of tested compounds. Results are shown as mean absorbance of
bacteria (indicate growth) ±SD from a (single replicate and 6 experimental
replicates).
7.5 Discussion
Because of the combination system between the PRE and metal ion it was challenging to
take in consideration the interaction that can occurs between polymers and PRE or
polymer and Zn(II) or even both. Metal ion such Zn(II) presence in a formulation, even
0
1
2
3
4
5
6 A
bso
rban
ce (
57
0 n
m)
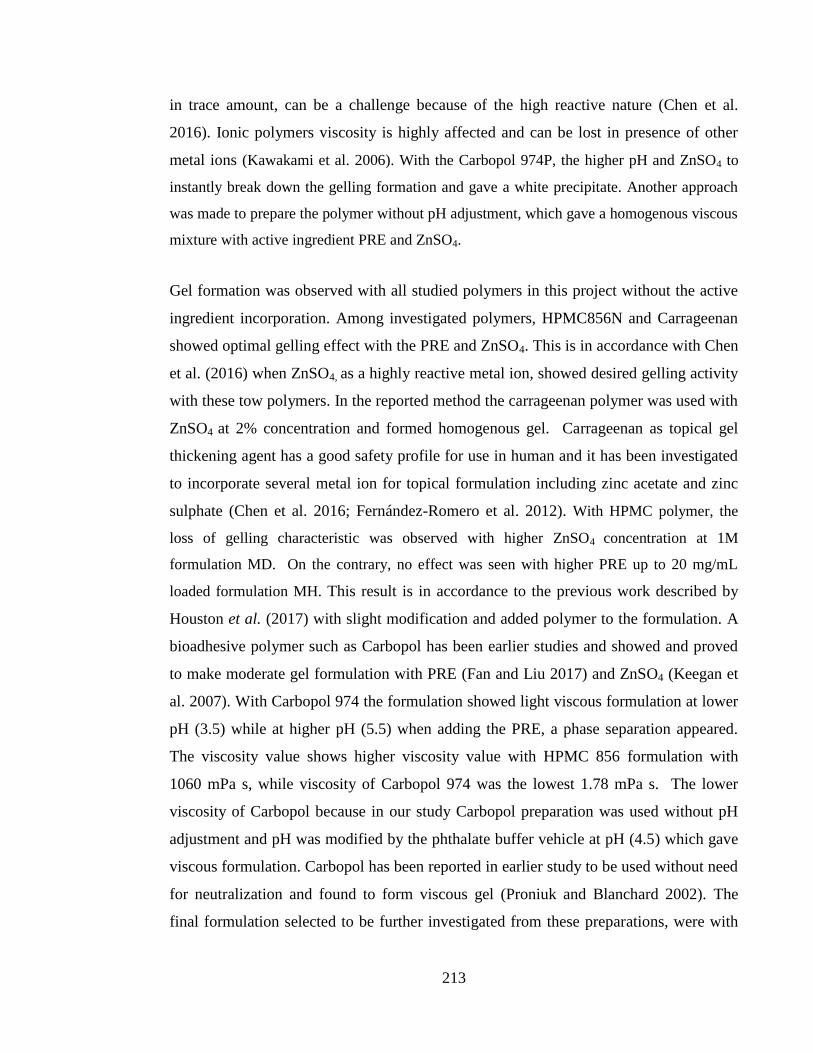
213
in trace amount, can be a challenge because of the high reactive nature (Chen et al.
2016). Ionic polymers viscosity is highly affected and can be lost in presence of other
metal ions (Kawakami et al. 2006). With the Carbopol 974P, the higher pH and ZnSO4 to
instantly break down the gelling formation and gave a white precipitate. Another approach
was made to prepare the polymer without pH adjustment, which gave a homogenous viscous
mixture with active ingredient PRE and ZnSO4.
Gel formation was observed with all studied polymers in this project without the active
ingredient incorporation. Among investigated polymers, HPMC856N and Carrageenan
showed optimal gelling effect with the PRE and ZnSO4. This is in accordance with Chen
et al. (2016) when ZnSO4, as a highly reactive metal ion, showed desired gelling activity
with these tow polymers. In the reported method the carrageenan polymer was used with
ZnSO4 at 2% concentration and formed homogenous gel. Carrageenan as topical gel
thickening agent has a good safety profile for use in human and it has been investigated
to incorporate several metal ion for topical formulation including zinc acetate and zinc
sulphate (Chen et al. 2016; Fernández-Romero et al. 2012). With HPMC polymer, the
loss of gelling characteristic was observed with higher ZnSO4 concentration at 1M
formulation MD. On the contrary, no effect was seen with higher PRE up to 20 mg/mL
loaded formulation MH. This result is in accordance to the previous work described by
Houston et al. (2017) with slight modification and added polymer to the formulation. A
bioadhesive polymer such as Carbopol has been earlier studies and showed and proved
to make moderate gel formulation with PRE (Fan and Liu 2017) and ZnSO4 (Keegan et
al. 2007). With Carbopol 974 the formulation showed light viscous formulation at lower
pH (3.5) while at higher pH (5.5) when adding the PRE, a phase separation appeared.
The viscosity value shows higher viscosity value with HPMC 856 formulation with
1060 mPa s, while viscosity of Carbopol 974 was the lowest 1.78 mPa s. The lower
viscosity of Carbopol because in our study Carbopol preparation was used without pH
adjustment and pH was modified by the phthalate buffer vehicle at pH (4.5) which gave
viscous formulation. Carbopol has been reported in earlier study to be used without need
for neutralization and found to form viscous gel (Proniuk and Blanchard 2002). The
final formulation selected to be further investigated from these preparations, were with
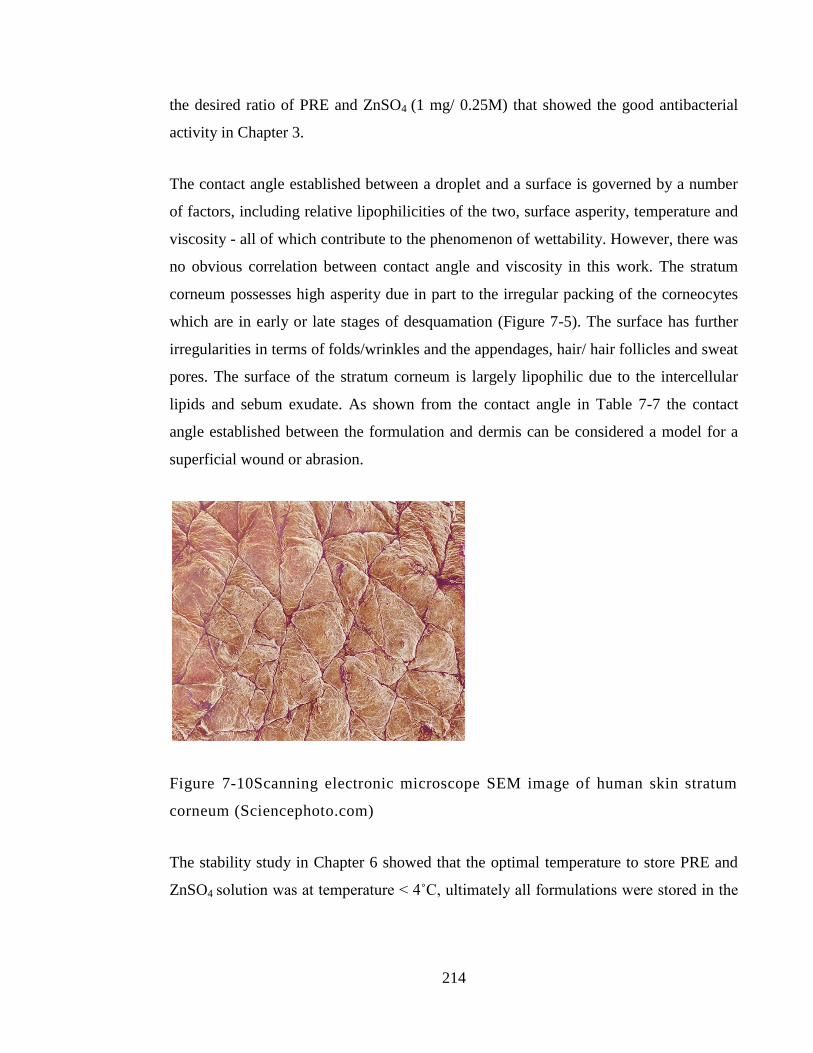
214
the desired ratio of PRE and ZnSO4 (1 mg/ 0.25M) that showed the good antibacterial
activity in Chapter 3.
The contact angle established between a droplet and a surface is governed by a number
of factors, including relative lipophilicities of the two, surface asperity, temperature and
viscosity - all of which contribute to the phenomenon of wettability. However, there was
no obvious correlation between contact angle and viscosity in this work. The stratum
corneum possesses high asperity due in part to the irregular packing of the corneocytes
which are in early or late stages of desquamation (Figure 7-5). The surface has further
irregularities in terms of folds/wrinkles and the appendages, hair/ hair follicles and sweat
pores. The surface of the stratum corneum is largely lipophilic due to the intercellular
lipids and sebum exudate. As shown from the contact angle in Table 7-7 the contact
angle established between the formulation and dermis can be considered a model for a
superficial wound or abrasion.
Figure 7-10Scanning electronic microscope SEM image of human skin stratum
corneum (Sciencephoto.com)
The stability study in Chapter 6 showed that the optimal temperature to store PRE and
ZnSO4 solution was at temperature < 4˚C, ultimately all formulations were stored in the
215
fridge and stability study performed over 6-month storage time. In all 3 tested
formulations, the stability of punicalagin > 93 % over this period.
For optimization of the formulation all three formulation were tested for antibacterial
activity against planktonic S. aureus. The results showed that a combination of PRE 1
mg/mL and Zn(II) 0.25 M that has been used in tested formulation (carrageenan
formulation, HPMC 856 formulation and Carbopol 974) or in simple solution (of PRE 1
mg/mL + ZnSO4 0.25 M at pH4.5; PRE 2.5 mg/mL + ZnSO4 0.5 M at pH4.5),
significantly decrease in S. aureus (NU118) viability when planktonic test was
performed in comparison to control group (p <0.05). The results in this Section validate
the potentiating activity achieved by PRE 1mg/mL and Zn(II) 0.25 M earlier revealed in
Chapter 3.
7.6 Conclusion
Three different polymers were used to prepare PRE/Zn formulations with different
viscosity properties. The conclusions that may be drawn from this chapter are:
1. Three formulations with the same PRE/Zn loadings were selected that showed
acceptable homogeneity, wettability. The gels had varying viscosities.
2. Stability of the active constituent, punicalagin, was demonstrated over 6-month
storage time at 2-4 °C and -20 °C.
3. Retention of microbiological activity of the gels and the solution was established
independently against S. aureus in an external collaborator’s laboratory.
216
As it is intended for the formulation to be used as topical formulation to infected skin
and wounds, the skin permeability and penetration will be investigated in the following
Chapter.
217
Chapter 8: In vitro skin penetration and
permeation of punicalagin and Zn(II) from
solution and hydrogel formulations
containing PRE and ZnSO4
218
8.1 Introduction
Although the topical application of an antimicrobial system is generally intended to
provide its activity on the surface, and ideally the actives would remain at the point of
application, this is rarely achieved as some will pass through the upper layers of the skin.
In this chapter, the skin penetration and permeation of punicalagin (from PRE) and
Zn(II) (from ZnSO4) were investigated from a topically-applied solution and several
topical formulations. Skin penetration can be defined as an amount of chemical
compound entering and resident within a membrane, i.e. skin; whereas skin permeation
can be defined as the amount and/or rate of a compound passing out of tissue (skin)
following the penetration stage.
While the PRE/Zn system will ideally be active on the surface of the skin for chronic
and acute wounds as an antiseptic, both skin penetration and permeation are investigated
here. A skin penetration study can indicate the mass (or moles) of actives that have been
absorbed into the skin, and show any reservoir formation within the outer layers. The
formation of a reservoir can be useful in providing a substantive effect, i.e. the
antimicrobial activity is sustained even after the initial colonies have been killed, thereby
inhibiting recolonisation. As the epidermis is constantly being formed and removed by
desquamation, actives located in lower layers migrate towards the surface where they
will provide sustained colonisation inhibition (Li et al. 2018). The substantivity of the
antibacterial activity of chlorhexidine antiseptic has been reported to be superior when
compared to isopropyl alcohol in an in vivo study comparing the antimicrobial effect on
the resident microflora of hands (Aly and Maibach 1979). Mertz et al. (1984) compared
the substantivity of the antibacterial effect of two antiseptic agents on inoculated partial
thickness wound in vivo. The study revealed that the antibacterial activity treatment of
10% povidone-iodine was prolonged post application at 24h, compared to the short
acting antiseptic 70% isopropyl alcohol.
219
The initial purpose of the permeation study was to demonstrate the level of applied dose
that may reach systemic circulation. However, if it can be demonstrated that PRE/Zn
permeates at sufficient levels through intact, unbroken skin, it might be a potential new
treatment for sub-surface skin infections known as cellulitis.
8.1.1 In vitro porcine skin model
In topical drug development and optimisation processes, animal skin is generally used as
the model of research in the preclinical trials stage of drug development (Semlin et al.
2011; Flaten et al. 2015). In vitro or ex vivo pig/porcine ear skin is the most frequently
used model for studying drug permeation and penetration. Pig skin has an advantage
over other animals such as rat and monkeys, due to its physiological and anatomical
similarity to human skin. It has also been established to be a good model for human skin
in terms of epidermal thickness, blood vessel density, and dermal to epidermal thickness
(Dick and Scott 1992; Godin and Touitou 2007). Several methods have been used to
prepare skin, including: full or split thickness skin, heat separated epidermis HSE, and
trypsin isolated stratum corneum. Porcine skin and ears are readily accessible and easy
to obtain from local slaughterhouses, and are generally considered as animal waste.
It is important to take into consideration and exclude any scarred or inflamed areas,
since the integrity of such skin could jeopardise the results obtained (Henning et al.
2009; Meyer et al. 2006). Another important consideration is whether the skin has been
frozen before use, and for how long, as this this is known to affect results. In this chapter
only fresh/unfrozen porcine skin was used, in conjunction with Franz diffusion cells
(FDCs).
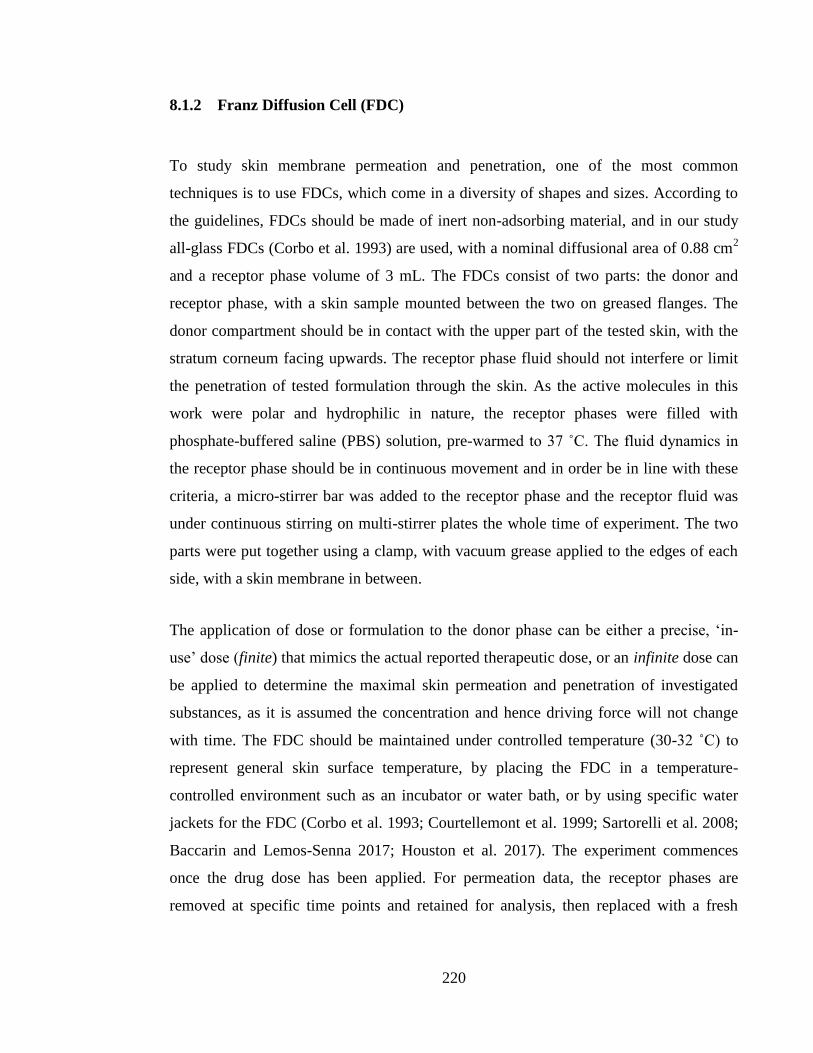
220
8.1.2 Franz Diffusion Cell (FDC)
To study skin membrane permeation and penetration, one of the most common
techniques is to use FDCs, which come in a diversity of shapes and sizes. According to
the guidelines, FDCs should be made of inert non-adsorbing material, and in our study
all-glass FDCs (Corbo et al. 1993) are used, with a nominal diffusional area of 0.88 cm2
and a receptor phase volume of 3 mL. The FDCs consist of two parts: the donor and
receptor phase, with a skin sample mounted between the two on greased flanges. The
donor compartment should be in contact with the upper part of the tested skin, with the
stratum corneum facing upwards. The receptor phase fluid should not interfere or limit
the penetration of tested formulation through the skin. As the active molecules in this
work were polar and hydrophilic in nature, the receptor phases were filled with
phosphate-buffered saline (PBS) solution, pre-warmed to 37 ˚C. The fluid dynamics in
the receptor phase should be in continuous movement and in order be in line with these
criteria, a micro-stirrer bar was added to the receptor phase and the receptor fluid was
under continuous stirring on multi-stirrer plates the whole time of experiment. The two
parts were put together using a clamp, with vacuum grease applied to the edges of each
side, with a skin membrane in between.
The application of dose or formulation to the donor phase can be either a precise, ‘in-
use’ dose (finite) that mimics the actual reported therapeutic dose, or an infinite dose can
be applied to determine the maximal skin permeation and penetration of investigated
substances, as it is assumed the concentration and hence driving force will not change
with time. The FDC should be maintained under controlled temperature (30-32 ˚C) to
represent general skin surface temperature, by placing the FDC in a temperature-
controlled environment such as an incubator or water bath, or by using specific water
jackets for the FDC (Corbo et al. 1993; Courtellemont et al. 1999; Sartorelli et al. 2008;
Baccarin and Lemos-Senna 2017; Houston et al. 2017). The experiment commences
once the drug dose has been applied. For permeation data, the receptor phases are
removed at specific time points and retained for analysis, then replaced with a fresh
221
receptor phase (Figure 8-1). The data is processed to allow the construction of
permeation profiles, drug/cm2 versus time. Linear plots or linear parts of plots are
generally 0-order and can yield steady state flux data, e.g. drug/cm2/h.
Figure 8-1 All glass Franz diffusion cell (FDC).
8.1.3 Skin Tape stripping
Tape stripping is one of the main methods that has been used to investigate drug
penetration and localisation within the stratum corneum and epidermis. At first, the
topical drug is applied for a certain time to the skin, then stripped via the application and
removal of adhesive tape on the outer layer of the skin. The stripping is done in a
repeated manner to the same area of skin using a new piece of tape each time; each piece
of tape contains tissue from deeper within the skin. The drug on each strip is then
desorbed and quantified (Escobar-Chávez, et al. 2008; Lademann et al. 2010; Raber et
al. 2014). Figure 8-2 shows the general steps of the tape stripping technique used here.
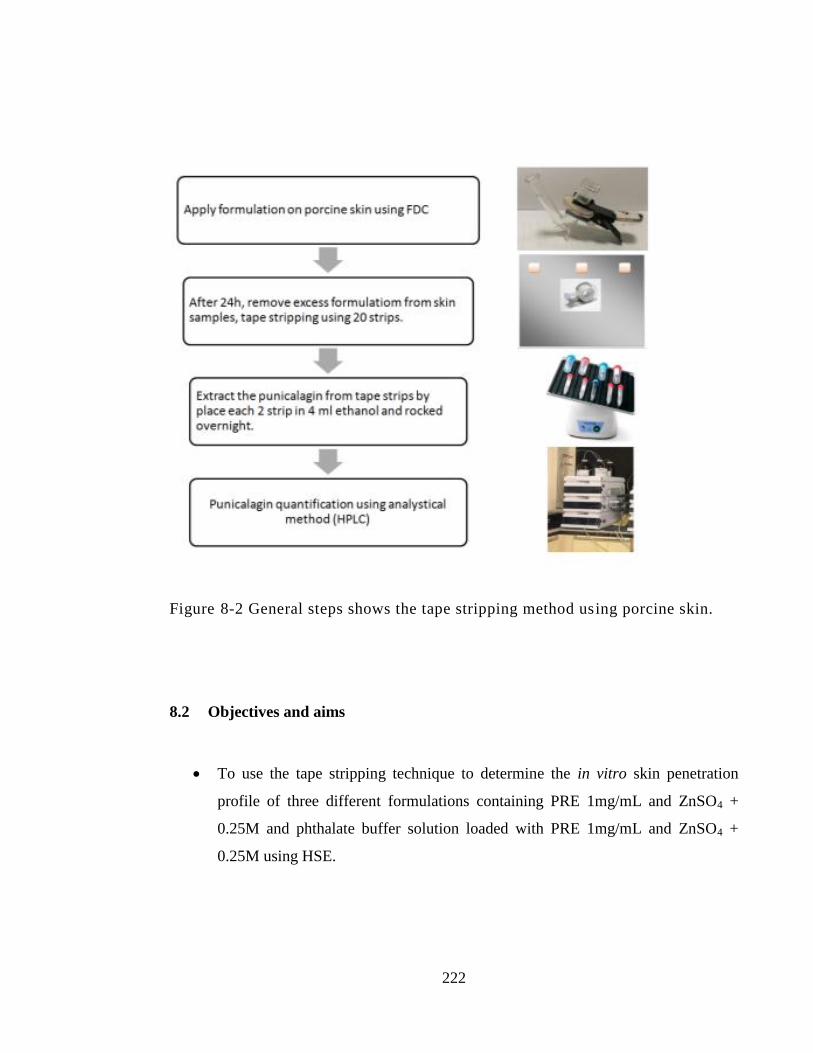
222
Figure 8-2 General steps shows the tape stripping method using porcine skin.
8.2 Objectives and aims
To use the tape stripping technique to determine the in vitro skin penetration
profile of three different formulations containing PRE 1mg/mL and ZnSO4 +
0.25M and phthalate buffer solution loaded with PRE 1mg/mL and ZnSO4 +
0.25M using HSE.
223
To determine the in vitro skin permeation profiles of punicalagin and zinc from
three different formulations containing PRE 1mg/mL and ZnSO4 0.25M and
phthalate buffer solution loaded with PRE 1mg/mL and ZnSO4 0.25M using a
heat-separated epidermis HSE model.
To relate delivery data to wound healing and antibacterial data to estimate
potential effects.
8.3 Materials and methods
8.3.1 Materials
All materials used in this chapter were previously detailed in Chapter 2, Section 2.1.
8.3.2 Preparation of formulation and solution contain PRE and ZnSO4
A solution of PRE 1 mg/mL + ZnSO4 0.25M in pH 4.5 phthalate buffer was prepared
according to the method described in Chapter 2, section 2.2.1. The three semi-solid
formulations, based on the thickened HPMC 856 formulation, Carbopol 974
formulation, and carrageenan, selected for further investigation are detailed in Chapter 7.
A blank control was prepared using the same method for each formulation without the
incorporation of PRE and ZnSO4.
8.3.3 Full thickness porcine ear skin preparation
Porcine ear skin was obtained from a local slaughterhouse and used without prior
freezing. The skin cleaning and preparation method is described in detail in Chapter 2,
Section 2.2.3.1.
224
8.3.4 In vitro depth profile using tape stripping technique and skin remaining
Tape stripping method previously described in Chapter 8 (Section 1.1) was used to
determine the skin penetration through the HSE prepared by method in detailed in
Chapter 2, section 2.2.3.2. The skin that was used to study the permeation of punicalagin
and zinc through heat-separated epidermis (HSE) was removed from the FDC and
placed on a porcelain tile, after which the excess formulation was removed using a
cotton bud with constant and uniform pressure applied each time. The skin was placed
on a porcelain tile with the stratum corneum facing upwards, in order to perform the tape
stripping. Twenty strips of regular adhesive tape were used for each porcine skin sample.
Several considerations were taken in mind when performing the tape stripping. The
pressure applied and removal velocity was kept the same each time. For each sample of
twenty strips, two strips were put together in one vial and added to 4 mL of ethanol, and
rocked overnight using a laboratory rocker. After that, the ethanol was evaporated and
the residue reconstituted in 1 mL of deionised water. Each vial was centrifuged at 1500
rpm for 15 minutes, then the supernatant was retained. Thereafter, the remaining skin
samples were cut and divided into small pieces in order to transfer them to a vial
containing 2 mL of ethanol. The chopped skin pieces were then homogenised using a
Stuart® SHM1 homogeniser (supplied by Fisher Scientific, Loughborough, UK). After
each use, the homogeniser was cleaned and the probe changed. After complete
homogenisation the samples were centrifuged at 1500 rpm for 30 minutes using a
Thermofisher Scientific Heraeus Megafuge 8R (supplied by Fisher Scientific,
Loughborough, UK). Clear supernatant was transferred to a vial and placed in a water
bath at 37 ˚C overnight until all ethanol had evaporated, then 1 mL of deionised water
was added to each sample and rocked until all solids had dissolved (Escobar-Chávez et
al. 2008; Ruela et al. 2016). The samples were then tested for punicalagin content via the
previously-described reverse phase HPLC method (Chapter 2, section 2.2.2.1)
(Weerheim and Ponec 2001), and tested for zinc using the ICP-MS method described in
Chapter 2, Section 2.2.2.2 (note: here we refer to zinc rather than Zn(II), as the
instrument analyses total element rather than specific chemical form).
225
8.3.5 Permeation of punicalagin and zinc through Heat Separated Epidermis
(HSE)
Using the Franz diffusion cell (FDC) method detailed in Chapter 8 and an HSE
membrane prepared according to the method detailed in Chapter 2, Section 2.2.3.2, the
selected formulation and solution of PRE/ZnSO4 with infinite dose was applied to the
phase of the porcine HSE with 1 g of formulation or solution being applied. All
formulations contained the same concentrations of PRE/ZnSO4 (PRE 1 mg/mL + ZnSO4
0.25M), and infinite dose conditions were selected to predict the maximal permeability
of the epidermis membrane. The solution in the receptor phase was taken after 24 hours,
and punicalagin content was analysed using the HPLC method and zinc determined by
ICP-MS, as previously described in Chapter 2, sections 2.2.2.1 and 2.2.2.2.
For the cumulative permeation study, the solutions in the receptor phases were collected
and replaced with fresh ones at 1, 3, 6, 12, and 24 hour time intervals. For each time
interval, the total fluid in the receptor phase was taken using a sterile pipette and
replaced with the same volume of fresh PBS solution. The samples were stored in a
light-protective glass container for further use. Analysis of punicalagin and zinc content
used HPLC and ICP-MS, respectively, with both methods having been previously
described in Chapter 2, sections 2.2.2.1 and 2.2.2.2. The permeation flux per unit of skin
surface area was determined from the linear regression of the initial linear part of the
curve.
8.3.6 Data analysis
In each test, data are expressed as means ± SD, unless otherwise stated. Statistical
analysis was carried out using One way analysis of variance (ANOVA) with Tukey‘s
post test to compare statistical significances between groups and or One way analysis of
variance (ANOVA) with post-test Dunnett analysis to compare groups against the
control. Results were expressed as significant and very significant with p < 0.05 and p <
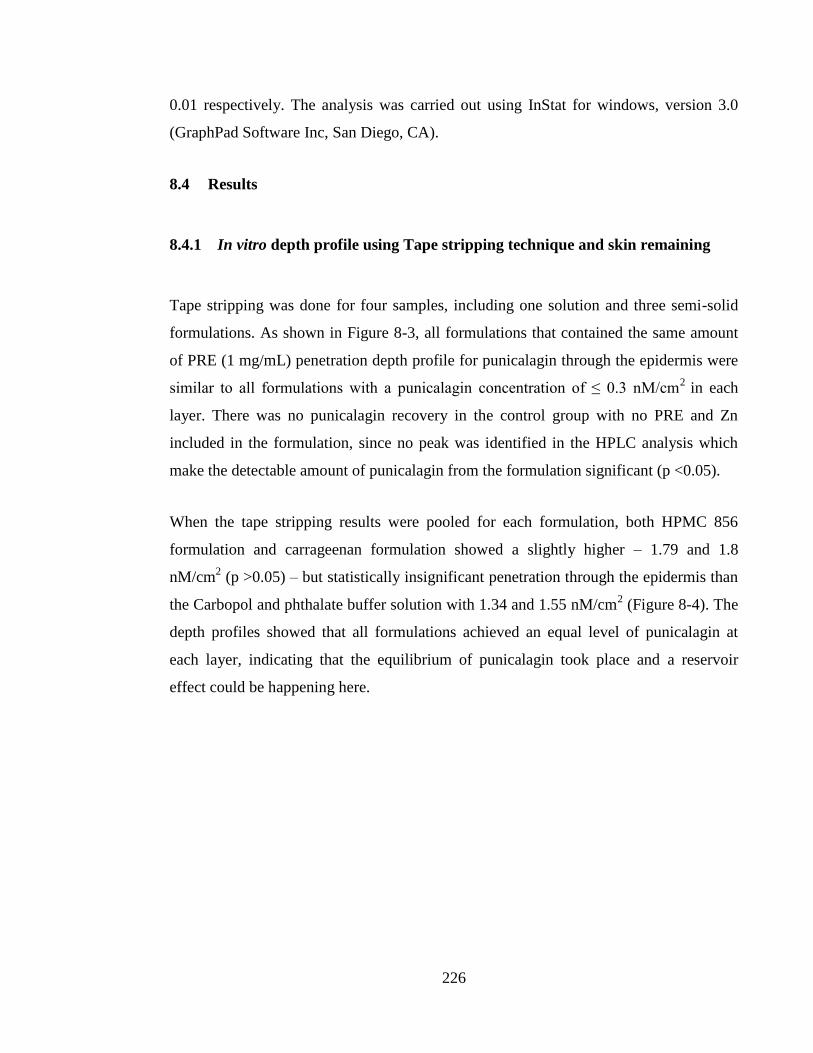
226
0.01 respectively. The analysis was carried out using InStat for windows, version 3.0
(GraphPad Software Inc, San Diego, CA).
8.4 Results
8.4.1 In vitro depth profile using Tape stripping technique and skin remaining
Tape stripping was done for four samples, including one solution and three semi-solid
formulations. As shown in Figure 8-3, all formulations that contained the same amount
of PRE (1 mg/mL) penetration depth profile for punicalagin through the epidermis were
similar to all formulations with a punicalagin concentration of ≤ 0.3 nM/cm2
in each
layer. There was no punicalagin recovery in the control group with no PRE and Zn
included in the formulation, since no peak was identified in the HPLC analysis which
make the detectable amount of punicalagin from the formulation significant (p <0.05).
When the tape stripping results were pooled for each formulation, both HPMC 856
formulation and carrageenan formulation showed a slightly higher – 1.79 and 1.8
nM/cm2 (p >0.05) – but statistically insignificant penetration through the epidermis than
the Carbopol and phthalate buffer solution with 1.34 and 1.55 nM/cm2 (Figure 8-4). The
depth profiles showed that all formulations achieved an equal level of punicalagin at
each layer, indicating that the equilibrium of punicalagin took place and a reservoir
effect could be happening here.
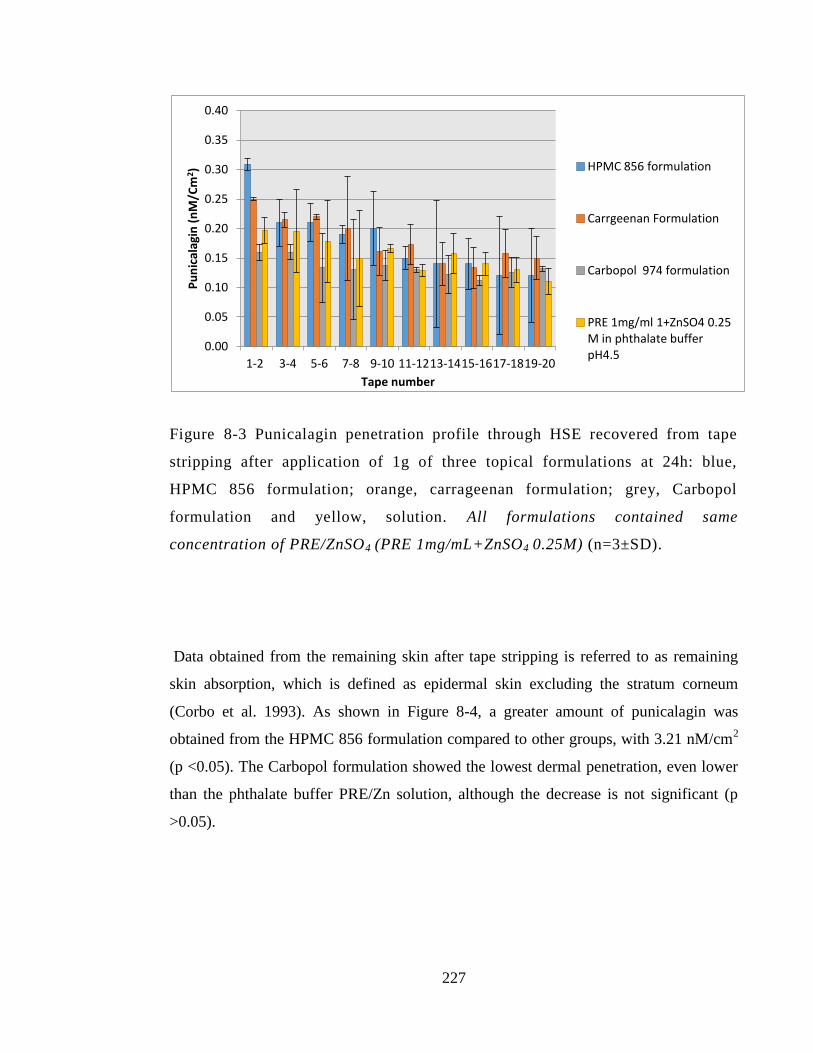
227
Figure 8-3 Punicalagin penetration profile through HSE recovered from tape
stripping after application of 1g of three topical formulations at 24h: blue,
HPMC 856 formulation; orange, carrageenan formulation; grey, Carbopol
formulation and yellow, solution. All formulations contained same
concentration of PRE/ZnSO4 (PRE 1mg/mL+ZnSO4 0.25M) (n=3±SD).
Data obtained from the remaining skin after tape stripping is referred to as remaining
skin absorption, which is defined as epidermal skin excluding the stratum corneum
(Corbo et al. 1993). As shown in Figure 8-4, a greater amount of punicalagin was
obtained from the HPMC 856 formulation compared to other groups, with 3.21 nM/cm2
(p <0.05). The Carbopol formulation showed the lowest dermal penetration, even lower
than the phthalate buffer PRE/Zn solution, although the decrease is not significant (p
>0.05).
0.00
0.05
0.10
0.15
0.20
0.25
0.30
0.35
0.40
1-2 3-4 5-6 7-8 9-10 11-12 13-14 15-16 17-18 19-20
Pu
nic
alag
in (
nM
/Cm
2 )
Tape number
HPMC 856 formulation
Carrgeenan Formulation
Carbopol 974 formulation
PRE 1mg/ml 1+ZnSO4 0.25 M in phthalate buffer pH4.5
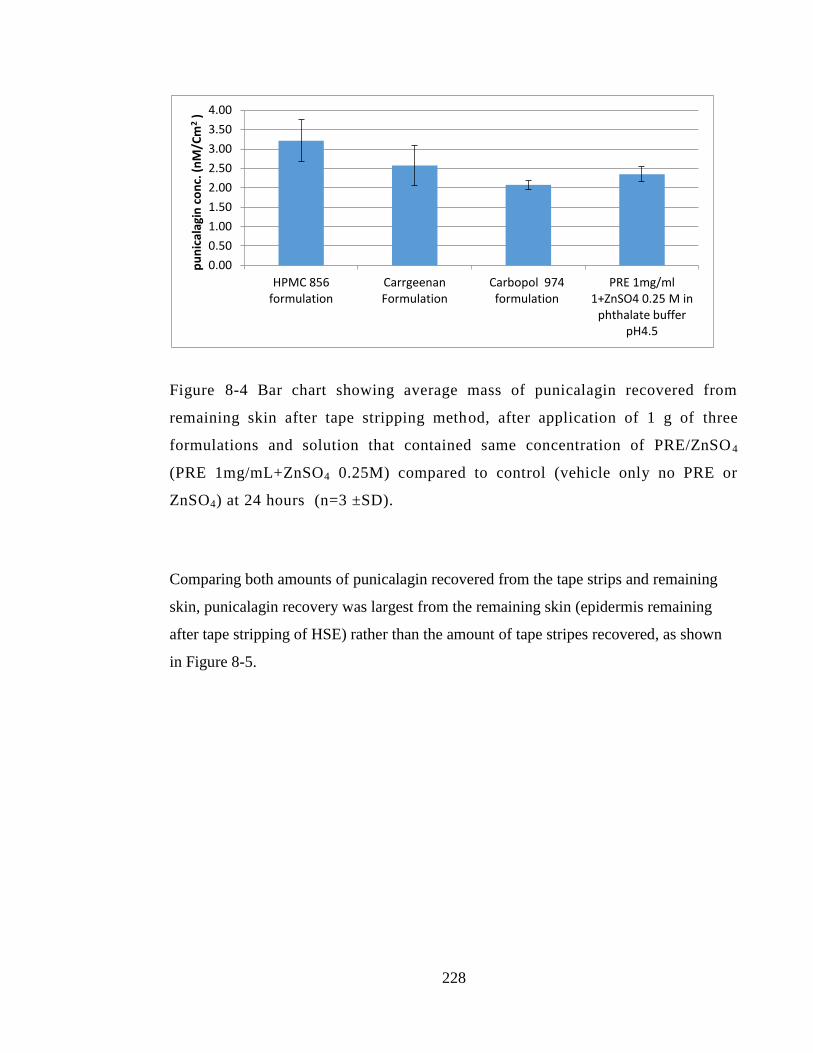
228
Figure 8-4 Bar chart showing average mass of punicalagin recovered from
remaining skin after tape stripping method, after application of 1 g of three
formulations and solution that contained same concentration of PRE/ZnSO 4
(PRE 1mg/mL+ZnSO4 0.25M) compared to control (vehicle only no PRE or
ZnSO4) at 24 hours (n=3 ±SD).
Comparing both amounts of punicalagin recovered from the tape strips and remaining
skin, punicalagin recovery was largest from the remaining skin (epidermis remaining
after tape stripping of HSE) rather than the amount of tape stripes recovered, as shown
in Figure 8-5.
0.00
0.50
1.00
1.50
2.00
2.50
3.00
3.50
4.00
HPMC 856 formulation
Carrgeenan Formulation
Carbopol 974 formulation
PRE 1mg/ml 1+ZnSO4 0.25 M in
phthalate buffer pH4.5
pu
nic
alag
in c
on
c. (
nM
/Cm
2 )
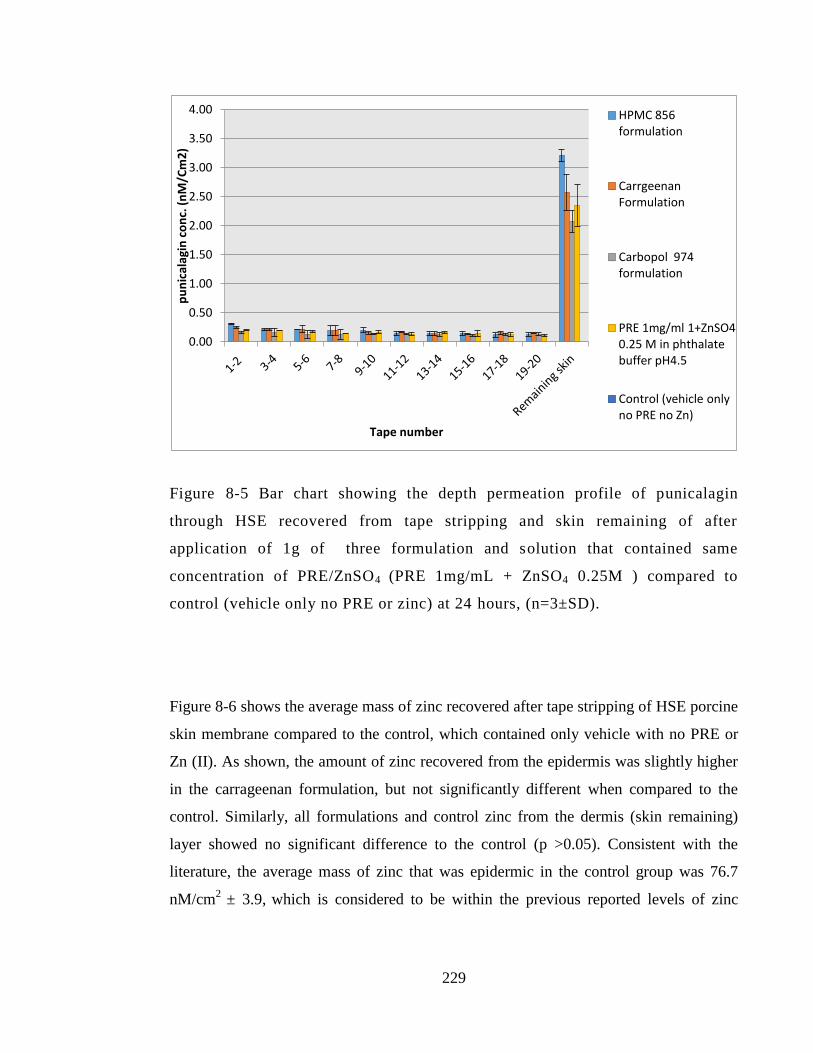
229
Figure 8-5 Bar chart showing the depth permeation profile of punicalagin
through HSE recovered from tape stripping and skin remaining of after
application of 1g of three formulation and solution that contained same
concentration of PRE/ZnSO4 (PRE 1mg/mL + ZnSO4 0.25M ) compared to
control (vehicle only no PRE or zinc) at 24 hours, (n=3±SD).
Figure 8-6 shows the average mass of zinc recovered after tape stripping of HSE porcine
skin membrane compared to the control, which contained only vehicle with no PRE or
Zn (II). As shown, the amount of zinc recovered from the epidermis was slightly higher
in the carrageenan formulation, but not significantly different when compared to the
control. Similarly, all formulations and control zinc from the dermis (skin remaining)
layer showed no significant difference to the control (p >0.05). Consistent with the
literature, the average mass of zinc that was epidermic in the control group was 76.7
nM/cm2
± 3.9, which is considered to be within the previous reported levels of zinc
0.00
0.50
1.00
1.50
2.00
2.50
3.00
3.50
4.00
pu
nic
alag
in c
on
c. (
nM
/Cm
2)
Tape number
HPMC 856 formulation
Carrgeenan Formulation
Carbopol 974 formulation
PRE 1mg/ml 1+ZnSO4 0.25 M in phthalate buffer pH4.5
Control (vehicle only no PRE no Zn)
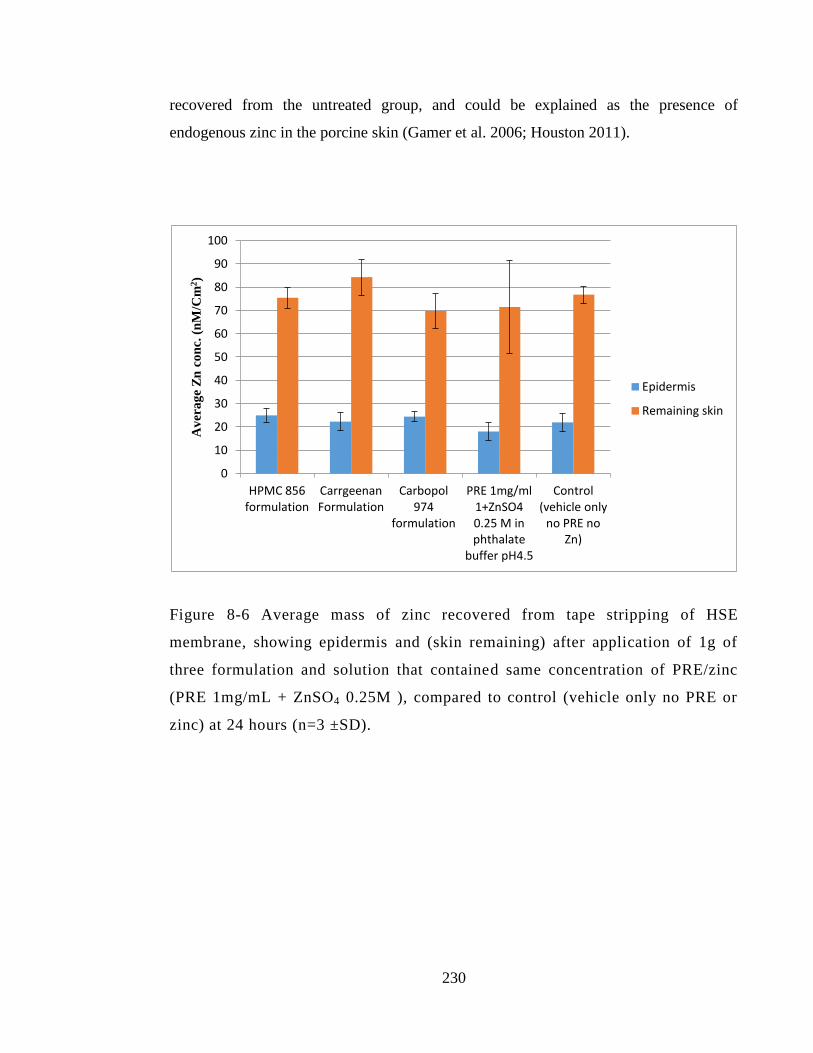
230
recovered from the untreated group, and could be explained as the presence of
endogenous zinc in the porcine skin (Gamer et al. 2006; Houston 2011).
Figure 8-6 Average mass of zinc recovered from tape stripping of HSE
membrane, showing epidermis and (skin remaining) after application of 1g of
three formulation and solution that contained same concentration of PRE/zinc
(PRE 1mg/mL + ZnSO4 0.25M ), compared to control (vehicle only no PRE or
zinc) at 24 hours (n=3 ±SD).
0
10
20
30
40
50
60
70
80
90
100
HPMC 856 formulation
Carrgeenan Formulation
Carbopol 974
formulation
PRE 1mg/ml 1+ZnSO4 0.25 M in phthalate
buffer pH4.5
Control (vehicle only
no PRE no Zn)
Av
era
ge
Zn
co
nc.
(n
M/C
m2)
Epidermis
Remaining skin
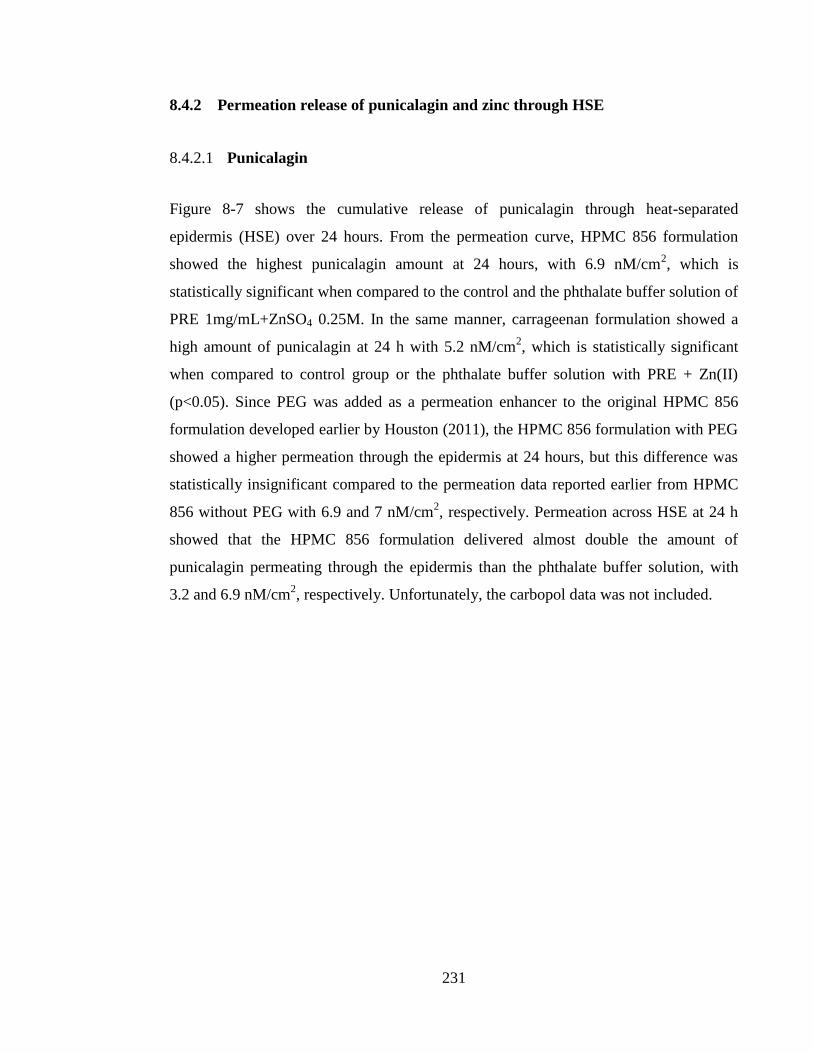
231
8.4.2 Permeation release of punicalagin and zinc through HSE
8.4.2.1 Punicalagin
Figure 8-7 shows the cumulative release of punicalagin through heat-separated
epidermis (HSE) over 24 hours. From the permeation curve, HPMC 856 formulation
showed the highest punicalagin amount at 24 hours, with 6.9 nM/cm2, which is
statistically significant when compared to the control and the phthalate buffer solution of
PRE 1mg/mL+ZnSO4 0.25M. In the same manner, carrageenan formulation showed a
high amount of punicalagin at 24 h with 5.2 nM/cm2, which is statistically significant
when compared to control group or the phthalate buffer solution with PRE + Zn(II)
(p<0.05). Since PEG was added as a permeation enhancer to the original HPMC 856
formulation developed earlier by Houston (2011), the HPMC 856 formulation with PEG
showed a higher permeation through the epidermis at 24 hours, but this difference was
statistically insignificant compared to the permeation data reported earlier from HPMC
856 without PEG with 6.9 and 7 nM/cm2, respectively. Permeation across HSE at 24 h
showed that the HPMC 856 formulation delivered almost double the amount of
punicalagin permeating through the epidermis than the phthalate buffer solution, with
3.2 and 6.9 nM/cm2, respectively. Unfortunately, the carbopol data was not included.
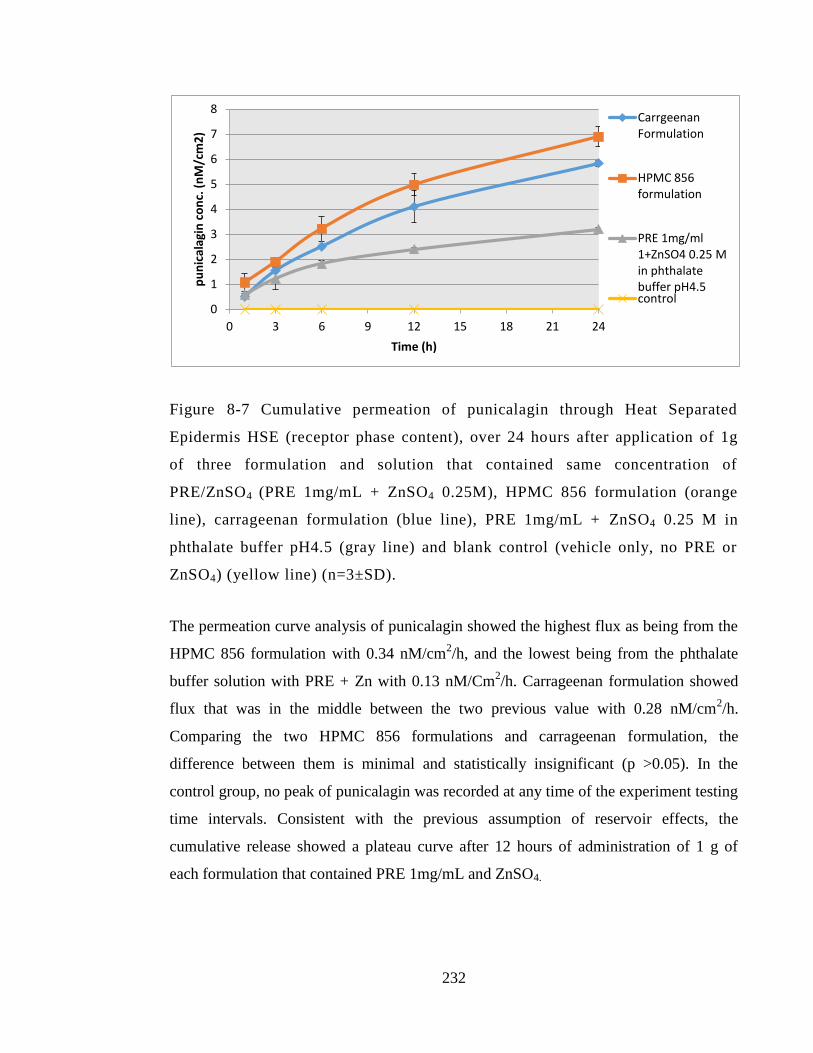
232
Figure 8-7 Cumulative permeation of punicalagin through Heat Separated
Epidermis HSE (receptor phase content), over 24 hours after application of 1g
of three formulation and solution that contained same concentration of
PRE/ZnSO4 (PRE 1mg/mL + ZnSO4 0.25M), HPMC 856 formulation (orange
line), carrageenan formulation (blue line), PRE 1mg/mL + ZnSO4 0.25 M in
phthalate buffer pH4.5 (gray line) and blank control (vehicle only, no PRE or
ZnSO4) (yellow line) (n=3±SD).
The permeation curve analysis of punicalagin showed the highest flux as being from the
HPMC 856 formulation with 0.34 nM/cm2/h, and the lowest being from the phthalate
buffer solution with PRE + Zn with 0.13 nM/Cm2/h. Carrageenan formulation showed
flux that was in the middle between the two previous value with 0.28 nM/cm2/h.
Comparing the two HPMC 856 formulations and carrageenan formulation, the
difference between them is minimal and statistically insignificant (p >0.05). In the
control group, no peak of punicalagin was recorded at any time of the experiment testing
time intervals. Consistent with the previous assumption of reservoir effects, the
cumulative release showed a plateau curve after 12 hours of administration of 1 g of
each formulation that contained PRE 1mg/mL and ZnSO4.
0
1
2
3
4
5
6
7
8
0 3 6 9 12 15 18 21 24
pu
nic
alag
in c
on
c. (
nM
/cm
2)
Time (h)
Carrgeenan Formulation
HPMC 856 formulation
PRE 1mg/ml 1+ZnSO4 0.25 M in phthalate buffer pH4.5 control
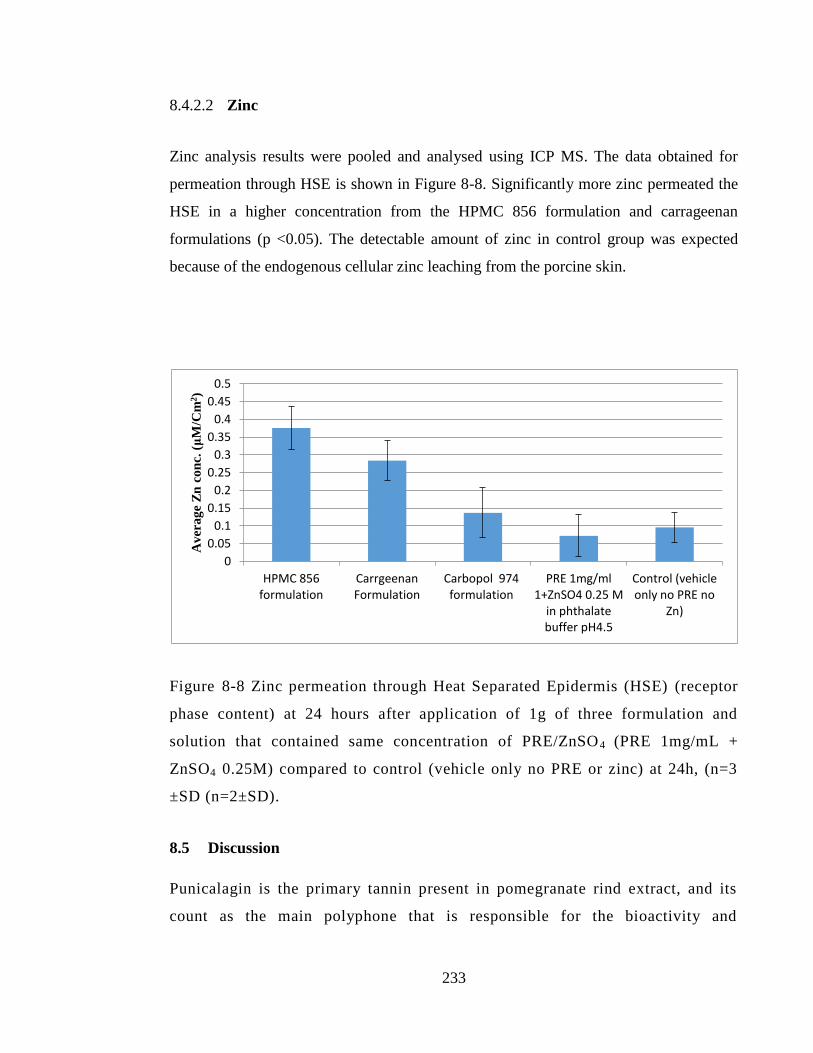
233
8.4.2.2 Zinc
Zinc analysis results were pooled and analysed using ICP MS. The data obtained for
permeation through HSE is shown in Figure 8-8. Significantly more zinc permeated the
HSE in a higher concentration from the HPMC 856 formulation and carrageenan
formulations (p <0.05). The detectable amount of zinc in control group was expected
because of the endogenous cellular zinc leaching from the porcine skin.
Figure 8-8 Zinc permeation through Heat Separated Epidermis (HSE) (receptor
phase content) at 24 hours after application of 1g of three formulation and
solution that contained same concentration of PRE/ZnSO4 (PRE 1mg/mL +
ZnSO4 0.25M) compared to control (vehicle only no PRE or zinc) at 24h, (n=3
±SD (n=2±SD).
8.5 Discussion
Punicalagin is the primary tannin present in pomegranate rind extract, and its
count as the main polyphone that is responsible for the bioactivity and
0
0.05
0.1
0.15
0.2
0.25
0.3
0.35
0.4
0.45
0.5
HPMC 856 formulation
Carrgeenan Formulation
Carbopol 974 formulation
PRE 1mg/ml 1+ZnSO4 0.25 M
in phthalate buffer pH4.5
Control (vehicle only no PRE no
Zn)
Av
era
ge
Zn
co
nc.
(μ
M/C
m2)
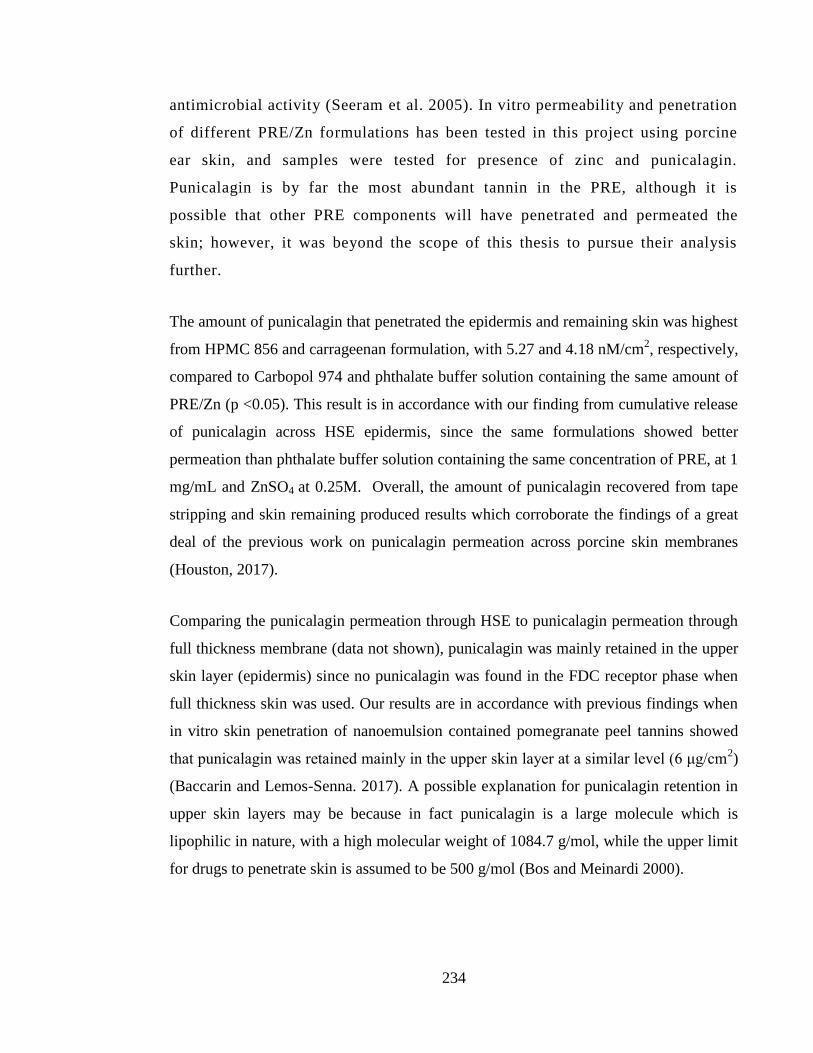
234
antimicrobial activity (Seeram et al. 2005). In vitro permeability and penetration
of different PRE/Zn formulations has been tested in this project using porcine
ear skin, and samples were tested for presence of zinc and punicalagin.
Punicalagin is by far the most abundant tannin in the PRE, although it is
possible that other PRE components will have penetrated and permeated the
skin; however, it was beyond the scope of this thesis to pursue their analysis
further.
The amount of punicalagin that penetrated the epidermis and remaining skin was highest
from HPMC 856 and carrageenan formulation, with 5.27 and 4.18 nM/cm2, respectively,
compared to Carbopol 974 and phthalate buffer solution containing the same amount of
PRE/Zn (p <0.05). This result is in accordance with our finding from cumulative release
of punicalagin across HSE epidermis, since the same formulations showed better
permeation than phthalate buffer solution containing the same concentration of PRE, at 1
mg/mL and ZnSO4 at 0.25M. Overall, the amount of punicalagin recovered from tape
stripping and skin remaining produced results which corroborate the findings of a great
deal of the previous work on punicalagin permeation across porcine skin membranes
(Houston, 2017).
Comparing the punicalagin permeation through HSE to punicalagin permeation through
full thickness membrane (data not shown), punicalagin was mainly retained in the upper
skin layer (epidermis) since no punicalagin was found in the FDC receptor phase when
full thickness skin was used. Our results are in accordance with previous findings when
in vitro skin penetration of nanoemulsion contained pomegranate peel tannins showed
that punicalagin was retained mainly in the upper skin layer at a similar level (6 μg/cm2)
(Baccarin and Lemos-Senna. 2017). A possible explanation for punicalagin retention in
upper skin layers may be because in fact punicalagin is a large molecule which is
lipophilic in nature, with a high molecular weight of 1084.7 g/mol, while the upper limit
for drugs to penetrate skin is assumed to be 500 g/mol (Bos and Meinardi 2000).
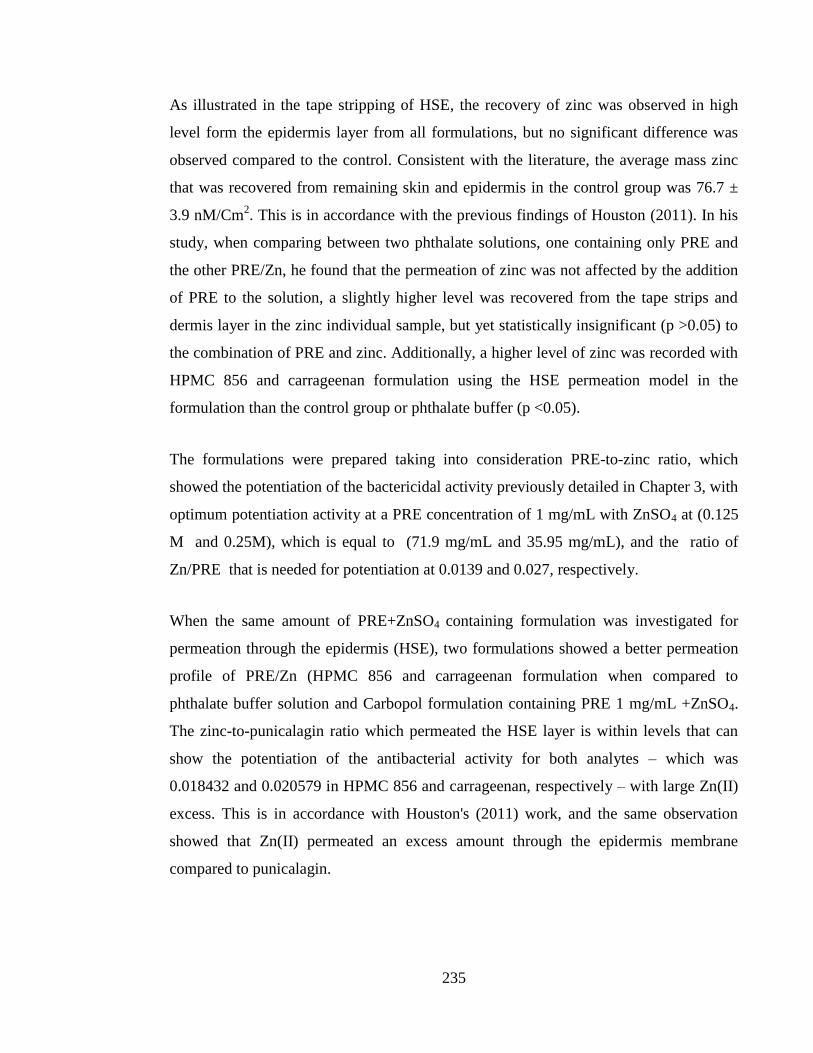
235
As illustrated in the tape stripping of HSE, the recovery of zinc was observed in high
level form the epidermis layer from all formulations, but no significant difference was
observed compared to the control. Consistent with the literature, the average mass zinc
that was recovered from remaining skin and epidermis in the control group was 76.7 ±
3.9 nM/Cm2. This is in accordance with the previous findings of Houston (2011). In his
study, when comparing between two phthalate solutions, one containing only PRE and
the other PRE/Zn, he found that the permeation of zinc was not affected by the addition
of PRE to the solution, a slightly higher level was recovered from the tape strips and
dermis layer in the zinc individual sample, but yet statistically insignificant (p >0.05) to
the combination of PRE and zinc. Additionally, a higher level of zinc was recorded with
HPMC 856 and carrageenan formulation using the HSE permeation model in the
formulation than the control group or phthalate buffer (p <0.05).
The formulations were prepared taking into consideration PRE-to-zinc ratio, which
showed the potentiation of the bactericidal activity previously detailed in Chapter 3, with
optimum potentiation activity at a PRE concentration of 1 mg/mL with ZnSO4 at (0.125
M and 0.25M), which is equal to (71.9 mg/mL and 35.95 mg/mL), and the ratio of
Zn/PRE that is needed for potentiation at 0.0139 and 0.027, respectively.
When the same amount of PRE+ZnSO4 containing formulation was investigated for
permeation through the epidermis (HSE), two formulations showed a better permeation
profile of PRE/Zn (HPMC 856 and carrageenan formulation when compared to
phthalate buffer solution and Carbopol formulation containing PRE 1 mg/mL +ZnSO4.
The zinc-to-punicalagin ratio which permeated the HSE layer is within levels that can
show the potentiation of the antibacterial activity for both analytes – which was
0.018432 and 0.020579 in HPMC 856 and carrageenan, respectively – with large Zn(II)
excess. This is in accordance with Houston's (2011) work, and the same observation
showed that Zn(II) permeated an excess amount through the epidermis membrane
compared to punicalagin.
236
Additionally, in Chapter 5, it was found that PRE also gave enhanced wound migration
and proliferation of HaCaT skin cell line with in vitro at 24 h with a concentration of
PRE at 5 and 2.5 μg/mL, although a statistically significant increase was seen at 10
μg/mL. The equivalent concentration of punicalagin present in these PRE concentrations
was calculated using the relationship between total mass of PRE extracted and β-
punicalagin within the freeze-dried PRE previously established in Chapter 2, Section
2.2.2.1.1. The equivalent level of punicalagin to enhance cell migration was found to be
0.23 nM.
The results of the tape stripping show that a large amount of punicalagin was found to be
retained in the epidermis layer. Potential reservoir effect was hypothesised because of
the equal amount of punicalagin concentration found in each layer of the upper skin
using tape stripping, which was in the range of ≤ 0.3 nM/cm2, and the total amount
added with the remaining skin to give 5.27 and 4.18 nM/cm2 of HPMC 856 and
carrageenan formulation. This level of punicalagin would be expected to promote cell
healing and migration. Lower levels were recorded with Carbopol and phthalate
solution, with punicalagin at 3.22 and 2.94 nM/cm2, but these values are still within the
level of punicalagin that can enhance cell migration.
The surface of the stratum corneum continually desquamates and is continually replaced
by the layers underneath. As the tape-stripping data has shown that punicalagin and zinc
are present in these lower layers, it can be inferred that they will remain present as the
lower layers emerge onto the surface and still be able to provide antibacterial activity
and therefore substantivity in antibacterial activity (Long, et al, 1985). Ideally, this
would need to be confirmed in follow up experiments.
From the depth penetration and epidermis permeation profile of PRE/Zn revealed in this
chapter, the system could potentially be used for other skin conditions that need an
active component to be available at the epidermis layer, such as cellulitis.
237
8.6 Conclusion
In this chapter the permeation profile of three different formulations and one solution
contained the same active component of PRE 1mg/mL + ZnSO4 0.25M has been
illustrated through in vitro porcine skin membrane.
Two formulations showed the optimum penetration and permeation profile
through in vitro epidermis model (HPMC 856 and carrageenan formulation) in
order to potentiate the antibacterial activity. Punicalagin and zinc penetrated the
epidermis in levels that should produce potentiated antibacterial activity.
Our intended formulations were made to provide bactericidal potentiation
concentration at the surface of the skin, but with this depth profile of skin
penetration and HSE permeation, such system could also be beneficial to treat
other sub-surface skin infection, such as cellulitis.
In the next Chapter the antiseptic activity of such formulations are investigated using
an inoculated porcine in vitro skin model.

238
Chapter 9: In vitro ‘in-use’ skin sanitation
potential of PRE and Zn(II) solution and
formulations
239
9.1 Introduction
The bacterial suspension test data, as detailed in Chapter 3, gave promising results in
regard to the enhanced antibacterial activity of PRE and Zn(II) in combination. The
activity associated with the combination was one of a synergistic effect when FIC was
calculated relative to the MICs of PRE and Zn(II) against MRSA. However, it is
important to be able to demonstrate that the microbiological data determined under such
laboratory conditions can be reflected in a simulated ‘in-use’ scenario. Obtaining similar
effects on an infected biological surface would support the further development of a
topical sanitation product based on the PRE and Zn(II) combination.
Although the mechanism of synergy between PRE and Zn(II) remains to be elucidated,
it is likely to involve interplay between the zinc and PRE (punicalagin) (Houston 2011).
Many factors could potentially interfere with and diminish this interplay and
antibacterial enhanced activity, including drying, the presence of materials such as
irregular surfaces of organic tissue, and phospholipid interactions.
In this chapter, the bacterial recovery from inoculated in vitro porcine skin following the
application of PRE formulations and solution is investigated. The s. aureus was used as
a test microorganism, as it is one of the most common bacteria to have been associated
with severe skin and wound infections, including surgical site infection (Wang et al.
2018). Furthermore, the PRE and Zn(II) combination has shown promising synergised
activity against MRSA, as previously detailed in Chapter 3. A control group will be
treated with skin antiseptic formulation (Hibiscrub) with 4% of the active ingredient
chlorhexidine. Chlorhexidine was chosen as the control in this chapter due to its superior
antiseptic activity compared to isopropyl alcohol, as has been reported in a previous in
vivo study comparing the antimicrobial effect on the resident microflora of the hand (Aly
and Maibach 1979).
240
9.2 Objective and aims
To evaluate the potential of PRE and Zn(II) solution and formulations to disinfect in
vitro porcine skin in a simulated in-use scenario.
Confirm synergised bactericidal activity of formulation containing PRE and
Zn(II) after application onto porcine skin inoculated with MRSA
9.3 Materials and methods
9.3.1 Materials
All materials used in this chapter were previously detailed in Chapter 2, Section 2.1.
9.3.2 Preparation of PRE and ZnSO4 solutions
Solutions containing individual PRE in phthalate buffer were prepared using methods
previously detailed in chapter 2, Section 2.2.1.2. Zinc sulphate individual samples in
phthalate buffer pH4.5 were prepared according to the method in Section, 2.2.1.4. Test
solution in combinations of PRE and ZnSO4 were prepared using the method previously
described for preparing combined solution in Section 2.2.1.5 in phthalate buffer pH 4.5.
9.3.3 Aseptic technique
An aseptic technique was maintained through all experiments in this chapter using
routine microbiological safety cabinets previously detailed in Chapter 2, Section 2.2.4.1.
241
9.3.4 Preparation of microbiology agar media and broth
Mueller Hinton agar and broth were prepared according to the methods previously
detailed in Chapter 2, Sections 2.2.4.2 and 2.2.4.3.
9.3.5 Preparation of bacterial culture
An overnight bacterial culture of methicillin-resistant Staphylococcus aureus (MRSA)
(NCTC 12493) was prepared according to the routine working bacterial culture
preparation previously described in Section 2.2.4.6. Then, preparation of 0.5 McFarland
(1.5 x10⁸
bacteria cell density) followed the methods detailed in Chapter 2, Section
2.2.4.7
9.3.6 Preparation of formulations
The selected three formulations were HPMC 856, Carbopol 974, and carrageenan, and
followed the method of preparation previously detailed in Chapter 7, sections 7.3.3,
7.3.4, and 7.3.5. Additional blank formulations without any PRE or ZnSO4 were
prepared using the same method of preparation, but excluding the active ingredients
(PRE, ZnSO4). An additional positive control group of skin samples were challenged
with a commercially available chlorhexidine 4% skin sanitiser product (Hibiscrub 4%).
9.3.7 Full thickness porcine ear skin preparation and skin sterilization prior to
the experiment
Porcine ear skin was provided by a local slaughterhouse. The skin cleaning and
preparation methods are described in Chapter 2, Section 2.2.3.1. Avoiding
imperfections, prepared porcine skin was cut with sterile scissors into similar squares
with a 2 cm2 surface area. Each skin sample was placed in a sterile petri dish and kept in
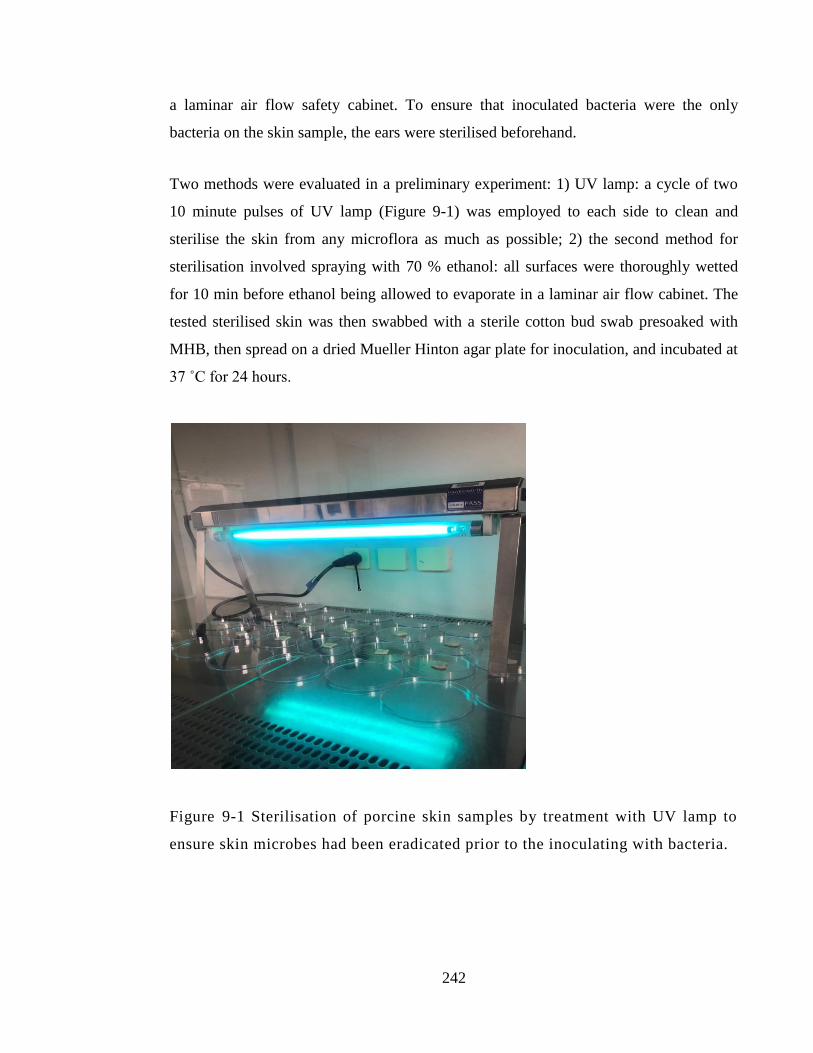
242
a laminar air flow safety cabinet. To ensure that inoculated bacteria were the only
bacteria on the skin sample, the ears were sterilised beforehand.
Two methods were evaluated in a preliminary experiment: 1) UV lamp: a cycle of two
10 minute pulses of UV lamp (Figure 9-1) was employed to each side to clean and
sterilise the skin from any microflora as much as possible; 2) the second method for
sterilisation involved spraying with 70 % ethanol: all surfaces were thoroughly wetted
for 10 min before ethanol being allowed to evaporate in a laminar air flow cabinet. The
tested sterilised skin was then swabbed with a sterile cotton bud swab presoaked with
MHB, then spread on a dried Mueller Hinton agar plate for inoculation, and incubated at
37 ˚C for 24 hours.
Figure 9-1 Sterilisation of porcine skin samples by treatment with UV lamp to
ensure skin microbes had been eradicated prior to the inoculating with bacteria.
243
9.3.8 Bacterial recovery from inoculated porcine skin following application of
PRE formulations and solution
The method used in this section is an adaptation of previously reported protocol that
investigated the bacterial survival on skin and their sensitivity to antibacterial agent by
Messager et al. (2004).Skin samples pretreated with a UV lamp were placed in a laminar
air flow cabinet for the entire duration of the experiment. An overnight culture was used
to inoculate skin samples by adding 10 μL of methicillin resistant Staphylococcus
aureus MRSA (NCTC 12493) with 1.5 x10⁸
CFU/mL in the centre of every 2 cm
sampling area. Each area was then dosed with 100 µL of test formulation challenge or
control, and then massaged using a sterile rod using the same protocol each time: 10
rotations with light pressure applied. After 20 minutes exposure time, skin areas were
swabbed with a sterile cotton bud pre-soaked in 5 mL MHB for 10 seconds. The
swabbing method was done in an identical manner for all samples: five times moving
the bud in a horizontal line up and down, and five times for a vertical line in the same
sampling area. The tip of each cotton bud was cut off using sterilised scissors, and then
transferred to 5 mL of MHB and vortex mixed for 20 seconds. Then 100 µL was
transferred to 900 mL of neutralising agent previously detailed in Chapter 2, Section
2.2.4.9, and allowed to sit for 60 minutes. Six serial dilutions were then prepared. After
that, the Miles and Misra (1938) drop count technique was employed for each dilution
using 3x10 µL drop onto agar plates then incubated for 24 hours at 37 °C. Colony
forming units per millilitre (CFU/mL) of the bacteria and bactericidal activity were
calculated for each group as a log reduction value, as previously described in Chapter 3,
sections 3.3.8 and 3.3.9.
To investigate bacterial survival on such a skin model, initially two samples of skin were
each inoculated with the same concentration of MRSA: 10 μL of (1.5 x10⁸ CFU/mL).
The first skin sample was swabbed and the drop count method was applied on an agar
plate to calculate the bacterial concentration at 0 hours. After incubation of the tested
244
skin for 3 hours at 37 °C, the second skin sample was swabbed and counted for bacterial
concentration. Both agar plates were incubated for 24 hours at 37˚C. This step was
initially made to determine the dryness effect and bacterial survival of MRSA after
inoculation on an in vitro skin model.
9.3.9 Statistical analysis
In each test, data are expressed as means ± SD, otherwise stated. Statistical analysis of
was carried out using One way analysis of variance (ANOVA) with Tukey‘s post test to
compare statistical significances between groups and or One way analysis of variance
(ANOVA) with post-test Dunnett analysis to compare groups against the control.
Results were expressed as significant and very significant with p < 0.05 and p < 0.01
respectively. The analysis was carried out using InStat for windows, version 3.0
(GraphPad Software Inc, San Diego, CA).
9.4 Results
9.4.1 Full thickness porcine ear skin preparation and skin sterilisation prior to
the experiment
As shown in Figure 9-2, the UV lamp swab sterilisation method showed better results as
illustrated after a skin swab growth test on MH agar, while the 70% ethanol still showed
some microbial growth. Based on these results, all further skin samples were treated
with a UV lamp prior to experimentation.
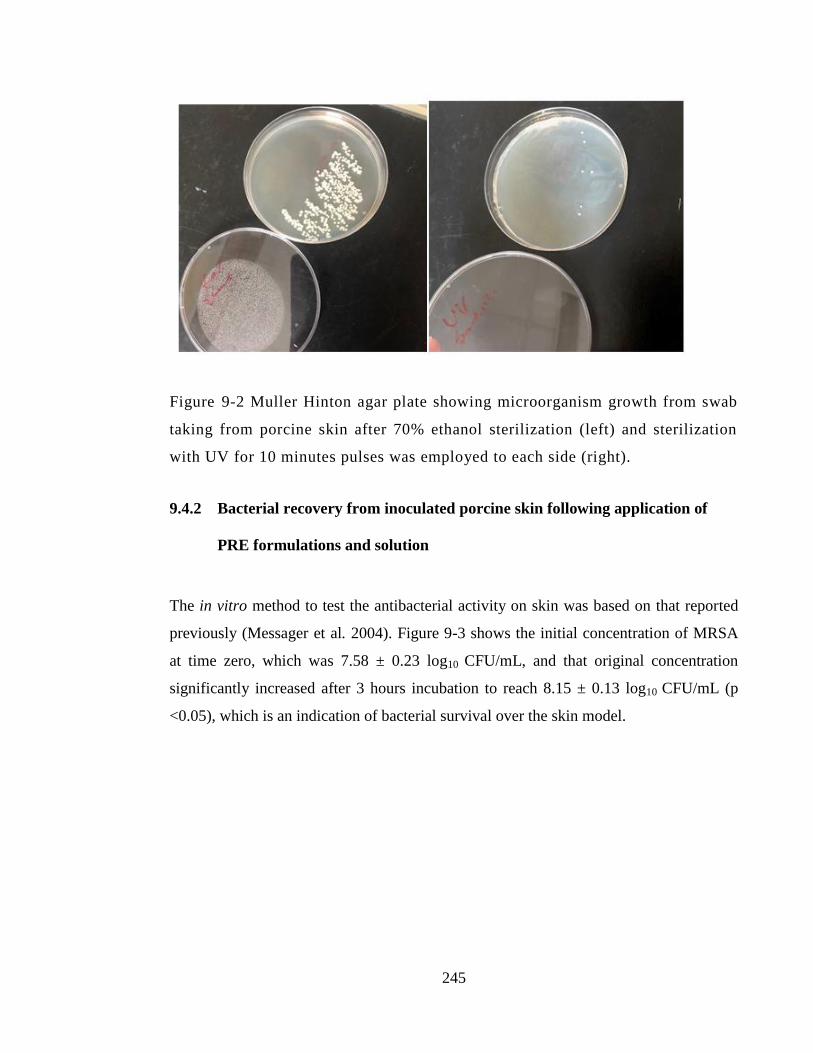
245
Figure 9-2 Muller Hinton agar plate showing microorganism growth from swab
taking from porcine skin after 70% ethanol sterilization (left) and sterilization
with UV for 10 minutes pulses was employed to each side (right).
9.4.2 Bacterial recovery from inoculated porcine skin following application of
PRE formulations and solution
The in vitro method to test the antibacterial activity on skin was based on that reported
previously (Messager et al. 2004). Figure 9-3 shows the initial concentration of MRSA
at time zero, which was 7.58 ± 0.23 log10 CFU/mL, and that original concentration
significantly increased after 3 hours incubation to reach 8.15 ± 0.13 log10 CFU/mL (p
<0.05), which is an indication of bacterial survival over the skin model.
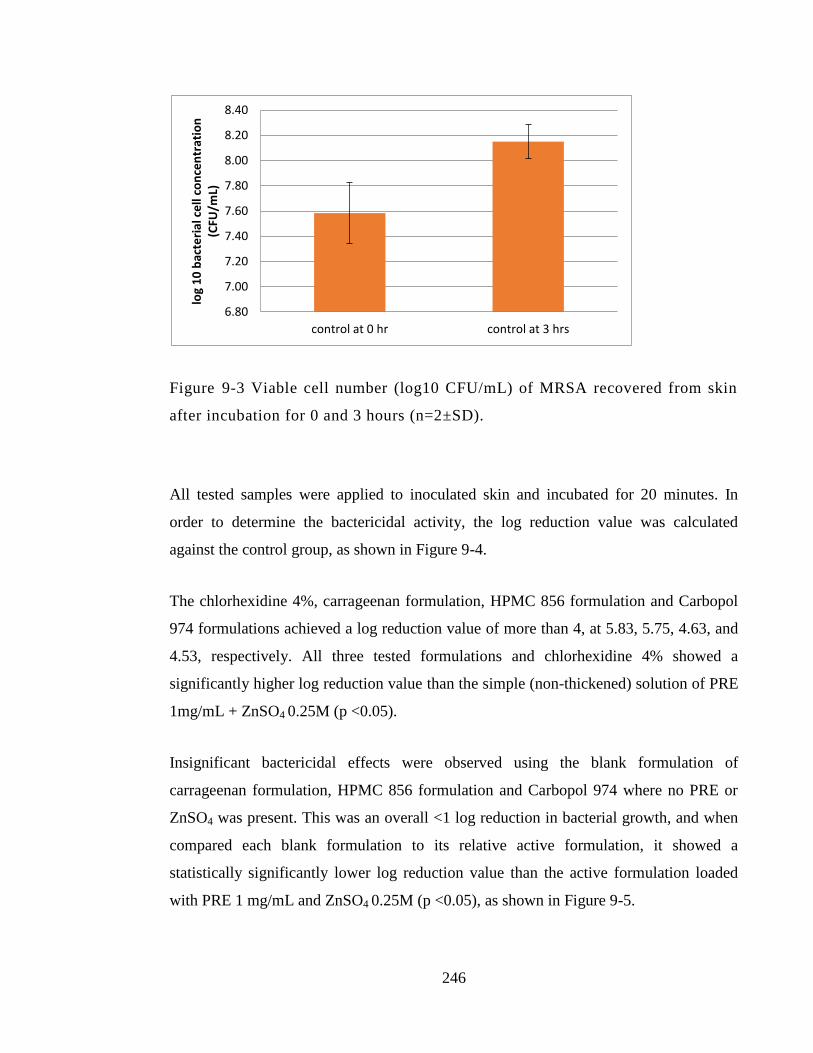
246
Figure 9-3 Viable cell number (log10 CFU/mL) of MRSA recovered from skin
after incubation for 0 and 3 hours (n=2±SD).
All tested samples were applied to inoculated skin and incubated for 20 minutes. In
order to determine the bactericidal activity, the log reduction value was calculated
against the control group, as shown in Figure 9-4.
The chlorhexidine 4%, carrageenan formulation, HPMC 856 formulation and Carbopol
974 formulations achieved a log reduction value of more than 4, at 5.83, 5.75, 4.63, and
4.53, respectively. All three tested formulations and chlorhexidine 4% showed a
significantly higher log reduction value than the simple (non-thickened) solution of PRE
1mg/mL + ZnSO4 0.25M (p <0.05).
Insignificant bactericidal effects were observed using the blank formulation of
carrageenan formulation, HPMC 856 formulation and Carbopol 974 where no PRE or
ZnSO4 was present. This was an overall <1 log reduction in bacterial growth, and when
compared each blank formulation to its relative active formulation, it showed a
statistically significantly lower log reduction value than the active formulation loaded
with PRE 1 mg/mL and ZnSO4 0.25M (p <0.05), as shown in Figure 9-5.
6.80
7.00
7.20
7.40
7.60
7.80
8.00
8.20
8.40
control at 0 hr control at 3 hrs
log
10
bac
teri
al c
ell
con
cen
trat
ion
(C
FU/m
L)
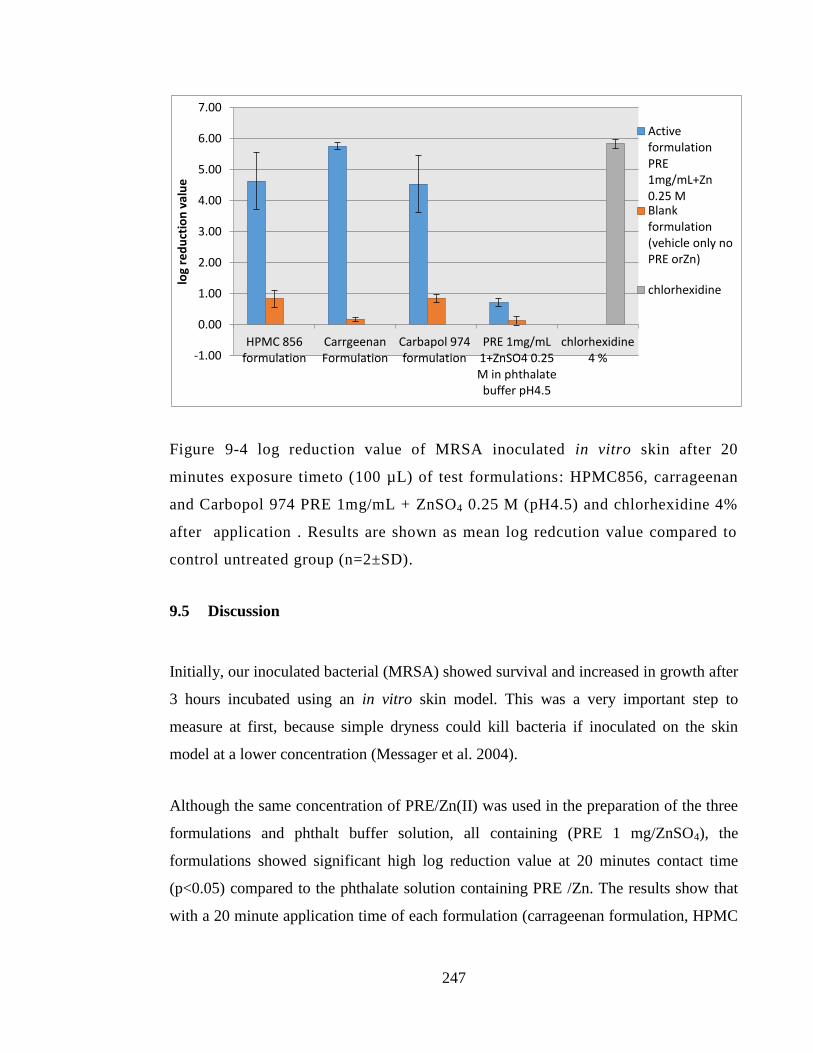
247
Figure 9-4 log reduction value of MRSA inoculated in vitro skin after 20
minutes exposure timeto (100 µL) of test formulations: HPMC856, carrageenan
and Carbopol 974 PRE 1mg/mL + ZnSO4 0.25 M (pH4.5) and chlorhexidine 4%
after application . Results are shown as mean log redcution value compared to
control untreated group (n=2±SD).
9.5 Discussion
Initially, our inoculated bacterial (MRSA) showed survival and increased in growth after
3 hours incubated using an in vitro skin model. This was a very important step to
measure at first, because simple dryness could kill bacteria if inoculated on the skin
model at a lower concentration (Messager et al. 2004).
Although the same concentration of PRE/Zn(II) was used in the preparation of the three
formulations and phthalt buffer solution, all containing (PRE 1 mg/ZnSO4), the
formulations showed significant high log reduction value at 20 minutes contact time
(p<0.05) compared to the phthalate solution containing PRE /Zn. The results show that
with a 20 minute application time of each formulation (carrageenan formulation, HPMC
-1.00
0.00
1.00
2.00
3.00
4.00
5.00
6.00
7.00
HPMC 856 formulation
Carrgeenan Formulation
Carbapol 974 formulation
PRE 1mg/mL 1+ZnSO4 0.25 M in phthalate buffer pH4.5
chlorhexidine 4 %
log
red
uct
ion
val
ue
Active formulation PRE 1mg/mL+Zn 0.25 M Blank formulation (vehicle only no PRE orZn)
chlorhexidine
248
856 formulation, and Carbopol 974), a >4.5 log reduction value was achieved against
MRSA. The resulting bactericidal activity was compared to a blank formulation that
contained the same excipient but not the active ingredient (PRE 1 mg/mL + ZnSO4 0.25
M). All blank combinations showed a <l log reduction and significantly lower activity
when compared to the comparator formulation containing actives/s (p <0.05). The
observed bactericidal activity with blank formulations could be attributed to the lower
pH value (pH4.5) or sensitivity to some of excipient presence in the formulation. This is
in accordance with previous report showed that MRSA susceptibility could be restored
when acidic media is in use (Lemaire, et al. 2007). This demonstrates evidence of
PRE/Zn activity under simulated in-use conditions.
The 3 thickened formulations all performed similarly, and it was not possible to select
the most active. This might be possible by diluting the formulations appropriately and
re-running the experiment, although such a dilution would disrupt the integrity and
viscosity properties of the gels.
On the other hand, the non-thickened solution of PRE 1mg/mL + ZnSO4 0.25 M at
phthalate buffer pH4.5 gave a <1 log reduction value, and this was expected from
previous findings in Chapter 3, which showed that the lowest contact time for
bactericidal activity to appear was 1 hour. The additive effects of active drug to be
incorporated in formulation rather than solution forms, was further explained by
Nicoletti et al. (1993). In his study, chlorhexidine 4% in formulation product showed
more rapidly antiseptic activity than when compared to the laboratory-prepared solution
of the same concentration of chlorhexidine against S. aureus. Another explanation for
the higher bactericidal activity achieved in the formulation but not the solution is the
substantivity effect, conferred by the thickening agents used. This effect can be defined
of the persistence of the antimicrobial activity of a substance even after rinsing and
drying (Nishioka, et al. 2018). In Chapter 8, the permeation through HSE and epidermis
layer achieved for both Zn(II) and punicalagin in higher amounts with HPMC 856 and
carrageenan formulation, and our results in this chapter show that highest bactericidal
249
activity was observed in the latest formulation with 5.75 log reduction value, which
further adds to the reservoir theory. In a previous study, the excellent long-term activity
of chlorhexidine was greatly attributed to its substantivity. After the application of
chlorhexidine, the compound bound to the skin stratum corneum will act as a reservoir
of the antiseptic activity, and even after rinsing or drying resulted in extended
bactericidal effect. The study reveals that only chlorhexidine showed substantivity
activity among the three tested antiseptics, including povidone-iodine and sodium
hypochlorite (Macias et al. 2013).
In our study, chlorhexidine 4% (Hibiscrub) showed high bactericidal activity (>5 log
reduction value) after application to in vitro full thickness porcine skin inoculated with
MRSA. This is in line with a previous report showing that chlorhexidine 4% gave a ≥
4.6 log reduction value against clinically isolated MRSA at 30 minutes exposure time
(Nicoletti et al. 1993). In another study, chlorhexidine 2% gave a log reduction value of
5 when the activity was investigated using bacterial suspension tests against MRSA,
which broadly confirms our results achieved with chlorhexidine 4% (Maillard et al.
1998). Although the same study reported lower bactericidal activity of chlorhexidine
recorded when bacteria was inoculated in an in vitro skin model. The study highlighted
that chlorhexidine 2 % bactericidal activity decreased significantly when using the
inoculated skin model to reach a log reduction value of almost 1 in comparison to the
bacterial suspension test (5 log reduction value) at the same contact time (p <0.05).
While our results show high bactericidal activity of chlorhexidine 4% using the in vitro
inoculated skin model, this could be explained by the fact that we used a higher
concentration of chlorhexidine (at 4%) and a longer contact time (20 minute) in contrast
to 2% and 10 minutes contact time in Maillard et al.'s (1998) study.
Overall, all three formulations which contained (PRE 1 mg/Zn 0.25M) showed
bactericidal activity against MRSA that is comparable to chlorhexidine 4% (Hibiscrub)
(p<0.05) after application on the inoculated in vitro skin model for 20 minutes contact
time.
250
9.6 Conclusion
Our data from this simulated in-use skin sanitation work shows that:
1. All three formulations (carrageenan formulation, HPMC 856 formulation, and
Carbopol 974) that contained the same concentration of active ingredient (PRE 1
mg/mL + ZnO4 0.25 M) achieved a >4 log reduction value against MRSA
(NCTC 12493). This was statistically greater than the unthickened formulation.
2. The enhanced activity of the formulations supports the development of a
topically applied bactericidal product.

251
Chapter 10: General discussion
252
10.1 General Discussion
The antimicrobial activity of pomegranate has long been recognised and extensively
studied in the literature, and has shown promising antimicrobial activity against a wide
range of microorganisms (Melendez and Capriles, 2006; Biedenbach et al. 2004; Choi et
al. 2011; Moorthy et al. 2013; Pagliarulo et al. 2016). While the activity of pomegranate
has been investigated by means of fruit extracts from either the juice, pulp, seeds,
flower, or rind, interest in the pomegranate peel extract has recently increased because of
the higher antimicrobial activity of the rind compared to extracts from various other
parts of the fruit (Fawole et al. 2012; Baccarin 2015; Ma et al. 2015; Nasiri et al. 2017;
Asadi et al. 2018).
In this project we set out to investigate the potential use of the natural products
pomegranate rind extract (PRE) and Zn(II) as a potential topical product to treat skin
infections, both superficial and wounds. The premise for the work was the significant
findings of Dr David Houston, who discovered that the co-application of PRE and
ZnSO4, in particular ratios, created synergistic and potent virucidal activity (the term
‘potentiated’ was used at the time, although it is more likely to be synergistic, as both
possess some degree of antimicrobial action).
Viral skin infections are important, including the Herpes simplex virus, which
commonly manifests as peri-oral coldsores and anogenital herpes, and the work of
Houston (2011) indicated that a new topical product was feasible to treat these
conditions. Additionally, as PRE/Zn is cidal in nature it has potential action in the later
stages of a cold sore, whereas antiviral therapy only works in the earlier replication
stages.
However, many other skin infections are caused by bacteria, and these are potentially far
more life-threatening, especially if the infection enters the system. A particularly
problematic topical infection is MRSA, and other bacteria which are becoming
253
increasingly resistant to first-line antibiotics, such as ciprofloxacin. Therefore, one of the
first tasks in this work was to determine if the PRE/Zn had any effect against a panel of
bacteria associated with wound infections.
The first major achievement of this work was to establish that PRE/Zn was indeed active
against MRSA. In Chapter 3, the investigation of antibacterial activity of PRE/ Zn(II)
showed that a synergistic effect was observed against MRSA and S. epidermidis when
FIC index value of PRE/Zn was ≤ 0.5 in both microorganisms. An additive effect was
also seen in MSSA S. aureus, E.coli, and P. aeruginosa. The activity varied depending
on the species being challenged, but overall each was sensitive to PRE/Zn. Importantly,
the activity was verified independently in an external laboratory setting (Dr Wing Man
Lau, Newcastle University).
It is rare that a compound or co-administered compounds are active against both viruses
and bacteria, because they are such different organisms. PRE/Zn exerts both
antimicrobial and microbicidal activities. Unpublished work has determined that new
ligand complexes are not formed in solution (Heard, personal communication). The
mechanism of action, although not the focus of this work, probably lies in an interplay
between the components of PRE (i.e. the tannin punicalagin, as shown by Houston) and
Zn(II). An important point, then, is that the PRE/Zn system can only work when applied
together topically to challenge the microorganism cooperatively – if administered
intravenously for example such cooperativity is unlikely to occur due to dilution in the
bloodstream.
Most drugs for treating microorganism infections are anti-microbial in nature – i.e. they
interfere with the life cycle in some manner – the ratio of Zn(II) to PRE (punicalagin) is
clearly of importance to achieve the best effect. Microbicides are rarer as
pharmaceuticals, and one reason is that they not only kill microbes, they also have
adverse effects on human tissues; i.e. they are overly cytotoxic.
254
Therefore, in the the next part of this project, the cytotoxicity of PRE with and without
Zn(II) was investigated using the HaCaT keratinocyte cell line as a standard model of
epidermal cells. Using the standard MTT cytotoxicity test, no cytotoxicity effect was
observed on HaCat cell line when treated with PRE from 2.5 μg/mL and up to 100
μg/mL, at 24 hours. While FACS analysis narrowed the toxicity level to PRE ≥100
μg/mL, all investigated Zn(II) concentration (12.5-100 μM) showed no cytotoxic effect
during 7 days exposure time. The previous study by Houston (2011) showed that ZnSO4
showed no cytotoxic effect on the epithelial cell line at 0.1 M up to 72 hours. The
antibacterial potentiation concentration that is needed for PRE to work against MRSA
and S. epidermidis is (62.5 and 31.25 μgmL) and ZnSO (1600, 400 μM), respectively.
These findings reveal that there was little or no cytotoxic effect observed in PRE/Zn in
the concentration range that is needed for the potentiating of antibacterial activity up to
24 contact times. So, if PRE/Zn is generally safe to use at the cellular level, how does it
affect the rate of wound closure?
Several studies have shown the potential of pomegranate extract application in wound
healing, especially against aggressive types of non-healing wounds such as diabetic foot
ulcers (Fleck et al. 2016). With this in mind, an in vitro scratch wound model was used
to investigate PRE/Zn on cultured HaCaT cell migration following the introduction of an
artificial scratch. The cell migration of the scratched wound model was followed using
confocal microscopy over a period of 48 hours. The cell migration process showed that
PRE at a lower concentration (2.5 and 5 μg/mL) appeared to show promotion within the
first 24 hours, whereas PRE 10 μg/mL significantly enhanced the migration and
proliferation at within this period to give 61% wound closure compared to the control
(untreated group) with 38%. The same positive effect on wound healing was observed in
ZnSO4 in concentrations of 25, 50, and 100μM, with 91, 74, and 96% closure within the
first 24 hours. All treatments in addition to the control showed complete wound closure
by the 48h mark. The combination of PRE (5 or 10 μg/mL) was made with ZnSO4 25, 50
and 100 μM) and all combinations at all times gave >86% closure in the first 24 hours.
Observed increase in wound healing at (PRE 10 µg/mL ZnSO4 50 µM) and (PRE 5
255
µg/mL + ZnSO4 50 µM) which gave 94 and 93% wound closure at the first 24 hours,
respectively, when compared to the PRE and Zn(II) individual results. Overall, these
positive effects seen at the cellular level suggest that PRE/Zn could indeed be beneficial
by accelerating wound healing in vivo.
To have any chance of reaching the marketplace, PRE/Zn must demonstrate stability
over a reasonable timescale. A stability study was thus performed over six months, and
three main effects were investigated: the effect of Zn(II) application on PRE, the effect
of three different temperatures (-20, 2-4, 20 °C), and the effect of pH value (pH 4.5 in
phthalate buffer and 7 in water). Using punicalagin content as a marker, both higher
temperatures and high pH value had a significant effect on the stability of PRE/Zn
formulations. At six months storage time, a significant loss of punicalagin was observed
with high pH (7) and high temperature (20 °C), with an almost 30 % loss in punicalagin
content. No negative or positive effect of Zn(II) addition to PRE was observed at any
condition. From this study, we conclude that the optimum stability of such a
combination will be at pH 4.5 with a temperature storage condition of ≤ 4 °C. This could
be considered an unwelcome finding, as it is far more preferable for a product to be
stored and be stable at room temperature.
The work carried out thus far involved PRE/Zn as a solution; however, this is of limited
value in terms of translating the positive effects observed into tangible pharmaceutical
products. Therefore, we next wanted to prepare a formulation that could be used for
topical application of the PRE/Zn combination. Three formulations were selected, which
used three types of thickening agent: carrageenan, HPMC856, and Carbopol 974.
Optimisation of the preparations was made by means of: physical appearance, stability
investigation, viscosity, wettability, and finally validation of the formulation’s
synergistic antibacterial activity against planktonic S. aureus. The three selected
formulations all contained the same active ingredients: PRE 1 mg/mL + ZnSO4 0.25 M.
Next, the formulations were investigated for their ability to deliver PRE (punicalagin)
and Zn(II) into and across the skin. The rationale for carrying this out was that a
256
reservoir might be created for these actives, which could facilitate a longer term or more
substantive effect on the skin surface. Also, initially mainly for completeness, we
wanted to determine the extent to which the actives permeated skin, using freshly
excised porcine ear skin. Consequently, depth profiling (by tape stripping) and
permeation was investigated in vitro using heat-separated epidermis membranes. The
potentiation of bactericidal activity was observed at two combinations: PRE 1mg/mL
and ZnSO4 0.125M and PRE 1mg/mL and ZnSO4 0.25M. Two formulations (HPMC 856
and carrageenan) showed the permeation ratio of both analytes through the HSE is at
levels which can show potentiation of the antibacterial activity for both analytes. It
became apparent that this finding was more significant than first realised, as it supported
the application of these formulations for the treatment of sub-surface skin infections,
such as cellulitis. From the tape stripping of the HSE, the punicalagin was found in
levels that could increase the reservoir effect of PRE. The punicalagin level detected at
the outer layer would be sufficient for PRE to promote cell proliferation and cell healing.
Finally, we wanted to end the thesis by establishing that the formulations provide
bactericidal activity in an in-use scenario. An in vitro skin sanitation study was therefore
performed, again using freshly excised porcine as a substrate and MRSA as test
bacterium. The skin was firstly sterilised used UV irradiation for 10 minutes, then
inoculated with MRSA. The areas inoculated were then dosed with the PRE/Zn
formulations and, after certain timepoints, bacterial recovery was determined. The
results show that the unthickened solution gave a < 1 log reduction after 20 minutes of
contact time. However, a >5 log reduction value was achieved against MRSA with all
three formulations (HPMC 856, Carbopol 974, and carrageenan), which was the same as
the positive control chlorhexidine 4% (Hibiscrub).
To summarise the main findings of this thesis:
1. PRE/Zn shows synergised activity against a panel of bacteria, as well as viruses
such as HSV as known from previous works
257
2. Little evidence of cytotoxicity using HaCaT cells
3. Positive effects on cell migration and wound closure
4. Good stability was demonstrated at temperatures of ≤ 4 ˚C
5. Three hydrogels were prepared and characterised, which are demonstrated
bactericidal activity
6. Of the tested formulations, PRE/Zn penetrates the skin to an extent that could
provide a reservoir effect.
7. Of the tested formulations, PRE/Zn permeates skin at levels that could be used
to treat sub-surface infections
8. Applied topically to skin, the formulations provide good bacterial sanitation, to a
similar level of the chlorhexidine control
Further work
This thesis has covered a lot of ground in determining the feasibility of developing a
PRE/Zn product for use as a skin and wound sanitiser. However, we are still some way
away from a refined marketable system.
Given more time, we would have liked to investigate activity across even further
bacterial biofilms, since it would make for an extremely interesting system across a wide
range of sanitising applications. Adding further bacterial species and clinical isolates
would also help to establish the broad spectrum activity of PRE/Zn.
258
As the current system is based on natural product (pomegranate rind extract),
development of a standardised method to decrease the extraction batch variations, i.e.
varying polyphenol content levels, would be advantageous.
In preliminary studies, we used a preparative HPLC system to isolate punicalagin from
PRE, and it showed a high purity level of about 89% (data not shown). It is worth
reinvestigating the punicalagin isolation method, and studying the stability and
antibacterial activity of this compound in isolation.
Pomegranate polyphenols antibacterial activity can be studied in separate such as
punicalagin and ellagic acid. More data antibacterial activity would give more insight
into the antibacterial activity part; specifically, whether it is advantageous to use isolated
polyphenol or the whole PRE in combination with Zn (II).
Mechanism of action can be further studied using several Zn (II) salts to confirm that the
antibacterial activity comes from the Zn(II) rather than its salt (i.e SO42-
). In addition, a
binding interaction between PRE and Zn(II) can be investigated using isothermal titration
calorimetry (ITC), in order to investigate if the combination made a new substance or simple
complexation took place.
Finally, given the high correlation of the porcine skin model to human skin, we showed
the encouraging antiseptic and permeation profile activity of PRE/Zn, although it is
important to note that all work was performed under “ex vivo” conditions. Ultimately, an
in vivo study on an animal model or in humans would need to be conducted, especially
when proposing the treatment of clinical conditions such as impetigo and cellulitis.
259
References
Adiga, S., Tomar, P. and Rajput, R.R., 2010. Effect of Punica granatum peel aqueous
extract on normal and dexamethasone suppressed wound healing in wistar
rats. International Journal of Pharmaceutical Sciences Review and Research, 5(2),
pp.34-37.
Afaq, F., Zaid, MA., Khan, N., Dreher, M., Mukhtar, H., 2009. Protective effect of
pomegranate-derived products on UVB-mediated damage in human reconstituted skin.
Experimental Dermatology 18(6), 553–561.
Ågren, M.S., 1993. Zinc oxide increases degradation of collagen in necrotic wound
tissue. British Journal of Dermatology, 129(2), pp.221-222.
Ågren, M.S., Chvapil, M. and Franzén, L., 1991. Enhancement of re-epithelialization
with topical zinc oxide in porcine partial-thickness wounds. Journal of Surgical
Research, 50(2), pp.101-105.
Ågren, M.S., Ostenfeld, U., Kallehave, F., Gong, Y., Raffn, K., Crawford, M.E., Kiss,
K., Friis‐Møller, A., Gluud, C. and Jorgensen, L.N., 2006. A randomized, double‐blind,
placebo‐controlled multicenter trial evaluating topical zinc oxide for acute open wounds
following pilonidal disease excision. Wound repair and regeneration, 14(5), pp.526-535.
Ahmad, I. and Beg, A.Z., 2001. Antimicrobial and phytochemical studies on 45 Indian
medicinal plants against multi-drug resistant human pathogens. Journal of
Ethnopharmacology 74(2), 113-123.
Akbarpour, V., Hemmati, K. and Sharifani, M., 2009. Physical and chemical properties
of pomegranate (Punica granatum L.) fruit in maturation stage. American-Eurasian
Journal of Agricultural & Environmental Sciences, 6(4), pp.411-416.
260
Akiyama H, Ueda M, Kanzaki H, Tada J, Arata J. Biofilm formation of Staphylococcus
aureus strains isolated from impetigo and furuncle: role of fibrinogen and fibrin. J
Dermatol Sci. 1997 Nov;16(1):2-10.
Al Saeedi, M., El Zubier, A.G., Bahnassi, A.A. and Al Dawood, K.M., 2003. Patterns of
belief and use of traditional remedies by diabetic patients in Mecca, Saudi Arabia. East
Mediterr Health J. 9, 99-107.
Al-Muammar, M. N., & Khan, F., 2012. Obesity: The preventive role of the
pomegranate (Punica granutum). Nutrition 28, 595–604.
Aly, R.A.Z.A. and Maibach, H.I., 1979. Comparative study on the antimicrobial effect
of 0.5% chlorhexidine gluconate and 70% isopropyl alcohol on the normal flora of
hands. Appl. Environ. Microbiol., 37(3), pp.610-613.
Al-Zoreky, N.S., 2009. Antimicrobial activity of pomegranate (Punica granatum L.) fruit
peels. International Journal of Food Microbiology 134(3), 244-248.
Asadi, M.S., Mirghazanfari, S.M., Dadpay, M. and Nassireslami, E., 2018. Evaluation of
wound healing activities of pomegranate (Punica granatum-Lythraceae) peel and
pulp. Journal of Research in Medical and Dental Science, 6(3), pp.230-236.
Aslam, M.N., Lansky, E.P. and Varani, J., 2006. Pomegranate as a cosmeceutical
source: pomegranate fractions promote proliferation and procollagen synthesis and
inhibit matrix metalloproteinase-1 production in human skin cells. Journal of
ethnopharmacology, 103(3), pp.311-318.
Atiyeh, B.S., Dibo, S.A. and Hayek, S.N., 2009. Wound cleansing, topical antiseptics
and wound healing. International wound journal, 6(6), pp.420-430.
261
Azarbayjani, A.F., Lin, H., Yap, C.W., Chan, Y.W. and Chan, S.Y., 2010. Surface
tension and wettability in transdermal delivery: a study on the in‐vitro permeation of
haloperidol with cyclodextrin across human epidermis. Journal of Pharmacy and
Pharmacology, 62(6), pp.770-778.
Babu, U.V., Mitra, S.K., Saxena, E., Suriyanarayanan, R., 2009.Composition, used to
prevent dental diseases e.g. plaque, comprises extracts of Punica granatum, Acacia
arabica, Terminalia chebula, Terminalia bellerica, Emblica oficinalis and Embelia
ribes, and naturally derived excipients e.g. xylitol. Patent Number(s): US2009185987-
A1; IN200800167-I1.
Baccarin, T. and Lemos-Senna, E., 2017. Potential application of nanoemulsions for skin
delivery of pomegranate peel polyphenols. AAPS PharmSciTech, 18(8), pp.3307-3314.
Badoe, E.A., Archampong, E.Q. and Jaja, M.O.A. eds., 1994. Principles and Practice of
Surgery, Including Pathology in the Tropics. University of Ghana Medical School.
Bajaj, S., Singla, D. and Sakhuja, N., 2012. Stability testing of pharmaceutical
products. J App Pharm Sci, 2(3), pp.129-38.
Barnes, H.A., Hutton, J.F. and Walters, K., 1989. Linear Viscoelasticity An introduction
to rheology (Vol. 3), pp.37-54. oxford: Elsevier,.
Barrientos, S., Stojadinovic, O., Golinko, M.S., Brem, H. and Tomic‐Canic, M., 2008.
Growth factors and cytokines in wound healing. Wound repair and regeneration, 16(5),
pp.585-601.
Beck-Sagué, C.M. and Jarvis, W.R., 1993. Secular trends in the epidemiology of
nosocomial fungal infections in the United States, 1980-1990. The Journal of Infectious
Diseases 167, 1247-1251.
262
Bereket, W., Hemalatha, K., Getenet, B., Wondwossen, T., Solomon, A., Zeynudin, A.
and Kannan, S., 2012. Update on bacterial nosocomial infections. Eur Rev Med
Pharmacol Sci, 16(8), pp.1039-44.
Berridge, M.V. and Tan, A.S., 1993. Characterization of the cellular reduction of 3-(4,
5-dimethylthiazol-2-yl)-2, 5-diphenyltetrazolium bromide (MTT): subcellular
localization, substrate dependence, and involvement of mitochondrial electron transport
in MTT reduction. Archives of biochemistry and biophysics, 303(2), pp.474-482.
Berridge, M.V., Tan, A.S., McCoy, K.D. and Wang, R.U.I., 1996. The biochemical and
cellular basis of cell proliferation assays that use tetrazolium salts. Biochemica, 4(1),
pp.14-19.
Bhushan, B., Chen, S. and Ge, S., 2012. Friction and durability of virgin and damaged
skin with and without skin cream treatment using atomic force microscopy. Beilstein
journal of nanotechnology, 3(1), pp.731-746.
Biedenbach, D.J., Moet, G.J. and Jones, R.N., 2004. Occurrence and antimicrobial
resistance pattern comparisons among bloodstream infection isolates from the SENTRY
Antimicrobial Surveillance ProGram (1997–2002). Diagnostic Microbiology and
Infectious Disease 50(1), 59-69.
Bonapace, C.R., White, R.L., Friedrich, L.V. and Bosso, J.A., 2000. Evaluation of
antibiotic synergy against Acinetobacter baumannii: a comparison with Etest, time-kill,
and checkerboard methods. Diagnostic microbiology and infectious disease, 38(1),
pp.43-50.
Bos, J.D. and Meinardi, M.M., 2000. The 500 Dalton rule for the skin penetration of
chemical compounds and drugs. Experimental dermatology, 9(3), pp.165-169.
263
Boukamp, P., Petrussevska, R.T., Breitkreutz, D., Hornung, J., Markham, A. and
Fusenig, N.E., 1988. Normal keratinization in a spontaneously immortalized aneuploid
human keratinocyte cell line. The Journal of cell biology, 106(3), pp.761-771.
Bowler, P.G., Duerden, B.I. and Armstrong, D.G., 2001. Wound microbiology and
associated approaches to wound management. Clinical microbiology reviews, 14(2),
pp.244-269.
Braga, L.C., Leite, A.A., Xavier, K.G., Takahashi, J.A., Bemquerer, M.P., Chartone-
Souza, E. and Nascimento, A.M., 2005. Synergic interaction between pomegranate
extract and antibiotics against Staphylococcus aureus. Canadian Journal of
Microbiology 51(7), 541-547.
Brennan, S.S. and Leaper, D.J., 1985. The effect of antiseptics on the healing wound: a
study using the rabbit ear chamber. British Journal of Surgery, 72(10), pp.780-782.
Briese M, Ghosh R, Oezka Y, Weiss T., 2010. Cosmetic use of an active agent mixture,
obtained from e.g. Clintonia borealis or Punica granatum, for preventing and/or
inhibiting the effect (that is, nonpathological effect) of psychoemotional stress on the
hair. Patent Number(s): DE102009043486-A1.
Bruins, M.J., Cermak, R., Kiers, J.L., Van Der Meulen, J., Van Amelsvoort, J.M.M. and
Van Klinken, B.J.W., 2006. In vivo and in vitro effects of tea extracts on enterotoxigenic
Escherichia coli-induced intestinal fluid loss in animal models. Journal of Pediatric
Gastroenterology and Nutrition 43(4), 459-469.
Bucknall, T.E., 1980. The effect of local infection upon wound healing: an experimental
study. British Journal of Surgery, 67(12), pp.851-855.
264
C. Konturek, T. Brzozowski, SJ Konturek, S. Kwiecien, A. Dembinski, EG Hahn, P.,
2001. Influence of bacterial lipopolysaccharide on healing of chronic experimental ulcer
in rat. Scandinavian journal of gastroenterology, 36(12), pp.1239-1247..
Cano Sanchez, M., Lancel, S., Boulanger, E. and Neviere, R., 2018. Targeting oxidative
stress and mitochondrial dysfunction in the treatment of impaired wound healing: a
systematic review. Antioxidants, 7(8), p.98.
Celik, I., Temur, A. and Isik, I., 2009. Hepatoprotective role and antioxidant capacity of
pomegranate (Punica granatum) flowers infusion against trichloroacetic acid-exposed in
rats. Food and Chemical Toxicology 47(1), 145-149.
Chen, M.X., Alexander, K.S. and Baki, G., 2016. Formulation and evaluation of
antibacterial creams and gels containing metal ions for topical application. Journal of
pharmaceutics, 2016.
Cho G, Kim D, Kim E, Kim H, Kim S, Moon E, Noh H, Park C., 2010. Skin external
composition useful for preventing skin dryness and skin aging, comprises extracts of
Punica granatum and Tussilago farfara. Patent Number: KR2010031839-A.
Choi, J.G., Kang, O.H., Lee, Y.S., Chae, H.S., Oh, Y.C., Brice, O.O., Kim, M.S., Sohn,
D.H., Kim, H.S., Park, H. and Shin, D.W., 2011. In vitro and in vivo antibacterial
activity of Punica granatum peel ethanol extract against Salmonella. Evidence-Based
Complementary and Alternative Medicine Article ID 690518.
Chou, T.C., 2006. Theoretical basis, experimental design, and computerized simulation
of synergism and antagonism in drug combination studies.Pharmacological
reviews, 58(3), pp.621-681.
265
Chu, Y.W., Liu, S.T., Yang, Y.L., Huang, S.M. and Wang, W.M., 2017. The cytotoxic
mechanism of epigallocatechin gallate on proliferative HaCaT keratinocytes. Journal of
biomedical science, 24(1), p.55.
Clarke, S.K., 1957. Sepsis in surgical wounds with particular reference to
Staphylococcus aureus. British Journal of Surgery, 44(188), pp.592-596.
CLSI, C., 2014. Performance standards for antimicrobial susceptibility testing; twenty-
fourth informational supplement. M100-S24 January.
Coello, R., Glynn, J.R., Gaspar, C., Picazo, J.J. and Fereres, J., 1997. Risk factors for
developing clinical infection with methicillin-resistant Staphylococcus aureus (MRSA)
amongst hospital patients initially only colonized with MRSA. Journal of Hospital
Infection, 37(1), pp.39-46.
Colsky, A.S., Kirsner, R.S. and Kerdel, F.A., 1998. Analysis of antibiotic susceptibilities
of skin wound flora in hospitalized dermatology patients: the crisis of antibiotic
resistance has come to the surface. Archives of dermatology, 134(8), pp.1006-1009.
Corbo, M, T W Schults, G K Wong, and G A Van Buskirk. Development and Validation
of In Vitro release Testing Methods for Semisolid Formulations. Pharmeceutical
Technology, 1993: 112-126.
Cory, A.H., Owen, T.C., Barltrop, J.A. and Cory, J.G., 1991. Use of an aqueous soluble
tetrazolium/formazan assay for cell growth assays in culture. Cancer
communications, 3(7), pp.207-212.
Cosgrove, S.E., Sakoulas, G., Perencevich, E.N., Schwaber, M.J., Karchmer, A.W. and
Carmeli, Y., 2003. Comparison of mortality associated with methicillin-resistant and
methicillin-susceptible Staphylococcus aureus bacteremia: a meta-analysis. Clinical
Infectious Diseases 36(1), 53-59.
266
D’Agostino, A., Stellavato, A., Busico, T., Papa, A., Tirino, V., Papaccio, G., La Gatta,
A., De Rosa, M. and Schiraldi, C., 2015. In vitro analysis of the effects on wound
healing of high-and low-molecular weight chains of hyaluronan and their hybrid H-
HA/L-HA complexes. BMC cell biology, 16(1), p.19.
Darrington, R.T. and Jiao, J., 2004. Rapid and accurate prediction of degradant
formation rates in pharmaceutical formulations using high-performance liquid
chromatography-mass spectrometry. Journal of pharmaceutical sciences, 93(4), pp.838-
846.
Davis, S.C., Martinez, L. and Kirsner, R., 2006. The diabetic foot: the importance of
biofilms and wound bed preparation. Current diabetes reports, 6(6), pp.439-445.
Davis, S.C., Ricotti, C., Cazzaniga, A., Welsh, E., Eaglstein, W.H. and Mertz, P.M.,
2008. Microscopic and physiologic evidence for biofilm‐associated wound colonisation
in vivo. Wound repair and Regeneration, 16(1), pp.23-29.
Demidova-Rice, T.N., Hamblin, M.R. and Herman, I.M., 2012. Acute and impaired
wound healing: pathophysiology and current methods for drug delivery, part 1: normal
and chronic wounds: biology, causes, and approaches to care. Advances in skin & wound
care, 25(7), p.304.
Desai A., 2010. Herbal formulation for treating sickle cell disease. Patent Number:
IN200801962-I3.
Desai, A.M., Desai, A.M., 2009. Herbomineral composition, useful for e.g. treating
sickle cell disease, comprises e.g. Abrakha bhasma (calyx of mica), Jaiphal (Myristica
fragrans houtt), Guduchi Ghana (Tinospora cordifolia) and Loha bhasma (calyx of
iron). Patent Number: WO2009063499-A2; WO2009063499-A3; IN200800564-I3.
267
Deters, A., Schnetz, E., Schmidt, M. and Hensel, A., 2003. Effects of zinc histidine and
zinc sulfate on natural human keratinocytes. Complementary Medicine Research, 10(1),
pp.19-25.
Dick, I.P. and Scott, R.C., 1992. Pig ear skin as an in‐ vitro model for human skin
permeability. Journal of Pharmacy and Pharmacology, 44(8), pp.640-645.
Dodov, M.G., Goracinova, K.A.T.E.R.I.N.A., Simonoska, M.A.J.A., Trajkovic-
Jolevska, S.U.Z.A.N.A., Ribarska, J.T. and Mitevska, M.D., 2005. Formulation and
evaluation of diazepam hydrogel for rectal administration. Acta Pharmaceutica-
Zagreb 55(3), p.251
Donlan, R.M. and Costerton, J.W., 2002. Biofilms: survival mechanisms of clinically
relevant microorganisms. Clinical microbiology reviews, 15(2), pp.167-193.
Donlan, R.M., 2001. Biofilm formation: a clinically relevant microbiological
process. Clinical Infectious Diseases, 33(8), pp.1387-1392.
Drosou, A., Falabella, A. and Kirsner, R., 2003. Antiseptics on wounds: an area of
controversy. Wounds, 15(5), pp.149-166.
Duman, A.D., Ozgen, M., Dayisoylu, K.S., Erbil, N., Durgac, C., 2009. Antimicrobial
activity of six pomegranate (Punica granatum L.) varieties and their relation to some of
their pomological and phytonutrient characteristics. Molecules 14, 1808-1817.
Edlich, R.F., Rodeheaver, G.T., Thacker, J.G., Lin, K.Y., Drake, D.B., Mason, S.S.,
Wack, C.A., Chase, M.E., Tribble, C., Long III, W.B. and Vissers, R.J., 2010.
Revolutionary advances in the management of traumatic wounds in the emergency
department during the last 40 years: part I. The Journal of emergency medicine, 38(1),
pp.40-50.
268
Edwards, R. and Harding, K.G., 2004. Bacteria and wound healing. Current opinion in
infectious diseases, 17(2), pp.91-96.
Elfalleh, W., Nasri, N., Marzougui, N., Thabti, I., M’Rabet, A., Yahya, Y., Lachiheb, B.,
Guasmi, F., Ferchichi, A., 2009. Physico-chemical properties and DPPH-ABTS
scavenging activity of some local pomegranate (Punica granatum) ecotypes.
International Journal of Food Sciences and Nutrition 60, 925-938.
Falanga, V., 1993. Chronic wounds: pathophysiologic and experimental
considerations. Journal of investigative dermatology, 100(5), pp.721-725.
Fan, G., Xu, Z. and Liu, X., 2017. Preparation of Pomegranate Ellagic Acid Inclusion
Complex Gel and Its Transdermal Permeation in Vitro. Procedia engineering, 174,
pp.724-731.
Fernández-Romero, J.A., Abraham, C.J., Rodriguez, A., Kizima, L., Jean-Pierre, N.,
Menon, R., Begay, O., Seidor, S., Ford, B.E., Gil, P.I. and Peters, J., 2012. Zinc
acetate/carrageenan gels exhibit potent activity in vivo against high-dose herpes simplex
virus 2 vaginal and rectal challenge. Antimicrobial agents and chemotherapy, 56(1),
pp.358-368.
Fischer, U.A., Carle, R. and Kammerer, D.R., 2011. Identification and quantification of
phenolic compounds from pomegranate (Punica granatum L.) peel, mesocarp, aril and
differently produced juices by HPLC-DAD–ESI/MS. Food Chemistry 127(2), 807-821.
Flaten, G.E., Palac, Z., Engesland, A., Filipović-Grčić, J., Vanić, Ž. and Škalko-Basnet,
N., 2015. In vitro skin models as a tool in optimization of drug formulation. European
journal of pharmaceutical sciences, 75, pp.10-24.
269
Fleck, A., Cabral, P., Vieira, F., Pinheiro, D., Pereira, C., Santos, W. and Machado, T.,
2016. Punica granatum L. hydrogel for wound care treatment: from case study to
phytomedicine standardization. Molecules, 21(8), p.1059.
Fong Yen, W., Basri, M., Ahmad, M. and Ismail, M., 2015. Formulation and evaluation
of galantamine gel as drug reservoir in transdermal patch delivery system. The scientific
world journal, 2015.
Frank, C., Bayoumi, I. and Westendorp, C., 2005. Approach to infected skin
ulcers. Canadian family physician, 51(10), pp.1352-1359.
Frykberg, R.G. and Banks, J., 2015. Challenges in the treatment of chronic
wounds. Advances in wound care, 4(9), pp.560-582
Fung, S.K., Louie, M. and Simor, A.E., 2002. Combined topical and oral antimicrobial
therapy for the eradication of methicillin-resistant Staphylococcus aureus (MRSA)
colonisation in hospitalized patients. Canadian Journal of Infectious Diseases and
Medical Microbiology, 13(5), pp.287-292.
Furneri, P.M., Marino, A., Saija, A., Uccella, N. and Bisignano, G., 2002. In vitro
antimycoplasmal activity of oleuropein. International journal of antimicrobial
agents, 20(4), pp.293-296.
Gallagher, S.J. and Heard, C.M., 2005. Solvent content and macroviscosity effects on
the in vitro transcutaneous delivery and skin distribution of ketoprofen from simple gel
formulations. Skin pharmacology and physiology, 18(4), pp.186-194.
Gamer, A.O., Leibold, E.V. and Van Ravenzwaay, B., 2006. The in vitro absorption of
microfine zinc oxide and titanium dioxide through porcine skin. Toxicology in
vitro, 20(3), pp.301-307.
270
Gannesen AV, Lesouhaitier O, Racine PJ, et al. Regulation of monospecies and mixed
biofilms formation of skin staphylococcus aureus and cutibacterium acnes by human
natriuretic peptides. Front Microbiol. 2018;9:2912. Published 2018 Dec 10.
doi:10.3389/fmicb.2018.02912
García-Alonso, M., de Pascual-Teresa, S., Santos-Buelga, C. and Rivas-Gonzalo, J.C.,
2004. Evaluation of the antioxidant properties of fruits. Food chemistry, 84(1), pp.13-18.
George Broughton, I.I., Janis, J.E. and Attinger, C.E., 2006. The basic science of wound
healing. Plastic and reconstructive surgery, 117(7S), pp.12S-34S.
George, H.F. and Qureshi, F., 2013. Newton’s Law of Viscosity, Newtonian and Non-
Newtonian Fluids. Encyclopedia of Tribology, pp.2416-2420.
Gerets, H.H., Dhalluin, S. and Atienzar, F.A., 2011. Multiplexing cell viability assays.
In Mammalian Cell Viability (pp. 91-101). Humana Press.
Gil, M.I., Tomás-Barberán, F.A., Hess-Pierce, B., Holcroft, D.M. and Kader, A.A.,
2000. Antioxidant activity of pomegranate juice and its relationship with phenolic
composition and processing. Journal of Agricultural and Food Chemistry 48(10), 4581-
4589.
Ginn, M.E., Noyes, C.M. and Jungermann, E., 1968. The contact angle of water on
viable human skin. Journal of colloid and interface science, 26(2), pp.146-151.
Gjodsbol K., Christensen, J.J., Karlsmark, T., Jørgensen, B., Klein, B.M. and Krogfelt,
K.A., 2006. Multiple bacterial species reside in chronic wounds: a longitudinal
study. International wound journal, 3(3), pp.225-231.
271
Godin, B. and Touitou, E., 2007. Transdermal skin delivery: predictions for humans
from in vivo, ex vivo and animal models. Advanced drug delivery reviews, 59(11),
pp.1152-1161.
Goldman, R.J., 2009. Hyperbaric oxygen therapy for wound healing and limb salvage: a
systematic review. PM&R, 1(5), pp.471-489.
Gottrup, F., 2004. A specialized wound-healing center concept: importance of a
multidisciplinary department structure and surgical treatment facilities in the treatment
of chronic wounds. The American journal of surgery, 187(5), pp.S38-S43.
Grada A, Otero-Vinas M, Prieto-Castrillo F, Obagi Z, Falanga V. Research Techniques
Made Simple: Analysis of Collective Cell Migration Using the Wound Healing Assay. J
Invest Dermatol. 2017 Feb;137(2):e11-e16. doi: 10.1016/j.jid.2016.11.020.
Green, J.W. and Wenzel, R.P., 1977. Postoperative wound infection: a controlled study
of the increased duration of hospital stay and direct cost of hospitalization. Annals of
surgery, 185(3), p.264.
Gross, D., Gross, D.F., 2009. Skin care product comprises enhancers including
cyclodextrin, pentasodium pentetate, phytic acid and/or potassium citrate, and skin care
ingredients including hesperidin methyl chalcone, Glycyrrhiza glabra root extract and
Glycine sofa. Patent Number: WO2009046116-A1; US2009117061-A1.
Gupta, A., Matsui, K., Lo, J.F. and Silver, S., 1999. Molecular basis for resistance to
silver cations in Salmonella. Nature medicine, 5(2), pp.183-188.
Hagens, R., Mann, T., Schreiner, V., Barlag, H.G., Wenck, H., Wittern, K.P. and Mei,
W., 2007. Contact angle measurement–a reliable supportive method for screening
water‐resistance of ultraviolet‐protecting products in vivo. International journal of
cosmetic science, 29(4), pp.283-291.
272
Haidari, M., Ali, M., Casscells, S.W. and Madjid, M., 2009. Pomegranate (Punica
granatum) purified polyphenol extract inhibits influenza virus and has a synergistic
effect with oseltamivir. Phytomedicine 16(12), 1127-1136.
Han, G. and Ceilley, R., 2017. Chronic wound healing: a review of current management
and treatments. Advances in therapy, 34(3), pp.599-610.
Hantash, B.M., Zhao, L., Knowles, J.A. and Lorenz, H.P., 2008. Adult and fetal wound
healing. Front Biosci, 13(13), pp.51-61.
Hardwicke, J., Moseley, R., Stephens, P., Harding, K., Duncan, R. and Thomas, D.W.,
2010. Bioresponsive dextrin− rhEGF conjugates: In vitro evaluation in models relevant
to its proposed use as a treatment for chronic wounds. Molecular pharmaceutics, 7(3),
pp.699-707.
Harper, D., Young, A. and McNaught, C.E., 2014. The physiology of wound
healing. Surgery (Oxford), 32(9), pp.445-450.
Hartmann, F.A., Trostle, S.S. and Klohnen, A.A., 1997. Isolation of methicillin-resistant
Staphylococcus aureus from a postoperative wound infection in a horse. Journal of the
American Veterinary Medical Association, 211(5), pp.590-592.
Hassanpour, S., N. Maheri-Sis, B. Eshratkhah and F. Baghbani Mehmandar., 2011b.
Plants and secondary metabolites (Tannins): A Review. International Journal of Forest,
Soil and Erosion 1(1), 47-53.
Hayouni, E.A., Miled, K., Boubaker, S., Bellasfar, Z., Abedrabba, M., Iwaski, H., Oku,
H., Matsui, T., Limam, F. and Hamdi, M., 2011. Hydroalcoholic extract based-ointment
from Punica granatum L. peels with enhanced in vivo healing potential on dermal
wounds. Phytomedicine, 18(11), pp.976-984.
273
Hellewell, T.B., Major, D.A., Foresman, P.A. and Rodeheaver, G.T., 1997. A
cytotoxicity evaluation of antimicrobial and non-antimicrobial wound
cleansers. Wounds-A Compendium of Clinical Research and Practice, 9(1), pp.15-20.
Henning, A., Schaefer, U.F. and Neumann, D., 2009. Potential pitfalls in skin
permeation experiments: influence of experimental factors and subsequent data
evaluation. European journal of pharmaceutics and biopharmaceutics, 72(2), pp.324-
331.
Hernandez, F., Melgarejo, P., Tomas-Barberan, F.A. and Artes, F., 1999. Evolution of
juice anthocyanins during ripening of new selected pomegranate (Punica granatum)
clones. European Food Research and Technology 210(1), 39-42.
Hernandez, F., Melgarejo, P., Tomas-Barberan, F.A. and Artes, F., 1999. Evolution of
juice anthocyanins during ripening of new selected pomegranate (Punica granatum)
clones. European Food Research and Technology, 210(1), pp.39-42.
Hipler, U.C., Schönfelder, U., Hipler, C. and Elsner, P., 2007. Influence of cyclodextrins
on the proliferation of HaCaT keratinocytes in vitro. Journal of Biomedical Materials
Research Part A: An Official Journal of The Society for Biomaterials, The Japanese
Society for Biomaterials, and The Australian Society for Biomaterials and the Korean
Society for Biomaterials, 83(1), pp.70-79.
Houston DMJ, Robins B, Bugert JJ, Denyer SP, Heard CM., 2017c. In vitro penetration
and biological activity of punicalagin and zinc (II) across skin and mucous membranes
prone to HSV infection. European Journal of Pharmaceutical Sciences 96, 99-106.
Houston, D., 2011. Towards a nanomedicine-based-spectrum topical virucidal
therapeutic system. PhD Thesis, Cardiff University.
274
Houston, D.M., Bugert, J., Denyer, S.P. and Heard, C.M., 2017a. Anti-inflammatory
activity of Punica granatum L. (Pomegranate) rind extracts applied topically to ex vivo
skin. European Journal of Pharmaceutics and Biopharmaceutics, 112, 30-37.
Houston, D.M., Bugert, J.J., Denyer, S.P. and Heard, C.M., 2017b. Potentiated virucidal
activity of pomegranate rind extract (PRE) and punicalagin against Herpes simplex virus
(HSV) when co-administered with zinc (II) ions, and antiviral activity of PRE against
HSV and aciclovir-resistant HSV. PLOS ONE, 12(6), p.e0179291.
Hseu, Y.C., Chou, C.W., Kumar, K.S., Fu, K.T., Wang, H.M., Hsu, L.S., Kuo, Y.H.,
Wu, C.R., Chen, S.C. and Yang, H.L., 2012. Ellagic acid protects human keratinocyte
(HaCaT) cells against UVA-induced oxidative stress and apoptosis through the
upregulation of the HO-1 and Nrf-2 antioxidant genes. Food and Chemical
Toxicology, 50(5), pp.1245-1255.
Hseu, Y.C., Chou, C.W., Kumar, K.S., Fu, K.T., Wang, H.M., Hsu, L.S., Kuo, Y.H.,
Wu, C.R., Chen, S.C. and Yang, H.L., 2012. Ellagic acid protects human keratinocyte
(HaCaT) cells against UVA-induced oxidative stress and apoptosis through the
upregulation of the HO-1 and Nrf-2 antioxidant genes. Food and Chemical Toxicology,
50(5), pp.1245-1255.
Huan, Y., Peng, K.J., Wang, Q.L., Gu, Z.Y., Lu, Y.Q., Jun, Z.H.A.O., Fang, X.U., Liu,
Y.L., Ying, T.A.N.G., Deng, F.M. and Peng, Z.H.O.U., 2013. Effect of pomegranate
peel polyphenol gel on cutaneous wound healing in alloxan-induced diabetic
rats. Chinese medical journal, 126(9), pp.1700-1706.
Hugo, W. B. and Bloomfield, S.F., 1971. Studies on the mode of action of the phenolic
antibacterial agent fentichlor against Staphylococcus aureus and Escherichia coli. 3. The
effect of fentichlor on the metabolic activities of Staphylococcus aureus and Escherichia
coli. Journal of Applied Bacteriology, 34(3), 579-591.
275
Human skin surface, SEM. [ONLINE] Available at: <a
href="https://www.sciencephoto.com/media/315792/view/human-skin-surface-
sem">https://www.sciencephoto.com/media/315792/view/human-skin-surface-sem</a>.
[Accessed 1 September 2019].
ICH, (2003). [online] Available at:
https://www.ich.org/fileadmin/Public_Web_Site/ICH_Products/Guidelines/Quality/Q1A
_R2/Step4/Q1A_R2__Guideline.pdf [Accessed 15 Nov. 2016].
ICH, (2003). [Online] Available at:
https://www.ich.org/fileadmin/Public_Web_Site/ICH_Products/Guidelines/Quality/Q1A
_R2/Step4/Q1A_R2__Guideline.pdf [Accessed 15 Nov. 2016].
Innes, M.E., Umraw, N., Fish, J.S., Gomez, M. and Cartotto, R.C., 2001. The use of
silver coated dressings on donor site wounds: a prospective, controlled matched pair
study. Burns, 27(6), pp.621-627.
Ismail, T., Sestili, P. and Akhtar, S., 2012. Pomegranate peel and fruit extracts: a review
of potential anti-inflammatory and anti-infective effects. Journal of
Ethnopharmacology, 143(2), 397-405.
Iwata, M., Takebayashi, T., Ohta, H., Alcalde, R.E., Itano, Y. and Matsumura, T., 1999.
Zinc accumulation and metallothionein gene expression in the proliferating epidermis
during wound healing in mouse skin. Histochemistry and cell biology, 112(4), pp.283-
290.
Jacobi U, Kaiser M, Toll R, Mangelsdorf S, Audring H, Otberg N, Sterry W and
Lademann J. Porcine ear skin: An in vitro model for human skin. Skin Research and
Technology. 2007;13(1):19-24. DOI: 10.1111/j.1600-0846.2006.00179.x
276
Jacobs, J., 2010. Antioxidant composition, useful for improving the appearance of the
skin, comprises agent derived from Lycium barbarum, Punica granatum, Vitis vinifera,
Aspalathus linearis and Camellia sinensis, and vehicle e.g. glycerine. Patent Number:
US2010119463-A1; WO2010056675-A2; WO2010056675-A3.
Jo, S.C., Lee, S.H., Lee, Y.J., Shin, H.D., 2009. Composition for promoting hair growth
for use in skin external application agent and for use in treatment of alopecia, comprises
extract of mixture of Artemisia absinthium, Angelicae gigantis radix and Biota orientalis
leaves. Patent Number: KR860349-B1.
Johnston, M.D., Lambert, R.J.W., Hanlon, G.W. and Denyer, S.P., 2002. A rapid
method for assessing the suitability of quenching agents for individual biocides as well
as combinations. Journal of applied microbiology, 92(4), 784-789.
Jurenka, J., 2008. Therapeutic applications of pomegranate (Punica granatum L.): a
review. Alternative Medicine Review 13(2), 128-144.
Kalaycıoğlu, Z. and Erim, F.B., 2017. Total phenolic contents, antioxidant activities, and
bioactive ingredients of juices from pomegranate cultivars worldwide. Food
Chemistry 221, 496-507.
Karimi, M., Sadeghi, R. and Kokini, J., 2017. Pomegranate as a promising opportunity
in medicine and nanotechnology. Trends in Food Science & Technology, 69, pp.59-73.
Karuppasamy, K., Hutton, M.J. and Porteous, M.L., 2004. A novel system for the
irrigation of open fractures. Injury, 35(10), pp.980-981.
Keegan, G., Smart, J., InGram, M., Barnes, L., Rees, G. and Burnett, G., 2007. An in
vitro assessment of bioadhesive zinc/carbomer complexes for antimicrobial therapy
within the oral cavity. International journal of pharmaceutics, 340(1-2), pp.92-96.
277
Khan, MI., and Zaidi, A.H., 2009. Herbal composition used for waist and tummy
firming, has extracts and oils of Cyprus, Ajowain, lemon, black pepper, pomegranate,
rosemary, Geranium, majuphal, doorva grass, gehun ankur, spirulina and soybean in
specific weigh percentage. Patent Number: IN200800662-I1.
Kingsley, A., 2003. The wound infection continuum and its application to clinical
practice. Ostomy/wound management, 49(7A Suppl), pp.1-7.
Kligman, A M, and E Christophers. ―Preparation of Isolated Sheets of Human Stratum
Corneum.‖ Archives of Dermatology 88, no. 6 (1963): 702-705.
Klugman, K. and Koornhof, H., 1989. Worldwide increase in pneumococcal antibiotic
resistance. The Lancet 334(8660), 444.
Köck, R., Becker, K., Cookson, B., van Gemert-Pijnen, J.E., Harbarth, S., Kluytmans,
J.A.J.W., Mielke, M., Peters, G., Skov, R.L., Struelens, M.J. and Tacconelli, E., 2010.
Methicillin-resistant Staphylococcus aureus (MRSA): burden of disease and control
challenges in Europe.
Kun, E. and Abood, L.G., 1949. Colorimetric estimation of succinic dehydrogenase by
triphenyltetrazolium chloride. Science, 109(2824), pp.144-146
Kupcsik, L., 2011. Estimation of cell number based on metabolic activity: the MTT
reduction assay. In Mammalian cell viability (pp. 13-19). Humana Press.
Laato, M., Niinikoski, J., Lundberg, C. and Gerdin, B., 1988. Inflammatory reaction and
blood flow in experimental wounds inoculated with Staphylococcus aureus. European
surgical research, 20(1), pp.33-38.
278
Lademann, J., Richter, H., Meinke, M., Sterry, W. and Patzelt, A., 2010. Which skin
model is the most appropriate for the investigation of topically applied substances into
the hair follicles?. Skin pharmacology and physiology, 23(1), pp.47-52.
Ladwig, G.P., Robson, M.C., Liu, R.A.N., Kuhn, M.A., Muir, D.F. and Schultz, G.S.,
2002. Ratios of activated matrix metalloproteinase‐9 to tissue inhibitor of matrix
metalloproteinase‐1 in wound fluids are inversely correlated with healing of pressure
ulcers. Wound repair and regeneration, 10(1), pp.26-37.
Lam, P.K., Chan, E.S.Y., Ho, W.S. and Liew, C.T., 2004. In vitro cytotoxicity testing of
a nanocrystalline silver dressing (Acticoat) on cultured keratinocytes. British journal of
biomedical science, 61(3), pp.125-127.
Lansdown, A.B., Mirastschijski, U., Stubbs, N., Scanlon, E. and Ågren, M.S., 2007.
Zinc in wound healing: theoretical, experimental, and clinical aspects. Wound repair and
regeneration, 15(1), pp.2-16.
Lansky, E.P. and Newman, R.A., 2007. Punica granatum (pomegranate) and its potential
for prevention and treatment of inflammation and cancer. Journal of
Ethnopharmacology, 109(2), 177-206.
Lawrence JC. Bacteriology and wound healing. In: Fox JA, Fischer J, editors.
Cadhexomer iodine. Stuttgart: Schttauer Verlag; 1983. pp. 19–31.
Lawrence, J.C., 1987. The aetiology of scars. Burns, 13, pp.S3-S14.
Leach, M.J., 2004. Making sense of the venous leg ulcer debate: a literature
review. Journal of wound care, 13(2), pp.52-56.
Leigh, I.M., 1995. Reepithelialisation of Wounds. In Wound Healing and Skin
Physiology (pp. 45-60). Springer, Berlin, Heidelberg.
279
Lemaire, S., Van Bambeke, F., Mingeot-Leclercq, M.P., Glupczynski, Y. and Tulkens,
P.M., 2007. Role of acidic pH in the susceptibility of intraphagocytic methicillin-
resistant Staphylococcus aureus strains to meropenem and cloxacillin. Antimicrobial
agents and chemotherapy, 51(5), pp.1627-1632.
Leong, H.N., Kurup, A., Tan, M.Y., Kwa, A.L.H., Liau, K.H. and Wilcox, M.H., 2018.
Management of complicated skin and soft tissue infections with a special focus on the
role of newer antibiotics. Infection and drug resistance, 11, p.1959.
Li, B.S., Cary, J.H. and Maibach, H.I., 2018. Stratum corneum substantivity: drug
development implications. Archives of dermatological research, 310(7), pp.537-549.
Li, G., Brockman, J.D., Lin, S.W., Schell, L.A. and Robertson, J.D., 2012. Measurement
of the trace elements Cu, Zn, Fe, and Mg and the ultratrace elements Cd, Co, Mn, and Pb
in limited quantity human plasma and serum samples by inductively coupled plasma-
mass spectrometry. American Journal of Analytical Chemistry, 3(09), p.646.
Li, Y., Yang, F., Zheng, W., Hu, M., Wang, J., Ma, S., Deng, Y., Luo, Y., Ye, T. and
Yin, W., 2016. Punica granatum (pomegranate) leaves extract induces apoptosis through
mitochondrial intrinsic pathway and inhibits migration and invasion in non-small cell
lung cancer in vitro. Biomedicine & pharmacotherapy, 80, pp.227-235.
Liang, C.C., Park, A.Y. and Guan, J.L., 2007. In vitro scratch assay: a convenient and
inexpensive method for analysis of cell migration in vitro. Nature protocols, 2(2), p.329.
Lipsky, B.A., Pecoraro, R.E., Larson, S.A., Hanley, M.E. and Ahroni, J.H., 1990.
Outpatient management of uncomplicated lower-extremity infections in diabetic
patients. Archives of Internal Medicine, 150(4), pp.790-797.
Liu, C., Guo, H., DaSilva, N.A., Li, D., Zhang, K., Wan, Y., Gao, X.H., Chen, H.D.,
Seeram, N.P. and Ma, H., 2019. Pomegranate (Punica granatum) phenolics ameliorate
280
hydrogen peroxide-induced oxidative stress and cytotoxicity in human
keratinocytes. Journal of functional foods, 54, pp.559-567.
Long, S.A., Wertz, P.W., Strauss, J.S. and Downing, D.T., 1985. Human stratum
corneum polar lipids and desquamation. Archives of dermatological research, 277(4),
pp.284-287.
Longmire, A.W., Broom, L.A. and Burch, J., 1987. Wound infection following high-
pressure syringe and needle irrigation. The American journal of emergency
medicine, 5(2), pp.179-181.
Lu, J., Ding, K. and Yuan, Q., 2010. One-step purification of punicalagin by preparative
HPLC and stability study on punicalagin. Separation Science and Technology, 46(1),
pp.147-154.
Lubrizol.com. (2020). Carbopol® 974P NF Polymer - Lubrizol. [online] Available at:
https://www.lubrizol.com/en/Life-Sciences/Products/Carbopol-Polymer-
Products/Carbopol-974P-NF-Polymer [Accessed 18 Feb. 2019].
Ma, K.I., Du, M., Liao, M., Chen, S., Yin, G., Liu, Q., Wei, Q. and Qin, G., 2015.
Evaluation of wound healing effect of punica granatum L Peel extract on deep second-
degree burns in rats. Tropical Journal of Pharmaceutical Research, 14(1), pp.73-78.
Machado, T.B., Pinto, A.V., Pinto, M.C.F.R., Leal, I.C.R., Silva, M.G., Amaral, A.C.F.,
Kuster, R.M. and Netto-dosSantos, K.R., 2003. In vitro activity of Brazilian medicinal
plants, naturally occurring naphthoquinones and their analogues, against methicillin-
resistant Staphylococcus aureus. International Journal of Antimicrobial Agents 21(3),
279-284.
Macias, J.H., Arreguin, V., Munoz, J.M., Alvarez, J.A., Mosqueda, J.L. and Macias,
A.E., 2013. Chlorhexidine is a better antiseptic than povidone iodine and sodium
281
hypochlorite because of its substantive effect. American journal of infection
control, 41(7), pp.634-637.
Maillard, J.Y., Messager, S. and Veillon, R., 1998. Antimicrobial efficacy of biocides
tested on skin using an ex-vivo test. Journal of Hospital Infection, 40(4), pp.313-323.
Main, R.C., 2008. Should chlorhexidine gluconate be used in wound cleansing?. Journal
of wound care, 17(3), pp.112-114.
Mandell GL, Bennett JE, Dolin R, editors. Principles and Practice of Infectious
Diseases. 2005. 6th ed. Philadelphia: Elsevier;. pp. 21-2.
Margolis, D.J., Bartus, C., Hoffstad, O., Malay, S. and Berlin, J.A., 2005. Effectiveness
of recombinant human platelet‐derived growth factor for the treatment of diabetic
neuropathic foot ulcers. Wound repair and regeneration, 13(6), pp.531-536.
Mastropietro, D.J., Nimroozi, R. and Omidian, H., 2013. Rheology in pharmaceutical
formulations-a perspective. J Dev Drugs, 2, pp.108-116.
Maver, T., Maver, U., Stana Kleinschek, K., Smrke, D.M. and Kreft, S., 2015. A review
of herbal medicines in wound healing. International journal of dermatology, 54(7),
pp.740-751.
McCarrell, E.M., Gould, S.W., Fielder, M.D., Kelly, A.F., El Sankary, W. and
Naughton, D.P., 2008. Antimicrobial activities of pomegranate rind extracts:
enhancement by addition of metal salts and vitamin C. BMC Complementary and
Alternative Medicine, 8(1), p.64.
Meléndez, P.A. and Capriles, V.A., 2006. Antibacterial properties of tropical plants from
Puerto Rico. Phytomedicine, 13(4), 272-276.
282
Menezes, S.M., Cordeiro, L.N. and Viana, G.S., 2006. Punica granatum (pomegranate)
extract is active against dental plaque. Journal of Herbal Pharmacotherapy, 6(2), 79-92.
Mertz, P.M., Alvarez, O.M., Smerbeck, R.V. and Eaglstein, W.H., 1984. A new in vivo
model for the evaluation of topical antiseptics on superficial wounds: The effect of 70%
alcohol and povidone-iodine solution. Archives of dermatology, 120(1), pp.58-62.
Messager, S., Hann, A.C., Goddard, P.A., Dettmar, P.W. and Maillard, J.Y., 2004. Use
of the ‘ex vivo’test to study long-term bacterial survival on human skin and their
sensitivity to antisepsis. Journal of applied microbiology, 97(6), pp.1149-1160.
Metzger, Z., Nitzan, D., Pitaru, S., Brosh, T. and Teicher, S., 2002. The effect of
bacterial endotoxin on the early tensile strength of healing surgical wounds. Journal of
endodontics, 28(1), pp.30-33.
Miguel, M.G., Neves, M.A. and Antunes, M.D., 2010. Pomegranate (Punica granatum
L.): A medicinal plant with myriad biological properties-A short review. Journal of
Medicinal Plants Research 4(25), 2836-2847.
Miles, A.A., Misra, S.S. and Irwin, J.O., 1938. The estimation of the bactericidal power
of the blood. Epidemiology & Infection 38(6), 732-749.
Mo, J., Panichayupakaranant, P., Kaewnopparat, N., Nitiruangjaras, A. and
Reanmongkol, W., 2014. Wound healing activities of standardized pomegranate rind
extract and its major antioxidant ellagic acid in rat dermal wounds. Journal of natural
medicines, 68(2), pp.377-386.
Moorthy, K., Punitha, T., Vinodhini, R., Sureshkumar, B.T., Vijayalakshmi, P. and
Thajuddin, N., 2013. Antimicrobial activity and qualitative phytochemical analysis of
Punica granatum Linn.(PERICARP). Journal of Medicinal Plants Research 7(9), 474-
479.
283
Moses, R., Reddell, P., Steadman, R. and Moseley, R., 2014. Preferential stimulation of
keratinocyte proliferation and migratory responses by novel tigliane pharmaceuticals
contribute to enhanced wound reepithelialization. Wound Repair and
Regeneration, 22(5).
Mousavinejad, G., Emam-Djomeh, Z., Rezaei, K. and Khodaparast, M.H.H., 2009.
Identification and quantification of phenolic compounds and their effects on antioxidant
activity in pomegranate juices of eight Iranian cultivars. Food chemistry, 115(4),
pp.1274-1278.
Murphy, P.S. and Evans, G.R., 2012. Advances in wound healing: a review of current
wound healing products. Plastic surgery international, 2012.
Nasiri, E., Hosseinimehr, S.J., Akbari, J., Azadbakht, M. and Azizi, S., 2017. The effects
of Punica granatum flower extract on skin injuries induced by burn in rats. Advances in
pharmacological sciences, 2017.
Navarro, V., Villarreal, M.L., Rojas, G. and Lozoya, X., 1996. Antimicrobial evaluation
of some plants used in Mexican traditional medicine for the treatment of infectious
diseases. Journal of Ethnopharmacology 53(3), 143-147.
Negi, P.S. and Jayaprakasha, G.K., 2003. Antioxidant and antibacterial activities of
Punica granatum peel extracts. Journal of Food Science, 68(4), 1473-1477.
Nguyen, M.H., Peacock, J.E., Morris, A.J., Tanner, D.C., Nguyen, M.L., Snydman,
D.R., Wagener, M.M., Rinaldi, M.G. and Victor, L.Y., 1996. The changing face of
candidemia: emergence of non-Candida albicans species and antifungal resistance. The
American Journal of Medicine 100(6), 617-623.
Nicoletti, G., Boghossian, V., Gurevitch, F., Borland, R. and Morgenroth, P., 1993. The
antimicrobial activity in vitro of chlorhexidine, a mixture of isothiazolinones
284
(‘Kathon’CG) and cetyl trimethyl ammonium bromide (CTAB). Journal of hospital
infection, 23(2), pp.87-111.
Nishioka, H., Nagahama, A., Inoue, Y. and Hagi, A., 2018. Evaluation of fast-acting
bactericidal activity and substantivity of an antiseptic agent, olanexidine gluconate,
using an ex vivo skin model. Journal of medical microbiology, 67(12), pp.1796-1803.
Nonaka, G., Nishioka, I., Nishizawa, M., Yamagishi, T., Kashiwada, Y., Dutschman,
G.E., Bodner, A.J., Kilkuskie, R.E., Cheng, Y.C., Lee, K.H., 1990. Anti-AIDS agents, 2:
inhibitory effects of tannins on HIV reverse transcriptase and HIV replication in H9
lymphocyte cells. Journal of Natural Products 53(3), 587–595.
Olga V. Dueva-Koganov, Michael Russell, Steven Micceri and Artyom Duev,
Evaluating Sunscreen Spray Polymers. Happi 03.05.12
Opara, L.U., Al-Ani, M.R. and Al-Shuaibi, Y.S., 2009. Physico-chemical properties,
vitamin C content, and antimicrobial properties of pomegranate fruit (Punica granatum
L.). Food and Bioprocess Technology 2(3), 315-321.
ORGILL, D. and DEMLING, R.H., 1988. Current concepts and approaches to wound
healing. Critical Care Medicine, 16(9), pp.899-908.
P Boukamp, R T Petrussevska, D Breitkreutz, J Hornung, A Markham, N E Fusenig.
Normal keratinization in a spontaneously immortalized aneuploid human keratinocyte
cell line. Journal of Cell Biology 1988 106 (3): 761
Pagliarulo, C., De Vito, V., Picariello, G., Colicchio, R., Pastore, G., Salvatore, P. and
Volpe, M.G., 2016. Inhibitory effect of pomegranate (Punica granatum L.) polyphenol
extracts on the bacterial growth and survival of clinical isolates of pathogenic
Staphylococcus aureus and Escherichia coli. Food Chemistry, 190, 824-831.
285
Panichayupakaranant, P., Itsuriya, A. and Sirikatitham, A., 2010. Preparation method
and stability of ellagic acid-rich pomegranate fruit peel extract. Pharmaceutical biology,
48(2), pp.201-205.
Panichayupakaranant, P., Tewtrakul, S. and Yuenyongsawad, S., 2010. Antibacterial,
anti-inflammatory and anti-allergic activities of standardised pomegranate rind
extract. Food Chemistry, 123(2), pp.400-403.
Papuc, C., Goran, G.V., Predescu, C.N., Nicorescu, V. and Stefan, G., 2017. Plant
polyphenols as antioxidant and antibacterial agents for shelf‐life extension of meat and
meat products: classification, structures, sources, and action
mechanisms. Comprehensive Reviews in Food Science and Food Safety, 16(6), pp.1243-
1268.
Parkinson, I J, and Pearce J. A. Peridotites from the Izu–Bonin–Mariana Forearc (ODP
Leg 125): Evidence for Mantle Melting and Melt–Mantle Interaction in a Supra-
Subduction Zone Setting. Journal of Petrology 39 (1998): 1577-1618.
Passamonti, S., Vrhovsek, U., Vanzo, A. and Mattivi, F., 2003. The stomach as a site for
anthocyanins absorption from food 1. FEBS letters, 544(1-3), 210-213.
Pastar, I., Stojadinovic, O., Yin, N.C., Ramirez, H., Nusbaum, A.G., Sawaya, A., Patel,
S.B., Khalid, L., Isseroff, R.R. and Tomic-Canic, M., 2014. Epithelialization in wound
healing: a comprehensive review. Advances in wound care, 3(7), pp.445-464.
Pitz, H.D.S., Pereira, A., Blasius, M.B., Voytena, A.P.L., Affonso, R.C., Fanan, S.,
Trevisan, A.C., Ribeiro-do-Valle, R.M. and Maraschin, M., 2016. In vitro evaluation of
the antioxidant activity and wound healing properties of Jaboticaba (Plinia peruviana)
fruit peel Hydroalcoholic extract. Oxidative medicine and cellular longevity, 2016.
286
Power, C., Wang, J.H., Sookhai, S., Street, J.T. and Redmond, H.P., 2001. Bacterial wall
products induce downregulation of vascular endothelial growth factor receptors on
endothelial cells via a CD14-dependent mechanism: implications for surgical wound
healing. Journal of Surgical Research, 101(2), pp.138-145.
Poyrazoglu, E., Gökmen, V. and Artιk, N., 2002. Organic acids and phenolic compounds
in pomegranates (Punica granatum L.) grown in Turkey. Journal of Food Composition
and Analysis 15(5), 567-575.
Prabhu, S. and Poulose, E.K., 2012. Silver nanoparticles: mechanism of antimicrobial
action, synthesis, medical applications, and toxicity effects. International nano
letters, 2(1), p.32.
Prashanth, D., Asha, M.K. and Amit, A., 2001. Antibacterial activity of Punica
granatum. Fitoterapia 72(2), 171-173.
Proniuk, S. and Blanchard, J., 2002. Anhydrous Carbopol® polymer gels for the topical
delivery of oxygen/water sensitive compounds. Pharmaceutical development and
technology, 7(2), pp.249-255.
Pugh, W.J., 2002. Kinetics of product stability. Textbook of Pharmaceutics, the Science
of Dosage Form Design. 2nd ed. London: Churchill Livingstone, pp.101-112.
Qu, W., Breksa III, A.P., Pan, Z., Ma, H. and Mchugh, T.H., 2012. Storage stability of
sterilized liquid extracts from pomegranate peel. Journal of food science, 77(7),
pp.C765-C772.
R Varges, P., M Costa, C., S Fonseca, B., F Naccache, M. and de Souza Mendes, P.R.,
2019. Rheological characterization of carbopol® dispersions in water and in
water/glycerol solutions. Fluids, 4(1), p.3.
287
Raber, A.S., Mittal, A., Schäfer, J., Bakowsky, U., Reichrath, J., Vogt, T., Schaefer,
U.F., Hansen, S. and Lehr, C.M., 2014. Quantification of nanoparticle uptake into hair
follicles in pig ear and human forearm. Journal of Controlled Release, 179, pp.25-32.
Reffuveille, F., Josse, J., Vallé, Q., Gangloff, C.M. and Gangloff, S.C., 2017.
Staphylococcus aureus Biofilms and their Impact on the Medical Field. The Rise of
Virulence and Antibiotic Resistance in Staphylococcus aureus, (11), p.p.187-203
Robson, M.C., Stenberg, B.D. and Heggers, J.P., 1990. Wound healing alterations
caused by infection. Clinics in plastic surgery, 17(3), pp.485-492.
Rodeheaver GT, Pettry D, Thacker JG, Edgerton MT, Edlich RF. Wound cleansing by
high pressure irrigation. Surg Gynecol Obstet. 1975;141(3):357–362.
Ross, D.D., Joneckis, C.C., Ordóñez, J.V., Sisk, A.M., Wu, R.K., Hamburger, A.W. and
Nora, R.E., 1989. Estimation of cell survival by flow cytometric quantification of
fluorescein diacetate/propidium iodide viable cell number. Cancer Research, 49(14),
pp.3776-3782.
Ruela, A.L.M., Perissinato, A.G., Lino, M.E.D.S., Mudrik, P.S. and Pereira, G.R., 2016.
Evaluation of skin absorption of drugs from topical and transdermal
formulations. Brazilian Journal of Pharmaceutical Sciences, 52(3), pp.527-544
Salami, A.A., Imosemi, I.O., Owoeye, O.O., Salami, A.A., Imosemi, I.O. and Owoeye,
O.O., 2006. A comparison of the effect of chlorhexidine, tap water and normal saline on
healing wounds. Int J Morphol, 24(4), pp.673-6.
Salcido R. What is bioburden?. 2007. The link to chronic wounds. Adv Skin Wound
Care; 20.pp.368.
288
Sami, D.G., Heiba, H.H. and Abdellatif, A., 2019. Wound healing models: a systematic
review of animal and non-animal models. Wound Medicine, 24(1), pp.8-17.
Santos, E.B., Dantas, G.S., Santos, H.B., Diniz, M.F. and Sampaio, F.C., 2009.
Ethnobotanical studies of medicinal plants for oral conditions in the municipality of João
Pessoa, Brazil. Revista Brasileira de Farmacognosia 19(1B), 321-324.
Sartorelli, P., Andersen, H.R., Angerer, J., Corish, J., Drexler, H., Göen, T., Griffin, P.,
Hotchkiss, S.A.M., Larese, F., Montomoli, L. and Perkins, J., 2000. Percutaneous
penetration studies for risk assessment. Environmental toxicology and
pharmacology, 8(2), pp.133-152.
Scher, K.S. and Peoples, J.B., 1991. Combined use of topical and systemic
antibiotics. The American journal of surgery, 161(4), pp.422-425.
Schmidt, C., Fronza, M., Goettert, M., Geller, F., Luik, S., Flores, E.M.M., Bittencourt,
C.F., Zanetti, G.D., Heinzmann, B.M., Laufer, S. and Merfort, I., 2009. Biological
studies on Brazilian plants used in wound healing. Journal of
Ethnopharmacology, 122(3), pp.523-532.
Seeram, N P. Pomegranates Ancient Roots to Modern Medicine. In, Pomegranates
Ancient Roots to Modern Medicine, by N P Seeram, R N Schulman and D Heber, 4-9.
Taylor and Francis Group, (2006).
Seeram, N.P., Adams, L.S., Henning, S.M., Niu, Y., Zhang, Y., Nair, M.G. and Heber,
D., 2005. In vitro antiproliferative, apoptotic and antioxidant activities of punicalagin,
ellagic acid and a total pomegranate tannin extract are enhanced in combination with
other polyphenols as found in pomegranate juice. The Journal of Nutritional
Biochemistry 16(6), 360-367.
289
Semlin, L., Schäfer-Korting, M., Borelli, C. and Korting, H.C., 2011. In vitro models for
human skin disease. Drug discovery today, 16(3-4), pp.132-139.
Sengupta, P., Chatterjee, B. and Tekade, R.K., 2018. Current regulatory requirements
and practical approaches for stability analysis of pharmaceutical products: A
comprehensive review. International journal of pharmaceutics, 543(1-2), pp.328-344.
Serra, R., Grande, R., Butrico, L., Rossi, A., Settimio, U.F., Caroleo, B., Amato, B.,
Gallelli, L. and de Franciscis, S., 2015. Chronic wound infections: the role of
Pseudomonas aeruginosa and Staphylococcus aureus. Expert review of anti-infective
therapy, 13(5), pp.605-613.
Siddiqui, A.R. and Bernstein, J.M., 2010. Chronic wound infection: facts and
controversies. Clinics in dermatology, 28(5), pp.519-526.
Siefert, S.A. and Sarkar, R., 2012. Matrix metalloproteinases in vascular physiology and
disease. Vascular, 20(4), pp.210-216.
Singh, P., Desai, S.J., Simonelli, A.P. and Higuchi, W.I., 1968. Role of wetting on the
rate of drug release from inert matrices. Journal of pharmaceutical sciences, 57(2),
pp.217-226.
Sirelkhatim, A., Mahmud, S., Seeni, A., Kaus, N.H.M., Ann, L.C., Bakhori, S.K.M.,
Hasan, H. and Mohamad, D., 2015. Review on zinc oxide nanoparticles: antibacterial
activity and toxicity mechanism. Nano-Micro Letters, 7(3), pp.219-242.
Söderberg, T., Hallmans, G., Ågren, M., Tengrup, I. and Banck, G., 1989. The effects of
an occlusive zinc medicated dressing on the bacterial flora in excised wounds in the
rat. Infection, 17(2), pp.81-85.
290
Stepanović, S., Vuković, D., Dakić, I., Savić, B. and Švabić-Vlahović, M., 2000. A
modified microtiter-plate test for quantification of staphylococcal biofilm
formation. Journal of microbiological methods, 40(2), pp.175-179.
Stern, J.L., Hagerman, A.E., Steinberg, P.D. and Mason, P.K., 1996. Phlorotannin-
protein interactions. Journal of Chemical Ecology 22(10), 1877-1899.
Stewart, G.S., Jassim, S.A., Denyer, S.P., Newby, P., Linley, K. and Dhir, V.K., 1998.
The specific and sensitive detection of bacterial pathogens within 4 h using
bacteriophage amplification. Journal of applied microbiology, 84(5), pp.777-783.
Stewart, G.S.A.B., Denyer, S.P. and Jassim S.A.A., 1995. ANTIVIRAL OR
ANTIFUNGAL COMPOSITION AND METHOD. (WO1995022254)
Stiger-Pouvreau, V., Bourgougnon, N. and Deslandes, E., 2016. Carbohydrates from
seaweeds. In Seaweed in health and disease prevention (pp. 223-274). Academic Press.
Stoddart, M.J., 2011. Cell viability assays: introduction. In Mammalian cell viability (pp.
1-6). Humana Press.
Strömberg, H.E. and Ågren, M.S., 1984. Topical zinc oxide treatment improves arterial
and venous leg ulcers. British Journal of Dermatology, 111(4), pp.461-468.
Su, X., Sangster, M.Y. and D'Souza, D.H., 2010. In vitro effects of pomegranate juice
and pomegranate polyphenols on foodborne viral surrogates. Foodborne Pathogens and
Disease 7(12), 1473-1479.
Sukri, S.N.A.M., Shameli, K., Wong, M.M.T., Teow, S.Y., Chew, J. and Ismail, N.A.,
2019. Cytotoxicity and antibacterial activities of plant-mediated synthesized zinc oxide
(ZnO) nanoparticles using Punica granatum (pomegranate) fruit peels extract. Journal of
Molecular Structure, 1189, pp.57-65.
291
Tanner, R.I. and Walters, K., 1998. Rheology: an historical perspective (Vol. 7).
Elsevier.pp. 1-23.
Tanveer, A., Farooq, U., Akram, K., Hayat, Z., Shafi, A., Nazar, H. and Ahmad, Z.,
2015. Pomegranate extracts: A natural preventive measure against spoilage and
pathogenic microorganisms. Food Reviews International 31(1), 29-51.
Tarnuzzer, R.W. and Schultz, G.S., 1996. Biochemical analysis of acute and chronic
wound environments. Wound Repair and Regeneration, 4(3), pp.321-325..
Tayel, A.A. and El‐Tras, W.F., 2010. Anticandidal activity of pomegranate peel extract
aerosol as an applicable sanitizing method. Mycoses 53(2), 117-122.
Thiruvoth, F.M., Mohapatra, D.P., Sivakumar, D.K., Chittoria, R. and Nandhagopal, V.,
2015. Current concepts in the physiology of adult wound healing. Plastic and Aesthetic
Research, 2(5), pp.250-256.
Thomas DW, Harding KG. Wound healing. Br J Surg 2002; 89:1203–1205.
Turrini, E., Ferruzzi, L. and Fimognari, C., 2015. Potential effects of pomegranate
polyphenols in cancer prevention and therapy. Oxidative Medicine and Cellular
Longevity Article ID 938475.
Ud‐Din, S. and Bayat, A., 2017. Non‐animal models of wound healing in cutaneous
repair: In silico, in vitro, ex vivo, and in vivo models of wounds and scars in human
skin. Wound Repair and Regeneration, 25(2), pp.164-176.
Viladomiu, M., Hontecillas, R., Lu, P. and Bassaganya-Riera, J., 2013. Preventative and
prophylactic mechanisms of action of pomegranate bioactive constituents. Evidence
Based Complementary and Alternative Medicine Article ID 789764.
292
Vilinsky, P., 2010. Hydrating mist formulation, useful in personal care for e.g.
improving and retaining the moisture level in the skin, comprises e.g. pure rain-water,
Hamamelis virginiana, menthyl lactate and natural preservatives and aroma imparting
oils. Patent Number(s): WO2010022393-A1
Vincent Ki, M.D. and Coleman Rotstein, M.D., 2008. Bacterial skin and soft tissue
infections in adults: a review of their epidemiology, pathogenesis, diagnosis, treatment
and site of care. Can J Infect Dis Med Microbiol, 19(2), pp.173-184.
Vinken, A., Li, Z., Balan, D., Rittenhouse, B., Willke, R. and Nathwani, D., 2001.
Economic evaluation of linezolid, flucloxacillin and vancomycin in the empirical
treatment of cellulitis in UK hospitals: a decision analytical model. Journal of Hospital
Infection, 49, pp.S13-S24.
Vinken, A., Li, Z., Balan, D., Rittenhouse, B., Willke, R. and Nathwani, D., 2001.
Economic evaluation of linezolid, flucloxacillin and vancomycin in the empirical
treatment of cellulitis in UK hospitals: a decision analytical model. Journal of Hospital
Infection, 49, pp.S13-S24.120(1), pp.58-62.
Vlachojannis, C., Erne, P., Schoenenberger, A.W. and Chrubasik‐Hausmann, S., 2015.
A critical evaluation of the clinical evidence for pomegranate preparations in the
prevention and treatment of cardiovascular diseases. Phytotherapy research, 29(4),
pp.501-508.
Voravuthikunchai, S.P. and Limsuwan, S., 2006. Medicinal plant extracts as anti–
Escherichia coli O157: H7 agents and their effects on bacterial cell aggregation. Journal
of Food Protection 69(10), 2336-2341.
Voravuthikunchai, S.P. and Mitchell, H., 2008. Inhibitory and killing activities of
medicinal plants against multiple antibiotic-resistant Helicobacter pylori. Journal of
Health Science 54(1), 81-88.
293
Waldrop, R., McLaren, A., Calara, F. and McLemore, R., 2014. Biofilm growth has a
threshold response to glucose in vitro. Clinical Orthopaedics and Related
Research®, 472(11), pp.3305-3310.
Wall, I.B., Davies, C.E., Hill, K.E., Wilson, M.J., Stephens, P., Harding, K.G. and
Thomas, D.W., 2002. Potential role of anaerobic cocci in impaired human wound
healing. Wound repair and regeneration, 10(6), pp.346-353.
Wang, L. and Martins-Green, M., 2014. Pomegranate and its components as alternative
treatment for prostate cancer. International Journal of Molecular Sciences, 15(9),
14949-14966.
Warren, J.R. and Marshall, B., 1983. Unidentified curved bacilli on gastric epithelium in
active chronic gastritis. The Lancet 321(8336), 1273-1275.
Watanabe, T., Tada, M., Nagai, H., Sasaki, S. and Nakao, M., 1998. Helicobacter pylori
infection induces gastric cancer in Mongolian gerbils. Gastroenterology 115(3), 642-
648.
Waterman, K.C. and Adami, R.C., 2005. Accelerated aging: prediction of chemical
stability of pharmaceuticals. International Journal of Pharmaceutics, 293(1-2), pp.101-
125.
White, R.L., Burgess, D.S., Manduru, M. and Bosso, J.A., 1996. Comparison of three
different in vitro methods of detecting synergy: time-kill, checkerboard, and E
test. Antimicrobial agents and chemotherapy, 40(8), pp.1914-1918.
Wilhelm, K.P., Wilhelm, D. and Bielfeldt, S., 2017. Models of wound healing: an
emphasis on clinical studies. Skin Research and Technology, 23(1), pp.3-12.
Williams, R.J.P., 1987. The biochemistry of zinc. Polyhedron, 6(1), pp.61-69.
294
Williamson, D.A., Carter, G.P. and Howden, B.P., 2017. Current and emerging topical
antibacterials and antiseptics: agents, action, and resistance patterns. Clinical
microbiology reviews, 30(3), pp.827-860.
Williamson, E.M., 2001. Synergy and other interactions in
phytomedicines.Phytomedicine, 8(5), pp.401-409.
Wolcott, R.D., Rumbaugh, K.P., James, G., Schultz, G., Phillips, P., Yang, Q., Watters,
C., Stewart, P.S. and Dowd, S.E., 2010. Biofilm maturity studies indicate sharp
debridement opens a time-dependent therapeutic window. Journal of wound care, 19(8),
pp.320-328
Wu, X., Cao, G. and Prior, R.L., 2002. Absorption and metabolism of anthocyanins in
elderly women after consumption of elderberry or blueberry. The Journal of
Nutrition 132(7), 1865-1871.
Wysocki, A.B., 2002. Evaluating and managing open skin wounds: colonisation versus
infection. AACN Advanced Critical Care, 13(3), pp.382-397.
Yehia, H.M., Elkhadragy, M.F. and Moneim, A.E.A., 2011. Antimicrobial activity of
pomegranate rind peel extracts. African Journal of Microbiology Research 5(22), 3664-
3668.
Zahin, M., Aqil, F., Ahmad, I., 2010.Broad spectrum antimutagenic activity of
antioxidant active fraction of Punica granatum L. peel extracts. Mutation Research 703,
99–107.
Zhang, Z. and Michniak-Kohn, B.B., 2012. Tissue engineered human skin
equivalents. Pharmaceutics, 4(1), pp.26-41.
295
Zografou, E. Ch., Kallimanis, A., Akrida-Demertzi, K., and Demertzis, P. G. (2013).
Total phenolics, antioxidant and antibacterial activity of commercial pomegranate based
juices from Greece. In, C.-T. Ho, C. Mussinan, F. Shahidi, & E. T. Contis (Eds.),
Nutrition, functional and sensory properties of foods. London, UK: Royal Society of
Chemistry.