potential carbon dioxide reduction from optimal task
TRANSCRIPT
European Journal of Molecular & Clinical Medicine
ISSN 2515-8260 Volume 07, Issue 11, 2020
5363
Potential Carbon Dioxide Reduction From Optimal
Task Performance Zone In An Office Space
Mohamed Ahmed Said Mohamed1a,b, Yakubu Aminu Dodo2c,d*, Emad Noaime3a and Nahla
Mohamed Shannan4e,f
aArchitectural Engineering Department, College of Engineering, the University of Hail, Saudi-
Arabia bArchitecture Department, College of Architecture and Planning, Sudan University of Science and
Technology Khartoum, Sudan cDepartment of Architecture, Faculty of Architecture and Engineering, Istanbul Gelisim University,
34310 Istanbul Turkey dDepartment of Research and Development, Wood Expo Nigeria, 900231 Asokoro, Abuja, Nigeria
eControl department, College of Engineering, Alneelain University, Khartoum-Sudan fElectrical Engineering Department, University College of Engineering, University of Hafr Al Batin,
Saudi-Arabia
[email protected] [email protected] [email protected] [email protected]
Abstract:
A post-occupancy evaluation (POE) was carried out on the identified optimum task performance
zone (OTPZ) in an office space (Dodo 2015). The OTPZ is a zone that daylighting can be used
most times except when the sky conditions are not favourable to provide up to 300lux. The amount
of carbon dioxide (CO2) saving when no artificial light is used this zone was calculated and
tabulated. This can directly reduce building cooling energy usage The findings denotes that the
OTPZ of 3m x 1m required lumens is 969 lm and 2 bulbs would be required to produce the desired
power which will give a required illumination of about 323 lux. The study identified that OPTZ
would reduce the amount of energy required to lit of the space and since the zone requires little or
no artificial lighting, the amount of CO2 emission will reduce. The result shows that about
304.82Kg of CO2 will be saved from polluting the atmosphere if an Incandescent (60 Watts)
lighting technology (800 Lumens) on a daily kilowatt bases is used. An equivalent of 69.86kg of
CO2 would be saved from polluting the atmosphere if 14what compact fluorescent lamp (CFL)
lighting technology were to be employed. If the OPTZ is adapted and used in an office then, there
the probability that a 90% to 95% saving of CO2 emission to the environment is possible. Future
research is recommended towards comparing the results with different office buildings, regions
and a longer duration period and probably using different energy savings lighting bulbs. Likewise,
calculating the actual amount that can be achieved from the OTPZ zone.
Keywords: CO2, Office, NOTPZ, OTPZ, POE, Space,
1. INTRODUCTION
About 20% of energy consumption can be reduced by the use of daylighting in Asian regions (Yunus,
Ahma and Zain-Ahmed, 2013). The lighting energy consumption is about 25–35% of the total energy
provided to buildings in Malaysia (METPM 1989). Studies indicated that typical Malaysian office
buildings have Building Energy Index (BEI) of (200-300) kWh/m2/yr. BEI between 65-135
kWh/m2/yr was attainable as demonstrated by Green Energy Office (GEO) building in Bangi and
Low Energy Office (LEO) building in Putrajaya (Mohd-Zin, 2005 & Mohd-Zin, 2010). The most
important aspect of light for task performance is the horizontal illuminance on the horizontal desk,
assuming a normal work task. The lux level required for an office building in Malaysia is 300lux -
European Journal of Molecular & Clinical Medicine
ISSN 2515-8260 Volume 07, Issue 11, 2020
5364
500lux as stated in MS 1525: 2019 (Department of Standards Malaysia 2019) code of Practice on
Energy Efficiency and Use of Renewable Energy for Non-residential Buildings (Heerwagen, and
Orians 1986). Daylight and accessibility to view can increase employees’ happiness and productivity
and this would in turn help in increasing energy efficiency by reducing the waste (Newsham, et al
2009; Dubois, Demers, and Potvin, 2007 & Tuaycharoen & Tregenza 2007). Despite the availability
of luminance in the Asian region most space users and office space design don’t utilize the renewable
source of energy. Hence, the study aims to identify possible strategies of office window design to an
occupant's task area that could enhance the comfort of performing a task (paper-based task and
verbal intellectual task) in a private office space. Besides, determine the potential carbon dioxide
(CO2) reduction from the OTPZ.
2. BACKGROUND
2.1 Task Performance
Task performance refers to cognitive performance in this research. Human performance alone is not
an adequate reflection of people's response to a daylight stimulus; in that people do not always obtain
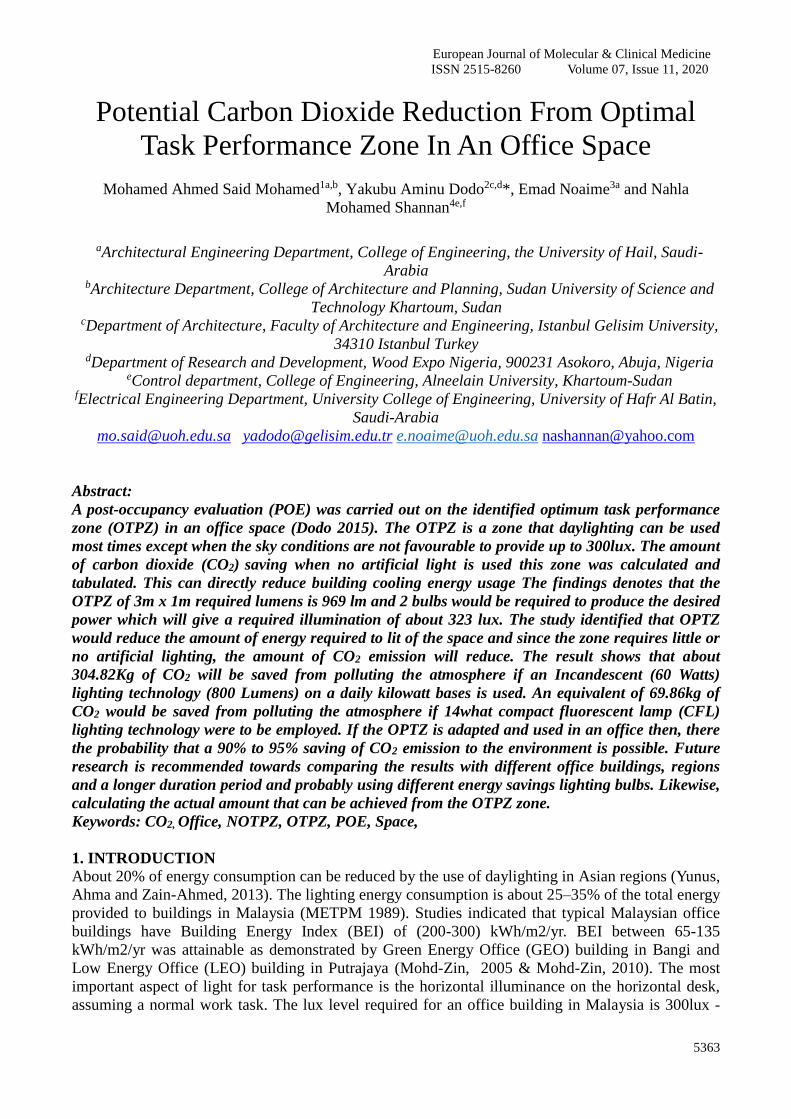
a correct understanding of the nature of performing a task. Newsham et al. (2009) in their proposed
linked mechanism map show how some factors affect task performance positively and negatively.
These are derived from three basic variables (personal control; luminous condition and non-task
surface brightness). Visual capabilities and motivation have effects on task performance. Veitch et
al. (2007) in an experiment shows that desirable lighting conditions that enhanced visibility will
likewise enhance task performance that includes computational and paper-based tasks shown in
Figure 1. The enhancement of performing a task to achieve sustainability may not be increased by
the presence of a window only, but some task can benefit from the availability of a window (Dodo et
al, 2013).
Figure 1: Task Performance Linked Mechanisms Map Source: (Veitch et al., 2007)
2.2 Types of Task Performed in Offices
Veitch and Newsham (1998) categorized task performance in office space based on the level of
lighting and activities performed. These categories are; visual performance (computational based
task and paper-based task), verbal-intellectual task and post visual performance (reading, eating,
sewing and walking). Furthermore, the sustained illuminance levels for general building areas as
European Journal of Molecular & Clinical Medicine
ISSN 2515-8260 Volume 07, Issue 11, 2020
5365
given in MS1525: 2019 (Malaysian Standard 2019) as 300lux to 400lux for general offices, stores
and shops, reading and writing; for inquiry desk which involves verbal task is 300lux while for
infrequent reading and writing is 200lux.
Computational Based Task
These are tasks carried out using various computers be it laptops, desktops and other digitalized
computers that require little of lighting since the task itself is self-illuminating as compared to the
other two types of task. The computer-based task required high attention.
Paper-Based Task
These are general paperwork carried out in the office premises and ranges from office filling,
writing, and all general clerical work excluding verbal and computational work. These tasks require
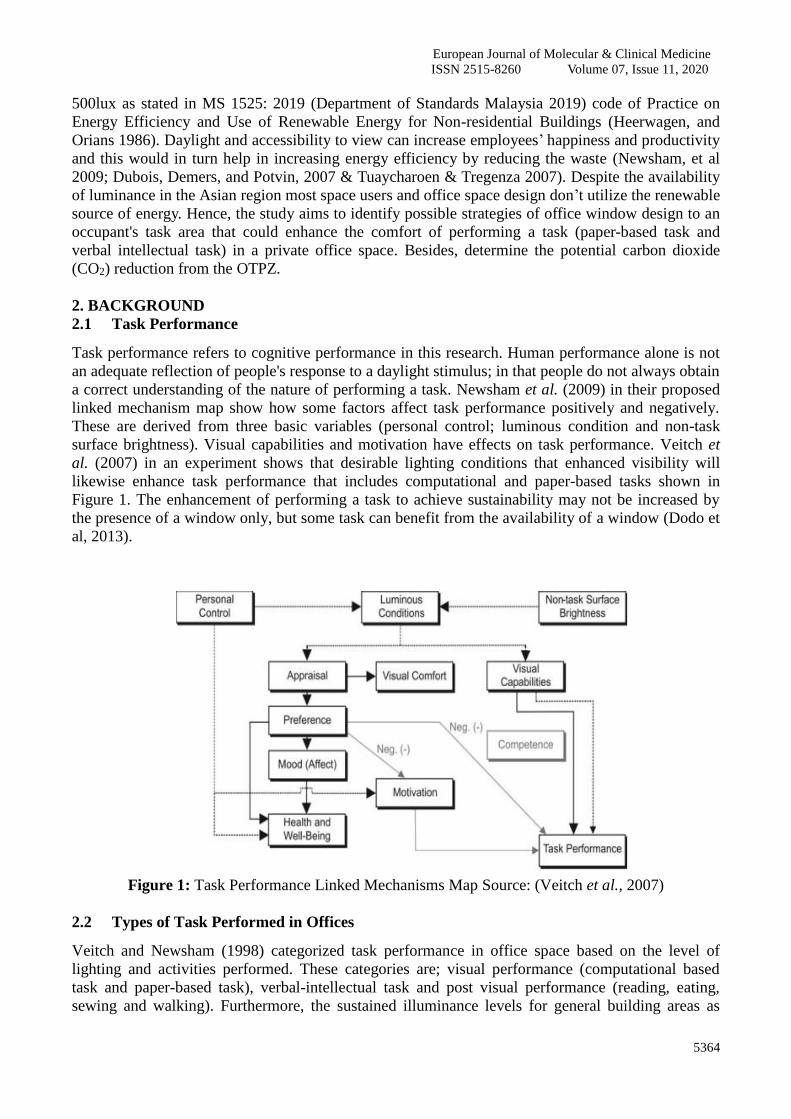
quite an amount of lighting. The difference between computer work and paper-based work is the
view of sight; in the paper-based task there is high need of light source be it natural or artificial;
while the computer-based task requires little or no lighting source: therefore in the computer work
the entire surrounding becomes part of the field of view (Bülow-Hübe, 2008) shown in Figure 2.
Figure2.Difference between Paper-Based and Computer Work (Bülow-Hübe, 2008)
Verbal Intellectual Task
The verbal based task is the task that includes using verbal communication and is carried out in some
specific area of work like in mass media; et cetera. This task requires quite an amount of lighting
since the task is visually inclined, therefore, the ability to see is a necessity here (reading,
comprehension and creative writing).
Post Visual Performance
These are tasks carried out when occupants are at break or decided to unwind after a hectic work,
which is (reading, eating, sewing, and walking). These tasks have less or no effect on occupants in
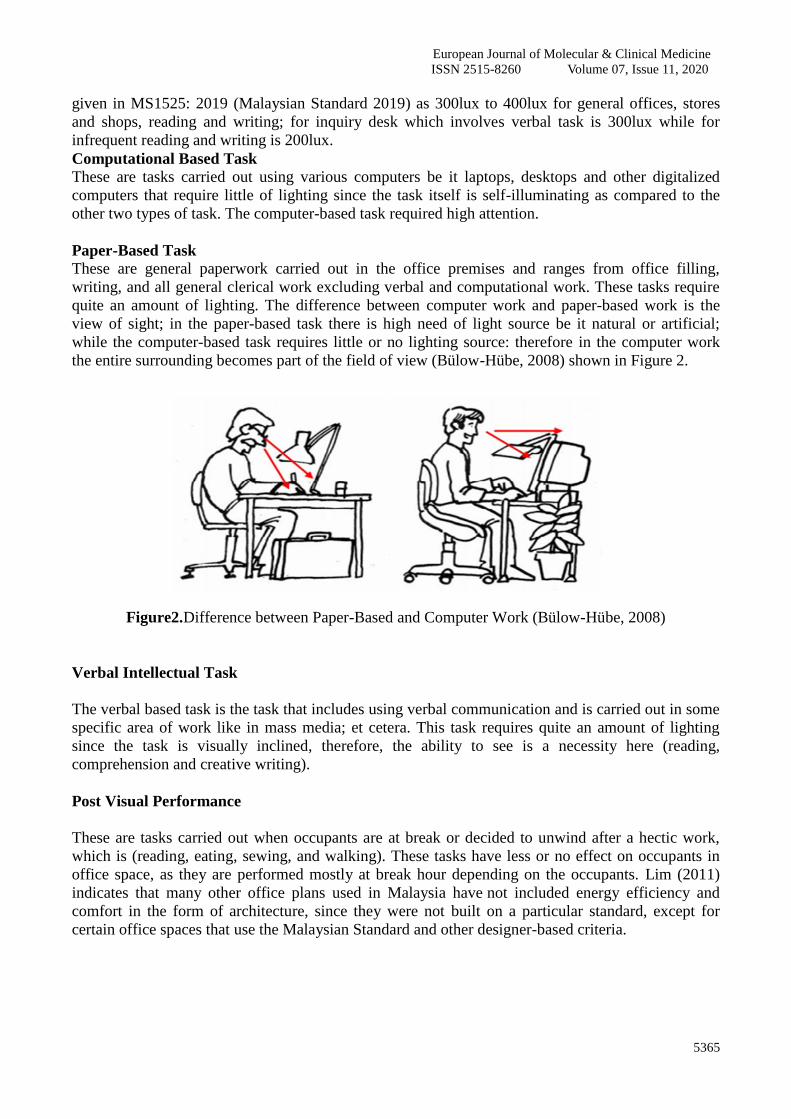
office space, as they are performed mostly at break hour depending on the occupants. Lim (2011)
indicates that many other office plans used in Malaysia have not included energy efficiency and
comfort in the form of architecture, since they were not built on a particular standard, except for
certain office spaces that use the Malaysian Standard and other designer-based criteria.
European Journal of Molecular & Clinical Medicine
ISSN 2515-8260 Volume 07, Issue 11, 2020
5366
Figure 3: Various Office Plans Shapes Categories Source: (Lim, 2011)
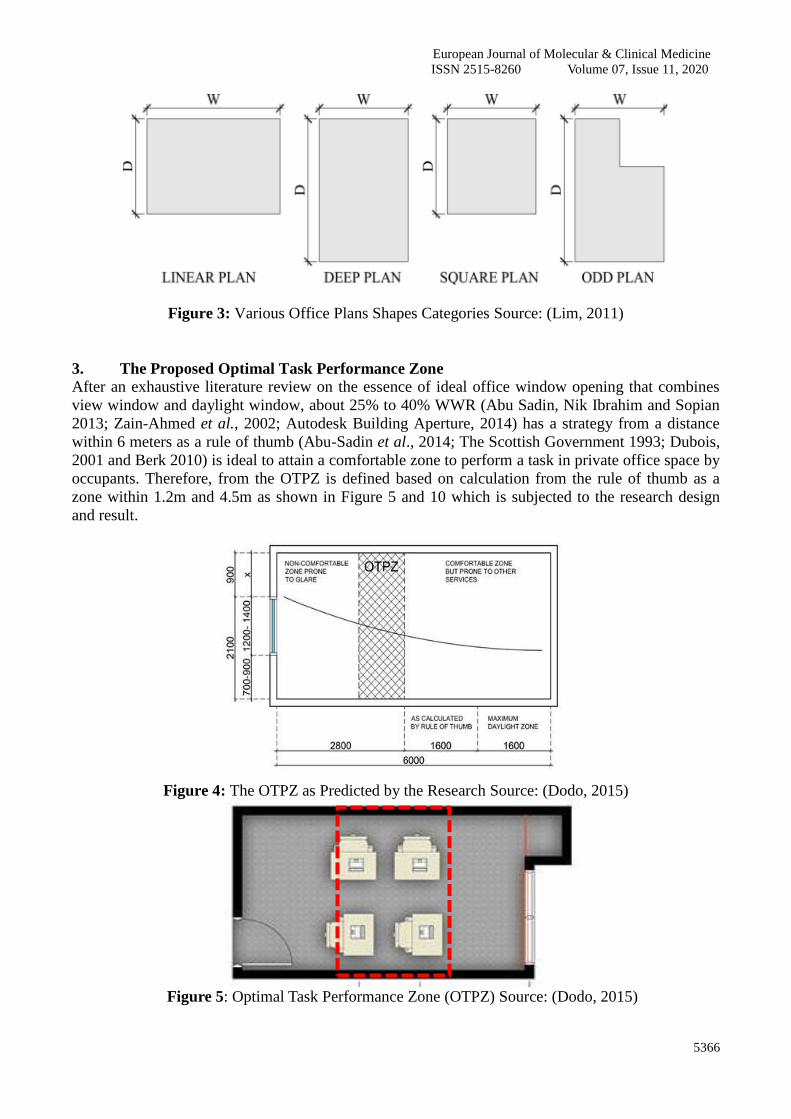
3. The Proposed Optimal Task Performance Zone
After an exhaustive literature review on the essence of ideal office window opening that combines
view window and daylight window, about 25% to 40% WWR (Abu Sadin, Nik Ibrahim and Sopian
2013; Zain-Ahmed et al., 2002; Autodesk Building Aperture, 2014) has a strategy from a distance
within 6 meters as a rule of thumb (Abu-Sadin et al., 2014; The Scottish Government 1993; Dubois,
2001 and Berk 2010) is ideal to attain a comfortable zone to perform a task in private office space by
occupants. Therefore, from the OTPZ is defined based on calculation from the rule of thumb as a
zone within 1.2m and 4.5m as shown in Figure 5 and 10 which is subjected to the research design
and result.
Figure 4: The OTPZ as Predicted by the Research Source: (Dodo, 2015)
Figure 5: Optimal Task Performance Zone (OTPZ) Source: (Dodo, 2015)
European Journal of Molecular & Clinical Medicine
ISSN 2515-8260 Volume 07, Issue 11, 2020
5367
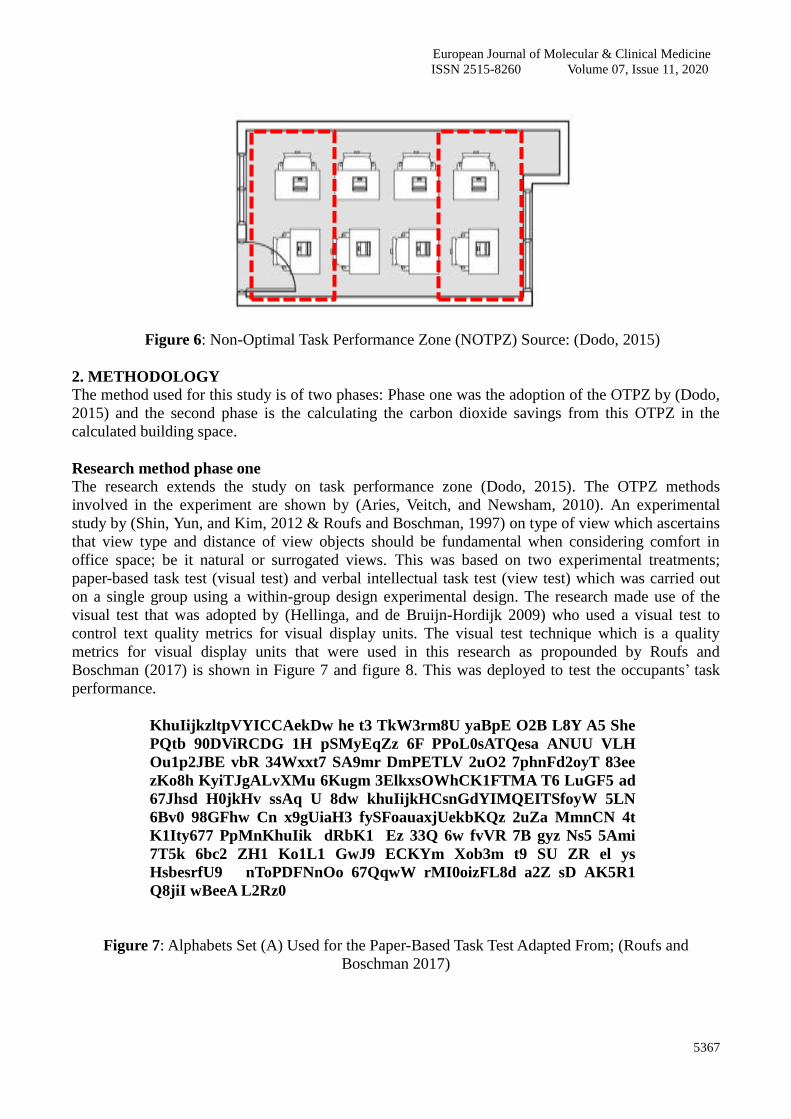
Figure 6: Non-Optimal Task Performance Zone (NOTPZ) Source: (Dodo, 2015)
2. METHODOLOGY
The method used for this study is of two phases: Phase one was the adoption of the OTPZ by (Dodo,
2015) and the second phase is the calculating the carbon dioxide savings from this OTPZ in the
calculated building space.
Research method phase one
The research extends the study on task performance zone (Dodo, 2015). The OTPZ methods
involved in the experiment are shown by (Aries, Veitch, and Newsham, 2010). An experimental
study by (Shin, Yun, and Kim, 2012 & Roufs and Boschman, 1997) on type of view which ascertains
that view type and distance of view objects should be fundamental when considering comfort in
office space; be it natural or surrogated views. This was based on two experimental treatments;
paper-based task test (visual test) and verbal intellectual task test (view test) which was carried out
on a single group using a within-group design experimental design. The research made use of the
visual test that was adopted by (Hellinga, and de Bruijn-Hordijk 2009) who used a visual test to
control text quality metrics for visual display units. The visual test technique which is a quality
metrics for visual display units that were used in this research as propounded by Roufs and
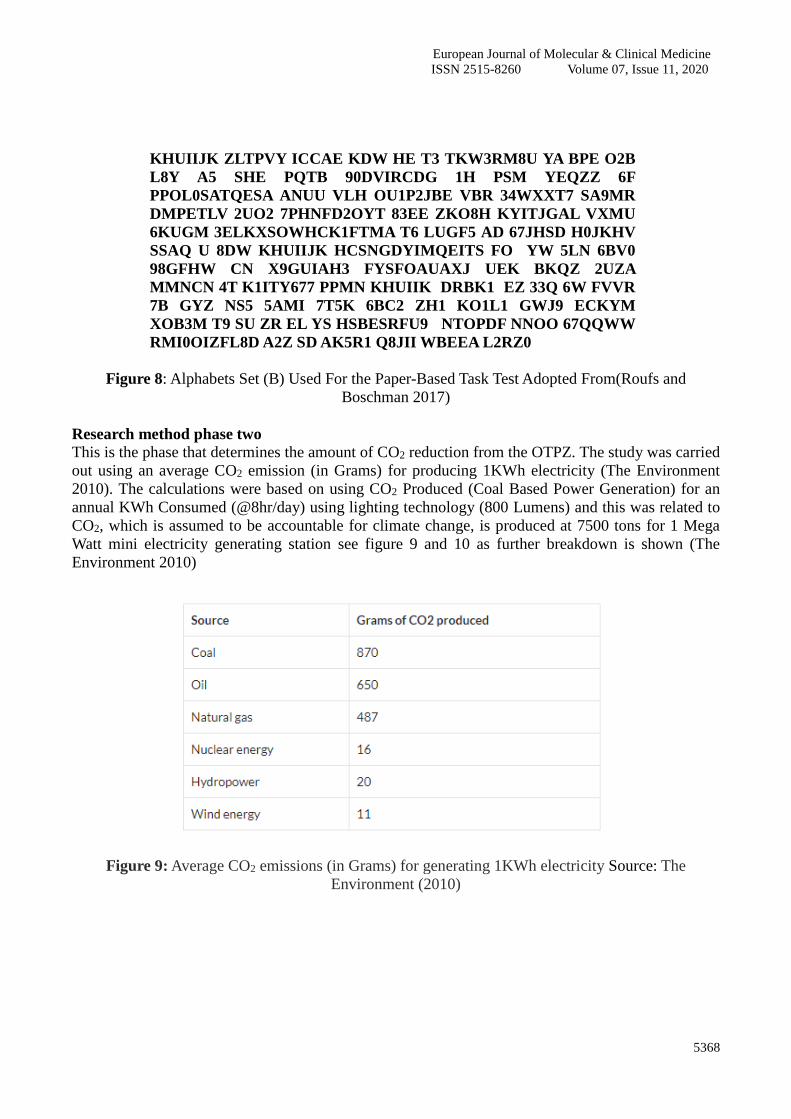
Boschman (2017) is shown in Figure 7 and figure 8. This was deployed to test the occupants’ task
performance.
KhuIijkzltpVYICCAekDw he t3 TkW3rm8U yaBpE O2B L8Y A5 She
PQtb 90DViRCDG 1H pSMyEqZz 6F PPoL0sATQesa ANUU VLH
Ou1p2JBE vbR 34Wxxt7 SA9mr DmPETLV 2uO2 7phnFd2oyT 83ee
zKo8h KyiTJgALvXMu 6Kugm 3ElkxsOWhCK1FTMA T6 LuGF5 ad
67Jhsd H0jkHv ssAq U 8dw khuIijkHCsnGdYIMQEITSfoyW 5LN
6Bv0 98GFhw Cn x9gUiaH3 fySFoauaxjUekbKQz 2uZa MmnCN 4t
K1Ity677 PpMnKhuIik dRbK1 Ez 33Q 6w fvVR 7B gyz Ns5 5Ami
7T5k 6bc2 ZH1 Ko1L1 GwJ9 ECKYm Xob3m t9 SU ZR el ys
HsbesrfU9 nToPDFNnOo 67QqwW rMI0oizFL8d a2Z sD AK5R1
Q8jiI wBeeA L2Rz0
Figure 7: Alphabets Set (A) Used for the Paper-Based Task Test Adapted From; (Roufs and
Boschman 2017)
European Journal of Molecular & Clinical Medicine
ISSN 2515-8260 Volume 07, Issue 11, 2020
5368
KHUIIJK ZLTPVY ICCAE KDW HE T3 TKW3RM8U YA BPE O2B
L8Y A5 SHE PQTB 90DVIRCDG 1H PSM YEQZZ 6F
PPOL0SATQESA ANUU VLH OU1P2JBE VBR 34WXXT7 SA9MR
DMPETLV 2UO2 7PHNFD2OYT 83EE ZKO8H KYITJGAL VXMU
6KUGM 3ELKXSOWHCK1FTMA T6 LUGF5 AD 67JHSD H0JKHV
SSAQ U 8DW KHUIIJK HCSNGDYIMQEITS FO YW 5LN 6BV0
98GFHW CN X9GUIAH3 FYSFOAUAXJ UEK BKQZ 2UZA
MMNCN 4T K1ITY677 PPMN KHUIIK DRBK1 EZ 33Q 6W FVVR
7B GYZ NS5 5AMI 7T5K 6BC2 ZH1 KO1L1 GWJ9 ECKYM
XOB3M T9 SU ZR EL YS HSBESRFU9 NTOPDF NNOO 67QQWW
RMI0OIZFL8D A2Z SD AK5R1 Q8JII WBEEA L2RZ0
Figure 8: Alphabets Set (B) Used For the Paper-Based Task Test Adopted From(Roufs and
Boschman 2017)
Research method phase two
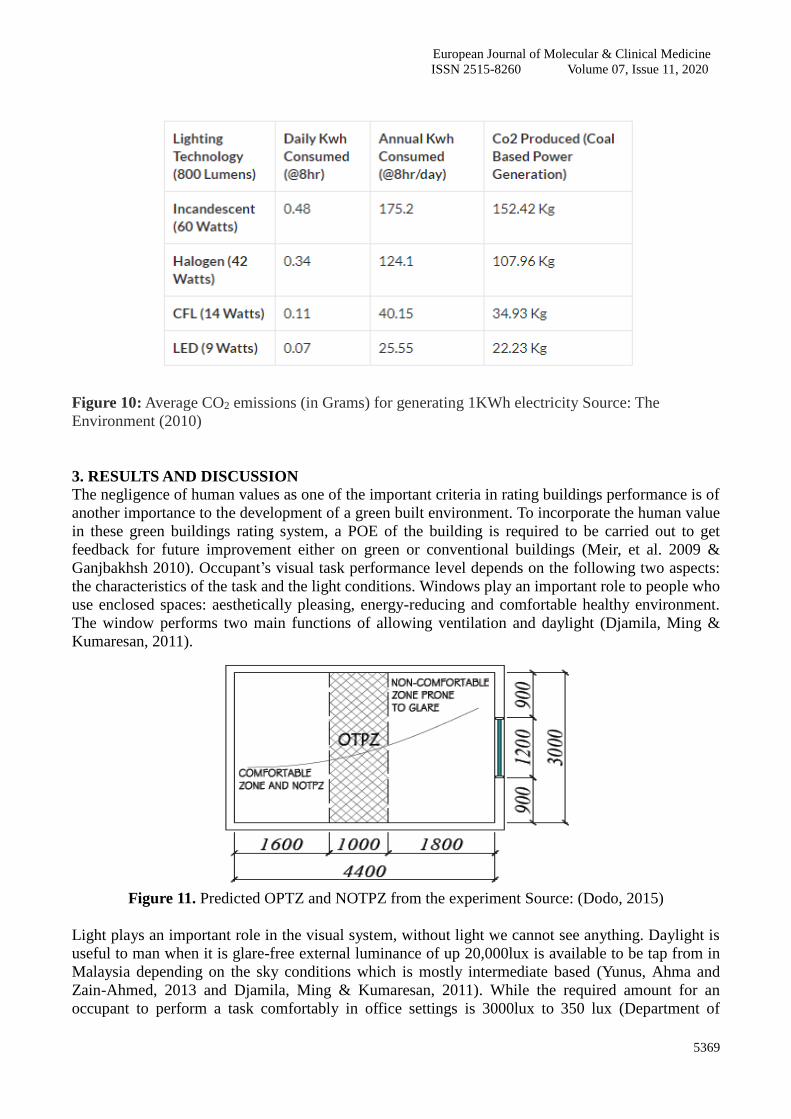
This is the phase that determines the amount of CO2 reduction from the OTPZ. The study was carried
out using an average CO2 emission (in Grams) for producing 1KWh electricity (The Environment
2010). The calculations were based on using CO2 Produced (Coal Based Power Generation) for an
annual KWh Consumed (@8hr/day) using lighting technology (800 Lumens) and this was related to
CO2, which is assumed to be accountable for climate change, is produced at 7500 tons for 1 Mega
Watt mini electricity generating station see figure 9 and 10 as further breakdown is shown (The
Environment 2010)
Figure 9: Average CO2 emissions (in Grams) for generating 1KWh electricity Source: The
Environment (2010)
European Journal of Molecular & Clinical Medicine
ISSN 2515-8260 Volume 07, Issue 11, 2020
5369
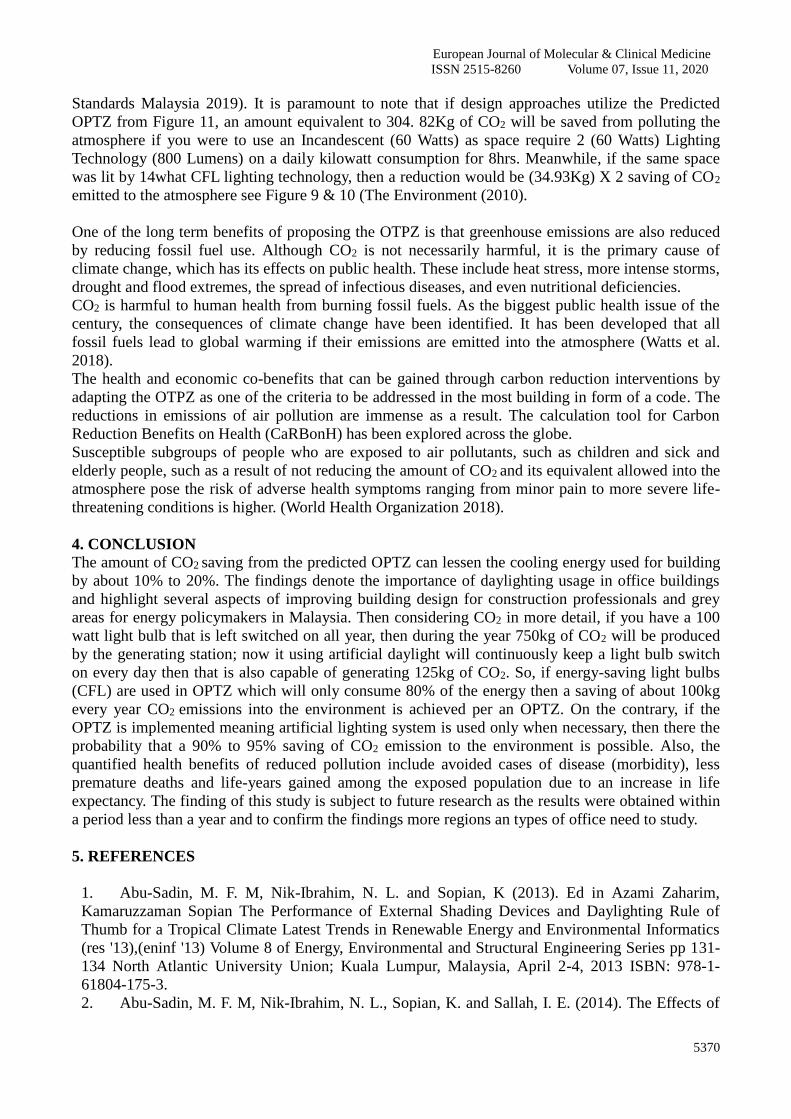
Figure 10: Average CO2 emissions (in Grams) for generating 1KWh electricity Source: The
Environment (2010)
3. RESULTS AND DISCUSSION
The negligence of human values as one of the important criteria in rating buildings performance is of
another importance to the development of a green built environment. To incorporate the human value
in these green buildings rating system, a POE of the building is required to be carried out to get
feedback for future improvement either on green or conventional buildings (Meir, et al. 2009 &
Ganjbakhsh 2010). Occupant’s visual task performance level depends on the following two aspects:
the characteristics of the task and the light conditions. Windows play an important role to people who
use enclosed spaces: aesthetically pleasing, energy-reducing and comfortable healthy environment.
The window performs two main functions of allowing ventilation and daylight (Djamila, Ming &
Kumaresan, 2011).
Figure 11. Predicted OPTZ and NOTPZ from the experiment Source: (Dodo, 2015)
Light plays an important role in the visual system, without light we cannot see anything. Daylight is
useful to man when it is glare-free external luminance of up 20,000lux is available to be tap from in
Malaysia depending on the sky conditions which is mostly intermediate based (Yunus, Ahma and
Zain-Ahmed, 2013 and Djamila, Ming & Kumaresan, 2011). While the required amount for an
occupant to perform a task comfortably in office settings is 3000lux to 350 lux (Department of
European Journal of Molecular & Clinical Medicine
ISSN 2515-8260 Volume 07, Issue 11, 2020
5370
Standards Malaysia 2019). It is paramount to note that if design approaches utilize the Predicted
OPTZ from Figure 11, an amount equivalent to 304. 82Kg of CO2 will be saved from polluting the
atmosphere if you were to use an Incandescent (60 Watts) as space require 2 (60 Watts) Lighting
Technology (800 Lumens) on a daily kilowatt consumption for 8hrs. Meanwhile, if the same space
was lit by 14what CFL lighting technology, then a reduction would be (34.93Kg) X 2 saving of CO2
emitted to the atmosphere see Figure 9 & 10 (The Environment (2010).
One of the long term benefits of proposing the OTPZ is that greenhouse emissions are also reduced
by reducing fossil fuel use. Although CO2 is not necessarily harmful, it is the primary cause of
climate change, which has its effects on public health. These include heat stress, more intense storms,
drought and flood extremes, the spread of infectious diseases, and even nutritional deficiencies.
CO2 is harmful to human health from burning fossil fuels. As the biggest public health issue of the
century, the consequences of climate change have been identified. It has been developed that all
fossil fuels lead to global warming if their emissions are emitted into the atmosphere (Watts et al.
2018).
The health and economic co-benefits that can be gained through carbon reduction interventions by
adapting the OTPZ as one of the criteria to be addressed in the most building in form of a code. The
reductions in emissions of air pollution are immense as a result. The calculation tool for Carbon
Reduction Benefits on Health (CaRBonH) has been explored across the globe.
Susceptible subgroups of people who are exposed to air pollutants, such as children and sick and
elderly people, such as a result of not reducing the amount of CO2 and its equivalent allowed into the
atmosphere pose the risk of adverse health symptoms ranging from minor pain to more severe life-
threatening conditions is higher. (World Health Organization 2018).
4. CONCLUSION The amount of CO2 saving from the predicted OPTZ can lessen the cooling energy used for building
by about 10% to 20%. The findings denote the importance of daylighting usage in office buildings
and highlight several aspects of improving building design for construction professionals and grey
areas for energy policymakers in Malaysia. Then considering CO2 in more detail, if you have a 100
watt light bulb that is left switched on all year, then during the year 750kg of CO2 will be produced
by the generating station; now it using artificial daylight will continuously keep a light bulb switch
on every day then that is also capable of generating 125kg of CO2. So, if energy-saving light bulbs
(CFL) are used in OPTZ which will only consume 80% of the energy then a saving of about 100kg
every year CO2 emissions into the environment is achieved per an OPTZ. On the contrary, if the
OPTZ is implemented meaning artificial lighting system is used only when necessary, then there the
probability that a 90% to 95% saving of CO2 emission to the environment is possible. Also, the
quantified health benefits of reduced pollution include avoided cases of disease (morbidity), less
premature deaths and life-years gained among the exposed population due to an increase in life
expectancy. The finding of this study is subject to future research as the results were obtained within
a period less than a year and to confirm the findings more regions an types of office need to study.
5. REFERENCES
1. Abu-Sadin, M. F. M, Nik-Ibrahim, N. L. and Sopian, K (2013). Ed in Azami Zaharim,
Kamaruzzaman Sopian The Performance of External Shading Devices and Daylighting Rule of
Thumb for a Tropical Climate Latest Trends in Renewable Energy and Environmental Informatics
(res '13),(eninf '13) Volume 8 of Energy, Environmental and Structural Engineering Series pp 131-
134 North Atlantic University Union; Kuala Lumpur, Malaysia, April 2-4, 2013 ISBN: 978-1-
61804-175-3.
2. Abu-Sadin, M. F. M, Nik-Ibrahim, N. L., Sopian, K. and Sallah, I. E. (2014). The Effects of
European Journal of Molecular & Clinical Medicine
ISSN 2515-8260 Volume 07, Issue 11, 2020
5371
Different Depth of Floor towards Internal Daylighting and Rules of Thumb for Office Room
Advanced Materials Research Vol. 935 Pp 92-96 www.scientific.net
doi:10.4028/www.scientific.net/AMR.935.92
3. Aries, M. B. C., Veitch, J. A., and Newsham, G. R. (2010). Windows, View, and Office
Characteristics Predict Physical and Psychological Discomfort. Building and Energy. 30, 533-541
4. Autodesk Education (2011) Light Distribution & Glare retrieved on 7 February 2016 from,
http://sustainabilityworkshop.autodesk.com/buildings/light-distribution-glare
5. Berk, A. B. M. (2010). Window and People: A Model-Based On a Literature Study to Identify
the Influence of Windows on People in an Office Environment Concerning Daylight and View. A
Review Unit Building, Building Physics of the Environment. Technische Universiteit Eindhoven
Faculteit Bouwkunde.
6. Bülow-Hübe, H. (2008) Daylight in Glazed Office Buildings A Comparative Study of
Daylight Availability, Luminance and Illuminance Distribution for an Office Room with Three
Different Glass Areas Report EBD-R--08/17 of the Division of Energy and Building Design
Department of Architecture and Built Environment Lund University Faculty of Engineering LTH,
pp 12 2008 ISSN-1651-8128 retrieved from
http://www.ebd.lth.se/fileadmin/energi_byggnadsdesign/images/Publikationer/Report_EBD_R_08_
17_dagsljus.pdf
7. Department of Standards Malaysia (2007). MS 1525:2007 Code of Practice on Energy
Efficiency and Use of Renewable Energy for Non-Residential Buildings ICS: 91.040.01 (1st ed.)
http://www.standardsmalaysia.gov.my
8. Department of Standards Malaysia (2019). MS 1525:2019 Code of Practice on Energy
Efficiency, Renewable Energy, Non-Residential, Buildings, Code of Practice, Energy 91.040.01
(Third Revision) Malaysia. http;//www.standardsmalaysia.gov.my
9. Djamila, H., Ming, C. C. & Kumaresan, S. (2011). Estimation of Exterior Vertical Daylight
for the Humid Tropic of Kota Kinabalu City In East Malaysia. Renewable Energy. 36 (1), 9-15
10. Dodo Yakubu Aminu (2015) Office window opening influence on occupants’ task
performance Unpublished Doctor of Philosophy, Faculty of Built Environment, Universiti
Teknologi Malaysia Skudai
11. Dodo, Y. A., Mohd - Zin, K., Ossen, D. R. Jibril, D. J., Bornoma, A. H. & Alkali I. (2013)
Importance of a View Window in Rating Green Office Buildings Advanced Materials Research Vol.
689 (2013) Pp. 180-183 DOI: 10.4028/www.sciencetific.net/AMR.689. 180
12. Dubois, M. C., Demers, C., and Potvin, A. (2007). The Influence of Daylighting on
Occupants Comfort and Diversity of Luminous Ambiences in Architecture. Conference
Proceedings of the American Solar Energy (ASES) Solar 2007 7-12 July Cleave land Ohio.
13. Ganjbakhsh (2010). Building Performance Diagnosis Using Post Occupancy Evaluation For
Low Energy Office Building Practices. Unpublished Master of Science, Faculty of Civil
Engineering – Construction Management University Teknologi Malaysia Johor
14. Heerwagen, J. H. and Orians, G. H. (1986). Adaptations to Windowlessness: A Study of the
Use of Visual Decor in Windowed and Windowless Offices. Environment and Behaviour. 18(5):
623-639
15. Hellinga H. I. J. (2010) Assessment of Daylight And View Quality: A Field Study in Office
Buildings CIE conference: Lighting Quality & Energy Efficiency 17-03-2010
16. Hellinga, H. I. J and de Bruijn-Hordijk, T. (2009). A New Method for the Analysis of
Daylight Access and View Out. 11th European lighting conference. Lx Europe 2009, Istanbul, (Pp.
1-8)
17. Lechner, N. (2015). Heating, Cooling, Lighting, Sustainable Design Methods for Architects.
Fourth Edition. New Jersey, Canada: John Wiley & Sons, Inc., Hoboken.
18. Lim, Y. W., Kandar, M. Z., Ahmad, M. H., Ossen, D. R. and Abdullah, A. M. (2012).
Building Façade Design for Daylighting Quality in Typical Government Office Building and
European Journal of Molecular & Clinical Medicine
ISSN 2515-8260 Volume 07, Issue 11, 2020
5372
Environment 57: 194-204.
19. Lim, Yaik-Wah. (2011). Internal Shading for Efficient Tropical Daylighting in High Rise
Open Plan Office. Unpublished Doctor of Philosophy, Faculty of Built Environment, Universiti
Teknologi Malaysia Skudai.
20. Meir, I. A., Garb, Y. Jiao, D. and Cicelsky, A. (2009). Post-Occupancy Evaluation: An
Inevitable Step toward Sustainability. Advances in Building Energy Research. 3: 189-220
21. Ministry of Energy, Telecommunication and Posts, Malaysia METPM (1989). Guidelines for
energy efficiency in buildings. In Zain-Ahmed et al., 2002.
22. Mohd-Zin, K. (2005). Energy Efficient Building Design Towards Sustainable Development.
Symposium International Urbanization, Architecture and Development in Nusantara. 18 June 2015.
23. Mohd-Zin, K. (2010). Towards Green Buildings Appreciations. Seminar Series of the
Department of Geoinformatics and Real Estate Universiti Teknologi Malaysia, B07 Faculty of Built
Environment April 2010.
24. Newsham, G. R., Brand, J., Donnelly, C., Veitch. J., Aries, M. and Charles, K. (2009).
Linking Indoor Environment Conditions to Job Satisfaction: A Field Study. Building Research and
Information 37, 129-147
25. Newsham, G. R., Brand, J., Donnelly, C., Veitch. J., Aries, M. and Charles, K. (2009).
Linking Indoor Environment Conditions to Job Satisfaction: A Field Study. Building Research and
Information 37, 129-147
26. Roufs J. A. J. and Boschman, M. C. (1997). Text Quality Metrics For Visual Display Units: I.
Methodological Aspects Displays. 18: 37-43.
a. Scotland Energy uses
http://www.archive2.officialdocuments.co.uk/document/deps/cs/shdg/ch04 /.
27. Shin, J. Y., Yun, Y. G. and Kim, T. J. (2012). View Types and Luminance Effects on
Discomfort Glare Assessment from Windows Energy and Buildings Volume 46, March 2012, Pages
139–145 Sustainable and Healthy Buildings
28. The Environment (2010) How Much CO2 Does A Light Bulb Create? Retrieved 16th January,
2021available @ https://www.saving-light-bulbs.co.uk/blog/how-much-co2-does-a-light-bulb-
create/
29. The Scottish Government (1993). Sustainable Housing Design Guidelines for Scotland
Energy use http://www.archive2.official-documents.co.uk/document/deps/cs/shdg/ch04 /.
30. Tuaycharoen, N. and Tregenza, P. R. (2007). View and Discomfort Glare from Windows.
Lighting Research and Technology 39: 185 http://lrt.sagepub.com/content/39/2/185.
31. Veitch, J. A. and Newsham, G. R. (1998) Lighting Quality and Energy-Efficiency Effects on
Task Performance, Mood, Health, Satisfaction, and Comfort, Journal of the Illuminating
Engineering Society, 27(1): 107-129. DOI: 10.1080/00994480.1998.10748216.
32. Veitch, J. A., Charles, K. E., Farley, K. M. J. and Newsham, G. R. (2007). A Model of
Satisfaction with Open Plan Office Conditions: COPE Field Buildings. Journal of Environmental
Psychology. 27: 177-189.
33. Watts, N., et al. (2018)“The Lancet Countdown on health and climate change: from 25 years
of inaction to a global transformation for public health.” The Lancet 391 10120, 581-630 (10 Feb
2018)
34. World Health Organization (2018) Achieving Health benefits from Carbon Reductions,
Manual for CaRBonH calculation tool. Retrieved on 20th January 2018 and available @
https://www.euro.who.int/__data/assets/pdf_file/0004/386923/health-carbon-reductions-eng.pdf
35. Yunus, J., Ahmad S.S., and Zain-Ahmed, A. (2013). Evaluating Daylighting Of Glazed
Atrium Spaces Through Physical Scale Model Measurements Under Real Tropical Skies Condition
Recent Researches in Energy, Environment, Entrepreneurship, Innovation 122-127 ISBN: 978-1-
61804-001-5
36. Zain-Ahmed, A., Sopian, K., Othman, M. Y. H., Sayigh, A. A. M. and Surendran, P. N. (2002).
European Journal of Molecular & Clinical Medicine
ISSN 2515-8260 Volume 07, Issue 11, 2020
5373
Daylighting as a Passive Solar Design Strategy in Tropical Buildings: A Case Study of Malaysia.
Energy Conversion and Management, 43: 1725–1736.