post-construction survey method statement for the beatrice
TRANSCRIPT
Post-construction survey
Method Statement for the Beatrice Offshore Windfarm
APEM Ref: P00004389
June 2021

Registered in England No. 2530851, Registered Address Riverview A17 Embankment Business Park, Heaton Mersey, Stockport,
SK4 3GN
Client: SSE Renewables
Project reference: P00004287
Date of issue: June 2021
________________________
Project Manager: Dr Marc Hubble
________________________
APEM Ltd
Riverview
A17 Embankment Business Park
Heaton Mersey
Stockport
SK4 3GN
Tel: 0161 442 8938
Fax: 0161 432 6083
Registered in England No. 02530851

Registered in England No. 2530851, Registered Address Riverview A17 Embankment Business Park, Heaton Mersey, Stockport,
SK4 3GN
Revision and Amendment Register
Version Number
Date Section(s) Page(s) Summary of Changes Approved by
1.0 28/06/2021 All All Draft document MH
Contents
1. Introduction ........................................................................................................................ 1
2. Timing of surveys ............................................................................................................... 2
3. Survey methods ................................................................................................................. 2
3.1 Benthic infauna survey ............................................................................................ 2
3.2 Underwater video survey of turbine foundations and surrounding area .................. 3
3.2.1 Survey of turbine foundations ................................................................................. 5
3.2.2 Survey of habitat in vicinity of turbine foundations .................................................. 5
3.2.3 Survey of NNS ........................................................................................................ 6
4. Laboratory analysis ............................................................................................................ 7
4.1 Benthic infauna survey ............................................................................................ 7
4.1.1 Laboratory Processing......................................................................................... 7
4.2 Underwater video survey ........................................................................................ 9
4.2.1 Laboratory analysis of video and stills ................................................................. 9
5. Data analysis and reporting ............................................................................................. 10
5.1 Benthic infauna survey .......................................................................................... 10
5.1 Underwater video survey ...................................................................................... 10
Appendix A – sampling and survey location maps.................................................................. 11
Appendix B – sampling and survey location coordinates ........................................................ 13
June 2021 Page 1
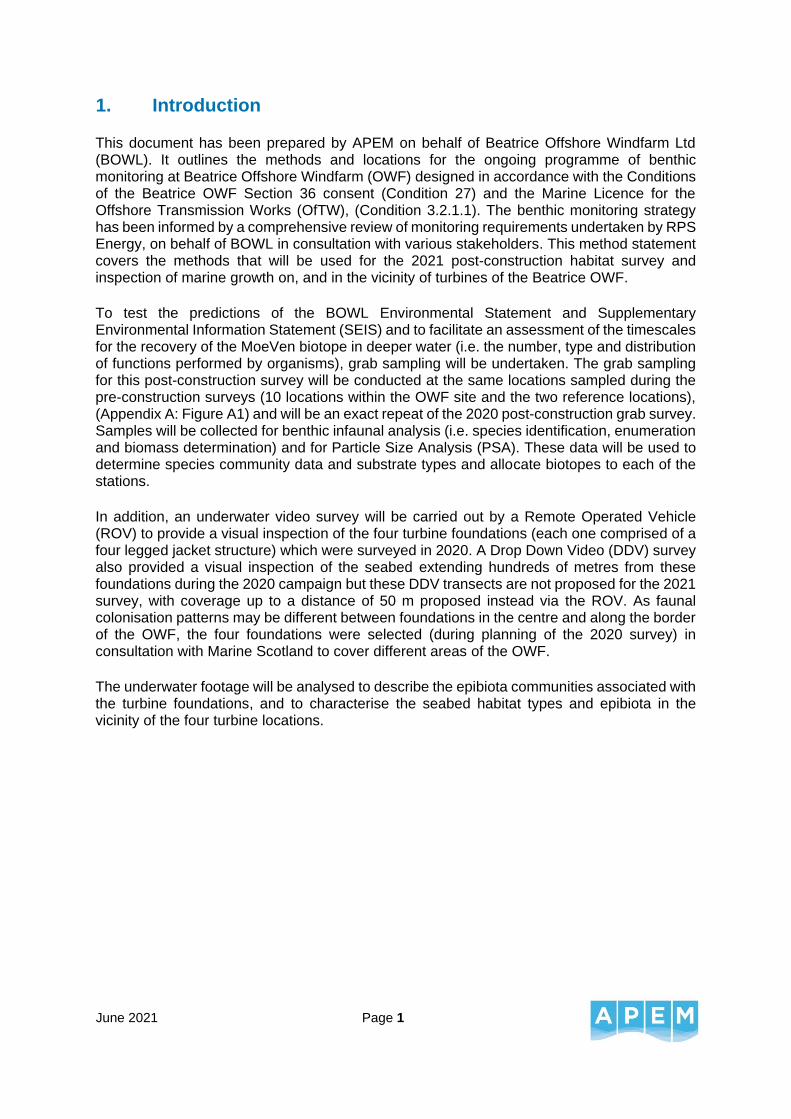
1. Introduction
This document has been prepared by APEM on behalf of Beatrice Offshore Windfarm Ltd (BOWL). It outlines the methods and locations for the ongoing programme of benthic monitoring at Beatrice Offshore Windfarm (OWF) designed in accordance with the Conditions of the Beatrice OWF Section 36 consent (Condition 27) and the Marine Licence for the Offshore Transmission Works (OfTW), (Condition 3.2.1.1). The benthic monitoring strategy has been informed by a comprehensive review of monitoring requirements undertaken by RPS Energy, on behalf of BOWL in consultation with various stakeholders. This method statement covers the methods that will be used for the 2021 post-construction habitat survey and inspection of marine growth on, and in the vicinity of turbines of the Beatrice OWF.
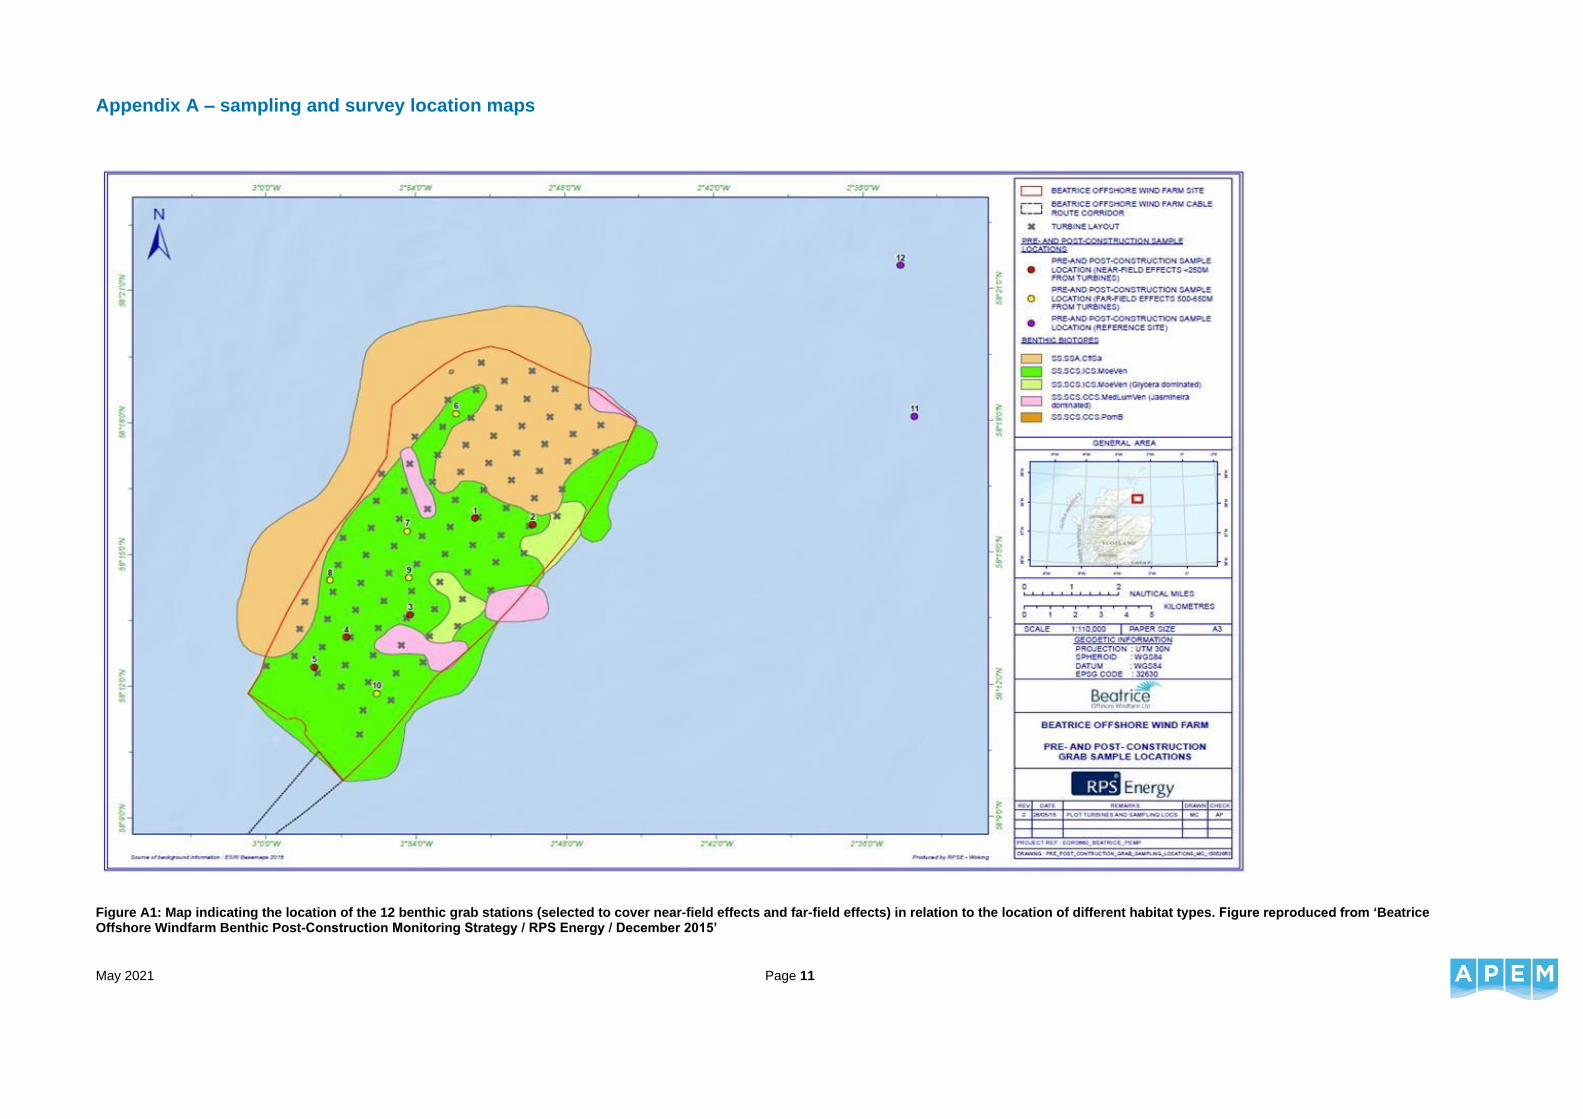
To test the predictions of the BOWL Environmental Statement and Supplementary Environmental Information Statement (SEIS) and to facilitate an assessment of the timescales for the recovery of the MoeVen biotope in deeper water (i.e. the number, type and distribution of functions performed by organisms), grab sampling will be undertaken. The grab sampling for this post-construction survey will be conducted at the same locations sampled during the pre-construction surveys (10 locations within the OWF site and the two reference locations), (Appendix A: Figure A1) and will be an exact repeat of the 2020 post-construction grab survey. Samples will be collected for benthic infaunal analysis (i.e. species identification, enumeration and biomass determination) and for Particle Size Analysis (PSA). These data will be used to determine species community data and substrate types and allocate biotopes to each of the stations.
In addition, an underwater video survey will be carried out by a Remote Operated Vehicle (ROV) to provide a visual inspection of the four turbine foundations (each one comprised of a four legged jacket structure) which were surveyed in 2020. A Drop Down Video (DDV) survey also provided a visual inspection of the seabed extending hundreds of metres from these foundations during the 2020 campaign but these DDV transects are not proposed for the 2021 survey, with coverage up to a distance of 50 m proposed instead via the ROV. As faunal colonisation patterns may be different between foundations in the centre and along the border of the OWF, the four foundations were selected (during planning of the 2020 survey) in consultation with Marine Scotland to cover different areas of the OWF.
The underwater footage will be analysed to describe the epibiota communities associated with the turbine foundations, and to characterise the seabed habitat types and epibiota in the vicinity of the four turbine locations.
June 2021 Page 2
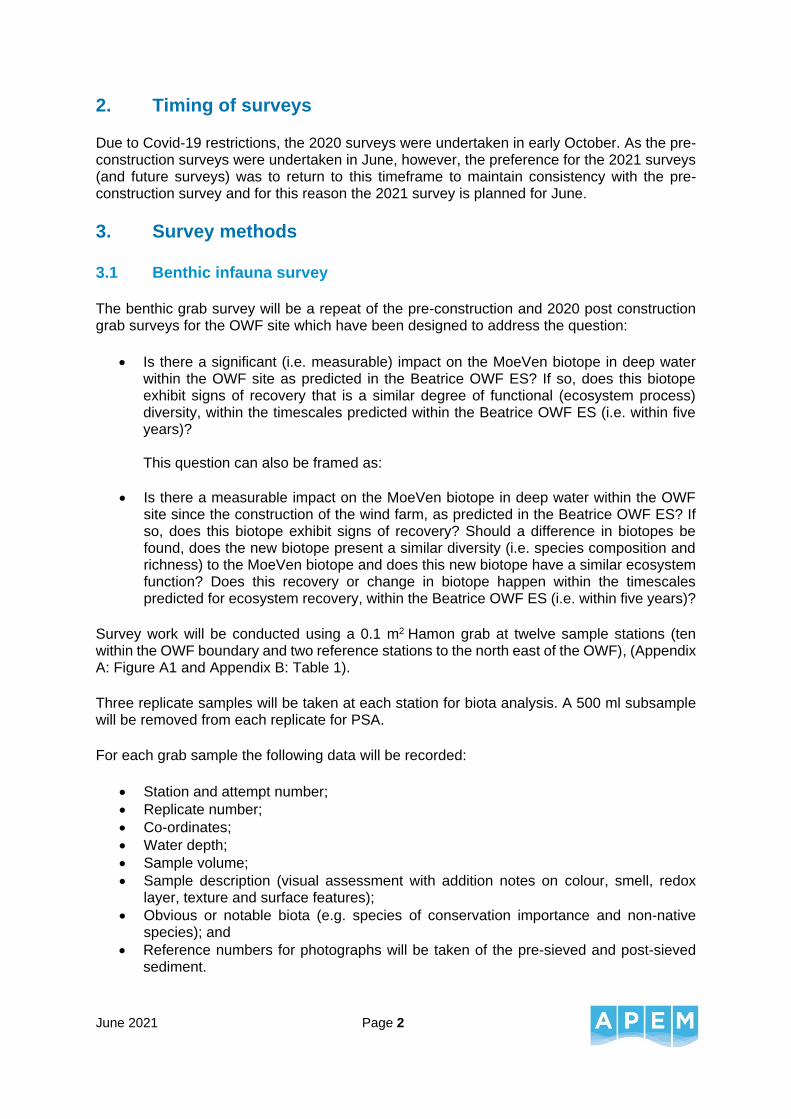
2. Timing of surveys
Due to Covid-19 restrictions, the 2020 surveys were undertaken in early October. As the pre-construction surveys were undertaken in June, however, the preference for the 2021 surveys (and future surveys) was to return to this timeframe to maintain consistency with the pre-construction survey and for this reason the 2021 survey is planned for June.
3. Survey methods
3.1 Benthic infauna survey
The benthic grab survey will be a repeat of the pre-construction and 2020 post construction grab surveys for the OWF site which have been designed to address the question:
• Is there a significant (i.e. measurable) impact on the MoeVen biotope in deep water within the OWF site as predicted in the Beatrice OWF ES? If so, does this biotope exhibit signs of recovery that is a similar degree of functional (ecosystem process) diversity, within the timescales predicted within the Beatrice OWF ES (i.e. within five years)? This question can also be framed as:
• Is there a measurable impact on the MoeVen biotope in deep water within the OWF site since the construction of the wind farm, as predicted in the Beatrice OWF ES? If so, does this biotope exhibit signs of recovery? Should a difference in biotopes be found, does the new biotope present a similar diversity (i.e. species composition and richness) to the MoeVen biotope and does this new biotope have a similar ecosystem function? Does this recovery or change in biotope happen within the timescales predicted for ecosystem recovery, within the Beatrice OWF ES (i.e. within five years)?
Survey work will be conducted using a 0.1 m2 Hamon grab at twelve sample stations (ten within the OWF boundary and two reference stations to the north east of the OWF), (Appendix A: Figure A1 and Appendix B: Table 1).
Three replicate samples will be taken at each station for biota analysis. A 500 ml subsample will be removed from each replicate for PSA.
For each grab sample the following data will be recorded:
• Station and attempt number;
• Replicate number;
• Co-ordinates;
• Water depth;
• Sample volume;
• Sample description (visual assessment with addition notes on colour, smell, redox layer, texture and surface features);
• Obvious or notable biota (e.g. species of conservation importance and non-native species); and
• Reference numbers for photographs will be taken of the pre-sieved and post-sieved sediment.
June 2021 Page 3
For each grab sampling attempt, the following steps will be followed in accordance with the protocols established by Cooper & Mason (2017)1:
1) Excess water will be poured off from the sample over the sieve table;
2) Sample will be photographed (with label);
3) Sample volume will be measured;
5) Sample will be washed and sieved on the sieve table;
6) The material retained on the sieve table mesh will be photographed; and
7) The sieved sample will be transferred to a bucket and labelled internally and externally with the project number, date, station and sample number.
To be valid, a sample must meet two criteria. Firstly, it must be of an acceptable volume, usually > 5 litres. Secondly, there must be no indication of a significant malfunction in the grab (Cooper & Mason 2017). If these criteria are not met then a further three attempts will be made at the same location. Using this approach, valid samples will be collected at each station.
Replicates for infauna determinations will be sieved over a 1.0 mm mesh and the retained material transferred to a suitable, labelled container and fixed in 4% buffered formaldehyde solution for later laboratory analysis. Conspicuous fauna or large material will be removed to a separate container prior to sieving to avoid damage to smaller material.
3.2 Underwater video survey of turbine foundations and surrounding area
This aspect of the post-construction survey will be undertaken to address the question:
• How do the fouling communities associated with the introduction of hard substrate (i.e. foundations) develop in the long term and what, if any, visible effects are there on the epibenthic community composition in the immediate vicinity? This question can also be framed as:
• How do the fouling communities associated with the introduction of hard substrate (i.e. foundations) change in the long term and what, if any, visible effects have occurred on the epibenthic community composition on the seabed in the immediate vicinity?
It should be noted that the original (2015) wording of this question included consideration of scour protection, however, no scour protection is evident at the turbine foundations surveyed.
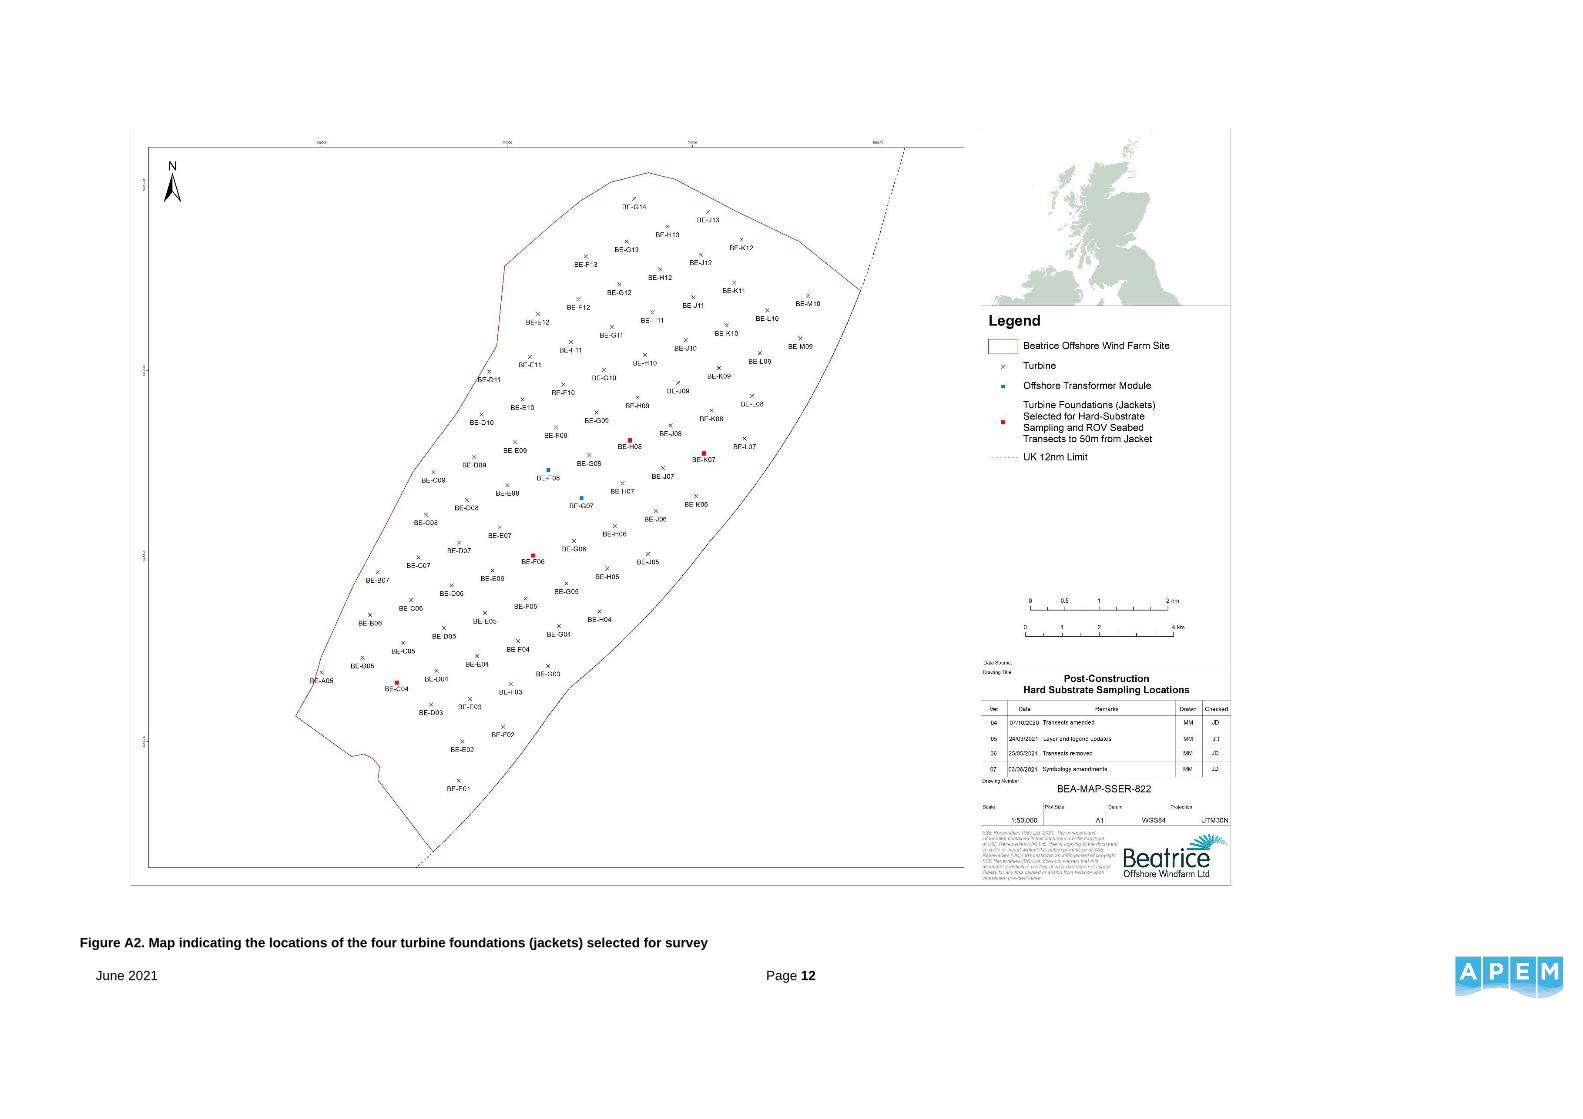
Visual inspection surveys will be carried out on the four jacket legs at each of the four turbine foundation locations (turbine locations shown in Appendix A: Figure A2), which were selected (during planning of the 2020 survey) to fulfil the following criteria:
1 Cooper K. & Mason C. 2017. Regional Seabed Monitoring Plan (RSMP). Protocol for Sample Collection and Processing. Version 5.0
June 2021 Page 4
• Locations are within the MoeVen biotope as mapped during the previous survey;
• Two locations are near the border of the wind farm, and two are near the centre, to provide good spatial coverage;
• Locations are close to one of the grab sample stations within the OWF site.
Due to the manoeuvrability required, an ROV will be used to survey the turbine foundations and immediate surrounding area of seabed (out to approximately 50 m). The approach will follow the methodology proposed in the JNCC Marine Monitoring Handbook and guidance produced as part of the Mapping European Seabed Habitats project (MESH) (Coggan et al. 20072) and Cooper (2017; RMSPv5 guidance3).
The ROV used will be an Outland 2500 with a tilting mechanism and LED lighting system providing high resolution outputs and good colour in low light conditions. The ROV will record High Definition (HD) 1080 dp video, and when descending the turbine foundation the movement of the ROV will be halted at five metre depth intervals along the foundation to enable freeze frame images to be captured. The typical depth of turbine foundation from the sea surface to the seabed is known to be 35-45 m.
An additional 2.7k video stream will also be captured by fitting a GoPro in a waterproof housing to the ROV via a specific mount. Additional positional data will be acquired from the ROV using a USBL subsea positioning system on the ROV.
The ROV seabed transect will be run to 50 m away from the foundation in the following directions
• east-southeast and west-northwest (perpendicular to the prevailing current).
• north-northeast and south-southwest (in the direction of the prevailing current).
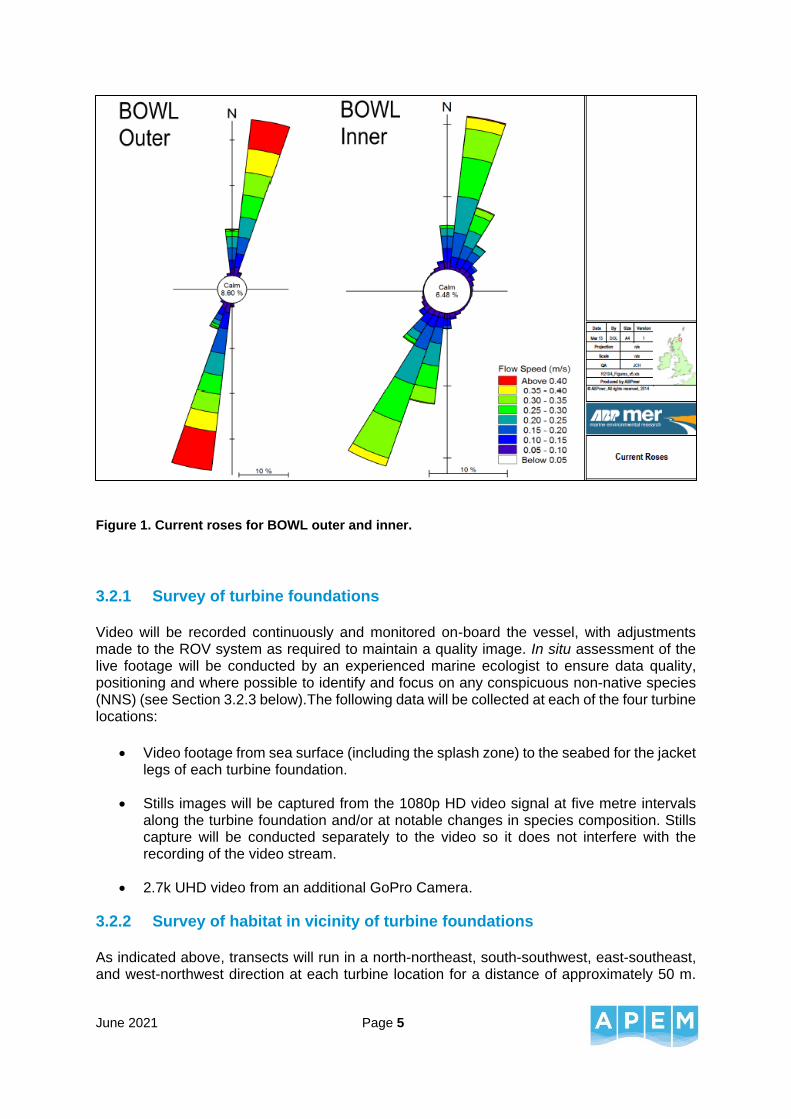
Current roses taken from pre-construction monitoring were reviewed to determine the direction of the prevailing currents at the site (Figure 1). These are taken from ABPmer (2015)4.
2 Coggan R., Mitchell A., White J. & Golding N. 2007. Recommended operating guidelines (ROG) for underwater video and photographic imaging techniques. MESH Project Available from: http://www. emodnet-seabedhabitats. eu/pdf/GMHM3_Video_ROG. pdf [Accessed 03 June 2017].
3 Cooper K. M. & Mason C. 2017. Protocol for Sample Collection and Processing Version 5.0. Regional Seabed Monitoring Plan (RSMP).
4 Beatrice Offshore Windfarm: Metocean Criteria for Construction, Decommissioning, Operation and Maintenance / ABP Marine Environmental Research Ltd / February 2015
June 2021 Page 5
Figure 1. Current roses for BOWL outer and inner.
3.2.1 Survey of turbine foundations
Video will be recorded continuously and monitored on-board the vessel, with adjustments made to the ROV system as required to maintain a quality image. In situ assessment of the live footage will be conducted by an experienced marine ecologist to ensure data quality, positioning and where possible to identify and focus on any conspicuous non-native species (NNS) (see Section 3.2.3 below).The following data will be collected at each of the four turbine locations:
• Video footage from sea surface (including the splash zone) to the seabed for the jacket legs of each turbine foundation.
• Stills images will be captured from the 1080p HD video signal at five metre intervals along the turbine foundation and/or at notable changes in species composition. Stills capture will be conducted separately to the video so it does not interfere with the recording of the video stream.
• 2.7k UHD video from an additional GoPro Camera.
3.2.2 Survey of habitat in vicinity of turbine foundations
As indicated above, transects will run in a north-northeast, south-southwest, east-southeast, and west-northwest direction at each turbine location for a distance of approximately 50 m.
June 2021 Page 6
The video will be recorded along the total specified length and direction at each transect, with still images taken at approximately 30 second intervals or when there is a change in habitat type. The video will be monitored on-board the vessel, with adjustments made to the camera system as required to maintain a quality image. In situ assessment of the live footage will be undertaken to ensure data quality, positioning and where possible identify and record any conspicuous NNS (if present).
For the ROV a survey log will be completed daily, detailing each drop of the camera equipment, with the following information recorded per deployment:
• Transect number
• Date
• Start time (24-hour format);
• Water depth;
• Tidal state;
• Sea surface conditions;
• Weather conditions;
• Start and end positions;
• Seabed substrate;
• Any conspicuous fauna;
• Presence/absence of Annex I habitats
3.2.3 Survey of NNS
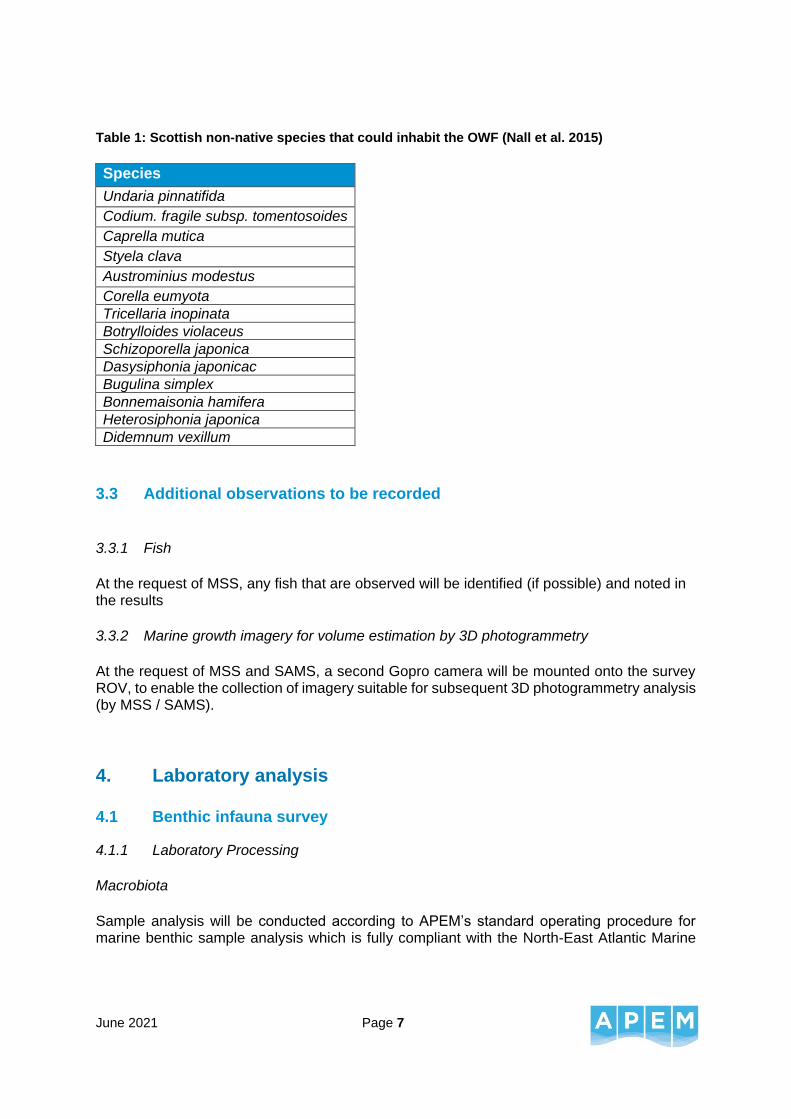
In addition to the standard video sampling protocol for the post-construction monitoring marine growth survey, it was suggested by the MFRAG steering group that an additional sampling approach should be conducted for NNS. As such, additional UHD 2.7k video footage will be collected to supplement the ROV footage. It is anticipated this will allow for easier identification of conspicuous NNS (if present) during the lab-based video analyses. During the survey and the subsequent lab-based video analysis, the onboard ecologist will look for the NNS indicated in Table 1 as well as any other NNS. These NNS have been recorded in Scottish waters and are considered to be potentially present at the OWF site (from Nall 20155). Note: this list is not considered exhaustive, and will be kept under review.
5 Nall, C.R., Guerin, A.J. and Cook, E.J., 2015. Rapid assessment of marine non-native species in northern Scotland and a synthesis of existing Scottish records. Aquatic Invasions, 10(1), pp.107-121.
June 2021 Page 7
Table 1: Scottish non-native species that could inhabit the OWF (Nall et al. 2015)
Species
Undaria pinnatifida
Codium. fragile subsp. tomentosoides
Caprella mutica
Styela clava
Austrominius modestus
Corella eumyota
Tricellaria inopinata
Botrylloides violaceus
Schizoporella japonica
Dasysiphonia japonicac
Bugulina simplex
Bonnemaisonia hamifera
Heterosiphonia japonica
Didemnum vexillum
3.3 Additional observations to be recorded
3.3.1 Fish
At the request of MSS, any fish that are observed will be identified (if possible) and noted in the results
3.3.2 Marine growth imagery for volume estimation by 3D photogrammetry
At the request of MSS and SAMS, a second Gopro camera will be mounted onto the survey ROV, to enable the collection of imagery suitable for subsequent 3D photogrammetry analysis (by MSS / SAMS).
4. Laboratory analysis
4.1 Benthic infauna survey
4.1.1 Laboratory Processing
Macrobiota
Sample analysis will be conducted according to APEM’s standard operating procedure for marine benthic sample analysis which is fully compliant with the North-East Atlantic Marine
June 2021 Page 8
Biological Analytical Quality Control (NMBAQC) Scheme’s Processing Requirement Protocol (PRP), (Worsfold et al. 20106).
To standardise the sizes of organisms recorded, and to separate preservative from the biota, all samples will be washed over a 1 mm sieve in a fume cupboard. All biota retained in the sieve will then be extracted, identified and enumerated, where applicable.
Taxa will be identified to the lowest practicable taxonomic level (usually species), using appropriate taxonomic literature. For certain taxonomic groups (e.g. nemerteans and nematodes), higher taxonomic levels will be used due to the widely acknowledged lack of appropriate identification tools for these groups. The NMBAQC Scheme’s Taxonomic Discrimination Protocol (TDP) (Worsfold et al. 2010), which gives guidance on the most appropriate level to which different marine taxa should be identified, will be adhered to for the laboratory analysis. Where required, specimens will also be compared with material maintained within the laboratory reference collection. Nomenclature will follow the World Register of Marine Species (WoRMS; WoRMS Editorial Board 2017), except where more recent published literature that had not yet been incorporated into the WoRMS list is known to exist.
All samples will be subject to internal quality assurance procedures and following analysis 10% of samples will be subject to formal Analytical Quality Control (AQC). For archiving purposes, all samples will be stored in 70% industrial denatured alcohol (IDA) solution. At least one example of each taxon recorded from the surveys will be set aside for inclusion in APEM’s in-house reference collection. This collection acts as a permanent record of the biota recorded.
Biomass Estimations
The estimation of biomass will be undertaken according to APEM’s standard operating procedure and the NMBAQC Scheme guidance and TDP (Worsfold & Hall 20107).
A non-destructive biomass procedure will be used that is fully compliant with the methods outlined in the Clean Seas Environmental Monitoring Programme (CSEMP) Green Book (CSEMP, 2012). Animals will be blotted dry before transfer to a tared analytical balance. Biomass values will be recorded as blotted wet-weight, +/- 0.0001g. Taxa weighing less than 0.0001g will be given a nominal weight of 0.0001g. Barnacles, ascidians, cnidarians and non-countable taxa will not be weighed.
Faunal biomass analysis will be undertaken at recorded taxon level and if a specimen is a juvenile it will be indicated. Biomass (g per m2) will then be calculated on a per station basis.
6 Worsfold T. M., Hall D. J. & O'Reilly M. (Ed.) 2010. Guidelines for processing marine macrobenthic invertebrate samples: a Processing Requirements Protocol: Version 1.0, June 2010. Unicomarine Report NMBAQCMbPRP to the NMBAQC Committee. 33pp. Available online.
7 Worsfold T. M & Hall D. J. 2010. National Marine Biological Analytical Quality Control Scheme: Guidelines for processing marine macrobenthic invertebrate samples: a Processing Requirements Protocol, Version 1.0, June 2010. Edited by Myles O’Reilly. National Marine Biological AQC Coordinating Committee.
June 2021 Page 9
To allow direct comparison with values in the 2010 site characterisation report (CMACS 20118), biomass values for each taxon will be converted to Ash Free Dry Weight (AFDW) using conversion factors based on major taxonomic groups (Polychaeta, Oligochaeta, Crustacea, Mollusca, Echinodermata and ’Others’) used in (CMACS 2011) and (BOWL 2015)9 which are adapted from Ricciardi & Bourget (1998)10.
Particle Size Analysis
Sub-sampling and PSA will be performed in accordance with NMBAQC best practice guidance (Mason 2016), with the modification that the wet separation will be performed at 2 mm rather than 1 mm, to determine the ‘gravel’ to ‘sand and mud’ proportions by weight. A combination of dry sieving and laser diffraction will be used depending upon the characteristics of the sediment.
4.2 Underwater video survey
4.2.1 Laboratory analysis of video and stills
Detailed laboratory analysis of digital stills and video footage will be conducted utilising supplementary notes recorded in the field, positional data, captured images and videos. Still images and video taken along each transect will be analysed by viewing in real-time or slower at 1:1 speed, with key habitat changes and species recorded utilising overlayed positional data to georeference the data. For the ROV transects the location of any species or habitat changes will be indicated in relation to changes in depth.
All taxa will be identified to the lowest possible taxonomic level using relevant taxonomic keys and photographic guides. Taxa will be counted semi-quantitatively using the SACFOR scale of abundance (Hiscock, 199611): Super-abundant (S), Abundant (A), Common (C), Frequent (F), Occasional (O), Rare (R) and Present (P). The abundance ratings for each taxon will then be assigned for each transect and each 5 m depth band along a jacket leg.
The taxonomic abundance data and substrate information for the ROV transect along the seabed will be used to assign a EUNIS habitat type (EEA 202012).
On the turbine foundations the taxonomic abundance data and substrate information for each image and video will be noted using 5 m depth bands to subdivide each jacket leg. As no
8 CMACS 2011. Beatrice Offshore Wind farm: Benthic Survey 2010 Technical Report. Ref: J3151 Beatrice Benthic Technical Report.
9 BOWL. 2015. Beatrice Offshore Wind Farm OWF Pre-construction Benthic Survey Report – APEM Ltd. report for BOWL Project Ref: LF000005-REP-585
10 Ricciardi A. & Bourget E. 1998. Weight-to-weight conversion factors for marine benthic macroinvertebrates. Marine Ecology Progress Series,163: 245-251.
11 Hiscock, K (ed.) (1996). Marine Nature Conservation Review: Rationale and methods. Coasts and seas of the United Kingdom. MNCR series. Joint Nature Conservation Committee, Peterborough.
12 EEA (European Environment Agency). 2020. EUNIS habitat descriptions. Available online [accessed 08 December 2020].
June 2021 Page 10
EUNIS habitats are currently designated for artificial substrates SACFOR data will be used to define vertical zonation where possible.
5. Data analysis and reporting
5.1 Benthic infauna survey
Following invertebrate identification, macrobiota will be analysed using a range of analytical techniques including:
• Univariate analysis;
• Multivariate analysis;
• Cluster analysis;
• Ordination analysis using non-Metric Multidimensional Scaling;
• SIMPER analysis; and
• RELATE/BIO-ENV
Appropriate statistical analyses will be applied to compare the results of the pre-construction and post-construction surveys for the biological sample data and the sediment composition data determined via PSA.
5.1 Underwater video survey
Taxa colonising the turbine foundations will be identified to the lowest possible taxonomic level and abundance data will be recorded using the semi-quantitative SACFOR scale as indicated above.
Based on the video footage, epibiota in the vicinity of the turbine foundations will be recorded and EUNIS habitat types will be allocated to the substrate on the seabed and mapped in a GIS.
Any NNS observed will be noted within a specific section of the report.
May 2021 Page 11
Appendix A – sampling and survey location maps
Figure A1: Map indicating the location of the 12 benthic grab stations (selected to cover near-field effects and far-field effects) in relation to the location of different habitat types. Figure reproduced from ‘Beatrice Offshore Windfarm Benthic Post-Construction Monitoring Strategy / RPS Energy / December 2015’
June 2021 Page 12
Figure A2. Map indicating the locations of the four turbine foundations (jackets) selected for survey
June 2021 Page 13
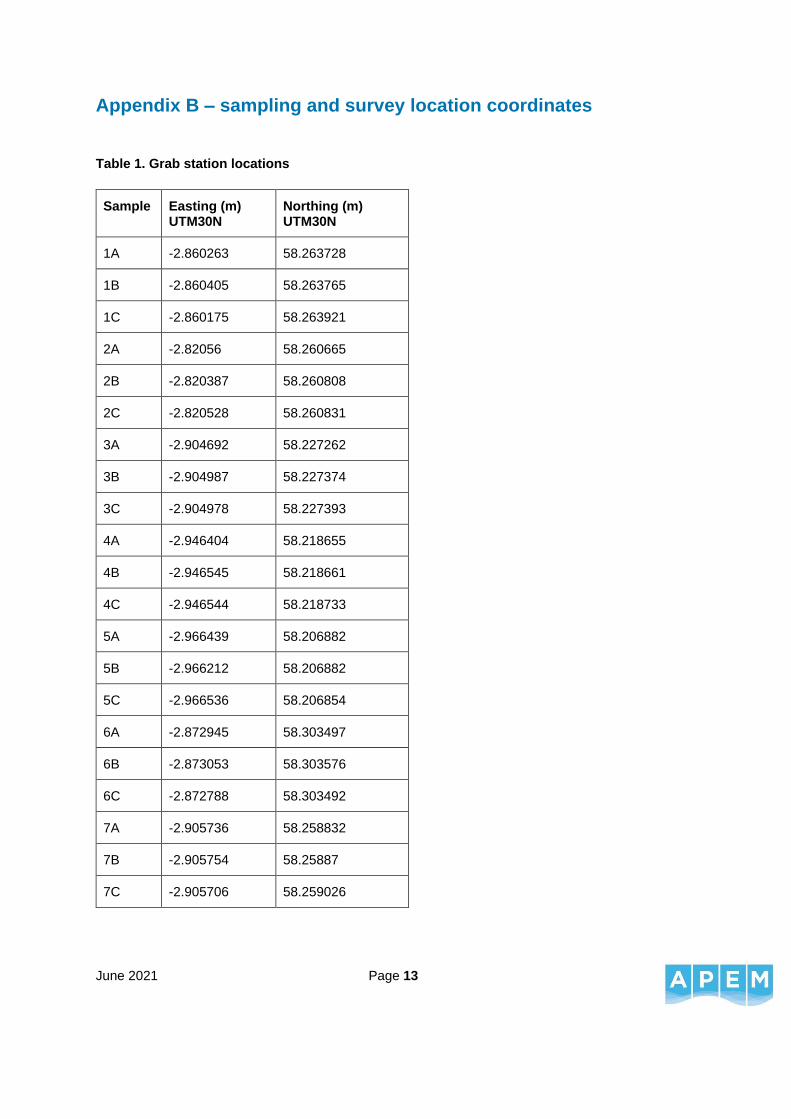
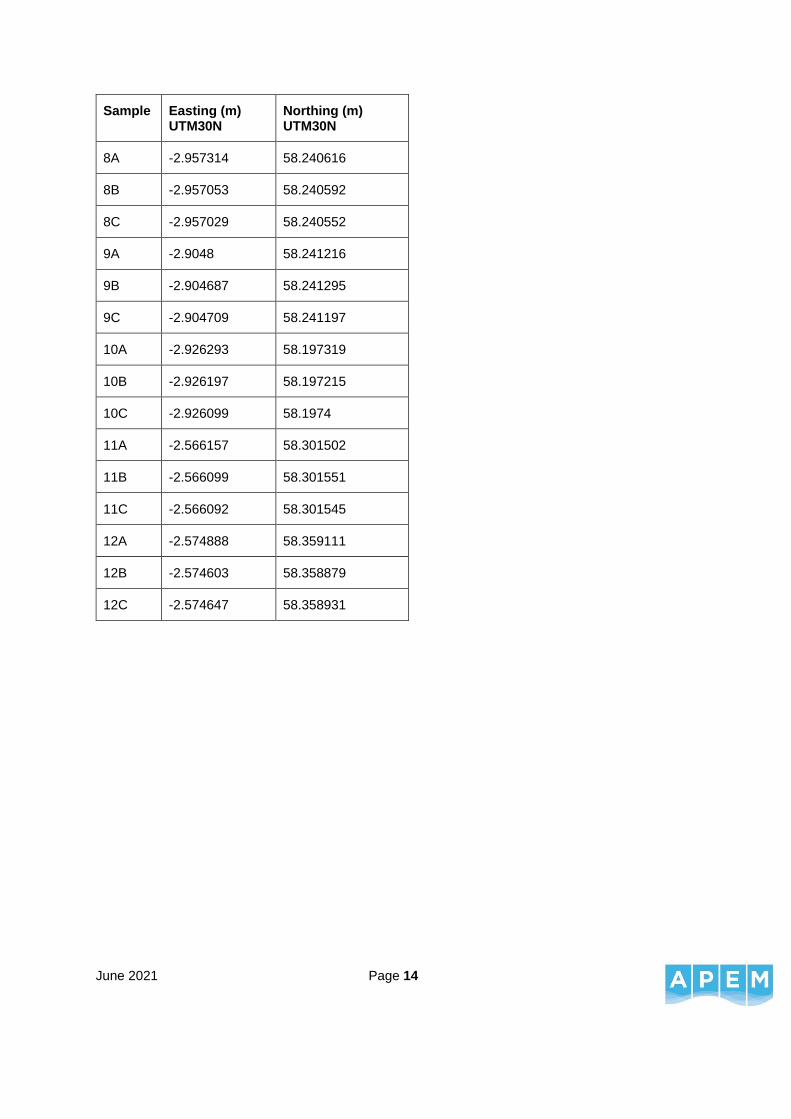
Appendix B – sampling and survey location coordinates
Table 1. Grab station locations
Sample Easting (m) UTM30N
Northing (m) UTM30N
1A -2.860263 58.263728
1B -2.860405 58.263765
1C -2.860175 58.263921
2A -2.82056 58.260665
2B -2.820387 58.260808
2C -2.820528 58.260831
3A -2.904692 58.227262
3B -2.904987 58.227374
3C -2.904978 58.227393
4A -2.946404 58.218655
4B -2.946545 58.218661
4C -2.946544 58.218733
5A -2.966439 58.206882
5B -2.966212 58.206882
5C -2.966536 58.206854
6A -2.872945 58.303497
6B -2.873053 58.303576
6C -2.872788 58.303492
7A -2.905736 58.258832
7B -2.905754 58.25887
7C -2.905706 58.259026
June 2021 Page 14
Sample Easting (m) UTM30N
Northing (m) UTM30N
8A -2.957314 58.240616
8B -2.957053 58.240592
8C -2.957029 58.240552
9A -2.9048 58.241216
9B -2.904687 58.241295
9C -2.904709 58.241197
10A -2.926293 58.197319
10B -2.926197 58.197215
10C -2.926099 58.1974
11A -2.566157 58.301502
11B -2.566099 58.301551
11C -2.566092 58.301545
12A -2.574888 58.359111
12B -2.574603 58.358879
12C -2.574647 58.358931