portland harbor: industrial land supply analysis
TRANSCRIPT
222 SW Columbia Street Suite 1600
Portland, Oregon 97201 503-222-6060
www.econw.com
9
Portland Harbor: Industrial Land Supply Analysis Prepared for the City of Portland: Bureau of Planning and Sustainability
Prepared by ECONorthwest
in association with:
Maul Foster & Alongi, Inc. and Bonnie Gee Yosick llc
May 2012
PSC Recommended Draft - June 2012 EOA Section 1 Appendix C

PSC Recommended Draft - June 2012 EOA Section 1 Appendix C
DRAFT Portland Harbor, Industrial Land Supply ECONorthwest February 2012 Page i
Preface This report addresses four questions about land in the Portland Harbor
area. It supports the City of Portland’s efforts to update its Economic Opportunities Analysis, plan for the land use in the Harbor area, and address issues related to the development and conservation of West Hayden Island.
ECONorthwest was the lead consultant to the City on this evaluation, assisted by subconsultants Maul Foster & Alongi, and Bonnie Gee Yosick LLC. This consultant team had substantial and appreciated assistance from many sources, but especially: City of Portland Bureau of Planning and Sustainability, Port of Portland, Port of Vancouver, Working Waterfront Coalition, and BST Associates.
Despite the assistance, ECONorthwest and its subcontractors alone are responsible for the report's contents. The report has been reviewed by City staff and an advisory committee, but the views expressed are those of the consultants and may not be shared by others who contributed to or reviewed this report.
Throughout the report ECONorthwest has identified sources of information and assumptions used in the analysis. Within the limitations imposed by uncertainty and the project budget, staff at ECONorthwest and the Bureau of Planning and Sustainability at the City of Portland have made every effort to check the reasonableness of the data, methods, and assumptions and to test the sensitivity of the results to changes in key assumptions. Any forecast of the future is uncertain. The fact that ECONorthwest and its team members evaluate the assumptions in this report as reasonable does not guarantee that those assumptions will prevail.
PSC Recommended Draft - June 2012 EOA Section 1 Appendix C

PSC Recommended Draft - June 2012 EOA Section 1 Appendix C
DRAFT Portland Harbor, Industrial Land Supply ECONorthwest February 2012 Page iii
Summary This evaluation starts from the assumption, embedded in the economic
development policies of all local governments in the region, that the retention, expansion, and relocation to the region of industrial sectors is something that the region desires. It addresses the capacity of industrial land in the Portland Harbor area to accommodate future development, both for new public marine terminals and private marine-dependent businesses. It addresses four questions posed by the City:
1. Are the methods the City used to estimate the location and amount of vacant, partially vacant, and potentially buildable industrial land in the Portland Harbor area likely to yield reasonable estimates?
2. Given the estimated land supply in the Portland Harbor area, how suitable for a public marine terminal are the few sites identified by the City as having the best potential to accommodate such a terminal?
3. If those sites do not develop as marine terminals (for whatever reasons) to what extent can the Port of Vancouver play a role in accommodating forecasted cargo demand in the Portland region?
4. Finally, if existing vacant land in the harbor area and in Vancouver is estimated to be insufficient to accommodate forecasted or desired transshipment or industrial activity, what is the potential for more efficient use of industrial land in the Portland Harbor study area? That question implies answering the question: What does more efficient use of industrial land mean, and how would it be measured?
SUPPLY OF VACANT OR UNDERUTILIZED INDUSTRIAL LAND The methods used for the City’s evaluation of the supply of vacant land
in the Harbor Area are sound, state of the practice, and produce results that have been confirmed by independent methods. When looking for where in the Harbor Area is vacant land that could potentially be assembled into a 100-acre (or, at a minimum, a 50-acre) site with waterfront access? the City correctly identified the two sites with greatest potential: Atofina and Time Oil.
PSC Recommended Draft - June 2012 EOA Section 1 Appendix C
Page iv May 2012 ECONorthwest Portland Harbor, Industrial Land Supply
POTENTIAL FOR MARINE TERMINAL SITES Public marine terminals have specific land use requirements that are
difficult to find. Ideally, sites must be large and flat, inside of an industrial zone, have significant shoreline on a navigable river, be served by both rail and truck, and free of contamination, wetlands, or other environmental constraints. Excluding West Hayden Island, there are no sites in the Portland Harbor that meet these ideal requirements, though there are a few sites that come close. This should not imply that West Hayden Island meets all the ideal site requirements (in fact West Hayden Island lacks sufficient truck access, and is constrained by wetlands), but is simply stating that the West Hayden Island site is outside the boundary of our study area. The questions are: how close do they come, and is there a way to cost-effectively develop these sites as productive public marine terminals?
The City of Portland identified the two sites in the Portland Harbor that are most likely to be suitable for development of a new public marine terminal: the Atofina site, and the Time Oil site. Of these two sites, development is technically possible on either, but there are major hurdles that would add significant costs. Both sites have some level of contamination, both sites would require negotiation and property acquisition from numerous property owners, and both sites are smaller than desirable, which precludes the possibility of an onsite rail loop. Ultimately, issues related to the Superfund cleanup of the Willamette River make all sites in the Portland Harbor very challenging (if not altogether unfeasible) for development in the near future.
ROLE OF VANCOUVER IN PROVIDING HARBOR-AREA INDUSTRIAL LAND
Recent forecasts suggest that under mid-range assumptions about cargo demand, the Port of Portland’s existing marine terminals will reach the limits of their capacity (for at least some cargo types) in the next several decades. Once these facilities meet their capacity, the Port will need to develop new facilities, or else turn away demand. The Port of Vancouver shares many of the same attributes that make the Port of Portland an attractive place for marine shipping. Thus, the Port of Vancouver is a logical place to site new marine terminals, if sites are unavailable in the 4,000-acre Portland Harbor.
Projecting future land needs to accommodate demand for public marine terminals is difficult, and even the best forecasts suggest a wide-range of potential outcomes. Given mid-range (and presumably most likely) scenario for future demand, the Port of Vancouver may, in theory, have
PSC Recommended Draft - June 2012 EOA Section 1 Appendix C
Portland Harbor, Industrial Land Supply ECONorthwest May 2012 Page v
enough developable land to accommodate regional growth in cargo volumes through 2040. The assumptions in variation of the mid-range forecasts show the Portland-Vancouver Region needing an additional 200 to 600 acres for new terminals by 2040: there is vacant industrial land with water-access that is in that range. In practice, however, competing demands for Port of Vancouver lands, policies and competition among affected jurisdictions, and the potential for higher growth in cargo volumes all make it possible, if not likely, that the land controlled by the Port of Vancouver would not be able to accommodate all of the regional demand for marine cargo. The “high” forecast of cargo demand, for example, is three times the mid-range demand.
From a regional perspective, it makes little difference whether terminal development occurs in Portland or Vancouver. Both cities function as part of the same regional economy, and share the same infrastructure and labor pool. At a local level, however, if demand for public marine terminals is shifted from Portland to Vancouver, the City of Portland would lose some industrial jobs and the income they generate to Vancouver.
POTENTIAL FOR INCREASED EFFICIENCIES IN THE USE OF LAND Typical measures of efficiency of land use include employment, real
market value, and built space. Harbor industrial development tends to have low floor-area ratios (FAR) and a relatively low number of jobs per acre. Thus, typical measures of efficiency would all tend to improve if industrial land were converted to other commercial uses. But industrial lands in general, and harbor lands in the case of this study, are clearly an important piece of the regional economy. Therefore, we suggest two alternative measures of efficiency that are more appropriate for harbor industrial land: value added and tonnage of cargo.
Data from recent years show some measures of economic output have been increasing faster than vacant land is being converted to developed land, and other measures have not. The region should continue to track these measures and adopt policies with the intention of increasing measures of economic output faster than vacant land is converted to developed land. This seems like an objective that could appeal to people with different interests: economic development, environmental amenity, or smart growth.
PSC Recommended Draft - June 2012 EOA Section 1 Appendix C

PSC Recommended Draft - June 2012 EOA Section 1 Appendix C
DRAFT Portland Harbor, Industrial Land Supply ECONorthwest February 2012 Page vii
Table of Contents Preface ...................................................................................................................................... i
Summary .............................................................................................................................. iii Supply of vacant or underutilized industrial land ............................................. iii Potential for marine terminal sites ......................................................................... iv Role of Vancouver in providing harbor-area industrial land ......................... iv Potential for increased efficiencies in the use of land ........................................ v
Table of Contents .............................................................................................................. vii
Chapter 1 Introduction .................................................................................................. 1 1.1 Background and purpose .................................................................................. 1 1.2 Organization of this report ............................................................................... 5
Chapter 2 Framework and Methods .......................................................................... 6 2.1 Framework ............................................................................................................. 6 2.1.1 Why care about industrial land? ........................................................................... 6 2.1.2 Defining industrial land and users ....................................................................... 6 2.1.3 Supply of and demand for industrial lands ....................................................... 7 2.1.4 “Efficient” use of industrial land ............................................................................ 8
2.2 Methods ................................................................................................................... 9 2.2.1 General data sources and techniques .................................................................. 9 2.2.2 Evaluating City methods used to estimate Portland Harbor buildable
land supply ..................................................................................................................... 9 2.2.3 Addressing the potential sites for new marine terminals ....................... 10 2.2.4 Addressing the role of Vancouver in harbor industrial land supply .. 10 2.2.5 Addressing the potential for increased efficiencies ................................... 11
Chapter 3 Analysis ........................................................................................................ 12 3.1 Evaluation of methods used by the city to estimate buildable land 12 3.2 Potential sites for new marine terminals ................................................. 18 3.2.1 Atofina ............................................................................................................................ 20 3.2.2 Time Oil ......................................................................................................................... 23 3.2.3 Implications ................................................................................................................. 26
3.3 Role of Vancouver in harbor industrial land supply ............................. 27 3.3.1 Existing capacity ........................................................................................................ 27 3.3.2 Forecast of future cargo volumes ....................................................................... 28 3.3.3 Capacity shortfall ...................................................................................................... 29 3.3.4 Land need for new port terminals ..................................................................... 31 3.3.5 Port of Vancouver developable land ................................................................. 33 3.3.6 Implications ................................................................................................................. 36
3.4 Potential for increased efficiencies ............................................................ 38 3.4.1 Recent trends in efficiency of Portland Harbor lands ............................... 38 3.4.2 Opportunities for increased efficiencies ......................................................... 42 3.4.3 Implications ................................................................................................................. 44
Chapter 4 Summary of findings ................................................................................ 47
PSC Recommended Draft - June 2012 EOA Section 1 Appendix C

PSC Recommended Draft - June 2012 EOA Section 1 Appendix C
DRAFT Portland Harbor, Industrial Land Supply ECONorthwest February 2012 Page 1
Chapter 1 INTRODUCTION Section 1.1 describes events leading to this study and what the City hopes to
learn from it. The City wants to evaluate the potential for the Portland Harbor to support economic activity. It has four questions about the capacity of land in the Portland Harbor to support future economic activity: (1) about the supply of vacant and underutilized land in the harbor area for marine terminals or water-dependent industrial uses; (2) about the land needs and potential land available for new port terminals; (3) about the role of Vancouver as a regional port; and (4) about potential changes in the use of industrial land (one aspect of which is referred to as “land efficiency”). Section 1.2 describes how the rest of the report is organized.
1.1 BACKGROUND AND PURPOSE The City of Portland (City) is the center of a large regional economy:
there are about one million jobs in the seven-county metropolitan area, and almost 400,000 jobs within the city limits.
Many factors have contributed to the growth of the Portland economy, but one important factor is its ability to transport goods. Portland benefits from accessibility by highways (at the intersection of Interstates 5 and 84), rail (two Class 1 railroads - Union Pacific and BSNF, and short-line railroads), air (Portland International Airport), and sea (the Columbia and Willamette rivers).
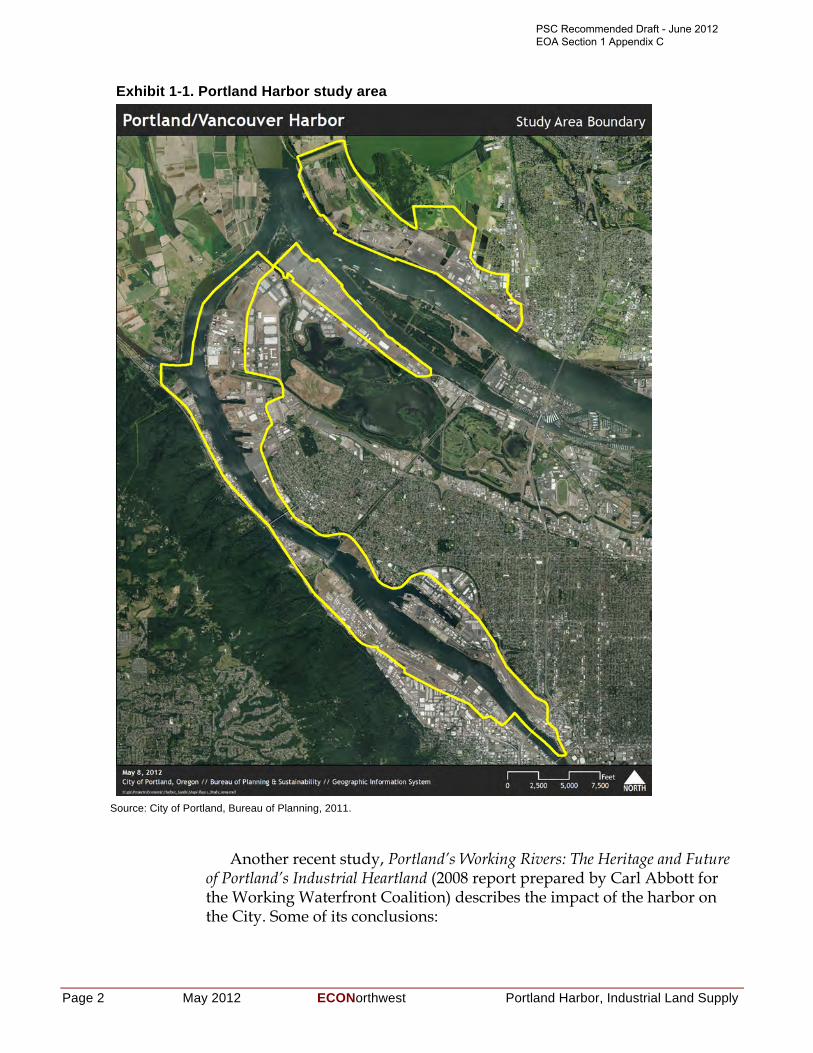
The Portland Harbor is an industrial area located along the Willamette River that relies on the confluence of transportation infrastructure in the City (Exhibit 1.1). It contains about 4,000 acres of land located south of the Columbia River, west of I-5, and on both the east and west shores of the Willamette River. River-related industrial activities operate as a partnership between public marine terminals (owned and operated by the Port of Portland) and private businesses, including many marine-dependent industries. Key industrial sectors in the Portland Harbor include construction, manufacturing, warehousing, and transportation.
Over the past decade several studies of the Portland Harbor have been completed. The 2010 West Hayden Island Economic Foundation Study (prepared by Entrix for the City of Portland) summarized the conclusions of these studies:
“Portland Harbor serves as an economic engine for the metro regional economy… Past studies indicate that cargo and manufacturing activities dependent on waterborne transportation contribute significantly to the metro region’s economy. These studies indicate that marine-related economic activity generates from 20,000 to 100,000 jobs and from $1.4 to 3.4 billion annually in regional income.”
PSC Recommended Draft - June 2012 EOA Section 1 Appendix C
Page 2 May 2012 ECONorthwest Portland Harbor, Industrial Land Supply
Exhibit 1-1. Portland Harbor study area
Source: City of Portland, Bureau of Planning, 2011.
Another recent study, Portland’s Working Rivers: The Heritage and Future of Portland’s Industrial Heartland (2008 report prepared by Carl Abbott for the Working Waterfront Coalition) describes the impact of the harbor on the City. Some of its conclusions:
PSC Recommended Draft - June 2012 EOA Section 1 Appendix C
Portland Harbor, Industrial Land Supply ECONorthwest May 2012 Page 3
• The Portland Harbor is the nexus of a multi-modal system. The Willamette and Columbia rivers serve marine terminals, ocean shipping lines, barge lines, and bulk handling facilities. These waterborne facilities connect to railroads, interstates, commercial and general airports, and pipelines.
• Approximately 90% of harbor sites have access to rail routes, improving efficiency of transporting large loads from sea to land.
• Cargo forecasts by the Port of Portland further highlight the importance of the harbor: the volume of trade through Portland is expected to double by 2035.
In 2004, four river-related districts (Northwest Industrial District, Swan Island / Central Eastside, Rivergate, and Columbia Corridor) had employment about equal to the metropolitan area’s three other industrial districts: the Sunset Corridor and 217 Corridor (where the electronics and computer industry is concentrated), and the Milwaukie/Clackamas Corridor (with a mix of manufacturing and distribution).
The importance of the harbor to the regional economy would be sufficient reason for the City to evaluate the harbor’s needs for continued operation and expansion. But additional issues motivate the current evaluation. First, the City is in the process of concluding an extensive study of the City and regional economy (its Economic Opportunities Analysis, or EOA) as required by state land-use law. Second, the City has been engaged in studies of West Hayden Island, where there is a question about which land should be made available for future port development and which should preserved as natural areas.1 Answering that question depends in part on whether alternative areas in or near the Portland Harbor study area have land that is appropriate and sufficient for the water- and port-related development that is expected or desired.
Thus, though several studies of development issues in the Portland Harbor area have occurred in the last five years, the City wanted an evaluation to (1) synthesize and evaluate the findings of previous studies as they relate to the harbor economy and industrial land uses, and (2) address three specific questions related to the development of industrial land in the Portland Harbor.
To that end, the City asked ECONorthwest (ECO) to re-examine the inventory of existing harbor lands, both in Portland and the broader region (including Vancouver). This report addresses the capacity of industrially-designated land in the harbor area to accommodate future development,
1 A current proposal for West Hayden Island is to devote 300 acres of land for marine terminal development, while setting aside 500 acres for open space.
PSC Recommended Draft - June 2012 EOA Section 1 Appendix C
Page 4 May 2012 ECONorthwest Portland Harbor, Industrial Land Supply
both for new public marine terminals and private marine-dependent businesses. It addresses four questions posed by the City, each new question building from the answer of the question preceding it:
1. Are the methods the City used to estimate the location and amount of vacant, partially vacant, and potentially buildable industrial land in the Portland Harbor area likely to yield reasonable estimates?
2. Given the estimated land supply in the Portland Harbor area, how suitable for a public marine terminal are the few sites identified by the City as having the best potential to accommodate such a terminal?
3. If those sites do not develop as marine terminals (for whatever reasons), to what extent can the Port of Vancouver play a role in accommodating forecasted cargo demand in the Portland region?
4. If existing vacant land in the harbor area and in Vancouver is estimated to be insufficient to accommodate forecasted or desired transshipment or industrial activity, what is the potential for more efficient use of industrial land in the Portland Harbor study area? That question implies answering the question: What does more efficient use of industrial land mean, and how would it be measured?
By answering these questions, this report helps the City move forward in its planning processes. It provides information to help with assumptions that the City’s Economic Opportunities Analysis may be making about industrial land supply and the efficiency (density) at which that land is likely to develop. It helps the City assess the importance of West Hayden Island as a site for future development of new public marine terminals by evaluating the (limited) potential of suitable sites for such development elsewhere in the Portland Harbor.2
2 This report does not, however, include any analysis regarding the applicability of its findings to state, regional or local planning policies: such information will presumably be provided as part of any additional analysis by the City.
PSC Recommended Draft - June 2012 EOA Section 1 Appendix C
Portland Harbor, Industrial Land Supply ECONorthwest May 2012 Page 5
1.2 ORGANIZATION OF THIS REPORT This report has three additional chapters and three appendices:
Chapter 2, Framework and Methods: Summary of economic concepts underlying the analysis, and specific methods used to answer the four questions that are the focus of this report.
Chapter 3, Analysis: Current and likely future conditions for key factors affecting economic activity in the Portland Harbor.
Chapter 4, Summary of Findings: Briefly restates the important conclusions of our analysis.
Appendix A: Research Methods: Framework for understanding and methods for conducting our analysis (more detail than is provided in Chapter 2 of the main report).
Appendix B: Port Terminal Site Evaluation Criteria: Used by Maul Foster & Alongi, Inc. to evaluate the feasibility of potential sites in the Portland Harbor.
Appendix C: Analysis of Harbor Land Capacity and Demand, Portland and Vancouver: Provides greater detail (including a wealth of tables) on the data-driven methods used, in part, to determine the potential for the Port of Vancouver to accommodate forecast demand for the Portland Harbor, if there are insufficient sites in Portland to accommodate all of the expected demand.
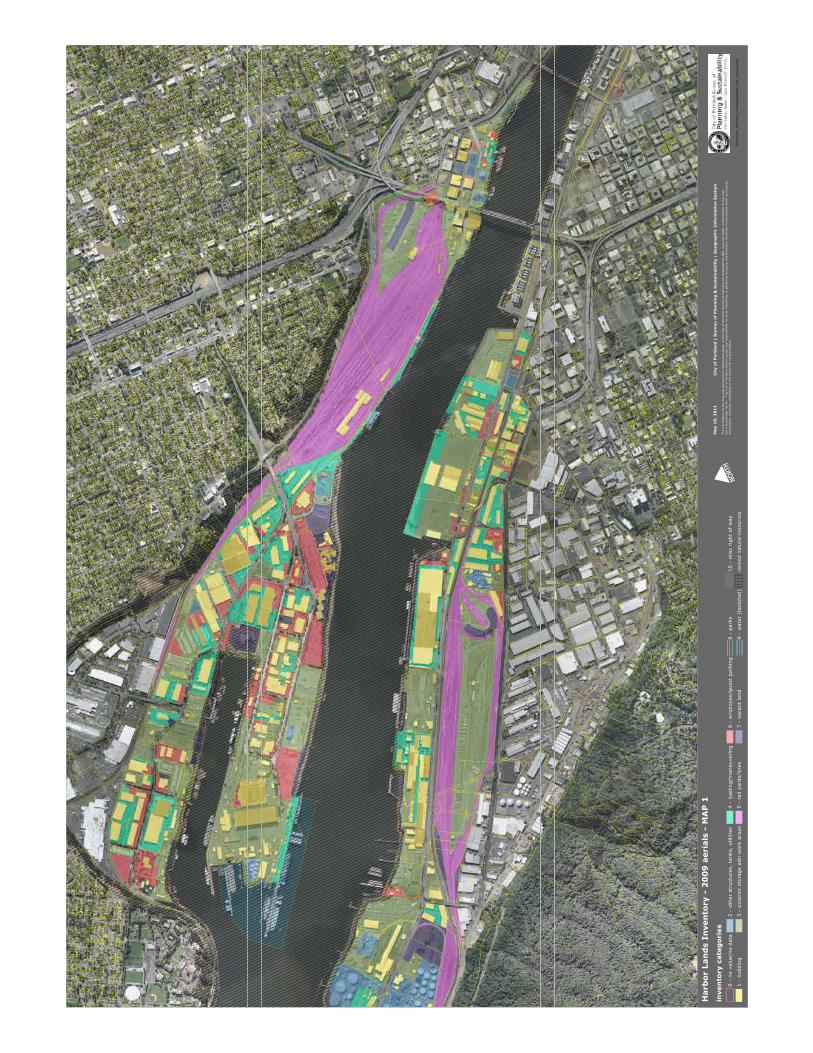
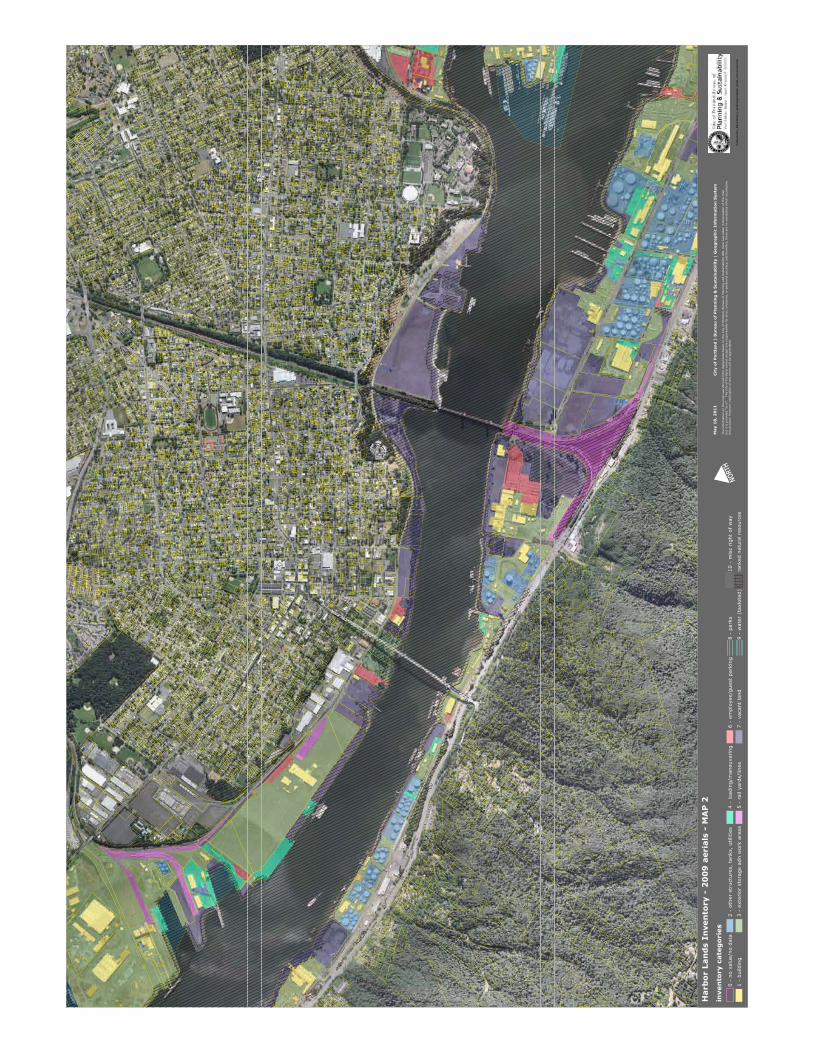
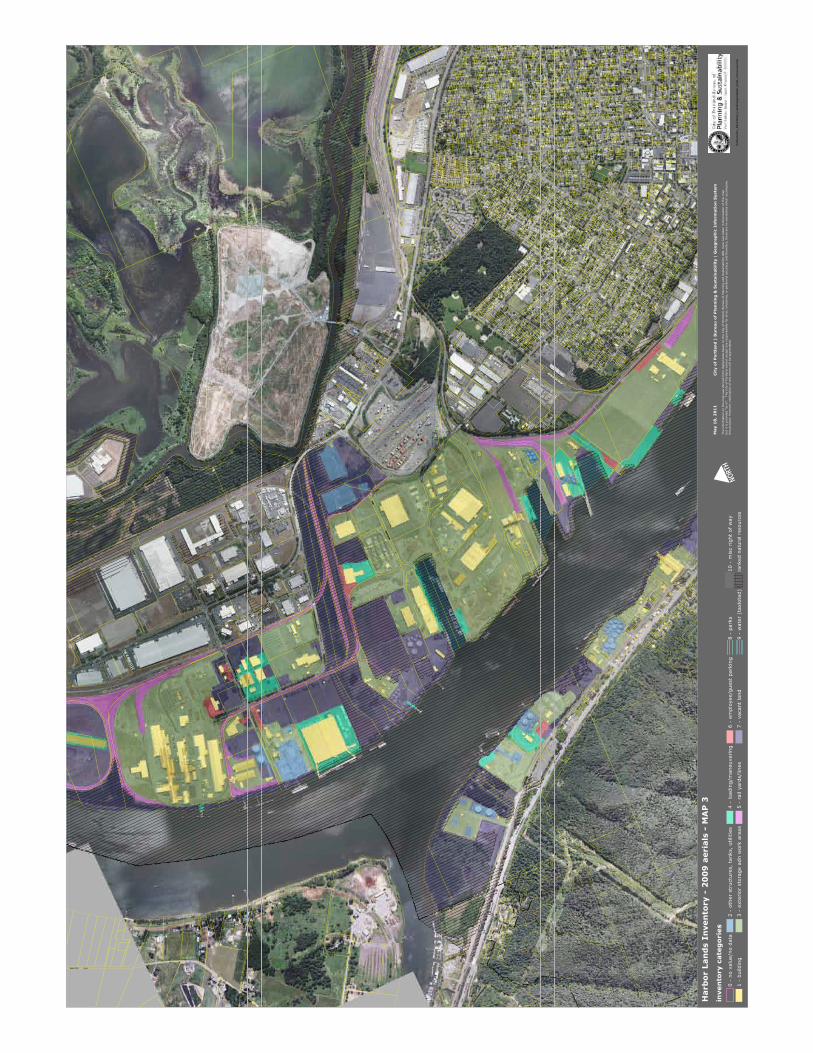
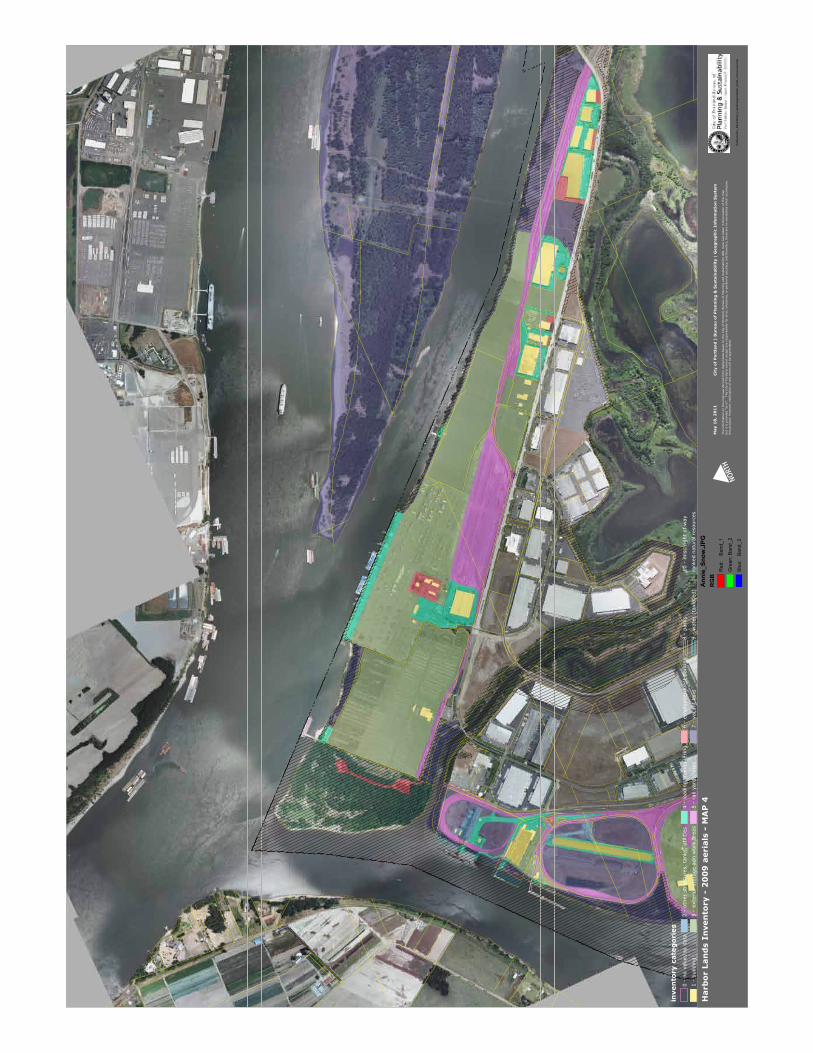
Appendix D: Mapping Analysis: Presents the results of the City’s visual survey of aerial maps of the Portland Harbor to classify the lands in one of several categories.
PSC Recommended Draft - June 2012 EOA Section 1 Appendix C
DRAFT Portland Harbor, Industrial Land Supply ECONorthwest February 2012 Page 6
Chapter 2 FRAMEWORK AND METHODS Section 2.1 discusses a framework for evaluation: concepts that underlie any
evaluation of this type. It discusses (1) the role of industrial activity in the economy, (2) definitions of industrial use and industrial land, (3) factors relating to the supply of and demand for industrial land, and (4) the concept of land efficiency: what is it, why does it matter, and how is it measured. Section 2.2 is more specific about the methods used for the evaluation (review of previous studies, secondary data, case studies, interviews) and how they are used to address this study’s four questions. Appendix A provides a more detailed description of our framework and methods.
2.1 FRAMEWORK 2.1.1 WHY CARE ABOUT INDUSTRIAL LAND?
This study starts from the assumption, embedded in the economic development policies of all local governments in the region, that the retention, expansion, and relocation to the region of industrial sectors is something that the region desires. Industrial activity and employment is mainly classified as export oriented (“traded sector”) and is likely to have jobs at higher than average wages.
2.1.2 DEFINING INDUSTRIAL LAND AND USERS • Industrial land: What is commonly referred to as “industrial” land is
land designated by a local government (in its comprehensive plan, and implemented by its zoning ordinances) to allow (but not necessarily require) industrial uses. In the Portland Harbor, the City does strictly limit non-industrial uses, and allows only river-related and river-dependent industry.
• Harbor land: A smaller subset of industrial land pertinent in this study is “harbor” land. For this study, we use the City’s definition of the “Portland Harbor.” A map of the Portland Harbor is shown previously in Exhibit 1-1.
• Industrial users: A recent analysis of industrial land published by the American Planning Association3 used NAICS codes to define “industrial use” in urban areas, including a “strict” definition of construction, manufacturing, wholesale trade, and transportation and warehousing. This list, however, does not necessarily reflect the types of businesses that require industrial land. For example, many jobs in the construction industry are not physically located at a
3 Howland, Marie. 2011. “Planning for Industry in a Post-Industrial World: Assessing Industrial Lands in a Suburban Economy.” Journal of the American Planning Association. Winter, Vol 77, No 1. pp 39-53.
PSC Recommended Draft - June 2012 EOA Section 1 Appendix C
Portland Harbor, Industrial Land Supply ECONorthwest May 2012 Page 7
central, industrial location, but instead operate on sites throughout the region. Therefore, one should not focus exclusively on a list of NAICS codes to identify the range of businesses that could have demand for industrial land in Portland.
• Public marine terminals: Our analysis treats public marine terminals (i.e., the Port of Portland facilities) differently from other uses of harbor industrial land. These port terminals function as public infrastructure, facilitating economic activity for other industries in the region.
2.1.3 SUPPLY OF AND DEMAND FOR INDUSTRIAL LANDS The total amount of land inside the Portland city limits is essentially
fixed. Thus, for the City of Portland, the question of land supply focuses on how much land is vacant, partially vacant, or underutilized, and how much land is constrained (by environmental contamination, environmental overlays, and other issues).
In general, industrial land must accommodate most job growth in “industrial” sectors. It must also accommodate some job growth in “non-industrial” sectors. In other words, not all jobs in “industrial” sectors use industrially-designated land, and not all industrially-designated land is used by “industrial” sectors.
Analysis of land supply is about estimation, not forecasting. The use of “data layers” from Geographic Information Systems (GIS) is the standard technique for such estimation. Because it is estimation, the uncertainty is not about the future, but about the data and assumptions that are used to describe what is on the ground now. Our evaluation consists of a review of the data and assumptions.
Factors affecting supply and demand are not independent. Businesses and developers choose the land with the best value. Price makes a difference. In the Portland Harbor land may be more expensive (cost per acre) than at the region’s periphery. But land in the Portland Harbor is also close to the downtown, labor markets, port terminals, and interstate highways. If it is only a little more expensive, it may still be a preferred location for growth. If it becomes too expensive, then prospective industrial users may locate elsewhere, on land that provides a better value (for example, because lower land cost and congestion are judged to more than offset the higher costs of being more distant from a preferred location). Businesses that need water access would have an incentive to bid more for land providing that access, and other businesses would find better value in alternative locations.
PSC Recommended Draft - June 2012 EOA Section 1 Appendix C
Page 8 May 2012 ECONorthwest Portland Harbor, Industrial Land Supply
2.1.4 “EFFICIENT” USE OF INDUSTRIAL LAND Efficiency is a measurement of how much output is produced per unit
of input. In this case, the City’s concern is about the amount of economic activity (output) generated per acre of land (input).
Traditional measures of efficiency Typical measures of efficiency of land use include employment, real
market value, and built space. These measures look at the amount of economic activity occurring on a property, but give relatively low marks to industrial development. Compared to an office tower, an acre of industrial development is likely to have much lower assessed value, employment, and gross square footage of built space. Thus, measures of the efficiency of employment land based on any of these measures in the numerator would all tend to improve if industrial land were converted to commercial uses.
But industrial lands (and harbor lands) are clearly important to the regional economy. If every jurisdiction allowed vacant industrial land to convert to commercial uses on the assumption that some other jurisdiction would provide the industrial land, the regional supply of industrial land would get smaller quickly. Land with port access is a particularly important and relatively rare component of all regional industrial land. Marine terminals provide access to other markets, facilitating commerce, and allowing traded-sector businesses to export their goods to other markets.
Alternative measures of the output component of efficiency To evaluate the efficiency of the use of industrial land in the Portland
Harbor, one needs a definition of efficiency that makes sense for industrial land. We suggest two alternative measures of efficiency that are most appropriate for harbor industrial land: value added, and tonnage of cargo.
• Value added: Value added is defined as the value of outputs (per unit or in the aggregate) minus the cost of inputs purchased from other firms used to create output.4 Proponents of the industrial and manufacturing sectors point to its potential for high “value added.” One measure of the efficiency of a fixed supply of industrial harbor land would be the amount of value added generated per acre for businesses located in the harbor.
• Cargo: There is a reasonable argument that much of the industrial land in the Portland Harbor area serves a regional need for
4 In that sense, value added is a measure of a firm’s contribution to GDP. Another way to think about this is that everything that a firm itself puts into the production of a product (primarily the labor of its employees and capital) “add value” to the raw materials and intermediate goods and services it purchases to make its final product.
PSC Recommended Draft - June 2012 EOA Section 1 Appendix C
Portland Harbor, Industrial Land Supply ECONorthwest May 2012 Page 9
transshipment. Therefore, a regional measure of transshipment activity might be appropriate for measuring the efficiency of such land. Some measure of cargo (e.g., tonnage, volume, value, berth utilization) is an obvious choice. Because data are more readily available for tonnage of cargo, that is an alternate measurement of land-use efficiency in the Portland Harbor that we examine in this report. If the City were interested in tracking these alternative efficiency measures in the future, then tracking multiple measures of cargo (i.e., tonnage and value) would provide a more complete picture of cargo trends.
2.2 METHODS 2.2.1 GENERAL DATA SOURCES AND TECHNIQUES
To conduct our analysis, we used the following data sources:
• Existing studies. Extensive analysis has been conducted regarding the Portland Harbor, industrial land, and port terminals. These efforts result in a library of reports and studies addressing different aspects of the regional economy. Appendix A includes a list of recent (or ongoing) studies that were reviewed in our analysis.
• Secondary data sources. ECO incorporated many secondary data sources into its analysis.5 As with “existing studies,” the objective is to leverage past research efforts to answer the questions posed in this study. Appendix A includes a list of the secondary data sources used in our analysis.
• Interviews: Many people in the Portland area have special knowledge of, and interest in, the Portland Harbor. ECO interviewed individuals from both the public and private sectors, and reviewed notes on past interviews that had been conducted for recent related studies.
2.2.2 EVALUATING CITY METHODS USED TO ESTIMATE PORTLAND HARBOR BUILDABLE LAND SUPPLY
ECONorthwest used the following methods to address this question:
5 Secondary data sources are ones collected and readily available by someone other than the user (in this case ECONorthwest). Typical secondary sources are government agencies (e.g., U.S. Census, ODOT, Metro, Port of Portland).
PSC Recommended Draft - June 2012 EOA Section 1 Appendix C
Page 10 May 2012 ECONorthwest Portland Harbor, Industrial Land Supply
• Review of studies summarizing industrial and harbor land supply: Industrial Districts Atlas (2004) and Harbor ReDI Industrial Sites Analysis (2009).
• Review of GIS shape files and cross-referencing to staff aerial analysis of harbor lands and Google Earth aerial photos (August 2011).
• Discussion of methods and BPS staff, and comparison to standard methods for developing land inventories and identifying buildable land.
2.2.3 ADDRESSING THE POTENTIAL SITES FOR NEW MARINE TERMINALS
To determine which sites might best accommodate a public marine terminal, we began by identifying the technical site requirements for a marine terminal. ECO interviewed representatives of the Port of Portland to identify their ideal site requirements, as well as which of these requirements could be reduced while still accommodating a working port facility. Members of the ECONorthwest team with experience running west coast ports looked for creative ways to adjust these site requirements to create a working terminal on smaller or otherwise constrained sites.
BPS staff identified sites that could potentially meet these criteria, based upon an aerial analysis of existing development in the Portland and Vancouver harbors.6 ECO, reviewed the sites identified by the City of Portland, and toured the sites, conducting a visual inspection, documenting conditions affecting the suitability of each site for the proposed development.
2.2.4 ADDRESSING THE ROLE OF VANCOUVER IN HARBOR INDUSTRIAL LAND SUPPLY
We began by attempting a data-driven analysis. In principle, if we knew the capacity of existing marine terminals in Portland and Vancouver, and subtracted the forecast future demand for these areas, then we could identify the amount of demand that could not be accommodated by existing facilities. This demand (in tons of cargo) could then be translated into the acres of land necessary for new terminals to accommodate this growth. Comparing the required acres to support new terminals with the available land supply in the Portland Harbor and in Vancouver, we could identify how much of Portland’s demand might need to be accommodated
6 Aerial photos were taken in 2010 and 2011.
PSC Recommended Draft - June 2012 EOA Section 1 Appendix C
Portland Harbor, Industrial Land Supply ECONorthwest May 2012 Page 11
in Vancouver, and whether or not Vancouver had sufficient land to accommodate it.
This analysis established a high and low boundary for the potential land need. We also defined a “most-likely” scenario that falls between the two extremes. In order to give these numbers more context, and to help us arrive at the most-likely scenario, we conducted numerous interviews with representatives of the ports of Portland and Vancouver.
2.2.5 ADDRESSING THE POTENTIAL FOR INCREASED EFFICIENCIES
The City is interested in knowing if industrial land in the Portland Harbor can be used more efficiently in the future. To answer, we looked at recent economic trends in the Portland Harbor and in the City of Portland as a whole for changes in land-use efficiency for industrial users. For this analysis, we considered several measures of output in an efficiency measure: employment, real market value, value added, and tonnage.
We began by identifying all parcels in the Portland Harbor using GIS. We examined data from two different years: 2002 (one of the earliest years that data are available using North American Industry Classification System codes), and 2008 (the most recent year Quarterly Census of Earnings and Wages data are available). Comparing data from the two years we calculated the change in developed acreage in the Harbor, the corresponding change in real market value, and the net change in employment.7
We also collected data from different sources for two alternative measures of output (for the denominator): value added and cargo (volume, tonnage, and value). Unlike employment and real market value, data for value added and cargo tonnage is not tracked at a parcel-specific level. Instead, data is available at the regional, City, zip code or Census tract level. For our analysis, we used Port of Portland data on historical levels of cargo tonnage in the Portland Harbor, and the IMPLAN economic model for the zip codes that most closely align with the boundaries of the Portland Harbor for value added. We used the same years (2002 and 2008) as were used for other measures of efficiency.
7 The time period used in this analysis, 2002 to 2008, does have limitations. Only having data for two years, doesn’t allow for a detailed view of trends during the interim years. Moreover, a six-year period is relatively short, and may not be indicative of long-term trends. Nonetheless, these years allowed us to make the most efficient use of available data for our analysis. Moreover, the analysis focused on comparing how these different measures of efficiency changed relative to each other over the same period of time, and not on establishing long-term trends for each measure.
PSC Recommended Draft - June 2012 EOA Section 1 Appendix C
DRAFT Portland Harbor, Industrial Land Supply ECONorthwest February 2012 Page 12
Chapter 3 ANALYSIS Section 3.1 addresses whether or not the methods used by the City to
estimate the location of buildable land in the Portland Harbor area yields reasonable estimates: it concludes that they are. Section 3.2 addresses the potential for land in Portland Harbor (not including West Hayden Island) to accommodate a new Port terminal. It finds that the two areas that might have enough vacant land to be assembled into a development site of sufficient size are relatively constrained: they could, theoretically, accommodate small terminals of various types, but some of the costs of development would be high relative to alternative sites. Section 3.3 addresses the potential for the Port of Vancouver to accommodate regional demand for expanded Port facilities. It concludes that under the most-likely scenario, the Port of Vancouver has about the right amount of land to accommodate the bulk of the region’s forecast growth in marine cargo through 2040, but that alternative and reasonable assumptions lead to the conclusion that more land than what the Port of Vancouver now controls will be needed. Section 3.4 addresses the potential for increased efficiency for the use of industrial land in the Portland Harbor. It concludes that value added and tonnage of cargo per acre are more appropriate than traditional measures of efficiency for harbor industrial lands, and that recent historical trends demonstrate the Portland Harbor has become more efficient by most efficiency measures.
3.1 EVALUATION OF METHODS USED BY THE CITY TO ESTIMATE BUILDABLE LAND
The question is whether the methods used by BPS to identify vacant and buildable land are likely to be accurate. Will they systematically over or under estimate the land supply? In particular, are they likely to miss areas of vacant, buildable land that are big enough for a marine terminal (sites of at least 50 acres of contiguous vacant of underutilized land that has river access and could be serviced)?
To begin to answer these questions, we looked at recent studies that sought to determine the supply of buildable land in the Portland Harbor. Exhibit 3-1 summarizes the findings of the City of Portland Economic Opportunities Analysis (EOA), including the first draft (Hovee, 2009), and final report (Hovee, 2012), as well as the West Hayden Island Economic Foundation Study (Entrix, 2011), and the City of Portland Bureau of Planning and Sustainability’s internal effort to quantify buildable lands, described in Exhibit 3-2 as “BPS Aerial Survey.”
PSC Recommended Draft - June 2012 EOA Section 1 Appendix C
Portland Harbor, Industrial Land Supply ECONorthwest May 2012 Page 13
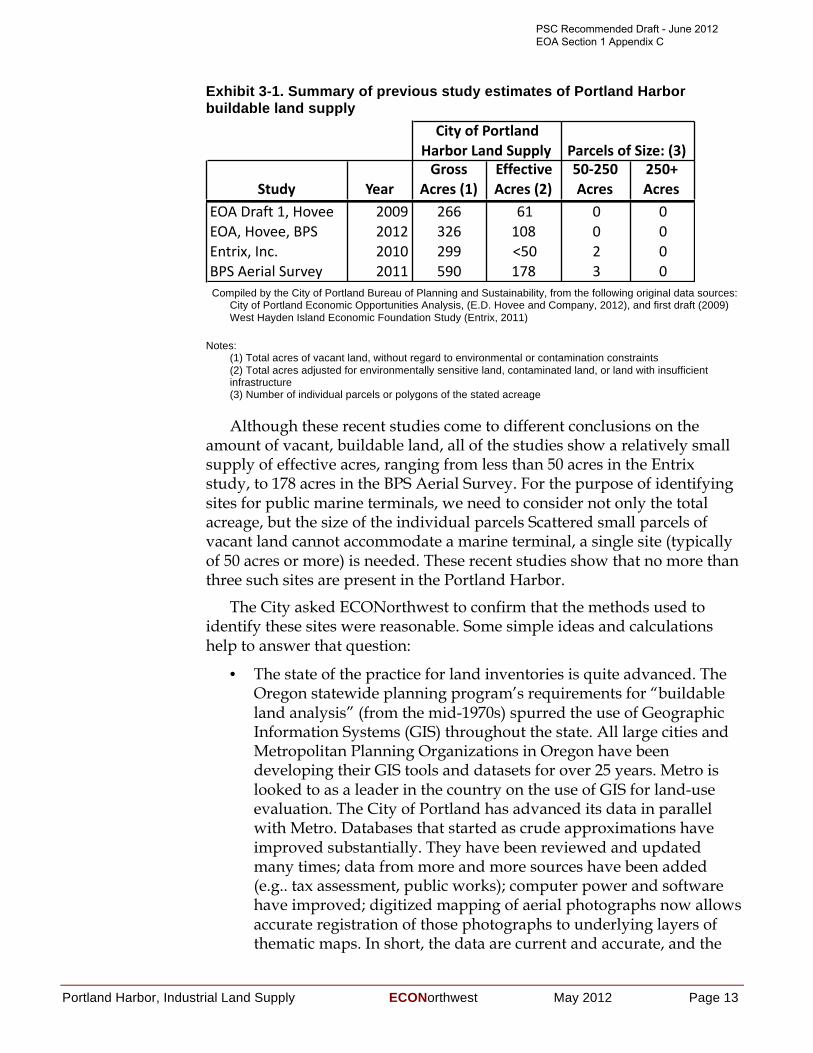
Exhibit 3-1. Summary of previous study estimates of Portland Harbor buildable land supply
Compiled by the City of Portland Bureau of Planning and Sustainability, from the following original data sources:
City of Portland Economic Opportunities Analysis, (E.D. Hovee and Company, 2012), and first draft (2009) West Hayden Island Economic Foundation Study (Entrix, 2011)
Notes: (1) Total acres of vacant land, without regard to environmental or contamination constraints (2) Total acres adjusted for environmentally sensitive land, contaminated land, or land with insufficient infrastructure (3) Number of individual parcels or polygons of the stated acreage
Although these recent studies come to different conclusions on the amount of vacant, buildable land, all of the studies show a relatively small supply of effective acres, ranging from less than 50 acres in the Entrix study, to 178 acres in the BPS Aerial Survey. For the purpose of identifying sites for public marine terminals, we need to consider not only the total acreage, but the size of the individual parcels Scattered small parcels of vacant land cannot accommodate a marine terminal, a single site (typically of 50 acres or more) is needed. These recent studies show that no more than three such sites are present in the Portland Harbor.
The City asked ECONorthwest to confirm that the methods used to identify these sites were reasonable. Some simple ideas and calculations help to answer that question:
• The state of the practice for land inventories is quite advanced. The Oregon statewide planning program’s requirements for “buildable land analysis” (from the mid-1970s) spurred the use of Geographic Information Systems (GIS) throughout the state. All large cities and Metropolitan Planning Organizations in Oregon have been developing their GIS tools and datasets for over 25 years. Metro is looked to as a leader in the country on the use of GIS for land-use evaluation. The City of Portland has advanced its data in parallel with Metro. Databases that started as crude approximations have improved substantially. They have been reviewed and updated many times; data from more and more sources have been added (e.g.. tax assessment, public works); computer power and software have improved; digitized mapping of aerial photographs now allows accurate registration of those photographs to underlying layers of thematic maps. In short, the data are current and accurate, and the
Study YearGross-
Acres-(1)Effective-Acres-(2)
50:250-Acres
250+-Acres
EOA$Draft$1,$Hovee 2009 266 61 0 0EOA,$Hovee,$BPS 2012 326 108 0 0Entrix,$Inc. 2010 299 <50 2 0BPS$Aerial$Survey 2011 590 178 3 0
City-of-Portland-Harbor-Land-Supply Parcels-of-Size:-(3)
PSC Recommended Draft - June 2012 EOA Section 1 Appendix C
Page 14 May 2012 ECONorthwest Portland Harbor, Industrial Land Supply
ability to manipulate and summarize them is substantial, fast, and technologically reliable.
• The Portland Harbor area is not big by regional standards. The detailed BPS GIS data put it at just over 4,000 acres. As a back-of-the-envelop corroboration using different datasets and tools, ECO used Google-Earth to draw the approximate boundaries of the study area (Exhibit 1-1 above) and calculate areas: the result was 4,100 acres, the equivalent of a square 2.5 miles on a side. Just inspecting aerial photographs would allow one to find large, undeveloped acreages.
• The City has conducted three extensive studies of industrial and harbor land that resulted in detailed mapping: Industrial Districts Atlas (2004), Harbor ReDI Industrial Sites Analysis (2009), and the GIS-based inventory (2011). The 2011 inventory maps and data table are included as an Appendix to this report.
• ECO has worked on a dozen buildable land evaluations, and has written many reports on the steps for working from “all land” to “vacant, buildable land.” ECO’s conversations with BPS staff led to the conclusion that staff had used state-of-the-practice techniques. In summary, (1) from “all land” the land not in parcels is removed (e.g., water bodies, street and other rights of way); (2) of the land in parcels, the land that is developed and judged unlikely to redevelop easily (usually based on the value of improvements) is removed; (3) from the undeveloped or under-developed land, the land with physical or policy constraints is removed (e.g., wetlands, in flood ways, steep slopes).
All of the previous points strongly suggest that the information about the supply of developable industrial land in the Portland Harbor area that BPS has generated is very reliable. The buildable land inventory using GIS data that was done for the update of the Economic Opportunity Analysis looks reasonable by the tests we noted.
But despite good intentions and good analysis, there are details in any such analysis that require assumptions, and the assumptions can make a difference to the outcomes. For example:
• Which constraints are absolute, and which are restrictive? Does a slope of more than 10% preclude industrial development? 15%? What if the average slope on a large parcel is 10%, but half of the parcel has slopes less than 5%? What about soil contamination: can the site be remediated, or is the extent of the contamination and legal complexities such that the site is effectively off the market for the foreseeable future?
• When is land “underutilized”? Some vacant areas around buildings may be necessary for vehicle movement, production staging, or
PSC Recommended Draft - June 2012 EOA Section 1 Appendix C
Portland Harbor, Industrial Land Supply ECONorthwest May 2012 Page 15
occasional storage. Are large parking lots “vacant” or are they an essential part of the operations in the buildings adjacent to them? A low value for improvements does not necessarily mean that the owner has any interest in redevelopment.
• Ownership patterns. What might look like relatively large areas of vacant land on an aerial photograph may be in many parcels with many different owners. Land assembly and development may be very difficult. This point is illustrated by the findings in Exhibit 3-1, which show up to three sites with at least 50 acres using the BPS methods (ignoring parcel boundaries and looking at aerial photographs), but no sites of that size when using the methods in the Economic Opportunities Analysis (which did look at parcel boundaries).
For the Harbor Area land evaluation, our evaluation is that the buildable land inventory using GIS data that was done by BPS to update of the Economic Opportunity Analysis has generally made inclusionary rather than exclusionary assumptions: we think that is appropriate. BPS did not, for example, eliminate from its search for large, buildable parcels those with arbitrarily defined thresholds for buildability (e.g., proximity to services or the river, steep slopes, contamination), or those that had a particular ownership. All those parcels are still part of the dataset from which large sites were identified. The result, as Section 3.2 shows, is that the large sites identified have several challenges for development: challenges that were not screened out by earlier assumptions about buildability criteria. In other words, on that score, the methods used by BPS were inclusive, and the result is that there would be less chance of screening out land that might eventually prove to be capable of contributing to a large site for a marine facility.
An assumption that BPS did make, and that all buildable land evaluations that we are familiar with also make, is that developed parcels are, in general, not buildable parcels. They can, of course, become buildable parcels if their buildings are removed. Thus, it is theoretically possible that parcels that look developed (from assessment data, aerial photographs, and field surveys) could eventually be part of a land assembly large enough to accommodate a large marine terminal. The kind of detailed, property-level analysis needed to make judgments about land redevelopment and site assembly is not done as part of a regional or city buildable land evaluation.
But there is still the issue of “underutilized” land. A buildable land dataset, like the one BPS has developed, will be quite good (after field testing—and there has been plenty in the Harbor Area over the last 10 years) at distinguishing developed parcels from vacant parcels in most cases. But it is more difficult to determine when a generally vacant parcel is underutilized, and more difficult still to determine whether parcels that are
PSC Recommended Draft - June 2012 EOA Section 1 Appendix C
Page 16 May 2012 ECONorthwest Portland Harbor, Industrial Land Supply
developed have underutilized remainders that might be considered as vacant and eligible for consolidation into a larger, developable site.
The documentation of the City of Portland’s GIS-based Development Capacity Model8 says that it (1) identifies (and presumably flags as undevelopable) “constrained” properties (i.e., significant environmental or historic resources), and (2) identifies developed parcels “significantly underutilizing their allowed development capacity (using less than 20% of available capacity, not including any development bonuses or incentives)” [that determination can be over-ridden by a judgment by BPS staff that a property is “likely” or “not likely” to redevelop]. The dataset has detailed information on parcel attributes (around 100 attributes per parcel), including building footprint (which allows a calculation of the amount of land not currently developed as a building). It has an algorithm for calculating “site area” by combining the acre of contiguous “underutilized” lots. In short, this is an extensive and well-documented dataset.
The BPS identification of potentially developable sites in the Portland Harbor did not rest entirely on technical analysis using GIS. Additional analysis done as part of the specific to the Harbor Lands Inventory also relied extensively on a review of aerial photographs, with staff performing a visual inspection of all sites along the Willamette River to ensure that any large areas of apparently vacant land had been included in the database of potential terminal sites, and that all of the sites identified by GIS appeared to have the development potential that was suggested by the data. Additionally, BPS staff made reasonable efforts to acquaint themselves with the sites, talking to Port of Portland officials, and visiting the areas, to make sure that the BPS analysis was grounded in a solid understanding of what was actually occurring on key sites in the Portland Harbor. In short, land uses and vacant lands identified in the visual survey were compared with the GIS/BLI data to ensure there were no large information gaps.
As a final check on the site inventory, we relied on our familiarity with the study area, the City documents cited above, and aerial photographs to see whether there were any large areas of vacant or underutilized land besides the two (Atofina and Time Oil sites) that the City identified as the best candidates for a new marine terminal. On the west bank of the Willamette River, we found nothing beyond the Atofina site: the north reach has only a narrow strip of mainly developed land; the south reach has a wider land area but is entirely developed along the waterfront. We found the following candidates on the east bank:
8http://www.portlandonline.com/cgis/metadata/viewer/display.cfm?Meta_layer_id=52965&Db_type=sde&City_Only=False
PSC Recommended Draft - June 2012 EOA Section 1 Appendix C
Portland Harbor, Industrial Land Supply ECONorthwest May 2012 Page 17
• Swan Island Industrial Park. Land at the south edge on the NE bank of the Willamette River could be classified as underutilized: it is an operation for transshipment of aggregate (10 acres). But even if the parking and storage on both sides of the site is counted, the site would still fall way short of the minimum threshold of 50 acres.
• McCormick and Baxter site, SE of BNSF bridge on east side of the Willamette River. Depending on what land is counted (e.g., backing out land for rail right of way, some existing buildings), this site may be 50 – 70 acres in size. This site was excluded from the City’s analysis, primarily because it was recently proposed to be rezoned as EG2 in the River Plan, which (although it allows industrial development) does not allow rail yards, and requires greater setbacks and landscaping than other industrial zones (like IH for heavy industrial). Conversations with BPS staff indicate that the EG2 zone designation is one element of the River Plan that has been challenged, and there is a good chance that a revised River Plan will not propose the EG2 zoning for the site, which would make this site potentially available for marine terminal development.
• “Underutilized” land north of St. John’s Bridge on east side of the Willamette. What may seem underutilized from a high-level aerial photograph is actually space for parking new cars from Asia—this is the Port of Portland’s Terminal 4 operation (about 260 acres total, handling autos, forest products, steel, and dry and liquid bulks). This site is already part of the Portland area’s supply of marine terminals and cannot be counted to add new capacity, unless it were redeveloped. Evaluating that possibility is beyond the scope of our study.
• Sites in the Terminal 5 and Terminal 6 area. There are some sites for infill (e.g., 50 acres off North Lombard in Terminal 6) but there is no water frontage available for a new terminal. Evaluating redevelopment of Port terminals is beyond the scope of our study.
• Kelly Point Park. About 50 acres at the confluence of the Willamette and Columbia Rivers, abutting Port properties of Terminals 5 and 6 is park land that is not available for development.
Of all the sites examined (beyond the Atofina and Time Oil sites already identified by BPS), the only one that met the minimum size requirements (and was not parkland) was the McCormick and Baxter site. The development potential of this site was studied extensively by the City in the past, and the results are described in the McCormick & Baxter Site Reuse Assessment: Final Report (June, 2001). The site could have potential for marine terminal development, but (as detailed in the 2001 site assessment) it is heavily constrained in several areas: relatively shallow water at the shoreline, inability to expand to adjacent parcels due to existing uses (Metro
PSC Recommended Draft - June 2012 EOA Section 1 Appendix C
Page 18 May 2012 ECONorthwest Portland Harbor, Industrial Land Supply
open space and University of Portland campus), isolation from truck routes that require traveling through residential neighborhoods and up a relatively steep bluff, other infrastructure insufficiencies, and significant liens and encumbrances. While the challenges are substantial, they are not necessarily insurmountable, and the other sites identified by BPS face some similar challenges.
Ultimately, the site was excluded from further analysis, because it is less likely that adjacent lands could be assembled into the site, due to the adjoining zoning, and because past brownfield remediation work on the site was carried out in a way that limits future industrial uses, unlike the Atofina and Time Oil sites. Our brief review of the site constraints suggest it is at least as constrained as the Atofina and Time Oil sites, and would not be a better site for marine terminal development, due to the access constraints mentioned above. Thus, our answer to question posed is:
• BPS has used appropriate measures to identify vacant and buildable land.
• The two sites it has identified as meeting the minimum size requirements for a new marine terminal (Atofina and Time Oil) appear to be the two best sites that meet that size requirement with vacant land. Any other location would require assembling and redeveloping properties that now have buildings on them.9
3.2 POTENTIAL SITES FOR NEW MARINE TERMINALS This section addresses the question: How suitable for a public marine
terminal are the few sites in the Portland Harbor that have been identified by the City as having the best potential to accommodate such a terminal? Through previous planning efforts,10 the City of Portland Bureau of Planning and Sustainability (BPS) identified the following minimum criteria to meet forecasted demand for new marine terminal sites in the Portland Harbor:
• Industrial zoning
• Deep-water harbor access
• Railroad access
9 Whether such redevelopment could be, in some cases, financially feasible is a question beyond the scope of this study.
10 West Hayden Island Economic Foundation Study, prepared by Entrix and Bonnie Gee Yosick LLC for the City of Portland Bureau of Planning and Sustainability, May 2010. City of Portland Economic Opportunities Analysis: Working Draft, prepared by E.D. Hovee and Company, LLC for the City of Portland Bureau of Planning & Sustainability, June 2011.
PSC Recommended Draft - June 2012 EOA Section 1 Appendix C
Portland Harbor, Industrial Land Supply ECONorthwest May 2012 Page 19
• Truck street access
• Vacant (unimproved or unoccupied brownfield) site-assembly area approaching 100 acres.
Using the methods described in Section 3.1 above, BPS staff identified only two sites that could potentially meet all these criteria. These are the two largest vacant sites in the Portland Harbor area: the 59-acre Atofina site, and the 43-acre Time Oil site. Both are brownfields, and both could potentially be assembled with nearby vacant sites.
This analysis looked only at vacant sites. It is always possible that some sites that are non-vacant today could be redeveloped as marine terminals in the future. When considering the opportunity to redevelop non-vacant sites, it is important to look at the net impact in economic activity. In other words, redeveloping existing sites would only be beneficial to the economy if the new use of the site were more efficient and able to accommodate more economic activity (whether measured by employment, output, cargo volumes, etc.) on the same acreage. Evaluating all non-vacant sites in the Portland Harbor to attempt to determine which might be most likely to redevelop in the future was beyond the scope of our analysis.
The ECONorthwest team reviewed the two vacant sites identified by the City of Portland, and evaluated maps of the Portland Harbor, including zoning, infrastructure and aerial photographs. Our preliminary review confirmed the City’s findings: most of the Portland Harbor has active development on it, and these two sites have the greatest opportunity to accommodate new public marine terminals.
Staff from ECONorthwest and Maul Foster & Alongi toured these sites with BPS staff, documenting conditions affecting the suitability of each site for the proposed development. Key factors considered in the evaluation were: site access, existing uses, natural features, and contamination / remediation. After conducting this site visit, Maul Foster & Alongi developed a set of criteria for evaluating site feasibility for typical port terminals (see Appendix B).
Using these criteria, Maul Foster & Alongi evaluated the potential opportunities and constraints of these sites to accommodate development of a public marine terminal. A cursory site visit is insufficient to make a final determination of site feasibility. Nonetheless, the methods are consistent with the scope and budget, and are sufficient for identifying major opportunities and constraints for these potential sites, and for making a preliminary determination of site feasibility. Further investigation of these sites could be conducted to refine our feasibility findings.
PSC Recommended Draft - June 2012 EOA Section 1 Appendix C
Page 20 May 2012 ECONorthwest Portland Harbor, Industrial Land Supply
3.2.1 ATOFINA The Atofina site is a collection of parcels under several ownerships,
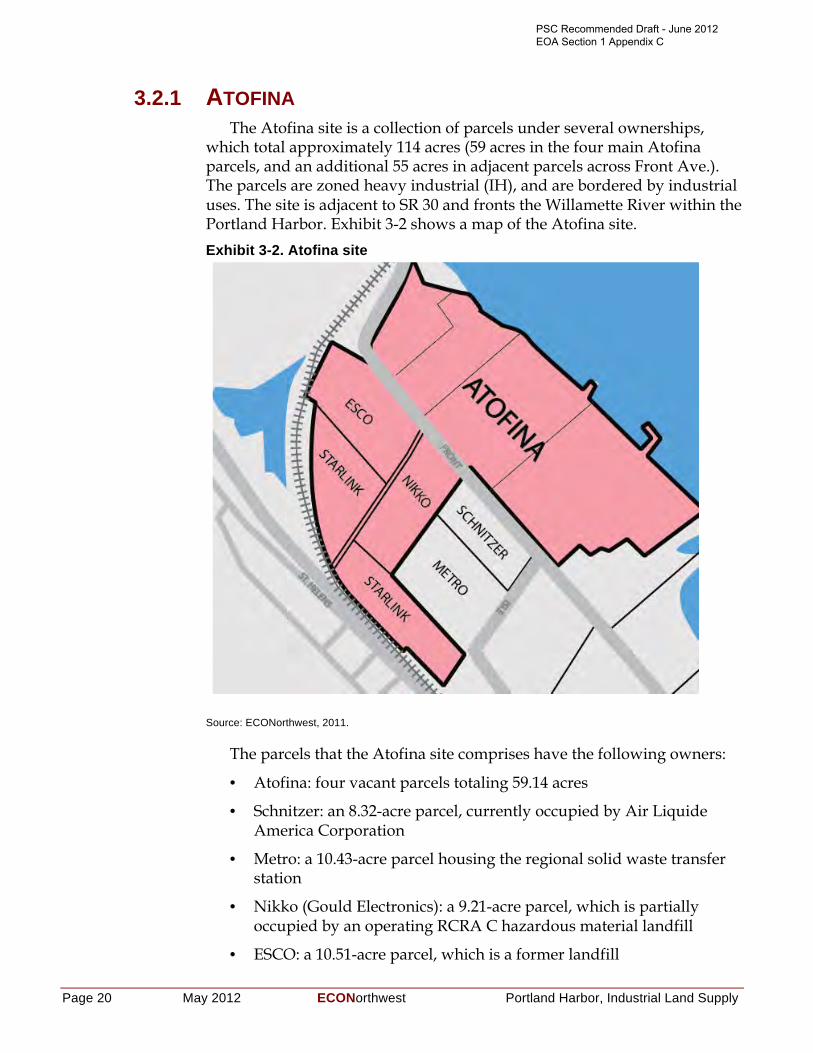
which total approximately 114 acres (59 acres in the four main Atofina parcels, and an additional 55 acres in adjacent parcels across Front Ave.). The parcels are zoned heavy industrial (IH), and are bordered by industrial uses. The site is adjacent to SR 30 and fronts the Willamette River within the Portland Harbor. Exhibit 3-2 shows a map of the Atofina site.
Exhibit 3-2. Atofina site
Source: ECONorthwest, 2011.
The parcels that the Atofina site comprises have the following owners:
• Atofina: four vacant parcels totaling 59.14 acres
• Schnitzer: an 8.32-acre parcel, currently occupied by Air Liquide America Corporation
• Metro: a 10.43-acre parcel housing the regional solid waste transfer station
• Nikko (Gould Electronics): a 9.21-acre parcel, which is partially occupied by an operating RCRA C hazardous material landfill
• ESCO: a 10.51-acre parcel, which is a former landfill
PSC Recommended Draft - June 2012 EOA Section 1 Appendix C
Portland Harbor, Industrial Land Supply ECONorthwest May 2012 Page 21
• Starlink (Aventis Cropscience USA LP; Rhone Poulenc Ag): two significantly contaminated parcels totaling 16.42 acres, currently under remediation.
Access Water depth in the Willamette River near the Atofina site ranges from
30 to 40 feet. The site has historically been used as a bulk-commodity manufacturing and shipping terminal. The waterside parcels (Atofina) provide a total of 2,700 feet of shoreline, and currently accommodate three existing piers on leases from the State of Oregon, Department of State Lands.
The aggregated Atofina site is served by a rail siding from the BNSF mainline. The siding is approximately 2,200 feet in length with three road ‘at grade’ crossings. While the site has rail access, it appears to be of insufficient size to accommodate a loop track, which would hamper efforts to build an efficient, modern port facility. Highway 30 access has been somewhat hampered by the closure of local streets accessing the highway.
Existing uses Current industrial uses on the Schnitzer property as well as the Metro
property seemingly eliminate 18.75 acres, while the existing Gould Superfund disposal site on the Nikko property reduces the available footprint by an additional 9.21 acres. The Nikko property contains an operational on-site 4.5-acre containment facility (Subtitle C closed hazardous waste landfill), and is approximately 25 to 30 feet higher in elevation than the surrounding property, with a structured fill containing 77,000 cubic yards of contaminated materials. The former ESCO landfill received non-recyclable wastes (e.g., foundry sand, slag, demolition debris) from ESCO’s foundry operations from approximately 1953 to 1983. The landfill was closed with the approval of the Oregon Department of Environmental Quality (DEQ) and the Oregon State Health Division in 1983. The Starlink properties are undergoing extensive investigation and remediation.
Natural features The property generally rises in grade from the Front Street ROW in the
east to the rail ROW in the west, and has considerable natural gain exclusive of the Subtitle C landfill mass. Along the north and northwest perimeter of the site is a berm with a steep slope leading up to the BNSF main line on its approach to the rail bridge. Across the rail line, North Doane Lake and an environmental conservation land designation wrap the ‘site’ to the north and west.
PSC Recommended Draft - June 2012 EOA Section 1 Appendix C
Page 22 May 2012 ECONorthwest Portland Harbor, Industrial Land Supply
The waterside parcel is partially within the FEMA Special Flood Hazard Area or was partially inundated by a 1996 flood event. The area is in a low to moderate earthquake hazard exposure area.
Contamination and remediation The Atofina parcels are being remediated by Legacy Site Services (LSS),
as the Atofina agent, under a consent order with DEQ, requiring source control and a site-wide feasibility study. The source control measures include both groundwater and stormwater migration controls. The site is included in the area of the Lower Willamette River that was designated a Superfund site in 2000 by the Environmental Protection Agency. Final remediation plans for the Portland Harbor Superfund site have not been determined. The potential liability for remediation of the Superfund adds a high level of risk for all affected properties, making prospective real estate transactions or development unlikely.
Other constraints In addition to these property encumbrances the Atofina site is
transected by Front Avenue (Service Level B; Priority Truck Route; peak-hour volume average of 106 vehicles and an average daily traffic volume of 640 vehicles, of which 92% are automobiles). Front Avenue separates the Atofina-owned parcels from the remainder of the site. Front Avenue provides primary access to the adjacent Siltronic site and is a public right of way. The Siltronic property does have alternate direct highway access to US 30, but there is an ‘at-grade’ rail crossing, and it does not readily serve the current land use configuration for the site. In addition to the Front Avenue ROW there is a pipeline easement adjacent to the east side of the street ROW.
While the total aggregated acreage appears to adequate for serving as a barge or bulk facility, current encumbrances, uses, and rights of way limit the useable area to 59 acres: the four parcels owned by Atofina to the East of Front Avenue, fronting the Willamette River.
Site assessment Significant changes would need to be overcome to develop this site as a
productive public marine terminal. To develop the entire site, NW Front Avenue would need to be closed, requiring additional infrastructure investments to provide alternative access to the Siltronic property. Without closing NW Front Avenue, this site is practically limited to 59 useable acres, with limited road and rail siding access.
While the site has rail access, site size and dimensions are insufficient to accommodate a rail loop track. Providing adequate rail service for the site is
PSC Recommended Draft - June 2012 EOA Section 1 Appendix C
Portland Harbor, Industrial Land Supply ECONorthwest May 2012 Page 23
even more challenging if development is limited to the 59 acres east of NW Front Avenue.
If NW Front Avenue were closed to accommodate development of the 114-acre site, the properties owned by Metro and Schnitzer are in active use, and would be unlikely to relocate. Property acquisition for the remaining parcels would be challenging, as it would require negotiations with five different private property owners. While acquiring these properties would provide additional acreage for development, acquisition would also involve additional costs as well as need for environmental remediation on these sites.
Ultimately, the site may be suitable for break bulk commodities, such as project cargoes, but the uncertainty of the planned and ongoing environmental remediation on the Atofina parcels--in addition to the uncertain liability for the Lower Willamette River Superfund remediation--probably make the cost of the land prohibitively high. The site could be big enough for a terminal, but the cost of preparing the site to accommodate such a terminal will make the effective land price very high relative to other industrial properties.
3.2.2 TIME OIL The Time Oil site includes several separately owned parcels totaling
approximately 84.2 acres. The subject parcels are adjacent to the Willamette River within the Portland Harbor and are zoned heavy industrial (IH) with a ‘River’ overlay designation. The site is bordered by industrial uses and also an area governed by a soon-to-expire natural resource management plan. Exhibit 3-3 shows a map of the Time Oil site.
The Time Oil site comprises parcels with the following owners:
• Time Oil: 43.41 acres
• Schnitzer Investment Corporation: 13.79 acres
• Bell Oil: 6.04 acres
• Dash Multi Corporation: 9.82 acres
• Millican Properties: 11.12 acres
PSC Recommended Draft - June 2012 EOA Section 1 Appendix C
Page 24 May 2012 ECONorthwest Portland Harbor, Industrial Land Supply
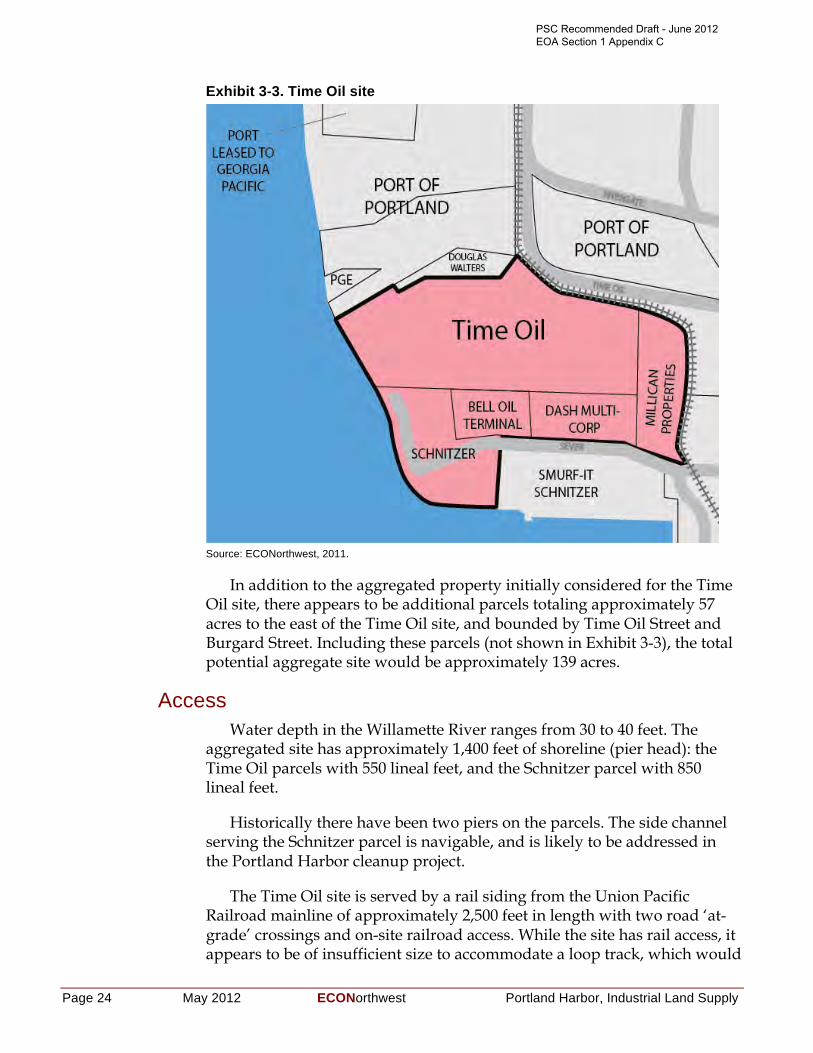
Exhibit 3-3. Time Oil site
Source: ECONorthwest, 2011.
In addition to the aggregated property initially considered for the Time Oil site, there appears to be additional parcels totaling approximately 57 acres to the east of the Time Oil site, and bounded by Time Oil Street and Burgard Street. Including these parcels (not shown in Exhibit 3-3), the total potential aggregate site would be approximately 139 acres.
Access Water depth in the Willamette River ranges from 30 to 40 feet. The
aggregated site has approximately 1,400 feet of shoreline (pier head): the Time Oil parcels with 550 lineal feet, and the Schnitzer parcel with 850 lineal feet.
Historically there have been two piers on the parcels. The side channel serving the Schnitzer parcel is navigable, and is likely to be addressed in the Portland Harbor cleanup project.
The Time Oil site is served by a rail siding from the Union Pacific Railroad mainline of approximately 2,500 feet in length with two road ‘at-grade’ crossings and on-site railroad access. While the site has rail access, it appears to be of insufficient size to accommodate a loop track, which would
PSC Recommended Draft - June 2012 EOA Section 1 Appendix C
Portland Harbor, Industrial Land Supply ECONorthwest May 2012 Page 25
hamper efforts to build an efficient, modern port facility. Access to the specific site would require use of a private or Port-owned right of way, connecting to either Rivergate Blvd. or Burgard St., ultimately connecting to N Lombard St, a district collector and priority truck roadway.
Existing uses Current industrial uses on the Schnitzer property appear to be
temporary in nature. The Bell Oil Terminal is inactive; the Millican parcel is underutilized, and the Dash Multi Corp parcel is an operational tire recycler. There are several existing structures on the Time Oil and Schnitzer site, and evidence of removal of liquid storage tanks. The western half of the site is in a floodplain.
Contamination and remediation Like most properties in the Portland Harbor, sediment in the adjacent
channel and berthing area have known or suspected contamination. The upland properties have known or suspected contamination and are in various regulatory phases of investigation and remediation. The site is included in the area of the Lower Willamette River that was designated a Superfund site in 2000 by the Environmental Protection Agency. Final remediation plans for the Portland Harbor Superfund site have not been determined. The potential liability for remediation of the Superfund adds a high level of risk for all affected properties, making any real estate transactions or development highly unlikely.
Other constraints To the north of the subject site there are high-tension power lines; a
small parcel owned by PGE and a series of parcels owned by the Port of Portland with the presence of wetlands (some of these wetlands have environmental conservation zoning). The site is generally flat with mild slope to the river.
Site assessment The Time Oil site faces challenges that would need to be overcome to be
developed as a productive public marine terminal. While the core of the site (57 acres) has only two different private property owners, the remainder of the site is divided into several different owners. Depending on the desired use and scale of a proposed port terminal, additional property to the east of the site may need to be acquired. The number of private properties and owners makes site assembly a challenge, but not an insurmountable obstacle.
Compared to the Atofina site, the Time Oil site appears to have fewer challenges to redevelopment: it does not require closing a public street, it
PSC Recommended Draft - June 2012 EOA Section 1 Appendix C
Page 26 May 2012 ECONorthwest Portland Harbor, Industrial Land Supply
appears to have less severe environmental contamination, and the possibility exists to acquire a larger aggregate site. The contamination is mainly along the river, not upland. It may be possible that lower lying contaminated land could be used as fill on other parts of the site and capped under the footprint of a new building.
The site would be a viable candidate for a marine terminal with the appropriate aggregation of key properties. Aggregating 80 to 140 acres would accommodate the transshipment of break bulk and some bulk commodities. Property configuration to make 1,400 feet of pier face accessible is critical to its usability. This site could be explored further for marine terminal use. It will be difficult, however, to negotiate any real estate transactions for this site while the liability for the Lower Willamette River Superfund remediation remains uncertain.
3.2.3 IMPLICATIONS Public marine terminals have specific land use requirements that are
difficult to find. Ideally, sites must be large and flat, inside of an industrial zone, have significant shoreline on a navigable river, be served by both rail and truck, and free of contamination, wetlands, or other environmental constraints. There are no sites in the Portland Harbor that meet these ideal requirements, though there are a few sites that come close. The questions are: how close do they come, and is there a way to cost-effectively develop these sites as productive public marine terminals?
The City of Portland identified the two sites in the Portland Harbor that are most likely to be suitable for development of a new public marine terminal: the Atofina site, and the Time Oil site. Of these two sites, development is technically possible on either, but there are major hurdles that would add significant costs. Both sites have some level of contamination, both sites would require negotiation and property acquisition from numerous property owners, and both sites are smaller than desirable, which precludes the possibility of an onsite rail loop.
Of the two sites, the Time Oil site is most suitable for development, as it does not have certain challenges faced by the Atofina site. The development of the Atofina site is further restricted by NW Front Ave. that bisects the site, and provides primary access to the Siltronic property. With this road in place, the site is limited to just 59 acres. Vacating the road would be costly, and would likely require significant infrastructure investments to be made to provide access to the Siltronic property. Even if the road were vacated, property on the other side of the road is contaminated or in active use. And the nature of the contamination on the Atofina site is considered to be more severe than contamination elsewhere in the Portland Harbor.
PSC Recommended Draft - June 2012 EOA Section 1 Appendix C
Portland Harbor, Industrial Land Supply ECONorthwest May 2012 Page 27
Ultimately, issues related to the Superfund cleanup of the Willamette River make all sites in the Portland Harbor unfeasible for development in the near future. Until a final agreement is reached, determining the specific liability for all property owners in the Harbor, there is too much cost uncertainty to negotiate a reasonable price for the land acquisition that would be necessary to assemble a site large enough for a new public marine terminal.
3.3 ROLE OF VANCOUVER IN HARBOR INDUSTRIAL LAND SUPPLY
The third question we were asked by the City is: What role can the Port of Vancouver play in accommodating forecast demand for cargo volumes in the Portland region? To answer this question, we reviewed estimates from recent studies on the current capacity and forecast demand for cargo in the region, and augmented this data-driven analysis through interviews with port officials. A more detailed description of our analysis is found in Appendix C: Analysis of Harbor Land Capacity and Demand, Portland and Vancouver.
3.3.1 EXISTING CAPACITY The Port of Portland has four marine terminals located along the
Willamette and Columbia Rivers. These terminals accommodated 575 ocean-going vessels in 2010, though over the past two decades it was not uncommon for the Port to accommodate 800 to 1,000 ocean-going vessels in a year. Not counting cargos received or shipped via inland barges, the Port of Portland shipped over 13 million short tons of cargo in 2010.
While the Port’s existing marine terminals have excess capacity, that capacity is limited. As demand increases over time, the Port will reach a point when existing facilities are unable to accommodate the demand that is forecasted. If the Port is unable to find new ways to improve the efficiency of existing terminals, or find suitable sites to build new terminals, then the Port of Portland may miss potential cargo opportunities. The Port of Vancouver, located across the Columbia River from the Port of Portland, could accommodate some unmet demand.
Exhibit 3-4 summarizes the estimated capacity of public marine terminals in the Port of Portland. Total capacity for all cargo types in the Port of Portland is estimated to be over 21,000,000 metric tons. This capacity is significantly above current cargo volumes for all cargo types, except for grain, which saw a reduction in capacity when the Port closed the terminal
PSC Recommended Draft - June 2012 EOA Section 1 Appendix C
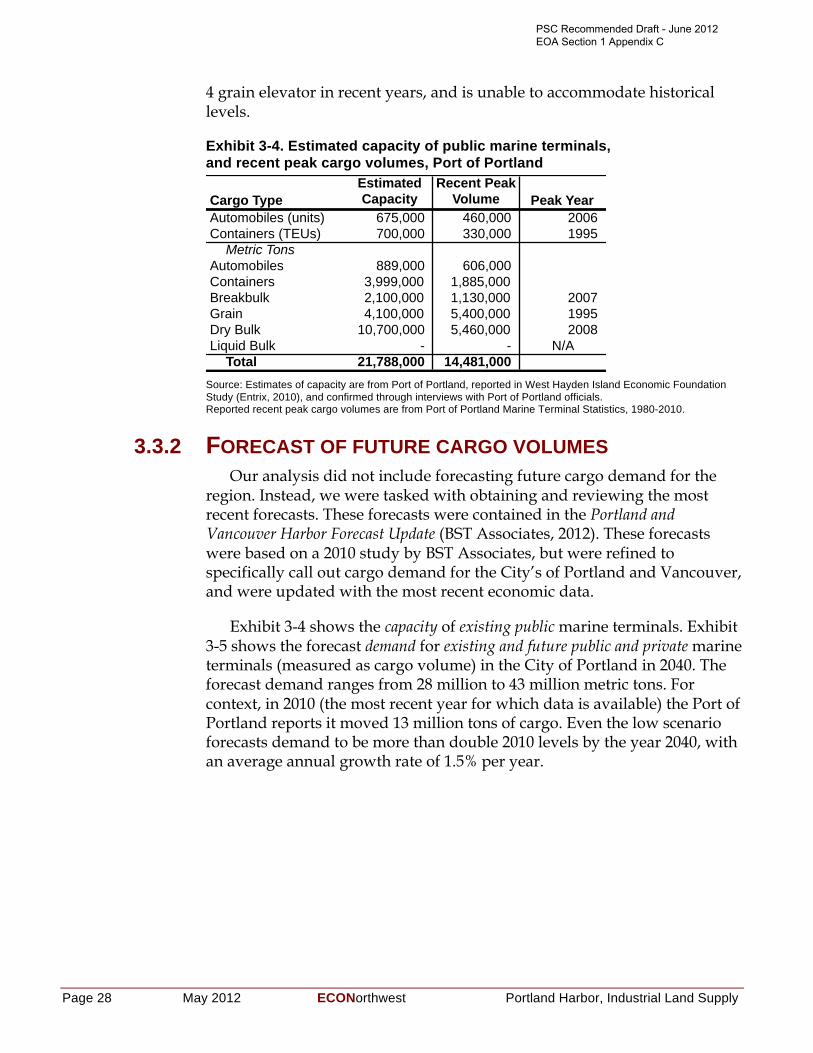
Page 28 May 2012 ECONorthwest Portland Harbor, Industrial Land Supply
4 grain elevator in recent years, and is unable to accommodate historical levels.
Exhibit 3-4. Estimated capacity of public marine terminals, and recent peak cargo volumes, Port of Portland
Source: Estimates of capacity are from Port of Portland, reported in West Hayden Island Economic Foundation Study (Entrix, 2010), and confirmed through interviews with Port of Portland officials. Reported recent peak cargo volumes are from Port of Portland Marine Terminal Statistics, 1980-2010.
3.3.2 FORECAST OF FUTURE CARGO VOLUMES Our analysis did not include forecasting future cargo demand for the
region. Instead, we were tasked with obtaining and reviewing the most recent forecasts. These forecasts were contained in the Portland and Vancouver Harbor Forecast Update (BST Associates, 2012). These forecasts were based on a 2010 study by BST Associates, but were refined to specifically call out cargo demand for the City’s of Portland and Vancouver, and were updated with the most recent economic data.
Exhibit 3-4 shows the capacity of existing public marine terminals. Exhibit 3-5 shows the forecast demand for existing and future public and private marine terminals (measured as cargo volume) in the City of Portland in 2040. The forecast demand ranges from 28 million to 43 million metric tons. For context, in 2010 (the most recent year for which data is available) the Port of Portland reports it moved 13 million tons of cargo. Even the low scenario forecasts demand to be more than double 2010 levels by the year 2040, with an average annual growth rate of 1.5% per year.
Cargo TypeEstimated Capacity
Recent Peak Volume Peak Year
Automobiles (units) 675,000 460,000 2006Containers (TEUs) 700,000 330,000 1995
Metric TonsAutomobiles 889,000 606,000 Containers 3,999,000 1,885,000 Breakbulk 2,100,000 1,130,000 2007Grain 4,100,000 5,400,000 1995Dry Bulk 10,700,000 5,460,000 2008Liquid Bulk - - N/A
Total 21,788,000 14,481,000
PSC Recommended Draft - June 2012 EOA Section 1 Appendix C
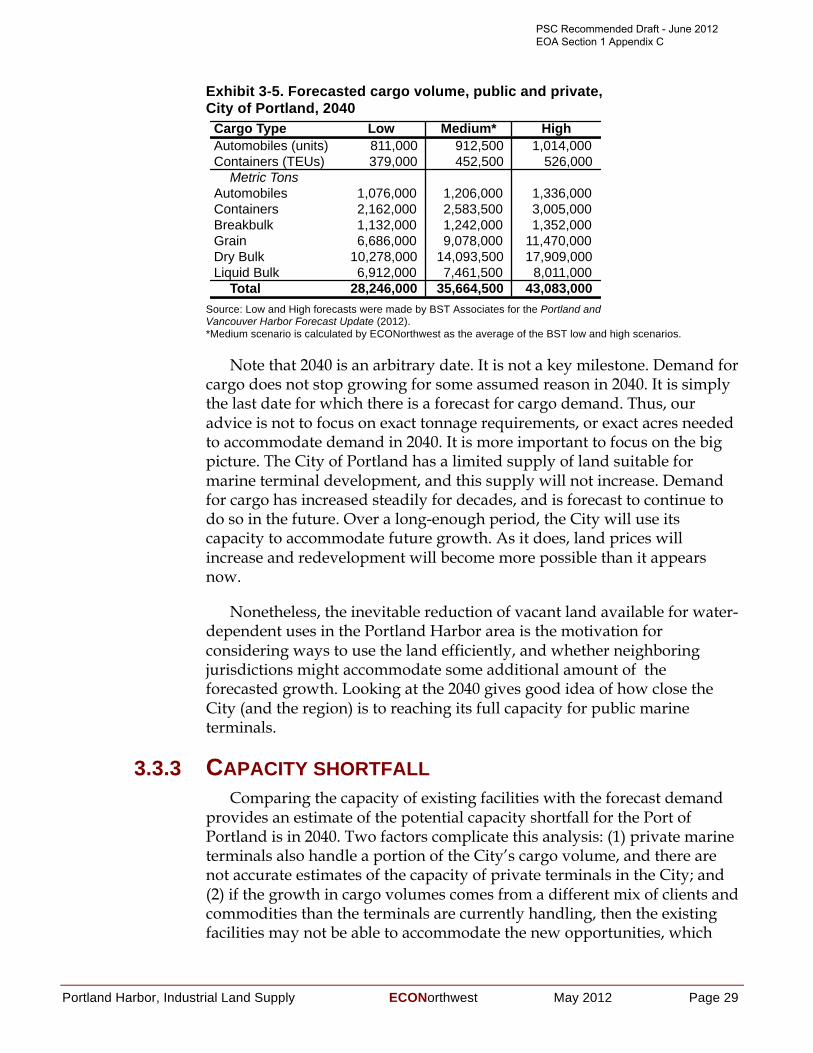
Portland Harbor, Industrial Land Supply ECONorthwest May 2012 Page 29
Exhibit 3-5. Forecasted cargo volume, public and private, City of Portland, 2040
Source: Low and High forecasts were made by BST Associates for the Portland and Vancouver Harbor Forecast Update (2012). *Medium scenario is calculated by ECONorthwest as the average of the BST low and high scenarios.
Note that 2040 is an arbitrary date. It is not a key milestone. Demand for cargo does not stop growing for some assumed reason in 2040. It is simply the last date for which there is a forecast for cargo demand. Thus, our advice is not to focus on exact tonnage requirements, or exact acres needed to accommodate demand in 2040. It is more important to focus on the big picture. The City of Portland has a limited supply of land suitable for marine terminal development, and this supply will not increase. Demand for cargo has increased steadily for decades, and is forecast to continue to do so in the future. Over a long-enough period, the City will use its capacity to accommodate future growth. As it does, land prices will increase and redevelopment will become more possible than it appears now.
Nonetheless, the inevitable reduction of vacant land available for water-dependent uses in the Portland Harbor area is the motivation for considering ways to use the land efficiently, and whether neighboring jurisdictions might accommodate some additional amount of the forecasted growth. Looking at the 2040 gives good idea of how close the City (and the region) is to reaching its full capacity for public marine terminals.
3.3.3 CAPACITY SHORTFALL Comparing the capacity of existing facilities with the forecast demand
provides an estimate of the potential capacity shortfall for the Port of Portland is in 2040. Two factors complicate this analysis: (1) private marine terminals also handle a portion of the City’s cargo volume, and there are not accurate estimates of the capacity of private terminals in the City; and (2) if the growth in cargo volumes comes from a different mix of clients and commodities than the terminals are currently handling, then the existing facilities may not be able to accommodate the new opportunities, which
Cargo Type Low Medium* HighAutomobiles (units) 811,000 912,500 1,014,000 Containers (TEUs) 379,000 452,500 526,000
Metric TonsAutomobiles 1,076,000 1,206,000 1,336,000 Containers 2,162,000 2,583,500 3,005,000 Breakbulk 1,132,000 1,242,000 1,352,000 Grain 6,686,000 9,078,000 11,470,000 Dry Bulk 10,278,000 14,093,500 17,909,000 Liquid Bulk 6,912,000 7,461,500 8,011,000
Total 28,246,000 35,664,500 43,083,000
PSC Recommended Draft - June 2012 EOA Section 1 Appendix C
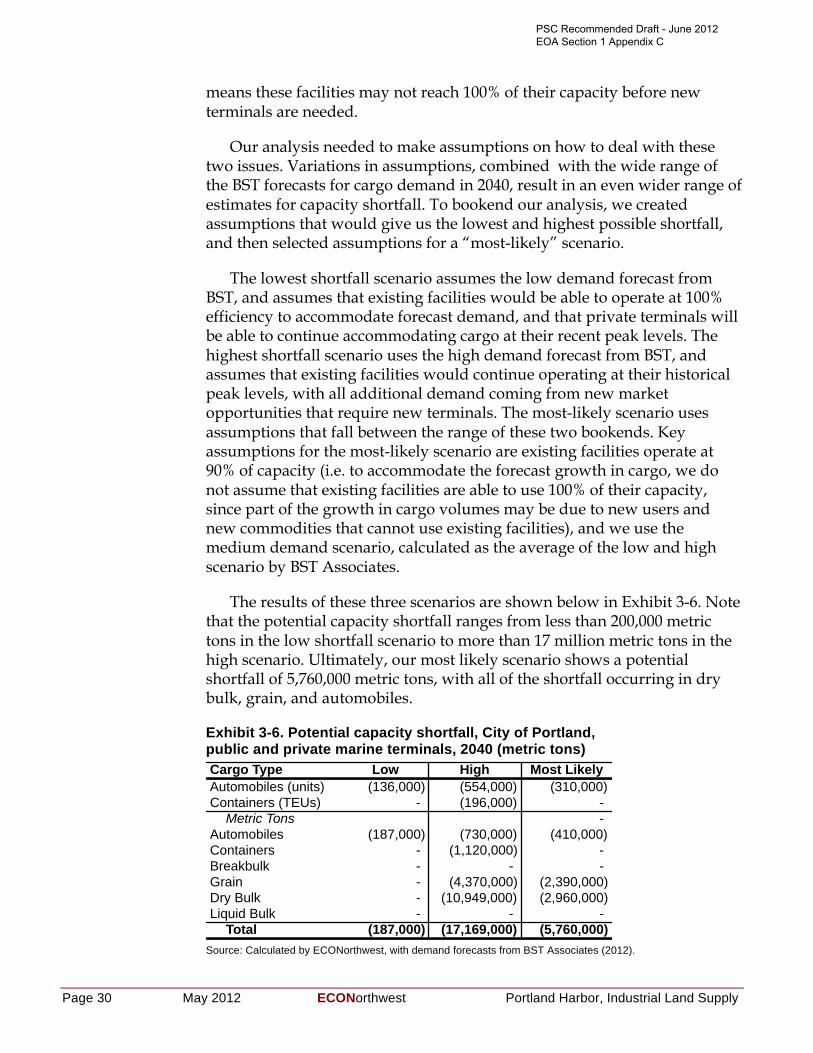
Page 30 May 2012 ECONorthwest Portland Harbor, Industrial Land Supply
means these facilities may not reach 100% of their capacity before new terminals are needed.
Our analysis needed to make assumptions on how to deal with these two issues. Variations in assumptions, combined with the wide range of the BST forecasts for cargo demand in 2040, result in an even wider range of estimates for capacity shortfall. To bookend our analysis, we created assumptions that would give us the lowest and highest possible shortfall, and then selected assumptions for a “most-likely” scenario.
The lowest shortfall scenario assumes the low demand forecast from BST, and assumes that existing facilities would be able to operate at 100% efficiency to accommodate forecast demand, and that private terminals will be able to continue accommodating cargo at their recent peak levels. The highest shortfall scenario uses the high demand forecast from BST, and assumes that existing facilities would continue operating at their historical peak levels, with all additional demand coming from new market opportunities that require new terminals. The most-likely scenario uses assumptions that fall between the range of these two bookends. Key assumptions for the most-likely scenario are existing facilities operate at 90% of capacity (i.e. to accommodate the forecast growth in cargo, we do not assume that existing facilities are able to use 100% of their capacity, since part of the growth in cargo volumes may be due to new users and new commodities that cannot use existing facilities), and we use the medium demand scenario, calculated as the average of the low and high scenario by BST Associates.
The results of these three scenarios are shown below in Exhibit 3-6. Note that the potential capacity shortfall ranges from less than 200,000 metric tons in the low shortfall scenario to more than 17 million metric tons in the high scenario. Ultimately, our most likely scenario shows a potential shortfall of 5,760,000 metric tons, with all of the shortfall occurring in dry bulk, grain, and automobiles.
Exhibit 3-6. Potential capacity shortfall, City of Portland, public and private marine terminals, 2040 (metric tons)
Source: Calculated by ECONorthwest, with demand forecasts from BST Associates (2012).
Cargo Type Low High Most LikelyAutomobiles (units) (136,000) (554,000) (310,000) Containers (TEUs) - (196,000) -
Metric Tons - Automobiles (187,000) (730,000) (410,000) Containers - (1,120,000) - Breakbulk - - - Grain - (4,370,000) (2,390,000) Dry Bulk - (10,949,000) (2,960,000) Liquid Bulk - - -
Total (187,000) (17,169,000) (5,760,000)
PSC Recommended Draft - June 2012 EOA Section 1 Appendix C
Portland Harbor, Industrial Land Supply ECONorthwest May 2012 Page 31
3.3.4 LAND NEED FOR NEW PORT TERMINALS Translating cargo volumes into acres for port terminals is challenging,
and depends on a host of variables for which we have little or no data for this analysis. Will the terminal need rail access, if so will it need a dedicated rail loop, or will it be able to share rail infrastructure with adjacent terminals? Would another rail configuration like a ladder track work?11
The composition of the demand is important as well. For example, if you have demand for 10 million pounds of dry bulk, will that all be the same commodity type? If not, you may not be able to use the same terminal (for example a coal exporter and potash exporter may need to have completely separate terminals even though they are both dry bulk and would have very similar needs. Even the ownership of the cargos makes a difference (e.g., one exporter with a throughput of 10 million tons of potash may require different facilities, than 5 exporters each handling 2 million tons of potash a piece).
Because of the many variables, it is difficult to translate the potential shortfall numbers shown in Exhibit 3-6 into the number of terminals that would be needed to service that demand, and even more difficult to translate the number of terminals into acres. For the purposes of our analysis, we first looked to recent studies to find an industry standard or a rule of thumb for the size of marine terminals for various cargo types. The three sources we looked at were the West Hayden Island Economic Foundation Study (Entrix, 2010), the Draft Report on Operational Efficiencies of Port/Terminal World Wide (Worley Parsons, 2012), and the Maul Foster and Alongi evaluation criteria included with this report as Attachment B.
Unfortunately, there is little consensus among these sources on the land needed for each terminal. This is because the unique characteristics of each site, the needs of each unique user and commodity, and the market conditions and technologies available at the time existing facilities were built result in a wide-range of variables that are difficult to control for. In short, no conclusive rule of thumb exists, and if it did exist, it would not necessarily be applicable to each of the sites in the Portland and Vancouver harbors. Nonetheless, for the purposes of our analysis, we needed to make some assumptions on the acreage requirements for new terminals for various commodities. We again sought to use different assumptions to present a high and low bound on our analysis, and then to select
11 Representatives of businesses in the Portland Harbor, as well as Port Officials, and other consultants with expertise in marine terminal development and cargo forecasts have stressed that there is no equal substitute for a loop track, and that other rail configuration such as a ladder track will not work, for attracting new port users in a competitive global economy.
PSC Recommended Draft - June 2012 EOA Section 1 Appendix C
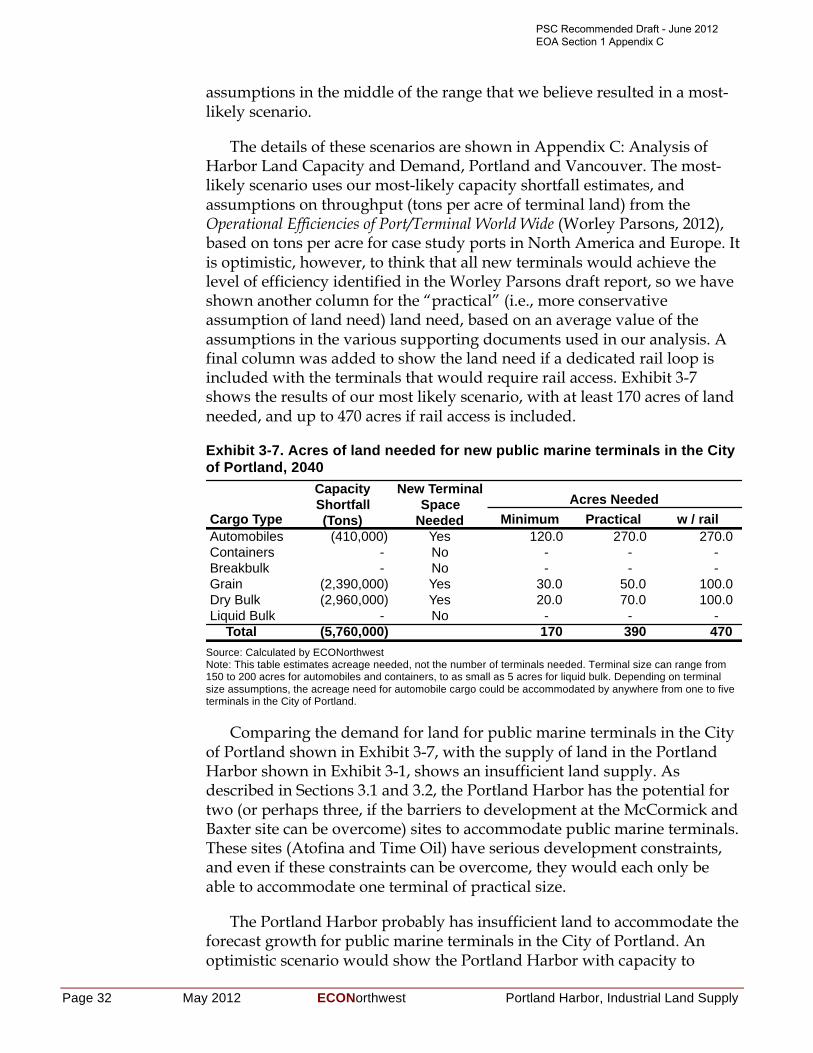
Page 32 May 2012 ECONorthwest Portland Harbor, Industrial Land Supply
assumptions in the middle of the range that we believe resulted in a most-likely scenario.
The details of these scenarios are shown in Appendix C: Analysis of Harbor Land Capacity and Demand, Portland and Vancouver. The most-likely scenario uses our most-likely capacity shortfall estimates, and assumptions on throughput (tons per acre of terminal land) from the Operational Efficiencies of Port/Terminal World Wide (Worley Parsons, 2012), based on tons per acre for case study ports in North America and Europe. It is optimistic, however, to think that all new terminals would achieve the level of efficiency identified in the Worley Parsons draft report, so we have shown another column for the “practical” (i.e., more conservative assumption of land need) land need, based on an average value of the assumptions in the various supporting documents used in our analysis. A final column was added to show the land need if a dedicated rail loop is included with the terminals that would require rail access. Exhibit 3-7 shows the results of our most likely scenario, with at least 170 acres of land needed, and up to 470 acres if rail access is included.
Exhibit 3-7. Acres of land needed for new public marine terminals in the City of Portland, 2040
Source: Calculated by ECONorthwest Note: This table estimates acreage needed, not the number of terminals needed. Terminal size can range from 150 to 200 acres for automobiles and containers, to as small as 5 acres for liquid bulk. Depending on terminal size assumptions, the acreage need for automobile cargo could be accommodated by anywhere from one to five terminals in the City of Portland.
Comparing the demand for land for public marine terminals in the City of Portland shown in Exhibit 3-7, with the supply of land in the Portland Harbor shown in Exhibit 3-1, shows an insufficient land supply. As described in Sections 3.1 and 3.2, the Portland Harbor has the potential for two (or perhaps three, if the barriers to development at the McCormick and Baxter site can be overcome) sites to accommodate public marine terminals. These sites (Atofina and Time Oil) have serious development constraints, and even if these constraints can be overcome, they would each only be able to accommodate one terminal of practical size.
The Portland Harbor probably has insufficient land to accommodate the forecast growth for public marine terminals in the City of Portland. An optimistic scenario would show the Portland Harbor with capacity to
Cargo Type Minimum Practical w / railAutomobiles (410,000) Yes 120.0 270.0 270.0 Containers - No - - - Breakbulk - No - - - Grain (2,390,000) Yes 30.0 50.0 100.0 Dry Bulk (2,960,000) Yes 20.0 70.0 100.0 Liquid Bulk - No - - -
Total (5,760,000) 170 390 470
Capacity Shortfall (Tons)
New Terminal Space
NeededAcres Needed
PSC Recommended Draft - June 2012 EOA Section 1 Appendix C
Portland Harbor, Industrial Land Supply ECONorthwest May 2012 Page 33
accommodate perhaps two terminals of relatively small size (and without a modern rail loop to serve these terminals). A more conservative outlook (and a real possibility) is that the two potential sites in the Portland Harbor may be unable to overcome their significant barriers to redevelopment, which would mean the Harbor may not have any capacity to accommodate future development of marine terminals.
Given the expected growth in demand over the next 30 years, there are few easy solutions to accommodate the City of Portland’s anticipated shortfall in land for public marine terminals. The City can take action to address the existing constraints to facilitate redevelopment, or look elsewhere for buildable land for public marine terminals. The following section addresses the latter solution: looking outside of the City of Portland for land for new marine terminals.
3.3.5 PORT OF VANCOUVER DEVELOPABLE LAND This analysis presupposes that from a regional perspective, there is no
benefit to having port development occur in Portland vs. Vancouver. Leadership for the ports, and for the cities, counties, and states they are located in, may have different opinions. Indeed many public policies exist that emphasize the importance of retaining and attracting industrial jobs, like those created by marine terminal development. However, the purpose of this analysis was to determine if it was technically possible (as opposed to politically desirable) to accommodate future marine terminal demand at the Port of Vancouver.
Additionally, our analysis assumed that the type of port users that would be attracted to the Port of Portland if land were available, would find the Port of Vancouver equally as attractive if there were no developable sites in Portland. This assumption may be true for many, but not necessarily all public marine terminal users. Portland and Vancouver are similar in many ways, sharing the same regional infrastructure and labor pool. But differences do exist between the two jurisdictions, and more so for specific sites within each jurisdiction. For the purposes of our analysis, we have assumed land at the Port of Vancouver would be an acceptable substitute for potential marine terminal users unable to find developable land in the Port of Portland.
Ideally, our analysis for the supply and demand for public marine terminals in the Port of Vancouver would have used the same methods as were used for the Port of Portland. Unfortunately, our analysis was constrained by both data limitations, and time/budget. Thus, we were asked to conduct a less rigorous analysis of the Vancouver land supply, making use of the best available data, gathered mostly from conversations and correspondence with officials from the Port of Vancouver.
PSC Recommended Draft - June 2012 EOA Section 1 Appendix C
Page 34 May 2012 ECONorthwest Portland Harbor, Industrial Land Supply
ECO interviewed officials with the Port of Vancouver to understand their long-term plans for harbor industrial lands, and the challenges and opportunities that would arise from a greater share of regional industrial development locating in Vancouver versus Portland.
The Port of Vancouver is located along the banks of the Columbia River, with access to the same markets and same multi-modal transportation infrastructure as the Port of Portland. The port handles more than 500 ocean-going vessels each year, as well as river barges, with total annual cargo of more than 5 million metric tons.
The Port of Vancouver has room to grow. An analysis of aerial photos of Port land indicate roughly 750 vacant acres. The Port of Vancouver sent a memorandum to the City of Portland that further clarified their intentions for these 750 acres. The land includes approximately 450 acres of undeveloped greenfield land called Columbia Gateway. Approximately 350 acres of this property is planned to be developed as maritime, and the remaining 100 acres planned for heavy industrial. In addition, the port has 110 acres of available undeveloped light industrial land called Centennial Industrial Park. The light industrial properties could be available for development within 12-14 months, while the Columbia Gateway area is not expected to be ready for development for another 8-15 years. The Centennial properties are not waterfront parcels.
Terminal 5, now under development, added 200 acres of heavy industrial and maritime land. All but four acres of this property is river-dependent maritime land. The maritime portion has been, or will be, filled with rail infrastructure, new tenants, and cargos, including wind energy exports and a dry bulk exporter with up to 16 million ton export capacity. The sole industrial tenant is a rail-dependent propane distributor.
The Port of Vancouver is in a period of rapid growth and is currently undertaking a number of public and private development projects, including the West Vancouver Freight Access project. This public rail improvement project will create a unit train facility, more than doubling the miles of track within the port, along with adding a new, grade separate entrance from the BNSF Railway mainline. This project will increase capacity from 45,000 rail cars per year, to more than 160,000 per year, with 40 percent less delay.
Given the Port of Vancouver’s holdings of vacant land, the recent dredging of the Columbia River to a depth of 43 feet, and ongoing investment in new rail infrastructure (i.e., the West Vancouver Freight Access project), the Port of Vancouver is well positioned to capture growth in the future. Officials from the Port of Vancouver believe that neither the Port of Portland or the Port of Vancouver have sufficient land and resources to accommodate all of the region’s future growth on their own.
PSC Recommended Draft - June 2012 EOA Section 1 Appendix C
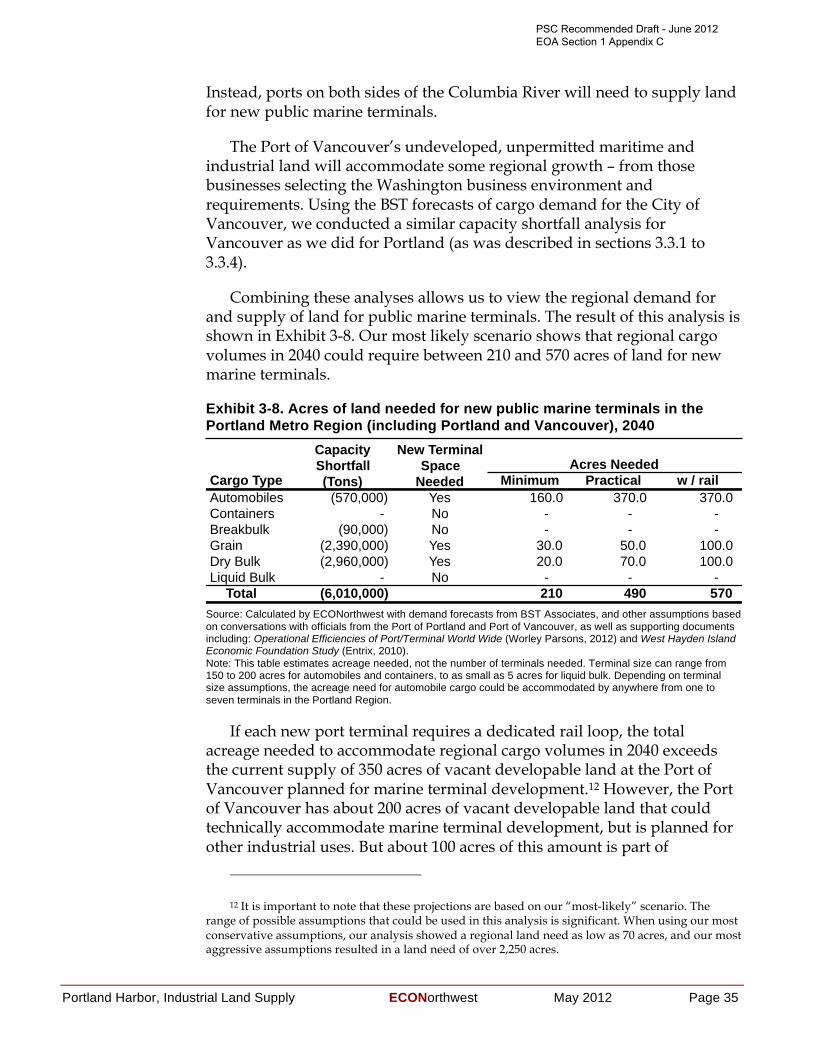
Portland Harbor, Industrial Land Supply ECONorthwest May 2012 Page 35
Instead, ports on both sides of the Columbia River will need to supply land for new public marine terminals.
The Port of Vancouver’s undeveloped, unpermitted maritime and industrial land will accommodate some regional growth – from those businesses selecting the Washington business environment and requirements. Using the BST forecasts of cargo demand for the City of Vancouver, we conducted a similar capacity shortfall analysis for Vancouver as we did for Portland (as was described in sections 3.3.1 to 3.3.4).
Combining these analyses allows us to view the regional demand for and supply of land for public marine terminals. The result of this analysis is shown in Exhibit 3-8. Our most likely scenario shows that regional cargo volumes in 2040 could require between 210 and 570 acres of land for new marine terminals.
Exhibit 3-8. Acres of land needed for new public marine terminals in the Portland Metro Region (including Portland and Vancouver), 2040
Source: Calculated by ECONorthwest with demand forecasts from BST Associates, and other assumptions based on conversations with officials from the Port of Portland and Port of Vancouver, as well as supporting documents including: Operational Efficiencies of Port/Terminal World Wide (Worley Parsons, 2012) and West Hayden Island Economic Foundation Study (Entrix, 2010). Note: This table estimates acreage needed, not the number of terminals needed. Terminal size can range from 150 to 200 acres for automobiles and containers, to as small as 5 acres for liquid bulk. Depending on terminal size assumptions, the acreage need for automobile cargo could be accommodated by anywhere from one to seven terminals in the Portland Region.
If each new port terminal requires a dedicated rail loop, the total acreage needed to accommodate regional cargo volumes in 2040 exceeds the current supply of 350 acres of vacant developable land at the Port of Vancouver planned for marine terminal development.12 However, the Port of Vancouver has about 200 acres of vacant developable land that could technically accommodate marine terminal development, but is planned for other industrial uses. But about 100 acres of this amount is part of
12 It is important to note that these projections are based on our “most-likely” scenario. The range of possible assumptions that could be used in this analysis is significant. When using our most conservative assumptions, our analysis showed a regional land need as low as 70 acres, and our most aggressive assumptions resulted in a land need of over 2,250 acres.
Cargo Type Minimum Practical w / railAutomobiles (570,000) Yes 160.0 370.0 370.0 Containers - No - - - Breakbulk (90,000) No - - - Grain (2,390,000) Yes 30.0 50.0 100.0 Dry Bulk (2,960,000) Yes 20.0 70.0 100.0 Liquid Bulk - No - - -
Total (6,010,000) 210 490 570
Capacity Shortfall (Tons)
New Terminal Space
NeededAcres Needed
PSC Recommended Draft - June 2012 EOA Section 1 Appendix C
Page 36 May 2012 ECONorthwest Portland Harbor, Industrial Land Supply
Centennial Industrial Park and are not on the waterfront parcels or linked to waterfront parcels, so 100 acres might be a more appropriate estimate. If these acres were included in the total supply, then the Port of Vancouver comes close to having a supply of land to accommodate regional cargo demand through 2040.
While this scenario is technically possible, it may not politically feasible or consistent with adopted policies of the affected jurisdictions: Vancouver’s land supply could fall short. The high and low demand forecasts differ by + or – 20% from the most-likely forecast, and assumptions about whether a new terminal has rail loop access or not can easily double the need for land. Portland and Vancouver probably have adequate land now to accommodate a low-demand forecast with few new terminals sized for loop trains. But in our simulations, high demand plus loop-train access at all new terminals led to a overall land shortfall of almost 1,500 acres. If only 350 acres at the Port of Vancouver are available for marine terminal development (its current estimated based on policy) then unmet demand for public marine terminals in the region would be around 1,100 acres.13
3.3.6 IMPLICATIONS The most recent forecasts for future cargo demand show the Port of
Portland will be unable to accommodate forecast demand by 2040 without adding new capacity. However, the extent of that capacity shortfall depends on the assumptions used. Interviews with officials from the Port of Portland, and the author of the most recent cargo forecasts indicate that although actual tonnage for specific cargo types may differ from the forecasts, long-term trends have shown past forecasts for total cargo volume to be fairly accurate, and the most recent forecasts should be seen as reliable.
Taken at face value, these forecasts suggest that additional port capacity will likely by utilized in the future; however, accurately and reliably forecasting the future is impossible. Although our forecasts (and the BST forecasts which underpin them) include a broad range of assumptions, reflecting the high degree of uncertainty, there is no way to guarantee that the future will fall within our forecast range, let alone our “most-likely” scenario. No one knows exactly how demand for port facilities in the lower
13 Although this is the “high-scenario,” it is not also “highly unlikely.” BST Associates, authors of the cargo forecasts used in this analysis, note that the high-scenario calls for 3.1% growth in cargo volumes per year, which is actually lower than the 4.1% average annual growth experienced on the Columbia River between 1962 and 2011.
PSC Recommended Draft - June 2012 EOA Section 1 Appendix C
Portland Harbor, Industrial Land Supply ECONorthwest May 2012 Page 37
Columbia will change in the future. Economist HE Haralambides effectively summarizes the difficulty forecasting port demand, stating:14
“As a result of intertwined and extended hinterlands; abundant land infrastructure and short-sea feedering networks; continuously evolving liner shipping networks; and the infamous `mobility’ of the container, demand is very volatile and unpredictable. Port market shares are unstable; investments in one region or country have an impact on another … In such a `fluid’ environment, how could one forecast port demand with any degree of credibility?”
Competitive and volatile environments do not support reliable forecasting because outcomes depend on many randomly moving variables. Ultimately, whether or not demand for additional port facilities on the lower Columbia materializes will depend on market conditions – demand (what’s produced and consumed in the Portland region), supply (what technologies are used to ship goods, what competing port capacity exists), and price. These factors will inevitably change over the next 30 years in ways that no one can predict, which means any attempt to forecast them should be taken with a grain of salt.
In other words, individual cargo types fluctuate year to year and are difficult to predict with accuracy, but long-term historical trends show that demand for total cargo volumes is less volatile, more predictable, and tends to grow at a pace that is linked to the global economy. While the Port’s four public marine terminals are not operating at 100% of capacity today, it is very likely that they will reach the limits of their capacity in the next several decades, as demand increases. Once these facilities reach capacity, the Port of Portland will need to develop new facilities, or else turn away demand.
The Port of Vancouver shares many of the same attributes that make the Port of Portland an attractive place for marine shipping. Thus the Port of Vancouver is a logical place to site new marine terminals, if sites are unavailable in Portland.
From a regional perspective, it makes no difference whether terminal development occurs in Portland or Vancouver. Both cities function as part of the same regional economy, and share the same infrastructure and labor pool. However, at a local level, if demand for public marine terminals is shifted from Portland to Vancouver, the City of Portland would lose out on high-paying industrial jobs (and some of the residents that fill those jobs), which would have a detrimental effect on the Portland economy, and a
14 Haralambides, H.E. (2002), Center for Maritime Economics and Logistics, “Competition, Excess Capacity, and the Pricing of Port Infrastructure”.
PSC Recommended Draft - June 2012 EOA Section 1 Appendix C
Page 38 May 2012 ECONorthwest Portland Harbor, Industrial Land Supply
positive impact on Vancouver’s. In other words, some amount of economic activity (measured any number of ways: jobs, wages, output, value added, etc.) would occur in Vancouver, rather than Portland, and Portland would miss out on the resulting direct, indirect, and induced economic benefits.
Given the most recent forecasts of demand, and reasonable assumptions on current capacity and the likely size of new terminals, it would appear that the Port of Vancouver has a surplus of vacant industrial land to accommodate their likely future demand, and should the Port of Portland be unable to accommodate forecast growth, the Port of Vancouver could accommodate some (and perhaps all) of that growth. However, officials from the Port of Vancouver stress that a regional strategy will be necessary to respond to future demand for public marine terminals in the region, and if actual cargo volumes reflect the high-scenario projections from the BST forecasts, then the region is likely to have a significant shortfall of suitable land for new public marine terminals.
3.4 POTENTIAL FOR INCREASED EFFICIENCIES What is the potential for more efficient use of industrial harbor land?
The total amount of land inside the Portland city limits is essentially fixed. Unless submerged land is filled to create new dry land, the only way the City can get more land is to expand its boundaries, which is unlikely to occur due to the constraints of surrounding land. Therefore, the City is interested in using its supply of industrial land as efficiently as possible to accommodate the most economic activity.
3.4.1 RECENT TRENDS IN EFFICIENCY OF PORTLAND HARBOR LANDS
We examined trends in efficiency in the Portland Harbor using several measures. Because of data limitations (see Chapter 2 and Appendix A) we focused our analysis on the period between 2002 and 2008. We calculated the economic activity in the Portland Harbor for these years, measured in terms of employment, real market value, value added, and cargo tonnage. We then divided each of these measures by the number of developed industrial acres in the Portland Harbor for each year to get a measure of land efficiency: i.e., some amount of some measure of economic activity, per acre. We then looked as the change in that measure of efficiency over this period of time.
Recent trends in the Portland Harbor show different results, depending on the measure of efficiency used. These results are summarized in Exhibit 3-9.
PSC Recommended Draft - June 2012 EOA Section 1 Appendix C
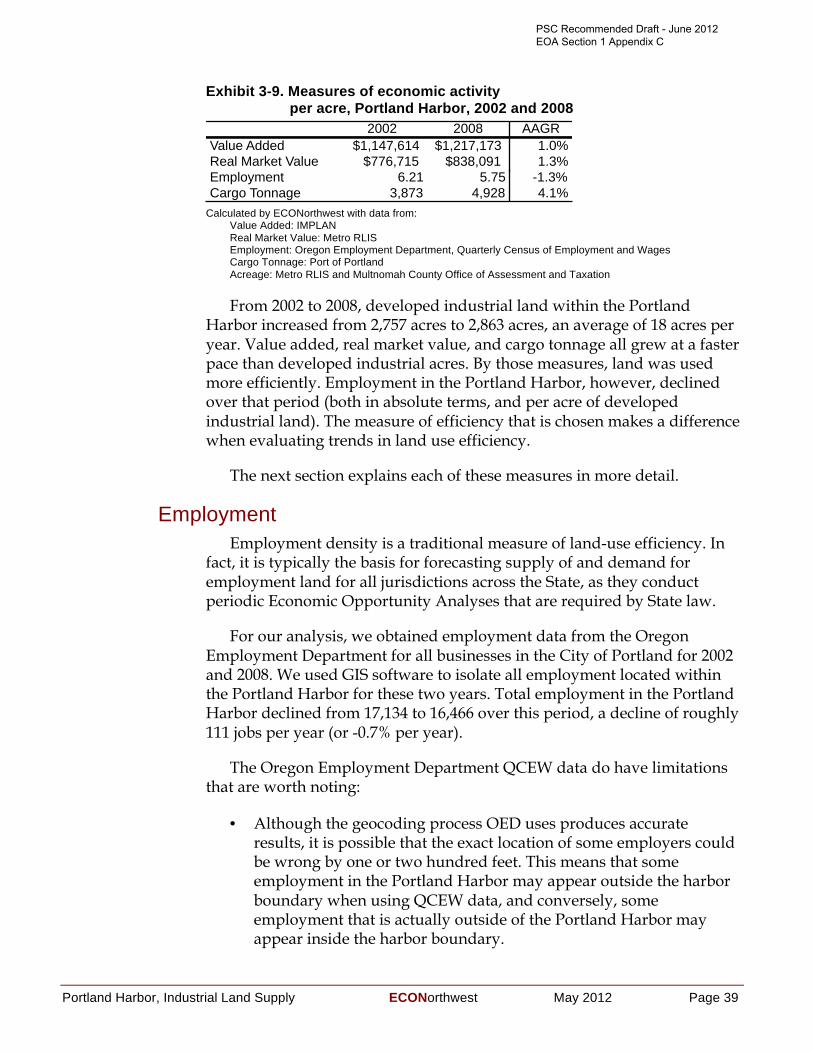
Portland Harbor, Industrial Land Supply ECONorthwest May 2012 Page 39
Exhibit 3-9. Measures of economic activity per acre, Portland Harbor, 2002 and 2008
Calculated by ECONorthwest with data from:
Value Added: IMPLAN Real Market Value: Metro RLIS Employment: Oregon Employment Department, Quarterly Census of Employment and Wages Cargo Tonnage: Port of Portland Acreage: Metro RLIS and Multnomah County Office of Assessment and Taxation
From 2002 to 2008, developed industrial land within the Portland Harbor increased from 2,757 acres to 2,863 acres, an average of 18 acres per year. Value added, real market value, and cargo tonnage all grew at a faster pace than developed industrial acres. By those measures, land was used more efficiently. Employment in the Portland Harbor, however, declined over that period (both in absolute terms, and per acre of developed industrial land). The measure of efficiency that is chosen makes a difference when evaluating trends in land use efficiency.
The next section explains each of these measures in more detail.
Employment Employment density is a traditional measure of land-use efficiency. In
fact, it is typically the basis for forecasting supply of and demand for employment land for all jurisdictions across the State, as they conduct periodic Economic Opportunity Analyses that are required by State law.
For our analysis, we obtained employment data from the Oregon Employment Department for all businesses in the City of Portland for 2002 and 2008. We used GIS software to isolate all employment located within the Portland Harbor for these two years. Total employment in the Portland Harbor declined from 17,134 to 16,466 over this period, a decline of roughly 111 jobs per year (or -0.7% per year).
The Oregon Employment Department QCEW data do have limitations that are worth noting:
• Although the geocoding process OED uses produces accurate results, it is possible that the exact location of some employers could be wrong by one or two hundred feet. This means that some employment in the Portland Harbor may appear outside the harbor boundary when using QCEW data, and conversely, some employment that is actually outside of the Portland Harbor may appear inside the harbor boundary.
2002 2008 AAGRValue Added $1,147,614 $1,217,173 1.0%Real Market Value $776,715 $838,091 1.3%Employment 6.21 5.75 -1.3%Cargo Tonnage 3,873 4,928 4.1%
PSC Recommended Draft - June 2012 EOA Section 1 Appendix C
Page 40 May 2012 ECONorthwest Portland Harbor, Industrial Land Supply
• Some firms have multiple locations, but may only report employment at one location (such as at a company headquarters). Depending on how a company reports multi-site employment, all of the company’s employment may be incorrectly reported as being inside or outside of the Portland Harbor boundary.
• QCEW data represents the number of covered workers. The data excludes members of the armed forces, the self-employed, proprietors, domestic workers, unpaid family workers, and railroad workers covered by the railroad unemployment insurance system. In the case of the Portland Harbor, the most important of these omissions is likely railroad workers. Other studies have shown a significant economic impact from railroad activity in the Portland Harbor, but these workers are excluded from the data.
We do not wish to imply that tracking employment density as a measure of economic activity is wrong or pointless. It is indeed an important measure, and one that the policy-makers, and the general public find useful for understanding the scale of economic activity. Despite the limitations listed above, the QCEW data is widely recognized as one of the most accurate employment data sources updated on an annual basis with site-specific data on all industries. We are just acknowledging that employment isn’t the only measure of economic activity, and due to its limitations, other alternative measures may prove more useful for evaluating the economic performance of the Portland Harbor.
Real market value Real market value is another typical measure of land-use efficiency. The
relationship is a fundamental principle of urban economics: higher prices reflect the relative scarcity of some type of land or location, and that relative scarcity causes developers to substitute capital for land (i.e., to build more intensively). Higher-value development typically translates into higher assessed values and property taxes, which is seen as a benefit to local governments.
For our analysis, we obtained real market value for all parcels in the Portland region from Metro RLIS data for 2002 and 2008. Using GIS software, we calculated the sum of the real market value of all parcels within the Portland Harbor. The Harbor saw real market values grow from $2.14 billion in 2006 to $2.40 billion in 2008, an average annual increase of 1.9%. However, the US Consumer Price Index grew by 3.0% per year over this same time period, indicating that real market value in the Portland Harbor grew at less than the pace of inflation.
Data on real market value for this time period should be treated cautiously. The local and national real estate markets were booming during
PSC Recommended Draft - June 2012 EOA Section 1 Appendix C
Portland Harbor, Industrial Land Supply ECONorthwest May 2012 Page 41
this period. Multnomah County real estate values grew at above average rates: more than 8% during this period. The region has now had three consecutive years of declining real market values since 2008; a detailed analysis of property values in the Portland Harbor would probably mirror these broader regional trends. Over a long period (long enough to include the ups and downs of several business cycles—say, 20 years) inflation-adjusted changes in real market value in the Portland Harbor might be a useful indicator of land-use efficiency. For shorter periods, it is not a measure that can be used without interpretation.
Value added Value added is a measure of economic activity that is not commonly
used to measure land use efficiency. Value added, simply defined, is the difference between the sale price and the production cost of a good or service.15 It is directly comparable to Gross Domestic Product (GDP) at the national level. Value added only considers the final cost of goods and services (the total of four components: wages, business income, other income, and indirect business taxes), and excludes the value of intermediate goods, to avoid double counting.
While value added is a good measure of economic activity at a regional level, the data are not typically collected at smaller geographic levels, and certainly are not available as time-series data at a parcel-specific level. This presents challenges for using value added as a measure of efficiency for the Portland Harbor.
We used the IMPLAN economic modeling software to obtain value added information for the smallest geographic areas possible (zip codes). ECO used the IMPLAN forecast of value added for the four zip codes that overlap the Portland Harbor for 2002 and 2008. Using a geographic boundary that is close to, but not exactly the same as, that of the Portland Harbor means that the measure of value added per gross developed acre should not be viewed as accurate in an absolute sense. But because our geographies and data sources were consistent in both years, the measure is still useful for observing trends over time.
Our analysis showed value added in the zip codes approximating the Portland Harbor increased from $3.16 billion in 2002 to $3.48 billion in 2008, an increase of 1.6% per year. However, the US Consumer Price Index grew by 3.0% per year over this same time period, indicating that value added in the Portland Harbor grew at less than the pace of inflation.
15 More accurately, the production costs are the outside purchases of materials and services, but do not count payments to employees for wages, salaries, and benefits. Thus, a lot of value added is a “return to labor;” it also includes returns to land and capital.
PSC Recommended Draft - June 2012 EOA Section 1 Appendix C
Page 42 May 2012 ECONorthwest Portland Harbor, Industrial Land Supply
Cargo The Port of Portland tracks cargo tonnage on a monthly basis and
publishes annual data, dating back 30 years. While the data are only available for Port of Portland public marine terminals, and not privately-operated terminals, they are a good proxy for cargo shipped in the Portland Harbor, and the most comprehensive historical data available. The Port data show cargo volumes (measured in short tons16) increased from 10.7 million in 2002 to 14.1 million in 2008, an increase of 4.8% per year. Over this period, cargo volumes experienced more robust growth than any of the other efficiency measures used in this analysis. In other words, despite a decline in employment, and modest gains in real market value and value added, the Portland Harbor saw strong growth in cargo volumes per developed acre of industrial land.
Note that is not the same as saying that land in the Portland Harbor is what generated or somehow caused that tonnage to go through the Port.
3.4.2 OPPORTUNITIES FOR INCREASED EFFICIENCIES The available data provide limited answers for understanding the
potential for industrial land in the Portland Harbor to be used more efficiently. To supplement them, we interviewed key stakeholders in the Portland Harbor to solicit their input on (1) ways to measure efficiency, (2) challenges to improving efficiency, and (3) strategies to overcome those challenges.
To conduct these interviews as efficiently as possible, ECO staff met with about a dozen members of the Working Waterfront Coalition (WWC), rather than conducting separate interviews with similarly qualified individuals. Established in 2005, the WWC is an organization of businesses concerned about the environmental health and economic vitality of the Portland Harbor. Members of the WWC who were interviewed for this project, included representatives of the following businesses and organizations:
16 2,000 pounds per ton, as opposed to metric tons (1,000 kilos, about 2,200 pounds).
PSC Recommended Draft - June 2012 EOA Section 1 Appendix C
DRAFT Portland Harbor, Industrial Land Supply ECONorthwest February 2012 Page 43
• The Greenbrier Companies
• CalPortland
• Northwest Pipe Company
• Schwabe, Williamson & Wyatt
• Kinder Morgan
• Smart Decisions
• Port of Portland
• Perkins Coie
• Schnitzer Steel
• Columbia Pacific Planning
• Evraz Oregon Steel Mills
Group members had different views based on their individual experiences in the Portland Harbor, yet the group as a whole agreed on most key points. Although no votes were taken at the meeting, the following points seemed to achieve consensus:
• The Portland Harbor has many attributes that provide a competitive advantage for water-dependent industrial activity. The Harbor benefits from its amazing connectivity: the confluence of two rivers, access to domestic markets via two major rail lines, inland waterways via the Columbia/Snake River system, and I-5 and I-84, and access to global markets via the Pacific Ocean. Having all of this connectivity in the heart of the City of Portland, with strong local policies in place to preserve harbor land for industrial use, creates a special place for water-dependent industrial firms. Members of the WWC recognize the importance of the Portland Harbor, and are committed to maintaining and enhancing its competitive advantages.
• The constrained land supply is an issue. Members of the WWC recognize that the industrial harbor land supply in the Portland region is fixed, and vacant developable land is rare and constrained. They believe this limitation is an important issue, and one that will become more important over time.
• Businesses adjust to these constraints by taking measures that have the effect increasing output on an existing site (i.e., of increasing land efficiency). Such measures include extra shifts, better machinery, tighter processing procedures, and more.
• There are bigger public policy issues that are affecting demand for new development in the Portland Harbor. While members of the WWC were concerned about the constrained land supply, they were more concerned with issues affecting demand: Superfund liability and a burdensome permitting process.
• Superfund liability. The specter of the Superfund is hanging over the heads of all property owners in the Portland Harbor. They know that their liability for the Willamette River cleanup effort will be significant, but they do not know what their individual liability will be, or when a final agreement will be
PSC Recommended Draft - June 2012 EOA Section 1 Appendix C
Page 44 May 2012 ECONorthwest Portland Harbor, Industrial Land Supply
reached. Members of the WWC expressed concern that it is nearly impossible to sell land in the Portland Harbor for new industrial development until a final agreement has been reached on the Superfund liability.
• Permitting process. Members of the group believe the local permitting processes to be time consuming, costly, and uncertain. Such beliefs are typical of most cities. But members of the group who operate facilities across the globe expressed their view that Portland’s permitting process is more costly and difficult than most other places they do business. An implication for land efficiency is that permitting, its other intended benefits notwithstanding, makes private sector efforts to improve sites and increase efficiency more difficult. Thus, the City should be sure that the intended benefits are worth the tradeoff, and adjust its permitting process if they do not appear to be.
• Traditional measures of efficiency do not apply for harbor industrial land, and alternative measures should be used. Regarding the efficiency of land use, members of the WWC supported the conclusions of this report, that traditional measures (employment, real market value, and FAR) are ill suited for measuring the performance of water-dependent industrial land. The group suggested other measures of economic output, such as value added and cargo tonnage, are more appropriate measures of land-use efficiency in the Portland Harbor.
3.4.3 IMPLICATIONS In our opinion, the main value of this attempt to measure land-use
efficiency was to show what a slippery notion it is, and why simple statements about that efficiency are more likely to derive from opinion and a simple causal model than from an even semi-rigorous empirical analysis. In other words, things are complicated.
For example, many would say that land is being used more efficiently if it accommodates more employees. That kind of definition would be consistent with land-use planning practice and law in Oregon. By that measure, land use efficiency in the Portland Harbor decreased from 2002 to 2008.
But an alternative view—and one more likely to be taken by economists—is that labor (employment) and land are both inputs to a production process. They may be substitutes, or at least there is no necessity that they move together. If a business can use less land and even less labor and still increase its production, it is getting more efficient. If a lot
PSC Recommended Draft - June 2012 EOA Section 1 Appendix C
Portland Harbor, Industrial Land Supply ECONorthwest May 2012 Page 45
of businesses in an area are increasing their output on the same land they have always been on, then “land efficiency” can be said to be increasing.
In Portland Harbor the data shows mixed results. Despite declining employment, and growth in real market value and value added that is less than the rate of inflation, the Portland Harbor experienced an increase in efficiency as measured by cargo tonnage. If the City is interested in generating the most economic activity on the fixed supply of harbor industrial land, then value added and cargo tonnage may be more appropriate measures than employment. But these measures are inconclusive on whether the harbor increased in land use efficiency from 2002 to 2008.
That last point leads to a suggestion for policy discussion: instead of talking broadly about “land efficiency,” talk specifically about changes in certain economic output per acre. Accept that there are different measures of output, and track several of them. That is what we did above. Our conclusion is that some measures of economic output have been increasing faster than vacant land is being converted to developed land, and other measures have not. The region should continue to track these measures, and adopt policies with the intention of increasing measures of economic output faster than vacant land is converted to developed land. This seems like a good objective for people with different passions: economic development, environmental amenity, or smart growth.
Finally, our simple analysis does not answer other questions that could be important for policy, such as (1) What is causing the increase or decrease in economic activity? (2) How does that change compare with other areas in the Portland region, or with other port areas in the U.S.? and (3) What policies would allow for even greater growth?
PSC Recommended Draft - June 2012 EOA Section 1 Appendix C

PSC Recommended Draft - June 2012 EOA Section 1 Appendix C
DRAFT Portland Harbor, Industrial Land Supply ECONorthwest February 2012 Page 47
Chapter 4 SUMMARY OF FINDINGS This report focused on issues related to the demand for and supply of
land for water-dependent industrial employment in the Portland Harbor (about 4,000 acres of land along the Willamette River, from approximately the I-405 Bridge north of downtown to the confluence of the Willamette and Columbia Rivers). Its main conclusions are:
• The City and its partner agencies have spent years in study and data development for the study area. The City’s mapping of vacant parcels is detailed and support its conclusion that outside of land already in Port of Portland Terminals, the best potential sites in the study area of a location and size that a new marine terminal would require are Atofina and Time Oil.
• These two sites meet mandatory criteria for minimum size (more than 50 acres) and location (frontage on the Willamette River) for a new marine terminal. That makes them possible sites, but not necessarily likely sites. The analysis in this report reconfirms findings of previous studies: small size and a lot of site constraints (especially the need to deal with the legal liabilities of prior soil contamination) make development of these sites for a marine terminal challenging.
• Even using the most detailed and recent data available, it is difficult to predict future land needs for public marine terminals with precision. While the potential land need through 2040 varies greatly depending on key assumptions, the most-likely scenario shows that the Port of Vancouver may, in theory, have enough developable land to accommodate regional growth in cargo volumes through 2040. In practice, however, competing demands for Port of Vancouver lands, competition among and public policies of affected jurisdictions, and the potential for higher growth in cargo volumes all make it possible, if not likely, that the land controlled by the Port of Vancouver would not be able to accommodate all of the regional demand for marine cargo.
• Regarding the efficiency of land use, for the time periods evaluated, we found a decline in employment, modest growth in real market value and value added (though less than the rate of inflation), and stronger growth in cargo volumes per developed acre of industrial land. The mixed results of the various measures of economic activity prevent us from drawing a strong conclusion. The region should continue to track these measures, and adopt policies with the intention of increasing measures of economic output faster than vacant land is converted to developed land. This seems like an objective that could appeal to people with different interests: economic development, environmental amenity, or smart growth.
PSC Recommended Draft - June 2012 EOA Section 1 Appendix C
Portland Harbor, Industrial Land Supply ECONorthwest May 2012 Page 1 Appendix A: Framework and Methods
Appendix A Research Approach Section A.1 describes why getting clear about definitions and assumptions at the beginning of a study is important. Section A.2 discusses a framework for evaluation: concepts that underlie any evaluation of this type. It discusses (1) definitions of industrial use and industrial land, (2) factors relating to the supply of and demand for industrial land, (3) the role of industrial activity in the economy and (3) the concept of land efficiency: what is it, why does it matter, and how is it measured. Section A.3 is more specific about the methods used for the evaluation (review of previous studies, secondary data, case studies, interviews) and how they are used to address four key questions: about land supply for water-dependent uses, a new marine terminal, the role of Vancouver in the regional land supply for marine terminals, and land efficiency.
A.1 OVERVIEW The purpose of research on public policy issues to provide information
to a public debate about public action. The research informs decisions; it does not make decisions. Those decisions are usually made by elected and appointed officials on behalf of the citizens they represent.
Some of the issues that require action are controversial. People and groups have different opinions about the extent of the problem, its causes, and best ways it can be mitigated. Ultimately, most solutions that get adopted are a result of debate and compromise. Fundamental to a productive debate about problems and solutions are (1) an agreement on definitions, and (2) clarity about assumptions. Many discussions fail to lead to consensus on action because there was never consensus on definitions. Moreover, it is common for evaluation results to depend more on the assumptions selected than on the data collected in support of those assumptions.
Thus, the analysis in this report starts by trying to describe clearly the context for the questions being asked. That context is a foundation from which to identify data sources and analytical methods. Stated another way, the methods used for evaluation should be consistent with generally accepted ideas about how a regional economy and industrial development work. What do theory and prior empirical work suggest are fundamental contributors to (causes of) economic activity and industrial development, and which of those factors are most closely related to the questions this study is addressing?
Section A.2 provides a framework for evaluation: evaluation concepts that underlie any evaluation of this type. Section A.3 then discusses more specific methods for data collection and analysis that are consistent with that framework.
Page 2 May 2012 ECONorthwest Portland Harbor, Industrial Land Supply Appendix A: Framework and Methods
A.2 FRAMEWORK FOR THE EVALUATION This section discusses a framework for evaluation. It discusses (1)
definitions of key concepts used in the analysis, (2) the role of industrial activity in the economy, (3) factors relating to the supply of and demand for industrial land, and (4) the concept of land efficiency: what it is, why it matters, and how it is measured.
A.2.1 WHY CARE ABOUT INDUSTRIAL LAND? No city or region exists that does not engage in economic activity. A
concentration of economic activity is a defining characteristic of all cities.
A substantial but inconclusive literature investigates which economic activities provide the greatest net benefits to cities. Most of that literature assumes, at least implicitly, that (1) specialization allows consumers to get a variety of goods and services at lower prices; (2) if places specialize where they have comparative advantages, they will (a) produce goods more efficiently and be more competitive, but (b) have to trade to get everything they want; and (3) trading requires having something to trade; it means exporting some goods and services so that that money is available to pay for imports. It is that logic that leads economic development specialists to emphasize the importance of growing and retaining local firms that export goods and services: the payment for those exports brings money into the local economy that, among other things, allows purchases of desired goods and services not provided in the local economy.
Whether industrial activity generates larger economic benefits than other economic activities is a matter of debate in the professional literature of development economics.1 Most economic development practitioners, however, believe that:
• Manufacturing is central to a strong regional economy (for a variety of reasons related to assumptions about greater value added, export
1 See a recent debate sponsored by The Economist on the motion “This house believes that an economy cannot succeed without a big manufacturing base.” (http://www.economist.com/debate/days/view/714; accessed 24 August 2011). The opening remarks of the moderator stated “Our topic for the next few days is one that has divided economic practitioners and commentators for as long as anyone can remember: how important is manufacturing?” Hypothetically, if the U.S. were manufacturing more products being sold abroad, its debt would be less. But are global and U.S. economic conditions such that manufacturing is the comparative advantage of the U.S.; maybe it should be exporting services (e.g., financial, accounting, medical, engineering, and so on) instead. Pro and con arguments are posted on-line and readers vote. Readers voted 3 to 1 in favor of the proposition.
Portland Harbor, Industrial Land Supply ECONorthwest May 2012 Page 3 Appendix A: Framework and Methods
orientation, multiplier effects, average wages, and employment social diversity) and their missions.2
• By extension, the supply of land to accommodate manufacturing (i.e., industrial land) is important: too little industrial land hinders the growth or utilization of regional economic capacity. It is not uncommon for economic development discussions to include a statement that a region lacks sufficient land for industrial development at what someone has judged to be reasonable prices.
While proponents of manufacturing and industrial development have arguments and data to support their beliefs, so do groups that have different opinions about the importance of manufacturing relative to other sectors. Some of their arguments: too much industrial land could impose opportunity costs on the regional economy and hinder the growth or utilization of regional economic capacity; land markets and resulting land price should be allocating land to highest and best use, and that preserving land for industrial users at the exclusion of non-industrial users would reduce regional economic well-being.
The disagreement between groups stems from different assumptions about the value of industrial uses on particular parcels of land relative to alternative uses. In debates about public policy on land use and development, advocates for any particular use usually argue that:
• Their preferred use of the lands in question generates greater net benefits for a region than the other potential uses.
• Regions should preserve lands for their preferred use even if other users are willing to pay higher prices for these lands. Stated differently, all sides frequently assume that their uses produce positive externalities for a local economy that justify the effective subsidy associated with keeping other users that might pay more for the lands at issue.
• Where the alternative use would pay less for land than their preferred use, their arguments go the other way: the preferred uses generate greater net benefits to a region because the alternative uses will not generate sufficient positive externalities to offset the lost consumer and producer surplus that results from requiring the land to be used for purposes that the market prices do not show to be the highest and best use.
2 One should note, however, the likelihood of self-selection bias here: local economic development has typically been funded with a mission to retain and attract manufacturing jobs, and people attracted to the field of economic development are likely to start with or acquire that point of view.
Page 4 May 2012 ECONorthwest Portland Harbor, Industrial Land Supply Appendix A: Framework and Methods
The arguments for public-sector involvement in urban land markets (e.g., planning, zoning, urban renewal) are based fundamentally on arguments about external effects that are not incorporated into the market price of land transactions. Proponents for policies favoring industrial land (or any type of land use3) might make both sides of the argument: because of the important external benefits of industrial use (1) protect industrial land from being converted to uses that will pay more for that land, and (2) do not prohibit industrial uses from converting other land to industrial uses when it is willing to pay more for the land than those other uses.
This study cannot resolve the longstanding debate about the net benefits of industrial uses and land relative to other uses and land. Rather, this study starts from the assumption, embedded in the economic development policies of all local governments in the region, that the retention and expansion of industrial sectors is something that the region desires. The City of Portland specifically addresses industrial land uses in its Comprehensive Plan and Zoning Code. The Urban Development goal of the Comprehensive Plan calls for industrial sanctuaries, where industrial land is preserved for manufacturing purposes exclusively. This stance is reiterated in Goal 5: Economic Development, which identifies retention of industrial sanctuary zones, including maximizing linkages with and within these areas, as a primary objective. These policies are implemented via the city’s zoning code, which restricts certain commercial uses in industrial zones and only permits changes to Industrial and Employment Comprehensive Plan designations, if stringent criteria are met. These policies demonstrate the City of Portland’s commitment to protecting industrial lands for industrial use. With this commitment in mind, this study then investigates land and in the Portland Harbor to see what capacity they have (given different assumptions about user types and changes in technology and operations) to accommodate industrial users.
A.2.2 DEFINING INDUSTRIAL LAND AND USERS A.2.2.1 Industrial land
What is commonly referred to as “industrial” land is land designated by a local government (in its comprehensive plan, implemented by its zoning ordinances) to allow (but not necessarily require) industrial uses.4 Thus, land may be defined by public policy (e.g., plan or zone designation) or by actual uses. Such definitions may lead to an identification of roughly the
3 For example, the fundamental argument for the preservation for West Hayden Island is that such preservation has external natural and social benefits that make the land more valuable to the region in its natural state than in development.
4 Much of the overview in section A.2.2 is drawn from previous work ECO has done on industrial lands, especially work for the City of Tukwila, WA.
Portland Harbor, Industrial Land Supply ECONorthwest May 2012 Page 5 Appendix A: Framework and Methods
same land, but they are not identical. Industrial uses exist on land not zoned for those uses, and non-industrial uses exist on lands zoned industrial. Either definition, or both, may be appropriate for a particular policy issues.
A smaller subset of industrial land pertinent in this study is “harbor” land. That land could be defined in any of several ways. It could be, for example, land parcels that are within the boundaries defined for this study and also:
• With docking facilities
• Abutting a navigable waterway
• With active water-dependent industries (however “water-dependent” may be defined
• Owned by the Port of Portland
• Any combination of the above.
For this study, we use the City’s definition of the “Portland Harbor,” based on land designated industrial by the City’s Comprehensive Plan in close proximity to the Willamette River. A map of the City’s harbor lands is shown below in Exhibit A-1.
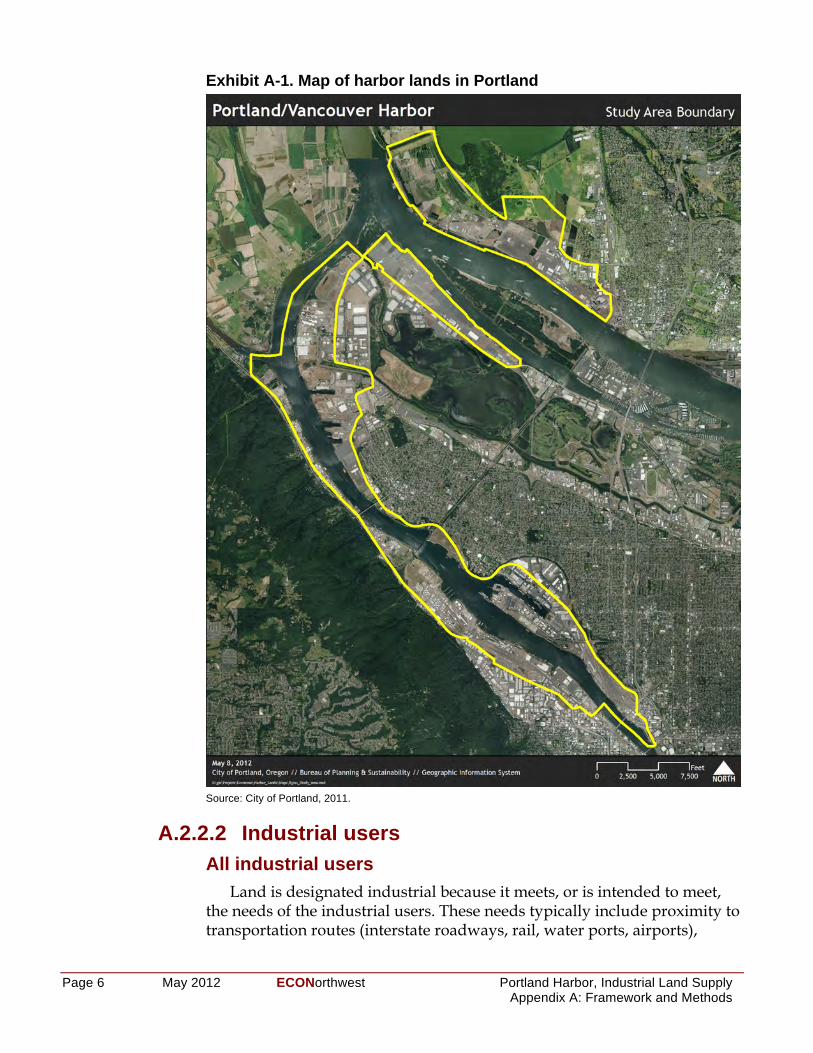
Page 6 May 2012 ECONorthwest Portland Harbor, Industrial Land Supply Appendix A: Framework and Methods
Exhibit A-1. Map of harbor lands in Portland
Source: City of Portland, 2011.
A.2.2.2 Industrial users All industrial users
Land is designated industrial because it meets, or is intended to meet, the needs of the industrial users. These needs typically include proximity to transportation routes (interstate roadways, rail, water ports, airports),
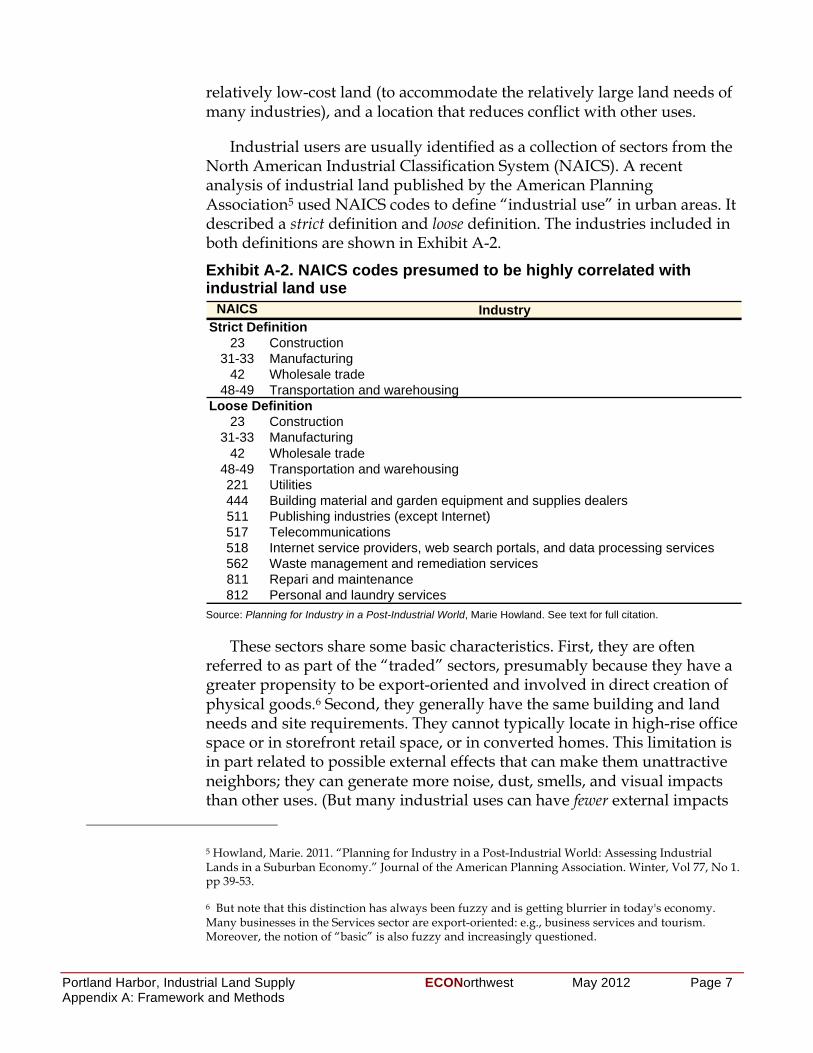
Portland Harbor, Industrial Land Supply ECONorthwest May 2012 Page 7 Appendix A: Framework and Methods
relatively low-cost land (to accommodate the relatively large land needs of many industries), and a location that reduces conflict with other uses.
Industrial users are usually identified as a collection of sectors from the North American Industrial Classification System (NAICS). A recent analysis of industrial land published by the American Planning Association5 used NAICS codes to define “industrial use” in urban areas. It described a strict definition and loose definition. The industries included in both definitions are shown in Exhibit A-2.
Exhibit A-2. NAICS codes presumed to be highly correlated with industrial land use
Source: Planning for Industry in a Post-Industrial World, Marie Howland. See text for full citation.
These sectors share some basic characteristics. First, they are often referred to as part of the “traded” sectors, presumably because they have a greater propensity to be export-oriented and involved in direct creation of physical goods.6 Second, they generally have the same building and land needs and site requirements. They cannot typically locate in high-rise office space or in storefront retail space, or in converted homes. This limitation is in part related to possible external effects that can make them unattractive neighbors; they can generate more noise, dust, smells, and visual impacts than other uses. (But many industrial uses can have fewer external impacts
5 Howland, Marie. 2011. “Planning for Industry in a Post-Industrial World: Assessing Industrial Lands in a Suburban Economy.” Journal of the American Planning Association. Winter, Vol 77, No 1. pp 39-53.
6 But note that this distinction has always been fuzzy and is getting blurrier in today's economy. Many businesses in the Services sector are export-oriented: e.g., business services and tourism. Moreover, the notion of “basic” is also fuzzy and increasingly questioned.
NAICS IndustryStrict Definition
23 Construction31-33 Manufacturing
42 Wholesale trade48-49 Transportation and warehousing
Loose Definition23 Construction
31-33 Manufacturing42 Wholesale trade
48-49 Transportation and warehousing221 Utilities444 Building material and garden equipment and supplies dealers511 Publishing industries (except Internet)517 Telecommunications518 Internet service providers, web search portals, and data processing services562 Waste management and remediation services811 Repari and maintenance812 Personal and laundry services
Page 8 May 2012 ECONorthwest Portland Harbor, Industrial Land Supply Appendix A: Framework and Methods
of some types than businesses in other sectors have: e.g., on traffic). The limitation also relates to their general need for cheap land and proximity to transportation routes.
The industrial sectors shown in Exhibit A-2 are defined by industrial activities, but the list does not necessarily reflect the types of businesses that require industrial land. For example, many jobs in the construction industry are not physically located at a central, industrial location, but instead operate on sites throughout the region. Similarly, many utility jobs in the region are often in office towers in the Central City, and do not require industrial land. Therefore, the list of NAICS codes that constitute industrial uses (as defined by the American Planning Association) do not necessarily reflect the range of businesses that would have demand for industrial land in Portland.
Water-dependent industrial users For this analysis, more important than “all industrial” users is the subset
of industrial users that are either “water dependent” or “water related.” Every type of job must, by definition, fit into one of 17 broad (“two-digit”) NAICS categories. But at the most detailed level (six-digit) there are about 1,175 categories. If one wants information about “water-dependent” employment, one must define it as some combination of NAICS codes, and those codes, even at the finest level of disaggregation, may have firms that one might call water-dependent and others one would not. No standard data source defines business this way; one has to either combine NAICS codes or do primary research (e.g., site evaluations of phone surveys).
Even seemingly obvious NAICS codes like 3366, ship and boat building, may not be completely populated by water-dependent firms: smaller pleasure boats may be built or refurbished for shipping by truck or rail. And codes that may appear to have little to do with water (e.g., 3112, oil seed and grain milling) may have reasons to be close to the water because of the importance of bulk shipment. This report does not conduct analysis that requires a definition of water-dependent industrial users, and because of the difficulties of defining water-dependent industries by NAICS codes, we have not attempted to do so.
The City of Portland defines river-dependent uses as those that can be carried out only on, in, or adjacent to a river because they require access to the river for waterborne transportation or recreation. Included is any development, which by its nature, can be built only on, in, or over a river. The zoning language, however, does not distinguish specific water-dependent industrial uses.
Portland Harbor, Industrial Land Supply ECONorthwest May 2012 Page 9 Appendix A: Framework and Methods
Public marine terminals Our analysis treats public marine terminals (i.e., the Port of Portland
facilities) differently from other users of harbor industrial land. These port terminals function as public infrastructure, facilitating economic activity for other industries in the region. In this report, we examine certain questions related to broader harbor industrial land efficiencies, and other questions related to land supply specifically for new public marine terminals.
A.2.3 EVALUATING THE SUPPLY OF AND DEMAND FOR INDUSTRIAL LANDS
This section looks at how cities answer critical questions like: How much developable industrial land is there? How is it likely to be used? Will it be enough for the expected demand in the future?
A.2.3.1 Supply of industrial land The total amount of land inside the Portland city limits is essentially
fixed. Unless submerged land is filled to create new dry land, the only way the City can get more land is to expand its boundaries. But such expansions are unlikely, because the City is mainly surrounded by rivers, protected areas (Forest Park), and incorporated municipalities.
Thus, for the City of Portland, the question of land supply focuses on how much land is vacant, partially vacant, or underutilized, and how much land is constrained (by environmental contamination, environmental overlays, and other issues).
The Bureau of Planning and Sustainability (BPS) at the City of Portland has done extensive work to characterize the land supply in the Portland Harbor. It uses state-of-the-practice procedures (e.g., GIS data layers) consistent with Oregon planning law (e.g., statutes and administrative rules for statewide Goals 9 and 14).
Exhibit A-4 shows the typical process for categorizing and evaluating land supply. In summary:
• All land is either fully developed or not.
• If not, it is either (1) under development (in the pipeline), (2) buildable, or (3) not buildable (because of prohibitive physical or policy constraints.
• If buildable, a parcel of land may be (1) fully vacant, (2) partially vacant, or (3) potentially redevelopable.
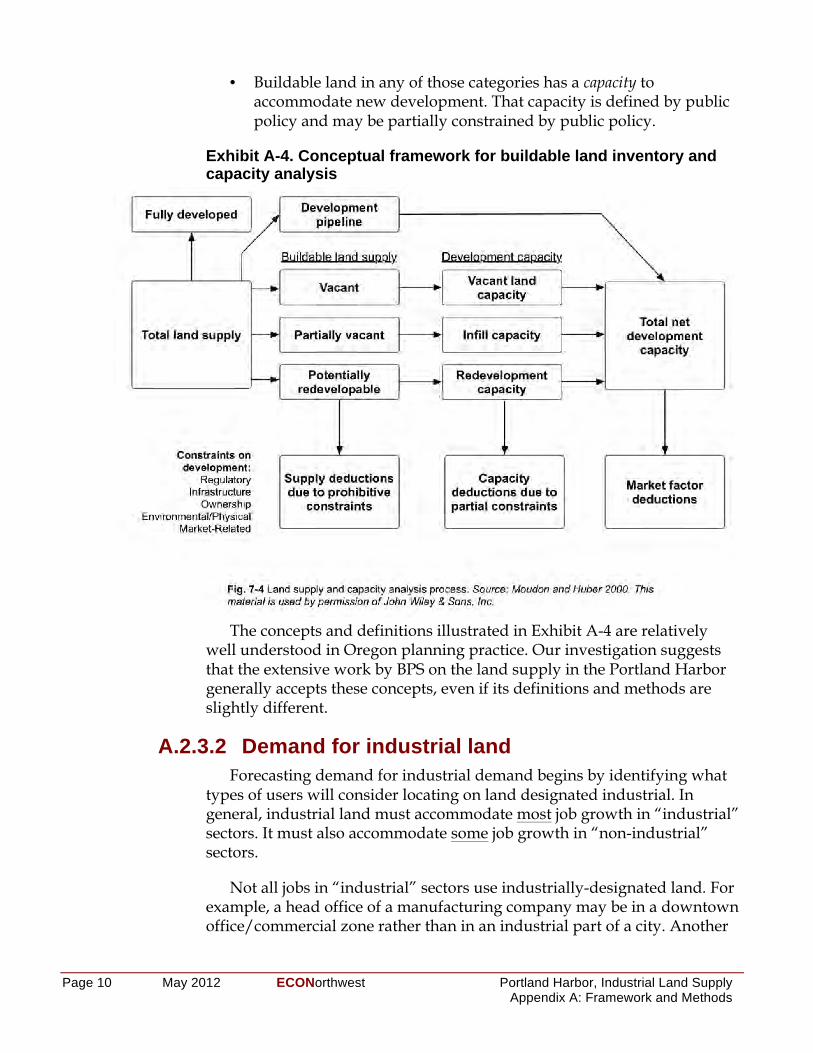
Page 10 May 2012 ECONorthwest Portland Harbor, Industrial Land Supply Appendix A: Framework and Methods
• Buildable land in any of those categories has a capacity to accommodate new development. That capacity is defined by public policy and may be partially constrained by public policy.
Exhibit A-4. Conceptual framework for buildable land inventory and capacity analysis
The concepts and definitions illustrated in Exhibit A-4 are relatively
well understood in Oregon planning practice. Our investigation suggests that the extensive work by BPS on the land supply in the Portland Harbor generally accepts these concepts, even if its definitions and methods are slightly different.
A.2.3.2 Demand for industrial land Forecasting demand for industrial demand begins by identifying what
types of users will consider locating on land designated industrial. In general, industrial land must accommodate most job growth in “industrial” sectors. It must also accommodate some job growth in “non-industrial” sectors.
Not all jobs in “industrial” sectors use industrially-designated land. For example, a head office of a manufacturing company may be in a downtown office/commercial zone rather than in an industrial part of a city. Another
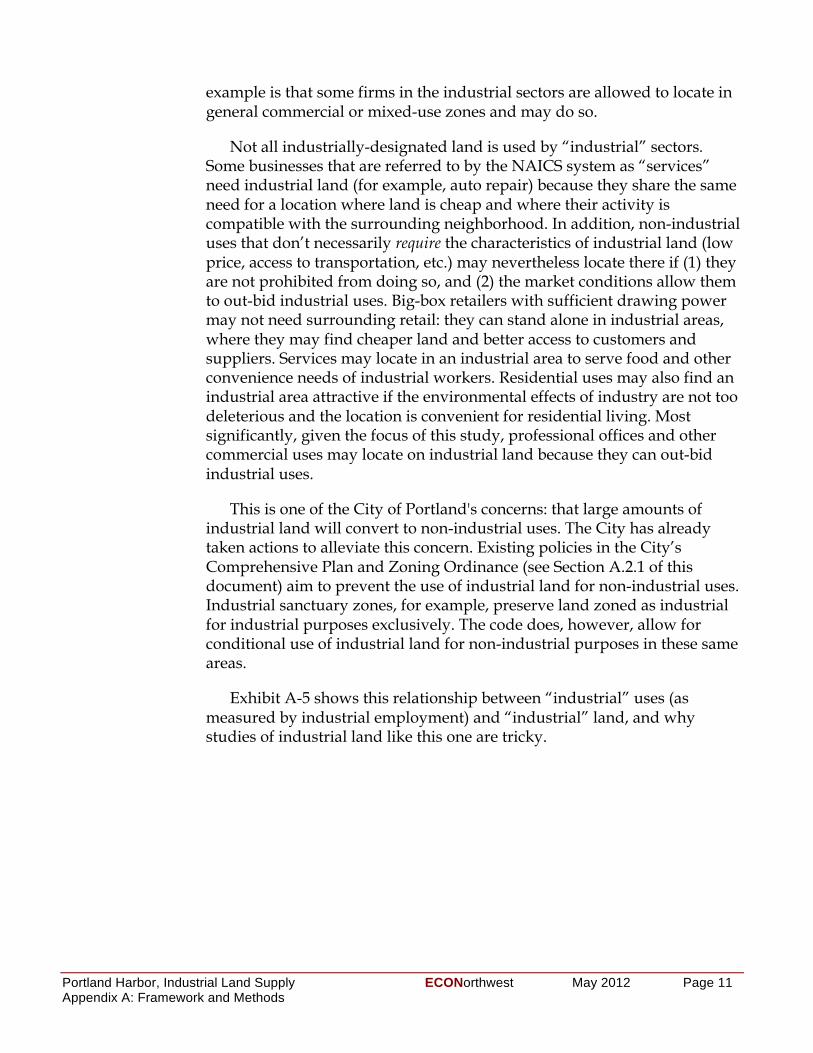
Portland Harbor, Industrial Land Supply ECONorthwest May 2012 Page 11 Appendix A: Framework and Methods
example is that some firms in the industrial sectors are allowed to locate in general commercial or mixed-use zones and may do so.
Not all industrially-designated land is used by “industrial” sectors. Some businesses that are referred to by the NAICS system as “services” need industrial land (for example, auto repair) because they share the same need for a location where land is cheap and where their activity is compatible with the surrounding neighborhood. In addition, non-industrial uses that don’t necessarily require the characteristics of industrial land (low price, access to transportation, etc.) may nevertheless locate there if (1) they are not prohibited from doing so, and (2) the market conditions allow them to out-bid industrial uses. Big-box retailers with sufficient drawing power may not need surrounding retail: they can stand alone in industrial areas, where they may find cheaper land and better access to customers and suppliers. Services may locate in an industrial area to serve food and other convenience needs of industrial workers. Residential uses may also find an industrial area attractive if the environmental effects of industry are not too deleterious and the location is convenient for residential living. Most significantly, given the focus of this study, professional offices and other commercial uses may locate on industrial land because they can out-bid industrial uses.
This is one of the City of Portland's concerns: that large amounts of industrial land will convert to non-industrial uses. The City has already taken actions to alleviate this concern. Existing policies in the City’s Comprehensive Plan and Zoning Ordinance (see Section A.2.1 of this document) aim to prevent the use of industrial land for non-industrial uses. Industrial sanctuary zones, for example, preserve land zoned as industrial for industrial purposes exclusively. The code does, however, allow for conditional use of industrial land for non-industrial purposes in these same areas.
Exhibit A-5 shows this relationship between “industrial” uses (as measured by industrial employment) and “industrial” land, and why studies of industrial land like this one are tricky.
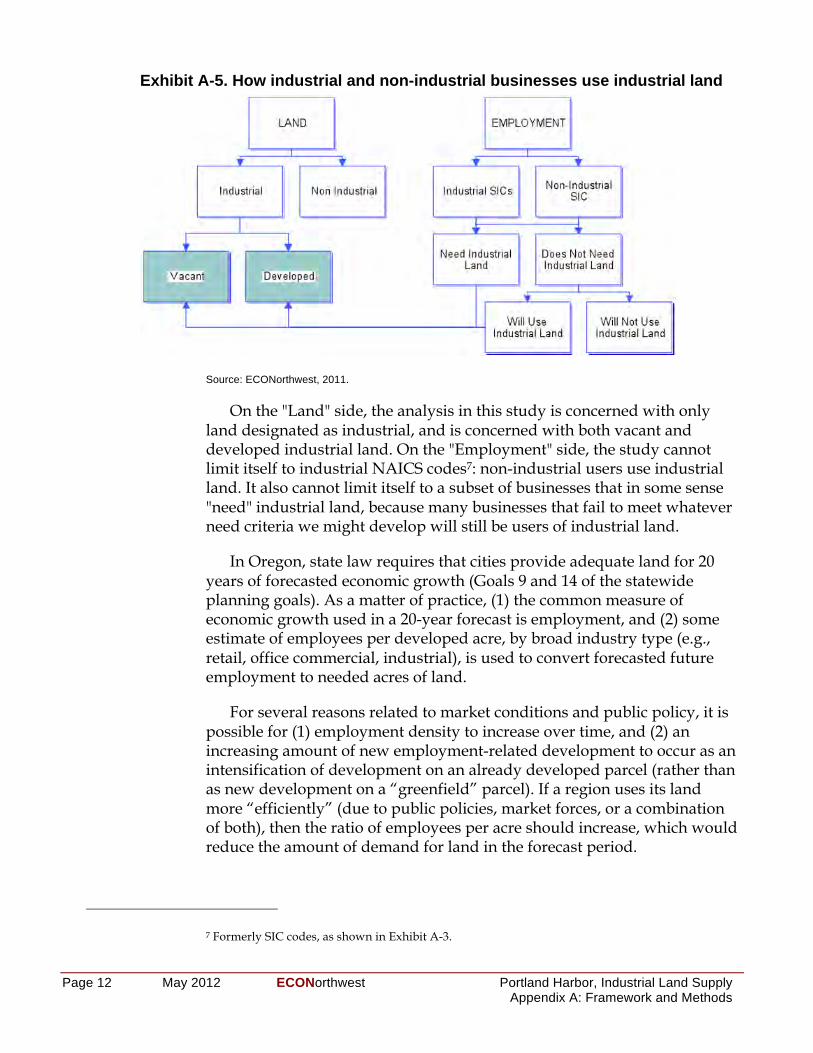
Page 12 May 2012 ECONorthwest Portland Harbor, Industrial Land Supply Appendix A: Framework and Methods
Exhibit A-5. How industrial and non-industrial businesses use industrial land
Source: ECONorthwest, 2011.
On the "Land" side, the analysis in this study is concerned with only land designated as industrial, and is concerned with both vacant and developed industrial land. On the "Employment" side, the study cannot limit itself to industrial NAICS codes7: non-industrial users use industrial land. It also cannot limit itself to a subset of businesses that in some sense "need" industrial land, because many businesses that fail to meet whatever need criteria we might develop will still be users of industrial land.
In Oregon, state law requires that cities provide adequate land for 20 years of forecasted economic growth (Goals 9 and 14 of the statewide planning goals). As a matter of practice, (1) the common measure of economic growth used in a 20-year forecast is employment, and (2) some estimate of employees per developed acre, by broad industry type (e.g., retail, office commercial, industrial), is used to convert forecasted future employment to needed acres of land.
For several reasons related to market conditions and public policy, it is possible for (1) employment density to increase over time, and (2) an increasing amount of new employment-related development to occur as an intensification of development on an already developed parcel (rather than as new development on a “greenfield” parcel). If a region uses its land more “efficiently” (due to public policies, market forces, or a combination of both), then the ratio of employees per acre should increase, which would reduce the amount of demand for land in the forecast period.
7 Formerly SIC codes, as shown in Exhibit A-3.
Portland Harbor, Industrial Land Supply ECONorthwest May 2012 Page 13 Appendix A: Framework and Methods
While employment is typically the measurement used to forecast demand for land, it may not be the best measurement for forecasting industrial land demand. Later, this appendix discusses other measurements that could be used to forecast demand, and to measure land efficiency.
A.2.3.3 Comparing supply and demand Factors affecting demand and factors affecting supply are not
independent: in theory those factors interact to result in a market clearing price. Businesses and developers do not necessarily choose the cheapest land or the best (most expensive) land: they choose the land with the best value. In other words, price makes a difference. Below are some key points that describe how factors of supply and demand interact to determine where industrial development occurs:
• In any production processes, businesses try to economize on scarce (relatively expensive) resources by finding substitutes or changing the production process. For example, if serviced lands become scarcer, their prices should increase and businesses will substitute other factors (e.g., equipment) for land. In other words, as land gets scarcer, its price should rise and it should get used more intensively.
• With a fixed supply of total land, the supply of vacant, buildable land will decrease as development occurs.
• As the supply decreases (and as the real costs of providing services to that land increase), the price of land for new development will increase.
• As the price increases, users of land (businesses and developers) will try to economize on the use of land. They may do that by (1) using the available land in Portland more intensively, (2) choosing locations in other cities in the region more distant from the center that have more and less expensive buildable land, or, if no land elsewhere in the region has the desirable attributes at an affordable price, then (3) locating somewhere other than the Portland region.
Exhibit A-6 shows some of the many factors that affect the absorption of employment built space and land.
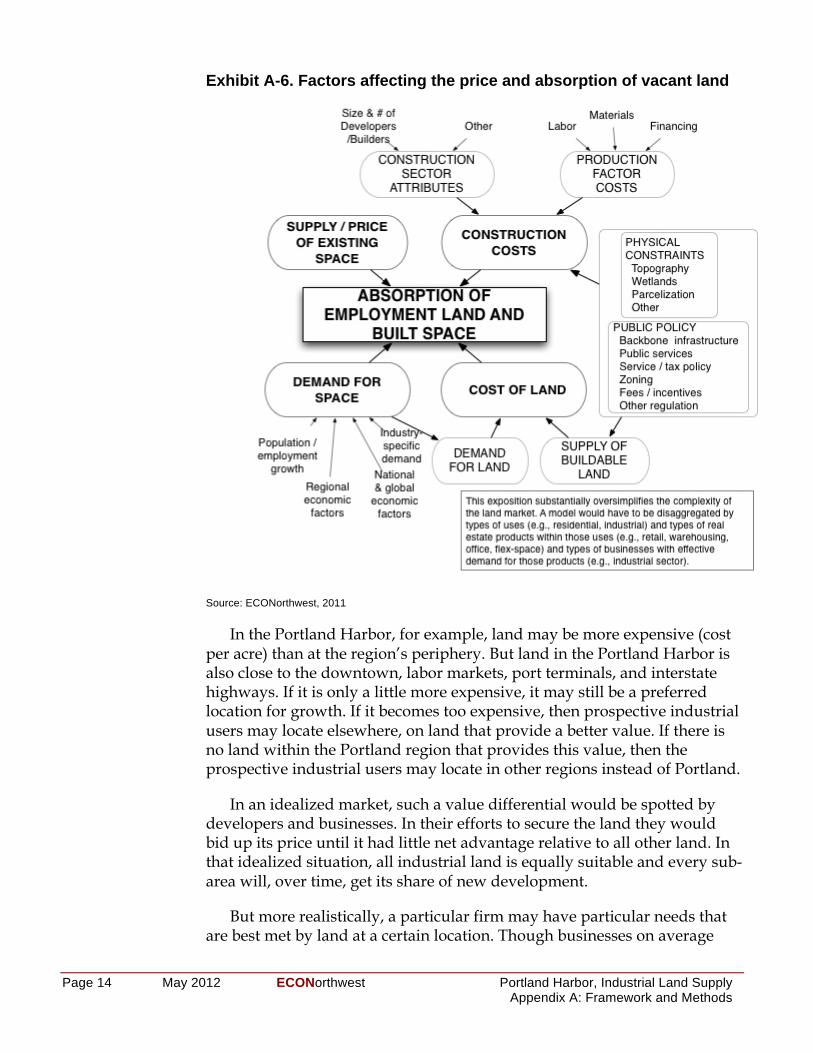
Page 14 May 2012 ECONorthwest Portland Harbor, Industrial Land Supply Appendix A: Framework and Methods
Exhibit A-6. Factors affecting the price and absorption of vacant land
Source: ECONorthwest, 2011
In the Portland Harbor, for example, land may be more expensive (cost per acre) than at the region’s periphery. But land in the Portland Harbor is also close to the downtown, labor markets, port terminals, and interstate highways. If it is only a little more expensive, it may still be a preferred location for growth. If it becomes too expensive, then prospective industrial users may locate elsewhere, on land that provide a better value. If there is no land within the Portland region that provides this value, then the prospective industrial users may locate in other regions instead of Portland.
In an idealized market, such a value differential would be spotted by developers and businesses. In their efforts to secure the land they would bid up its price until it had little net advantage relative to all other land. In that idealized situation, all industrial land is equally suitable and every sub-area will, over time, get its share of new development.
But more realistically, a particular firm may have particular needs that are best met by land at a certain location. Though businesses on average
Portland Harbor, Industrial Land Supply ECONorthwest May 2012 Page 15 Appendix A: Framework and Methods
may be filling to pay only, say, $5 per square foot for the land, such a firm may be willing to pay, say, $8 per square foot. Thus, the question becomes one of making some assessment of whether the particular package of land attributes for properties in the Portland Harbor is going to be especially desired by some subset of businesses (e.g., water-dependent businesses).
A.2.4 “EFFICIENT” USE OF INDUSTRIAL LAND Efficiency is a measurement of how much output is produced per unit
of input. Thus, an efficiency measure requires a numerator (output) and a denominator (input). In this case, we care about the amount of economic activity (output) generated per acre of land (input). The denominator—acres—is relatively clear in theory and straightforward to measure. Thus, the bigger challenge is in choosing and measuring the numerator: economic activity. This section describes the various ways to measure efficiency of industrial land, and why some of these measures may be more appropriate than others.
If land use in an area becomes more efficient, then any given amount of economic activity will require less land than it would have otherwise. In an area with a fixed supply of industrial land, like the Portland Harbor, it makes sense to consider ways to use the land more efficiently to accommodate more economic activity. Typical measures of efficiency, however, may not be ideal for evaluating industrial land and marine terminals.
A.2.4.1 Traditional measures of efficiency Typical measures in the numerator of an efficiency measure of land use
include employment, real market value, and built space. These measurements look at the amount of economic activity occurring on a property. In general, advocates of economic development would prefer larger buildings, with higher value, and more employees to locate on a given parcel of land. But these measures of efficiency tend to give relatively low marks to industrial development.
Harbor industrial development tends to have low floor-to-area ratios (FAR) and a relatively low number of jobs per acre. Compared to an office tower, an acre of industrial development is likely to have much lower assessed value, employment, and gross square footage. Thus, measures of the efficiency of employment land based on any of these measures in the numerator would all tend to improve if industrial land were converted to commercial uses.
But industrial lands in general, and harbor lands in the case of this study, are clearly an important piece of the regional economy. If every
Page 16 May 2012 ECONorthwest Portland Harbor, Industrial Land Supply Appendix A: Framework and Methods
jurisdiction allowed vacant industrial land to convert to commercial uses on the assumption that some other jurisdiction would provide the industrial land, the regional supply of industrial land would get smaller quickly and, at the margin, industrial expansion would be slower than it would have been. Land with port access is a particularly important and relatively rare component of all regional industrial land. Marine terminals provide access to other markets, facilitating commerce, and allowing traded-sector businesses to export their goods to other markets.
In the context of the discussion in A.2.1 above, land with port access is necessary for the development of port and port-related facilities, and such facilities may have large external benefits for the region. Since the benefits are external (and, by definition, cannot be readily captured by owners of the land), they do not influence the price that private developers will pay for land. Thus, land prices that industrial users are willing to pay for land in the Portland Harbor probably do not reflect the full value to the Portland region of having that land in industrial use.8
A.2.4.2 Key issues for measuring efficiency Regardless of what measure of economic activity is used in the
numerator for calculating efficiency, there are fundamental issues that present challenges for defining and measuring efficiency and changes in efficiency for industrial land.
Efficient use of land versus efficient production of goods and services
Fundamental to land-use planning regulation in Oregon is the assumption that sprawl is inefficient, and that reducing sprawl saves valuable natural land (for farming, forestry, and the provision of ecosystem services) and promotes more intensive use of urban land (i.e., more density). This system intends to promote more efficient use of land. Denser development, however, does not necessarily mean more efficient production of goods and services for all types of businesses. Put another way, a public-sector mandated increase in certain measures of intensity of industrial land use (e.g., minimum FAR) may or may not increase the efficiency of a particular operation (measured by value added, employment, etc.).
This issue is critical when discussing land-use efficiency in the Portland Harbor. For some (perhaps many) industrial businesses located in the
8 Proponents of other uses could make the same argument: that their external benefits are substantial and not capitalized in land value. A full technical evaluation of the relative net benefits would require extensive empirical work, is unlikely to be definitive, and is beyond the scope of this study.
Portland Harbor, Industrial Land Supply ECONorthwest May 2012 Page 17 Appendix A: Framework and Methods
Portland Harbor, pressure to develop at greater density is unlikely to increase the efficiency of their operations.
Site-specific land efficiency versus regional land efficiency Site-specific efficiency refers to the economic activity on an individual
site. If a user of a one-acre industrial parcel were to double some measure of economic activity (e.g., employment, value added, etc.) without developing more land, one could call that an example of increasing the efficiency of industrial land as a factor of production. This is often what is meant by increasing efficiency.
But what if a parcel serves the regional economy: in other words, what if it provides external benefits? For example, a warehouse may allow other businesses in the region to transport their goods. The warehouse could appear unchanged over time by many measures of economic activity (e.g., assessed value, employment, FAR), but it may be accommodating more goods for other businesses in the region, allowing these businesses to grow.
There are at least three implications. First, standard measures of economic activity like employment may be the wrong ones. The warehouse and its employment may not have changed: it may be that both are now more efficient because the warehouse is now processing more goods because of increases in demand, changes in technology, or some other factor. Second, even if the production per acre for that warehouse were to remain the same in terms of tons or cubic feet of cargo processed, the value of that cargo may have increased (so an argument can be made that efficiency should be measured as value, not tonnage). Third, and related, even if the value of cargo did not change much, its transshipment is a necessary component of what may be a different and rapidly growing industrial sector that is contributing to the regional economy.
An example of this regional land efficiency is the Port of Portland itself. A port’s economic impacts extend well beyond its land and the land that surrounds it. In Oregon, the economy of eastern Oregon and Washington depend on the port facilities in the Portland area to ship grain and other products. Looking just at measures of production on land around a port can easily miss the point: a port is a regional facility that may benefit many businesses a great distance from the port. Thus, it may be “efficient” for a port to have relatively low-density uses that allow efficient transportation of goods, facilitating economic growth throughout the region.
Economies of scale and threshold effects For many enterprises, as they grow for small and start-up to bigger and
established, they achieve economies of scale. There are start-up costs that they have to incur, and there are relatively fixed ongoing operating costs
Page 18 May 2012 ECONorthwest Portland Harbor, Industrial Land Supply Appendix A: Framework and Methods
that must be amortized. It is common for costs per unit of output (or, in the case of transshipment) throughput to decline.
Economies of scale (because of declining marginal costs) almost certainly exist for port facilities. There is a large initial capital investment in facilities: once they are there, they can be used more intensively at a low additional (marginal) cost per unit of activity (e.g., tonnage handled). As more facilities, even of different types are available, the per-unit cost of operation and maintenance can decrease, and the attractiveness of and demand for the facilities may increase for users.
Politically, getting to some scale is probably important for users and for higher levels of government (state and federal) that provide financial assistance to ports: in the case of Portland especially, for dredging the Columbia River. In other words, there may be subtle or not-so-subtle threshold effects: if port operations drop below some level, its ability to sustain even those lower levels of activities may be seriously diminished.
Markets versus public policies Many economists would argue that the best judges of the efficiency of a
particular industrial use at a particular site are the owners and managers of the use in question. If they believe that they can operate more efficiently by adding employees, buildings, or equipment to their site, they will do so. If they believe they can profitably increase production without adding land, they will do so. If their land and land around their site has locational characteristics that make it particularly valuable for certain types of production, and if there are a number of businesses involved in that type of production, its price will rise, and the price is a measure of the increasing value (efficiency) of the land in production.
That argument, however, does not address a concern of cities like Portland about that market-based process: what if non-industrial and non-water-dependent commercial uses (e.g., offices and retail) outbid industrial uses for the land? Yes, the land value has increased (as have the cities’ property-tax revenues), but perhaps at a greater cost to the regional economy.
A.2.4.3 Alternative measures of the output component of efficiency
In short, to address the question about the efficiency of the use of industrial land in the harbor area, one needs a definition of efficiency that makes sense for industrial land. Such a definition must make sense not only in theory, but also in the context of the data and methods that are available for measuring efficiency. We suggest two alternative measures of efficiency
Portland Harbor, Industrial Land Supply ECONorthwest May 2012 Page 19 Appendix A: Framework and Methods
that are most appropriate for harbor industrial land: value added, and tonnage of cargo.
Value added Proponents of the industrial and manufacturing sectors point to its
potential for high “value added.” Value added means that the value of outputs (per unit or in the aggregate) less the cost of inputs purchased from other firms used to create output.9 In economic terms, industrial activity is a “goods-producing” activity, and is generally considered to have strong potential for value added. A service industry, in contrast, tends mainly to sell transformed labor services. There is value added, of course, but this value added is often lower than in a goods-producing setting.10
Setting aside cross-sector comparisons, value added may be a better measure of output over time within sectors than employment or built square footage. A measure of the efficiency of a fixed supply of industrial harbor land would be the amount of value added generated per acre for businesses located in the harbor.
Cargo There is a reasonable argument that much of the industrial land in the Portland Harbor area serves a regional need for transshipment. Therefore, a regional measure of transshipment activity might be appropriate for measuring the efficiency of such land. Some measure of cargo (e.g., tonnage, volume, value) is an obvious choice. Because data are more readily available, we suggest tonnage of cargo as an alternate measurement of land-use efficiency in the Portland Harbor.
The economic activity occurring on a parcel is only part of the impact that land has on the regional economy. Many users of harbor industrial land facilitate economic activity throughout the region. While most measures of efficiency fail to measure this broader impact, tonnage of cargo is a measurement that is consistent with the idea that port facilities have broader regional economic benefits.
9 In that sense, value added is a measure of a firm’s contribution to GDP. Another way to think about this is that everything that a firm itself puts into the production of a product (primarily the labor of its employees and capital) “add value” to the raw materials and intermediate goods and services it purchased to make its final product.
10 Often lower, but not always lower. Service sectors that use highly-trained human capital may have high productivity and high value added. In addition, as technology increases the productivity of physical capital, less manufacturing and construction activity is required to produce the same output. Communication systems, for example, are much more productive than they were in the past, but require much less “brick and mortar” type activities and, hence, less construction activity.
Page 20 May 2012 ECONorthwest Portland Harbor, Industrial Land Supply Appendix A: Framework and Methods
Methodologically, such an analysis should be done for the Portland Harbor in the aggregate, not for individual businesses or parcels. For this measure, it does not matter how much cargo occurs on a given parcel; it matters how much the amount of tonnage per developed acre of land is increasing.
A.3 METHODS Section A.2 is a framework: it is about definitions and concepts related to
the issues this study is investigating. It is a basis for selecting specific methods (data and analytical approaches) for addressing the four questions posed:
• Are the methods the City used to estimate the location and amount of vacant, partially vacant, and potentially buildable industrial land in the Portland Harbor area likely to yield reasonable estimates?
• How suitable for a public marine terminal are the few sites in the Portland Harbor that have been identified by the City as having the potential to accommodate such a terminal?
• What role can the Port of Vancouver play in accommodating forecast demand for cargo volumes in the Portland region?
• What is the potential for more efficient use of industrial harbor land?
We describe the methods we used to answer those questions in the rest of this section.
A.3.1 GENERAL DATA SOURCES AND TECHNIQUES To conduct our analysis, we used the following data sources:
• Existing studies. Extensive analysis has been conducted regarding the Portland Harbor, industrial land, and port terminals. Local governments and service districts in the region (e.g., Metro, the City of Portland, the Port of Portland) are constantly evaluating past economic growth patterns, and planning for future economic development opportunities. These efforts result in a library of reports and studies addressing different aspects of the regional economy. These recent (as well as ongoing) efforts contain useful information for the analysis. The scope for this study emphasized synthesizing and interpreting existing data over collecting new data. Thus, ECO reviewed these related research efforts, and pulled their key findings into the analysis where appropriate.
The City of Portland provided ECO with a list of over 30 recent, relevant documents. After an initial review of all of these documents,
Portland Harbor, Industrial Land Supply ECONorthwest May 2012 Page 21 Appendix A: Framework and Methods
ECO selected a subset of documents of particular value to its analysis:
• Portland Economic Opportunities Analysis (2010)
• West Hayden Island Economic Foundation Study (2010)
• West Hayden Island: Marine Cargo Forecasts & Capacity Assessment (2010)
• Portland Vancouver Trade Capacity Analysis (2006)
• West Hayden Island Planning Document
• Oregon Commodity Flow Forecast (2005)
• Portland’s Working Rivers: The Heritage and Future of Portland’s Industrial Heartland (2008)
• Port of Portland annual reports
ECO focused on data and text related to historical trends and future projections for economic growth: in the region in general and the Portland Harbor in particular.
• Secondary data sources. ECO incorporated many secondary data sources into its analysis.11 As with “existing studies,” the objective is to leverage past research efforts to answer the questions posed in this study. Examples of secondary data sources we used are:
• Buildable Lands Inventory (City of Portland). This source includes multiple data layers in the City’s Geographic Information System (GIS)
• Port of Portland Marine Terminal Statistics
• Multnomah County Assessment & Taxation
• RLIS (Metro)
• Quarterly Census of Employment and Wages
• IMPLAN
• Interviews: Many people in the Portland area have special knowledge of, and interest in, the Portland Harbor. ECO interviewed individuals from both the public and private sectors, and reviewed notes on past interviews that had been conducted for recent related studies. Interviewees included:
11 Secondary data sources are ones collected and readily available by someone other than the user (in this case ECONorthwest). Typical secondary sources are government agencies (e.g., U.S. Census, ODOT, Metro, Port of Portland).
Page 22 May 2012 ECONorthwest Portland Harbor, Industrial Land Supply Appendix A: Framework and Methods
• Port of Portland officials
• Port of Vancouver officials
• Authors of relevant studies and reports
• Members of the Working Waterfront Coalition
• Other local economic development professionals
Data from these sources were used to address the three specific questions that are the focus of this study. The next sections explain how.
A.3.2 EVALUATION OF PRIOR EFFORTS TO IDENTIFY LAND SUPPLY IN THE PORTLAND HARBOR
The City asked ECO to evaluate whether the methods the City used to estimate the location and amount of vacant, partially vacant, and potentially buildable industrial land in the Portland Harbor area likely to yield reasonable estimates? More specifically, the question was whether it is reasonable to assume that the two sites that the City identified (Atofina and Times Oil) are the only two in the Harbor study area (as defined in Exhibit A-1) that are of a size and location that they might be suitable for a new Port of Portland marine terminal?
To answer that question we needed an estimate of the minimum feasible size of a marine terminal. Maul, Foster & Alongi provided that estimate (documented in Section 3.2 of the report and Appendix B): 50 acres. We then looked for 50 acres of vacant land with waterfront access in the study area by:
• Reviewing studies summarizing industrial and harbor land supply: Industrial Districts Atlas (2004) and Harbor ReDI Industrial Sites Analysis (2009).
• Reviewing GIS shape files and cross-referencing to Google Earth aerial photos (August 2011).
• Discussing methods with BPS staff, and comparing those to standard methods for developing land inventories and identifying buildable land.
A.3.3 ADDRESSING THE POTENTIAL SITES FOR NEW MARINE TERMINALS
Much of the analysis in this report deals with the supply of harbor industrial lands in general: it includes both public and private ownership and uses of the land. This task deals specifically with land supply for new, public, marine terminals.
Portland Harbor, Industrial Land Supply ECONorthwest May 2012 Page 23 Appendix A: Framework and Methods
To determine which sites might best accommodate a public marine terminal, we began by identifying the technical site requirements for a marine terminal. ECO interviewed representatives of the Port of Portland to identify their ideal site requirements, as well as which of these requirements could be reduced while still accommodating a working port facility. ECO compared these site requirements with the findings of the Worley Parsons, a consultant to the City evaluating the potential site design of a new marine terminal on West Hayden Island. Finally, ECO turned to internal team members with experience running west coast ports, and looked for creative ways to adjust these site requirements to create a working terminal on smaller or otherwise constrained sites.
BPS staff identified only two sites that could potentially meet these criteria. ECO, reviewed the sites identified by the City of Portland, and evaluated maps of the Portland Harbor, including zoning, infrastructure and aerial photographs. Our preliminary review confirmed the City’s findings, that most of the Portland Harbor has active development on it, and these two sites have the greatest opportunity to accommodate new public marine terminals.
The ECONorthwest Team, including Maul Foster & Alongi, Inc., toured these sites with BPS staff. Maul Foster & Alongi, Inc. conducted a visual inspection of the sites, documenting conditions affecting the suitability of each site for the proposed development. Key factors considered in our analysis were: site access, existing uses, natural features, and contamination/remediation. After conducting this site visit, we developed a set of criteria for evaluating site feasibility for typical port terminals. This set of criteria is included with this document as Appendix C.
Using these criteria, Maul Foster & Alongi evaluated the potential opportunities and constraints of these sites to accommodate development of a public marine terminal. A cursory site visit is insufficient to make a final determination of site feasibility. Nonetheless, our methods are consistent with our scope and budget, and are sufficient for identifying major opportunities and constraints for these potential sites, and making a preliminary determination of site feasibility.
A.3.4 ADDRESSING THE ROLE OF VANCOUVER IN HARBOR INDUSTRIAL LAND SUPPLY
The third question we were asked by the City is: What role can the Port of Vancouver play in accommodating forecast demand for cargo volumes in the Portland region? To answer this question, we used a combination of interviews with port officials and reviews of past reports.
Page 24 May 2012 ECONorthwest Portland Harbor, Industrial Land Supply Appendix A: Framework and Methods
We began by attempting a data-driven analysis. In principle, if we knew the capacity of existing marine terminals in Portland and Vancouver, and subtracted the forecast future demand for these areas, then we could identify the amount of demand that could not be accommodated by existing facilities. This demand (in tons of cargo) could then be translated into the acres of land necessary for new terminals to accommodate this growth. Comparing the required acres to support new terminals with the available land supply in the Portland Harbor and in Vancouver, we could identify how much of Portland’s demand might need to be accommodated in Vancouver, and whether or not Vancouver had sufficient land to accommodate it.
The specific steps in our analysis, and detailed tables showing our results are contained in Appendix C: Analysis of Harbor Land Capacity and Demand, Portland and Vancouver. In short, we relied on the following data sources:
• Capacity of existing facilities: Estimates for the public marine terminals in the Port of Portland were taken from the West Hayden Island Economic Foundation Study, prepared by Entrix for the City of Portland in May 2010. These estimates were produced in interviews conducted by Entrix with Port of Portland staff. For estimates of capacity of private terminals in the City of Portland, as well as all terminals in the City of Vancouver, we relied on historical data on cargo volumes reported by BST Associates in their Portland and Vancouver Harbor Forecast Update, prepared for the Port of Portland in February 2012. Our estimates were confirmed and refined through interviews with Port of Portland officials.
• Future cargo demand: Estimates of cargo demand for all public and private terminals in the cities of Portland and Vancouver in the year 2040 were taken from the BST Associates Portland and Vancouver Harbor Forecast Update. These forecasts included a low and high scenario.
• Acreage necessary for new terminals: Estimates of the acreage required for new marine terminals were taken from a variety of sources, including the West Hayden Island Economic Foundation Study (Entrix, 2010), the Draft Report on Operational Efficiencies of Port/Terminal World Wide (Worley Parsons, 2012), and the Maul Foster and Alongi evaluation criteria included with this report as Attachment B.
• Available land supply: Finally, estimates of available land in the Portland Harbor are based on our own analysis of developable sights, described in Sections A.3.2 and A.3.3. Estimates of available
Portland Harbor, Industrial Land Supply ECONorthwest May 2012 Page 25 Appendix A: Framework and Methods
land in Vancouver, were based on the West Hayden Island Economic Foundation Study (Entrix, 2010), and verified through GIS analysis, and conversations with officials from the Port of Vancouver.
The data-driven method described above has many advantages: it is a logical way to conduct the analysis, it relies on the best and most recent data and forecasts, and with any one-set of assumptions used in the analysis, it results in a definitive answer of the acres of land needed for new terminal development. However, there is one major limitation to this method: it relies on so many assumptions, which can be pulled from such a broad range, with each assumption compounding on all previous assumptions, that using different sets of reasonable assumptions can create largely different results.
Therefore, our analysis uses the data to establish a high and low boundary for the potential land need, and describes a “most-likely” scenario that falls between the two extremes. In order to give these numbers more context, and to help us arrive at the most-likely scenario, we also conducted numerous interviews with representatives of the ports of Portland and Vancouver.
A.3.5 ADDRESSING THE POTENTIAL FOR INCREASED EFFICIENCIES
Section A.2.4 provides a context for defining and evaluating the efficiency of the use of industrial land. This section builds on that context to describe specific data and analytical techniques that this study uses.
The City is interested in knowing if industrial land in the Portland Harbor can be used more efficiently in the future. To answer we looked at recent economic trends in the Portland Harbor and in the City of Portland as a whole for changes in land-use efficiency for industrial users. For this analysis, we considered several measures of output in an efficiency measure: employment, real market value, value added, and tonnage.
Ideally, we would like to have data with a long time series (20 – 30 years) for each efficiency measure. But changes in the type, definition, and collection of data make it impossible to get consistent time-series data for both the numerators and denominators of efficiency measures. Our method is an approximation based on available data. We create different measures of efficiency for two different time periods: (1) 2002 – 2008, when detailed and consistent data are available on both output and land area, and (2) 1960 - 1997 when the Port of Portland did occasional studies of its land and activity.
Page 26 May 2012 ECONorthwest Portland Harbor, Industrial Land Supply Appendix A: Framework and Methods
For 2002- 2008 we began by identifying all parcels in the Portland Harbor using GIS. We examined data from two different years: 2002 (one of the earliest years that data are available using NAICS codes), and 2008 (the most recent year QCEW data are available). Comparing data from the two years we calculated the change in developed acreage in the Harbor, and the corresponding change in real market value, and employment.
We also collected data from different sources for two alternative measures of output (for the denominator): value added and cargo (volume, tonnage, and value). Unlike employment, and real market value, data for value added and cargo tonnage is not tracked at a parcel specific level. Instead, data is available at the regional, City, zip code or Census tract level. For our analysis, we used Port of Portland data on historical levels of cargo tonnage in the Portland Harbor, and the IMPLAN economic model for the zip codes that most closely align with the boundaries of the Portland Harbor for value added. We used the same years (2002 and 2008) as were used for other measures of efficiency.
In summary, we created various measures of change in land-use efficiency between 2002 and 2008.
This method has limitations. Six years is not a long time to observe economic trends and changes in land-use efficiency if one is hoping to use those trends as a basis for long-run forecasts. Moreover, the period includes the recent recession, which began in 2007. Ideally, our analysis would include years before 2002, as well as years later than 2008. However, data after 2008 are not yet available, and data before 2002 have significant limitations. Prior to 2000, employment was recorded by SIC codes, rather than NAICS. The change in classification makes comparing data across this time period difficult and unreliable for time-series analysis. Additionally, land-use data, including data from the County Assessor is less accurate prior to 2000, as GIS and other technology had not yet been widely adopted.
For a long-run look at trends, we used yet another method based on cargo tonnage as a measure of output. The Port of Portland conducts periodic studies of land use and development in the Portland Harbor. The earliest Port study dates back to 1960, with additional studies in 1990 and 1997. Additionally, various data sources, including the Port of Portland, the US Department of Transportation, and the Corps of Engineers track cargo tonnage that is shipped through the Portland Harbor. Comparing these datasets, we were able to calculate the tons of cargo that were shipped per developed acre in the Portland Harbor from 1960 through 1997, and observe trends over this 37-year period.
Page 1 May 2012 ECONorthwest Portland Harbor, Industrial Land Supply Appendix B: Site Criteria for Marine Terminals
Appendix B Criteria for Evaluating Potential Sites for Marine Terminals
One of the four questions that this study addressed was, “How well do the characteristics of the Atofina and Time Oil sites (the two identified by the City as meeting the minimum requirements for size and waterfront access) match the characteristics that would be needed to create a reasonable probability the sites could be developed as marine terminals?” To answer that question the consultant team had to specify those characteristics. Team member Maul, Foster & Alongi created the evaluation criteria summarized in the table that follows. Those criteria are used in the evaluation reported in Section 3.2 of the main report.
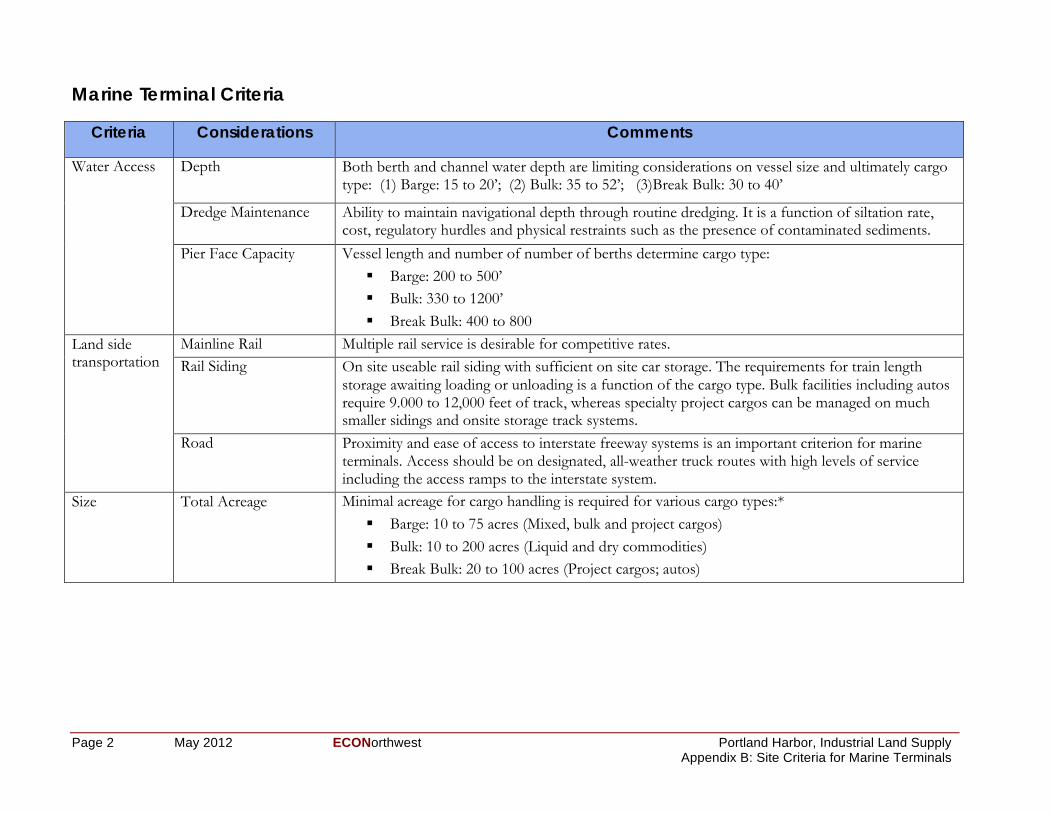
Page 2 May 2012 ECONorthwest Portland Harbor, Industrial Land Supply Appendix B: Site Criteria for Marine Terminals
Marine Terminal Criteria
Criteria Considerations Comments
Water Access Depth Both berth and channel water depth are limiting considerations on vessel size and ultimately cargo type: (1) Barge: 15 to 20’; (2) Bulk: 35 to 52’; (3)Break Bulk: 30 to 40’
Dredge Maintenance Ability to maintain navigational depth through routine dredging. It is a function of siltation rate, cost, regulatory hurdles and physical restraints such as the presence of contaminated sediments.
Pier Face Capacity Vessel length and number of number of berths determine cargo type: ! Barge: 200 to 500’ ! Bulk: 330 to 1200’ ! Break Bulk: 400 to 800
Land side transportation
Mainline Rail Multiple rail service is desirable for competitive rates. Rail Siding On site useable rail siding with sufficient on site car storage. The requirements for train length
storage awaiting loading or unloading is a function of the cargo type. Bulk facilities including autos require 9.000 to 12,000 feet of track, whereas specialty project cargos can be managed on much smaller sidings and onsite storage track systems.
Road Proximity and ease of access to interstate freeway systems is an important criterion for marine terminals. Access should be on designated, all-weather truck routes with high levels of service including the access ramps to the interstate system.
Size Total Acreage Minimal acreage for cargo handling is required for various cargo types:* ! Barge: 10 to 75 acres (Mixed, bulk and project cargos) ! Bulk: 10 to 200 acres (Liquid and dry commodities) ! Break Bulk: 20 to 100 acres (Project cargos; autos)
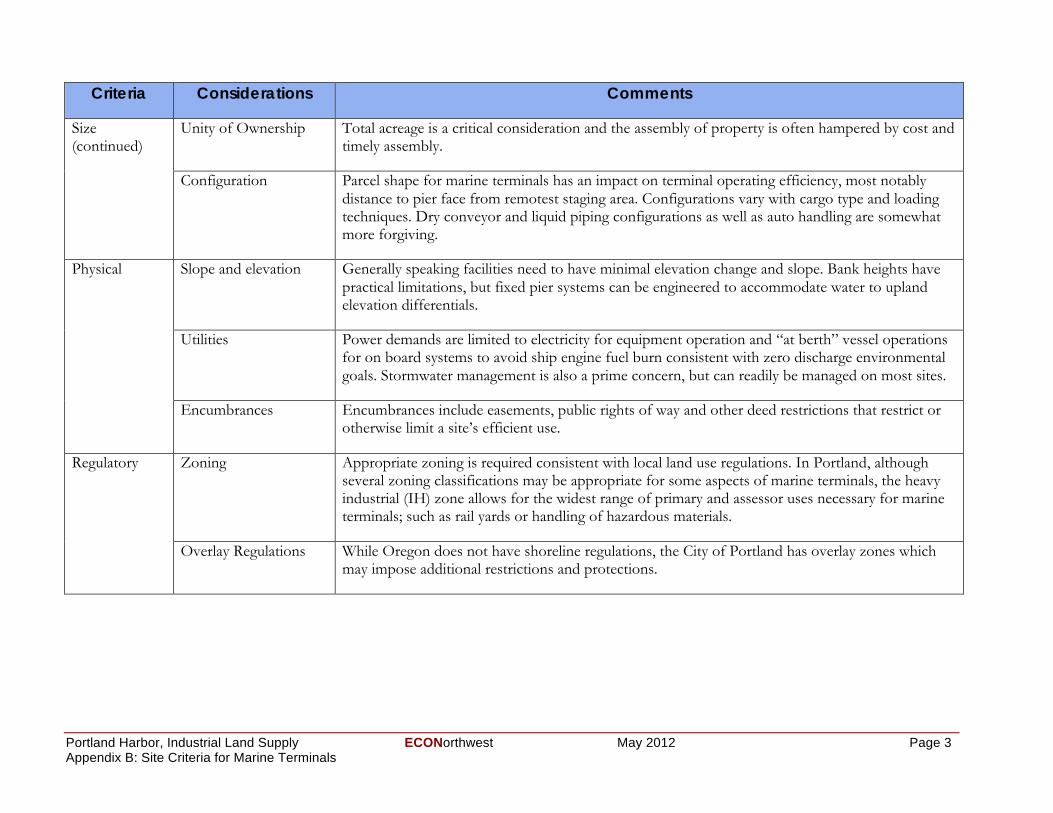
Portland Harbor, Industrial Land Supply ECONorthwest May 2012 Page 3 Appendix B: Site Criteria for Marine Terminals
Criteria Considerations Comments
Size (continued)
Unity of Ownership Total acreage is a critical consideration and the assembly of property is often hampered by cost and timely assembly.
Configuration Parcel shape for marine terminals has an impact on terminal operating efficiency, most notably distance to pier face from remotest staging area. Configurations vary with cargo type and loading techniques. Dry conveyor and liquid piping configurations as well as auto handling are somewhat more forgiving.
Physical Slope and elevation Generally speaking facilities need to have minimal elevation change and slope. Bank heights have practical limitations, but fixed pier systems can be engineered to accommodate water to upland elevation differentials.
Utilities Power demands are limited to electricity for equipment operation and “at berth” vessel operations for on board systems to avoid ship engine fuel burn consistent with zero discharge environmental goals. Stormwater management is also a prime concern, but can readily be managed on most sites.
Encumbrances Encumbrances include easements, public rights of way and other deed restrictions that restrict or otherwise limit a site’s efficient use.
Regulatory Zoning Appropriate zoning is required consistent with local land use regulations. In Portland, although several zoning classifications may be appropriate for some aspects of marine terminals, the heavy industrial (IH) zone allows for the widest range of primary and assessor uses necessary for marine terminals; such as rail yards or handling of hazardous materials.
Overlay Regulations While Oregon does not have shoreline regulations, the City of Portland has overlay zones which may impose additional restrictions and protections.
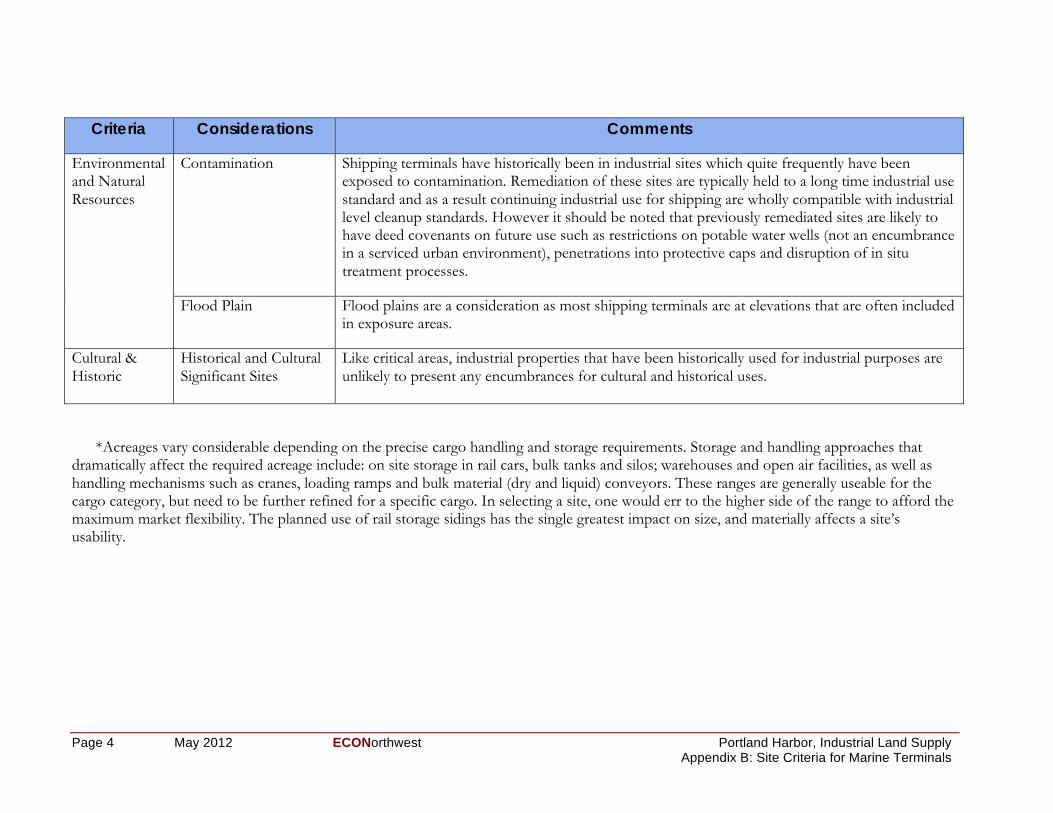
Page 4 May 2012 ECONorthwest Portland Harbor, Industrial Land Supply Appendix B: Site Criteria for Marine Terminals
Criteria Considerations Comments
Environmental and Natural Resources
Contamination Shipping terminals have historically been in industrial sites which quite frequently have been exposed to contamination. Remediation of these sites are typically held to a long time industrial use standard and as a result continuing industrial use for shipping are wholly compatible with industrial level cleanup standards. However it should be noted that previously remediated sites are likely to have deed covenants on future use such as restrictions on potable water wells (not an encumbrance in a serviced urban environment), penetrations into protective caps and disruption of in situ treatment processes.
Flood Plain Flood plains are a consideration as most shipping terminals are at elevations that are often included in exposure areas.
Cultural & Historic
Historical and Cultural Significant Sites
Like critical areas, industrial properties that have been historically used for industrial purposes are unlikely to present any encumbrances for cultural and historical uses.
*Acreages vary considerable depending on the precise cargo handling and storage requirements. Storage and handling approaches that dramatically affect the required acreage include: on site storage in rail cars, bulk tanks and silos; warehouses and open air facilities, as well as handling mechanisms such as cranes, loading ramps and bulk material (dry and liquid) conveyors. These ranges are generally useable for the cargo category, but need to be further refined for a specific cargo. In selecting a site, one would err to the higher side of the range to afford the maximum market flexibility. The planned use of rail storage sidings has the single greatest impact on size, and materially affects a site’s usability.
Portland Harbor, Industrial Land Supply ECONorthwest May 2012 Page 1 Appendix C: Analysis of Capacity and Demand
Appendix C Analysis of Harbor Land Capacity and Demand, Portland & Vancouver
The City of Portland asked us: to what extent can the Port of Vancouver play a role in accommodating forecast cargo demand in the Portland region? This question is addressed Section 3.3 of the main report. This appendix provides additional tables with more detail than was presented in the main report. Our analysis finds that the Portland Harbor has very limited capacity to accommodate future demand for public marine terminals, but that the Port of Vancouver may technically have sufficient capacity to accommodate all forecast demand for cargo for both the cities of Portland and Vancouver through the year 2040.
C.1 DISCLAIMER All of this analysis described in this appendix depends on estimates of
current variables that are uncertain, and forecasts that are even more uncertain, and themselves dependent on a wide range of possible assumptions. Like any analysis of future economic conditions, this one is built upon many layers of assumptions: each assumption widens the range of potential outcomes, and each layer of assumptions compounds on the previous layer to provide an even wider range of potential results. That fact does not necessarily make the analysis irrelevant: it can definitely inform public policy about possible and likely futures. Despite the uncertainty inherent in this analysis, it is helpful for bookending the potential land need for public marine terminals. Assumptions in the middle of the range give conclusions that should be useful for planning purposes, even if actual results may vary.
C.2 DEMAND FOR MARINE CARGO We were tasked with obtaining and reviewing the most recent forecasts.
These forecasts were contained in the Portland and Vancouver Harbor Forecast Update (BST Associates, 2012). These forecasts were based on a 2010 study by BST Associates, but were refined to specifically call out cargo demand for the City’s of Portland and Vancouver, and were updated with the most recent economic data. Exhibit C-1 shows the forecast demand for public and private marine terminals in the City of Portland in 2040.
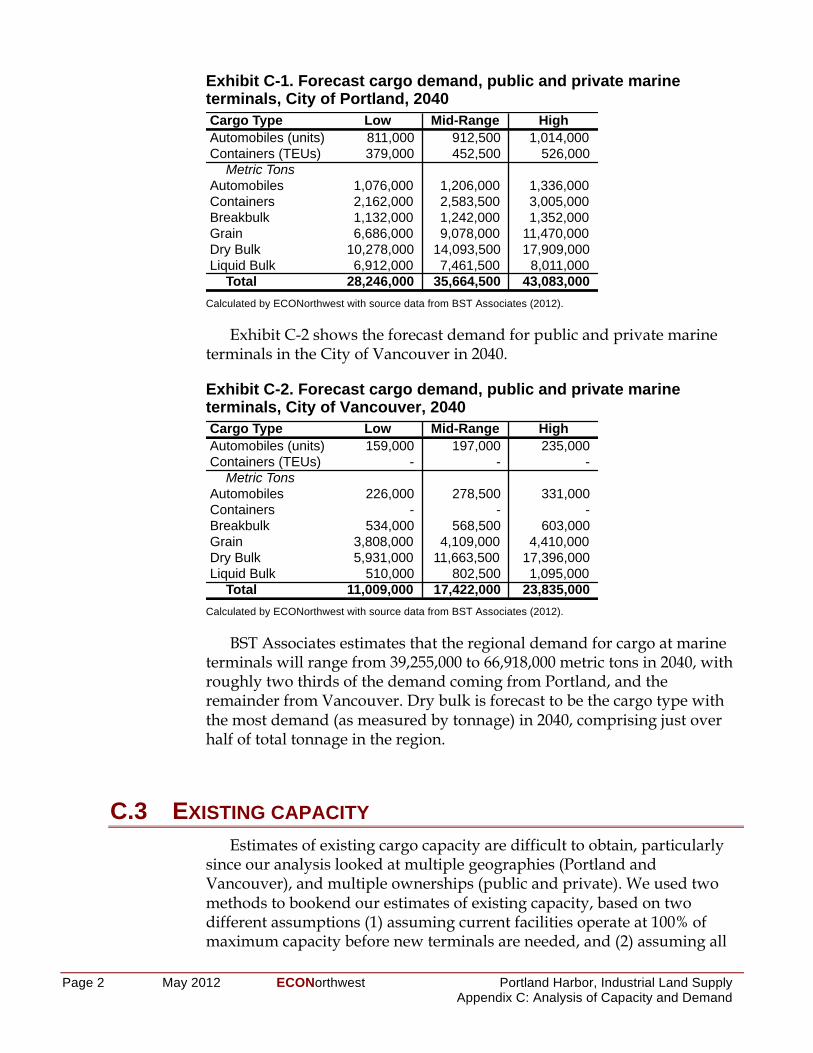
Page 2 May 2012 ECONorthwest Portland Harbor, Industrial Land Supply Appendix C: Analysis of Capacity and Demand
Exhibit C-1. Forecast cargo demand, public and private marine terminals, City of Portland, 2040
Calculated by ECONorthwest with source data from BST Associates (2012).
Exhibit C-2 shows the forecast demand for public and private marine terminals in the City of Vancouver in 2040.
Exhibit C-2. Forecast cargo demand, public and private marine terminals, City of Vancouver, 2040
Calculated by ECONorthwest with source data from BST Associates (2012).
BST Associates estimates that the regional demand for cargo at marine terminals will range from 39,255,000 to 66,918,000 metric tons in 2040, with roughly two thirds of the demand coming from Portland, and the remainder from Vancouver. Dry bulk is forecast to be the cargo type with the most demand (as measured by tonnage) in 2040, comprising just over half of total tonnage in the region.
C.3 EXISTING CAPACITY Estimates of existing cargo capacity are difficult to obtain, particularly
since our analysis looked at multiple geographies (Portland and Vancouver), and multiple ownerships (public and private). We used two methods to bookend our estimates of existing capacity, based on two different assumptions (1) assuming current facilities operate at 100% of maximum capacity before new terminals are needed, and (2) assuming all
Cargo Type Low Mid-Range HighAutomobiles (units) 811,000 912,500 1,014,000 Containers (TEUs) 379,000 452,500 526,000
Metric TonsAutomobiles 1,076,000 1,206,000 1,336,000 Containers 2,162,000 2,583,500 3,005,000 Breakbulk 1,132,000 1,242,000 1,352,000 Grain 6,686,000 9,078,000 11,470,000 Dry Bulk 10,278,000 14,093,500 17,909,000 Liquid Bulk 6,912,000 7,461,500 8,011,000
Total 28,246,000 35,664,500 43,083,000
Cargo Type Low Mid-Range HighAutomobiles (units) 159,000 197,000 235,000 Containers (TEUs) - - -
Metric TonsAutomobiles 226,000 278,500 331,000 Containers - - - Breakbulk 534,000 568,500 603,000 Grain 3,808,000 4,109,000 4,410,000 Dry Bulk 5,931,000 11,663,500 17,396,000 Liquid Bulk 510,000 802,500 1,095,000
Total 11,009,000 17,422,000 23,835,000
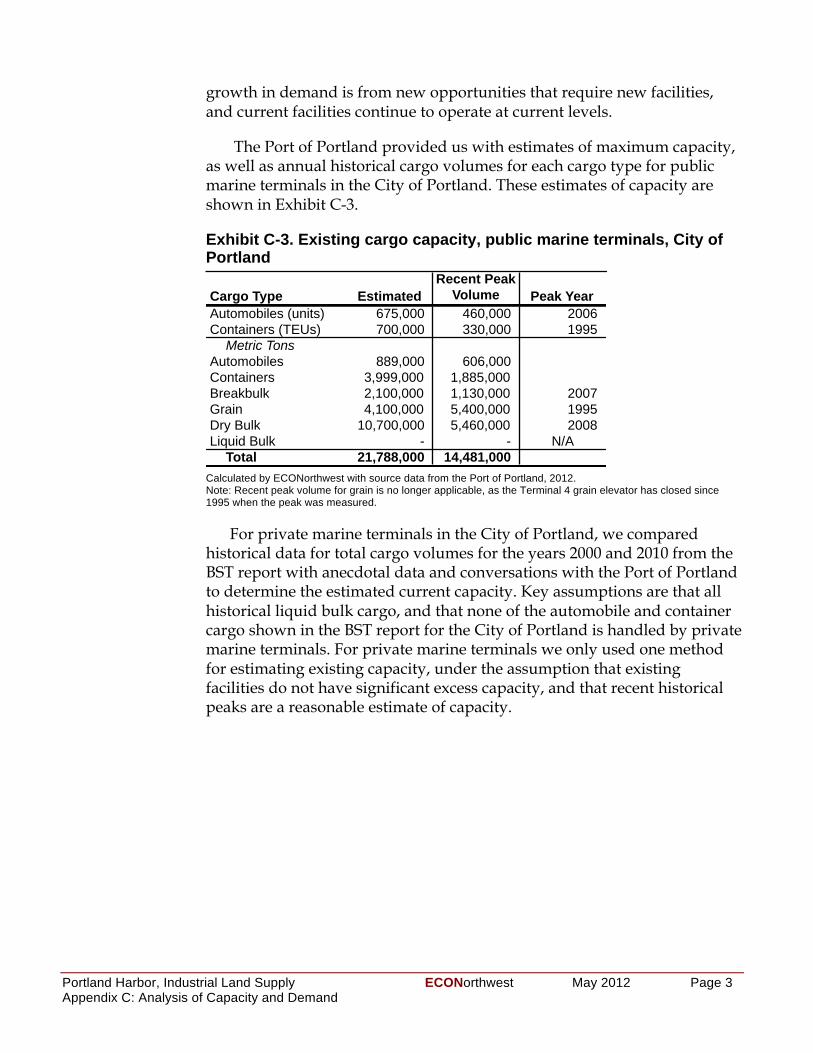
Portland Harbor, Industrial Land Supply ECONorthwest May 2012 Page 3 Appendix C: Analysis of Capacity and Demand
growth in demand is from new opportunities that require new facilities, and current facilities continue to operate at current levels.
The Port of Portland provided us with estimates of maximum capacity, as well as annual historical cargo volumes for each cargo type for public marine terminals in the City of Portland. These estimates of capacity are shown in Exhibit C-3.
Exhibit C-3. Existing cargo capacity, public marine terminals, City of Portland
Calculated by ECONorthwest with source data from the Port of Portland, 2012. Note: Recent peak volume for grain is no longer applicable, as the Terminal 4 grain elevator has closed since 1995 when the peak was measured.
For private marine terminals in the City of Portland, we compared historical data for total cargo volumes for the years 2000 and 2010 from the BST report with anecdotal data and conversations with the Port of Portland to determine the estimated current capacity. Key assumptions are that all historical liquid bulk cargo, and that none of the automobile and container cargo shown in the BST report for the City of Portland is handled by private marine terminals. For private marine terminals we only used one method for estimating existing capacity, under the assumption that existing facilities do not have significant excess capacity, and that recent historical peaks are a reasonable estimate of capacity.
Cargo Type EstimatedRecent Peak
Volume Peak YearAutomobiles (units) 675,000 460,000 2006Containers (TEUs) 700,000 330,000 1995
Metric TonsAutomobiles 889,000 606,000 Containers 3,999,000 1,885,000 Breakbulk 2,100,000 1,130,000 2007Grain 4,100,000 5,400,000 1995Dry Bulk 10,700,000 5,460,000 2008Liquid Bulk - - N/A
Total 21,788,000 14,481,000
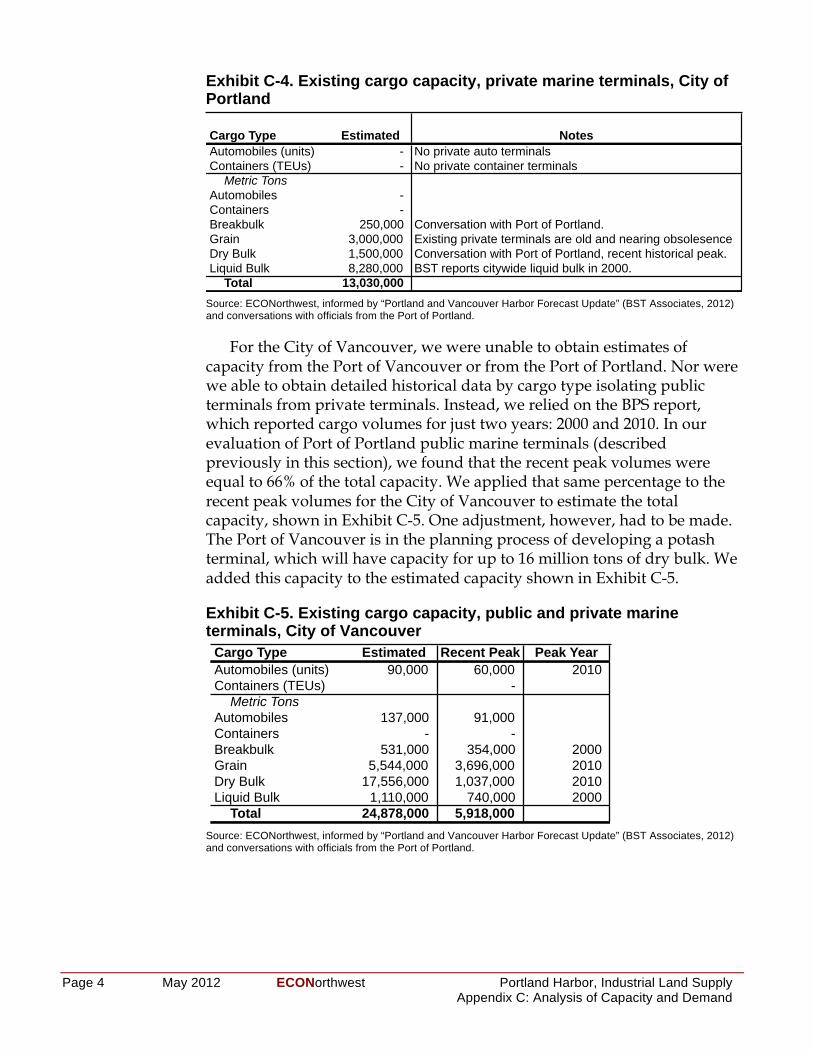
Page 4 May 2012 ECONorthwest Portland Harbor, Industrial Land Supply Appendix C: Analysis of Capacity and Demand
Exhibit C-4. Existing cargo capacity, private marine terminals, City of Portland
Source: ECONorthwest, informed by “Portland and Vancouver Harbor Forecast Update” (BST Associates, 2012) and conversations with officials from the Port of Portland.
For the City of Vancouver, we were unable to obtain estimates of capacity from the Port of Vancouver or from the Port of Portland. Nor were we able to obtain detailed historical data by cargo type isolating public terminals from private terminals. Instead, we relied on the BPS report, which reported cargo volumes for just two years: 2000 and 2010. In our evaluation of Port of Portland public marine terminals (described previously in this section), we found that the recent peak volumes were equal to 66% of the total capacity. We applied that same percentage to the recent peak volumes for the City of Vancouver to estimate the total capacity, shown in Exhibit C-5. One adjustment, however, had to be made. The Port of Vancouver is in the planning process of developing a potash terminal, which will have capacity for up to 16 million tons of dry bulk. We added this capacity to the estimated capacity shown in Exhibit C-5.
Exhibit C-5. Existing cargo capacity, public and private marine terminals, City of Vancouver
Source: ECONorthwest, informed by “Portland and Vancouver Harbor Forecast Update” (BST Associates, 2012) and conversations with officials from the Port of Portland.
Cargo Type Estimated NotesAutomobiles (units) - No private auto terminalsContainers (TEUs) - No private container terminals
Metric TonsAutomobiles - Containers - Breakbulk 250,000 Conversation with Port of Portland.Grain 3,000,000 Existing private terminals are old and nearing obsolesenceDry Bulk 1,500,000 Conversation with Port of Portland, recent historical peak.Liquid Bulk 8,280,000 BST reports citywide liquid bulk in 2000.
Total 13,030,000
Cargo Type Estimated Recent Peak Peak YearAutomobiles (units) 90,000 60,000 2010Containers (TEUs) -
Metric TonsAutomobiles 137,000 91,000 Containers - - Breakbulk 531,000 354,000 2000Grain 5,544,000 3,696,000 2010Dry Bulk 17,556,000 1,037,000 2010Liquid Bulk 1,110,000 740,000 2000
Total 24,878,000 5,918,000
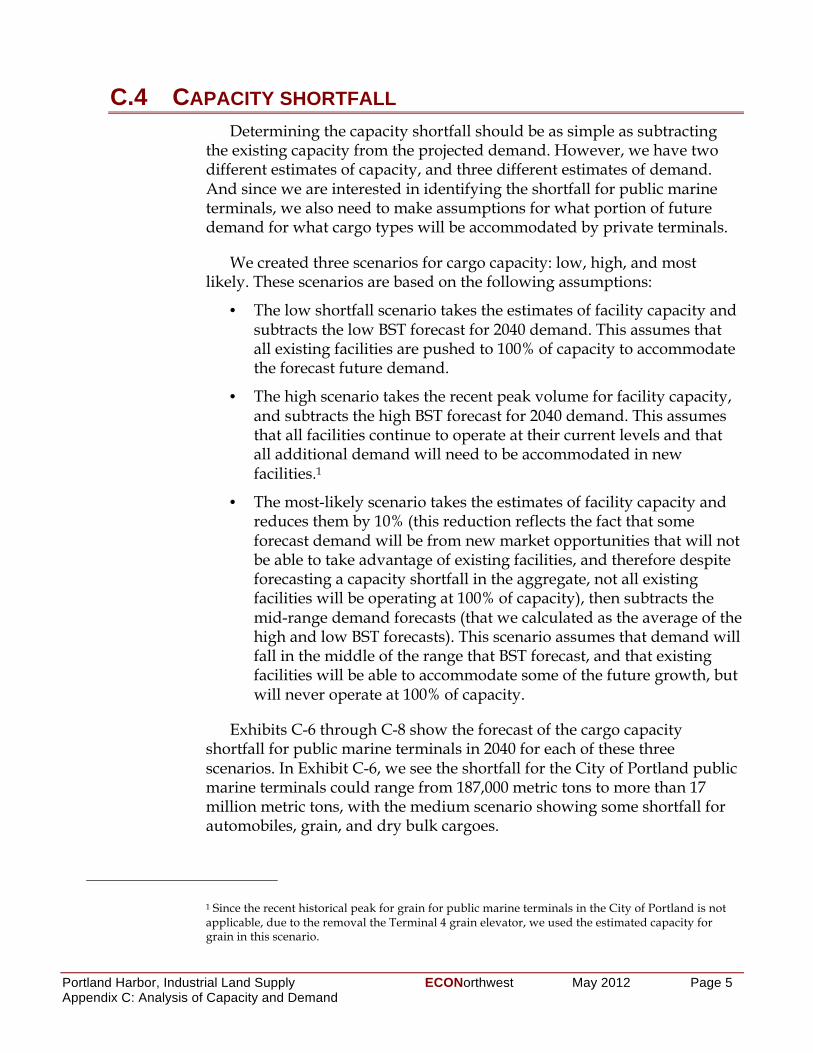
Portland Harbor, Industrial Land Supply ECONorthwest May 2012 Page 5 Appendix C: Analysis of Capacity and Demand
C.4 CAPACITY SHORTFALL Determining the capacity shortfall should be as simple as subtracting
the existing capacity from the projected demand. However, we have two different estimates of capacity, and three different estimates of demand. And since we are interested in identifying the shortfall for public marine terminals, we also need to make assumptions for what portion of future demand for what cargo types will be accommodated by private terminals.
We created three scenarios for cargo capacity: low, high, and most likely. These scenarios are based on the following assumptions:
• The low shortfall scenario takes the estimates of facility capacity and subtracts the low BST forecast for 2040 demand. This assumes that all existing facilities are pushed to 100% of capacity to accommodate the forecast future demand.
• The high scenario takes the recent peak volume for facility capacity, and subtracts the high BST forecast for 2040 demand. This assumes that all facilities continue to operate at their current levels and that all additional demand will need to be accommodated in new facilities.1
• The most-likely scenario takes the estimates of facility capacity and reduces them by 10% (this reduction reflects the fact that some forecast demand will be from new market opportunities that will not be able to take advantage of existing facilities, and therefore despite forecasting a capacity shortfall in the aggregate, not all existing facilities will be operating at 100% of capacity), then subtracts the mid-range demand forecasts (that we calculated as the average of the high and low BST forecasts). This scenario assumes that demand will fall in the middle of the range that BST forecast, and that existing facilities will be able to accommodate some of the future growth, but will never operate at 100% of capacity.
Exhibits C-6 through C-8 show the forecast of the cargo capacity shortfall for public marine terminals in 2040 for each of these three scenarios. In Exhibit C-6, we see the shortfall for the City of Portland public marine terminals could range from 187,000 metric tons to more than 17 million metric tons, with the medium scenario showing some shortfall for automobiles, grain, and dry bulk cargoes.
1 Since the recent historical peak for grain for public marine terminals in the City of Portland is not applicable, due to the removal the Terminal 4 grain elevator, we used the estimated capacity for grain in this scenario.
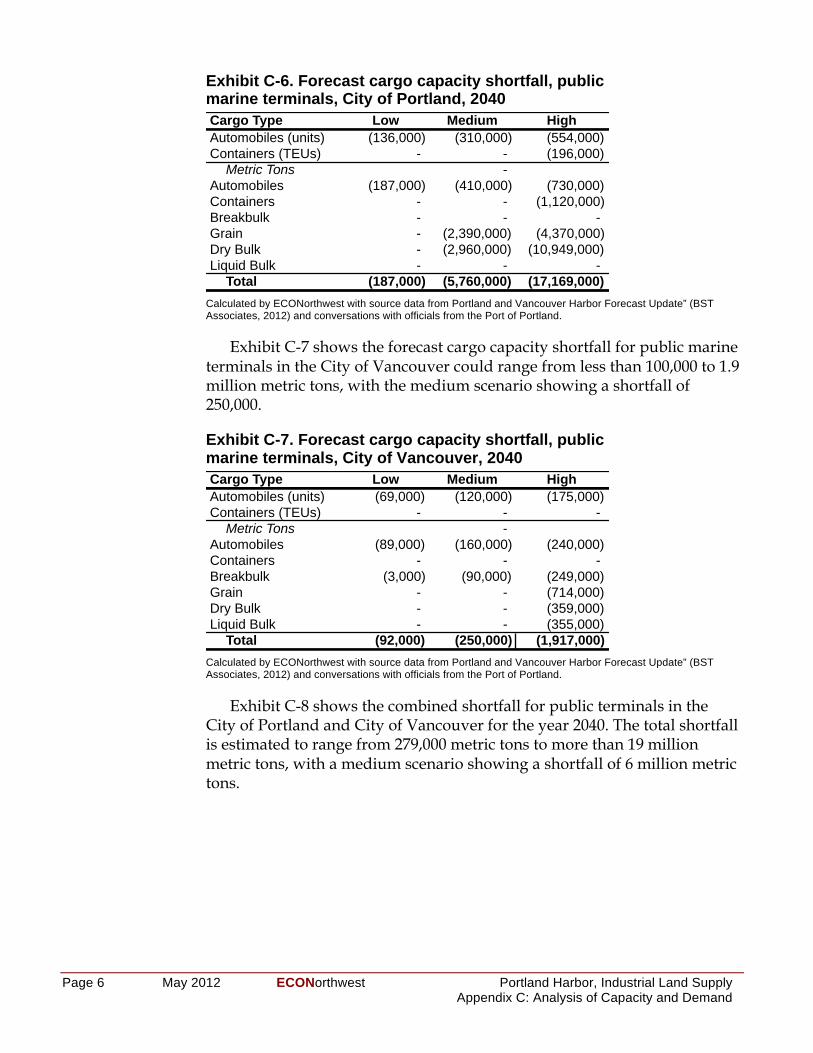
Page 6 May 2012 ECONorthwest Portland Harbor, Industrial Land Supply Appendix C: Analysis of Capacity and Demand
Exhibit C-6. Forecast cargo capacity shortfall, public marine terminals, City of Portland, 2040
Calculated by ECONorthwest with source data from Portland and Vancouver Harbor Forecast Update” (BST Associates, 2012) and conversations with officials from the Port of Portland.
Exhibit C-7 shows the forecast cargo capacity shortfall for public marine terminals in the City of Vancouver could range from less than 100,000 to 1.9 million metric tons, with the medium scenario showing a shortfall of 250,000.
Exhibit C-7. Forecast cargo capacity shortfall, public marine terminals, City of Vancouver, 2040
Calculated by ECONorthwest with source data from Portland and Vancouver Harbor Forecast Update” (BST Associates, 2012) and conversations with officials from the Port of Portland.
Exhibit C-8 shows the combined shortfall for public terminals in the City of Portland and City of Vancouver for the year 2040. The total shortfall is estimated to range from 279,000 metric tons to more than 19 million metric tons, with a medium scenario showing a shortfall of 6 million metric tons.
Cargo Type Low Medium HighAutomobiles (units) (136,000) (310,000) (554,000) Containers (TEUs) - - (196,000)
Metric Tons - Automobiles (187,000) (410,000) (730,000) Containers - - (1,120,000) Breakbulk - - - Grain - (2,390,000) (4,370,000) Dry Bulk - (2,960,000) (10,949,000) Liquid Bulk - - -
Total (187,000) (5,760,000) (17,169,000)
Cargo Type Low Medium HighAutomobiles (units) (69,000) (120,000) (175,000) Containers (TEUs) - - -
Metric Tons - Automobiles (89,000) (160,000) (240,000) Containers - - - Breakbulk (3,000) (90,000) (249,000) Grain - - (714,000) Dry Bulk - - (359,000) Liquid Bulk - - (355,000)
Total (92,000) (250,000) (1,917,000)
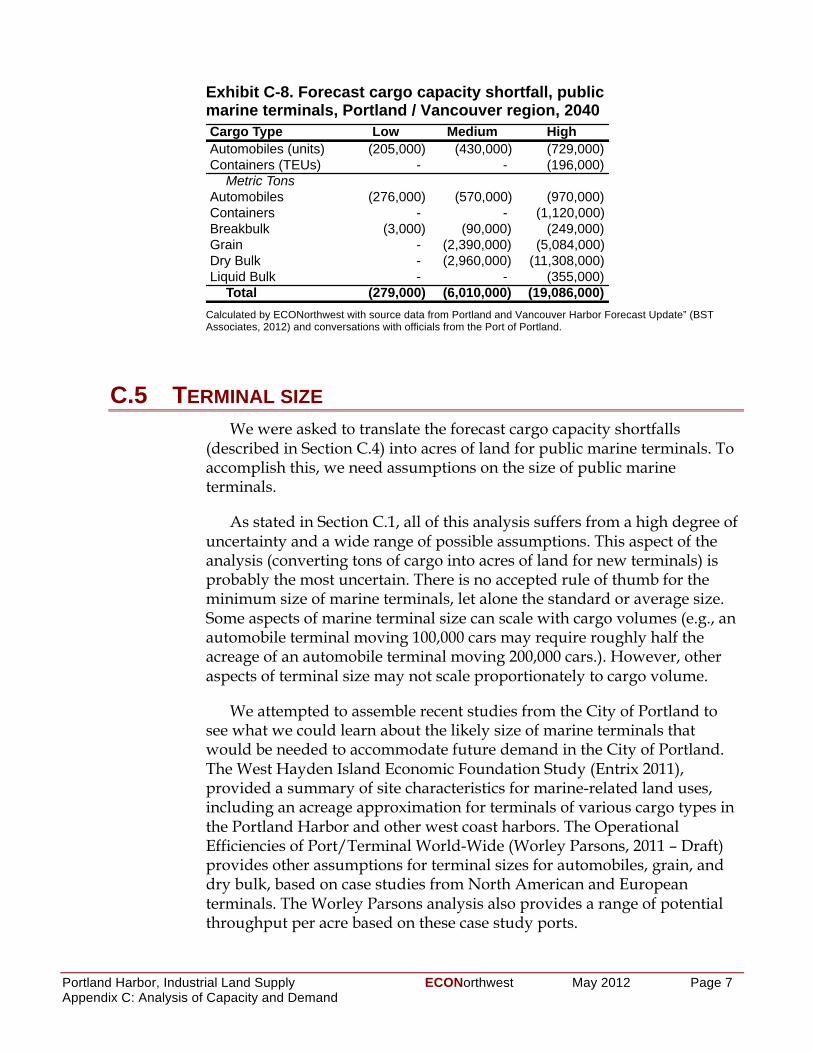
Portland Harbor, Industrial Land Supply ECONorthwest May 2012 Page 7 Appendix C: Analysis of Capacity and Demand
Exhibit C-8. Forecast cargo capacity shortfall, public marine terminals, Portland / Vancouver region, 2040
Calculated by ECONorthwest with source data from Portland and Vancouver Harbor Forecast Update” (BST Associates, 2012) and conversations with officials from the Port of Portland.
C.5 TERMINAL SIZE We were asked to translate the forecast cargo capacity shortfalls
(described in Section C.4) into acres of land for public marine terminals. To accomplish this, we need assumptions on the size of public marine terminals.
As stated in Section C.1, all of this analysis suffers from a high degree of uncertainty and a wide range of possible assumptions. This aspect of the analysis (converting tons of cargo into acres of land for new terminals) is probably the most uncertain. There is no accepted rule of thumb for the minimum size of marine terminals, let alone the standard or average size. Some aspects of marine terminal size can scale with cargo volumes (e.g., an automobile terminal moving 100,000 cars may require roughly half the acreage of an automobile terminal moving 200,000 cars.). However, other aspects of terminal size may not scale proportionately to cargo volume.
We attempted to assemble recent studies from the City of Portland to see what we could learn about the likely size of marine terminals that would be needed to accommodate future demand in the City of Portland. The West Hayden Island Economic Foundation Study (Entrix 2011), provided a summary of site characteristics for marine-related land uses, including an acreage approximation for terminals of various cargo types in the Portland Harbor and other west coast harbors. The Operational Efficiencies of Port/Terminal World-Wide (Worley Parsons, 2011 – Draft) provides other assumptions for terminal sizes for automobiles, grain, and dry bulk, based on case studies from North American and European terminals. The Worley Parsons analysis also provides a range of potential throughput per acre based on these case study ports.
Cargo Type Low Medium HighAutomobiles (units) (205,000) (430,000) (729,000) Containers (TEUs) - - (196,000)
Metric TonsAutomobiles (276,000) (570,000) (970,000) Containers - - (1,120,000) Breakbulk (3,000) (90,000) (249,000) Grain - (2,390,000) (5,084,000) Dry Bulk - (2,960,000) (11,308,000) Liquid Bulk - - (355,000)
Total (279,000) (6,010,000) (19,086,000)
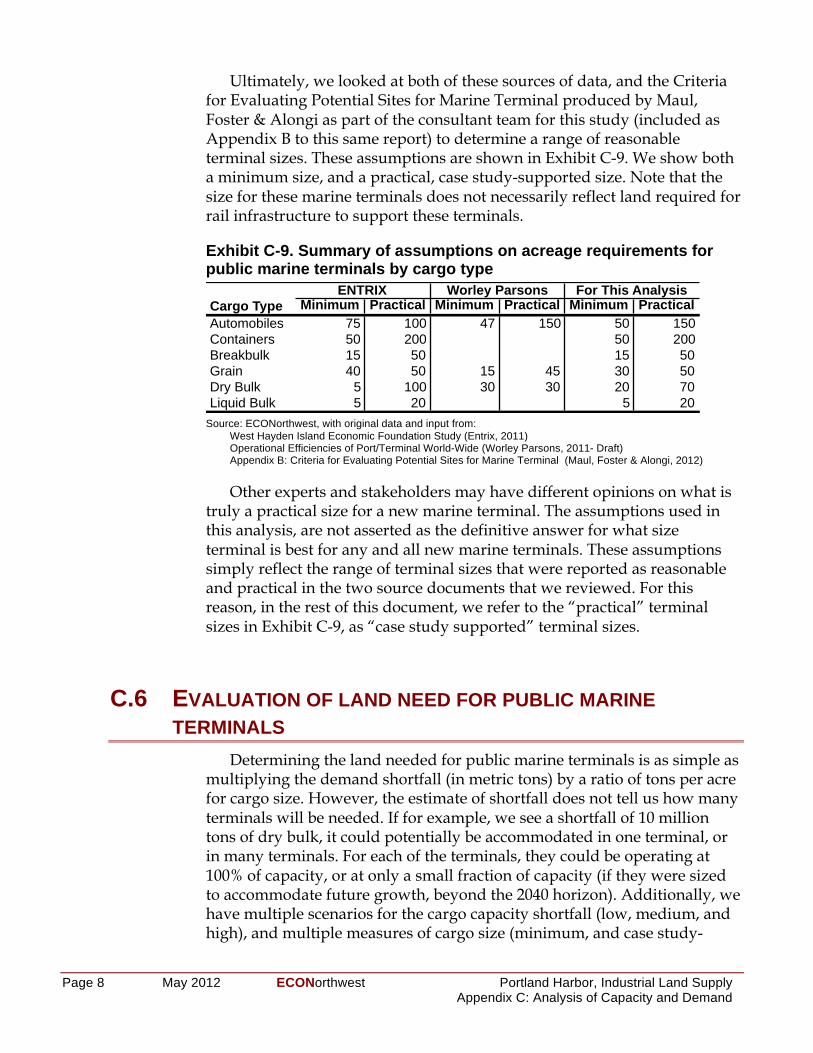
Page 8 May 2012 ECONorthwest Portland Harbor, Industrial Land Supply Appendix C: Analysis of Capacity and Demand
Ultimately, we looked at both of these sources of data, and the Criteria for Evaluating Potential Sites for Marine Terminal produced by Maul, Foster & Alongi as part of the consultant team for this study (included as Appendix B to this same report) to determine a range of reasonable terminal sizes. These assumptions are shown in Exhibit C-9. We show both a minimum size, and a practical, case study-supported size. Note that the size for these marine terminals does not necessarily reflect land required for rail infrastructure to support these terminals.
Exhibit C-9. Summary of assumptions on acreage requirements for public marine terminals by cargo type
Source: ECONorthwest, with original data and input from: West Hayden Island Economic Foundation Study (Entrix, 2011) Operational Efficiencies of Port/Terminal World-Wide (Worley Parsons, 2011- Draft) Appendix B: Criteria for Evaluating Potential Sites for Marine Terminal (Maul, Foster & Alongi, 2012)
Other experts and stakeholders may have different opinions on what is truly a practical size for a new marine terminal. The assumptions used in this analysis, are not asserted as the definitive answer for what size terminal is best for any and all new marine terminals. These assumptions simply reflect the range of terminal sizes that were reported as reasonable and practical in the two source documents that we reviewed. For this reason, in the rest of this document, we refer to the “practical” terminal sizes in Exhibit C-9, as “case study supported” terminal sizes.
C.6 EVALUATION OF LAND NEED FOR PUBLIC MARINE TERMINALS
Determining the land needed for public marine terminals is as simple as multiplying the demand shortfall (in metric tons) by a ratio of tons per acre for cargo size. However, the estimate of shortfall does not tell us how many terminals will be needed. If for example, we see a shortfall of 10 million tons of dry bulk, it could potentially be accommodated in one terminal, or in many terminals. For each of the terminals, they could be operating at 100% of capacity, or at only a small fraction of capacity (if they were sized to accommodate future growth, beyond the 2040 horizon). Additionally, we have multiple scenarios for the cargo capacity shortfall (low, medium, and high), and multiple measures of cargo size (minimum, and case study-
Cargo Type Minimum Practical Minimum Practical Minimum PracticalAutomobiles 75 100 47 150 50 150Containers 50 200 50 200Breakbulk 15 50 15 50Grain 40 50 15 45 30 50Dry Bulk 5 100 30 30 20 70Liquid Bulk 5 20 5 20
ENTRIX Worley Parsons For This Analysis
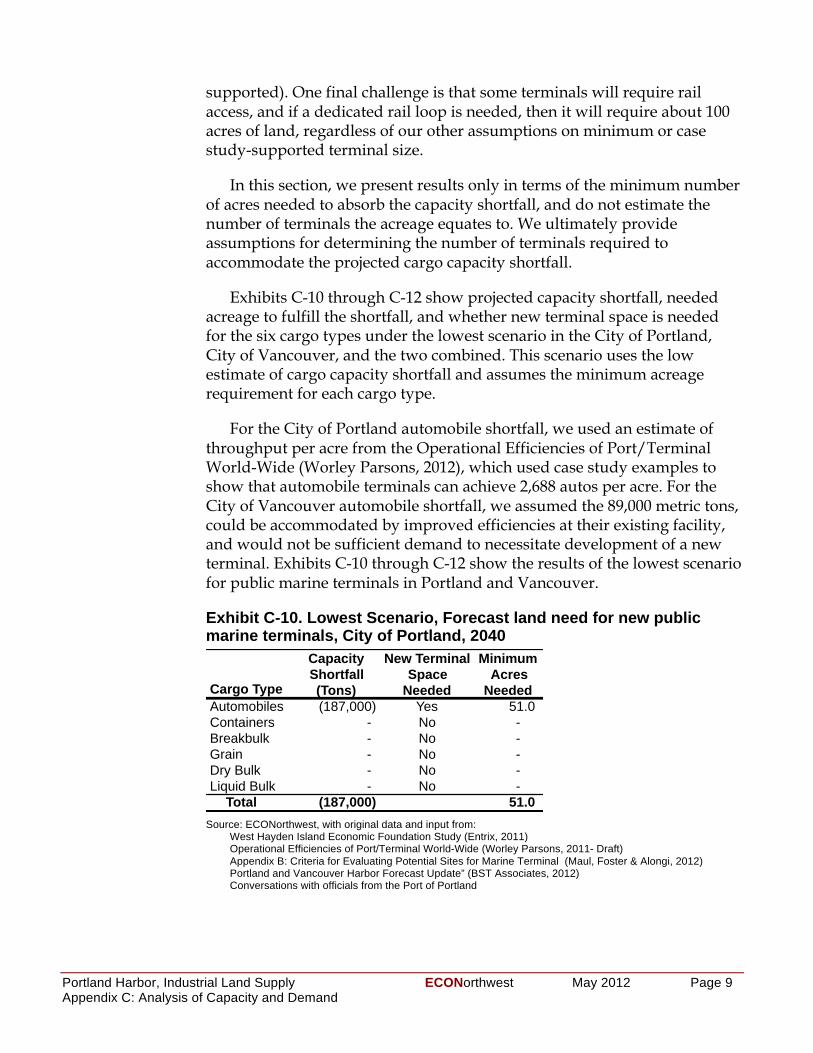
Portland Harbor, Industrial Land Supply ECONorthwest May 2012 Page 9 Appendix C: Analysis of Capacity and Demand
supported). One final challenge is that some terminals will require rail access, and if a dedicated rail loop is needed, then it will require about 100 acres of land, regardless of our other assumptions on minimum or case study-supported terminal size.
In this section, we present results only in terms of the minimum number of acres needed to absorb the capacity shortfall, and do not estimate the number of terminals the acreage equates to. We ultimately provide assumptions for determining the number of terminals required to accommodate the projected cargo capacity shortfall.
Exhibits C-10 through C-12 show projected capacity shortfall, needed acreage to fulfill the shortfall, and whether new terminal space is needed for the six cargo types under the lowest scenario in the City of Portland, City of Vancouver, and the two combined. This scenario uses the low estimate of cargo capacity shortfall and assumes the minimum acreage requirement for each cargo type.
For the City of Portland automobile shortfall, we used an estimate of throughput per acre from the Operational Efficiencies of Port/Terminal World-Wide (Worley Parsons, 2012), which used case study examples to show that automobile terminals can achieve 2,688 autos per acre. For the City of Vancouver automobile shortfall, we assumed the 89,000 metric tons, could be accommodated by improved efficiencies at their existing facility, and would not be sufficient demand to necessitate development of a new terminal. Exhibits C-10 through C-12 show the results of the lowest scenario for public marine terminals in Portland and Vancouver.
Exhibit C-10. Lowest Scenario, Forecast land need for new public marine terminals, City of Portland, 2040
Source: ECONorthwest, with original data and input from:
West Hayden Island Economic Foundation Study (Entrix, 2011) Operational Efficiencies of Port/Terminal World-Wide (Worley Parsons, 2011- Draft) Appendix B: Criteria for Evaluating Potential Sites for Marine Terminal (Maul, Foster & Alongi, 2012) Portland and Vancouver Harbor Forecast Update” (BST Associates, 2012) Conversations with officials from the Port of Portland
Cargo TypeAutomobiles (187,000) Yes 51.0 Containers - No - Breakbulk - No - Grain - No - Dry Bulk - No - Liquid Bulk - No -
Total (187,000) 51.0
Capacity Shortfall (Tons)
New Terminal Space
Needed
Minimum Acres
Needed
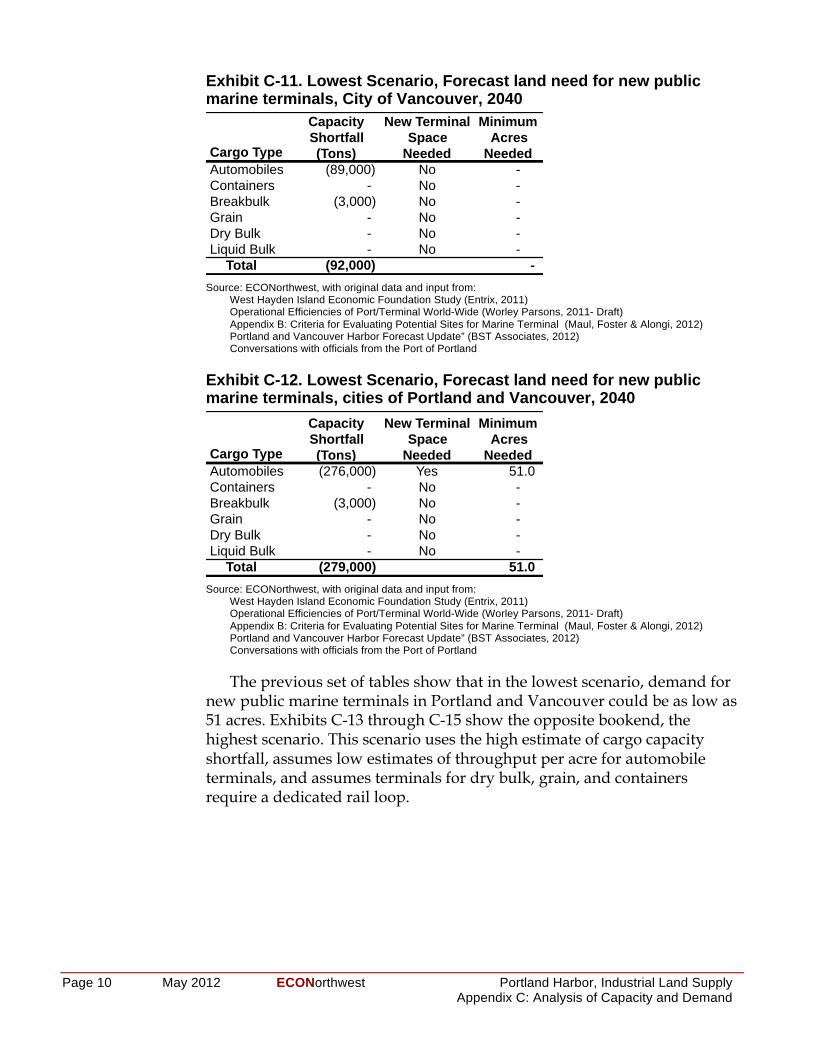
Page 10 May 2012 ECONorthwest Portland Harbor, Industrial Land Supply Appendix C: Analysis of Capacity and Demand
Exhibit C-11. Lowest Scenario, Forecast land need for new public marine terminals, City of Vancouver, 2040
Source: ECONorthwest, with original data and input from:
West Hayden Island Economic Foundation Study (Entrix, 2011) Operational Efficiencies of Port/Terminal World-Wide (Worley Parsons, 2011- Draft) Appendix B: Criteria for Evaluating Potential Sites for Marine Terminal (Maul, Foster & Alongi, 2012) Portland and Vancouver Harbor Forecast Update” (BST Associates, 2012) Conversations with officials from the Port of Portland
Exhibit C-12. Lowest Scenario, Forecast land need for new public marine terminals, cities of Portland and Vancouver, 2040
Source: ECONorthwest, with original data and input from:
West Hayden Island Economic Foundation Study (Entrix, 2011) Operational Efficiencies of Port/Terminal World-Wide (Worley Parsons, 2011- Draft) Appendix B: Criteria for Evaluating Potential Sites for Marine Terminal (Maul, Foster & Alongi, 2012) Portland and Vancouver Harbor Forecast Update” (BST Associates, 2012) Conversations with officials from the Port of Portland
The previous set of tables show that in the lowest scenario, demand for new public marine terminals in Portland and Vancouver could be as low as 51 acres. Exhibits C-13 through C-15 show the opposite bookend, the highest scenario. This scenario uses the high estimate of cargo capacity shortfall, assumes low estimates of throughput per acre for automobile terminals, and assumes terminals for dry bulk, grain, and containers require a dedicated rail loop.
Cargo TypeAutomobiles (89,000) No - Containers - No - Breakbulk (3,000) No - Grain - No - Dry Bulk - No - Liquid Bulk - No -
Total (92,000) -
Capacity Shortfall (Tons)
New Terminal Space
Needed
Minimum Acres
Needed
Cargo TypeAutomobiles (276,000) Yes 51.0 Containers - No - Breakbulk (3,000) No - Grain - No - Dry Bulk - No - Liquid Bulk - No -
Total (279,000) 51.0
Capacity Shortfall (Tons)
New Terminal Space
Needed
Minimum Acres
Needed
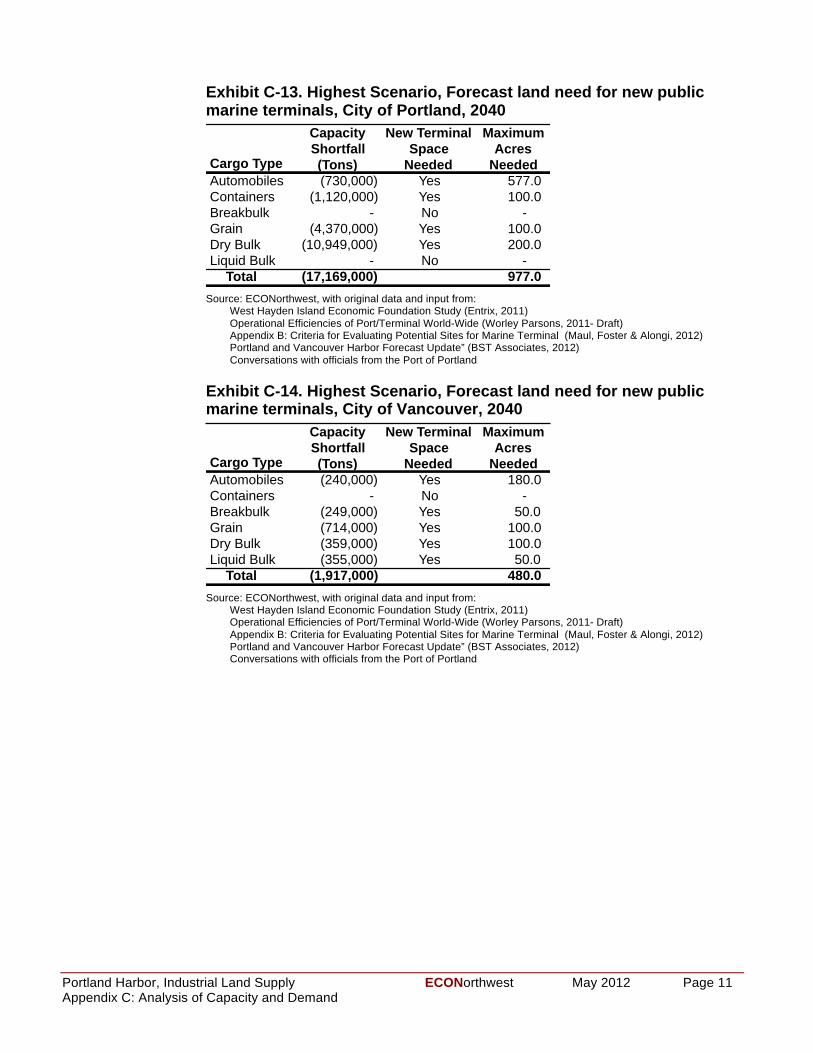
Portland Harbor, Industrial Land Supply ECONorthwest May 2012 Page 11 Appendix C: Analysis of Capacity and Demand
Exhibit C-13. Highest Scenario, Forecast land need for new public marine terminals, City of Portland, 2040
Source: ECONorthwest, with original data and input from:
West Hayden Island Economic Foundation Study (Entrix, 2011) Operational Efficiencies of Port/Terminal World-Wide (Worley Parsons, 2011- Draft) Appendix B: Criteria for Evaluating Potential Sites for Marine Terminal (Maul, Foster & Alongi, 2012) Portland and Vancouver Harbor Forecast Update” (BST Associates, 2012) Conversations with officials from the Port of Portland
Exhibit C-14. Highest Scenario, Forecast land need for new public marine terminals, City of Vancouver, 2040
Source: ECONorthwest, with original data and input from:
West Hayden Island Economic Foundation Study (Entrix, 2011) Operational Efficiencies of Port/Terminal World-Wide (Worley Parsons, 2011- Draft) Appendix B: Criteria for Evaluating Potential Sites for Marine Terminal (Maul, Foster & Alongi, 2012) Portland and Vancouver Harbor Forecast Update” (BST Associates, 2012) Conversations with officials from the Port of Portland
Cargo TypeAutomobiles (730,000) Yes 577.0 Containers (1,120,000) Yes 100.0 Breakbulk - No - Grain (4,370,000) Yes 100.0 Dry Bulk (10,949,000) Yes 200.0 Liquid Bulk - No -
Total (17,169,000) 977.0
Capacity Shortfall (Tons)
New Terminal Space
Needed
Maximum Acres
Needed
Cargo TypeAutomobiles (240,000) Yes 180.0 Containers - No - Breakbulk (249,000) Yes 50.0 Grain (714,000) Yes 100.0 Dry Bulk (359,000) Yes 100.0 Liquid Bulk (355,000) Yes 50.0
Total (1,917,000) 480.0
New Terminal Space
Needed
Maximum Acres
Needed
Capacity Shortfall (Tons)
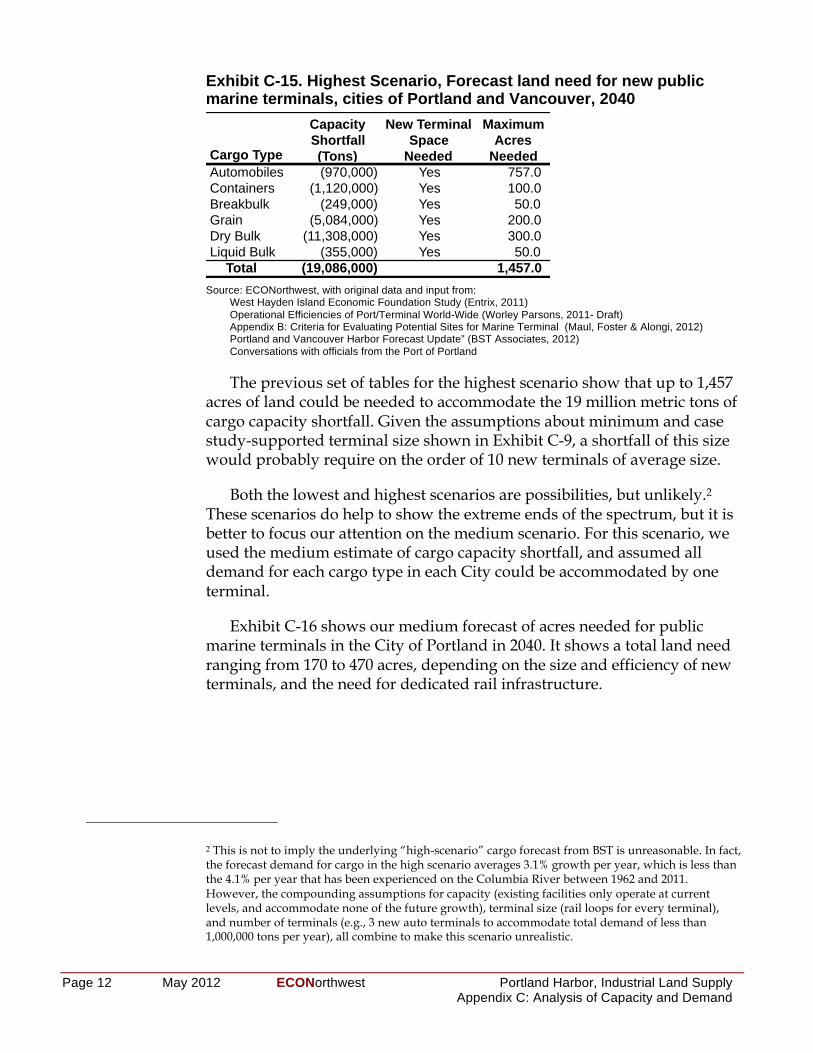
Page 12 May 2012 ECONorthwest Portland Harbor, Industrial Land Supply Appendix C: Analysis of Capacity and Demand
Exhibit C-15. Highest Scenario, Forecast land need for new public marine terminals, cities of Portland and Vancouver, 2040
Source: ECONorthwest, with original data and input from:
West Hayden Island Economic Foundation Study (Entrix, 2011) Operational Efficiencies of Port/Terminal World-Wide (Worley Parsons, 2011- Draft) Appendix B: Criteria for Evaluating Potential Sites for Marine Terminal (Maul, Foster & Alongi, 2012) Portland and Vancouver Harbor Forecast Update” (BST Associates, 2012) Conversations with officials from the Port of Portland
The previous set of tables for the highest scenario show that up to 1,457 acres of land could be needed to accommodate the 19 million metric tons of cargo capacity shortfall. Given the assumptions about minimum and case study-supported terminal size shown in Exhibit C-9, a shortfall of this size would probably require on the order of 10 new terminals of average size.
Both the lowest and highest scenarios are possibilities, but unlikely.2 These scenarios do help to show the extreme ends of the spectrum, but it is better to focus our attention on the medium scenario. For this scenario, we used the medium estimate of cargo capacity shortfall, and assumed all demand for each cargo type in each City could be accommodated by one terminal.
Exhibit C-16 shows our medium forecast of acres needed for public marine terminals in the City of Portland in 2040. It shows a total land need ranging from 170 to 470 acres, depending on the size and efficiency of new terminals, and the need for dedicated rail infrastructure.
2 This is not to imply the underlying “high-scenario” cargo forecast from BST is unreasonable. In fact, the forecast demand for cargo in the high scenario averages 3.1% growth per year, which is less than the 4.1% per year that has been experienced on the Columbia River between 1962 and 2011. However, the compounding assumptions for capacity (existing facilities only operate at current levels, and accommodate none of the future growth), terminal size (rail loops for every terminal), and number of terminals (e.g., 3 new auto terminals to accommodate total demand of less than 1,000,000 tons per year), all combine to make this scenario unrealistic.
Cargo TypeAutomobiles (970,000) Yes 757.0 Containers (1,120,000) Yes 100.0 Breakbulk (249,000) Yes 50.0 Grain (5,084,000) Yes 200.0 Dry Bulk (11,308,000) Yes 300.0 Liquid Bulk (355,000) Yes 50.0
Total (19,086,000) 1,457.0
Maximum Acres
Needed
Capacity Shortfall (Tons)
New Terminal Space
Needed
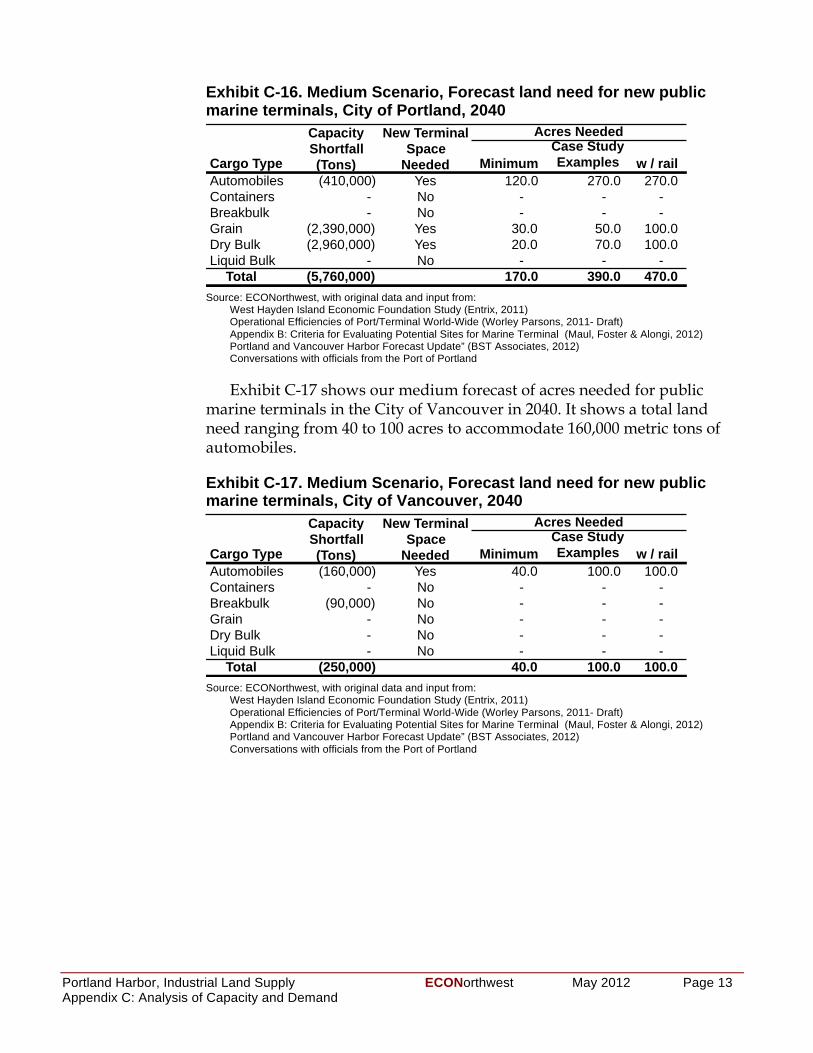
Portland Harbor, Industrial Land Supply ECONorthwest May 2012 Page 13 Appendix C: Analysis of Capacity and Demand
Exhibit C-16. Medium Scenario, Forecast land need for new public marine terminals, City of Portland, 2040
Source: ECONorthwest, with original data and input from:
West Hayden Island Economic Foundation Study (Entrix, 2011) Operational Efficiencies of Port/Terminal World-Wide (Worley Parsons, 2011- Draft) Appendix B: Criteria for Evaluating Potential Sites for Marine Terminal (Maul, Foster & Alongi, 2012) Portland and Vancouver Harbor Forecast Update” (BST Associates, 2012) Conversations with officials from the Port of Portland
Exhibit C-17 shows our medium forecast of acres needed for public marine terminals in the City of Vancouver in 2040. It shows a total land need ranging from 40 to 100 acres to accommodate 160,000 metric tons of automobiles.
Exhibit C-17. Medium Scenario, Forecast land need for new public marine terminals, City of Vancouver, 2040
Source: ECONorthwest, with original data and input from:
West Hayden Island Economic Foundation Study (Entrix, 2011) Operational Efficiencies of Port/Terminal World-Wide (Worley Parsons, 2011- Draft) Appendix B: Criteria for Evaluating Potential Sites for Marine Terminal (Maul, Foster & Alongi, 2012) Portland and Vancouver Harbor Forecast Update” (BST Associates, 2012) Conversations with officials from the Port of Portland
Cargo Type MinimumCase Study Examples w / rail
Automobiles (410,000) Yes 120.0 270.0 270.0 Containers - No - - - Breakbulk - No - - - Grain (2,390,000) Yes 30.0 50.0 100.0 Dry Bulk (2,960,000) Yes 20.0 70.0 100.0 Liquid Bulk - No - - -
Total (5,760,000) 170.0 390.0 470.0
Capacity Shortfall (Tons)
New Terminal Space
Needed
Acres Needed
Cargo Type MinimumCase Study Examples w / rail
Automobiles (160,000) Yes 40.0 100.0 100.0 Containers - No - - - Breakbulk (90,000) No - - - Grain - No - - - Dry Bulk - No - - - Liquid Bulk - No - - -
Total (250,000) 40.0 100.0 100.0
Capacity Shortfall (Tons)
New Terminal Space
Needed
Acres Needed
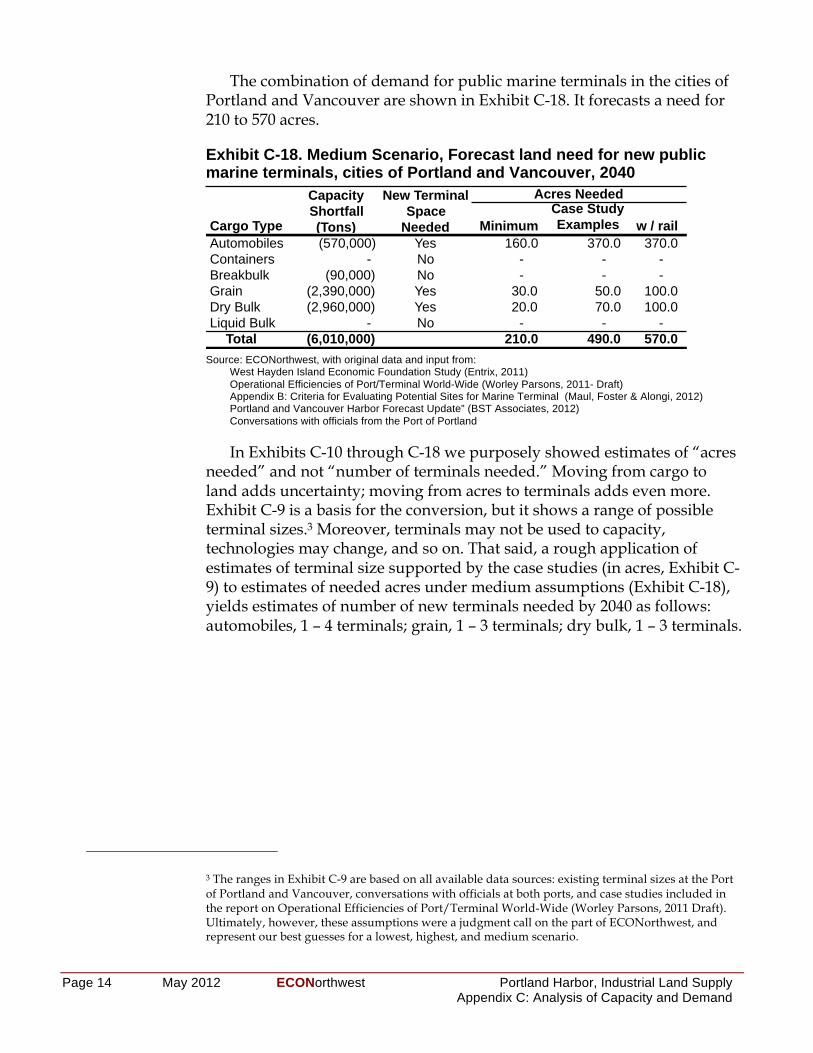
Page 14 May 2012 ECONorthwest Portland Harbor, Industrial Land Supply Appendix C: Analysis of Capacity and Demand
The combination of demand for public marine terminals in the cities of Portland and Vancouver are shown in Exhibit C-18. It forecasts a need for 210 to 570 acres.
Exhibit C-18. Medium Scenario, Forecast land need for new public marine terminals, cities of Portland and Vancouver, 2040
Source: ECONorthwest, with original data and input from:
West Hayden Island Economic Foundation Study (Entrix, 2011) Operational Efficiencies of Port/Terminal World-Wide (Worley Parsons, 2011- Draft) Appendix B: Criteria for Evaluating Potential Sites for Marine Terminal (Maul, Foster & Alongi, 2012) Portland and Vancouver Harbor Forecast Update” (BST Associates, 2012) Conversations with officials from the Port of Portland
In Exhibits C-10 through C-18 we purposely showed estimates of “acres needed” and not “number of terminals needed.” Moving from cargo to land adds uncertainty; moving from acres to terminals adds even more. Exhibit C-9 is a basis for the conversion, but it shows a range of possible terminal sizes.3 Moreover, terminals may not be used to capacity, technologies may change, and so on. That said, a rough application of estimates of terminal size supported by the case studies (in acres, Exhibit C-9) to estimates of needed acres under medium assumptions (Exhibit C-18), yields estimates of number of new terminals needed by 2040 as follows: automobiles, 1 – 4 terminals; grain, 1 – 3 terminals; dry bulk, 1 – 3 terminals.
3 The ranges in Exhibit C-9 are based on all available data sources: existing terminal sizes at the Port of Portland and Vancouver, conversations with officials at both ports, and case studies included in the report on Operational Efficiencies of Port/Terminal World-Wide (Worley Parsons, 2011 Draft). Ultimately, however, these assumptions were a judgment call on the part of ECONorthwest, and represent our best guesses for a lowest, highest, and medium scenario.
Cargo Type MinimumCase Study Examples w / rail
Automobiles (570,000) Yes 160.0 370.0 370.0 Containers - No - - - Breakbulk (90,000) No - - - Grain (2,390,000) Yes 30.0 50.0 100.0 Dry Bulk (2,960,000) Yes 20.0 70.0 100.0 Liquid Bulk - No - - -
Total (6,010,000) 210.0 490.0 570.0
Capacity Shortfall (Tons)
New Terminal Space
Needed
Acres Needed
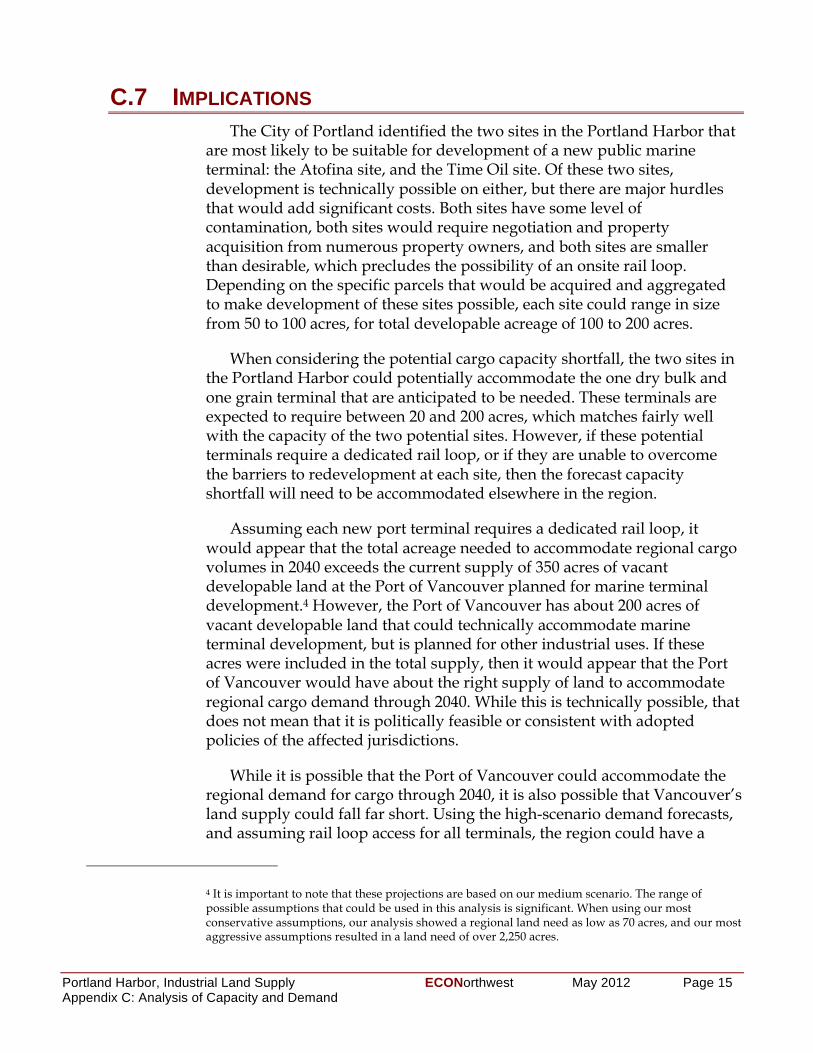
Portland Harbor, Industrial Land Supply ECONorthwest May 2012 Page 15 Appendix C: Analysis of Capacity and Demand
C.7 IMPLICATIONS The City of Portland identified the two sites in the Portland Harbor that
are most likely to be suitable for development of a new public marine terminal: the Atofina site, and the Time Oil site. Of these two sites, development is technically possible on either, but there are major hurdles that would add significant costs. Both sites have some level of contamination, both sites would require negotiation and property acquisition from numerous property owners, and both sites are smaller than desirable, which precludes the possibility of an onsite rail loop. Depending on the specific parcels that would be acquired and aggregated to make development of these sites possible, each site could range in size from 50 to 100 acres, for total developable acreage of 100 to 200 acres.
When considering the potential cargo capacity shortfall, the two sites in the Portland Harbor could potentially accommodate the one dry bulk and one grain terminal that are anticipated to be needed. These terminals are expected to require between 20 and 200 acres, which matches fairly well with the capacity of the two potential sites. However, if these potential terminals require a dedicated rail loop, or if they are unable to overcome the barriers to redevelopment at each site, then the forecast capacity shortfall will need to be accommodated elsewhere in the region.
Assuming each new port terminal requires a dedicated rail loop, it would appear that the total acreage needed to accommodate regional cargo volumes in 2040 exceeds the current supply of 350 acres of vacant developable land at the Port of Vancouver planned for marine terminal development.4 However, the Port of Vancouver has about 200 acres of vacant developable land that could technically accommodate marine terminal development, but is planned for other industrial uses. If these acres were included in the total supply, then it would appear that the Port of Vancouver would have about the right supply of land to accommodate regional cargo demand through 2040. While this is technically possible, that does not mean that it is politically feasible or consistent with adopted policies of the affected jurisdictions.
While it is possible that the Port of Vancouver could accommodate the regional demand for cargo through 2040, it is also possible that Vancouver’s land supply could fall far short. Using the high-scenario demand forecasts, and assuming rail loop access for all terminals, the region could have a
4 It is important to note that these projections are based on our medium scenario. The range of possible assumptions that could be used in this analysis is significant. When using our most conservative assumptions, our analysis showed a regional land need as low as 70 acres, and our most aggressive assumptions resulted in a land need of over 2,250 acres.
Page 16 May 2012 ECONorthwest Portland Harbor, Industrial Land Supply Appendix C: Analysis of Capacity and Demand
shortfall of up to 1,457 acres. If only 350 acres at the Port of Vancouver are available for marine terminal development, as is their current stated policy, then that would leave over 1,100 acres of unmet demand for public marine terminals in the region.
Our analysis finds that the Portland Harbor has very limited capacity to accommodate future demand for public marine terminals, but that the Port of Vancouver has capacity to accommodate some (but not necessarily all) forecast demand for cargo for both the cities of Portland and Vancouver through the year 2040 under our medium scenario.
Portland Harbor, Industrial Land Supply ECONorthwest May 2012 Page 1 Appendix D: Mapping Analysis
Appendix D Mapping Analysis As part of the background research for the Harbor Lands Contract, Bureau of Planning and Sustainability staff conducted a visual survey of aerial maps of the Portland Harbor to classify the lands in one of several categories. The first reason for undertaking this review was to provide the consultant for the Harbor Lands Analysis, ECONorthwest (ECO), with a visual representation of current Portland Harbor development so that they could analyze this and confirm potential sites to consider for assembly into larger parcels. The second reason for this effort was to help validate the initial acreage findings of the draft Economic Opportunities Analysis (EOA).
Lands were split into various development types, including buildings, other structures/tanks, exterior work/storage areas, loading & maneuvering areas, parking areas, rail yards, vacant land and a few residual categories (see chart below). Once these lands were categorized, they were compared with the lands that are considered environmentally constrained or brownfields. The intent was to specifically consider whether vacant lands predominantly had one of these constraints applied to them. While the visual survey and analysis was initially considered to cover the lands that staff wanted ECO to review along the harbor, it was also refined to incorporate the boundary of the EOA for the Portland Harbor sub-geography to determine whether the acreage was significantly different. The findings are provided in a table attached to this summary.
Within the Portland Harbor sub-geography, the visual survey identified a total of 590 acres of lands that were considered vacant. However, of this acreage, approximately 412 acres either contained medium or high level natural resources (174.4 acres), were existing brownfields (145.2 acres), or were brownfield sites with resources as well (92.6 acres). This left approximately 174 acres that were not constrained. This number exceeds the amount of unconstrained vacant land determined by Hovee (108 acres). This is partially due to the fact that the visual survey included vacant portions of otherwise developed parcels, and was not constrained by lot lines. Thus vacant portions of lots were included in the aerial survey that were not included in the EOA. Within the EOA update, Hovee had separated out the Harbor Access Lands from the larger Columbia Harbor subgeography. In either case, the unconstrained land represents a minority of the overall vacant land in the harbor.
For the ECO analysis, the maps helped illustrate the potential vacant sites that could be looked in greater detail in their report. This led to the consideration of the Time Oil and Atofina sites as possible areas for consideration of a marine terminal. The report includes the analysis on these sites.
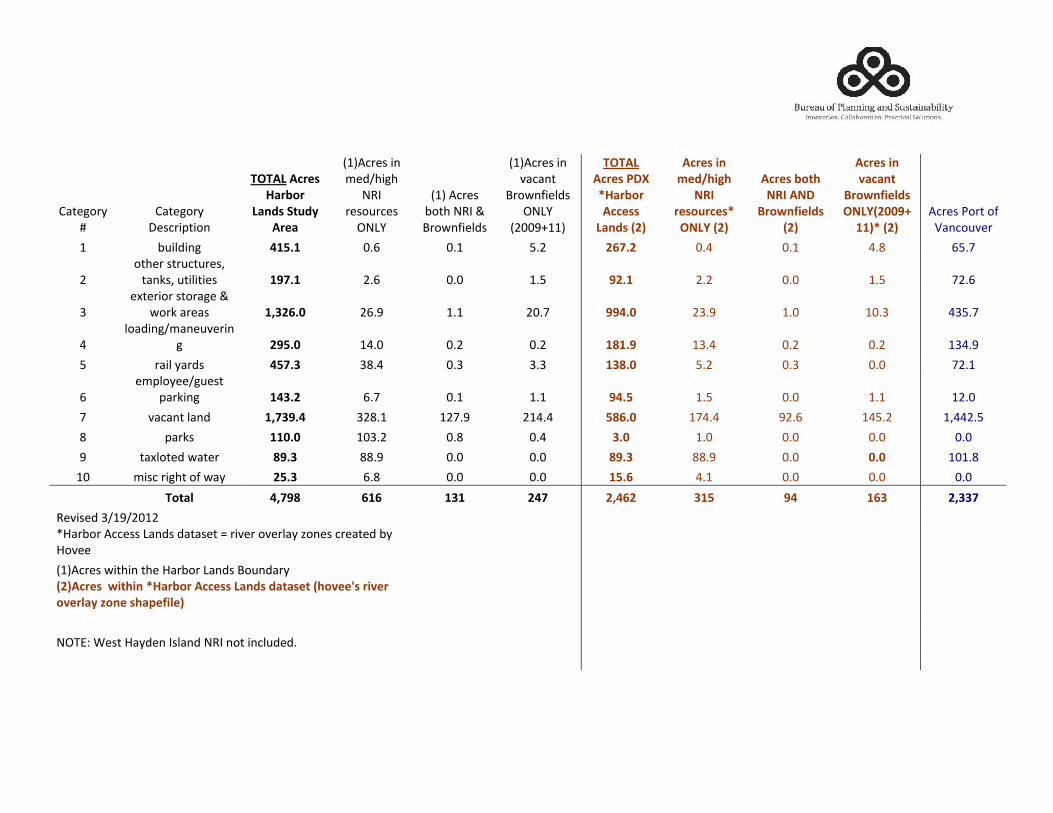
! ! !!!
!"#$%&'()
!"#$%&'(*$+,'-.#-&/
!"!#$ #%&'()*&+,&
$*-.( /01.2#&'*
0123,'$+ -/4$567-%7
89:'$+&;',$+<8=>
012 3,'$+? 89: @A'&B/C-$D5+
0123,'$+ -/E","/#
A'&B/C-$D5+<8=>
0FGGHI112
!"!#$#%&'( 3456)*&+,&#%%'(($*-.( 789
#%&'( :-;'.<=:>=
?@A&'(,1&%'(6"?$B 789
#%&'( +,0=?@A #?4
C&,D-E:'F.(789
#%&'( :-G*%*-0
C&,D-E:'F.("?$B78HHIJKK96 789
3,'$+ J&'# &CK"/,&;E$'
1 ?;-D5-/% LKMNK GLM GL1 NLF 8OPN8 GLO GL1 OLP MNLQ
F$' +#';,#;'$+R#"/S+R ;#-D-#-$+ KIPNK FLM GLG 1LN I8NK FLF GLG 1LN QFLM
T$U#$'-&' +#&'"%$ @
B&'S "'$"+ KQR8ONH FMLH 1L1 FGLQ IILNH FTLH 1LG 1GLT OTNLQ
OD&"5-/%64"/$;E$'-/
% 8IMNH 1OLG GLF GLF KSKNI 1TLO GLF GLF 1TOLH
N '"-D ("'5+ LMPNR TPLO GLT TLT KRSNH NLF GLT GLG QFL1
M$4.D&($$6%;$+#
."'S-/% KLRN8 MLQ GL1 1L1 ILNM 1LN GLG 1L1 1FLG
Q E","/# D"/5 KQPRINL TFPL1 1FQLH F1OLO MSONH 1QOLO HFLM 1ONLF 1ROOFLN
P ."'S+ KKHNH 1GTLF GLP GLO RNH 1LG GLG GLG GLG
H #"UD&#$5 B"#$' SINR PPLH GLG GLG SINR PPLH GLG HNH 1G1LP
1G 4-+, '-%7# &C B"( 8MNR MLP GLG GLG KMNO OL1 GLG GLG GLG
!,0*F LQPIS OKO KRK 8LP 8QLO8 RKM IL KOR 8QRRP
9$E-+$5 T61H6FG1FVW"'?&' 3,,$++ ="/5+ 5"#"+$# X '-E$' &E$'D"( Y&/$+ ,'$"#$5 ?(W&E$$
0123,'$+ B-#7-/ #7$ W"'?&' ="/5+ A&;/5"'(789#%&'( D:0=:- 6)*&+,& #%%'(( $*-.( .*0*('0 7=,G''T( &:G'&,G'&F*2 U,-' (=*V'E:F'9
8<Z[\ ]$+# W"(5$/ :+D"/5 89: /&# -/,D;5$5L
!