polyol mediated solvothermal synthesis and characterization of spindle shaped la2(moo4)3: eu3+...
TRANSCRIPT
Chemical Engineering Journal 255 (2014) 205–213
Contents lists available at ScienceDirect
Chemical Engineering Journal
journal homepage: www.elsevier .com/locate /cej
Polyol mediated solvothermal synthesis and characterization of spindleshaped La2(MoO4)3: Eu3+ phosphors
http://dx.doi.org/10.1016/j.cej.2014.05.1071385-8947/� 2014 Elsevier B.V. All rights reserved.
⇑ Corresponding author. Tel.: +82 312013820; fax: +82 312062820.E-mail address: [email protected] (J.S. Yu).
L. Krishna Bharat a, Vengala Rao Bandi b, Jae Su Yu a,⇑a Department of Electronics and Radio Engineering, Kyung Hee University, Yongin-si, Gyeonggi-do 446-701, Republic of Koreab Department of Humanities and Sciences, Sri Venkateswara College of Engineering and Technology, RVS Nagar, Chittoor 517127, Andhra Pradesh, India
h i g h l i g h t s
� La2(MoO4)3 spindles were preparedby a polyol mediated solvothermalsynthesis.� The (MoO4)2� has a significant effect
on the emission from Eu3+ ions.� These phosphors are a good red
emitting candidate for UV-based tri-band WLEDs.� The nanosized and porous structures
are very useful for biologyapplications.
g r a p h i c a l a b s t r a c t
a r t i c l e i n f o
Article history:Received 27 March 2014Received in revised form 18 May 2014Accepted 23 May 2014Available online 13 June 2014
Keywords:Inorganic compoundSolvothermal synthesisOptical materialsLuminescence
a b s t r a c t
Spindle shaped tetragonal La2(MoO4)3: Eu3+ phosphors were synthesized by a polyol mediated solvother-mal synthesis method. Growth mechanism for the formation of spindles was explained by increasing thereaction temperature. Similarly, the effect of EDTA concentration and calcination temperature on themorphology of particles was studied. Structural properties of the samples were analyzed by X-ray diffrac-tion patterns and Fourier transform infrared spectra. The emission richness in the red region wasinvestigated by measuring both photoluminescence (PL) and cathadoluminescence (CL) emission spectra.The excitation spectra of the samples at different calcination temperatures exhibited intense excitationbands at different wavelengths in the ultraviolet (UV)-A, UV-B, UV-C and visible regions. This propertymakes the sample to be a promising red region component in UV or visible excitation based whitelight-emitting diodes. The lifetime variation as a function of calcination temperature was observed.The CL spectra exhibited similar behaviors as the PL spectra except the considerable emission intensitiesin lower wavelength region. The CIE coordinates obtained from the PL and CL spectra provided a goodchromaticity in the red region.
� 2014 Elsevier B.V. All rights reserved.
1. Introduction
Solid-state lighting (SSL) imparts significant changes to thelighting industry. Reduced power consumption by more than90%, 50 times longer lifetime compared to incandescent light
bulbs, dimmability, and flexibility provide new possibilities forlighting designers. Thus, light-emitting diode (LED) lighting isexpected to continue to grow very fast in all applications. However,in terms of volume, the two most important segments are residen-tial and commercial industries. For indoor illumination, white LEDs(WLEDs) which have high color rendering index (CRI) and highoutput power are preferable. In the case of blue LED chips com-bined with yellow phosphors (Y3Al5O12: Ce3+), the CRI value is
206 L. Krishna Bharat et al. / Chemical Engineering Journal 255 (2014) 205–213
low due to their poor emission in the red region [1]. The alternativefor getting high CRI values is to use ultraviolet (UV)-LED chips withred, green, and blue phosphors or blue LED chips coupled with redand green phosphors [2]. So there is a need to develop phosphorswhich can be excited well with the UV-LEDs. In earlier studies, itwas found that uniform shape and size distribution of particlesare important factors for obtaining higher output power from thedevices [3]. Irregular particle size and shape practically lead tonon-uniform packing morphologies that result in packing densityvariations of devices [4]. Thus, synthesizing nanoparticles with def-inite shape and size distribution by viable techniques like sol–gel[5], hydrothermal [6], molten salt synthesis [7], supersonic andmicrowave co-assisted method [8,9] etc., is worthy for the fabrica-tion of highly efficient luminescence devices.
The inorganic lanthanide ions show narrow emission bands,long lifetime, and prominent stokes shifts. Among various typesof lanthanide incorporated materials, molybdates of Ln2(MoO4)3
and Ln2MoO6 (Ln: lanthanides) types have gained much attentiondue to the broad range of potential applications as up-conversionmaterials, catalysts, high-performance phosphors [10–17] whichenable researchers to focus deeply on these compounds. The spell-binding character of MoO4
2� clusters also makes it as a good hostmaterial for preparing high-efficiency luminescent materials[18,19]. Previously, Zhang et al. have reported the self-assembleddendritic nanostructures of La2(MoO4)3 via a facile hydrothermalsynthesis method. Here, polyethylene glycol (PEG) was used as astructure-directing agent [20]. Lin et al. also reported the forma-tion of various self-assembled three-dimensional hierarchicalstructures of La2(MoO4)3 by controlling the EDTA concentrationand the pH of solution via a hydrothermal method [21]. Watchingover those works, we tried to synthesize self-assembled nanostruc-tures of La2(MoO4)3 (LM) phosphors by a polyol-mediated solvo-thermal method and succeeded in obtaining the nanospindle ofalmost uniform size and shape with less amount of aggregation.Further studies were performed on the growth mechanism of spin-dle shaped nanoparticles by changing different parameters such asreaction temperature, time, and concentration of surfactant. Thestability of morphology was also observed at different calcinationtemperatures. The optical properties of these compounds werestudied with the help of Eu3+ ions doping.
2. Experimental procedure
2.1. Materials
The starting materials for the preparation of LM: Eu3+ phos-phors were lanthanum (III) nitrate hexahydrate (La(NO3)3�6H2O),ammonium molybdate tetrahydrate ((NH4)6Mo7O24�4H2O), ammo-nia solution (28 wt.%), ethylene glycol (EG), ethylenediaminetetra-acetic acid (EDTA), and europium nitrate pentahydrate(Eu(NO3)3�5H2O). All the chemicals purchased from sigma Aldrichwere high purity grade and were used without any furtherpurification.
2.2. Synthesis
For the preparation of LM: Eu3+ phosphors via a solvothermalprocess, two solutions were prepared separately. Solution I wasprepared by taking EG (205 ml), EDTA (0–0.1 g), x mmol Eu(NO3)3,and (2 � x) mmol La(NO3)3 in one beaker and solution II with3 mmol (NH4)6Mo7O24, 9 mmol ammonia solution (28 wt.%), and37.5 ml DI water was made in another beaker. In solution II,ammonia and DI water were used to obtain the monomeric oxya-nions (MoO4
2�) from ammonium heptamolybdate which was usefulin the formation of the final product. The two solutions were mixed
constantly under continuous magnetic stirring for 30 min. Afterthat, the solution I was heated to 80 �C (5 �C/min) for 15 min. Then,the solution II was added drop wise to the solution I, and a milkywhite colloidal solution was immediately formed. The final solu-tion was transferred into a SUS-316 liner (360 cm3 volume and70% filling capacity) and was placed in a stainless steel autoclave.The solution temperature was raised to a required temperaturebetween 100 and 200 �C and kept at that temperature for 1 h withmagnetic stirring and then continued heating up to 10 h withoutmagnetic stirring. The autoclave was cooled to room temperatureand the powder was collected and washed several times with eth-anol and water. The powders were dried at 70 �C for a day in ambi-ent air atmosphere. A series of Eu3+ doped (1, 3, 5, 7 and 9 mol%)LM compounds were prepared by repeating the above synthesismethod. The prepared powders were calcined to different calcina-tion temperatures.
The crystallinity and phase purity of the products were ana-lyzed by X-ray diffraction (XRD) patterns (M18XHF-SRA, Mac Sci-ence) using CuKa (1.5406 Å) radiations in a 2h range of 15–65�(0.02�/s). The size and shape of the particles were determined byusing a field-emission scanning electron microscope (FE-SEM:LEO SUPRA 55, Carl Zeiss) and a transmission electron microscope(TEM: JEM-2100F, JEOL). The presence of EDTA was confirmed byusing a Fourier transforms infrared (FTIR) system (spectrum 100,Perkinelmer). Room-temperature photoluminescence (PL) andcathodoluminescence (CL) measurements were carried out byusing a spectrofluorometer (QM-4/2005SE, PTI) equipped withxenon arc lamp and Gatan (UK) MonoCL3 system attached withSEM (Hitachi S-4300 SE), respectively.
3. Results and discussion
The nanostructured LM particles were prepared by the solvo-thermal method using EG as a solvent. The reaction mechanismsuggested for the formation of LM compound is as follows:
3ðNH4Þ6Mo7O24 � 4H2O! 3Mo7O6�24 þ 18NHþ4 þ 12H2O
Mo7O6�24 þ 8NH3 �H2O! 7MoO2�
4 þ 8NHþ4 þ 4H2O
2La3þ þ 3MoO2�4 ! La2ðMoO4Þ3
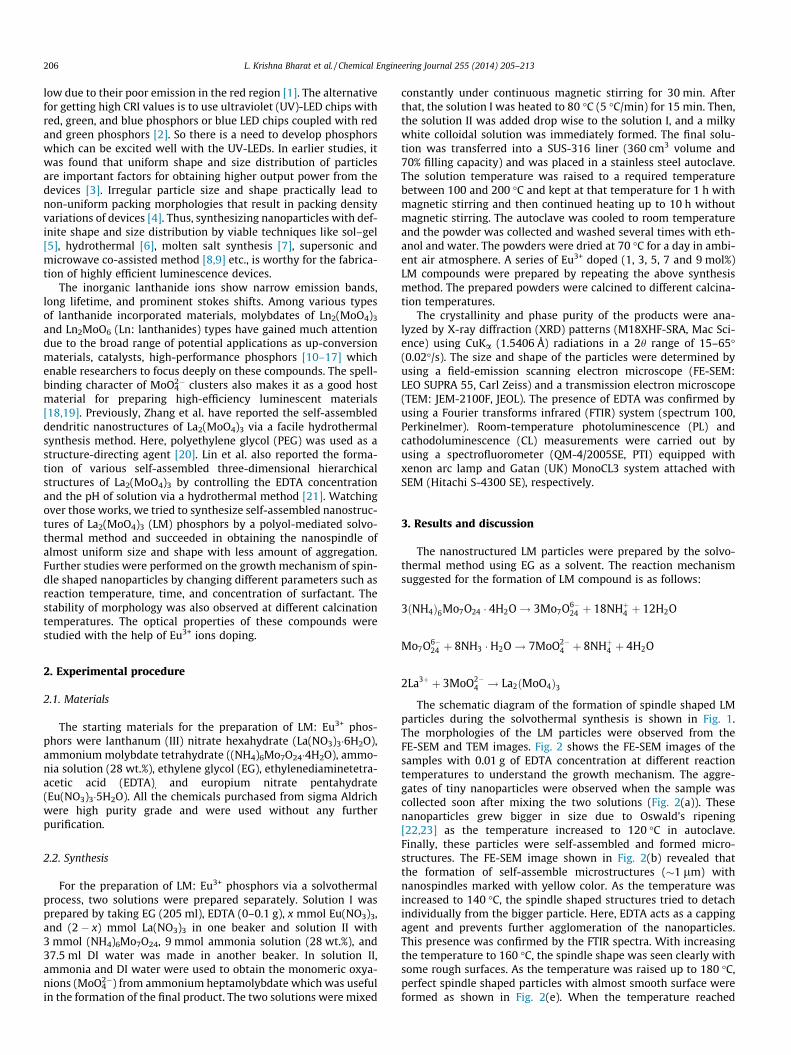
The schematic diagram of the formation of spindle shaped LMparticles during the solvothermal synthesis is shown in Fig. 1.The morphologies of the LM particles were observed from theFE-SEM and TEM images. Fig. 2 shows the FE-SEM images of thesamples with 0.01 g of EDTA concentration at different reactiontemperatures to understand the growth mechanism. The aggre-gates of tiny nanoparticles were observed when the sample wascollected soon after mixing the two solutions (Fig. 2(a)). Thesenanoparticles grew bigger in size due to Oswald’s ripening[22,23] as the temperature increased to 120 �C in autoclave.Finally, these particles were self-assembled and formed micro-structures. The FE-SEM image shown in Fig. 2(b) revealed thatthe formation of self-assemble microstructures (�1 lm) withnanospindles marked with yellow color. As the temperature wasincreased to 140 �C, the spindle shaped structures tried to detachindividually from the bigger particle. Here, EDTA acts as a cappingagent and prevents further agglomeration of the nanoparticles.This presence was confirmed by the FTIR spectra. With increasingthe temperature to 160 �C, the spindle shape was seen clearly withsome rough surfaces. As the temperature was raised up to 180 �C,perfect spindle shaped particles with almost smooth surface wereformed as shown in Fig. 2(e). When the temperature reached
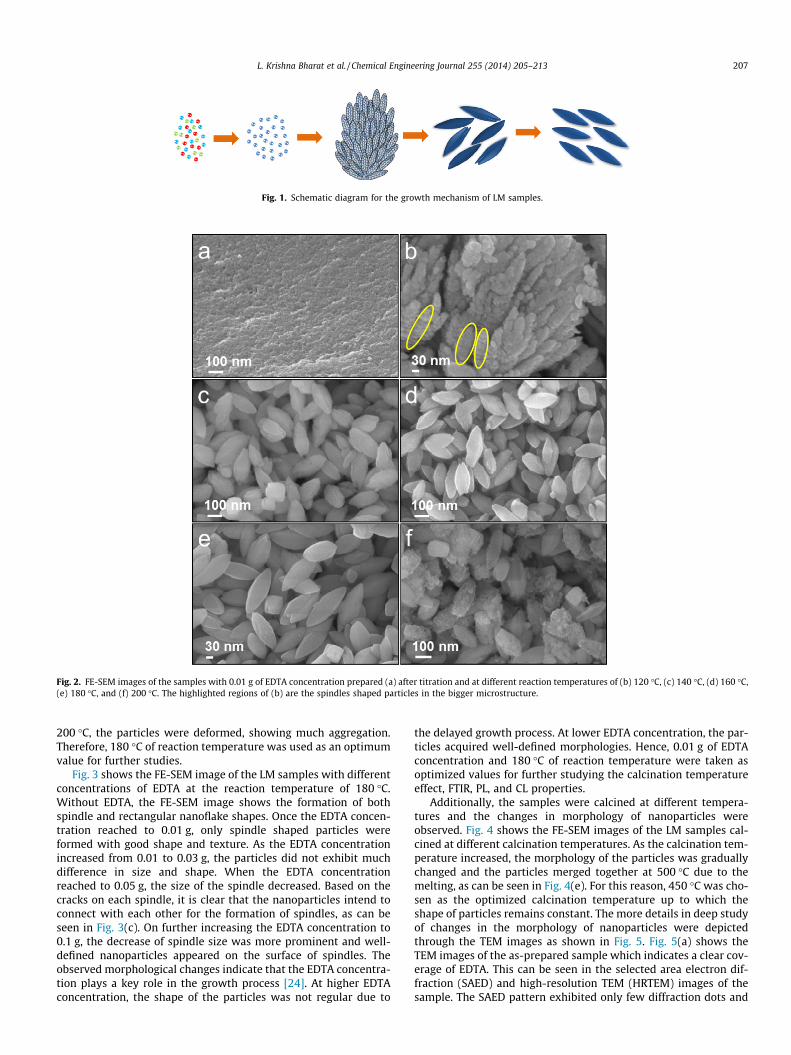
Fig. 1. Schematic diagram for the growth mechanism of LM samples.
Fig. 2. FE-SEM images of the samples with 0.01 g of EDTA concentration prepared (a) after titration and at different reaction temperatures of (b) 120 �C, (c) 140 �C, (d) 160 �C,(e) 180 �C, and (f) 200 �C. The highlighted regions of (b) are the spindles shaped particles in the bigger microstructure.
L. Krishna Bharat et al. / Chemical Engineering Journal 255 (2014) 205–213 207
200 �C, the particles were deformed, showing much aggregation.Therefore, 180 �C of reaction temperature was used as an optimumvalue for further studies.
Fig. 3 shows the FE-SEM image of the LM samples with differentconcentrations of EDTA at the reaction temperature of 180 �C.Without EDTA, the FE-SEM image shows the formation of bothspindle and rectangular nanoflake shapes. Once the EDTA concen-tration reached to 0.01 g, only spindle shaped particles wereformed with good shape and texture. As the EDTA concentrationincreased from 0.01 to 0.03 g, the particles did not exhibit muchdifference in size and shape. When the EDTA concentrationreached to 0.05 g, the size of the spindle decreased. Based on thecracks on each spindle, it is clear that the nanoparticles intend toconnect with each other for the formation of spindles, as can beseen in Fig. 3(c). On further increasing the EDTA concentration to0.1 g, the decrease of spindle size was more prominent and well-defined nanoparticles appeared on the surface of spindles. Theobserved morphological changes indicate that the EDTA concentra-tion plays a key role in the growth process [24]. At higher EDTAconcentration, the shape of the particles was not regular due to
the delayed growth process. At lower EDTA concentration, the par-ticles acquired well-defined morphologies. Hence, 0.01 g of EDTAconcentration and 180 �C of reaction temperature were taken asoptimized values for further studying the calcination temperatureeffect, FTIR, PL, and CL properties.
Additionally, the samples were calcined at different tempera-tures and the changes in morphology of nanoparticles wereobserved. Fig. 4 shows the FE-SEM images of the LM samples cal-cined at different calcination temperatures. As the calcination tem-perature increased, the morphology of the particles was graduallychanged and the particles merged together at 500 �C due to themelting, as can be seen in Fig. 4(e). For this reason, 450 �C was cho-sen as the optimized calcination temperature up to which theshape of particles remains constant. The more details in deep studyof changes in the morphology of nanoparticles were depictedthrough the TEM images as shown in Fig. 5. Fig. 5(a) shows theTEM images of the as-prepared sample which indicates a clear cov-erage of EDTA. This can be seen in the selected area electron dif-fraction (SAED) and high-resolution TEM (HRTEM) images of thesample. The SAED pattern exhibited only few diffraction dots and
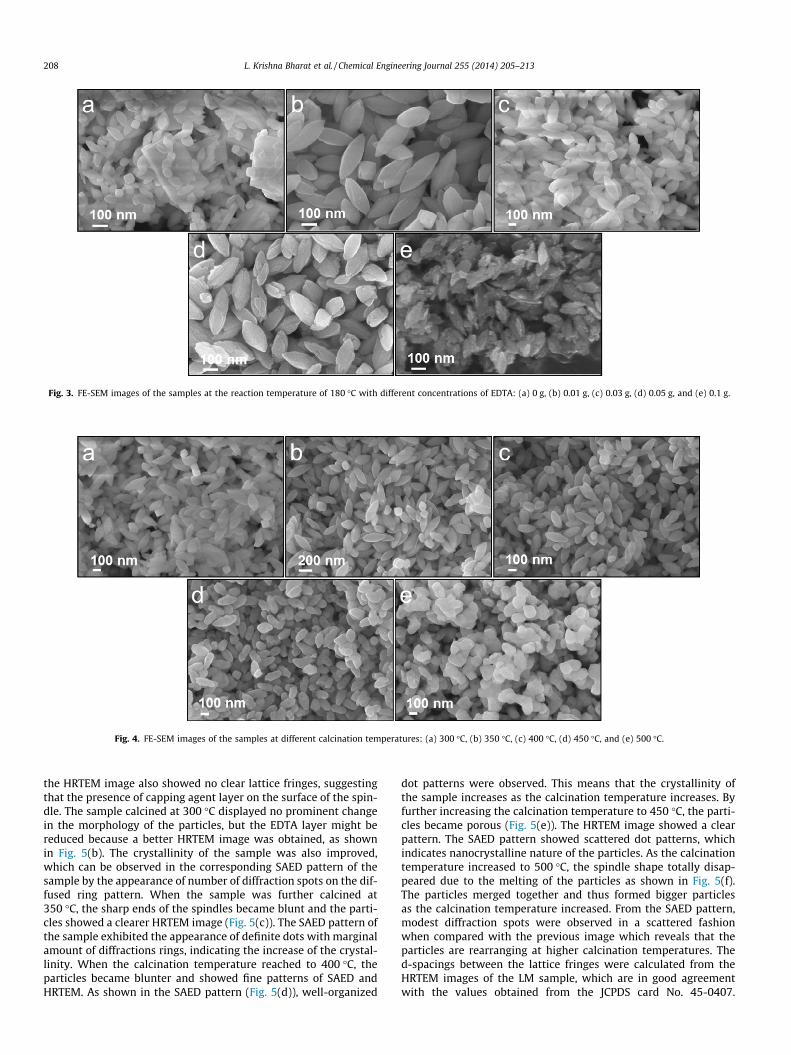
Fig. 3. FE-SEM images of the samples at the reaction temperature of 180 �C with different concentrations of EDTA: (a) 0 g, (b) 0.01 g, (c) 0.03 g, (d) 0.05 g, and (e) 0.1 g.
Fig. 4. FE-SEM images of the samples at different calcination temperatures: (a) 300 �C, (b) 350 �C, (c) 400 �C, (d) 450 �C, and (e) 500 �C.
208 L. Krishna Bharat et al. / Chemical Engineering Journal 255 (2014) 205–213
the HRTEM image also showed no clear lattice fringes, suggestingthat the presence of capping agent layer on the surface of the spin-dle. The sample calcined at 300 �C displayed no prominent changein the morphology of the particles, but the EDTA layer might bereduced because a better HRTEM image was obtained, as shownin Fig. 5(b). The crystallinity of the sample was also improved,which can be observed in the corresponding SAED pattern of thesample by the appearance of number of diffraction spots on the dif-fused ring pattern. When the sample was further calcined at350 �C, the sharp ends of the spindles became blunt and the parti-cles showed a clearer HRTEM image (Fig. 5(c)). The SAED pattern ofthe sample exhibited the appearance of definite dots with marginalamount of diffractions rings, indicating the increase of the crystal-linity. When the calcination temperature reached to 400 �C, theparticles became blunter and showed fine patterns of SAED andHRTEM. As shown in the SAED pattern (Fig. 5(d)), well-organized
dot patterns were observed. This means that the crystallinity ofthe sample increases as the calcination temperature increases. Byfurther increasing the calcination temperature to 450 �C, the parti-cles became porous (Fig. 5(e)). The HRTEM image showed a clearpattern. The SAED pattern showed scattered dot patterns, whichindicates nanocrystalline nature of the particles. As the calcinationtemperature increased to 500 �C, the spindle shape totally disap-peared due to the melting of the particles as shown in Fig. 5(f).The particles merged together and thus formed bigger particlesas the calcination temperature increased. From the SAED pattern,modest diffraction spots were observed in a scattered fashionwhen compared with the previous image which reveals that theparticles are rearranging at higher calcination temperatures. Thed-spacings between the lattice fringes were calculated from theHRTEM images of the LM sample, which are in good agreementwith the values obtained from the JCPDS card No. 45-0407.
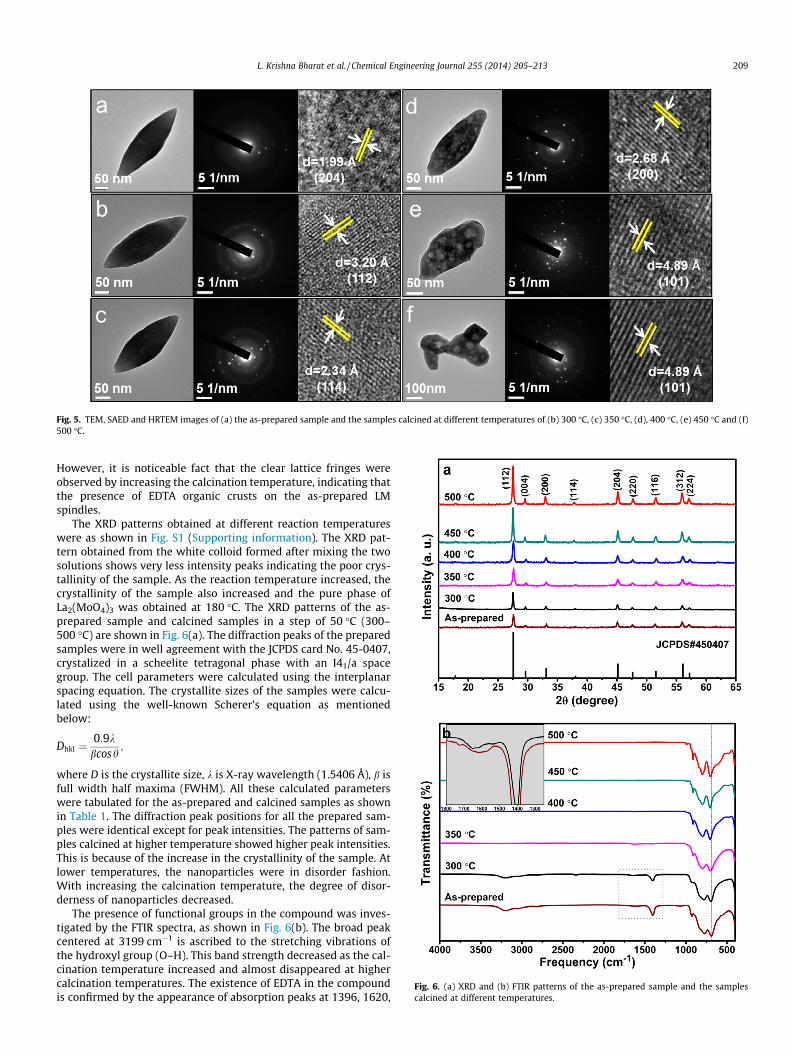
Fig. 5. TEM, SAED and HRTEM images of (a) the as-prepared sample and the samples calcined at different temperatures of (b) 300 �C, (c) 350 �C, (d), 400 �C, (e) 450 �C and (f)500 �C.
Fig. 6. (a) XRD and (b) FTIR patterns of the as-prepared sample and the samplescalcined at different temperatures.
L. Krishna Bharat et al. / Chemical Engineering Journal 255 (2014) 205–213 209
However, it is noticeable fact that the clear lattice fringes wereobserved by increasing the calcination temperature, indicating thatthe presence of EDTA organic crusts on the as-prepared LMspindles.
The XRD patterns obtained at different reaction temperatureswere as shown in Fig. S1 (Supporting information). The XRD pat-tern obtained from the white colloid formed after mixing the twosolutions shows very less intensity peaks indicating the poor crys-tallinity of the sample. As the reaction temperature increased, thecrystallinity of the sample also increased and the pure phase ofLa2(MoO4)3 was obtained at 180 �C. The XRD patterns of the as-prepared sample and calcined samples in a step of 50 �C (300–500 �C) are shown in Fig. 6(a). The diffraction peaks of the preparedsamples were in well agreement with the JCPDS card No. 45-0407,crystalized in a scheelite tetragonal phase with an I41/a spacegroup. The cell parameters were calculated using the interplanarspacing equation. The crystallite sizes of the samples were calcu-lated using the well-known Scherer’s equation as mentionedbelow:
Dhkl ¼0:9kbcosh
;
where D is the crystallite size, k is X-ray wavelength (1.5406 Å), b isfull width half maxima (FWHM). All these calculated parameterswere tabulated for the as-prepared and calcined samples as shownin Table 1. The diffraction peak positions for all the prepared sam-ples were identical except for peak intensities. The patterns of sam-ples calcined at higher temperature showed higher peak intensities.This is because of the increase in the crystallinity of the sample. Atlower temperatures, the nanoparticles were in disorder fashion.With increasing the calcination temperature, the degree of disor-derness of nanoparticles decreased.
The presence of functional groups in the compound was inves-tigated by the FTIR spectra, as shown in Fig. 6(b). The broad peakcentered at 3199 cm�1 is ascribed to the stretching vibrations ofthe hydroxyl group (O–H). This band strength decreased as the cal-cination temperature increased and almost disappeared at highercalcination temperatures. The existence of EDTA in the compoundis confirmed by the appearance of absorption peaks at 1396, 1620,
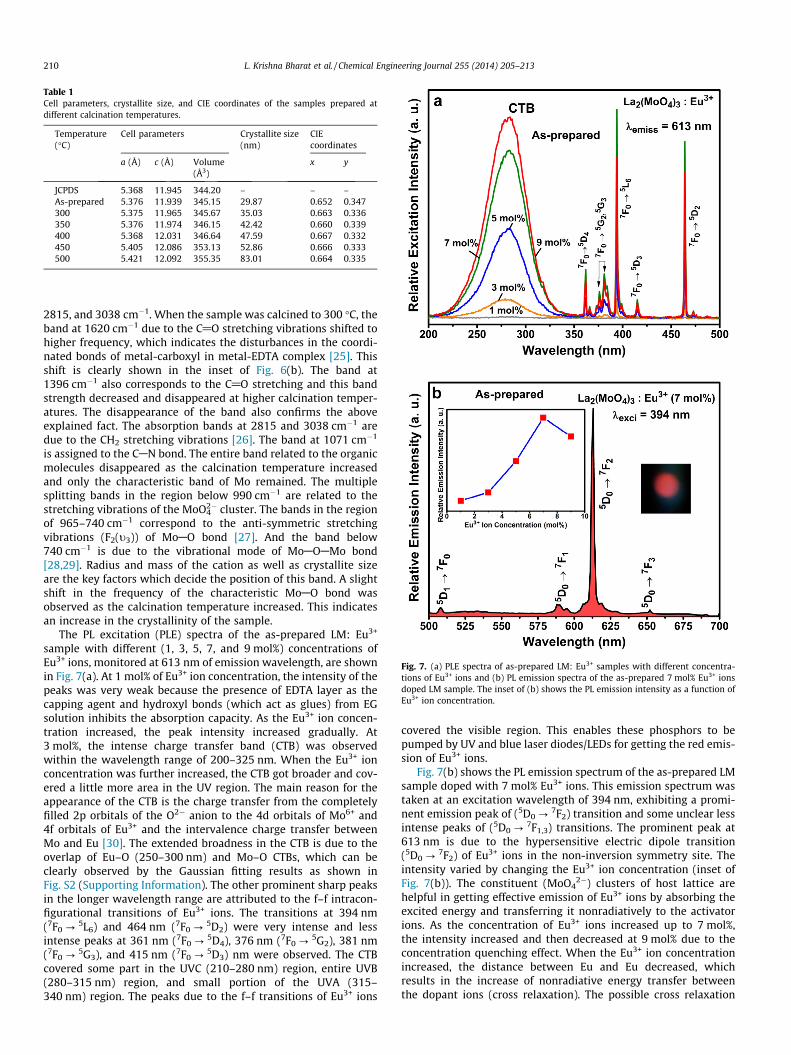
Table 1Cell parameters, crystallite size, and CIE coordinates of the samples prepared atdifferent calcination temperatures.
Temperature(�C)
Cell parameters Crystallite size(nm)
CIEcoordinates
a (Å) c (Å) Volume(Å3)
x y
JCPDS 5.368 11.945 344.20 – – –As-prepared 5.376 11.939 345.15 29.87 0.652 0.347300 5.375 11.965 345.67 35.03 0.663 0.336350 5.376 11.974 346.15 42.42 0.660 0.339400 5.368 12.031 346.64 47.59 0.667 0.332450 5.405 12.086 353.13 52.86 0.666 0.333500 5.421 12.092 355.35 83.01 0.664 0.335
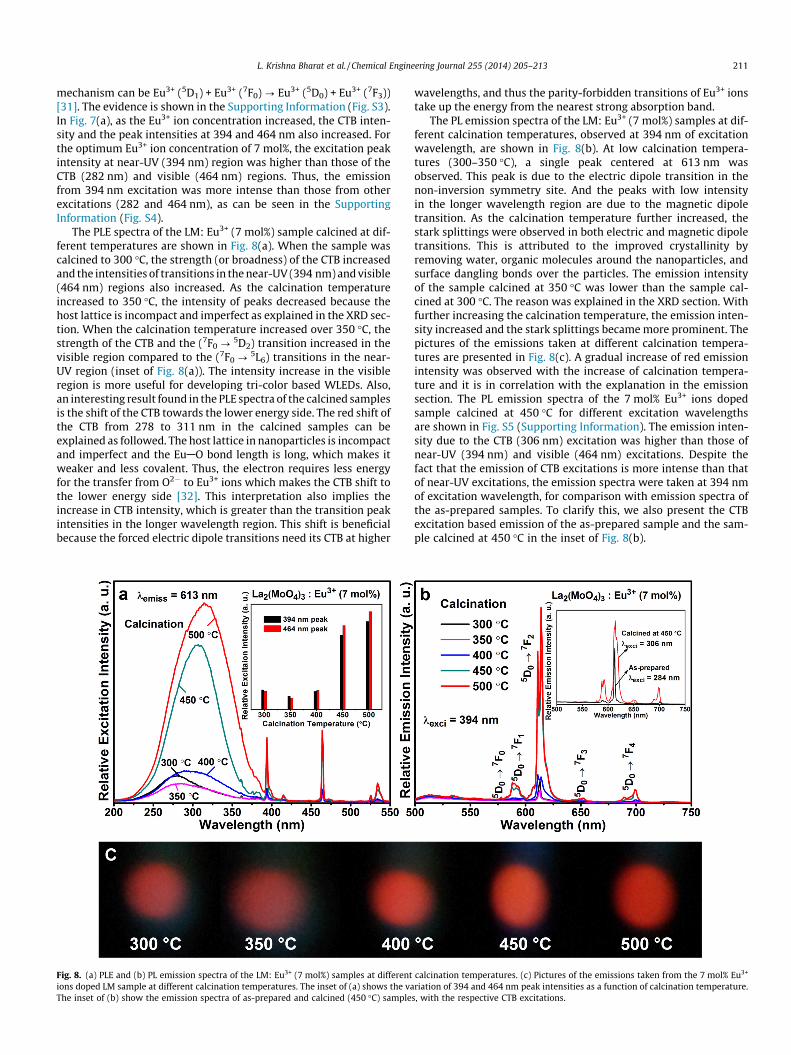
Fig. 7. (a) PLE spectra of as-prepared LM: Eu3+ samples with different concentra-tions of Eu3+ ions and (b) PL emission spectra of the as-prepared 7 mol% Eu3+ ionsdoped LM sample. The inset of (b) shows the PL emission intensity as a function ofEu3+ ion concentration.
210 L. Krishna Bharat et al. / Chemical Engineering Journal 255 (2014) 205–213
2815, and 3038 cm�1. When the sample was calcined to 300 �C, theband at 1620 cm�1 due to the C@O stretching vibrations shifted tohigher frequency, which indicates the disturbances in the coordi-nated bonds of metal-carboxyl in metal-EDTA complex [25]. Thisshift is clearly shown in the inset of Fig. 6(b). The band at1396 cm�1 also corresponds to the C@O stretching and this bandstrength decreased and disappeared at higher calcination temper-atures. The disappearance of the band also confirms the aboveexplained fact. The absorption bands at 2815 and 3038 cm�1 aredue to the CH2 stretching vibrations [26]. The band at 1071 cm�1
is assigned to the CAN bond. The entire band related to the organicmolecules disappeared as the calcination temperature increasedand only the characteristic band of Mo remained. The multiplesplitting bands in the region below 990 cm�1 are related to thestretching vibrations of the MoO4
2� cluster. The bands in the regionof 965–740 cm�1 correspond to the anti-symmetric stretchingvibrations (F2(t3)) of MoAO bond [27]. And the band below740 cm�1 is due to the vibrational mode of MoAOAMo bond[28,29]. Radius and mass of the cation as well as crystallite sizeare the key factors which decide the position of this band. A slightshift in the frequency of the characteristic MoAO bond wasobserved as the calcination temperature increased. This indicatesan increase in the crystallinity of the sample.
The PL excitation (PLE) spectra of the as-prepared LM: Eu3+
sample with different (1, 3, 5, 7, and 9 mol%) concentrations ofEu3+ ions, monitored at 613 nm of emission wavelength, are shownin Fig. 7(a). At 1 mol% of Eu3+ ion concentration, the intensity of thepeaks was very weak because the presence of EDTA layer as thecapping agent and hydroxyl bonds (which act as glues) from EGsolution inhibits the absorption capacity. As the Eu3+ ion concen-tration increased, the peak intensity increased gradually. At3 mol%, the intense charge transfer band (CTB) was observedwithin the wavelength range of 200–325 nm. When the Eu3+ ionconcentration was further increased, the CTB got broader and cov-ered a little more area in the UV region. The main reason for theappearance of the CTB is the charge transfer from the completelyfilled 2p orbitals of the O2� anion to the 4d orbitals of Mo6+ and4f orbitals of Eu3+ and the intervalence charge transfer betweenMo and Eu [30]. The extended broadness in the CTB is due to theoverlap of Eu–O (250–300 nm) and Mo–O CTBs, which can beclearly observed by the Gaussian fitting results as shown inFig. S2 (Supporting Information). The other prominent sharp peaksin the longer wavelength range are attributed to the f–f intracon-figurational transitions of Eu3+ ions. The transitions at 394 nm(7F0 ?
5L6) and 464 nm (7F0 ?5D2) were very intense and less
intense peaks at 361 nm (7F0 ?5D4), 376 nm (7F0 ?
5G2), 381 nm(7F0 ?
5G3), and 415 nm (7F0 ?5D3) nm were observed. The CTB
covered some part in the UVC (210–280 nm) region, entire UVB(280–315 nm) region, and small portion of the UVA (315–340 nm) region. The peaks due to the f–f transitions of Eu3+ ions
covered the visible region. This enables these phosphors to bepumped by UV and blue laser diodes/LEDs for getting the red emis-sion of Eu3+ ions.
Fig. 7(b) shows the PL emission spectrum of the as-prepared LMsample doped with 7 mol% Eu3+ ions. This emission spectrum wastaken at an excitation wavelength of 394 nm, exhibiting a promi-nent emission peak of (5D0 ?
7F2) transition and some unclear lessintense peaks of (5D0 ?
7F1,3) transitions. The prominent peak at613 nm is due to the hypersensitive electric dipole transition(5D0 ?
7F2) of Eu3+ ions in the non-inversion symmetry site. Theintensity varied by changing the Eu3+ ion concentration (inset ofFig. 7(b)). The constituent (MoO4
2�) clusters of host lattice arehelpful in getting effective emission of Eu3+ ions by absorbing theexcited energy and transferring it nonradiatively to the activatorions. As the concentration of Eu3+ ions increased up to 7 mol%,the intensity increased and then decreased at 9 mol% due to theconcentration quenching effect. When the Eu3+ ion concentrationincreased, the distance between Eu and Eu decreased, whichresults in the increase of nonradiative energy transfer betweenthe dopant ions (cross relaxation). The possible cross relaxation
L. Krishna Bharat et al. / Chemical Engineering Journal 255 (2014) 205–213 211
mechanism can be Eu3+ (5D1) + Eu3+ (7F0) ? Eu3+ (5D0) + Eu3+ (7F3))[31]. The evidence is shown in the Supporting Information (Fig. S3).In Fig. 7(a), as the Eu3+ ion concentration increased, the CTB inten-sity and the peak intensities at 394 and 464 nm also increased. Forthe optimum Eu3+ ion concentration of 7 mol%, the excitation peakintensity at near-UV (394 nm) region was higher than those of theCTB (282 nm) and visible (464 nm) regions. Thus, the emissionfrom 394 nm excitation was more intense than those from otherexcitations (282 and 464 nm), as can be seen in the SupportingInformation (Fig. S4).
The PLE spectra of the LM: Eu3+ (7 mol%) sample calcined at dif-ferent temperatures are shown in Fig. 8(a). When the sample wascalcined to 300 �C, the strength (or broadness) of the CTB increasedand the intensities of transitions in the near-UV (394 nm) and visible(464 nm) regions also increased. As the calcination temperatureincreased to 350 �C, the intensity of peaks decreased because thehost lattice is incompact and imperfect as explained in the XRD sec-tion. When the calcination temperature increased over 350 �C, thestrength of the CTB and the (7F0 ?
5D2) transition increased in thevisible region compared to the (7F0 ?
5L6) transitions in the near-UV region (inset of Fig. 8(a)). The intensity increase in the visibleregion is more useful for developing tri-color based WLEDs. Also,an interesting result found in the PLE spectra of the calcined samplesis the shift of the CTB towards the lower energy side. The red shift ofthe CTB from 278 to 311 nm in the calcined samples can beexplained as followed. The host lattice in nanoparticles is incompactand imperfect and the EuAO bond length is long, which makes itweaker and less covalent. Thus, the electron requires less energyfor the transfer from O2� to Eu3+ ions which makes the CTB shift tothe lower energy side [32]. This interpretation also implies theincrease in CTB intensity, which is greater than the transition peakintensities in the longer wavelength region. This shift is beneficialbecause the forced electric dipole transitions need its CTB at higher
Fig. 8. (a) PLE and (b) PL emission spectra of the LM: Eu3+ (7 mol%) samples at differentions doped LM sample at different calcination temperatures. The inset of (a) shows the vaThe inset of (b) show the emission spectra of as-prepared and calcined (450 �C) sample
wavelengths, and thus the parity-forbidden transitions of Eu3+ ionstake up the energy from the nearest strong absorption band.
The PL emission spectra of the LM: Eu3+ (7 mol%) samples at dif-ferent calcination temperatures, observed at 394 nm of excitationwavelength, are shown in Fig. 8(b). At low calcination tempera-tures (300–350 �C), a single peak centered at 613 nm wasobserved. This peak is due to the electric dipole transition in thenon-inversion symmetry site. And the peaks with low intensityin the longer wavelength region are due to the magnetic dipoletransition. As the calcination temperature further increased, thestark splittings were observed in both electric and magnetic dipoletransitions. This is attributed to the improved crystallinity byremoving water, organic molecules around the nanoparticles, andsurface dangling bonds over the particles. The emission intensityof the sample calcined at 350 �C was lower than the sample cal-cined at 300 �C. The reason was explained in the XRD section. Withfurther increasing the calcination temperature, the emission inten-sity increased and the stark splittings became more prominent. Thepictures of the emissions taken at different calcination tempera-tures are presented in Fig. 8(c). A gradual increase of red emissionintensity was observed with the increase of calcination tempera-ture and it is in correlation with the explanation in the emissionsection. The PL emission spectra of the 7 mol% Eu3+ ions dopedsample calcined at 450 �C for different excitation wavelengthsare shown in Fig. S5 (Supporting Information). The emission inten-sity due to the CTB (306 nm) excitation was higher than those ofnear-UV (394 nm) and visible (464 nm) excitations. Despite thefact that the emission of CTB excitations is more intense than thatof near-UV excitations, the emission spectra were taken at 394 nmof excitation wavelength, for comparison with emission spectra ofthe as-prepared samples. To clarify this, we also present the CTBexcitation based emission of the as-prepared sample and the sam-ple calcined at 450 �C in the inset of Fig. 8(b).
calcination temperatures. (c) Pictures of the emissions taken from the 7 mol% Eu3+
riation of 394 and 464 nm peak intensities as a function of calcination temperature.s, with the respective CTB excitations.
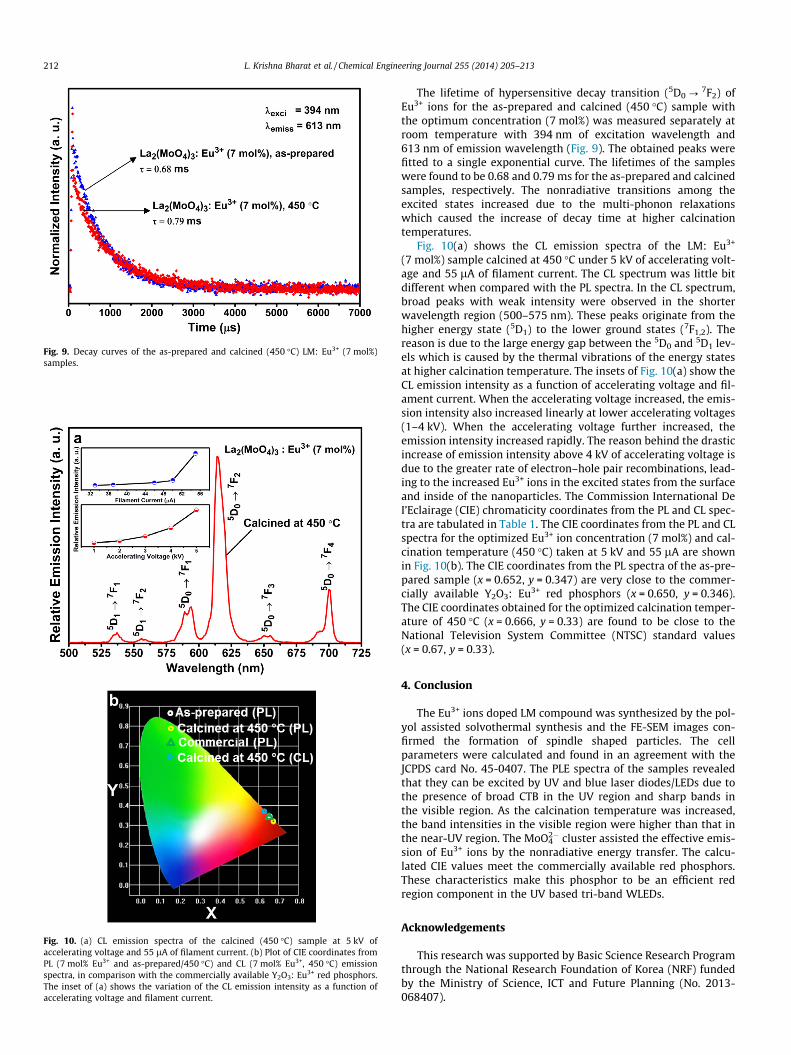
Fig. 9. Decay curves of the as-prepared and calcined (450 �C) LM: Eu3+ (7 mol%)samples.
Fig. 10. (a) CL emission spectra of the calcined (450 �C) sample at 5 kV ofaccelerating voltage and 55 lA of filament current. (b) Plot of CIE coordinates fromPL (7 mol% Eu3+ and as-prepared/450 �C) and CL (7 mol% Eu3+, 450 �C) emissionspectra, in comparison with the commercially available Y2O3: Eu3+ red phosphors.The inset of (a) shows the variation of the CL emission intensity as a function ofaccelerating voltage and filament current.
212 L. Krishna Bharat et al. / Chemical Engineering Journal 255 (2014) 205–213
The lifetime of hypersensitive decay transition (5D0 ?7F2) of
Eu3+ ions for the as-prepared and calcined (450 �C) sample withthe optimum concentration (7 mol%) was measured separately atroom temperature with 394 nm of excitation wavelength and613 nm of emission wavelength (Fig. 9). The obtained peaks werefitted to a single exponential curve. The lifetimes of the sampleswere found to be 0.68 and 0.79 ms for the as-prepared and calcinedsamples, respectively. The nonradiative transitions among theexcited states increased due to the multi-phonon relaxationswhich caused the increase of decay time at higher calcinationtemperatures.
Fig. 10(a) shows the CL emission spectra of the LM: Eu3+
(7 mol%) sample calcined at 450 �C under 5 kV of accelerating volt-age and 55 lA of filament current. The CL spectrum was little bitdifferent when compared with the PL spectra. In the CL spectrum,broad peaks with weak intensity were observed in the shorterwavelength region (500–575 nm). These peaks originate from thehigher energy state (5D1) to the lower ground states (7F1,2). Thereason is due to the large energy gap between the 5D0 and 5D1 lev-els which is caused by the thermal vibrations of the energy statesat higher calcination temperature. The insets of Fig. 10(a) show theCL emission intensity as a function of accelerating voltage and fil-ament current. When the accelerating voltage increased, the emis-sion intensity also increased linearly at lower accelerating voltages(1–4 kV). When the accelerating voltage further increased, theemission intensity increased rapidly. The reason behind the drasticincrease of emission intensity above 4 kV of accelerating voltage isdue to the greater rate of electron–hole pair recombinations, lead-ing to the increased Eu3+ ions in the excited states from the surfaceand inside of the nanoparticles. The Commission International DeI’Eclairage (CIE) chromaticity coordinates from the PL and CL spec-tra are tabulated in Table 1. The CIE coordinates from the PL and CLspectra for the optimized Eu3+ ion concentration (7 mol%) and cal-cination temperature (450 �C) taken at 5 kV and 55 lA are shownin Fig. 10(b). The CIE coordinates from the PL spectra of the as-pre-pared sample (x = 0.652, y = 0.347) are very close to the commer-cially available Y2O3: Eu3+ red phosphors (x = 0.650, y = 0.346).The CIE coordinates obtained for the optimized calcination temper-ature of 450 �C (x = 0.666, y = 0.33) are found to be close to theNational Television System Committee (NTSC) standard values(x = 0.67, y = 0.33).
4. Conclusion
The Eu3+ ions doped LM compound was synthesized by the pol-yol assisted solvothermal synthesis and the FE-SEM images con-firmed the formation of spindle shaped particles. The cellparameters were calculated and found in an agreement with theJCPDS card No. 45-0407. The PLE spectra of the samples revealedthat they can be excited by UV and blue laser diodes/LEDs due tothe presence of broad CTB in the UV region and sharp bands inthe visible region. As the calcination temperature was increased,the band intensities in the visible region were higher than that inthe near-UV region. The MoO4
2� cluster assisted the effective emis-sion of Eu3+ ions by the nonradiative energy transfer. The calcu-lated CIE values meet the commercially available red phosphors.These characteristics make this phosphor to be an efficient redregion component in the UV based tri-band WLEDs.
Acknowledgements
This research was supported by Basic Science Research Programthrough the National Research Foundation of Korea (NRF) fundedby the Ministry of Science, ICT and Future Planning (No. 2013-068407).
L. Krishna Bharat et al. / Chemical Engineering Journal 255 (2014) 205–213 213
Appendix A. Supplementary data
Supplementary data associated with this article can be found, inthe online version, at http://dx.doi.org/10.1016/j.cej.2014.05.107.
References
[1] G. He, L. Mei, L. Wang, G. Liu, J. Li, Synthesis and luminescence properties ofnano-/microstructured Y3Al5O12:Ce3+ microspheres by controlled glasscrystallization, Cryst. Growth Des. 11 (2011) 5355–5361.
[2] Y. Hu, W. Zhuang, H. Ye, D. Wang, S. Zhang, X. Huang, A novel red phosphor forwhite light emitting diodes, J. Alloys Compd. 390 (2005) 226–229.
[3] S.C. Das, S.R.B. Behara, D.A.V. Morton, I. Larson, P.J. Stewart, Importance ofparticle size and shape on the tensile strength distribution and de-agglomeration of cohesive powders, Powder Technol. 249 (2013) 297–303.
[4] H.Y. Sohn, C. Moreland, The effect of particle size distribution on packingdensity, Can. J. Chem. Eng. 46 (1968) 162–167.
[5] E. Pavitra, G. Seeta Rama Raju, J.-H. Oh, J.S. Yu, Pump power induced tunableupconversion emissions from Er3+/Tm3+/Yb3+ ions tri-doped SrY2O4nanocrystalline phosphors, N. J. Chem. (2014), http://dx.doi.org/10.1039/C4NJ00163J.
[6] G. Seeta Rama Raju, E. Pavitra, G.P. Nagaraju, R. Kandimalla, B.F. El-Rayes, J.S.Yu, PEGylated a-Gd2(MoO4)3 mesoporous flowers: synthesis, characterization,and biological application, Cryst. Growth Des. 13 (2013) 4051–4058.
[7] M. Hashim, C. Hu, X. Wang, X. Li, D. Guo, Synthesis and photocatalytic propertyof lead molybdate dendrites with exposed (001) facet, Appl. Surf. Sci. 258(2012) 5858–5862.
[8] J. Lin, Q. Wang, Y. Zheng, Y. Zhang, Supersonic microwave co-assistance (SMC)efficient synthesis of red luminescent Eu3+ activated silver molybdates andtheir phase-dependent evolution processes, CrystEngComm 15 (2013) 5668–5672.
[9] J. Lin, Z. Zeng, Q. Ma, Q. Wang, Y. Zhang, Effects of multiple irradiations onluminescent materials and energy savings – a case study for the synthesis ofBaMO4: Ln3+ (M = W, Mo; Ln = Eu, Tb) phosphors, Energy 64 (2014) 551–556.
[10] S. Abtmeyer, R. Pazik, R.J. Wiglusz, M. Małecka, G.A. Seisenbaeva, V.G. Kessler,Lanthanum molybdate nanoparticles from the Bradley reaction: factorsinfluencing their composition, structure, and functional characteristics aspotential matrixes for luminescent phosphors, Inorg. Chem. 53 (2014) 943–951.
[11] S. Prasad, V.D. Leite, R.A.C.d. Santana, J.B. Brito, Electrometric investigations onformation of lanthanum molybdates as a function of Ph, J. Braz. Chem. Soc. 15(2004) 246–252.
[12] S. Georges, F. Goutenoire, F. Altorfer, D. Sheptyakov, F. Fauth, E. Suard, P.Lacorre, Thermal, structural and transport properties of the fast oxide-ionconductors La2�xRxMo2O9, R=Nd, Gd, Y, Solid State Ionics 161 (2003) 231–241.
[13] I.P. Marozau, D. Marrero-López, A.L. Shaula, V.V. Kharton, E.V. Tsipis, P. Núñez,J.R. Frade, Ionic and electronic transport in stabilized b-La2Mo2O9 electrolytes,Electrochim. Acta 49 (2004) 3517–3524.
[14] Y. Ding, Y. Wan, Y.-L. Min, W. Zhang, S.-H. Yu, General synthesis and phasecontrol of metal molybdate hydrates MMoO4�nH2O (M = Co, Ni, Mn, n = 0, 3/4,1) nano/microcrystals by a hydrothermal approach: magnetic, photocatalytic,and electrochemical properties, Inorg. Chem. 47 (2008) 7813–7823.
[15] D. Marrero-López, J. Canales-Vázquez, J.C. Ruiz-Morales, J.T.S. Irvine, P. Núñez,Electrical conductivity and redox stability of La2Mo2�xWxO9 materials,Electrochim. Acta 50 (2005) 4385–4395.
[16] F. Meng, X. Zhang, H. Li, H.J. Seo, Synthesis and spectral characteristics ofLa2MoO6: Ln3+ (Ln=Eu, Sm, Dy, Pr, Tb) polycrystals, J. Rare Earths 30 (2012)866–870.
[17] D.D. Agarwal, K.L. Madhok, H.S. Goswami, Selective oxidation of toluene overlayered structures of Bi2MoO6 and La2MoO6, React. Kinet. Catal. Lett. 52 (1994)225–232.
[18] J.C. Sczancoski, L.S. Cavalcante, N.L. Marana, R.O. da Silva, R.L. Tranquilin, M.R.Joya, P.S. Pizani, J.A. Varela, J.R. Sambrano, M. Siu Li, E. Longo, J. Andrés,Electronic structure and optical properties of BaMoO4 powders, Curr. Appl.Phys. 10 (2010) 614–624.
[19] M. Fujita, M. Itoh, T. Katagiri, D. Iri, M. Kitaura, V.B. Mikhailik, Opticalanisotropy and electronic structures of CdMoO4 and CdWO4 crystals: polarizedreflection measurements, X-ray photoelectron spectroscopy, and electronicstructure calculations, Phys. Rev. B 77 (2008) 155118.
[20] N. Zhang, W. Bu, Y. Xu, D. Jiang, J. Shi, Surfactant-assisted growth of novelLa2(MoO4)3 dendritic nanostructures via facile hydrothermal processes, J.Nanosci. Nanotechnol. 8 (2008) 1468–1472.
[21] L. Xu, C. Lu, Z. Zhang, X. Yang, W. Hou, Various self-assembled three-dimensional hierarchical architectures of La2(MoO4)3: controlled synthesis,growth mechanisms, luminescence properties and adsorption activities,Nanoscale 2 (2010) 995–1005.
[22] Y. Cheng, Y. Wang, D. Chen, F. Bao, Evolution of single crystalline dendritesfrom nanoparticles through oriented attachment, J. Phys. Chem. B 109 (2004)794–798.
[23] P.W. Voorhees, The theory of Ostwald ripening, J. Stat. Phys. 38 (1985) 231–252.
[24] B. Wu, Q. Zhang, H. Wang, Y. Li, Low-temperature preparation ofmonodispersed Eu-doped CaTiO3 LED phosphors with controllablemorphologies, CrystEngComm 14 (2012) 2094–2099.
[25] Y.E. Zhao, C.Y. Cai, Y.Y. Luo, Z.H. He, FTIR Spectra of the M(EDTA)n� complexesin the process of sol–gel technique, J. Supercond. 17 (2004) 383–387.
[26] D.T. Sawyer, P.J. Paulsen, Properties and infrared spectra ofethylenediaminetetraacetic acid complexes. I. Alkaline earth chelates1, J.Am. Chem. Soc. 80 (1958) 1597–1600.
[27] G.S.R. Raju, E. Pavitra, Y.H. Ko, J.S. Yu, A facile and efficient strategy for thepreparation of stable CaMoO4 spherulites using ammonium molybdate as amolybdenum source and their excitation induced tunable luminescentproperties for optical applications, J. Mater. Chem. 22 (2012) 15562–15569.
[28] R.S. Patil, M.D. Uplane, P.S. Patil, Structural and optical properties ofelectrodeposited molybdenum oxide thin films, Appl. Surf. Sci. 252 (2006)8050–8056.
[29] V.S. Marques, L.S. Cavalcante, J.C. Sczancoski, A.F.P. Alcântara, M.O. Orlandi, E.Moraes, E. Longo, J.A. Varela, M. Siu Li, M.R.M.C. Santos, Effect of differentsolvent ratios (water/ethylene glycol) on the growth process of CaMoO4
crystals and their optical properties, Cryst. Growth Des. 10 (2010) 4752–4768.[30] P.S. Dutta, A. Khanna, Eu3+ activated molybdate and tungstate based red
phosphors with charge transfer band in blue region, ECS J. Solid State Sci.Technol. 2 (2013) R3153–R3167.
[31] E. Pavitra, G.S.R. Raju, Y.H. Ko, J.S. Yu, A novel strategy for controllableemissions from Eu3+ or Sm3+ ions co-doped SrY2O4:Tb3+ phosphors, Phys.Chem. Chem. Phys. 14 (2012) 11296–11307.
[32] K. Shioi, N. Hirosaki, R.-J. Xie, T. Takeda, Y.Q. Li, Y. Matsushita, Synthesis,crystal structure, and photoluminescence of Sr-a-SiAlON:Eu2+, J. Am. Ceram.Soc. 93 (2010) 465–469.