plasticity of human regulatory t cells in healthy subjects and patients with type 1 diabetes
TRANSCRIPT

The Journal of Immunology
Plasticity of Human Regulatory T Cells in Healthy Subjectsand Patients with Type 1 Diabetes
Stephanie A. McClymont,* Amy L. Putnam,* Michael R. Lee,* Jonathan H. Esensten,*
Weihong Liu,* Maigan A. Hulme,† Ulrich Hoffmuller,‡ Udo Baron,‡ Sven Olek,‡
Jeffrey A. Bluestone,* and Todd M. Brusko*,1
Regulatory T cells (Tregs) constitute an attractive therapeutic target given their essential role in controlling autoimmunity. How-
ever, recent animal studies provide evidence for functional heterogeneity and lineage plasticity within the Treg compartment. To
understand better the plasticity of human Tregs in the context of type 1 diabetes, we characterized an IFN-g–competent subset of
human CD4+CD127lo/2CD25+ Tregs. We measured the frequency of Tregs in the peripheral blood of patients with type 1 diabetes
by epigenetic analysis of the Treg-specific demethylated region (TSDR) and the frequency of the IFN-g+ subset by flow cytometry.
Purified IFN-g+ Tregs were assessed for suppressive function, degree of TSDR demethylation, and expression of Treg lineage
markers FOXP3 and Helios. The frequency of Tregs in peripheral blood was comparable but the FOXP3+IFN-g+ fraction was
significantly increased in patients with type 1 diabetes compared to healthy controls. Purified IFN-g+ Tregs expressed FOXP3 and
possessed suppressive activity but lacked Helios expression and were predominately methylated at the TSDR, characteristics of an
adaptive Treg. Naive Tregs were capable of upregulating expression of Th1-associated T-bet, CXCR3, and IFN-g in response to
IL-12. Notably, naive, thymic-derived natural Tregs also demonstrated the capacity for Th1 differentiation without concomitant
loss of Helios expression or TSDR demethylation. The Journal of Immunology, 2011, 186: 3918–3926.
Type1 diabetes results from a breakdown in the mechanismsthat maintain immune tolerance leading to the eventualdestruction of pancreatic b-cells (1). The tissue specificity
of the disease is conferred, in part, by the expansion of islet-reactive T effector (Teff) cells controlled by complex geneticand environmental factors (2). Regulatory T cells (Tregs) ex-pressing the transcription factor FOXP3 have emerged as a potentand selective means to counteract this progressive loss of immunetolerance and have led to the development of Treg cellular ther-apies for the treatment of autoimmune diseases, transplantation,and graft versus host disease (3). For example, CD4+CD25+ Tregsadoptively transferred in an animal model of type 1 diabetes, theNOD mouse, effectively prevent or even reverse disease (4). We
have previously reported that the isolation of CD4+CD127lo/2
CD25+ T cells could be used to identify and expand a highly purepopulation of FOXP3+ T cells from human peripheral blood inquantities sufficient for autologous transfer to type 1 diabeticpatients (5, 6).Tregs are generally classified into two categories, natural Tregs
(nTregs) and adaptive Tregs (aTregs). These Treg subsets differ intheir cell surface markers and cytokine profiles, although each hasbeen shown to possess suppressive activity (3). nTregs primarilyemerge from the thymus, whereas aTregs are generated in theperiphery from naive T cells after Ag exposure (7). In addition tothese broad subsets, there is mounting evidence of further phe-notypic and functional heterogeneity within the FOXP3+ Tregpopulation, including the potential for Th1- or Th2-type Tregs,although it is unclear whether these represent distinct subsetsor transcriptional plasticity (8). Animal studies have shown thatTregs may appropriate the transcriptional program of lineage-specific Teff cells to selectively suppress cells of that same line-age (9–11) (e.g., T-bet+ Tregs suppress Th1-driven immune re-sponses). However, this overlap in the transcriptome presents thepotential for conversion of Tregs to Teff cells upon loss of FOXP3expression, and indeed, lineage instability has been describedwithin the FOXP3+ Treg population (12, 13). We recently showed,using a Treg-lineage tracking reporter system in mice, that cellsthat previously expressed Foxp3, exFoxp3 cells, acquired effector-like properties and were capable of eliciting autoimmunity (14).The studies described above suggest a critical challenge in
the transition of Treg-based cell therapies from animal studiesto human clinical trials. Knowledge of the purity, stability, andphenotypic characteristics of cell therapy products will be essen-tial prior to their introduction into patients (15). Although opti-mized sorting strategies have dramatically improved the yield andpurity of sorted Tregs, the current use of surrogate surface markersfor selection cannot identify a 100% pure population of stable
*Diabetes Center, University of California, San Francisco, San Francisco, CA 94143;†Department of Pathology, College of Medicine, University of Florida, Gainesville,FL 32611; and ‡Epiontis, GmbH, 12489 Berlin, Germany
1Current address: Department of Pathology, College of Medicine, University of Flor-ida, Gainesville, FL.
Received for publication September 20, 2010. Accepted for publication January 20,2011.
This work was supported by a Juvenile Diabetes Research Foundation CollaborativeCenter for Cell Therapy grant. T.M.B. was supported by a Juvenile Diabetes Re-search Foundation transition award. This work also received funding and reagentsupport from Noel Warner and BD Biosciences.
Address correspondence and reprint requests to Jeffrey A. Bluestone or Todd M.Brusko, Diabetes Center, University of California, San Francisco, 513 Parnassus,Box 0540, San Francisco, CA 94143 (J.A.B.) or Department of Pathology, Collegeof Medicine, University of Florida, Box 100275, 1275 Center Drive, BMSB RoomJ583, Gainesville, FL 32611 (T.M.B.). E-mail addresses: [email protected](J.A.B.) and [email protected] (T.M.B.)
The online version of this article contains supplemental material.
Abbreviations used in this article: aTreg, adaptive Treg; MFI, mean fluorescenceintensity; nTreg, natural Treg; Tconv, conventional T; Teff, T effector; Treg, regula-tory T cell; Tresp, responder T; TSDR, Treg-specific demethylated region.
Copyright� 2011 by TheAmericanAssociation of Immunologists, Inc. 0022-1767/11/$16.00
www.jimmunol.org/cgi/doi/10.4049/jimmunol.1003099

FOXP3-expressing T cells. Furthermore, the need for in vitroexpansion opens up the possibility for outgrowth of non-Tregsduring culture, or the potential loss of a regulatory phenotypeby expanded nTregs. This raises a significant safety concern thatexpanded Tregs with some inherent autoreactivity may precipitatetissue damage rather than prevent it (16). Given the importance ofthese issues, we sought to systematically investigate the lineagecharacteristics and function of a population of CD4+CD127lo/2
CD25+ T cells capable of producing IFN-g.We report in this study that a subset of Tregs coexpressing
FOXP3 and IFN-g was enriched in patients with type 1 diabetesafter in vitro expansion while the frequency of nTregs, as de-termined by highly sensitive epigenetic analysis, was equivalent tothat seen in healthy controls. IFN-g+ cells from expanded humanCD4+CD127lo/2CD25+ Tregs expressed high levels of FOXP3and could suppress the proliferation of responder T (Tresp)cells in vitro, albeit with reduced efficiency. However, epige-netic analysis revealed that FOXP3+IFN-g+ T cells were predomi-nately methylated at the FOXP3 Treg-specific demethylated re-gion (TSDR) in contrast to what has been shown for nTregs;demethylation of this region is a marker of FOXP3 transcriptionalstability (17). Further, the majority of FOXP3+IFN-g+ T cells didnot express Helios, an Ikaros-family transcription factor recentlyshown to be selectively expressed by nTregs (18). Notably,CD45RA+ naive Tregs cultured in the presence of IL-12 acquireda Th1-like phenotype without loss of FOXP3 or Helios, orremethylation of the TSDR. Our results provide insights into theheterogeneity and plasticity of the human FOXP3+ Treg pop-
ulation and have implications for cell-based therapeutic inter-ventions, particularly in situations involving inflammation.
Materials and MethodsPatient population
Controls were recruited from the general population at the University ofCalifornia, San Francisco, University of Florida, and the University ofColorado. Patients with type 1 diabetes were diagnosed by physician ex-amination and comprised recent-onset subjects (within 1 y of diagnosis),and subjects with established type 1 diabetes. For quantification of theFOXP3+IFN-g+ subset, CD4+CD127lo/2CD25+ Tregs were sorted andexpanded from controls (n = 15; 8 male/7 female; mean age 29.2 6 4.7 y;range 20–35 y) and from recent-onset (n = 9; 5 male/4 female; mean age27.1 6 9.6 y; range 18–41 y) and established (n = 2; 2 male/0 female;mean age 25.7 6 3.6 y) type 1 diabetic subjects, and then analyzed byFACS. For epigenetic analyses, frozen PBMCs from healthy controls (n =11; 7 male/4 female; mean age 24.1 6 12.9 y; range 9–46 y) and fromrecent-onset (n = 12; 9 male/3 female; mean age 16.46 10.1 y; range 8–41y) and established (n = 28; 7 male/21 female; mean age 22.3 6 11.1 y;range 5.5–53.4 y) type 1 diabetic subjects were thawed, and an aliquot wasrefrozen prior to analysis. For quantification of the Helios+IFN-g+ Tregsubset, frozen PBMCs from healthy controls (n = 10; 7 male/3 female;mean age 18.7 6 8.4 y; range 12–40 y) and patients with type 1 diabetes(n = 11; 7 male/4 female; mean age 18.4 6 7.0 y; range 9–32 y) wereanalyzed by FACS. Informed consent was obtained in accordance withapproved policies and procedures.
T cell subset isolation
CD4+CD127lo/2CD25+ Tregs and CD4+CD127+CD252 conventional T(Tconv) cells were purified as previously described (5) with CD45RA-PE.Cy7 (L48) and in some cases CD45RO-PE.Cy5 (UCHL1) included toisolate naive cells. Postsort purity was 97.6 6 1.1%, 95.3–98.9% for CD4+
FIGURE 1. Isolation of viable in vitro-expanded Tregs capable of producing IFN-g. A, Flow cytometric analysis of intracellular IFN-g and FOXP3
expression in CD4+CD127lo/2CD25+ Tregs purified from three individuals (rows I, II, and III) are shown. Cytokine expression was assessed in an aliquot
removed immediately after the initial Treg sort (left panels) and after a 14-d expansion period (right panels). B, After expansion, CD4+CD127lo/2CD25+
Tregs were labeled with IFN-g capture reagent. Frequencies of IFN-g+ cells before (top plot) and after cytokine capture and sorting of IFN-g2 (center plot)
and IFN-g+ (bottom plot) cells. Data are representative of four experiments. C, Real-time quantitative PCR analysis of IFN-g expression after cytokine
capture and sorting of IFN-g–producing cells. Mean 6 SD of two independent experiments with triplicate measurements, indexed to IFN-g2 Teff cells, is
shown.
The Journal of Immunology 3919
CD127lo/2CD25+ cells; 99.3 6 1.1%, 97.2–100% for CD4+CD127lo/2
CD25+CD45RA+CD45RO2 cells; and 95.96 2.2%, 92.7–97.5% for CD4+
CD127lo/2CD25+CD45RA+ cells.
Cell culture
In vitro expansion and suppression assays were conducted in RPMI 1640media (Mediatech, Manassas, VA) supplemented with 5 mMHEPES, 2 mML-glutamine, 50 mg/ml each penicillin/streptomycin (Invitrogen, Carlsbad,CA), 50 mM 2-mercaptoethanol (Sigma), 5 mM nonessential amino acids,5 mM sodium pyruvate (Mediatech), and 10% FCS (Invitrogen). Cellswere activated with anti-CD3/anti-CD28–coated microbeads (Invitrogen)at a 1:1 ratio at days 2 and 9. Media and IL-2 (300 U/ml) were added atdays 2, 5, 7, 9, and 12. For Th1-skewing, CD4+CD127lo/2CD25+
CD45RA+ Tregs and CD4+CD127+CD252CD45RA+ Tconv cells wereincubated with recombinant human IL-12 (20 ng/ml; R&D Systems,Minneapolis, MN) and anti-human IL-4 (10 mg/ml; R&D Systems) duringinitial activation (day 0). Expansion was 14 d unless otherwise noted in thelegends to figures.
Isolation of cytokine-producing Tregs
IFN-g– or IL-10–producing Tregs were isolated from expanded cells usingthe cytokine secretion–cell enrichment and detection kit (Miltenyi Biotec,Bergisch Gladbach, Germany) according to the manufacturer’s instructionswith the following modifications: 135 3 106 to 400 3 106 cells wereactivated for 4–5 h with PMA (10 ng/ml) and ionomycin (500 mM) prior tolabeling with the catch reagent. During the secretion phase, Tregs werediluted in 10 ml media/107 cells, and Tconv cells were diluted in 100 ml/107 cells to prevent capture of cytokine produced by neighboring cells.Labeled cells were sorted by FACS. Alternatively, cytokine-producingcells were FACS-sorted following fixation, permeabilization, and intra-cellular staining with IFN-g–PE or IL-10–PE (BD Biosciences), FOXP3–Alexa Fluor 647 (206D; BioLegend, San Diego, CA), and Helios–PE (22F6;BioLegend). In this case, GolgiStop (4 ml/6 ml culture; BD Biosciences)was added during PMA/ionomycin activation.
Flow cytometry
The following Abs were used: IFN-g–PE, IFN-g–allophycocyanin (B27),CD183–allophycocyanin (1C6/CXCR3), CD3–PerCP, and IL-2 PE (BDBiosciences), FOXP3–Pacific blue, FOXP3–Alexa Fluor 488 (206D), andHelios–PE (22F6) (BioLegend), and T-bet PE (4B10; eBioscience, SanDiego, CA). Where noted, CD4+ T cells were enriched from peripheralblood using the RosetteSep CD4+ negative selection enrichment mixture(Stemcell Technologies, Vancouver, BC, Canada). GolgiStop was added
prior to IL-2 and T-bet staining. Fixation was performed with FOXP3 Fix/Perm Buffer Set (BioLegend). T-bet staining was conducted as previouslydescribed (10). Data collected on a FACSCalibur (BD Biosciences) wereanalyzed with FlowJo (Tree Star). FOXP3+ gates were set based on isotypebackground staining standardized at 1%.
Epigenetic analysis
Cell pellets were stored at 280˚C, and isolation of genomic DNA andquantification of TSDR (19) and CD3 demethylation (20) by real-timePCR were performed by Epiontis.
Quantification of the Helios+IFN-g+ Treg subset
Frozen PBMCs were thawed and stimulated with PMA (10 ng/ml) andionomycin (500 mM) for 4 h. After activation, cells were stained for vi-ability using the Violet LIVE/DEAD dye (Invitrogen) according to themanufacturer’s recommendations. Cells were subsequently stained forCD4 and intracellular FOXP3, Helios, and IFN-g using the FOXP3 stain-ing protocol previously described.
RNA isolation and real-time PCR
Sorted cells were stored at 280˚C before RNA extraction with TRIzol(Invitrogen). Real-time PCR was performed as previously described (21)on a 7500 Fast Real-time PCR System (Applied Biosystems), using Taq-Man primer-probe Hs99999041_m1 (Ifng), and TaqMan primer-probe setfor eukaryotic 18S rRNA as an internal control.
In vitro suppression
In vitro suppression was assessed by [3H]thymidine incorporation as pre-viously described (6). PBMCs were plated in 96-well U-bottom plates (105
cells/well) with 2 mg/ml soluble anti-CD3 (Hit3a) and 1 mg/ml solubleanti-CD28 (28.2; BD Biosciences). Purified Tregs were added at a range ofTreg/Tresp cell ratios as indicated. Cells were cultured for 4–5 d andpulsed with 1 mCi [3H]thymidine for the final 16 h of culture. Percentagesuppression was calculated as [1 – (mean cpm Treg + Tresp cell)/(meancpm Tresp cell)] 3 100%.
Statistical analysis
Statistical tests were performed using Prism software (GraphPad, SanDiego, CA). Significance was determined by t test or ANOVA analysis withBonferroni correction, as noted in the legends to figures, and defined asp , 0.05.
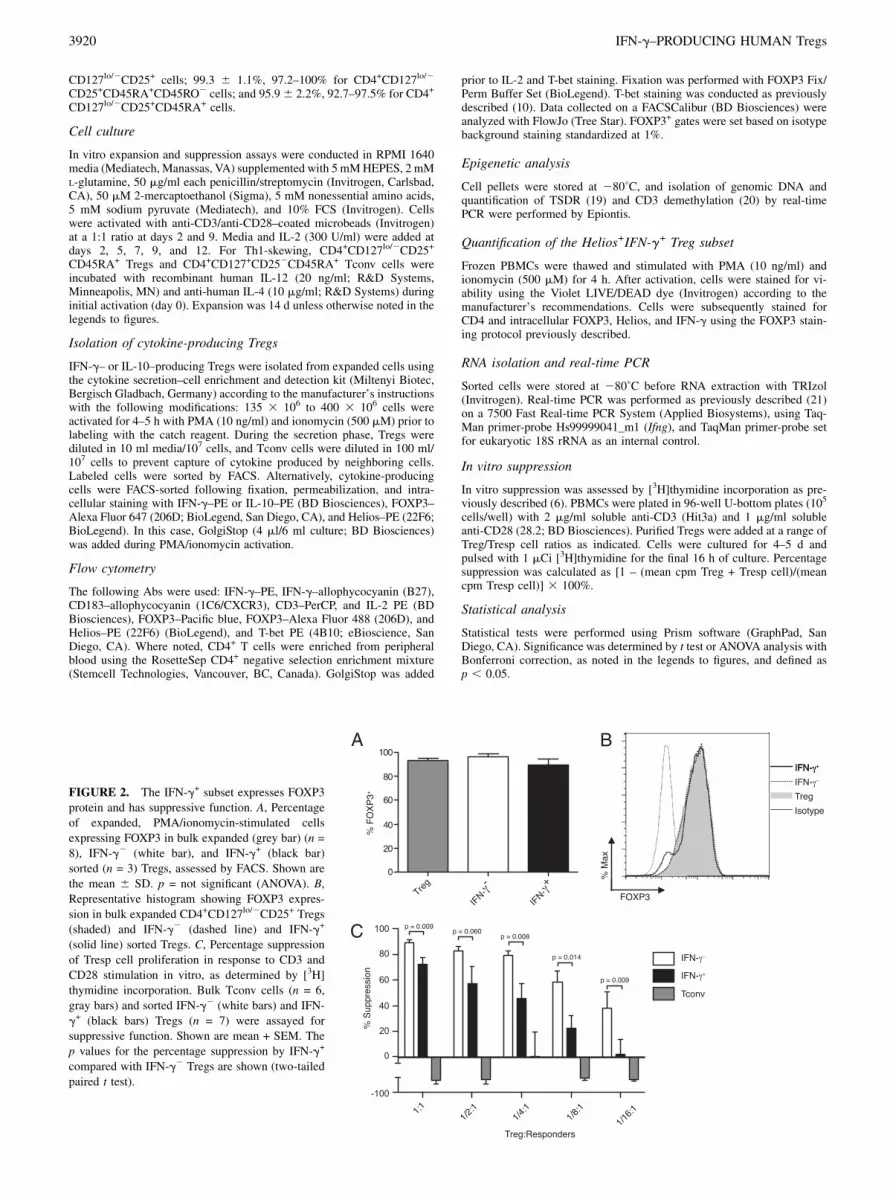
FIGURE 2. The IFN-g+ subset expresses FOXP3
protein and has suppressive function. A, Percentage
of expanded, PMA/ionomycin-stimulated cells
expressing FOXP3 in bulk expanded (grey bar) (n =
8), IFN-g2 (white bar), and IFN-g+ (black bar)
sorted (n = 3) Tregs, assessed by FACS. Shown are
the mean 6 SD. p = not significant (ANOVA). B,
Representative histogram showing FOXP3 expres-
sion in bulk expanded CD4+CD127lo/2CD25+ Tregs
(shaded) and IFN-g2 (dashed line) and IFN-g+
(solid line) sorted Tregs. C, Percentage suppression
of Tresp cell proliferation in response to CD3 and
CD28 stimulation in vitro, as determined by [3H]
thymidine incorporation. Bulk Tconv cells (n = 6,
gray bars) and sorted IFN-g2 (white bars) and IFN-
g+ (black bars) Tregs (n = 7) were assayed for
suppressive function. Shown are mean + SEM. The
p values for the percentage suppression by IFN-g+
compared with IFN-g2 Tregs are shown (two-tailed
paired t test).
3920 IFN-g–PRODUCING HUMAN Tregs

ResultsExpanded human Tregs include an IFN-g+ subset
We isolated CD4+CD127lo/2CD25+ Tregs by FACS (purity 98.360.7%) and expanded them with anti-CD3/anti-CD28 microbeadsand exogenous IL-2, as previously described (6). We consistentlyobserved that a fraction of FOXP3+ cells isolated from healthydonors produced the Th1 signature cytokine IFN-g after activationwith PMA/ionomycin. This fraction remained relatively constantover the course of a 2-wk in vitro culture, suggesting that cyto-kine production was not induced by expansion conditions (Fig.1A). The capacity for cytokine production was activation signalstrength dependent, as lower levels of IFN-g were observed whencells were stimulated with anti-CD3 and anti-CD28 (6). Theseresults suggest that a small subset of IFN-g–producing Tregsexists in vivo. As noted previously by us (6) and others (22–24),these cells tend to be enriched in the CD45RO+ memory T cellpopulation.Given the evidence from animal models both for Treg plasticity
(14) and for T cell subsets that coexpress Th1 and Treg lineagemarkers (10), we sought to characterize the lineage and functionof human IFN-g–producing Tregs. CD4+CD127lo/2CD25+ Tregswere sorted and expanded for 14 d. After PMA/ionomycin stim-ulation, cells were labeled with a cytokine capture reagent andresorted by FACS (Fig. 1B). This procedure yielded viable cellshighly enriched for IFN-g–producing cells (98.7 6 1.0%). Quan-titative real-time PCR confirmed that IFN-g transcripts were en-riched in IFN-g+ cells relative to IFN-g2 cells (.1300-fold)(Fig. 1C).
IFN-g+ Tregs retain FOXP3 expression and mediatesuppression
The frequency of FOXP3+ cells in the IFN-g+–sorted subset(89.36 8.3%) was comparable with that found in IFN-g2 (96.264.0%) and bulk unstimulated (92.9 6 5.6%) Tregs (Fig. 2A, pvalue was not significant). Furthermore, IFN-g+ cells maintainedhigh levels of FOXP3 protein comparable with that observed inIFN-g2 and bulk unstimulated Tregs (Fig. 2B). IL-2 productionwas low in Tregs compared with Tconv cells (1.0 6 0.8% versus13.2 6 9.6%, respectively) and virtually absent in IFN-g+ Tregs,consistent with their anergic properties when cultured alone dur-ing suppression assays. Notably, transient upregulation of FOXP3in Tconv did not abrogate IL-2 production (Supplemental Fig. 1).Prior studies have shown that transient FOXP3 expression by
Teff cells does not confer suppressive capacity (25–28). To in-vestigate the functional capacity of FOXP3+IFN-g+ cells, IFN-g+
cells isolated from expanded Treg cultures were assayed fortheir ability to suppress T cell proliferation in response to anti-CD3 and anti-CD28 stimulation in vitro. Notably, the IFN-g+
subset retained partial regulatory function, though with decreasedpotency relative to IFN-g2 Tregs (Fig. 2C). Importantly, expandedCD4+CD127+CD252 Tconv cells did not suppress Tresp cellproliferation. Together, these data suggest that the IFN-g+ subsetof isolated CD4+CD127lo/2CD25+ Tregs constitutes a regulatorypopulation rather than contaminating Teff cells that transientlyexpress FOXP3.
IFN-g+ Tregs are predominately methylated at the TSDR
Epigenetic analysis of the FOXP3 TSDR has recently emerged asa robust method for identifying stable nTregs in humans (29). TheTSDR of Tregs is demethylated, whereas that of Tconv cells ismethylated. Unlike DNA methylation over the FOXP3 promoterregion, the epigenetic marks at the TSDR are independent of ac-tive FOXP3 expression. TSDR methylation persists during tran-
sient expression of FOXP3 by Tconv cells or unstable TGF-b–induced Tregs, whereas drug-induced demethylation of Tconvcells results in stable FOXP3 expression, suggesting lineage sta-bility in Tregs may be epigenetically regulated (17, 30). Wetherefore examined the TSDR in the different Treg subsets iso-lated and expanded from healthy individuals. The frequency ofcells with a demethylated TSDR was significantly reduced in theIFN-g+ fraction (22.1 6 10.1%) compared with that of bulk(83.7 6 9.6%) or IFN-g2 (94.8 6 6.1%) Tregs (Fig. 3A). Thelower percentage of demethylation in the IFN-g+ fraction couldarise in part from the presence of contaminating FOXP32 T cells,which may have been preferentially selected by the cytokinecapture technique. To address this possibility, FOXP3+IFN-g+ cellswere isolated by FACS after intracellular staining, and the epige-netic status of the TSDR in these cells was analyzed. Comparablewith the results of the cytokine capture system (Fig. 3A, blacksymbols), significantly lower levels of TSDR demethylation wereseen in FOXP3+IFN-g+ cells than those in FOXP3+IFN-g2 cells(Fig. 3A, gray symbols). The plasticity observed in the IFN-g+
FIGURE 3. IFN-g+ Tregs lack characteristic markers of nTregs. A,
Percentage of expanded CD4+CD127+CD252 Tconv cells (squares) and
CD4+CD127lo/2CD25+ Tregs (circles) demethylated at the FOXP3 TSDR.
IFN-g2 and IFN-g+ Treg subsets were sorted by cytokine capture (black)
or by fixation and intracellular FOXP3 and IFN-g staining (gray). ***p ,0.001 (ANOVA). B and C, CD4+ PBMCs were enriched with RosetteSep
and stimulated 4 h with PMA/ionomycin. B, Representative flow cyto-
metric analysis of intracellular IFN-g and Helios expression in the CD3+
FOXP3+ gated population. C, Percentage of Helios+ cells within the IFN-
g2 and IFN-g+ subsets of the CD3+FOXP3+ population. The mean 6 SD
of three independent experiments is shown. ***p = 0.0003 (two-tailed
paired t test).
The Journal of Immunology 3921
subset did not appear to be specific to this cytokine, as sorted IL-10+
Tregs resembled IFN-g+ Tregs in FOXP3 expression, suppressivefunction, and TSDR methylation (Supplemental Fig. 2).
The majority of IFN-g+ Tregs do not express Helios
Because TSDR methylation in the context of FOXP3-expressingcells has been associated with unstable, in vitro-induced Tregs,we sought to investigate whether the FOXP3+IFN-g+ subset mighthave arisen from Tconv cells in the periphery. Although the abilityof Tconv cells to differentiate into Tregs under tolerogenic con-ditions is well-established, there is a paucity of markers forin vivo-induced Tregs. Recently, the Ikaros family transcriptionfactor Helios has been shown to be selectively expressed onnTregs of thymic origin (18). We therefore examined the ex-pression of Helios in the IFN-g+ Treg subset. Total CD4+ T cellswere enriched from PBMCs, and the expression of FOXP3, IFN-g,and Helios was assessed after activation (Fig. 3B). Within theFOXP3+ population, we observed the selective expression ofHelios in the IFN-g2 subset (82.2 6 1.5% Helios+ compared withonly 14.2 6 0.8% in the IFN-g+ subset) (Fig. 3C).
IL-12 induces IFN-g production by naive Tregs
Signaling through IFN-gR and IL-12R, in combination with TCRengagement, induces strong expression of T-bet, which drives thedifferentiation of Tconv cells to a Th1 lineage (31). The capacityof Tregs to adopt a Th1 phenotype has recently been demonstratedin murine models (10). However, the plasticity of the human Tregcompartment is relatively uncharacterized, and furthermore it isunclear to what extent cytokine production by Tregs is due to trueplasticity rather than to heterogeneity in the population. Thecharacterization of the TSDR and Helios expression suggestedthat IFN-g production by Tregs was due predominately to a sub-population of aTregs. However, the observation that a fraction ofIFN-g+ Tregs did exhibit the TSDR demethylation that is char-acteristic of stable Tregs suggested that even nTregs are a plasticpopulation capable of producing effector cytokines. We thereforetested the ability of human naive Tregs to differentiate into a Th1-like lineage in response to inflammatory stimuli. CD4+CD127lo/2
CD25+CD45RA+CD45RO2 naive Tregs were sorted to minimizethe possibility of contamination with effector/memory T cells orAg-experienced adaptive Tregs and expanded in Th1-polarizingconditions (IL-12 upon initial activation).Control naive CD4+CD127+CD252CD45RA+CD45RO2 Tconv
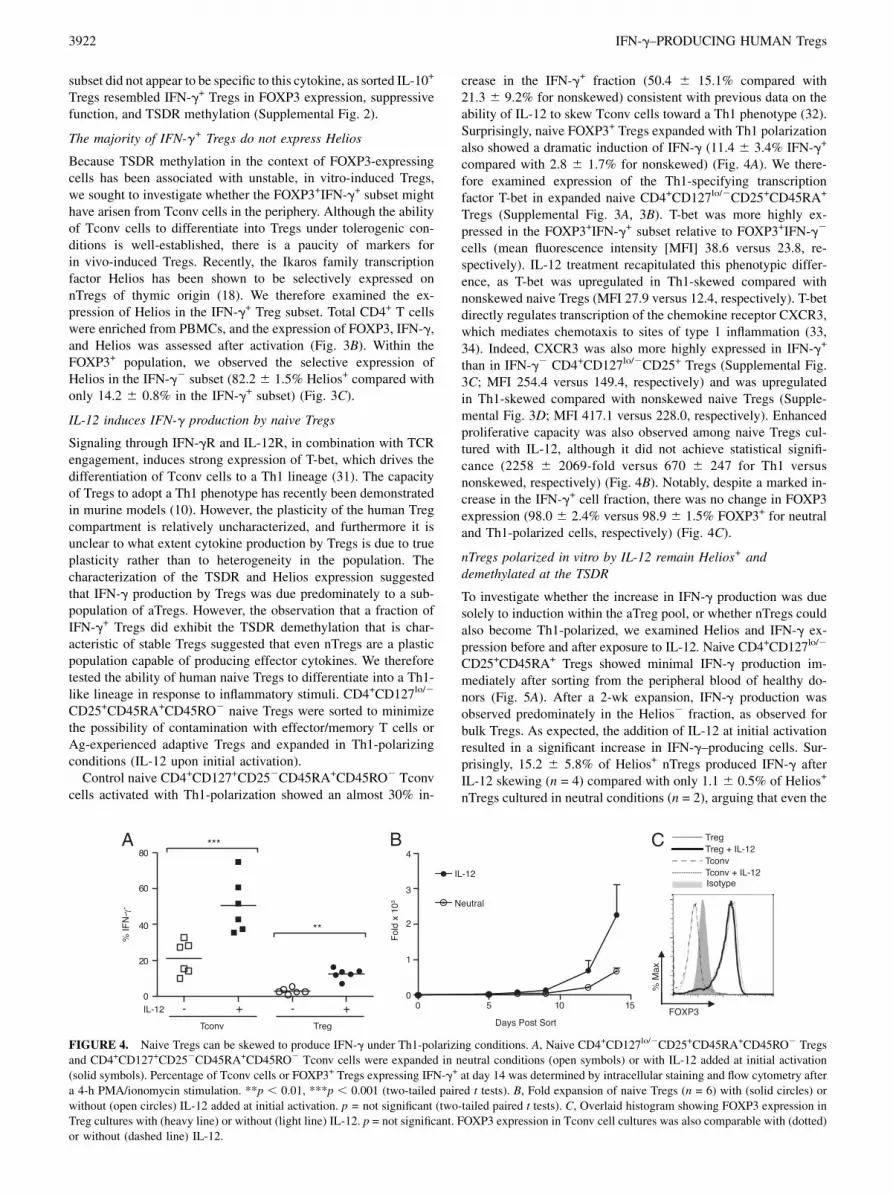
cells activated with Th1-polarization showed an almost 30% in-
crease in the IFN-g+ fraction (50.4 6 15.1% compared with21.3 6 9.2% for nonskewed) consistent with previous data on theability of IL-12 to skew Tconv cells toward a Th1 phenotype (32).Surprisingly, naive FOXP3+ Tregs expanded with Th1 polarizationalso showed a dramatic induction of IFN-g (11.4 6 3.4% IFN-g+
compared with 2.8 6 1.7% for nonskewed) (Fig. 4A). We there-fore examined expression of the Th1-specifying transcriptionfactor T-bet in expanded naive CD4+CD127lo/2CD25+CD45RA+
Tregs (Supplemental Fig. 3A, 3B). T-bet was more highly ex-pressed in the FOXP3+IFN-g+ subset relative to FOXP3+IFN-g2
cells (mean fluorescence intensity [MFI] 38.6 versus 23.8, re-spectively). IL-12 treatment recapitulated this phenotypic differ-ence, as T-bet was upregulated in Th1-skewed compared withnonskewed naive Tregs (MFI 27.9 versus 12.4, respectively). T-betdirectly regulates transcription of the chemokine receptor CXCR3,which mediates chemotaxis to sites of type 1 inflammation (33,34). Indeed, CXCR3 was also more highly expressed in IFN-g+
than in IFN-g2 CD4+CD127lo/2CD25+ Tregs (Supplemental Fig.3C; MFI 254.4 versus 149.4, respectively) and was upregulatedin Th1-skewed compared with nonskewed naive Tregs (Supple-mental Fig. 3D; MFI 417.1 versus 228.0, respectively). Enhancedproliferative capacity was also observed among naive Tregs cul-tured with IL-12, although it did not achieve statistical signifi-cance (2258 6 2069-fold versus 670 6 247 for Th1 versusnonskewed, respectively) (Fig. 4B). Notably, despite a marked in-crease in the IFN-g+ cell fraction, there was no change in FOXP3expression (98.0 6 2.4% versus 98.9 6 1.5% FOXP3+ for neutraland Th1-polarized cells, respectively) (Fig. 4C).
nTregs polarized in vitro by IL-12 remain Helios+ anddemethylated at the TSDR
To investigate whether the increase in IFN-g production was duesolely to induction within the aTreg pool, or whether nTregs couldalso become Th1-polarized, we examined Helios and IFN-g ex-pression before and after exposure to IL-12. Naive CD4+CD127lo/2
CD25+CD45RA+ Tregs showed minimal IFN-g production im-mediately after sorting from the peripheral blood of healthy do-nors (Fig. 5A). After a 2-wk expansion, IFN-g production wasobserved predominately in the Helios2 fraction, as observed forbulk Tregs. As expected, the addition of IL-12 at initial activationresulted in a significant increase in IFN-g–producing cells. Sur-prisingly, 15.2 6 5.8% of Helios+ nTregs produced IFN-g afterIL-12 skewing (n = 4) compared with only 1.1 6 0.5% of Helios+
nTregs cultured in neutral conditions (n = 2), arguing that even the
FIGURE 4. Naive Tregs can be skewed to produce IFN-g under Th1-polarizing conditions. A, Naive CD4+CD127lo/2CD25+CD45RA+CD45RO2 Tregs
and CD4+CD127+CD252CD45RA+CD45RO2 Tconv cells were expanded in neutral conditions (open symbols) or with IL-12 added at initial activation
(solid symbols). Percentage of Tconv cells or FOXP3+ Tregs expressing IFN-g+ at day 14 was determined by intracellular staining and flow cytometry after
a 4-h PMA/ionomycin stimulation. **p , 0.01, ***p , 0.001 (two-tailed paired t tests). B, Fold expansion of naive Tregs (n = 6) with (solid circles) or
without (open circles) IL-12 added at initial activation. p = not significant (two-tailed paired t tests). C, Overlaid histogram showing FOXP3 expression in
Treg cultures with (heavy line) or without (light line) IL-12. p = not significant. FOXP3 expression in Tconv cell cultures was also comparable with (dotted)
or without (dashed line) IL-12.
3922 IFN-g–PRODUCING HUMAN Tregs
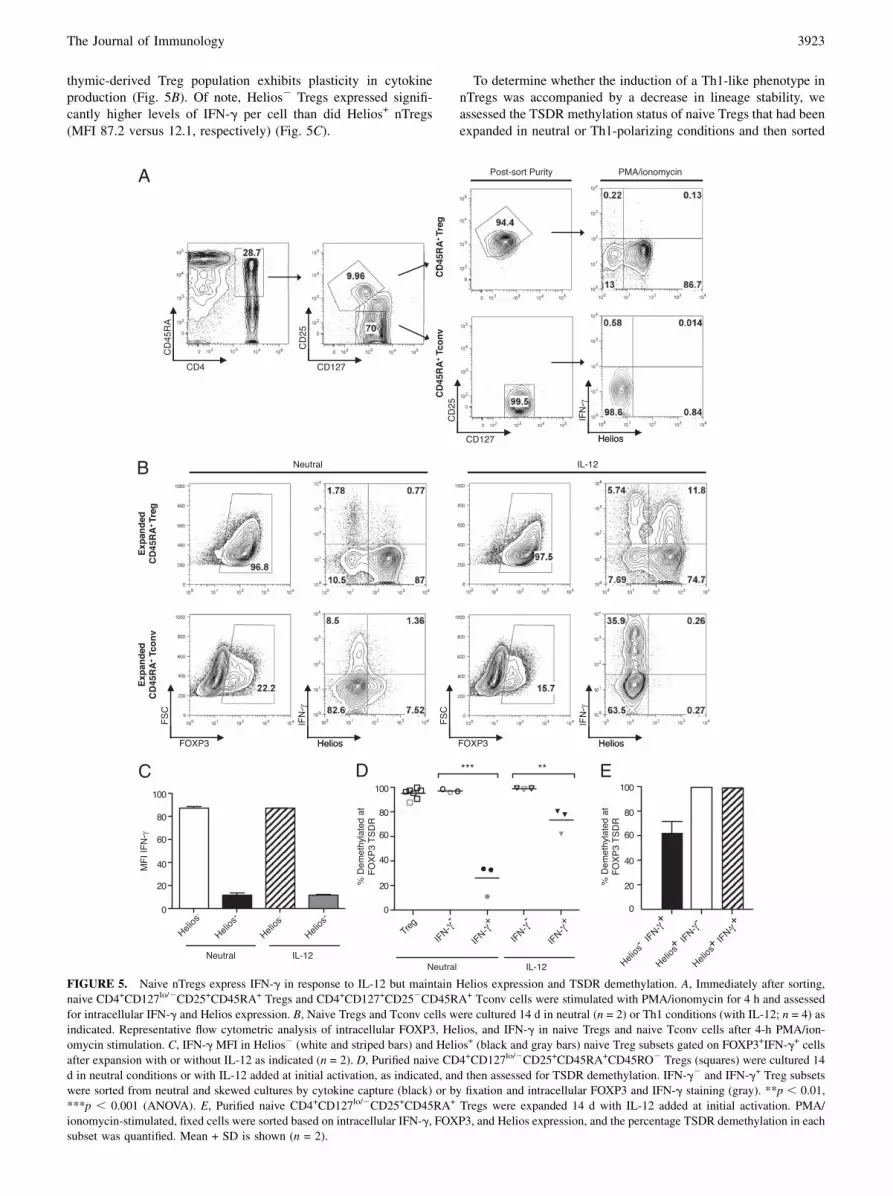
thymic-derived Treg population exhibits plasticity in cytokineproduction (Fig. 5B). Of note, Helios2 Tregs expressed signifi-cantly higher levels of IFN-g per cell than did Helios+ nTregs(MFI 87.2 versus 12.1, respectively) (Fig. 5C).
To determine whether the induction of a Th1-like phenotype innTregs was accompanied by a decrease in lineage stability, weassessed the TSDR methylation status of naive Tregs that had beenexpanded in neutral or Th1-polarizing conditions and then sorted
FIGURE 5. Naive nTregs express IFN-g in response to IL-12 but maintain Helios expression and TSDR demethylation. A, Immediately after sorting,
naive CD4+CD127lo/2CD25+CD45RA+ Tregs and CD4+CD127+CD252CD45RA+ Tconv cells were stimulated with PMA/ionomycin for 4 h and assessed
for intracellular IFN-g and Helios expression. B, Naive Tregs and Tconv cells were cultured 14 d in neutral (n = 2) or Th1 conditions (with IL-12; n = 4) as
indicated. Representative flow cytometric analysis of intracellular FOXP3, Helios, and IFN-g in naive Tregs and naive Tconv cells after 4-h PMA/ion-
omycin stimulation. C, IFN-g MFI in Helios2 (white and striped bars) and Helios+ (black and gray bars) naive Treg subsets gated on FOXP3+IFN-g+ cells
after expansion with or without IL-12 as indicated (n = 2). D, Purified naive CD4+CD127lo/2CD25+CD45RA+CD45RO2 Tregs (squares) were cultured 14
d in neutral conditions or with IL-12 added at initial activation, as indicated, and then assessed for TSDR demethylation. IFN-g2 and IFN-g+ Treg subsets
were sorted from neutral and skewed cultures by cytokine capture (black) or by fixation and intracellular FOXP3 and IFN-g staining (gray). **p , 0.01,
***p , 0.001 (ANOVA). E, Purified naive CD4+CD127lo/2CD25+CD45RA+ Tregs were expanded 14 d with IL-12 added at initial activation. PMA/
ionomycin-stimulated, fixed cells were sorted based on intracellular IFN-g, FOXP3, and Helios expression, and the percentage TSDR demethylation in each
subset was quantified. Mean + SD is shown (n = 2).
The Journal of Immunology 3923
by IFN-g expression. As expected, naive Tregs cultured in neutralconditions showed robust FOXP3 protein expression (94.6 63.2%) and TSDR demethylation (Fig. 5D). Consistent with ourfindings with CD4+CD127lo/2CD25+ Tregs, the proportion ofnaive Tregs demethylated at the TSDR was significantly reducedin IFN-g+ (25.9 6 12.7%) compared with IFN-g2 (96.8 6 1.3%)naive subsets, despite high FOXP3 expression in both populations(98.5 6 1.9% and 98.1 6 2.3%, respectively).Surprisingly, in contrast to IFN-g+ Tregs present in the culture
under nonpolarizing conditions, Th1-polarized IFN-g+ Tregs re-mained predominately demethylated at the TSDR (73.2 6 9.9%),demonstrating that TSDR methylation is not a prerequisite foreffector cytokine production in Tregs. This also suggests thatthe increased frequency of IFN-g+ cells in response to IL-12reflected de novo IFN-g expression rather than expansion of themethylated IFN-g+ subset. Notably, Tconv cells cultured in thesame conditions remained completely methylated (data not shown),arguing that IL-12 does not cause TSDR demethylation. How-ever, to more rigorously assess lineage stability after Th1-polari-zation specifically in Helios+ nTregs, naive Tregs expanded inthe presence of IL-12 were sorted based on intracellular FOXP3,IFN-g, and Helios expression (Fig. 5E). Epigenetic analysisrevealed that the Helios+FOXP3+IFN-g+ subset remained fullydemethylated at the TSDR (98.7 6 0.7% versus 99.7% in theHelios+FOXP3+IFN-g2 nTreg subset). In contrast, the Helios2
FOXP3+IFN-g+ aTreg subset was only 61.9 6 13.8% demethy-lated. Collectively, these data imply that nTregs can exhibit flex-ibility in cytokine production while maintaining lineage stabilityand therefore support the hypothesis that IFN-g–producing,
TSDR-methylated Tregs found in the circulation may represent anunstable aTreg subset rather than nTregs.
IFN-g+ Tregs are selectively enriched in patients with type 1diabetes
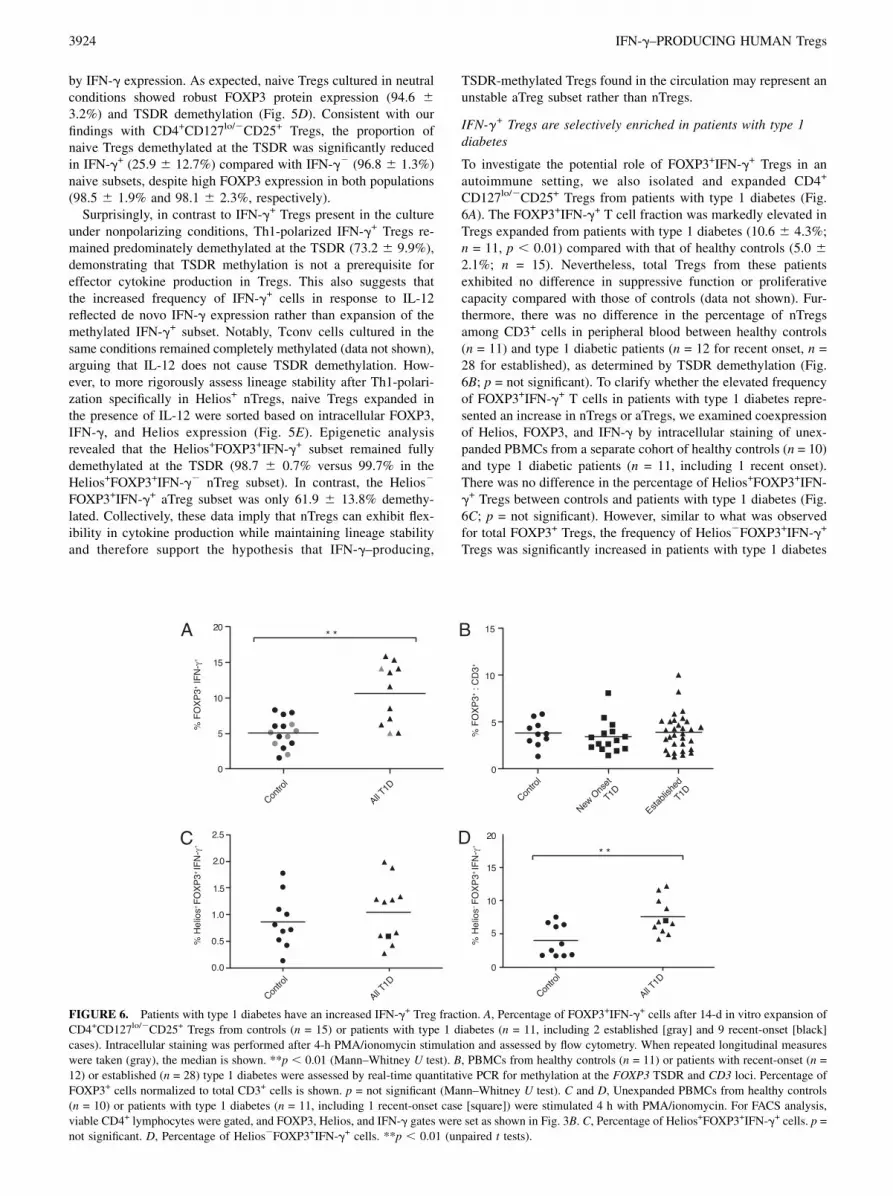
To investigate the potential role of FOXP3+IFN-g+ Tregs in anautoimmune setting, we also isolated and expanded CD4+
CD127lo/2CD25+ Tregs from patients with type 1 diabetes (Fig.6A). The FOXP3+IFN-g+ T cell fraction was markedly elevated inTregs expanded from patients with type 1 diabetes (10.6 6 4.3%;n = 11, p , 0.01) compared with that of healthy controls (5.0 62.1%; n = 15). Nevertheless, total Tregs from these patientsexhibited no difference in suppressive function or proliferativecapacity compared with those of controls (data not shown). Fur-thermore, there was no difference in the percentage of nTregsamong CD3+ cells in peripheral blood between healthy controls(n = 11) and type 1 diabetic patients (n = 12 for recent onset, n =28 for established), as determined by TSDR demethylation (Fig.6B; p = not significant). To clarify whether the elevated frequencyof FOXP3+IFN-g+ T cells in patients with type 1 diabetes repre-sented an increase in nTregs or aTregs, we examined coexpressionof Helios, FOXP3, and IFN-g by intracellular staining of unex-panded PBMCs from a separate cohort of healthy controls (n = 10)and type 1 diabetic patients (n = 11, including 1 recent onset).There was no difference in the percentage of Helios+FOXP3+IFN-g+ Tregs between controls and patients with type 1 diabetes (Fig.6C; p = not significant). However, similar to what was observedfor total FOXP3+ Tregs, the frequency of Helios2FOXP3+IFN-g+
Tregs was significantly increased in patients with type 1 diabetes
FIGURE 6. Patients with type 1 diabetes have an increased IFN-g+ Treg fraction. A, Percentage of FOXP3+IFN-g+ cells after 14-d in vitro expansion of
CD4+CD127lo/2CD25+ Tregs from controls (n = 15) or patients with type 1 diabetes (n = 11, including 2 established [gray] and 9 recent-onset [black]
cases). Intracellular staining was performed after 4-h PMA/ionomycin stimulation and assessed by flow cytometry. When repeated longitudinal measures
were taken (gray), the median is shown. **p , 0.01 (Mann–Whitney U test). B, PBMCs from healthy controls (n = 11) or patients with recent-onset (n =
12) or established (n = 28) type 1 diabetes were assessed by real-time quantitative PCR for methylation at the FOXP3 TSDR and CD3 loci. Percentage of
FOXP3+ cells normalized to total CD3+ cells is shown. p = not significant (Mann–Whitney U test). C and D, Unexpanded PBMCs from healthy controls
(n = 10) or patients with type 1 diabetes (n = 11, including 1 recent-onset case [square]) were stimulated 4 h with PMA/ionomycin. For FACS analysis,
viable CD4+ lymphocytes were gated, and FOXP3, Helios, and IFN-g gates were set as shown in Fig. 3B. C, Percentage of Helios+FOXP3+IFN-g+ cells. p =
not significant. D, Percentage of Helios2FOXP3+IFN-g+ cells. **p , 0.01 (unpaired t tests).
3924 IFN-g–PRODUCING HUMAN Tregs

(7.6 6 2.7%; p , 0.01) compared with that of controls (4.0 62.4%) (Fig. 6D).
DiscussionOur data support a growing body of evidence that FOXP3+ Tregsare a heterogeneous and plastic population. An IFN-g+ Treg subsetcan be isolated from both CD4+CD127lo/2CD25+ and naive CD4+
CD127lo/2CD25+CD45RA+ Tregs after expansion and was foundto retain the hallmarks of a regulatory cell: high levels of FOXP3expression, lack of IL-2 production, and suppressive activity.Despite a regulatory phenotype, the FOXP3+IFN-g+ subset iso-
lated from expanded CD4+CD127lo/2CD25+ T cells lacked theepigenetic imprinting (i.e., demethylated TSDR) characteristic ofthymic-derived nTregs. These epigenetic results suggested theFOXP3+IFN-g+ subset might not be a stable lineage and led tothe speculation that these cells represent an aTreg population,which may exhibit less FOXP3 transcriptional stability relativeto nTregs. In fact, type 1 regulatory T (Tr1) cells, which producehigh levels of IL-10 and low levels of IFN-g, have been shown tomediate suppression despite a lack of constitutive FOXP3 ex-pression (35, 36).Although specific markers for aTregs are currently lacking, the
transcription factor Helios has recently been suggested to dis-criminate nTregs from aTregs or Tconv cells. Specifically, FOXP32
CD4+ Tconv cells converted in vitro by activation in the presenceof TGF-b, or in vivo by oral Ag exposure, remain Helios2 despiterobust FOXP3 induction. Furthermore, Helios+FOXP3+ Tregsretained Helios expression 4 wk after adoptive transfer into acongenic host (18). Therefore, although we cannot formally ex-clude a downregulation of Helios by nTregs, our finding thatFOXP3+IFN-g+ T cells are predominately Helios2 argues that thisrepresents a peripherally induced aTreg population. Furthermore,although naive Tregs upregulated IFN-g, T-bet, and CXCR3 inresponse to IL-12, they maintained the epigenetic signature andfrequency of Helios expression characteristic of nTregs. With thecaveat that additional factors or chronic IL-12 exposure may resultin lineage destabilization, this finding does not support thehypothesis that the majority of circulating FOXP3+IFN-g+ cellsderived from nTregs in Th1 conditions.Importantly, in light of potential therapeutic applications of
expanded Tregs, we have demonstrated that the Helios2FOXP3+
IFN-g+ population is already present ex vivo and is not enrichedby our expansion procedures. These data argue that FOXP3+IFN-g+ T cells may arise both from Tconv cells induced to adopta regulatory phenotype in the periphery and from thymic-derivednTregs exposed to an inflammatory microenvironment, howeverthese cell populations are distinct in terms of Helios expressionand epigenetic status of the FOXP3 locus. Nevertheless, the long-term fate of nTregs induced to express IFN-g+ in response to IL-12 is an important question that remains to be determined.Whether Treg frequency is altered in patients with type 1 diabetes
has been the subject of much debate (37) and is complicated by thefact that in humans, FOXP3 expression is not restricted to Tregs butcan be transiently induced by a significant proportion of Teff cellsafter TCR activation (38). In this study we use epigenetic analysisof the TSDR, which is a robust measure of Treg frequency that isindependent of FOXP3 protein expression, to demonstrate thatthere is no deficiency of nTregs in the peripheral blood of type 1diabetic patients, irrespective of disease duration, compared withhealthy controls. It is important to note, however, that circulatingnTreg frequencies may not be representative of cell populations atthe site of inflammation. Consistent with this, a deficiency in Tregfrequency in inflamed islets, but not pancreatic lymph nodes, hasbeen reported in the NOD mouse (39). Furthermore, the ability of
Tregs to express IFN-g in response to IL-12 suggests that not onlythe number but also the cytokine profile of Tregs in the inflamedtissue may be distinct from those in circulation.We observed a significantly increased frequency of Helios2
FOXP3+IFN-g+ Tregs in type 1 diabetic patients, which suggestsa potential role for this subset during autoimmune pathogenesis. Incriss-cross experiments, Teff cells from NOD mice (40) or fromtype 1 diabetic patients (41) were shown to be resistant to sup-pression by Tregs. However, transfer of Tregs can effectivelycontrol disease in NOD even after disease onset (4), demonstratingthat a sufficient increase in Tregs can dominantly suppress evenresistant Teff cells. Although our studies cannot rule out thatFOXP3+IFN-g+ cells could contribute to pathology, the regulatoryproperties observed here suggest they may arise in a compensatoryfashion to control chronic Th1 inflammation.The observation of FOXP3+IFN-g+ and FOXP3+IL-10+ Tregs in
peripheral blood, most likely reflective of an aTreg population,raises broader questions regarding the roles of these cells incontrolling immunity. FOXP3+IFN-g+ aTregs likely represent anormal response to antigenic exposure, as evidenced by thepresence of a small fraction of the subset in healthy controls.Rather than merely increasing Treg numbers, the generation ofTh1-like aTregs might also enable a more finely tuned response toinflammation. Consistent with this notion, Tregs coexpressingFOXP3 and T-bet accumulated at sites of Th1 inflammation, andT-bet expression by adoptively transferred Tregs was essentialfor control of Th1 responses in scurfy mice (10). Furthermore,in patients with recent-onset type 1 diabetes, TGF-b–inducedTregs were more potent suppressors than donor-matched nTregs,whereas no difference was seen in cells from control or long-standing type 1 diabetic patients (42). Similarly, FOXP3+IFN-g+
human Tregs induced in vitro by allogeneic dendritic cells havebeen shown to selectively suppress alloreactive T cell proliferation(43). This compensatory mechanism might itself be subject toregulation, as the ability of naive T cells to be converted to Tregsis abrogated in Toxoplasma gondii-induced Th1 inflammation(44). The fate of IFN-g+ Tregs in patients with type 1 diabetes andthe function of this subset in the context of inflammation remainimportant questions and are the focus of ongoing experiments.Moreover, whether these cells possess autoreactive TCRs againstb-cell Ags remains to be determined. Further characterization ofhuman FOXP3+IFN-g+ Tregs, in particular using Ag-specific hu-manized mouse models, will be important to elucidate the stabilityand physiological role of IFN-g–producing Tregs in vivo.
AcknowledgmentsWe thank Marc Martinez-Llordella, Dimitri de Kouchkovsky, Samantha
Bailey-Bucktrout, Courtney Myhr, and members of the Bluestone and
Anderson laboratories for helpful comments and expert technical advice.
We thank Mark Atkinson, Kieran McGrail, and Clive Wasserfall at the Uni-
versity of Florida, Peter Gottlieb and Rebecca Wagner at the Barbara Davis
Center, and Steven Gitelman and Kathleen Fraser at University of Califor-
nia, San Francisco for providing patient samples. We also thank all those
who kindly donated blood for this research.
DisclosuresU.H. and S.O. are associates of Epiontis, and U.B. is an employee of
Epiontis. Thus, U.H., S.O., and U.B. have declared a financial interest in
Epiontis, whose potential product was studied in the current work. All
other authors have no financial conflicts of interest.
References1. Bach, J. F. 2003. Autoimmune diseases as the loss of active “self-control.” Ann.
N.Y. Acad. Sci. 998: 161–177.
The Journal of Immunology 3925

2. Atkinson, M. A., and G. S. Eisenbarth. 2001. Type 1 diabetes: new perspectiveson disease pathogenesis and treatment. Lancet 358: 221–229.
3. Brusko, T. M., A. L. Putnam, and J. A. Bluestone. 2008. Human regulatoryT cells: role in autoimmune disease and therapeutic opportunities. Immunol. Rev.223: 371–390.
4. Bluestone, J. A., and Q. Tang. 2004. Therapeutic vaccination using CD4+CD25+antigen-specific regulatory T cells. Proc. Natl. Acad. Sci.USA 101(Suppl 2):14622–14626.
5. Liu, W., A. L. Putnam, Z. Xu-Yu, G. L. Szot, M. R. Lee, S. Zhu, P. A. Gottlieb,P. Kapranov, T. R. Gingeras, B. Fazekas de St Groth, et al. 2006. CD127 ex-pression inversely correlates with FoxP3 and suppressive function of humanCD4+ T reg cells. J. Exp. Med. 203: 1701–1711.
6. Putnam, A. L., T. M. Brusko, M. R. Lee, W. Liu, G. L. Szot, T. Ghosh,M. A. Atkinson, and J. A. Bluestone. 2009. Expansion of human regulatoryT-cells from patients with type 1 diabetes. Diabetes 58: 652–662.
7. Bluestone, J. A., and A. K. Abbas. 2003. Natural versus adaptive regulatoryT cells. Nat. Rev. Immunol. 3: 253–257.
8. O’Shea, J. J., and W. E. Paul. 2010. Mechanisms underlying lineage commitmentand plasticity of helper CD4+ T cells. Science 327: 1098–1102.
9. Zheng, Y., A. Chaudhry, A. Kas, P. deRoos, J. M. Kim, T. T. Chu, L. Corcoran,P. Treuting, U. Klein, and A. Y. Rudensky. 2009. Regulatory T-cell suppressorprogram co-opts transcription factor IRF4 to control T(H)2 responses. Nature458: 351–356.
10. Koch, M. A., G. Tucker-Heard, N. R. Perdue, J. R. Killebrew, K. B. Urdahl, andD. J. Campbell. 2009. The transcription factor T-bet controls regulatory T cellhomeostasis and function during type 1 inflammation. Nat. Immunol. 10: 595–602.
11. Chaudhry, A., D. Rudra, P. Treuting, R. M. Samstein, Y. Liang, A. Kas, andA. Y. Rudensky. 2009. CD4+ regulatory T cells control TH17 responses ina Stat3-dependent manner. Science 326: 986–991.
12. Yang, X. O., R. Nurieva, G. J. Martinez, H. S. Kang, Y. Chung, B. P. Pappu,B. Shah, S. H. Chang, K. S. Schluns, S. S. Watowich, et al. 2008. Molecularantagonism and plasticity of regulatory and inflammatory T cell programs. Im-munity 29: 44–56.
13. Battaglia, M., and M. G. Roncarolo. 2009. The fate of human Treg cells. Im-munity 30: 763–765.
14. Zhou, X., S. L. Bailey-Bucktrout, L. T. Jeker, C. Penaranda, M. Martınez-Llordella, M. Ashby, M. Nakayama, W. Rosenthal, and J. A. Bluestone. 2009.Instability of the transcription factor Foxp3 leads to the generation of pathogenicmemory T cells in vivo. Nat. Immunol. 10: 1000–1007.
15. Riley, J. L., C. H. June, and B. R. Blazar. 2009. Human T regulatory cell therapy:take a billion or so and call me in the morning. Immunity 30: 656–665.
16. Zhou, X., S. Bailey-Bucktrout, L. T. Jeker, and J. A. Bluestone. 2009. Plasticityof CD4(+) FoxP3(+) T cells. Curr. Opin. Immunol. 21: 281–285.
17. Floess, S., J. Freyer, C. Siewert, U. Baron, S. Olek, J. Polansky, K. Schlawe,H. D. Chang, T. Bopp, E. Schmitt, et al. 2007. Epigenetic control of the foxp3locus in regulatory T cells. PLoS Biol. 5: e38.
18. Thornton, A. M., P. E. Korty, D. Q. Tran, E. A. Wohlfert, P. E. Murray,Y. Belkaid, and E. M. Shevach. 2010. Expression of Helios, an Ikaros tran-scription factor family member, differentiates thymic-derived from peripherallyinduced Foxp3+ T regulatory cells. J. Immunol. 184: 3433–3441.
19. Wieczorek, G., A. Asemissen, F. Model, I. Turbachova, S. Floess, V. Liebenberg,U. Baron, D. Stauch, K. Kotsch, J. Pratschke, et al. 2009. Quantitative DNAmethylation analysis of FOXP3 as a new method for counting regulatory T cellsin peripheral blood and solid tissue. Cancer Res. 69: 599–608.
20. Sehouli, J., C. Loddenkemper, T. Cornu, T. Schwachula, U. Hoffmuller, A. Grutzkau,P. Lohneis, T. Dickhaus, J. Grone, M. Kruschewski, et al. 2011. Epigenetic quanti-fication of tumor-infiltrating T-lymphocytes. Epigenetics 6: 236–246.
21. Esensten, J. H., M. R. Lee, L. H. Glimcher, and J. A. Bluestone. 2009. T-bet-deficient NOD mice are protected from diabetes due to defects in both T cell andinnate immune system function. J. Immunol. 183: 75–82.
22. Hoffmann, P., R. Eder, T. J. Boeld, K. Doser, B. Piseshka, R. Andreesen, andM. Edinger. 2006. Only the CD45RA+ subpopulation of CD4+CD25high T cellsgives rise to homogeneous regulatory T-cell lines upon in vitro expansion. Blood108: 4260–4267.
23. Hoffmann, P., T. J. Boeld, R. Eder, J. Huehn, S. Floess, G. Wieczorek, S. Olek,W. Dietmaier, R. Andreesen, and M. Edinger. 2009. Loss of FOXP3 expressionin natural human CD4+CD25+ regulatory T cells upon repetitive in vitro stim-ulation. Eur. J. Immunol. 39: 1088–1097.
24. Miyara, M., Y. Yoshioka, A. Kitoh, T. Shima, K. Wing, A. Niwa, C. Parizot,C. Taflin, T. Heike, D. Valeyre, et al. 2009. Functional delineation and differ-
entiation dynamics of human CD4+ T cells expressing the FoxP3 transcriptionfactor. Immunity 30: 899–911.
25. Gavin, M. A., T. R. Torgerson, E. Houston, P. DeRoos, W. Y. Ho, A. Stray-Pedersen, E. L. Ocheltree, P. D. Greenberg, H. D. Ochs, and A. Y. Rudensky.2006. Single-cell analysis of normal and FOXP3-mutant human T cells: FOXP3expression without regulatory T cell development. Proc. Natl. Acad. Sci. USA103: 6659–6664.
26. Wang, J., A. Ioan-Facsinay, E. I. van der Voort, T. W. Huizinga, and R. E. Toes.2007. Transient expression of FOXP3 in human activated nonregulatory CD4+T cells. Eur. J. Immunol. 37: 129–138.
27. Allan, S. E., S. Q. Crome, N. K. Crellin, L. Passerini, T. S. Steiner, R. Bacchetta,M. G. Roncarolo, and M. K. Levings. 2007. Activation-induced FOXP3 in hu-man T effector cells does not suppress proliferation or cytokine production. Int.Immunol. 19: 345–354.
28. Tran, D. Q., H. Ramsey, and E. M. Shevach. 2007. Induction of FOXP3 ex-pression in naive human CD4+FOXP3 T cells by T cell receptor stimulation istransforming growth factor-beta dependent but does not confer a regulatoryphenotype. Blood 110: 2983–2990.
29. Baron, U., S. Floess, G. Wieczorek, K. Baumann, A. Grutzkau, J. Dong,A. Thiel, T. J. Boeld, P. Hoffmann, M. Edinger, et al. 2007. DNA demethylationin the human FOXP3 locus discriminates regulatory T cells from activatedFOXP3(+) conventional T cells. Eur. J. Immunol. 37: 2378–2389.
30. Polansky, J. K., K. Kretschmer, J. Freyer, S. Floess, A. Garbe, U. Baron, S. Olek,A. Hamann, H. von Boehmer, and J. Huehn. 2008. DNA methylation controlsFoxp3 gene expression. Eur. J. Immunol. 38: 1654–1663.
31. Amsen, D., C. G. Spilianakis, and R. A. Flavell. 2009. How are T(H)1 and T(H)2effector cells made? Curr. Opin. Immunol. 21: 153–160.
32. Wu, C. Y., C. Demeure, M. Kiniwa, M. Gately, and G. Delespesse. 1993. IL-12induces the production of IFN-gamma by neonatal human CD4 T cells. J.Immunol. 151: 1938–1949.
33. Beima, K. M., M. M. Miazgowicz, M. D. Lewis, P. S. Yan, T. H. Huang, andA. S. Weinmann. 2006. T-bet binding to newly identified target gene promoters iscell type-independent but results in variable context-dependent functionaleffects. J. Biol. Chem. 281: 11992–12000.
34. Bonecchi, R., G. Bianchi, P. P. Bordignon, D. D’Ambrosio, R. Lang, A. Borsatti,S. Sozzani, P. Allavena, P. A. Gray, A. Mantovani, and F. Sinigaglia. 1998.Differential expression of chemokine receptors and chemotactic responsivenessof type 1 T helper cells (Th1s) and Th2s. J. Exp. Med. 187: 129–134.
35. Vieira, P. L., J. R. Christensen, S. Minaee, E. J. O’Neill, F. J. Barrat, A. Boonstra,T. Barthlott, B. Stockinger, D. C. Wraith, and A. O’Garra. 2004. IL-10-secretingregulatory T cells do not express Foxp3 but have comparable regulatory functionto naturally occurring CD4+CD25+ regulatory T cells. J. Immunol. 172: 5986–5993.
36. Levings, M. K., S. Gregori, E. Tresoldi, S. Cazzaniga, C. Bonini, andM. G. Roncarolo. 2005. Differentiation of Tr1 cells by immature dendritic cellsrequires IL-10 but not CD25+CD4+ Tr cells. Blood 105: 1162–1169.
37. Brusko, T., and M. Atkinson. 2007. Treg in type 1 diabetes. Cell Biochem.Biophys. 48: 165–175.
38. Ziegler, S. F. 2006. FOXP3: of mice and men. Annu. Rev. Immunol. 24: 209–226.39. Tang, Q., J. Y. Adams, C. Penaranda, K. Melli, E. Piaggio, E. Sgouroudis,
C. A. Piccirillo, B. L. Salomon, and J. A. Bluestone. 2008. Central role of de-fective interleukin-2 production in the triggering of islet autoimmune de-struction. Immunity 28: 687–697.
40. D’Alise, A. M., V. Auyeung, M. Feuerer, J. Nishio, J. Fontenot, C. Benoist, andD. Mathis. 2008. The defect in T-cell regulation in NOD mice is an effect on theT-cell effectors. Proc. Natl. Acad. Sci. USA 105: 19857–19862.
41. Schneider, A., M. Rieck, S. Sanda, C. Pihoker, C. Greenbaum, and J. H. Buckner.2008. The effector T cells of diabetic subjects are resistant to regulation via CD4+ FOXP3+ regulatory T cells. J. Immunol. 181: 7350–7355.
42. Glisic, S., S. Ehlenbach, P. Jailwala, J. Waukau, S. Jana, and S. Ghosh. 2010.Inducible regulatory T cells (iTregs) from recent-onset type 1 diabetes subjectsshow increased in vitro suppression and higher ITCH levels compared withcontrols. Cell Tissue Res. 339: 585–595.
43. Stroopinsky, D., I. Avivi, J. M. Rowe, D. Avigan, and T. Katz. 2009. Allogeneicinduced human FOXP3(+)IFN-gamma(+) T cells exhibit selective suppressivecapacity. Eur. J. Immunol. 39: 2703–2715.
44. Oldenhove, G., N. Bouladoux, E. A. Wohlfert, J. A. Hall, D. Chou, L. DosSantos, S. O’Brien, R. Blank, E. Lamb, S. Natarajan, et al. 2009. Decrease ofFoxp3+ Treg cell number and acquisition of effector cell phenotype during lethalinfection. Immunity 31: 772–786.
3926 IFN-g–PRODUCING HUMAN Tregs