plasmodium falciparum: evaluation of a quantitative nucleic acid sequence-based amplification assay...
TRANSCRIPT

Downloaded from UvA-DARE, the Institutional Repository of the University of Amsterdam (UvA)http://dare.uva.nl/document/112998
Description ThesisFile ID 112998Filename thesis.pdf
SOURCE, OR PART OF THE FOLLOWING SOURCE:Type DissertationTitle Molecular tools for the diagnosis of malaria and monitoring of parasite dynamics under drug
pressureAuthor P.F. MensFaculty Faculty of MedicineYear 2008Pages 159
FULL BIBLIOGRAPHIC DETAILS: http://dare.uva.nl/record/281294
Copyrights It is not permitted to download or to forward/distribute the text or part of it without the consent of the copyright holder(usually the author), other then for strictly personal, individual use. UvA-DARE is a service provided by the Library of the University of Amsterdam (http://dare.uva.nl)


1
Molecular tools for the diagnosis of malaria and
monitoring of parasite dynamics under drug pressure
Petra Mens

2
Molecular tools for the diagnosis of malaria and monitoring of parasite dynamics under
drug pressure
ISBN 978-90-9023222-5
Copyright 2008, Petra Mens, Amsterdam, the Netherlands
All rights are reserved. No part of this thesis may be reproduced, stored or transmitted in
any form or by any means, without the prior permission of the author, or, when
applicable, of the publishers of the scientific papers.
Printed by: Gildeprint B.V.
Cover design: Nico Capel
Photography: Petra Mens

3
MOLECULAR TOOLS FOR THE DIAGNOSIS OF
MALARIA AND MONITORING OF PARASITE
DYNAMICS UNDER DRUG PRESSURE
ACADEMISCH PROEFSCHRIFT
ter verkrijging van de graad van doctor
aan de Universiteit van Amsterdam
op gezag van de Rector Magnificus
prof.dr. D.C. van den Boom
ten overstaan van een door het college voor promoties ingestelde commissie, in
het openbaar te verdedigen in de Agnietenkapel
op donderdag 18 september 2008, te 14.00 uur
door
Petronella Francisca Mens
geboren te Amsterdam
4
Promotiecommissie:
Promotor:
Prof. dr. P.A. Kager
Overige leden:
Prof. dr. U. d’Alessandro
Prof. dr. M.W. Borgdorff
Prof. dr. T.F. Rinke de Wit
Prof. dr. R.W. Sauerwein
Dr. P.J. de Vries
Faculteit der Geneeskunde

5
Life can only be understood backwards;
but it must be lived forwards.
Søren Kierkegaard

6

7
Contents
Chapter 1 General introduction……………………………………………………………9
Chapter 2 Detection and identification of human Plasmodium species with real-time
quantitative nucleic acid sequence-based amplification (Real-Time QT-
NASBA).....................................................................................................3
Chapter 3 Development of a Pvs25 based real-time QT-NASBA for the detection of
the sexual stage of Plasmodium vivax……………………………………...49
Chapter 4 Plasmodium falciparum: evaluation of QT-NASBA to predict the outcome
of sulfadoxine–pyrimethamine treatment of uncomplicated malaria ....…63
Chapter 5 A randomized trial to monitor efficacy and effectiveness by QT-NASBA of
artemether-lumefantrine versus dihydroartemisinin-piperaquine for
treatment and transmission control of uncomplicated Plasmodium
falciparum malaria in western Kenya...................................................... 81
Chapter 6 Molecular biology the best alternative for diagnosis of malaria to
microscopy? A comparison between microscopy, antigen detection and
molecular tests in rural Kenya and urban Tanzania.................................99
Chapter 7 Molecular diagnosis of malaria in the field: development of a novel,
nucleic acid lateral flow immuno assay for the detection of all 4 human
Plasmodium species and its evaluation in Mbita, Kenya. ………………113
Chapter 8 General discussion ................................................................................131
Summary........…………………………………………………………………………...........147
Samenvatting …………………………………………………………………………...........150
Publications …………………………………………………………………….. ……………155
Acknowledgments ……………………………………………………………………………157
Curriculum vitae......………………………………………………………………..…………158

8

9
���������
�
�
�
�
General introduction

10
Malaria, the disease
Malaria is caused by the protozoan parasite Plasmodium that is transmitted to
humans via the bite on an infected female Anopheles mosquito [1]. Four
Plasmodium species can infect humans and cause disease; i.e. P. falciparum, P.
vivax, P. ovale and P. malariae. P. falciparum is the most pathogenic species and
this parasite is highly prevalent on the African continent [1,2]. Malaria is one of
the leading parasitic diseases in the world causing 200-300 million clinical cases
and over 1 million deaths each year, especially in children under five years of age
[1-4]. Pregnant women are another risk group with high morbidity as a
consequence of P. falciparum infection. Around 25 million women living in Sub-
saharan Africa in areas with stable malaria transmission become pregnant each
year [5] and malaria is estimated to cause at least 10.000 maternal deaths each
year and results in 100.000 infant deaths due to low birth weight associated with
malaria in pregnancy [6,7]. In general, the disease burden is almost 50 million
disability adjusted life years [8]. Furthermore, malaria endemic countries are not
only poorer than non-malarial countries, but they also have a lower economic
growth rate; i.e. 1.3% lower in countries with intensive malaria transmission
compared to countries without malaria [9].
The field work described in this thesis was performed in eastern Africa because
of the high prevalence of P. falciparum infection in that area. The work mainly
involved children as they are the most vulnerable risk group.
Malaria has a large variety in clinical presentation and severity of the disease.
The symptoms of a mild infection are general, with fever as the main
characteristic and can be combined with symptoms like headache, myalgias,
arthralgias, weakness, vomiting and diarrhea. Other clinical features include
splenomegaly, anemia, thrombocytopenia, hypoglycemia and pulmonary or renal
dysfunction. In severe infections neurological damage coma and even death can
be caused by rosetting of the red blood cells, leading to impaired microvascular
blood flow in the brain, and the release of cytokines such as TNF-� which can in
turn trigger the release of harmful substances such as nitric oxide that damage
the brain [1,3,10, 11].

11
Malaria, its discovery
In 1880 a French military doctor Alphonse Laveran published a note at a meeting
of the Académie de Médecine in Paris, describing “New Parasite Found in the
Blood of Several Patients Suffering from Marsh Fever.” [12] This was the first
official report describing Plasmodium parasites. Laveran worked in Algeria at
different military hospitals and during his time malaria was a serious health
problem for the soldiers. Even though previous theories argued that malaria was
caused by bad air (Italian: mala=bad aria=air) Laveran, fueled by Pasteurs
finding that most infectious diseases were caused by microbes, believed that
there was another causative agent. Although Laveran could not establish a
relationship between clinical or anatomical features, he did discover the
presence of granules of black pigment in the blood [12,13]. These pigmented
granules occurred at very different frequencies depending on the cases. Laveran
concluded that these pigmented granules were specific to malaria and that they
originated in the blood. He made several other observations but at the 6th of
November 1880 he examined the blood of a patient that had been ill for 15 days.
He saw “on the edges of a pigmented spherical body, filiform elements which
move with great vivacity, displacing the neighboring red blood cells.” The motility
of these elements immediately convinced Laveran that he had discovered the
agent causing malaria and that it was a protozoan parasite. Nevertheless, it took
him almost 10 years to convince the scientific community of the causative agent
of malaria. Laveran made drawings of what would be the first picture of the
malaria causing parasite Plasmodium (fig1.1) [12,13].
Malaria: life cycle of Plasmodium falciparum
P. falciparum is the most prevalent species and causes the highest number of
casualties, therefore this chapter is focused on the description of the life cycle of
this species of the Plasmodium genus (fig 1.2). The parasite is able to
successfully infect humans as well as its vector, the female Anopheles mosquito.
When a person is bitten by a an infected mosquito, sporozoites are injected into

12
Figure 1.1
Drawings of the different stages of Plasmodium falciparum as observed by Laveran in the blood
of his patients suffering from malaria.
http://www.cdc.gov
13
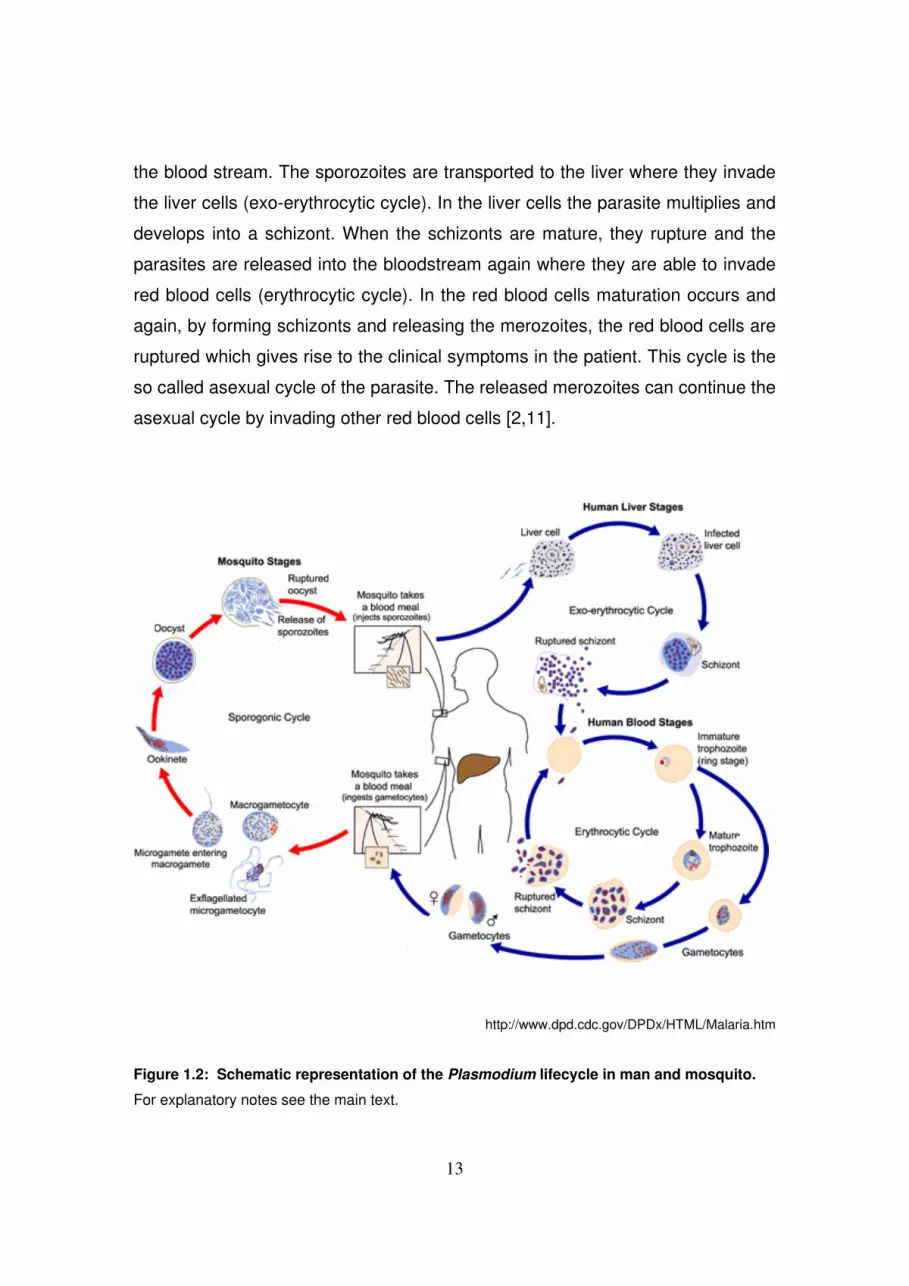
the blood stream. The sporozoites are transported to the liver where they invade
the liver cells (exo-erythrocytic cycle). In the liver cells the parasite multiplies and
develops into a schizont. When the schizonts are mature, they rupture and the
parasites are released into the bloodstream again where they are able to invade
red blood cells (erythrocytic cycle). In the red blood cells maturation occurs and
again, by forming schizonts and releasing the merozoites, the red blood cells are
ruptured which gives rise to the clinical symptoms in the patient. This cycle is the
so called asexual cycle of the parasite. The released merozoites can continue the
asexual cycle by invading other red blood cells [2,11].
http://www.dpd.cdc.gov/DPDx/HTML/Malaria.htm
Figure 1.2: Schematic representation of the Plasmodium lifecycle in man and mosquito.
For explanatory notes see the main text.
14
Alternatively, instead of maturing into schizonts, the merozoites can also mature
into the sexual stages of Plasmodium, the gametocytes. The lifecycle in the
human body is however arrested in the gametocyte stage. The cycle can be
continued by another blood meal of the mosquito in which the gametocytes are
transmitted (sporogonic cycle). After fertilization in the mosquito ookinetes are
formed which can develop subsequently into oocysts. After maturation, the
oocysts release the infectious sporozoites that migrate to the salivary gland of the
mosquito where they wait to be transmitted to another human and make the cycle
complete [2,11].
Malaria control: prevention, diagnosis and treatment
Key features in controlling malaria are vector control, prevention (e.g. insecticide
sprays, bed nets, prophylaxis), and treatment.
In the absence of an effective vaccine these features will still be the most
important tools in combating malaria [14]. However, the use of affordable anti-
malaria drugs, like chloroquine (CQ) and sulfadoxine-pyrimethamine (SP), is
severely hampered, because P. falciparum has become resistant to the action of
these drugs [15,16]. This has prompted the need for alternative treatment and
nowadays artemisinin based combination therapy (ACT) is recommended. ACT
uses a combination of drugs, one of which is an artemisinin derivative and a
partner drug with a longer half life [17]. ACT has several advantages over
previous therapies. They are, at present, effective in treating malaria patients and
the combination of two drugs should prevent the parasites of becoming resistant.
In order to effectively and not unnecessarily treat patients, proper diagnosis is
essential [18]. Although several diagnostic tools are currently available (e.g.
microscopy, rapid diagnostic tests, molecular tools), all have their shortcomings
[19,20]. This thesis describes the development of new tools for the diagnosis of
Plasmodium infections. In addition it shows the advantages of having tools that
not only are able to diagnose patients but also enable research towards the
dynamics of parasites when they are challenged in vivo with different drugs.

15
Diagnosing malaria
Malaria is a global health problem and although it mainly affects the poorer
regions of the world the disease can be encountered in the developed world as
well, mainly as so called imported or travel malaria [21]. This fact makes the
subject of good diagnosis a worldwide issue. The capabilities of proper
diagnosing are however not universally distributed. When discussing diagnostic
methods and its advantages and drawbacks it is important to keep this in mind
since the applicability of diagnostic methods largely depends on the resources
available in a certain place [19-22]. Malaria in the developed world is not endemic
anymore and therefore diagnosis possesses its own problems. Laboratories are
well equipped but do not encounter the disease regularly which could lead to not
recognizing the Plasmodium parasite in a clinical sample [22]. In the developing
world the disease is encountered very frequently but resources are often lacking
[24]. The section below describes the most commonly used methods for
diagnosing malaria and although the principles of diagnosing are universal, the
applicability of each method and its use will be discussed from a “developing
world” perspective. In this point of view issues such as user friendliness, price
and malaria associated problems such as semi-immunity and low parasite
densities are of major importance [19-24].
Clinical diagnosis
In many parts of the world the diagnosis malaria and the subsequent treatment
will be made without a laboratory test and the physician will often rely on the
clinical symptoms of the patient [4,24,25]. Although malaria has several
characteristic features such as intermittent fevers and typical symptoms,
presumptive diagnosis is very unspecific and often confused with other diseases
like respiratory tract infections or typhoid fever. In areas of high endemicity, fever
in children is often regarded and treated as malaria [10,18,25]. Although in some
areas and during high transmission seasons this may be the case for a large
proportion of children, this also means that in a large proportion of patients other
diseases causing a fever are not treated as such and unnecessary anti-malarial

16
drugs are given instead [10,14]. In the light of wide spread drug resistance
against affordable drugs and changing of drug policies towards expensive ACTs
the importance of laboratory confirmed diagnosis is evident.
Microscopy
Microscopy has been used since the time of Laveran to diagnose malaria in the
blood of an infected patient. The method relies on the microscopic identification
and morphological determination of the parasite in, usually Giemsa or Leishman
stained, thin and thick films [20]. The method has several advantages above
other methods such as the ability to differentiate between the different species,
that is important in determining the treatment of a patient, and differentiation
between asexual and gametocyte stages which also has consequences for the
treatment. In many areas patients are gametocyte carriers but do not harbour
asexual parasites and are therefore often not treated [26,27]. Another advantage
of microscopy is the ability to quantify the parasitaemia, which is an important
indicator for the clinical outcome [21]. In addition, microscopy allows for an easy
identification of blood abnormalities [19-21]. However, this method has its
disadvantages as well. Microscopy can be very sensitive but under normal field
conditions an expert microscopist can only reach a sensitivity of 100 parasites/ �l
blood in a thin smear and 40-50 parasites/�l blood in a thick film [22].
Other obstacles are maintenance of microscopes, electricity and the relatively
long processing, staining and reading time that is required. To overcome some of
these obstacles methods such as Field’s stain, that give very good quality slides
and are much faster to stain, have been developed [19-21,28]. Adjustments of
microscopes towards battery powered systems have enabled microscopy
diagnosis to be performed where no electricity is available [29]. To circumvent
the need of highly trained and experienced laboratory personnel staining with
acridine orange has been introduced which stains the parasites that are easily
recognized under a fluorescent microscope [30,31]. Quantitative Buffy Coat
(QBC) is also based on acridine orange staining in a microcentrifuge tube
[20,30,32,33]. The parasites can be easily seen under an ultraviolet light. Albeit

17
easy to perform, these methods are very expensive and require additional
equipment to the traditional microscope [31,33]. Furthermore, QBC is, under field
conditions, just as sensitive as conventional microscopy but species identification
and quantification is not possible with this technique making Giemsa stain the
optimal method for microscopy diagnosis [30].
Rapid Diagnostic Tests
In recent years, a variety of rapid diagnostic tests (RDTs) has been developed to
overcome the limitations of microscopy [19,20,34]. These tests are fast, easy to
perform and do not require electricity or specific equipment and cost currently,
depending on the manufacturer and/or supplier, around Euro 2.0/test [19,34].
RDT’s are immunochromatographic lateral flow assays and are based on the
recognition of Plasmodium antigens circulating in the blood of the patient [34,35].
Few targets have been used in commercialized RDT’s, i.e. parasite specific
aldolase, parasite lactate dehydrogenase (pLDH) and histidine rich protein-2
(HRP-2) with the latter two most frequently used [36]. HRP-2 is a water soluble
antigen that is present during the whole erythrocytic cycle of the parasite [37,38].
It is a very specific antigen but has a drawback that the antigen persists for at
least a week after treatment making follow-up monitoring and recognition of
resistant parasites difficult [35,39]. In contrast, pLDH, a metabolic enzyme that is
actively produced during the growth of the parasite in RBCs, is cleared rapidly
after the patient is successfully treated and is used in several RDT’s [36]. The
pLDH tests are less sensitive than the HRP-2 based tests [40]. In a study
performed in Uganda the sensitivity of HRP-2 based tests was 92% whereas
LDH based tests had a sensitivity of 85% [39]. These differences were mainly
due to the ability of HRP-2 tests to detect lower parasite densities. On the other
hand HRP-2 based tests are prone to give false positive signals in patients with
rheumatoid factors, and patients that recently have cleared a Plasmodium
infection [39, 40]. Several studies including the study in Uganda [39] found 98-
100% specificity for LDH-based tests and 90-93% specificity for HRP-2 based
tests. This lower specificity is primarily due to the persistence of antigens after

18
parasite clearance. In general RDTs can detect around 100 parasites/µl but at
lower parasitaemia their sensitivity decreases, making these tests unsuitable for
patients with low numbers of parasites [41]. Another drawback is the lack of
stability of the tests under tropical conditions and their inability to discriminate
between the different species of Plasmodium although some recently developed
tests are able to distinguish between P. falciparum and non-falciparum infections
[42]. Despite their shortcomings, in areas where microscopy is unavailable or in
situations where it is difficult to perform microscopic slide examinations, such as
emergencies or during the night, RDTs can be very useful [43]. An additional
advantage of RDTs may be the detection of HRP-2 in pregnant women that have
placental malaria that can not be detected by microscopy in the peripheral blood
[44].
Molecular methods
The application of molecular techniques circumvents the limitations of
conventional malaria diagnosis [45,46]. Polymerase Chain Reaction (PCR) based
assays are sensitive and can be converted to a quantitative format if SYBR green
or molecular probes (e.g. a Taqman probe or a molecular beacon) are used in
real time assays [47,48,49]. Other applications, such as the identification of drug
resistant strains [50], make these techniques very suitable for epidemiological
[51] and vaccine [52,53] studies as well. However, molecular techniques are not
routinely implemented in developing countries because of the complexity of these
test and the lack of resources to perform these tests adequately and on a routine
basis [54]. Major obstacles are the need for continuous supply of electricity and
complex apparatus like PCR machines. Furthermore, the analysis of the end
product (amplicons) involves the handling of labour intensive read-out systems
such as electrophoresis systems that use very toxic ethidium bromide stained
gels and hazardous UV light transilluminators. These read-out systems are
expensive and require well organised laboratories [55]. Nevertheless, many see
the potential of these highly sensitive techniques and therefore possibilities to
overcome the above mentioned limitations are explored [56]. Isothermal

19
reactions such as Loop-mediated isothermal amplification (LAMP) [57],
exponential amplification reaction (EXPAR) [58], or Nucleic Acid Sequence
Based Amplification (NASBA) [59] circumvent the use of expensive and
maintenance dependent thermocyclers and might be an alternative for PCR
methods [56]. This thesis describes the exploitation of one of these techniques;
NASBA, as a simpler but equally sensitive method for nucleic acid detection. It
also describes a first step towards a simplified detection method for nucleic acid
detection as an alternative to expensive real-time systems and/or ethidium
bromide stained gels; the Nucleic Acid Lateral Flow Immuno Assay (NALFIA).
Nucleic Acid Sequence Based Amplification
Nucleic acid sequence based amplification (NASBA) is a technology which uses
the activity of three enzymes (AMV-RT, RNase H and T7 RNA polymerase) for
the isothermal amplification of RNA molecules [54,59]. The low reaction
temperature (41 0C) and the addition of a T7 polymerase sequence on one of the
added primers ensures the amplification of only single stranded RNA [54,59]. The
reaction does not require a DNA denaturing step hereby preventing amplification
of genomic DNA in case of contamination. Therefore, NASBA can be performed
in a background of DNA in a sample and, in addition, allows easy detection of
stage specific expressed genes (e.g. Pfs25 for the specific detection of the
gametocyte stage of P. falciparum [60]). Moreover, with some technical
adaptations and appropriate controls, NASBA can be used in a quantitative
format to determine the number of infectious agents in a clinical sample [61]. The
technique has been successfully applied for the detection and quantification of
several infectious agents such as HIV-1 [62], Hepatitis viruses [63], respiratory
syncytial virus [64],� Leishmania spp [65], and dengue [66]. NASBA has also
proven its value in several areas of malaria research, because this highly specific
and sensitive technique also allows for quantification of very low parasite
densities [60,67]. These properties make NASBA a very effective tool for
epidemiological studies [68,69], monitoring of drug resistance [70] and the
analysis of parasite dynamics even at sub-microscopical level [68,69,71].

20
Furthermore, quantitative NASBA has proven to be very well suited to monitor
treatment efficacy in malaria [70,71] as well as other parasitic diseases, such as
leishmaniasis [72]. These assays have shown to be even more sensitive than
other molecular techniques such as PCR or RT-PCR [61,73]. Quantification of P.
falciparum in a sample using 18S ribosomal RNA (18S rRNA) as a target can still
be achieved with as little as 10 parasites/ ml of blood [61,67]. This thesis
describes two methods for the detection of the NASBA amplicons. The sensitive
but time consuming electrochemiluminescence (ECL) which detects the
amplicons after amplification (end-point detection) and the real-time quantitative
(real-time QT-NASBA) that can be achieved by adding a molecular beacon to the
sample which enables even faster results with less handling steps than the ECL-
NASBA and measures the amplicons during amplification. Although the
amplification itself can be performed in the field, the detection limits its
applicability and can only be performed in well equipped laboratories.
Nucleic Acid Lateral Flow Immuno Assay
Nucleic Acid Lateral Flow Immuno Assay (NALFIA) is a simple test format that
can be used for the visualization of nucleic acids after amplification [74-76]. This
simple read out system has been successfully applied for the detection of food-
borne pathogens such as Bacillus cereus and Salmonella [77]. This assay
combines the lateral flow assay, that is widely known for its serological
applications like the above mentioned RDT’s, with the detection of labeled
nucleic acid-amplification-products on a nitrocellulose stick (fig. 1.3). The
nitrocellulose is coated with specific antibodies that capture the amplicons which
are labeled with specific primers that contain a biotin molecule and a hapten. This
complex is detected by direct hybridization with a colloidal, avidine labeled
carbon particle and shows a product line if the sample is containing the product.
The combination of the proven successful methods of lateral flows assays and
molecular tools can overcome the need for expensive or laborious read out
systems when performing assays such as PCR [76,78]. In this thesis the
development and evaluation of a NALFIA for the detection of Plasmodium

21
amplicons after PCR is described and shows its potential to be used under field
conditions where laboratory facilities are limited.
Figure 1.3: Schematic representation of NALFIA During PCR the targeted template is labelled by two specifically labelled primers (e.g. with
digoxigenin and biotin). After amplification the product is incubated with colloidal, neutravidin
labelled carbon nano-particles. The nitrocellulose dipstick is coated with specific antibodies that
capture the Dig-label of the amplicons and with biotinylated goat-anti-mouse IgG that will capture
free carbon nanoparticles (control line). The amplification complex is detected by direct
interaction and shows a product line if the sample is containing the template. Carbon
nanoparticles not specifically captured will bind to the biotinylated Goat Anti-Mouse IgG at the
control line and check the assay performance. If no amplification took place or no template is
present than only the control line will be visible.
22
Aim and outline of this thesis
This thesis describes the development of several molecular tools for the
diagnosis of malaria and their applicability to monitor parasite dynamics when
parasites are being exposed in vivo to anti-malarial drugs. Chapter 2 explains
the laboratory development and evaluation of a NASBA assay that is able to
discriminate between the four different species of the malaria causing parasites.
Chapter 3 describes an additional NASBA assay specifically targeting the
gametocyte stages of Plasmodium vivax. In addition to the previously developed
18S and Pfs25 gametocyte specific P. falciparum NASBA, the development of
these NASBA assays complete the arsenal of NASBA tools for the diagnosis of
malaria.
The developed NASBA assays are not only applicable for diagnosis but can also
be used to predict treatment outcome (chapter 4). The 18S P. falciparum
NASBA was evaluated for its potential to predict treatment outcome at day 7 after
start of treatment. In routine clinical practice, with the use of microscopy
treatment failures can only be identified reliably at day 28 after start of treatment.
The results of this study indicated that NASBA could be used in predicting
treatment outcome and thus could possibly be used in treatment dynamics.
Another characteristic of NASBA is its capability to detect gametocytes at a level
well under the detection limit of microscopy. After treatment and clearance of
asexual parasites, gametocytes continue to circulate and they have a very large
impact on malaria control. It is important to assess the effect of drugs on the
development of gametocytes. The new ACTs are advocated as anti-malarial
drugs of choice for the treatment of P. falciparum infection at the moment and
they are reported as having effect on gametocytogenesis. Many pharmaceutical
companies are currently developing these drugs, submit new combinations for
registration and bring them on the market.
In chapter 5 NASBA was applied to evaluate parasite dynamics and presence
and production of gametocytes in a trial of two ACTs in Kenyan children with
uncomplicated P. falciparum malaria. The efficacy of both drugs was analyzed
and compared. Although the information gained by NASBA is very valuable for

23
the control of malaria and NASBA has the potential of being a tool for diagnosis
as well as for research in developed countries, the implementation of NASBA for
diagnosis of malaria in endemic countries is hampered due to the lack of
resources. Many claim that microscopy is the only reliable and feasible method in
resource poor settings and that other methods are not sensitive enough or have
no added value, whereas others argue that molecular tools should be used in
addition or even as single tool since they are the most sensitive detection
techniques currently available. Chapter 6 compares microscopy with RDT’s and
molecular diagnostic tools in an urban and rural setting in two endemic countries
i.e. Tanzania and Kenya. This study showed that microscopy and RDT’s are of
great value, but that there is a potential for molecular tools in the diagnosis of
malaria as well. However, the lack of simple techniques to perform the assays or
detect the results hinders implementation. Chapter 7 describes the first step
towards a simplified detection method, Nucleic Acid Lateral Flow Immuno Assay
(NALFIA), for the molecular diagnosis of malaria in endemic and resource pour
settings and shows the feasibility to perform NALFIA under difficult field
conditions. Although this test is still based on PCR the translation into a NASBA
based test can open the door to the wider use of molecular tools in developing
and malaria endemic regions.
References
�� ������ ����� ���������� ��� �������� ������ ������� ������ ����
�� ������������ !������� ����� ��"�#��$%�������!�
�
�� ���&'��%%%!�&�!(�(!��#��
�
)� "*������� $��%�+��� �,� $�!��������������������������������� �� ���!�
����-�.�-����!����/� �) )01!��
�
2� �34���������*�-��+��5���-��"��5�-��!������������������������������������
����������������(�!����2������16/01!�
�

24
� 7*���� �������89����#���������$:� �����������������!�"����������������
��� ��� �����"� ��� ��������� ������� �����"� ���� ������� �������� ������
�������"�����;�:���� #$���/�)0�/�/!�
�
/� 5�<���5:��+�3��-�����<�������$�����������=���>>������("��,�+�����(���
7��� %�-�$��?@��--����������-��������-(���.+�� ���� :!�%����&��������!����������
��������.�(��!����2� ��) 60;1�
�
;� ?-�� ��� 7*��� � � ���� ��-��� �� �������"� ���� ��� ������ ��� ������� ��
�������"�����;���(����>�?�-�$��6)0��2�
�
1� ������ ����� ����������%�� ������ '����� (����� ����� �� � ���2!�� "�#�
$%���������&!��/!�
�
6� $(�-�:�����,�.�!�%�������������������������������������������*���)���
/1�0/1 !��
�
��� +,<*�������<���+��?�9�,���������������%9-*��*������%����� ��$����7��
$���:��7��*���� ��3��+��"��%����5��������,��:!�*�����������������������������
+��������������������%��,��������������������"��5�:!����2�� #������
�
��� �*�8�+��������!��������+���5$�:!����;� $��2/;�06�
�
��� ���&'����<�&���!������<�A&���-�3��(����*��-��6�;�&�--!��3���
�
�)� 5�*(0��*#����:�-�������.�����/��������"�)���"����������������"/���������
��������������������:�+�$�(���!��61��$�� )�0/!��
�
�2� $��9-�"?�%�������������������������������������������������������/�:�
.�-��������� ��;;0�1�!�
�
� � �,��:�!�0���!���������������!�������������5$�:!����;� $��2/11061!�
�
�/� ��-���>�������������������������&�����������������������������������
�������1��������������������"�����)��*��� &�����-���>(��?�---�)��� )0 1!�
�

25
�;� $*��������:�� ���+��?*�,��$!�(�������������������������������-�������
���2�����+�������!������������3�!������������ �.��$���� ��6��
�
�1� $(����<��� ?�� �<�*��� $�� +�&�� �!� 3������ ����� ���� ���!�������� ������ ���
��������4�����������������������/!��*�������������� )0�/�!�
�
�6� �%9-���� 7��� 7�!� -�����������������������!� �4&���+#��������>(�����!�
���;!���21 06 !�
�
��� �9�������.�3���:��������!�-���+�����������������2������������������
������������������&����.�-����!��661�# �2�60))!�
�
��� "8��*&�����=-�������$��������7��+��������5,�<8������.��������"�������������
���������������������������������������$(���:���>(��?�-!����;��#�;�;0�)��
�
��� �����?�����"���-���� ����������������"���*������������������������&&!'�);02/�
�
�)� $���+��7��(������?#�-���!�%��������������������������������������������"�
�������������������������!����������������!����->*-����+#!���� !�)#���602�!�
�
�2� +>������ �,������� �����������3�B���"���-����� �����+�(������������������
������������������-������������������������������������*�������-��(-!����/�
�����)602;�
�
� � �����*�����,--�7����������"�����5�5�����������������6�������������
���� ��������"���� �������������������� ������������� �����"�����������
3��������&������������!����/!�))���20��!�
�
�/� "�*������� 9(��5���7<��*�����7�����"��� <��.�� 3<��,�$��5���:���7���-�5"��
"���*�� :��� B�� "!� 7������"� ��� 4��������� ���������� ������"��� �� �������
����������������������������+�����8�"�!��-���>�����:!����)�9��/�;0)2�
�
�;� ��#-� �.�� "��� ���� ������� ���� +�<���� .��� �3���� �.�� ?� $��#� �� -�"���������
����������4��������������������������������������������������2����������
:��,����-��,����:��������3��!���� �� �;;;06!�
�
26
�1� "�-���+�!�-����������������������&��������������������������������
�"�����������3���!��66;�)#��260 �!��
�
�6� :��-� ?�� �,�%���� :�� ���,� ��� 5����� �.� ��-������ ������� ����������
��������������������������������-����.�-��������;��)'2/102/6�
�
)�� ���,�" ��������3������������;���������:���"�3��������2��<;:3=�+���
>���!���������&�����<>%?=����������������������!�.�-��������!����;� /')�10��!�
�
)�� "*,�+����*�.��.��>����.�����������%������������������������������
����������������������������������������������!�����:!����;���16!�
�
)�� 5�3��?��������5+�� $3���,� :��� 7��������� 7<��$7��"*����+!� ������������
2��������� ����"� ����� <;:3=� ����"� ���� ���"����� ����� ������� <43(=� ����
�������������������:���33*��?�-!����)!�����;�01�!�
�
))� $(��������������������������������+����#�����5���<����"�� :*��*�<��,�"!�
0����������������,�����������"����������������!���������������������
�������������������������+���2�������������"����������"���3�:����&�����,�!�
����!����) 0/��
�
)2� ����,��!�(����������������������������� ��������� �������(��<����+#!� �����
)��//0;1!�
�
) � ��*(������������$���������5�-(�� ��$�&������"����������!�6"���������+����
��� �������"� ��� ��� 4���6���!?� ���� �� ��� �������� ��� 4��������� ����������
������!����$(�������!����2�)����1�01�
�
)/� ���������5���93&�5��������3-�����+�--�*%��:��7��,�=:��7���-(�3������������*�
��� ���,� "�!� ?��� ���� ���������"� ���������� ��������� ��� ��� ����� �������
������������������-�+�$�(����&�����,�!������#��� 10/ �
�
);� .��������#�-��5���,����?��7�������������4������������������������!
���������� �����������������������+�����������:��������(��<���!��66�� #��/�60)2�
�

27
)1� ?�����&�����?-9����=��.����#���&��,�����$�--����?��$��3*��7�������#��(��
7���%����.���.���-*�����*3�.�� $3���,3������������:��?,��.!� ��������������������
������������������������������������������� �������4�'(4 !� .��$���!� ��� �
���2�
�
)6� ��&9��-����73<�����73,��+��$��9�$"��?��-,�"��+�-�����.:!�3���������
���'(4 !������.0'!�����������������������������������+�������������������+!
�����8������1�5��������3�:����&�����,�!����;�$����6�0;!�
�
2�� �C<��:�� 7������������.+�4������������������������4�������������������
��������������������������!������"�+������������������#��4&����5���!� ���)�
��)��) 021�
�
2�� +*<��� :��� 5*���-���� $*<���-���� 5C*������ .*��� $�� 5����� -� .�����������
�������"���������"���������������������������������������������������
����43(!�����������������������:��������(��<���!�������#��;)/0;�
�
2�� #�����5��9��������� ��"������������������5���3��.����*��������"*��3���:.!�
�����������������������������������������4����������������4����������������
3���������3�:����&�����,�!����/�$�����60� �
�
2)� ��-���*3����7���������*�93�����7��3�����9���$���*(-������9��$!�5��
�������������������������������������������"������������������������������
����,���2���.*<��(�����!����/�) ��2220;!�
�
22� �9�+���?8�93�++���<*�+���9�+:�����9��:�����9�*�+������*�$��$3�"��D��*�
B�� ������ ��� .��� ��� �,���� ?�!�0������ ��� ��� 4��������� ���������� ������
�����!���� ������ � �� ������ ��� �������� +����� ���������� ���� ���������
�����������������:��������(��<���!��666��$��66�0/!�
�
2 � $��*��*� "� (���1� ������ ���� ����� ��������� �������� ��� �������� ��
��������"�������+�"����@��*�*����(��<���!����;� �2;;01�!�
�
2/� ��-(�������"��<*-(���.!�'�+���������43(�����������������������@�����-�
.�-����!������)9�)6 01�
�

28
2;� 5����$��+�>���0���%��������!�(��!���2���������43(�������������"������-�
.�-����!������)9�));02�!�
�
21� .�����������(��������������.�((����"��"�������+�((��������(��������(�������
����$��*��*�"��?������"���������!�0����������������!���43(�����"������������
��� 4��������� ���������1� 4��������� ����1� ���� 4��������� ����� ���� ������
��������������!�:��������(��<���!����2�� ����206!�
�
26� +�*�3�������=��$������$����+�������9-����.��5����:��:����7!�0��������������
4��������� ����� �� ������ ����� ������� �"� )96� �(A-� ��� ������!����� ����
����!���������!���43(�����"�!�:��������(��<���!����2�� � /)/02)�
�
�� ���-���>�� ���� �-���(9� $+� �������"� ��� ����!�������� ������!� ��(��
��>(��?�-!������ ���60�1!�
�
�� $����� 5!� ��������� ������� ���� �������� ���� ����������� ������ ���
���������������!�����:�.�-����!��66;!� $���) 02 !����-��(��������.�(9��������
�
�� ��������"�����5��$3���������������5(9��.!����������������������������
�����������������-�.�-����!����)!�)#�/�0)!�
�
)� ����%-��������-��+����<-���?��?*�(���$��������+���58���.���*��0���9����
5��-��� "�� $���-��� ��� ����� �=�� "��<��� $�!�;��������� ���!��� ���"����� �����
������������������������������������������������������������������3�:����&�
����,�!���� �$���6�01!�
�
2� ����(�3<�?���%�����+��E�������$!� �661�-����������������������0A-!�����
������������*����� &�����-����5���(������,�#1�/��0/�1!�
�
� ����B���.��(�&�"���.�-����?��������������������������������������������
��3!��66;�2)'����0)1!2���
�
/� =���--�:��=���--��7��"�-�?:!�7��������������������������������������
��������������.��(������(��$(����$��!����)�)���2 �206�
�

29
;� �9�����7�������$#��+��$9�����7-���(�����:��B�-���������3���!�0���������
"���+�������������������"�����!��������������������������<.-�4=��:�=�����
�����-!����/!�)���� �0/�
�
1� �����������:����*,��?��D����B����%���5��=���--��7��59��$���"�-�?:����3���!�
7��������� 0A-� ����������� ������� +��� 0A-� ��������!����� ����������
��������������3!���� !�$$�;61206��
�
6� ��3&����:�A����������2���!�������������������*�!��66������6�0�!�
�
/�� $(������ .�� $(����� "�� $(������ ��� =���� ?�� ����� ?�� ������ ��� $*�%��� +!�
;����������� ��� 4��������� ���������� ������"��� �� ��������� ������ ���
����������"�2��������������������2���!���������������������5��(�3�
.�-����!����2�)�$�) 02��
�
/�� $(������.�������-���� $(�����"�� $(��������� $���9�-�.����3-��+�� $*�%���+!�
(��!������������� �2���!��������������������������������������!
���43(�����2��������������4��������������������:��������(��<���!���� ����2��0 �
�
/�� �,�����5���.��"�*�-3���:��7��&�*�-��������*�����?�����0D�-3��������,�?���<<�
�������-�*�B��.���9�-�"!�6�����������������"�����'7B!)�����"��3��� ����������
��!�����A-6:-��������������������"���������������+������������3�����
3/��:�=����������-!���� �)�����06�
�
/)� �<���0"����7����0$�99�,�����7����$���$��������B�-��=����������*�(������
�!� (��!��� ������ ���� �2���!����� ����������� ����"� ���� ������� ���
�������-�����!��&&����#�������(��<���!���� ��$)�;��)0/�
�
/2� ?�3��5�� $(���#��������������-�3������?��#��������.�(������������"�
������2�����������!�������"�����������������������"��"��"���������-�����
:������A-6:-����������������������������"!�:�=����������-!����;�C�����
�
/ � #�������������$(�����":���<���+��D����:�����=��-��:�� �<��B����������
+�������������7--�����$(�������?!�;��������������������2���!���������"������
�+������������������������������2��������������.������������������&��
����"���������:��������(��<���!���� ���� /�0/!�

30
//� �*�3��$��$*%��9������$*%��(�������$�3<����.��.�&��������!�-�����"����
�������������������-�����"�������-�������������������!����������
�� ��� ������ ��� %������� ����� ������ ���� �2���� ����� ����������� ����"��
$�*��-���-���:����&����.*<��(�����!����;��9�2210 2!�
�
/;� $(�����":�� -93����7���������$(�������?�� 3��$��0����������2�����������
���4���������������������������������������2��������������������2���!
�����������������:��������(��<���!�������9'2�;�0 !�
�
/1� $�9����$���5�*-3�:���7*���77���*-�����.���-�9������������-��+���%9�����
$�� ��-�� ���� $*�%��� +��� ?�9�,� �:!� 6������������ 4��������� ����������
������"�� ������� �� ������� �� ��� ���� ��� ��+� ���� �������� ����������� ��
%��,��������&������������!����;�) � 2;0 )�
�
/6� $(������.��5�*-3� :���"�*������� �����$��#����=��05��3����� 3��$���
$*�%��� +�!� 6������������ 4��������� ���������� ������"�� ������
��2����"������������2�������������3�:����&�����,�!����;�$��2;�02!�
�
;�� 3��$�����-�.���$(�����":��B*-*>�����%����:��7���*�$�� 3��"���$(�������?!�
4��������� ����������� ��������� ��� �� 2��������� ������ ���� �2���!�����
���������������"��������������������������������!�"����������������
������������������������4&�.�-����!���� �))��;)06!
�
;�� $(������ .�� 5�*-3� ��� 3�� $�� "�*��� ��� $%� .�� $(������ ��� $*�%��� +!�
F6��=����������4�������������������������"�������8�"���������������
�������� +��� ����������!�"�������� ���������"� ��� �� ���������� +���
��������!�����:�.�-����!����/!����2�)01!��
�
;�� �� =��-� .:�� #�� ��� ���� ���� "��>���� ���� $(������ �?�� ?����� �:�� �<�� �+!�
;�����������������������������������������������������������������"�
;%!A-6:-�����-�+�$�(����&�����,�!����/!�)��'��1)0/�
�
;)� 5���3� .�� ����-��-�� .+�� $*%��*-9� +�� .��(� +��� +*--��� 5�� �90����� �!�
3��������� ��� ���� ��������� ������� ���� ��� ������� ���� �������� ���
4������������������4������������������������:!����;!��'��2�
�

31
;2� �����?:����,�+5!�.���������+���������"����������������������������������
�������������������������,������������+��������������"���*(��(��(��-�+-!�
���;G�������;!�
�
; � ���-�8�-�.��D*���%�89����5���9�������$��������������<��+$����9��!�5�������!
����������������������������������!���+�����"���������� ����������������
�2������ �� ����1� ������ 0A-� ���� ��� ����"� ������ ������������� �"�� )��
���������������3!�������$��11 06)!�
�
;/� "�� ��� ��� H�� D��� ��� .��� �!� (���� ��������� ������� ����"�� �� �����
����������������������������������������������?������(��<������>(��?�-!����;�
(�������&�--�
�
;;� �3������ #�� ��� 7��-� �!� 6���� ���� ����� �������� ������ ���� 0A-�
��������������������������������������+��������������������������������
7���(���������������������������������������������������������>�!���-!��!�
#���3�������?!�5�*������!��*%�-�����������(�3�(�.*<��-��-��������������
�������-����� ��$5�'�6�;/661 )���&�-��� 0��/�
�
;1� 5�����#�(�:��7��-����$���������*��-������8-����������9�?��#���3���������
?�9-�"!�(��������������������������!��"���������+��&����������+�����
����������+����������"��:������,�������33*���!����/!�))9��� ;0/)�

32

33
����������
�
�
�
�
Detection and identification of human Plasmodium
species with real-time quantitative nucleic acid
sequence-based amplification
4�?�����)1 1�>�C��6�����)1�4�-��8��� �����'�0�?�'��6������)����7����9��89���-���**��#���������&��F7��I�+�,�����&�(����-���*���7���5��3��(��+-�(������(�3�(����(��������?�#�-�����>���>(���*-�?�---�����&�(�����(��������?$���
�������C������� ���1���9��

34
Summary
Decisions concerning malaria treatment depend on species identification causing
disease. Microscopy is most frequently used, but at low parasitaemia (<20
parasites/�l) the technique becomes less sensitive and time consuming. Rapid
diagnostic tests based on Plasmodium antigen detection do often not allow for
species discrimination as microscopy does, but also become insensitive at <100
parasites/�l.
This paper reports the development of a sensitive and specific real-time
Quantitative Nucleic Acid Sequence Based Amplification (real-time QT-NASBA)
assays, based on the small subunit 18S rRNA gene, to identify the four human
Plasmodium species.
The lower detection limit of the assay is 100 – 1000 molecules in vitro RNA for all
species, which corresponds to 0.01 – 0.1 parasite per diagnostic sample (i.e. 50
�l of processed blood). The real-time QT-NASBA was further evaluated using 79
clinical samples from malaria patients: i.e. 11 Plasmodium. falciparum, 37
Plasmodium vivax, seven Plasmodium malariae, four Plasmodium ovale and 20
mixed infections. The initial diagnosis of 69 out of the 79 samples was confirmed
with the developed real-time QT-NASBA. Re-analysis of seven available original
slides resolved five mismatches. Three of those were initially identified as P.
malariae mono-infection, but after rereading the slides P. falciparum was found,
confirming the real-time QT-NASBA result. The other two slides were of poor
quality not allowing true species identification. The remaining five discordant
results could not be explained by microscopy, but may be due to extreme low
numbers of parasites present in the samples. In addition, 12 Plasmodium berghei
isolates from mice and 20 blood samples from healthy donors did not show any
reaction in the assay.
Real-time QT-NASBA is a very sensitive and specific technique with a detection
limit of 0.1 Plasmodium parasite per diagnostic sample (50 �l of blood) and can
be used for the detection, identification and quantitative measurement of low
parasitaemia of Plasmodium species, thus making it an effective tool for
diagnostic purposes and useful for epidemiological and drug studies.

35
Introduction
Malaria is one of the leading infectious diseases in the world, with 300–500
million clinical cases and 1–3 million deaths each year [1]. Traditionally diagnosis
of malaria is based on microscopic detection of Plasmodium parasites in Giemsa-
stained blood slides. In recent decades, antigen detection assays and molecular
detection assays were introduced as alternatives to microscopy [2]. Antigen
detection assays are mainly aimed at the identification of Plasmodium falciparum.
Only very few assays are able to identify infections caused by other human
Plasmodium species [2,3]. Furthermore, the sensitivity and specificity of these
tests is low and parasite quantification is not possible [3,4]. The application of
molecular techniques circumvents the limitations of conventional malaria
diagnosis. PCR based assays are sensitive and can be converted to a
quantitative format if SYBR green or molecular probes (e.g. a Taqman probe or a
molecular beacon) are used in real time assays [5-7]. Alternatively, Real-time
Quantitative Nucleic Acid Sequence Based Amplification (real-time QT-NASBA)
technology can be applied, which has some advantages above real-time PCR
assays. The real-time QT-NASBA assay is simple and fast compared to real-time
PCR assays that can take up to four hours compared to 60 minutes in the case of
NASBA [8,9]. Furthermore, real-time QT-NASBA detects ribosomal RNA of which
more copies are present per genome in a parasite than the corresponding DNA
on which PCR is based. This makes NASBA a very sensitive diagnostic assay.
Moreover, NASBA is based on an isothermal reaction at 41 degrees that does
not require a DNA denaturing step hereby preventing amplification of genomic
DNA in case of contamination [8]. Real-time QT-NASBA, using a molecular
beacon as detection probe, has been developed for P. falciparum and has shown
to be very sensitive with a detection limit of 20 parasites/ml [9]. Detection of the
other parasites causing human malaria, i.e. Plasmodium vivax, Plasmodium
malariae and Plasmodium ovale, is of clinical importance in order to decide on
appropriate treatment. This paper describes the development of a real-time
QTNASBA for the detection, identification and quantification of these
Plasmodium species.

36
Materials and Methods
Primer/probe selection and in vitro RNA production
Generic Plasmodium forward (5’-TCAGATACCGTCGTAATCTTA-3’) and reverse
(5, - TTCGCGCAAGCAGAAAGTT-3’) primers were used to amplify a 180 bp
region of P. vivax, P. ovale and P. malariae 18S rRNA gene by PCR as
previously described [10]. The amplified fragments were cloned into plasmid
pCR2 in Escherichia coli INValphaF (Invitrogen, Carlsbad, California USA). Next,
in vitro RNA was produced with the transcription kit SP6/T7 (Roche, Mannheim,
Germany) and the cloned fragment was sequenced (Base Clear, Leiden, The
Netherlands). Production of P. falciparum 18S rRNA based in vitro RNA was
performed previously [10]. Primers were selected on the basis of the DNA
sequences of the three species (Figure 2.1). Homology of these sequences with
published sequences and specificity of primers was analysed with the BLAST
database for homology search [15]. The NASBA forward primers were chosen
on their specificity for the targeted species. P. falciparum:
5’GTCATCTTTCGACGTGACTT-3’; P. vivax: 5’-TTTCTCTTCGGAGTTTATTC-3’;
P. ovale: 5’-CGACATTGTCATTCCATTTAC-3’; P. malariae: 5’-
GAGTGTTTCTTTTAGATAGC-3’. A T7 promotor sequence was added to the
generic Plasmodium NASBA reverse primer; 5’-
AATTCTAATACGACTCACTATAGGGAGAAGGAACTTTCTCGCTTGCGCGAA-
3’. The published pf18S molecular beacon 5’- 6-carboxyfluorescein-
CGATCGGAGAAATCAAAGTCTTTGGGCGATCG-dimethylaminoazosulfonic
acid-3’ was used as a detection probe [9].
The molecular work was performed under permit 02-080 granted on 22 February
2002 to KIT Biomedical Research by the Netherlands Ministry for Spatial
Planning, Housing and the Environment.
Real-time – QT-NASBA
Real-time QT-NASBA for 18S rRNA of all four Plasmodium species was
performed on an IQ5 Real-Time analyser (Bio-RAD). The reactions were
performed with the Nuclisens Basic kit for amplification (BioMerieux) according to
37
the manufacturers instructions with a KCl concentration of 80 mM for P.
falciparum, P. vivax and P. malariae and 70 mM for P. ovale. The reaction
mixture (5 µl) containing the primers (100 pmol/µl) molecular beacon (20 µM) and
template RNA (2.5 µl) was incubated at 65 0C for two minutes followed by two
minutes at 41 0C. Thereafter, 2.5 µl enzyme mixture from the basic kit was added
to each reaction. Amplification was monitored for 60 minutes after which the
results were analysed. A sample containing only water and reaction mixture was
used as blank and served as control for background fluorescence. The signal
produced by the blank samples is automatically subtracted from the analytical
samples (Bio-RAD IQ5 software v. 1.0). In order to quantify the number of
parasites in a clinical sample, a 10 fold serial dilution of 109 to 102 molecules of in
vitro RNA per amplification reaction of each respective Plasmodium species was
run in triplicate in each test, wherein 104 molecules corresponds to one
Plasmodium parasite [10].
Clinical samples
Blood samples for validation (n=79) were obtained from patients diagnosed with
malaria by detection and differentiation of Plasmodium parasites in Giemsa-
stained slides with standard microscopy according to WHO recommendations
[11] or PCR methods as established in the contributing medical centres. The
samples were collected from returned travellers with clinical symptoms visiting
the out patient clinic of the University Medical Centre Leiden (The Netherlands)
and the Academic Medical Centre Amsterdam (The Netherlands) and from
ongoing field studies in Vietnam, Turkey and Kenya (Table 2.1). The samples
were tested blinded from the diagnostic results. Specificity of the assays was
tested against in vitro RNA of the four Plasmodium species and RNA isolated
from Plasmodium berghei isolates (12 samples). Furthermore 20 samples from
Dutch healthy blood donors were tested as negative controls. Blood samples (50
µl) were mixed with 950 µl guanidium isothiocyanate lysis buffer and RNA was
isolated as described previously [12].

38
Statistical analysis of test performance
Microscopy performed at initial diagnosis was considered as the golden standard
for this purpose and all NASBA results were compared to these results. The
agreement between microscopy and the real-time QT-NASBA assay was
determined by calculating Kappa values with a 95% confidence interval (Altman,
1991). Kappa values express the agreement beyond chance and a kappa value
of 0.21-0.60 is a moderate, a kappa value of 0.61-0.80 a good and kappa > 0.80
an almost perfect agreement beyond chance.
Table 2.1: Overview of sample origin
a. Royal Tropical Institute, Amsterdam, The Netherlands, b. Leiden Iniversity Medical Centre, Leiden, The
Netherlands , c. Ege University Medical School, Izmir, Turkey, d. Radboud University, Nijmegen, The
Netherlands, e. Academic Medical Centre, Amsterdam, The Netherlands.
Species microscopy Origin of samples
P. falciparum 11 Kenya (KITa)
P. vivax 37 8 LUMCb, 24 Turkey (Izmirc), 5 Vietnam (KIT)
P. malariae 7 2 Kenya (KIT) 4 Kenya (Nijmegend)
P. ovale 4 3 LUMC 1 AMCe
Mixed infection 20 Kenya (Nijmegend)
P. berghei 12 LUMC (mouse isolate)

39
Figure 2.1:rRNA
Alignment of sequenced 18S rRNA gene. Forward primers used in the different assays are shown in italics. Beacon and reverse primers are
shown in bold.
P. VIVAX: TCAGATACCGTCGTAATCTTAACCATAAACTATGCCGACTAGGCTTTGGATGAAAGATTTTAA
P. OVALE: TCAGATACCGTCGTAATCTTAACCATAAACTATGCCAACTATGTTTTGGATGTATGAGAAAAA
P. MALARIAE: TCAGATACCGTCGTAATCTTAACCATAAACTATGCCGACTAGGTGTTGGATGATAGAGTAAAA
P. VIVAX AATAAGA ATTTTCTCTTCGGAGTTTATTC .TTAGATT GCTTCCTTTAGTG
P. OVALE: GATGGAA TACTTTGTTTTACGACATTGTCATTCCATTTAC GCTTCATTCAGTA
P. MALARIAE: AATAAAA GAGACATTCATATATATGAGTGTTTCTT TTAGATA GCTTCCTTCAGTA
P. VIVAX: CCTTATGAGAAATCAAAGTCTTTG GGTTCTGGGGCGAGTATTCGCGCAAGCAGAAAGTT
P. OVALE: CCTTATGAGAAATCAAAGTCTTTG GGTTCTGGGGCGAGTATTCGCGCAAGCAGAAAGTT
P. MALARIAE: CCTTATGAGAAATCAAAGTCTTTG GGTTCTGGGGCGAGTATTCGCGCAAGCAGAAAGTT

40
Results
Analytical performance of the assay
The lower detection limit of the developed assay as determined by analysing
serial dilutions of in vitro RNA of P. vivax, P. ovale or P. malariae, respectively,
was 100 – 1,000 molecules of in vitro RNA for each species, corresponding to
0.1 – 0.01 parasite per diagnostic sample (i.e. 50 µl of processed blood) (Figure
2.2, 2.3 and 2.4). No cross-hybridisation of the primers with the in vitro RNA of
the other species and none with P. berghei RNA isolated from mice (n=12) was
observed. Blood samples form healthy donors (n = 20) showed no reaction in any
of the assays.
Figure 2.2: Standard curves of the P. malariae assay. The NASBA assay with P. malariae in
vitro RNA using the P. malariae specific forward and generic revere primer and beacon. R2 =
0,972.

41
Figure 2.3 Standard curves of the P. vivax assay. The NASBA assay with P. vivax in vitro RNA
using the P.vivax specific forward and generic revere primer and beacon wit an R2 = 0,992
Figure 2.4 Standard curves of the P. ovale assay. A NASBA assay with P. ovale in vitro RNA
using the P. ovale specific forward and generic revere primer and beacon. R2 = 0,993.

42
Clinical performance of the assay
The developed real-time QT-NASBA was further evaluated using 79 clinical
samples (Table 2.2). Real-time QT-NASBA confirmed the initial diagnosis with
microscopy of 69 out of the 79 clinical samples. The 37 P. vivax samples were
found to be P. vivax with microscopy as well as with NASBA. However, one
clinical sample gave an additional weak P. ovale signal with the real-time QT-
NASBA. The four P. ovale samples were identified as such by real-time QT-
NASBA. However, one sample gave a weak additional P. vivax signal. Two of the
seven P. malariae mono-infections were found negative by NASBA. Furthermore,
three of the seven P. malariae mono-infections were identified with real-time QT-
NASBA as a P. falciparum/P. malariae mixed infection. Only 11 P. falciparum
samples were analysed with real-time QT-NASBA in the present study, as a
thorough analysis of this species has already been done [9]. The microscopical
diagnosis P. falciparum of the clinical samples tested in the present study was
confirmed by NASBA. Of the 20 P. falciparum/P. malariae mixed infections, 19
were identified as a mixed infection with NASBA: 17 being a mixed infection of P.
falciparum/P.malariae and two samples gave a weak P. vivax reaction instead of
P. malariae. One sample was identified with real-time QT-NASBA as a P.
falciparum mono-infection. Of the 10 discordant results, seven samples were re-
analysed by re-reading the blood slides by an expert microscopist who was
blinded from the original microscopy and NASBA results. There were no back-up
slides or PCR samples available from the other three discordant results. The
microscopic re-analysis resolved five discordant results. In the three P. malariae
mono-infections that were identified as a mixed infection by real-time QT-
NASBA, a very low number of P. falciparum was found after re-reading the
slides. In the two slides which were initially diagnosed by microscopy as being P.
falciparum/P. malariae mixed infections, but with real-time QT-NASBA as being a
P. falciparum/P. vivax mixed infection, the results of re-reading the blood slides
were inconclusive for the presence of P. malariae and/or other Plasmodium
species.

43
Table 2.2: Positive Plasmodium samples
The table gives an overview of the positive results of the 99 Plasmodium samples analyzed with
microscopy and NASBA.
Statistical analysis
A high degree of agreement was observed between the real-time QT-NASBA
assay and microscopy in the present study. A kappa value of 0.926 (95% CI
0.872-0.967) indicates a very good agreement beyond change.
Discussion
The aim of the present study was to develop a real-time QT-NASBA for the
detection of all four human Plasmodium species. Based on the analytical
evaluation of the developed test, it was concluded that the sensitivity of the
developed tests is 0.1 to 0.01 parasites per diagnostic sample. This is
comparable to the previously developed NASBA for P. falciparum [9] and
approximately 50 times more sensitive than standard microscopy [2]. The
Species Microscopy NASBA Pf NASBA Pv NASBA Po NASBA Pm
P. falciparum 11 11 0 0 0
P. vivax 37 0 37 1 0
P. malariae 7 3 0 0 5
P. ovale 4 0 1 4 0
Mixed infection 20 20 2 0 17
P. berghei 12 0 0 0 0

44
developed molecular assays identified in 69 out of 79 samples the same species
as the initial microscopy diagnosis. After re-checking the slides, the molecular
diagnosis appeared to be correct in three discordant cases, leaving five results
unresolved. The apparent discrepancy between the two diagnostic tests may be
due to a very low number of parasites in the sample below the detection limit of
microscopy, but still detectable with real-time QT-NASBA. The fact that in one
sample no signal was obtained with real-time QT-NASBA could be due to
degradation of the RNA or extraction failure. Unfortunately there was no backup
sample available to repeat the extraction and analysis. In principal, quantification
of parasites is possible with real-time QT-NASBA, but comparison with
microscopic data from the clinical samples was not possible since parasite
counts from the slides were not available. A parasite in vitro culture was also not
available for P. vivax, P. ovale and P. malariae, making it difficult to make exact
calculations. The parasite calculations used in the present study are based on
the number of in vitro RNA molecules, which correlates to the number P.
falciparum parasites [10]. It is assumed that these quantities are comparable to
the other species. In general there is little clinical relevance for quantification of
the P. ovale, P. malariae and P. vivax since the patients normally have < 2 %
parasitaemia [13] and treatment is given on basis of the infecting species and not
on parasitaemia. In contrast, the parasitaemia in P. falciparum infection is an
important factor for treatment regimen and monitoring of treatment efficacy. It has
been shown that QT-NASBA is a valuable tool for assessing the parasite
dynamics in studies where drug efficacy is monitored or drug combinations are
compared [10,14]. The submicroscopic detection limit of the NASBA technique
offers the possibility to monitor even small differences that are otherwise not
noticed by microscopy and may even be a predictor for treatment failure [14].
Conclusion
The developed real-time QT-NASBA for the detection of all four human
Plasmodium species based on the 18S rRNA gene of Plasmodium showed to be

45
a very sensitive and specific technique with a detection limit of 0.1 parasites per
diagnostic sample. The assay can be used for the detection, identification and
quantitative measurement of all human Plasmodium species even at low parasite
levels, thus making it an effective tool for diagnostic purposes and useful for
epidemiological and drug studies.
Acknowledgements
This work received financial support from the Knowledge and Innovation Fund of
the Koninklijk Instituut voor de Tropen (KIT)/ Royal Tropical Institute (Amsterdam,
The Netherlands). We thank Dr. J Verweij of the Leiden University Medical
Centre (Leiden, The Netherlands), Dep. of Medical Microbiology (Radboud
University, Nijmegen, The Netherlands) and Yusuf Özbel of the Ege University
Medical School (Izmir, Turkey) for providing us with clinical samples, which were
used in the validation of this study. We also thank Dr. C. Janse of the Leiden
University Medical Centre (Leiden, The Netherlands) for providing us with the P.
berghei samples and Nel Kroon for carefully re-reading the slides.
�
References
�� ����������� ����-����� F�66�I��� ��?$�+5������!�2!��������0�������A+�
4�������D��� ���������!��6�0�� !�5-�(�3����3�(��-(�&,�J�&�������� ��"�#��
$%�������!�
�
�� �9�������.�3���:��������'�-���+�����������������2������������������
������������������&����.�-������661��# �2�602))!�
�
)� ����,�-��(������������������������������������!��������(��<����+#!� ������
)��//0;1�
�
2� ��3�:�����$���������������+���7����'�0�������������������������
�������������������"�43(������������+�����������"�����+���4���6���!?�����
73%��������4����������������������������:��������(��<���!��666���$'���/60��;)�
�

46
� .�����������(��������������.�((����"��"�������+�((��������(��������(�������
����$��*��*�"��?������"���������'�0����������������!���43(�����"������������
��� 4��������� ���������1� 4��������� ����1� ���� 4��������� ����� ���� ������
���������������:��������(��<���!����2��� ����20���6��
�
/� +�*�3�������=��$������ $����+��������9-����.��5���� :�� :����7��0���������
?����4�����������������������������������"�)96��(A-����������!���������
6���!6�����(��!%��43(�-���"�!�:��������(��<���!����2��� � /)/0 /2)�
�
;� ����%-��������-��+����<-���?��?*�(���$��������+���58���.���*��0���9����
5��-��� "�� $���-��� ��� ����� �=�� "��<��� $�'�;��������� ���!��� ���"����� �����
������������������������������������������������������������������3�:����&�
����,�!���� ��$���6�0�61�
�
1� ����-�����,���������?K�-�������-��:��?<#��:'�0����������������!���
A-6:-�����"������������������3���"��������EE�������!� :���(��<���������-!����
&�--!�
�
6� $(������.�������-���� $(�����"�� $(��������� $���9�-�.����3-��+�� $*�%���+'�
(��!��������������2���!�����������������������������������(��!
%��43(�����2��������������4������������������!� :!��������(��<���!���� �����2��0
2� �
�
��� $(����� ":�� -93� ��� 7����� ����� $(������ �?���� 3�� $�'� 0������ ����
2��������������4���������������������������������������2���������������
�����2���������������������:��������(��<�����������9�2�;�02�; �
�
��� ������ ����� ���������� ��� �������� ������ ������� ������ ����
�� ������������ !������� ����� ��"�#��$%�������!�
�
��� 5��3�+��$����:��$��3�-�����:�-�����������30#��?�����.���=�����������:'�
(����������������������������������������������!�:��������(��<���!��66��� 9�26 0
�)�
�
�)� "���-�����������?�'����5�*(0��%��K-� �--�������������,�������������!� �������'�
�������&*<��-��-G��66)'�;�
47
�2� 3��$�����-�.���$(�����":��B*-*>�����%����:��7���*�$�� 3��"���$(�������?��'�
4��������� ����������� ��������� ��� �� 2��������� ������ ���� �2���!�����
���������������"��������������������������������!�"����������������
���������������������!��4&�.�-����!���� ��))��;)0;6!�
�
� � ��5��5��$����3����,�-�(�!�L���&'��%%%!�(<�!�3�!���!��#�5��$�M!�

48
�

49
����������
�
�
�
�
�Development of a Pvs25 based real-time QT-NASBA for
the sexual stage of Plasmodium vivax
�
�
���:���&��)1�4�?����� 1�1�(��'����)1�'�0�?�'��6������ �����(����
6���+�)�
���+�<�*�����#�-��,����(���������83���?&��3����>����(����(��<�����,���7����9��89���-���**��#���������&��F7��I�+�,�����&�(����-���*���7���5��3��(��+-�(���)��(�3�(����(��������?�#�-�����>���>(���*-�?�---�����&�(�����(��������?$��
6���������������������

50
Summary
P. vivax is the predominant malaria species outside Africa, where it accounts for
over half of all clinical cases. Parasitaemia in P. vivax infections is generally low.
Recently, a 18S real-time QT-NASBA has been developed for detection and
quantification of sub-microscopic P. vivax parasitaemia. Availability of a similar
sensitive test for P. vivax gametocytes would facilitate studies on P. vivax
gametocytaemia and transmission.
Here, we describe the development of a quantitative real-time QT-NASBA assay
P. vivax gametocytes based on mRNA encoding the PvS25 surface protein. The
detection limit of the assay is 100 copies PvS25 in vitro RNA/µl, which accounts
for 25 gametocytes/ml. The PvS25 real-time QT-NASBA is highly reproducible
with an inter-assay variation of < 10% (SD/mean). Clinical performance of the
assay was tested in 104 samples from malaria patients: 74 P. vivax, 8 P.
falciparum, 5 P. malariae, 4 P. ovale and 13 mixed infections, all of which were
confirmed by species specific 18S real-time QT-NASBA. All non-vivax
Plasmodium samples were negative, while 51 out of 74 P. vivax infections were
found positive by PvS25 QT-NASBA suggesting the absence of gametocytes in
23 out of 71 blood samples.
In conclusion, the PvS25 real-time QT-NASBA assay is a sensitive and specific
technique that can be used for detection and quantification of P. vivax
gametocytes in epidemiological and clinical intervention studies.
51
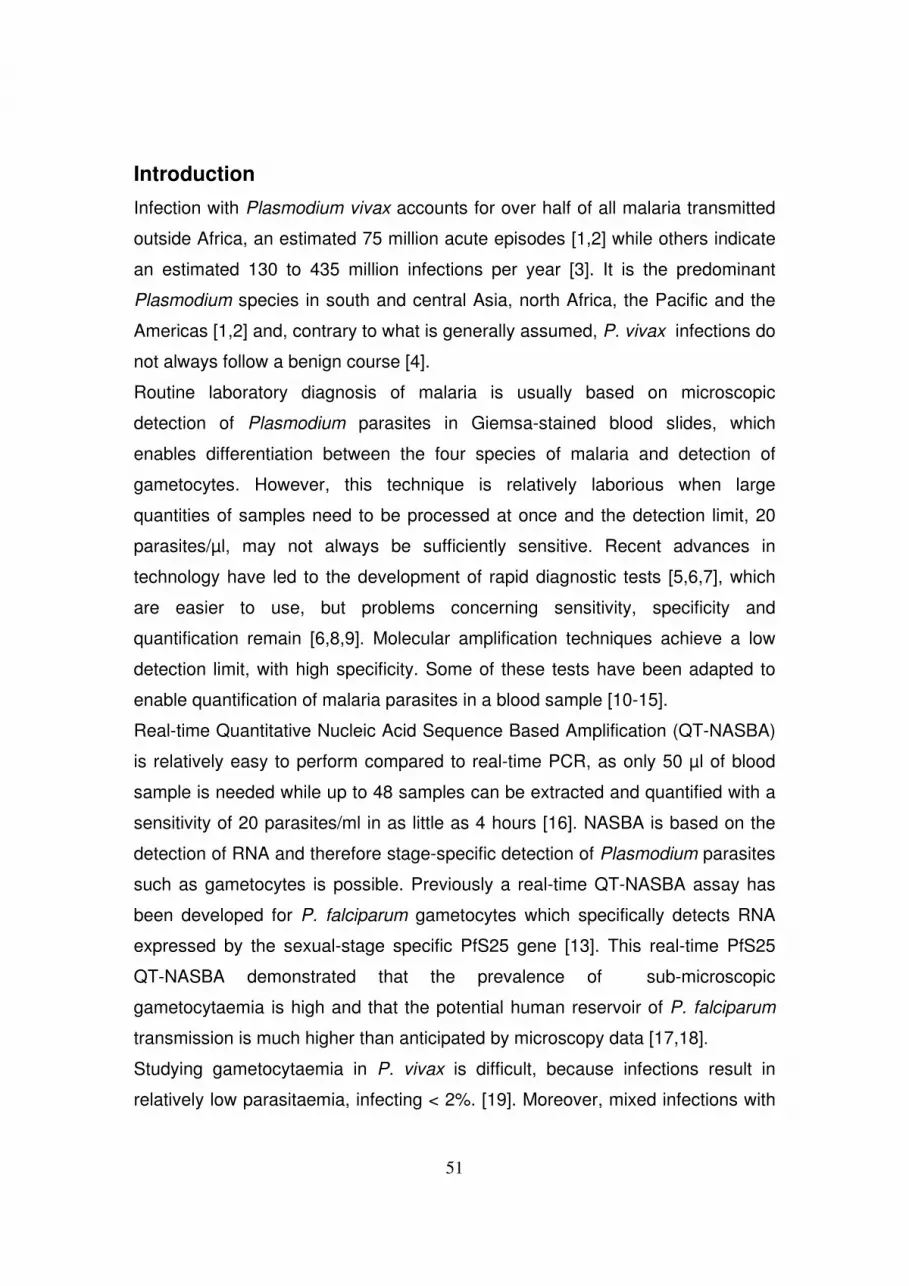
Introduction
Infection with Plasmodium vivax accounts for over half of all malaria transmitted
outside Africa, an estimated 75 million acute episodes [1,2] while others indicate
an estimated 130 to 435 million infections per year [3]. It is the predominant
Plasmodium species in south and central Asia, north Africa, the Pacific and the
Americas [1,2] and, contrary to what is generally assumed, P. vivax infections do
not always follow a benign course [4].
Routine laboratory diagnosis of malaria is usually based on microscopic
detection of Plasmodium parasites in Giemsa-stained blood slides, which
enables differentiation between the four species of malaria and detection of
gametocytes. However, this technique is relatively laborious when large
quantities of samples need to be processed at once and the detection limit, 20
parasites/µl, may not always be sufficiently sensitive. Recent advances in
technology have led to the development of rapid diagnostic tests [5,6,7], which
are easier to use, but problems concerning sensitivity, specificity and
quantification remain [6,8,9]. Molecular amplification techniques achieve a low
detection limit, with high specificity. Some of these tests have been adapted to
enable quantification of malaria parasites in a blood sample [10-15].
Real-time Quantitative Nucleic Acid Sequence Based Amplification (QT-NASBA)
is relatively easy to perform compared to real-time PCR, as only 50 µl of blood
sample is needed while up to 48 samples can be extracted and quantified with a
sensitivity of 20 parasites/ml in as little as 4 hours [16]. NASBA is based on the
detection of RNA and therefore stage-specific detection of Plasmodium parasites
such as gametocytes is possible. Previously a real-time QT-NASBA assay has
been developed for P. falciparum gametocytes which specifically detects RNA
expressed by the sexual-stage specific PfS25 gene [13]. This real-time PfS25
QT-NASBA demonstrated that the prevalence of sub-microscopic
gametocytaemia is high and that the potential human reservoir of P. falciparum
transmission is much higher than anticipated by microscopy data [17,18].
Studying gametocytaemia in P. vivax is difficult, because infections result in
relatively low parasitaemia, infecting < 2%. [19]. Moreover, mixed infections with

52
other Plasmodium species are common [20,21]. Moreover, P. falciparum
gametocytes sequestrate to avoid clearance by the spleen [19], whereas P. vivax
is believed to evade trapping and clearance in the sinusoids of the spleen
increasing its deformability [22]. The absence of sequestration and increased
deformability in P. vivax may lead to local differences in gametocyte densities (for
example capillary vs. venous blood) both within the human host as well as
compared to P. falciparum. Consequently, relatively little is known about P. vivax
gametocytaemia and epidemiology of transmission.
This study describes the development and testing of a P. vivax gametocyte-
specific NASBA assay based on RNA of PvS25, which is sexual stage specific
and the homologue of P. falciparum PfS25 [23,24]
Materials & Methods
Selection of primers, molecular beacon and in vitro PvS25 RNA synthesis
P. vivax forward (5’ – CTC CTA CTA CAG CCT CTT CG – 3’) and reverse (5’ –
CGT AAA GCC TTC CAT ACA CTG – 3’) primers were used to amplify a 553 bp
region of the PvS25 gene by PCR. The amplified fragment was cloned into a
pCR II vector in E.coli TOP10F cells (both from Invitrogen, Carlsbad, USA). The
cloned fragment was subsequently sequenced at the department of
Antropogenetics (RUNMC, Nijmegen, The Netherlands) to confirm a perfect
homology with all PvS25 entries available. PvS25 in vitro RNA was synthesized
using the mMessage mMachine T7 kit (Ambion, Austin, USA) and after
transcription RNA was purified by LiCl-precipitation, as described in the
mMessage mMachine protocol.
Primers and molecular beacon for the P. vivax sexual stage real-time QT-NASBA
were based on PvS25 mRNA (Genbank accession number AY639972). Forward
primer was 5’ – AAT TCT AAT ACG ACT CAC TAT AGG GAA AAA ATT CTC
ATC TTC TGG ATT GGG G – 3’ (position 427 to 446, including a T7 promotor
sequence), Reverse primer was 5’ – CTT GTG TGC TTG ATG TAT GTC – 3’
(position 314 to 334) and PvS25 molecular beacon was 5’ – 6FAM – CGC GAT

53
GCA TTG TTG AGT ACC TCT CGG AAT CGC G – Dabcyl – 3’ (position 365 to
386, a hairpin structure with a stem of 6 paired nucleotides at both ends). All
three sequences showed a 100% homology with all P. vivax entries known at
that time in a BLAST database search and none with human or other invertebrate
sequences [25] (February 2006).
In vitro samples
Blood samples (n = 104), 38 full blood and 66 blood spots on filter paper, were
used to evaluate the specificity of the PvS25 real-time QT-NASBA. All samples
were screened on the presence and specificity of the Plasmodium infection by
their respective 18S real-time QT-NASBA, as described previously [12,16]. The
blood samples were collected from returned travellers (n=22) with clinical malaria
symptoms visiting the patient clinic of the Radboud University Nijmegen Medical
Centre (Nijmegen, The Netherlands) and during field studies in Indonesia (n =
37), Kenya (14), Mali (2), Senegal (4), Turkey (21), Vietnam (2) and Zambia (2).
Blood samples (50 µl) or blood spots on filter paper (50 µl blood equivalent) were
mixed with guanidium isothiocyanate lysis buffer and nucleic acids were
extracted as described previously [26].
PvS25 Real-time QT-NASBA
NASBA was performed using NucliSens Basic Kits for amplification (BioMérieux,
Boxtel, The Netherlands) at a KCl concentration of 60 mM. The reaction mixture,
including both primers (20 pmol/assay), molecular beacon (10 pmol/assay) and
2.5 µl of sample, was incubated for two minutes at 65oC and subsequently for
two minutes at 41oC. After addition of 2.5 µl of enzyme mix (AMV-RT, RNase H
and T7 RNA polymerase) amplification was followed for 90 minutes at 41oC in a
Nuclisens EasyQ Analyzer (BioMérieux, Boxtel, The Netherlands). Afterwards,
time to positivity (TTP, the time point during amplification at which fluorescence,
detecting target amplicons, exceeded the mean fluorescence of the three
negative controls plus 20 standard deviations) was calculated. Quantification (in

54
copy numbers) was made possible by using a ten-fold dilution series of PvS25 in
vitro RNA ranging from 108 to 102 copies/µl.
Statistics
Regression of the PvS25 in vitro mRNA 10-fold dilution series was analyzed
using Microsoft Excel. Mean and standard deviation (SD) were calculated for
every dilution step and inter-assay variation was calculated as (SD/mean) *
100%. The relation between log PvS25 and log P. vivax 18S copy numbers in
PvS25-positive samples was analyzed in SPSS version 11.0 using the Pearson
analysis for correlation.
Results and discussion
In vitro RNA samples
In vitro PvS25 RNA synthesis and purification resulted in one distinct band
(without degradation) after agarose gel electrophoresis enabling exact
quantification of the number of PvS25 in vitro RNA copies (figure 3.1b). The
concentration of the synthesized product was 0.9 µg/µl as determined by
spectrophotometry corresponding to 2.4 * 1012 copies/µl of the 679 nucleotide
fragment of PvS25 in vitro RNA.
After optimization, sensitivity of the QT-NASBA was assessed with 10-fold
dilution series of PvS25 in vitro RNA. The lower detection limit for reliable
quantification was 100 copies/µl (figure 3.1a). The relation between time to
positivity (TTP) and the input measured in 18 different dilution series for 102 to
108 copies/µl was highly reproducible (R2 = 0.996 and p < 0.01). Inter-assay
variation analysis demonstrated that the variation is below 10% for every
concentration of the dilution series (table 3.1).

55
Figure 3.1: (A) Mean time to positivity (TTP) of 18 dilution series of in vitro RNA, quantified by the
PvS25 real-time QT-NASBA. Error bars indicate standard deviations of TTP for every dilution
step. (B) PvS25 in-vitro RNA (0.5 �l of 0.9 �g/�l after LiCl-purification) on a 1.0 % agarose gel,
indicated by the white arrow. The marker (on the left) is a 100 bp DNA ladder, although not used
to determine the in vitro PvS25 RNA fragment size, showed that electrophoresis had been
successful.
Table 3.1: Inter-assay variation analysis
The Inter-assay variation in PvS25 dilution series was calculated as standard deviation / mean *
100%. The mean TTP, standard deviation and range were calculated over 18 assays for every
dilution step
Log copies PvS25in vitro RNA/�l
Mean TTP Variation Range
8 30.52 7.69 26.46 – 33.19 7 36.39 8.66 29.28 – 43.08 6 42.95 9.04 34.42 – 52.37 5 48.58 8.58 38.92 – 56.13 4 57.12 9.22 42.13 – 67.49 3 65.83 6.67 54.39 – 73.33 2 71.67 8.10 61.31 – 80.46
1.7 73.26 6.52 69.88 – 76.64

56
In vivo samples
Clinical performance and specificity of the PvS25 real-time QT-NASBA assay
were tested in 104 clinical samples. All 30 non-vivax Plasmodium blood samples
were negative in the the PvS25 real-time QT-NASBA assay showing 100%
specificity for P. vivax
Table 3.2 shows that 51 out of 74 samples which were positive for P. vivax by
18S real-time QT-NASBA, were also positive in the PvS25 real-time QT-NASBA
(TTP ranging from 37.69 – 76.52). No back-up smears were available from the
remaining 23 negative samples to re-analyse gametocytaemia. There was no
correlation between P vivax parasitaemia and gametocytaemia, as determined
by PvS25 and 18S real-time QT-NASBA assays, respectively (Pearson; R = –
0.149 and p = 0.33).
Table 3.2: results of clinical samples (n=104)
P. vivax parasitemia (determined by Pv18S NASBA)
Positive
Negative
Positive 51 0 P. vivax gametocytaemia
(determined by PvS25 NASBA) Negative 23 30
The table shows all samples measured in the PvS25 real-time QT-NASBA assay. P. vivax 18S
real-time QT-NASBA positive samples were measured in triplo in the PvS25 real-time QT-
NASBA, whereas the 30 non-vivax Plasmodium samples were measured in duplo.
There are several explanations for this discrepancy. Firstly, these 23 samples
may truly not contain any P. vivax gametocytes. Little is known about the
incidence and prevalence of gametocytes in P. vivax. Some researchers indicate
that gametocytes appear simultaneously with the first asexual parasites [19], and
in a field study carried out in Afghanistan and Pakistan, gametocytes were
observed in all patients microscopically confirmed with P. vivax [27]. Others state
57
that gametocytes can only be found 7 – 12 days after detection of asexual
parasites nu [28], and a more recent study showed that only 22% of P. vivax
infected patients were positive for gametocytes [29].
Secondly, gametocyte densities may be below the detection limit of the PvS25
real-time QT-NASBA. Previously, it has been shown in P. falciparum that
mosquitoes became infected in membrane feeding experiments after feeding on
samples which were negative for P.falciparum gametocytes by either PfS25 real-
time QT-NASBA or by microscopy [30].
Finally, the inability to detect P. vivax gametocytes may be due the target gene
itself. The PvS25 gene is considerably more polymorphic than its P. falciparum
homologue [31,32,33]. In the Pvs25 gene, three point mutations were found that
resulted in amino acid substitutions [32], whereas the actual number of
nucleotide changes is probably higher. Every nucleotide change in the PvS25
targets for NASBA primers and molecular beacon has the possibility to reduce
the efficiency of the PvS25 real-time QT-NASBA. Recently, the number of
sequence entries in genomic databases has grown tremendously. We re-
analysed specificity of our primers and molecular beacon by searching in the
latest BLAST database [25] (October 2007). Primer 2 still shows a 100%
homology with all PvS25 entries (ntotal = 107), whereas both primer 1 and the
molecular beacon show a homology of 95% (ntotal = 100) and 99% (ntotal = 104),
respectively. All mismatches with the BLAST database originate from a study in
Thailand, where single-pass sequences for approximately 21,500 expressed
sequence tags (ESTs) were obtained from mixed blood stages of a single P.
vivax field isolate [34]; 20 of these ESTs showed a certain degree of homology
with one of the PvS25 primers and/or the molecular beacon, as described above.
Consequently, differences between the ESTs themselves were found as well.
This implicates either that this patient has been infected by multiple genetically
different P. vivax parasites, or that the polymorphisms described above result
from errors in cDNA-synthesis or sequencing, which is more likely since no other
polymorphisms in the PvS25 gene than the ones described by Cui et al. [34]
occur in the BLAST database. Two of the 23 samples that were negative in the

58
PvS25 real-time QT-NASBA while being P. vivax 18S real-time QT-NASBA
positive originated from Thailand. Therefore, a mutation in PvS25 mRNA as
described above might be responsible for the inability to detect gametocytes in
these samples. The 21 remaining P. vivax samples that could not be detected in
our assay may not have been detected as well due to a mutation. This could
have been elucidated by sequencing the PvS25 gene, however, no sample was
left for sequence analysis.
In conclusion, this study shows that the PvS25 real-time QT-NASBA assay is a
valuable tool to detect and quantify P. vivax gametocytaemia. It offers an easy,
specific and more sensitive alternative for microscopy in larger scale studies on
epidemiology of transmission and in drug or transmission blocking vaccine trials
of P. vivax.
Acknowledgements
This work was in part financially supported by a grant from The Netherlands
Foundation for the Advancement of Tropical Research (WOTRO contract
01.83.2004.006)
�� ����-� 7�� $��� 5:�� ��(�-���� .� E� ����� +� ����� %�� ������� ������ ���
4�����������������������3��(��:�*�����>����&�(�����(�������,��������6;0��/!�
�
�� $���5:������?��������4�������������������-����.�-������,�)9���1;0�16!�
�
)� �,�$���"*���������3��:����������E�$��%�+�����2�%�����������������������
���������������&������������ ����1� �����1����������!���(����>(���*-�?�---����
)�;0))/!�
�
2� 5���� :7� ���;�A��������4��������� ������������� ����-����.�-������,� ���
))0 )6�
�
� ����,��� �����(�������������������������������������������(����(��<�����,�
+#�%-�)���//0;1�
�
59
/� �9�������.�3���:�E�������� �661�-���+���� �������������2����������
�����������������!�����-��>����&�(�����(������.�-������,�# ��2�602))!�
�
;� ��3� :��� �� $��� �������� �����+�B�E� 7����7� �666�0������ ���� �����
�������������������� ���������"�43(��3���������+�����������"�����+���
4���6���!?� ���� 73%� ������� 4�� ����� �� �� ������� ���������� :�*���� �>� �����(��
��(��<�����,��$��);11!�
�
1� +*<���:���5*���-����$*<���-����5C*������.*���$�E�5������������.�����������
�������"���������"���������������������������������������������������
����43(!�����������������������:�*�����>������(����(��<�����,��#���;)/0�;);!�
�
6� "��<*-(���.���N�-(�������"O<�-�7��$�#�������D��������+O����"�E���(�3���?����)�
6�����"����4����������������������������������������������������������!
�����������!���#�������>(��?�-!�)����60���!�
�
��� ��(������� :*��*�<��,�"��",���E�?��-����666�0�������������4���������
43(�������������������"������������������������:�*�����>������(����(��<�����,��$��
) 0)1!�
�
��� ��3-�����������?$��������-���.��#������(����������������������-��9��:5��E�
$*�%���+�������0���������4�����������������������������������������"�
���!���2���������43(!����(*������5��(�3�(��.�-������,�))9���2;0� �!�
�
��� ��-�.���$(�����":��7���.��E�$(�������?������/�0��������������������
��� ������ 4��������� ����� +��� ���!��� 2��������� ������ ���� �2���!
���������������!������:�*���� !�
�
�)� $(������.��$(�����"��$(���������=����?�������?����������E�$*�%���+����2�
;����������� ��� 4��������� ���������� ������"��� �� ��������� ������ ���
����������"�2��������������������2���!��������������������(*������
5��(�3�(��.�-������,�)�$��) 02�!�
�
�2� $��*��*�"�E�5(9��.� �661�%��������43(�����"���������������������
���������������������������������������������������.�-������,����,�)���
2/�02/;!�

60
�
� � $(�����":�� -93���� 7���������� $(�������?���E� 3�� $�� �����0����������
2��������������4���������������������������������������2���������������
�����2���!�����������������:�*�����>������(����(��<�����,��9��2�;�02�; !�
�
�/� �$(������.�������-����$(�����"��$(���������$���9�-�.����3-��+�E�$*�%���+�
��� �(��!������������� �2���!�����������������������������������
���!��� 43(� ���� 2����������� ��� 4��������� ���������!� :�*���� �>� �����(��
��(��<�����,�����2��02� !�
�
�;� $�9����$���5�*-3�:���7*���77���*-�����.���-�9������������-��+���%9�����
$����-������$*�%���+��E�?�9�,��:����;�6������������4�������������������
������"�� ������� �� ������� �� ��� ���� ��� ��+� ���� �������� ����������� ��
%��,��������&�(�����(���E�����������������) �� 2;0 )!�
�
�1� 5�*-3�:���"�*�������?�9�,��:���*�-������� 9(��5����9�3���:��5���:���
"���*�� :�� E� $*�%��� +�� ���2� 4��������� ���������� ������"�� ������� ��
��"������������������+�����8�"��������:�*������
�
�6�?-&�33����"%���������E�7���-(����� �%���������!����.�-���(���---����� ����
�%�B��9'��&&�����&���*(����-�����F��.I!�
�
��� $��*��*�"�E�������:� ���2�%����!���������4���������� �������������
����������������������������%������������-����.�-������,� ���)))0))6�
�
��� �,4,����.*9����,93�$���%����.��E�������:����2����!������������
����������������!�����-����.�-������,� ���))0�2�!�
�
��� $*%��*-9� +�� ���9� 5��� ?�����&� ���� $��3*�� 7�� $��<���9��� :�� ����� �:� E�
���3-��&�(��+����2�%�����������"������������������������,���"�4���������
��������������4�������:�*�����>���>(���*-�?�---�)9#��6�0�62!�
�
�)� 5<�9������ <��0��<���� ��3�� $�� $*��3�� $�� +�>���0���%��������� �����+�E�
����9�� ?� �666� 0������ ��� ��+� ���� 4��������� ���������� ������"��� �����
��������������������"���������������������(*������5��(�3�(��.�-������,�
##��2)0�21!�
61
�
�2� �����.��66��4���������6�����6����-�������.�-������,����,�$��660��)�
�
� � ��5�!�������5��$����3����,�-�(�!����&'��%%%!�(<�!��3!���!��#�<�-��� !� ���;!� �+>�
�,&'���(�����(���������
�
�/� 5��3��+!��$�����!:!�!��$��3�-���!�!��:�-����!�!�������30#��?������.!�!����������
:!�#�������66�!�(����������������������������������������������!� :�*�����>�
�����(����(��<�����,���1��26 0 �)!�
�
�;� �-�������,�������-������$>������7���9�<�����������,��:��E�+�%���������;�
6��������!�"�������1� �������������!������1� ��� ������2��� ���� ���
�����������4�����������������������-��������������4�&�����!�-�������,��
����������������:30:�*�����>�����3��(�����(���--�(������ #$������0���6!�
�
�1�� 5�,�� ��� �626� =�#4� 3���!� ��� ��������"� !� -� ���������� ����"� ��� ����
����������������������������������������������������1�&&����;0��2 !�������'��!5!�
$*���-�(�3&�,!�
�
�6�� 5��(�� ���-&������"3<��?=���������:�����#�����+��(�������#������.���
�:� E� "��*���� �� ��� � 3������� ������ ����������� ���� ��"��������� 4���������
���������� ���� 4��������� ����� ������� �������� �� �� �����"� ����1�
�"�������4������-��,����������"!������:�*�����!�
�
)�� $(������.��5�*-3�:���"�*������� �����$��=����=��05��3����� 3��$��E�
$*�%��� +�� ���;� 6������������ 4��������� ���������� ������"�� ������
��2����"������������2�������������3��(��:�*�����>����&�(�����(�������,����
$���2;�02;2!�
�
)�� $��<���9��� :���-*<��������-������(��<����� $*%�<*�����+*���*���������
B���$��%�-�����$���(��-�����&�:�����3��+��E������������)�:���&��������������������
���2������"�������"����4������������������������������������4�� ������

62
4�� 9������ ������� ���"�������� �� ���� �������� �3��(�� :�*���� �>� ���&�(��
���(�������,�����#�� )/0 2�!�
�
)���-*<������7�9�� �����B����(��<�����B9*-��8���B���������7�<����E������������2�
-� ����� ����"���� ������ ���� ��� ����� ������� ����������!����&��� ������
��������1�4�� ������4�� 9!�.�-������,�������������������0��/!�
�
))� �-*<�������(��<�����7�9�� �E������������)�%���������!����&������������
�������������.�-������,������������� ���0���
�
)2� �*���������P���*�B��7�3,(�#�$���P*(9�<*-��:��7�*������5��$��<���9���:�E�
�������:����� �>��������"���4�����������������������2��������� 6%�������
��������������������(*������5��(�3�(��.�-������,�)�����06!�

63
����������
�
�
�
�
�
Plasmodium falciparum: Evaluation of a quantitative
nucleic acid sequence-based amplification assay to
predict the outcome of sulfadoxine–pyrimethamine
treatment of uncomplicated malaria
�
�
6�-��*���)1�4�?����� 1�>�C��6����� 1�-��F����)1�C���+���)1�6��8�����)1�
>�-�-��*�� �����'�0�?�'��6������ �
���7�,����(��+-�(����-���*��������>���5���(������,�+-�(�����?#��&3�����7����9��89���-���**��#���������&��F7��I�+�,�����&�(����-���*���7���5��3��(��+-�(�����
���������4���������"�))��< ���=�$�!$#�

64
Summary
A quantitative nucleic acid sequence-based amplification (QT-NASBA) assay
was employed to predict retrospectively the outcome of sulfadoxine–
pyrimethamine (SP) treatment of uncomplicated malaria in children aged <6
years in an endemic region. Blood samples were collected at initial diagnosis and
during follow-up. Mutation-specific nested PCR methods to analyse DHFR (Arg-
59) and DHPS (Glu-540) mutations that are associated with SP drug resistance
were applied. Parasite genotyping was performed to distinguish between re-
infection and recrudescence. Eighty-six patients were recruited of which 66 were
available for follow-up. Nine children were classified as early treatment failure, 13
cases were classified as late clinical failure, 32 as late parasitological failure, and
only 12 children had an adequate clinical and parasitological response. DHFR
and DHPS mutations conferring SP resistance were abundant in the Plasmodium
population. Blood samples obtained 7 days after treatment were used to predict
retrospectively the outcome of SP treatment. QT-NASBA was able to give a
correct prediction of treatment outcome in 85.7% of the cases. Positive predictive
value (PPV) of QT-NASBA case was 95% (95% confidence intervalD88.3–100)
and negative predictive value (NPV) was 63% (95% CID39.5–86.5). In contrast,
microscopy correctly predicted outcome in only 37.5% of the cases. PPV of
microscopy was 100% (95% CID73.9–100) and the NPV was 25.5% (95%
CID13.0–38.0). The analysis of a day 7 blood sample with QT-NASBA allows for
the prediction of late clinical or parasitological treatment failure in the majority of
the cases analysed in the present study.

65
Introduction
It is estimated that Plasmodium falciparum malaria kills one to three million
people per year, mainly children in developing countries [23]. According to the
World Health Organisation early diagnosis and adequate treatment are the basic
elements of any malaria control programme [23]. However, the control of malaria
is increasingly compromised due to the occurrence of widespread resistance of
P. falciparum against first-line and second-line anti-malarial drugs such as
chloroquine (CQ) and sulfadoxine-pyrimethamine (SP) [12].
In view of the widespread emerging drug resistance, laboratory techniques are
becoming more important. First in initial diagnosis to prevent treatment with anti-
malarial drugs of patients with diseases other than malaria and subsequently
during and after treatment to assess treatment efficacy.
At present, the malaria parasite is routinely diagnosed by microscopy on blood
films stained with Giemsa, Wright’s or Field’s stain [21]. This technique is cheap,
easy-to-perform and allows counting of parasites, but blood film examination on
samples from patients with low parasitaemia, as may be found after treatment, is
also time consuming. At low levels of parasitaemia, the detection limit of
microscopy (usually around 20 parasites per µl blood) and constraints on the
time available for examination of the blood slide, may lead to false-negative
results [6]. Alternative techniques, i.e. antigen detection methods, are fast and
simple to perform, but not sensitive enough to detect low parasitaemia; i.e. <100
parasites/µl [6,8]. Furthermore, some Plasmodium antigens, for example histidine-
rich protein II, persist after treatment, making it impossible to distinguish between
past and present infection [8].
The availability of a fast, sensitive, reliable and quantitative method for the
detection of parasite survival during and after drug treatment would help clinicians
to monitor and –if necessary- adjust the treatment regimen. Nucleic Acid
Sequence-Based Amplification (NASBA) has proven to be a sensitive and specific
assay in diagnostic microbiology [3]. A qualitative NASBA for the detection and
semi-quantification of Plasmodium parasites has been established [18]. This
qualitative NASBA has recently been further developed into a quantitative NASBA

66
(QT-NASBA), which allows for the quantification of P. falciparum over a wide range
of levels of parasitaemia, 0.2 – 1x10⁶ parasites/µl of blood, which is approximately
100x more sensitive than conventional microscopy [16]. Preliminary research
data suggest that NASBA can be used to monitor drug treatment efficacy and,
perhaps more importantly, to predict treatment failure [18]. In particular, the
NASBA count at day 7 could be a good predictor for treatment failure [13]. The
use of QT-NASBA to predict late clinical or parasitological treatment failure was
retrospectively assessed using blood samples collected at day 7 after SP
treatment during a field study conducted in Kimbimbi (Mwea district), a malaria
meso-endemic area in Kenya.
Materials and methods
Study site and design
The Kenya Medical Research Institute (KEMRI, Nairobi, Kenya) Ethical Steering
Committee approved the study. Patients were recruited with parental/guardian
permission after they were provided with appropriate information about the
purpose of the study. Patients, under 6 years of age, presenting to the outpatient
clinic of Kimbimbi district hospital (Mwea region, Central Kenya, a meso-endemic
malaria region) were enrolled in the study if they met the following criteria:
uncomplicated P. falciparum malaria with initial parasitaemia between 1,000 to <
200,000 parasites per µl of blood, axillary temperature ≥ 37.5 oC (measured with
a clinical thermometer) or a history of fever, no effective anti-malarial intake as
confirmed by urine testing for chloroquine, quinine or sulphonamides.
Following diagnosis (at day 0), patients were treated with an appropriate dose
(determined by the patient’s weight) of sulfadoxine-pyrimethamine (SP), and
antimalarial efficacy was assessed using the WHO in vivo test. However, the
follow-up period was extended with an additional 14 days, making day 28 the end
point of the study [cf. 24]. Children developing danger signs or severe malaria on
day 1 or 2 of the study were immediately withdrawn, referred to the hospital and
given alternative treatment. Response to treatment was measured and defined
67
according to WHO guidelines [24] as early treatment failure (ETF), late clinical
failure (LCF), late parasitological failure (LPF) or adequate clinical and
parasitological response (ACPR).
Patients showing complications or treatment failure were treated with appropriate
second line drug and supportive therapy. At initial diagnosis (day 0) and during
follow up (day 3, 7, 14, 21 and 28) blood samples were collected for microscopy,
QT-NASBA and DNA analysis.
Blood samples
For microscopy, blood samples were collected onto microscope slides and
stained with Giemsa’s stain. For QT-NASBA, 50 µl of blood was collected on day
7 after treatment and mixed with 950 µl of guanidinium isothiocyanate (GuSCN)
L6 lysis buffer and stored in liquid nitrogen until processed for RNA isolation. For
DNA analysis, blood was collected as dry blood spots on Whatman 3M filter
paper.
Microscopy
Microscopical examination of thick blood smears was used as ‘gold standard’ for
comparison with the quantification of parasites in the QT-NASBA. Giemsa
stained thick blood films were microscopically examined by two independent
micoscopists (300 fields of the thick film at 1,000 x magnification) and the
number of parasites was assessed. A post-treatment blood film which on
microscopy shows gametocytes only is regarded as parasite-negative for
purposes of clinical evaluation.
Mutation specific PCR tests
PCR-RFLP method was used to analyse DHFR (Arg-59) and DHPS (Glu-540)
mutations that are highly associated with SP drug resistance [5] and was
performed as described elsewhere [4].
68
Genotyping
In order to discriminate between re-infection (RI) and recrudescence (RE),
merozoite surface protein 1 and 2 (msp1 and msp2) and glutamate rich protein
(GLURP) genotyping was performed as described [19].
QT-NASBA
Retrospective QT-NASBA analysis of the blood samples collected at day 7 after
treatment was performed at KIT Biomedical Research according to the
established standard protocol [16]. Before RNA extraction, 1X10⁷ molecules of
in vitro Q-RNA, which serves as an internal standard, were added to the blood
sample/L6 lysis buffer mixture as competitor RNA. Next, nucleic acids were
isolated from the blood samples with the GuSCN-silica procedure as described
[2]. Two µl of the nucleic acid isolate was used in the QT-NASBA. The NASBA
reaction was performed and parasite counts assessed as previously described
[16]. A sample with a QT-NASBA count of >1.0 parasite per µl is considered
positive.
Association between NASBA, microscopy and response to treatment
The association between a positive or negative QT-NASBA or microscopy result
on day 7 and subsequent success or failure of SP treatment was assessed and
positive and negative predictive values of the employed tests were calculated at
95% confidence intervals [1]. In the present study, the positive predictive value is
defined as the proportion of cases with a positive test result at day 7 who showed
a LCF or LPF during follow-up. The negative predictive value is for this purpose
defined as the proportion of cases with a negative test result at day 7 who were
defined as ACPR at the end of the study period.

69
Table 4.1
Patient nr DHFR DHPS Response RI or RE NASBA day 7
Microscopy day 7
K04001 Mutant Mutant LPF RE 1 0 K04002 Mutant Mutant LPF RE 1 0 K04003 Mixed Mutant LPF RI/RE 1 0 K04004 Mutant Mixed LPF RI/RE 1 0 K04005 Wild type Mixed ACPR 0 0 K04006 Wild type Wild type ACPR 0 0 K04007 Mutant Mutant LPF RE 1 0 K04008 Mutant Mutant LPF RI/RE 1 0 K04009 Mixed Mutant LPF RI 0 0 K04010 Wild type Mutant ETF RI/RE K04011 Mutant Mutant LCF RE not done 0 K04012 Wild type Mixed ACPR 0 0 K04013 Wild type Mutant LCF RI/RE 1 1 K04014 Mutant Mutant LPF RI/RE 1 1 K04015 Wild type Mutant ETF K04016 Mutant Mutant LPF RE 1 0 K04017 Mutant Mutant LCF RI/RE 1 0 K04018 Mutant Mutant LPF RI/RE 1 0 K04019 Mutant Mutant LPF RE 0 0 K04020 Mixed Mutant LCF RE 1 0 K04021 Mutant Mutant LCF RI/RE 1 0 K04022 Mixed Mutant ETF K04023 Mixed Mixed LPF RI 1 1 K04024 Mixed Mutant LCF RE 1 0 K04025 Mutant Mutant LPF RI/RE 1 0 K04026 Mutant Wild type ACPR 1 0 K04027 Mixed Mutant LCF RI/RE 1 0 K04028 Mixed Mutant LPF RI/RE 1 0 K04029 Mutant Mutant LPF RE 1 0 K04030 Mutant Mutant LPF RE 1 0 K04031 Mixed Mixed ACPR 1 0 K04032 Mixed Mutant LCF RI 1 0 K04033 Mutant Wild type LCF RI 0 0 K04034 Mixed Mutant LPF RI 1 0 K04035 Wild type Wild type ACPR 0 0 K04036 Mutant Mutant LCF RI/RE 1 1 K04037 VOLUNTARY WITHDRAWAL K04038 Wild type Mutant LPF RI/RE 1 0 K04039 Wild type Mutant LPF RI 1 1 K04040 Mutant Wild type LPF RI 0 0 K04041 Mutant Mixed LPF RE 1 0 K04042 Mutant Mutant LPF RE 1 0
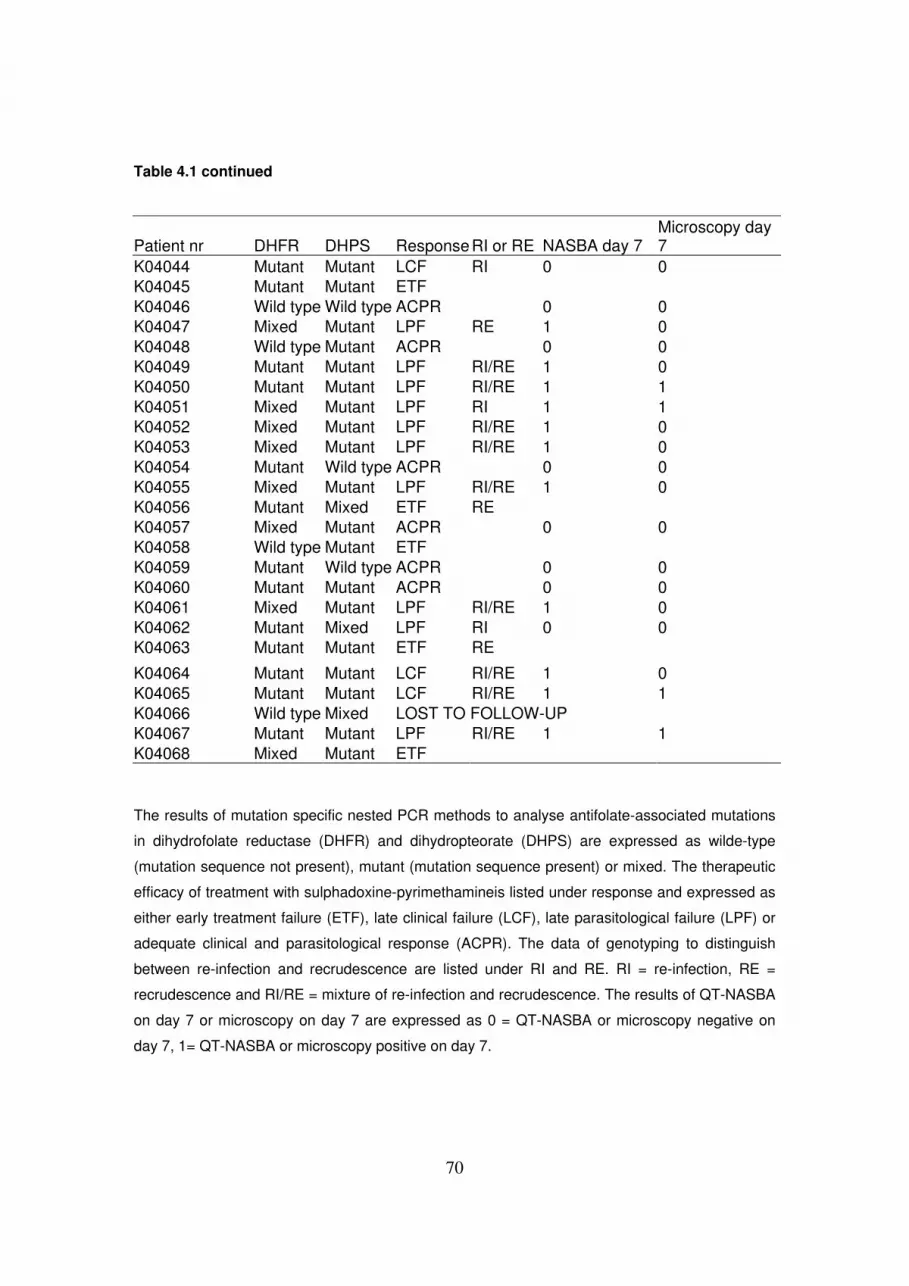
70
Table 4.1 continued
Patient nr DHFR DHPS Response RI or RE NASBA day 7
Microscopy day 7
K04044 Mutant Mutant LCF RI 0 0 K04045 Mutant Mutant ETF K04046 Wild type Wild type ACPR 0 0 K04047 Mixed Mutant LPF RE 1 0 K04048 Wild type Mutant ACPR 0 0 K04049 Mutant Mutant LPF RI/RE 1 0 K04050 Mutant Mutant LPF RI/RE 1 1 K04051 Mixed Mutant LPF RI 1 1 K04052 Mixed Mutant LPF RI/RE 1 0 K04053 Mixed Mutant LPF RI/RE 1 0 K04054 Mutant Wild type ACPR 0 0 K04055 Mixed Mutant LPF RI/RE 1 0 K04056 Mutant Mixed ETF RE K04057 Mixed Mutant ACPR 0 0 K04058 Wild type Mutant ETF K04059 Mutant Wild type ACPR 0 0 K04060 Mutant Mutant ACPR 0 0 K04061 Mixed Mutant LPF RI/RE 1 0 K04062 Mutant Mixed LPF RI 0 0 K04063 Mutant Mutant ETF RE
K04064 Mutant Mutant LCF RI/RE 1 0 K04065 Mutant Mutant LCF RI/RE 1 1 K04066 Wild type Mixed LOST TO FOLLOW-UP K04067 Mutant Mutant LPF RI/RE 1 1 K04068 Mixed Mutant ETF
The results of mutation specific nested PCR methods to analyse antifolate-associated mutations
in dihydrofolate reductase (DHFR) and dihydropteorate (DHPS) are expressed as wilde-type
(mutation sequence not present), mutant (mutation sequence present) or mixed. The therapeutic
efficacy of treatment with sulphadoxine-pyrimethamineis listed under response and expressed as
either early treatment failure (ETF), late clinical failure (LCF), late parasitological failure (LPF) or
adequate clinical and parasitological response (ACPR). The data of genotyping to distinguish
between re-infection and recrudescence are listed under RI and RE. RI = re-infection, RE =
recrudescence and RI/RE = mixture of re-infection and recrudescence. The results of QT-NASBA
on day 7 or microscopy on day 7 are expressed as 0 = QT-NASBA or microscopy negative on
day 7, 1= QT-NASBA or microscopy positive on day 7.

71
Results
In total 68 patients that were infected with P. falciparum, as detected by
microscopy, were enrolled in the present study during the 2 weeks recruitment
period. Typically, patients microscopically negative for P. falciparum had
respiratory tract infections, schistosomiasis, P. malariae infections or other
undefined fevers. One child voluntarily withdrew from the study for unknown
reasons and another child was lost to follow-up.
Treatment efficacy
Of the 66 children that were followed up after initial diagnosis and treatment, 9
children were classified as ETF. Seven ETF cases developed danger signs of
severe malaria on day 1 or 2 of the study and were treated with quinine. Two
other ETF cases had a parasitaemia on day 3 which was >25% of the count of
day 0 and were subsequently offered alternative treatment. Thirteen cases were
classified as LCF and 32 as LPF (see Table 4.1). Only 12 children had an ACPR.
Correlation between the presence of mutations conferring drug resistance
and treatment efficacy
DHFR59 and DHPS540 mutations conferring SP resistance were abundant in the
Plasmodium population (Table 4.1). The results of the mutation-specific nested
PCR methods indicate that only 3 samples, all ACPR, had the wild-type
sequences at DHFR59 and DHPS540. Twenty-five samples had both mutant
sequences, 19 samples had mixed wild-type and mutant forms at DHFR59
combined with mutant sequence at DHPS540. Less frequent were wild-type
sequence at DHFR59 combined with either mutant sequence at DHPS540 (7
samples) or mixed wild-type and mutant forms at DHPS540 (2 samples). Five
samples had the mutation at DHFR59 combined with wild-type sequence at
DHPS540 and 4 samples had DHFR59 mutation combined with mixed wild-type
and mutant sequence at DHPS450. Only 1 sample had both mixed wild-type and
mutant sequences at DHFR59 and DHPS540, whilst none of the samples had a
mixed sequence at DHFR59 combined with wild-type DHPS540.

72
Genotyping
PCR genotyping to distinguish between re-infection (RI) and recrudescence (RE)
was performed on 3 ETF cases and all late treatment (either clinical or
parasitological) failures. Two ETF cases were classified as RE and 1 as a mixed
RI/RE. The remaining 6 ETF cases were not genotyped. Within the late treatment
failures, 10 cases were classified as RI, 13 as RE and 22 as mixture of RI/RE
(Table 4.1).
Association between NASBA, microscopy and response to treatment
QT-NASBA analysis was retrospectively performed on blood samples collected
at day 7 after treatment. All ACPR, LCF and LPF samples could be analysed,
with the exception of 1 LCF case, due to inhibition in the NASBA reaction. The
ETF samples were not analysed as a day 7 sample was in most cases not
available. In total 56 day 7 samples were thus analysed with QT-NASBA.
The association between a positive or negative QT-NASBA or microscopy result
on day 7 and subsequent success or failure of SP treatment is presented in
Table 2 and 3, respectively. If the day 7 QT-NASBA result is taken as a
predictive value for treatment outcome (i.e. NASBA negative on day 7 = ACPR;
NASBA positive on day 7 = LCF or LPF) then a correct prediction was made in
48 cases (85.7%) of the total number of cases (n = 56). Ten of the 12 ACPR and
38 of the 44 LCF or LPF were correctly predicted by NASBA. The positive
predictive value (PPV) of QT-NASBA in this case was 95% (95% confidence
interval = 88.3 – 100). The negative predictive value of QT-NASBA is calculated
to be 63% (95% C.I. = 39.5 – 86.5).
In contrast, positive or negative microscopy on day 7 resulted in a correct
prediction of treatment outcome in only 21 cases (37.5%). All 12 ACPR were
correctly predicted, but 35 wrong predictions were made in the case of LCF or
LPF. The PPV of microscopy was 100% (95% C.I. = 73.9 - 100) and the NPV
was 25.5% (95% C.I. = 13.0 – 38.0).

73
Table 4.2SrRN
A g
Outcome of treatment Result of NASBA Positive at day 7 Negative at day 7 Total
Failure 38 6 44
Success 2 10 12
Total 40 16 56
PPV of NASBA = 0.95; NPV of NASBA = 0.63
Relation between NASBA result at day 7 after treatment and the outcome of treatment (success =
adequate clinical and parasitological response; failure = late parasitological or clinical failure. )
Table 4.3SrRN
Relation between microscopy at day 7 after treatment and the outcome of treatment (success =
adequate clinical and parasitological response; failure = late parasitological or clinical failure. )
Outcome of treatment Result of microscopy Positive at day 7 Negative at day 7 Total
Failure 9 35 44
Success 0 12 12
Total 9 47 56
PPV of NASBA = 1.0; NPV of NASBA = 0.25

74
Discussion
Perhaps the most striking observation of the present study is the poor adequate
clinical and parasitological response (ACPR) of the study group to treatment of
uncomplicated falciparum malaria with sulfadoxine-pyrimethamine (SP). Twelve
children (18%) could be classified ACPR. In contrast, 9 children (14%) had an
early treatment failure (ETF) for which immediate alternative treatment was
needed and the remaining 45 patients (68%) were classified as either late clinical
(LCF) or late parasitological failure (LPF). Mutations conferring SP resistance
were present in all patients failing treatment. This confirms observations of Kublin
et al. [5] that mutations in DHFR (Arg-59) and DHPS (Glu-540) are highly
associated with SP drug resistance. Nine out of the 12 ACPR cases had
mutations in either DHFR and/or DHPS, but were still able to control the disease.
In these cases, potentially resistant parasites were most likely cleared from the
patients by a combination of acquired immunity and drug treatment [10]. In
Kenya, SP has replaced chloroquine as first-line drug for the treatment of
uncomplicated malaria, but selection of parasites resistant to the drug is evident
[see review 17], and the clinical effectiveness of this combination is decreasing
[9,10, this study]. The rapid evolution of SP resistant P. falciparum is a public
health disaster, because inexpensive alternatives are currently not available
[7,9].
The management of malaria would benefit from the availability of a sensitive test
for the detection of parasite survival during drug treatment. Such a test will help
clinicians to make treatment decisions and to improve patient management. In
the present study, analysis of a day 7 blood sample for the presence of SP
treatment surviving P. falciparum with quantitative nucleic acid sequence based
amplification (QT-NASBA) assay appeared to adequately predict late clinical or
parasitological treatment failure in the majority of cases. A positive QT-NASBA
test on day 7 implies a high risk for late treatment failure, whereas a negative
QT-NASBA test on that day is a rather good indication for success of treatment.
The results of NASBA testing would even be better if the applied assay would be
able to make a discrimination between re-infection and recrudescence, which is

75
at present beyond the possibilities of the test. If the data obtained with the
apparent re-infections are omitted from analysis (= 10 samples), i.e. only RE and
RE/RI are taken into account (= 46 samples), the QT NASBA made a incorrect
prediction in 2 ACPR cases and 1 LPF case (93.5% correct predictions). In
contrast, microscopy would only make 18 correct predictions ( 39.1 %) if
apparent re-infections are excluded from the analysis.
A limited number of ACPR cases (12) were followed-up in the present study and
QT-NASBA predicted in 2 cases a possible treatment failure in this group. The
two ACPR cases that were found positive on day 7 with QT-NASBA were
gametocyte carries. It is well established that treatment with SP can induce
gametocytogenesis [20] and this may limit the application of QT-NASBA for the
prediction of SP treatment outcome. However, in a previous study in which all
treated cases showed ACPR, QT-NASBA found all day 7 samples negative [14],
but these patients were not treated with SP. The QT-NASBA assay applied in
the present study is based on the detection of 18S rRNA, that is expressed by all
developmental stages of the parasite [16]. The recently developed sexual stage
specific QT-NASBA [16] will make it possible, in combination with currently
applied assay, to quantify separately all developmental stages of P. falciparum
present in the circulation.
The possible application of NASBA technology for the prediction of LPF and LCF
in places where most of the malaria cases are diagnosed, i.e. a simple laboratory
environment or under field conditions in rural Africa, is limited. At present, the
detection of NASBA amplification products takes place at the end of the process
using electro-chemiluminescence (ECL). In molecular diagnostics, the search for
increased detection sensitivity combined with a simple detection system is an
ongoing challenge [22] and would ultimately lead to the feasibility of introducing
molecular tools in developing countries. However, even if these technological
obstacles are circumvented, the high costs of this type of technology remains an
issue. This should, however, not prevent the application of NASBA technology in
clinical trial settings and academic hospitals [14]. Sentinel sites, such as those in

76
the EANMAT network, could use this technique (perhaps in a simplified version),
to monitor the choice and efficacy of first line antimalarial drugs.
Acknowledgements
Supported by: The Hubrecht-Janssen Fund, KIT (Koninklijk Instituut voor de
Tropen/Royal Tropical Institute, Amsterdam, The Netherlands). We are grateful
to the staff of the Kimbimbi district hospital for technical assistance and the
children and their parents who participated in the study.
References
�� ���3��� ?!"!�� �66�!�4�������� ��������� ���� ������ �������� ��&3�� E� �����
���������!7!!���
�
�� 5��3��+!��$�����!:!�!��$��3�-���!�!��:�-����!�!�������30#��?������.!�!����������
:!�#�������66�!�(����������������������������������������������!�:�*�����>�
�����(����(��<�����,�� 9��26 0 �)!�
�
)� ������!5!����4�� :!?!�� �666!�A-6:-��������������������������������������
����������������������������������������"!�+#�%-�������(����(��<�����,�)���
�1 0�6/!�
�
2� ?*��-�������!�!���*���-��:�!����*�-���?!�!���661!�4���������������������������
��� ���"��������� �� ��� ��"��������� �������� ���� ��"���������� �"�������
�����"�43(��������������������!��4&��3����.�-������,�9#���01!�
�
� 7*<����� :!"!��?���8�3����!7!�� 73%�����?!?!����9���� �!�!������-�� :!�!����������
�!�!�� �*9�3�� +!�!"!�� +���-���� $!:!�� �-(���� �!"!�� ���,�*4�� �!�!�� ���-���,�� .!�!��
���3&����.!���,������!�!��.��%���!=!������!�������������&�������������������������!
�"�������� ���� �������������!������� �������� ��� 4��������� ����������
������!����:�*�����>���>(���*-�?�---�)9���)1�0)11!�
�
/� �9�����!�!��.�3����!:!��������!�!���661!�-���+�����������������2����������
�����������������!�����-��>����&�(�����(������.�-������,�6���2�602))!�

77
;� ��-���7!���661!�����������������-����!���(���� ��6�206� !�
�
1� ����,���!������!�(������������������������������������!������(����(��<�����,�
+#�%-�)���//0;1!�
�
6� �*�*��5!+!��$3�9��5!�!����*����+!�!���<���0��(���?!�!���%�����!��$��9-��"!?!��
����!� %�� �����"� ��� �"�������!���������� <?������=� �� ��� �������� ���
������������4����������������������������8�"��������������-(����-��>����
+�,��$�(��,��>����&�(�����(�������,����#���1)012!�
�
��� 3��� $!�!�����*���!$!�����*�-���?!�!�� ����!�3�����!�������� �����������
������������������������������4������������������������������������������
���������!�"�������� �������� �����@� ���-(����-� �>� ��� +�,�� $�(��,� �>�
���&�(�����(�������,����#���)� 0)�6!�
�
��� 3���$!�!�����*���!$!��"*3&��?!������*���!.!�����*�-���?!�!������<!�4���������
������������8�"����������������������!�������!������������"�����������
�����������������+���������������������������������-��>����&�(�����(���
E�.�-������,�#���//�0//6!�
�
��� +���,�� +!"!�� ����!� ������ ��1� ������� ���������"� ���� ��� ���� ����
����������������!���*���)���/1/0/6)!�
�
�)� $(��������!?!�!�!��$(������"!:!��7�������!�!�!�� 3���$!�!��=��-��.!:!����"������!�#���
����!�;�����������������!��������������������4��������������������������������
���� ������� �"� ������ ���� �2���!����� ����������� <A-6:-=�� :�*���� �>�
��(��<������(�������-��$���� !�
�
�2� $(��������!?!�!�!��$(������"!:!����33�-���!:!�!��7�������!�!�!��=��-��:!.!����"������!�
#��� ���)!� 5�������� ��� 2��������� ������ ���� �2���!����� ����������� ����
�������� ��� ������� �� ��� ������� �������� ������� �*��&�� :�*���� �>� �����(��
��(��<�����,������>(���*-�?�---� �� �J� ;!�
�
� � $(�������.!��$(������"!��$(��������!��=�����?!��������?!����������!��$*�%����+!��
���2!�;��������������4�������������������������"�����������������������
78
����������"�;��������� A����� -��� 62���� :���� -����������� ���(*���
���5��(�3�(��.�-������,�)�$��) 02�!�
�
�/� $(������ "!:!�� -93�� �!�� 7������ �!�!�!�� $(������� �!?!�!�!�� 3��� $!�!�� ����!�
0������ ���� 2����������� ��� 4��������� ���������� �� ������ ������� �����
2������������������� �2��������������������� :�*�����>������(����(��<�����,�
�9��2�;�02�; !�
�
�;� $�<�,���!�!���,���:!�!��$�3-��.!�!��.��%���!=!��7*<�����:!"!���<�*���!7!����%3����!�!��
���-���,��.!�!����9��-���!�!���������!�!������!�4"�������!������������������
��4��������������������+�������@�����-����.�-������,�)$�� 1�0 11!�
�
�1� $3��-���!�!��"*--���#���"!�!����&-�����!��$(�*99��9��+!�!�!��"3���5!�#���"�������
#��� �66;!�0�����1� �������������� ��!2��������������������� ���������"�
A-6:-� ����������� ��� ������ ������� ��������� (A-� �2������ :�*���� �>�
��(��<������(�������-� 9��/ 0; !�
�
�6� $��*��*��"!��D�*��H!��$���&������!��:�����!������������$!��5��%���7!�!��=���,9�-����$!��
�666!�:��������������������)�������� �����������������4�������������������
�������������%�����������-(����-��>����+�,��$�(��,��>����&�(�����(�������,����
#���)/60);2!�
�
��� $��������!�#����:%����!�����3���+!��?����,���!�����#���"!���������"!������!�
4��������� ���� ������"����� ����� �������� +��� ������2��1�
�"�������G���������1� ���� �"�������G���������� ������� +���
��������� �� "����� >������� +��� ������������ �������� ���&�(�� ���(��� ���
�������������������6�061!�
�
��� ���*�-��� ?!�!�� �����3-�� :!�!�� �66/!�.��������"��������� ���������!� :�*�����>�
�����(��.������,��#'� ))0 )1!�
�
��� ����(�3<��?!���%������!+!���������$!���661!�-����������������������0A-!�����
������������*����� &�����-����5���(������,�#1�/��0/�1!�
�
�)� ������ ����� ����������� ����!� ������� 0�������� A+� 4�������!� �� ��
"�#��$%�������!�

79
�2� ����������� ��������������)!�-����������������������������������������
�����"� ���� ��� �������� ��� ������������ ���������� ������!� �� �� "�#��
$%�������!�

80
�
�

81
�������� �
�
�
�
�
�
�
A randomized trial to monitor the efficacy and
effectiveness by QT-NASBA of artemether-lumefantrine
versus dihydroartemisinin-piperaquine for treatment
and transmission control of uncomplicated Plasmodium
falciparum malaria in western Kenya.
�
4�?�����)1 1�4��6�+��1�6��������-�������)1�7��B����)1�6�-��*����1�
'�0�?�'��6������)�����4�-��8��� �
�
��7����9��89���-���**��#���������&��F7��I�+�,�����&�(����-���*���7���5��3��(��+-�(������(�3�(����(��������?�#�-�����>���>(���*-�?�---�����&�(�����(��������?$��)�����������������>�����-(��.�,-�����,�����(����,��F���.�I���<���.�������<���7�,�2�7�,����(��+-�(����-���*��������>���5���(������,�+-�(�����?#��&3�����
6��������������������

82
Summary
Many countries have implemented artemisinin based combination therapy (ACT)
for the first line treatment of malaria. Although many studies have been
performed on efficacy and tolerability of the combination arthemeter -
lumefantrine (AL) or dihydroartemisinin - piperaquine (DP), less is known of the
effect of these drugs on gametocyte development, which is an important issue in
malaria control. In this two arm randomized controlled trial 146 children were
treated with either AL or DP. Both groups received directly observed therapy and
were followed for 28 days after treatment. Blood samples were analyzed with
microscopy and NASBA. In comparison with microscopy NASBA detected much
more gametocyte positive individuals. Moreover, NASBA showed a significant
difference in gametocyte clearance in favour of AL compared to DP. The decline
of parasitaemia was slower and persistence or development of gametocytes was
significantly higher and longer at day 3, 7 and 14 in the DP group but after 28
days no difference could be observed between both treatment arms. Although
practical considerations could favour the use of one drug over another, the effect
on gametocytogenesis should also be taken into account and studied further
using molecular tools like NASBA. This also applies when a new drug is
introduced.

83
Introduction
In response to widespread resistance of P. falciparum parasites to the commonly
used drugs chloroquine (CQ) and sulfadoxine-pyrimethamine (SP), many African
countries recently adopted artemisinin based combination therapy (ACT) as first
line treatment for uncomplicated malaria. The combination artemether-
lumefantrine (AL) proved to be highly effective and well tolerated in several
studies in Africa [2-4, 14, 20]. Disadvantages of this combination drug are the
twice-daily dosing and the fact that it should be administered with a fat-rich meal
[5, 11, 16] or at least a cup of soya milk [3]. In Uganda, in an area of intense
malaria transmission, recurrence of parasitemia within 28 days occurred in 29%
of AL treated patients, in 8.9% adjusted by genotyping, indicating recrudescence
[14].
Another ACT, dihydroartemisinin combined with piperaquine (DP), which was
originally developed in China, is increasingly used in Southeast Asia [7, 8].
Piperaquine is an orally active bisquinoline with a half life elimination time of 2.5-
4 weeks [7]. The drug is structurally related to CQ, but still active against highly
CQ-resistant P. falciparum strains [1, 2]. This relatively inexpensive drug was
well tolerated and highly effective in Southeast Asia [1, 2, 9, 11, 17] as was the
case in 2 studies in Africa [13, 14]. Consequently, both AL and DP are
considered to be amongst the most promising artimisinin-based drugs [13, 14].
Artemisinin-based drugs also act on gametocytes and thus on transmission, at
least in low transmission areas [12, 18-19]. In high transmission areas of Africa
not much information is yet available on gametocytemia after ACT treatments
and on possible influence on transmission. In a comparative study of AL and DP
in Uganda, the appearance of gametocytes in those who did not have
gametocytes at the start of treatment was lower from day 15 to day 42 of follow
up in those treated with DP than in those treated with AL [14]. A limitation of this
study was the fact that gametocytemia was assessed by microscopic
examination only. It has recently been shown that sub-microscopic gametocyte
densities may significantly contribute to the transmission of malaria [22].

84
Adequate assessment of gametocytemia is important. Quantitative nucleic
sequence based amplification technique (QT-NASBA) has been shown to be
much more sensitive for the detection of gametocytes than microscopy [4, 22-23,
24] In this study we assessed the post treatment prevalence of gametocytes in
children in Mbita, Western Kenya after treatment with AL and DP. We compared
microscopy and QT-NASBA for the quantification of gametocytemia and
assessed effectiveness of both drugs regarding clinical symptoms, clearance of
parasites and tolerability.
Material and Methods
Study site and population
The study was conducted in Mbita, western Kenya, at the shores of Lake Victoria
during the high malaria transmission season of April-July 2007. Children (6
months-12 years) visiting the outpatient clinic of the health centre and diagnosed
with uncomplicated malaria were included after informed consent from parents or
guardians. Inclusion criteria were: uncomplicated P. falciparum malaria with initial
parasitaemia between 1000 and < 200,000 parasites/µl blood, axillary
temperature >37.5 °C (measured with a digital thermometer) or a history of fever.
Children with severe malaria, mixed infection or other underlying illness were
excluded from the study. In total 146 children were recruited for the present
study. Ethical approval for this study was obtained from appropriate local
authorities and The Kenya Medical Research Institute (KEMRI, Nairobi, Kenya)
Ethical Steering Committee (SSC protocol No 948). The trial was registered as
an International Standard Randomised Controlled Trial at current controlled trials
(ISRCTN36463274).
Study design and treatment
Following diagnosis (at day 0), the patients were randomly allocated to one of the
two treatment groups following a computer generated randomization list. One
group was assigned DP (Sigma-Tau, Italy) once per day for 3 days. One tablet of

85
the study drug contained 20 mg of dihydroartemisinin and 160 mg of piperaquine
(pediatric formulation). Treatment was according to body weight as follows:
children between 4-7 kg received half a tablet per dose, those between 7-13 kg 1
tablet, 13-24 kg 2 tablets per dose and children between 24-35 kg 4 tablets. The
other group was assigned to AL (Novartis Pharma, Switzerland). Each tablet
contained 20 mg artemether and 120 mg lumefantrine. Patients received
treatment according to bodyweight; i.e. children between 5-14 kg received 1
tablet per dose, those between 15-24 kg 2 tablets and those between 25-34 kg
received 3 tablets per dose. Doses were given twice daily. All treatments were
given under supervision at the clinic or, for the 2nd dose of AL, at home.
Outcomes: efficacy.
Efficacy was assessed using the WHO in vivo test with a follow-up period of 28
days [27]. At enrollment (day 0) a full clinical examination was performed;
information was recorded on a case record form. At initial diagnosis (day 0) and
during follow-up (day 1, 2, 3, 7, 14, and 28), finger prick blood samples were
collected for microscopy, measurement of haemoglobin level and molecular
analysis. Haemoglobin was measured with Hemocue 201+ analyser and cuvettes
(HemoCue diagnostics B.V. Waarle, The Netherlands). Response to treatment
was measured and defined according to WHO guidelines (2003) [27].
Patients showing complications or treatment failure were treated with appropriate
supportive therapy. Children developing danger signs or severe malaria on day 1
or 2 of the study were withdrawn from the study, referred to the hospital, and
given alternative treatment. Adverse events were recorded on the case record
forms. An AE was defined as an unfavourable and unintended symptom, sign or
disease. A serious adverse event (SAE) was defined as a symptom or sign that
is temporally associated with the drugs administered to the patient that is life
threatening or results in hospitalization, permanent and significant disability or
death. SAE’s were immediately reported to the ethical committee of KEMRI and
the drug safety department of Sigma-Tau, Italy.
86
Outcomes: parasite clearance and gametocyte dynamics.
Parasite clearance and gametocyte dynamics were assessed microscopically as
well as with quantitative nucleic acid sequence based amplification assay, QT-
NASBA.
Microscopy
Giemsa stained thick and thin smears were prepared according to WHO
guidelines. Two independent experienced microscopists, who were blinded to the
treatment and clinical status of the patient, examined the smears for the
presence of parasites and identified the observed parasite species. Parasitaemia
was determined by counting the number of parasites against 200 leukocytes for
the asexual stages (assuming that there are 8000 leukocytes/µl blood). The
presence of gametocytes was examined against 500 leukocytes.
QT-NASBA
Finger prick blood (50 ul) for NASBA analysis was collected on Whatman 903
filter paper (Whatman international Ltd. Maidston, United Kingdom) and air-dried
at room temperature. Nucleic acid extraction was performed as previously
described by Boom et al. [6]. Real-time 18S rRNA QT-NASBA was applied to
study asexual parasite clearance below microscopical threshold [24]. In order to
quantify the number of parasites in blood, a 10 fold serial dilution of 106 to 10 in
vitro cultured parasites/ml was used as reference and processed and analysed
with NASBA. Furthermore, to assess prevalence of gametocytes below the
detection limit of microscopy, QT-NASBA targeting Pfs25 mRNA as described by
Schneider et al [24] was used on blot spots collected during follow-up.
Genotyping
In order to discriminate between re-infection (RI) and recrudescence (RE),
merozoite surface protein 1 and 2 (msp1 and msp2) and glutamate rich protein
(GLURP) genotyping was performed as described by Snounou [25] on blood
spots obtained at primary (day 0) and secondary infection (time point of re-

87
occurrence). Blood spots were collected on Whatman 903 filter paper (Whatman
international Ltd. Maidston, United Kingdom) and air-dried at room temperature
for PCR analysis. DNA was isolated as described by Boom et al. [6]. Molecular
analysis was performed at Royal Tropical Institute, Amsterdam and was done
blinded from the treatment that was given to the patients.
Sample size and statistical analysis
The aim of the study was to compare gametocytemia after AL and DP and to
compare assessment of gametocytemia by microscopical examination versus
QT-NASBA All data were entered in excel and analyzed with SPSS for windows
(version 12.0). Parasite densities were analyzed after natural log-transformation.
Where appropriate, proportions were compared with the �2-test and means were
compared with the one-way ANOVA or Student t-test.
Results
Patient recruitment
In total 1882 cases suspected of uncomplicated malaria were screened for
eligibility into the study during an 8 week recruitment period in April and May
2007. 1736 children were excluded because they did not meet the inclusion
criteria (figure 5.1). 146 patients fulfilling the inclusion criteria entered the study;
73 were randomly allocated to the DP arm and 73 to the AL arm. Both study
groups were comparable at base line for their demographical and clinical
characteristics and parasite densities (table 5.1). On completion of follow up (day
28) data of 134 patients (92%) were available for analysis.
12 patients did not reach the study endpoint. 7 patients were lost during follow
up, 1 was unable to take oral medication, 1 developed severe anaemia, 1 did not
receive the proper drugs, 1 withdrew from the study and 1 patient died.

88
Table 5.1: Baseline characteristics of patients included in the study at the time of
enrollment in the study
Characteristic DHA-PQP ( n=73) ALN (n=73)
Sex ratio male:female 33:40 40:33
Age (in months), median (IQR) 60 (44) 52 (44)
Body weight, mean kg (range) 17.62 (6-37) 17.32 (6-42)
Temperature, mean ºC ± SD 38.1 ± 0.99 37.8 ± 0.73
Haemoglobin mmol/L ±SD 6.33 ± 1.29 6.28 ± 1.27
Parasites /µl geometric mean (range)
as determined by microscopy
12145 (1000-72640) 13379 (1080-72000)
Treatment outcome
There were no early treatment failures during the first 3 days of follow up. Only
one patient in the AL arm had a recurrent parasitaemia (43 880 parasites/µl) at
day 28 of follow up. Genotyping analysis revealed that this patient had a
reinfection with Plasmodium falciparum. All other 133 patients who completed
follow-up had an adequate clinical and parasitological response. After one day of
treatment, over 90% of the patients had no microscopically detectable asexual
parasites. In the AL group no parasites could be detected with microscopy in any
of the patients at day two. One patient was still microscopically positive at day
two in the DP group with 40 p/ul, but this patient was also microscopically
negative at day 3. NASBA was also applied to monitor parasite dynamics below
sub-microscopical level. Due to extraction failures, a full range of follow-up
samples of 56 DP and 54 AL treated patients could be analyzed. Both treatment
arms showed a steep decline in parasitemia from the day of enrollment (day 0) to
day 1; 62% reduction after DP treatment and 89% reduction in the AL arm. At
day 2, the level of parasitaemia was reduced to 1.2% in the AL group and 2.75%
in the DP group.
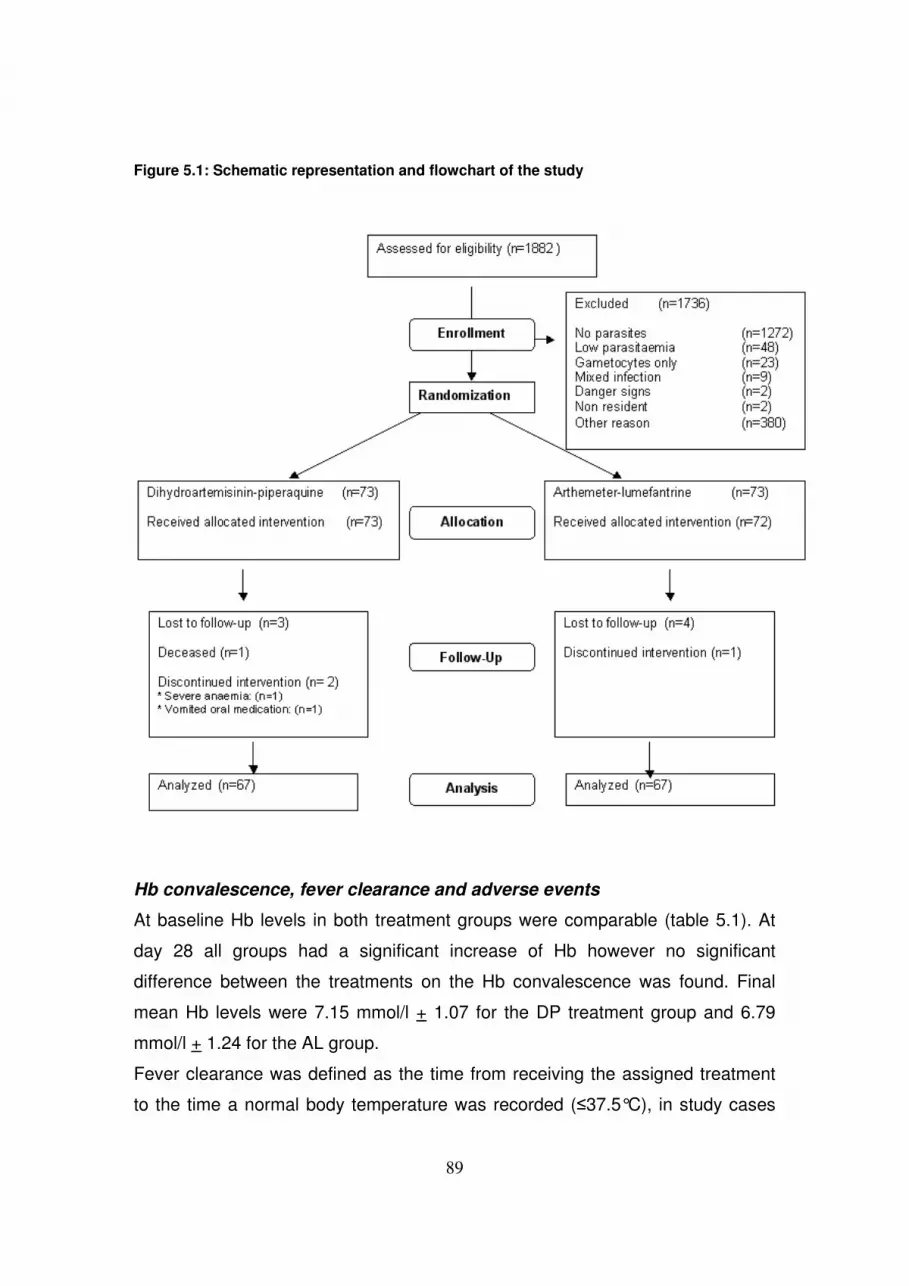
89
Figure 5.1: Schematic representation and flowchart of the study
Hb convalescence, fever clearance and adverse events
At baseline Hb levels in both treatment groups were comparable (table 5.1). At
day 28 all groups had a significant increase of Hb however no significant
difference between the treatments on the Hb convalescence was found. Final
mean Hb levels were 7.15 mmol/l + 1.07 for the DP treatment group and 6.79
mmol/l + 1.24 for the AL group.
Fever clearance was defined as the time from receiving the assigned treatment
to the time a normal body temperature was recorded (�37.5°C), in study cases

90
who presented with fever. Fever clearance was rapid in both study groups. On
day 1, 10 cases (13.7%) in the DP group presented with fever and 6 cases
(8.2%) were observed in the AL group. In the DP group fever was observed on
day 2 in 4 cases (5.5%) and 3 cases (4.1%) on day 3. In the AL group cases
with fever also presented on day 2 (12 study subjects, 16.4%) and on day 3 (2
individuals, 2.7%). Fever was not observed during follow-up after day 7, with the
exception of the child that presented with a P. falciparum reinfection on day 28 in
the AL group and the child that developed broncho-pneumonia (case presented
below).
Most adverse events were mild, self limiting and consistent with symptoms of
malaria. There was no significant difference between the two study groups (table
5.2). One patient died. The child (63 months) had been ill for 2 weeks prior to
presentation at the clinic. Plasmodium falciparum infection with parasitemia of 20
120 parasites/ul was diagnosed. There was a fever (38.6 ºC) but there were no
other complaints and no signs of severe anaemia (Hb: 6.4 mmol/L). At day 3
there were no signs of illness. On day 7 the child presented with fever (38.6 ºC),
cough and complaints of anorexia. There was no history of significant illness or
allergies. After examination (microscopy was negative for malaria parasites),
broncho-pneumonia was diagnosed and the child was treated with oral
phenoxymethylpenicillin for 5 days and Paracetamol syrup. At day 14 the child
did not attend the follow-up visit, the parents reported that the child died a day
before in a local health post. The event was assessed as unrelated to the study
drug. Autopsy was not performed.
Gametocyte dynamics
The presence of gametocytes in clinical samples was assessed by microscopy
and NASBA and is presented in table 5.3.
At the start of the study 3 patients in the DP arm (4.5%) and 6 patients in the AL
arm (9.0%) carried microscopically detectable gametocytes. Microscopical follow-
up of the presence of gametocytes during the whole study period revealed that in
total 39 samples (distributed over 13 patients) in the DP arm and 18 samples

91
Table 5.2: Summary of adverse events recorded during the study
Adverse event DHA-PQP ALN P-value
Headache 43 (58.9%) 37 (50.7%) 0.318
Abdominal pain 25 (32.4%) 26 (35.6%) 0.862
Weakness 19 (26.0%) 30 (41.1%) 0.035
Anorexia 8 (10.9%) 10 (13.7%) 0.439
Diarrhea 9 (12.3%) 7 (9.6%) 0.785
Cough 16 (21.9%) 17 (23.3%) 0.843
Vomiting 11 (15.1%) 9 (12.3%) 0.806
Pruritis 4 (5.5%) 3 (4.1%) 0.698
(distributed over 9 patients) in the AL arm carried gametocytes (not significantly
different). It was observed that the microscopical detection of gametocytes in
blood slides during the study was subjected to fluctuations (for example a case
positive at day 0, negative at day 1 and subsequently again positive at day 3),
which is probably due to the fact that gametocytes circulate at low levels.
However, at day 7, three patients in the DP group and 1 in the AL group showed
gametocyte positive slides for the first time. At day 28 in none of the cases
gametocytes were observed with microscopy. There was no difference between
children older than 60 months and younger as regards carriage of gametocytes
and density (data not shown).
NASBA analysis on 56 DP treated subjects and 54 AL treated subjects detected
strikingly more gametocyte carriers at the start of the study compared to
microscopy; i.e. 22 study subjects in the DP arm (39.3%) and 21 in the AL
(38.9%) were harboring gametocytes before. The pfs25 NASBA revealed that 34
cases (60.7%) were gametocyte positive in the DP group at day 3, of which 13
cases were newly identified compared to day 0. In contrast, a significantly lower
number of patients (20; 37%) were gametocyte positive in the AL treatment
group at day 3 of which 6 new cases. This trend was also observed at day 7: the
DP arm had 33 (58.9%) gametocyte positive samples, whereas the AL treated
group had a significantly lower number of gametocyte positive samples (11,

92
20.3%). However at day 14 (AL: 12 positive [22.2%], 6 new; DP: 17 [30.4%], 5
new) and day 28 (AL: 5 positive [9.3%], no new cases; DP: 8 [14.3 %], no new
cases) of follow-up no significant difference in gametocyte carriage was observed
between both treatment groups. Stratifying the data for age under and above 60
months showed no difference in either of the groups.
Table 5.3: Occurrence of gametocytes as detected by microscopy or NASBA in the
different study groups at the start of the study and during subsequent follow-up.
Discussion
Several studies have analyzed the efficacy and tolerability of AL and DP and all
show very good results [2, 5, 9, 11, 13-15]. Our findings with the two drugs are
similar with respect to effectiveness and tolerability compared to other studies.
No adverse events other than those related to malaria itself were observed in the
current study, which is in line with other reports. In the present study all children
Gametocyte positive samples Day 0 Day 1 Day 2 Day 3 Day 7 Day 14 Day 28
DP group microscopy (n=67)
Total number of positive cases
Number of new cases observed
3
7
5
7
2
10
0
7
3
5
0
0
0
DP group Nasba (n=56)
Total number of positive cases
Number of new cases observed
22
34a
13
33a
8
17
5
8
0
AL group microscopy (n=67)
Total number of positive cases
Number of new cases observed
6
3
1
3
1
3
0
2
1
1
0
0
0
AL group Nasba (n=54)
Total number of positive cases
Number of new cases observed
21
20
6
11
4
12
6
5
0 a Number of gametocyte carriers detected with NASBA is significantly higher in the DP treated group
compared to the AL treated group.

93
experienced hemoglobin convalescence without difference between the two
treatment arms in contrast to the study of Kamya et al who found a greater
increase in the DP treated patients [14]. The difference in numbers of patients
included in both studies may be responsible for this difference.
The fact that DP can be taken once per day [2, 13, 14] and not necessarily with a
fatty meal could favour the implementation of DP instead of AL. The shorter
elimination half life, and thus the shorter prophylactic effect of AL compared to
those of DP may be considered a disadvantage, but the long half life of
piperaquine and its long presence in the circulation at low concentrations may
lead to quicker development of resistance. In our study one reinfection at day 28
was observed in the AL treated group. Further large scale studies in areas with
different malaria pressure are needed to give answers to these issues.
The effects on gametocytemia and possibly malaria transmission deserve further
study. Whereas asexual parasites were cleared in three days after the initiation
of the two treatment schedules, gametocytemia appeared different when
assessed by microscopy as well as with NASBA. Gametocytes were present in
low numbers throughout follow-up in both study groups. Artemisinin derivatives
have in general a negative effect on gametocyte development and survival and
thus influence malaria transmission, at least in low transmission areas [12, 18-
19]. In this study we did not look at the actual infectiousness of the remaining
gametocyte populations in both treatment arms; the presence of gametocytes
does not necessarily mean that they actually contribute to transmission. Several
studies have shown that gametocytes persist in a large population of previously
infected and treated children [10, 20, 23, 26]. A large proportion of these carriers
has a parasite load below microscopical detection limit, a load that can be
detected with molecular assays like NASBA. Patients with submicroscopic
parasite densities may still be infectious to mosquitoes and may contribute to
transmission [4, 23] as confirmed with membrane feeding experiments [21, 22].
Studies that include reduction of transmission as a component of efficacy of
drugs, thus need to incorporate highly sensitive molecular assays to reliably
assess gametocyte densities.

94
In contrast to the reported trial of Kamya et al [14], the present study showed a
limited effect of DP on gametocyte development in comparison with AL, which
could limit the usefulness of DP to areas with low transmission. It is not clear if
plasma concentrations of dihydroartemisinin in the blood could play a role.
Dihyrodartemisinin is the major and the active metabolite of artemether. So far,
no studies have been performed that compare the plasma levels of
dihydroartemisinin when given as such or after administration of artemether and
subsequent metabolisation. This should be further investigated together with
effect on gametocytogenesis.
The finding of the current study that DP could be less effective in reducing
gametocyte clearance as measured with NASBA could have some implications
for the introduction of this drug. However, our results should be confirmed in
larger studies and in other study areas with different malaria transmission
intensities. Transmission intensity varies significantly in the different African
countries and within a country high and low transmission areas can often be
identified. Malaria endemic countries generally have a national malaria drug
policy for the whole country. Although this is logical from a practical and logistical
point of view, it may not be the best approach for effective malaria control. It
could therefore be more effective if a country develops specific drug policies to
suit regional instead of national requirements.
Acknowledgments
This work was financially supported by the Knowledge and Innovation Fund
Koninklijk Instituut voor de Tropen/Royal Tropical Institute, Amsterdam, The
Netherlands and Stichting Dioraphte, The Netherlands. DP was provided for free
by Sigma-Tau Italy. We thank Dr. J Githure for his help in facilitating the fieldwork
in Mbita. We would like to thank the staff of Kenya Medical Research Institute
(KEMRI) and International Centre for Insect Physiology and Ecology (ICIPE)
Mbita Point for their technical assistance. We also thank the children and their
guardians for their participation in this study.

95
Conflict of interest
The authors declare not to have a conflict of interest. The organisations that
provided financial support had no influence in the design, the actual field and
laboratory work, analysis and writing.
References
�� �-��,�����7�*�-����$��.��&�*�����$��#�������$���("��,�+����%��������*���*���
+�� �������� .�� 5��(93�� ��� ����-*%�� $�� ��-��� ��� ����� �:!� ���2!�(�����,�1�
���������� ���!����,����� ������ ��� ��"����������!����2��� ���� ���
�������� ��� ������������ ��������!�������� ���������� ������� �� %�������� :�
��>(��?�-!�)#���;;)01�!�
�
�� �-��,������("��,�+���*���*���+��.��&�*�����$���������.��*4�$����%��7���5���-�
�������-*%��$��������:����-����!����� !�(�����,�1���������������"����������1�
���!���"� ����� ��� ��"����������!����2��� ���� ��� �������� ���
�����������1���������!���������������������������������>(��?�-!��)�2� 0)�!�
�
)� �-��,� ���� $�&��%-9� 7�� ��������� ��� ����<��� ��� 7�3� ��� 5��(93�� ���
$����-�#���� .�� ����� �:�� ��-��� �!� ���;!� '�+� ����� ���� �� ������"� ��� ����,�
�������������������������"@����&�������������) ��6 0���!�
�
2� 5�*-3�:���$(������.��"�*�������?�9�,��:����-�3��������*<��+��"���*��:���
���+��$*��������:�� 3��$���$*�%���+�!����/�����������������������!�����
���������������"������������������4��������������������:���>(��?�-!�)#���� �0
6!�
�
� #�����5��9���� 7�������������-� $����<3����5�-��3����"*��3��� :.!� ���/!�
�����"� ��� ���� �������� ���������� ������� ���� ��� �������� ���
������������4�������������������������������(���������3����������:!�����)
�
/� 5��3�+!��$����:!��$��3�-���!��:�-����!�������30#��?�����.�!��=�����������
:!�� �66�!�(��������6�������������� ������������������������� :� �������(��<���!�
9�26 0 �)�
96
�
;� ?#�-� ���� 7�*�8%� ���� ����� 7�!� ��� !� -������!����� ����������
����������������������������������:��*-�!�)9 ��1�0 !�
�
1� ?#�-���!�!���*�����!B!��$�3���!7!��7�*�8%���!�!��������7!�!���� !�4���2������
�������������������������?�*�-������; 01;!�
�
6� ?��-��5��?#�-������%����$����(�����$����3���7�����*�����.��#*���B����3����
$�(���?!� ����!� �����"� ���� ����"���� ��"����������!����2��� <-��&�=���
3��������������������������+����������������������������������������>(��?�-!�
����2/60;/!�
�
��� ?*�,�� $�� �������� .�� ��%��-� ��� $*������� ��� ������ "�� .����� �!� ���/!�
>�����"����������0����%����������-�"���������4������������������!�.��$�
���������-!�)'���
�
��� ������ �!��� �!� 7�3�� �!� #�� ?����� ������ =�� #�3���� ?!� ��3�8�� �!�
?K��--����!� ���;!� � -� ��������� ����� ��� ������ ��� ����"� ���� �����"� ���
�������H���������� <3�����I=� ���� ��� �������� ��� ������������
4����������������������������(+���������-!�+!�$�(!����&!���!��,��)�)�)220 �!�
�
��� �*�����P��=��-�.:��"���.����3��=��5�����P������������P*�(���������������*���
���� 7���.�!� ����!�3�������������������� ���������������������B��A���� 5*���
����������� ���!�9���//�0/!�
�
�)� 7�3�� �!�� ������� �!�!�� =�� #�3�����!�� =��"���*,���� :!0.!�� #��?����� �!��
��3�8�� ?!�� ?K��--������ �!�� ���/!� 6���"� ���� �����"� ���
��"����������G����2��� <-��&�I=� ���� ��� �������� ��� ������������
4����������������������������(+�������������� ���-!�+!� $�(!� ���&!���!��,�!�
)�)���� 0�����
�
�2� 73,��+��B9����5*9��%�����*�3%����+%9�3���:5��$��9�$"�����-*��� ��
"����*-� 5�� ��-��� ��� +�-����� .:�� �<%��0����� ��� ?��-,� "!� ���;!� -������!
���������� ������ ��"����������!����2��� ���� �������� ��� �������� ��
������,��������.��$����������-!� ����!��
�

97
� � -��������"�������:�� ������.���,�����+!� ���;� -������!���������������
�����"�����������������4����������������������������3������������:!� 9�� �
�
�/� .�����.!���������!��58*���%���!��5������$!��"���--����!��+*�������!��5<��*3����:!��
7��������!��7��*����:!��7,�3*������:!������������!���,������!����((�����!��"*��3����:!.!����� !�
6������� ������ ���������� ���&� ��� ��!���� �������!���������� ����
�������� ��� ����1� ������������ 4��������� ���������� ������� �� �������1�
5��������������������������(���������2/;Q�2;)!�
�
�;� ������!�!��?��(9���!��.�3��.!�!����*,����!?!����*,����!�!������!�!��?������!�!��
������!�!��$�&��%-9��7!���������!:!��������:!�����2!�0�"����������H����2���
������������������������4����������������������������B������������,��
���������������(��������10��!�
�
�1� .��(�+�����-�������*43<*���������� 7*���� ��.�&�*����������-*&�8�-���������
������:!� �66/� ����������������������������������������������"����(�!�
��$��/ 201!�
�
�6� ��-������#��=*������.��(�+���*43<*���������%,�7���5��(93������("��,�+�����
7*����������-*%��$��������:!�����!� �����������������!����2�������������
������������4����������������������������������2�������������+�����
%�����������������������"����(�!�����6;0)��!�
�
��� �8������� $*&������$����-�,���!� ����!�'����������"���������������+���
������ ��� �������� ��� 4��������� ���������� ������� +��� ���������!
�"����������������������������������2�����������������!�"���������
������������������������������!������������������-�+�$�(����&�����,�!�#��2)20
;!�
�
��� $*��������:�� ���+��?*�,��$��:%�����?�9�,��:����4����������3��+��.�����
��� ���#�� "�� ������ "�!� ��� !� (������� ��� ������� ����������� ��� -�������
���2�����+�������!��������������!�������!�.��$���!��'6�!�
�
��� $(������.��5�*-3� :���"�*������� �����$��#����=��05��3����� 3�� $���
$*�%��� +�!� ���;� 6������������ 4��������� ���������� ������"�� ������
��2����"������������2�������������3�:����&�����,�!�$��2;�02!�

98
�
�)� $(������.��5�*-3���� 3��$��"�*������$%�.��$(���������$*�%���+!����/!�
<6��=����������4�������������������������"�������8�"���������������
�������� +��� ����������!�"�������� ���������"� ��� �� ���������� +���
��������������:�.�-����!����2�)01!�
�
�2� $(������.��$(�����"��$(���������=����?�������?�����������$*�%���+!����2!�
;����������� ��� 4��������� ���������� ������"��� �� ��������� ������ ���
����������"�2��������������������2���!��������������������E�5��(�3�
.�-�����)�$�) J2��
�
� �� $��*��*�"!�����!�>���"�������4��������������A����43(�������-��������
$ ����)0��/�
�
�/� $�9��� �$�� ��&� :��� +�<��� =!� ����!�>�����"����� �� 6������ �������
+��� ������������ ���������� ������� ������ +��� ������2��1� �����2��� ���
����������J��"���������.�-��!�9��2)0 �!�
�
�;� �� �� ���)!�-���������������������������������������������"��������
���������������������������������������������������� �����������"�#!�

99
�
����������
�
�
�
�
Molecular biology the best alternative for diagnosis of
malaria to microscopy? A comparison between
microscopy, antigen detection and molecular tests in
rural Kenya and urban Tanzania
4�?�����)1 1�A��6�&��1�6�-��*����1����'E��)1�'�0�?�'��6������)������
4�-��8��� �
���7����9��89���-���**��#���������&��F7��I�+�,�����&�(����-���*���7���5��3��(��+-�(������(�3�(����(��������?�#�-�����>���>(���*-�?�---�����&�(�����(��������?$��)����7��������$�#�(-�������(��.������,��?��-�$�3���������2�7�,����(��+-�(����-���*��������>���5���(������,�+-�(�����?#��&3����
�
%����������������7�����������'�����) �< ��$=� �9! ���

100
Summary
The objective was to asses the agreement of different diagnostic methods for the
diagnosis and confirmation of the clinical suspicion of Plasmodium infection in
children in Tanzania and Kenya. Finger prick blood was collected from a total
338 children with the clinical suspicion of uncomplicated malaria in health clinics
in Tanzania and Kenya. The presence of Plasmodium parasites was assessed
with microscopy, rapid diagnostic tests (RDT’s) and the molecular assays
Quantitative-Nucleic Acid Sequence Based Amplification (QT-NASBA) and PCR.
The results were compared and analysed for agreement. A high degree of
agreement (88.6% - 100%) was observed between the different tests employed
compared to microscopy. In rural Kenya, with a high incidence of malaria cases,
the � �value was high ranging from 0.94 for RDT’s to 0.76 for PCR. In urban
Tanzania, where there was a low incidence of cases the � value for RDTs was
1.0 but for PCR and NASBA only 0.25 and 0.33, respectively.
Malaria is overestimated if the diagnosis is based solely on clinical signs.
Therefore, laboratory confirmation is essential. Microscopy is a reliable method in
rural areas where malaria is often seen, but RDT’s offer a good alternative with
the advantage that it is an easy and rapid method. Molecular tests are more
sensitive however difficult to implement in rural areas. In areas with lower
incidence, molecular tests detect a significantly higher number of Plasmodium
infections than RDT’s or microscopy. Although implementation of molecular tools
in the detection of malaria parasites can be difficult, the prospect of development
of an easy and cheap detection system makes it promising tools for the near
future.
101
Introduction Initiation of malaria treatment largely depends on good, laboratory-confirmed
diagnosis. However, in many disease endemic countries, clinical diagnosis is the
only method used to decide on treatments as laboratory techniques to confirm
the clinical suspicion are considered to be too labour intensive or are not
sensitive enough [4,8,9]. In general the screening of blood slides by microscopy
is still considered to be the “gold standard”. An experienced microscopist is said
to have a detection limit of approximately 20 parasites/µl [8]. This method is
cheap and simple but labour intensive, time consuming and requires well-trained
personnel who can differentiate between the different Plasmodium species [15].
In recent years, a variety of rapid diagnostic tests (RDT’s) have been developed
for the diagnosis of malaria. These tests are fast, easy to perform and do not
require electricity or specific equipment and currently around US$ 0.62/test
[11,12,23]. These tests are based on the recognition of Plasmodium antigens in
the blood circulation of the patient. The tests can detect less than 100
parasites/µl but with lower parasitaemia their sensitivity decreases, making these
tests unsuitable for patients with low numbers of parasites [12,13]. Another
drawback is the reported persistence of antigens, in particular Histidine Rich
Protein II (HRP-II), in the blood circulation of the patient after parasite clearance,
generating false-positive results when microscopy is used as a reference test
[10,12,21]. However, other reports state that antigen persistence is not the
problem but limitations of microscopy that miss a sub-set of the patient
population [3]. This may be partly because of the skills of the microscopist or the
setting in which microscopy is performed (e.g. a rural vs. an urban setting,
endemic vs. non-endemic regions). Molecular techniques such as Polymerase
Chain Reaction (PCR) and Nucleic Acid Sequence Based Amplification
(NASBA), are much more sensitive than microscopy. For example PCR is said to
have a lower detection limit of between 0,7 and 0,02 parasites/µl [2,6,18].
Quantitative Nucleic Acid Sequence Based Amplification (QT-NASBA) can detect
parasites at a level as low as 0,02 parasites/µl blood, and allows for precise
quantification of the parasite load over a range of 20-108 parasites/ml blood
102
[17,18,19]. This paper describes the comparison of conventional microscopy and
two rapid diagnostic tests for the detection of Plasmodium species, based on the
HRP-II or Plasmodium specific Lactate dehydrogenase, with QT-NASBA and
PCR using blood samples of children with the clinical suspicion of uncomplicated
malaria, visiting a local district hospital (Kenya) and an urban health clinic
(Tanzania).
Materials and Methods
Study population
This prospective study was conducted in two areas in eastern Africa, the rural
Kimbimbi sub-district hospital, (Mwea) a mesoendemic area in the Cental
Province of Kenya, and in an urban setting in the Aga Khan Health Service, Dar
es Salaam, Tanzania. Ethical approval for this study was obtained from the
appropriate local authorities; i.e. Kenya Medical Research Institute (KEMRI)
Kenya (SSC 947), The Aga Khan University Ethical Research Committee and
Health Research Ethics Review Subcommittee, Tanzania. The samples were
collected during the high transmission seasons of May 2005 (Kenya) and
December 2005 (Tanzania). Children (6 months to 12 years) visiting the health
centres, suspected to have uncomplicated malaria and willing to participate in the
study after informed consent of their parents or guardians were included.
Inclusion criteria were: suspicion of uncomplicated malaria, axillary temperature �
37.5 0C or a history of fever in the past 24 hours. 149 children in Kenya and 154
children in Tanzania were enrolled in the study.
Microscopy
Finger prick blood was collected and Giemsa stained thick and thin smears were
prepared according to WHO guidelines but because of local practice staining
times varied from 5 -10 minutes instead of the recommended 20 minutes. Two
independent experienced microscopists, who were blinded to the results of the
other tests performed, examined the smears for the presence of parasites and

103
identified the observed parasite species. Parasitemia was determined from the
thick smears by counting the number of parasites against 200 leukocytes
assuming that there are 8000 leukocytes/µl blood.
Rapid diagnostic tests
Finger prick blood was also used to evaluate the rapid assays OptiMAL (Diamed
AG, Switzerland) and Paracheck Pf (Orchid Biomedical Systems, India). In
addition in Kenya the Parascreen test (Zephyr Biomedicals, Verna Goa, India)
was also included in the study. All the tests were performed according to the
manufacturers’ instructions. Two readers, blinded from the other tests performed,
independently examined the RDTs. An RDT was considered positive when both
the internal control and the test band were stained (irrespective of the intensity of
the staining). A test was considered negative if only the internal control was
visible. The result of an RDT was considered not valid (test failure) if the internal
control was not visible.
PCR and QT-NASBA
Blood was collected on Whatman 903 filter paper (Whatman international Ltd.
Maidston, United Kingdom) and air-dried at room temperature for NASBA and
PCR analysis. DNA and RNA was isolated as described by Boom et al.[5]. All
molecular testing was done blinded from the results of microscopy and RDT
testing. PCR for the detection of Plasmodium in the sample was performed on
the 18S rRNA gene target as described previously [20]. Amplification products
were detected on a 2% ethidium bromide stained agarose gel and visualized
under UV light. QT -NASBA was performed on RNA of 18S rRNA gene on an
IQ5 Real-Time analyser (Bio-RAD, The Netherlands) as described previously
[19] with some modifications by Schneider et al.[18]. A generic Plasmodium
reaction was used with the following primers: forward 5’-
TCAGATACCGTCGTAATCTTA-3’ and reverse 5’-
AATTCTAATACGACTCACTATAGGGAGAAGGAACTTTCTCGCTTGCGCGAA-

104
3’. The reactions were performed with the Nuclisens Basic kit for amplification
(bioMerieux, Boxtel, The Netherlands) according to the manufacturer’s
instructions with a KCl concentration of 80 mM. The reaction mixture (5 �l)
containing the primers (100 pmol/µl), molecular beacon (20 �M) and template
RNA (2.5 �l) was incubated at 65 0C for 2 minutes followed by 2 minutes at 410C.
Thereafter 2.5 �l enzyme mixture from the basic kit was added to each reaction.
Amplification was monitored for 90 minutes after which the results were
analysed. In order to quantify the number of parasites in blood, a 10 fold serial
dilution of 106 to 10 in vitro cultured parasites/ml was used as reference and
processed and analysed as described above.
Statistical analysis
All data was recorded on separate case record forms. The agreement between
microscopy, RDT testing and molecular analysis of blood samples was assessed
using Epi Info version 6.04 (Centre for Disease Control and Prevention, Atlanta,
GA, USA). Kappa (�) value expressed the agreement beyond chance [1] and
were calculated with a 95% confidence interval. A � value of 0.21-0.60 is a
moderate, a � value of 0.61-0.80 a good and � > 0.80 an almost perfect
agreement beyond chance.
Results
Patient recruitment
In Kenya, in total 184 suspected cases of uncomplicated malaria were included
in the present study during a 3-week recruitment period in May 2005. The mean
age of the children was 77,5 months and the sex ratio male:female was 1:1. In
Tanzania, 154 individuals (mean age: 70,6 months; sex ratio: 1,8:1) were
recruited for the study during the 3 weeks the study was conducted (December
2005).
105
Microscopy
Expert microscopy in Kenya (see Table 6.1) revealed 60 slide-positive cases of
malaria (32.6%). There were no discordant readings between the two
independent microscopists who examined the slides. Species determination
identified 58 slides with a mono-infection of P. falciparum ranging from 400
parasites/µl to 828,800 parasites/µl with a mean count of 18,680 parasites/µl and
two slides with mono-infections with P. malariae (not counted). In 124 (63.4 %)
slides Plasmodium parasite were not observed with microscopy. In Tanzania,
only three slides (1.9%) were found P. falciparum positive (160, 280 and 1,000
parasites/µl) and in the remaining 151 slides no parasites were seen. There were
no discrepant microscopic results obtained in Tanzania.
RDTs
The data of RDT testing are summarised in Table 6.1. The results of RDT testing
in Kenya revealed the following: in total, 61 cases were found Plasmodium
falciparum positive with the OptiMal test and two additional OptiMal tests were
positive for Plasmodium non-falciparum (in total 34.2% of the OptiMal tests gave
a positive result), 59 cases (32.0%) with Paracheck and 69 cases (37.5%) with
the Parascreen test. Test failures, which were defined as tests that did not show
a control band, were observed with all three RDTs; i.e. OptiMal four failures,
Paracheck five failures and Parascreen one failure. In Tanzania only three cases
(1.9%) were found positive with both RDTs evaluated which were the same as
identified positive by microscopy. Only one test failure was observed with the
OptiMal test and four failures were found for the Paracheck test. The total
percentage of RDT test failures over all 338 cases examined was 1,5% for the
OptiMal test and 2,7% for the Paracheck test.

106
Tabel 6.1: Comparison of five different diagnostic tests for malaria with microscopy in 338 blood samples from clinically suspected children,
collected at two different endemic areas. The number of positive samples is indicated in each case.
Kenya (n=184) Tanzania (n=154)
Microscopy Positive (400-828800; 18680)a
(n=60)
Microscopy Negative (n=124)
K-value (Confidence-Interval 95%)
Microscopy Positive (160, 280, 1000)b
(n=3)
Micoscopy Negative (n=151)
K-value (Confidence- Interval 95%)
PCR 60 21 0.76 (0.667-0.855) 2 11 0.25 (-0.09-0.568)
NASBA 60 17 0.80 (0.716-0.891) 3 11 0.33 (0.015-0.648)
OptiMal® 58 3 0.94 (0.867-0.985) 3 0 1.0 (1.0-1.0)
Paracheck® 56 3 0.91 (0.851-0.975) 3 0 1.0 (1.0-1.0)
Parascreen® 60 9 0.89 (0.825-0.961) n/a n/a n/a
(a) parasites/µl (range; mean)
(b) parasites/µl
(n/a) not applicable
107
Molecular Biology
Blood spots collected on filter paper at both study sites were analysed in the
laboratory in the Netherlands for the presence of Plasmodium DNA/RNA with
PCR and QT-NASBA, respectively (see Table 6.1). Forty-four percent (n=81) of
the samples collected in Kenya were found positive with PCR and 41,8% was
positive with NASBA (n=77), with parasite counts ranging from 16 – 108, with a
mean count of 390,000 parasites/ml blood). Six of the PCR-positive samples
were negative with all other tests including NASBA. Two NASBA-positive
samples (parasite count 9 and 339 parasites/ml) were found negative with PCR
as well as with the other tests employed in this study. Thirteen samples (8.4%)
collected in Tanzania were found positive with PCR and 14 samples (9.1%) with
QT-NASBA (parasite counts ranging from 9-1,370,000, mean count: 149,000 ml/
blood). All microscopy positive samples from Kenya were also found positive in
PCR and NASBA. One microscopy positive sample from Tanzania was found
negative by PCR but positive by NASBA. One sample from Tanzania was found
positive by PCR but negative with the other tests employed.
Agreement between microscopy, RDTs and molecular tests
The degree of agreement, with a 95% confidence interval, observed between the
different diagnostic test is presented in Table 1. The agreement beyond chance
(� �value) varied in the different settings. High degree of agreement was observed
between microscopy and RDT in Kenya. The number of positive cases found in
Tanzania was too little to make a meaningful statement about agreement
between the RDTs and microscopy. In Kenya molecular tests had also a high
agreement for PCR and NASBA. In Tanzania, on the other hand, PCR and
NASBA had only a moderate agreement beyond chance.
Quantitative Nucleic Acid Based Assay allowed for the sub-microscopic
quantification of P. falciparum in blood samples. The mean parasite count with
NASBA observed in the microscopy-negative samples from Kenya was 6,940
parasites/ml blood, with a range of 16 – 12,000 parasites/ml. In Tanzania, the

108
mean count of the NASBA-positive- microscopy-negative samples was 75,000
parasites/ml blood, over a range of 9 - 660,000 parasites/ml.
Discussion
Malaria can be a life-threatening disease, especially in children, when left
untreated and therefore, it is important to have a quick and accurate diagnosis.
However, even though malaria is a frequently encountered disease in many
developing countries, it is difficult to impossible to make the right diagnosis
relying on clinical signs only. To prevent unnecessary anti-malarial treatment, it is
important to confirm clinical suspicions with a good laboratory test. In the light of
the changing drug policies of many African countries, including Tanzania and
Kenya, where the expensive Artimisinin based Combination Therapy (ACT) drugs
are prescribed as first line treatment, good laboratory confirmation will also have
its impact on the economical situation [8,14]. In this study we assessed which
method is best suited for confirmation of the clinical suspicion of malaria in two
areas: in Tanzania, with low prevalence of malaria, and Kenya with a high
prevalence of malaria, where diagnosis relying on clinical signs only is always an
overestimation of the true incidence. For this purpose blood samples of children
presenting themselves with the clinical symptoms of malaria were analysed with
microscopy, RDT or molecular biology. Almost all microscopy positive samples
were found positive with the RDT’s and molecular tests. However, the molecular
tests found a substantial higher amount of positive samples compared to the
RDT’s and microscopy, confirming the higher sensitivity of QT-NASBA/PCR [19].
The mean number of parasites found in the QT-NASBA positive – microscopy
negative samples in Kenya was below the accepted lower detection limit of 20
parasites/µl blood for microscopy [8]. It is noted however, that in Tanzania two
samples were scored microscopically negative that had QT-NASBA parasite
counts above this accepted limit. The shortened staining time of the blood slides
may have caused missing these infections.

109
The sensitivity of the molecular tests identifies more children with low
parasitaemia. As these children are symptomatic with the clinical suspicion of
malaria the chances of feeling ill because of the submicroscopic infection with
Plasmodium are real. However, the possibility of also having another cause for
fever cannot be excluded. Nevertheless, the presence of parasites in the blood
indicates a malaria infection that should be treated as such. Therefore, molecular
tests would be preferred to microscopy and RDT testing for the confirmation of
the clinical suspicion of malaria [16]. The drawback however is that many
molecular tools and protocols are too cumbersome, too expensive, and not
simple or rapid ore even not available at all because of limited resources such as
electricity and inadequate laboratory infrastructures in developing countries [7]. In
areas where incidence is low, the impact of molecular diagnostics is much higher
than in high malaria incidence areas, therefore making molecular tools more
important in the former. The more developed urban hospitals laboratories, such
Aga Khan in Dar es Salaam, would greatly improve their diagnosis.
Implementation of molecular methods as a quality control tool for microscopy
diagnosis of Plasmodium infections would not only be an improvement for the
developing countries but also in research settings and in the quality control
programmes of routine diagnosis for malaria of developed countries where
infections are less frequently encountered. The costs may be an obstacle, but in
practice patients are at present treated on clinical grounds, often more
unnecessarily than necessary. The presently advised ACT treatment is very
costly. To avoid patient costs, proper diagnostic testing is favoured above
prescription of medication on clinical grounds only. In the more underdeveloped
areas, where the resources are poor, implementation of these techniques is a
great obstacle. However in areas where there is a high incidence of malaria the
lack of facilities undermines the benefit of molecular tools. RDT’s, however, are in
our hands as sensitive as microscopy and have a good agreement beyond
chance. The simple format and quick results without the need of good
microscopy equipment and electricity makes these test a good alternative to
microscopy in these areas [11]. Nevertheless, the search for increased detection

110
sensitivity combined with a simple detection system is an ongoing challenge [22]
and would ultimately lead to the feasibility of also introducing molecular tools in
the developing areas where the need is immense but the facilities limited.
Acknowledgements
This work was supported by the Hubrecht-Janssen Fund, KIT (Koninklijk Instituut
voor de Tropen/Royal Tropical Institute, Amsterdam, The Netherlands). We
would like to thank the staff of Kimbimbi district hospital Kenya and of the Aga
Khan Health Centre, Dar es Salaam Tanzania for their technical assistance and
Dr John Mpangala of the Aga Khan Health Centre for his help in obtaining the
ethical clearance for this study. We also thank the children and their guardians
for their participation in this study.
�
�
References
�� ���3�!�?!"!�� �66�!�4��������6�������� ���� ������(������� ��&3��E� �����
��������/���&&!�
�
�� 5����$�E�+�>������%��������������(���%��2���������43(�������������"!�
����-����.�-������,�)9��));0)2��
�
)� 5��� ?+�� ���-��� ?�� E� ������ �5� ��� �?���� ������ ������� ��� �� 4���������
�������������������������� �������������������������������������������
������"������������"�+����������������+����������������3��(��:�*�����>��
���&�(�����(�������,����$�1��660��)�
�
2� 5�8���7��� <���$������-������E�"��%����5�������-������������������������
�������������������������������������������>������������!����&�(�����(���
��������������������1��)�0�)/�
�
� 5��3�+��$����:��$��3�-�����:�-�����������30#��?�����.���=�����������:!�
�66�� (���� ���� 6���� ������ ���� ���������� ��� ������ ������ :�*���� �>� �����(��
��(��<�����,� 91�26 0 �)�

111
/� ��3-������������?$�������-�������������0���������4�������������������
����������������������"�(��!%��43(!����(*���5��(�3�(��.�-������,�))91��2;0
� ��
�
;� ��-(������E�"��<*-(���.!������'�+���������43(�����������������������@�
����-����.�-������,�)9��)6 0)61�
�
1� :��93��������<%�+���7����3��� ����!��66 �����!����������������������"�
��������������������������������������������������������������+!�5*������
�>��������������� ����������$�1���)0��;�
�
6� �*43<*���������-�����E�7,��?�����!��661�3����������������������������
��������������������������������������������������������������������
�����+����������������-(����-��>����+�,��$�(��,��>����&�(�����(�������,����# 1�
2 026�
�
��� �,4,� ��� .*9���,93� $�� �����#��(�� 7�� ����-*%�� $�� ����� �:� �����
4����������4�������������������'(4! �������������"����������������������
�����������-(����-��>����+�,��$�(��,��>����&�(�����(�������,���!�#����;60�1��
�
��� �<������������������3�+����!����/�3���������������4������&!4��I�����
+�����������"1����������������������4����������������������������%��,�����
����-��>����&�(�����(���E�.�-������,�)��1��� 0����
�
��� ����,��!������(�������������������������������������������(����(��<�����,�
+#�%-�)�1�//0;1�
�
�)� �*��,��7��5���?��"--���+��E�����-��(������!����)�(�����������������������
������!����&�(�����(���������������������!�9��1;/011)�
�
�2� �*�<���%� �7!� ��� � -������!����� ���������� ������� <-3%�=�� ����
��������������������������������������������"R��(�����&�(�#�1�)��0)� ��
�
� � +,<*�������<���+��?�9�,������!����2�*���������������������������+���
�����������������%��,��������������������"��5����-�����(��:�*����� #1������
�
112
�/� +*<���:���5*���-����$*<���-����5C*������.*���$�E�5������!������.��������
����������"���������"��������������������������������������������������
����43(!�����������������������:�*�����>������(����(��<�����,��#1��;)/0�;);�
�
�;� $(�������?�� $(�����":�� ��33�-� �:�� 7��������� ��=��-�.:� E�#��"�����!� ���)�
5�����������2��������������������2������������������������������������
��������������������!� �*��&��:�*�����>������(����(��<�����,������>(���*-�?�--�
1� 0 ;�
�
�1� $(������.�������-���� $(�����"�����!� ��� �(��!%��A�����-���62����
:���� -���������� �� ���� �������� ����� (��!%�� 43(� ���� 2����������� ���
4��������������������:�*�����>������(����(��<�����,����2��02� �
�
�6� $(�����":�� -93���� 7���������� $(�������?���E� 3�� $�!� �����0����������
2��������������4���������������������������������������2���������������
�����2���������������������:�*�����>�������(����(��<�����,��91�2�;�02�; �
�
��� $��*��*� "� �66/� 0������ ���� ���������� ��� ��� ����� ������� �������
��������������������"�43(������������������-�������(*���5�����,���1��/)0�6��
�
��� �8�������$*&������$��?,������*����5:�E���-�,���!��666�?������������������73%�
������� 4��G4��� ������������ ���� ���� ������� ��� 4��������� ���������� �����
4��������� ����� �� ������� +��� �� ��������� ������� �������� ��� ������� ��
������7��������:�*�����>�������(����(��<�����,��$1��2��0�2�;�
�
��� ����(�3<�?���%�����+��E�������$!��661�-����������������������0A-!�����
������������*����� &�����-����5���(������,�#1�/��0/�1!�
�
�)� ����-��(������������(�����������������2���������������������!�����-����
.�-������,�)$1�)�;0)�6�

113
����������
�
�
�
�
�Molecular diagnosis of malaria for the field:
development of a novel, one-step Nucleic Acid Lateral
Flow Immuno-Assay for the detection of all 4 human
Plasmodium species and its evaluation in Mbita, Kenya
�
�
�
4�?�����)1 1�-������-�������1�4��6�+��1�4�-��8��� �����'�0�?�'��6������)�
���7����9��89���-���**��#���������&��F7��I�+�,�����&�(����-���*���7���5��3��(��+-�(����3-���3��
���(�3�(����(��������?�#�-�����>���>(���*-�?�---�����&�(�����(��������?$���3-���3��)������(������,E������$(��(-�"��*&�F��$"I�������������#�-��,����+-�(����������������2�����������������>�����-(��.�,-�����,�����(����,��F���.�I���<���.�������<���7�,�
��
0�����������������"�����7��������0�����)�< ��9=�� )!� $�

114
Summary
Microscopy is frequently used for the diagnosis of malaria, but at low
parasitaemia it becomes less sensitive and time consuming. Molecular tools
allow for specific and sensitive diagnosis of malaria but current formats such as
PCR combined with gel electrophoresis and real-time assays, are difficult to
implement in resource-poor settings. This study describes the development of a
simple, fast (results in 10 minutes), sensitive and specific detection system,
Nucleic Acid Lateral Flow Immunoassay (NALFIA) for amplified PCR products of
Pan-Plasmodiun, (i.e P. falciparum, P. vivax, P. ovale and P. malariae). The
lower detection limit of NALFIA is 0.3 to 3 parasites/ul which is 10 fold more
sensitive compared to gel-electrophoresis analysis. Further evaluation of the
Pan-Plasmodium assay was performed under field conditions in rural Kenya, in
which 650 clinical samples of clinically suspected malaria cases were analyzed
with NALFIA, gel-electrophoresis and microscopy. Comparing microscopy with
NALFIA the latter found more positive samples (agreement: 95%; k-value 0.85).
However, when gel-electrophoresis was compared with NALFIA an excellent
agreement (98.5%) was found and a k-value of 0.96 indicated an almost equal
performance of the two assays. In conclusion this study shows that the
developed NALFIA is more sensitive than microscopy and this technique can be
a good alternative for the detection of PCR products while circumventing the use
of electricity or expensive equipment therefore, making NALFIA the first step in
opening the way to the use of molecular diagnosis in the field.
115
Introduction
Malaria is the leading parasitic disease in the world. Annually 1 to 2 million
people die because of to the disease, mostly children younger than 5 years from
resource-poor countries [27]. Prompt and accurate diagnosis is essential for
treatment of the patient. For decades microscopy has been the method of choice
for the diagnosis of malaria, and it is, by most considered to be the gold standard
[9, 14]. In recent years, molecular techniques such as PCR have been developed
to replace microscopy [9,11,18,22]. PCR has evolved as one of the most specific
and sensitive methods for the diagnosis of infectious diseases and many specific
applications for detection of pathogenic micro-organisms have been reported
[6,7,23,25]. However, molecular techniques are not routinely implemented in
developing countries because of the complexity of these tests and the lack of
resources to perform these adequately and on a routine basis. One of the major
obstacles is the need for continuous sources of electricity and complex apparatus
such as PCR machines [16,25,28]. The analysis of PCR results involves the
handling of labour intensive readout systems, such as electrophoresis systems
that use very toxic ethidium bromide-stained gels and hazardous UV light
transilluminators. These systems are expensive and require well-organised
laboratories [28]. The continuous search for simplified methods, which can be
applied in resource-poor settings, has led to the development of several rapid
diagnostic tests [9,14]. However, for malaria, these tests are based on antigen
detection with a high detection limit (100 parasites/�l) and, because of the
persistence of antigens after treatment, these tests are not suited for follow up
after treatment [17,19]. Molecular tools do not have these drawbacks, but up till
now easy read out systems were lacking. Nucleic Acid Lateral Flow Immuno
Assay (NALFIA) is a simple readout system for nucleic acids and has been
successfully applied for the detection of food-borne pathogens such as Bacillus
cereus and Salmonella [3]. A NALFIA is a rapid immunochromatographic test to
detect labeled amplicon products on a nitrocellulose stick coated with specific
antibodies [1,5]. The amplicons are labeled via specific primers that contain a
biotin molecule and a hapten. This complex is detected by direct interaction with
116
a colloidal, neutravidin labelled carbon particle. The detection test is a simple,
straightforward, and safe one-step procedure in which the results are visible
within 10-20 minutes.
This article describes the development of a NALFIA for the detection of all four
human Plasmodium species, that is a pan-Plasmodium NALFIA which in this
format is, not able to discriminate between the different Plasmodium species.
The performance of the NALFIA is compared with conventional PCR combined
with gel electrophoresis and microscopy. In addition, the article describes the
evaluation of the developed pan-Plasmodium NALFIA conducted under field
conditions in rural Kenya.
Material and Methods
NALFIA development and analytical performance in the laboratory
Nitrocellulose strips were coated with anti-Digoxigenin (�-Dig) antibodies (200
ng/µl). A 0.2% colloidal carbon suspension was conjugated with 350 µg/ml
neutravidin. Initial laboratory optimization and laboratory validation of the NALFIA
test was performed on DNA extracted from P. falciparum in vitro culture (strain
NF54) with a known parasitaemia (obtained from Radboud University Nijmegen,
The Netherlands). These samples were subsequently diluted to obtain a serial
dilution panel with a parasitaemia ranging from 3,0 * 105 parasites/µl to 3,0 *10-2
parasites/ µl. The samples resulting from this panel were used in separate PCR
reactions and subsequently used in the NALFIA. The serial dilution experiments
were performed in triplicate. In addition a small panel of DNA purified extracts
from microscopy confirmed patients (n = 53), visiting various outpatient clinics in
the Netherlands; that is, P. malariae n=9; P. ovale n=2; P. vivax n=20 and P.
falciparum n=22 were analyzed and 10 blood donations from healthy Dutch
volunteers were used as negative controls.
Detection of genomic DNA on either the nitrocellulose (NALFIA test), or for
comparison using standard electrophoresis on a 2% ethidium bromide stained
agarose gel and visualization under UV light, was performed after PCR
amplification of the 18S ribosomal RNA gene of Plasmodium. PCR was

117
performed with a 5’Digoxigenin-labelled forward primer (primer N1) 5’-
TCAGATACCGTCGTAATCTTA-3’ (25 pmol) and 5’Biotin-labelled reverse primer
(primer N2) 5’-AACTTTCTCGCTTGCGCG-3’ (25 pmol). These pan-Plasmodium
specific primers, without the T7 promotor region, were published [21] and chosen
for their specificity and the absence of cross-reactivity with other species.
The following amplification protocol was used: 2 µl template was added to a 25 µl
reaction mixture of 2,5 µl 10X PCR buffer, primer, 0.25 µmol/l dNTP mix, 0.5 µl of
MgCl2 (200mM) and 1 U Hotstart Taq polymerase (Quiagen, United Kingdom).
The DNA was amplified by incubation for 10 min at 95 ºC, followed by 35 cycles
of 1 min at 94 ºC 15 sec at 57 ºC 1 min at 72 ºC and finally an extension step of
10 min at 72 ºC.
All amplification products were analyzed on nitrocellulose strips by adding 1 µl
PCR product mixed with 1 µl neutravidin labelled carbon to 100 µl running buffer
(0,1 M borate buffer, 1% bovine serum albumin (BSA), 0.05% Tween-20). The
strips were run for a maximum of 20 minutes at room temperature after which the
results were interpreted.
Study population for the evaluation of NALFIA under field conditions
To evaluate the performance of NALFIA under field conditions a prospective
study was conducted in Mbita, Western Kenya on the shores of Lake Victoria.
Ethical approval for the study was obtained from the Scientific Steering
Committee and Ethical Review Committee of Kenya Medical Research Institute
(SSC 947). In total 650 samples were collected of which 119 samples were
positive for malaria by microscopy. One hundred and nine samples had P.
Falciparum only, 9 samples contained P. malariae and 1 sample contained, next
to P. falciparum, P. ovale. The study was performed during the high-transmission
season April to May 2007. Children (6 months to 12 years old) visiting the
outpatient clinic of the health centre with the clinical suspicion of uncomplicated
malaria and willing to participate in the study, and after obtaining informed
consent of their parents or guardians, were included. Inclusion criteria were:

118
clinical suspicion of uncomplicated malaria, axillary temperature � 37.5 0C or a
history of fever in the past 48 hours.
Sample collection for the field evaluation of the Pan-Plasmodium NALFIA
One drop of finger prick blood was taken for microscopy, and an additional 200 µl
of finger prick blood sample was taken for DNA isolation and PCR analysis from
all the patients meeting the inclusion criteria as mentioned above. Samples were
collected in EDTA tubes (0.78 mg EDTA-K2) (Terumo, Belgium) and extracted on
site with the QuiaAmp extraction kit (Quiagen, United Kingdom). After extraction,
samples were amplified by PCR and analyzed with NALFIA (as described below).
Field evaluation NALFIA
PCR for pan-Plasmodium was performed in the field following the same protocol
as described above. After amplification, 1 µl of PCR product was mixed with 100
µl of running buffer (0,1 M borate buffer, 1% BSA, 0.05% Tween-20) and added
to a tube containing 1 µl dried neutravidin labelled carbon coated to the bottom
(Koets et al., 2006). Following re-suspension of the neutravidin labelled carbon
nano-particles by shortly shaking the tube, a nitrocellulose strip was placed in the
tube, and the fluid was allowed to run through the strip for 10 minutes at ambient
temperature after which, the strips were interpreted.
Microscopy
Giemsa stained thick and thin smears were prepared from finger prick blood
according to WHO guidelines [26]. Two independent experienced microscopists,
blinded from the results of the PCR tests, examined the smears for the presence
of parasites and identified the observed parasite species. Parasitaemia was
determined from thick smears by counting the number of parasites against 200
leukocytes, assuming that there are 8000 leukocytes/µl blood. The presence of
gametocytes was recorded as seen or not seen.

119
PCR-gel electrophoresis under field conditions
PCR for the detection of pan-Plasmodium DNA in the sample was performed on
the 18S rRNA gene. Following, in principle, the protocol described above, but
with modified primers that is using unlabeled primers with the same sequence as
primer N1 (12.5 µmol/l) and primer N2 (12.5 µmol/l) generating a 180 bp
amplification product. Amplification was carried out as described under the PCR-
NALFIA section. Amplification products were detected on a 3 % ethidium bromide
stained precast Mini ReadyAgarose Gel; TAE (Bio-RAD, The Netherlands) and
run for 3 hours on a field proof mini electrophoresis system on batteries (700-
7127; VWR-international, The Netherlands). The gels were visualized under UV
light with a hand UV-illuminator (VWR-International, The Netherlands). All PCR
runs contained a positive DNA template sample as positive control and a non
template H2O sample as negative control.
Isolation amplification and internal assay control
Lateral flow assay performance was assessed by the binding of neutravidin
labelled-carbon nano-particles to the position of the lateral flow immuno-assay
where biotinylated Goat anti-Mouse IgG was spotted on the stick. (figure 7.1). If
no black band appeared the flow assay was considered invalid.
To control for isolation, inhibition and amplification, the glyceraldehyde-3-
phosphate dehydrogenase (GAPDH) household gene was used as a control
target and amplified as described by Hennig et al. [10]. In addition, each PCR run
contained a non template control (H2O) and a positive control to check for PCR
performance. Amplification products were detected on a 2% ethidium bromide
stained agarose gel and visualized under UV light.
Statistical analysis
Data were recorded on idividual case record forms. The agreement between
microscopy, conventional PCR and NALFIA analysis of blood samples was
assessed using Epi Info version 6.04 (Centre for Disease Control and Prevention,
Atlanta, GA, USA). Kappa (�)-values expressed the agreement beyond chance

120
[2] and were calculated with a 95% confidence interval. A � value of 0.21-0.60 is
moderate, a � value of 0.61-0.80 is good and � > 0.80 is an almost perfect
agreement beyond chance.
Results
Analytic performance of NALFIA
The lower detection limit of the developed NALFIA assay was determined by
analyzing serial dilutions of DNA isolated from P. falciparum cultures. The
detection limit was 0.3-3 parasites/µl. All results were compared to gel analysis,
which showed to be 10-fold less sensitive. Blood samples (n=10) from healthy
donors showed no reaction. Further sensitivity analysis was performed on a
panel of 53 microscopy-positive diagnostic samples (table 7.1). Forty-eight
samples were positive for Plasmodium in NALFIA as well as with gel analysis.
Figure 7.1: example of positive and negative NALFIA
The left stick shows the negative control sample that does
not contain target DNA. Only the control line becomes
positive. The stick on the right shows a NALFIA with the
amplified Plasmodium product (lower band) and the control
line (upper band).

121
Table 7.1. Overview of the results of the clinical laboratory analysis of NALFIA..
Number of samples positive for each target
P. falciparum (n=22)
P. vivax (n=20)
P. ovale (n=2)
P. malariae (n=9)
Negative (n=10)
Total
PCR-gel 22/22 (100%) 20/20 (100%) 2/2 (100%) 5/9 (55.6%)* 0/10 49/53 (93%)
PCR-NALFIA 22/22 (100%) 19/20 (95%) 2/2 (100%) 6/9 (66.7%)* 0/10 49/53 (93%)
* 3 samples tested for GAPDH were negative suggesting inhibition or DNA degradation

122
One P. vivax sample was positive only with gel analysis, one P. malariae sample
was only NALFIA-positive and three samples were negative with both methods.
An extraction control with the GAPDH PCR was performed on the three samples
that were negative with both assyas, and all these samples were negative with
this PCR as well, indicating that DNA was degraded in these samples, probably
because of prolonged storage.
Clinical sample collection in the field
In total, 650 suspected cases of uncomplicated malaria were included in the
present study during a 5 week recruitment period in April to May 2007. The mean
age of the children was 54.4 months and the sex ratio male:female was 1:0.9.
Children presented themselves with general symptoms such as fever, coughing,
headache, vomiting, weakness and muscle pains. Other diseases that were seen
in this group were helminthic infections and respiratory tract infections.
Microscopy under field conditions
One hundred and nineteen of the 650 slides were positive for Plasmodium; 109
of these were identified as P. falciparum (92%). The parasitaemia of P.
falciparum ranged from 40 to 72 640 parasites/µl with a mean of 9 372
parasites/µl. In 21 of the P. falciparum slide-positive cases, only gametocytes
were observed. Another 9 slides were positive for P. Malariae, of which 5
samples were a mixed infection with P. falciparum. One sample was identified as
a P. falciparum/P. ovale mixed infection.
PCR electrophoresis and NALFIA evaluation under field conditions
DNA was extracted from the 650 clinical samples collected in the field according
to protocol for 200 µl of blood. Fifteen samples required addition of phosphate
buffered saline to reach the starting volume of 200 µl.
A first round of PCR assays followed by gel electrophoresis analyses was not
satisfactory due to severe power interruptions. In order to ensure a constant
supply of power, a field generator was attached to the PCR machine and the

123
extracted clinical samples were re-analysed with PCR followed by gel
electrophoresis (system on batteries) and NALFIA. The results of comparison
microscopy with PCR followed by gel electrophoresis or NALFIA, and between
both molecular tests employed for the detection of the presence of Plasmodium
species in the clinical samples is presented in Table 7.2. Compared with
microscopy, PCR followed by gel electrophoresis detected an additional 19
Plasmodium positive samples and NALFIA detection revealed 25 additional
positive samples. In contrast, gel electrophoresis was negative in 4 microscopy
positive cases and NALFIA missed 7 slide positive cases. GAPDH analysis to
assess insufficient DNA extraction or degradation was not performed under field
conditions, but only in the laboratory to assure proper performance of the PCR
and to have no hindrance of poorer field conditions.
The degree of agreement, with a 95% confidence interval, observed between the
different diagnostic tests is also presented in Table 7.2. The agreement beyond
chance (�-�value) varied slightly between the different tests compared, but all had
an almost perfect agreement. In particular, when the two molecular detection
tools were compared with each other an excellent agreement was found, and a �-
-value of 0.96 indicated an almost equal performance of the two assays.
Discussion
In many countries, molecular diagnosis of infectious diseases in general, and for
malaria in particular, is not routinely implemented, although a growing number of
countries want to use these techniques in their laboratories [19]. However, lack of
both resources and handling of expensive or hazardous products hamper this
implementation [16, 28]. Therefore, microscopy is still used as the method of
choice, which has its own advantages over standard molecular methods such as
PCR. Microscopy is cheap, almost no equipment is required, and quantification
as well as identification of different species and parasite stages is possible. In
contrast, PCR requires hazardous reagents for visualization of the amplification
products such as ethidium bromide and UV transilluminators whereas real-time

124
Table 7.2: Comparison of the three different assays, i.e. microscopy, PCR followed by NALFIA
(PCR-NALFIA) or PCR followed by gel electrophoresis (PCR-gel) employed in the study for the
diagnosis of malaria of 650 clinically suspected children.
PCR gel positive PCR gel negative Total
Microscopy positive 115 4 119
Microscopy negative 19 512 531
Total 134 516 650
Agreement:96.4%; � value = 0.89; CI 95% = 0.84 - 0.93
PCR NALFIA positive PCR NALFIA negative Total
Microscopy positive 112 7 119
Microscopy negative 24 507 531
Total 136 514 650
Agreement: 95.2%; � value = 0.85; 95% CI = 0.80 - 0.90
PCR NALFIA positive PCR NALFIA negative Total
PCR gel positive 131 3 134
PCR gel negative 5 511 516
Total 136 514 650
Agreement:98.8%; � value = 0.96; 95% CI = 0.94 - 0.99
PCR, which does not use these instruments, is too expensive to be employed in
many endemic regions. This article describes the first steps towards the
development of a simple, multi-analyte and user-friendly detection tool for
genomic material of Plasmodium species which makes the use of gel
electrophoresis and UV light redundant. The developed NALFIA assay has

125
shown to be as sensitive as PCR combined with electrophoresis, but it has an
additional advantage because NALFIA results available after 10 minutes of
incubation, in contrast to 1.5 to 3 hrs needed for gel electrophoresis.
This study showed some negative results with PCR, which could be explained
because of degradation or insufficient extraction of DNA by using a GAPDH-PCR
control for the presence of human DNA. Future incorporation of this assay into
the NALFIA for multiplex analysis will circumvent extra analysis and, in addition,
controls for the amplification reaction itself. Furthermore, a multiplex assay for the
four different species can be developed as well and incorporated in one analyte
[5]. Although the NALFIA format is very promising and effective, one of the
drawbacks of this prototype analysis system is the need of a PCR. Despite the
fact that PCR is currently the most widely used amplification method, it requires a
thermocycler and, consequently, electricity. During this trial, several assays had
to be reanalyzed because of power-failures during the PCR-amplification runs.
Implementation of a back-up generator evaded this problem and showed the
possibility to conduct molecular diagnostics in peripheral, poorly equipped
hospitals but it was still considered sub-optimal. Transferring the amplification
system to an isothermal method, for example Loop-mediated isothermal
amplification (LAMP) [8], exponential amplification reaction (EXPAR) [24], or
Nucleic Acid Sequence Based Amplification (NASBA) [4] would circumvent the
need of a thermocycler and electricity as well as reduce the time for the whole
amplification procedure to 30-60 minutes, thereby hugely increasing the
applicability of this molecular diagnostic detection device and molecular
diagnostics in endemic settings [11]. In addition, methods such as LAMP or
NASBA, that specifically detect RNA enable the development of stage specific
(i.e. asexual and gametocyte stages) assays [20] which will be useful in
monitoring therapeutic success. PCR and antigen capture tests, such as rapid
diagnostic tests, are not able to discriminate between these stages and,
therefore, post-therapeutic monitoring of patients is difficult.
In conclusion, the first steps towards a fast, simple, accurate and sensitive
detection method for the molecular diagnosis of malaria in endemic and resource

126
pour settings is described, and the feasibility to perform this kind of tests under
difficult field conditions has been proven. In potential this assay will allow for a
wide variety of screening possibilities from species to stage-specific tests [5].
Although the test evaluated here is still based on PCR, the translation into an
isothermal amplification assay, for example, NASBA based test, could finally
open the door to the wider use of molecular tools in developing and malaria
endemic regions.
Acknowledgments
This work was partially supported by the Knowledge and Innovation Fund.
(Koninklijk Instituut voor de Tropen/Royal Tropical Institute, Amsterdam, The
Netherlands) and Stichting Dioraphte, The Netherlands. We would like to thank
the staff of Kenya Medical Research Institute (KEMRI), dr. S.A. Omar and her
technical staff and International Centre for Insect Physiology and Ecology,
(ICIPE) and the people of St. Jude’s clinic at Mbita Point for their technical
assistance. We also thank the children and their guardians for their participation
in this study. Wanda Konijn has been of great help in collecting samples in the
field and we thank Annette van Lonkhuyzen for her work on the internal control.
Many thanks to Brigit Beelen for producing the NALFIA lateral flow tests and
critically reading the manuscript.
�
�
References
�!� ����*-���!�!���!�#���3�������+!�!�����-���!�!�.(9��:!�!���(��-����"!�!��,��!�
���)!� 4������� ��� ���� ����� ����� �����&� ������� ���� ������� ����
��������,������������������ �������������:��&&����(��<���!�#�')1�06!�
�
�!� ����3�!�?!"!�� �66�!�4��������6������������������(������� ��&3��E������
��������/���&&!�
�

127
)!� ��3������#���������!�7��-!���� �6�������������������������������0A-�
��������������������������������������+������������������������������!�
��'� +&��� 3����-� >��� <������(�� ��� (�3�(�� (���3����-� ��� >���� ��� >�!� ��-!� �!� #��
�3�������?!�5�*������!��*%�-�����������(�3�(�.*<��-��-��������������
�������-���$5�'�6�;/661 )���&�-��� 0��/!�
�
2!� ���3&����:���66��A����������2���!�������������������*�!����'6�06�!�
�
!�� ?�����:!�!����5!���,����;!�.���������+���������"����������������������������
�������������������������������,������������+��������������"���*(��(��(���
+-������0;2�
�
/!� "�(�0P*����������!��:!�"�����0�������"!��*�����!��-&-������!�!�:�3���������!�
����� 6���������� ���������� ��� �"���������� ����� ���� �"����������
��������������������������� ��������"��K��������������������43(�� :!�����!�
��(��<���!�����2/2/02/ ��
�
;!�� "����!� .!�� ��� �!� ��*��!� ���)!� 0������ ���� ����������� ��� ��������
�"������������ ������������������������������ ��������"�43(������,"�!
��&������������������"!�:!�����!���(��<���!��)��);0�2��
�
1!� �����!�!��+!����<��:!�$��<���9����5!�7�*�������:!�$���(��-�����&���!����9����!�:����
$!� �9������!��-*<��!� ���;!�0���������?����4���������6�����"�>���!�����
6���!6�����.���!������7���������-��������������3������0��������:������
��(��<���!�:*���)�&*<�
�
6!� ��%9-������7!�!�7��!����;!�-��������������������������4&���+#������
��>(�����!���21 06 �
�
��!� ����������*�3�?�����%���?��7�S������7��(�����!������-������(%!43(�����������
���������'3B�(A-������������������������������->*-�����)'����0���/!�
�
��!� �*(9��?!����/!�4����������������������+���������������������������@�
�4&���+#!���!�?#�(-!����2��0)21�
�

128
��!� 7��(9�� �!:!� �666!�A����� ���� ������� ���������� �����1� �������1� ����
����������������3!����2 )02 1!�
�
�)!� 7��-����8����������$�����:���5�����#�(��"���?�9-��������#���3�����!�
���/!�-����������������+����������"������������������������������!��"�������
���+��&������:���#�����������9'62�J/!�
�
�2!� �9�����!�!���!:!�.�3������!�!������661�-���+�����������������2�������
�����������������������������&����.�-�����# �2�602))!�
�
� !� ��-��.!�!��"!:!�$(������.!�!�7�������!?!�!�!�$(�����!����/!�0����������
�������������������4��������������+������!���2�������������������
�2���!����������������������:�*������1��
�
�/!� ��-��.!�!����!�$&�9���$!�!� 3����!���8�����!?!�!�!�$(���������.!�!�7��!����;!�
��������� �����"� ��� ���� ��������� ���� �������� ��� ������� ��� ��������"@� -�
���������� ��+�� ��������"1� ������ ������� ���� ��������� ����� �� ������
8�"������������%��,�������&������������!) ��)10�22��
�
�;!� ����,��!������+&��������������������������������������������(��<����+#�)���
//0;1�
�
�1!�� .��������!���!���(���!���������"!�.�((������!�"������!��+�((����!�!����(����!�!�
��(��������"!�$��*��*��"!�?����������!������!����2!�0����������������!���43(�
����"������������������4������������������1�4�������������1�����
4����������������������������������������:��������(��<����� '���20���6!�
�
�6!�� +*<����:!�!���!�5*���-���!�$*<���-���!�5C*����$!�.*�������!�5����!������.����
��������������"���������"������������������������������������������������
�������43(!�����������������������:!��������(��<���!��#���;)/0��
�
�
��!� �$(�������.!��"!�$(�������!�$(�������?!�=�����?!��������!�����������+!�
$*�%��!����2!�;��������������4�������������������������"��������������
�������������������"�2��������������������2���!��������������������
E�5��(�3�.�-�����)�$�) J2��

129
�
���� $(����� ":�� �!� -93�� �!� 7������ �!� $(������� $� 3�!� ����!� 0������ ����
2��������������4���������������������������������������2���������������
����������2���������������:��������(��<�����9��2�;�02�;
�
��!� �$��*��*��"���66/�0���������������������������������������������
��������������������"�43(������������������������5���������/)0�6��
�
�)!�� $������.!��=!�:33���*��.!��K"*--����!��K?�����!�!�?8������!�!�����!������
3�������������������0A-������������������������43(������������������
-������%�"�������������3����K7������(�����&!G�9 �)260 /�
�
�2!�� �����!��:!�������?!���*,���B!�D�����5!���%�����!7!�#���--��$!�!�59���?!:!�"�-�
����!���3�!���� !�7���������0A-�������������������+���0A-���������!�����
������������������������3!�$$�;61206��
�
� !�� ��--��:!5!��66 !�0A-�����������43(���������������������������������������
��(��<����+#��9'��)0�)�!�
�
�/!�� ����������� ����-����'��� ��?$�+5������!�2!��������0�������A+�
4�������������� ���������!��6�0�� !�5-�(�3����3�(��-(�&,�J�&������� ��"�#��
$%�������G��66�!�
�;!�� ����������� �������������������!�������������������� ��������
�� ������������ !�������� ��"�#��$%�������G���� !�
�
�1!�� B����$����+!�!�+���3�����2!�43(�����������������������������������
������������������������������������������������������(����>(��?�-!����));0
)21�

130

131
����������
�
�
�
�
�
�General discussion
�
132
This thesis describes the development of molecular assays for detection of
malaria parasites, the quantification of these parasites and the application of
these tools in different research areas such as drug efficacy assessment and the
applicability of molecular tools in resource poor settings for the diagnosis of
malaria. It should be noted that results presented in this thesis were obtained
from controlled studies at a certain place and time in a defined population thus
one should be careful with generalizations and conclusions derived from these
studies. Especially for studies that involve the testing of drugs, resistance
patterns or the presence or intensity of gametocytemia, the results should be
confirmed in different geographical areas, epidemiological settings and disease
patterns.
Diagnostics
Parasitological examination of patient samples (blood or stool) has traditionally
been performed by microscopy. However, with the description of the concept of
the Polymerase Chain Reaction (PCR) in 1983 a whole new field for fundamental
and applied research opened in biology [1]. Since that time, numerous assays
exploiting this principle of molecular biology have been developed for many
diagnostic purposes, and molecular diagnostics was soon also introduced in the
field of parasitology [2-5]. The method is very sensitive, in most cases able to
detect infectious agents below the detection limit of conventional microscopy, and
allows for discrimination at the species level. Although PCR has been widely
employed in the detection of pathogenic parasites, it also became clear that this
method is not always the answer to some of the problems encountered in routine
diagnostics. The implementation of PCR into the routine practise of diagnostic
laboratories seems to a certain extend problematic. The main reason for this lies
in the absence of validated commercial kits with appropriate quality controls [6].
Many laboratories use in-house developed PCR methods, while only a few
research groups have tried to optimize, to standardize and to compare different
PCR assays for parasite detection. This has led to the situation that very
divergent results are reported for the same disease by different research groups,

133
concerning the sensitivity and the specificity of the PCR assays [6].
The implementation of molecular biology as a diagnostic tool in health care
systems in developing countries is sporadic and appears to be very difficult [7].
The developments in molecular biology do not translate into useful tools for
developing countries. A major obstacle in preventing the implementation of these
innovative tools is the fact that they rely on a constant supply of electricity and
require investment in expensive equipment, which often needs dedicated
maintenance [7]. There are at present only few research initiatives that strive
towards the development of simplified molecular-based diagnostic tests that
circumvent the use of sophisticated equipment and electricity. Examples are the
Foundation for Innovative New Diagnostics (www.finddiagnostics.org) for the
development of tools for poverty-related diseases in the developing world,
including malaria, and the TRYLEIDIAG consortium (www.tryleidiag.org) for
simplified molecular diagnostic tools for leishmaniasis and trypanosomiasis.
Application of molecular biology in diagnostic practise in resource poor settings
can be helped by combining alternative amplification methods (preferably
isothermal as this will circumvent the use of thermocyclers) with easy read-out
systems, like oligo-chromatography [8] or NALFIA [9], which is discussed further
below. An alternative for PCR is nucleic acid sequence based amplification
(NASBA) technology, which has proven to be a successful tool in revealing the
presence of many infectious agents, including the detection and quantification of
Plasmodium falciparum [10-11] and P. falciparum specific gametocytes [12]. The
potential of this assay in research and diagnostics has led to the development of
a very sensitive NASBA assay for the detection of the other three known disease
causing human Plasmodium species; vivax, malariae and ovale (chapter 2) [13].
Although quantification is considered not to be clinically relevant in these latter
cases, it can be very useful to know numbers of parasites in samples when
mixed infections, parasite dynamics in drug studies or epidemiological research
questions are addressed.
A case in which the application of molecular biology has again proven its value is
the following. Although it was previously thought that these four Plasmodium

134
species are the only malaria parasites causing disease in humans, it recently
became clear that the so- called “monkey” species P. knowlesi can cause, more
often than up to now thought, severe illness in humans, in particular in Malaysia
[14], Singapore [15] and the Philippines [16]. This finding showed the importance
of molecular diagnostics since this species closely resembles P. malariae when
viewed under the microscope and its presence could only be revealed when
analyzing samples with molecular tools [14]. At this moment a NASBA test for the
specific detection of P. knowlesi is not available, but it can be argued that such
an assay should be developed since the parasite can easily reach potentially
lethal densities making quantification in this case a valuable advantage. The
adaptation of these different NASBA assays in a multiplex format, which has
been developed for other organisms, [17-19] in which only one reaction is
needed for the differentiation of the species could further increase the value of
the NASBA assay and in addition reduce the cost.
The value of tools for gametocyte detection
The valuable information that was obtained form Pfs25 NASBA studies on
gametocytemia in P. falciparum has led to the development of a similar assay for
P. vivax gametocytes (chapter 3) [20]. Although P. vivax is generally accepted as
giving only mild malaria symptoms, it only just became evident that also more
severe illness can be the result of infection with this parasite and that radical cure
of P. vivax can sometimes be problematic [21]. These facts show the importance
of further research into disease pathogenesis and parasite virulence factors, but
also call for good control measures. Up till now little is known about gametocyte
development in P. vivax infections, and almost all data are derived form
microscopically examined samples [22]. In this light the possibilities to gain more
insight in transmission patterns of this species with the developed Pvs25 NASBA
should be further explored [20]. Although the recently developed NASBA still has
to prove its usefulness in larger epidemiological studies, our study already
showed some interesting results. Unexpectedly, not all samples containing P.
vivax parasites harbored gametocytes as assessed with Pvs25 NASBA [20].

135
Whether this is due to late maturation of gametocytes, to a strain specific
phenomenon or limitations of the developed assay, remains at present unclear
and should be studied in more detail in the future.
Can molecular tools be implemented in resource poor settings?
Although the developed molecular assays have proven their ability to answer
scientific questions in many fields, the endeavour remains to implement these
technologies and it is still not an immediate answer for the routine diagnostic
centres, in particular in disease endemic countries [5, 7, 23]. In a study
performed in Kenya and Tanzania (chapter 6) [23] it became apparent that,
especially in low endemic areas, the use of molecular diagnostics can be
beneficial. It should be noted that this study was performed in a population that
had clinical suspicion of malaria infection and thus is a selected population. The
sensitivity of the employed assay (below the detection limit of standard
microscopy) and the fact that no differentiation between asexual and gametocyte
stages was made, might give an overestimation of clinical disease [23]. However,
rapid diagnostic tests that are promoted for malaria diagnosis in many parts of
the world are also not able to differentiate between gametocyte and asexual
stages of the parasite and this combined with the generally practiced
presumptive diagnosis “fever = malaria” leads to severe over treatment especially
in low endemic areas [24-26]. NASBA does have the potential to differentiate
between gametocyte and asexual stages and efforts should be made to develop
a simple assay format that also enables simple detection of these different
stages. A small step towards the development of tests that makes
implementation of molecular assays in resource poor settings more feasible is
made with the use of nucleic acid lateral flow immuno-assay (NALFIA, chapter 7)
[9]. Although quantification is not possible with such a format, the amplified
products can be visualized within 5-10 minutes. In contrast to time consuming
conventional assays where post amplification equipment is needed, NALFIA only
requires a pipette. Similar approaches have proven to be successful in other
parasitological fields, such as the development of a diagnostic device with a

136
100% sensitivity and specificity for sleeping sickness [8], but this has
unfortunately not yet led to wide implementation of molecular tools in the field.
The combination of NALFIA with amplification techniques such as NASBA or loop
mediated isothermal amplification (LAMP) [27] could circumvent the use of a
thermocycler and would further increase the applicability in resource poor
settings.
Identification of resistance markers
Research calls aiming at studies on the simplification of diagnostic tests and at
simple molecular tools to identify resistance markers in for example HIV,
tuberculosis and malaria show that there is a need for such simple techniques as
described above [28]. NASBA combined with NALFIA could lead to the
implementation of molecular diagnostics in field settings and could also be used
for other identification purposes. Besides identification of the parasites, the
detection of resistance conferring markers in a similar format could be included.
Although this would not lead to real bedside diagnostics, it could be of great
importance in for example malaria control programs [29]. The resistance markers
for several anti-malaria drugs are known [29,30]. The possibility to develop a
PCR or NASBA –NALFIA based on these targets, which contain single
nucleotide polymorphisms, should be further exploited. For other drugs, like
artemisinins, resistance markers are not yet fully identified. When such
information becomes available, this could be included in a NALFIA format as
well. It is also possible that resistance to drugs may be conferred by down or up
regulation of certain genes. In this case a NASBA-NALFIA format could be
useful, because such a system can specifically target RNA, including messenger
RNA (mRNA) [31]. Although it was previously thought that mRNA is a very liable
molecule, which has a short half life and would therefore be very difficult to
target, researchers like Cools et al showed that mRNA could be used to detect C.
jejuni even after 48 hours of lethal treatment of the bacterium [32]. This
demonstrates that mRNA is in fact a quite stable, not readily degraded, molecule
and could therefore serve as a target for diagnostic purposes as well.

137
NASBA and antimalarial treatment Diagnostics on its own will not be sufficient to successfully control malaria.
Another important cornerstone of control is treatment, which is not only important
in curing patients from the disease itself, but also to reduce transmission. Many
studies have been conducted on the efficacy of different drugs, which have had
conflicting success rates [33-35]. Some drugs have lost their effectiveness over
time, whereas new drugs are being brought to the market.
To avoid the occurrence and subsequent spread of resistance to old and new
drugs, the effectiveness of drugs has to be monitored closely to avoid massive
loss of cheap and effective drugs, as was encountered with sulfadoxine-
pyrimethamine (SP) and Chloroquine (CQ) [34, 36-37]. The conventional way to
monitor this is either to perform surveys on existing resistance markers or to
conduct periodically studies on the efficacy of the first and second line drugs
used in a certain setting by following up patients for at least 28 but preferably up
to 58 or even 64 days after treatment and subsequently measure reoccurrence of
parasites in the treated cases [37-39]. These kinds of studies involve a lot of
logistics since effective alternative screening tools are not yet available. We
showed however in chapter 4 [37] that NASBA could be of help in reducing time
of follow up in these labour intensive studies. The reported study on SP treatment
showed that treatment outcome could be predicted on samples obtained at day 7
of follow up when NASBA was employed, as accurately as samples examined by
microscopy at day 28, giving a reduced time of follow up of 14 days [37]. In
addition these results showed, as well as others studies, that SP resistance was
high and that a change of drug policy was urgently needed [30, 37-38, 40].
Besides curing the patient from disease, drugs can also interrupt gametocyte
development since the asexual stages of the parasites are killed [35, 40, 43-45].
This fact can be very important in the eradication of the disease. However, in
patients treated with CQ or SP a rise in gametocyte development can be
observed [34,40,42,46]. It has been hypothesized that this may be due to
unsuccessful clearance of asexual stages. In order to answer this question there
is a need for a tool that is able to specifically identify the asexual stages of the

138
malaria parasite under microscopical threshold. A NASBA assay targeting an
asexual specific RNA molecule could solve these problems and the possibilities
in developing such an assay will be further investigated.
Studies investigating the gametocytocidal effect of an antimalarial drug are also
often hindered by the detection limit of microscopy since they circulate in
quantities near the microscopical threshold [40, 47-48]. The number of sexual
parasites in children that developed gametocytes in the month they were followed
during a study normally ranges between 15 to 30 gametocytes/µl [40, 48]. But
once observed, the gametocytes often dropped below microscopical threshold to
subsequently reappear in a next visit. In contrast, when a gametocyte specific
NASBA assay is employed a different picture occurs. NASBA is capable of
detecting a 3-5 times higher proportion of gametocyte carriers [40, 45, 48-50] and
several studies employing this gametocyte specific detection technology have
shown that children frequently harbour gametocytes for several weeks after
treatment and the duration of gametocyte carriage appeared longer than the
period of 7-10 days that was estimated by microscopy [43, 49-50]. Although
these very low numbers of gametocytes do not necessarily have clinical
relevance, it remains an important factor if one considers the infectious patients
in the light of transmission. Studies have shown that transmission can still occur
even at low density gametocytemia and that this low number of parasites does
not prevent malaria transmission or reduce the proportion of infectious individuals
even 14 days after initiation of treatment [55,58-61]. An important and promising
tool against transmission is the relatively new artemisinin-based combination
therapy (ACT) which has a high therapeutic as well as gametocytocidal effect
[45,50-56]. Nowadays, many malaria endemic countries have switched to the use
of ACT and studies on efficacy as well as on the effect of ACT on gametocytes
are appearing [50,-56]. However, it should be noted that most studies were done
with the use of microscopy that show dramatic reduction of gametocytes after
ACT whereas this clearance was not so absolute when NASBA was employed
(40, 45, 50). Although ACTs are considered efficious, the gradual decline in the
number of gametocytes as observed with NASBA could in reality also be due to a

139
clearance of asexual stages that is not as complete as what is observed with
microscopy in which they almost immediately, in 1 to 3 days after administering
ACT treatment, become below the microscopical detection limit. Also with
NASBA a steep decline in parasitaemia can be observed in the first three days
but a low, sub-microscopical, number of parasites could remain which could give
rise to gametocytes. If this is the case, this hypothesis should be confirmed by
sensitive assays like NASBA specific for asexual parasites. Also the different
effects found between the different ACTs on gametocyte reduction and clearance
should be further investigated as well as the fitness of the remaining circulating
gametocytes. This should be confirmed with membrane feeding experiments
because it should be noted that gametocyte carriage does not equal
infectiousness to mosquitoes [57-61]. Answers to these questions could be very
useful to malaria control programs and accurate estimates of the infectious
reservoir could lead to changes in policy from national to more regional
intervention programs in which not only malaria endemicity but also actual
transmission potential is taken into account.
References
�� �*���-��7!5!��66�!�%������������������������"������������������$(����>�(�
�3��(��� � � /0/ !
2 ��-��?+�����9�"��� (�-�?���5��,��.���(7���+��?���-���:�!��616!�0���������
%�"����������������������%�"�����������������������"�0A-������������
�����������"������������������.�-������,�##�� ;0//
3 ��-��?+��7��(���>>��=��?���-���:���616!�0���������%�"������������,��"�0A-�
������������������� ���"������������������ :�*�����>������(����(��<�����,� $��
�2;;0�21�
4 ����B���.��(�&�"���.�-����?��������������������������������������������
��3!��66;�2)'����0)1!2�

140
5�� $��*��*� "� (���1� ������ ���� ����� ��������� �������� ��� �������� ��
��������"�������+�"����@��*�*����(��<���!����;� �2;;01�!�
/� �%9-���� 7��� 7�!� -�����������������������!� �4&���+#��������>(�����!�
���;!���21 06 !�
�
;� ?���$��5����-���7��.�-��?���$�����.�!����;!�'�+���������������������
�����������������"���������������@�5�����������.*<��(������$��2)/!�
�
1�� ?�<�����#�$����-����*�����������-�.��(��&�%*4���?*8�����:����%�8��.��
5*-(��� .!� ���/!� ��������� �����&� ���� ���� �������� ��� ������ ��&���� :!� �����
��(��<���!���'��11206�
�
6� ��-�.���#���3��������$%�.��7���.���$(�������?����1������������������
��� ������� �� ��� ����� ��������� ��� �� ����� )!���� ������ ���� ������� ���+�
���������"������������������������������4��������������������������������
����1�8�"���?������(��<������>(��?�-���&��)������&�--�
�
��� $(�����":�� -93����7���������$(�������?�� 3��$��0����������2�����������
���4���������������������������������������2��������������������2���!
�����������������:��������(��<���!�������9'2�;�0 !�
�
��� $(������.�������-���� $(�����"�� $(��������� $���9�-�.����3-��+�� $*�%���+!�
(��!������������� �2���!��������������������������������������!
���43(�����2��������������4��������������������:��������(��<���!���� ����2��0 �
�
��� $(������ .�� $(����� "�� $(������ ��� =���� ?�� ����� ?�� ������ ��� $*�%��� +!�
;����������� ��� 4��������� ���������� ������"��� �� ��������� ������ ���
����������"�2��������������������2���!���������������������5��(�3�
.�-����!����2�)�$�) 02��
�
�)�� ��-�� .!�!�� $(������ "!:!�� 7���� .!�!� E� $(������� �!?!�!�!� F���/I!�0������ ����
7�������������������4��������������+������!���2�������������������
�2�������������������!������:�*��������1��
�

141
�2� ��40$�����:��?#�-�������7$��$�3-*��$$����*-�&����+��3�$��+�3���������%,�
?:�� $�����5!� ���1�4���������&��+���������������������+��"��������������
��������"��������������������>(��?�-!�����/ 0;�!
�
� � ��� ��� ���������������.:���������.��$����*���������:.�����B$����1!�A�������"�
-�2����'�����4���������&��+���7������1�6���������3�����>(��?�-�)���1�2J/�
�
�/� �*(�#��:���-&��������*�3���.���-&���+��5���?�����������.��������?��$*����������
��7$�� $�����5� ���1!�'�����7��������+���4���������&��+��1����4��������
�3�����>(��?�-�)���1��J1�)�
�
17 Tyagi S,kramer FR, 1996. Molecular beacons: probes that fluoresce upron
hybridization. Nat Biotechnol 14: 303-8
�
�1� ����"�#��-(��8������#��"3��5�7�3���� $(����(G� �661����������������
������� ������� +��� ����������� �"� A-6:-� ����� ���������� ���� ���
����������(A-���*(��(��(��-�+-!� ����� �0 �
�
�6� "��8�� ���� �����-� ���� ?99�-� ���� ��������&� :�!� ����!��������� ���!���
A-6:-�����������������������"����������������"�������������������7 )�
�������$�(�-��:!������=������ ��� ;0//�
�
��� 5*�-9�-� �!�� ��-� .!�!�� ��3-�� +!�� $(������ �!?!�!�!�� $*�%��� +!�!� F���1I�
0�������������(��!%��2���������������������������������������"�����
������������������������������4�������������!�$*<3�����
�
���� ����-� 7�� $��� 5:�� ��(�-���� .� E� ����� +� ����� %�� ������� ������ ���
4�����������������������3��(��:�*�����>����&�(�����(�������,��������6;0��/!�
�
��� 5����:7����;�A��������4��������������������������-����.�-������,� ���
))0 )6�
�
�)� ��-��.!�!��$&�9����!�� 3���$!����8�����!��$(��������!?!�!�!�E�7����.!�!�F���;I!�
��������������"�����������������������������������������������������"@�-�

142
���������� ��+�� ��������"1� ������ ������� ���� ��������� ����� �� ������
8�"������������%��,���!����&�(�����(�����������������������) ���)10��22!�
�
�2�� �*��,��7��5���?��"--���+��E�����-��(������!����)�(�����������������������
������!����&�(�����(���������������������!�9��1;/011)�
�
� � +,<*�������<���+��?�9�,������!����2�*���������������������������+���
�����������������%��,��������������������"��5����-�����(��:�*����� #1������
�
�/�� �,4,� ��� .*9���,93� $�� �����#��(�� 7�� ����-*%�� $�� ����� �:� �����
4����������4�������������������'(4! �������������"����������������������
�����������-(����-��>����+�,��$�(��,��>����&�(�����(�������,���!�#����;60�1��
�
�;�� �9�����7�������$#��+��$9�����7-���(�����:��B�-���������3���!�0���������
"���+�������������������"�����!��������������������������<.-�4=��:�=�����
�����-!����/!�)���� �0/�
�
�1� �$!��*����<������.���������;!�-�������"���������?4$!' -.%'! ��$!-�G�?4$!
' -.%'! ��$!:����+-�(��,�*��-%�--��*������*��&���-�(�!�..!�;�
�
�6� D����"P��"*��BB��$��������D����5���*�$��H����$������������1��������!43(�
���� ������������ ��������"� ���� ������� ��� ����� �������� ���"���������
���������+������������������4�������������������� :��������(��<������&��)������
&�--�
�
)�� +���%���.����;�3�������������������������������������+���������5*���
�(���������)#)����;)J12�
�
)��� ��3&����:��66��A����������2���!�������������������*�!�����6�0�!�
�
)�� ����-�����,���������?K�-� ������-��:��?<#�� :!� ���/!�0�������������
���!��� A-6:-� ����"� ���� ��� ������� ��� 3���"�������� EE��� ������ :� ��(��<����
�����-!�����)�)0��!�
�
))� $(����<���?�� 7���%����?�9�,���������������,�� :���-�93�����&���� ::��
���������-���������������������-��.�!�����!�%������"����������"�������������!

143
�"�������1� �����2��1� ���� ���� ���������� �� ��� �������� ���
������������4����������������������������3�:����&�����,�!��$��;0�)!�
�
)2� #���$���������?�9�,����"��%����5�����#��"��������"!�����!�(�&�������������
������"�����������>���������������3�:����&�����,�!���� �)0;!�
�
) � ������"��?�9�,����:%�����#���$������������3��+��?��:��.��������?����,�
���$*�������������#��"����������.!� ����!�-��������������������������������
��������������������������4����������������������-��������������:���>(��
?�-!�)9���� 206�
�
)/�� +�<��� =�� ����� :��� ��&� :�!� �66/� 6����� ������� ������"��1� ������2���
������1� ���� ��� ������ ������� �������� ��������� ��� �������� ������� ���
�������������������+���-�������3�:����&�����,�!����) �0�!
�
);�� 3���$!�!����-��.!�!��$(�����"!:!��B*-*>���!���%�����:!��7���*��$!�� 3���"!�!�!�E�
$(��������!?!�!�!� F��� I!�4�������������������� ��������������2���������������
���� �2���� ����� ����������� <;%!A-6:-=� ����"� ��� ������ ��� ������� ���
���������!�"�������� �������� ��� ������������ ������!� �4&��3����
.�-������,�))���;)0;6!�
�
)1� �*�<���%��7��������,�?����������������+����3��:��?�9�,����"��%����5���
�����,� �:!� ��� !� -����2��� ����1� �����2��J���������!�"�������1�
�����2��J��������1������������!����������������������������������
������� �� %��,����� �������� �� ����!���� ��������� ��������� ������ ��(�!�
�����2;201�!�
�)6� ����������� �������������)!�-����������������������������������������
���� �����"� ���� ��� �������� ��� ������������ ���������� ��������
�� �����+5�����)! �
�
2�� $(������.��5�*-3���� 3��$��"�*������$%�.��$(���������$*�%���+!����/!�
<6��=����������4�������������������������"�������8�"���������������
�������� +��� ����������!�"�������� ���������"� ��� �� ���������� +���
��������������:�.�-����!����2�)01!�
�

144
2�� $��9� $"�� �&�3<����� 73,��+�� ���*<��57�� ?��-,�"�� +�-�����.:!� ���2!�
3�����������������������������������������������������8������1�5�������
������������������������(�!�������6 �0;!�
�
2�� 5*(9��������+�>���0���%�������������-����+����!� �666!�3�����2����������
4�������������������������"���������������.�-������,!�))9�))602/!�
�
2)� 5�*-3� :���"�*�������?�9�,��:���*�-������� 9(��5����9�3�����5��� :���
"���*�� :��� $*�%��� +�!� ���2!� 4��������� ���������� ������"�� ������� ��
��"������������������+�����8�"�������:!����1!�
�
22� ������ +��� $*������� �:�� ��4���� ��� ��� +�� :%�� ��� ?�9�,� �:�� .����� ���
���#�� "�� ������ "��� ����*(�� �!� ���2!� 3��������� �����"� ����������� ���
�������������������������!�����������������������������2����������3�(��<�
����-���3����!��9�)62�0)!�
�
2 � 5�*-3�:���$(������.��"�*�������?�9�,��:����-�3��������*<��+��"���*��:���
���+��$*��������:�� 3��$���$*�%���+�!����/�����������������������!�����
���������������"������������������4��������������������:���>(��?�-!�)#���� �0
6!�
�
2/� 5��-�7�������������<*���������3�*�*����"�#��:��?*����3�?��+�&�������9��-�5��
����� �:� ���1!�7������� >�����"��������� %�������� -�� ���"� 4�������������
7����������� ������6��������!4"��������(���������?�����������������:�
��>(��?�-�)#$'��/� 0�/�)�
�
2;� ��(�������?�<������������*4����������-����� :>>�,�"���?����7!� ����!�>���1�
�2��������� ���� �������� ��� 4��������� ���������� ������"���� ��������
������� ����� ������ �� ����� ��� �����������"� ���������-� +� $�(� ���&� ��� �,�!�
#��26;0 ��!�
�
21� 7���$��?#��������������"��3<���5�����(����.���*�������D<���%-9�����D�33�3��
.�� ���1!� ������� ������� ��� ������"��� �"� ������� �������� ��������"�
������������������������4�����������������������������������:�$'//�
�

145
26� $(������.��5�*-3� :���"�*������� �����$��#����=��05��3����� 3��$���
$*�%��� +�!� ���;� 6������������ 4��������� ���������� ������"�� ������
��2����"������������2�������������3�:����&�����,�!�$��2;�02!�
�
�� ��-�.!�!�� $%�.!��=�-����!�� $(�������!?!�!�!�� 7���.!�!� F���1I�-�������,��
����� ��� ������� ��� �����"� ���� ��������� �"� ;%!A-6:-� ��� �������!
������������������"����������!����2������������������������������
�����������������������4����������������������������+�����8�"���$*<3�����
�
�� .*9����,93� $�������#��(�� 7�������������3�-�+������-*%�� $��������:�
���2!� -������ ��� ��������� ���� ����2��� ������� ������!� ���� �����!�����
��������������������������������3�(��<�����-���3����!��9��)�60)2!�
�
�� .�����.!���������!��58*���%���!��5������$!��"���--����!��+*�������!��5<��*3����:!��
7��������!��7��*����:!��7,�3*������:!������������!���,������!����((�����!��"*��3����:!.!����� !�
6������� ������ ���������� ���&� ��� ��!���� �������!���������� ����
�������� ��� ����1� ������������ 4��������� ���������� ������� �� �������1�
5��������������������������(���������2/;Q�2;)!�
�
)� ���8*�9���� 5<�9����� "����.�� ������.�� �,������� ������G� ���2!�7�����������
-�������6���"�>������ -���������������������������������������������!
����"������(�!�����60�;!�
�
2� $�9����$��?�9�,����"�-�����+����������#������������#����������>����-����
��-�����$*�%���+��5�*-3�������;!�4���2����������������������4���������
���������� ������"��� ����� ������ ����� �������� +��� ����������!
�"��������������������!�.��$� ��! ����)!�
�
� ?#�-� ���� 7�*�8%� ���� ����� 7�!� ��� !� -������!����� ����������
����������������������������������:��*-�!�)9 ��1�0 !�
�
/� 73,��+��B9����5*9��%�����*�3%����+%9�3���:5��$��9�$"�����-*��� ��
"����*-� 5�� ��-��� ��� +�-����� .:�� �<%��0����� ��� ?��-,� "!� ���;!� -������!
���������� ������ ��"����������!����2��� ���� �������� ��� �������� ��
������,��������.��$����������-!� ����!�
�

146
;� 5�*���� ��� ��#��� ��� ����� :��� ������� :.�� �3<���-0���3-� .!� �66)!�'��� ������
��������������"�������������"!����-�������������������������:��&���?�����
�3�:����&�����,�!��9�;��0/!�
�
1� $*��������:�� ���+��?*�,��$��:%�����?�9�,��:����4����������3��+��.�����
��� ���#�� "�� ������ "�!� ��� !� (������� ��� ������� ����������� ��� -�������
���2�����+�������!��������������!���������.��$���!� �6�!��
�
6� ?�9�,� �:�� :%�� ��� ������ "��� ���#�� "�� <�-�9� ��� ���3�� +�� .����� ���
$*��������:����2!�-���������������������������2������������������4���������
�������������������>���������������������������������������!������������
��������������������2����!����&������������!�:��#�� )0/��
�
/�� ���3�� +��� 7*3&��9� ��� .���%�� ��� ��(��� ��� .�*�9��(��� =�� +(�&%� ���
D������ "�� $��<���9��� :!� ���2!� 7������"� ��� ��"��������� 4��������!������
��������������������-���������������2�������+�����%��������:��������3��!�
�)����01!�
�
/�� "3�0����-�����+89�*��:�������+������-�7�!��66�!�7������������������
4������������������4��������������������������������������������6��
.��&����3�:����&�����,�!����2;601;!�

147
Summary
The laboratory diagnosis of malaria is usually done by microscopic examination
of blood samples for the detection of Plasmodium parasites. There are several
factors that influence the sensitivity as well as the specificity of microscopic
examination, for example the experience of the microscopist and the level of
infection (parasitaemia) of the patient. Several adaptations to microscopic
examination and alternative technologies to circumvent the use of a microscope
have been developed and are discussed in the general introduction chapter 1 of
this thesis.
Technologies based on molecular biology have been used in routine diagnosis
for several parasitic diseases, most of them based on the recognition of DNA.
With Nucleic Acid Sequence Based Amplification (NASBA), which is based on
the detection of RNA, it is possible not only to quantify parasite load but also to
detect and quantify stage specific targets. Previously, NASBA technology for the
identification of Plasmodium falciparum and its gametocyte specific pfs25 target
was described. Chapter 2 describes the development and evaluation of assays
for the detection and quantification of the three other disease causing
Plasmodium species; Plasmodium vivax, Plasmodium ovale, and Plasmodium
malariae. These assays have shown to specifically and reliably identify and
quantify the different species making the molecular diagnostic arsenal for malaria
infections complete. In addition, these assays can be used in for example
epidemiological studies. Chapter 3 describes the development and evaluation of
an assay for the specific detection of P. vivax gametocytes. P. vivax is generally
considered a parasite that gives rise to only mild disease but evidence is growing
that it could also have a more malignant disease outcome. In this light the
possibilities to gain more insight in transmission patterns of this species are
relevant and the developed Pvs25 NASBA serves this purpose. Interestingly, the
analysis shows that not all samples containing P. vivax parasites harbour its
gametocytes. Whether this is due to late maturation of gametocytes, to a strain

148
specific phenomenon or limitations of the developed assay, remains at present
unclear and should be studied more extensively in the future.
NASBA not only allows analysis of samples in a setting of patient care but is also
a valuable tool in research. The high sensitivity allows for detection of parasites
below the microscopic threshold. The advantage of this low threshold is
demonstrated in chapter 4 in which the clinical and parasitological response to
sulfadoxin-pyrimethamine treatment in Kenyan children was assessed. In this
study a positive NASBA count on day 7 after the initiation of treatment predicted
late treatment failure much better than expert microscopy. Lack of microscopic
sensitivity forces many studies on the assessment of the efficacy of first-line
antimalarials to follow patients for 28 days in order to assess late treatment
failure. The implementation of assays such as NASBA could reduce follow up
time dramatically.
The high sensitivity of NASBA and its capacity to detect specific stages of the
parasite also proved to be useful in the assesment of gametocyte development
when patients were treated with an artemisinin drug. Although artemisinin
combination treatments (ACTs) have shown to rapidly clear asexual stages of
Plasmodium from the blood of infected patients and no difference could be found
in the efficacy of artemether-lumefantrine (AL) and dihydroartemisinin-
piperaquine (DP), a clear difference between both drugs could be observed when
the presence of gametocytes were analyzed during follow-up after treatment
(chapter 5). In this study patients treated with DP harboured a higher proportion
of gametocytes compared to AL treated patients. These findings could have
implications in malaria control and should be taken into account when malaria
control programs are developed.
Above studies show the possibilities to use NASBA in research and possibly also
in routine patient care. In spite of the higher sensitivity of NASBA compared to
microscopy it is however the question if implementation of NASBA, particularly
for endemic areas, should be favored. The additional value of molecular
diagnostics in comparison with other routine diagnostic procedures, rapid

149
diagnostic tests (RDT) and microscopy, was studied in two endemic areas with
different transmission intensity (chapter 6). NASBA detected more malaria
patients than RDTs and microscopy, both in high and in low endemic areas.
Moreover, the study showed that in high endemic areas the added value of
molecular diagnostics is small because a very high percentage of patients is
infected. In these areas good microscopy or, if that is not possible, use of RDT
methods is a good alternative. In low endemic areas the added value is much
higher and implementation of NASBA could be an improvement in patient care.
Although NASBA is an isothermal reaction that in principle only uses a simple
water bath at 41 ºC, it needs modern equipment that needs and consumes
electricity and requires a sophisticated laboratory for the detection of the product.
In many malaria endemic countries these prerequisites are not available, which is
one of the reasons why the implementation of NASBA as a diagnostic tool is
hampered. A simplification of the technology and the read- out system could aid
the implementation of molecular diagnostics in endemic areas. With the
application of Nucleic Acid Lateral Flow Immuno Assay (NALFIA) technology a
start has been made towards the simplification of the read out system (chapter
7). NALFIA is fast and sensitive and was evaluated in a peripheral out-patient
clinic in Kenya where it was shown to work under field conditions. The current
NALFIA detects DNA therefore this technology is not immediately applicable for
NASBA. Once the system is translated to a NASBA detection system it will make
molecular diagnostics accessible for endemic settings as well.

150
Samenvatting
De laboratoriumdiagnose van malaria berust gewoonlijk op microscopisch
onderzoek van bloed waarin Plasmodium parasieten gedetecteerd kunnen
worden. Er zijn verschillende factoren die de gevoeligheid en de specificiteit van
microscopisch onderzoek kunnen beïnvloeden zoals de ervaring van de
microscopist en de mate van infectie (parasitemie) van de patiënt. Verscheidene
aanpassingen om het microscopisch onderzoek te verbeteren als ook
alternatieve technologieën die helemaal geen gebruik maken van microscopie
zijn in de laatste jaren ontwikkeld en worden besproken in de algemene inleiding
(hoofdstuk 1) van dit proefschrift.
De technologieën die op moleculaire biologie gebaseerd zijn worden inmiddels
gebruikt in de routinediagnose van diverse parasitaire ziekten. De meeste testen
zijn gebaseerd op de detectie van DNA. Nucleic Acid Sequence Based Assay
(NASBA) detecteert RNA waardoor het niet alleen mogelijk is om te kwantificeren
maar ook stadiumspecifieke vormen van de malaria parasiet aan te tonen.
Toepassing van NASBA voor de identificatie en kwantificering van Plasmodium
falciparum is reeds beschreven evenals ontwikkeling van een specifieke test voor
detectie van P. falciparum gametocyten, gebaseerd op het pfs25 coderend RNA.
Hoofdstuk 2 beschrijft de ontwikkeling en de evaluatie van testen voor de
detectie en kwantificering van de drie andere ziekte veroorzakende Plasmodium
soorten; P vivax, P. malariae en P. ovale. Deze testen zijn gevoelig en specifiek
en kunnen de verschillende soorten kwantificeren. Hiermee maken deze testen
het arsenaal voor de diagnostiek van de verschillende malaria soorten compleet.
Daarnaast kunnen deze testen in bijvoorbeeld epidemiologische studies worden
gebruikt. Hoofdstuk 3 beschrijft de ontwikkeling en de evaluatie van NASBA
voor de specifieke detectie van P. vivax gametocyten. P. vivax is lang gezien als
de veroorzaker van slechts milde symptomen van malaria. Recente publicaties
laten echter zien dat P. vivax infecties ook een ernstiger beloop kunnen hebben.

151
Mede in dit licht bezien is het belangrijk een beter inzicht te verkrijgen in de
transmissiepatronen van P. vivax. Daarom is er op basis van het Pvs25 coderend
RNA een kwantitatieve NASBA ontwikkeld die specifiek de P. vivax gametocyten
kan aantonen. Opmerkelijk is dat de analyse van de bloedmonsters uitwijst dat
niet alle P. vivax bevattende monsters ook P. vivax gametocyten bevatten. Of dit
toe te schrijven is aan late ontwikkeling van gametocyten of aan beperkingen van
de ontwikkelde test, of dat het mogelijk een stam of regiospecifiek fenomeen is,
zal in verder moeten worden bestudeerd.
NASBA is niet alleen een geschikte methode voor de diagnostiek van malaria,
maar is ook een waardevol hulpmiddel in onderzoek. De hoge gevoeligheid van
de test maakt het mogelijk om parasieten aan te tonen onder de detectiedrempel
van microscopie. De lage detectielimiet van NASBA heeft het mogelijk gemaakt
om de parasitemie gedurende de behandeling met sulfadoxine-pyrimethamine in
Keniaanse kinderen te vervolgen (hoofdstuk 4). In deze studie had dat een
positieve NASBA uitslag op dag 7 na de start van behandeling, een
voorspellende waarde voor het falen van behandeling op dag 28. In vergelijking
met microscopie scoorde de NASBA beduidend beter. Het gebrek aan
gevoeligheid van microscopie dwingt vele studies naar de doeltreffendheid van
eerstelijns anti-malaria middelen om patiënten tot dag 28 of langer te vervolgen
om hiermee laat behandelingsfalen uit te sluiten. De implementatie van testen
zoals NASBA zou de vervolgtijd mogelijk drastisch kunnen verminderen.
De gevoeligheid van NASBA en de mogelijkheid om specifieke stadia van de
parasiet aan te tonen hebben hun nut getoond in de analyse van ontwikkeling
van gametocyten in patiënten die behandeld zijn met artemisinine combinatie
therapie (ACT). Terwijl er geen verschil te zien is in de effectiviteit van
artemisinine-lumefantrine (AL) en dihydroartemisinine-piperaquine (DP) en beide
medicijnen snel aseksuele parasieten klaren, is er een duidelijk verschil te zien
als er naar gametocyten gekeken wordt gedurende en na behandeling
(hoofdstuk 5). Het percentage patiënten dat gametocyten heeft na behandeling

152
is groter in de groep die is behandeld met DP. Deze bevindingen zouden
implicaties kunnen hebben voor de beheersing van malaria en moeten in
overweging worden genomen als nieuwe malaria controleprogramma’s worden
opgezet.
Bovenstaande studies pleiten voor het gebruik van NASBA in onderzoek en
mogelijk ook in diagnostiek. Ondanks de hogere gevoeligheid van de techniek is
het de vraag of implementatie van NASBA in de diagnostiek, met name in
endemische gebieden, een overtuigende winst oplevert. De additionele waarde
van moleculaire diagnostiek in vergelijking met andere routine diagnostiek, zoals
teststripjes (rapid diagnostic tests, RDT) en microscopie, is bestudeerd in twee
verschillende endemische gebieden met een verschillende transmissie intensiteit
(hoofdstuk 6). Dit liet zien dat NASBA in zowel hoog endemische als in laag
endemische gebieden meer patiënten met malaria identificeert. Daarnaast liet de
studie ook zien dat in een hoog endemisch gebied de toegevoegde waarde van
moleculaire diagnostiek gering is doordat een zeer hoog percentage patiënten
geïnfecteerd is en in deze gebieden goede microscopie, of daar waar dat niet
mogelijk is RDT, goed te gebruiken methodes zijn. In laag endemische gebieden
is de toegevoegde waarde veel groter en zal implementatie van NASBA een
verbetering van de patiëntenzorg kunnen opleveren.
In principe is voor de uitvoering van NASBA slechts een waterbad nodig dat
verwarmd is tot 41 ºC maar voor de detectie van het NASBA product wordt
gebruik gemaakt van apparatuur die elektriciteit en een geavanceerd
laboratorium vereist. In veel malaria endemische gebieden zijn deze
voorzieningen niet voorhanden en dit houdt mede de implementatie van NASBA
als diagnostisch hulpmiddel tegen. Een vereenvoudiging van de technologie en
de afleesmethoden zou implementatie mogelijk dichterbij brengen. Met behulp
van Nucleic Acid Lateral Flow Immuno Assay (NALFIA) is een begin gemaakt
met de vereenvoudiging van de afleestechnologie (Hoofdstuk 7). NALFIA is snel
en gevoelig en is geëvalueerd in een perifeer ziekenhuisje in Kenia waar deze

153
technologie toepasbaar bleek onder veld condities. De huidige NALFIA is
gebaseerd op DNA-detectie waardoor deze technologie niet meteen toepasbaar
is voor NASBA die immers RNA detecteert. Een vertaalslag naar NASBA
technologie zou ook moleculaire diagnostiek in de lokale ziekenhuizen
toegankelijk kunnen maken.
154
To accomplish great things we must not only act, but also dream,
not only plan, but also believe.
Anatole France Acknowledgments
Dit proefschrift had nooit geschreven kunnen worden zonder de hulp en
aanmoediging van een groot aantal mensen die zijn blijven geloven in een goede
afronding van dit geheel. Aan allen, collegae, vrienden en familie die hieraan
hebben bijgedragen een heel groot dank.
Ik wil van deze ruimte gebruik maken om een aantal mensen te bedanken die op
een bijzondere mannier hebben bijgedragen aan het tot stand komen van mijn
proefschrift. Allereerst, Professor dr. Piet Kager, mijn promotor. Vanaf het
allereerste begin heeft u een grote betrokkenheid getoond voor mijn werk. Bij alle
werkbesprekingen die wij door de jaren heen hebben gevoerd heeft u altijd blijk
gegeven van een groot enthousiasme, wat zeer vaak aanstekelijk werkte en er
voor zorgde dat er weer wat focus in het grote geheel kwam. Daarnaast kreeg ik
mede dankzij u ook meer inzicht in de klinische kant van de malaria problematiek
en heeft het mij geleerd om niet alleen vanuit de laboratoriumkant maar ook met
oog voor de kliniek naar de problematiek die in het proefschrift is beschreven te
kijken. Voor dit alles zeer hartelijk dank.
Professor dr. Robert Sauerwein en de afdeling medische microbiologie van de
Radboud Universiteit wil ik bedanken voor de collegiale samenwerking en
gastvrijheid in Nijmegen. Dank voor alle goede werkbesprekingen en adviezen,
de stammen en cultures die ik heb mogen gebruiken en voor de begeleiding in
het kweken van de malaria parasieten.
For assisting in the field work in Kenya I would like to thank dr. Sabah Omar.
Thank you for your kind hospitality in Kenya. It was always a pleasure to visit you
and your staff at KEMRI or in the field. I would like to extent my special thanks
and gratitude towards Steve Kaniaru and Daniel Kariuki for their cooperation,
guidance and their expertise during the field studies in Kenia. The staff of ICIPE,
Mbita, Kenya has been very helpful in the execution of some of the clinical trails

155
described in this thesis. Special thanks goes to dr. John Githure for his
cooperation and dr Patrick Sawa for his hard work, assistance and ever lasting
enthusiasm during these trails.
Dr. Nicole Spieker wil ik bedanken voor de mogelijkheid om een deel van het
onderzoek in Tanzania te verrichten. Dank voor je gastvrijheid en alle hulp bij het
rond krijgen van de studie. Ook wil ik alle medewerkers van het Aga-Kahn
ziekenhuis bedanken die geholpen hebben bij het verkrijgen van alle nodige
papieren en voor de prettige samenwerking gedurende de studie. Asante sana.
Dr. Peter de Vries wil ik danken voor zijn hulp bij de analyses van het klinisch
werk en de belangstelling voor al het werk wat verricht werd binnen dit onderzoek
en ook binnen de andere projecten waaraan we hebben gewerkt. Jouw
vertrouwen was een inspiratie.
Dr. Aart van Amerongen wil ik bedanken voor zijn werk met de NALFIA. De vele
besprekingen en het kritisch analyseren van de problemen waren verhelderend
en getuigden altijd van een grote betrokkenheid bij de voortgang van het project.
Ik wil ook Birgit van Beelen bedanken voor de het conjugaat en de duizenden
dipsticks die ze voor me wist te produceren.
Het grootste deel van mijn werk heb ik gedaan op de afdeling van KIT-BR. Ik wil
alle collega’s bedanken voor de samenwerking. Speciale dank gaat uit naar
Gerard Schoone die alle jaren met veel enthousiasme met mij heeft meegedacht
en mij met raad en daad heeft bijgestaan bij vele experimenten en Inge Versteeg
die gezorgd heeft dat ook de laatste analyses nog een plaats in dit boekje
hebben mogen krijgen.
Uiteraard ook een woord van dank aan alle collega’s van de Afdeling Tropische
Geneeskunde van het AMC. De werkbesprekingen en patiënten besprekingen
hebben iedere keer weer laten zien dat “de tropen” ook heel dicht bij kunnen zijn.
I would like to thank colleagues all over the world who contributed to this work
either by providing samples, advise or just by discussing principles and results.
Even though your contribution might not seem that large it was invaluable and
expanded my views in many ways.

156
Lots of this work could not have been accomplished without the help of the
children and their parents in Tanzania and Kenya which cooperated in the
diagnostic evaluation of developed tests and the clinical trails and who willingly
participated in all the procedures. To all of you thank you very much.
Verscheidene studenten hebben meegeholpen aan het onderzoek zowel in
Nederland als in het veld: dank jullie wel voor jullie inzet.
Daarnaast wil ik nog een aantal mensen bedanken die niet direct een bijdrage
hebben geleverd aan de inhoud van het proefschrift maar die toch van
onschatbare waarde zijn geweest voor het tot stand komen ervan.
Lieve vrienden en familie, hartelijk dank voor alle steun die jullie de afgelopen
jaren hebben gegeven. Het was erg fijn m’n verhaal kwijt te kunnen wanneer het
niet meezat en jullie pogingen om alle moeilijke concepten van het werk te
snappen. Het is fijn te weten dat er altijd mensen zijn om op terug te vallen.
Lieve papa en mama, het is haast onmogelijk uit te drukken hoe blij ik ben dat
jullie mijn ouders zijn. Dank jullie voor alle steun die jullie me alle jaren hebben
gegeven in mijn studie en daar buiten. Jullie interesse in het werk was een
stimulans. Jullie sturing waar het nodig was maar vooral de vrijheid om mijn
eigen weg te volgen heeft mij zover gebracht. Mede dankzij jullie vertrouwen in
mij is het gelukt al dit voor elkaar te krijgen.
Tot slot ben ik een zeer groot dank verschuldigd aan mijn lieve man Henk. Henk,
jij hebt me in al deze jaren bijgestaan in dit onderzoek. Dankzij jou ben ik in het
malaria onderzoek en parasitologie terechtgekomen en je vertrouwen in mijn
kunnen heeft me altijd erg goed gedaan. Onze samenwerking, je kritische blik
maar bovenal je stimulans heb ik altijd als erg prettig ervaren. Maar meer wil ik je
danken je steun en liefde; het zijn lang niet altijd gemakkelijke tijden geweest
maar je wist me altijd te motiveren. Mede daardoor is er gekomen wat hier nu ligt.
Een heel groot dank! Tot slot; mijn nu nog kleine David, door jou was dit
proefschrift precies op tijd af.
Amsterdam 2008 Pètra
157
Curriculum vitae
Pètra Mens was born in Amsterdam, the Netherlands in 1981. After completion of
Senior General Secondary Education at Spinoza lyceum in 1999 she continued
her studies at the school for higher vocational education, Amsterdam to follow the
foundation course in biological and medical laboratory research. In 2003 she
obtained her BSc degree in bio-medical science from the Free University,
Amsterdam, which included work on the detection of Actinobacillus
actinomycetemcomitans by Real-Time assays. She obtained her MSc degree in
Bio-molecular science from the same university in 2005 and wrote a thesis in the
field of molecular cell biology and immunology on the inflammation cascade in
ischemia reperfusion in the kidney. A literature survey on the mediators,
adhesion molecule and inflammatory cells. She developed an interest in tropical
diseases during her work on real-time PCR systems for identification of
resistance related DHPS-540 mutations in Plasmodium falciparum at the Institute
for Tropical Medicine in Antwerp.
Since 2005 she has been working as a PhD student on the development of
molecular tools for the diagnosis of malaria and monitoring of parasite dynamics
under drug pressure (this thesis). She gave training in malaria diagnosis for the
Dutch tropical medicine training course and several workshops on molecular and
serological methods for the diagnosis of malaria. Besides training she has been
responsible for the daily supervision of several MSc students that have been
working on the ongoing malaria projects at the Royal Tropical Institute. She has
been involved and coordinated several international projects on drug monitoring
and development of diagnostic tools for malaria. Pètra Mens is currently
employed by the Royal Tropical Institute in Amsterdam.

158
.�����������������
�
�������!�! ����-��.�!�� 9�3>���! !�� 9&����!�!��$(��������!?!�!�!�E�.���-�����!�F���1I!�
4�����������������������������������"��4���������������������������1�
�����1� ���� ������� ���� �&��� �������� ������ �������� +���� ��������
���������������� ���6���1�A�����$*<3�����
�
��-�.!�!��$%�.!��=�-����!��$(�������!?!�!�!��7���.!�!� F���1I�-�������,����������
������� ��� �����"� ���� ��������� �"� ;%!A-6:-� ��� �������!����������
������ ��"����������!����2��� ���� �������� ���� ����������� �������� ���
������������4����������������������������+�����8�"���$*<3�����
�
5*�-9�-��!����-�.!�!����3-��+!��$(�������!?!�!�!��$*�%���+!�!�F���1I�0��������
�����(��!%��2���������������������������������������"������������������
�����������������4�������������!�$*<3�����
�
�%3���!�!���&���-����:!��������+!:!��$#���!����-��!�!��5���%�:!����4��!��$(������
�!?!�!�!�� ��-� .!�!�� F���1I� -� ������!����� �������+����� ��� �!���� �������� ���
���������������"��������������!����������������!�5��&�,-�(��:�*����#���6620�����
�
��-� .!�!�� �3������ #�� �!�� $%� .!�� 7��� .!�!�� $(������ �!?!�!�!� F���1I! ���������
����������������������������������������������1���!���������������������
���+� �����!����"� ���� ��� ������� ��� ���� �� ������ 4��������� ����� ���� ���
���������������1�8�"���?����-��(���(��<�����,������>(���*-�?�--��)��2��02�;��
�
��-� .!�!�� #�3��� �!=!�� 5����� �!�� ?*8����� :!�!�� �K��--����� �!� F���1I� (��!%��
43(G�3-�����"���������������������������"��������������������"�������
��������������0'46!���������������4�������������������� ������:�*����$��
21�
�
5�*-3�� :!�!��?�9�,���!:!����-��.!�!�����-���!����*<���+!��"�*�����!�!�� 3��� $!�!��
$(������ �!?!�!�!� E� $*�%���� +!�!� F���1I!� 7������� 4�� ���������� ������"��
������������������������+���4������������3��(��:�*������>����&�(�������(���
E��,�����$9��22�0221�

159
��*��� 5!�� ��-�� .!�!�� $�� !�� ���33����� �!�� $(������� �!?!�!�!� F���;I�6���������
���������&����������������������������������������"�������������������
���� 2��������� ������ ���� �2���� ����� ����������� <;%!A-6:-=� ����"��
���->*-�����������#-�������->*-�������(����#�����0�� �
�
��-�� .!�!�� $&�9��� �!�� 3��� $!�� ��8���� �!�� $(������� �!?!�!�!� E� 7���� .!�!� F���;I!�
��������������"�����������������������������������������������������"@�-�
���������� ��+�� ��������"1� ������ ������� ���� ��������� ����� �� ������
8�"������������%��,���!����&�(�����(�����������������������) ���)10��22!�
�
��-�� .!�!�� $(������ "!:!�� 7���� .!�!� E� $(������� �!?!�!�!� F���/I!� 0������ ����
7�������������������4��������������+������!���2�������������������
�2�������������������!������:�*��������1���
�
3���$!�!����-��.!�!��$(�����"!:!��B*-*>���!���%�����:!��7���*��$!�� 3���"!�!�!�E�$(�������
�!?!�!�!�F��� I!� ��������������2��������������������2��������������������
<;%!A-6:-=�����"��������������������������������!�"�������������������
������������4�������������������������!��4&��3����.�-������,�))���;)0;6!��
�
��-��.!�!�� 3���$!�!��$(������"!:!��B*-*>���!���%�����:!��7���*��$!�� 3���"!�!�!��$(�������
�!?!�!�!�E�7����.!�!�F��� I!� ��������������2��������������������2���������
����������� <;%!A-6:-=� ����"� ��� ������ ��� ������� ��� ?������� �������� ���
������������ 4�� ���������� �������� �<-��(�� <��9� 7,-���� $,3&�-�*3� ����'�
�*�(������"��3�(-����5�����,�������(���F�1��<�*�,�J� ���(�����/����-���$�I�� ;!�
�
��-�� .!�!�� $(������ "!:!�� 7���� .!�!� E� $(������� �!?!�!�!� F���/I!� 0������ ����
�������������������4��������������+������!���2�������������������
�2���� ����� ����������!� �<-��(�� <��9� ����� ����������� �����--� �>� .�-������,�
F�� .��H�G�/�J�����*�*-�����/��"�-��%���!7!I��0&*<��(����!�
�
$(��������!��������!�#��������-��.!�� $(�������.!���*�-���!��5-�,���!�� $(������"!��
.9����!��$*�%����+!���<����!�E�7����.!�F���;I!�;��������������������2����
����� ����������� ��� �� ����� ��� ������ ����� �����"� �� �<-��(�� <��9� 7,-����
$,3&�-�*3�?�*�-�����-��.��������.�-��-� F�1� :�*�,� J� �� �<�*�,� ���;�� "����<99��
�-������������,�����>�������$�I��26!�
�