pink guava (psidium guajava l.) by-products
TRANSCRIPT
PINK GUAVA (Psidium guajava L.) BY-PRODUCTS:
HEALTH-PROMOTING POTENTIALS
By
HENG WOOI SHIN
A project report submitted to the Department of Chemical Science
Faculty of Science
Universiti Tunku Abdul Rahman
in partial fulfilment of the requirements for the degree of
Bachelor of Science (Hons) Biochemistry
October 2016
ii
ABSTRACT
PINK GUAVA (Psidium guajava L.) BY-PRODUCTS:
HEALTH-PROMOTING POTENTIALS
Heng Wooi Shin
Pink guava (Psidium guajava L.) is well-known for its rich content of fiber,
phenolics and vitamins, hence, it is predicted that its co-products may possess
these beneficial properties as well. In this study, three types of by-products
collected from the pink guava puree processing line: refiner, siever and
decanter were used for the evaluation of their health-related properties. Pre-
analysis treatments including freeze-drying, grinding, sieving and
determination of moisture content were done prior to ethanol (80%, v/v)
extraction. The moisture content for all the freeze-dried samples was less than
10% for better chemical and microbial stability throughout the study.
Through the simple maceration technique, dry ethanolic extract (from
supernatant) was employed for the antioxidant assays and the α-amylase
inhibitory assay; while dry pellet was used for the glucose diffusion assay. The
health-promoting potentials of these guava by-products were evaluated in
terms of their antioxidant capacity through DPPH assay, reducing power, anti-
amylase activity and glucose dialysis retardation index. Results revealed that
the pink guava by-products exhibit high levels of antioxidant activities.
Among the three samples, siever was found to possess the highest antioxidant
capacity with EC50 of 0.317 mg/ml, significantly (p < 0.05), followed by
iii
decanter (EC50 = 0.389 mg/ml) and refiner (EC50 = 0.394 mg/ml), in DPPH
assay. These results were consistent with the findings in reducing power assay.
However, in terms of the α-amylase inhibitory potential and glucose retardation
potential, decanter showed the highest activity as compared to siever and
refiner. These findings could be attributed to the presence of fibers in the
samples, which can enhance their hypoglycemic potentials. Thus, further study
should be done on the composition of fibers in guava by-products, to correlate
their compositional and functional properties. Through the present study, the
guava by-products could be value-added due to their high antioxidant and
antidiabetic potentials.
iv
ACKNOWLEDGEMENTS
First and foremost, I would like to express my gratitude towards my final year
project supervisor, Dr. Chang Ying Ping for her dedication towards the
completion of my final year project. Her guidance, advices, patience, support
and encouragement throughout the commencement of bench works and thesis
writing had motivated me to strive harder in making this project successful.
Next, I would like to show my sincere appreciation to the lab officers, Mr. Ooh
Keng Fei, Mr. Soon Yew Wai and Mr. Leong Thung Lim from Department of
Chemical Science, Faculty of Science, for their willingness to give advices and
technical supports regarding laboratory skills and machine operations during
the lab works.
Besides, I wish to thank my family members, course mates and friends for
giving mental support and unconditional love during lab works and thesis
writing. Thanks to their priceless support, I managed to gone through the ups
and downs in the completion of my final year project.
v
DECLARATION
I hereby declare that the project report is based on my original work except for
quotations and citations which have been duly acknowledged. I also declare
that it has not been previously or concurrently submitted for any other degree
at UTAR or other institutions.
___________________________
HENG WOOI SHIN
vi
APPROVAL SHEET
The project report entitled “PINK GUAVA (Psidium guajava L.) BY-
PRODUCTS: HEALTH-PROMOTING POTENTIALS” was prepared by
HENG WOOI SHIN and submitted as partial fulfilment of the requirements for
the degree of Bachelor of Science (Hons) Biochemistry at Universiti Tunku
Abdul Rahman.
Approved by:
__________________________
(Dr. CHANG YING PING) Date:………………….....
Supervisor
Department of Chemical Science
Faculty of Science
Universiti Tunku Abdul Rahman
vii
FACULTY OF SCIENCE
UNIVERSITI TUNKU ABDUL RAHMAN
Date: ___________________
PERMISSION SHEET
It is hereby certified that HENG WOOI SHIN (ID No: 13ADB07272) has
completed this final year project entitled “PINK GUAVA (Psidium guajava L.)
BY-PRODUCTS: HEALTH-PROMOTING POTENTIALS” supervised by
DR. CHANG YING PING from the Department of Chemical Science, Faculty
of Science.
I hereby give permission to my supervisor to write and prepare manuscripts of
these research findings for publishing in any form, if I do not prepare it within
six (6) months from this date, provided that my name is included as one of the
authors for this article. The arrangement of the name depends on my supervisor.
Yours truly,
___________________
(HENG WOOI SHIN)
viii
TABLE OF CONTENTS
Page
ABSTRACT ii
ACKNOWLEDGEMENT iv
DECLARATION v
APPROVAL SHEET vi
PERMISSION SHEET vii
TABLE OF CONTENTS viii
LIST OF TABLES xi
LIST OF FIGURES xii
LIST OF ABBREVATIONS
xiii
CHAPTER
1. INTRODUCTION 1
1.1 Background of Study 1
1.2 Objectives
4
2. LITERATURE REVIEW 5
2.1 Selected Plant: Pink Guava (Psidium guajava L.) 5
2.1.1 Guava By-products 6
2.2 Nutritional Values of Pink Guava 7
2.2.1 Nutrient Contents of Guava Fruits 8
2.2.2 Nutrient Contents of Guava Wastes 8
2.3 Health-Promoting Factors 9
2.4 Antioxidant Potentials 10
2.4.1 Antioxidant Properties of Flavonoids
2.4.2 Antioxidant Properties of Vitamins
2.4.3 Antioxidant Properties of Carotenoids
11
11
13
2.5 Antidiabetic Potentials
2.5.1 Action of α-amylase on Starch Hydrolysis
2.5.2 Hypoglycemic Effect of Dietary Fiber
14
14
15
2.6 Antioxidant Assays 16
ix
2.6.1 DPPH (2,2-Diphenyl-1-picrylhydrazyl)
Radical Scavenging Assay
16
2.6.2 Reducing Power Assay
2.7 α-amylase Inhibitory Assay:Starch-iodine Colour Assay
2.8 Glucose Diffusion Assay
2.8.1 Principle of GOPOD Assay Kit
17
17
18
18
3. MATERIALS AND METHODS 19
3.1 Materials 19
3.1.1 Guava By-products 19
3.1.2 Chemicals 19
3.1.3 Equipments 20
3.1.4 Methodology 21
3.2 Pre-analysis Treatments 22
3.3 Determination of Moisture Content 22
3.4 Ethanol Extractions 22
3.4.1 Simple Maceration 22
3.4.2 Soxhlet Extraction 23
3.5 Antioxidant Assays 24
3.5.1 DPPH (2,2-Diphenyl-1-picrylhydrazyl)
Radical Scavenging Assay
24
3.5.2 Reducing Power Assay 25
3.6 α-amylase Inhibitory Assay:Starch-iodine Colour Assay 26
3.7 Determination of Hypoglycemic Potential 27
3.7.1 Quantitation of D-glucose
3.7.2 Standard Curve of D-glucose
3.7.3 Suitability of Samples for Glucose
Diffusion Assay
3.7.4 Optimum Conditions for Glucose
Diffusion Assay
3.7.5 Glucose Diffusion Assay
3.8 Statistical Analysis
27
28
29
30
31
31
4. RESULTS 32
4.1 Moisture Contents of Freeze-Dried Guava
By- products
32
4.2 Yield of Extraction 32
4.3 Antioxidant Properties of Ethanolic Extracts 33
4.3.1 DPPH (2,2-Diphenyl-1-picrylhydrazyl)
Radical Scavenging Activity
33
4.3.2 Reducing Power 35
4.4 α-amylase Inhibition Properties of Ethanolic Extracts 36
4.5 Hypoglycemic Potentials of Dry Pellets 37
4.5.1 Standard Curve of D-glucose
4.5.2 Suitability of Samples for Glucose
Diffusion Assay
4.5.3 Optimum Conditions for Glucose
Diffusion Assay
37
37
39
x
4.5.4 Glucose Diffusion Assay
40
5. DISCUSSIONS 42
5.1 Moisture Contents of Freeze-Dried Guava
By-products
42
5.2 Ethanol Extraction of Guava By-products 43
5.3 Health-Promoting Potentials of Guava By-products
5.3.1 Antioxidant Properties
5.3.2 α-amylase Inhibition Activities
5.3.3 Hypoglycemic Potentials: Glucose Diffusion
5.3.4 Glucose Dialysis Retardation Index (GDRI)
44
44
46
48
49
5.4 Future Study
51
6. CONCLUSIONS
52
REFERENCES
54
APPENDICES 64
xi
LIST OF TABLES
Table Page
3.1 List of chemicals used for sample preparation and analysis
19
3.2 List of equipments used for sample preparation and analysis
20
3.3 Serial dilutions for extract in antioxidant assay
24
3.4 Serial dilutions for extract in α-amylase inhibitory assay
26
3.5 Serial dilutions for D-glucose
28
3.6 Various sample forms for D-glucose determination
29
3.7 Various conditions for glucose diffusion assay
30
4.1 The moisture content in freeze-dried guava by-products
32
4.2 The intrinsic glucose concentration in various sample forms
38
4.3 Glucose concentration in dialysate over time for different test
conditions
39
4.4 Glucose concentration of dialysate at different time interval 41
xii
LIST OF FIGURES
Figure Page
2.1 White and pink guava 5
2.2 Varieties of pink guava in Malaysia 6
2.3 Pink guava puree processing 7
2.4 Classification of dietary phytochemicals 10
2.5 Scavenging action of reactive oxygen species (R·)
by flavonoid
11
2.6 Radical scavenging mechanism of ascorbic acid 12
2.7 Lipid radical scavenging by α-tocopherol 13
2.8 Starch hydrolysis by α-amylase 14
2.9 DPPH free radical scavenging reaction 16
3.1 Soxhlet apparatus setup 24
4.1 The extraction yield in guava by-products. Values represent
means ± SD (n=2)
33
4.2 DPPH free radical scavenging activity for ethanolic extracts.
Values represent means ± SD (n=3)
34
4.3 EC50 values for ethanolic extracts. Values represent means ±
SD (n=3). Different letters denote a significant difference (p <
0.05)
34
4.4 Reducing power of ethanolic extracts. Values represent means
± SD (n=3)
35
4.5 α-amylase inhibition activity of ethanolic extracts. Values
represent means ± SD (n=3)
36
4.6 Standard curve of D-glucose. Values represent means ± SD
(n=2)
37
4.7 Glucose concentration of dialysate at different time interval.
Values represent means ± SD (n=3)
40
xiii
LIST OF ABBREVATIONS
Abs Absorbance
DPPH 2,2-Diphenyl-1-picrylhydrazyl
EC Enzyme Commission
EC50 Half maximal effective concentration
Eds Editors
et al. et alia (and others)
GAE Gallic acid equivalents
GDRI Glucose dialysis retardation index
GOPOD Glucose oxidase/peroxidase
HCl Hydrochloric acid
HPLC High performance liquid chromatography
min Minutes
MWCO Molecular weight cut-off
Psidium guajava L. Psidium guajava Linn.
R2 Regression coefficient
SD Standard deviation
v/v Volume/volume
w/v Weight/volume
α Alpha
β Beta
γ Gamma
CHAPTER 1
INTRODUCTION
1.1 Background of Study
It was reported that the current world population has reached around seven
billion and the number was believed to strike nine billion by year 2050,
according to Hofstrand (2012). Generally, the rising population shows a close
association with the food demand and supply, whereby the Food and
Agricultural Organization (FAO) projected that 70% increment in food
production will be required to sustain the needs in year 2050 (Hofstrand, 2012).
As a consequence, the increase in food production will lead to environmental
problems, since 33% of all food was squandered throughout the food supply
chain, ranging from initial processing to the end products consumption (FAO,
2011). Many waste management issues have been arouse, including improper
management of disposal sites, health and safety issues as well as limited
landfills (Bartelings and Sterner, 1999). Thus, the exploitation of existing
underutilized resources such as by-products is of utmost importance in coping
with these critical issues.
Guava (Psidium guajava L.), is a highly nutritious tropical fruit which can be
found all-year-round in Malaysia, in two major types: white-fleshed and pink-
fleshed guava. Basically, white-fleshed guava is consumed freshly whereas
pink-fleshed guava is normally used in puree and juice production in Malaysia.
According to Kong and Ismail (2011), approximately 25% of the pink guava
fruits are disposed of as by-products during puree processing, through cutting
2
and crushing, sieving and decanting step. Large amount of wastes have been
produced through the processing of fruits and vegetables in the food processing
industry. This can create environmental problems due to microbial spoilage on
the liquid and pulp wastes (Sukeksi and Sarah, 2016). Thus, the present study
was undertaken in order to explore the health-promoting potentials of various
guava by-products obtained from the pink guava puree processing industry
while minimizing the waste management issue and disposal cost at the same
time.
Next, the cases of diabetes (especially Type 2 diabetes mellitus) have become
the alarming issues among human populations in recent years. According to
Wild et al. (2004), World Health Organization (WHO) estimated that the
worldwide prevalence of diabetes for all age groups will be elevated from 171
million to 366 million (year 2000 to 2030). Basically, Type 2 diabetes mellitus
is a systemic metabolic disease which closely associated with hyperglycemia,
insulin insensitivity as well as obesity (characterized by hyperlipidemia and
hypertension), and the coexistence of these diseases will eventually lead to
cardiovascular diseases (Kaplan, 1989).
Due to the adverse effects caused by the prolonged usage of insulin and other
hypoglycemic drugs such as biguanides, sulfonylureas and thiazolidinediones
(Mary and Gayathri, 2015), there is an increasing demand for natural products
with high anti-hyperglycemic activity (Choudhary et al., 2013). According to
Mehta (2005), through the consumption of adequate dietary fiber, the risk of
chronic diseases including bowel cancer, gastrointestinal disorders, obesity,
3
diabetes and other cardiovascular diseases can be lowered down. Also, fiber
was believed to aid in the reduction of blood cholesterol and glucose
attenuation, promoting optimum physiological functions in the body.
Besides, the potential risk of getting cancer, atherosclerosis, diabetes and other
common human diseases can be reduced via the dietary intake of
phytochemicals-rich foods containing high levels of antioxidant activities
(Temple, 2000). Many plants serve as the exemplary natural sources of
antioxidant and thus studies have been carried out for the isolation, extraction
and characterization of the bioactive components from different plant parts and
species (Musa et al., 2011). According to Gupta and Sharma (2006), several
compounds present in plants, for instances, flavonoids (flavones, isoflavones,
anthocyanins, catechins), vitamins (vitamin C, vitamin E, carotenoids) as well
as polyphenols (ellagic acid, gallic acid, tannins), are important antioxidants.
In addition, Larrauri (1999) said that by-products from fruits and vegetables
typically serve as the promising sources for dietary fibers as well as other
functional compounds. This was further proven by other studies, which
showed that many fruit peels contain polyphenolic compounds, flavonoids,
ascorbic acid and other bioactive components contributing to various medicinal
and pharmacological properties (Kim et al., 2010; Leontowicz et al., 2003;
Zhao et al., 2007). Also, since the disposal of guava wastes could be a
potential environmental issue, alternatives for reducing the amount of wastes
produced are of great importance (Uchôa-thomaz et al., 2014).
4
1.2 Objectives
The general aim of this study is to value-add the guava by-products through
evaluating their potential health-promoting properties.
The following are the specific objectives of this study:
1. To determine the antioxidant properties of guava by-products through
DPPH free radical scavenging assay and reducing power assay.
2. To evaluate the α-amylase inhibitory potential of guava by-products using
starch-iodine colour assay.
3. To determine the hypoglycemic effect of guava by-products through glucose
diffusion assay.
5
CHAPTER 2
LITERATURE REVIEW
2.1 Selected Plant: Pink Guava (Psidium guajava L.)
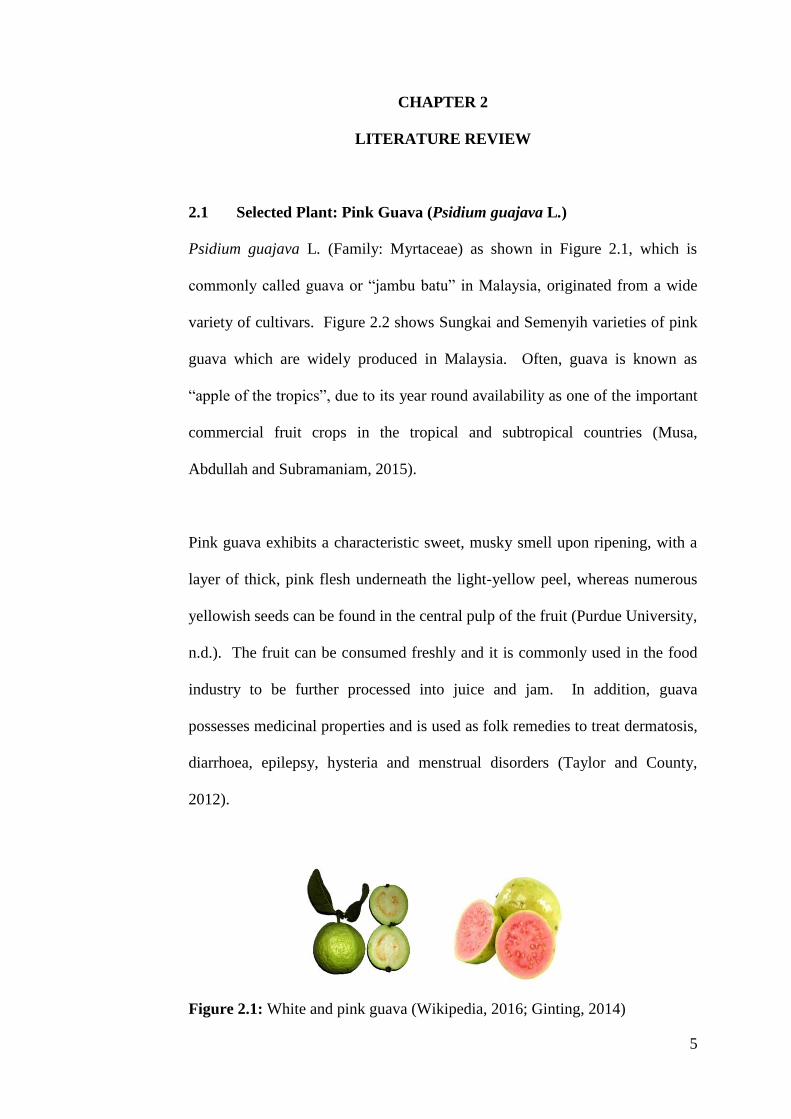
Psidium guajava L. (Family: Myrtaceae) as shown in Figure 2.1, which is
commonly called guava or “jambu batu” in Malaysia, originated from a wide
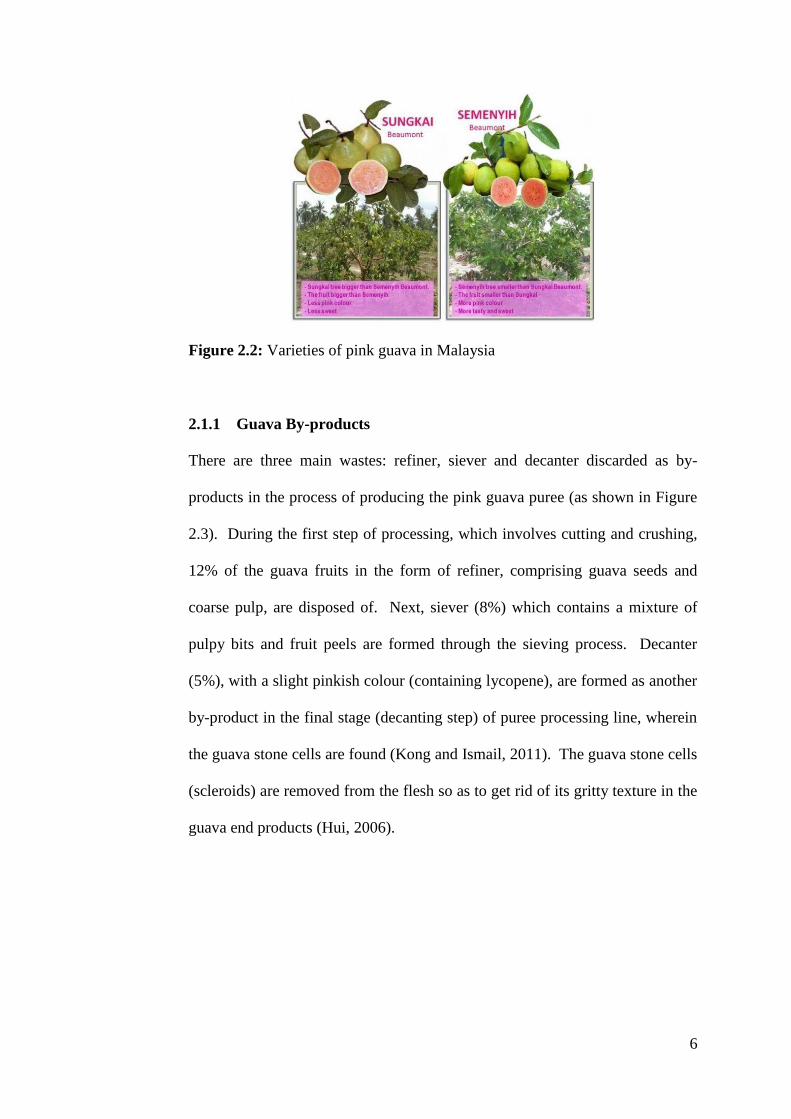
variety of cultivars. Figure 2.2 shows Sungkai and Semenyih varieties of pink
guava which are widely produced in Malaysia. Often, guava is known as
“apple of the tropics”, due to its year round availability as one of the important
commercial fruit crops in the tropical and subtropical countries (Musa,
Abdullah and Subramaniam, 2015).
Pink guava exhibits a characteristic sweet, musky smell upon ripening, with a
layer of thick, pink flesh underneath the light-yellow peel, whereas numerous
yellowish seeds can be found in the central pulp of the fruit (Purdue University,
n.d.). The fruit can be consumed freshly and it is commonly used in the food
industry to be further processed into juice and jam. In addition, guava
possesses medicinal properties and is used as folk remedies to treat dermatosis,
diarrhoea, epilepsy, hysteria and menstrual disorders (Taylor and County,
2012).
Figure 2.1: White and pink guava (Wikipedia, 2016; Ginting, 2014)
6
Figure 2.2: Varieties of pink guava in Malaysia
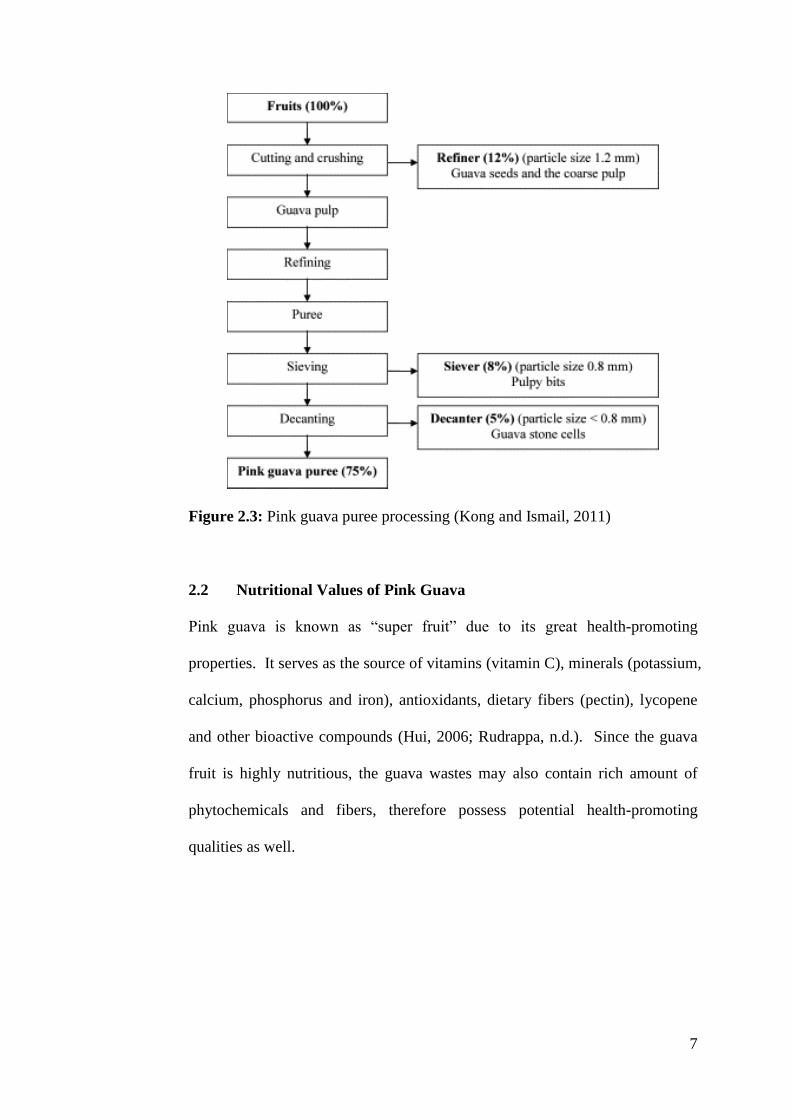
2.1.1 Guava By-products
There are three main wastes: refiner, siever and decanter discarded as by-
products in the process of producing the pink guava puree (as shown in Figure
2.3). During the first step of processing, which involves cutting and crushing,
12% of the guava fruits in the form of refiner, comprising guava seeds and
coarse pulp, are disposed of. Next, siever (8%) which contains a mixture of
pulpy bits and fruit peels are formed through the sieving process. Decanter
(5%), with a slight pinkish colour (containing lycopene), are formed as another
by-product in the final stage (decanting step) of puree processing line, wherein
the guava stone cells are found (Kong and Ismail, 2011). The guava stone cells
(scleroids) are removed from the flesh so as to get rid of its gritty texture in the
guava end products (Hui, 2006).
7
Figure 2.3: Pink guava puree processing (Kong and Ismail, 2011)
2.2 Nutritional Values of Pink Guava
Pink guava is known as “super fruit” due to its great health-promoting
properties. It serves as the source of vitamins (vitamin C), minerals (potassium,
calcium, phosphorus and iron), antioxidants, dietary fibers (pectin), lycopene
and other bioactive compounds (Hui, 2006; Rudrappa, n.d.). Since the guava
fruit is highly nutritious, the guava wastes may also contain rich amount of
phytochemicals and fibers, therefore possess potential health-promoting
qualities as well.
8
2.2.1 Nutrient Contents of Guava Fruits
In the study done by Thaipong et al. (2006), guava fruit was found to contain
high amount of vitamin C, ranging from 174.2 to 396.7 mg/100 g fresh fruit in
the pink pulp varieties. Beside exhibiting excellent radical scavenging activity
and reducing power, guava powder also contains high dietary fiber content (5.4
g/100 g of fruit) (Rudrappa, n.d.) as well as phenolics content (44.04 mg
GAE/g) (Verma et al., 2013). Phenolic compounds that are present in high
amounts include myricetin, apigenin (Miean and Mohamed, 2011), ellagic acid
and anthocyanins (Misra and Seshadri, 1968). According to Musa, Abdullah
and Subramaniam (2015), kaempferol was found to be the predominant
flavonoid in the pink guava. In addition, this highly nutritious fruit possesses
some carotenoids such as β-carotene, γ-carotene, phytofluene, lycopene, β-
cryptoxanthin, rubixanthin, lutein, cryptoflavin and neochrome (Mercadante,
Steck and Pfander, 1999). These compounds are well-known antioxidants and
thus are essential for maintaining optimal health upon consumption by the host
(Rudrappa, n.d.).
2.2.2 Nutrient Contents of Guava Wastes
Based on the study carried out by Maniyan, John and Mathew (2015), guava
peels showed the highest carbohydrate content (75 mg/ml) as compared to
pomegranate, apple, banana and grapes. Besides, it also possesses considerable
amount of protein (0.19 mg/ml) and reducing activity (0.47%) as well as low
amount of antinutritional factors such as phytic acid and tannin. In addition,
guava peel extract possesses high phenolic content (7.21 g GAE/100 g crude
extract) (Marina and Noriham, 2014) and reducing power. Next, the guava
9
seeds are rich in vitamin C, carotenoids and insoluble dietary fiber, according
to the study done by Uchôa-thomaz et al. (2014). On the other hand, pink
guava contains high amount of dietary fiber (5.4 g/100 g fruit) in the flesh, as
reported by Siddiq (2012). Also, Kong and Ismail (2011) suggested that the
by-products of pink guava puree industry are rich in lycopene and antioxidant
compounds. Hence, guava by-products serve as potential sources for nutrient
enrichment.
2.3 Health-Promoting Factors
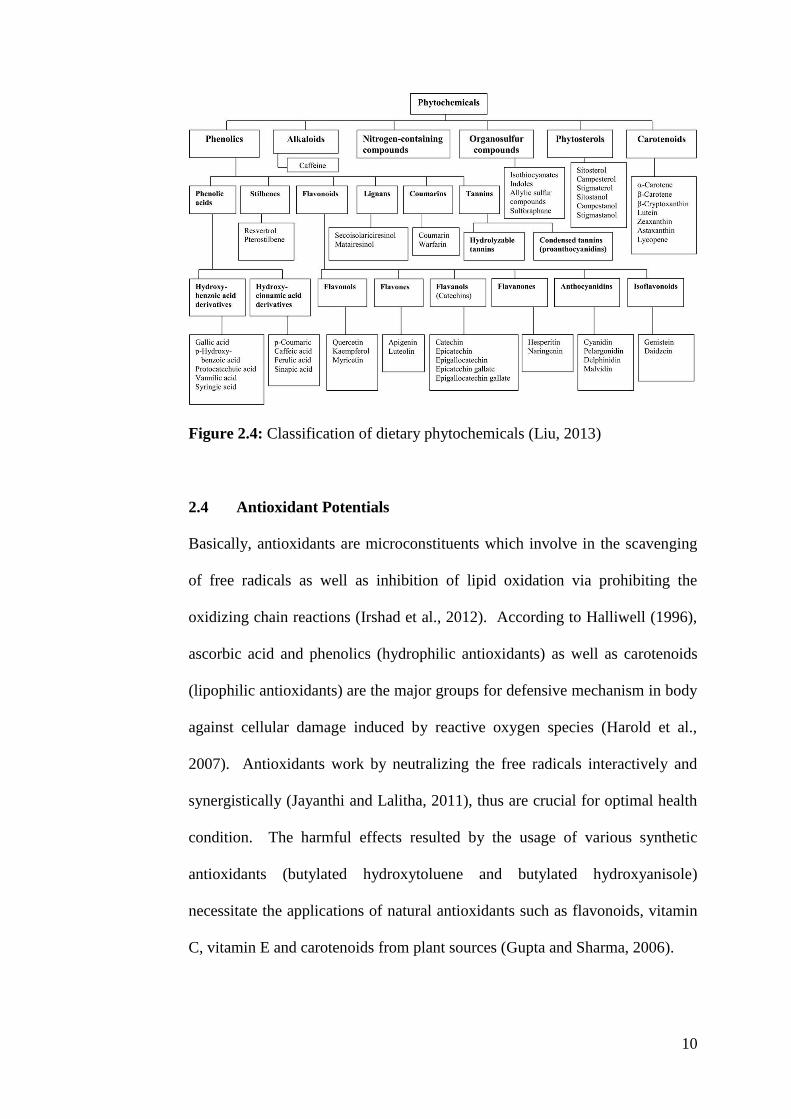
In the presence of bioactive phytochemicals (Figure 2.4) such as phenolics and
carotenoids, health-promoting effects can be achieved through lowering down
the risk of chronic diseases (Liu, 2004). Generally, fruits and vegetables
possess rich amount of vitamins (such as vitamin C) as well as dietary
phenolics (such as flavonoids) which involve in the reduction of cancer,
diabetes and cardiac diseases development. On the other hand, orange-red and
yellow fruits and vegetables serve as a good source for carotenoids such as β-
carotene and lycopene. Briefly, all these bioactive components possess
antioxidant potentials, due to their abilities in scavenging free radicals for
cancer prevention (Liu, 2013). Next, adequate intake of dietary fibers aids in
the prevention of diabetes, hypertension, colon cancer and other
gastrointestinal disorders (Anderson et al., 2009), thus promoting and
enhancing the health status of the consumers.
10
Figure 2.4: Classification of dietary phytochemicals (Liu, 2013)
2.4 Antioxidant Potentials
Basically, antioxidants are microconstituents which involve in the scavenging
of free radicals as well as inhibition of lipid oxidation via prohibiting the
oxidizing chain reactions (Irshad et al., 2012). According to Halliwell (1996),
ascorbic acid and phenolics (hydrophilic antioxidants) as well as carotenoids
(lipophilic antioxidants) are the major groups for defensive mechanism in body
against cellular damage induced by reactive oxygen species (Harold et al.,
2007). Antioxidants work by neutralizing the free radicals interactively and
synergistically (Jayanthi and Lalitha, 2011), thus are crucial for optimal health
condition. The harmful effects resulted by the usage of various synthetic
antioxidants (butylated hydroxytoluene and butylated hydroxyanisole)
necessitate the applications of natural antioxidants such as flavonoids, vitamin
C, vitamin E and carotenoids from plant sources (Gupta and Sharma, 2006).
11
2.4.1 Antioxidant Properties of Flavonoids
Flavonoids are a group of unique plant secondary metabolites, characterized by
the red, blue and purple anthocyanin pigments in plant tissues (Winkel-Shirley,
2001). According to Prior and Cao (2000), many flavonoids have stronger
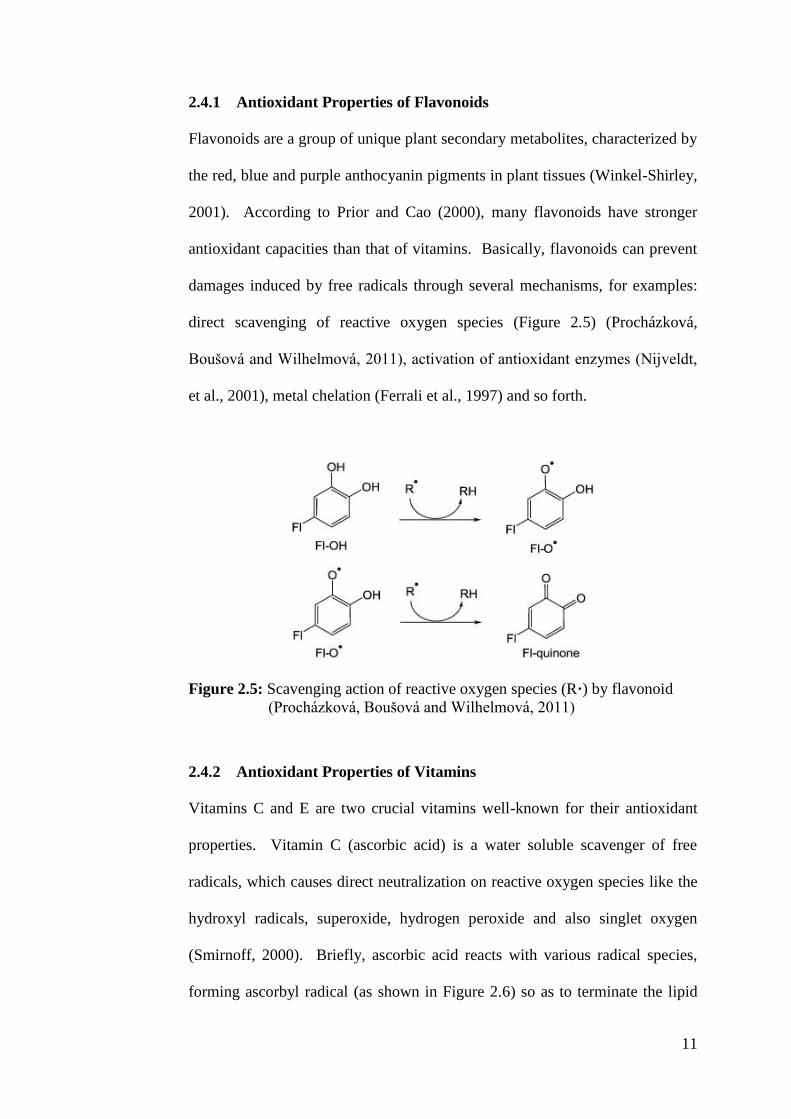
antioxidant capacities than that of vitamins. Basically, flavonoids can prevent
damages induced by free radicals through several mechanisms, for examples:
direct scavenging of reactive oxygen species (Figure 2.5) (Procházková,
Boušová and Wilhelmová, 2011), activation of antioxidant enzymes (Nijveldt,
et al., 2001), metal chelation (Ferrali et al., 1997) and so forth.
Figure 2.5: Scavenging action of reactive oxygen species (R·) by flavonoid
(Procházková, Boušová and Wilhelmová, 2011)
2.4.2 Antioxidant Properties of Vitamins
Vitamins C and E are two crucial vitamins well-known for their antioxidant
properties. Vitamin C (ascorbic acid) is a water soluble scavenger of free
radicals, which causes direct neutralization on reactive oxygen species like the
hydroxyl radicals, superoxide, hydrogen peroxide and also singlet oxygen
(Smirnoff, 2000). Briefly, ascorbic acid reacts with various radical species,
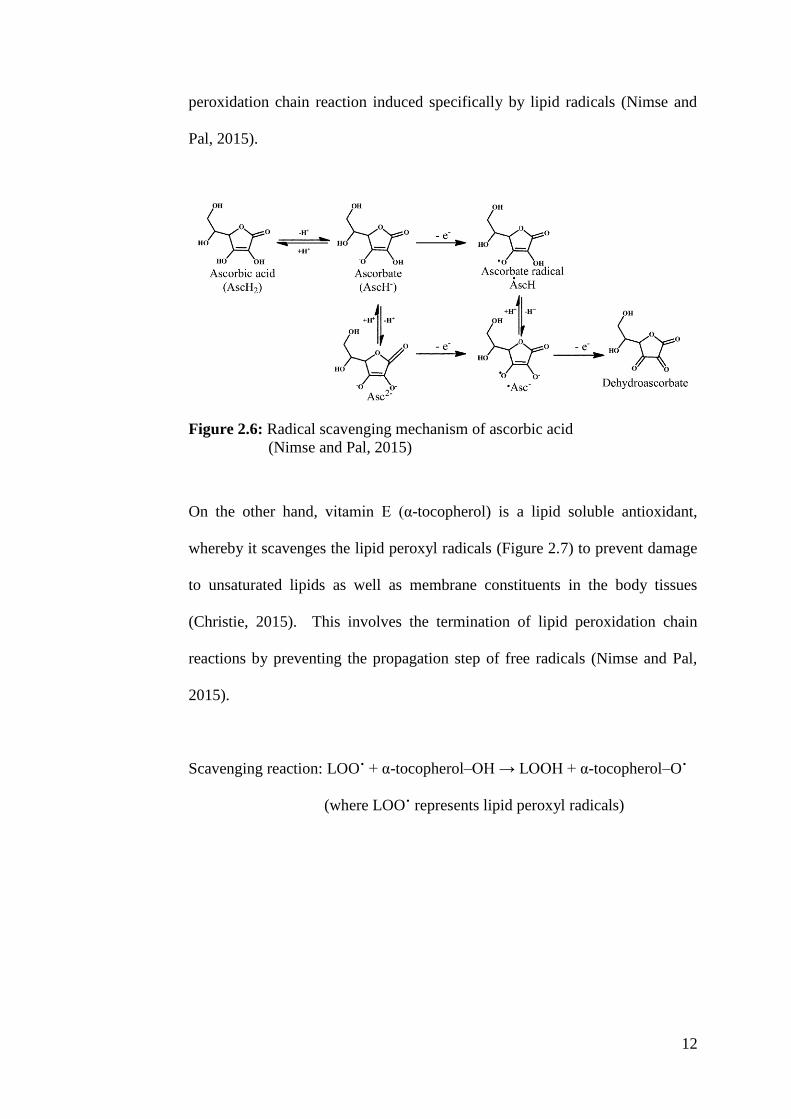
forming ascorbyl radical (as shown in Figure 2.6) so as to terminate the lipid
12
peroxidation chain reaction induced specifically by lipid radicals (Nimse and
Pal, 2015).
Figure 2.6: Radical scavenging mechanism of ascorbic acid
(Nimse and Pal, 2015)
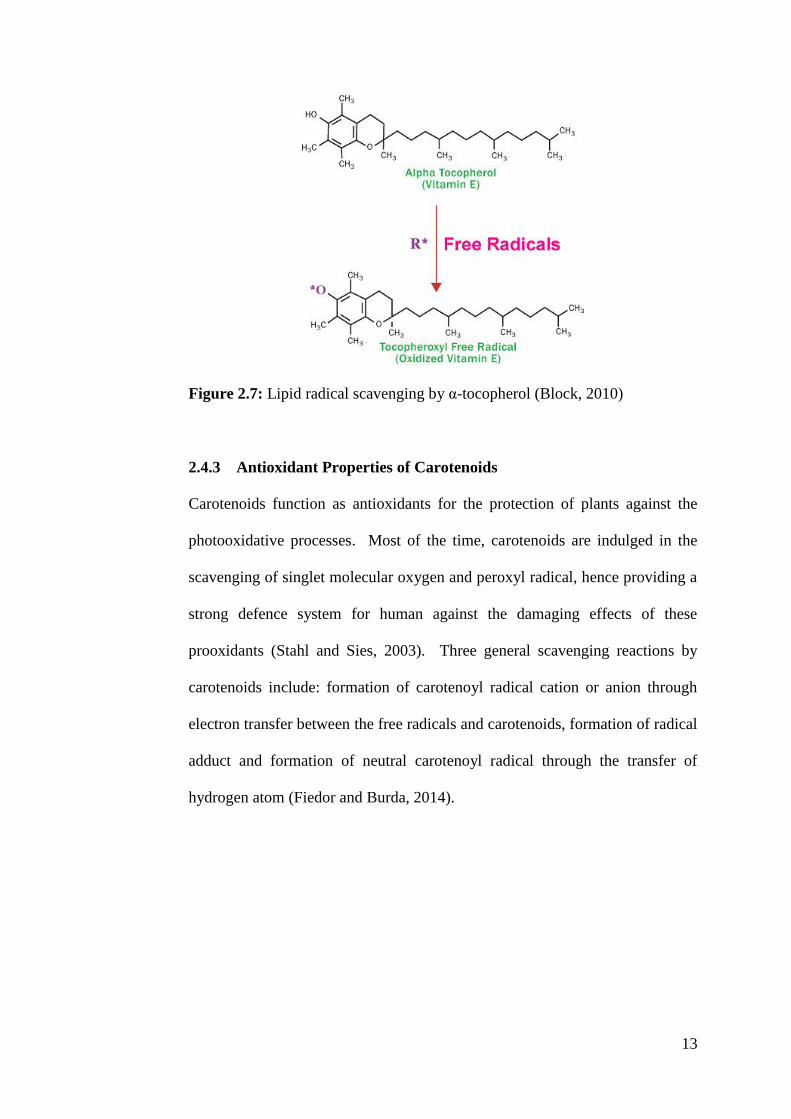
On the other hand, vitamin E (α-tocopherol) is a lipid soluble antioxidant,
whereby it scavenges the lipid peroxyl radicals (Figure 2.7) to prevent damage
to unsaturated lipids as well as membrane constituents in the body tissues
(Christie, 2015). This involves the termination of lipid peroxidation chain
reactions by preventing the propagation step of free radicals (Nimse and Pal,
2015).
Scavenging reaction: LOO˙ + α-tocopherol–OH → LOOH + α-tocopherol–O˙
(where LOO˙ represents lipid peroxyl radicals)
13
Figure 2.7: Lipid radical scavenging by α-tocopherol (Block, 2010)
2.4.3 Antioxidant Properties of Carotenoids
Carotenoids function as antioxidants for the protection of plants against the
photooxidative processes. Most of the time, carotenoids are indulged in the
scavenging of singlet molecular oxygen and peroxyl radical, hence providing a
strong defence system for human against the damaging effects of these
prooxidants (Stahl and Sies, 2003). Three general scavenging reactions by
carotenoids include: formation of carotenoyl radical cation or anion through
electron transfer between the free radicals and carotenoids, formation of radical
adduct and formation of neutral carotenoyl radical through the transfer of
hydrogen atom (Fiedor and Burda, 2014).
14
2.5 Antidiabetic Potentials
2.5.1 Action of α-amylase on Starch Hydrolysis
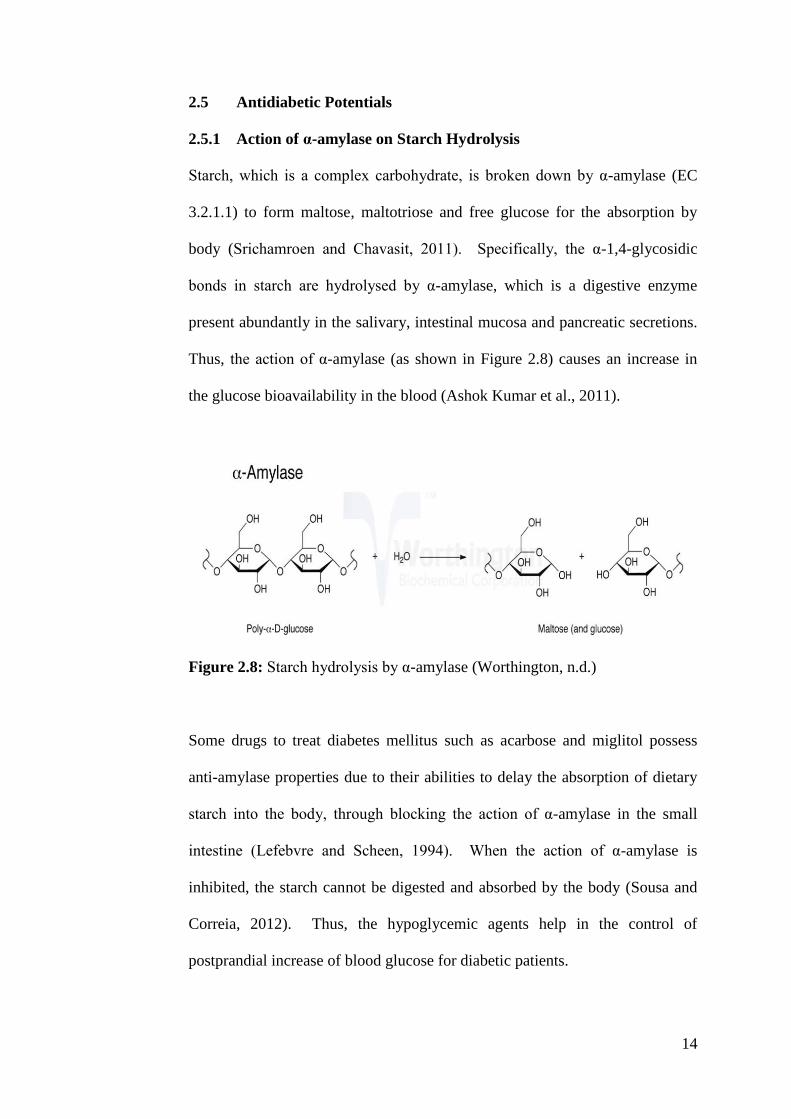
Starch, which is a complex carbohydrate, is broken down by α-amylase (EC
3.2.1.1) to form maltose, maltotriose and free glucose for the absorption by
body (Srichamroen and Chavasit, 2011). Specifically, the α-1,4-glycosidic
bonds in starch are hydrolysed by α-amylase, which is a digestive enzyme
present abundantly in the salivary, intestinal mucosa and pancreatic secretions.
Thus, the action of α-amylase (as shown in Figure 2.8) causes an increase in
the glucose bioavailability in the blood (Ashok Kumar et al., 2011).
Figure 2.8: Starch hydrolysis by α-amylase (Worthington, n.d.)
Some drugs to treat diabetes mellitus such as acarbose and miglitol possess
anti-amylase properties due to their abilities to delay the absorption of dietary
starch into the body, through blocking the action of α-amylase in the small
intestine (Lefebvre and Scheen, 1994). When the action of α-amylase is
inhibited, the starch cannot be digested and absorbed by the body (Sousa and
Correia, 2012). Thus, the hypoglycemic agents help in the control of
postprandial increase of blood glucose for diabetic patients.
15
2.5.2 Hypoglycemic Effect of Dietary Fiber
Generally, dietary fiber can be classified into two major categories: soluble
dietary fiber and insoluble dietary fiber; each with different physiological roles
in body. According to Gohil and Lele (2014), insoluble dietary fiber is
responsible for several health promoting properties, including hypoglycemic,
hypocholesterolemic as well as anti-constipating effect. On the other hand, the
fully hydrated chains of soluble dietary fibers are responsible in the reduction
of the rate of carbohydrate digestion and absorption through increasing the
viscosity of digestive system in the gastrointestinal tract (Torsdottir et al.,
1989). However, the effect of insoluble fibers on GDRI was shown to be
greater than soluble fibers (López et al., 1996).
Ou et al. (2001) and Chau, Huang and Lee (2003) revealed that dietary fiber
could reduce the postprandial serum glucose levels through several
mechanisms. First, through increasing the viscosity of digestive juices in small
intestine and thus delaying glucose diffusion; second, through binding with
glucose which causes the decreased availability of glucose in small intestine;
and lastly, through retarding α-amylase action by capsuling starch and the
enzyme respectively. Also, Srichamroen and Chavasit (2011) suggested that
the higher the concentration of gum (a unique soluble fiber), the higher the
retardation rate on glucose diffusion.
16
2.6 Antioxidant Assays
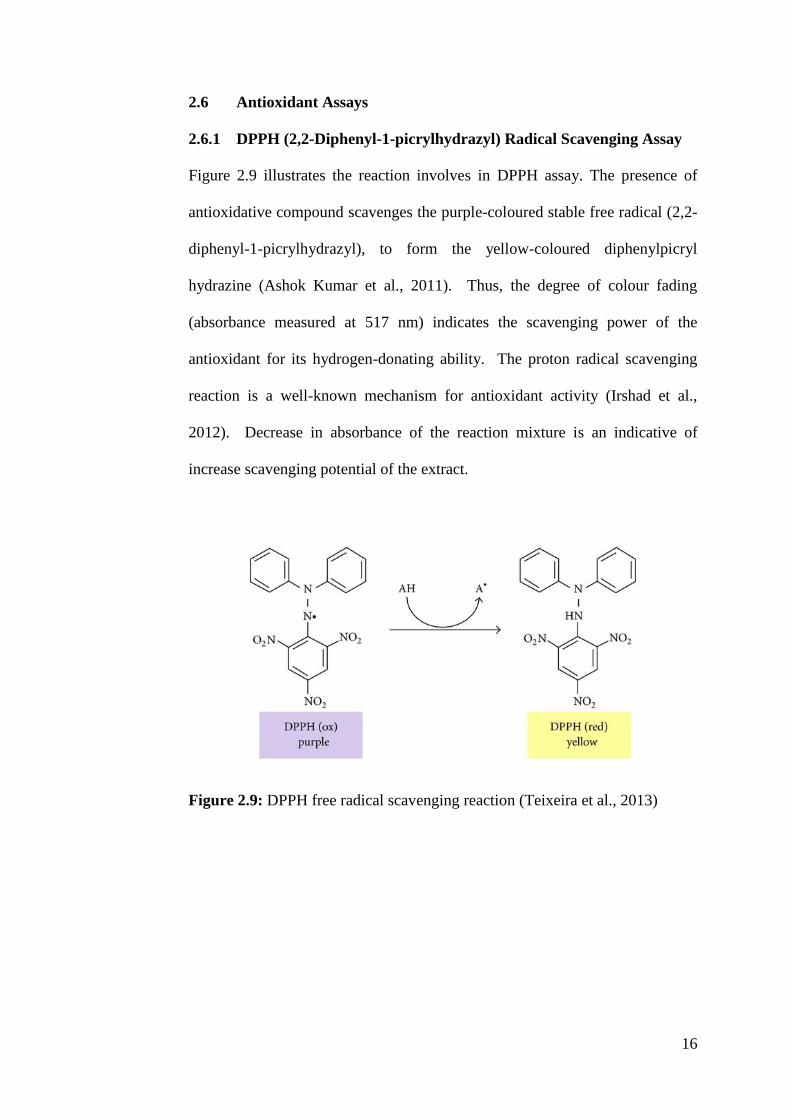
2.6.1 DPPH (2,2-Diphenyl-1-picrylhydrazyl) Radical Scavenging Assay
Figure 2.9 illustrates the reaction involves in DPPH assay. The presence of
antioxidative compound scavenges the purple-coloured stable free radical (2,2-
diphenyl-1-picrylhydrazyl), to form the yellow-coloured diphenylpicryl
hydrazine (Ashok Kumar et al., 2011). Thus, the degree of colour fading
(absorbance measured at 517 nm) indicates the scavenging power of the
antioxidant for its hydrogen-donating ability. The proton radical scavenging
reaction is a well-known mechanism for antioxidant activity (Irshad et al.,
2012). Decrease in absorbance of the reaction mixture is an indicative of
increase scavenging potential of the extract.
Figure 2.9: DPPH free radical scavenging reaction (Teixeira et al., 2013)
17
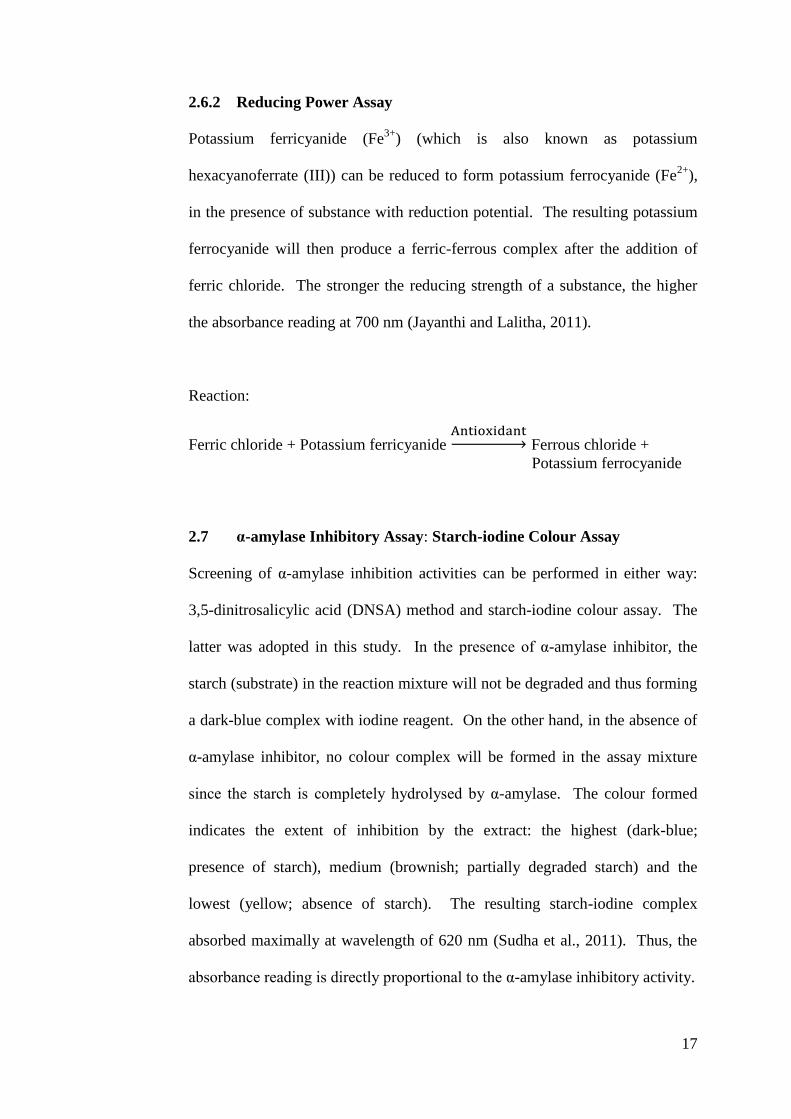
2.6.2 Reducing Power Assay
Potassium ferricyanide (Fe3+
) (which is also known as potassium
hexacyanoferrate (III)) can be reduced to form potassium ferrocyanide (Fe2+
),
in the presence of substance with reduction potential. The resulting potassium
ferrocyanide will then produce a ferric-ferrous complex after the addition of
ferric chloride. The stronger the reducing strength of a substance, the higher
the absorbance reading at 700 nm (Jayanthi and Lalitha, 2011).
Reaction:
Ferric chloride + Potassium ferricyanide → Ferrous chloride +
Potassium ferrocyanide
2.7 α-amylase Inhibitory Assay: Starch-iodine Colour Assay
Screening of α-amylase inhibition activities can be performed in either way:
3,5-dinitrosalicylic acid (DNSA) method and starch-iodine colour assay. The
latter was adopted in this study. In the presence of α-amylase inhibitor, the
starch (substrate) in the reaction mixture will not be degraded and thus forming
a dark-blue complex with iodine reagent. On the other hand, in the absence of
α-amylase inhibitor, no colour complex will be formed in the assay mixture
since the starch is completely hydrolysed by α-amylase. The colour formed
indicates the extent of inhibition by the extract: the highest (dark-blue;
presence of starch), medium (brownish; partially degraded starch) and the
lowest (yellow; absence of starch). The resulting starch-iodine complex
absorbed maximally at wavelength of 620 nm (Sudha et al., 2011). Thus, the
absorbance reading is directly proportional to the α-amylase inhibitory activity.
18
2.8 Glucose Diffusion Assay
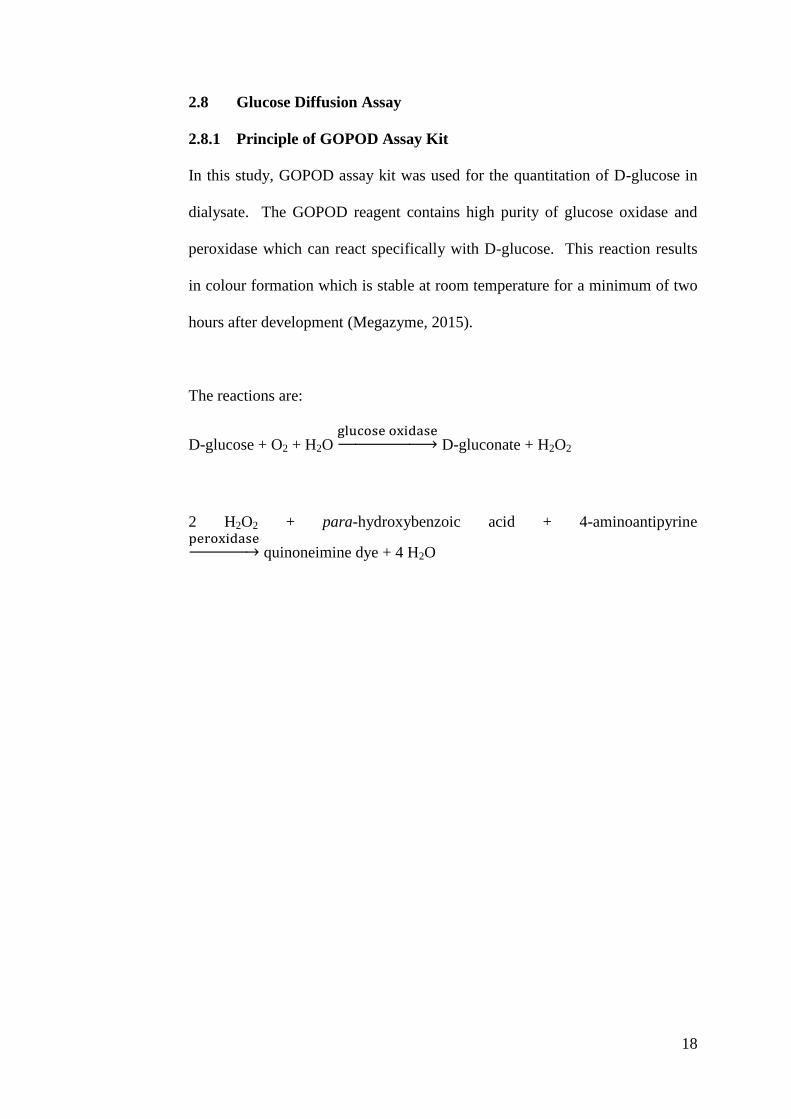
2.8.1 Principle of GOPOD Assay Kit
In this study, GOPOD assay kit was used for the quantitation of D-glucose in
dialysate. The GOPOD reagent contains high purity of glucose oxidase and
peroxidase which can react specifically with D-glucose. This reaction results
in colour formation which is stable at room temperature for a minimum of two
hours after development (Megazyme, 2015).
The reactions are:
D-glucose + O2 + H2O → D-gluconate + H2O2
2 H2O2 + para-hydroxybenzoic acid + 4-aminoantipyrine → quinoneimine dye + 4 H2O
19
CHAPTER 3
MATERIALS AND METHODS
3.1 Materials
3.1.1 Guava By-products
Pink guava (Psidium guajava L.) puree processing by-products namely refiner,
siever and decanter were obtained from Sime Darby Beverages Sdn. Bhd. in
Sitiawan, Perak, Malaysia. The by-products were collected at different
processing points: cutting and crushing (refiner); sieving (siever); and
decanting (decanter). They were kept in a frozen form at -20oC prior to pre-
analysis treatments.
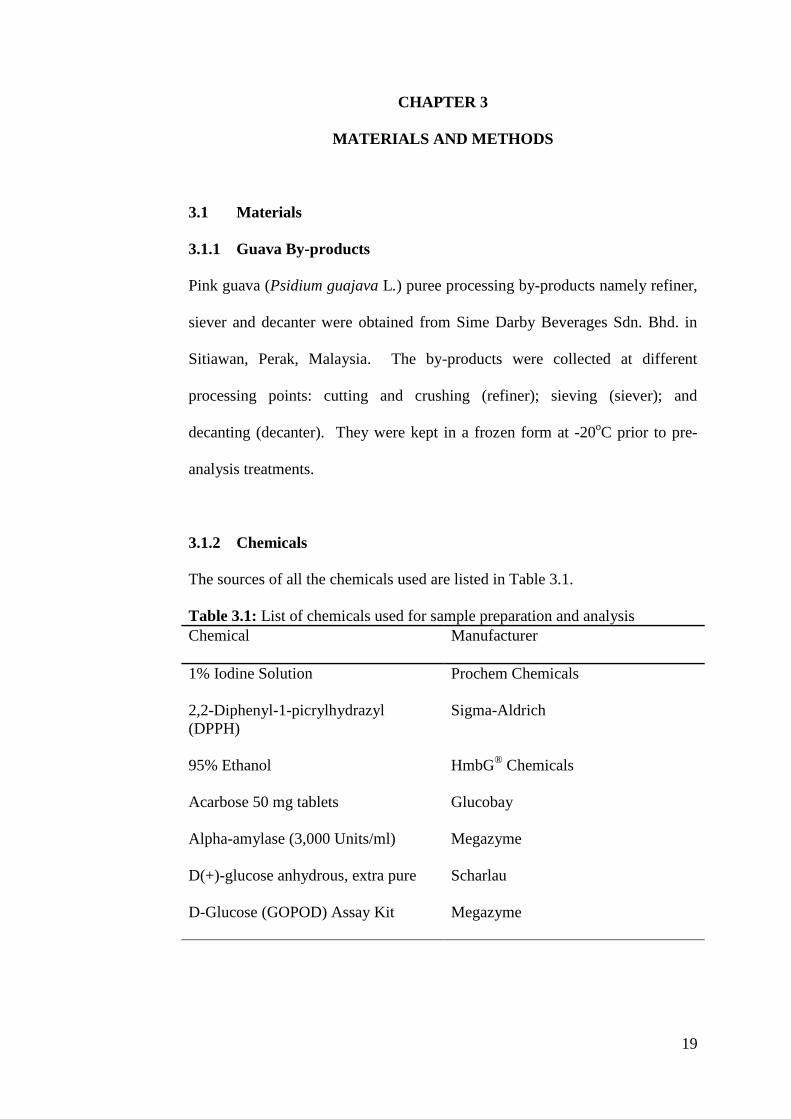
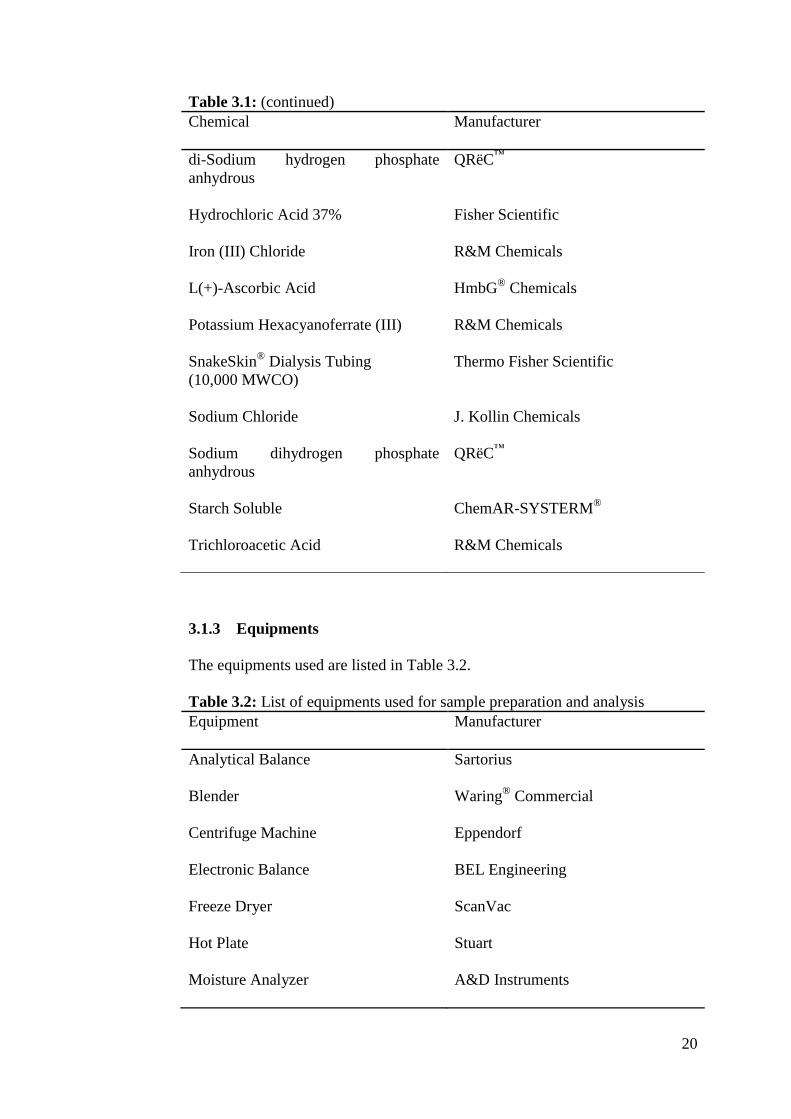
3.1.2 Chemicals
The sources of all the chemicals used are listed in Table 3.1.
Table 3.1: List of chemicals used for sample preparation and analysis
Chemical Manufacturer
1% Iodine Solution Prochem Chemicals
2,2-Diphenyl-1-picrylhydrazyl
(DPPH)
Sigma-Aldrich
95% Ethanol HmbG®
Chemicals
Acarbose 50 mg tablets Glucobay
Alpha-amylase (3,000 Units/ml) Megazyme
D(+)-glucose anhydrous, extra pure Scharlau
D-Glucose (GOPOD) Assay Kit Megazyme
20
Table 3.1: (continued)
Chemical Manufacturer
di-Sodium hydrogen phosphate
anhydrous
QRëC™
Hydrochloric Acid 37% Fisher Scientific
Iron (III) Chloride R&M Chemicals
L(+)-Ascorbic Acid HmbG®
Chemicals
Potassium Hexacyanoferrate (III) R&M Chemicals
SnakeSkin®
Dialysis Tubing
(10,000 MWCO)
Thermo Fisher Scientific
Sodium Chloride J. Kollin Chemicals
Sodium dihydrogen phosphate
anhydrous
QRëC™
Starch Soluble ChemAR-SYSTERM®
Trichloroacetic Acid R&M Chemicals
3.1.3 Equipments
The equipments used are listed in Table 3.2.
Table 3.2: List of equipments used for sample preparation and analysis
Equipment Manufacturer
Analytical Balance Sartorius
Blender Waring®
Commercial
Centrifuge Machine Eppendorf
Electronic Balance BEL Engineering
Freeze Dryer ScanVac
Hot Plate Stuart
Moisture Analyzer A&D Instruments
21
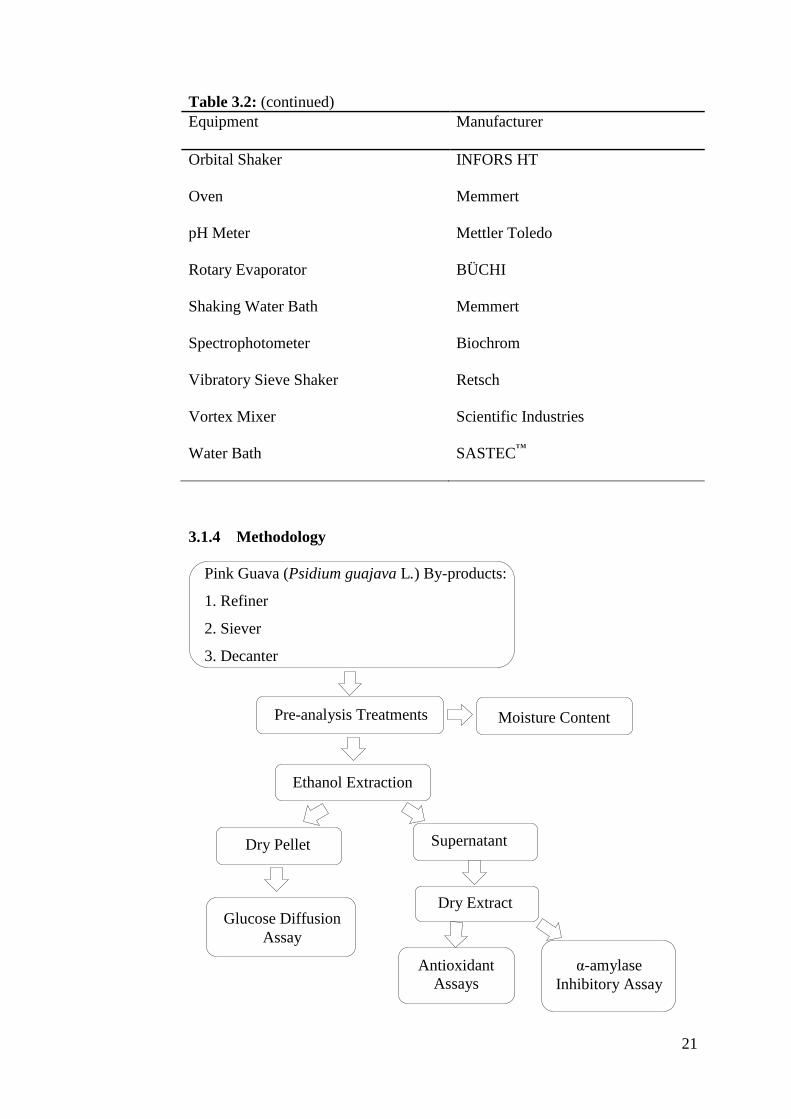
Table 3.2: (continued)
Equipment Manufacturer
Orbital Shaker INFORS HT
Oven Memmert
pH Meter Mettler Toledo
Rotary Evaporator BÜCHI
Shaking Water Bath Memmert
Spectrophotometer Biochrom
Vibratory Sieve Shaker Retsch
Vortex Mixer Scientific Industries
Water Bath SASTEC™
3.1.4 Methodology
Pink Guava (Psidium guajava L.) By-products:
1. Refiner
2. Siever
3. Decanter
Moisture Content Pre-analysis Treatments
Dry Pellet
Glucose Diffusion
Assay
Dry Extract
Antioxidant
Assays
α-amylase
Inhibitory Assay
Ethanol Extraction
Supernatant
22
3.2 Pre-analysis Treatments
The samples (refiner, siever and decanter) were freeze-dried for about 48 hours
to get rid of excess water. The dried samples were then finely ground to a
particle size of less than 1.2 mm before passing through sieve sizes of 1 mm,
500 µm and 250 µm, using a vibratory sieve shaker (Retsch, Germany). In this
study, the particle sizes selected for extractions were ranged from 250 µm to
500 µm. The pulverized samples were stored in capped bottles at room
temperature prior to further analysis or extractions.
3.3 Determination of Moisture Content
Approximately 2 g of pulverized sample was weighed and spread evenly on a
sample pan. The sample pan was then placed in a moisture analyzer (A&D
Instruments Ltd, United Kingdom), with a pre-set drying temperature of 105oC.
Once the measurement was done, the heater cover was opened and the sample
was removed from the moisture analyser by using the pan handle.
3.4 Ethanol Extractions
3.4.1 Simple Maceration
The ethanolic extraction of guava by-product was performed based on the
method of Farrant et al. (2003), with some modifications. Approximately 2.5 g
of sample was extracted in 100 ml of ethanol (80%, v/v) using two 50 ml
centrifuge tubes. The mixture was then heated for 1 hour at 80oC in a shaking
water bath (Memmert, Germany). After heating, the mixture was centrifuged
for 20 minutes at 7,800 rpm. The supernatant was decanted, whereas the pellet
was re-suspended and re-extracted for another time. Again, the supernatant
23
was decanted, while the pellet was added with 50 ml of ethanol (80%, v/v),
before heating (1 hour at 80oC in a shaking water bath) and centrifugation (20
minutes at 7,800 rpm). All the three supernatants collected after
centrifugations were combined. This extract was then concentrated through
evaporation using a rotary evaporator at 50oC with a water aspirator. The dry
extract was then kept in a desiccator. On the other hand, the final pellet
obtained was dried at 50oC in an oven overnight and stored at room
temperature for further analysis. The yield of the extract and dry pellet were
calculated based on the following equation:
Yield (%) = (Weight of extract or pellet / 2.5 g of sample used) × 100%
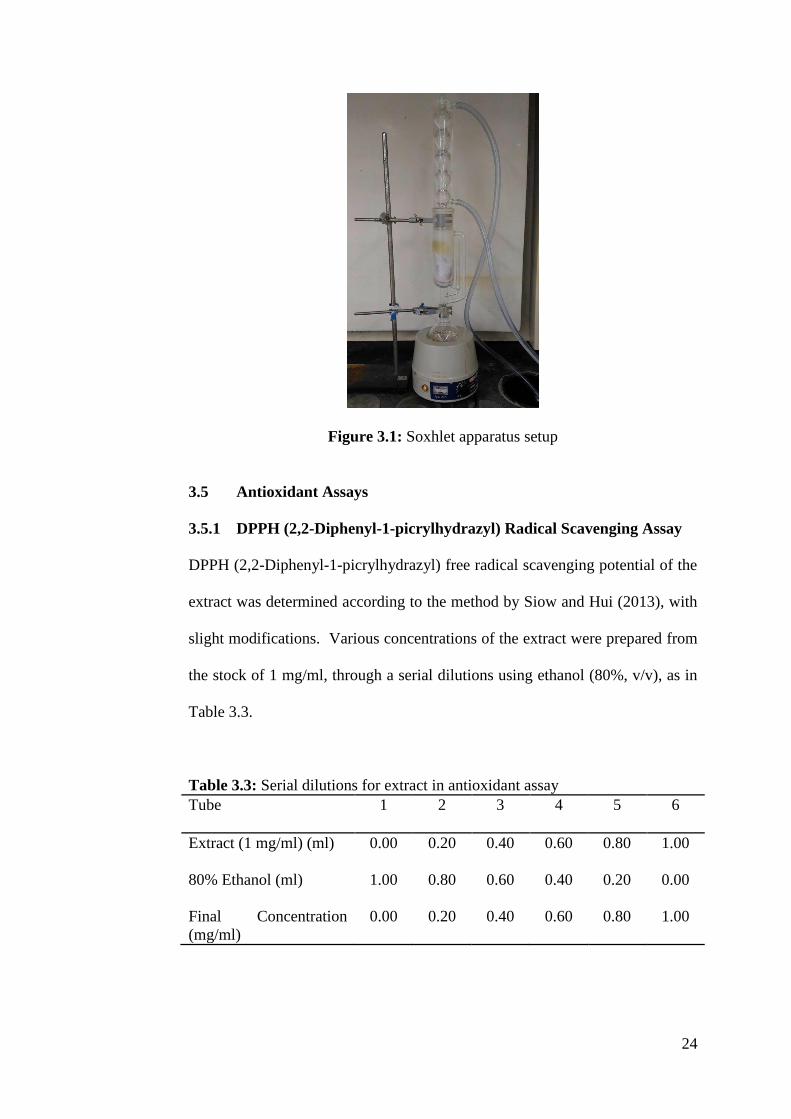
3.4.2 Soxhlet Extraction
Soxhlet extraction of guava by-product was adapted from Pandey, Pandey and
Singh (2014), with some modifications. The Soxhlet apparatus was set up as
shown in Figure 3.1. Approximately 2.5 g of sample was weighed and
wrapped with a few layers of cheese cloth. It was then placed into the
extraction chamber and extracted for 7 hours with 250 ml of ethanol (80%, v/v)
through hot continuous percolation method using Soxhlet apparatus so as to
eliminate some coloured materials, oligosaccharides and other low molecular
weight compounds (Boual et al., 2012). After that, the residue remained in the
extraction chamber was allowed to dry out at 50oC in an oven overnight and
stored at room temperature for further analysis.
24
Figure 3.1: Soxhlet apparatus setup
3.5 Antioxidant Assays
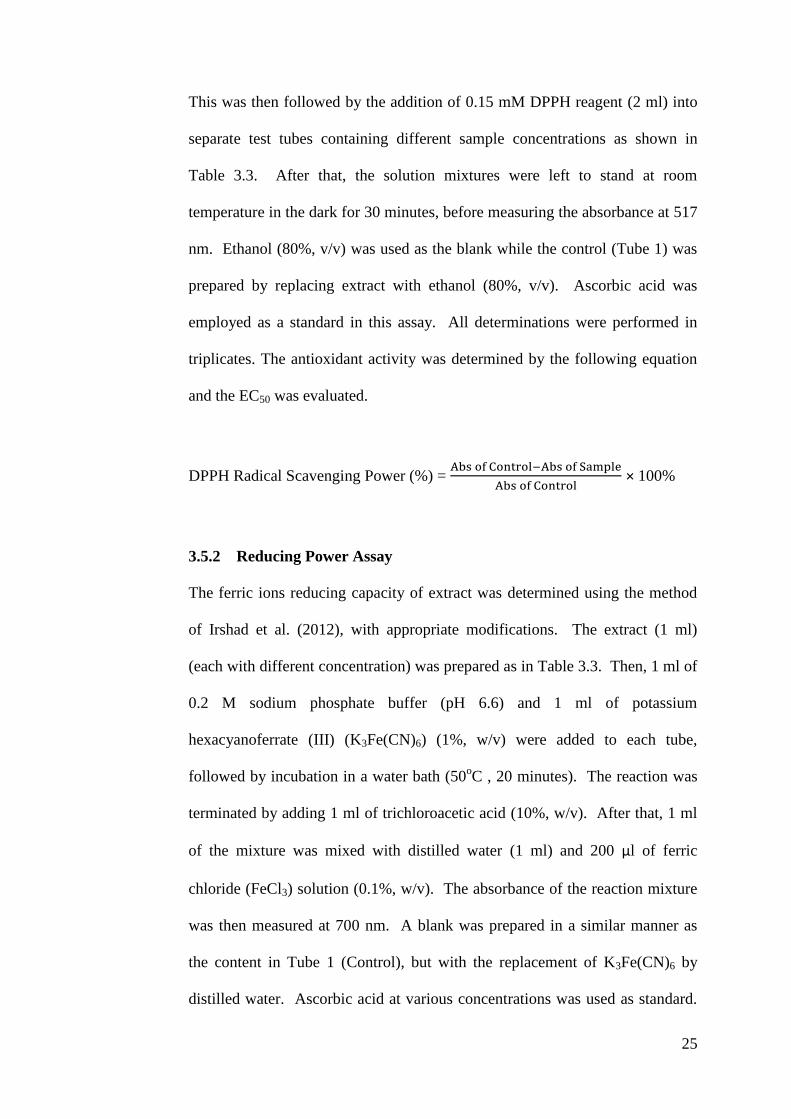
3.5.1 DPPH (2,2-Diphenyl-1-picrylhydrazyl) Radical Scavenging Assay
DPPH (2,2-Diphenyl-1-picrylhydrazyl) free radical scavenging potential of the
extract was determined according to the method by Siow and Hui (2013), with
slight modifications. Various concentrations of the extract were prepared from
the stock of 1 mg/ml, through a serial dilutions using ethanol (80%, v/v), as in
Table 3.3.
Table 3.3: Serial dilutions for extract in antioxidant assay
Tube 1 2 3 4 5 6
Extract (1 mg/ml) (ml) 0.00 0.20 0.40 0.60 0.80 1.00
80% Ethanol (ml) 1.00 0.80 0.60 0.40 0.20 0.00
Final Concentration
(mg/ml)
0.00 0.20 0.40 0.60 0.80 1.00
25
This was then followed by the addition of 0.15 mM DPPH reagent (2 ml) into
separate test tubes containing different sample concentrations as shown in
Table 3.3. After that, the solution mixtures were left to stand at room
temperature in the dark for 30 minutes, before measuring the absorbance at 517
nm. Ethanol (80%, v/v) was used as the blank while the control (Tube 1) was
prepared by replacing extract with ethanol (80%, v/v). Ascorbic acid was
employed as a standard in this assay. All determinations were performed in
triplicates. The antioxidant activity was determined by the following equation
and the EC50 was evaluated.
DPPH Radical Scavenging Power (%) =
× 100%
3.5.2 Reducing Power Assay
The ferric ions reducing capacity of extract was determined using the method
of Irshad et al. (2012), with appropriate modifications. The extract (1 ml)
(each with different concentration) was prepared as in Table 3.3. Then, 1 ml of
0.2 M sodium phosphate buffer (pH 6.6) and 1 ml of potassium
hexacyanoferrate (III) (K3Fe(CN)6) (1%, w/v) were added to each tube,
followed by incubation in a water bath (50oC , 20 minutes). The reaction was
terminated by adding 1 ml of trichloroacetic acid (10%, w/v). After that, 1 ml
of the mixture was mixed with distilled water (1 ml) and 200 µl of ferric
chloride (FeCl3) solution (0.1%, w/v). The absorbance of the reaction mixture
was then measured at 700 nm. A blank was prepared in a similar manner as
the content in Tube 1 (Control), but with the replacement of K3Fe(CN)6 by
distilled water. Ascorbic acid at various concentrations was used as standard.
26
All determinations were performed in triplicates. The reducing power for each
extract can be expressed as:
Reducing Power (%) =
× 100%
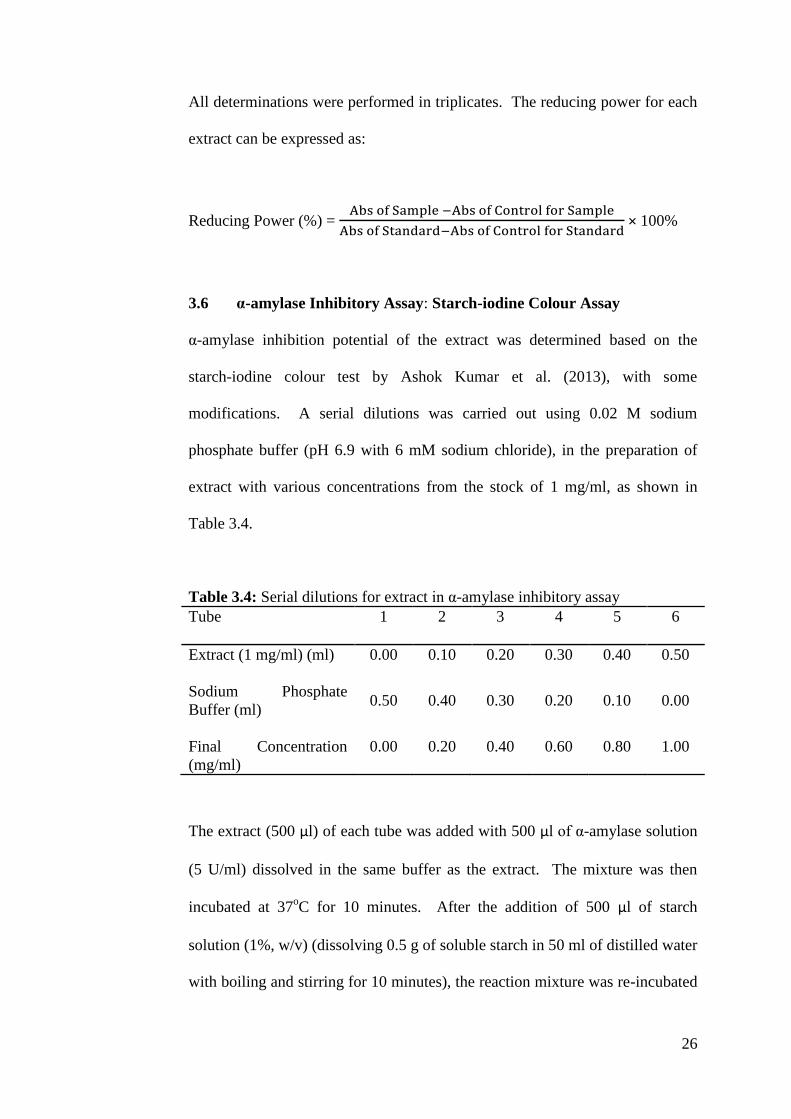
3.6 α-amylase Inhibitory Assay: Starch-iodine Colour Assay
α-amylase inhibition potential of the extract was determined based on the
starch-iodine colour test by Ashok Kumar et al. (2013), with some
modifications. A serial dilutions was carried out using 0.02 M sodium
phosphate buffer (pH 6.9 with 6 mM sodium chloride), in the preparation of
extract with various concentrations from the stock of 1 mg/ml, as shown in
Table 3.4.
Table 3.4: Serial dilutions for extract in α-amylase inhibitory assay
Tube 1 2 3 4 5 6
Extract (1 mg/ml) (ml) 0.00 0.10 0.20 0.30 0.40 0.50
Sodium Phosphate
Buffer (ml)
0.50 0.40 0.30 0.20 0.10 0.00
Final Concentration
(mg/ml)
0.00 0.20 0.40 0.60 0.80 1.00
The extract (500 µl) of each tube was added with 500 µl of α-amylase solution
(5 U/ml) dissolved in the same buffer as the extract. The mixture was then
incubated at 37oC for 10 minutes. After the addition of 500 µl of starch
solution (1%, w/v) (dissolving 0.5 g of soluble starch in 50 ml of distilled water
with boiling and stirring for 10 minutes), the reaction mixture was re-incubated
27
at 37oC for 15 minutes. Then, 20 µl of 1 M HCl was added to terminate the
enzymatic reaction in each tube, followed by the addition of 1% iodine reagent
(100 µl). The absorbance was then read at 620 nm against buffer for the
measurement of starch-iodine complex. Two controls were used in the assay,
namely inhibition control (100% inhibition) and enzyme control (0%
inhibition). The inhibition control contained 50 µg/ml acarbose whereas the
enzyme control was the standard reaction with no inhibitors (Tube 1). All
determinations were done in triplicates. Inhibition of α-amylase activity was
evaluated as:
Inhibition of α-amylase activity (%) =
) × 100%
where:
S = Absorbance of extract
I = Absorbance of inhibition control
E = Absorbance of enzyme control
3.7 Determination of Hypoglycemic Potential
3.7.1 Quantitation of D-glucose
The quantitation of D-glucose was carried out by using the D-Glucose (glucose
oxidase/peroxidase; GOPOD) Assay Kit K-GLUC 10/15 (Megazyme
International Ireland Ltd.) based on enzymatic-spectrophotometric principles,
through reactions of D-glucose with glucose oxidase and peroxidase
(Megazyme, 2015).
28
An aliquot of 0.1 ml of sample solution (containing D-glucose) was added with
3 ml of GOPOD reagent, followed by incubation at 50oC for 20 minutes. The
absorbance was then read at 510 nm against the reagent blank (0.1 ml distilled
water + 3 ml GOPOD reagent) (Megazyme, 2015).
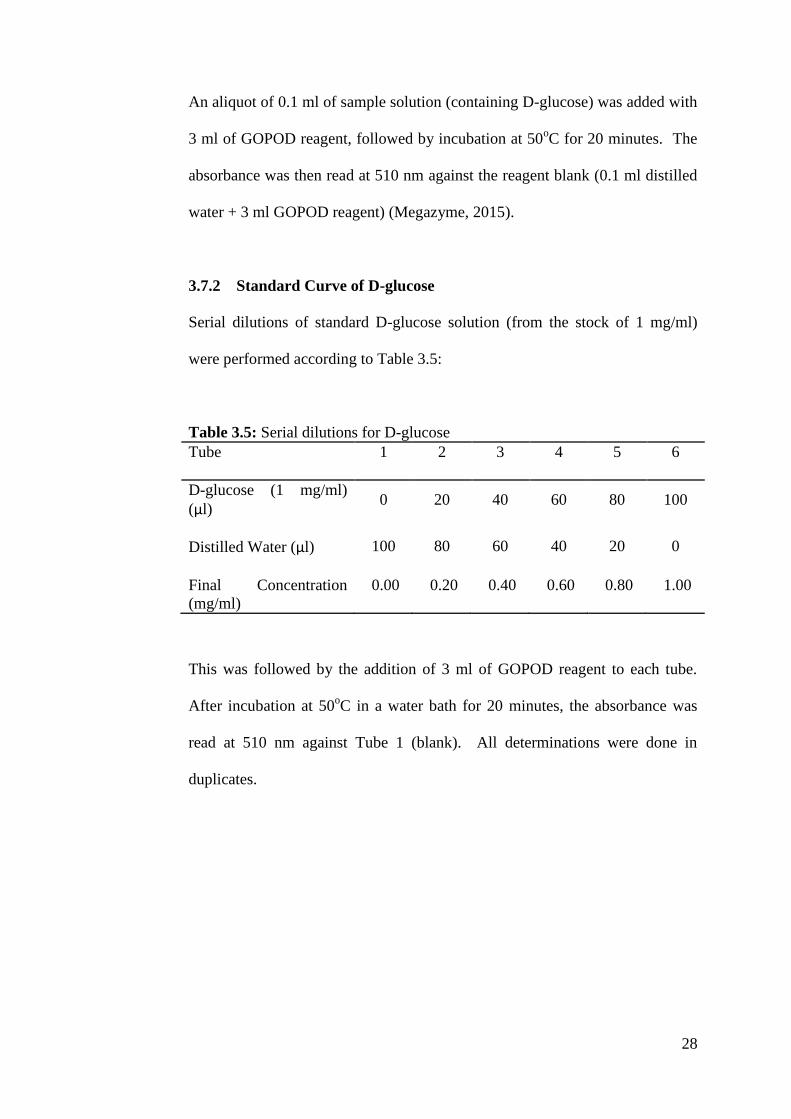
3.7.2 Standard Curve of D-glucose
Serial dilutions of standard D-glucose solution (from the stock of 1 mg/ml)
were performed according to Table 3.5:
Table 3.5: Serial dilutions for D-glucose
Tube 1 2 3 4 5 6
D-glucose (1 mg/ml)
(µl)
0 20 40 60 80 100
Distilled Water (µl) 100 80 60 40 20 0
Final Concentration
(mg/ml)
0.00 0.20 0.40 0.60 0.80 1.00
This was followed by the addition of 3 ml of GOPOD reagent to each tube.
After incubation at 50oC in a water bath for 20 minutes, the absorbance was
read at 510 nm against Tube 1 (blank). All determinations were done in
duplicates.
29
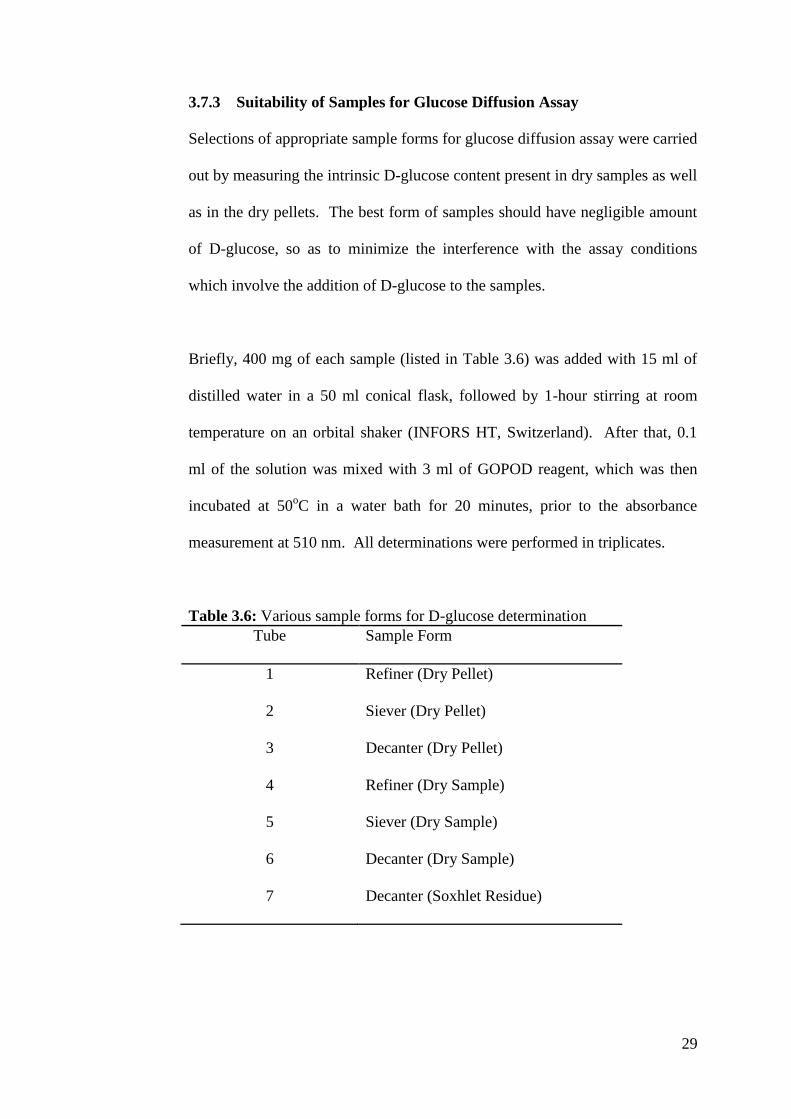
3.7.3 Suitability of Samples for Glucose Diffusion Assay
Selections of appropriate sample forms for glucose diffusion assay were carried
out by measuring the intrinsic D-glucose content present in dry samples as well
as in the dry pellets. The best form of samples should have negligible amount
of D-glucose, so as to minimize the interference with the assay conditions
which involve the addition of D-glucose to the samples.
Briefly, 400 mg of each sample (listed in Table 3.6) was added with 15 ml of
distilled water in a 50 ml conical flask, followed by 1-hour stirring at room
temperature on an orbital shaker (INFORS HT, Switzerland). After that, 0.1
ml of the solution was mixed with 3 ml of GOPOD reagent, which was then
incubated at 50oC in a water bath for 20 minutes, prior to the absorbance
measurement at 510 nm. All determinations were performed in triplicates.
Table 3.6: Various sample forms for D-glucose determination
Tube Sample Form
1 Refiner (Dry Pellet)
2 Siever (Dry Pellet)
3 Decanter (Dry Pellet)
4 Refiner (Dry Sample)
5 Siever (Dry Sample)
6 Decanter (Dry Sample)
7 Decanter (Soxhlet Residue)
30
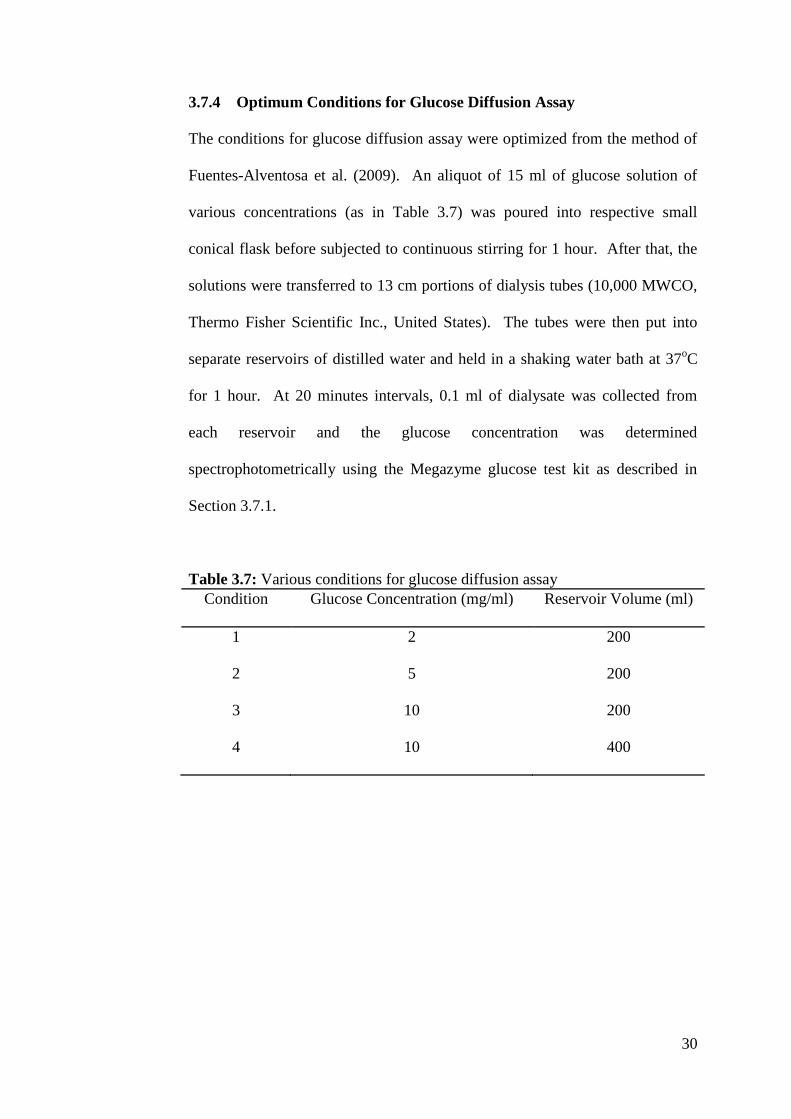
3.7.4 Optimum Conditions for Glucose Diffusion Assay
The conditions for glucose diffusion assay were optimized from the method of
Fuentes-Alventosa et al. (2009). An aliquot of 15 ml of glucose solution of
various concentrations (as in Table 3.7) was poured into respective small
conical flask before subjected to continuous stirring for 1 hour. After that, the
solutions were transferred to 13 cm portions of dialysis tubes (10,000 MWCO,
Thermo Fisher Scientific Inc., United States). The tubes were then put into
separate reservoirs of distilled water and held in a shaking water bath at 37oC
for 1 hour. At 20 minutes intervals, 0.1 ml of dialysate was collected from
each reservoir and the glucose concentration was determined
spectrophotometrically using the Megazyme glucose test kit as described in
Section 3.7.1.
Table 3.7: Various conditions for glucose diffusion assay
Condition Glucose Concentration (mg/ml) Reservoir Volume (ml)
1 2 200
2 5 200
3 10 200
4 10 400
31
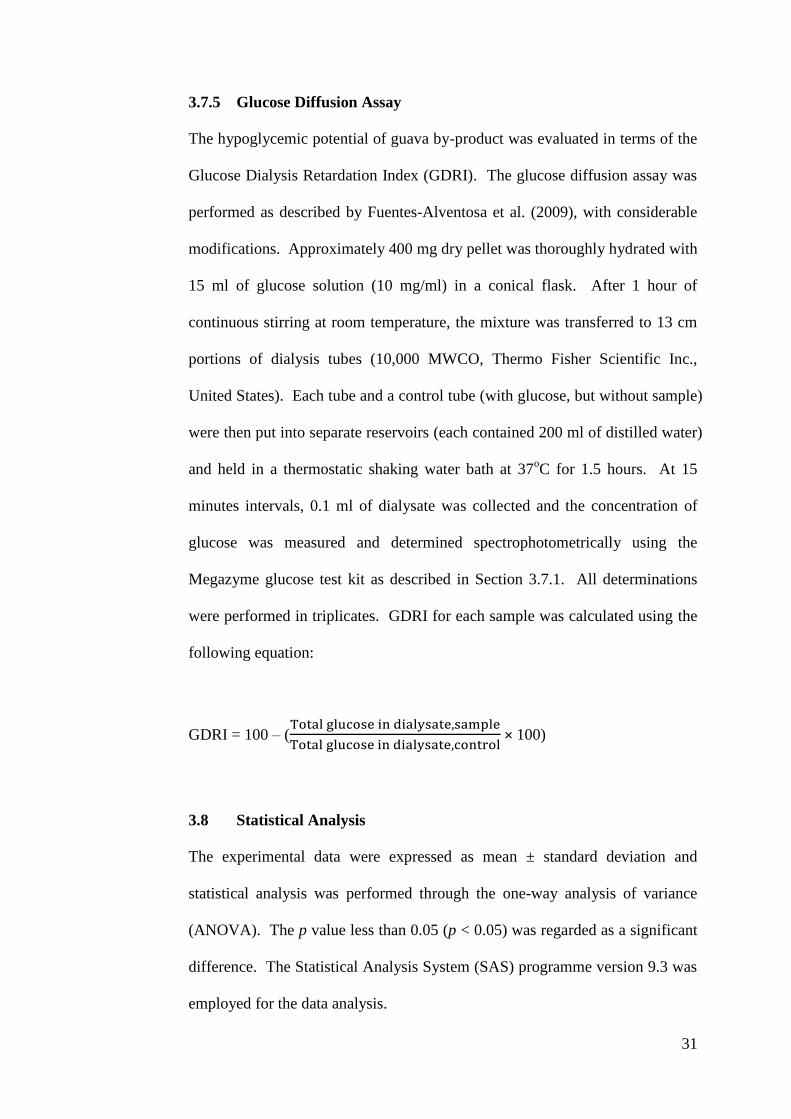
3.7.5 Glucose Diffusion Assay
The hypoglycemic potential of guava by-product was evaluated in terms of the
Glucose Dialysis Retardation Index (GDRI). The glucose diffusion assay was
performed as described by Fuentes-Alventosa et al. (2009), with considerable
modifications. Approximately 400 mg dry pellet was thoroughly hydrated with
15 ml of glucose solution (10 mg/ml) in a conical flask. After 1 hour of
continuous stirring at room temperature, the mixture was transferred to 13 cm
portions of dialysis tubes (10,000 MWCO, Thermo Fisher Scientific Inc.,
United States). Each tube and a control tube (with glucose, but without sample)
were then put into separate reservoirs (each contained 200 ml of distilled water)
and held in a thermostatic shaking water bath at 37oC for 1.5 hours. At 15
minutes intervals, 0.1 ml of dialysate was collected and the concentration of
glucose was measured and determined spectrophotometrically using the
Megazyme glucose test kit as described in Section 3.7.1. All determinations
were performed in triplicates. GDRI for each sample was calculated using the
following equation:
GDRI = 100 – (
× 100)
3.8 Statistical Analysis
The experimental data were expressed as mean ± standard deviation and
statistical analysis was performed through the one-way analysis of variance
(ANOVA). The p value less than 0.05 (p < 0.05) was regarded as a significant
difference. The Statistical Analysis System (SAS) programme version 9.3 was
employed for the data analysis.
32
CHAPTER 4
RESULTS
4.1 Moisture Contents of Freeze-Dried Guava By-products
Table 4.1 shows the moisture contents of freeze-dried samples (with particle
sizes of 250 µm to 500 µm) prior to extractions and further analysis. Refiner
had the highest moisture content (4.81%), followed by siever (3.31%) and
decanter (3.17%).
Table 4.1: The moisture content in freeze-dried guava by-products
Sample Moisture Content (%)
Refiner 4.81
Siever 3.31
Decanter 3.17
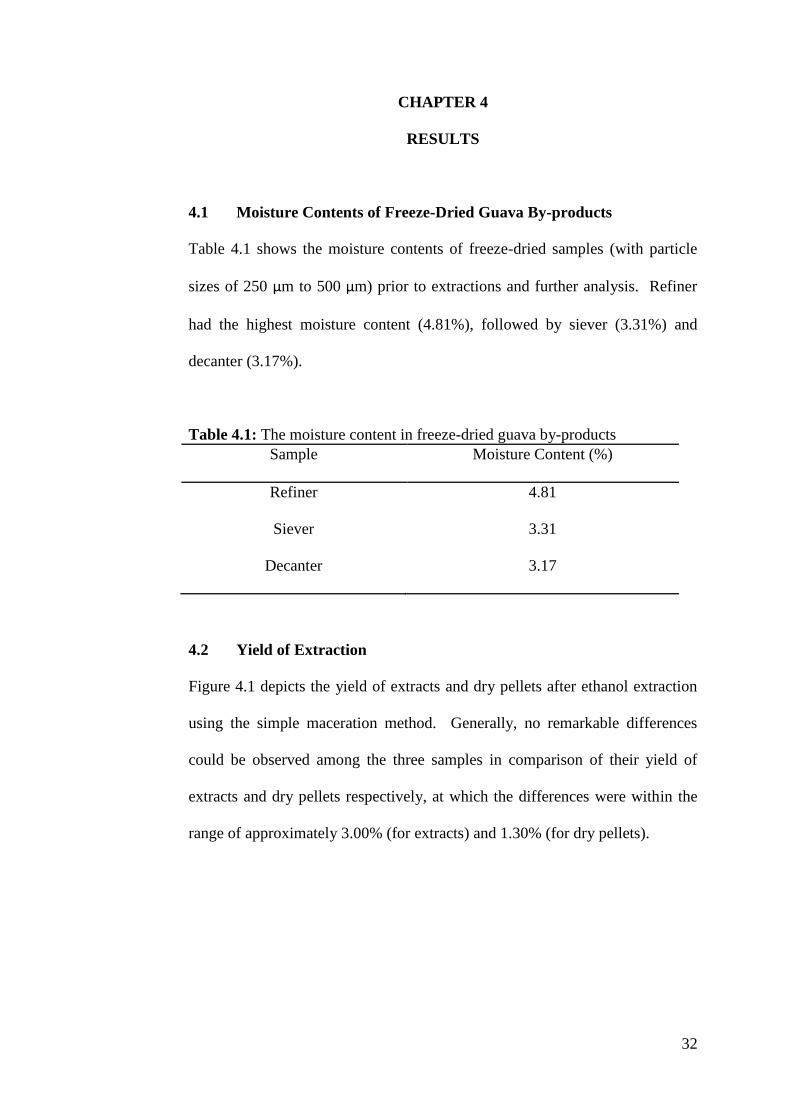
4.2 Yield of Extraction
Figure 4.1 depicts the yield of extracts and dry pellets after ethanol extraction
using the simple maceration method. Generally, no remarkable differences
could be observed among the three samples in comparison of their yield of
extracts and dry pellets respectively, at which the differences were within the
range of approximately 3.00% (for extracts) and 1.30% (for dry pellets).
33
Figure 4.1: The extraction yield in guava by-products. Values represent
means ± SD (n=2).
4.3 Antioxidant Properties of Ethanolic Extracts
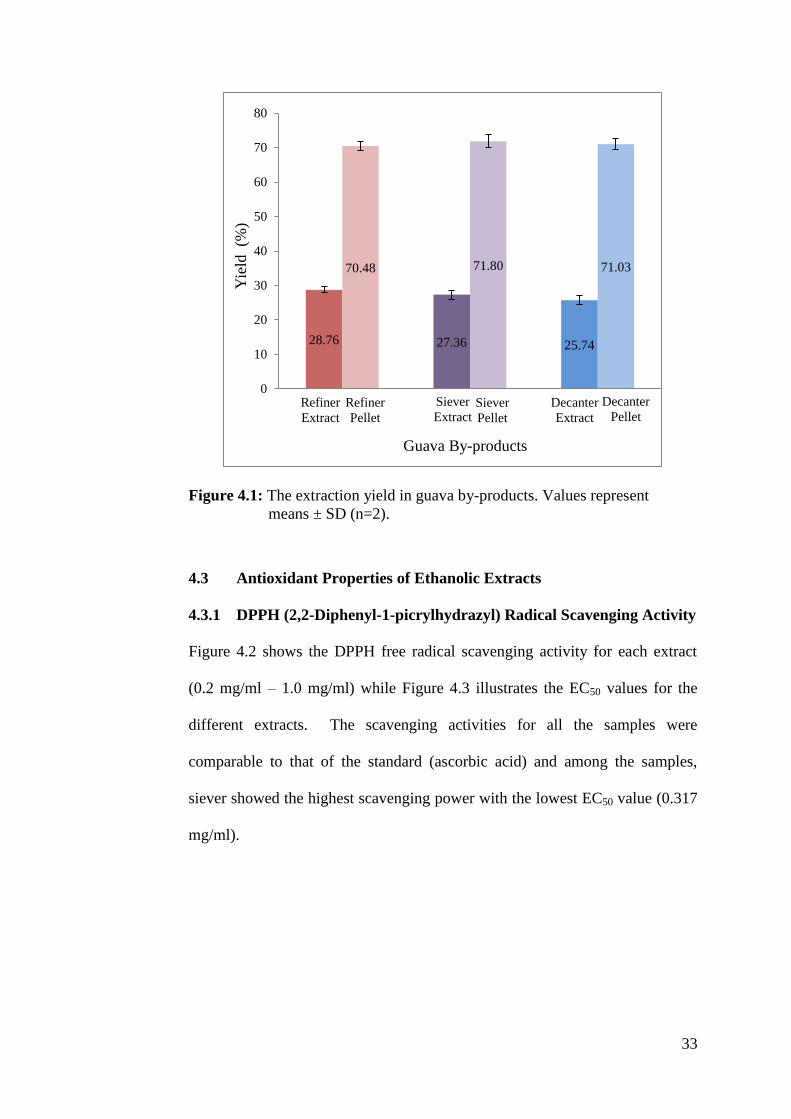
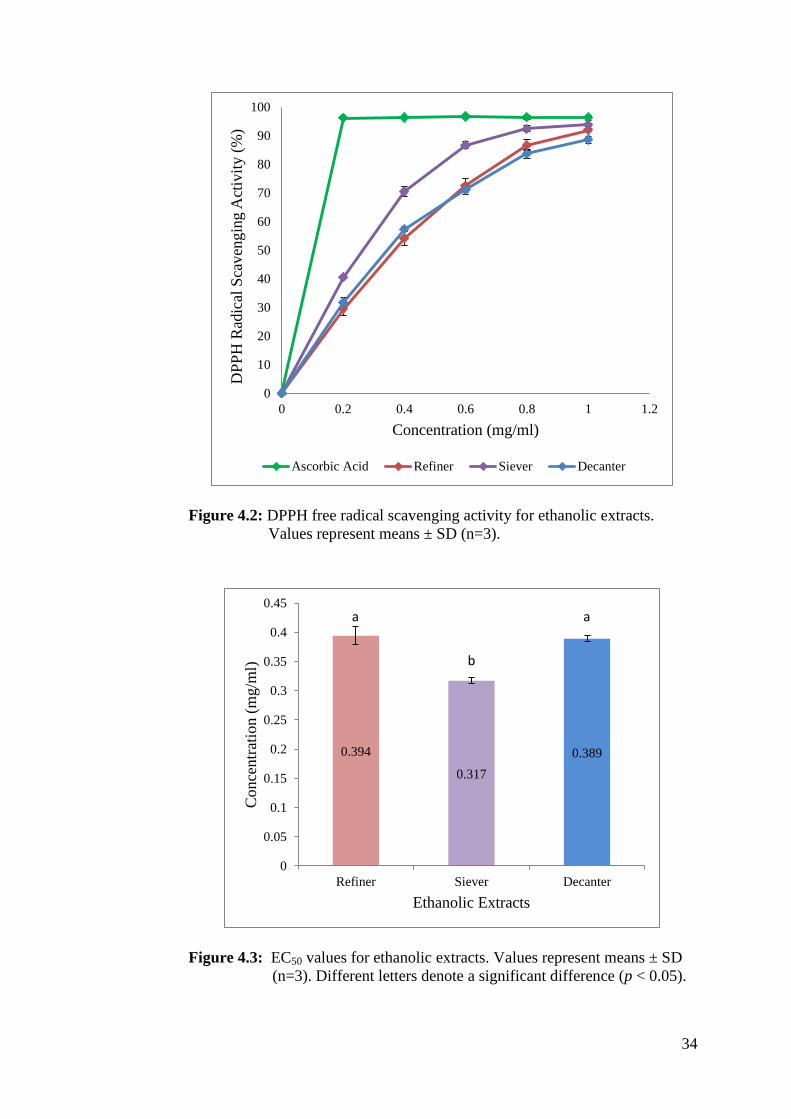
4.3.1 DPPH (2,2-Diphenyl-1-picrylhydrazyl) Radical Scavenging Activity
Figure 4.2 shows the DPPH free radical scavenging activity for each extract
(0.2 mg/ml – 1.0 mg/ml) while Figure 4.3 illustrates the EC50 values for the
different extracts. The scavenging activities for all the samples were
comparable to that of the standard (ascorbic acid) and among the samples,
siever showed the highest scavenging power with the lowest EC50 value (0.317
mg/ml).
28.76 27.36 25.74
70.48 71.80 71.03
0
10
20
30
40
50
60
70
80
Yie
ld (%
)
Guava By-products
Refiner
Extract
Refiner
Pellet
Siever
Extract Siever
Pellet
Decanter
Pellet Decanter
Extract
34
Figure 4.2: DPPH free radical scavenging activity for ethanolic extracts.
Values represent means ± SD (n=3).
Figure 4.3: EC50 values for ethanolic extracts. Values represent means ± SD
(n=3). Different letters denote a significant difference (p < 0.05).
0
10
20
30
40
50
60
70
80
90
100
0 0.2 0.4 0.6 0.8 1 1.2
DP
PH
Rad
ical
Sca
ven
gin
g A
ctiv
ity (
%)
Concentration (mg/ml)
Ascorbic Acid Refiner Siever Decanter
0.394
0.317
0.389
0
0.05
0.1
0.15
0.2
0.25
0.3
0.35
0.4
0.45
Refiner Siever Decanter
Conce
ntr
atio
n (
mg/m
l)
Ethanolic Extracts
a a
b
35
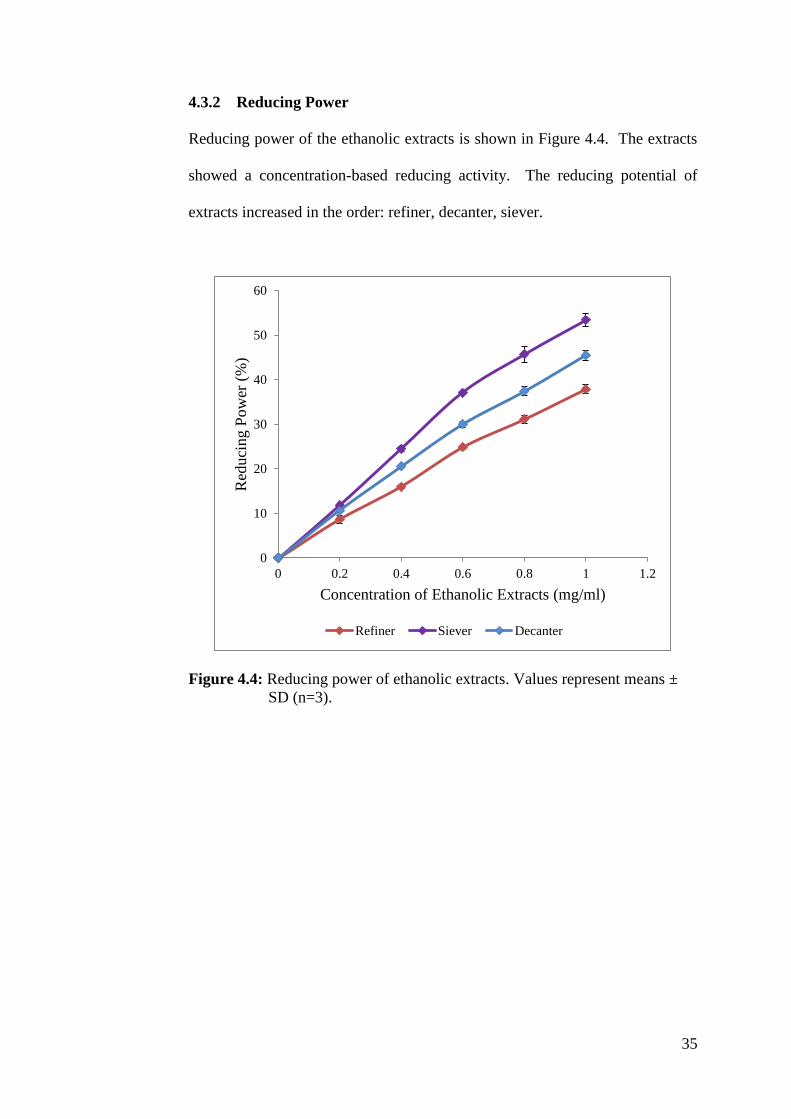
4.3.2 Reducing Power
Reducing power of the ethanolic extracts is shown in Figure 4.4. The extracts
showed a concentration-based reducing activity. The reducing potential of
extracts increased in the order: refiner, decanter, siever.
Figure 4.4: Reducing power of ethanolic extracts. Values represent means ±
SD (n=3).
0
10
20
30
40
50
60
0 0.2 0.4 0.6 0.8 1 1.2
Red
uci
ng P
ow
er (
%)
Concentration of Ethanolic Extracts (mg/ml)
Refiner Siever Decanter
36
4.4 α-amylase Inhibition Properties of Ethanolic Extracts
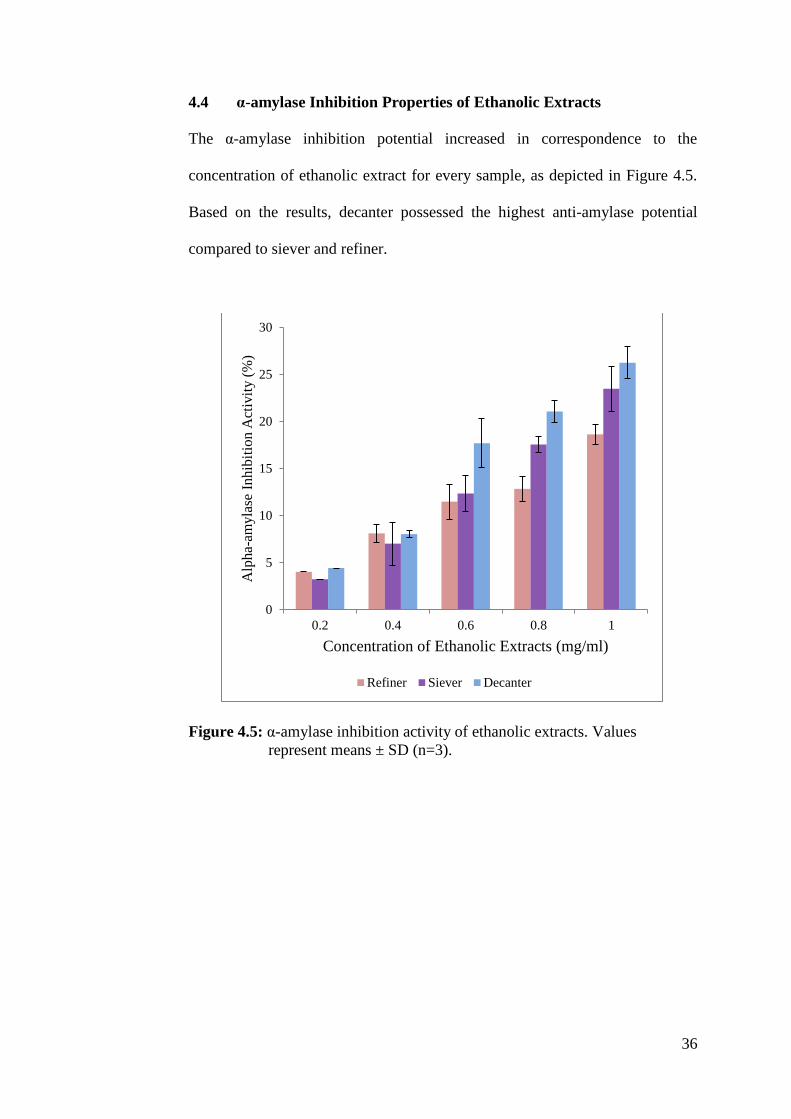
The α-amylase inhibition potential increased in correspondence to the
concentration of ethanolic extract for every sample, as depicted in Figure 4.5.
Based on the results, decanter possessed the highest anti-amylase potential
compared to siever and refiner.
Figure 4.5: α-amylase inhibition activity of ethanolic extracts. Values
represent means ± SD (n=3).
0
5
10
15
20
25
30
0.2 0.4 0.6 0.8 1
Alp
ha-
amyla
se I
nhib
itio
n A
ctiv
ity (
%)
Concentration of Ethanolic Extracts (mg/ml)
Refiner Siever Decanter
37
4.5 Hypoglycemic Potentials of Dry Pellets
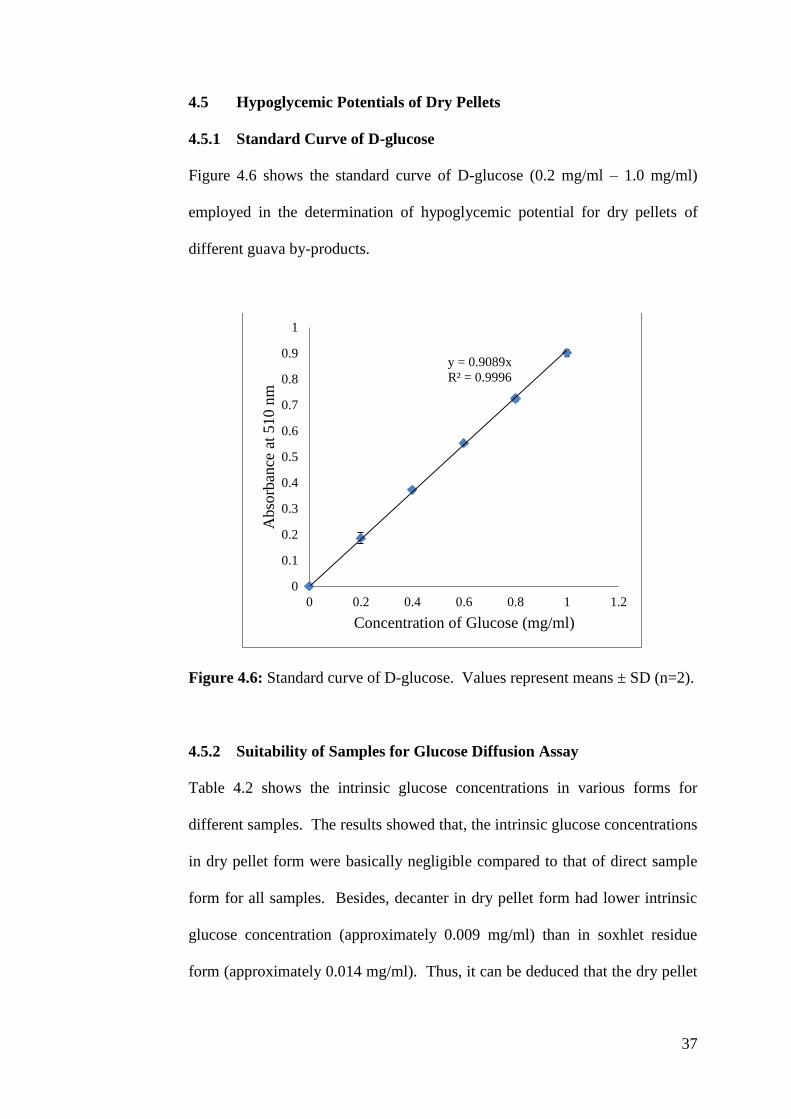
4.5.1 Standard Curve of D-glucose
Figure 4.6 shows the standard curve of D-glucose (0.2 mg/ml – 1.0 mg/ml)
employed in the determination of hypoglycemic potential for dry pellets of
different guava by-products.
Figure 4.6: Standard curve of D-glucose. Values represent means ± SD (n=2).
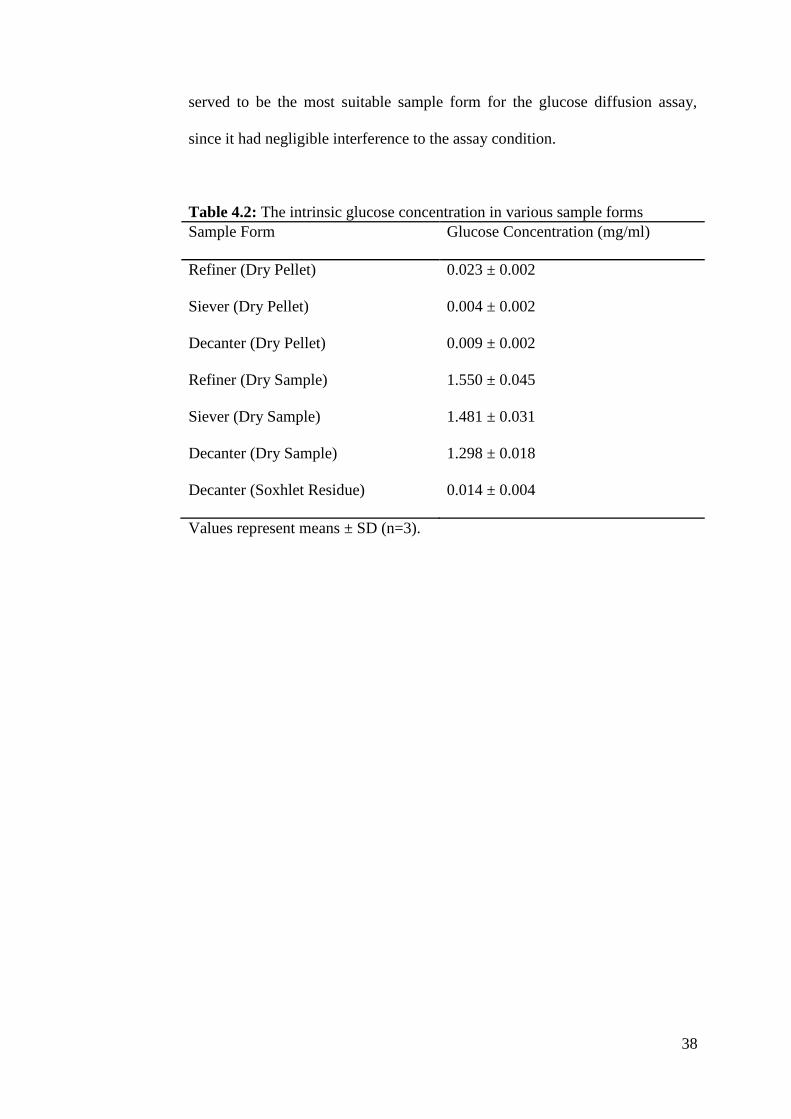
4.5.2 Suitability of Samples for Glucose Diffusion Assay
Table 4.2 shows the intrinsic glucose concentrations in various forms for
different samples. The results showed that, the intrinsic glucose concentrations
in dry pellet form were basically negligible compared to that of direct sample
form for all samples. Besides, decanter in dry pellet form had lower intrinsic
glucose concentration (approximately 0.009 mg/ml) than in soxhlet residue
form (approximately 0.014 mg/ml). Thus, it can be deduced that the dry pellet
y = 0.9089x
R² = 0.9996
0
0.1
0.2
0.3
0.4
0.5
0.6
0.7
0.8
0.9
1
0 0.2 0.4 0.6 0.8 1 1.2
Abso
rban
ce a
t 510 n
m
Concentration of Glucose (mg/ml)
38
served to be the most suitable sample form for the glucose diffusion assay,
since it had negligible interference to the assay condition.
Table 4.2: The intrinsic glucose concentration in various sample forms
Sample Form Glucose Concentration (mg/ml)
Refiner (Dry Pellet) 0.023 ± 0.002
Siever (Dry Pellet) 0.004 ± 0.002
Decanter (Dry Pellet) 0.009 ± 0.002
Refiner (Dry Sample) 1.550 ± 0.045
Siever (Dry Sample) 1.481 ± 0.031
Decanter (Dry Sample) 1.298 ± 0.018
Decanter (Soxhlet Residue) 0.014 ± 0.004
Values represent means ± SD (n=3).
39
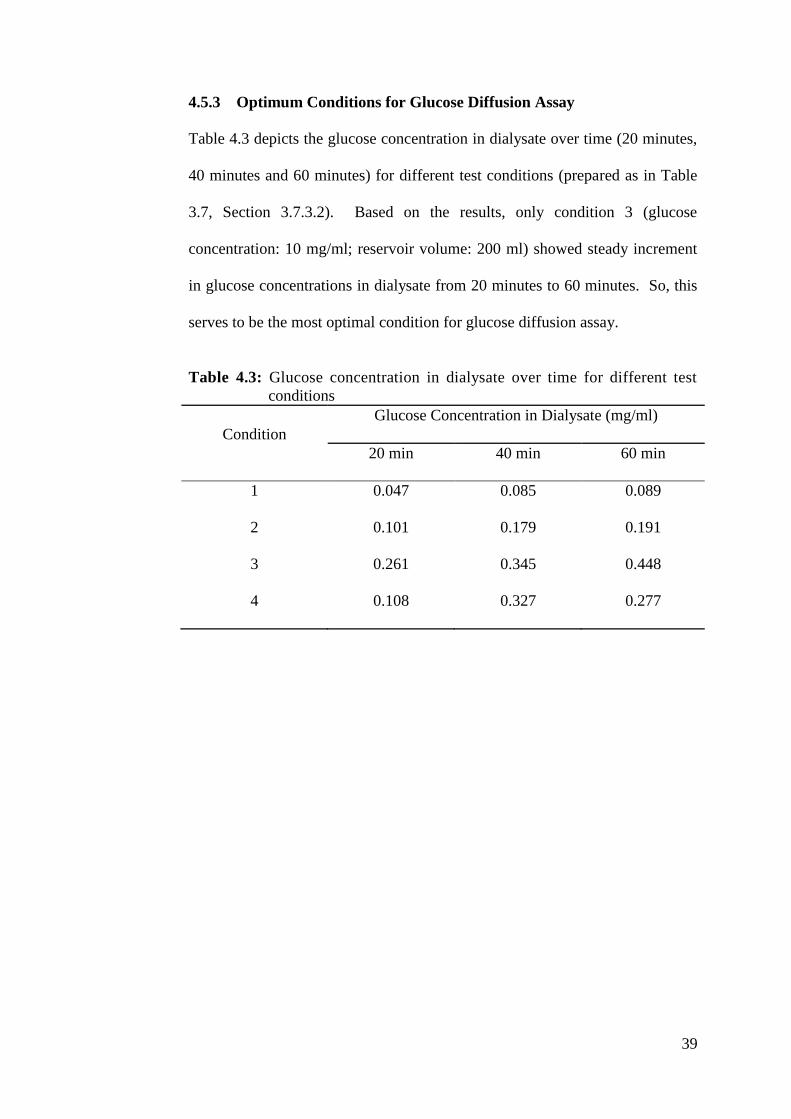
4.5.3 Optimum Conditions for Glucose Diffusion Assay
Table 4.3 depicts the glucose concentration in dialysate over time (20 minutes,
40 minutes and 60 minutes) for different test conditions (prepared as in Table
3.7, Section 3.7.3.2). Based on the results, only condition 3 (glucose
concentration: 10 mg/ml; reservoir volume: 200 ml) showed steady increment
in glucose concentrations in dialysate from 20 minutes to 60 minutes. So, this
serves to be the most optimal condition for glucose diffusion assay.
Table 4.3: Glucose concentration in dialysate over time for different test
conditions
Condition
Glucose Concentration in Dialysate (mg/ml)
20 min 40 min 60 min
1 0.047 0.085 0.089
2 0.101 0.179 0.191
3 0.261 0.345 0.448
4 0.108 0.327 0.277
40
4.5.4 Glucose Diffusion Assay
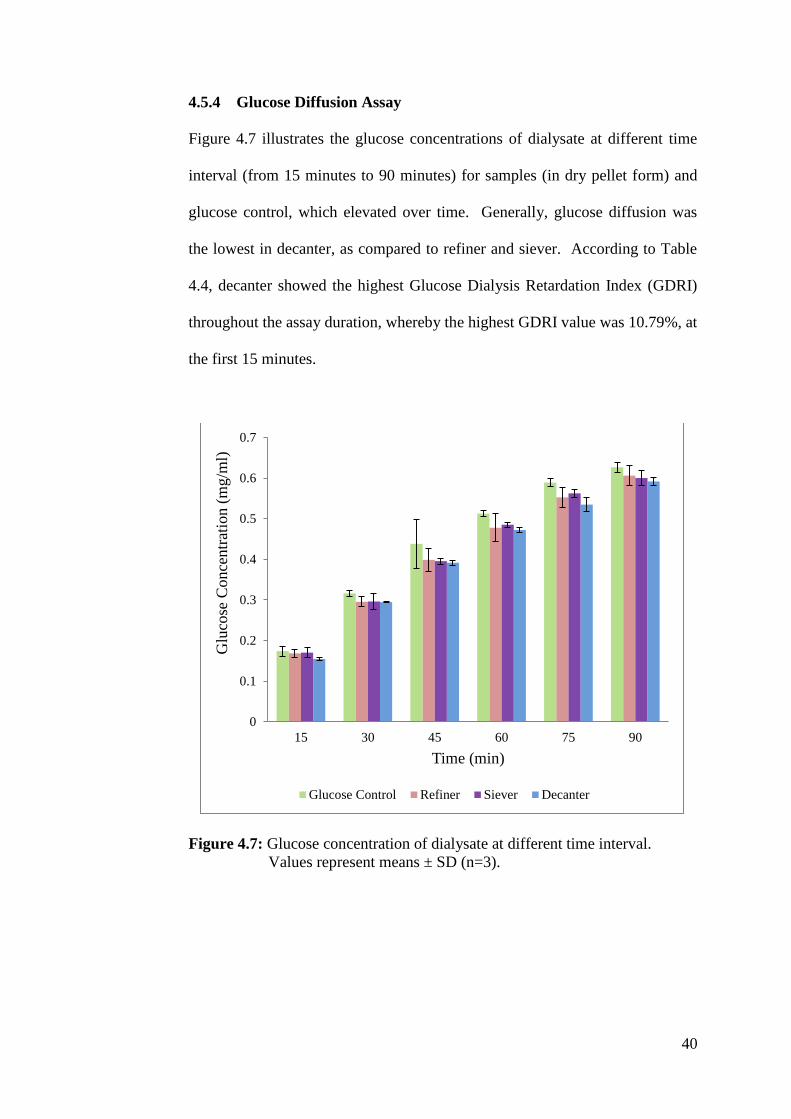
Figure 4.7 illustrates the glucose concentrations of dialysate at different time
interval (from 15 minutes to 90 minutes) for samples (in dry pellet form) and
glucose control, which elevated over time. Generally, glucose diffusion was
the lowest in decanter, as compared to refiner and siever. According to Table
4.4, decanter showed the highest Glucose Dialysis Retardation Index (GDRI)
throughout the assay duration, whereby the highest GDRI value was 10.79%, at
the first 15 minutes.
Figure 4.7: Glucose concentration of dialysate at different time interval.
Values represent means ± SD (n=3).
0
0.1
0.2
0.3
0.4
0.5
0.6
0.7
15 30 45 60 75 90
Glu
cose
Conce
ntr
atio
n (
mg/m
l)
Time (min)
Glucose Control Refiner Siever Decanter
41
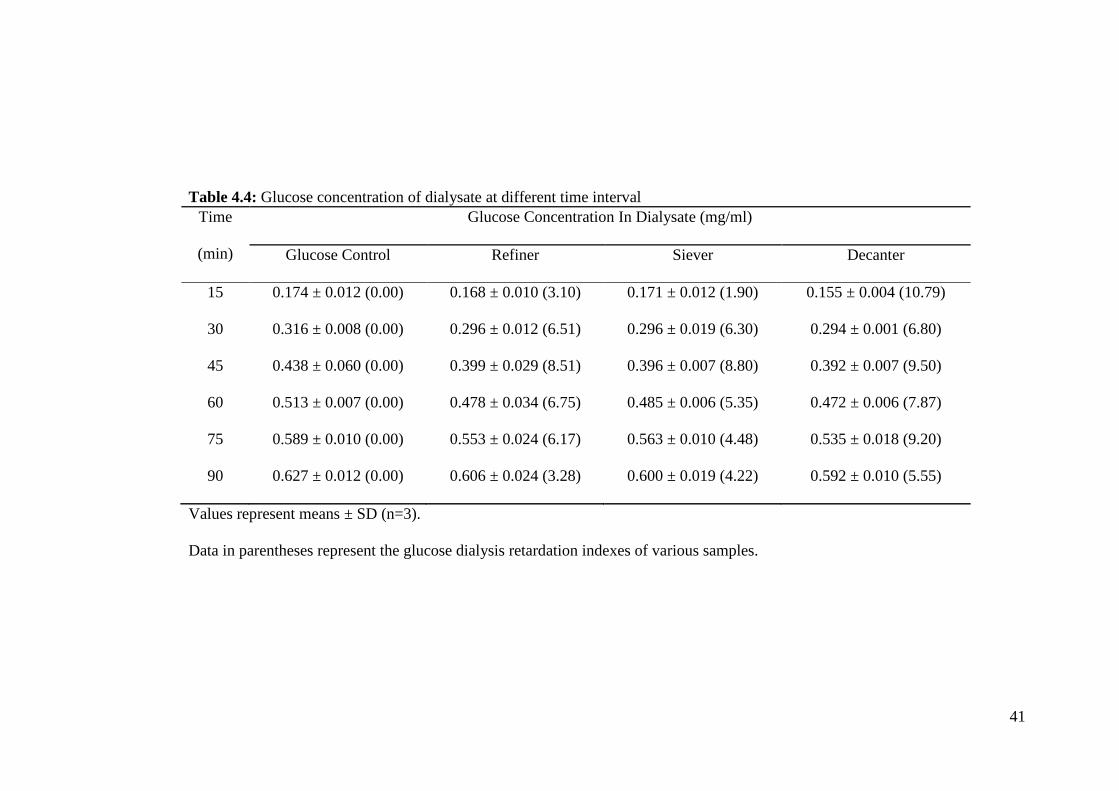
Table 4.4: Glucose concentration of dialysate at different time interval
Time
(min)
Glucose Concentration In Dialysate (mg/ml)
Glucose Control Refiner Siever Decanter
15 0.174 ± 0.012 (0.00) 0.168 ± 0.010 (3.10) 0.171 ± 0.012 (1.90) 0.155 ± 0.004 (10.79)
30 0.316 ± 0.008 (0.00) 0.296 ± 0.012 (6.51) 0.296 ± 0.019 (6.30) 0.294 ± 0.001 (6.80)
45 0.438 ± 0.060 (0.00) 0.399 ± 0.029 (8.51) 0.396 ± 0.007 (8.80) 0.392 ± 0.007 (9.50)
60 0.513 ± 0.007 (0.00) 0.478 ± 0.034 (6.75) 0.485 ± 0.006 (5.35) 0.472 ± 0.006 (7.87)
75 0.589 ± 0.010 (0.00) 0.553 ± 0.024 (6.17) 0.563 ± 0.010 (4.48) 0.535 ± 0.018 (9.20)
90 0.627 ± 0.012 (0.00) 0.606 ± 0.024 (3.28) 0.600 ± 0.019 (4.22) 0.592 ± 0.010 (5.55)
Values represent means ± SD (n=3).
Data in parentheses represent the glucose dialysis retardation indexes of various samples.
42
CHAPTER 5
DISCUSSION
5.1 Moisture Contents of Freeze-Dried Guava By-products
In order to achieve higher accuracy for sample analysis, moisture content of
sample has to be taken into account during the calculation of dry weight at the
beginning of the assays. Based on the results (Table 4.1), the moisture content
of freeze-dried guava by-products was in the order of: refiner (4.81%) > siever
(3.31%) > decanter (3.17%). Surface area plays an important role in affecting
the absorption of water molecules, as mentioned by Bridgeman et al. (2007).
Basically, sample with larger particle size possesses smaller surface area, and
thus the moisture content is lower. In this study, although the range of particle
size selected was the same (250 µm to 500 µm) for all samples, the size
distribution might not be uniform among the samples, thus resulting in slight
deviation for their moisture contents.
According to Delgado and Barbosa de Lima (2014), the drying process causes
the sample to shrink and change in size, due to the loss of water. The factors
causing variations among samples in terms of their moisture content include
different drying rate, density, size and shape, as well as physical properties
such as water holding capacity. However, more replicates should be done in
order to further confirm the effect of pre-analysis treatments (freeze-drying,
grinding and sieving) on samples. Also, in this study, since the moisture
contents of all samples were lower than 10%, they are suitable for long term
storage at room temperature. This is supported by Procházková and
43
Bezděčková (2008), whereby the beechnuts dried to a moisture content of 8 to
9% can be stored for three to four years without affecting their germination.
5.2 Ethanol Extraction of Guava By-products
For the respective yield of ethanolic extract and dry pellet (Figure 4.1), no
observable difference was found among different samples. Thus, the yield of
extraction was irrespective to the moisture content as well as particle size. This
is in agreement with Naidu et al. (2007), whereby no effect of particle size of
ground corn on the yield of thin stillage soluble solids could be observed.
Based on the results, the yield of ethanolic extract and dry pellet for all the
samples were in the range of 25% - 29% and 70% - 72% respectively.
In this study, 80% (v/v) ethanol was employed in the extraction of bioactive
compounds for the determination of their antioxidant as well as anti-amylase
activities. According to Anwar and Przybylski (2012), high amount of
flavonoids was extracted out using 80% ethanol. Also, in their study,
extraction using 80% ethanol gave rise to better antioxidant capacity for the
flaxseed sample, as compared to extraction using 80% methanol, 100%
methanol and 100% ethanol. Hence, 80% ethanol is the most effective solvent
which can be used to recover the antioxidant components from the samples.
Next, for the determination of hypoglycemic potential of guava by-products,
dry pellet from ethanol extraction was used instead of the ethanolic extract.
According to Farrant et al. (2003), the simple maceration method (as described
in Section 3.4.1) was employed for the extraction of soluble carbohydrates. In
44
other words, the leftovers from the ethanol extraction (dry pellet) will be
mainly comprised of insoluble carbohydrates including the insoluble fiber.
Hence, dry pellet was used so as to examine the effect of insoluble dietary fiber
on the hypoglycemic potential of guava by-products. Next, based on Table 4.2,
the intrinsic concentration of glucose (soluble carbohydrate) for decanter was
found to be higher in soxhlet residue form (0.014 mg/ml) than in dry pellet
form (0.009 mg/ml). Thus, simple maceration method was proven to be more
effective compared to the soxhlet extraction method in the ethanol extraction.
5.3 Health-Promoting Potentials of Guava By-products
5.3.1 Antioxidant Properties
The expression of EC50 can be defined as the effective concentration of sample
extract required to achieve 50% antioxidant effect. The lower the EC50 value,
the better the antioxidant potential of sample extract. In DPPH assay, the EC50
for siever (0.317 mg/ml) was significantly (p < 0.05) lower than decanter
(0.389 mg/ml) and refiner (0.394 mg/ml) while there was no significant
difference in terms of EC50 exhibited by decanter and refiner (Figure 4.3).
Generally, DPPH scavenging power increased with the concentration of the
sample extract (as shown in Figure 4.2). In the case of ascorbic acid (as
standard), maximum scavenging effect was achieved at low concentration
(96.19% at 0.2 mg/ml), due to its high antioxidant power. All samples showed
remarkable DPPH scavenging activity at 1.0 mg/ml (88.67% to 93.80%),
probably due to the contributions of their rich phenolics contents (Irshad et al.,
2012). Thus, all the guava by-products possess great health-promoting
45
potential in terms of their antioxidant properties, which are especially crucial in
the cancer prevention. Based on the results, it can be deduced that siever has
the strongest antioxidant power among the samples, due to the lowest EC50
value.
In reducing power assay, due to the reduction of Fe3+
into Fe2+
, the colour of
reaction mixture changes from yellow to green or blue-green, depending on the
reducing capability of the extract (Ferreira et al., 2007). Based on the results
(Figure 4.4), reducing power of ethanolic extracts decreased in the order: siever
(53.40%), decanter (45.50%), refiner (37.87%), at the concentration of 1.0
mg/ml respectively. These findings are comparable to the study done by
Marina and Noriham (2014) on the guava peel extract. According to the
authors, high phenolic content was found in guava peel and this may
contributes to the plant protection against UV radiation.
According to Shimada et al. (1992), the reducing potential of a compound is
highly associated with its hydrogen-donating ability. This was further
supported by Amarowicz et al. (2004), whereby a direct correlation was
observed among antioxidant activities and reducing power of plant extracts.
Hence, this could explain the consistency of data on the DPPH scavenging
assay and reducing power assay, whereby siever showed the highest activity in
both assay. The differences in antioxidative potential among the extracts might
be influenced by several reasons, such as structure and antioxidative
mechanisms of different phenolic compounds as well as the presence of
synergistic effects of different components in the extracts (Abdul Hamid et al.,
46
2002). Furthermore, Torres de Pinedo, Penalver and Morales (2007) stated that
the antioxidant strength is enhanced in the presence of primary alcohol and also
increase in number of phenolic hydroxyl groups.
Also, the results are in consistent with the findings from Purdue University
(n.d.), whereby the ascorbic acid of guava was found to be mainly distributed
in the peel (siever), followed by flesh (decanter) and trace amount in the central
pulp (refiner) of the fruit. Besides, Yahia (2011) also stated that higher amount
of ascorbic acid can be found in the guava peel compared to the flesh.
However, the results are slightly different from the study by Kong and Ismail
(2011), whereby the decanter were reported to exhibit the highest lycopene
content and lipophilic antioxidant capacity, followed by siever and refiner.
This indicates that the antioxidant activity of guava waste is not solely
contributed by lycopene. Instead, the presences of other phenolic compounds
have to be taken into account for the study on their antioxidant potential.
5.3.2 α-amylase Inhibition Activities
Gohil and Lele (2014) stated that the action of α-amylase is affected by the
presence of fibers. In other words, the increase in anti-amylase activity by
fibers will result in the reduction of glucose formation through starch
hydrolysis. Also, the phenolics present in the fruit parts may contain some
phytochemical constituents which contribute to their hypoglycemic activity
(Oboh et al., 2014). McCue and Shetty (2004) stated that phenolic compounds
have the potential to inhibit amylase action and thus contribute to the control of
Type 2 diabetes mellitus. Comparatively, according to Figure 4.5, decanter
47
showed a stronger inhibitory effect on α-amylase than siever and refiner.
Further study needs to be done in order to correlate the composition of fiber
and phenolic compounds in different guava by-products to their anti-amylase
activities.
In general, the α-amylase inhibition potentials of the extracts (18.62% to
26.25%, at 1.0 mg/ml) were comparable to that of Nisamalaki churna
(antidiabetic formulation in India), which showed about 45% inhibition at 50
µg/ml, as reported by Ashok Kumar et al., 2013. Thus, the guava by-products
serve as the potential sources for antidiabetic function. This is in accordance to
the findings by Krentz and Bailey (2005), whereby the mild inhibition of
pancreatic α-amylase can be one of the effective management for Type 2
diabetes mellitus. Based on the study of Afrisham et al. (2015), plants phenolic
content possesses therapeutic potential for the treatment of postprandial
hyperglycemia due to their inhibitory effect on α-amylase enzyme.
However, the detailed mechanisms of hypoglycemic activity by guava by-
products are yet to be determined. According to Algariri et al. (2013) and
Malviya, Jain and Malviya (2010), several mechanisms involved in the
functional restoration of pancreatic tissues: through increasing insulin output,
prohibiting the intestinal absorption of glucose or facilitating metabolites
which are involved in the insulin-dependent reactions. The variations in
inhibitory strength exhibited by different samples could be attributed to several
reasons, such as compositional difference of insoluble fiber, the presence of
fiber inhibitors, fiber capsulation of starch and α-amylase as well as direct
48
adsorption of α-amylase on fiber, which then lowering the enzyme accessibility
to starch (Bisoi et al., 2012; Chau, Chen and Lee, 2004). Also, the anti-
amylase potential relies on the concentration, the number and position of the
hydroxyl groups of the phenolic compounds (Rohn, Rawel and Kroll, 2002).
5.3.3 Hypoglycemic Potentials: Glucose Diffusion
In this study, effect of guava by-products on glucose diffusion was investigated
in comparison with that of control from 15 minutes to 90 minutes, before the
system attained equilibrium. The dialysis assay simulates the events happening
along the gastrointestinal tract, specifically the jejunum (Bisoi et al., 2012;
Daou and Zhang, 2012). In Figure 4.7, it can be clearly observed that all the
samples showed elevated glucose concentration in dialysate from 0.155 – 0.171
mg/ml (at 15 minutes) to 0.592 – 0.606 mg/ml (at 90 minutes), but with lower
amount compared to control at each time interval. This indicates a positive
result, whereby the samples are capable to retard movement of glucose into
external solution across the dialysis tubes (Mary and Gayathri, 2015).
Glucose diffusion was the lowest in decanter compared to control and other
samples at corresponding time intervals. According to Chau, Chen and Lin
(2004), the delay of glucose diffusion across the membrane could be due to the
glucose adsorption abilities and complex meshwork of fibers present in the
samples, which bind to the glucose and thus reduce its availability for diffusion.
In addition, Ahmed, Sairam and Urooj (2011) further correlated the glucose
diffusion to α-amylase inhibition, by suggesting that the inhibitors of α-
amylase could have potential hypoglycemic effect through prolonging the
49
glucose release from starch. Thus, the consistency of findings for the anti-
amylase assay and glucose diffusion assay could be explained, since decanter
showed the highest activity in both assays.
5.3.4 Glucose Dialysis Retardation Index (GDRI)
Glucose Dialysis Retardation Index (GDRI) can be defined as the in vitro index
which is employed in evaluating the effect of fiber on the delay in absorption
of glucose in the gastrointestinal tract (López et al., 1996). Based on the
results as shown in Table 4.4, decanter had the highest GDRI value at every
time interval among the samples, with the maximum value of 10.79% (at 15
minutes). While the maximum GDRI value occurred at 45 minutes for both
refiner and siever, which was 8.51% and 8.80% respectively. After 45 minutes,
both refiner and siever showed considerable decrease in GDRI values. This
phenomenon could be explained by Gupta and Premavalli (2011), whereby
complete inhibitions and saturation had been achieved by samples and so
further glucose retention did not happen, as the duration increased.
Based on the study regarding the effect of crystalline cellulose on plasma
glucose concentration in rats done by Takahashi et al. (2005), the ingestion of
cellulose may delay glucose diffusion and retard glucose absorption in the
lumen, through inducing the increase in digesta viscosity. Also, cellulose
could control the postprandial plasma glucose concentration and thus reducing
the risk of getting diarrhoea associated with enteral nutrition. When comparing
the GDRI values of various guava by-products to the findings from Gohil and
Lele (2014), decanter (7.87%) and refiner (6.75%) showed higher glucose
50
retardation potential than cellulose (5.81%), at 60 minutes interval. On the
other hand, siever (5.35%) showed a slightly lower GDRI value than cellulose
at that time. Thus, the insoluble fiber from decanter and refiner serve to
possess higher hypoglycemic potential than that of siever and cellulose.
According to Guillon et al. (1998), physicochemical properties of fiber might
be influenced by porosity, available surface as well as the regiochemistry of the
surface layer. Also, decanter fiber particles might be smaller than refiner and
siever, and thus the resulting larger surface area facilitate glucose entrapment
within the fiber meshwork. This causes slower diffusion rate, thus higher
GDRI value (Peerajit, Chiewchan and Devahastin, 2012). Furthermore, the
variations among samples in terms of their GDRI values could be attributed to
their differences in fibers viscosity (Adiotomre et al., 1990). In this case,
decanter might have higher viscosity of fibers which contributed to the delay in
glucose diffusion across dialysis tubes. Therefore decanter probably could aid
in the control of postprandial blood glucose level due to its fiber enrichment
and hypoglycemic properties.
51
5.4 Future Study
This study can be further extended to:
1. Quantification of ascorbic acids and phenolics compounds in the guava by-
products using reversed-phase HPLC.
2. Compositional study on the types of fiber in guava by-products.
3. Study on the mode of α-amylase inhibition by guava by-products.
4. Comparative study using different solvent systems for the extraction of
bioactive compounds in guava by-products.
52
CHAPTER 6
CONCLUSION
From the results, it can be concluded that the peel (siever), flesh (decanter) and
seed (refiner) of pink guava have crucial health-related functional properties.
Their antioxidant potentials were evaluated in terms of DPPH free radical
scavenging assay as well as reducing power assay. Both of these assays
showed consistent results whereby siever demonstrated the highest antioxidant
activity, followed by decanter and refiner. In DPPH assay, the EC50 for siever
(0.317 mg/ml) was significantly (p < 0.05) lower than decanter (0.389 mg/ml)
and refiner (0.394 mg/ml), indicating that lesser amount of siever is needed to
achieve 50% antioxidant effect, and hence siever could serve as the natural
antioxidant source, to lower down the risk of getting cancer, atherosclerosis,
diabetes and so on. The ascorbic acid and phenolic contents were believed to
be the major components causing the variation of antioxidant strength among
different samples.
Also, the results revealed that the pink guava by-products (especially decanter,
with GDRI of 10.79% at 15 minutes) could effectively hinder the α-amylase
activity and retard glucose diffusion. The presence of dietary fiber could
contribute to the anti-hyperglycemic effect. Thus, decanter can be included in
the diet for its promising hypoglycemic potential. This aids in the prevention
of chronic diseases such as Type 2 diabetes mellitus, cardiovascular diseases,
hypertension and other gastrointestinal diseases. However, the findings should
be further confirmed by in vivo animal studies, in order to establish the
53
possibility of the health-promoting applications of the guava by-products for
their incorporation into dietary and pharmaceutical products. Also, further
structural elucidation and functional group characterization should be done for
the identification of the bioactive compounds present in the guava by-products.
54
REFERENCES
Abdul Hamid, A., Shah, Z., Muse, R. and Mohamed, S., 2002. Characterization
of antioxidative activities of various extracts of Centella asiatica (L) Urban.
Food Chemistry, 77(4), pp. 465-469.
Adiotomre, J., Eastwood, M., Edwards, C. A. and Brydon, W., 1990. Dietary
fiber: in vitro methods that anticipate nutrition and metabolic activity in
humans. American Journal of Clinical Nutrition, 52(1), pp. 128-134.
Afrisham, R., Aberomand, M., Ghaffari, M. A., Siahpoosh, A. and Jamalan, M.,
2015. Inhibitory effect of Heracleum persicum and Ziziphus jujube on activity
of alpha-amylase. Journal of Botany, 2015, pp. 1-8.
Ahmed, F., Sairam, S. and Urooj, A., 2011. In vitro hypoglycemic effects of
selected dietary fiber sources. Journal of Food Science and Technology, 48(3),
pp. 285-289.
Algariri, K., Meng, K. Y., Atangwho, I. J., Asmawi, M. Z., Sadikun, A.,
Murugaiyah, V. and Ismail, N., 2013. Hypoglycemic and anti-hyperglycemic
study of Gynura procumbens leaf extracts. Asian Pacific Journal of Tropical
Biomedicine, 3(5), pp. 358-366.
Anderson, J. W., Baird, P., Davis, R. H., Ferreri, S., Knudtson, M., Koraym, A.,
Waters, V. and Williams, C. L., 2009. Health benefits of dietary fiber.
Nutrition Reviews, 67(4), pp. 188-205.
Anwar, F. and Przybylski, R., 2012. Effect of solvents extraction on total
phenolics and antioxidant activity of extracts from flaxseed (Linum
usitatissimum L.). Acta Scientiarum Polonorum, 11(3), pp. 293-301.
Ashok Kumar, B. S., Khan, S., Saran, G. S., Nandeesh, R. and Manjunath, N.
K., 2013. In vitro antidiabetic activity of Nisamalaki churna. Sains Malaysiana,
42(5), pp. 625-628.
Ashok Kumar, B. S., Lakshman, K., Jayaveera, K. N., Sheshadri Shekar, D.,
Narayan Swamy, V. B., Khan, S. and Velumurga, C., 2011. In vitro α-amylase
inhibition and antioxidant activities of methanolic extract of Amaranthus
caudatus Linn. Omam Medical Journal, 26(3), pp. 166-170.
55
Bartelings, H. and Sterner, T., 1999. Household waste management in a
swedish municipality: determinants of waste disposal, recycling and
composting. Environmental and Resource Economics, 13(4), pp. 473-491.
Bisoi, P. C., Sahoo, G., Mishra, S. K., Das, C. and Das, K. L., 2012.
Hypoglycemic effects of insoluble fiber rich fraction of different cereals and
millets. Journal of Food Processing and Technology, 3(7), pp. 1-11.
Block, W., 2010. Break the bonds of dementia. [online] Available at:
<http://www.life-enhancement.com/magazine/article/2274-break-the-bonds-of-
dementia> [Accessed 16 August 2016].
Boual, Z., Kemassi, A., Ould El Hadj Khelil, A., Michaud, P. and DidiOuld El
Hadj, M., 2012. Partial characterization and hydrolysis procedure of water
soluble polysaccharides extracted from onesaharian medicinal plant:
Malvaaegyptiaca L.. International Journal of Bioscience, Biochemistry and
Bioinformatics, 2(2), pp. 100-103.
Bridgeman, T. G., Darvell, L. I., Jones, J. M., Williams, P. T., Fahmi, R.,
Bridgwater, A. V., Barraclough, T., Shield, I., Yates, N., Thain, S. C. and
Donnison, I. S., 2007. Influence of particle size on the analytical and chemical
properties of two energy crops. Fuel, 86(1), pp. 60-72.
Chau, C., Chen, C. and Lin, C., 2004. Insoluble fiber-rich fractions derived
from Averrhoa carambola: hypoglycemic effects determined by in vitro
methods. LWT-Food Science and Technology, 37, pp. 331-335.
Chau, C. F., Huang, Y. L. and Lee, M. H., 2003. In vitro hypoglycemic effects
of different insoluble fiber-rich fractions prepared from the peel of Citrus
sinensis L. cv. Liucheng. Journal of Agricultural and Food Chemistry, 51(22),
pp. 6623-6626.
Choudhary, S., Sharma, M., Tripathi, J. and Mishra, P., 2013.
Antihyperglycemic activity of Vernonia cinera L. on alloxan-induced diabetic
mice. International Journal of Advanced Research, 1(2), pp. 35-42.
Christie, W. W., 2015. Isoprenoids: 1. tocopherols and tocotrienols. [online]
Available at: <http://www.lipidhome.co.uk/lipids/simple/tocol/index.htm>
[Accessed 16 August 2016].
56
Daou, C. and Zhang, H., 2012. Study on functional properties of physically
modified dietary fibres derived from defatted rice bran. Journal of Agricultural
Science, 4(9), pp. 85-97.
Delgado, J. M. P. Q. and Barbosa de Lima, A. G. eds., 2014. Transport
phenomena and drying of solids and particulate materials. [e-book] Springer
International Publishing Switzerland. Available at: Google Books
<books.google.com> [Accessed 6 August 2016].
FAO, 2011. Food loss and food waste. [online] Available at:
<http://www.fao.org/food-loss-and-food-waste/en/> [Accessed 23 August
2016].
Farrant, JM., Bailly, C., Leymarie, J., Hamman, B., Côme, D. and Corbineau,
F., 2003. Wheat seedlings as a model to understand desiccation tolerance and
sensitivity. Physiologia Plantarium, 120, pp. 563-574.
Ferrali, M., Signorini, C., Caciotti, B., Sugherini, L., Ciccoli, L., Giachetti, D.
and Comporti, M., 1997. Protection against oxidative damage of erythrocyte
membranes by the flavonoid quercetin and its relation to iron chelating activity.
FEBS Letters, 416, pp. 123-129.
Ferreira, I. C. F. R., Baptista, P., Vilas-Boas, M. and Barros, L., 2007. Free-
radical scavenging capacity and reducing power of wild edible mushrooms
from northeast Portugal: Individual cap and stipe activity. Food Chemistry, 100,
pp. 1511-1516.
Fiedor, J. and Burda, K., 2014. Potential role of carotenoids as antioxidants in
human health and disease. Nutrients, 6, pp. 466-488.
Fuentes-Alventosa, J. M., Rodríguez-Gutiérrez, G., Jaramillo-Carmona, S.,
Espejo-Calvo, J. A., Rodríguez-Arcos, R., Fernández-Bolańos, J., Guillén-
Bejarano, R. and Jiménez-Araujo, A., 2009. Effect of extraction method on
chemical composition and functional characteristics of high dietary fibre
powders obtained from asparagus by-products. Food Chemistry, 113, pp. 665-
671.
Ginting, M., 2014. 10 benefits of red guava for health. [photograph] Available
at: <http://www.medicineofherbs.com/2015/12/10-benefits-of-red-guava-for-
health.html> [Accessed 15 August 2016].
57
Gohil, D. D. and Lele, S. S., 2014. Insoluble vegetable fiber as a potential
functional ingredient: In vitro studies on hypoglycemic and
hypocholesterolemic effect. American Journal of Food Science and
Technology, 2(2), pp. 48-52.
Guillon, F., Auffret, A., Robertson, J. A. and Barry, J. L., 1998. Relationship
between physical characteristics of sugar beet fibre and its fermentability by
human faecal flora. Carbohydrate Polymers, 37(2), pp. 185-197.
Gupta, P. and Premavalli, K. S., 2011. In-vitro studies on functional properties
of selected natural dietary fibers. International Journal of Food Properties,
14(2), pp. 397-410.
Gupta, V. K. and Sharma, S. K., 2006. Plants as natural antioxidants. Natural
Product Radiance, 5(4), pp. 326-334.
Haliwell, B., 1996. Antioxidants in human and disease. Annual Review of
Nutrition, 16, pp. 33-50.
Harold, E. S., Darrell, E. A., Evan, I. F. and John, A. M., 2007. A review of the
interaction among dietary antioxidants and reactive oxygen species. The
Journal of Nutritional Biochemistry, 18, pp. 567-579.
Hofstrand, D., 2012. More on feeding nine billion people by 2050. [online]
Available at: <http://www.agmrc.org/renewable-energy/renewable-
energy/more-on-feeding-nine-billion-people-by-2050/> [Accessed 22 August
2016].
Hui, Y. H., ed., 2006. Handbook of fruits and fruit processing. Iowa, USA:
Blackwell publishing.
Irshad, M., Zafaryab, M., Singh, M. and Rizvi, M. M. A., 2012. Comparative
analysis of the antioxidant activity of Cassia fistula extracts. International
Journal of Medicinal Chemistry, 2012, pp. 1-6.
Jayanthi, P. and Lalitha, P., 2011. Reducing power of the solvent extracts of
Eichhornia crassipes (Mart.) Solms. International Journal of Pharmacy and
Pharmaceutical Sciences, 3(3), pp. 126-128.
58
Kaplan, N. M., 1989. The deadly quartet. upper-body obesity, glucose
intolerance, hypertriglyceridemia, and hypertension. Archives of Internal
Medicine, 149(7), pp. 1514-1520.
Kim, H., Moon, J. Y., Kim, H., Lee, D., Cho, M., Choi, H., Kim, Y. S.,
Mosaddik, A. and Cho, S. K., 2010. Antioxidant and antiproliferative activities
of mango (Mangifera indica L.) flesh and peel. Food Chemistry, 121, pp. 429-
436.
Kong, K. W. and Ismail, A., 2011. Lycopene content and lipophilic antioxidant
capacity of by-products from Psidium guajava fruits produced during puree
production industry. Food and Bioproducts Processing, 89, pp. 53-61.
Larrauri, J. A., 1999. New approaches in the preparation of high dietary fibre
powders from fruit by-products. Trends in Food Science and Technology, 10(1),
pp. 3-8.
Lefebvre, P. J. and Scheen, A. J., 1994. The use of acarbose in the prevention
and treatment of hypoglycaemia. European Journal of Clinical Investigation,
24(3), pp. 40-44.
Leontowicz, M., Gorinstein, S., Leontowicz, H., Krzeminski, R., Lojek, A.,
Katrich, E., Cíž, M., Martin-Belloso, O., Soliva-Fortuny, R., Haruenkit, R. and
Trakhtenberg, S., 2003. Apple and pear peel and pulp and their influence on
plasma lipids and antioxidant potentials in rats fed cholesterol-containing diets.
Journal of Agricultural and Food Chemistry, 51(19), pp. 5780-5785.
Liu, R. H., 2004. Potential synergy of phytochemicals in cancer prevention:
mechanism of action. The American Society for Nutritional Sciences, 134, pp.
3479S-3485S.
Liu, R. H., 2013. Health-promoting components of fruits and vegetables in the
diet. Advances in Nutrition, 4, pp. 384S-392S.
López, G., Ros, G., Rincón, F., Periago, M. J., Martínez, M. C., and Ortuño, J.,
1996. Relationship between physical and hydration properties of soluble and
insoluble fiber of artichoke. Journal of Agricultural and Food Chemistry, 44,
pp. 2773–2778.
59
Malviya, N., Jain, S. and Malviya, S., 2010. Antidiabetic potential of medicinal
plants. Acta Poloniae Pharmaceutica, 67(2), pp. 113-118.
Maniyan, A., John, R. and Mathew, A., 2015. Evaluation of fruit peels for
some selected nutritional and anti-nutritional factors. Emer Life Sci Res, 1(2),
pp. 13-19.
Marina, Z. and Noriham, A., 2014. Quantification of total phenolic compound
and in vitro antioxidant of fruit peel extracts. International Food Research
Journal, 21(5), pp. 1925-1929.
Mary, S. D. C. and Gayathri, D. S., 2015. In vitro glucose binding activity of
Terminalia bellirica. Asian Journal of Pharmaceutical and Clinical Research,
8(2), pp. 320-323.
McCue, P. P. and Shetty, K., 2004. Inhibitory effects of rosmarinic acid
extracts on porcine pancreatic amylase in vitro. Asia Pacific Journal Clinical
Nutrition, 13(1), pp. 101-106.
Megazyme, 2015. D-glucose assay procedure (GOPOD-FORMAT). [online]
Available at: <https://secure.megazyme.com/files/Booklet/K-
GLUC_DATA.pdf> [Accessed 30 July 2016].
Mehta, R., 2005. Dietary fiber benefits. Cereal Foods World, 50(2), pp. 66-71.
Mercadante, A. Z., Steck, A. and Pfander, H., 1999. Carotenoids from guava
(Psidium guajava L.): isolation and structure elucidation. Journal of
Agricultural and Food Chemistry, 47(1), pp. 145-151.
Miean K. H. and Mohamed, S., 2001. Flavonoid (myricetin, quercetin,
kaempferol, luteolin, and apigenin) content of edible tropical plants. Journal of
Agricultural and Food Chemistry, 49(6), pp. 3106-3112.
Misra, K. and Seshadri, T. R., 1968. Chemical components of the fruits of
Psidium guava. Phytochemistry, 7(4), pp. 641-645.
Musa, K. H., Abdullah, A. and Subramaniam, V., 2015. Flavonoid profile and
antioxidant activity of pink guava. ScienceAsia, 41, pp. 149-154.
60
Musa, K. H., Abdullah, A., Jusoh, K. and Subramaniam, V., 2011. Antioxidant
activity of pink-flesh guava (Psidium guajava L.): effect of extraction
techniques and solvents. Food Analytical Methods, 4(1), pp. 100-107.
Naidu, K., Singh, V., Johnston, D. B., Rausch, K. D. and Tumbleson, M. E.,
2007. Effects of ground corn particle size on ethanol yield and thin stillage
soluble solids. Cereal Chemistry, 84(1), pp. 6-9.
Nijveldt, R. J., Van Nood, E., Van Hoorn, D. E., Boelens, P. G., Van Norren, K.
and Van Leeuwen, P. A., 2001. Flavonoids: a review of probable mechanisms
of action and potential applications. The American Journal of Clinical
Nutrition, 74(4), pp. 418-425.
Nimse, S. B. and Pal, D., 2015. Free radicals, natural antioxidants, and their
reaction mechanisms. RSC Advances, 5, pp. 27986-28006.
Oboh, G., Isaac, A. T., Akinyemi, A. J. and Ajani, R. A., 2014. Inhibition of
key enzymes linked to type 2 diabetes and sodium nitroprusside induced lipid
peroxidation in rats’ pancreas by phenolic extracts of avocado pear leaves and
fruit. International Journal of Biomedical Science, 10(3), pp. 208-216.
Ou, S., Kwok, K., Li, Y. and Fu, L., 2001. In vitro study of possible role of
dietary fiber in lowering postprandial serum glucose. Journal of Agricultural
and Food Chemistry, 49(2), pp. 1026-1029.
Pandey, S., Dr. Pandey, R. and Singh, R., 2014. Phytochemical screening of
selected medicinal plant Cinnamon zeylanicum bark extract, area of research;
Uttarakhand, India. International Journal of Scientific and Research
Publications, 4(6), pp. 1-6.
Peerajit, P., Chiewchan, N. and Devahastin, S., 2012. Effect of pretreatment
methods on health-related functional properties of high dietary fiber powder
from lime residues. Food Chemistry, 132, pp. 1891-1898.
Procházková, D., Boušová, I. and Wilhelmová, N., 2011. Antioxidant and
prooxidant properties of flavonoids. Fitoterapia, 82(4), pp. 513-523.
Procházková, Z. and Bezděčková, L., 2008. Effects of moisture content,
storage temperature and type of storage bag on the germination and viability of
stored European beech (Fagus sylvatica L.) seeds. Journal of Forest Science,
54(7), pp. 287-293.
61
Purdue University, n.d. Guava. [online] Available at: <
https://www.hort.purdue.edu/newcrop/morton/guava.html> [Accessed 6
August 2016].
Rohn, S., Rawel, M. and Kroll, J., 2002. Inhibitory effects of plant phenols on
the activity of selected enzymes. Journal Agricultural Food Chemistry, 50(12),
pp. 3566-3571.
Rudrappa, U., n.d. Guava nutrition facts. [online] Available at:
http://www.nutrition-and-you.com/guava.html [Accessed 6 August 2016].
Shimada, K., Fujikawa, K., Yahara, K. and Nakamura, T., 1992. Antioxidative
properties of xanthan on the autoxidation of soybean oil in cyclodextrin
emulsion. Journal of Agricultural and Food Chemistry, 40(6), pp. 945-948.
Siddiq, M., ed., 2012. Tropical and subtropical fruits: postharvest physiology,
processing and packaging. John Wiley & Sons.
Siow, L. F. and Hui, Y. W., 2013. Comparison on the antioxidant properties of
fresh and convection oven-dried guava (Psidium guajava L.). International
Food Research Journal, 20(2), pp. 639-644.
Smirnoff, N., 2000. Ascorbic acid: metabolism and functions of a multi-
facetted molecule. Current Opinion in Plant Biology, 3, pp. 229-235.
Sousa, B. A. and Correia, R. T. P., 2012. Phenolic content, antioxidant activity
and antiamylolytic activity of extracts obtained from bioprocessed pineapple
and guava wastes. Brazilian Journal of Chemical Engineering, 29(01), pp. 25-
30.
Srichamroen, A. and Chavasit, V., 2011. In vitro retardation of glucose
diffusion with gum extracted from malva nut seeds produced in Thailand. Food
Chemistry, 127, pp. 455-460.
Stahl, W. and Sies, H., 2003. Antioxidant activity of carotenoids. Molecular
Aspects of Medicine, 24, pp. 345-351.
Sudha, P., Zinjarde, S. S., Bhargava, S. Y. and Kumar, A. R., 2011. Potent α-
amylase inhibitory activity of Indian Ayurvedic medicinal plants. BMC
Complementary and Alternative Medicine, 11(5), pp. 1-10.
62
Sukeksi, L. and Sarah, M., 2016. Characterizations and extraction of
polyphenols from residual pulp of pink guava as source of antioxidants. Asian
Research Publishing Network (ARPN), 11(8), pp. 5209-5216.
Takahashi, T., Karita, S., Ogawa, N. and Goto, M., 2005. Crystalline cellulose
reduces plasma glucose concentrations and stimulates water absorption by
increasing the digesta viscosity in rats. The Journal of Nutrition, 135, pp. 2405-
2410.
Taylor, L. and County, M., 2012. Tropical plant database. [online] Available
at: <http://www.rain-tree.com/guava.htm#.V7EqLfnnako> [Accessed 15
August 2016].
Teixeira, J., Gaspar, A., Garrido, M. E., Garrido, J. and Borges, F., 2013.
Hydroxycinnamic acid antioxidants: an electrochemical overview. BioMed
Research International, 2013, pp. 1-11.
Temple, N. J., 2000. Antioxidants and disease: more questions than answers.
Nutrition Research, 20(3), pp. 449-459.
Thaipong, K., Boonprakob, U., Crosby, K., Cisneros-Zevallos, L. and Byrne, D.
H., 2006. Comparison of ABTS, DPPH, FRAP, and ORAC assays for
estimating antioxidant activity from guava fruit extracts. Journal of Food
Composition and Analysis, 19, pp. 669-675.
Torres de Pinedo, A., Penalver, P. and Morales, J. C., 2007. Synthesis and
evaluation of new phenolic-based antioxidants: structure-activity relationship.
Food Chemistry, 103(1), pp. 55-61.
Torsdottir, I., Alpsten, M., Andersson, H. and Einarsson, S., 1989. Dietary guar
gum effects on postprandial blood glucose, insulin and hydroxyproline in
humans. Journal of Nutrition, 119(12), pp. 1925-1931.
Uchôa-thomaz, A. M. A., Sousa, E. C., Carioca, J. O. B., De Morais, S. M., De
Lima, A.., Martins, C. G., Alexandrino, C. D., Ferreira, P. A. T., Rodrigues, A.
L. M., Rodrigues, S. P., De Albuquerque Thomaz, J. C., Silva, J. D. N. and
Rodrigues, L. L., 2014. Chemical composition, fatty acid profile and bioactive
compounds of guava seeds (Psidium guajava L.). Food Science and
Technology, 34(3), pp. 485-492.
63
Verma, A. K., Rajkumar, V., Banerjee, R., Biswas, S. and Das, A. K., 2013.
Guava (Psidium guajava L.) powder as an antioxidant dietary fibre in sheep
meat nuggets. Asian-Australasian Journal of Animal Sciences, 26(6), pp. 886-
895.
Wikipedia, 2016. Green apple guava. [photograph] Available at: <
https://en.wikipedia.org/wiki/Guava> [Accessed 15 August 2016].
Wild, S., Roglic, G., Green, A., Sicree, R. and King, H., 2004. Global
prevalence of diabetes: estimates for the year 2000 and projections for 2030.
Diabetes Care, 27(5), pp. 1047-1053.
Winkel-Shirley, B., 2001. Flavonoid biosynthesis. a colorful model for genetics,
biochemistry, cell biology, and biotechnology. American Society of Plant
Physiologists, 126(2), pp. 485-493.
Worthington, n.d. Amylase, alpha. [image] Available at: <
http://www.worthington-biochem.com/AA/default.html > [Accessed 11 August
2016].
Yahia, E.M., ed., 2011. Postharvest biology and technology of tropical and
subtropical fruits volume 3: cocona to mango. Philadelphia: Woodhead
Publishing Limited.
Zhao, M., Yang, B., Wang, J., Liu, Y., Yu, L. and Jiang, Y., 2007.
Immunomodulatory and anticancer activities of flavonoids extracted from litchi
(Litchi chinensis Sonn.) pericarp. International Immunopharmacology, 7, pp.
162-166.
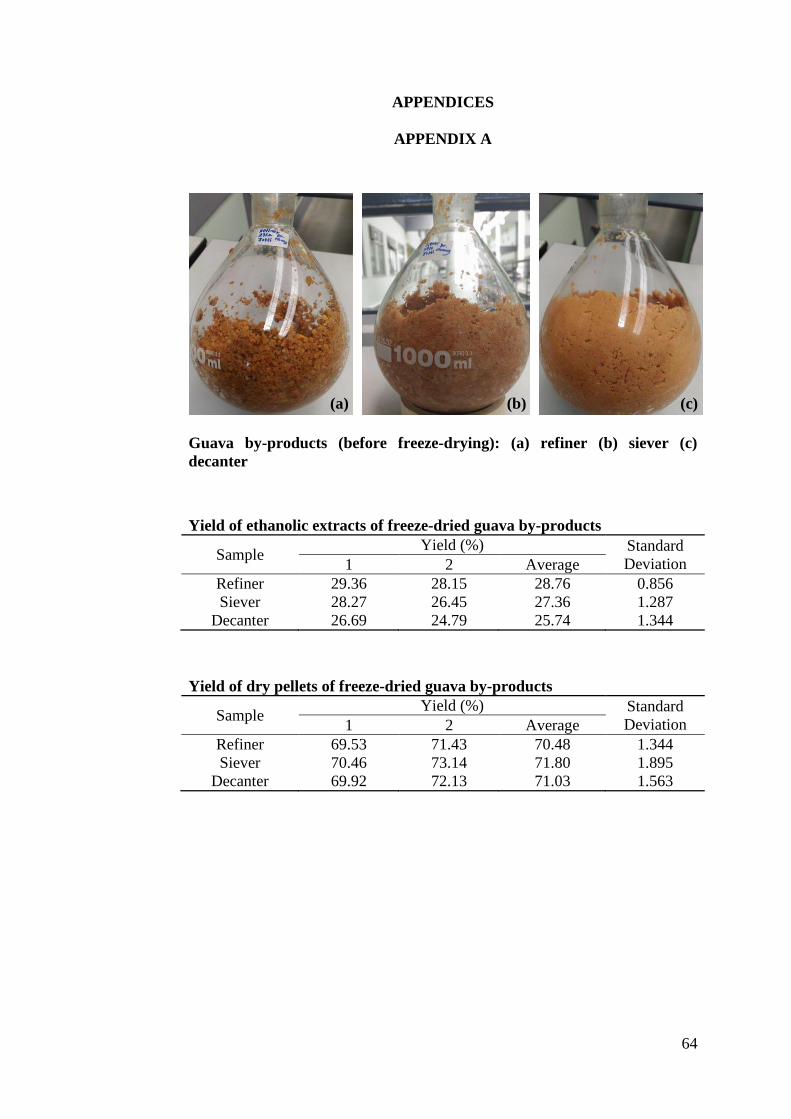
64
APPENDICES
APPENDIX A
Guava by-products (before freeze-drying): (a) refiner (b) siever (c)
decanter
Yield of ethanolic extracts of freeze-dried guava by-products
Sample Yield (%) Standard
Deviation 1 2 Average
Refiner 29.36 28.15 28.76 0.856
Siever 28.27 26.45 27.36 1.287
Decanter 26.69 24.79 25.74 1.344
Yield of dry pellets of freeze-dried guava by-products
Sample Yield (%) Standard
Deviation 1 2 Average
Refiner 69.53 71.43 70.48 1.344
Siever 70.46 73.14 71.80 1.895
Decanter 69.92 72.13 71.03 1.563
(a) (b) (c)

65
APPENDIX B
Absorbance at 517 nm for ethanolic extracts of freeze-dried guava by-
products in DPPH assay
Standard/Sample
Absorbance at 517 nm
Concentration (mg/ml)
0.00 0.20 0.40 0.60 0.80 1.00
Ascorbic acid
1
2
3
1.110
1.086
0.990
0.037
0.044
0.040
0.034
0.043
0.038
0.029
0.040
0.035
0.032
0.042
0.039
0.029
0.043
0.043
Refiner
1
2
3
1.092
1.087
0.960
0.791
0.771
0.655
0.511
0.517
0.413
0.305
0.323
0.238
0.133
0.169
0.117
0.084
0.093
0.074
Siever
1
2
3
1.081
1.090
0.975
0.636
0.648
0.584
0.333
0.331
0.267
0.149
0.155
0.116
0.072
0.096
0.070
0.061
0.072
0.062
Decanter
1
2
3
1.089
1.094
0.927
0.737
0.729
0.653
0.468
0.474
0.385
0.300
0.311
0.284
0.182
0.191
0.136
0.119
0.139
0.096
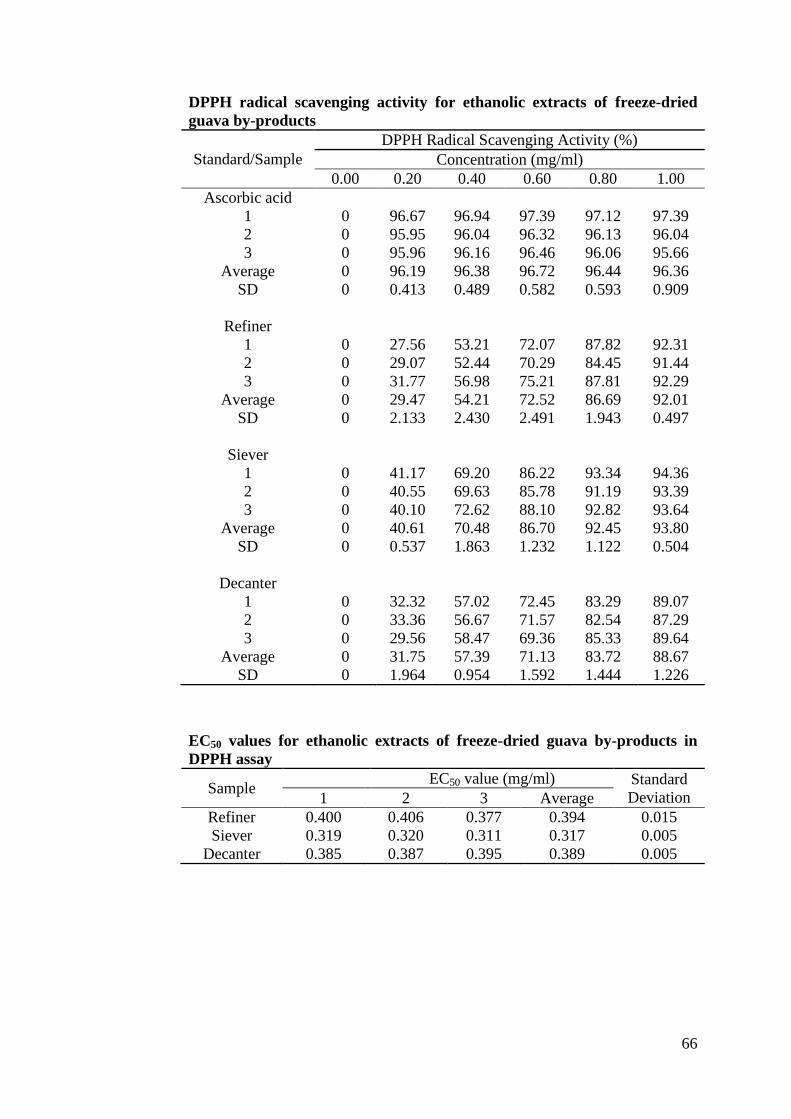
66
DPPH radical scavenging activity for ethanolic extracts of freeze-dried
guava by-products
Standard/Sample
DPPH Radical Scavenging Activity (%)
Concentration (mg/ml)
0.00 0.20 0.40 0.60 0.80 1.00
Ascorbic acid
1
2
3
Average
SD
0
0
0
0
0
96.67
95.95
95.96
96.19
0.413
96.94
96.04
96.16
96.38
0.489
97.39
96.32
96.46
96.72
0.582
97.12
96.13
96.06
96.44
0.593
97.39
96.04
95.66
96.36
0.909
Refiner
1
2
3
Average
SD
0
0
0
0
0
27.56
29.07
31.77
29.47
2.133
53.21
52.44
56.98
54.21
2.430
72.07
70.29
75.21
72.52
2.491
87.82
84.45
87.81
86.69
1.943
92.31
91.44
92.29
92.01
0.497
Siever
1
2
3
Average
SD
0
0
0
0
0
41.17
40.55
40.10
40.61
0.537
69.20
69.63
72.62
70.48
1.863
86.22
85.78
88.10
86.70
1.232
93.34
91.19
92.82
92.45
1.122
94.36
93.39
93.64
93.80
0.504
Decanter
1
2
3
Average
SD
0
0
0
0
0
32.32
33.36
29.56
31.75
1.964
57.02
56.67
58.47
57.39
0.954
72.45
71.57
69.36
71.13
1.592
83.29
82.54
85.33
83.72
1.444
89.07
87.29
89.64
88.67
1.226
EC50 values for ethanolic extracts of freeze-dried guava by-products in
DPPH assay
Sample EC50 value (mg/ml) Standard
Deviation 1 2 3 Average
Refiner 0.400 0.406 0.377 0.394 0.015
Siever 0.319 0.320 0.311 0.317 0.005
Decanter 0.385 0.387 0.395 0.389 0.005
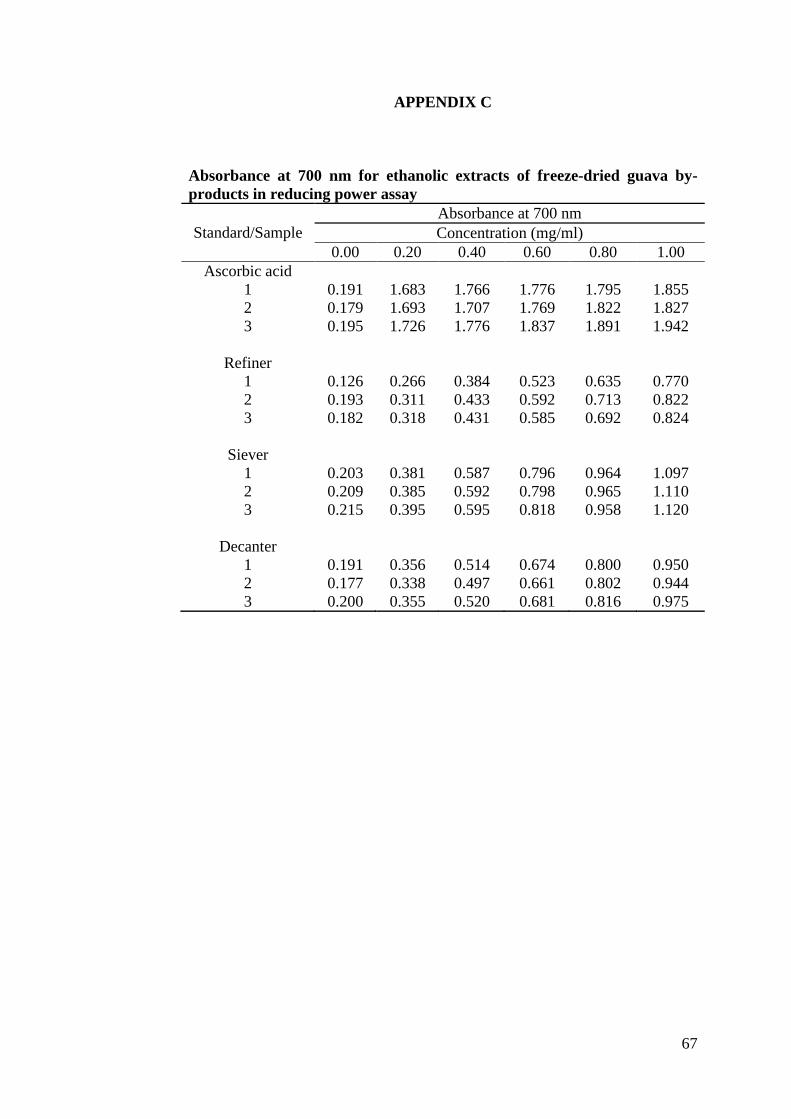
67
APPENDIX C
Absorbance at 700 nm for ethanolic extracts of freeze-dried guava by-
products in reducing power assay
Standard/Sample
Absorbance at 700 nm
Concentration (mg/ml)
0.00 0.20 0.40 0.60 0.80 1.00
Ascorbic acid
1
2
3
0.191
0.179
0.195
1.683
1.693
1.726
1.766
1.707
1.776
1.776
1.769
1.837
1.795
1.822
1.891
1.855
1.827
1.942
Refiner
1
2
3
0.126
0.193
0.182
0.266
0.311
0.318
0.384
0.433
0.431
0.523
0.592
0.585
0.635
0.713
0.692
0.770
0.822
0.824
Siever
1
2
3
0.203
0.209
0.215
0.381
0.385
0.395
0.587
0.592
0.595
0.796
0.798
0.818
0.964
0.965
0.958
1.097
1.110
1.120
Decanter
1
2
3
0.191
0.177
0.200
0.356
0.338
0.355
0.514
0.497
0.520
0.674
0.661
0.681
0.800
0.802
0.816
0.950
0.944
0.975
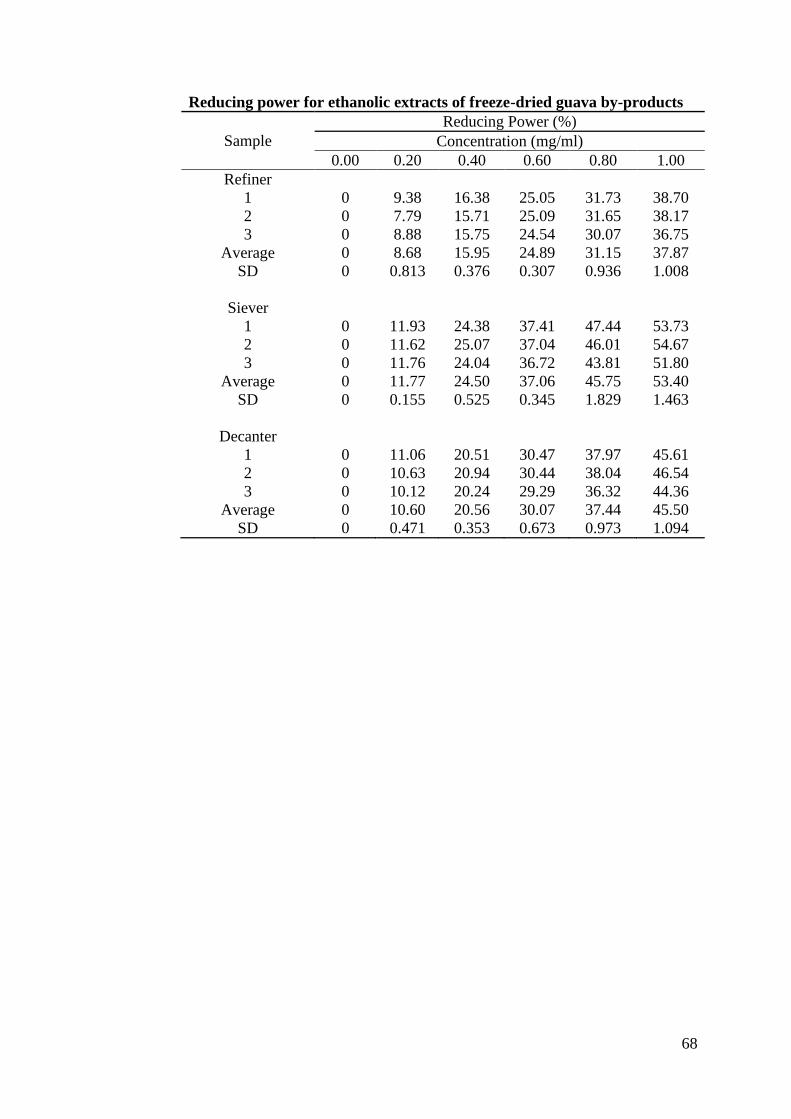
68
Reducing power for ethanolic extracts of freeze-dried guava by-products
Sample
Reducing Power (%)
Concentration (mg/ml)
0.00 0.20 0.40 0.60 0.80 1.00
Refiner
1
2
3
Average
SD
0
0
0
0
0
9.38
7.79
8.88
8.68
0.813
16.38
15.71
15.75
15.95
0.376
25.05
25.09
24.54
24.89
0.307
31.73
31.65
30.07
31.15
0.936
38.70
38.17
36.75
37.87
1.008
Siever
1
2
3
Average
SD
0
0
0
0
0
11.93
11.62
11.76
11.77
0.155
24.38
25.07
24.04
24.50
0.525
37.41
37.04
36.72
37.06
0.345
47.44
46.01
43.81
45.75
1.829
53.73
54.67
51.80
53.40
1.463
Decanter
1
2
3
Average
SD
0
0
0
0
0
11.06
10.63
10.12
10.60
0.471
20.51
20.94
20.24
20.56
0.353
30.47
30.44
29.29
30.07
0.673
37.97
38.04
36.32
37.44
0.973
45.61
46.54
44.36
45.50
1.094
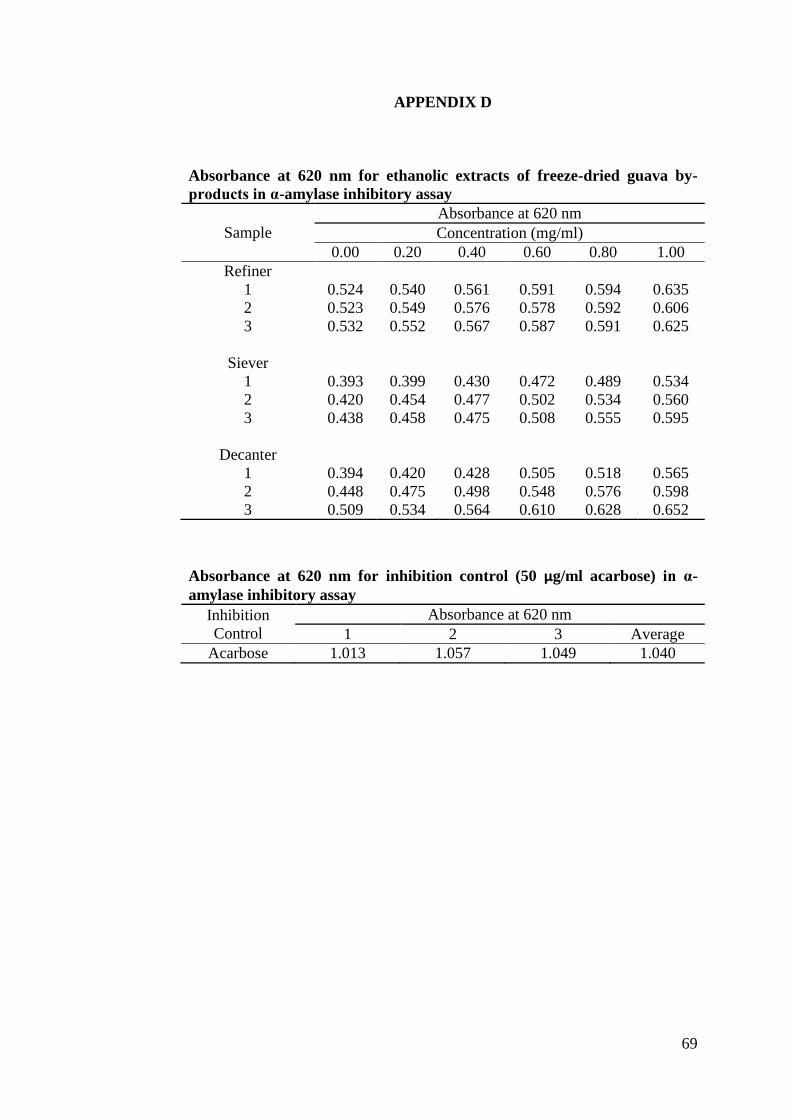
69
APPENDIX D
Absorbance at 620 nm for ethanolic extracts of freeze-dried guava by-
products in α-amylase inhibitory assay
Sample
Absorbance at 620 nm
Concentration (mg/ml)
0.00 0.20 0.40 0.60 0.80 1.00
Refiner
1
2
3
0.524
0.523
0.532
0.540
0.549
0.552
0.561
0.576
0.567
0.591
0.578
0.587
0.594
0.592
0.591
0.635
0.606
0.625
Siever
1
2
3
0.393
0.420
0.438
0.399
0.454
0.458
0.430
0.477
0.475
0.472
0.502
0.508
0.489
0.534
0.555
0.534
0.560
0.595
Decanter
1
2
3
0.394
0.448
0.509
0.420
0.475
0.534
0.428
0.498
0.564
0.505
0.548
0.610
0.518
0.576
0.628
0.565
0.598
0.652
Absorbance at 620 nm for inhibition control (50 µg/ml acarbose) in α-
amylase inhibitory assay
Inhibition
Control
Absorbance at 620 nm
1 2 3 Average
Acarbose 1.013 1.057 1.049 1.040
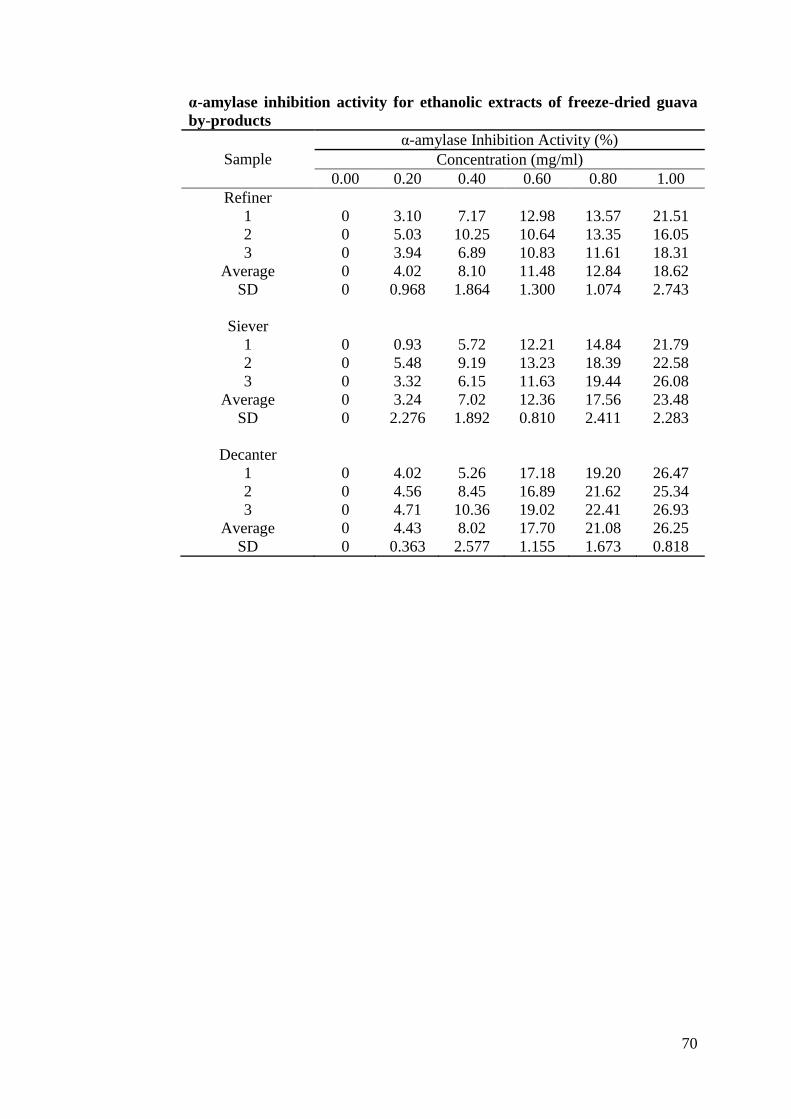
70
α-amylase inhibition activity for ethanolic extracts of freeze-dried guava
by-products
Sample
α-amylase Inhibition Activity (%)
Concentration (mg/ml)
0.00 0.20 0.40 0.60 0.80 1.00
Refiner
1
2
3
Average
SD
0
0
0
0
0
3.10
5.03
3.94
4.02
0.968
7.17
10.25
6.89
8.10
1.864
12.98
10.64
10.83
11.48
1.300
13.57
13.35
11.61
12.84
1.074
21.51
16.05
18.31
18.62
2.743
Siever
1
2
3
Average
SD
0
0
0
0
0
0.93
5.48
3.32
3.24
2.276
5.72
9.19
6.15
7.02
1.892
12.21
13.23
11.63
12.36
0.810
14.84
18.39
19.44
17.56
2.411
21.79
22.58
26.08
23.48
2.283
Decanter
1
2
3
Average
SD
0
0
0
0
0
4.02
4.56
4.71
4.43
0.363
5.26
8.45
10.36
8.02
2.577
17.18
16.89
19.02
17.70
1.155
19.20
21.62
22.41
21.08
1.673
26.47
25.34
26.93
26.25
0.818
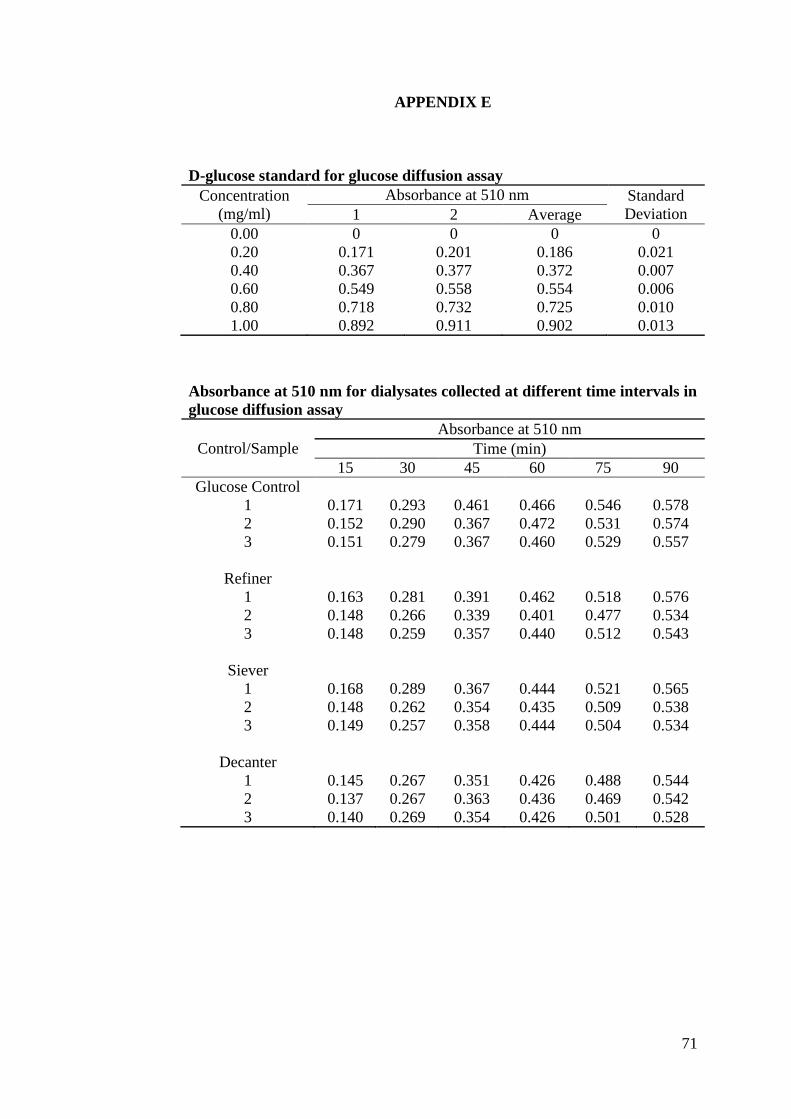
71
APPENDIX E
D-glucose standard for glucose diffusion assay
Concentration
(mg/ml)
Absorbance at 510 nm Standard
Deviation 1 2 Average
0.00 0 0 0 0
0.20 0.171 0.201 0.186 0.021
0.40 0.367 0.377 0.372 0.007
0.60 0.549 0.558 0.554 0.006
0.80 0.718 0.732 0.725 0.010
1.00 0.892 0.911 0.902 0.013
Absorbance at 510 nm for dialysates collected at different time intervals in
glucose diffusion assay
Control/Sample
Absorbance at 510 nm
Time (min)
15 30 45 60 75 90
Glucose Control
1
2
3
0.171
0.152
0.151
0.293
0.290
0.279
0.461
0.367
0.367
0.466
0.472
0.460
0.546
0.531
0.529
0.578
0.574
0.557
Refiner
1
2
3
0.163
0.148
0.148
0.281
0.266
0.259
0.391
0.339
0.357
0.462
0.401
0.440
0.518
0.477
0.512
0.576
0.534
0.543
Siever
1
2
3
0.168
0.148
0.149
0.289
0.262
0.257
0.367
0.354
0.358
0.444
0.435
0.444
0.521
0.509
0.504
0.565
0.538
0.534
Decanter
1
2
3
0.145
0.137
0.140
0.267
0.267
0.269
0.351
0.363
0.354
0.426
0.436
0.426
0.488
0.469
0.501
0.544
0.542
0.528
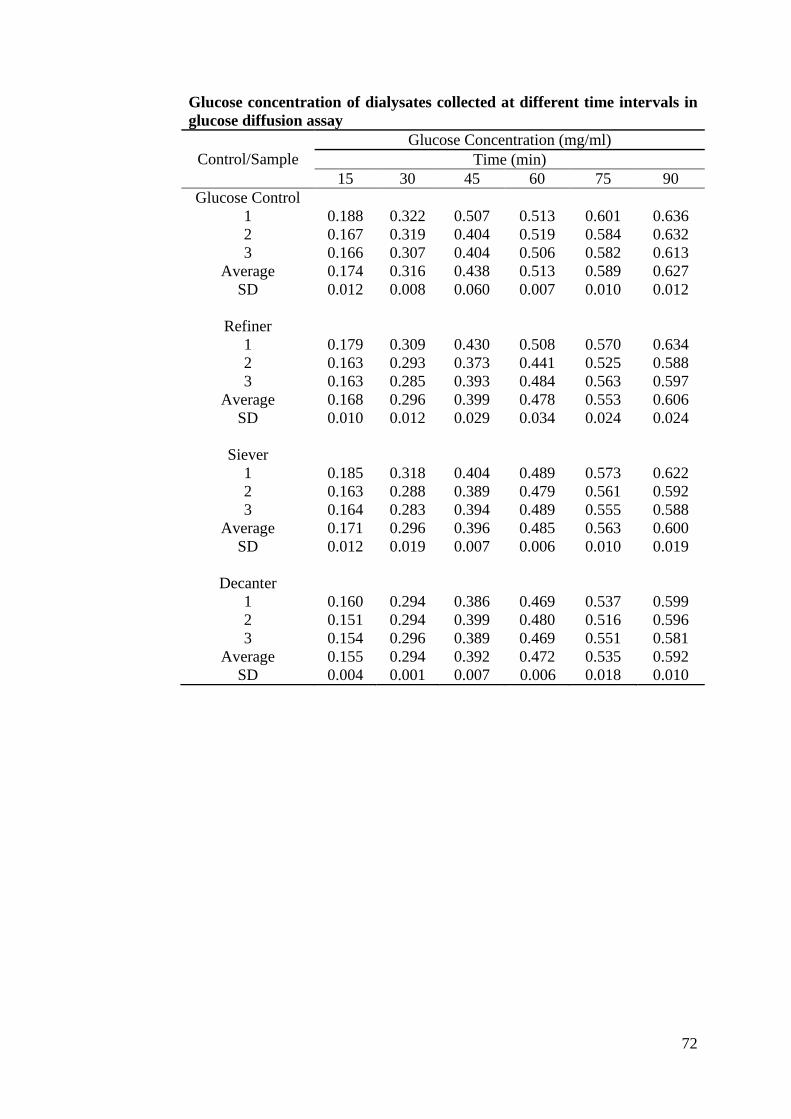
72
Glucose concentration of dialysates collected at different time intervals in
glucose diffusion assay
Control/Sample
Glucose Concentration (mg/ml)
Time (min)
15 30 45 60 75 90
Glucose Control
1
2
3
Average
SD
0.188
0.167
0.166
0.174
0.012
0.322
0.319
0.307
0.316
0.008
0.507
0.404
0.404
0.438
0.060
0.513
0.519
0.506
0.513
0.007
0.601
0.584
0.582
0.589
0.010
0.636
0.632
0.613
0.627
0.012
Refiner
1
2
3
Average
SD
0.179
0.163
0.163
0.168
0.010
0.309
0.293
0.285
0.296
0.012
0.430
0.373
0.393
0.399
0.029
0.508
0.441
0.484
0.478
0.034
0.570
0.525
0.563
0.553
0.024
0.634
0.588
0.597
0.606
0.024
Siever
1
2
3
Average
SD
0.185
0.163
0.164
0.171
0.012
0.318
0.288
0.283
0.296
0.019
0.404
0.389
0.394
0.396
0.007
0.489
0.479
0.489
0.485
0.006
0.573
0.561
0.555
0.563
0.010
0.622
0.592
0.588
0.600
0.019
Decanter
1
2
3
Average
SD
0.160
0.151
0.154
0.155
0.004
0.294
0.294
0.296
0.294
0.001
0.386
0.399
0.389
0.392
0.007
0.469
0.480
0.469
0.472
0.006
0.537
0.516
0.551
0.535
0.018
0.599
0.596
0.581
0.592
0.010
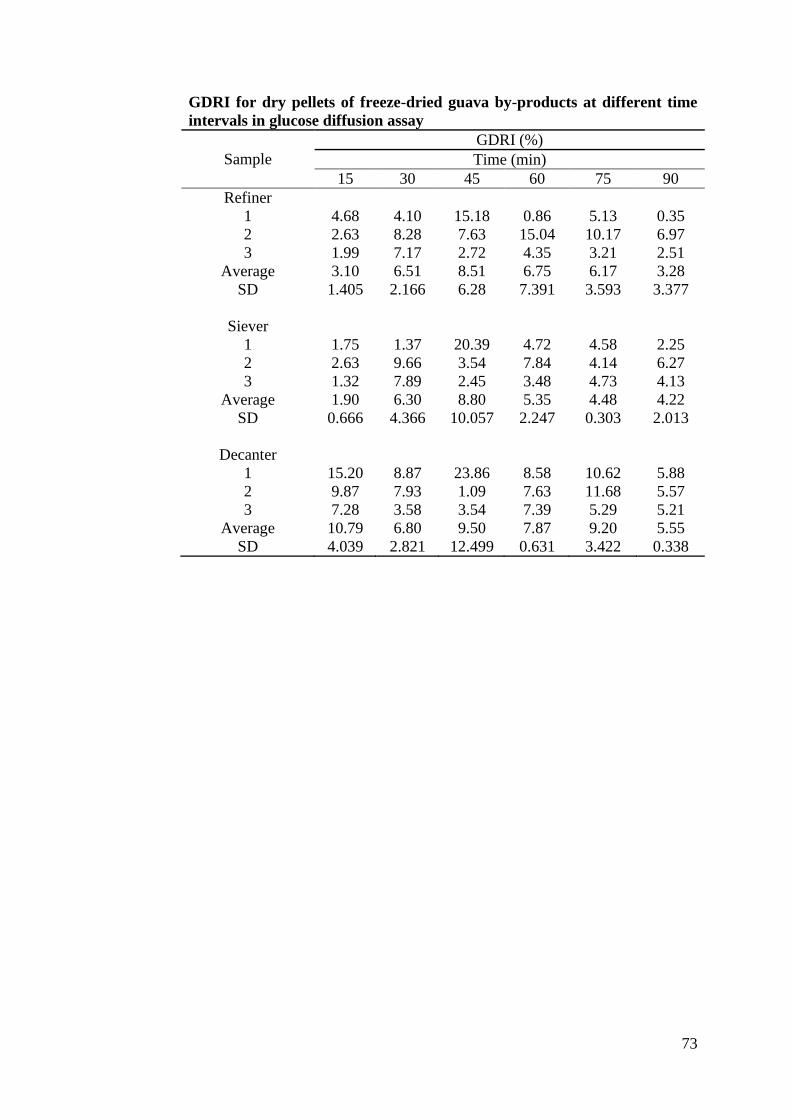
73
GDRI for dry pellets of freeze-dried guava by-products at different time
intervals in glucose diffusion assay
Sample
GDRI (%)
Time (min)
15 30 45 60 75 90
Refiner
1
2
3
Average
SD
4.68
2.63
1.99
3.10
1.405
4.10
8.28
7.17
6.51
2.166
15.18
7.63
2.72
8.51
6.28
0.86
15.04
4.35
6.75
7.391
5.13
10.17
3.21
6.17
3.593
0.35
6.97
2.51
3.28
3.377
Siever
1
2
3
Average
SD
1.75
2.63
1.32
1.90
0.666
1.37
9.66
7.89
6.30
4.366
20.39
3.54
2.45
8.80
10.057
4.72
7.84
3.48
5.35
2.247
4.58
4.14
4.73
4.48
0.303
2.25
6.27
4.13
4.22
2.013
Decanter
1
2
3
Average
SD
15.20
9.87
7.28
10.79
4.039
8.87
7.93
3.58
6.80
2.821
23.86
1.09
3.54
9.50
12.499
8.58
7.63
7.39
7.87
0.631
10.62
11.68
5.29
9.20
3.422
5.88
5.57
5.21
5.55
0.338