pi tc. basic studies: executive summaries
TRANSCRIPT

Pi tC. DP~P A ~ru. ON THE ~'COST OF NON-EUROPE"
BASIC FINDINGS
VOLUME 1
BASIC STUDIES: /
EXECUTIVE SUMMARIES
Document
* * * * * * * * * * * *
1
COMMISSION OF THE EUROPEAN COMMUNITIES

i4NW!RSITY OF PiTTSBURGH UBRARIE!t
Cataloguing data can be found at the end of this publication.
Luxembourg: Office for Official Publications of the European Communities, 1988
ISBN 92-825-860~-7
Catalogue number: CB-PP-88-B14-EN-C
© ECSC-EEC-EAEC, Brussels · Luxembourg, 1988
Printed in the FR of Germany

- 3 -
INTRODUCTION
Set out in the following pages is th~complete collection of
the executive summaries of the basic reports conducted for the
research programme on the "costs of non-Europe" which was
launched in 1986 and completed early 1988.
The programme's reports, funded by the European Commission,
sought to establish the present costs of the European
Community's market fragmentation- and thus the potential
benefits from their removal - by analysing the impact of market
barriers, and by comparing with the North American experience.
The costs inherent in these barriers were examined both in
reports dealing with the principal horizontal barriers impeding
market integration, and in those studying the impact of
specifie examples of barriers in representative sectors of the
Community's service and manufacturing economy.
The reports, while supervised by Commission officiais, were
conducted by independent consultants, who are thus responsible
for the findings set out in them.
Common to all reports was the unprecedented nature of the
research task. This created novel methodological challenges
encountered in assessing non-Europe's present costs, and thus
the potential gains to be had from market integration. Two
symposia held between the consultants and the Commission in May
and October, 1987, were essential to the project's
methodological and indeed overall coherence.
To these challenges was added another : the project's
geographical scope. In view of material constraints, studies
could not embrace all twelve Community countries. However, data
on the four largest EEC economies provided a common empirical
core for systematic analysis. Despite the fragilities, the
stories told by these various reports are complementary and
convergent, and their message to the politicians unmistakeable.


- 5 -TABLE OF CONTENTS
Introduction
1. The "Cost of Non-Europe": Border Related Controls and Administrative Formalities 7 Ernst & Whinney
2. The "Cost of Non-Europe": An Illustration in the Road Haulage Sector 41 Ernst & Whinney
3. The "Cost of Non-Europe" in Public Sector Procurement 65 WS Atkins Management Consultants in association with Eurequip SA-Roland Berger & Partner-Eurequip Italia
4. Technical Ba~riers in the EC: an Illustration by Six Industries 121 Groupe MAC
S. The "Cost of Non-Europe": Some Case Studies on Technical Barriers 155 GEWIPLAN
6. The "Cost of Non-Europe": Obstacles to Transborder Business Activity 189 European Research Associates & Prognos
7. The "Cost of Non-Europe" for Business Services 225 Peat Marwick McLintock
8. The "Cost of Non-Europe" in Financial Services 259~-Price Waterhouse
9. The Benefits of Completing the Internal Market for Telecommunication 293 Services in the Community INSEAD
10. The Benefits of Completing the Internal Market for Telecommunication Equipment in 329 the Community INSEAD
11. The EC 92 Automobile Sector 359 Ludvigsen Associates Ltd.
12. The "Cost of Non-Europe" in the Foodstuffs Industry 397 Groupe MAC
13. Le "Coût de la Non-Europe" des produits de construction 443 B.I.P.E. avec ses partenaires d'Euroconstruct
14. The "Cost of Non-Europe" in the Textile-Clothing Industry 477 IFO-Institut für Wirtschaftsforschung - Prometeia Calcolo SrL
15. The "Cost of Non-Europe" in the Pharmaceutical Industry 509 Economists Advisory Group Ltd
16. The Internal Markets of North America. Fragmentation and Integration in the US 533 and Canada Jacques Pelkmans in cooperation with Marc Vanheukelen
Annexes: Presentation of the "Research on the Cost of Non-Europe": 555 1 - The Structure of the Research 2- The Publication Programme


- 7 -
1.
The •cost of Non-Europe•:
Border Related Controls and Administrative Formalities
Ernst & Whinney


The Cost of ''Non Europe'':
B 0 R D E R R E L A T E D C 0 N T R 0 L S A N D
A D M I N I S T R A T I V E F 0 R M A L I T I E S
Executive Summary
November 1987
•• Ernst &Whinney E

- 11 -
OPPORTUNITY COSTS
Introduction
Other studies
Mail order and express companies
Findings
COSTS TO GOVERNMENT
Introduction
Approach
Findings
CUSTOMS RELA 1ED SECTOR
Annex
Introduction
Findings
The structure of the sample


- 13 -
THE COSTS OF 'NON EUROPE': BORDER RELATED CONTROLS AND
ADMINISTRATIVE FORMALITIES
EXECUTIVE SUMMARY
SUMMARY OF OVERALL FINDINGS
INTRODUCTION
The 1985 white paper
Completing the market
Previous estimates of costs
The issues
The approach
Thesamp/e
W eighting the sample data
Adding import and export costs
Gross costs
COST TO FIRMS
Introduction
Overall results
Costs by country
Costs and size of firms
Existing simplified procedures
INDEX
The single administrative document
Banking, Insurance and Inventory Costs
Cost of de/ays
Cost and means of transport


- 15 -
1
SUMMARY OF OVERALL FINDINGS
There are widely quoted estimates of the costs of customs barriers applying to trade in
goods between Members of the European Community which have tended to have either little clear
empirical basis or they have been extrapolated from evidence which relates to American experience
severa! years ago in very different circumstances.
The present study, initiated by the Directorate General for the Internai Market and Industrial
Affairs, is intended to provide estimates of:
• the costs to fmns of compliance with customs formalities;
• the costs to govemment of administering the procedures;
• an estima te of the opportunity cost to the Community;
• the economie significance of services in the customs related sector.
The fmdings discussed below are ali subject to a range of assumptions, limitations imposed
by the size and coverage of the sample, and the extent of available official data, as indicated in each
of the earlier sections of this report. While therefore the results need to be interpreted with caution
they do represent the frrst attempt to obtain comprehensive empirical evidence on the customs costs
of 'non Europe', which they confrrm to be of considerable significance.
With these caveats in mind, the estimates presented below suggest that:
• the costs to frrms of customs procedures might be in the area of:
7 112 billion ECU for administrative costs, and a further 415-830 million ECU
for delay related costs;
• costs to govemment might amount to 500-1000 million ECU;
• the economie significance of the customs sector in terms of its turnover might be of the
order of 11!2 billion ECU;
• turning to lost trade, where the estimates need to be treated with particular caution, firms'
opinions imply that trade could rise by in the region of3/4- 3%, or 3 3/4- 15 billion ECU.

- 16 -
2
INTRODUCTION
Non-Europe: Customs
The 1985 Commission White Paper 'Completing The Internai Market' recalled that the
Treaty of Rome envisaged the creation of a single integrated Community market within which there
would be the free movement of goods.
Although a common extemal customs tariff had been adopted, the White Paper emphasised
that severa! physical, technical and fiscal barriers remain. Physical barriers, in the form of
Customs posts, are the most visible example of continued division in the Community. Frontier
controls contribute to the costs and disadvantages of a divided market and the White Paper argued
that their removal is essential for the completion of the internai market.
The White Paper recognised that frontier controls exist to ensure the enforcement of
national policies on such matters as immigration control, health and safety regulation, the taxation
of goods, the collection of trade statistics, the control of drugs and terrorism, and of the Common
Agricultural Policy with respect to monetary compensation amounts. The White Paper said the
"objective is not merely to simplify existing procedures, but to do away with internai controls in
their entirety".
Completing the internai market: The 1992 Target
The Single European Act, which came into effect on 1 July 1987, states:
"The Community shall adopt measures with the aim of progressively establishing the
internai market over a period expiring on 31 December 1992 ... The internai market shall
comprise an area without internai frontiers in which the free movement of goods, persons
and capital is ensured in accordance with the provisions of the Treaty".
By 1992 the Commission intends that Member States will agree on the abolition of barriers
of ali kinds, harmonisation of rules, approximation of legislation and tax structures, strengthening
of monetary co-operation and the necessary measures to encourage European firms to work
together.
It was against this background that the present study of the costs of customs controls was
initiated by the Commission of the European Communities.
The costs may be divided into:

- 17 -
3
• the financial costs to fmns of the administrative procedures and of the dela ys associated
with compliance with customs fonnalities;
• the opportunity costs of lost trade; and
• the costs of administering customs con trois borne by national government agencies.
Previous Estimates of costs
Previous attempts to quantify the costs of customs formalities have had to be made without
the benefit of direct evidence from the frrms and national administrations concerned. It is also a
feature of severa! previously published estimates that their precise source is difficult to establish.
The 1981 report from the Commission to the Council on "The State of the Internai Market" (COM
(81) 313) simply states " ... these procedures increase the costs of goods by around 5-10%". ln
1983 Commissioner Narjes on behalf of the Commission said of customs formalities that "they are
calculated in business circles to account for 5 to 7 per cent of the priee of the goods traded
"(Kangaroo News, February 1983). The Patterson Report to the Economie and Monetary
Committee of the European Parliament (31 May 1985, Document A 2-50/85/B) quotes the
estimates in the Albert and Bali Report ("Towards European Economie Recovery" European
Parliament Working Document, 1983), which estimates the total costs of Non-Europe at 50 billion
ECU or 2% of GNP, of which 12 billion ECU is attributed to the costs of crossing frontiers;
Albert and Bali quote as their source Commission document to Council (COM (83) 80) which
quotes the Economie and Monetary Affairs Committee of the Parliament as a source and states that
preliminary c~culations by the Commission suggest that the cost of these formalities could be
equal to between 5% and 10% of the actual value of goods traded.
In short the source for each official estimate quoted above is either another official
document or "business circ les" or not stated, rather th an a primary source su ch as a survey of
frrms.
In fact the basic source of ali these estimates appears to be a 1971 study by the US National
Committee on International Trade Documentation. That study suggested that the costs of exporting
and importi.ng could each amount to 7 percent of the value of goods traded, or 14 per cent in total.
Estimates of comparable EC costs of up to 10 per cent have been derived from the US figures after
making certain adjustments: assuming that costs of about 4 per cent arise anyway for domestic
trade. This is sometimes further reduced to 5-7 per cent in view of the greater simplification of

- 18 -
4
procedures which traders in the Community face than existed in 1971 for US frrms, and because
the US estimates included fmancing and insurance charges as well as customs compliance costs.
A recent report to the UN Economie Commission for Europe ("Methodology for Estimating
Costs and Benefits of Trade Facilitation", 31 December 1986) argued that the US figures are
quoted out of context, that they are out of date, and that they were grossed up from data of variable
quality supplied by a possibly unrepresentative sample of frrms, by an unclear methodology. They
included all documentation costs (for instance, fmance and shipping as well as customs) relating to
US trade with the rest of the World, with which US trading relationships can be subject to much
more complex control than exist currently within the EC. In particular, EC customs authorities are
more co-operative than hitherto, their inspections are more selective; techniques for document
preparation and processing have improved; comprehensive, competitively priced services by agents
have helped to eut costs.
The degree of seriousness of the effect of administrative formalities on trade has therefore
been a matter of conjecture.
The study for the British Overseas Trade Board stated that "successful exporters- almost
without exception, dismissed such matters as customs procedures and export documentation as
nothing more than an administrative nuisance". However other firms fmd either the prospect of
complying with customs formalities, or their initial attempts to comply with such formalities, off
putting.
A study carried out among a sample of frrms in Germany (by DIHT) suggested, on the
basis of "fragmentary and inconsistent" information there is little relationship between compliance
costs and the value of goods traded. The suggestion that the compliance costs facing frrms is
unrelated to the value of goods traded implies that exports of small value consignments, and by
smaller frrms, will bear a disproportionately high cost burden. It follows that, if the above
impression is correct that the deterrent effect of frontier barri ers will be greater for smaller than for
very large frrms. But it also implies that customs costs will tend to be a small proportion of the
value of large consignments and of exports by larger firms. A recent study for the British
Overseas Trade Board ("Into active Exporting" 1987) says "In terms of aggregate value, exports
are dominated by a small number of large frrms."
It would seem to follow from the German and British studies quoted above that if customs
compliance costs are a low proportion of the value of exports by large frrms, then because large
firms dominate trade, compliance costs will be a low proportion of the actual value of trade.
Nevertheless:

- 19 -
5
• the burden on smaller fmns may be such that the opportunity for potential trade by small
fmns is lost;
• the impact on marginal decisions by larger fmns on whether or not to export will be
important if customs costs are a significant proportion of profit margins;
• although customs barriers are not insurmountable they are only overcome at a cost.
It is clear from the discussion above that accurate, relevant information above the costs of
'Non Europe' customs barriers need to be established. To the extent that the costs of 'Non
Europe' are passed on to consumers in the form of higher priees, the costs of consumption are
raised. Furthermore, the value of trade, output and employment will be reduced both because
costs of trading within the EC are higher than they need be and because at least sorne fmns are
inhibited from trading because of their perception of the barriers imposed by customs formalities.
The loss of trade, output and employment does not arise solely because trade within the
Community is lower than it otherwise would be; the cost-raising effect on customs formalities
reduces Europe's competitiveness vis a vis the rest of the world.
Initiation of the E& W Study: The Issues
The present study was initiated by the Directorate General for the Internai Market and
Industrial Affairs to estimate, with the co-operation of firms and national administrations, the costs
of 'Non Europe' created by customs formalities.
The purposes of the study are to identify the barriers to intra-community code resulting
from customs formalities and to measure:
• the costs borne by firms including:
the administrative costs of complying with customs formalities;
costs associated with the delays caused by customs procedures;
• the opportunity costs, that is the foregone exports and imports for firms
including the costs on entry to another Community market;
• the budgetary cost to public authorities of customs formalities;
• the economie importance of the customs-related sector.

- 20 -
6
The Approach
The information to be obtained needed to cover:
• a range of countries;
• a sample of finns, by interview;
• a range of commodities;
• imports and exports.
The countries chosen (Belgium, France, Germany, Italy, Netherlands, United Kingdom)
together account for 90 per cent by value of the internai trade of the EEC.
In view of the Commission's particular interest in the problems of small and medium sized
fmns (SMEs) the sample was to be constructed to give particular emphasis to industries in which
they are important. But to the extent that trade is dominated by large fmns it needs to be borne in
mind that the costs to SMEs might not be typical of trade as a whole.
Three detailed questionnaires were devised following pilot testing requesting information
on:
• costs of customs procedures to finns;
• road haulage dela ys and restrictions on competition;
• freight forwarders/customs agents.
The sample
Over 2,500 fmns were approached by Ernst & Whinney offices in the six countries
concerned, over 2,000 questionnaires were sent out and our staff interviewed 467. Details of
internai costings and trade values were obtained from 267 for imports and 224 for exports. The
sample accounts 0.8 percent of intra-EEC trade. Summary data on the sample are shown at
Annex 1.
Ernst & Whinney decided to telephone the offices of the chief executives of fmns before
sending them the questionnaires, to exp lain the importance of the survey, in order to improve the
response rate.
- 21 -
7
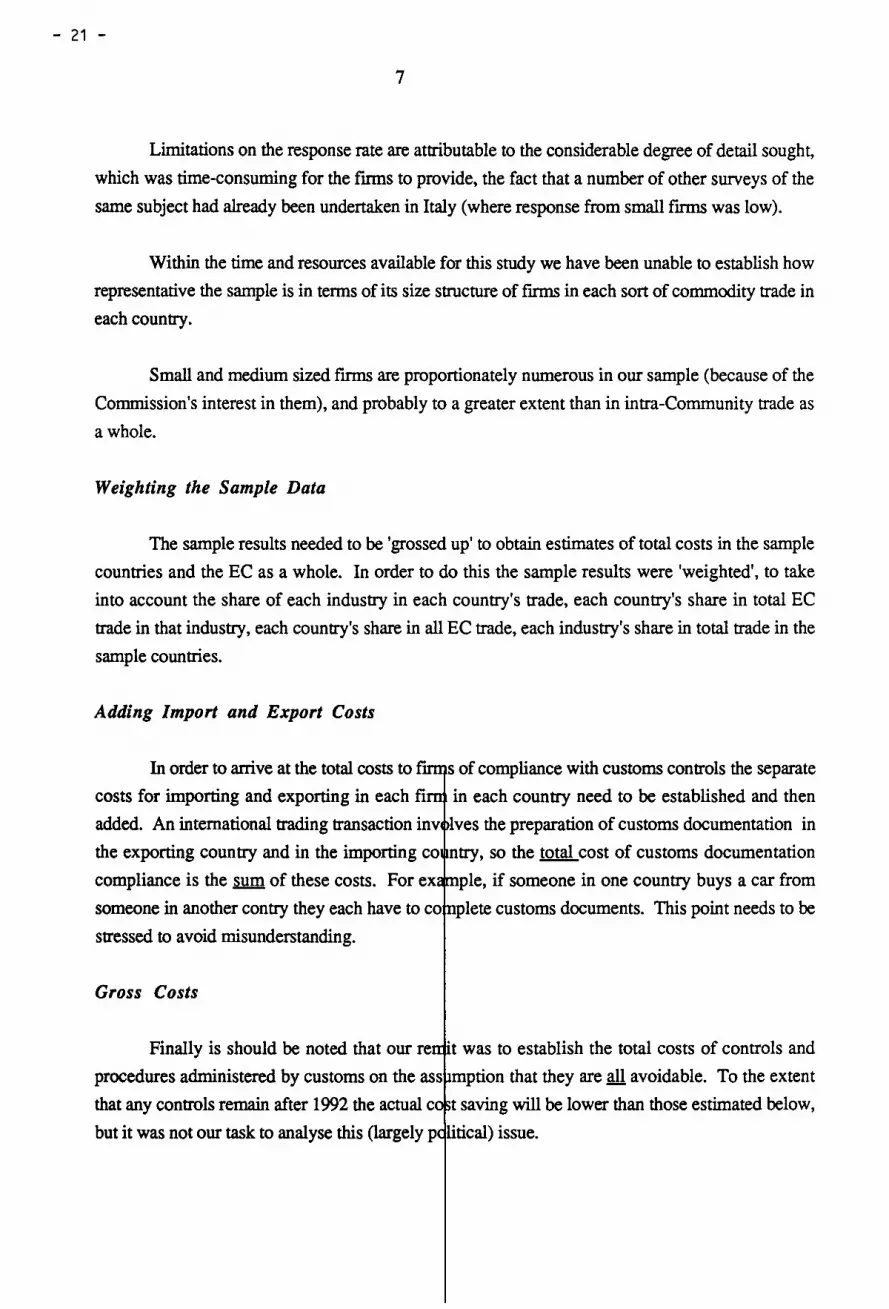
Limitations on the response rate are attributable to the considerable degree of detail sought,
which was time-consuming for the fmns to provide, the fact that a number of other surveys of the
same subject had already been undertak:en in Ital y (where response from small fmns was low).
Within the rime and resources available for this study we have been unable to establish how
representative the sample is in terms of its size structure of fmns in each sort of commodity trade in
each country.
Small and medium sized fmns are proportionately numerous in our sample (because of the
Commission's interest in them), and probably to a greater extent than in intra-Community trade as
a whole.
Weighting the Sample Data
The sample results needed to be 'grossed up' to obtain estima tes of total costs in the sample
countries and the EC as a who le. In order to do this the sample results were 'weighted', to take
into account the share of each industry in each country's trade, each country's share in total EC
trade in that industry, each country's share in ali EC trade, each industry's share in total trade in the
sample countries.
Adding lmport and Export Costs
In order to arrive at the total costs to fi s of compliance with customs controls the separate
costs for importing and exporting in each fi in each country need to be established and then
added. An international trading transaction inv Ives the preparation of customs documentation in
the exporting country and in the importing co ntry, so the total cost of customs documentation
compliance is the sum of these costs. For ex pie, if someone in one country buys a car from
someone in another contry they each have to co plete customs documents. This point needs to be
stressed to avoid misunderstanding.
Gross Costs
Finally is should be noted that our re · t was to establish the total costs of con trois and
procedures administered by customs on the ass mption that they are ali avoidable. To the extent
that any controls remain after 1992 the actual c t saving will be lower than those estimated below,
but it was not our task to analyse this (largely p litical) issue.

- 22 -
8
COST TO FIRMS
Introduction
The intention was to obtain as much information as possible about:
• the nature of the costs borne by fmns (internai administration costs, including staff,
computers, overheads, agents' fees, delay related costs, excessive inventories and any
other costs regarded as significant);
• the way in which these costs varied according to:
fums' size;
connnoditiestrade~
the value of consignments;
the means of transport used;
countries concerne~
• the use of simplified customs procedures;
• the expected impact on costs of the new Single Administrative Document;
• the impact on trade expected if ail customs fonnalities were abolished within the EC;
• fmn's views on the main source of difficulty posed by official procedures.
Overall results of Ernst & Whinney Survey
The average cost per consignment (including internai costs and agents fees) to firms in the
sample was found to be in the region of approximately 65-85 ECU, or 0.7-0.8 percent of value,
for imports and exports respectively. In round terms the combined costs for both imports and
exports could amount to 11!2 percent of the value of internai Connnunity trade, or in the region of
1112 billion ECU (but see below).
To this delay related costs need to be added (see below), these might amount to 415-830
million ECU for road haulage.
- 23 -
...
9
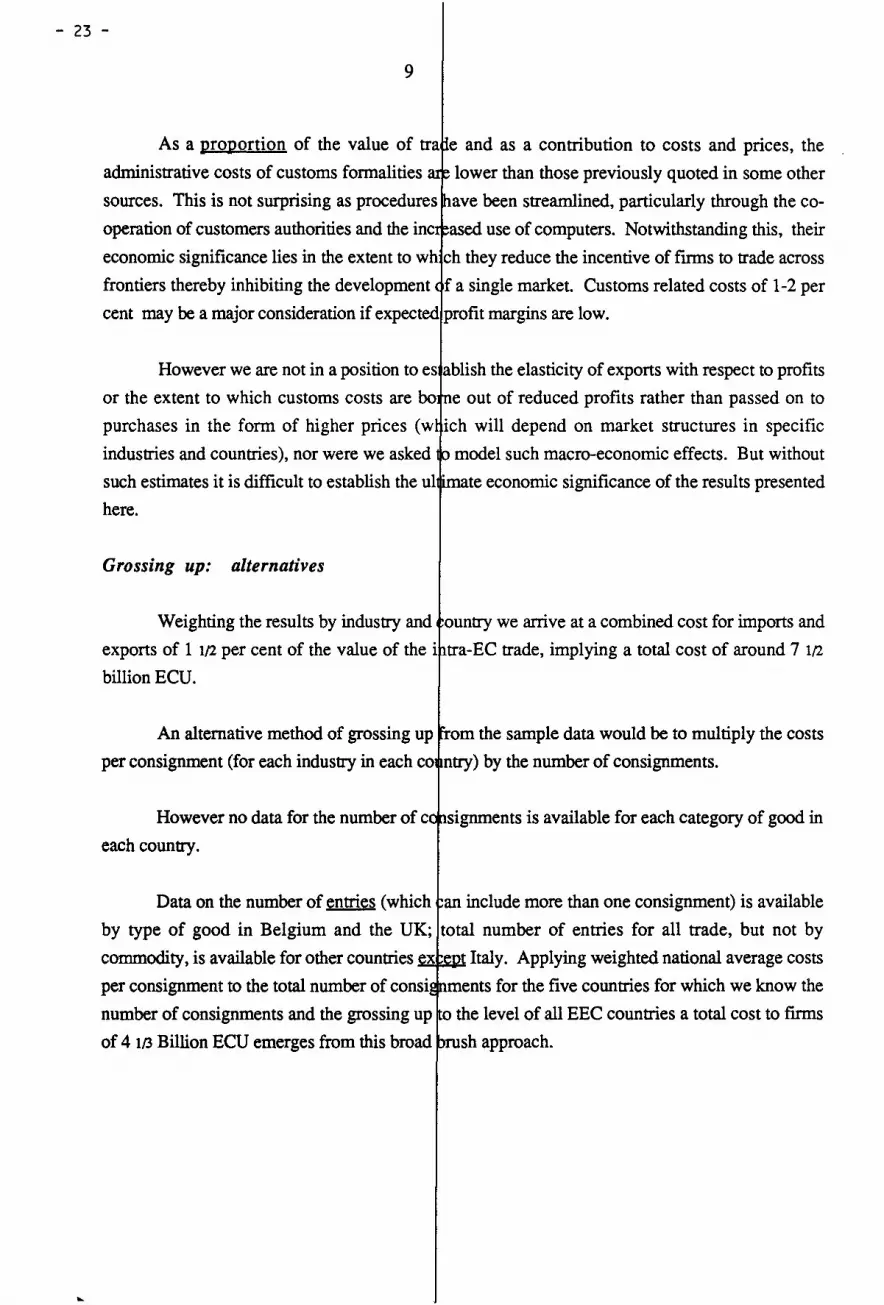
As a proportion of the value of tra e and as a contribution to costs and priees, the
administrative costs of customs formalities lower than those previously quoted in sorne other
sources. This is not surprising as procedures ave been streamlined, particularly through the co
operation of customers authorities and the in ased use of computers. Notwithstanding this, their
economie significance lies in the extent to wh ch they reduce the incentive of fmns to trade across
frontiers thereby inhibiting the development fa single market. Customs related costs of 1-2 per
cent may be a major consideration if expected profit margins are low.
However we are not in a position to es ablish the elasticity of exports with respect to profits
or the extent to which customs costs are bo e out of reduced profits rather than passed on to
purchases in the form of higher priees (w ich will depend on market structures in specifie
industries and countries), nor were we asked model such macro-economie effects. But without
such estimates it is difficult to establish the ul ·mate economie significance of the results presented
here.
Grossing up: alternatives
Weighting the results by industry and ountry we arrive at a combined cost for imports and
exports of 1 1/2 percent of the value of the i tra-EC trade, implying a total cost of around 7 1!2
billion ECU.
An alternative method of grossing up om the sample data would be to multiply the costs
per consignment (for each industry in each co ntry) by the number of consignments.
However no data for the number of c signments is available for each category of good in
each country.
Data on the number of entries (which an include more than one consignment) is available
by type of good in Belgium and the UK; total number of entries for ali trade, but not by
commodity, is available for other countries x e t Italy. Applying weighted national average costs
per consignment to the total number of consi
number of consignments and the grossing up
of 4 1/3 Billion ECU emerges from this broad
ments for the five countries for which we know the
o the level of ali EEC countries a total cost to fmns
sh approach .
- 24 -
10
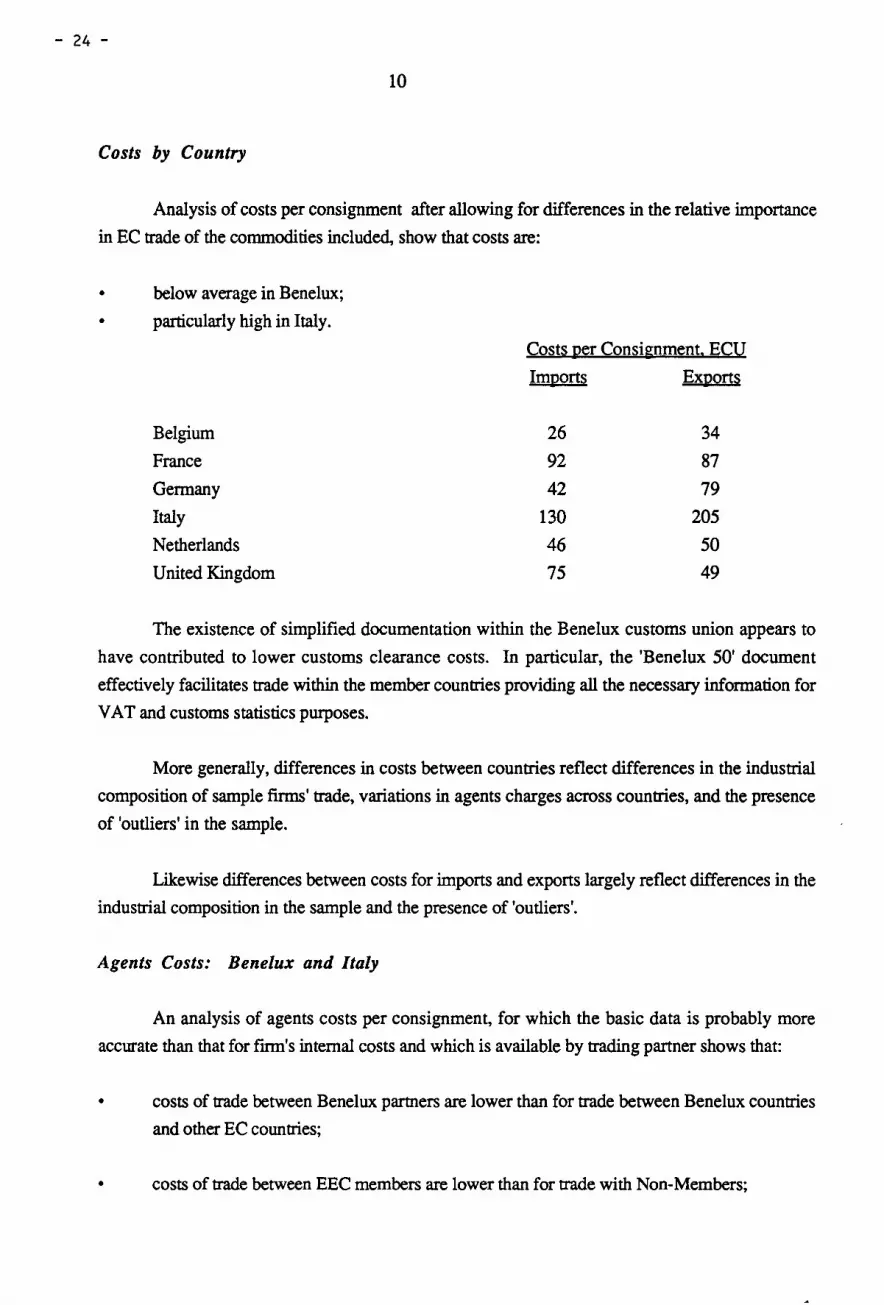
Costs by Country
Analysis of costs per consignment after allowing for differences in the relative importance
in EC trade of the commodities included, show that costs are:
• below average in Benelux;
• particularly high in Italy .
Costs 12er Consignment~ ECU
Im12orts EXROrtS
Belgium 26 34
France 92 87
German y 42 79
Ital y 130 205
Netherlands 46 50
United Kingdom 75 49
The existence of simplified documentation within the Benelux customs union appears to
have contributed to lower customs clearance costs. In particular, the 'Benelux 50' document
effectively facilitates trade within the member countries providing ali the necessary information for
V AT and customs statistics purposes.
More generally, differences in costs between countries reflect differences in the industrial
composition of sample firms' trade, variations in agents charges across countries, and the presence
of 'outliers' in the sample.
Likewise differences between costs for imports and exports largely reflect differences in the
industrial composition in the sample and the presence of 'outliers'.
Agents Costs: Benelux and Italy
An analysis of agents costs per consignment, for which the basic data is probably more
accurate than that for fmn's internai costs and which is available by trading partner shows that:
• costs of trade between Benelux partners are lower than for trade between Benelux countries
and other EC countries;
• costs of trade between EEC members are lower than for trade with Non-Members;

- 25 -
11
• that trade between ltaly and other countries is more costly than between any other country
and the rest of the EC.
Costs and firms' sizes
Our sample data suggests that costs per consignment are 30-45 per cent higher for fmns
with fewer than 250 employees than for larger fmns. But larger fmns account for over 65 per cent
of trade (in our sample) so that their lower costs will be the more important influence on the
average for firms as a whole.
Costs by industry
An analysis of costs by industry exhibits variations between industries and between
imports and exports. There are a number of factors which can cause these differences:
• the sample size for petroleum products is too small to make inferences and
is influenced by a French company with extremely high costs;
• cost per consignment is positively related to value per consignment although not in direct
proportion;
• sorne industries require additional documentation for strategie reasons or
because they are covered by trade agreements;
• outliers have an impact in sorne industries such as iron and steel where
sorne Italian importers report very high costs;
• countries with high (or low) costs in a particular industry can distort the
differences between import and export costs if their share of EEC exports
and imports are significantly different
Existing simplified procedures
A number of procedures have been developed by customs authorities to simplify
fonnalities. They include pre-authenticated documents, local import or export control (as opposed
to border control) and period entry (whereby a trader can have perhaps a month's imports/exports
processed together).
- 26 -
12
Such procedures can reduce the time between the presentation of documentation to customs
control offices and the release of the goods at the border transit point to a few minutes. At sorne
stage the necessary documentation needs to be prepared and subsequent! y processed.
Where fmns do not use simplified procedures this is mainly because either the minimum
necessary loads required to qualify are not available, or the finn uses agents to complete all the
fonnalities; in only a minority of cases we did find that fmns were not sufficiently aware of the
available simplified procedures.
The sample data suggests that costs per consignment are in the region of 50 per cent lower
where simplified procedures are al ways used than where they are never used.
The Single Administrative Document
From January 1988 a new customs document, the Single Administrative Document (SAD)
is to be introduced. It represents document simplification, not a simplified procedure. It will
enable export, transit and certain import information to be entered on a single form, rather than on
separate forms.
However, serious misunderstandings about the purpose and effects of SAD emerged from
our discussions with several fmns in certain countries, where the customs authorities will need to
help finns to understand the changes.
Virtuany an finns which commented on the anticipated impact of SAD believe it will neither
accelerate nor simplify customs procedures.
Companies which do not have computerised systems are afraid that without a computer
they will not be able to complete the form; those with computers need to change their programs and
most do not expect a significant reduction in costs subsequently. Sorne fear that the replacement of
text by code numbers will make documentation more difficult to complete and read. Sorne fmns
are worried that SAD will not be the only document if different documents will be needed for
exporting, transit and importing, in each language of the countries concerned. Sorne said they still
await official explanations of the changes. Sorne fmns which have thought about 1992 see SAD as
an unnecessary step, given the target of abolishing an intra-EEC formalities.
- 27 -
13
The principal conclusion to emerge from the above opinions is that SAD is not regarded as
reducing the benefits to be achieved in 1992 by comparison with the current situation and that a
major information and training effort is needed in certain countries to explain the nature, purposes
and procedures of SAD.
Banking, Insurance and Inventory Costs
Abolition of customs barriers are not seen as reducing financial costs or inventories, which
are not usually regarded as being sensitive to changes in procedures which may save minutes or
hours rather than da ys in terms of reduced dela ys. In could be argued that severa! hours delay can
effectively amount to a whole working day, but most frrms interviewed have not adopted 'just-in
time' inventory control techniques this could reflect the structure of our sample which contains
severa! small frrms.
Banks and insurance companies were interviewed to establish whether the removal of
customs formalities would bring any benefits to firms through the impact of swifter, more
predictable transactions. Neither banks nor insurance companies saw any significant benefit
arising, whether through the reduction of premiums for European traffic, through lessened
possibility of consequentialloss or through lower bank charges.
Cost of delay
In our survey "Cost of Non Europe: lllustrations in the road haulage sector" we include
details of the work carried out to assess the cost of delay borne by road vehicles across the
Community. The results of our survey were then used to estimate a cost for delay for ali road
haulage. The cost of delay for road traffic amounts to sorne 830 Million ECU. This represents a
gross figure that cannot ali be saved as it assumes that ali delay rime can be utilised. This is not
necessarily the case as drivers tend to coïncide rest breaks with frontiers wherever possible and
cargo is not necessarily available to occupy the available capacity. To take this into account, we
have assumed that a 50% saving could be achieved, th us giving a range of ECU 415-830 million
ECU for the Community as a whole.
Although significant tonnage is also carried by Inland Waterway (41% of 1986 tonnage
total) and rail (13%), an insufficient proportion of our sample utilised these services to provide any
reliable data from which to calculate delay-related costs. This should be borne in mind when
considering the cost of delay for the Community as a whole.

- 28 -
14
Costs and Means of Transport
No significant difference in customs compliance costs appear to be associated with
differences in the means of transport used, although as the sample was heavily biased in favour of
road traffic the reliability of data relating to the use of other modes is suspect.

- 29 -
15
OPPORTUNITY COSTS
Introduction
The second key part of the study is to examine the opportunity costs for fmns, especially
lost trading opportunities.
In our assessment of this cost we have concentrated on four key issues:
• the.extent to which importers and exporters claim they would increase their trade within the
community if customs fonnalities were abolished;
• the extent to which fmns contend that the presence of customs regulations has prevented
them from trading with partners in the European Community;
• differences in perceptions among fmns of different sizes;
• particular activities likely to be hit by delays and indefmite transit times, namely:
express;
mail order.
It is important to emphasise that the data presented below, as in -several other studies, is
based on what fmns perçeive or claim to be the problems associated with customs barriers and the
benefits they claim to expect from the removal of those barriers. As such they do not represent
objective data about costs and benefits which can be independently tested. But as perceptions they
have a reality of their own which needs to be recognised.
Other studies
The paper on "implementation of ECEIF AL recommendations methodology for estimating
costs and benefits oftrade facilitation" (31/12/86) for the United Nations Economie Commission
for Europe Committee on the Development of Trade sees opportunity costs arising in the import
and re-export of goods and consequent compliance with two sets of formalities and procedures.
The rime delays and consequent unpredictability of both the import and export cycle mean that
"costs and so priees rise, profits tumble and customers are lost and alienated". The same study
identifies "deterrent costs", (classified in this study as an opportunity cost) as the barrier to trade

- 30 -
16
represented by "a general impression of complication and difficulty" associated with "complicated
procedures and documents".
A survey is currently being carried out by the Banque Nationale de Belgique involving 500
Belgian companies. We understand that initial feedback from this study has not identified customs
formalities as a major barrier to trade.
The Joint Textile Committee's report, "Lifting the Barriers to Trade" (June 1986) analysed
the trade barriers to UK exports of textiles and clothing, and categorised the type and severity of
barrier according to the country concerned. The Western European countries are categorised
together as "relatively accessible" with reasonably low import duties and generous quotas.
The real barriers in EEC are seen as "administrative inconveniences rather than real obstacles".
The exceptions are Greece, Portugal and Spain, ali new members of the EEC whose barriers are
now being dismantled. The view of the Joint Textile Committee then, is that the EEC
administrative formalities do not represent a major barrier to trade.
The BOTB research paper "lnto Active Exporting" (April1987) analysed the presence of
uptapped export potential in smaller and medium sized manufacturing companies, identifying:
• the barriers to export and their relative importance;
• how export can be encouraged.
The BOTB questionnaire based survey the problem associated with customs procedures and export
documentation was seen "as nothing more than an administrative nuisance" by successful
exporters, although with inevitable teething problems. Of the fmns not exporting, 10 percent
mentioned lack of experience and confidence in exporting but documentation was not seen as a
prime barrier to trade. The report concluded that export documentation and procedures represent
no problem to professionals either internally or externally. The ten least successful frrms had tried
to eut corners in this area
A Small Business Research Trust study (ail firms including non manufacturing) concluded
that the following were the most significant factors:
• finance/delays in payment 26.2%
• export paperwork 14.4%

- 31 -
17
• market information 14.4%
• product suitability 14.3%
This shows that the smaller fmns believed export paperwork (of which about half is customs
related) was a more serious problem than the larger fmns but again indicates that it is one of many
contributory factors.
Findings
In our discussions with trade associations and traders, we have found little empirical
evidence to suggest that customs formalities represent a major barrier to trade for newcomers.
Rather, these procedures are seen as an irritation or an inconvenience to be overcome by successful
fmns. Smaller fmns which do successfully export have found customs formalities particularly
worrying but have leamed to cope with them, often with the advice of trade associations and quasi
official agencies intended to promote trade. As for those fmns which do not export it is difficult to
establish the significance of customs barriers al one, a part from ali the other (languages etc)
problems involved. For this reason advisory bodies who have been approached for advice by
small firms from which they subsequently beard no more, are very doubtful of being able to
derive valid estimates of the effect of customs formalities, even if a large sample of such firms
were to be contacted; in any event a large sample of non exporters was beyond the scope of the
present study.
One of the largest Chambers of Commerce in Germany emphasised to us that the reasons
why SMEs do not trade across frontiers include:
different industrial standards;
limited knowledge of foreign markets;
different procedures for registering and testing the design of certain goods apart
from customs barriers.
Nonetheless the results of our survey shown in the table below are not insignificant.
A number of smaller companies reported to us that they are reluctant to attempt to break into
new markets because small unmarketable samples and brochures may be subject to duty by
Customs authorities; the duty on the despatch of severa! such consignments is regarded as a
significant deterrent by such finns.

- 32 -
18
Mail Order and Express Companies
Most mail order fmns conduct their operations within national boundaries, partly because
of the cost of translating and distributing catalogues in other countries. There were mixed
responses from the small sample of companies which do mail order business in other countries:
sorne found customs regulations burdensome, others said they were not a major consideration.
Little thought has been given by sorne to their post 1992 strate gy, but in any event customs
formalities are just one element of the changes they need to consider.
Express companies find customs procedures the cause of delay (up to about 1 hours per
consignment). One fmn reported that 8 out of 25 staff at a central European despatching point in
Brussels are involved in customs procedures, (but this includes non-EEC business).
Survey Findings
The table below shows those companies indicating that the removal of customs formalities
willlead to an increase in existing trading activities. It clearly shows that the smaller fmns see
themselves in particular benefitting from the completion of the internai market
IMPORTS
% of sample stating
increase Average % increase
stated
EXPORT
% of sample stating
increase Average % increase
stated
Number of Employees
Morethan
0 - 50 51 - 250 251 - 500 500
12 8 3 11
22 13 7 8
24 22 14 22
26 20 8 10
* Including firms not expecting increase.
Average Over
AU Firms*
9
1.0*
22
3.2**
** Weighted according to share of total imports/exports accounted for by firms in each size
category in the sample.

- 33 -
19
The results suggest that exporters are more optimistic about increased opportunities than
importers. In practice increased exports and imports within the EC must equal one another, but it
is not logically required that this balance must apply to this particular sample.
These results take no account of possible increases in trade by frrms which do not trade
across frontiers at present, a large sample survey of such frrms being beyond the scope of this
study.
Even if finns do perceive customs formalities as being due for abolition in 1992 it does not
follow that they envisage greater export activity unless the other barriers are expected to vanish,
and even then the other inhibitions on trade (such as limited awareness of foreign markets) need to
be overcome.
An increase in trade of the order of 1 - 3 per cent implied by the table above is by no means
insignificant and, if true of the EC as a whole, could amount to 4 112- 15 Billion ECU. These
results need to be compared to those which can be obtained from a simulation using an econometrie
model of trade in Europe, on the assumption that the costs to finns fall to the extent reported in the
previous part of th~? report, that these costs are passed on in lower priees, and taking into account
the elasticity of demand for, and supply of, traded goods.
- 34 -
20
COST TO GOVERNMENT
Introduction
The third part of the study involves the calculation of the budgetary cost to the public
authorities in terms of the material and human resources employed to carry out inspections. The
initial assessment of this cost was to be based on publicly available data which was then to be
discussed with the officiais in the agencies concerned.
Approach
In each country involved in the survey responsibility for customs formalities is combined
with additional duties. In order to obtain a consistent and representative cost of administration we
have adopted the following approach to the assessment:
• ali figures relate to the calendar year, 1986;
• trade with all member states is included (including Portugal and Spain);
• where possible, the cost associated with non-customs tasks have been deducted, for
example:
administration and collection of domestic value-added tax (V AT);
compilation of trade statistics;
excise administration;
• the number of consignments rather than the value trade has been used as a basis for
splitting the cost of customs between EEC and non-EEC trade wherever possible or at
least between export and import: where this is not available we have used trade values;
• if customs officiais have indicated that import consignments take more time than exports
we have weighted the costs accordingly: however, where the ratio of EEC trade to non
EEC (trade in terms of consignments or alternatively value) for imports and export is
similar we have not weighted the results;
• equally, if officiais indicate that EEC traffic requires generally less attention than non
EEC, an adjustment has been made.

- 35 -
21
• compilation of trade statistics has been deducted wherever separate figures are available
as in most countries this is not a task for customs authorities.
Findings
The table below shows estimates of the costs to government and of the staff involved. The
figures for 'Total' staff and budget refer to ali the operations of customs administrations as shown
in official sources. The 'adjusted' figure frrst removes the costs of activities which are not related
to customs con trois for international trade, such as domestic V AT administration and car taxation
which customs administrators undertake - to varying extents - in the countries concerned. The
remaining costs are then adjusted according to a statistical estimate based on the percentage of
international trade undertaken with panner EC countries.
It takes no account of the likelihood that costs of dealing with EEC trade are in general
lower than those for a similar amount of non-EEC trade. Assuming that costs are indeed lower for
EEC trade it follows that the potential savings which should arise from the abolition of customs
barriers will be lower than those shown in 'adjusted' columns.
It is also the case that certain customs officiais believe that feasible reductions in their
function after 1992 are for discussion and do not automatically imply that they will have no role as
far as EC trade is concerned. Taking these matters into account it may be that the savings to be
achieved may lie in the range of 500 to 1,000 million ECU, or 15,000- 30,000 staff, that is to say
between a half and ali the expenditure and staff implied by the 'adjusted' figures.
COSTS TO GOVERNMENTS
Total Adjusted
Staff Costs Staff Costs
ECU ECU
~ millions ~ millions
Belgium 6.4 160 4.7 75
France 21.1 470 12.3 275
German y 8.0 487 4.0 245
Ital y 6.8 240 3.3 115
Netherlands 7.0 220 2.3 67
llK 2hl 660 ~ ill Total 75.4 2,237 31.1 902

- 36 -
22
CUSTOMS RELATED SECTOR
Introduction
As part of our study we were asked to calculate the economie importance of the acùviùes
directly associated with customs inspecùons. Such economie activity includes:
• customs clearance by agents;
• providers of customs and tax advice;
• support services at fronùer points, eg. restaurants, hotels and other services catering for
the drivers arriving and waiting at frontiers.
The scale of this activity is very difficult to assess as formai statistics are not kept of any of
these functions.
Customs agents
There are no reliable statistics on the customs-related sectors. Customs clearance is
increasingly provided as one of the services from diversified forwarding agents and is therefore
difficult to analyse as it forms only part of the firm's turnover. There is no single body
representing all customs agents in any country and the organisations representing freight
forwarders are not subscribed to by ail relevant organisations.
At the beginning of this year the European Federation of National Federations of Freight
forwarders (Clecat) carried out a survey of its Members' views on the expected loss of jobs arising
from the abolition of customs barriers for intra-EEC trade and estimated that 85,000 jobs could be
lost. However, because of differences in the manner in which the questions appear to have been
interpreted and ambiguity over the split between EEC and non-EEC work we have not felt able to
rely on these figures as a means of assessing the scale of economie activity.
In order to assess the scale of agent activity in Member States we have taken the fees paid
to customs and forwarded agents from the main study and have grossed these figures up to provide
an indicative assessment of the scale of this activity and we have:

• - 37 -
23
• calculated the number of consignments moving between member states, using either
publicly available figures or extrapolating from total consignments for ali trade and using
the value of trade for EEC countries;
• calculated the % and number of entries prepared by agents, either using estimates from
official customs statistics (United Kingdom and Belgium) or the% found in our survey;
• taken the average cost per consignment charged by agents in our survey and used this
to compute total charges for the survey countries.
The resulting figures show total revenues of ECU 1,500m. The following points should
be considered:
• the agent percentages, whilst drawn from a random, small sample have been found accurate
when comparing our survey percentage with customs estimates in Belgium and UK;
• it is not straightforward matter to derive a related manpower figure for this activity:
charges for customs clearance are often based on a standard tariff that may be influenced
more by competitive pressures than by the actual cost of preparation;
• the manpower impact will vary depending on the level of diversification and the size of
the organisation.
Organisations engaging in tax advice may have separate departments specialising in the
provision of customs-related advice, but again, no breakdown of these revenues is available.
Whilst there are sorne small specialised fmns providing this advice there is no means of
aggregating their revenues short of a detailed search.
Customs and tax advice
It is very difficult to quantify this activity, as the fmn providing the services tend not to
publish their turnover in a sufficiently detailed fashion and together do not form a recognisable,
measurable economie sector.
Whilst we found customs tax specialists active in sorne countries, for instance, United
Kingdom, in other countries, for example Belgium, much of this work is carried out by the agents
themselves as a means of diversifying activities and providing clients with a more complete

- 38 -
24
service. When advice is provided it tends to be "one off' rather than continuons and we do not
regard it as a major activity area in the context of customs related services as a whole.
Support services
Many frontier points have support services established not only to provide facilities for the
passing haulier or tourist but also for the customs-related fonctions that have given up at these
points. Without a detailed examination of this phenomenon it is difficult to assess the total scale of
activity involved and the extent to which it would be effected by the abolition of customs
formalities. We do not believe this is likely to be a major cost, compared to the cost of Customs
agents.
•

- 39 -
25
ANNEX 1
STRUCTURE OF SAMPLE
Questionnaires* Useful
sent out Replies Imp Exp
Ital y 379 73 38 41
Belgium 211 73 59 46
Netherlands 281 49 35 33
WGennany 310 93 62 63
France 514 101 25 26
UK 316 78 48 39
* After deducting companies approached by telephone who did not want to receive the
questionnaire.

- 41 -
2.
The •cost of Non-Europe•:
An Illustration in the Road Haulage Sector
Ernst & Whinney


The Cost of ''Non Europe'': An illustration in the Road Haulage sector
Executive Summary
November 1987
•• Ernst &Whinney E


- 45 -
COSTS OF 'NON EUROPE': ILLUSTRATIONS IN THE ROAD
HAULAGE SECTOR
EXECUTIVE SUMMARY
SUMMARY OF OVERALL FINDINGS
INTRODUCTION
Background
Terms of reference
Approach
COST OF DELA YS
Data and analysis
lnte~retationofjinGUngs
COST OF EMPTY JOURNEYS
Introduction
Data and analysis
I nte~retation of jinGUngs
INDEX


- 47 -
1
SUMMARY OF OVERALL FINDINGS
Our study was initiated to provide:
• an estimate of the costs borne by road hauliers as a result of customs formalities at
border and inland clearance sites;
• an indication of the cost of empty road joumeys and the reported views of a small sample
of road hauliers re garding the impact on these costs arising from:
lifting restrictions on cabotage;
removing quantitative limitations on permit availability.
The findings discussed below are subject to a range of assumptions and limitations
imposed by the size of the sample. Our findings indicate that the total cost of delay is between
415-830 million ECU.

- 48 -
2
INTRODUCTION
Background
The completion of the internai market will have a profound impact on the road haulage
industry which represents the prime means of transporting goods between Member States.
Indeed, in sorne quarters this impact is already being felt.
In the current regime road vehicles are subject to delays either at frontiers or at inland
clearance sites brought about by the presence of import and export formalities. Whilst the extent of
these delays differs between Member States and indeed between frontier points, the existence of
the delay imposes an additional cost on the haulage operator and thereby on the priee of these
services to importers and exporters.
The Cockfield White Paper foresees a market in which the passage of vehicles and thereby
goods is unhindered by the need to comply with documentary and physical control obligations,
resulting in the faster and more predictable movement of cargoes.
The free movement and operation of road vehicles throughout the Community is restricted
by a variety of measures, which include:
• the quota system, which requires hauliers to apply for quantitatively restricted permits in
order to move goods to, from and across Member States;
• the restrictions over non-resident hautiers carrying out a collection and delivery within the
boundaries of a Member State ("cabotage").
The presence of these regulations bas created an environment in which free competition
does not exist, and again, although the extent of these restrictions varies greatly between Member
States, this bas inevitably influenced the operating efficiency of international road hauliers within
the Community.
As a consequence of the Treaty of Rome, a common transport policy and an internai market
are envisaged, in which:
• limitations on the number of permits are replaced by qualitative criteria relating to the
credentials of the haulier concerned;

- 49 -
3
• cabotage is allowed, thereby enabling non resident hauliers to collect and deliver loads
within the boundaries of a Member State, in order to supplement the revenue
earned for the vehicle round-trip.
Terms of reference
Our study was initiated to provide an indication of the impact of these restrictions on road
haulage operators, in conjunction with our survey, "Costs of Non Europe: Customs Barriers".
The work undertaken for the Commission is split into two distinct although related parts as
follows:
• an assessment of the cost of delay experienced by hauliers in the movement of goods
between Member States as a result of customs formalities;
• a preliminary evaluation of the cost of empty movements borne by the hauliers in the
sample and of their views on the impact that the Commission's proposais will have.
Approach
The study was to comprise "own account" operators from the sample of fmns surveyed in
the customs study and additional "hire and reward" hauliers from the following Member States:
• France;
• Belgium, Luxembourg and Netherlands (Benelux);
• West Germany;
• Italy;
• United Kingdom.
Our sample was to include small haulage businesses as well as the major international
operators and was aimed at hautiers involved in Community trade. Contact was also made with the
appropriate trade associations in each Member State. The data received is described in subsequent
sections of this report.
Following completion of the questionnaire, participants were interviewed in order to
validate the data received. Following our analysis of the data we held discussions with certain
experts in the road haulage industry.

- 50 -
4
Severa! difficulties were encountered in obtaining the desired leve! of support from road
hauliers. These included the following:
• many of the fmns we approached did not keep statistics in the form required to complete
our questionnaire: this was particularly true of the smaller enterprises;
• the amount of information required to satisfy our needs for both dela ys and empty moves
was felt by sorne fmns to be excessive, particularly if additional analysis was needed to
extract data from existing reports and files;
• sorne fmns were unwilling to provide data concerning empty loadings as this was deemed
to be extremely sensitive, in spite of our assurances regarding confidentiality: this was
particularly the case in West Germany where it was felt that releasing such data could put
hauliers at a competitive disadvantage.
Additional problems were also caused by lack of publicly available data in standard,
consistent formats. This situation was referred to in the International Road Union report of late
1985, in which is described, "the considerable difficulties encountered whenever comparisons are
drawn in the sphere of statistics, and more especially in that relating to the transportation of goods
and passengers by road".
The sample size of this outline study is small when considered in the context of the size of
the road haulage community in each Member State. Our sample of 68 hire and reward operators is
drawn from over 283,000 hauliers in the six Member States surveyed. Care has been exercised in
drawing global conclusions from our results without frrst considering the appropriateness of the
sample and we have therefore adopted a policy of explicitly presenting our assumptions and the
influences that may affect the figures shown.

- 51 -
5
Size and structure of sample: Number of fmns in sample classified by number of vehicles
Hir~ & Reward Own Account
Number of Vehicles 1-5 6-10 11+ 1-5 6-10 11+ Total
Belgium 1 10 4 2 1 18
France 3 6 10 19
West Germany 1 3 4
Ital y 1 3 3 2 9
Netherlands 2 2 5 3 2 14
UK _.1 _.1 16 - - - 21 - - -
9 10 49 10 2 5 85

- 52 -
6
COST OF DELAYS
Data and analysis
Data required
In order to assess the cost of delay hau1iers were asked to provide details of:
• time spent on typical transactions in export, transit and importing countries: hauliers
were asked to include in their estimates all the formalities that are completed inland and at
frontiers;
• vehicle and driver costs;
• the causes of delay;
• the extent to which hauliers estimate that charges would be reduced if customs formalities
were abolished.
Delay costs have been combined for both hire and reward and own account traffic.
Cost of delays
In order to assess the cost of delays it is necessary to reflect the two major types of cost
arising namely, driver costs and opportunity costs relating to the vehicle utilisation, and to then
derive a basis upon which an hourly rate for these costs can be calculated. We describe our
approach to these below.
Having calculated the average delay time on each route, irrespective of haulier nationality,
an average annual driver cost was established (26,500 ECU) and an hourly rate was computed
based on 214 working days per year (allowing for holidays and sickness) and a maximum nine
hour working day.
To provide a global figure for all road transport between the countries surveyed, the total
number of journeys was needed. In order to assess the total number of journeys made and thereby
calcu1ate the total cost of empty movements between Member States, we have assumed a typical
load of 12.5 tonnes of cargo per road vehicle. A major Europe-wide haulier uses this figure as

- 53 -
7
supplied by Customs statistics for Community trade in its management information and it has been
used here in the absence of any other verifiable figures.
It was decided to include the opportunity cost associated with the under-utilisation of the
vehicle, for although the dela ys were only measured in hours, the wasted rime nevertheless relates
to an unused asset which over time could be better used. However, the data collected in our
survey relates to vehicle running cost rather than the fixed annual costs, from which opportunity
costs can be calculated. These costs are:
• depreciation;
• financing cost;
• insurance;
• vehicle tax •
A recent study entitled, "Freight Transport in the European Community" showed that,
coincidentally, annual driver costs and fixed vehicle costs represent very similar percentages of the
total annual operating cost, namely 22-34% and 23-30% respective! y. As the total operating costs
from our survey were similar to those in this study, we have used the driver-related cost from our
sample as a substitute for the annual vehicle operating cost. To derive an houri y vehicle delay cost
rate, we have assumed that the vehicle will be 95% available, 24 hours a day for 365 days a year.
This figure has been verified by an international haulier. The resultant hourly rate is theo applied to
the custom delay.
1 nterpretation of findings
Using this approach the total delay-related cost is calculated as ECU 780 million for the six
countries surveyed. If similar delays and costs are found in the remaining Member States, which
represent 6% of the total road haulage tonnage, then a globalised figure would be ECU 830m.
This figure is however subject to certain distortions, as follows:
• the computation of hourly cost saved is based on an effective nine-hour working day;
this is a regulatory maximum and the actual working day is likely to be lower, thus
increasing the hourly rate and cost;
• the computation assumes that the time spent in delay could otherwise be effective! y used;
this may not al ways be the case, as legitimate rest periods may be timed to coïncide with

- 54 -
8
known customs delay points: this in itself is not al ways possible to achieve, due to the
regulations on driving and rest hours;
• the dela ys include those incurred by unaccompanied trailers for which the driver-related
costs do not apply;
• the assumption is made that work can be found for the driver and the vehicle: this will not
al ways be the case.
Given that there are a number of influences that will tend to reduce the overall potential
savings the cost estimate above must be treated with caution and therefore as an upper limit. We
suggest that a lower limit should be established at 50% of this figure, providing a globalised range
of 415-830 million ECU.
P erceived ejfect of abolition
ln our survey we asked hauliers to estimate the effect that the abolition of customs
formalities would have on their costs and the extent to which clients would benefit from this. It
should be noted here that in many cases the hauliers will be operating for forwarding agents and
therefore the net benefit will not automatically be passed onto the importers and exporters.
The majority of hauliers stated that although their costs would be reduced, they did not
believe that this would result in a similar reduction in their charges to clients. Most hauliers we
spoke to regard rating structures as highly competitive at present and will take opportunities
wherever possible to boost short-term profitability. Traders with own account operations will
benefit more directly from the reductions in operating costs. In overall terms, the net effect for
users of road haulage services will be largely influenced by the more competitive market envisaged
by the Commission which should ensure that in the long-term these users will benefit.

- 55 -
9
COST OF EMPTY MOVEMENTS
Introduction
The countries included in this survey were those chosen for the customs formaliùes study,
and whilst these countries generate over 90% of the cargo tonnage moving by road within the
Community, it cannot be assumed that the data collected and views reported from the surveyed
countries are idenùcal to those in the other Member States, namely Greece, Eire, Denmark,
Luxembourg, Spain and Portugal. Indeed, the excluded States include a number of the poorer
naùons with lower operaùng costs as weil as those on the geographie periphery of the Community.
As a result, there are likely to be specifie issues and problems relating to these countries that differ
markedly from the pattern established in our survey countries. This should be borne in mind when
our survey results are viewed in global context.
Data and analysis
Data required
In order to assess the cost of empty joumeys hauliers were asked to provide details of:
• the number of loaded and empty journeys to and from Member States and the distances
and times involved;
• vehicles and driver costs;
• causes of empty movements.
Cost of empty journeys
Our sample was small, and as a result, unlikely to be representaùve of road haulage across
the Community as a whole and it was therefore decided that the data collected should not be used
for global analysis, but should rather be viewed in the context of the sample itself. In order to do
this, the following approach was used:
• establishing an average annual cost for both driver and vehicle based on the average ùme
and length of the empty joumeys: these were esùmated averages for each country as
data was not available from each individual firm;

- 56 -
10
• estimating the net operating cost for each haulier as 90% of the stated turnover assuming
a 10% gross margin;
• assessing the percentage that the average cost of empty journeys represents of the total net
operating cost for each haulier: the results are presented for each country by vehicle fleet
size, separating hire and reward and own account operations.
The results are summarised below.
Cost of empties as % of net operating cost Cali countries)
No of vehicles
Hire & Reward OwnAccount
Cost% 1-5 6-10 11+ 1-5 6-10 11+
Incomplete data
(Turnover or empty
moves) 3 4 11 8 1 5
No empty moves 3 3 19 1
Below 1 1 5 1
1-5 1 2 7
5- 10
Over 10 2 7 1
The picture presented in the table above is broadly similar for each of the countries
concerned. The majority of positive observations occur in the 1 - 5% range which, although small
as a share of costs, may be significant in relation to profits and could result in a sizeable profit
increase if the revenue earning potential can be realised. Of the 32 firms whose responses could
not be used in this analysis over half did not provide turnover data. Just under half of the
companies with no empty journeys were from the UK for whom the round trip was only profitable
if loads could be found in each direction. This is due to the downward pressure on rates on the
outward leg arising from substantial competition from other Community hautiers. Although the

- 57 -
11
main beneficiaries appear to be the larger organisations this simply reflects the structure of our
sample. From our analysis hauliers of ali sizes will benefit, as our survey sample shows that the
smaller operators do not have a materially different loaded to empty ratio than the larger hauliers.
Reported causes of empty journeys
Hauliers were asked to rank the possible reasons for empty moves as:
• most important;
• significant;
• not important
The options provided were:
• awareness of loads;
• cabotage;
• permit availability;
• unprofitability;
• incompatibility;
• customer creditworthiness;
• other.
In analysing. the responses to the questionnaire, we have identified the number of
incidences of each reason specified as "most important" and "significant". The table below
summarises these results.
Incidence of "mQSt im12ortant" and "significant" reason~ for hire and reward hauliers
Incidences as Incidences as
"mQst important" % Position "Significant" % Position
Awareness 72 49 1 19 16 4
U nprofitable 33 23 2 27 19 3 Cabotage 19 13 3 11 8 6 Incompatible 13 9 4 31 22 2
Permits 8 5 5 13 9 5
Other 1 1 6 10 7 7 Customer
creditworthiness 0 0 7 32 22 1

- 58 -
12
For most countries observed and for all haulier nationalities operating to and from these
countries, awareness of cargo and unprofitability are the most commonly mentioned "most
important" reasons. Permit shortages were most often reported in Italy where this reason was placed
third. Cabotage was in third place for every country except Ital y.
The main findings in respect of the causes of empty moves stated by fmns in this sample
can be summarised as follows:
• the key concern of the majority of hauliers was the awareness and availability of loads,
although most used automated means to locate cargo, usually telex;
• the lack of multi-lateral permits is not seen as a cause of empty movements and although
the lack of permits restricts cross-trade opportunities, cross-trading itself is still not
regarded by most of the sample hauliers as a weil developed opportunity area;
• cabotage was viewed as a potentially significant means of reducing empty trips.
It was not within the remit of the study to calculate the net benefits that would accrue from
liberalisation, but rather to identify the cost of empty moves that liberalisation is intended to reduce.
It is clear that, whilst there is a potential cost saving there are also factors which could reduce this
potential.
Interpretation of findings
Introduction
It is important to distinguish between the findings arising from the views expressed to us
by our survey sample and our interpretation of these views in relation to liberalisation. In order to
form a basis for the views expressed in this section we have used input from:
• industry experts;
• previous reports;
• studies from the USA relating to the impact of de-regulation.
In our survey the focus has been on assessing the number of empty journeys as a means of
providing a measure of "wasted capacity". However, this measure needs to be interpreted with
caution because of the following factors:

- 59 -
•
•
•
•
13
the imbalance of each country's imports and exports compatible for carriage by road;
the natural imbalances of import and export road traffic arising from the use of
specialised equipment to carry particular cargoes for example, refrigerated and liquid loads;
the under-utilised capacity represented by part-loaded lorries;
the extent of oversupply of vehicle capacity in the international road haulage market: this
is evidenced by the presence of empty loads and the differentiai that exists between inter
national haulage rates and those for domestic journeys of equivalent distance.
In addition, any assessment of the effects of liberalisation should take into account the tendency of
operators to improve productivity as rates become more competitive.
Permit availability
The questionnaire was designed to assess the extent to which the shortage of multi-lateral
permits causes empty moves, as without such permits the option of cross-trading is precluded.
The availability of bilateral permits is not an issue here as these cover a return journey and cannot
therefore be said to cause empty movements. It could be argued however, that this does reduce the
effective utilisation of capacity if equipment is unused because of a bilateral permit shortage.
Whilst our study did not fmd that permit restrictions were believed to be a significant cause
of empty moves, there was sorne suggestion that sorne permits are in short supply, particularly
those for multi-lateral purposes. The "Freight Transport" report to which we referred earlier found
evidence of a "black market" in permits in the United Kingdom leading to "a Joss of priee
competitiveness for the UK operator compared with foreign hauliers who can secure permits
through official channels". The study concludes however that "the problem of permit shortage is a
diminishing one", and that "80 percent of UK international hauliers considered the problem to be
Jess severe than it was 3 years ago". Given that the number of permits available is planned to
increase annually this seems a reasonable conclusion.
ln assessing the importance placed upon the lack of mutli-lateral permits it is instructive to
consider the extent to which cross-trading is currently undertaken, using statistics from a recent
Commission report.
- 60 -
14
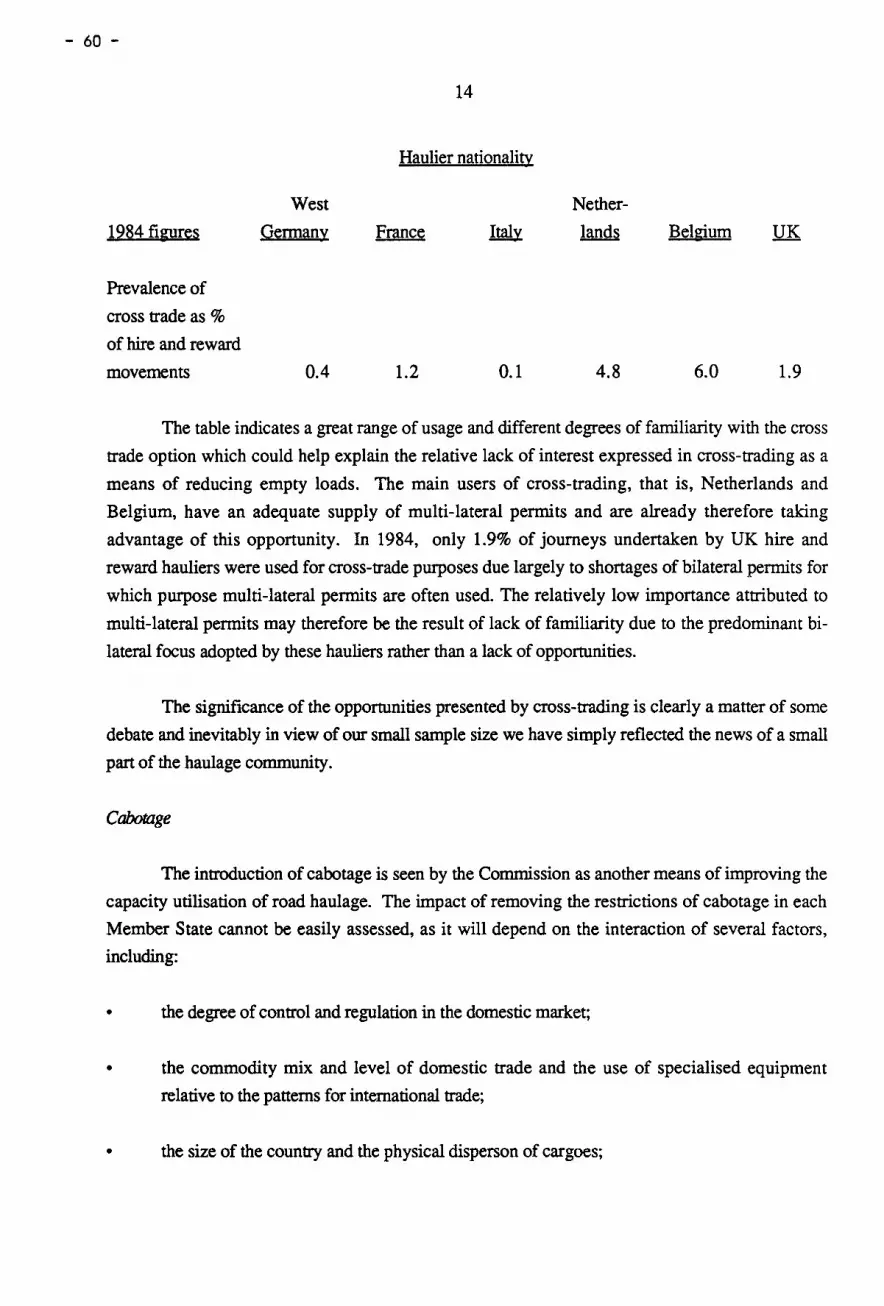
Haulier nationality
West Nether-
1984 figures German y France Ital y lands Belgium UK
Prevalence of
cross trade as %
of hire and reward
movements 0.4 1.2 0.1 4.8 6.0 1.9
The table indicates a great range of usage and different degrees of familiarity with the cross
trade option which could help explain the relative lack of interest expressed in cross-trading as a
means of reducing empty loads. The main users of cross-trading, that is, Netherlands and
Belgium, have an adequate supply of multi-lateral permits and are already therefore taking
advantage of this opportunity. In 1984, only 1.9% of journeys undertaken by UK hire and
reward hauliers were used for cross-trade purposes due largely to shortages of bilateral permits for
which purpose multi-lateral permits are often used. The relatively low importance attributed to
multi-lateral permits may therefore be the result of lack of familiarity due to the predominant bi
lateral focus adopted by these hautiers rather than a lack of opportunities.
The significance of the opportunities presented by cross-trading is clearly a matter of sorne
debate and inevitably in view of our small sample size we have simply reflected the news of a small
part of the haulage community.
Cabotage
The introduction of cabotage is seen by the Commission as another means of improving the
capacity utilisation of road haulage. The impact of removing the restrictions of cabotage in each
Member State cannot be easily assessed, as it will depend on the interaction of severa! factors,
including:
• the degree of control and regulation in the domestic market;
• the commodity mix and level of domestic trade and the use of specialised equipment
relative to the patterns for international trade;
• the size of the country and the physical disperson of cargoes;

- 61 -
15
• the prevalence of freight forwarders who are reported to be less nationalistic is selecting
road haulage services.
Large countries with tightly regulated domestic haulage market and high domestic rates, for
example, France and German y see themselves as being particularly vulnerable. However, in each
country diverse views have been expressed, emphasising the subjectivity of the topic. The
"Freight Transport" report (quoted above) estimated that, under liberalised cabotage, 1% of the UK
domestic market was under threat. At the same rime a press report declared that the UK would be
"swamped" with European operators.
In our survey we found that whilst the operators in Northern Europe are worried about the
influx of low cost operators from Southern Europe, the Southern European operators are
concerned about the inroads that the highly efficient Northern European hauliers will make.
Clearly this is a complex and emotive issue and one that is beyond the scope of this study to
address comprehensively.
Comparison with USA
One of the difficulties in quantifying the effects of a liberalised road haulage market is the
absence of precedent, as, for example, ali Member States restrict cabotage. For this reason we
have made comparisons with the road haulage market and industry in the USA which until 1980
was characterised by high transport rates and state-based restrictive practices.
In 1980 the Motor Carrier Reform Act enabled:
• trucking companies to raise or lower rates by ten per cent without lnterstate Commerce
Commission approval;
• easing of entry barriers;
• reduction of the level of operating restrictions;
• abolition of collective rate fixing.
There are severa! key differences between the operating frameworks in USA and the
Community, which must be borne in mind. For example, in the USA:
• no authority is required for interstate bilateral or cross-trade movements, whereas there is a
permit system in the Community;

- 62 -
16
• there are differences between states in the levels of taxation and vehicle weights, but these
do not distort the relative operating costs of hauliers from different states to the same
extent as in the Community;
• there are no currency differences between states.
Given that the USA does not reflect the same level of complexity and competitive distortion
as that which exists in the Community, it nevertheless represents a market in which competition
has been increased. Intrastate barriers to entry still exist in 43 states, the equivalent of cabotage
restrictions, and this provides the opportunity to observe the relative performance of operations in
both regulated and de-regulated environments.
There have been a number of studies undertaken in recent years, including sorne by Ernst
& Whinney, to quantify the effect of de-regulation in the USA. These studies have sought to
establish the extent to which operational efficiency has been increased and to identify the potential
benefit yet to be derived. Sorne statistics are instructive:
• during 1960-80 expenditures of manufacturers and distributors on freight transportation
averaged 8% of GNP, whereas in 1986 this had fallen to 6.8%;
• between 1960-80 truck ton miles had an annual compound growth rate of 10.7%: since
1980 truck ton miles have grown at the same rate as GNP, that is 3.2% per annum, thereby
indicating an increase in carriage effciency.
Several important trends are emerging, and although they cannet all be ascribed to
deregulation because of the parallel effects of the depression, it appears that there are sorne positive
indicators of relevance to the Community. These include the following:
• competition has reduced freight rates and brought an improved level and choice of service
in most cases;
• whilst there have been a large number of bankruptcies spread across ail sizes of company,
the total number of carriers has increased;
• small hauliers have survived by occupying niche markets and concentraùng on low invest
ment strategies;

- 63 -
17
• successful haulage frrms have shifted their emphasis from pure operations to marketing,
planning and the need for innovation;
• there is evidence that frrms operating in regulated environments are not necessarily more
profitable than those in more competitive markets because of the higher operating costs that
can prevail in regulated markets;
• a recent study found that the high level of regulation in Texas has lead to:
higher distribution costs;
increased prevalence of own account haulage;
lower carrier productivity;
business lost to other de-regulated states.
Implications for the European Community
Although the USA is not an exact parallel with the European Community there is sufficient
similarity to make the comparison worthwhile. Indeed, sorne of the trends emerging in the USA
can already be seen in the Member States, for example:
• the growth in the importance of multi-modal, multi-service operators providing additional
facilities in the form of warehousing and customs clearance;
• the movement of the large operators into high value-added, capital intensive and specialised
products and services and away from general haulage, typically dominated by the small
owner-operator with low operating costs and a high degree of operational flexibility;
• the increased focus on productivity and efficiency, for example, on the highly competitive
link to and from the UK, unaccompanied trailers account for 50% of the cargo moved: m
this way, driver and tractor utilisation are improved on both sides of the channel;
• the increased demand for computerised freight-broking services, particularly in Northern
Europe.
The market in the Community has already begun to change and there are indications which
suggest that the benefits enjoyed by traders in the USA may begin to accrue here. Further work is
required to confrrm the validity of this comparison and to provide evidence that can assist the
Commission in assessing the impact of the proposed liberalisation measures.


- 65 -
3.
The "Cost of Non-Europe"
in Public Sector Procurement
WS Atkins Management Consultants in association with
Eurequip SA-Roland Berger & Partner-Eurequip Italia


- 67 -
NOVEMBER 1987
THE COST Of NON-EUROPE IN PUBLIC SECTOR PROCURERENT
EXECUTIVE SURRARY
WS ATKINS MANAGEMENT CONSULTANTS Woodcote Grove Ashley Road
Epsom Surrey KT18 SBW in association with
Eurequip SA-Roland Berger & Partner-Eurequip Italia


- 69 -
CONTENTS
1. INTRODUCTION
1.1 Background 1.2 The public sector
2. KEY CONCLUSIONS
2.1 Barriers to trade in public purchasing 2.2 The completion of the internal market 2.3 Savings in public expenditure
3. OVERVIEW OF THE STUDY METHOD
4. THE POTENTIAL FOR SAVINGS
Page
1
l
2
3
3 4
6
8
11
4.1 The institutional framework of the public seêtor 11 4.2 Procurement procedures 12 4.3 Areas of potential savings 13
5. THE VOLUME OF PUBLIC PURCHASING 16
6. SELECTION OF REPRESENTATIVE PRODUCTS 20
7. PRICE COMPARISONS 26
8. CASE STUDIES 33
8.1 Selection of the case studies 33 8.2 Case study method 33 8.3 Characteristics of the case study industries 35 8.4 Priees and economies of scale 36 8.5 Scenarios 38
9. THE COST OF NON-EUROPE IN PUBLIC PROCUREMENT 42

- 70 -
LIST OF TABLES AND FIGURES
Tables
Page
Table 1 Public Sector Import Penetration from EC and Non-EC Sources 4
Table 2 Macroeconomie Importance of Public Sector Purchasing 18
Table 3 Products/Sectors affected by Opening Up Public Procurement 22
Table 4 Potential Static Priee Savings by Product 29
Table 5 Characteristics of the Selected Case Studies 34
Table 6 Case Studies: Market Characteristics, 1986 35
Table 7 Case Studies EC v USA in 1987 36
Table 8 Case Studies Potential Priee Saving 37
Table 9 Case Studies : Restructuring Effects 38
Table 10 Summary of Potential Savings 45
Figures
Figure 1 Breakdown of Public Purchases by Supplying Sector 19

- 71 -
1 • 1 NTRODUCTI ON
1.1 Background
Si nee the i nee pt ion of the European Economi c Commun i ty in 1957,
private sector trade between member states has risen substantially.
However, despite the existence of directives designed ta promote
open tendering and competition, the public sector has not enjoyed
the same level of benefit. Indeed, direct imports represent a very small proportion of public purchasing.
Today, the world is a highly competitive commercial environment.
With the contraction and disappearance of old industries such as
coal, steel, shipbuilding and textiles and the rapid growth of new
industries, such as electronics and biotechnology, European
producers have ta face the joint threats from 1 ar ge sc a 1 e hi gh
technology companies in the USA and Japan and law labour cast manufacturers/assemb lers in the newly i ndustri a 1 ising nations such as Korea, Malaysia and Taiwan.
In certain key industries, for example, telecommunications
equipment, the public sector1
is a major - often dominant -purchaser. Therefore, by not encouraging intra-Community
competition, it is implicitly supporting sub-optimal enterprises, which is reflected in European industry being less competitive in
world markets. In addition, public expenditure is higher than necessary.
Against this background, WS Atkins Management Consultants have
carried out a global assessment of the potential savings in public
expenditure from removing all barriers ta trade in public
purchasing, including: national purchasing practices and

- 72 -2
procedures, standards, border formalities etc. The Consultant•s brief was to quantify the measurable effects: the important dynamic effects are discussed at the end of the report.
1.2 The Public Sector
In this study, the pub 1 i c sec tor i s defi ned to i ne 1 ude centra 1 and local government and its agencies, and also the •non-competitive sector•, that is, those enterprises, whether privately or publicly owned, which are granted a monopoly or concession to provide a public service. Gas distribution, power generation and distribution, railways, airport authorities and the like are therefore included in the estimates of expenditure and savings. On the other hand, publicly owned manufacturing firms, for example, Regie Renault, are excluded.

- 73 -
3
2. KEY CONCLUSIONS
2.1 Barriers to Trade in Public Purchasing
Public purchasing is sometimes used by EC member states as a policy instrument to support national or regional firms or industries, either:
* for strategie reasons (e.g. defence goods, telecommunications aerospace, etc)
* to support employment in declining industries (e.g. shipbuilding)
* to compensate local communities near environmentally damaging public industries (e.g. coal mining, nuclear fuels)
* to support emerging high technology industries (e.g. new telecommunications systems, lasers)
* for more general political reasons (e.g. highly visible goods like cars, tableware).
Public purchasing authorities generally deny that overt nationalistic purchasing policies exist. However, in certain key sectors there i s vi rtua lly no trade between produci ng countries of the Community even though they have extensive trade with other countries, as described in the case studies in Section 8. Sample contract data collected during the study (see Table 1) support the view that the degree of import penetration in public purchases is much lower than for the economy as a whole. This may be an underestimate since purchasers do not always know whether contracts let with national suppliers include the supply of imported goods.

- 74 -
TABLE 1 - PUBLIC SECTOR IMPORT PENETRATION FROM EC AND NON-EC SOURCES (percent)
Belgium France Germany Ital y UK
4
National import 1 penetration (1) 1 43 20 22 19 22
1 Apparent public 1 sector import 1 penetration (2) 1 21 16 12 1 4
1 Public purchases froml foreign suppliers (3)1 2.6 1.6 3.8 0.3 0.4
1
Sources: (1) ESA National accounts 1985, ( 2) and (3) At ki ns sample contract database
Definitions: (1) Imports/(national production+ imports) (2) Purchases reported to be of foreign origin/total
pure hases (tot a 1 purchases i ne 1 ude tho se of unreported origin)
(3) Value of contracts with foreign suppliers/total value of contracts (includes contracts with unreported suppliers)
2.2 The Completion of the Internal Market
The consequence of closed and protective public purchasing is that in certain key high technology supplying sectors - notably capital equipment for defence, power generation, telecommunications and railways - a symbiotic relationship builds up between suppliers and purchasers. This has enabled a situation to persist in which:
* there are widely differing national design standards, for example in railways and power generation. This also creates a barrier to the trade in the goods and services supplied by the public sector, with widespread repercussions on transport and communications, and hence on the efficiency of European business
* Governments attempt to enforce competition between alternative national suppliers (e.g. GEC and Plessey, or the three German locomotive manufacturers) which di rectly leads to suboptima 1

- 75 -
5
size of plants, and to Government support for inefficient firms which would otherwise have to improve performance or go out of business
* markets are distorted by Government subsidies, R&D support and artificially high priees
* R&D effort is duplicated, dispersed and suboptimal
* there is little incentive to invest in new technology to confront the competition from non-EC firms
* firms have shortsighted marketing and production strategies. In key sectors such as computers, aerospace, telecommunications and vehicles, US and Japanese firms, as well as non-EC firms, are making increasing inroads into the EC market by adopting European marketing strategies while EC firms shelter behind their national public sector customers and look outward only towards declining third world markets
* there is a lack of product specialisation, so that even large EC firms have uneconomically wide product ranges and short production runs.
Unless the restrictions on public purchasing are swept away, it is the Consultants' view that, far from strategie industries being protected, whole areas of industry which have high multiplier effects on other sectors of manufacturing could cease to be viable.
In most of the key industrial sectors the largest world firms are generally US or Japanese. Yet the EC's larger number of firms adds nothing to the degree of competition in EC states, because of the protectiveness of European national markets.
Completion of the internal market, as far as public purchasing is concerned, means:

- 76 -6
* making public purchasing procedures transparent, and open ta all qualified suppliers
* doing away with unnecessary differences in engineering standards and design specifications which confuse third country customers as well as making intra EC trade difficult
* viewing competition policy on an EC wide basis, permitting bath national and transnational mergers sa that world-league EC firms can be built.
Although the completion of the internal market will lead ta increased intra-Conmunity trade and a reduction in priees of sorne products, the bulk of producers in a given country will experience no significant direct impact, because:
* in most sectors public purchasing only represents a small proportion of gross output
* the restructuring effects will be limited ta certain key industries, for example, telecommunications equipment
* local purchasing will still continue for a wide range of products
* as in the private sector, not all priee competitive producers will take advantage of the export opportunities in the public sectors of ether Community countries.
2.3 Savings in Public Expenditure
The analysis and estimates described in Section 9 indicate potential savings in annual public expenditure of sorne 8 ta 19 billion ecus, made up of:
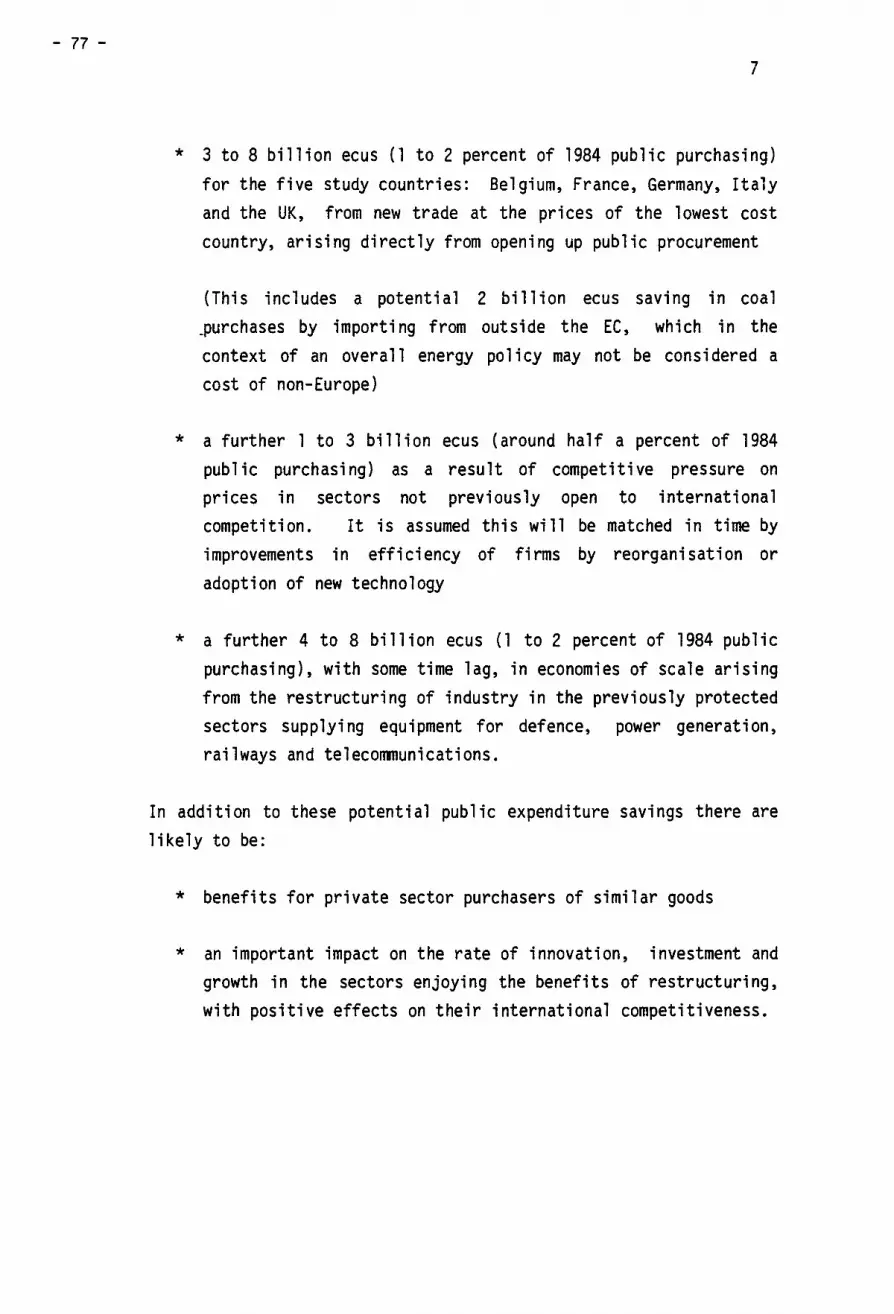
- 77 -7
* 3 to 8 billion ecus (1 to 2 percent of 1984 public purchasing) for the five study countries: Belgium, France, Germany, Italy and the UK, from new trade at the priees of the lowest cost country, arising directly from opening up public procurement
(This includes a potential 2 billion ecus saving in coal _purchases by imparti ng from out si de the EC, which in the context of an ove ra 11 energy po 1 i cy may not be con si dered a cost of non-Europe)
* a further l to 3 billion ecus (around half a percent of 1984 public purchasing) as a result of competitive pressure on priees in sectors not previously open to international competition. It is assumed this will be matched in time by improvements in efficiency of firms by reorganisation or adoption of new technology
* a further 4 to 8 billion ecus (1 to 2 percent of 1984 public purchasing), with sorne time lag, in economies of scale arising from the restructuring of industry in the previously protected sectors supplying equipment for defence, power generation, railways and telecommunications.
In addition to these potential public expenditure savings there are likely to be:
* benefits for private sector purchasers of similar goods
* an important impact on the rate of innovation, investment and growth in the sectors enjoying the benefits of restructuring, with positive effects on their international competitiveness.

- 78 -8
3. OVERVIEW OF THE STUDY METHOD
The study has been carried out in two parts:
* Part I, a study of the present public purchasing environment, which included three main streams of research:
institutional aspects of the purchasing entities and their purchasing procedures, in the EC and USA
- data on tot a 1 vo 1 urnes of pure has i ng and its breakdown by purchasing entity and product group compilation and analysis of an extensive database covering detailed information on a sample of over 4,000 contracts in the five study countries.
The results of this research were presented in the Part I report.
The compilation of data was made difficult by the reluctance of sorne purchasing authorities to participate, and by the lack of detailed records or data on purchasing in most authorities. In one country the current legislation precluded the provision of all the information requested on contracts, particularly priee information and data on suppliers
* Part II, an evaluation of the cast of non-Europe in public procurement. This part investigated existing priee differences and the potential for future cast savings through industrial restructuring, in a representative sample of products purchased by the public sector. The products include:

- 79 -9
- a • priee effect 1 i st •, of products for which the re were thought to be possible restrictions on trade and priee differences between countries
- a •case study list•, of products predominantly purchased by or for the public sector, for which there was thought to be strongly nationalistic purchasing, and potential for significant economies from industry restructuring.
From this analysis, the potential savings in public expenditure have been estimated in terms of:
* the static trade effect - by buying from the cheapest supplying country at present priees
* the competition effect - reduction in priees from national producers who are faced with foreign competition for the first time. It is assumed that these priee reductions can be met by
• reduction in real production costs, by investment in new technology or by eliminating •x-inefficiency•
* the restructuring effect - the long run saving ar1s1ng from economies of scale, including shared R&D and distribution costs, following industry restructuring in certain key sectors dominated by public sector purchasing.
The following sections describe the analysis, assumptions and findings in more depth. They caver:
* the institutional constraints and opportunities for saving (Section 4)
* the derivation of da~a on the size and breakdown of total public purchasing (Section 5)
* the selection of products for detailed study of priee differences and economies of scale (Section 6)

- 80 -
10
* the methodology and findings on static priee savings (Section 7)
* the case studies on economies of scale (Section 8)
* the aggregation of findings and analysis of total potential
savings (Section 9).
- 81 -
11
4. THE POTENTIAL FOR SAVINGS
4.1 The Institutional Framework of the Public Sector
The five countries studied have quite different institutional and legal frameworks for public purchasing.
Firstly, there are important differences between the study countries in the extent and legal form of public ownership, and hence in the degree of public control over purchasing in key sectors like transport, telecommunications, and energy.
Secondly, there are also differences in the level of decentralisation of purchasing decisions. Where purchasing is highly decentralised, contracts are generally small and of little interest to foreign suppliers except in border areas. Decentralised purchasers also have few resources to handle international tendering (if this involves evaluation of complex bids or quality assurance of foreign firms}. In all countries, defence, railways and posts and telecommunications, which together make up 20 to 35 percent of public purchasing, depending on the country, are fairly centralised, whereas local government purchasing (15 to 40 percent of the total} is highly decentralised. For the rest, which includes electricity, gas, water, health, roads and other transport, purchasing is highly decentralised in Germany and Italy, and much less so in the other countries, particularly the UK.
Thirdly, there are differences in the traditional regulatory framework for public purchasing into which the current and proposed EC legislation is inserted. In France, there is a rigid legal code and central control over a widely defined concept of 'marches publics•. Less rigid systems apply in Belgium, Italy and Germany, while the UK traditionally has no central system of regulations.

- 82 -
12
4.2 Procurement Procedures
The EC Directives on public purchasing have been in force since 1971 (for works contracts) and 1977 (for su pp 1 i es). The se enforce transparency in tendering procedures by, amongst other provisions, requiring publication of calls for tender to a standard format in the Official Journal of the European Communities (OJEC); limiting the use of negotiated (i.e. non-competitive) tendering procedures and of brand names or restrictive specifications.
Des pite the existe nee of the se procedures, the re has so far been very little effective opening up of public procurement. This is true for all sectors, and particularly so for the purchasing sectors where there is really nationalistic purchasing for strategie reasons, and where there are large specialist contracts of interest to foreign suppliers. These have up to now been excluded from coverage by the directives. They are:
* energy
* transport
* telecommunications
* drinking water supply.
In addition, certain categories of defence contracts, particularly those involving special security measures or state security, are also excluded. This study has shawn that in these excluded sectors there are very large potential gains from opening up the markets.
The purchasing authorities which do comply at present (including ministries, local authorities and health authorities) tend to have a lot of small contracts, and purchases of relatively common supplies and works which could be purchased from local importers or locally established representatives or subsidiaries of foreign firms. Such authorities have not seen much benefit in terms of direct bids from

- 83 -
13
foreign suppliers. Sorne purchasing officers view the directives as an irritant and waste resource trying to evade them. It is likely, however, that implementation of the directives has improved national firms' awareness of public sector opportunities, by increasing the extent of open tendering, and so led to saving in public purchasing even where trade has not increased. As new legislation takes effect, the benefits must increase.
In the past, legislation on procurement has not had much direct effect on trade because:
* the re are too many ways to ev ade the ru 1 es or i nf 1 uence the choice of supplier during bid evaluation
* the other barriers to trade which permit priee differences sti 11 exi st
* purchasers perceive that th~ir resources do not permit costly active sourcing and evaluation of international bids for low value contracts (although the thresholds set by the Directives are such that if foreign suppliers respond, the potential benefits ought to justify the additional cost)
* suppliers sometimes either do not want to export, are limited by marketing agreements or exclusive dealerships, do not want to enter into competitive bidding, or do not believe the call for tender is serious, so international tendering is unproductive.
It is hoped that by 1992 this situation will have changed.
4.3 Areas of Potential Savings
Although central purchasing agencies and large public enterprises which practi ce competitive tenderi ng are sometimes very effective, resources for public procurement in many authorities are often insufficient. Purchasing is sometimes inefficient, complacent and

- 84 -14
open to corruption, particularly at the local level. The re i s clearly an argument for improving control and transparency in public purchasi ng in the i nterest of consumers and taxpayers. Benefits would come from improved purchasing within a country or region, not just by increased trade, and in many cases local suppliers would be forced to meet import priees.
The study has shawn that for most of the products considered there are large potential savings for sorne countries by buying from foreign suppliers. The fact that priee differences exist, indicates either that there are other barriers to trade (including lack of knowledge), or the products concerned are not really comparable. If it is the latter then sorne of the potential gains from trade would be overestimated. It should also be noted that except for centralised purchasing agencies which have enormous market power and act commercially, public purchasers are unlikely to be better traders than commercial trading companies; there would not be many significant savings from cross-border trade on products which are a 1 ready free ly t raded by the priva te sector. The 1 ar ge pri ce differences identified in the study suggest, however, that many products are not freely traded and there are very significant restrictions on private sector trade, so a few large cross-border public contracts could have a powerful knock-on effect on bath purchasers and suppliers by, in particular, breaking restrictive trade practices.
A special situation exists in the case studies and similar products where the public sector is the main purchaser, contracts are large and there are few suppliers. Public purchasing in these sectors has in the past been used to maintain an indigenous capabi 1 ity for strategie reasons, and also at the same time to be an organ of anti-trust policy, to maintain more than one supplier. This had led to a si tu at ion in many sec tors where the re i s vi rtua lly no trade between EC producers. Railway, power generation and telecommunications equipment are prime examples. Consequently there is overcapacity, too many firms, duplication of R&D and marketing efforts, and suboptimal scale of production. In sorne of these

- 85 -
15
sectors (power generation equipment, railway locomotives, telecommunications equipment) technology changes and the threat from new 1 ow cast producers have now made fi rms· want to merge, rationalise and invest in new technology. Wider public procurement is essential to permit this; without it, protectionist countries will be left with no viable producer.
Where potenti a 1 benefits from trade and restructuri ng have been identified, these may be a result of a combination of:
* changes in public procurement procedures
* changes in Member States• protection and competition policy
* other changes in the Internal Market (e.g. freedom to create pan-European companies and harmonisation of standards)
* changes in technology (e.g. the development of TGVs in France) which give one firm an advantage and help to break up cartel arrangements.
There is possibly a danger of double counting the benefits. What this study has measured is the total benefit of the internal market, in terms of savings in public expenditure (but without taking account of the benefits to private sector purchasers caused by more competition in the public sector). Public purchasing legislation alone may not achieve these benefits without other elements of the internal market programme being implemented, and without changes in suppliers• attitudes and strategies.

- 86 -
16
5. THE VOLUME OF PUBLIC PURCHASING
In arder ta estimate the potential benefits of the internal market on public purchasing, data have been collected on the volume and pattern of purchases.
Three different concepts, which can be applied ta any entity or group of entities, need ta be distinguished:
* total expenditure, which includes wages and salaries, other employment costs, financial charges, and transfers ta other individuals or authorities (e.g. grants, subsidies, etc) as well as purchasing
* total purchasing, which includes all payments for goods and services from third parties. For government (excluding public enterprises) this is typically 10 ta 20 percent of government expenditure
* contract procurement, defined for this study as that portion of total purchasing which is made after tendering or negotiating a formal written contract with a limited term of validity and which theoretically could have been open ta competition. This excludes a substantial portion of total purchases which are either:
non-competitive or non-tradable services or products such as gas and electricity, rents of buildings, post and teleconmunications and administrative expenses. The data suggest that this is around 15-25 percent of total purchasing

- 87 -
17
- sma 11 pure hases or other pure hases not subject to forma 1 contract procedures. From limited evidence in France and the UK these appear to make up around 20-30 percent of total purchasing (but this may be partly due to underreporting of contracts).
Table 2 shows the macroeconomie importance of public purchasing. In 1984, it totalled 384 billion ecus in the five study countries, which indicates a total of about 440 billion ecus for the 12 member states. This is equivalent to 15 percent of GDP.
Total contract procurement (total purchasing less the above elements) is estimated at between 170 and 250 billion ecus in 1984 (200 to 280 billion ecus for the 12 member states), equal to between 6 and 10 percent of GDP.
The figures in Table 2 need to be treated with caution. The data have been compiled from a variety of sources, including Eurostat ESA National Accounts, Member States' national accounts, contract data compiled by Ministries and local government representative bodies, company accounts and the Consultants' own estimates. The values for contract procurement are approximate, a centra 1 record of pub 1 i c contracts high degree of under-reporting.
because only France maintains let, and this suffers from a Belgium has a more limited
database, which does not include local government.
Data on the breakdown of total purchases by product group have been obtained from manipulation of the input-output tables for 1980, adjusted to 1984 levels of purchasing. At the one digit level the breakdown is shawn in Figure 1.

- 88 -
18
TABLE 2 - MACROECONOMie IMPORTANCE OF PUBLIC SECTOR PURCHASING (Billion units national currency, 1984)
Belgium 1 France German y Italy UK Total BF 1 FF DM Lit UKL ecu
1
GDP 1 4,402 4,282 1 '754 720,682 319 2,566 1
Total expenditure: 1 Government 1 2,599 2,048 788 336,515 137 1 '183
1 Total public 1 purchasing: 1
Government 1 288 369 131 60,215 38 227 Public enterprises 1 480 235 77 34,226 32 157 Total PP 1 768 604 208 94,441 70 384
1 Government purchasing/1 expenditure 1 11.0% 18.0% 17.0% 18.0% 28.0% 19.0%
1 Total PP as % GDP 1 17.5% 14.1% 11.8% 13.1% 21.8% 15.0%
1 Estimated total 1 contract procurement 1 350-500 270-400 95-140 43,000- 32-45 170-250 (45-65% PP) 1 60,000
1
Sources: ESA National Accounts; Atkins• estimates for public enterprises and contract procurement
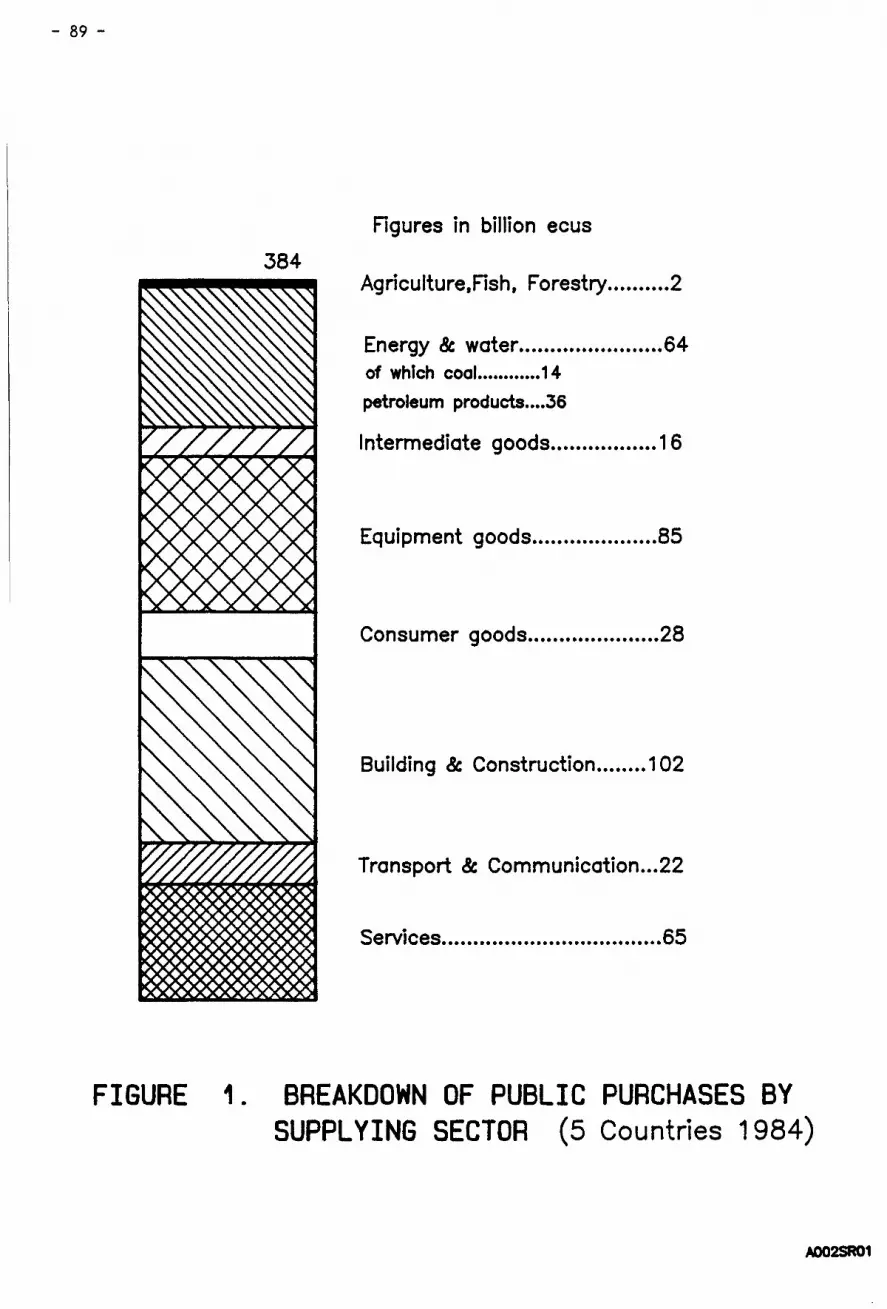
- 89 -
384
Figures in billion ecus
Agriculture,Fish, F orestry .•.•••••.• 2
Energy & water •.•••••••.••.•.•••••..• 64 of whtch coal •••••••••••• 14
petroleum products •••• 36
lntermediate goods ...••.•••.•...••. 16
Equipment goods ....•..•.•.•......•. 85
Consumer goods ..••.••••.••.•..•..•• 28
Building & Construction ••.•.•.. 1 02
Transport & Communication ... 22
~E!,ÏC:E!fi •••••••••••.•••.•••••..••..••.••••• ES~
FIGURE 1. BREAKDOWN OF PUBLIC PURCHASES BY SUPPLYING SECTOR (5 Countries 1984)
A002SR01

- 90 -
20
6. SELECTION OF REPRESENTATIVE PRODUCTS
The quantitative estimation of gains from trade and restructuring started from specifie cases. For priee comparisons, very specifie products were selected and closely defined. Within the limitations of the present study the re i s a trade-off between the number of different products that can be studied and the level of detail at which each can be analysed. agreed:
Two 1 i sts of se 1 ected products were
* a 'priee effect' list of products which show a potential saving from new trade due to static priee differences
* a 'restructuring effect' list of products for which there is a potential dynamic benefit from restructuring and economies of sc a le.
To evaluate the static trade effect of gains from new trade arising from openi ng up pub 1 ic procurement, it was necessary to 1 ook at products which:
* have a large share in public purchasing, so that priee differences lead to significant savings
* are tradable
* are not at present freely traded, so that there is a possibility of priee differences existing {after allowing for trading and transport costs)
* benefit from nationalistic purchasing policies, the removal of which might lead to increased trade by the public sector.

- 91 -
21
Using the NACE classification of economie activities at the three digit level, all products were reviewed against these criteria, using data on the breakdown of public purchasing. The products for which savings were considered possible are shawn in the "Priee Effect List", Table 3.
In arder that opening up public procurement should have an effect on the effici ency of the industry through restructuri ng and economies of scale it is necessary in addition that the supplying industry should:
* depend heavily on public sector purchasers
* have a few dominant producers in each country, because economies of scale are important.
These products are shawn in the 11 Restructuring Effect List", Table 3.
A further selection of these products was made to arrive at a list of products for analysis of priees, costs and industry structure and behaviour. Products of little importance in total purchasing, products not researchable for security reasons, and defence industries were eliminated from further study (but the conclusions of the analysis of selected products have been applied to all products). This left 14 product groups (42 specifie products) for which an analysis of priees has been carried out and 8 products for which case studies have been prepared covering industry structure, markets, competitiveness, cast structure and economies of scale, and the industries• likely response to opening up public procurement.
Most of the products are from the manufacturi ng sectors. Raw materials and commodities can generally be excluded since near perfect international markets exist in most cases, and public sector purchases are law. The main exception is coal, for which restrictive purchasing agreements exist, and has been treated as a special case in the analysis.

TABLE 3 - PRODUCTS/SECTORS AFFECTED BY OPENING UP PUBLIC PROCUREMENT
Estimated share of Priee effect list Restructuring effect 1 i st PP affected
6.8% * Aerospace equipment/arms 1 * Aerospace/arms 4.6% * Business services 1 -3.7% Coal for power stations 1 Coal 3.0% * Specialised civil engineering & building 1. 7% Motor vehicles 1. 6% Pharmaceuticals 1.3% * All other mechanical engineering 1.2% Heavy steel fabrications Heavy fabrications 0.9% * Shipbuilding * Shipbuilding 0.9% Power generation equipment Power generation equipment 0.9% Telecommunication equipment Telecom equipment 0.9% Computer equipment Mainframe computers 0.9% Railway rolling stock Raliway rolling stock 0.7% School/office desks/furniture 0.7% Uniforms/clothing 0.5% Power cables 0.5% Lighting (office/street) 0.4% Paper 0.3% * Nuclear fuels * Nuclear fuels 0.3% * Explosives o. 1% * HVAC equipment o. 1% * Mining e~uipment o. 1% * Military police boots o. 1% * Steel tubes/special steels o. 1% Lasers and optoelectronics
less than O. 1% Cement less than 0.1% * Steel plant less than 0.1% * Pit props less than 0.1% * Railway track
Source: WS Atkins: Shares of public purchasing from analysis of input-output data
* not included in detailed studies
-.() N
- 93 -
23
There are also a large number of categories of utilities and services for which the potential for trade is very weak distribution of water and electricity, personal services, transport and communications - because proximity of the final supplier and the eus tomer i s of the essence. (This does not prevent the servi ce being provided by a local establishment with foreign ownership, or imported materials being used in providing the service).
The re are, however, undoubtedly a reas wi thin the servi ces sector where there is potential for sorne expansion of trade - examples are engineering design, management consultancy, computer services, or architectural services, within the business services sector. This sector also includes insurance and finance brokers, estate agents, legal services, accountants, advertising, and technical services. In most of these sectors, language and knowledge of local laws, eus toms and ci rcumstances are the main barri ers to cross border trade, and nationalistic purchasing is likely to be of little importance. Most business is done by or through local representative offices. Nevertheless in this, and in sorne other service sectors, there is opportunity for trade in border areas and in specialist services. Completion of the internal market will facilitate this trade, for which international tendering is a prerequi site. It is not susceptible to detai led compari son of priees, but an estimate has been made of the potential impact in the calculation described in Section 9.
Building and civil engineering is a far larger supplying sector, representi ng about 30 percent of pub 1 ic purchasi ng. A lthough the potential for increased trade is in general limited by distance, the volume of purchases makes any savings potentially important. Trade i s restricted by the on-si te nature of most of the work, and the limited mobility of labour and the cast of transporting building materials, which also limit potential savings which could be offered by foreign contractors. potential savings:
Nevertheless, there are likely to be

- 94 -
24
* in border areas
* in specialist activities such as tunnelling, airports, and innovative building methods
* when there are local areas of high construction activity and law construction activity, leading to differential profit margins, so that firms with law orders have an incentive to bid in the high demand areas.
Although there are highly innovative contractors, designers and building product manufacturers, the construction industry tends, rightly in view of the long term risks of new methods, to be cautious. The building materials trade is also prone to restrictive practices. The entry of foreign contractors with proven methods and experience which are new to national markets is likely to accelerate useful innovation, stimulate competition and by-pass materials cartels. The Commission•s own experience in building 120 rue de la Loi is an example of potential savings:
The Commission issued a call for tender in the Official Journal of the European Communities for the contract to construct a Commission office building at 120 rue de la Loi, Brus se 1 s. Res panses were recei ved from a wi de range of construction companies bath from within and outside the Community. They provided interested firms with a specification of works in English and French. There were few foreign tenders, which were generally more expensive than local bids. The selection was made from tenders received -not all firms submitted a tender subject to the tenderer being financially sound and complying with the works specification. The contract was awarded to a consortium of four companies, including Dumez of France, which collectively took on the role of the prime contractor. Tenders were also invited for sub-contract parcels of work and nominated sub-contractors were appointed. Although there was foreign involvement in the contract and it was not always evident as to the origin of certain materials and equipment - other than specialist equipment such as the air conditioning system, all purchases were made locally - according to the responsible Commission official:
* an estimated 90% of the cast of works remained in Belgium

- 95 -
25
* the project was completed on time and to budget
* the value of the contract was sorne 15 - 25% below the initial estimate provided by the Belgian Ministry of Works in 1981 prior to the issue of the call for tender.
As with services, these potential areas of saving are specifie to particular locations, contracts and times and are not easily quantifiable. An estimate of the potential has been made in the calculations of the static priee effect.

- 96 -
26
7. PRICE COMPARISONS
For analysis of the static trade effect, inter-country comparisons of priees have been obtained from four sources:
* direct market research for 17 closely specifie standard products. In each country enquiries were made to obtain quotations from three suppliers (where three exist and were willing to quote), and the priee actually paid by one purchasing authority
* data he 1 d by Eurostat. Of the se data, 17 products had comparable priees for at least four of the five study countries (this includes data on 18 models of car, averaged to represent one composite product)
* data on the cast of a basket of pharmaceutical products from a study by the Bureau Europeen des Unions de Consommateurs ( • A Common Market in Medicines• BEUC 1987)
* data from case study interviews.
The compari son of pri ces rai ses a number of prob 1 ems, the most critical of which are:
* identical products are not available in all countries, because of differing national standards, and product differentiation. In sorne cases the nearest available product has a quite different specification (e.g. diameter of power cable, rating of transformer) for which it has been possible in the direct priee enquiries to make a correction. It is understood that similar analyses and corrections have been carried out on the Eurostat data. In other cases, however, quality and design
- 97 -
27
differences have not been able to be analysed, and may account for a part or all of the priee differences observed. In the case of street lamps, for example, comparable specifications could not be found in all countries; and products like desks, however c 1 ose ly defi ned, are subject to design and qua 1 ity differences
* there is a considerable variation in priees within each country. For example, a study of local authority purchasing in the UK found priee differences of typically 2:1 and sometimes more, even for identical product speci fi cati ons. This effect has been minimised by taking the mean of four observations where possible, but the fact that the priee differentials within a country are as great as the differences between countries indicates that expenditure savings could often be made by improved purchasing without increased trade.
To calculate the potential savings, the Consultants estimated a savings threshold for typical contracts for each product and each pair of trading countries. The savings threshold is the cast of transport, trading, procurement and bidding, and a risk premium, as a percentage of the domestic priee. The potential savings factor is then estimated by subtracting this savings threshold from the priee differential for each pair of trading countries. Sensitivity analyses have been carried out to test the effect of different assumptions, and in particular the effect of assuming negligible trading and procurement costs and zero risk in the future internal market.
The potential savings factors calculated by this method are shawn in Table 4. For several products there are no apparent potential savings at all (for example fluorescent tubes, school desks, cement, cardiac monitors). For sorne there are apparent potential savings of 30 to 50 percent for the high priee countries (for example uniforms, filing cabinets, X-ray machines, telephones). These data are

- 98 -28
carried forward to the calculations of the trade effect, where aggregate sa vi ngs are ca leu 1 ated for each product group and a pp 1 i ed . to product groups not covered by detailed analyses.

-a -a
TABLE 4 - POTENTIAL STATIC PRICE SAVINGS BY PRODUCT (percent of 1987 home priee - base case hypothesis)
R59 Product sector % of total Belgium France Germ any Italy UK Data source pure hases
31 Coal 3.69 0 0 50 0 25 a
151 Cement etc 0.05 0 0 0 0 0 a
170 Chemicals 3.22 Pharmaceuticals 9 0 52 0 40 c
190 Metal products 2.27 Boi lers 0 0 0 0 0 d Fi1ing cabinets 20 15 28 0 0 a Fixed armchair 0 2 23 0 5 b Storage cabinet 0 0 0 0 0 b File cabinet 4 19 0 11 0 b Shelf 30 0 0 0 0 b Swive1 chair 16 0 5 0 0 b
Weighted average 6 3 5 1 0
210 Agriculture/industry etc 2.62 11 8 10 7 4 e
230 Office machine & instrumentation l. 76 Mainframe 0 0 0 0 0 a Typewriter I 0 10 0 28 27 b Calculator 1 4 25 17 43 0 b Paper shredder 0 0 0 31 0 b Calculator II 0 22 0 33 0 b
Weighted average 1 12 3 27 5

~
0
TABLE 4 - POTENTIAl STATIC PRICE SAVINGS BY PRODUCT - CONTINUED 0
(percent of 1987 home priee - base case hypothesis)
R59 Product sector % of total Belgium France German y Ital y UK Data source pure hases
250 Electrical equipment 4.69 Turbine generators 20 5 0 10 0 d Cab les 28 0 0 0 0 a Transformers 12 16 0 0 19 a Transformer 1 0 6 6 0 29 b Telephone switching 60 40 70 50 50 a Telephones 20 43 39 0 0 a Te 1 ephone II 47 63 68 34 0 b laser 0 0 0 0 0 a Cardiac mon. 0 0 0 0 0 a Electrocardiograph 0 0 0 0 0 b X-ray machine 18 30 29 49 0 a Street 1amp 0 0 0 0 0 a Fluorescent tube 0 0 0 9 0 a
Weighted average 17 14 15 14 7
270 Motor vehic1es l. 70 Ope1 0 11 9 9 7 a Average car 0 4 0 8 12 b Fiat 0 12 4 5 0 a vw 0 15 4 17 0 a Van 86 0 0 11 13 t 14 b Van 87 0 21 5 12 1 13 b Bus 08 0 8 0 19 1 0 b Bus 014 0 30 4 0 1 21 b
1 Weighted average 0 13 4 10 1 9
1

~
0 ~
TABLE 4 - POTENTIAL STATIC PRICE SAVINGS BY PRODUCT - CONTINUED (percent of 1987 home priee - base case hypothesis)
1 1 R59 Product sector % of total Belgium France Germany Italy UK Data source 1 pure hases 1 1 1 290 Other transport 9.01 1 Electric locos 10 0 10 20 0 d 1 Goods wagon 13 0 23 5 10 a 1 1 Weighted average 11 0 13 16 3 1 1 410 Textiles and clothing 0.69 1 Uniforms 55 25 0 36 1 a 1 ~ 450 Wooden furniture 0.70
School desk 20 7 25 0 0 a Office desk 0 0 15 0 0 a
Weighted average 10 4 20 0 0
471 Paper and board 0.44 Copier paper 0 8 18 0 0 a
430 Leathers, leather & skin goods, footwear o. 13 11 6 11 14 4 e
490 Rubber & plastic products o. 71 11 6 11 14 4 e
510 Other manufacturing products 0.46 11 6 11 14 4 e
530 Building & civil engineering works 26.65 10 10 10 10 10 f

TABLE 4 - POTENTIAL STATIC PRICE SAVINGS BY PRODUCT - CONTINUED (percent of 1987 home priee - base case hypothesis)
..... 0 N
R59 Product sector % of total Belgium pure hases
France Germany Italy UK Data source
710 Business services provided to enterprises 4.63 10 10 10 10 10 f
Sources: a b c
Notes: 1
2
3
Atkins direct enqu1r1es 1987 Eurostat priee survey 1986 BEUC 'A Common Market in Medicines' 1987
63.41
d e f
Atkins case study interviews Weighted average of other manufacturing sectors Atkins hypothesis
To estimate potential savings for leather goods and footwear, rubber and plastics, and other manufacturing products, a weighted average was used of the potential savings in other manufacturing sectors. A straight estimate of 10% potential savings was made for building and civil works, and business services, for each country The potential savings for coal are taken from the case study

- 103 -
33
8. CASE STUDIES
8.1 Selection of the Case Studies
The objective of the case studies was to examine, for specifie supplying industries, the potential impact of the internal market on industry structure and economies of scale. The analysis included a comparison of the structure and competitiveness the EC and US industries. The case studies were selected from the range of special 'public sector goods', which was shown in the restructuring list in Table 3. These are principally capital equipment for the defence, transport, energy, telecomunications and water sectors. They were chosen to cover different industry sectors, traditional and hi-tech industries and different industry structures, as illustrated in Table 5.
8.2 Case Study Method
Interviews were held with senior executives and directors concerned with European marketing and development strategy in the principal firms in the five study countries, a total of sorne 60 companies, supplemented by desk research in Europe and USA. Many of these companies supply several of the case study products. The outstanding example is that three subsidiaries of CGE (Framatome, A 1 sthom and A 1 ca te 1 ) are vi rtua lly monopoly su pp 1 i ers in France and also dominant EC suppliers of equipment to the rail, power generation and telecommunications sectors.
The interview programme and case study desk work covered:
* the industry structure: size of firms, market shares, ownership patterns

- 104 -34
TABLE 5 - CHARACTERISTICS OF THE SELECTED CASE STUDIES
Product sector
Coal
Boilers (heavy fabrications)
Turbine generators
Locomotives
Mainframe computers
Public switching
Telephones
Lasers
Purchasing sector
Power generation
Power generation
Power generation
Transport
Central & local gov•t & public enterprises
Telecommunications
Telecommunications
Defence and telecoms
Characteristics
Declining industry Strategie resource
Traditional industry, facing technical change. Few producers
Similar to boilers
Oligopolistic industry, hitech with traditional base
High technology; with external threat
High R&D costs, rapid technology change, government involvement in R&D
Small unit value, high volume, medium scale industry
New product, highly innovative with strategie importance
* market size, trends and existing trade patterns
* technology and technology trends
* cost structure and capacity utilisation
* relative priees
* perceived barriers to intra-EC trade
* the firms• European marketing strategies
* the firms• views of future industry scenarios and restructuring.

- 105 -
35
8.3 Characteristics of the Case Study Industries
Table 6 summarises the key market characteristics of the case study products. There is generally excess capacity (except telephones and computers) and negligible trade between EC producers (except in computers - mainly due to IBM - and public switching equipment between local subsidiaries of EC and non EC firms).
TABLE 6 - CASE STUDIES : MARKET CHARACTERISTICS, 1986
Product
Coal Boil ers Turbine generators Locomotives Mainframe computers Public switching Telephones Lasers
Approx. EC market
rn Ecus
20,000 2,000 2,000
100 10,000 7,000 5,000
500
Estimated capacity
utilisation
20% 60%
50% to 80% 80%
approx 70% 90% 50%
Source: WS Atkins interviews and estimates
Intra-EC trade
negl negl negl negl
30 to 100% 15% to 45%
negl high
Table 7 compares the number of major firms in the EC and USA. In several of the products (boilers, turbine generators, locomotives, public switching) there are more firms in the EC than the USA, and economies of scale are important in each of these products. It is not, however, universally true that the EC has too many firms, and there are only sorne sectors which would be likely to undergo major restructuring in the internal market. Mainframe computer manufacturing, however, illustrates the point that although the US has more firms than the EC, in the US the biggest (like IBM) may be very big and achieve economies of scale and the smaller firms may speci a 1 ise ( 1 i ke Cray). In Europe, product ranges and R&D are duplicated, without effective competition to improve efficiency.

- 106 -
TABLE 7 - CASE STUDIES : EC v USA IN 1987
Product No. of EC firms
Coal Boil ers Turbine generators Locomotives Mainframe computers Public switching Telephones Lasers
Source: WS Atkins interviews
10 majors 12 10 16 5
11 12
over 1,000
No. of US firms
3,000 6 2 2 9 4
17 over 1,000
36
8.4 Priees and Economies of Scale
Table 8 summaries, in rounded terms, the concensus of industry views on typical priee differences for the case study products, relative to ei ther the lowest priee EC su pp 1 i er or the 1 i ke ly future open market priee. These differences are included in Table 4.
In each of the sectors a quantitative analysis of potential economies of scale was made, using data on cast structures, capacity utilisation and technology. Likely scenarios, based on firms• reported strategies and their views of likely changes in industry structure, were considered. This enabled hypotheses to be developed on potential changes in the output of typical plants and potential economies in R&D and overheads.
Economies of scale can be defined in terms of:
* Short Run Economies of Scale (SREOS} - economies achievable with existing fixed capital (or with de-bottlenecking} as a result of utilisation and overall capacity restructuring, with markets unchanged. plants are also unchanged
minor investment in increased capacity
reduction due to The size of firms and
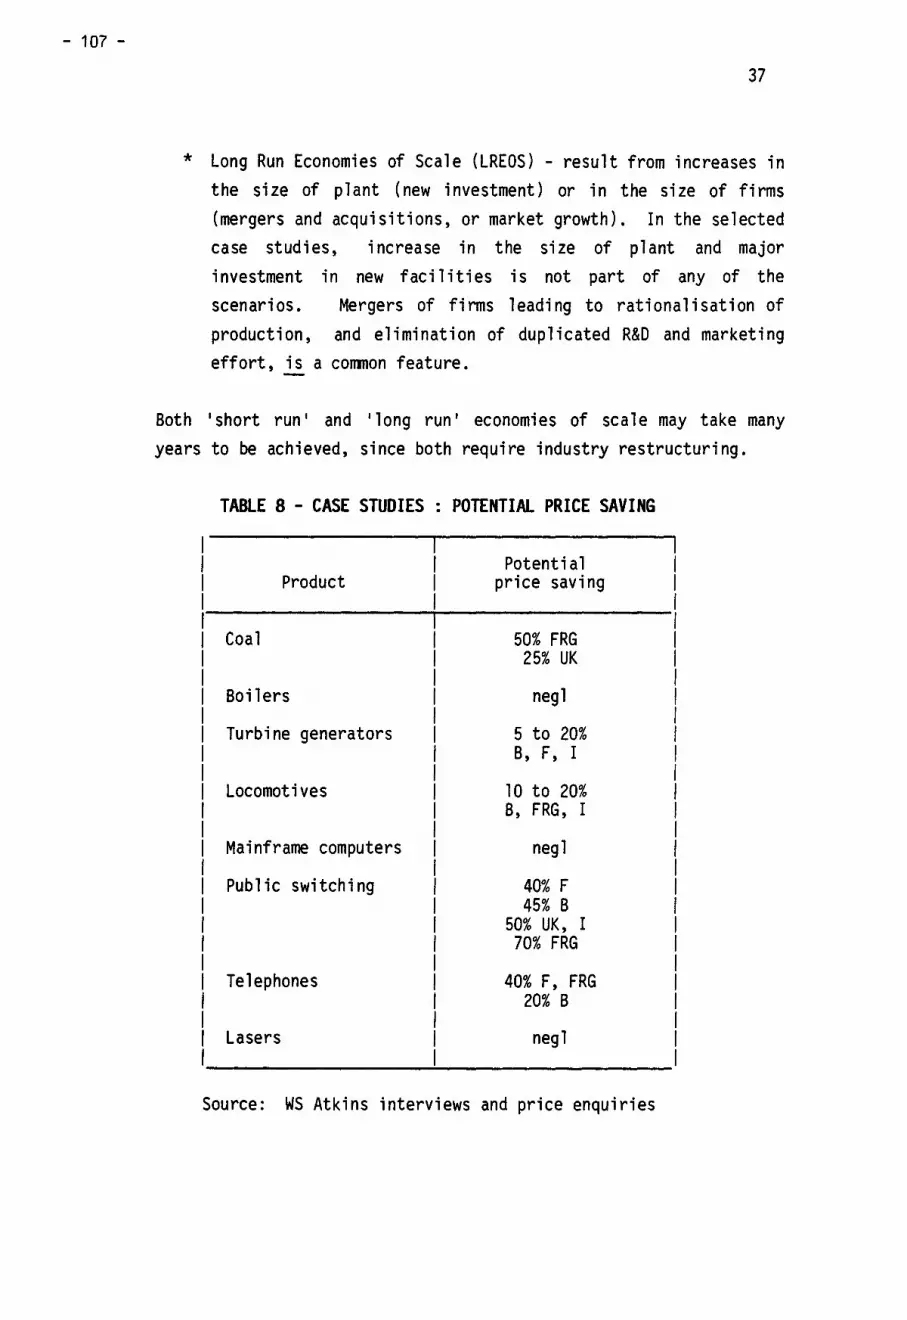
- 107 -
37
* Long Run Economies of Scale (LREOS) - result from increases in the si ze of p 1 a nt (new i nvestment) or in the si ze of fi rms (mergers and acquisitions, or market growth). In the selected case studies, increase in the size of plant and major investment in new facilities is not part of any of the scenarios. Mergers of firms leading to rationalisation of production, and elimination of duplicated R&D and marketing effort, is a common feature.
8oth 'short run' and 'long run' economies of scale may take many years to be achieved, since bath require industry restructuring.
TABLE 8 - CASE STUDIES : POTENTIAL PRICE SAVING
Product
Coal
Boil ers
Turbine generators
Locomotives
Mainframe computers
Public switching
Telephones
Lasers
Potenti al priee saving
50% FRG 25% UK
negl
5 to 20% 8, F, I
10 to 20% 8, FRG, I
negl
40% F 45% 8
50% UK, I 70% FRG
40% F, FRG 20% B
negl
Source: WS Atkins interviews and priee enquiries

- 108 -38
8.5 Scenarios
Co al
A brief sunmary of the assumed scenarios for each of the case studies is given below. The estimated priee change due to economies of scale - assuming all cost savings are passed on to customers (as they should in the new competitive environment) - is shawn in Table 9.
TABLE 9 - CASE STUDIES : RESTRUCTURING EFFECTS
Pro du ct SREOS LREOS Restructuring required
Pit closures
Boil ers 20% Mergers and plant closures
Mergers and rationalisation
Mergers and technical collaboration, sorne closures
Turbine generators 10% 2%
Locomotives 13% 7%
Mainframe computers negl 5% Rationalisation of product ranges and manufacturing
Public switching 10% 10% Further acquisitions and rationalisation
Telephones negl negl Sorne closures, sorne rationalisation
Lasers large, not due to Natural growth and internal market consolidation
1
Source: WS Atkins
* Coal: Germany and UK have purchasing agreements between power authorities and the coal industry. (France and Belgium have high production subsidies but smaller, declining industries and do not prevent imports). Removal of purchasing restrictions would lead to sorne accelerated closures in UK and massive closures in Germany. Germany would save around 50 percent and UK about 25 percent of coal priees by imports from outside the EC. It is assumed that imports would capture most

- 109 -
39
of the German market and about 10-20 percent of the UK market. This is only the effect of removal of purchasing restrictions, not the removal of all subsidies. In the absence of purchasing restrictions, the same protection could be afforded to coal industries by increasing production subsidies to lower home production priees, or by external tariffs. Since this is a matter of energy policy the potential savings estimated here may not be considered a 'cast of non-Europe' in the context of this study
* Boilers: there is no trade between EC producing countries, and the re i s massive overcapacity. Pri ce differences gi ve no evident static priee advantage, but increased competition in the internal market would lead to sorne reduction in boilermaking capacity, and in the number of firms from 15 (in five countries) to around four. Unit priees and costs would fall by around 20 percent. The industry is vulnerable to low cast third world competition, and sorne manufacturing would probably shift offshore. These developments will require changes in na ti on al competition po licy as we 11 as openi ng up public procurement
* Turbine generators: As in boi 1 ers, the re i s 1 itt 1 e trade between the main EC producing countries, and sorne overcapacity. There are sorne priee differences, so there are potential static priee gains. Italy and the UK are beginning new power station building programmes, so French and German firms would be able to enter these markets. This is likely to lead to mergers and acquisitions and rationalisation of production, reducing unit costs by an estimated 12 percent, without major closures
* Electric locomotives: There is no significant trade yet between EC producing countries, but mergers and collaboration agreements are beginning to occur. Purchasing is opening up. Trade will be slow to develop because present locomotive designs were developed jointly between railway authorities and

- 110 -
40
national suppliers, and different rail systems are perceived as a barrier. Over a period of decades, the number of main manufacturers is likely to reduce from 16 (counting bath mechanical and electrical subsystem manufacturers) to 3 or 4, with rationalised product ranges. Unit costs would fall by around 13 percent. Pressure for these changes already exists because of changing technology, but they cannat occur without changes in public purchasing policy
* Mainframe computers: Unlike the previous case studies, this is a highly competitive industry, but in a bilateral fashion, with indigenous producers competing against IBM in each country. IBM has bec orne a pan-European fi rm, and other manufacturers are following, particularly Groupe Bull. There is no static priee effect likely as a result of opening up public procurement. industry is likely,
Sorne continued rationalisation of the leading to minor savings in R&D and
marketing, estimated at around 5 percent of costs, but Europe now has fewer manufacturers (5 including IBM) than the USA (9 fi rms). Japan a 1 rea dy has a strong presence in Europe ( ICL, Comparex and Olivetti sell Japanese machines) and this is likely to increase, with direct sales and possibly local manufacture
* Public exchange switching equipment: There are seven different digital switching systems being installed in EC countries, five of which were developed by EC firms with the protection of national purchasing policies and R&D funding. According to interviewees and press reports, the 1987 priee per line ranges from $225 to $500, because of varying levels of amortisation of development costs, compared to around $100 in the USA. With open tendering the European priee would probably fall to around $150 (there are still R&D costs for adaptation to different nation al networks). The i ndustry has been restructuring rapidly recently to compete for national market shares, notably by the emergence of Alcatel as a major pan-European fi rm and a seri es of other mergers and
- 111 -41
cooperation agreements. With completely open markets there
would probably be only two firms in the EC. This would give
economies of sc a 1 e in production, a 1 though the re wou 1 d st i 11
be distributed manufacturing, and would give sorne economies in
the next round of development costs for future systems
* Telephones: There are many manufacturers of telephones and
significant imports into deregul ated markets. There are
substantial priee differences, mainly because there are high specifications for telephones into regulated markets (ie.
first telephones in all but UK) and lower quality products in free markets. There are also differences in technology
between manufacturers. Free competition would drive out expensive products and high cast producers, bringing priees
dawn by 30 to 40 percent in Belgium, France and Germany, but
there ~re no additional economies of scale to be achieved bJ; major restructuring
* Lasers: The laser industry is very competitive, with many small firms, at the beginning of the product cycle curve.
Only France is reported to have nationalistic public
purchasing policies, although for telecommunications
a pp 1 i cati ons 1 a sers are produced by sorne of the
teleconmunications equipment firms which are themselves
protected by public purchasing. Otherwise the market is open.
Costs will continue to fall as the industry matures and
economies of scale will be achieved through market growth and
mergers, but this will not be a result of internal market effects.

- 112 - 42
9. THE COST OF NON-EUROPE IN PUBLIC PROCUREMENT
The priee analyses and case studies described in preceding sections give estimates of the potential changes in priees of products entering into public purchasing. The priee changes were applied to give a weighted average priee change for each 2-digit NACE product category (sorne of which, for perfectly traded commodities and for non-tradables, are zero). To estimate the potential savings in public expenditure, these priee changes were input into a madel, developed by the Consultants, of the total volume of public purchasing and potential changes in trade flows.
It is assumed throughout that there is no change in the total volume of public purchasing, nor of the volumes of private consumption. It is also assumed that all priee changes result from a change in the cast of production, so that profit levels remain unchanged. Welfare gains are therefore measured directly by the change in public expenditure. This is essentially a comparative static approach. The longer term dynamic macroeconomie effects of the change in public expenditure and resource use on financial constraints, balance of payments, employment and economie growth are to be estimated by Commission staff using macroeconomie models.
The measurable effects of the internal market on priees and hence on public expenditure have been analysed in three components, the formulae for which are summarised in the technical appendix. The additional very important effects which cannat be quantified are listed at the end of the section.
* a static trade effect: this arises from increased imports from law cast producers. It i s assumed that the products concerned are differentiated goods with monopolistically competitive markets (apart from coal, which is treated

- 113 -
43
differently in the analysis, traded commodities are excluded) so that the lower priced imports wi 11 take a share of the market without initially affecting the priee of existing products. A range of hypotheses have been made about the potential change in import penetration. The base case assumes that public sector import penetration reaches the same level as the private sector for each product. The change in import penetration has been calculated using data from the contract database, trade statistics, and the analysis of public and private sector purchases from ESA input-output tables, for each country and each product.
For each product, the static trade effect equals:
(initial expenditure) x (% priee saving) x (change in import penetration proportion)
* a competition effect: as imports increase due to the trade / effect, domestic suppliers will be under pressure to eut priees to maintain market share. To the extent that there is x-inefficiency (that is, wasteful use of resources) they can do this by improving efficiency (e.g. reorganising or adopting new technology) and maintaining profit levels. If there is no x-inefficiency then either firms must merge or restructure to achieve economies of scale or any priee eut is matched by loss of profits and there is no welfare gain. The existence of x-inefficiency implies an absence of profit maximising behaviour, which can only occur in non-competitive markets. The assumption is therefore made that a competition effect applies to all output in the case study sectors and similar products (where there is negligible public sector trade at present and few private sector buyers) but not at all to other products where there is a substantial private sector market.
In the previously •non-competitive• markets therefore the competition effect equals for each product:
- 114 -
44
(initial expenditure) x (% priee saving) x (1 - change in import penetration proportion)
The competition effect on priees of domestic suppliers is 1 i ke ly to be seen as saon as the re i s new trade or threat of trade. The effect on costs will take longer, since firms have to reorganise, improve procedures and possibly invest in new technology. In the intervening period there will be a loss of profits for firms, and it is this which will stimulate the efficiency improvements required.
* a restructuring effect: the development scenarios for the case study industries outlined in the previous section lead to the reduction in average costs, and hence in priees, due to the economies of scale which were shawn in Table 8. Such effects would probably take 5 to 10 years to be realised. These priee reductions are estimates for a •typical• firm and are assumed to apply equally to all countries.
The restructuring effect is estimated by:
(initial expenditure) x (restructuring factor)
The results of a series of sensitivity analyses on the import penetration factors, savings thresholds, and priee differentials is shawn in Table 10. These also include the effect of an assumed + 30 percent variation in the economies of scale factors in the restructuring effect.
The total potential savings are estimated in the range 8 to 19 billion ecus. The static trade effect, which can be assumed to be achieved by or saon after the completion of the internal market in 1992, amounts to 4 to 9 billion ecus. The competition effects on domestic suppliers, which will follow very saon after, gives an additional 1 to 3 billion ecus saving. The longer term restructuring effect is estimated to be similar in magnitude to the potential trade effect.

- 115 - 45
TABLE 10 - SUMMARY OF POTENTIAL SAVINGS IN TOTAL PUBLIC PURCHASING (Billion Ecus 1984 - 5 countries)
Component Value % GDP % of total (billion ecus) public purchasing
Static trade effect * 3 - 8 0.1 - 0.3 1 - 2 Competition effect 1 - 3 0.04- 0.1 0.3 - 1 Restructuring effect 4 - 8 0.15- 0.3 1 - 2
8 - 19 0.3 - 0.7 2 - 5
* Note: Savings are calculated on total purchasing (not just contract procurement). The base case estimate of the static trade effect includes:
Coal Pharmaceuticals Other manufactured goods Construction Services
bi 11 ion ecus 2.0 1.2 2.2 1.0 0.2 o.6'
The savings in public purchasing which have been quantified exclude sorne very important elements, which are outside the scope of the present study:
* savings for the private sector purchasers of goods whose priee has been reduced by increased competition. In the case study sectors, where the greatest savings apply, private sector pure hases are sma 11 - the re are few 1 priva te 1 purchasers of power station equipment, railway equipment, and network telecommunications equipment, since all enterprises providing these services are included in this study 1 s definition of the public sector. Nevertheless, the leverage wielded by public sector purchasers may break up restrictive trade practices (such as sole concessions and discriminatory pricing) and generate new gains from trade in products, su ch as of fi ce equipment, pharmaceuticals or construction, which are purchased by bath pub 1 i c and priva te sec tors. Su ch sa vi hgs would, however, under the assumptions of this madel, be partly offset by reductions in profit margins

- 116 -
46
* dynamic effects on innovation and growth. The 1 on ger term restructuring effect includes an estimate of the reduction in R&D and marketing expenditure possible as a result of company mergers and collaboration eliminating duplication. On the ether hand, a more effective use of the same R&D and marketing expenditure could have a far-reaching impact on innovation, investment and growth, which has not been quantified
* external effects: the more effective use of R&D and marketing effort may have a profound effect, not just on innovation and growth, but on the survival of sorne sectors of European industry. In key high technology sectors such as computers, telecommunications, aerospace, transport equipment and defence goods the historical fragmentation of European industry into national preserves has made it increasingly uncompetitive, bath at home and in world markets. Even though imports from outside the EC are likely to increase in the short term, major restructuring and increased competition can bring costs dawn and enable European industry to remain viable, compete and possibly gain new export markets in the long term.
The total estimated savings in public expenditure represent around half a percent of GDP, and this is equivalent to 2 to 5 percent of public purchasing, a very considerable saving. The dynamic effects outlined above would not only add to t~se savings in the long term but act as a powerful stimulant to European economie growth.

- 117 -
TECHNICAL APPENDIX - METHOD OF CALCULATION OF TOTAL POTENTIAL SAVINGS
1. Formulae used in the Madel
Initial public purchasing = pQ
where Q = tot a 1 vo 1 ume of purchases from bath 1 oc a 1 producers and importers
p = initial home priee of bath local producers and importers.
After opening up markets, expected public purchasing
where M = new imports Pm =priee (delivered) of new imports from foreign supplies
immediately after opening up dpc = change in priee of local suppliers due to new competition dpr = change in priee of all products due to restructuring
effects
Savings = initial purchasing - expected purchasing
= pM - dp Q + dp M - dp Q - p M c c r rn
........ trade effect
+ (-2.Ec) (1 - !:!) pQ ........ competition effect ( p ) ( Q)
.....•.. restructuring effect
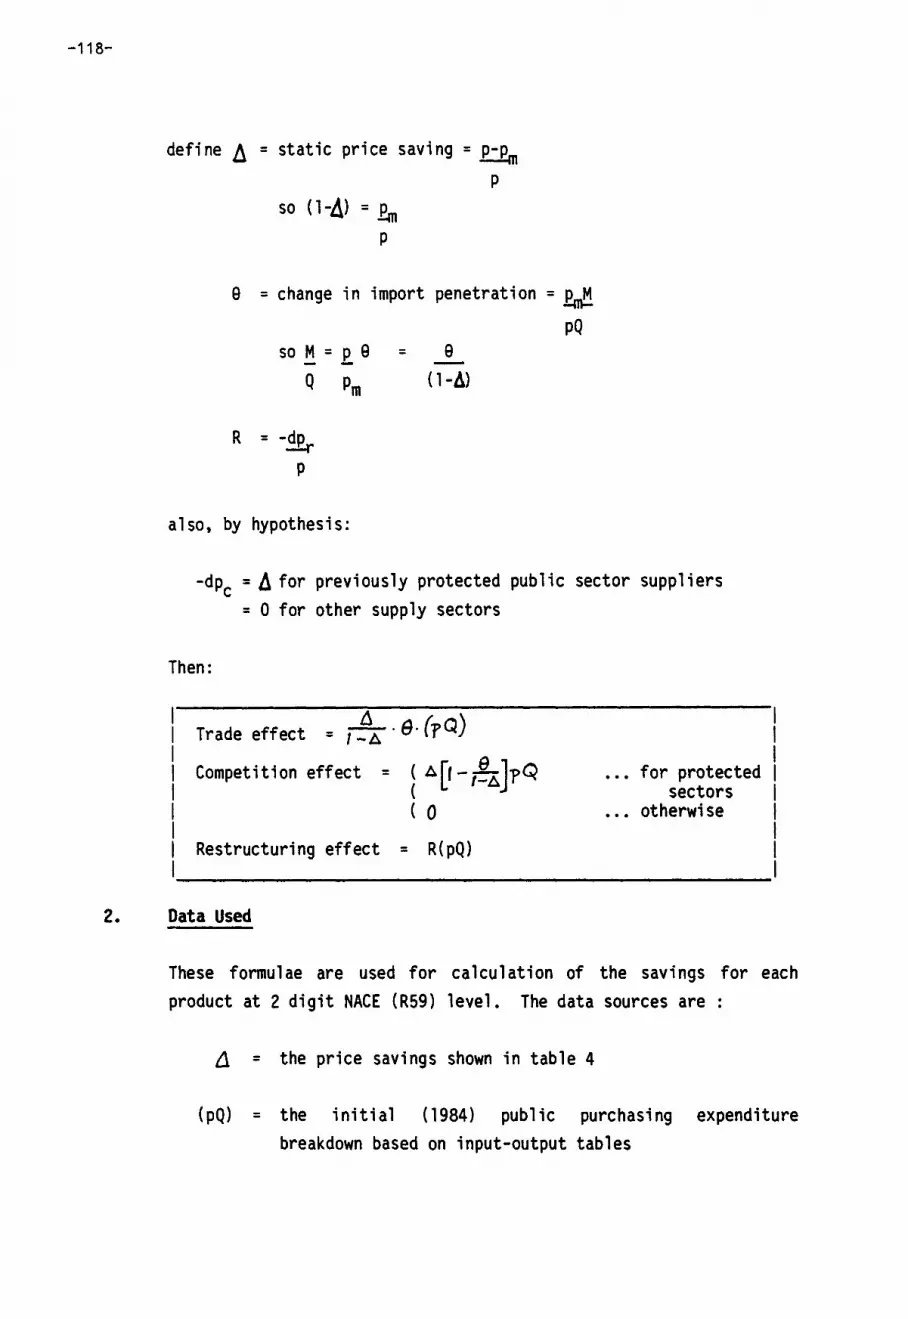
-118-
define ~ = static priee saving = p-pm p
so { 1-Â) = .P.m p
e = change in import penetration = ~
pQ so !:! = R e
Q Pm
R = -dp ~
p
also, by hypothesis:
= e -{ 1-â)
-dpc =~for previously protected public sector suppliers = 0 for other supply sectors
Then:
Trade effect = 1 ~A · 8· (-pQ)
Competition effect = ~ A[r- 1~A}pQ { 0
Restructuring effect = R{pQ)
for protected sectors
otherwise
2. Data Used
These formulae are used for calculation of the savings for each product at 2 digit NACE {R59) level. The data sources are
ll = the priee savings shown in table 4
{pQ) = the initial {1984) public purchasing expenditure breakdown based on input-output tables

- 119 -
R = the economies of scale factors from the case studies, extrapolated to 2 digit NACE level
9 = change in import penetration estimated as described below.
3. Estimation of the change in import penetration
For the calculations of the 11 Cost of Non-Europe.. in public procurement, a hypothesis has to be made about the change in public sector import penetration for each product group at the 2 digit NACE level. Since no reliable data exists on the current level of public sector import penetration, and since the 1992 public sector import penetration is pure hypothesis, an assumption was made of the maximum likely change in import penetration as follows:
* For coal:
* For construction:
* For services:
as assumed in the case study
10% increase, representing border areas and sorne specialist construction
10% of business services, zero for other services (eg. maintenance, rents, health, travel)
* For manufactured goods: After 1992 the pub 1 ic sector import penetration will be similar to the private sector at present. The latter is not known, but data for total import penetration of each 2 digit sector (public and private purchases) is known.
Estimates of the present level of import penetration in the public sector have been made on the basis of av ail ab le evidence from the Contract data base. The implied private sector

- 120 -
import penetration is then calculated, us i ng data from the ana 1 ys i s of ESA input-output tables for the ratio of private and public sector purchasing (using intermediate consumption as a proxy), as follows:
Taking for each 2-digit NACE category 9AV = total import penetration, from the DGII
data base (1986 or latest year available)
9PRIV = present private sector import penetration 9PUB = present public sector import penetration
EPUB = public purchases of the sector output EPRIV = private sector purchases ETOT = total purchases
ETOT x 9AV = EPUB x 9PUB + EPRIV x 9PRIV whence:
PUB =
and hence:
Change in import penetration 9 = SPRIV - 9PUB

- 121 -
4.
Technical Barriers in the EC:
An Illustration by Six Industries
Groupe MAC


Technical Barriers in the EC :
Illustrations in six industries
Executive Summary
March 1988
GROUPE MAC

Groupe MAC- 11 Bd Latour Maubourg- 75007 PARIS- TEL.: (1) 45.55.91.78

- 125 - /1/
ACKNOWLEDGMENTS
The MAC Group would like to acknowledge the help in conducting this
research provided by the following officiais of the European Commission :
Thomas Garvey, Ernesto Previdi, Marc Vanheukelen, and by Wolfgang
Gerstenberger, Maria Brindlmayer and Andrea Forti. Ali views and
conclusions contained in this paper belong solely to the author, and any
errors, of course, remain his full responsibility
ParAgro3727188
GROUPE MAC


- 127 -
CONTENTS
1. INTRODUCTION
Il. TECHNICAL BARRIERS IN THE EC
A. Wh at is a technical trade barrier what are the benefits of their removal ?
B. Why is it that technical trade barri ers exist?
C. How has the European Community approached this problem?
Ill. THE EXISTENCE OF TECHNICAL TRADE BARRI ERS IN SIX INDUSTRIES
Page
3
5
7
9
A. The incidence oftechnical trade barriers in six industries 12
B. Description of illustrative cases 1. Foodstuffs 2. Pharmaceuticals 3. Automobiles 4. Building Materials S. Electrical Products and Machines 6. Telecommunications Equipment.
IV. CONCLUSIONS.
ParAgro3727188
GROUPE MAC
16
28
/2/

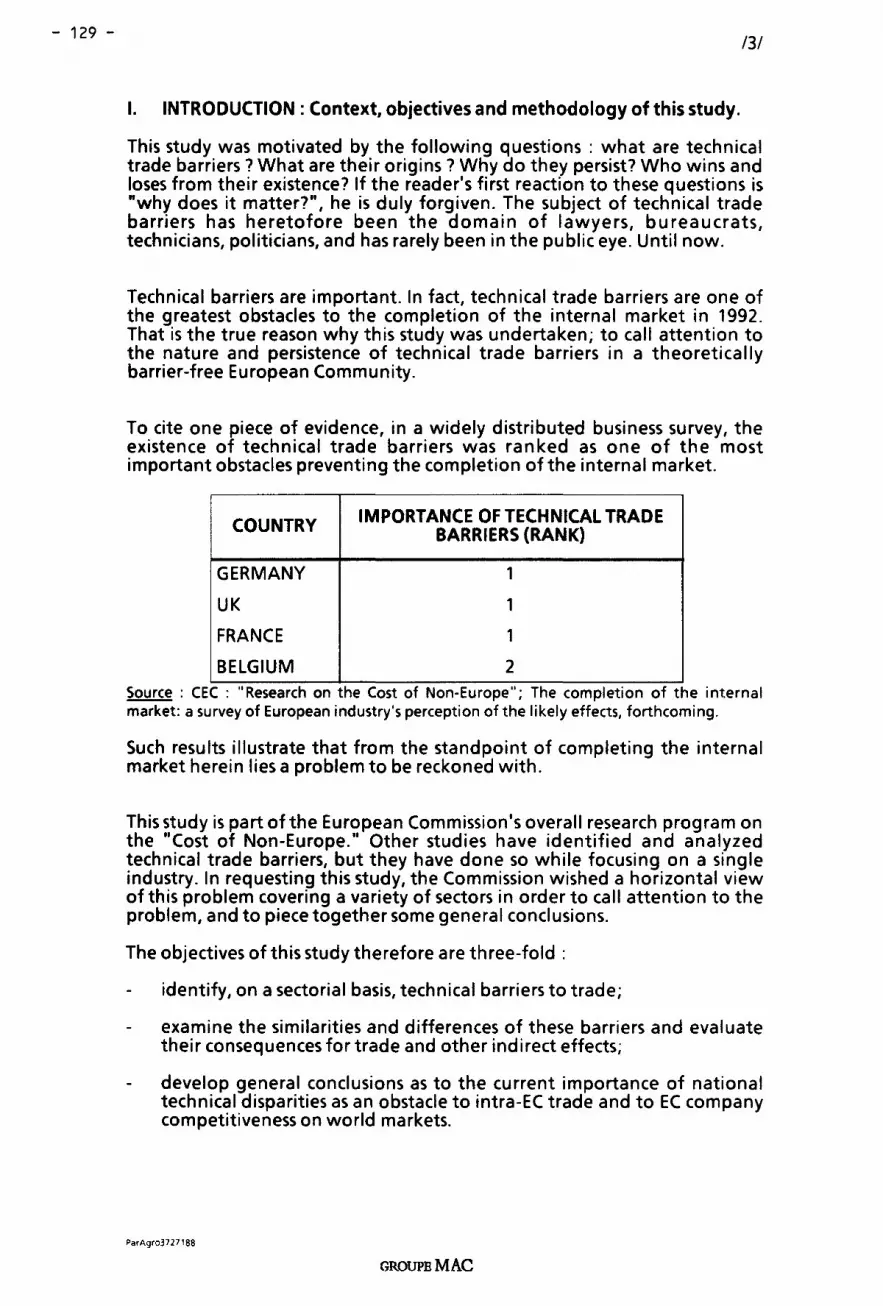
- 129 -131
1. INTRODUCTION : Context, objectives and methodology of this study.
This study was motivated by the following questions : what are technical trade barriers? What are their origins? Why do they persist? Who wins and loses from their existence? If the reader's first reaction to these questions is "wh y does it matter?", he is duly forgiven. The subject of technical trade barriers has heretofore been the domain of lawyers, bureaucrats, technicians, politicians, and has rarely been in the public eye. Until now.
Technical barriers are important. ln fact, technical trade barriers are one of the greatest obstacles to the completion of the internai market in 1992. That is the true reason why this study was undertaken; to cali attention to the nature and persistence of technical trade barriers in a theoretically barrier-free European Community.
To cite one piece of evidence, in a widely distributed business survey, the existence of technical trade barriers was ranked as one of the most important obstacles preventing the completion of the internai market.
COUNTRY IMPORTANCE OF TECHNICAL TRADE BARRIERS {RANK)
GER MANY 1
UK 1
FRANCE 1
BELGIUM 2 Source : CEC : "Research on the Cost of Non-Europe"; The complet1on of the internai market: a survey of European industry's perception of the likely effects, forthcoming.
Such results illustrate that from the standpoint of completing the internai market herein lies a problem to be reckoned with.
This study is part of the European Commission's ove rail research program on the "Cast of Non-Europe." Other studies have identified and analyzed technical trade barriers, but they have done so while focusing on a single industry. ln requesting this study, the Commission wished a horizontal view of this problem covering a variety of sectors in arder to cali attention to the problem, and to piece together sorne general conclusions.
The objectives of this study therefore are three-fold :
identify, on a sectorial basis, technical barri ers to trade;
examine the similarities and differences of these barriers and evaluate their consequences for trade and other indirect effects;
develop general conclusions asto the current importance of national technical disparities as an obstacle to intra-EC trade and to EC company competitiveness on world markets.
ParAgro3727188
GROUPBMAC

- 130 - /4/
The sectors covered in the study were chosen based on the importance and frequency of technical trade barriers as weil as the availability of data. The sectors are :
Foodstuffs
Pharmaceuticals
Automobiles
Building Materials
Electrical Products and Machines
Telecommunications Equipment.
Given the time constraints, the MAC Group conducted this study based on data previously collected du ring the relevant sectorial studies developed on the cost of Non-Europe, supplemented with 25 individual interviews within the Commission and with industry experts, observers and participants. The author also reviewed existing lite rature on the subject.
ParA:jr03727188
GROUPE MAC

- 131 - /5/
Il. TECHNICAL TRADE BARRIERS IN THE EC
A. What are technical trade barriers and what are the benefits of their removal ?(1l:
If an EC producer must alter his product to comply with industrial standards or legal regulations for commercialization in another EC country, and/or, if a producer must have his product tested and certified by the importing country, he faces a technical trade barrier. lt is th at simple.
There are three types of technical trade barriers. The first two concern the specifications of a given product and the third relates to the procedure by which product specifications are verified.
Differences between countries in industry standafds, when imposed as a condition of entry, sale or use, create the first 'type of technical trade barrier. Here standards refer to voluntary specifications regarding product form, functioning, quality, compatibility and/or interchangeability. Standards are not legally binding and are defined by private individuals and organizations (ie. standardization bodies such as AFNOR in France,) in the ir own interest. The DIN system of standards used for building materials in Germany provides a good example of an industry standard. That these standards differ from the AFNOR standards in France prevents certain goods from freely moving between the two countries.
The precise way trade is hindered can be quite subtle in the case of technical standards. For certain building materials, French insurance companies will only pay for damages caused by the product in question if it meets the industry standard and has been approved as such. Architects, who can be held liable for damages, are therefore reluctant to use (foreign) products produced according to a different standard, even if their level of safety is the same.
The second type of technical trade barrier is caused by differences in legal regulations, where regulations are specifications similar to standards but differ in that they are legally binding often with the purpose of serving the public interest, in particular the objectives of health, safety, and environmental protection. The legal basis and the public interest of regulations distinguish them from standards. An example of a regulation is the pasta purity law in France, Ital y and Gree ce which specifies th at "pasta" must be composed of duram wheat only. A British-made pasta composed of both duram and soft wheat is prohibited from being sold in these countries under the na me "pasta" --creating a formidable marketing obstacle.
By contrast to standards, the way in which a country's regulations prevent a good from being imported is unambiguous; they make importation illegal if the good does not comply with them.
(1) Based on CEC, "Research on the Cost of Non-Europe"; The economies of 1992 : an assessment of the potential economie effects of completing the internai market of the European Community, "European Economy", forthcoming.
ParAgro3727188
GROUPE MAC

- 132 - /6/
The third type of technical trade barrier are testing and certification procedures that are designed to ensure conformity to existing regulations or standards. Technical trade barriers are created when an importing country requires an additional certification procedure to that required in the country of origin. Pharmaceutical certification procedures and the type approvals necessary for automobiles are examples of this technical trade barrier. The trade hampering effects include the cost, time, and effort producers must expend to comply with these procedures.
ln addition to the obvious restrictions on trade, the existence of technical trade barriers deprives the Community--both producers and consumers--of important economie benefits, both direct and indirect. Economies of scale in production gained by the acceptability of a single product throughout the Community is one important direct benefit. A second benefit is linked to the reduction in raw materials and finished goods inventory storage costs that could be realized by companies who heretofore build and distribute heterogeneous products within the EC. Manufacturing companies serving different Community markets could be significantly and positively a.ffected by a single, barrier-free market, and competitive pressures would ensure that a portion of these benefits are passed onto customers in the form of lower priees. Sorne of these direct benefits are quantified in the final chapter of this paper for the specifie case studies.
Indirect economie effects of removing technical trade barriers include the increase in consumer choice, and a further gain in scale economies resulting from increased foreign sales. lndustry restructuring is a third important indirect benefit as more efficient European producers displace higher cost locally orientated manufacturers; which in turn would have a positive effect on the competitiveness of selected EC industries in world markets.
ParAgro3727, 88
GROUPE MAC
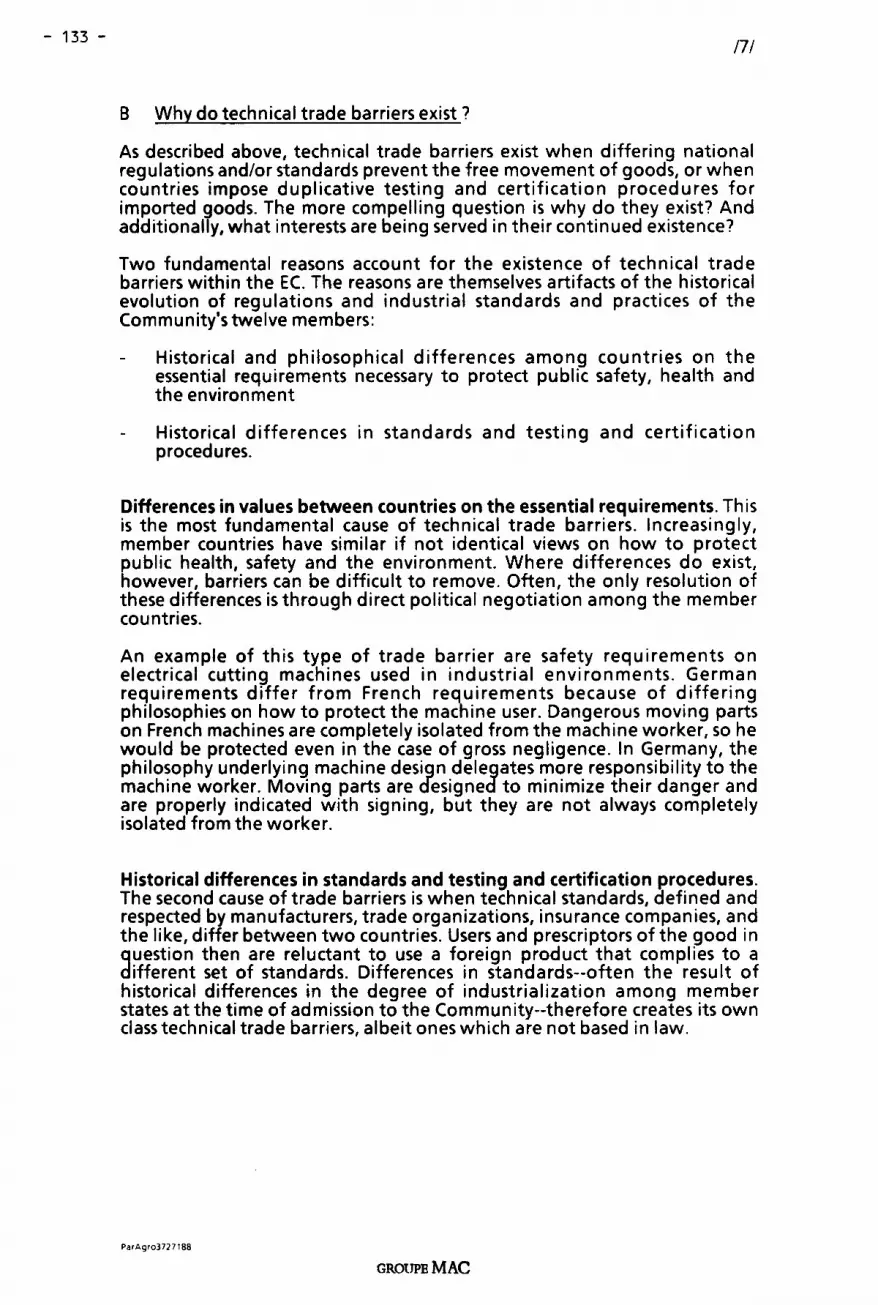
- 133 - n1
B Why do technical trade barri ers exist ?
As described above, technical trade barriers exist when differing national regulations and/or standards prevent the free movement of goods, or wh en countries impose duplicative testing and certification procedures for imported goods. The more compelling question is why do they exist? And additionally, what interests are being served in their continued existence?
Two fundamental reasons account for the existence of technical trade barriers within the EC. The reasons are themselves artifacts of the historical evolution of regulations and industrial standards and practices of the Community's twelve members:
Historical and philosophical differences among countries on the essential requirements necessary to protect public safety, health and the environ ment
Historical differences in standards and testing and certification procedures.
Differences in values between countries on the essential requirements. This is the most fundamental cause of technical trade barriers. lncreasingly, member countries have similar if not identical views on how to protect public health, safety and the environment. Where differences do exist, however, barriers can be difficult to remove. Often, the only resolution of these differences is through direct political negotiation among the member countries.
An example of this type of trade barrier are safety requirements on electrical cutting machines used in industrial environments. German requirements differ from French requirements because of differing philosophies on how to protect the machine user. Dangerous moving parts on French machines are completely isolated from the machine worker, so he would be protected even in the case of gross negligence. ln Germany, the philosophy underlying machine design delegates more responsibility to the machine worker. Moving parts are designed to minimize their danger and are properly indicated with signing, but they are not always completely isolated from the worker.
Historical differences in standards and testing and certification procedures. The second cause of trade barri ers is wh en technical standards, defined and respected by manufacturers, trade organizations, insurance companies, and the like, differ between two countries. Users and prescriptors of the good in question then are reluctant to use a foreign product that complies to a different set of standards. Differences in standards--often the result of historical differences in the degree of industrialization among member states at the ti me of admission to the Community--therefore creates its own class technical trade barri ers, albeit on es which are not based in law.
ParAgro3727188
GROUPE MAC
- 134 - /8/
A good example of the second fundamental cause of technical barriers, which also makes obvious the difficulty or impossibility of their removal, is the custom of right-hand drive in the British Isles and the Republic of lreland. lt is not illegal to own and operate a vehicle designed for left-hand drive, but a hundred years of road design and consumer habits combine to make it impossible to penetrate the automobile market with left-hand drive cars. ln this case, of course, it is unlikely the difference will ever be resolved.
Another example of this type of technical barrier are the DIN versus AFNOR versus BPI systems of standards for building materials in Germany, France and the UK, respectively.
The removal of technical barriers has been and will be accomplished easily for sorne and with much more difficulty for others. ln examining the various sectors covered in this study, two reasons appeared th at explain wh y certain technical trade barri ers are difficult to remove :
- Protection of special interests
- Protection of a strategie industry
ln each of these cases, the "official" explanation or justification of barri ers is based on differences in values between two countries. However, looking behind the official explanations, one or both of these reasons can be identified.
"Protection" of special interests. This is perhaps the most common reason why technical trade barriers are erected and or why they are difficult to remove. Examples of this class of barriers abound. ln ltaly, duram wheat used in the production of pasta is produced by a relatively small but powerful group of farmers in the southern part of the country. Pressure exerted by this group has led to the continued enforcement of the pasta purity legislation in ltaly. The "official" explanation of this legislation is to protect the consumer from poor quality pasta--something, it must be added, the consumer may do for himself by not purchasing it. Other examples in elude the restriction against the use of the sweetener aspartame in soft drinks in France--thereby protecting the sugar industry--and the individual approval required by European PTTs for telecommunications equipment--to protect domestic manufacturers.
""Protection" of strategie industries is the second common reason why barriers are difficult to remove. Many European governments use selective procurement and certification policy as weil as incompatible standards to protect industries deemed of strategie importance. The pharmaceutical, automobile, and telecommunications equipment industries are ali prot~cted by member states, in part, through the erection of technical trade ba mers.
As a case in point, the automobile industry Community Directives exist for 41 out of 44 essential requirements of an automobile. The three that remain are relatively unimportant in themselves: weight and sizes, tyres, and wind screens. However, certain member states are resisting the completion of these directives for fear of losing complete control on the inflow of extracommunity imports.
PorAgro3727 188
GROUPE MAC

- 135 - /9/
C. How has the European Community approached this problem?
Before going further, it will be useful to review the Commission's approach to the probrem of technical trade barriers and clarify sorne of the jargon that has arisen on this subject. The reader may find that a basic understandin~ of the often misunderstood concepts such as "the new approach", 'mutual recognition", and "reference to standards" will advance significantly his appreciation of technical trade barri ers.
The principle of mutual recognition derives from the "cassis de dijon" ru ling which is based on Article 30 of the Treaty of Rome(2l. lt sim ply means that a good lawfully produced and commercialized in one countrY. of the EEC should be aole to be freely transported and sold in another member country, without being modified, tested, certified, or renamed. Mutual recognition1 therefore1 is the first tool the Commission has at its disposai to ensure the rree flow or goods.
The principle of mutual recognition breaks down legally and practically concerning each member country's obligation to protect pubric health, safety ana the environment. Specificany, if one country maintains a different philosophy on how to protect healthhsafety and the environ ment, from another country, then it may prevent t e free circulation of goods. This right is guaranteed by Article 36 of the Treaty of Rome(3), and is a genesis of technical trade barri ers.
ln those instances where two countries differ concerning how to protect safety, health and the environ ment, the oniY. solution to ensuring free trade is for the member countries to agree to a harmonized set of regulations. Harmonization takes the form of directives which are legal, Community wide proclamations that state the measures with which a product must comply to be commercialized in any country of the Community. If a good is produced according to these measures no national legislation can prevent 1ts commercialization in a given country (4l.
(2) Article 30 : "Quantitative restrictions on imports and ali measures having equivalent effect shall, without prejudice to the following provisions, be prohibited between member states".
(3) Article 36 : "The provision of Articles 30 to 34 shall not preclude prohibitions or restrictions on imports, exports or goods in transit justified on grounds of public morality, public policy or public security; the protection of health and life of humans, animais or plants, the protection of national treasures possessing artistic, historie or archaeological value, or the protection of industrial and commercial property. Such prohibitions or restrictions shall not, however, constitute a means of arbitrary discrimination or a disguised restriction on trade between Member States".
(4) More recently, Article 1 OOA recognizes the right of member states to adopt yet stricter regulations than those contained in Community directives when justified by Article 36 {ie., for protecting health, safety and the environment,) and thereby prevent entry of goods which comply to the Directive but not their own regulations. However, as no actions on this basis have been undertaken, the procedure and impact of Article 100A cannot be clearly evaluated.
Article 100A, paragraph 4: "If, after the adoption of a harmonization measure by the Council actin~ by a qualified majority, a Member State deems it necessary to apply national prov1sions on grounds of major needs referred to in Article 36, or relating to protection of the environment or the working environment, it shall notify the Commission of these provisions. The Commission shall confirm the provisions involved after having verified that they are not a means of arbitrary discrimination or a disguised restriction on trade between member states ... "
ParAgro3727 188
GROUPE MAC

- 136 - /10/
From the 1960's to the early 1980's, the European Commission went about the process of developing "harmonization directives" in ali areas where the principle of mutual recognition proved ineffectual. However despite the considerable efforts of the Commission, this proved to be a failure(s). Basically, directives got bogged down in defining technical product specifications, which, given the need for unanimous approval by the member states, delayed the approval process. As a case in point, the harmonization program for foodstuffs drawn up in 1973 listed far in excess of 50 directives to be put in place. By 1985 only 14 directives had been adopted.
Enter the new approach. ln the often cited "white paper", simply entitled "Completing the Internai Market" the Commission described a new approach to the intractable problem of technical trade barriers. The new approach simply argues for a different orientation of directives--away from a detailed specification of technical standards, toward a simple outline of the principal features that products must have. These features were called the essential requirements, because they contain only what is essential for the protection of health, safety and the environment and exclude peripheral technical matters. ln place of the detailed technical specifications, "new approach" directives include a reference to European standards, which are standards drawn up outside the Commission by European standardization bodies (eg CEN, CENELEC, CEPT, etc) and based on mandates included in the directives. Compliance with these standards ensures that the "harmonized essential requirements" are met, thus guaranteeing access to ali EC markets.
ln simple terms, Commission directives are no longer to include detailed specifications of how a product should meet an essential requirement, but simply state what that requirement is, and then refer to a European standard as a favored means of proving conformity. ln theory, this reorientation should increase the speed and flexibility of the Commission and th us contribute to the reduction of technical trade barri ers, which is the ultimate objective.
The new approach provides a number of benefits. lt allows the Commission to delegate to standards institutes what the Commission is illequiped to do and wh at the institutes presumably do weil: specify technical standards. Likewise, it limits the content of directives to a specification of the minimum essential requirements for protecting health, safety and the environment, that if met, guarantee a product commercial access to any country in the Community (though see (4) above). Such a narrower scope for directives should speed up the process by which they are written and approved.
(5) See Pelkmans, Jacques, "The New Approach to Technical Harmonization and Standardization", Journal of Common Market Studies, March 1987.
ParAgro3727188
GROUPE MAC

- 137 - /11/
ln parai lei with the new approach, two developments of this decade should considerably improve the Commission's ability to speed up the approval of directives and to slow down the creation of technical trade barriers. ln reverse chronological order, the Single European Act of 1987 permits the Council to adopt Commission directives with a simple majority vote, rather than the previously required unanimity.
Second, the Mutuallnformation Directive of 1983 obliges member states to notify the Commission in advance of draft technical regulations and standards. lt also gives the Commission the power to delay the implementation of national legislation by one year in order to prepare a directive to combat the trade restricting nature of the legislation.
Having now an appreciation of what technical barriers are, their origins, and how the Commission is trying to remove them, it is appropriate to examine next sorne of these barri ers in more detail.
ParAgro3727188
GROUPE MAC
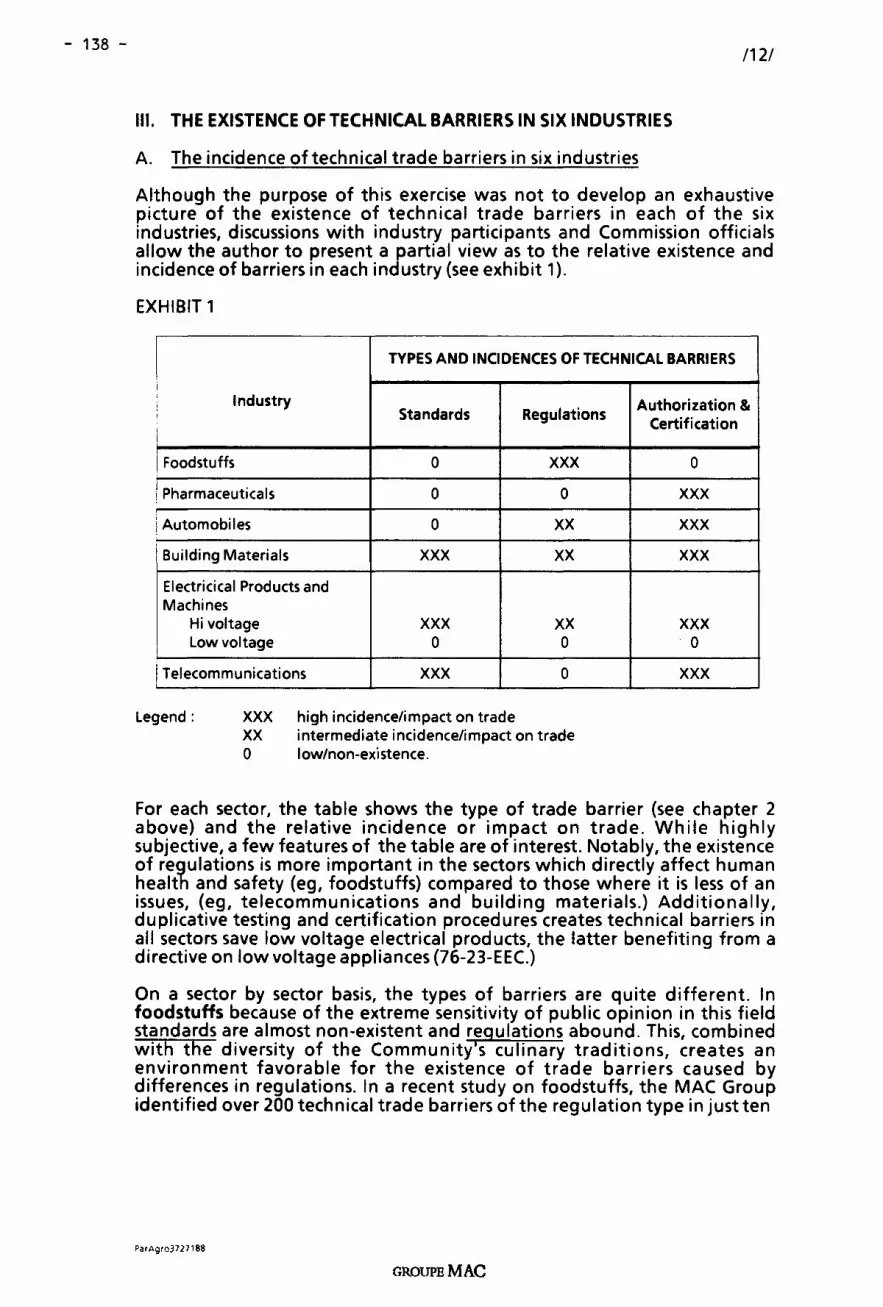
- 138 -/12/
Ill. THE EXISTENCE OF TECHNICAL BARRI ERS IN SIX INDUSTRIES
A. The incidence oftechnical trade barriers in six industries
Although the purpose of this exercise was not to develop an exhaustive picture of the existence of technical trade barriers in each of the six industries, discussions with industry participants and Commission officiais allow the author to present a partial view as to the relative existence and incidence of barriers in each industry (see exhibit 1).
EXHIBIT 1
TYPES AND INCIDENCES OF TECHNICAL BARRI ERS
lndustry Standards Regulations
Authorization & ' Certification
Foodstuffs 0 xxx 0
Pharmaceuticals 0 0 xxx Automobiles 0 xx xxx Building Materials xxx xx xxx Electricical Products and Machines
Hi voltage xxx xx xxx Lowvoltage 0 0 . 0
Telecommunications xxx 0 xxx
Legend: XXX high incidence/impact on trade XX intermediate incidence/impact on trade 0 law/non-existence.
For each sector, the table shows the type of trade barrier (see chapter 2 above) and the relative incidence or impact on trade. While highly subjective, a few features of the table are of interest. Notably, the existence of regulations is more important in the sectors which directly affect hu man health and safety (eg, foodstuffs) compared to those where it is less of an issues, (eg, telecommunications and building materials.) Additionally, duplicative testing and certification procedures creates technical barriers in ali sectors save low voltage electrical products, the latter benefiting from a directive on low voltage appliances (76-23-EEC.)
On a sector by sector basis, the types of barriers are quite different. ln foodstuffs because of the extreme sensitivity of public opinion in this field standards are almost non-existent and regulations abound. This, combined with the diversity of the Community's culinary traditions, creates an environment favorable for the existence of trade barriers caused by differences in regulations. ln a recent study on foodstuffs, the MAC Group identified over 200 technical trade barri ers of the regulation type in just ten
ParAgro3727188
GROUPE MAC
- 139 - /13/
product sectors, and this was not an exhaustive list (6). lnterestingly, in foodstuffs, few barriers are cr:eated from certification and testing procedures.
Technical trade barriers caused by regulations fall into three general categories:
product composition laws relating to use of a generic product na me
- specifie ingredient restrictions
packaging and labeling laws.
Technical trade barriers in the first category are created when a member state restricts the use of a generic product name, such as pasta or beer, to products produced according to a specifie recipe. If products do not comply to the recipe, they may not be commercialized under the given product name, which presents obvious marketing obstacles to the producer/importer. Though these barri ers are flagrant, they are a Iso increasingly subject to direct and indirect legislative action. The Cassis de Dijon and Reinheitsgebot court rulings have set powerful precedents in this a rea.
The second and third categories of barriers are the most troublesome from the standpoint of their removal because of the recourse member governments have to Article 36. Specifie ingredient restrictions, as the term implies, are those laws that prohibit the use of additives in certain products. The prohibition of aspartame in soft-drinks in France is a good example. Aspartame is a sugar substitute used in diet soft drinks in many European countries and the US (where it received approval from the often stringent FDA). The use of aspartame in soft-drinks in France was illegal, ostensibly for reasons of protecting consumer health. lndustry insiders admit,however, that this restriction was in fact the result of successful lobbying efforts by sugar producers and distributors.
Like specifie ingredient restrictions, packaging and labeling laws a Iso specify requirements, which if not met, prohibit the sales of a product in a given country. These laws are often justified as means to protect consumers and the environment. Restrictions against the use of plastic botties for mineral water in over 150 ltalian municipalities is justified, argue the local authorities, for air pollution reasons. However, substitute measures could achieve the same end (eg, a depositlrecycling program) and the restriction places foreign mineral water producers (mainly French) at a severe cost disadvantage compared to local producers. The infamous Danish returnable bottle law imposes a similar transportation cost disadvantage on foreign beverage companies. Partially as a result of this barrier beer imports into Den mark account for less th at 0.1% of total consumption.
{6) The MAC Group, "Research on the Cost of Non-Europe in the Foodstuffs lndustry", 1987.
ParAgro3727188
GROUPE MAC

- 140 - /14/
Due to the inherent critical nature of health and safety in pharmaceuticals, standards are non-existent (like in foodstuffs) and required technical specifications are upheld through national legislation. Twenty years of harmonization efforts by the Commission have fortunately given rise to eleven basic directives and two Council Recommendations, which have harmonized the criteria of drug quality, safety and efficacy. However, severe technical barriers remain in the testing and certification of drugs.
Each EC country requires a separate marketing authorization for pharmaceuticals. If a product is to be admitted to a particular national market is must first receive approval by the national registration authority. Therefore, in spite of the harmonization of approval criteria, differences exist in the authorization decisions made by national authorities. Priee regulation and the placing of drugs on reimbursement lists are two other significant features in the Community's pharmaceutical industry, which,though not technical trade barriers in themselves, are used by member states to regulate the pharmaceutical industry.
Differences in standards play a small role too in the genesis of technical trade barriers in the automobile industry. Regulations play only a moderate role, given that 41 out of 44 "essential requirements" have been harmonized across the community. The most notable sticking point on regulatory differences are exhaust emissions, where Denmark remains steadfast on imposing stricter requirements than other Community members. lt is, however, in the area of testing and type approval where the most important technical trade barriers exist in the automobile industry. More will be sa id about this below.
A recent study fou nd that 70% of a sample of 50 building material products faced differences in norms--both standards and regulations--across the principal five countries in the Community{7) (8). These differences cou pied with different certification and testing methods in each country plague the construction products industry with a seemingly disproportionate number of technical trade barriers. Northern European countries such as Germany, France and Great Britain suffer the greatest differences in standards and regulations.
Perhaps more than the other sectors considered in this study, the barriers against the use of foreign products are deeply entrenched and diffused among many participants in the building products industry. Because of the local nature of building materials and methods, craftsmen in one region may simply be unfamiliar or unsatisfied with products coming from another region, much less country. ln France, Spanish roofing shingles are about 50% cheaper th an domestic ones, owing to the geologie depth at which the slate is found in Spain compared to France. However, roofers in France are not familiar with using Spanish shingles because they have slightly different qualities which change how they are attached to the roof.
(7) BIPE, "Le coût de la Non-Europe des produits de construction", 1987. (8) The Commission is scheduled to submit to the Council later this year a draft "new
approach" directive for buildings which should reduce technical trade barriers in the building materials industry. The directive seeks to harmonize seven essential requirements for buildings: stability, fire resistance, durability, energy economy, health/hygiene/ environment, user safety, resistance to noise.
ParAgro3727188
GROUPE MAC

- 141 - /15/
lnsurance companies also play a subtle role in creating technical barriers in this industry. Often, insurers will only insu re various aspects of buildings if the building and the materials used in its construction comply with certain national standards. Architects and contractors, who could be held liable for accidents caused by faulty construction, resist using foreign products that do not correspond to the national standards, even though they may be otherwise suitable for the job.
Electrical products and machines must at a minimum be divided into two categories: low voltage products which are typically home appliances and high voltage products which are often industrial tools. Because of the lawvoltage directive, technical trade barriers have been ali but eliminated in this sector, which in itself is quite promising. Severe trade barriers remain however in the second product sector. These latter barriers, like building materials, are created by ali three barrier types: differences in technical standards, regulations and certification and testing procedures. The case of wood cutting machinery will be discussed below.
Because Telecommunications equipment does not per se affect public health, safety or the environment,industry specifications are maintained through the respect of technical standards rather than legally based regulations. Moreover, these standards differ substantially from one country to another. However, due to the strategie nature of the telecommunications industry, and the fact that the state-controlled PTT is often the main buyer of equipment and thus can impose standards on the domestic industry, differences in standards and certification processes are only slowly being aligned. A recent paper developed for the Commission cites four main technical trade barriers in the telecommunications equipment industry(9>:
differences in standards
over-specification of technical requirements
excessively costly, complex duplicative testing procedure
lack of clear administrative processes.
Apparently, both consumer premise equipment {eg PABX, telephones, etc.} and central office computers (eg public switching systems) are equally affected. The example of PABX will be discussed in sorne detail below.
(9) Deutsches Institut fur Wirtschaftsforschung, "The Economie Benefits of a Common Concept for Telecommunications within the European Community" 1986.
ParAgro3727188
GROUPE MAC

- 142 - /16/
B. Description of illustrative cases
This section examines technical trade barri ers in more detail through six case studies,one for each industry considered. For each case study, we describe the technical trade barrier, evaluate it with respect to its origin and "justification", and present the potential economie impact of its removal.
Contained in the six examples are two cases of technical standards, two cases of regulations and two pure cases of testing and certification. Each case offers the reader a deeper insight into the causes and impact of technical trade barriers. Exhibit 2 presents the six barrier cases studies and their classification by barrier type.
EXHIBIT2
TYPE
TECH NI CAL AUTHORIZA TION BARRIER STANDARDS REGULATIONS
& CERTIFICATION
Foodstuffs Pasta purity law x xxx Pharmaceuticals Registration process x xxx Automobiles Type Approval xxx x Building Materials Building til es x xxx x xxx Electricical Products and Machines x xxx xxx x Wood cutting tools
Telecommunications PABX standards xxx x x xxx
Before describing these in more detail, it will be useful to briefly review a simple three criteria test used by the Commission to evaluate the justification--as guaranteed by Article 36-- of technical trade barriers imposed by member states to protect safety, health and the environment(10l.
(10) A. Mattera, "les barrières frontalières à l'intérieur de la CEE et l'action menée par la Commission pour leur démantelement", Revue du Marché Commun, n°307, May-June 1987.
ParAgro3727188
GROUPE MAC

- 143 - /17/
Towit:
Criteria of causality : there must exista direct cause and effect relation between the trade restrictive measure and the objective or "essential requirement" being pursued.
Criteria of proportionality : the trade restrictive effects of the measure should not be disproportionate with respect to the objective being sought.
Criteria of substitution : if a noth er means exists to attain the objective that does not hamper trade, then this criteria is not met. The substitution criteria is perhaps the most important of the three.
Though these criteria were designed for evaluating adherence to Article 36, which necessarily concerns only legally imposed barriers to trade {i.e. technical regulations), they can be usefully applied to any technical trade barrier, including those caused by differences in standards. How then do each of these case studies stand up to the three criteria test?
ParAgro3727188
GROUPE MAC
- 144 - /18/
1. Foodstuffs
Composition ru les are common in the European foodstuffs industry. Among the most significant from an economie standpoint are the so called pasta purity laws in ltaly, France and Greece. This case study concerns the ltalian version which was adopted as law in 1967.
Very simply, the law states that in arder to use the generic product name "pasta", the product must be composed exclusively of duram wheat, as opposed to the less expensive soft wheat. Historically, the law was erected to help ltalian duram wheat farmers (essentially in the South) secure a market for the ir product. The only other commercial use of duram wheat is for couscous, a market of considerably smaller size. lnterestingly, before the law was erected, "mixed pasta" made with a combination of soft and duram wheat accounted for up to 50 % of ltalian pasta consumption. After the law was introduced, this proportion feil to close to zero. This barrier falls under the category of a technical regulation (see exhibit 2) and like most foodstuffs it is not associated with a testing procedure.
With respect to the three criteria test, the case of the pasta purity law is quite clear from the author's perspective. First, causality ; it is not apparent that the consumer is "protected" by the pasta purity law. The consumption of mixed pasta does not pose a health risk and there is no reason to assume mixed pasta, which is typically associated with lower quality at lower priees, would "drive out" pasta made from duram wheat. ln fact, industry experts believe a substitution of 10-20% is the most likely scenario.
Second, proportionality ; the law effectively prohibits ali imports of mixed pasta from other European countries where this form of pasta is consumed and produced (e.g. England, Holland, Germany.) lmports of pasta into ltaly account for less th an 0.05% of total consumption.
Fi nally, substitution ; to the extent th at con su mers need to be "protected" from mixed pasta, this can be accomplished through labeling without the adverse trade hampering effects.
Th us the pasta purity law satisfies none of the criteria that could justify its existence from the perspective of article 36 of the Treaty of Rome. Wh at are the "costs" therefore of this technical trade barrier.
Without repeating the analysis, the MAC Group has demonstrated the direct cost savings that could accrue to consumers from the removal of this law are the arder of 20-60 million Ecu per year. These costs result from the savings that could be realized from the substitution of a lower cost ingredient, in this case, soft for duram wheat, in the production of pasta.
Indirect effects are likewise significant. ln the short term, imports into ltaly cou Id increase dramatically, accounting for up to 5 % of consumption. This would then decrease as local pasta producers geared up their production facilities to serve the newly created product segment. ln addition, the re moval of the law could speed up the eurre nt industry consolidation ta king place, ultimately helping extra-community trade in the process as larger more powerful pasta concerns are formed with an increased capacity to export.
ParAgro3727188
GROUPE MAC

- 145 -/19/
2. Pharmaceuticals
From a technical barrier stand point, testing and certification procedures are the most significant trade obstacles in the pharmaceuticals industry.
If a pharmaceutical product is to be admitted to a particular national market within the EEC it must first be approved by the national registration authority. Each authority is free to make its own decision. Closely linked to this are the pricing and reimbursement decisions th at local authorities make on an individual drug basis. Drug registration, combined with pricing/reimbursement decisions, forms a potential barrier to the unification of the community pharmaceutical market. How does this barrier stand up to the three criteria test?
From a causation stand point, it can be arg ued th at the testing and certification procedures do protect public health and thus pass the first criteria. However, testing and certification procedures fail the proportionality and substitution tests. Namely, the trade distorting effects cou pied with the feasibility of either centralized testing {similar to the FDA) or a mutual recognition approach lead to a rejection of this barrier based on the criteria test.
The largest direct effects of the individual testing and certification processes are increased delays and administrative costs. At the present time no country can meet the official 120-day limit. The European average is in the 18-24 month range, but delays up to three years have been reported. The cost of delays and duplication for a company wishing to introduce a product across the community as a who le can be significant. One estimate has placed these costs on the order of 0.5-0.8 % of total industry costs within the community(11l. Other industry observers have suggested that this could be an underestimate.
An indirect effect of this technical barrier is the continued fragmentation of pharmaceutical manufacturing throughout the Community. The high value per weight of the product lends itself to a strategy featuring centralized production and exports. However, currently sorne 250 pharmaceutical plants are scattered about the Community. Companies pol led on this subject revealed that their direct investment in individual countries was practically a sin qua non of doing business. "If we were to close down our plant in--, we'd never get another priee increase there." (11)
If however the industry could consolidate, the gains could be large. Benefits in terms of both labor and capital saved could amou nt to 0.3-0.8% of total industry costs.(11l
The overall implication is significant for the pharmaceuticals industry. Between 0.8-1.6% of total industry costs cou Id potentially be economized if ali technical barriers were removed.
(11) See a study for the European Commission by Economists Advisory Group, "Research on the Cost of Non-Europe, The Costs of Fragmentation in the European Community's Pharmaceutical lndustry and Market", November 1987 (forthcoming}
ParAgro3727188
GROUPE MAC

- 146 - /20/
3. Automobiles
Like pharmaceuticals, the principal technical trade barrier within the automobile industry is in the area of testing and authorization procedures. Since the 1970's, the Commission identified and then went about the process of harmonizing 44 "essential requirements" that an automobile must meet in order to guarantee free shipment from one country in the Community to another. Today, EC directives exist for 41 of these requirements. The requirements which remain to be harmonized are tires, weight and sizes, and windshields.
The implication of this is that type approval from an EC standpoint is not feasible. Because directives do not exist for the whole gambit of essential requirements, type approval must take place on an individual country basis. ln addition, neither the majority of industry members nor certain EC governments are in favor of trying to harmonize the remaining directives. Why would this be the case?
Certain national governments, notably France, are concerned about control ling imports originating outside the Community. If local approval did not exist and if border customs checkpoints were eliminated, France would have more difficulty in stopping, say, Japanese imports from entering the country via a neighboring country. For this reason, sorne member governments are not supporting efforts to harmonize the remaining three directives. National manufacturers and their distributors are also concerned about extra-community imports. They have th us joined their governments in slowing down the harmonization process.
Examining the criteria test this author finds that none of the criteria is met. Given 41 requirements are already harmonized, type approval is not necessary for protecting health, safety of the environment (causality). lt thwarts the free movement of goods across community borders (proportionality) ; and public health, safety and environmental requirements could be equally weil upheld through finishing the harmonization task coupled with mutual recognition of testing and certification procedures (substitution).
If automobiles could be approved in just one country and then be freely exported to other countries, the direct cost savings could range from 14-22 million Ecus(12l. Indirect benefits include increased consumer choice, namely the freedom to purchase cars anywhere in the Community for domestic consumption.
(12) Based on a study for the EC Commission by Ludvigsen Associates Limited "Research on the Cost of non-Europe- The EC92 Automobile Sector: Executive Summary", 1987.
Par Agro3 727188
GROUPE MAC

- 147 - /21/
4. Building Materials
Not unlike different recipes in foodstuffs, the fragmented nature of building materials used throughout Europe have contributed to a large, though predictable, body of technical trade barriers in this sector. Many examples exist where building material manufactures of one country, often working with standardization organizations, erect ali three types of barri ers to prevent competition from abroad. Building tiles provides a good example.
The market for glazed and unglazed building tiles is large, approximately 3.2 billion Ecus per year, owing to the common use of these products in both public and private buildings. The European market is dominated by ltaly and Spain, who between them posses a 79 % share of the total volume of production (see exhibit 3).
EXHIBIT 3
PRINCIPAL PRODUCERS OF 1985 PRODUCTION SHARE OF EC BUILDING TILES (MILLION SQ. M) PRODUCTION
Ital y 300 58%
Spain 110 21%
German y 40 8%
France 25 5%
Other EC 45 9%
Total 520 100%
Source: BIPE
ParAgro3727188
GROUPE MAC

- 148 - /22/
ln addition, the Spanish and ltalian products are less expensive than their European competitors (see exhibit 4).
EXHIBIT 4
PRICE INDICES (SPAIN •100)*
PRODUCING COUNTRY
GLAZED UNGLAZED
German y 193 249
Den mark 142 268
France 127 172
Holland 115 183
Ital y 126 163
UK 98 116
Spain 100 100 Source : BIPE Note: Priee index based on 1980 export priees
ln France, domestic tile manufacturers feeling pressure from ltalian and Spanish competitors worked through AFNOR to create an especially stringent standard for ti les (UPEC). Any building material expert will admit this standard is overly restrictive with respect to the essential requirements it should be designed to protect.
Given this is a standard and not a regulation, non-standard til es may still be sold in France but they may not be used in public works (about 40% of the market) and architects and building engineers are reluctant to use them. If an accident occurs as a result of the non-standard ti les, insu rance companies could refuse damages daims.
The standard is coupled with a certification process, which reportedly can take from severa! months to a year's delay. Moreover, the product must be tested and certified on an annual basis. Together these technical barriers have effectively reduced the flow of tiles into France from its southern neighbors. Reportedly, similar standards and testing procedures are being developed in Germany, Holland, and the UK(13l.
Like type approval for automobiles, the technical trade barrier for ti les fa ils ali criterià and therefore is difficult to justify on legal grounds. While this particular example is a candidate for mutual recognition, other building material products, due to their safety and public health implications, cou Id require a harmonization of standards.
(13) A draft directive on construction materials should help to eliminate this trade barrier. See "Proposai for a Council Directive on the approximation of the laws, regulations and administrative provisions of the member states relating to construction products (Com (86) 756 final/3)
ParAgro3727188
GROUPE MAC

- 149 - /23/
The direct costs of the trade barri ers for building til es are important. If these restrictions prevent Spanish producers from doubling their marketshare in France, (the ir current share is about 10% ), they are casting French consumers about 3% of the value of the ir domestic expenditures on til es, or $15 million.
Indirect effects cou Id a Iso be pronounced. Ti le manufacturing lends itself to significant scale economies. ln a barrier free EC, it could be expected that significant consolidation in the tile industry would take place. Centralized production units would serve distant markets through experts programs. Overall, this should exert downward pressure on priees, further benefiting consumers.
ParAgro3727188
GROUPE MAC

- 150 - /24/
5. Electrical Products and Machines
Given the low voltage directive has ali but eliminated technical trade barriers in household appliances, it is more revealing to draw a case from the high voltage sector. The case of wood working machines has been chosen, based on a recent paper submitted to the Commission(14l.
Regulations for the commercialization of wood working machines, differ significantly in France as compared to Germany, ltaly and the UK. ln France, additional safety deviees (protective hoods) are required and machines must be tested and approved through the Minister of Labor. ln addition a separate testing and certification process is required. The testing procedure must be repeated for each type of machine to be imported and takes from six months to a year to complete. By comparison, similar tests in ltaly, Germany and the UK take two to three months.
ln this case, the three criteria test is less clear. lt could be argued that protective hoods are necessary for the safety of the French workers. The fa ct that other countries do not require the same measures is a philosophical difference in the needed level of protection. One implication is that the simple policy of mutual recognition would not resolve the problem, and a harmonization would be necessary. However, the cumbersome testing procedure and delay cannat be readily justified by the criteria test.
EC suppliers of wood working machinery have reacted in different ways to this trade barrier :
Many, notable UK suppliers, do not attempt to export to France,
ltalian manufacturers have modified their products and export only a standard model to France, thereby economizing on testing costs,
German suppliers export only machines with an automatic feed mechanism, which circumvents the worker safety requirement.
lt has been estimated that the direct impact of the French regulations and testing procedures increases the cost of imported machines by 20-30% of the machine's value. If technical regulations were harmonized at a "nonFrench" level, scale economy (indirect) effects on the order of 3-5 % of production costs cou Id a Iso be realized<14l.
(14) Gewiplan, "The Realization of a Joint Domestic Market"
ParAgro3727 188
GROUPE MAC

- 151 -/25/
6. Telecommunications Eguipment
A recent paper by the DIW(15l presents convincing evidence on the existence of technical barriers in the PABX (private automatic branch exchange) market and it is to this topic that we now turn for the sixth and last case study.
The principal thesis is that the EC market for PABX is fragmented as a result of differing national technical and regulatory standards. This arises from two sources which correspond, once again, to differences in technical standards and a costly testing and certification program :
differences in standards and over-specification of requirements,
excessively costly, complex and duplicative testing procedure without clear administrative processes.
Despite efforts to harmonize standards, differences still exist across major EC members. ln addition, standards are imposed " ... weil beyond th ose needed to avoid network damage"(15l.
Besides differing standards, delays surrounding the approval process and the lack of a formai appeal procedure compounds the technical trade barrier ; foreign companies may not have enough confidence in the integrity of the approval process to even attempt to obtain approval for their products. Below is a table comparing the various delays and appeal procedures a cross major EC countries with th ose of the US(15l.
FOR MAL COUNTRY DELAY APPROVAL APPEALS
PROCEDURE
Belgium 3-6 months PIT No
France 12 months PIT No
Germany 6-12 months PIT No
Ital y 6-12 months PIT No
UK 3 months (min) British Approval Y es Board
us less than 10 weeks FCC Y es
(15) Deutsches Institut fur Wirtschaftsforschung, "The Economie Benefits of a Common Concept for Telecommunications within the European Community" 1986.
ParAgro3727188
GROUPBMAC
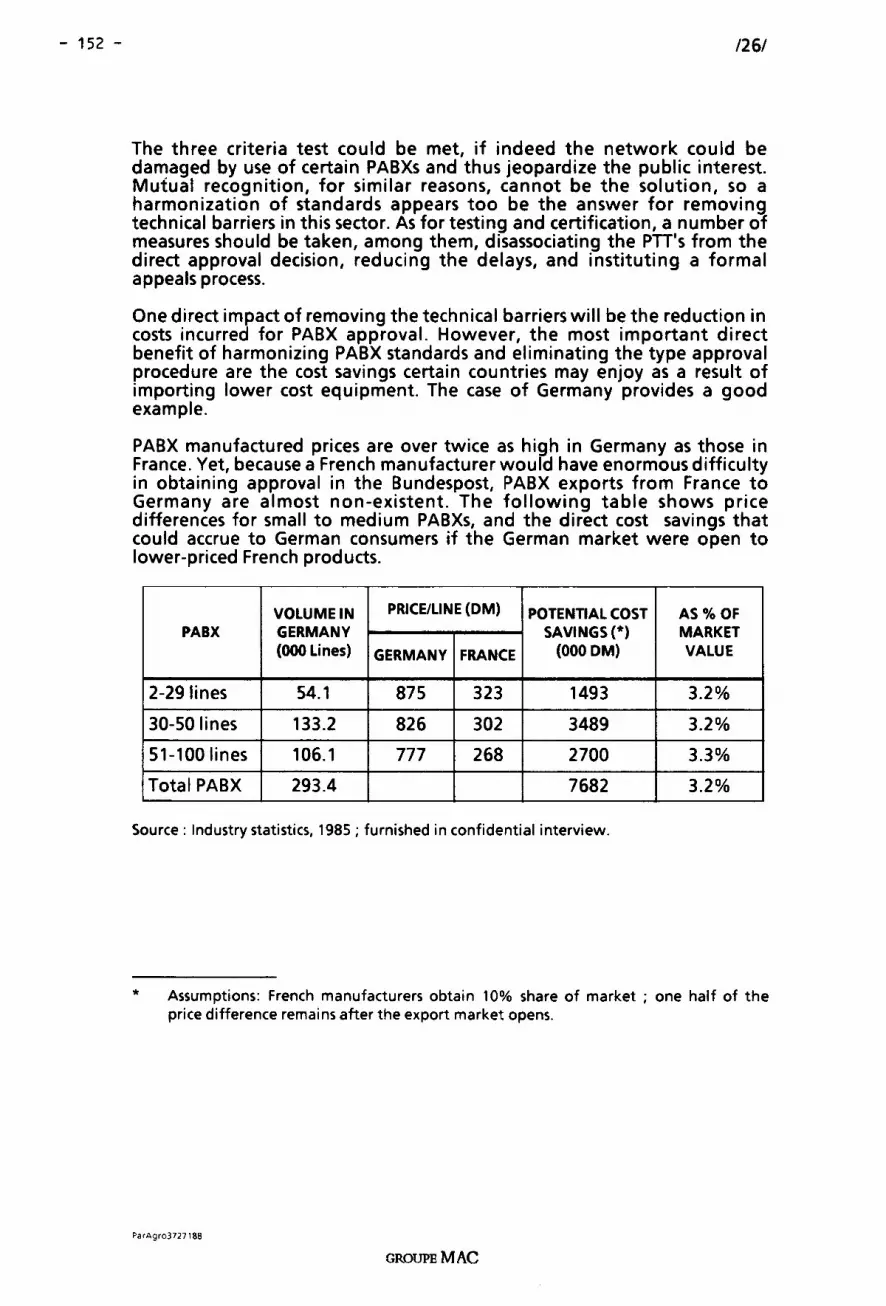
- 152 - /26/
The three criteria test could be met, if indeed the network could be damaged by use of certain PABXs and thus jeopardize the public interest. Mutual recognition, for similar reasons, cannat be the solution, so a harmonization of standards appears too be the answer for removing technical barriers in this sector. As for testing and certification, a number of measures should be taken, among them, disassociating the PTT's from the direct approval decision, reducing the delays, and instituting a formai appeals process.
One direct impact of removing the technical barriers will be the reduction in costs incurred for PABX approval. However, the most important direct benefit of harmonizing PABX standards and eliminating the type approval procedure are the cost savings certain countries may enjoy as a result of importing lower cost equipment. The case of Germany provides a good example.
PABX manufactured priees are over twice as high in Germany as those in France. Y et, because a French manufacturer wou Id have enormous difficulty in obtaining approval in the Bundespost, PABX exports from France to Germany are almost non-existent. The following table shows priee differences for small to medium PABXs, and the direct cost savings that could accrue to German consumers if the German market were open to lower-priced French products.
VOLUME IN PRICE/LINE (DM) POTENTIAL COST AS%0F PABX GERMAN Y SAVINGS(*) MARKET
(000 Li nes) GERMAN Y FRANCE (000 DM) VALUE
2-291ines 54.1 875 323 1493 3.2%
30-50 lines 133.2 826 302 3489 3.2%
51-100 lin es 106.1 777 268 2700 3.3%
Total PABX 293.4 7682 3.2%
Source: lndustry statistics, 1985; furnished in confidential interview.
* Assumptions: French manufacturers obtain 10% share of market ; one half of the priee difference remains after the export market opens.
ParAgro3727188
GROUPE MAC

- 153 - /27/
The table suggests that a direct cost reduction of over 3 % of total expenditures on PABXs (equipment only) could be realized if French manufacturers could capture a 10% market share in Germany.
Indirect benefits are equally compelling and include:
reducing the current fragmentation of the PABX industry allowing it to enjoy the significant scale economies in production and r&d,
increasing the incentive to experiment, which will a id the inovativeness of the European industry,
reducing entry barriers to encourage start-ups of small firms wishing to attack selected market niches.
Ali these features should increase specialization among current producers, encourage trade, and strengthen the EC industry with respect to global competitors.
ParAgro3727188
GROUPE MAC

- 154 - /28/
IV. CONCLUSIONS
• The elimination of technical trade barriers is a sin qua non condition for creating a single EC market in 1992. Businesses polled on the subject view technical trade barri ers as one of the two most severe obstacles to trade within the Community.
• Significant technical trade barriers exists in each of the six sectors considered in this study. Of the six specifie technical trade barriers examined, none indisputably met, in the author's view, ali three criteria which "justifies" a technical trade barrier.
• Ali member countries have similar goals for protecting health, safety and the environment. Differences on how these goals should be reached accounts for a large reason why the technical trade barriers exist. Two additional reasons explain why certain technical trade barriers are especially difficult to remove:
protection of special interests,
protection of a "strategie industry".
• ln theory, the principle of mutual recognition and the (ongoing) harmonization of essential health, safety and environmental requirements should eliminate technical trade barriers. ln practice, this has not yet been the case. Because of the manoeuvres of member countries, the inherently slow process of adopting EC directives, and uncertainties businesses have about legal recourse, technical trade barriers have proved extremely difficult to overcome.
• The new approach to removing technical trade barriers, and the harmonization of standards that it promotes, should speed up the process of removing technical trade barriers.
• Removing barriers will generate economie benefits to both producers and consumers throughout the Community. ln the six sectors studied, the existence of technical trade barriers reduces consumer choice, delays the introduction of new products, and causes higher relative priees for similar products.
ParAgro3727188
GROUPE MAC

- 155 -
s.
The •cost of Non-Europe•:
Some Case Studies on Technical Barriers
GEWIPLAN

THE «COST OF NON EUROPE": SOME CASE STUDIES ON
TECHNICAL BARRIERS
EXECUTIVE SUMMARY
FEBRUARY1988
Gesellschaft für Wirtschaftsfbrderung und Marktplanung mbH
Friedrich-Ebert-Anlage 38 D-6000 Frankfurt a. M.-1 Tei.Sa.Nr. 069-7404 71 Telex: 412998 gwpl-d Cable: Gewiplan

- 159 -
- I -
CONTENTS
Introduction
PART A: THE NATURE OF THE PROBLEM
1. Technical Specifications
2. Harmonization of Technical Specifications
3. Removing Technical Barriers
PART B: CASE-STUDIES
1. Remarks
2. Methodology
3. Results of Fact-Finding
2.1 Technical Specifications
3.2 Results
Page
1
4
4
6
8
1 0
10
11
12
12
1 3
3.2.1 Lifts 13
3.2.2 Dishwashers 14
3.2.3 Weighing Equipment 15
3.2.4 Wood-working Machines 18
3.2.5 Fire Protection Products 24
PART C: CONCLUDING COMMENTS: THE PRODUCT POSITION IN THE MARKET 26


- 161 -
- 1 -
Introduction
In the course of the "Cost of Non-Europe" study, GE~VIPLAN
was commissioned to analyze the problems surrounding
"Technical Barriers".
The work entailed:
identification of existing technical barriers
description of possible differences in technical
specifications between the relevant countries,
Germany, France, Italy and Great Britain
determination of the possible impacts of a
harmonization of technical specifications
From the numerous products available for which technical
barriers exist, the following products were selected.

- 162 -
product group:
relevant products:
product group:
relevant product:
product group:
relevant product
product group:
relevant products:
product group:
relevant products:
- 2 -
wood working machines
planing machines
single-spindle type
multi-spindle type
testing and measuring
equipment
weighing machine,
especially mechanical
weighing machines for
consumer purposé (household
and kitchen balances)
low tension product
household dishwashers
fire protection
doors (inhouse)
plates (inhouse)
electrically driven lifts
electrically driven
passenger lifts
electrically driven
material lifts
- 163 -
- 3 -
The criteria applied in selecting the products were:
already executed harrnonization of technical
specification
non-executed harrnonization
In order to ascertain the impact of already executed or
future harrnonization, case-studies were carried out with
rnanufacturers. The Executive Surnrnary presented is
cornposed of three chapters:
PART A:
PART B:
PART C:
contains a short description of the
justification for the existence of
technical specifications; a definition
of technical barriers; and the efforts
by the EC for harrnonization.
This section contains the results of
the case-studies.
concluding cornrnents
- 164 -
- 4 -
PART A: THE NATURE OF THE PROBLEM
1. Technical Specifications
Technical Standards are basically designed by
manufacturers themselves.
The classical form of technical standards arising
from industrialization served to rationalize
production. The objectives were:
simpler production
reduction of types
increase of lotsize
cheaper products
The fact that technical standards are formulated for
increasingly more areas, which even the judiciary
now refers to, means an extension of the aspects
involving technical specifications.
We must distinguish:
technical standards
technical regulations
technical certification

- 165 -
- 5 -
Technical standards are voluntarily agreed codifica
tions of the form, functioning, quality, compatibil
ity and/or exchangeability of methods, products,
processes and services.
Technical regulations are specifications as to form,
construction, performance (etc.) of products,
service and sometimes even of processes and methods,
included or referred to in public law, e.g. for
health, safety, environmental and consumer protection.
Technical certification comprises arrangements such
as technical inspection, testing and comparisons,
for identifying conformity to given standards or
regulations. The evidence is usually found in testing
reports. For simplicity, products may carry and
marketing may employ approval signs and comformity
of certification marks.

- 166 -
- 6 -
2. Harmonization of Technical Specifications
Harmonization implies the existence of varying
technical specifications. Technical standards are
indeed voluntary agreements between firms, however,
inter-firm and branch-specific aspects are
frequently devised with the possible consequences
that foreign suppliers are confronted with competi
tive disadvantages. In arder to realize supra
national interests, the national organizations,
such as DIN, AFNOR, BSI etc., cooperate under the
framework of CEN and CENELEC.
At the end of 1983, only 147 European standards had
been adopted by CEN and CENELEC together; draft
standards in total numbered 290; CENELEC harmoniza
tion documents amounted to 320 and draft CEN/CENELEC
harmonization documents added up to 147. On the
ether hand, in 1983 DIN was said to have adopted
23,000 standards, AFNOR approximately 18,000 and
BSI sorne 13,000. 1)
If an internal market is to be realized, any
divergences in national technical specifications
must be harmonized.
1) see: Pelkmans & Vanheukelen, Coming togrips with the internal market, EIPA, 1986

- 167 -
- 7 -
Increasingly Mutual Recognition is replacing old
style harmonization.
The mutual recognition principle was already referred
to in the Treaty of Rome in the context of professional
qualifications, and introduced relatively early in
the financial sector. It began to be used widely in
the technical standards field in the early nineteen
eighties. However, the 1985 White Paper generalised
the principle and spelt out the philosophy behind it.

- 168 -
- 8 -
3. Removing Technical Barriers
Removing technical barriers refers to activities
with respect to technical standards, technical
regulations and technical certification.
The actual problem regarding technical barriers is
not so much the possibly different technical
standards but more the technical regulations and
technical certification (a well-known exception is
e.g. the field of telecommunications).
As stressed previously, technical standards are of
a voluntary nature; technical regulations have a
predominantly legal character primarily involving
the implementation of national environmental and
safety measures. Internationally-active companies
themselves are interested in orientating the national
technical standards to international practice. The
expert discussions conducted made it clear that the
companies consider technical standards as unproblem
atical with regard to an international exchange of
goods. Technical regulations and technical certifica
tion are based on national considerations, whereby
safety aspects, consumer protection and environmental
aspects dominate. Due to the influence of these
interests, technical regulations are created which
differ between states, i.e. the creation of trade
barriers is a possible side-effect.

- 169 -
- 9 -
Such technical barriers are of a partially pro
hibitive nature in the case of wood-working
machines and, to a certain extent for fire
protection products and weighing equipment.

- 170 -
- ·10 -
PART B: CASE-STUDIES
1. Remarks
The work of GEWIPLAN is not so much to analyse and
quantify the costs and benefits of technical specifica
tions as such, but to scrutinize the effects of removing
technical barriers among EC-Mernber States' markets
in the five product groups, electrical lifts,
wood working machines, consumer orientated mechanical
and electro-mechanical weighing machines, dishwashers
and specifie products of the fire-protection sectors
(doors and panels).
- 171 -
- 11 -
2. Methodology
The evaluation of public statistics in the study
relevant countries, Germany, Great Britain, Italy
and France was accompanied by conducting expert
discussions with individual manufacturers from
each country (84 expert discussions altogether).
This producted firm-specific estimations of a
largely qualitative nature.

- 172 -
- 12 -
3. Results of Fact-Finding
The effects of removing technical barriers depend
on, amongst other things, the market situation,
competition, the product and the divergence of
regulations.
3.1 Technical Specifications
The level of harmonization of technical specifica
tions involving the products analyzed can be
devided into two groups:
Product group 1: harmonization already conducted
dishwashers (low voltage
directive)
lifts (EN-81 standard)
mechanical weighing equipment
(directive)
Product group 2: lack of harmonization measures
woodworking machines
fire protection products
- 173 -
- 13 -
3.2 Results
3.2.1 Lifts
As a result of the EN-81 standard published in 1984
techncial barriers no longer exist in this sector.
A concentration process began in the sixties and
was completed in the middle of the seventies. A
number of companies were bought out/stopped produc
tion. Today there are five important suppliers
within the four countries. Production volume fell
from 25,900 units to 21,900 units, which represents
a decrease of approximately 16 % between 1974 and
1985. This was caused on the one hand by the very
close correlation between construction activity and
the demand for lifts and the substitution of
electrically driven lifts by hydraulic driven lifts
on the ether. (The EN-81 refers only to electrically
driven lifts.) 1985, the share of hydraulically
driven fifts amounted to 35-40 %; in 1975 this share
amounted to 10-15 %. Manufacturers also do main
tenance work.

- 174 -
- 14 -
3.2.2 Dishwashers
The low voltage directive has applied to this
sector since 1976. Remaining technical differences
(e.g. the UK's 240 volt system) create no serious
problems for trade.
In the case of dishwashers, concentration also set
in in the sixties. Today there are approximately
6-8 firms active in this market, whereby there are
none in the UK and only one manufacturer in France.
Italian production primarily involves contract
production for foreign suppliers who still partially
exploit the comparative cost advantages. Production
of dishwashers rose in the period 1975/1980 by
approximately 38 % (from 1.4 mio. units to approx
imately 1.9 mio. units).

- 175 -
- 15 -
3.2.3 Weighing Equipment
The EC guideline of 1/7/1982 has led to a harmoniza
tion of the technical specifications being
conducted. De facto, however, considerable differ
ences still exist particularly those caused by
testing and certification requirements.
Mechanical weighing machines are being increasingly
replaced by electronic scales, particularly in the
case of industrial and shop scales. The demand for
mechanical household scales is stagnating. Manufac
turers of scales who did not switch into electronic
scales have had to move into up-market niches. To
survive they have had either to rely on low wages
or to introduce rationalization investment.
As a result we observe:
few important suppliers in the mechanical
scales market (1-2 manufacturers per country)
substantially identical manufacturing costs
with divergent costs structure
The average manufacturing costs for personal scales
amounts to approximately 7-8 ECU. The structure
of the costs are comprised of the following:

- 176 -
- 16 -
10-20 % plant costs, 30-40 % personnel costs and
approximately 40-50 % material costs. The size
of the material costs is influenced by the
existing model variety
divergent national technical regulations.
The divergent national regulations primarily concern
the calibration and scaling. Therefore, in France
e.g. - as opposed to the ether countries - there
exists a calibration obligation for scales with a
load exceeding 350 g. In Great Britain the units of
weight must correspond to the imperial system. There
are also differences regarding the limits of
calibration errer. In Italy and Great Britain this
amounts to +/- 1 d from zero to maximum load, where
as the errer limit in France and the FRG amounts to
+/-1 0.5/1/1.5 d. These divergent regulations lead
to an increase in the number of components so that
a manufacturer supplying all countries requires
8,000 components. Harmonization could result in
reducing this number to approximately 800-1,200,
which would represent a material costs saving of
approximately 15-20 %. With average material costs
of approximately 40-50 % - related to manufacturing
costs - this would represent a savings per balance
of approximately 0.2-0.8 ECU.

- 177 -
- 17 -
Possible harmonization of technical certification
and technical regulations has only slight impacts
because:
manufacturer concentration has not yet taken
place
adaption investment has been carried out
demand is stagnating.
The direct effect of harmonization will be in the
arder of magnitude of less than one percent. 1 )
Indirect effects will result from possible
reduction of components as well as a more
efficient utilization of production capacity.
Due to the type variety (= small lot sizes) as
well as the relatively large share of manual work
in the manufacturer of scales (calibration), cast
reduction with a rise in output is very slight.
Related to manufacturing costs, costs reduction
would amount to less than 3 %. With a stagnating
output of approximately 10 mio. scales in Europe
(approximately 50 % thereof in the relevant
countries), costs savings would amount to an
approximately maximum of 2 mio. ECU.
1) test costs per type: 2,000 ECU, related to an output of at least 200,000 units at 7-8 ECU, this represents a cast share of less than 1 %

- 178 -
- 18 -
3.2.4 Wood-working Machines
Harrnonized technical standards do not exist.
However, different regulations only exist in France.
Sirnilar norrns apply in Gerrnany, the UK and Italy.
In July 1980, various decrees concerning the general
safety of machines and deviees were issued by the
French governrnent. Regulations for the forrnal
implementation of these regulations were published
in 1981 and 1982, and also carne into force in 1982.
The new rules tighened both safety standards and
testing procedures. Under decrees 81-170, 171, 172,
173, 408, 409, 410, and 411, there are new rules
for self-certification, for a "visa d'examen
procedure", and for homologation.
According to the type of machine, the costs for
additional protective facilities arnount to approx
irnately 1,200-1,400 ECU per machine. These
additional regulations apply to all suppliers, even
the French, i.e. they are cornpetitively neutral
(upwards trend of econorny of scale curve).

- 179 -
- 19 -
The consequences of the French regulations are as
follows:
Tests are frequently duplicated and repeated, which
imposes heavy travel and transport costs, as well
as requiring complex and duplicated French-language
documentation for each separate test. Test fees are
300-800 ECU per test. Making suitable assumptions
about adaptation costs, production and export
volumes, we estimated that compliance with no French
norms would raise priees by 6.6-20 % per machine.
Firms interviewed reported figures of 7-10 % extra
costs.
The testing duration itself is between six months
and a year. In the other countries, Italy, UK,
FRG, the test duration extends to 2-3 months only.
The firms react to the French decrees in varying
manners:
sorne foreign suppliers did not carry out
adaption investment with the consequence that
no machines are exported to France
in so far as it was accepted, manufacturers of
special machines passed on the full cost of
the priee rise to the customer

- 180 -
- 20 -
Italian manufacturers carried out product
improvement and concentrated on exporting
smaller, standardised machines to France
German manufacturers primarily supply CNC
controlled machines with automatic feeding of
the workpiece, i.e. this new technique takes
the safety aspect into account
there are no noteworthy British experts to
the French market
Taking the described state of affairs into account,
the following direct costs of a non-realised
internal market will arise:

Planing, milling or moulding machines (1986) in mio. ECU
Production
Imports
Imports share
Exports
Exports share in %
share of
single-spindle type
multi-spindle type (production 1985)
France
17.5
9.5
54 %
6.9
39 %
60-70 %
30-40 %
Ital y
48.7
5.6
11.5 %
31.6
64.9 %
98 %
2 %
UK
9.4
8.0
85 %
5.3
56.4 %
80 %
20 %
German y
1 01 • 5
1 3. 3
1 3. 2 %
100.0
98.5 %
6 %
94 %
...... 00 ......

- 182 -
- 22 -
Based on the French foreign trade data - imports -
and the focal points of production in each country
the following results:
French imports of planing, milling or moulding machines (in 1,000 ECU)
Total
EC
German y
Ital y
UK
other countries
1) estimations
1983 1984 1985 share of
1986 conv~nti?~al mach1.nes J
in % in 1 '000
ECU
7,256 6,770 7,872 9,528
6,907 6,587 7,442 9,030
4,508
1 1967
257
350
4,165
2,143
1 98
183
5,624
1 '7 31
26
430
5,716
2,920
212
498
6
98
80
343
2,860
170
3,373
In 1986, French imports of (conventional planing,
milling or moulding machines amounted to approxi
mately 3,3 mio. ECU. The direct effect of
harmonization at the French level would accordingly
amount to approximately 0,2-0.33 mio. ECU. From
the longer term viewpoint the complete market
situation must be considered. The demand for

- 183 -
- 23 -
conventional planing, milling or moulding machines
is tendentially stagnating/declining.
Consumption of planing, milling or moulding machines (in mio. ECU)
France Ital y FRG UK
1983 1 9. 2 28.9 32.6 11.9
1984 16.7 20.8 1 0. 7 10.2
1985 1 9. 0 34.0 31 . 2 1 2. 7
1986 2 0. 1 22.8 14. 7 8.3
Source: estimations
Total
92.6
58.4
96.9
65.9
Harmonization of the technical regulations at a
"non-French level" could lead to an expansion of
production, particularly for the Italian manufacturers. The expense of French manufacturers,
i.e. the number of French manufacturers
(currently approximately 6 firms) would be
reduced. The initial basis for further observa
tion is the French production volume, which
amounted to 17.5 mio. ECU in 1986. Taking into
account the well-known economies of scale in
mechanical engineering of approximat@ly 3.5 % in

- 184 -
- 24 -
the case of a rise in average lot size to approx
imately 30-40 units, this results in cost reduction
of 17.5 mio. ECU x 3-5 % = 0.5-0.9 mio. ECU.
3.2.5 Fire Protection Products
Harmonized standards do not exist in this field.
Considerable differences exist in each country
regarding the demands on the products in the case
of fire. The strictest regulations are int'he FRG,
followed by the UK, France and Italy.
Production of fire protection doors and panels (in mio. ECU)
Production UK 1 ) F I FRG
1983 102 34 2 99
1984 110 33 4 100
1985 114 34 5 88
1986 116 37 7 106
1992 130 85 20 140
Total
237
247
241
266
375
1) also contains, among others, fire protection adhesives and mortar
Source: estimations, based on interviews

- 185 -
- 25 -
Trade is negligible due to regulatory divergences,
which or example raise UK and German product priees
in Italy, e.g. a domestic fire protection plate
costs 5-6 ECU per m2 in Italy; a German product
costs 12.3 ECU per m2 ; an English product costs
9.6-12 ECU per m2•
Manufacturers would incur prohibitive fixed costs
if they tried to meet more than one set of specifi
cations.
The high costs of approval (FRG e.g.: 14,000 ECU
per plate type, UK approx. 2,500 ECU) have the
effect of acting as a barrier to market entry,
because related to a volume of approximately
500,000-1 mio. m2, this represents a product priee
increase of less than 0.1 %. Transport costs at
10-20 % of sales priee also restrict experts.
In the long run it may be assumed that harmonization
will take place at the level of UK or German
standards. If so the priees throughout the EEC could
not differ by more than transport costs from the
priee at which the most competitive EEC producers
could meet these specifications.

- 186 -
- 26 -
PART C: CONCLUDING COMMENTS:
THE PRODUCT POSITION IN THE MARKET
When the life cycle of the products is considered,
it can be seen that most of the products for which
harrnonization measures have been established are
on the decline. That this is possibly not purely
coincidence arises from the harrnonization procedure
up to now. Product-specific stipulation of
technical standards takes sorne years - even at the
national level. If the rnulti-nationality of the
procedure is taken into consideration, a period of
5-10 years was necessary to corne to an agreement.
In the meantirne, the relevant market developed in
such a way that harrnonization was "overtaken" by
market developrnent. If the intention is to realize
a domestic market by the end of 1992 then it is
necessary to reverse the harrnonization policy,
i.e. the replacement of national regulations by
EC regulations. This is in accordance with the
"new approach" in which only cornerstone data is
defined. The following was ascertained with regard
to the developrnent of each product:

turnover
market entry
Product life cycle
multi-spindle
wood-working-machine
- electronic balancers
Eire protection
products
market penetration
IIJ\R-cables
market saturation
mechanical/electromechanical balancers
single-spindle wood-working
machines
market degeneration


- 189 -
6.
The •tost of Non-Europe•:
Obstacles to Transborder Business Activity
European Research Associates & Prognos


- 191 -
Il
THE~.~COST OF NON -EUROPE:
OBSTACLES TO TRANSBORDER
BUSINESS ACTIVITY
EUROPEAN RESEARCH ASSOCIATES
&
prognos


- 193 -
THE"'COST OF NON -EUROPE~
OBSTACLES TO TRANSBORDER BUSINESS ACTIVITY
Executive Summary
Prepared by
Dr. Wolfgang Hager, European Research Associates
Dr. Heimfried Wolf, Prognos
in collaboration with
François de Lavergne
Dr. Andrew Millington
Inge Weidig November 1987


- 195 -
Table of contents
Chapter I: Introduction p. 1 Methodology P. 1
Chapter II: Findings from the business survey p. 3
1. Individual obstacles p. 4
1.1 Industrial policy p. 4_)
1.2 Company law and taxation p. 5 Au di ting p. 6 Taxes p. 6
1.3 Product/production standards p. 9 1.4 Trade obstacles p. 10 1.5 Social Policy p. 11 1.6 Capital and current transfers p. 11 2. Large and small comparues p. 12 3. Country variations p. 13
United Kingdom p. 13 France p. 13 German y p. 14 Italy p. 14
Chapter III: Measuring the costs p. 15 Estimating costs by sector p. 18
Chapter IV: The cost to the European economy p. 22
1. Cooperative networking p. 23
2. Business expansion p. 25


- 197 -
Chapter 1 Introduction
Our task was to analyse in qualitative and, if possible, quantitative terms the
economie costs incurred in transborder business activity (TBA) in the Community
which are caused by divergent and/or discriminatory laws and regulations. Our
brief was limited to manufacturing industries.
We use the term "transborder business activity" in contradistinction to arms
length trade and define it as any relationship between two firms in different coun
tries linked in a long-term contractual relationship, and each of which carry out
at least two functions with sorne autonomy from each other (e.g. selling; produc
tion; research). Only one of these functions need to be the object of a special con
tract.
The link is often, but not necessarily, accompanied by equity holdings, e.g.
a subsidiary or a joint venture. Our empirical sample was largely limited to these
two forms of TBA.
In identifying obstacles to TBA we did not limit ourselves to company law
and related issues, but tackled the problem from the standpoint of enterprises.
The broader question therefore became: in what way does regulatory diversity in
Europe either discourage firms from engaging in TBA; or cause significant extra
costs, relative to purely national operations, when they do.
Methodology
Our methodology required the scaling up of micro-economie insights to
macro-economie consequences. These insights were derived from actors (both
first hand through interviews; and second hand from academie surveys of business
behavior); and from academie analysis on the nature of modern industrial organi
sation. Only at one level, i.e. the costs of"Non-Europe" to firms engaging in trans
border business, was direct observation conceivable. Even here, given the time
constraint, we relied on estima tes of business executives interviewed. Interviews
E.R.A./PROGNOS Pagel

- 198 -
also served to identify the chief obstacles to TBA, and their micro-economie ef
fects on company performance.
Our empirical work was based on a standardised interview of sorne 70 com
panies in four countries (D, GB, F, 1) which ( collectively) bad subsidiaries (or par
ents) in most Member States. In addition, we interviewed experts in national and
EEC industrial federations and others with a working experience of our area of
enquiry.
The key to our analytical approach is contained in Figure 1, which we re
use, with variants, throughout this report. We start from the assumption that the
potential benefits of a contractuallink between two Community firms vary from
very high to negative. This is the sloping curve on the Y -axis.
Coapera~lon
b-v1t.s l'l-oft +
TBA
co
Figure 1
These potential benefits are reduced by diseconomies in management and
production which are caused by non-Europe. This is the part of reality one can
actually observe (Chapter II), and which we tried to "measure" (point Co). Multi
plied by the number ofTBA cases actually existing in the Community, these costs
are represented by the integral A in our graph. Chapter III presents the results of
our attempts at quantification.
There is a point - BM - where these Euro-caused costs become larger than
the benefits ofwhat would otherwise be profitable cases ofTBA. This creates in
tegral B, a theoretical construct which we cannot directly observe although we
E.R.A./PROGNOS Page2

- 199 -
have ample empirical evidence that it exists. Integral B contains the "might-have
beens" of European industrial cooperation which were discouraged by non-Eu
rope. To measure the cost of this loss we have developed a "theory" of the bene
tits of TBA adapted to the concrete situation of the Community today, defining
the costs as the reciprocal, i.e. non-realised benefits. We discuss these opportunity
costs in Chapter IV.
Integral C represents that part of industry where TBA would not make sense
even in a Europe with uniform regulations for business. These are firms, or acti
vities, with local markets and no need for outside technology or components, e.g.
brick making; or small and very specialised firms who are in effect global monop
olists in their particular niches: certain machine tool and instrument makers for
instance.
Chapter II Findings from the business survey
Interviews were conducted in four major countries on the basis of a stand
ardised interview. They were conducted between September 3 and N ovember 11,
1987, and lasted from 11/2 hours to seven hours. They usually involved severa!
of the following executives:
Chief executive Head of the legal department
Acquisitions manager Export manager
Finance manager Logistics manager
In order to increase the chance of making valid comparisons even with very
small samples (15-20 companies in each country), we tried to set up interviews
with comparues from a limited number of sectors:
automobiles machinery/machine tools
pharmaceuticals telecommunication
textiles
E.RA./PROGNOS Page3
- 200 -
In addition we interviewed severa! companies from the food industry, two
computer manufacturers, a chemical company, a major rubber producer, and pro
ducers of professional and consumer electronics.
A third break-down planned in our sample, in addition to the sectoral and
national one, was that between large companies and SMEs. Here, too, we obtained
robust findings of significant differences.
1. Individual obstacles
1.1 Industrial policy
In this first item we strayed furthest from our brief to examine regulatory
obstacles, as we are dealing here above ali with the discretionary application of
national regulation. We were interested in such things as cut-offfrom (para-)sta
tal credit !ines; discrimination in R&D support and in access to procurement mar
kets for "foreign" subsidiaries; pressures to increase local content; etc. Our find
ings can be summarised as follows:
There was little hard evidence that governments discriminated widely against
subsidiaries with foreign parents as regards access to R&D funds. However, gain
ing access to national programmes sometimes necessitated an extra effort to per
suade authorities of the contribution to employment and exports; and the discre
tionary nature of decision-making left an ( only slightly discouraging) margin of
uncertainty.
However, national R&D programmes may be discontinued altogether if a
whole sector passes into "foreign" bands (consumer electronics in Germany). On
the other end of the scale, a country building up a strategie techriology from scratch,
i.e. one previously dominated by foreign technology, may practise outright dis
crimination against foreign-owned subsidiaries (telecom in ltaly).
Sorne countries with inward investment controls ( e.g. Spain) may make the
take-over of attractive companies conditional on the simultaneous take-over of a
lame duck.
E.R.A./PROGNOS Page4

- 201 - '
As regards procurement, local content (employment) considerations were
more important than ownership. Exceptions are newly established subsidiaries
(often in hi-tech areas) who have not yet acquired a national"smell" and estab
lished working relationships with the bureaucracy.
Odd cases of"local content" maximisation could be found in the pharmaceu
tical industry, where priee controls can be manipulated to that end. In Belgium,
it was charged, authorities "rewarded" local production with higher priees. In Bri
tain, it was suggested by non-British companies, priee controls are related to total
investment, including R&D. This led European companies to "overinvest" in Brit
ish R&D activities: with 4% of the world market, Britain accounted for 10% of
world research.
Non-Europe's competitive national indus trial policies encouraged otherwise
non-economie local production not just in these cases, and in the procurement
case mentioned earlier, but also because of export credits. Thus German firms
may upgrade local content in France in order to benefit from more generons ex
port finance. On the other band, products from truly integrated operations may
fall below the local content barrier in any country, and bence be excluded from
export credits, causing a competitive disadvantage from being "European".
More generally, sorne companies complained bitterly of the political risk in
volved in "going European" without the support of a "government" at that level.
In one case, a company instituted an across-the-board eut of employment of 10%
in ail its subsidiaries to forestall charges of "job-killing". This economically inef
ficient step is the politically induced cost of the private sector doing on its own
what the EC is trying in rationalising the steel sector.
1.2. Company law and taxation
Non-Europe in the field of company law, including accounting standards and
fiscal law, were the single most important source of both high start-up costs and,
more importantly, of dead-weight administrative costs and sub-optimallocation
of plant and use of resources in general.
E.R.A./PROGNOS PageS
Most broadly we can distinguish between:
different accounting practices, with considerable administrative costs of "translation" and integration for central managment control; and the administrative costs, and effects on company flexibility, of "fiscal suspicion" which sees any transfer of assets and current payments, and of profits themselves, as "hidden profit distribution", i.e. an opportunity for tax evasion.
Au di ting
Different auditing standards ( e.g. historical cost vs. replacement cost ac
counting, adjustments for currency changes,etc.) are mainly a problem for inte
grated European multinationals (EMs). The administrative problem is magnified
by the fact that companies' internai accounting ( controlling) is coloured by exist
ing legal auditing systems. Most large companies therefore have to produce three
sets of figures: th ose conforming to the national requirements of the parent com
pany, and which include the consolidated (i.e. "translated") accounts of subsi
diaries; national accounts for each subsidiary; and a standardised, firm-specific
system used by ali units for controlling purposes. The work involved in producing
legally required accounts is sometimes complicated by different reporting dates
and periods in different Member States.
While sorne of the cost of "translation" can be handled by the appropriate
software, experts are needed in both subsidiaries and parent companies to fine
tune the system. Fees for legal consultants and, of course, external auditors, are
substantial. The Fourth Company Law Directive dealing with accounting stand
ards was mentioned only by one company as having improved the situation.
Taxes
The problems caused by "fiscal suspicion" and beggar-thy- neighbour at
tempts by national tax authorities to maximise their share of an EMs total tax lia
bility have much graver consequences. They do not only cause administrative costs
but influence locational decisions regarding group administration, R&D, and pro
duction.
E.RA./PROGNOS Page6

- 203 -
The root cause of fiscal suspicion are above ail differences in profit taxes,
including structural elements such as R&D allowances etc. Companies are sus
pected to use transfer priees to maximise tax liability in the most favorable country.
There is no doubt that this suspicion is sometimes justified, although even then
there is a cost (of manipulation) to the firm; and a dead-weight loss to the econ
omy.
Responses, notably regarding the desirability of a unified European com
pany law, differed according to whether one talked to the tax specialists (notably
external consultants) who rather enjoyed the game of "arbritrage"; and executives,
notably oflarge companies, who recognised the cost to company management and
planning imposed by fiscal suspicion. Moreover, a large part of the energies of tax
lawyers were simply devoted to avoiding double taxation.
Thus, one French EM bad to institute a complex system of cost-accounting
at the production lev el to satisfy German authorities ofthe bona-fides of the priees
charged toits German subsidiary. Difo a large German electronics company to
satisfy Italian authorities. In addition, companies complained about the periodic
and prolonged (up to 8 months) presence of controllers on the premises of espe
cially German subsidiaries.
Another company pointed out that national requirements on transfer priees
were inconsistent (e.g. as regards short-term variations of exchange rates), so that
the company had to be in an illegal situation somewhere. In fact, "Europe would
grind to a halt if national legislation were fully applied". Living with such ambi
guities, however, is both costly and highly unnerving to executives.
The problem of transfer priees sometimes intersected with that of different
product standards, since "home" and "export" priees for the same product could
differ because of different specifications.
Many companies complained of the difficulty of charging its subsidiaries for
central R&D expenditure. This is particularly awkward in view of the fact that,
from an economie point ofview (see chapter III below), te--chnology transfer and
R&D scale economies are among the most useful features of TBA.
E.RA./PROGNOS Page7
- 204 -
Particular scrutiny (including at customs) is reserved for the transfer priee
of software. It was mu ch easier, our respondents claimed, for an independent firm
to "export" software at its just value than for an integrated TBA. Software makes
up significant proportions of the value of an increasing number of products (ma
chine-tools + -30%; telematics (50% + ); it is also the form in which production
know-how is often transferred. If the full value of this "component" cannot be
charged by the main technology bolder in an integrated company or a joint ven
ture, serious distortions result.l.a. a firm may choose to sell "embodied" software,
i.e. a hard product, rather than utilising local production opportunities.
Y et a third consequence of suspicion towards "immaterial" transfers was the
difficulty for central management companies to level a management charge on
their subsidiaries. This again inhibits economies of scale in administration; and
the development of Euro-centric rather than national loci of planning and know
how.
As regards Italy, many of these problems were accentuated by a second mo
tive for suspicion, i.e. the circumvention of capital controls. This not only in
fluenced current TBAs, but also business expansion (i.e. acquisitions; for more
detail see the notes on individual countries, below).
In ali, the extra administrative costs imposed by different auditing and fis
cal systems was estimated at 10-30% of the relevant departments. This, tous, sur
prisingly high figure was cited by ali large European companies. A partial excep
tion were British companies which did not, by and large, engage in truly integrated
operations. (See also section 3, below).
Many companies cited the impossibility of reducing tax liability by off-set
ting losses in one branch by profits in another as very costly to their operations.
One particularly serious obstacle to business expansion is the practice of tax
authorities to levy capital gains taxes on firms taken over or merged, i.e. treating
this as a case of "realised assets". The holding company, with both partners re
maining legally in existence, is a clumsy substitute for a true merger. An excep
tion are the Netherlands, where (foreign) companies can obtain a "ruling" before
E.R.A./PROGNOS PageS

- 205 -
a merger. That stillleaves the problem of negotiating their exit from the previous
tax residences.
A last item under the heading of company law and fiscal suspicion relates to
the rigidity of many national company statu tes. The growing preference of Euro
pean multinationals to choose the N etherlands as headquarters had less to do with
tax advantages ( dividends }, and more with the flexibility and pragmatism of Dutch
laws, not least as regards the ability of holding companies to levy and transfer im
material income, e.g. from royalties, trade marks, etc. Sorne firms have transferred
from tax-friendly Luxemburg for this reason. Flexibility also extends to such things
as voting rights - important in joint ventures - where tailor-made agreements be
tween partners are accepted, provided they are spelled out in writing.
1.3. Product/production standards
While this problematique is the object of specialised studies in the Cost of
Non-Europe project, our interest related particularly toits effect on integrated
business planning in Europe.
We found that sorne large firms devoted 1/3 of their R&D budgets to the
adjustment of their technology to different national settings. This obviously re
duces the scale advantages from R&Dwhich would otherwise accrue to integrated
European companies. Alternatively, the innovative output of a given R&D effort
would be greater. This problem applies particularly to telecommunication on the
one band and mass-produced electronic components on the other. It has little re
levance in industrial plant and machinery made to customer specifications.
As regards product standards, even the most marginal divergences ( e.g. la
belling requirements) prevented, at the very least, efficient, i.e. centralised and
flexible, stock management. Stock management, including the option to have a
central European warehouse in a post-"1992" world, was particularly important to
relatively small multinationals with specialised products ( e.g. hospital supplies).
E.R.A./PROGNOS Page9

- 206 -
As regards regulations of production, the piecemeal introduction of pollu
tion standards in Europe caused major uncertainties in investment planning and/or
led to distorted locational decisions.
It is worth noting that ali problems under this heading caused costs to EMs
and rather discouraged them to increase the level of internai integration; while
sorne of the same problems encouraged SMEs to seek local production partners
to adapt their product to local standards; get type approval, etc.
1.4. Trade Obstacles
Again we limit our remarks to their impact on integrated business strategies.
Border delays and uncertainties are becoming increasingly relevant as just
in-time management of components is gaining in importance. TBA by EMs, with
their tight logistics planning, is hampered by this even more than arms-length
trade. While customs are one source of the problem, divergent social and techni
cal regulation of the transportation industry was cited as an additional risk factor.
Intra-EEC applications of COCOM controls were mentioned by many firms
in the electronics and advanced engineering sectors. The problems were hold-ups
at the border; difficulties in carrying out speedy repairs (spare-parts); and dif
ferences in national COCO M lists.
Together with the familiar deadweight administrative and resource cost of
border-crossing (1% of value in our estimate), uncertaintypenalises otherwise ef
ficiency-enhancing forms of integrated TBA which would allow large scale econ
omies through decentralised components manufacture.
A particular problem is posed by Italy, which prohibits temporary imports
of components for re-export in a chain of value-added, necessitating the admin
istrative (fiscal, customs) registration of two sales. Dito for demonstration ma
chines, test equipment and other temporary exports.
E.RA./PROGNOS Page JO

- 207 -
Non-Europe was also said to ham.per business planning due to the discre
tionary and varied national administration of the common external policy by dif
ferent countries (quota enforcement).
1.5. Social Policy
TBA, especially within integrated businesses, requires the ex change of sorne
managerial and technical personnel. This raises the question of the "portability"
of social security benefits, notably pension schemes, which are tailored to national
fiscal systems and/or related to public schemes. In practice, the firm must pay
twice, raising salary costs by 10- 15%. Lack of "mutual recognition" of secondary
and other school diplomas by dependents also reduced flexbility of technical and
managerial staff.
A different problem is posed by differences in technical training in Europe.
Man/machine interfaces and production in general are designed with particular
skill combinations in mind. Sorne firms spend considerable sums to train the work
forces in their subsidiaries to conform to a particular standard, and to make com
munication at the various technicallevels possible.
1.6. Capital and Current Transfers
Here there were few general problems: most were country specifie. One
general problem, however, was the difficulty of gaining access to local stock-ex
changes to finance a new subsidiary for medium-sized companies.
ltaly, am.ong the major countries, continues to be a special case. We deal
with it under point 3 below. The main point to make is that only large and very
sophisticated companies can engage in genuine TBA.
Currency risks were cited by virtually ali French EMs, sorne of which are
considering introducing the ECU as internai accounting unit. Complaints about
currency risks were also occasionally made by companies in other countries. The
extra problem raised for transfer priees bas been mentioned. One German hi-tech
E.R.A./PROGNOS Page 11

- 208 -
EM called for the speedy introduction of the ECU as an official means of pay
ment.
2. Large and small companies
While there were important exceptions, TBA by European multinationals
(EMs) on the one band, and small and medium- sized enterprises on the other,
could be clearly distinguished as follows:
1. Large companies always engage in sorne form of TBA SMEs rarely do so.
2. SMEs are above ali interested in marketing, with local production an unplanned
afterthought when it occurs, e.g. via a graduai expansion of after-sales service;
adaption of products to local standards; or co-production with a former sales
"agent".
Large companies are more likely to systematically exploit cost advantages,
notably labour and transport, and scale advantages; they are also driven by
formai or informai local content considerations; more rarely by political
diversification of supply risks (strikes). They also exploit investment and
export incentives.
3. SMEs tend to have a relatively arms-length relationship with their production
subsidiaries abroad, using long-term contracts not very different from those
concluded with third parties. This reflects their relative scarcity of
management resources and, in particular, international expertise.
Most EMs prefer a hands-on approach to management, not only in order to
exploit ali mann er of technical and economie cost advantages (of which SMEs may
be only vaguely aware ); but also in order to pursue market strategies which are
directed not only at the customers (as in the case of SMEs) but at competitors.
Sophisticated financial management, including tax minimisation; use of capital
markets; currency portfolio management, etc. is scarcely practised by firms with
less than 2000 employees.
E.R.A./PROGNOS Page 12
- 209 -
This makes sense in terms of relative management cost; but suggests un
tapped opportunities for external service providers, e.g. banks, with the requisite
economies of scale.
3. Country variations
United Kingdom
The most striking peculiarity of UK companies is the extreme arms-length
approach to management. Even world-sized companies seemed to look at their
European subsidiaries more in terms of investment diversification than in exploit
ing the opportunities of continental integration. Thus, for example, the expatria
tion of staff was not an issue in any of our twenty interviews. R&D was pursued
in parallel (duplicated) by closely related subsidiaries. "The first time we saw our
colleagues was in the BRITE programme", according to an executive of a hi-tech
Italian British-owned engineering subsidiary. Subsidiaries were often managed by
special holdings with a handful of staff, headquartered in London - far from the
manufacturing headquarters in the provinces, again confirming the financial over
the industrial interest.
Given the low lev el of integration, non-Europe was not perceived as a great
problem for British companies engaging in TBA.
France
In France, bands-on management was typical even for medium- sized enter
prises. "Expatriation" of management staff was common. The re was great pride in
being "European". In contrast to the other three countries, being merely French
was considered provincial. Like Italy, companies in mature sectors threatened by
both German and extra-European competition saw the European "home market"
as the only chance for survival through economies of scale. High levels of produc
tion integration brought out the problems of non-Europe more sharply than else
where.
E.R.A./PROGNOS Page 13

- 210 -
German y
German firms are reluctant players in the game of TBA. Direct exports are
generally preferred over local production, except when it cornes to exploiting la
bour-cost advantages in Britain, Spain, and Portugal. Formai and informai local
content pressures also provide an incentive to produce abroad.
Machine-tool makers were particularly harsh in their comments about TBA
with France, where a combination of government interference and unreliable de
livery has produced a legacy of distrust. While state interference was a problem
in Italy, the fact that there was not actually a government industrial policy made
such interference less of a problem than in France.
Italy
Italian TBA full y confirms to the overall image of Italian industry, i.e. a pri
vate sector struggling to thrive in spite of the State.
As mentioned for France, large companies in the more traditional sectors
see the extension to "Europe" as the only chance of remaining competitive. In
other words, moves to rationalise European industry will not be spearheaded by
the strongest country, Germany, but by relatively weaker competitors.
The major problem for Italian companies were capital controls which effec
tively prevent smaller firms from engaging in TBA. Getting permission to invest
in a productive facility abroad is not a problem- itjust takes time (3 months). Per
mission for an increase in capital already involves more difficult negotiations.
Most difficult of all is to get permission to crea te a holding abroad. Only very large
. companies can assume the cost of "negotiating" such a permit with the relevant
ministries; and to prepare lengthy annual reports to those ministries, which go
weil beyond normal audit requirement.
The combination of capital controls with controls on tax evasion, and hence
the need to negotiate acceptable business plans with both the Finance and the
Foreign Trade Ministries, was particularly felt to complicate life, even for large
companies.
E.R.A./PROGNOS Page 14

- 211 -
-
The extra-territorial application ofltalian controls is another interestingfea
ture: furtherinvestments by Italiansubsidiaries (i.e.legally French etc. companies ),
need approval from Rome.
Chapter III Measuring the costs
The following table serves to illustrate the methodology we used to get or
ders of magnitudes of the costs of individual obstacles to TBA expressed in a com
parable unit, i.e. total turnover.
Table 1 ONE FIRM'S COST
(case study)
Obstacle interview data published data assumption %of turnover
Fiscal 30% due to NE fisc admin = 15% of all admin; administration bence NE = 5% of aU admin.
white collar = 50% of salary costs; all salary = 25% of turnover 25: 2x5% 0.625
Training 10 million ECU turnover=? 1/3 for diversity (NE) 0.07 for systemic inte-gration
R&D 25% of total for TotalR&D = NE 6.5% of turnover 1.6
Location optim. 5% savings poss. divide by2 2.5
Transport 10 - 15 of total transport = 1 - 2% of turnover 0.2 duetoNE
Sum 4.995
Special case
Unused econ- loss of 10% of$ $ market = reduce by half 2.5 omies of scale market 1/2 of turnover (resource saving)
Sum 7.495
E.R.A./PROGNOS Page 15

- 212 -
The figures, which incidentally refer to an advanced auto components manu
facturer, are surprisingly high; but yet higher figures could be found in state-domi
nated sectors (see below). The high figures reflect
- the very high "service" content of contemporary industrial production, i.e.
administration, technology exchange, marketing, etc.;
- the considerable - and only partially realised - economies-of-scale
opportunities which lead many companies to engage in TBA in the first place.
Of course, precise quantitative estimates were the exception, as most execu
tives found it difficult to quantify e.g. hypothetical economy-of-scale gains. When
they did quantify, however, the answers were surprisingly consistent. With these
elements in band we needed to make a series of - increasingly heroic - estimates
to scale up our results to sorne level of sector, groups of sectors, and GNP.
The first step was to estimate an average level of cost for each obstacle and
each industry for each country separately. The results are not reproduced here.
The second step involved aggregating the country results, taking into account the
peculiarities of our not always representative samples. This was done in an itera
tive round-table discussion among the principal interviewers. The rankings of the
importance of various obstacles correspond roughly to 1 = less than 1% of turn
over to 4 = 4% and above of turnover. (see table 2 overleaf)
These figures aggregate not just apples and pears but apples and cheese.
Thus the cost of "company law" sums both the administrative cost, and induced
scale-diseconomies. Both averages would be higher if there bad been more truly
integrated companies in our sample. Or, taking the example of trade-barriers, the
figures may refer to actual transport costs; difficulties for just-in-time production
integration; or COCOM- induced problems for supplying and servicing advanced
machine tools - problems which do not arise for more conventional producers.
E.R.A./PROGNOS Page 16

- 213 -
Table 2
ph arma telec auto textiles machinery
industrial policy 4 3-4 3 0-1 1
company law ( 1) 2-3 2 3 0-2 2
"social"regu1.(2) 2 1-2 2 0-3 0
techn. standards 4 4 2-3 1 1-3
other trade barr. 2 3 2 1 1-3
technology trade 2 1-2 0 0 0
int. payments * * * * *
(1) includes administrative costs and sub-optimal production
(2) includes lay-off regulations, education, and "expatriation"
* taken in isolation, payments restrictions ranked high only in Italy
Leaving these caveats aside, we felt that our sectors fell into three broad
groups:
1 Pharmaceuticals and telecommunications
These were highly regulated and protected industries with a high incidence
of obstacles of almost ali kinds, especially "indus trial po licy" and "technical stand
ards". We estimated the total cost of non-Europe to firms in this group engaging
in TBA at 9% of turnover.
II Automobiles
This group, togetherwith firms in consumer electronics, a large rubber manu
facturer and food processors, were hampered by indus trial protection; difficulties
to adjust the labour force in response to market shifts; economy-of-scale losses
E.R.A./PROGNOS Page 17

- 214 -
due to quite marginal differences in technical standards; and substantial "admin
istrative" costs if they were highly integrated. Total cost of TBA was estimated at
6% of turnover, i.e. higher than both average profits, or average R&D expendi
ture of firms in these sectors.
ill Textiles and machine tools
This group had in common: high specialisation; a relatively low integration
at the component level; subsidiaries which either served marketing and service
purposes; or produced fairly independently parts of the product range; few prob
lems with technical standards. Total cost of TBA = 1.7% of turnover.
Estimating costs by sector
Our next step was to estimate, "on the back of an envelope", the points on
the X-axis of our graph, i.e. the proportion of turnover in each group which was
generated in a TBA context forming the base-line for integral A ; the proportion
potentially suited to TBA but discouraged by non-Europe (base-line B); and the
proportion which would remain "local" under any circumstances (C). This latter
category included local component suppliers as weil as local repair and other ser
vices.
Table 3: Cooperation and potential
lndustry TBA potential TBA efficient local
pharma
30% 40% 30%
telec.
40% 40% 20%
auto
30% 40% 30%
auto (US -------owned) 60% 10% 30%
textiles,
machinery 10% 30% 60%
E.R.A./PROGNOS Page 18

- 215 -
With these assumptions our standard graph can be drawn in three illustra
tive versions.
Figure2 Cost of non-Europe: sectoral profiles
GROUPm
E.R.A./PROGNOS Page 19

- 216 -
We can also quantify more precisely the contents of integral A, which is
cost of TBA x total turnover x % of turnover involved in TBA
Since we are ultimately interested in the costs for industry as a whole, we do
not make this calculation separately for our five sectors, but for three groups, "as
signing" each two to four- digit industry to one of the three groups. Since the EEC
does not publish very detailed industrial statistics, and only on a country basis, we
took our data from the OECD's Industrial Structure Statistics 1984 (1986). That,
however, omits countries such as France, so that we make our calculation for a
single country, Germany.
Group 1
3522 pharmaceuticals
3825 Office & computing machin.
3832 Communications equipment
3841 shipbuilding
3842 railroad equipm.
3845 aircraft
Total
Group II
31 Food etc.
35 Chemicals (exc.351,3522)
3833 Electrical appliances
384 Transport ( exc.see 1)
Total
E.R.A./PROGNOS
19 billion DM (rounded)
15
55
8
1
9
107
172 200
15
152
539
Page20

- 217 -
Group III
32 Textiles etc. 66
33 Wood products 36
34 Paper etc. 57
351 Industrial chemicals 106
36 Non-Metalic Min.Prod. 40
37 Basic Metal Ind. 90
381 Metal products 80
382 Machinery ( exc.3825) 142
383 Elec.machinery ( exc.3832)
and 3833) 63
385 Professional goods 16
39 "Other" 8
Total 704
The integrais A thus become:
Group I
35% x 107 = 37; 37 x 9% ( cost of TBA) = 3.4 billion DM
Group II
30% x 539 = 162; 162 x 6% =
Group III
10% x 704 = 74; 74 x 1.7% = Total manufacturing
9.7 billion DM
1.3 billion DM
14.5 billion DM
Scaling up these results to the Community level needs taking account of the
relatively large share of manufactures in German output; the relative strength of
specialised (group III) sectors and weakness of sorne group II industries like elec
trical appliances, etc. In addition, the "military indus trial complex", which belongs
into the high-cost group 1, is largely hidden in groups II and III. On the other hand,
making more precise calculations on the four-digit level for all countries would
be tantamount to creating a false illusion of precision for what are, after all, py-
E.R.A./PROGNOS Page21

- 218 -
ramidal guesstimates. Nevertheless, we feel that a loss of 30 billion ECU for the
Community as a whole is a conservative estimate. To this must be added the con
tents of integral B, i.e. the non-realised TBA benefits to which we now tum.
Chapter IV The cost to the European economy
We turn in this last chapter to integral B in our basic graph, i.e. the cost to
Europe of TBA which is discouraged altogether because of obstacles. This cost
must be inversely related to the benefits of transborder business activity. So the
more upbeat formulation of the question asked in this chapter could be: What
(further) contribution could TBA make to the prosperity and integration of the
European economy?
If in what follows we stress exclusively the benefits of TBA, the "classical"
objections to business cooperation which were stressed in an earlier ERA report
is not presumed to be invalidated: collusion, and other forms of anti-competitive
behaviour, may reduce welfare; slow down technological innovation; and lead to
firms which are too large to respond quickly to the economie environment. We
do so partially in order to simplify exposition; and partially because the present
period is not like any other:
• industry is experimenting with new forms of organisation which overcome
many of the drawbacks of large size
• the completion of the Internai Market cannot succeed without TBA
• Europe is exposed, as never before, to competition from world-scale firms.
The exchange of goods and services on an arms-length and ad hoc basis, i.e.
"trade" in a text-book sense, between independent firms in two different coun
tries, is becoming the exception rather than the rule: Contractual relationships
between links in the "chain of value added" are becoming an essential feature of
the modern economy.
Transborder business links of this kind can involve one or ali of the elements
of the c~ain of value added, from basic research to R&D, organisational know
how, production or procurement of intermediate and final products, to market
ing and other services.
E.R.A./PROGNOS Page22

- 219 -
The decision on the organisational "mode" of supplying a given link of the
chain of value added involves a complex optimisation problem where firms seek
to:
- minimise
• information/search costs
• transaction (negotiation on priee and specification) costs
• market risks (on supply and demand side) and
- maximise
• market control
• control over uses of technology
• economies of scale.
A first conclusion to draw with regard to TBA in Europe is to point out the
importance of the geographie space in which this optimisation problem can, or
cannot, be tackled efficiently; and point to the evident properties of TBA as cre
a tors of markets for intermediate products, services, and, a hove ali technology.
The benefits of TBA in the Europe of the 1990s appear more sharply if we
distinguish between two patterns of indus trial organisation: "cooperative network
ing" and "competitive expansion".
1. Cooperative networking
Cooperative networking can exist without equity participation. In practice,
it is usually associated with minority shareholdings between partners; and even
with 100% equity control (cf. results form our British sample; and for SMEs in
general). In organisational terms, the differences to "competitive expansion" is
that networking implies very loose management control at best; and that the link
between two partners, and even between a parent and its wholly owned subsidiary,
is narrowly focussed on e.g. the supply of a certain component, technology, and/or
service (marketing).
This being said, cooperation between fairly autonomous, geographically and
functionally specialised economie units in "networks", provides a combination of
E.R.A./PROGNOS Page23

- 220 -
strategie control and flexibility, and hence efficient short-term market responsive
ness which is becoming the essence of modern business organisation. As an alter
native to both centralised management and arms-length trade, it is an instrument
for coping with two features of the contemporary economy: the globalisation of
markets; and the speed of technological change.
Both lead to information overload. Thus it may become difficult for central
management to know what technology is available at the production and product
level in each of its hundreds of specialities; and where to sell "surplus" technol
ogy which is generated internally.
The information problem caused by technological and geographie (market)
complexity is directly reflected in another cost, i.e. transaction costs. Although
networking, even among equity linked firms, always involves negotiation on priees
and specifications, these can be routinised in long-standing relationships with
built-in elements of mutual trust. In this latter context one sometimes speaks of
the "hostage function" of minority share-holdings.
Another, frequently observed, pattern is for two large firms to pool risks,
and achieve economies of scale by developing or producing a component or other
input, or sharing a service such as marketing. This form is often referred to as
"strategie alliances". While it may have more than its share of anti- competitive
dangers, it does provide a highly capital-saving way for firms to achieve world
competitive technology and scale; and to extend their market presence geographi
cally so as to reap general economies of scale.
Last but not least, given the known hesitations of companies to engage in
arms-length technology transfer (patent sales; licensing) which would compromise
monopoly rents, cooperation-which allows such trans fers ( often on a barter basis)
- tends to increase the diffusion of technology.
These micro-level effects are linked to specifie macro effects. Information
cost reduction and risk reduction combine to increase potential investment op
portunities, bence raise total investment in the economy. Capital saving increases
the overall productivity of capital. And technological excellence, combined with
E.R.A../PROGNOS Page24

- 221 -
rapid market responses to local opportunities and shifts in requirements, trans
lates into a better defense of the home market against foreign competitors.
While the se advantages are valid at any lev el, from sub-national, i.e. regional,
to global cooperation, information costs and other barriers to transactions are
relatively high in the European Community.
Information/transaction barriers are, of course, not higher in an absolute
sense - geographie proximity and decades of living in a common market favour
intra-European over extra-European links in this respect- but relative to the pay
off in terms of the size of individual national markets for a given "investment" in
information/learning. This pay-off is likely to be much greater when extending
business activity to the United States.
2. Business expansion
While virtually alllarger businesses today engage in sorne form of network
ing, the creation of an integrated European economy also requires more robust
forms of TBA. These involve the extension of direct control from the manage
ment in the firm in one country over productive resources in another.
The wholly-owned subsidiary, whether greenfield or the result of a take
over, is the typical instrument of expansion. Mergers are either a polite circum
locution of the same thing; or, more rarely, involve a genuine centralisation of
two centers of control.
Business expansion is economically beneficiai if it asserts competitive ad
vantages of a firm more quickly and more effectively than is possible by trade
alone. These competitive advantages may lie in technology and/or production
know-how; management know-how; marketing skills, etc.
ln theory trade, i.e. exports by firms having such advantages, will also serve
to deplace inefficient competitors, with the winner reaping the economies of scale
of the large market. In practice, however, this process is slow, with the eventual
losers staying in the market while running down their financial and technological
E.RA./PROGNOS Page25

- 222 -
assets. More importantly, adjustment may be inhibited by countervailing national
subsidies and other forms of local protection.
This points to the single most important task of transborder "business ex
pansion" for the completion of the Internai Market: the rationalisation of indus
try. Overcapacity is a typical feature of too much of European industry. It exists
both in mature industries whose adjustnient is delayed by national policies; and,
occasionally, in high-tech industries fostered by other national policies. Equally,
the two ills of Europe's R&D effort: duplication of national programmes; and
preferential national procurement, will not disappear with legislation, but only
when the nationality of the firms themselves will be sufficiently confused to make
nonsense of national preference. No one in Europe can buy a national Airbus.
The difference between networking and business expansion is illustrated by
the automobile industry. Ail manufacturers and component suppliers are cooper
ating; i.e. they are situated in the upper triangle of figure 3. Partial economies of
scale in R&D and manufacture ( e.g. engin es) are achieved. But virtually ali are
in the lower triangle as regards business expansion. Rationalisation has taken
place within the national context.
Figure 3
( TBA 1n the automobile industry 1 CooperaT-Ion bomef'lt.!l
+ ~ .. TBA
E.R.A./PROGNOS Page 26

- 223 -
In practice, "networking" and expansion are often present simultaneously in
business links, with the relative emphasis on de-centralisation and control shift
ing according to the strategie necessities of a technology (maturity) and a market.
To sum up, transborder business activity is a pre-condition for the function
ing of a modern exchange economy. Its relationship to the overall1992 project is
therefore one of an accelerator or inhibitor of the positive effects, both static and
dynamic, expected from trade and services liberalisation in general. As such it is
a parameter to be put before the entire welfare function established for the 1992
project.
In turn, the likelihood ofTBA increasing beyond present levels not only de
pends on the realisation of the White Paper's targets for company law, but on ad
vances in the liberalisation and de-regulation of trade and services.
E.R.A./PROGNOS Page27


- 225 -
7.
The •cost of Non-Europe•
for Business Services
Peat Marwick Mclintock


- 227 -
THE COST OF NON-EUROPE FOR BUSINESS SERVICES
EXECUTIVE SUMMARY
Prepared by Peat Marwick McLintock
Dated: April 1988

- 229 -
1. INTRODUCTION
This study is part of a research programme undertaken at the
European Commission by the Directorate General for industrial Affairs
and the Internal Market, under the title the Cost of Non-Europe. The
studies in this programme investigate the costs to the Community economy
of the continued fragmentation of the internal market, each study
addressing a particular sector or type of cost. This study addresses
the cost of non-Europe for business services. By implication the study
also assesses the economie benefits which are implied by the removal of
barriere to trade in business services envisaged through the completion
of the internal market by 1992.
The main elements of the study were to:
examine the process of externalising services, that is
contracting services out to specialist firms and investigate
the degree of externalisation in the European Community,
examine whether the existence of barriers within the
internal market limits the ability of firms to purchase the
most cost effective business services provided within the
Community, and to provide estimates of the extra costs borne
by enterprises,
estimate the benefits from completing the internal market,
both for enterprises purchasing business services, and for
the business services sector itself.
Business services include the technical, professional and
operational services generally consumed by firms rather than households
and are those commonly defined as business services for most statistical
purposes in European countries. They exclude financial services such as
banking, insurance and securities.

- 230 -
This executive summary outlines the main findings of the study.
The broad findings of the existing research helped shape our
questionnaire and the conclusions were tested and in the main confirmed
by our sample interviews. Despite our small sample, therefore, we felt
happy with the overall trends in our conclusions.
- 2 -

- 231 -
2. METHODOLOGY
2.1 General
The original research for the study was based on two sets of
face-to-face interviews and the completion of two corresponding
questionnaires. One set related to the demand side, the us ers of
business services, and consisted of a sample of companies in sectors
spread across the economy from Benelux, France, Germany, Italy and the
United Kingdom. The other related to the supply side of the question,
and consisted of interviews with companies whtch provide business
services. In order to draw on a broad spread of experience we
interviewed trade associations rather than individual firms in those
sectors, generally at the national, but in sorne cases at an
international, level.
The demand questionnaire on which the interviews have been
centred covered a number of aspects of service provision:
the demand and supply of business services: the range of
services employed, the source of supply (whether internally
or externally supplied) , the extent to which externally
supplied services are imported, and the domestic
availability of services,
decision making and trends in the demand for business
services from outside sources: the factors underlying the
decision to externalise (1. e. shift the provision of a
business service function from in-house to an external
supplier of those services), orto internalise, the process
of decision making, recent trends, and the effect in terms
of cost implications and employment turnover of these
trends,
the internai market for services: perceptions of barriere
to trade which exist in the business services market, and
the effects of removing barriers on the demand for business
services and on the overall economie activity.
- 3 -

- 232 -
The supply side questionnaire had four points of emphasis:
the extent to which services are traded internationally,
the trend towards externalisation,
the importance of trade barriers in the interna! market,
the likely effects on cost and demand for business services
as a result of the completion of the interna! market.
In addition to the supply side and demand side surveys we carried
out a literature search which provided statistical information about the
business services sector, insight into the economies of the
externalisation process, as well as priee and income elasticities.
Further information about the business services sector in Europe came
from the Peat Marwick McLintock factsheets, prepared for DGIII, which
gave indications of the turnover in the main business service
categories.
Finally, for guidance on the quantitative analysis of the cost of
non-Europe for business services some existing econometrie research was
consulted, as was Peat Marwick McLintock information relating to
comparative cost structures within Europe in certain business service .
sectors.
2.2 The survey
Wide ranging interviews were carried out with 100 companies which
are usera of business services and 20 trade associations representing
business service suppliera. These were more or less evenly spaced
between France, Germany, Italy, Benelux and the United Kingdom.
2.2.1 Demand side
The companies selected constituted a sample representing a wide
spectrum of industries. They were of sizes ranging from small family
run businesses to the larger corporations. They ranged from companies
operating only in local markets to multi-national organisations with
- 4 -

- 233 -
links worldwide. Around one-third of the sample consisted of small and
medium sized enterprises. One-third of the sample bad a turnover of
less than Sm ECU in 1986, and a similar proportion bad turnover in
excess of 250m ECU.
ln all 61% of the panel was made up of service sector companies
(of which around one-third were the financial services sector): the
remaining 39% were companies in the manufacturing sector.
Nearly two-thirds of the sample functioned in some capacity in at
!east one Community state other than their own. Around half the sample
operated additionally in non-EEC markets, North America being the most
frequently mentioned.
2.2.2 Supply side
The trade associations covered commercia~ communications (2),
engineering and related services (5), management consultancy (4),
computing services (3), various operational services (such as security)
(3) and legal services (2).
- 5 -

- 234 -
3. THE USE OF BUSINESS SERVICES
Having established the characteristics of the company sample the
questionnaire then sought to establish the nature of the demand for, and
sources of supply of, business services.
3.1 Degree of externalisation by service
Table 1 summarises the degree of externalisation of each category
of business service.
Table 1 Degree of externalisation of business services
Degree of Externalisation
(% of Total Sample)
Purely Purely Sec tor External Combination Internai Subsidiary
Engineering & Related Services 55 29 14 2 Management Consultancy 36 25 36 3 Advertising 48 25 25 2 Public Relations 10 31 59 0 Computing Services 21 54 24 0 Research & Development 13 22 58 7 Financial Review 48 18 32 2 Operational Services 59 17 21 3 Legal Services 40 38 21 1
TOTAL 40 27 31 2
-= -
Sorne 40% of business services used by our sample were entirely
sub-contracted, 31% were provided exclusively in-house, 27% were
provided in combination and 2% were provided by a parent or subsidiary
company. This broad picture conceals considerable disparities between
the individual business service sectors.
- 6 -

- 235 -
Operational services followed by engineering and related services
had the highest degree of pure externalisation. Financial review and
advertising services also had an above average degree of pure
externalisation. Public relations, research and development, and
computing services had the lowest degree of pure externalisation.
The services with the highest degree of pure internalisation
(in-house provision) were public relations and research and development,
with management consultancy also above average in this category.
Those services most often done by combination of in-house and
external provision include computing services, legal services and public
relations. Provision by subsidiary or parent companies representa
everywhere an insignificant proportion of total provision.
3.2 Degree of externalisation by country
Table 2 shows the degree of externalisation for each country in
the survey.
Table 2 Degree of externalisation by country
Externalisation Internalisation Combinat ion
% % %
France 57 31 12 Germany 32 47 21 Ital y 48 35 16 Netherlands 39 18 43 United Kingdom 35 22 43
TOTAL 40 31 27 == ""= =-=
Based on our sample, France has the highest percentage of
exclusively externalised business services (57%) and the lowest degree
of combined provision (12%). Italy follows a similar pattern with 48%
of business services externalised and only 16% provided in combination.
The United Kingdom and the Netherlands have very similar externalisation
profiles. Both have a below average degree of in-house business service
- 7 -
- 236 -
provision and a considerably above average level of combined business
service provision (40%). Germany has the highest percentage of in-bouse
provision of business services, wi th correspondingly below average
levels of both pure externalisation and combined provision.
3.3 Degree of externalisation by company size
The very smallest companies internalised a very high percentage
of business services (45%) (see Table 4). This drops sharply for medium
sized firms which externalised a high proportion of business services
(54%) and internalised only a very low proportion. For larger companies
a larger proportion of services were internalised and the degree of
externalisation drops (as it becomes economie to bring services
in-bouse). However, perhaps reflecting an awareness of the wider
benefits of externalisation, the percentage of combined provision is
above average for the larger firms. These broad findings bear out the
conclusions of the current literature on business services.
Table 3 Degree of externalisation by size
Em2loi!ent Externalisation Internalisation Combinat ion
% % %
0 - 50 36 45 19 51 - 500 54 21 24 501 - 1,000 39 30 31 1,001 - 5,000 39 35 26 5,000+ 36 33 31
TOTAL 40 32 28 == == ==
3.4 Trends in externalisation
A significant increase in the last five years in the amount of
services bought from external compani~s was reported by 53% of demand
side respondents. A significant re-internalisation of business services
was reported by over 4%. The services most frequently mentioned in the
context of a higher degree of externalisation in recent years were:
marketing and sales promotion,
- 8 -
- 237 -
computing services,
taxation advice,
legal services,
consultancy,
external audit.
The reasons cited for an increased trend towards externalisation
included changes in company policy in favour of externalising all
non-core activities. In a number of cases this was as a result of a
strategie review of all company operations. Other ressons mentioned
included cost cutting (implying that companies see externalisation as a
money saving option), the need to reduce the workforce to a minimal
sustainable lev el, and the need for flexibility arising from using
services provided on a contract basis. Organic growth was also
mentioned as a factor in increasing externalisation. The implication
here is that companies find expansion easier by sub-contracting rather
than by building up interna! resources, particularly in the absence of
the interna! expertise necessary to start the process.
In the handful of cases in which services were being
re-internalised the reasons cited included cost-cutting (as the company
grew to a size at which services could be provided economically
in-house) and company policy for reasons of control.
The supply side interviews confirmed these trends.
3.5 The externalisation decision process
3.5.1 Decision factors
Companies were questioned on all aspects of their decision making
with particular reference to externalisation decisions taken in the
recent past in order to ascertain the likely effect of a reduction in
the cost of business services or any other changes resulting from the
completion of the interna! market.
- 9 -

- 238 -
Table 4 ranks the general factors underlying the selection of
external business service suppliera. The table shows that although cost
and availability are undoubtedly important factors in the selection of
externally provided business services, the quality of these services is
ultimately more important. This bas clear implications when assessing
the likely benefit that result from eliminating barriers in Europe.
Table 4 Service supplier selection factors (%) (1)
Very Important Çuite Important Less Important
Quality 70 8 0 Cost 32 50 4 Availability 39 27 4 Tradition 0 16 51
(1) Expressed as a percentage of total panel (multiple responses allowed)
3.5.2 Decision processes
The evidence of the survey is that iri many cases a strategie
decision is taken to externalise non-core activities after the general
benefits of such an approach have been assessed often by external review
of operations. In the majority of cases, however, and particularly
prevalent in France, Germany and the UK, it would appear to be a
management philosophy which bas evolved as a means to cost cutting and
reducing the workforce to a sustainable minimum, possibly in response to
the painful experience of many countries in the world recession of the
early 1980s. Given this underlying philosophy, individual cases are
then decided on their own merits. The initial externalisation of a
service, or the externalisation of a one-off need, is often subject to
some form of cost-benefit analysis. Established contracte are managed
via the business's usual annual operating process. In the few cases
where inertia is given as a reason for externalisation it is often in
areas of very long standing externali~ation, such as for legal services.
- 10 -

- 239 -
3.5.3 Externalisation and economie performance
Firms had great difficulty quantifying either cost or employment
effects suggesting that very little subsequent analysis of decision
outcomes is made to assess whether externalisation decisions had been
justified in practice. However, interviewees usually had overall
perceptions of the costs and benefits of externalisation:
cost: Over half the sample were unable to say whether
savings had been achieved or not. Of those companies able
to answer the question, 84% claimed that expected services
had been realised and 89% found that the quality of services
matched expectations. In the cases for which estimates of
cost savings could be made these averaged between 10 and 15%
for each business service (although the point was repeatedly
made that cost is often not the prime motivation for
externalisation).
employment: Some 38% of the sample reported that contracting
out of services had enabled them to reduce their own staff,
compared to 14% who reported no change in the level of
employment. The picture is not as straight forward as these
figures might suggest. Frequently, externalisation appears
to occur as a natural part of the organic growth process of
a company. In these cases, representing 12% of the sample,
job growth is foregone as companies sub-contract rather than
recruit. Altogether, therefore, from the point of view of
the client company there are negative effects on the
employment levels which would have occurred without
externalisation. It is difficult to quantify "average"
employment effects from the survey since estimates (when
they do exist) range from a "handful" of staff to
"substantial" numbers where externalisation is undertaken as
part of a general cost cutting exercise.
Clearly, however, there is a potentially positive effect on
employment of externalisation arising from:
additional company growth from externalisation benefits,
- 11 -

- 240 -
additional employment by business service companies.
Average job losses were between 0. 6% and 0. 9% of the total
workforce. This average is somewhat distorted by the exclusion of firms
reporting either no job losses, foregone job growth, or those unable to
quantify jobs lost.
The overall conclusion is that externalisation undoubtedly bas an
effect on employment, at the very least shifting employment from client
companies indirectly to the business service sector. The net effect is
not quantified by this survey, but the overall effect is unlikely to be
significant relative to the size of the workforce.
3.5.4 Motivations for externalisation by business service
Particular examples of externalisation which bad taken place in
the last five years were examined to identify which sectors have
featured in recent trends towards externalisation (discussed in
Section 2.1.3)
The reasons which emerge can be classified into the categories
shown in Table 8 together with a broad indication of the frequency of
occurrence.
Clearly the list is not exclusive: externalisation may be
motivated by more than one of these factors. The list is also not
exhaustive but it does include all the factors which occurred
frequently. The re is also clearly an overlap between some of the
motivations.
The cost motivation for externalisation is straightforward to
interpret and applied particularly to operational services. Lack of
interna! expertise generally applies to areas which require a high
degree of specialist knowledge and therefore includes computing
services, marketing (often in overseas markets), research and
development and consultancy. While cost saving is the single most
important motivation, altogether cost motives account for only a third
of cases of externalisation.
- 12 -

- 241 -
Table 5 Motivations for externalisation by business services used
Motivation
Coat saving
Lack of internal expertise
Desire to eut employment/ fixed costs
Need for external perspective
Flexibility
Economies of scale
One-off exercise
Lack of internal resource
Need for higher quality service
Main Sectors
Operational, IT, Marketing
IT, Marketing (overseas), R&D, Consultancy
IT, Operational services
Consultancy, IT, PR
Marketing, Consultancy, IT
Operational, Legal, Marketing
Consultancy, Audit, Recruitment
IT
Operational, IT
Frequency %
26
18
10
10
10
8
7
7
5
Other sectors such as engineering and related services and legal
services, although falling into the specialist category, are already
widely externalised and do not feature in this analysis of recent
trends.
- 13 -
- 242 -
4. BUSINESS SERVICES AND THE INTERNAL MARKET
In this section we examine the issue of trade in business
services within the Community and trade barriers encountered. We begin
with the experience of the demand side in obtaining an adequate supply
of business services domestically (4.1) and the extent to which they go
beyond their national borders for services (4.2). We then address the
nature and significance of barriers to trade in business services both
from the demand side (4.3) and supply side (4.4) experience. Finally,
we consider these barriers in the context of the volume of intra
Community trade (4.5).
4.1 Domestic availability of services
Sorne 26% of companies reported that they bad tried to contract
out a service but bad failed to find a sui table domestic supplier.
These companies were concentrated particularly in Italy, but also in the
Netherlands. In the former case difficulties appear to be largely
associated with recent changes in company accounting procedures for
which the domestic accounting profession is not yet fully prepared. The
most frequently mentioned services included:
audit,
consultancy,
taxation advice,
specialist software,
marketing in foreign markets,
foreign legal and tax advice.
With the exception of areas such as audit, tax and consultancy,
in which countries such as the UK and the US appear to have developed
internationally recognised expertise, services which are unavailable
locally usually relate either to the need for local knowledge of a
foreign market or are of a highly specialist nature (such as the example
of research and development in a specialist field) of a type not
generally available.
- 14 -
- 243 -
4.2 Purchases of services from foreign owned companies
In the sample 68% of firms bought some of their externally
provided services from a foreign-owned firm. The services affected are
general! y those mentioned in 4. 1. It was frequently stated that
nationality is irrelevant in the selection of sub-contractors and that
work is given to firms purely on the basis of the most favourable
tender. Specifie reasons given for using a foreign firm were:
policy to use local firms by overseas subsidiaries,
the reputation of foreign firms (in terms of cost and
quality) in certain fields, mainly audit, consultancy and
computing services,
the need for advice on foreign markets or legal and taxation
systems.
Reasons were also mentioned for not using foreign owned firms.
These included:
adequacy of locally available services,
language, cultural and geographical barriers,
government procurement policies (discriminating against
contracta with a significant element of foreign sub
contracting)
lack of information about the availability of foreign
services.
The conclusion of this section of the survey is that there is
already considerable cross-border provision of business services within
the EEC and that generally firms were not averse to using those
services, their main concern being to obtain the best available product.
It was not, however, possible to tell from the replies how important
lack of information was and whether the use of foreign firms would have
been larger if their existence were known.
- 15 -

- 244 -
4.3 Barriers to trade in business services: demand side view
Only 17% of the sample recognised barriers to business services,
over half the sample stating that they were aware of no barriers. For
those companies recognising barriers, the most common reasons fell into
the "fact-of-life" category and included mainly language and cultural
differences or proximity. Availability of information and shareholder
or official pressure to buy domestically were also mentioned.
The ranking of those barriers which were recognised is given in
Table 6.
Table 6 Importance of selected business service barriers
Barrier
Financial Administrative National Standards & Regulations Legal
Rank
1 2 3 4
Financial barriers (such as exchange controls) and administrative
barriers (such as paperwork) were regarded as marginally more important
than barriers related to differences in national standards and
regulations and legal barriers. These resulta are, however, based on a
very small sample and should be treated,with appropriate caution.
Larger companies with offices throughout the Community indicate
that barriers were not really regarded as obstacles, given the systems
and structures which bad evolved for trade within the Community.
4.4 Barriers to trade in business services: supply side view
The overall picture from the supply side is that most business
services are perceived by their suppliera to suffer from some barriers
even though they are not considered to be of great significance. Two of
the services on the other band could think of no barriers at all (beyond
problems such as cultural and market differences, which we are not
classifying as trade barriers), these being management consultancy and
operational services.
- 16 -

- 245 -
Table 7 Barriers to trade in business services
Sec tor
Commercial Communications
Engi~.teering & Related
Management Consultancy
Computing Services
Research & Development
Operational Services
Legal Services
Nature of Barriers
Satellite broadcasting barriers
Differences in advertising law (regarding permissible advertising material)
Limitations on media time for advertising
Lack of access to equity markets (Germany)
Qualifications of professionals
Government procurement
Technical standards
Licensing of professionals
Tax treatment
None
Government and PTT procurement of computer services
Bias in government procurement
None
Freedom to practice
Overall Significance of Barrier
Generally regarded as reasonably free market
i) Engineers: barriers quite significant
ii) Architects: barriers very restrictive
No barriers of significance
UK reports this barrier only
Reported by Germany (demand side interview)
Largely unregulated market
Not generally recognised by professional bodies as significant
In four sectors barriers are recognised but are not viewed as
very significant impedimenta to the exchange of services - namely
commercial communications, computing services, research and development
and legal services. The associations generally replied that the
significance of these barriers for individual service companies would
depend on the nature of the services they provided. Sorne would be
affected quite significantly while others hardly at all. The view of
- 17 -

- 246 -
all these four services is that the removal of barriers will have some,
if quite a limited, effect on the ability of service providers to sell
in other European countries.
Some specifie points should be made in relat:l.on to individual
services:
in advertising, the development of satellite broadcasting is
creating a new medium of international broadcasting which
allows cross-border television advertising. As cross
boarder advertisements are not currently allowed for there
could be a significant raising of barriers in the near
future unless changes are made to the current regulations,
with regard to legal services, the profession does not
regard the most fundamental restriction on cross-border
services, that is the existence of entirely separate legal
systems in each member state, as a trade barrier but as a
fact of life. This is understandable given that the removal
of such a restriction could only be a long term aim.
Nevertheless, there are examples of lawyers being restricted
in practising even when appropriately qualified,
while we did not formally interview representatives in the
accountancy profession, it is common knowledge that within
certain member states accountants are prohibited from
offering non-auditing services to their audit clients.
Moreover, non-auditing activities have become an important
growth market for most large firms. However, in practice
there is said to be only a moderate inconvenience in setting
up legally separate firms for consultancy and tax services.
In no countries have firms been prevented from providing all
the services which they would like to offer.
The remaining sector, engineering and related services, appears
to suffer most from barriere, which were described as a significant
limitation on competition. This is reflected in the degree of trade in
these services, which is qui te limited within the Community. The
barriers which have most effect are the licensing of professionals and
- 18 -

- 247 -
bias in public procurement. While these professions are significant
exportera Table 5 shows that very little of the export market is within
the Community. Instead exporta are concentrated on developing countries
which lack the skills to perform the se services themselves. In
countries where qualified professionals do exist (which would include
the whole of the Community) such services are imported to a very limited
degree. Bias in public procurement is an important barrier, given that
public bodies are significant purchasers in relation to infrastructure
projects. While both consulting engineers and architects feel that
barriers are significant, the latter group appears to find them
particularly restrictive.
Finally, one should note that there were some more general
problems reported by some sectors, although they are not business
service barriers directly. In particular the high costs of air
transport and telecommunications created by an imperfect market were
raised by sever al respondents. Some also reported restrictions on
access to foreign exchange and the repatriation of profits.
4.5 Extent of intra-Community trade in business services
Supply side respondents were asked for information regarding the
significance of exporta for domestic suppliera. This information,
combined with data taken from a series of service sector factsheets is
presented in Table 8.
Table 8 Internationalisation of business services
Location of .Business Service Clients
(% of turnover) Business Service Domestic Other EEC Non-EEC
Engineering & Related 55 4 41 Consultancy 90-95 2-5 2-5 Commercial Communication 50 40 10 Computer Services 90 5 5 Research & Development N/A N/A N/A Financial Review N/A N/A N/A Operational Services 98 1 1 Legal Services N/A N/A N/A
Source: Supply side interviews and PMM factsheets
- 19 -

- 248 -
Business service sectors divide into three clear categories:
engineering and related services and commercial
communications, where roughly half the turnover of business
services is for foreign clients. In the case of commercial
communications, most exporta are within the Community,
against only a small proportion of engineering and related
services (where developing countries are the biggest export
market),
consultancy, computer and operational services in which
there appears to be very little international trade,
research and development, financial review and legal
services, on which the re is no data available on export
shares of turnover.
The picture given by Table 5 roughly bears out our demand side
interviews. Those services which are not traded significantly according
to the table were generally contracted to local firms, with the
exception of consultancy. For this service, Table 5 is probably
misleading since international consultancies generally have subsidiaries
or partnerships in European countries. "Foreign" services of this kind
would therefore not be registered as experts. This also applies to
financial review, on which there are no figures in Table 5. Foreign
accountancy services are very widely used in the sense that the "Big
Eight" firms are international partnerships, though this would not be
reflected in export figures.
The highly domestic orientation of operational services was also
reflected in our demand side interviews.
4.6 Conclusion
Most business service trade associations recognise the existence
of barriers. While they feel that their significance is somewhat
limited this view does seem at variance with the demand side perception
- 20-

- 249 -
of barriere, whereby most firms know of no barriere and the few that do
acknowledge their existence believed them to be either insignificant or
marginal.
The following seem the most likely explanations of this
dictonomy:
the associations say that only some of their services are
affected and these have not touched upon our demand sample
significantly,
barriere are not fully recognised by users of business
services and despite prompting, are taken as facts of life,
many services are not sophisticated and can easily be
provided by local firms, such that consumera of services may
not feel deprived by having local supply only (though it
could mean a more restricted choice and possibly higher
priees). It is perhaps significant that those services for
which consumera most often turn to foreign suppliera are
specialised, sophisticated services not available in the
local market.
The general impression from the interviews is that the latter two
explanations are most.likely. Interestingly companies did not tend to
regard the purchase of foreign services as a natural option, even though
many imported foreign inputs in the goods sector in substantial
quantities.
- 21 -

- 250 -
5. THE COSTS OF NON-EUROPE FOR BUSINESS SERVICES
5.1 Background and methodology
In order to quantify the economie and financial coste of
non-Europe for business services we used a number of sources. The
literature review and the Peat Marwick McLintock factsheets provided
background statistical information about the business services sector
and the underlying economies of externalisation. The factsheets also
discuss the current state of internationalisation of business services
within the Community. The demand and supply side surveys and sorne
existing econometrie etudies provide the mechanisms by which to quantify
the effects of completion of the internai market.
Four factors complicate the analysis of the cost of non-Europe in
the case of business services:
relative lack of statistical information,
absence of existing etudies in the area of service sector
trade barriere,
poor perception of barriere by questionnaire respondents,
complexity of quantifying indirect effects for an
intermediate service.
Given these difficulties the emphasis in this section is on a
discussion of the elements of the costs of non-Europe supported by
quantitative assumptions as to the range and likely values of these
effects. These effects are summarised below in Table 11.
5.2 The size of the business service sector
The Peat Marwick McLintock factsheets yielded estimates as to the
size of the business service market in the Community. Turnover figures
are shown in Table 7.
- 22 -

- 251 -
Table 7 Business services turnover, 1986
Sec tor
Engineering & Related Services Consultancy Advertising (1) Public Relations Computing Services Research & Development Financial Review Legal Services
TOTAL
(1) including media costs
Turnover bn ECU
7.5 3.5
57 2
13 15 13 13
124.0 =====
Business services are an important sector in the Community
economy. The sector is also one of rapid growth even when compared to
other service industries.
5.3 Effects of the removal of business service barriers
Respondents in the demand-side questionnaire were asked about the
likely effects of removing business service barriers.
5.3.1 Changes in demand for business services
Even in the cases in which barriers were recognised over half of
the respondents did not consider that removal of these barriers would
affect purchases of business services.
5.3.2 Priee sensitivity
Companies were asked to assess the priee reduction for business
services which would be required to indu ce additional purchases.
Although average response was in the region of 10% there was a
considerable spread from 5% to 20% plus.
- 23 -

- 252 -
5.3.3 Effect on company sales
Of those companies recognising barriers to trade in business
services 41% considered that removal of those barriers would have no
effect on sales and 44% thought that sales would increase by up to 5%.
The remainder anticipated larger increases.
Almost equal weight was given to the following factors as
explanations for anticipated sales increases:
reduction in product priees,
improved competitiveness,
ability to enter new markets in Europe,
generally faster market growth.
5.4 Cost of non-Europe
We have divided the costs of non-Europe for business services
into four sources:
i) The higher costs of business services which results from
limited competition.
ii) Lower output across the economy which results from these
higher business service input costs.
iii) Lower demand for business services which results from higher
costs and more limited range of business services.
iv) Lower levels of (cost-saving) externalisation which result
from higher costs, and more limited range, of business
services.
The completion of the internal market for business services can
therefore be expected to produce the following corresponding benefits:
i) Savings due to reduction in business service priees.
ii) Increase in output across the economy.
- 24 -
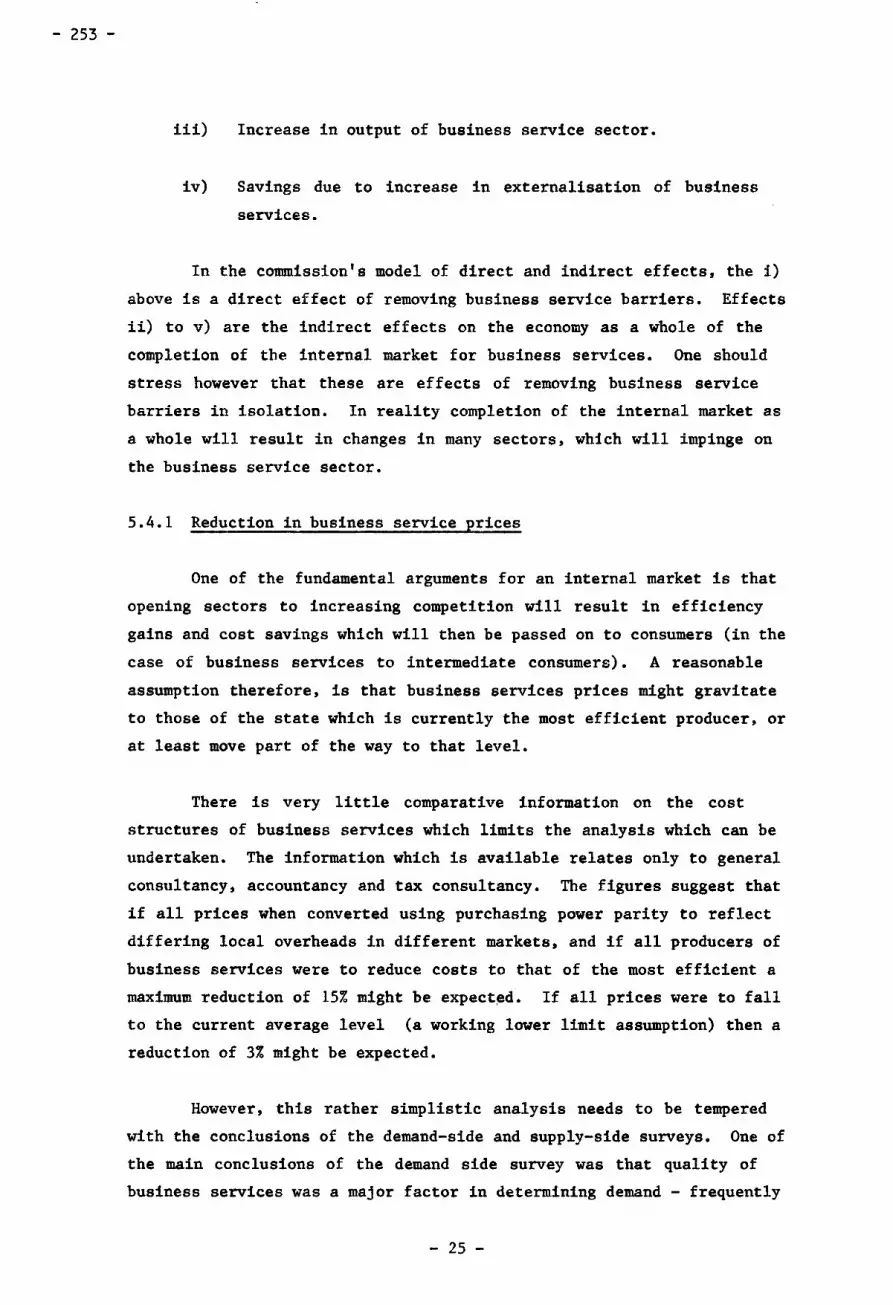
- 253 -
iii) Increase in output of business service sector.
iv) Savings due to increase in externalisation of business
services.
In the commission's model of direct and indirect effects, the i)
above is a direct effect of removing business service barriers. Effects
ii) to v) are the indirect effects on the economy as a whole of the
completion of the internai market for business services. One should
stress however that these are effects of removing business service
barriere in isolation. In reality completion of the internai market as
a whole will result in changes in many sectors, which will impinge on
the business service sector.
5.4.1 Reduction in business service priees
One of the fundamental arguments for an internai market is that
opening sectors to increasing competition will result in efficiency
gains and cost savings which will then be passed on to consumera (in the
case of business services to intermediate consumers). A reasonable
assumption therefore, is that business services priees might gravitate
to those of the state which is currently the most efficient producer, or
at least move part of the way to that level.
There is very little comparative information on the cost
structures of business services which limits the analysis which can be
undertaken. The information which is available relates only to general
consultancy, accountancy and tax consultancy. The figures suggest that
if all priees when converted using purchasing power parity to reflect
differing local overheads in different markets, and if all producers of
business services were to reduce costs to that of the most efficient a
maximum reduction of 15% might be expect~d. If all priees were to fall
to the current average level (a working lower limit assumption) then a
reduction of 3% might be expected.
However, this rather simplistic analysis needs to be tempered
with the conclusions of the demand-side and supply-side surveys. One of
the main conclusions of the demand side survey was that quality of
business services was a major factor in determining demand - frequently
- 25 -

- 254 -
costly services were used when cheaper were available for reasons of
quality. Such behaviour tends to support the view mentioned in many of
the supply-side interviews that competitors are not likely to enter new
markets on a priee cutting basis, but rather by offering an improved
product. Clearly this does not imply that business services clients
will not be better off; it does however make it very difficult to
qualify the gains to be made.
This view is further supported by the fact that when companies do
go to foreign companies for business services it is invariably because
of availability or quality reasons and not for reasons of cost.
It must also be stressed that very few respondents on the demand
side recognised any barriere other than "fact-of-life" type barriers
(such as language, proximity etc) to prevent them already from obtaining
the best possible service in europe. This was borne out by those on the
supply-side of the business service sector, most of whom did not foresee
a significant fall in priee.
Combining these survey results with the fact that the statistical
comparison of cost is limited by lack of data and narrowness of coverage
it seems reasonable to assume that the 3% priee fall mentioned below
might be seen as the most likely estimate of coAt reductions to be
expected from the completion of the internal market in business
services. Based on existing turnover and a priee reduction of 3%, the
cost savings to users of business services will be around 3.5 bn ECU.
The gains in efficiency made from access to better quality
services may be considerably greater but they cannot be quantified. It
is also clear that there will be differences between sectors. Sectors
in which substantial barriers exist (e.g. legal services) may witness
larger priee falls than advertising which already has a high degree of
internationalisation.
5.4.2 Increase in output in all sectors
Any reduction in the priee of business services or improvement in
quality will ultimately have a positive effect on demand for the final
output of business service consumera, and for goods generally.
- 26 -

- 255 -
Severa! factors must be considered, however when the extent of
this increase in damend is assessed. Firstly, externalised business
services represent only a small through increasing proportion of a
firm' s total costs ( typically in the region of 3%). Secondly, the
hypothesis of section 5.4.1 is that priees of business services will not
fall greatly. Thirdly, and confirming the first two points, demand side
respondents did not expect a large increase in general sales as a result
of the removal of barriers to business services. Even in instances in
which business service barriers were recognised, effects on general
sales were not perceived to be significant. The general effect on sales
of around 0.1%, and maybe less seems reasonable. A range of between 0%
and 0.2% (0 to 3 bn ECU) might be the lower and upper limits.
5.4.3 Increase in business service output
A relative priee reduction and general increase in economie
activity will, via priee and income multipliera, increase the demand for
business services. The conclusion of the demand side survey is that
priee elasticity is low. Competition is mainly on quality, and
respondents indicated that an average 10% priee reduction would be
required before any increase in demand for business services would be
realised. However, there was a considerable spread around this average.
There is no econometrie work which includes a priee or income
elasticities of business services but there are figures for the service
sector as a whole which we have used as a base for estimating business
service elasticities. Income elasticities in the service sector seem
typically in excess of 1%. Our survey results point to a very low priee
elasticity but a reasonably high income elasticity of demand for
business services, most probably higher than for services as a whole
which includes income inelastic government services. Long run priee
elasticity of 0.2% and a long run income elasticity of 1.4% was a
reasonable working assumption using the se figures. The increase in
demand for business services derived from a relative priee reduction and
income growth and range between 0.7 and 2.5bn ECU.
- 27 -

- 256 -
Table 8 Elements of the costs of non-Europe
Element bn ECU
Fall in priees of business services General sales growth Growth in business service sales Savings due to increases in externalisation
5.4.4 Increases in externalisation
0 3.5 0 - 3.0 0.7- 2.5 0.1- 0.2
Increased competion in the business services market will reduce
costs, improve quality, increase availability and improve the
information and marketing of business services, consequently increasing
the degree of externalisation ( that is the number of services
externalised). The demand side survey bas revealed that this leads to
cost savings. The true opportunity cost of non-Europe from this source
is the net gain, since externalisation implies a transfer of jobs and
income from the consuming sector to the business service sector.
The demand side survey suggest that of those firms recognising
business service barriers (a small proportion) only about half,
representing 8% of the sample, expected to contract out more services on
their removal. This small figure is again consistent with the finding
that business service barriers are not substantial. The increase in
externalisation from this source is therefore unlikely to be very
significant and overall business service demand is unlikely to rise by
more than 1% from this source (on the basis of demand side questionnaire
responses). This representa a maximum gain of 1. 25bn ECU for the
business service sector and, on the basis of 10 to 15% savings stemming
from externalisation, and on the fact that business services account for
only 3% of total costs, it accounts for a 0.1-0.2bn ECU saving on the
cost of business services to consumer companies.
5.5 Conclusions
Table 9 summarises our estimate of the costs of non-Europe.
- 28 -

- 257 -
Table 9
i)
ii)
iii)
iv)
Estimates of the cost of non-Europe
Direct effects
Higher costs of business services
Indirect effects
Lower output in whole economy
Lower demand for business services
Higher costs from foregone externalisation
Range (bn ECU)
3.5
0-3.0
0.8-2.5
0.1-0.2
The corporate sector bas for severa! years been in a process of
externalising many of its business services and this process is clearly
continuing. Y~reover this process is economically beneficia!, largely
because of the higher quality of service which specialists are able to
provide, but in some cases also because there are cost advantages.
In contrast to the purchase of goods as inputs into their
products, firms are not inclined to look abroad for the provision of
business services. It is clear that some trade barriere exist for
severa! services, even though they have limited effects in impeding
trade. In general, however, these barriere are not acknowledged by
service users, largely because of their tendency to rely on domestic
provisions. Trade in most business service sectors is low; service
companies are heavily dependent on domestic markets, which have been
growing strongly in most countries. This fragmentation of the market is
not only unusual in comparison with the goods sector and some other
services, it also seems at odds with the varying strengths and
weaknesses of different countries in each sector.
The continued fragmentation of the market bas effects on both
providers and users of services. For providers it hinders the expansion
of their services and reduces the range of services they provide in
other countries. As a result it bas some effect of inflating priees
(effect i) above).
- 29 -

- 258 -
However it has more significant implications in terms of the
quality and range of service available, which is a more significant
determinent of whether business services are purchased from outside.
Thus the use of external business services is lower in a fragmented
market (effect iii) above). This in turn means that the benefits of the
foregone externalisation are lost (effect iv) above) and output as a
whole is reduced (effect ii) above).
- 30 -
- 259 -
8.
The •cost of Non-Europe•
in Financial Services
Priee Waterhouse


- 261 -
Priee Waterhouse International Economie Consultants
THE COST OF 'NON-EUROPE' IN FINANCIAL SERVICES
EXECUTIVE SUMHARY
MARCB 1988
Priee Waterhouse


- 263 -
1.
2.
3.
4.
5.
EUROPEAN COMMISSION
THE COST OF NON-EUROPE FOR BUSINESS SERVICES
INTRODUCTION
METHODOLOGY
EXECUTIVE SUMMARY
- Contents -
THE USE OF BUSINESS SERVICES
BUSINESS SERVICES AND THE INTERNAL MARKET
THE COST OF NON-EUROPE FOR BUSINESS SERVICES
1
3
6
14
22

- 264 -
CONTENTS
PAGE NO.
SECTION 1: INTRODUCTION 1 - 2
SECTION 2: METHODOLOGICAL ISSUES 3 - 4
SECTION 3: MACROECONOMie AND SECTORAL ANALYSIS 5 - 7
SECTION 4: ANALYSIS OF THE STRUCTURE OF FINANCIAL SERVICES MARKETS 8 - 9
SECTION 5: QUANTIFICATION OF THE EFFECTS OF REGULATIONS 10 - 18
SECTION 6: ESTIMATING THE GAINS FROM EUROPEAN ECONOMIC INTEGRATION 19 - 27

- 265 - - 1 -
SECTION 1: INTRODUCTION
1.1 This report was prepared by Priee Waterhouse and represents the results of an economie study of the costs of "Non Europe" in financial services. The study's geographical coverage was as follows:
Federal Republic of Germany, France, Italy, the United Kingdom, the Benelux countries and Spain.
1.2 The principal objectives of this study were to:
assess the importance of financial services to the Community economy; analyse the present organisation of the market for financial services; evaluate the economie impact of completing the interna! market in financial services.
1.3 For clarity and ease of reference, the organisation of the main report is described below and a brief outline of each section is given in this executive summary.
In Section 2 a review of methodological issues is presented.
This is followed in Section 3 by a macroeconomie and sectoral analysis with the object of evaluating the importance of financial services to eight economies of the Community under review.
In Section 4 an overview of the present structure of the financial services market is set out. The focus of this section is on regulatory barriers which have the potential to affect the establishment of financial service institutions in overseas markets or the potential to affect cross border trade directly.
In Section 5 an analysis of the scope for quantitative assessment of the effects of completing the interna! market is considered.
Finally, in Section 6, the estimation of the economie impact of integration is presented. Detailed analyses relating to a number of important areas of the study have been included as appendices to the main report.
1.4 In view of the complex and sensitive nature of the information and analysis in this report it is important that disclosure of specifie parts of the study are not made out of context.

- 266 - - 2 -
1.5 It should be appreciated that certain key assumptions were made in the conduct of our field work and in the preparation of this report. These include, inter alia, the assumption that the central aim of the Commission is to create a framework for a free and competitive interna! market in financial services whilst at the same time ensuring adequate standards of consumer protection. The intention is that this will be achieved through a legislative programme which is aimed at stimulating cross-border trade and encouraging investment and establishment in foreign territories.
1.6 It is also envisaged that the economie climate thus created will lead to an intensified interest in Pan-European acquisition and merger opportunities and that this will need to be supported by an appropriate regime of freedom for capital movements. Our analysis considers the likely economie consequences for the Community of this scenario.
1.7 An evaluation of the 1ikelihood of progress towards an integrated financial services market or the likely responses from national governments to opening up of the financial markets is outside of the scope of the study. Similarly, an evaluation of the likely response of producers in different countries to the assumed integrated market is outside the scope of this economie study.
1.8 It should also be recognised that in the achievement of the economie goals, summarised above, any significant changes in the pattern of market concentration may need to be kept under review in the early stages 1eading up to the following liberalisation in order to alleviate market distortion effects which undermine the aims of the 1992 initiative. This will have a wide range of implications for Commission competition policy, for example in the approach adopted towards multi-national industry groupings and the balance of investment opportunities between Community and external providers of financial services.
1.9 We would like to thank the Steering Committee for advice provided to the consultancy team during the course of the study and for input made by externa1 advisors. We would also like to thank al! individuals and institutions who provided information, during this study.

- 267 -- 3 -
SECTION 2: METHODOLOGICAL ISSUES
2.1 The purpose of this section is to resolve three methodological problems:
0
0
0
to provide a comprehensive operational definition of financial services.
to dentify producers and users of financial services.
to clarify the link between liberalising the market for financial services and liberalising capital movements.
2.2 Definition of Financial Services
It was agreed with the Commission at the outset that financial services should be defined to include the provision of a financial service or the sale of a financial product or both and that the following activities should be included in the definition.
0
0
0
0
0
0
0
0
0
international, commercial and private banking corporate financial services offshore banking and money market activities broking funds management assurance, insurance, and reinsurance consumer credit building societies stock exchange services.
A description of the financial products and services covered by each of these activities is outlined in the main report. The activities can be grouped under three headings:
0
0
0
banking and credit services insurance services brokerage and securities services
These categories have been used, as far as possible, throughout the study, and particularly in the macroeconomie and sectoral analysis and in the analysis of the market. In the examination of the scope for a quantitative assessment of the effects of completing the internal market, representative services have been selected from each of the above groups of activities.
2.3 Identification of Producers and Users
It was necessary from a methodological viewpoint to decide how to treat the identification of producers and users in the sectoral analysis. It was also clear that, in identifying producers and users of financial services, segmenta! differences between countries would need to be recognised. In addition it was decided that only primary users could be identified.
-

- 268 - - 4 -
This methodological decision implied the need for sectoral analysis to be undertaken on a country-by-country basis. It also highlighted the need to attempt to identify differences in the type and range of services offered by different institutions in different member countries. This issue is considered at sorne length under the section on macroeconomie and sectoral analysis in the main report. It should also be appreciated that in the analysis of the economie impact of integration in Section 6, consumers are defined as including all consumers including private, commercial and institutional groups.
2.4 The Lint Between Trade in Financial Services and Capital - Movements
An important methodological issue examined related to the link between trade in financial services and exchange controls. In view of its importance and complexity we consider this issue in detail in Appendix 3 of the main report. The main question addressed is the extent to which freedom of trade or overseas establishment can yield consumer benefits despite the persistence of controls on capital movements. The Commission's objective is a regime of freedom of capital movements as well as freedom to establish and trade, with home country prudential regulation being recognised in the first place. However it is important to assess also the consequences of a partial or intermediate stage in the achievement of this objective.
Our analysis indicates that maintenance of strict exchange controls may well inhibit the full consumer benefits from freedom of trade and freedom of establishment. This is principally because financial institutions will not be able to take full advantage of the economies of a wider market. Although an attempt to maintain a regime of strict regulation may well run into difficulties under a system of home country control, it is not certain that these regulations will create competitive disadvantages for home financial institutions. Market segmentation rather than global loss of competitiveness may often be the consequence.
Under host country regulations, the result of freedom of establishment may be very little improvement where uncompetitive market structures exist or may result. In contrast, the prospect for welfare gains from a liberalisation of exchange controls does not seem to depend so heavily on freedom of establishment, at least for financial services of a wholesale type.
At present the persistence of exchange controls prevents the free flow of capital from moving to the countries with the highest rates of return. Even if there were no differences between the efficiency of the financial services in various member states, the removal of exchange controls could therefore be expected to have beneficia! effects.

- 269 - - 5 -
SECTION 3: MACROECONOMie AND SECTORAL ANALYSIS
3.1 In this section aggregate datais presented for each of the countries in the study to indicate the relative economie importance of the financial services sector. Data will be found covering:
employment; value added; output;
In the main report we also present information on the demand for financial services by households, companies and government. In addition data is presented on external transactions in financial services and on the profitability of the banking and insurance sectors.
3.2 Employment in Financial Services
Total Employment
Table 3.1 shows that employment in the banking, finance and insurance sectors in the countries studied exceeded 3.1 million in 1985. Banking and finance employed in excess of 1.7 million; and there were more than 700,000 employed in insurance (Note 1). Banking, finance and insurance represented 3.5 per cent of total employees in the eight countries in 1985. Individually, most countries were close to this average except Luxembourg at 7.7 per cent and Italy at 2.5 per cent.
Table 3.1: Employment in Banlting and Insurance by Country 1985 (See Note 2)
Employment (•ooo) Banlting
Country and Finance Insurance Total Total as % of
Total Employees
B D ES F I L NL UK
TOTAL
89 604
n.a. 448
n.a. 9.9 111 527
30.0 230
n.a. 154
n.a. 0.9
42 245
119 3.9 834. 3.7 292 3.9 602 3.4 379 2.5
11 7.7 153 3.5 772 3.6
3,162 3.5
Source: Statistical Office of the European Commission (s.O.E.C.)
Notes: (1) These figures exclude Italy and Spain for which there is no breakdown between employment in insurance and banking.
(2) These data exclude agents not acting as principals in the financial sector.

- 270 -
3.3
- 6 -
Value Added
In the subsequent economie analysis, value added represents the sum of compensation of employees and profits accruing to the resources employed. It is an important indication of the economie significance of financial services. The table below shows value added for credit and insurance.
In the National Accounts data, transactions are classified by branch and by sector. Branches consist of units of homogeneous production engaged in the production of a single product or group of products and sectors are based on the institutional arrangements in force. The sectoral data shows a breakdown between credit and insurance and is broadly comparable with the employment data. Data on value added by both branch and sector are shawn in the table below. The data on value added is provisional and may be subject to revisions.
In 1985, value added at market priees in credit and insurance on the basis of branch data represented 6.7 percent of GDP. The countries with the highest contribution were Luxembourg (14.0%) and the UK (12.6%). The lowest percentages were in France Netherlands and Germany.
Table 3.2: Value Added in Credit and Insurance in 1983 & 1985
Country
B D ES F I L (Note 1) NL UK
Total
1985 ECUm
(Branch)
5,966 44,417 13,929 29,277 26,998
535 8,537
70,240
199,899
(1) 1982 data
Source: S.O.E.C.
% GDP
5.9 5.5 6.1 4.5 5.6
14.0 5.4
12.6
6.7
1983 ECUm
(Branch)
4,442 40,925 8,889
22,156 24,051
535 8,049
53,896
162,943
% GDP 1983 % GDP -- (ECUm) (Sector)
4.9 4,584 5.1 5.7 41,874 5.7 5.1 9,131 5.1 3.9 28,462 4.9 6.0 25,027 6.3
14.0 535 14.0 5.4 8,207 5.5
11.2 30,004 5.9
6.2 147,824 5.6

- 271 - - 7 -
3.4 Output/Turnover in Financial Services
In this analysis a number of turnover measures are related to GDP as further indicators of the significance of financial services in each member state.
Table 3. 3: Insurance Premiums, Bank Loans Outstanding and Stock Market Capitalisation as % of GDP
Country Insurance Premiums
1984
B 3.9 D 6.6 ES 2.5 F 4.3 I 2.2 L 3.1 NL 6.1 UK 8.1
Bank Loans 1984
Stock Market Capitalisation (Note 2)
142 (Note 1) 92 139 89
99 69 93 (Note 1) 85 96 75
6,916 11,125 130 165 208 149
Source: S.O.E.C, Sigma, O.E.C.D., F.I.B.V
(1) 1982 data (2) End 1986 data
Table 3.3 shows that relative to GDP the banking and securities markets were by far the largest in Luxembourg and that the insurance market relative to GDP was largest in the UK.

- 272 -- 8 -
SECTION 4: ANALYSIS OF THE PRESENT STRUCTURE OF THE FINANCIAL SERVICES MARKETS
4.1 This section focuses on regulatory barriers and how they are implemented. In particular, attention is given to those barriers affecting the establishment of a financial service in a foreign state and affecting trade directly. In this section we use "foreign" to refer to other European Conununity countries as well as to countries outside the EC.
4.2 Regulatory Barriers to Trade and Establishment in Banking
In general there are no overt barriers to the establishment of foreign banks in the countries surveyed.
Foreign banks must in general comply with the same procedures as domestic banks. This does not imply that successful entry by a foreign bank is easy since the costs involved in meeting the requirements for establishment of branches and subsidiaries may be considerable. There is however control over the acquisition of domestic banks by foreign entities in all the countries in the study and some details of licensing requirements in each country are outlined in the main report.
In all countries except the UK, branches of banks are required to maintain their own minimum endowment capital. Some countries also impose solvency ratios. While it has not proved feasible to quantify the impact of differences in such ratios a study carried out by the Economists Advisory Group reflected a consensus in the banking world that lack of harmonis~tion in this area constituted a barrier to trade.
Moreoverr there are often restrictions on the services which may be offered by a branch or subsidiary of a foreign bank.
The overall conclusion drawn in this section is that barriers lie not in overt rules or practices but in national practices that apply equally to all banks. Clearly differences in national practices may make sorne countries more attractive than others for foreign banks wishing to establish operations.
4.3 Regulatory Barriers to Trade and Establishment in Securities
Exchange controls may be a significant barrier in this market sector. Many of the operators in this market are banks and the points made earlier in relation to freedom of trade and establishment in banking apply equally.
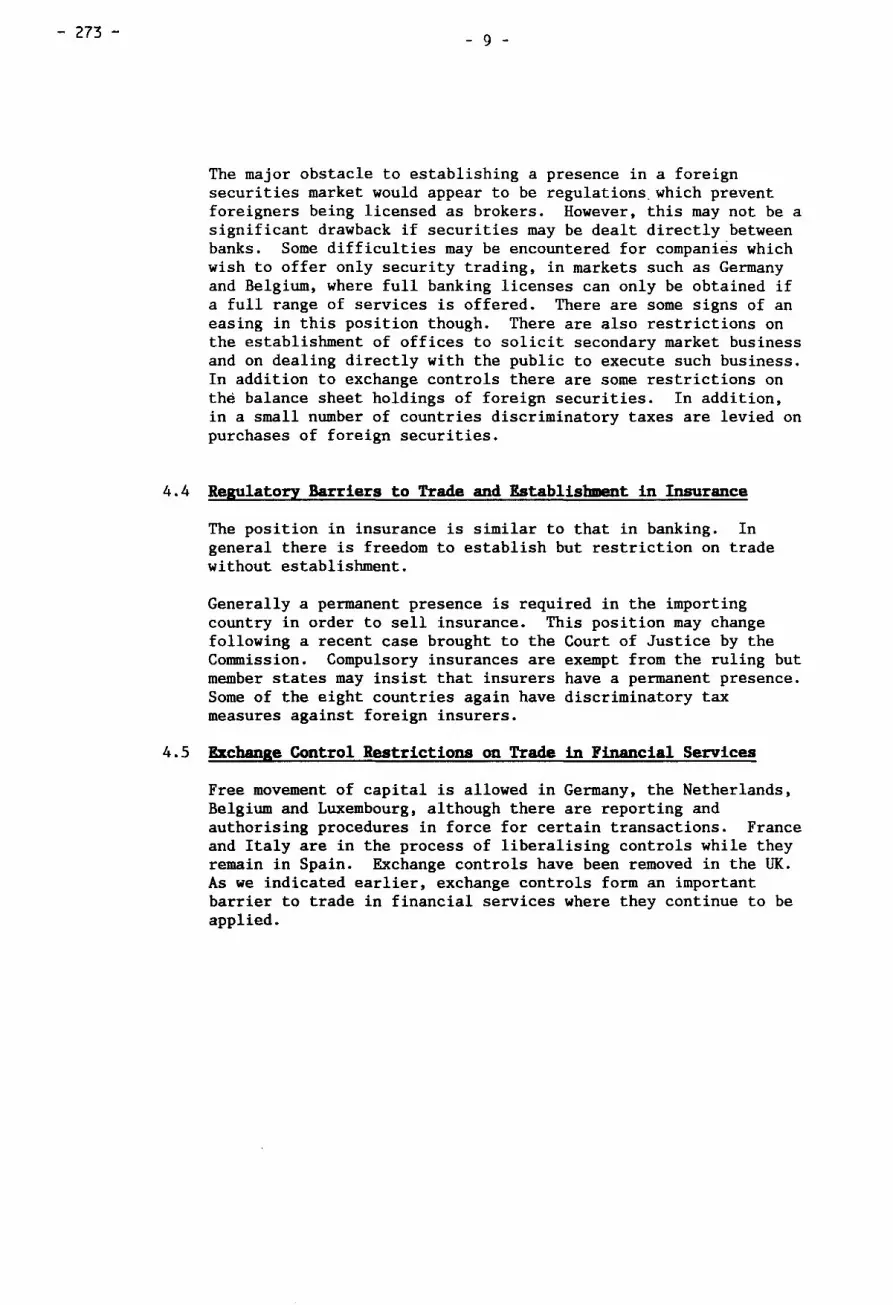
- 273 - - 9 -
The major obstacle to establishing a presence in a foreign securities market would appear to be regulations. which prevent foreigners being licensed as brokers. However, this may not be a significant drawback if securities may be dealt directly between banks. Sorne difficulties may be encountered for companies which wish to offer only security trading, in markets such as Germany and Belgium, where full banking licenses can only be obtained if a full range of services is offered. There are sorne signs of an easing in this position though. There are also restrictions on the establishment of offices to solicit secondary market business and on dealing directly with the public to execute such business. In addition to exchange controls there are sorne restrictions on thè balance sheet holdings of foreign securities. In addition, in a small number of countries discriminatory taxes are levied on purchases of foreign securities.
4.4 Regulatory Barriers to Trade and Establishment in Insurance
The position in insurance is similar to that in banking. In general there is freedom to establish but restriction on trade without establishment.
Generally a permanent presence is required in the importing country in order to sell insurance. This position may change following a recent case brought to the Court of Justice by the Commission. Compulsory insurances are exempt from the ruling but member states may insist that insurers have a permanent presence. Sorne of the eight countries again have discriminatory tax measures against foreign insurers.
4.5 Ezchange Control Restrictions on Trade in Financial Services
Free movement of capital is allowed in Germany, the Netherlands, Belgium and Luxembourg, although there are reporting and authorising procedures in force for certain transactions. France and Italy are in the process of liberalising controls while they remain in Spain. Exchange controls have been removed in the UK. As we indicated earlier, exchange controls form an important barrier to trade in financial services where they continue to be applied.

- 274 -- 10 -
SECTION S. QUANTIFICATION OF THE EFFECTS OF REGULATIONS
5.1 Introduction and Review of Approaches
The abject of this section is to determine the scope for a quantitative assessment of the effects of completing the internal market in financial services. In particular, the section provides quantitative measures of the effect of regulation, and of the lack of Community wide competition.
In the main report we present a quantification of the impact of regulation on the basis of a set of priees for selected financial services and products. We believe, however, that such an approach is on its own not sufficient and we have therefore obtained additional measures of the effects of regulation from other sources.
In attempting to quantify the effects of regulation we considered a wide range of approaches including the following:
Comparative priees of specifie products/services; Value added/output ratios; Survey data on net margins; Indirect measures of impact of specifie regulations. A case study of the impact of deregulation.
The rationale and the limitations of each of the above approaches are discussed below.
(1) Comparative Priees of Specifie Products/Services
In reviewing comparative priees as a measure of the effect of regulation or market segmentation, there are bath concepttial and technical difficulties to be resolved.
A conceptual difficulty with using priee differences as a measure of the effect of regulation is indicated by the fact that there are significant priee differences within national markets although suppliers in these markets are faced with the same regulations. It is, therefore, unlikely that the removal of regulatory barriers to trade would result in a single priee. It is also important to realise that there are market as well as regulatory barriers to trade. An example of a market barrier is the information required to gain entry. We formed the opinion that priee divergence within countries may well be due to information barriers as well as to legislative obstacles.

- 275 - - 11 -
In addition to this conceptual difficulty there are severe technical difficulties in measuring priees. Firstly, there is the question of comparability of products. For example the priee of motor insurance for the same class of insurance etc may differ as a reflection of differences in the underlying risk. The issue of comparability of priee data is particularly important and the difficulties in obtaining strictly comparable data are discussed in detail in the main report. A second problem arises due to the effect of cross subsidies between financial services products.
In our analysis, we have selected a range of products/services in such a way as to attempt to minimise these factors. There are also severe practical difficulties in obtaining priee comparisons as relative priees can change rapidly and clearly given significant priee variations within countries there is also a danger that priee divergences between countries may reflect sampling errors.
(2) Value Added/Output Ratios
In considering value added to output ratios we have attempted to quantify the effect of market segmentation by measuring the resources used in producing a unit of output. In many service industries the ambiguity of the concept of output, and the difficulty of measuring it, has often led statisticians to turn to resource inputs themselves in arder to overcome these difficulties. It should be appreciated that the measure of output used has to be conceptually independent of inputs.
There are also deficiencies in using value added/output ratios as an indication of efficiency and these are discussed in detail in the main report. These deficiencies are likely to be particularly severe in making comparisons between individual financial institutions. Aggregation over all institutions, and the use of time series for cross-country comparison will tend to reduce limitations in this respect. Notwithstanding the residual problems which have been recognised we believe this provides a useful aggregate check on the micro data.
(3) Survey Data on Net Margins
An alternative approach to exam1n1ng priees is to look at differences in the costs or profits obtained by different financial institutions in the different countries. In particular, an examination of margins in the banking sector and of cost-to-output ratios in such sectors as insurance can be of use in evaluating the effect of regulations. This represents a micro cross-check on the value added to output ratios considered above.

- 276 - - 12 -
(4) Indirect Measures of Impact of Specifie Regulations
It was recognised at the outset of the study that the impact of selected specifie regulations could also provide useful input into the quantification of the effect of regulation. This, however, would only measure static effects. In addition, it would only measure the impact on institutions who decided to "pay the cost" of meeting the regulations. Our judgement is that such an approach is very unlikely to prove worthwhile. For illustrative purposes we have however reported on the results of selective research on the impact of specifie regulations in the banking and insurance sectors.
(5) Case Studies of Impact of Deregulation within a National Boundary
A potential approach to quantifying the effect of regulation is offered by individual case studies on the priee impact of deregulation within a national boundary. This could be a useful additional source of input into the evaluation of the effects of removing or reducing regulations in Europe. We have, therefore, taken as a case study the example of deregulation of the UK securities business.
The remainder of this section sets out the quantified data for comparative priees, value added/output ratios, survey data on net margins, indirect measures of the impact of specifie regulations, and the case study of impact of deregulation.

- 277 -
5.2
- 13 -
Quantification of Comparative Priees
In the following paragraphs we present a quantification of comparative priees for a range of financial services products in the eight countries. We present details of priees in the banking and credit sectors, in insurance, and in the securities and brokerage sectors. In particular, we analyse details of priees for the following services/products:
cost of commercial loans;
cost of consumer credit;
cost of mortgages;
cost of credit cards;
cost of purchasing foreign exchange drafts and travellers cheques;
cost of letters of credit;
cost of current bank accounts;
cost of term insurance;
cost of home and contents insurance;
cost of motor insurance;
cost of fire and theft insurance;
cost of public liability insurance;
and cost of stock exchange transactions.
Our selection of products was designed and agreed with the Commission to overcome sorne of the difficulties referred to earlier in Section 5.1.
Many of the priees have been obtained directly via a sample of financial providers. As we have already noted however, it is important to treat comparative priee data with care. Priees of financial services change frequently and the data presented represents a "snap-shot" at a given point in time. Also of critical importance is that for a wide range of financial services there is a substantial variation in possible priees on offer, and in many cases there is cross-subsidisation between different financial services.

- 278 - - 14 -
Another important issue relates to how representative the chosen products are, of the output of the financial services sector as a whole. This is a difficult issue to judge but given the large number of different services chosen which caver bath private consumer and commercial services in the banking, insurance and securities sectors, these services are believed to be broadly representative. The services covered do not include advisory services. The reason for this is methodological in that it was not felt possible to obtain priees for standardised advisory services. The sources of the data presented are indicated.
It should be appreciated that we have attempted to present information in a standard manner for the same financial services products in different countries. In certain cases regulatory or market practices have prevented this and these cases are discussed in our main report. We have also attempted to standardise the presentation for different types of financial services products.
A key issue in interpreting the priee data is that we have attempted to focus on the cast of the service provided by the financial institutional and have adjusted the figures to remove the influence of interest rate differentiais. The impact of interest rate differentiais is considered separately in Section 6. In the table overleaf we define the financial services and products for which priees were obtained. As many of the products represent the margin over wholesale money market rates the priees do not represent the cast to the consumer. This is consistent with our economie modelling requirements. The data would not be suitable as a definitive measure of consumer priees in different countries.
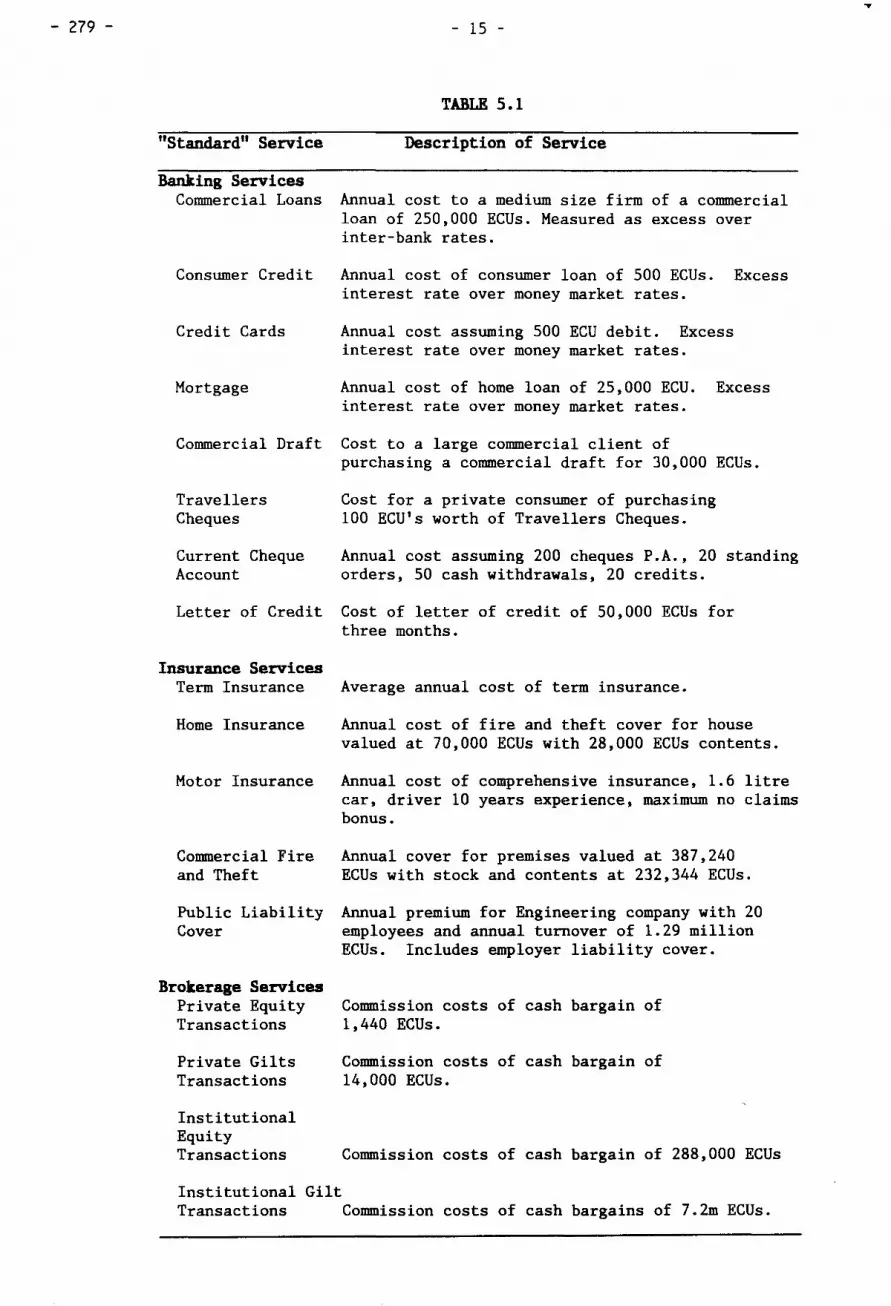
- 279 -
"Standard" Service
Banking Services Commercial Loans
Consumer Credit
Credit Cards
Mortgage
Commercial Draft
Travellers Cheques
Current Cheque Account
Letter of Credit
Insurance Services Term Insurance
Home Insurance
Motor Insurance
Commercial Fire and Theft
Public Liability Cover
Brokerage Services Private Equity Transactions
Private Gilts Transactions
Institutional Equity Transactions
- 15 -
TABLE 5.1
Description of Service
Annual cost to a medium size firm of a commercial loan of 250,000 ECUs. Measured as excess over inter-bank rates.
Annual cost of consumer loan of 500 ECUs. Excess interest rate over money market rates.
Annual cost assuming 500 ECU debit. Excess interest rate over money market rates.
Annual cost of home loan of 25,000 ECU. Excess interest rate over money market rates.
Cost to a large commercial client of purchasing a commercial draft for 30,000 ECUs.
Cost for a private consumer of purchasing 100 ECU's worth of Travellers Cheques.
Annual cost assuming 200 cheques P.A., 20 standing orders, 50 cash withdrawals, 20 credits.
Cost of letter of credit of 50,000 ECUs for three months.
Average annual cost of term insurance.
Annual cost of fire and theft caver for bouse valued at 70,000 ECUs with 28,000 ECUs contents.
Annual cost of comprehensive insurance, 1.6 litre car, driver 10 years experience, maximum no claims bonus.
Annual caver for premises valued at 387,240 ECUs with stock and contents at 232,344 ECUs.
Annual premium for Engineering company with 20 employees and annual turnover of 1.29 million ECUs. Includes employer liability caver.
Commission costs of cash bargain of 1,440 ECUs.
Commission costs of cash bargain of 14,000 ECUs.
Commission costs of cash bargain of 288,000 ECUs
Institutional Gilt Transactions Commission costs of cash bargains of 7.2m ECUs.
...

- 280 - - 16 -
Priees of a number of the financial services examined in the eight countries are presented below. Additional details are presented in the main report.
Table 5.2: Comparative "Priees" of Purcbases of a Range of Financial Services in the Eight Countries
Banting Services Commercial Loans Consumer Credit Credit Cards Mortgages Foreign Exchange Drafts Travellers Cheques Current Accounts Letters of Credit
Insurance Services Term Insurance House Insurance Motor Insurance Commercial Fire and
B
4,500 12 94
480
43 7.3
0 575
380 118 494
D
5,000 46 84
575
53 5.0 117 425
225 144 436
ES
5,625 27 66
800
120 7.0
2 750
294 135 758
ECU F
4,375 40 37
653
63 7.5
10 438
285 195 413
I
5,125 43 99
350
50 6.6 240 515
392 253 942
L
5,000 14 46
499
54 5.0
8 600
355 220 671
NL
6,750 26 75
343
22 7.2
0 550
195 164 354
UK
6,875 43 61
290
47 5.0 112 510
150 266 316
Theft 1,296 2,023 1,765 3,587 4,896 1,204 1,412 1,797 Public Liability Co ver
Securities Services Private Equity Transactions
Private Gilts Transactions
Institutional Equity Transactions
968 1,257 1,364 1,852
14 11 17 9
65 108 180 69
1,727 2,302 3,453 1,292
1,508 934 714 798
10 11 22 23
21 72 148 77
2,014 2,302 1,726 719
Institutional Gilt Transactions 21,583 5,395 8,993 8,844 10,791 3,597 4,640 n/a
Source: Survey Results 1) Consumer credit in Italy assumed to be equal to the average of Germany,
France and UK 2) The London Gilt market is now on a net of commission basis 3) Mortgages in Luxembourg assumed to be equal to average in other Countries
Caution must be exercised in interpreting the above priee comparisons, and the analysis in the report concerning cross subsidisation and the problems in priee comparability must be noted. It is also important to stress as indicated earlier that many of the products represent the margin over wholesale money market rates and therefore the "priees" do not represent the cost to the consumer. This is consistent with our economie modelling requirements but the data would not be suitable as a measure of consumer priees. Priees are also exclusive of consumer taxes.
- 281 -
5.3
- 17 -
Value-Added to Output Ratios
The value-added to output ratios provided in the main report gave sorne indication of the resources used to produce a unit of output, since value-added represents the return to labour and capital before allowance for depreciation and excluding transfers. In the case of banking, the measure of output generally used is loans outstanding. This is not entirely satisfactory since it does not take account of a number of elements affecting the output of banks such as differences in risk attaching to loans, the extent of deposit and money transmission services, and a number of off-balance sheet transactions. The comparisons made using aggregate data across countries tend to reduce sorne of these difficulties but nevertheless problems remain. Taking insurance as an example the use of premiums as a measure of output masks the problem that for sorne policies the premium may cover more than one year and in others may partly represent a pure investment sum.
Insurance
Value-added in the insurance sector does not include interest and dividend earnings which, for national accounts purposes, are regarded as transfers. The value-added to premiums ratio in 1983 was highest in the UK at 25.5% and lowest in France at 6.0%. However, when net interest earnings are taken into account the UK percentage falls to 1.1% and that of France rises. Belgium's percentage was highest at 32.2% in this case. When dividend earnings are also added to the value-added figure Germany emerges with the lowest ratio and Belgium remains the highest.
Banking
In the banking sector the value-added to loans ratio (including interest earnings) was lowest in the UK and the Netherlands at 3.0% and highest in Italy at 6.3% on average over the period 1978-84.
5.4 Survey Data on Net Hargins/Costs
This approach represents a micro cross-check on the value-added to output measures considered above. The data relating to 1982 shows that the gross earnings margin in large banks was highest in the UK at 4.72% of assets and lowest in the Netherlands at 2.9%.
A sample of the accounts of insurance companies in different countries was evaluated to establish the ratio of expenses to premiums. Non-life insurance management expenses and commissions were the largest percentage of premiums in Belgium at 39.6% and lowest in the UK at 21.2%.
In life insurance the percentage was highest in Spain and lowest in the UK though it was possible to identify life business separately in the published accounts for only three countries.

- 282 -
5.5
- 18 -
Indirect Measures of Specifie Regulations
This section summarises the main findings of studies carried out by EAG (1) on 11 the impact of prudential regulations on banking11 and by Carter and Morgan (2) on the impact of regulation on insurance.
Banking
Banks in different countries may be required to observe a combination of minimum absolute capital requirements, gearing ratios, own funds/risk assets ratios, fixed asset ratios and large loan ratios. The EAG study indicated that it would not be possible to provide quantitative comparisons of the effects of these requirements but on the basis of the opinions of those interviewed it was felt that in the three major banking countries, the UK, France and Germany, French banks had a significant advantage over the other two. Banks in the UK probably enjoyed a slight competitive advantage over those in Germany.
Insurance
In life insurance the degree of regulation varied between countries. The supervisory authorities generally control the mortality rates to be used in premium calculation (apart from the UK) but controls in sorne cases cover interest rates, the calculation of expense overheads and the distribution of profits. The study carried out in 1986 by Carter and Morgan showed that the mortality rates used in the calculation of term insurance were in most cases 2-4 times more conservative than in the UK. The UK is the only country in which the mortality rates used are based on insured lives rather than population averages. As an example, pure premiums for a 20 year term using UK and Belgian mortality rates and 6 and 4% interest rates were calculated. This showed a difference of 227% of which only one 25th was accounted for by the interest differentia!.
From this it can be seen that the measurement of the effect of specifie regulations is difficult to quantify and more importantly, is likely to under-estimate the costs of "Non-Europe".
5.6 Case Study E!ample of the Impact of the Deregulation
The impact of deregulation of the London Stock Exchange has been taken as an example of the effects of regulation. The effect may be seen by examining commission rates, the number of market makers, equity dealing spreads and the depth of markets for different types of shares. These are considered in detail in the main report. Overall, the case study indicated that while there were small increases in commissions for small transactions, for the institutional transactions sector, commission rates fell by between 20 and 36 per cent. It is not certain however if these priee reductions will remain given the level of capacity in the market.
(1) An Evaluation Of The Consequences Of The Existence Of Different Prudential Ratios For Competition Between Credit Institutions In The European Community, EAG Report 1986, Report Prepared for European Commission.
(2) Carter R.L., Morgan E.V. Freedom To Offer Life Insurance Across EEC State Boundaries, EAG Report 1986.

- 283 - - 19 -
SECTION 6: ESTIMA TING THE GAINS FROM EUROPEAN ECONOMIC INTEGRATION
6.1 In this section we present our estimates of the gains from European economie integration. In particular we consider two aspects of this important issue. Firstly, we examine our estimates for the microeconomie gains from integration of European financial services markets. Secondly we review the macroeconomie welfare gains from integration of the European capital markets. In this connection we also consider the gains from risk pooling and equalisation of interest rates.
6.2 Our estimates of the costs of "Non-Europe" are based primarily on assumptions of the likely movement of priees in an integrated financial market. Earlier in this study, data on the existing priees of financial products was presented. The data indicated a wide range of priees both within and between countries and it is clear that while priees for certain financial services were lower in some countries, the priees of other services were higher than in the other countries examined. Later in this section we consider our assumptions for the likely priees of financial services in an integrated market.
6.3 At present in a non-integrated Europe the various barriers to the completion of the interna! market in financial services result in different priees being charged in the different countries. The net effect is as if there were a set of tariffs protecting the producers of financial services in the high priee countries.
6.4 From this perspective the evaluation of welfare gains (i.e. net economie benefits) from the completion of the interna! market involves an exercise similar to the calculation of the gains (in terms of consumer surplus, etc.) from a move to free trade, or the establishment of a customs union.
6.5 In our main report we consider in detail a methodology for moving from assumptions of the likely range of future priee changes to economie welfare gains. In this executive summary we focus on our assumptions for future priees and the results of our calculations.
ruture Priee Levels
6.6 The level by which priees of financial services will change in an integrated European market is by definition speculative and difficult to verify. Our analysis in this report is intended to provide a basis for producing estimates of the potential change in the value added element of priees that could be expected. In particular our estimates are guided by a number of factors including data on existing priee differentiais, value added/output ratios, net margins/cost data and the extent of specifie regulations. Our future priee scenarios are also guided by the case study example of the impact of deregulation within national boundaries.

- 284 -
6.7
6.8
6.9
6.10
6.11
- 20 -
The study of priee reductions resulting from deregulation within a national market summarised earlier, referred to the UK securities market. This case study indicated that while there were small increases in commission for small transactions, for institutional transactions commission rates fel! by between twenty and thirty six per cent. In arriving at an estimate of the costs of barriers, we have utilised scenarios where priees for the financial services sector are assumed to decline by between one and twenty six per cent in different countries. Again we stress that these assumed "priee" reductions do not represent absolute reductions in consumer priees as in the banking sector they are based on priees or costs in excess of money market rates. The implied reduction in real consumer priees in these cases would be significantly less than the assumed priee reductions used in this study. In view of the difficulties inherent in estimating likely priee movements we have also considered in the main report the sensitivity of our findings to alternative priee assumptions.
It is possible to construct a wide range of possible priee scenarios which could emerge in an integrated market. For example one could assume that priees would fall to the leve! of the lowest existing priee observation. Indeed there would be sorne grounds for assuming that the expanded market opportunities presented by an integrated European financial services market would enable priees to fall below existing lowest priees, as economies of scale are exploited. In this study we have taken a more conservative estimate of the potential gains which could be secured.
Our priee scenarios are based on assuming a range of priee reductions. In order to highlight the reasoning behind our future priee scenarios it is useful to consider the existing priee differentiais. The points raised regarding relative priees in Section 5 of the report should be noted in interpreting the analysis in this section. In the main report we also analyse sorne of the other factors referred to in 6.6 above.
The priee comparisons are based on assuming for each category of financial services (e.g. banking, insurance and securities) a weighting for each of the financial services priees presented within the category, based on estimates of the relative economie importance of the particular service. Details of the weighting system used are presented in the main report.
In table 6.1 comparative "priees" for financial services in the eight countries are presented. In particular we present calculations of differences in priees compared with the average of the four lowest priee observations together with figures for the implied potential priee falls and assumed potential priee falls. The costs of current accounts are excluded in recognition of the widespread belief that these are very significantly affected by cross subsidisation. The cost of credit cards and letters of credit used represent the particular examples referred to and defined in Section S.
;

- 285 -
6.12
6.13
- 21 -
The comparative costs of insurance products and stock exchange transactions are also presented in the table overleaf. These include beth consumer, company and institutional transactions. The particular examples used in the calculations were described and defined in Section 5.
We believe the assumption that priees would fall to the average of the four lowest observations as measured by the implied weighted priee reductions would still tend to overestimate the economie gains from integration. There are a number of reasons for this including the fact that the value added figures used in our economie mode! include value added incurred in producing financial services which are sold outside of the Community and also services at present subject to intense international competition.
6.14 In addition, differences in priees undoubtedly reflect in part differences in underlying risks which are unlikely to be. affected by European integration.
6.15 In view of these factors and the recognised difficulties in obtaining comparative priee figures we have therefore scaled down these implied priee reductions to arrive at the assumed reductions which have been used in our estimates of economie welfare gains. In particular we have used a range of assumptions of between 40-60 per cent of the implied priee reductions. We have also in our estimates of the economie gains from integration constructed a range of assumed potential priee falls of five percentage points above and below our estimates. As indicated earlier these are based on our analysis of existing priee levels and are also guided by our analysis of margins, cost structures and the extent of specifie regulations. A more detailed analysis of the reasoning behind these priee assumptions is included in our main report.
Resulta of Impact of European Intesration
6.16 Using the assumptions regarding future priee changes it is possible to estimate the impact of European integration. In the table on page 24, estimates of the economie impact of European integration of financial services as measured by the change in consumer surplus are presented for each of the countries examined. The estimates indicate that the gain in consumer surplus would be in the range 11-33bn ECUs. The lower estimate is based on a lower assumed priee reduction while the higher estimate is based on a scenario of greater priee reductions.

~
C011111ercial Loans
Cost of Consumer Credit ( 4) Cost of Credit Cards Cost of Mortgages ( 5) Cost of Letters of Credit Cost of Foreign Exchange Drafts Cost of Trave11ers Cheques
Implied Potentia1 Priee Fall (2) Assumed Potentia1 Priee FaU (3)
IDiunDce
Cost of Contents and House Insurance Cost of Motor Insurance Cost of Fire and Theft Cost of Public Liability Cost of Tera Insurance
Implied Potential Priee Fall Assumed Potential Priee FaU
!AlLI 6.1: DIIIVA'mll Of PIOPOSID lAUS D riiAICJAL PIIDJCr PIICa AS A IIISDLI Of aJIPLitliG a IIDIIAL IIAID!
Belpu. Ital y
-4.6 6.0 19.2 -7.3 8.6 -41.0 135.9 38.5 105.1 121.0 79.0 60.0 25.7 -29.5 88.6 31.3 57.3 118.8 78.5 -4.3 21.8 -10.0 58.9 -7.2 9.1 6.2 30.9 196.3 55.6 23.5
35.2 -7.4 29.6 38.9 22.2
16.0 33.0 34.0 25.0 18.0 8.0 13.0 20.0 13.0 9.0
-15.9 2.7 -3.7 39.0 80.4 30.0 14.7 99.5 8.7 147.9 -8.7 42.5 24.4 152.8 245.0 13.4 47.3 59.9 117.0 76.8 77.6 5.1 37.4 33.2 83.2
31.0 10.0 32.0 24.0 51.0 16.0 5.0 19.0 12.0 26.0
letharlauda
6.0 43.0 -26.9 30.8 -12.4 42.9 36.5 -6.3 27.1 16.5 33.3 -45.7 -7.41 33.3
16.0 10.0 8.0 5.0
56.9 16.9 76.6 -6.8
-15.2 -0.5 9.5 -16.3
65.9 -8.9
37.0 1.0 19.0 0.5
45.7 121.5 16.2
-20.7 8.1
16.1 -7.4
18.0 9.0
89.7 -16.8 26.6 -6.5
-29.9
4.0 2.0
N 00 o-
IV IV

Securltiu
Cost of Private Kquities
Cost of Private Gilts
Cost of Institutional Kquities
Cost of Institutional Gilts (6)
Implied Potential Priee Fa11
Assumed Potential Priee Fall
Implied Potential Priee Fall
Assumed Potential Priee Reduction
Assumed Range of Priee Reductions (7)
Belgium
35.9
14.4
26.4
284.1
53.0
26.0
23.0
11.0
6 - 16
tAIU 6.1 WltDUID
Germany Spain France
6.8 65.0 -12.6
90.1 216.9 21.5
68.5 152.7 -5.4
-4.0 60.0 57.4
11.0 44.0 23.0
6.0 26.0 12.0
PIICI lALI.S lOI 'IO!AL liiAICIAL :unD::IIS SIIC10I
25.0
10.0
5 - 15
34.0 21.0
16 - 26
24.0
12.0
7 - 17
Caution 111.1st be exercised in interpreting the above data. See footnote to Table 5.1.
Ital y
-2.9
-63.0
47.4
92.0
33.0
17.0
29.0
14.0
9 - 19
Luxembourg
6.8
26.8
68.5
-36.0
9.0
5.0
17.0
8.0
3 - 13
Netherlands
113.6
160.6
26.3 -17.4
...
18.0
9.0
9.0
4.0
1 - 9
United Kingdom
123.3
35.6
-47.4
-47.4
12.0
6.0
13.0
7.0
2 - 12
(1) While the data is referred to as 11priees11 it should be noted that the data in the banking sector refers to the cost over money market rates and therefore do not represent the
cost to consuaaers. Data is also exclusive of const~Er taxes. (2) Implied priee faU is calculated as weighted average of priee cœparisons cœpared with average of the four lowest observations. The weighting system used was designed to attempt
to reflect the importance of the different services in value added. Details are presented in the main report. Also of significance is the fact that where priees are below the
average of the four lowest it is assUIIed that no increase in priees would result frœ integration.
(3) Assumed priee fall is calculated as a percentage of implied priee faU (see main report for details)
(4) Cost of Consumer Credit in Italy assumed to be equal to the average of Germany, France and the UK.
(5) Cost of mortgages in Luxembourg assumed to be equal to the average in the other countries.
(6) Cost of institutional gilts in the UK assUIIed to have the same priee difference as institutional equities.
(7) Asswaed range is derived as five percentage points above and below the assumed priee reduction.
N 00 ......
"-1 w

- 288 - - 24 -
6.17 In the event of the consumer surplus gains being used as a measure of economie welfare gains we believe it would be prudent to use the mid-point in the range as the upper estimate of economie welfare gains. The results represent a snapshot of the position before and after integration. The figures also assume a competitive market structure after integration and indicate the net gains in consumer surplus country-by-country but do not make any assumptions about the redistributive effects between producers in different countries. Thus the results indicate the benefits to the consumers in each country and the overall gain in consumer surplus to the Community, after all of the benefits of integration have been achieved.
Table 6.2
Estimated Gain in Consumer Surplus Resulting from Integration of European Credit and Insurance Markets
B D ES F I LU N UK
ECUsM
Range
366 - 1,081 2,264 - 7,074 2,376 - 4,040 2,105 - 5,330 2,516 - 5,542
16 - 73 86 796
1,415 - 8,837 11' 144 - 32,710
Mid Point* Estima te
685 4,619 3,189 3,683 3,996
44 347
5,051 21,614
* Mid point refers to mid point in assumptions regarding priee range and not the mid point in estimated gain in consumer surplus.
6.18 The extent to which the above estimates represent a gain in economie welfare depends on the assumptions made regarding the extent to which the priee reductions used result in a loss in producer surplus. The particular framework which we have adopted would indicate that it would be necessary to subtract from this gain in consumer surplus sorne estimates of the likely decline in producer surplus. In so doing we recognise that it could be argued that this results in an underestimation of the gains from European economie integration but consider that a conservative approach is more likely to represent the real situation as barriers are removed. In an appendix to our main report we present a methodology for estimating economie welfare gains.
Macroeconomie Implications
6.19 In addition to estimating the microeconomie impact of integration of the European financial services sector it is also necessary to consider the macroeconomie welfare gains from integration of European Capital markets. In particular it is important to consider the gains from risk pooling, and equalisation of interest rates. These issues are summarised in subsequent paragraphs.

- 289 -- 25 -
Conclusions Regarding Rist Pooling by Capital Markets
6.20 Our analysis of risk pooling indicates that the European capital markets are not integrated in the sense that rates of return do not fully reflect all diversification possibilities. Furthermore, investors who are restricted to domestic assets can not achieve as good a trade-off between risk and return as if there were freedom to choose from foreign assets.
6.21 In terms of the importance of greater portfolio diversification possibilities, sorne estimates can be obtained by computing the expected rate of return on an internationally diversified portfolio with the same risk as the actual risk of the market portfolio in the particular country. The difference between this and the actual market return represents the annual gain in rate of return which could result from integration. For example, using data from previous research (Levy & Sarnat) an appropriately levered international portfolio could generate mean returns almost three-quarters as high as the mean return on the EEC-6 market portfolio, for the same risk. In fact research indicates a mean levered return, for the same risk, over 11% per annum higher. More recent US research, referring to the US rather than EEC-6, also suggests very substantial gains from international diversification.
Equalisation of Rist P'ree Rates
6.22 At present the existence of exchange controls prevent the free flow of capital from moving to the countries with the highest rates of return. Even if there were no differences between the efficiency of the financial services industries in the various Member States, the removal of exchange controls could be expected to have beneficia! effects through the convergence of real interest rates.
6.23 Given information on the marginal efficiency of capital and the real interest rates prevailing in the different countries, it is possible to quantify the gains from a move to common interest rates. A caveat should be recognised in respect of the assumption that the removal of exchange controls would necessarily equalise the real rates of interest across Europe. Until there is a much tighter exchange rate mechanism in the EMS, and one covering all of the countries, convergence of real interest rates will remain imperfect. In order to consider the potential benefits it is nevertheless useful to consider the economie impact of an equalisation of interest rates, resulting from the integration of European capital markets.
6.24 The size of the welfare gains to be achieved from equalisation of real interest rates depends both on the size of the differences and on the responsiveness of the demand for capital to interest rate changes in different countries.
1. Levy, Sarnat "International Diversification of Investment Portfolios" American Economie Review 1970.

- 290 - - 26 -
6.25 The table below shows estimates, for real interest rates, of the responsiveness of the demand for capital ta a one percentage point decline in the real cast of capital and deviations from the equilibrium real interest rate. The equilibrium rates are derived on the basis of an assumption that interest rates would tend over time ta equalise. This analysis is based largely on O.E.C.D. (1) research and is described in detail in the main report. It is important ta stress that real interest rate
~~ .• !·•·~reductions will also affect consumer's income and welfare.
Table 6.3
Welfare Gains from the Equalisation of Real Interest Rates
Real Interest Rates Changes Deviations From Deviations Rates 1986 in Demand EquilibrillDI From Long
Short Long for Short Term ~erm Term Term Capital Interest Interest
* ECU BN Rate Rate
Percentage Points
1 2 3 4 5
B 9.4 6.9 16 1.3 0.8 D 7.6 6.4 135 -0.4 0.3 ES 5.7 3.6 33 -2.3 -2.5 F 8.6 6.3 80 0.6 0.2 I 8.8 6.2 104 0.7 0.8 L 9.4 6.9 0.6 1.3 0.8 NL 8.2 7.4 28 0.2 1.3 UK 7.9 5.9 96 -0.1 -0.2
* As a result of a 1 percentage point decline in interest rates.
Sources: Real Interest Rates - Central Banks
6.26 The potential welfare gains from equalisation of interest rates can be calculated using the deviations of real interest rates from equilibrium (columns 4 + 5 above), the estimates of the change in the demand for capital shawn (column 3) and using the formula outlined in our main report for the approximation of the loss of non-integration. In view of the primary focus of this study on the microeconomie gains and the nature of the methodology described above we have not presented the results of the macroeconomie gains of interest rate equalisation in this report. The results using this methodology, however, indicate a rouch smaller welfare gain compared with our estimates of microeconomie benefits.
(1) See "Internationalisation of Financial Markets: Some Implications for Macroeconomie Policy and for the Allocation of Capital". Furao, M. Hanozaki, M; OECD Working Paper, November 1986.

- 291 -- 27 -
Conclusion
6.27 Our research indicates that there are significant potential gains to be secured in terms of increases in consumer surplus and economie welfare, resulting from integration of the European financial services markets.
As we have indicated though, extreme caution must be exercised in interpreting any quantification of the potential gains as the results will of necessity be speculative. Viewed in this context our estimates indicate that the gain in consumer surplus would be of the order of 11-33bn ECUs. If the consumer surplus calculations are used as a measure of the net economie welfare gains we believe it would be prudent to use the mid-point in the priee range namely, 22bn, as the upper estimate of the potential welfare gains. These gains represent the potential microeconomie benefits of integration of the main European Community financial services markets.
6.28 In addition to the above gains, it is also likely there will be macroeconomie welfare gains from integration of the European capital markets. The gains from risk pooling by capital markets could generate mean returns almost three-quarters as high as the return on existing market portfolios. Also of importance is the potential gains from equalisation of interest rates.
6.29 The gains from integration will result from the dynamic effect of economie integration and not simply as a result of removing the costs of meeting sorne of the existing regulations. In all countries consumers will benefit from European integration but sorne producers will come under pressure to survive in the single market. It is important to stress however that these benefits would only occur in a competitive market.
6.30 In this study the importance of financial services in terms of output and employment was indicated. The critical macroeconomie importance of capital markets was also highlighted. From an economie standpoint, in view of the potential benefits of European integration of both financial and capital markets it is important that steps are taken to rapidly complete the interna! market in financial services within the framework of free competition between and within member states.


- 293 -
9.
The Benefits of Completing the Internal Market for Telecommunication Services in the Community
INSEAD


Institut Européen d'Administration des Affaires European lnstitute of Business Administration Europaisches Institut für Unternehmensführung IMmut Pm~ d'EnK,...monl Supôneur
Boulevard de Constance 77305 Fontainebleau Cedex. France Telephone (6) 422 48 27 Telex 690389F
The Benefits of Completing the Internai Market for
Telecommunication ServiceSin the Community
Executive Summary
Submitted to the European Commission
Det. 1987


- 297 -
Executive Sumrnary
The Benefits of Completing the Interna! Market for
Telecommunication Servises in the Community
1. Industry Background
1.1 Goals of European Integration in Telecommunication
Services
One of the objectives of the European Comrnunity in completing
the internal market by 1992 is to elirninate all current
barriers to trade. This does not only apply to goods, but
also to services (including telecommunication services), an
issue specifically addressed in the EEC's Green Paper on the
development of the Common Market for telecommunication
services and equipment (COM (87) 290 Final). The purpose of
the Green Paper is to initiate a wide-ranging discussion on
those issues and to help in the establishment of a coherent
Cornmunity-wide framework in the ongoing changes to the
present system of telecommunications regulations.
1.2 The Product
Telephone services are based on telephone networks, which
link various parties through fixed (or mobile) networks
electronically with each other, so that interactive exchange
of information (voice, message, data, image) is possible.
They are generally provided by national telecommunication
administrations, who exercise the monopoly for providing
these services. Table 1.1 gives an overview of the size of
these services in different Community countries. Most of this
revenue is from voice (85 - 95 percent). The rest is
accounted for by telex and data services, 1 as well as TV
1 Telex revenue ranges from 5 to 6 percent of revenue in Belgium, Italy, the Netherlands and Portugal, to 3 to 4 percent for Germany and the U.K. Revenues from Data services are probably equivalent to this sum. See ITU Yearbook 1987.

- 298 -
-2-
programme transmission. With the introduction of ISDN, data
and image transmission should increase significantly.
Important applications can also be expected with respect to
value added network services (VANS), such as message storage,
processing and distribution; code and protocol conversion
between different data processing systems; information
retrieval services, for example from videotex data bases;
information processing services, for example through
electronic data interchange; safety and alarm services etc.
Table 1.1: Income from Telecoms Service Provision
Country
Belgium Denmark France German y Greece Italy
(1985)
Ire land Luxemburg Netherla~?s Portugal Spain United Kingdom2 )
Total
Operating Income
in mill. ECU
1,405.45 1,075.90
13,428.15 15,123.62
720.58 8,351.00
623.54 82.07
2,538.72 678.90
3,154.35 14,244.99
61,714.31 =========================================================== 1) CCT and CLT 2) BT only
Source: Telefonica/ITU Exchange rates as of 1985
1.3 Trade in Telecommunication Services
The international telecommunications network infrastructure
has traditionally been produced jointly by the national Tele
communications Administrations so that trade in telecommu
nication services does not really take place. For connecting
- 299 -
-3-
international traffic, neigboring carriers will forward
(transit) traffic onward to its final destination and vice
versa and are therefore reimbursed accordingly. For traffic
that may transit a number of countries or go via alternative
routes, sorne elements of competition are introduced since the
possibility to play off one transit country against another
can lead to rate reductions. The access to competing
satellite networks creates a similar incentive.
Trade does, of course,take place on services transmitted via
the telephone network or produced in direct conjunction with
it, as in the case of VAN!services. The attractiveness of
telephone tariffs may, for example determine where the "host
computers" for data banks are located. With the increasing
internationalization of the economies, the growing importance
of tourism and international financial services, demand for
international telecommunication services is increasing so
that the telecommunication administrations see this as an
important source of revenue. Increasingly, domestic carriers
will set up international companies in another carrier's
territory, not only to assist its customers, but also to
explore the potential for economie activites in that 2 country.
1.4 Barriers to Integration
In the 1985 White Paper by the Commission (COM (85) 310) the
costs of physical and technical frontiers are identified as
basic obstacles to completing the internal market by 1992.
The main advantage of reducing these frontier costs would be
a greater integration of markets, in other words making them
more competitive, while at the same time allowing increasing
specialization and utilization of economies of scale. In
telecommunication services provision economies of scale are
2 Cable and Wireless, the parent company of the British carrier Mercury has bought a network in the U.S.; Ameritech, one of the seven large American regional carriers has bought the VAN carrier AirCall in the U.K. etc.
- 300 -
-4-
already realized at a national level since,except for the
U.K., we have only one operator and one physical network (for
the moment ignoring the sizeable networks of public utilities
and the military). 3 Increased integration could therefore
bring about only limited scale effects, unless one envisaged
rather unrealistically the merger of a number of national and
geographie telephone networks. But a harmonization of the
different regulatory procedures may be possible and has
important economie effects, as European governrnents are
attempting to adjust their national regulatory structure to
the effects of the''telematics revolution."
Each of these regulatory parameters affects a number of markets
either on the input side (affecting the national base of telecoms
equipment manufacturers) or on the output side (affecting the
performance of individual sectors or the services available
to indivjdual customers). If the market for inputs is
harmonized in such a way that a uniform European-wide market
with competitive procurement practices results, sizeable
savings as a consequence of product and production
rationalization are possible 4 . The same applies to the market
for customer premises equipment, where barriers to entry and
restrictive certification practices sofar inhibit the full
Community-wide market integration and the benefits that can
be derived fro~ such a policy.
On the output side, performance can also be increased through
more cost effective service provision, fewer restrictions on q
network utilization and the availability of additional,
Community-wide standardized services. These effects may be
due to (a) lower cost per given output and (b) better network
utilization through more rational pricing. Concerning the
first effect, our study shows that differences in operating
practice may significantly affect productivity and the cost
3 There are several network operators in Italy, Denmark and Portugal, but their responsibilities are strictly delineated according to geographie or functional lines.
4 See the INSEAD report on the benefits of completing the internai market for telecommunications equipment in the Community.

- 301 -
-5-
at ~rhich services are provided. Sorne administrations have had
to pursue a restrictive investrnent policy so that there
exists excess dernand: manning levels had to be kept high in
spite of large productivity advances in network services,
because rationalization and the associated shedding of laber
was politically not feasible.
Concerning the second effect, we found that most
administrations have also kept long distance tariffs
artificially high in order to cross-subsidize ether services,
and postal and parcel services. Such decisions not only raise
tariff levels, but also influence tariff structures (i.e. the
ratio of connection to call charges, the cost relation
between local and long-distance calls, between switched and
fixed network services, etc), thereby further distorting
input decisions for telecom users. As a consequence, re
strictions must be placed on the utilization of the network
(especially for the use of leased lines), so that service
provision on the basis of the available network infrastruc
ture, for exarnple value added services, may be harnpered.
Both effects raise production costs, thereby rnaking "the
nervous system" of modern economie societies more costly and
less effective. Furtherrnore, by rnaking especially long
distance communication unnecessarily expensive, the incentive
to broaden the arena of competition and to integrate
neighbouring areas into one market is harnpered, reducing the
potential effects of integration.
1.5 Recornrnendations of the Green Paper
The recommendations of the Commission are set out in points
A-J of the Green Paper along with a set of lines of action
and an acceleration of existing action lines such as the
Cornrnunity prograrns RACE and ESPRIT. The airns of the Green
Paper to bring about a more coherent frarnework in the
ongoing regulatory change, to encourage the developrnent of
new services in a more competitive frarnework and to establish
(and utilize politically, for exarnple in international trade

- 302 -
-6-
negotiations) a wider European Market for telecommunication
services. The acceleration of existing action lines is
intended to speed up and to support this process.
2. Scenarios to Analyze the Likely Effects of a Unified
European Telecommunications Service Market
2.1 A Status Quo Scenario
In order to have a reference point against which to analyze
the effects of the completion of the internal market, a
status quo scenario as an "antimonde" is necessary. The basis
of this is to assume that the recommendations of the Green
Paper had not been made, but other developments would still
take place.
In our study we have noted the high degree of service inte
gration already achieved between the national telecommunica
tion operators, for example through the Conference of Euro
pean Post and Telecommunication Administrations (CEPT) and
its Coordination Committee on Harmonization (CCH), and the
activities of the ITU and its International Telephone and
Telegraph Consultive Committee (CCITT). Standards for new
services and interconnection continue to be harmonized as,
for example, in the case of videotex, teletex and facsimile
services. Joint interfaces developed in that context allow
the creation of private telecommunication services on the
basis of public networks (via leased lines). On the inter
national side, especially over longer distances, sorne com
petitive effects are already being felt so that the high
priee cost margins on international calls are likely to be
reduced further. On the input side production continues to be
rationalized due to the current industrial restructuring. The
trend of regulatory reform in the individual countries will
also continue though in a much less harmonized manner than
that evisaged by an acceptance of the recommendations of the
EEC's Green Paper.
- 303 -
2.2
-7-
A Scenario in Accordance with
the Community's Green Paper
the Recommendations of
When comparing the status quo scenario with the recommen
dations of the Green Paper we notice that the EEC goes
further in its recommendations concerning:
the provision of competitive "non-reserved" services by
private firms (Proposition C),
open network provision on the basis of non
discriminatory terms (Proposition E), and
a more liberalized market for CPE (including receive
only satellite earth stations (ROES) in combination with
more Co~~unity-wide standard setting) (Proposition F).
Important are also the insistence on stronger anti-trust
rules (Propositions H and I) and the recommended separation
of regulation from operation (Proposition G) which should
give important support to those competitive activities that
are permitted to take place in competition with the public
telecommunication operator (PTO).
2.3 A Scenario of Full Service Competition
A scenario of network competition in long-distance services
seems highly unlikely in the Community. However, it must be
noted that this is already possible in the very large U.K.
market moving in this direction. This together with increased
international competition might be enough to suggest a third
scenario of full network competition. Even if politically
unrealistic, it also represents a useful reference point
against which to compare the scenario based on the current
Green Paper.

- 304 -
-8-
3. Estimating the Costs of Non-Europe
3.1 Identifying the Effects of the different Policies
We are mainly concerned about the economie effects of
alternative scenarios, and therefore attempt first to analyze
those effects which directly reduce telecommunication costs,
to be followed by an investigation of the effects on changes
in service offerings and their indirect effects on the
economy as a consequence of more rational and less
restrictive tariff policies.
There are several (direct) cost reducing effects that might
be iàentified as a result of completing the internal market.
The first effect refers to the benefits of joint, open pro
curement. They have been identified in two separate exper
tises for the Commission. 5 Depending on the divergence of
current domestic market priees from competitive market
priees, tariff levels could be reduced between 2 to 8 percent
as a result of more competitive purchasing.
The second direct effect is related to differences in opera
tional efficiency. We have attempted to estimate these ef
fects by comparing productivity between different telecommu
nication administrations and with an analysis of total factor
productivity for different administrations over time.
The third direct effect relates to the consequences of a more
rational tariff policy, when the recommendations of the Green
Paper to move tariffs closer to cost take place. These
effects will be larger with the introduction of network
competition, as the current political opposition to tariff
rebalancing is overtaken by more direct economie pressure.
The fourth direct effect relates to CPE equipment, as a
consequence of a more liberal certification policy in a
larger market. The ether effects are more indirect in nature, but
5 See the studies by WS/ATKINS and INSEAD.

- 305 -
-9-
may be equally important, since they concern the range of
service offerings. This is not only the case with respect to
CPE, where a large product variety is expected, but
especially with respect to VANS and services offered in
competition to "reserved" monopoly services. Both aspects are
directly related to a refinement of the regulatory structure,
i.e. a "narrowing" of the remaining monopoly area and a more
effective interfaces between the regulated "reserved" and the
"non-reserved" competitive area.
3.2 Productivity Comparisons
The ain of a productivity comparison is to see whether
one telecommunication ad~inistration, say the Spanish one,
could produce the same output in the U.K. as BT actually does
but using fewer resources. Such a comparison relates
bundles of national outputs to their corresponding national
input indices or alternatively compares pairs of output with
input ratios. Scale effects must also be considered. If they
are important, an administration with a small territory may
be more efficient, but operate at a lower scale level.
Differences in X-inefficiency also play a role. 6
The effects of externally imposed constraints, for example
concerning procurement or employment rules, must also be
taken into account. They may prevent an organization from
achieving the same degree of operational efficiency as an ., organization which does not operate under such constraints.
Productivity comparisons are difficult to carry out because
inputs, outputs and production structures differ across ad~inistrations even for such a homogeneous product as
telecommunication services. Simple (partial) measures of
productivity such as mainlines or revenue per employee (Tab.
3.1) are onlv a first step, since they ignore differences in
the degree of vertical integration. A PTO may install and
6 X-inefficiency refers to those unexploited efficiency gains which an organization could make by moving to its production possibility frontier.

- 306 -
-10-
maintain telephones with its own staff or subcontract this
service to private companies; it may or may not operate
CATV networks; it may produce value added services together
with its othe~ activities or have a separate subsidiary for
this purpose (Fig. 3.1).
To account for these differences, the most important input
and output variables must be combined into a total factor
productivity index based on weighted input and output
variables. 7 They allow a series of binary comparisons between
countries.
Table 3.1: Main line per Full-time Telecommunication Staff
1984
Country Main Lines Staff Main Lines Staff
Be1gium 2951.327 28.394 103
German y 14602.734 207.693 118
Denmark 2465.993 17.395 141
United King dom 20192.894 241.817 85
France 22086.000 167.130 132
Netherlands 5800.000 27.760 208
Italy 16520.763 108.782 151
Norway 1618.200 17.302 93
Spain 8881.727 71.199 124
Source: ITU
7 The comparisons are based on weighted standardized input and output variables. Outputs are standardized in terms of local and long distance calls which means that all ether outputs have to be converted to this measure; inputs are standardized for an average worker, material and capital input are related as far as possible to a physical measure (either relative priees or costs are used as weights.)

- 307 -
-11-
F1gure 3.1: aange of tlort DDdert.ùen by P!'Os
xx a only by adrr.inistrat1on: X K partly by adm1nistration;
Installat.1on Ma1ntenance Exchange External Plant Country Manu:ac-:u~e
Busi- 'es1- Bus!- ResJ- tola.;.n- Cons truc- Ma1n- Cons truc-ness denee ness de ne~ tenance ti on te nance è.lor,
Belgiwr x x x x xx x
Denmark x x • x xx x xx x
France x xx x x xx xx x x
F~ Cermany x x x x xx x xx x
Ital y (SJP) xx xx xx xx xx
Netherlands x x JI x x JI
Norway x xx JI xx xx JI xx
Spain xx xx xx xx xx x x x
UIC (British Telecom) x x x x xx x xx x
Source: BT and Telefonica
Table 3.2 shows the results of this more complex exercise. As
a standard of comparison we have used British Telecom, set
ting its productivity level at 100. Norway was also included
because of data considerations. This more comprehensive
analysis changes the previous ranking obtained with a partial
productivity measure in Table 3.1 dramatically. At the same
time, even when accounting for most inputs and outputs,
significant productivity differences remain. They show that Norway and
appear
to be less
Denmark, which have rouch smaller networks than BT
more productive8 . Telefonica and SIP now seem
efficient than BT and the Bundespost.
The results vary with the output measure used. The
Bundespost performs better if short-ha~l calls are used as
output weights but worse when using long distance calls. The
ambiguity arises because the pricing structure of output
8 Denrnark actually has four different telephone companies.
x
x
P.&D
x
x
x
xx
x
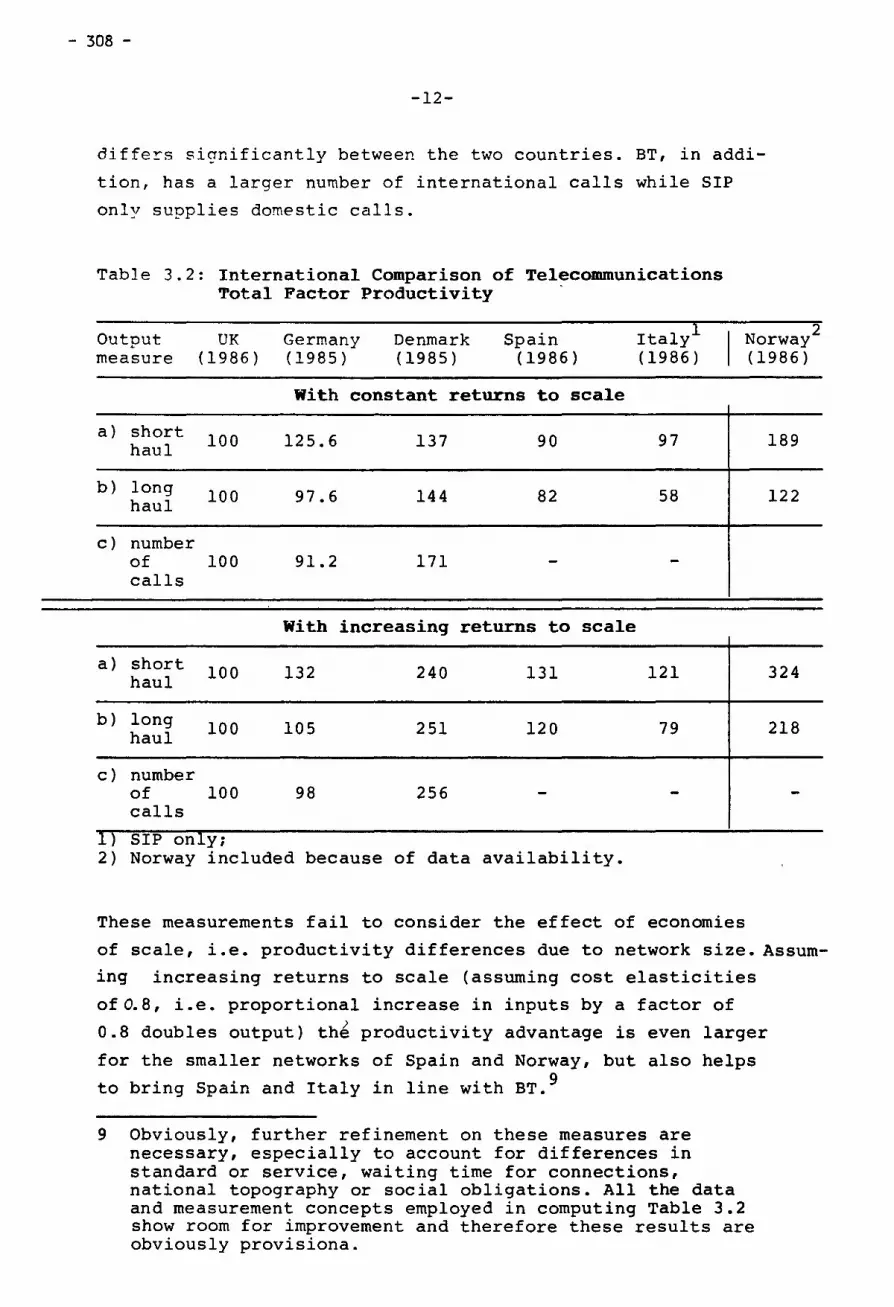
- 308 -
-12-
diffe~s significantly between the two countries. BT, in addi
tion, has a larger number of international calls while SIP
only supplies domestic calls.
Table 3.2: International Comparison of Telecommunications Total Factor Productivity
Output UK German y Denmark Spain Ital y Norway measure (1986) (1985) (1985) (1986) (1986) (1986)
With constant returns to sc ale
a) short lOO 125.6 137 90 97 189 haul
b) long 100 97.6 144 82 58 122 haul
c) number of 100 91.2 171 calls
With increasing returns to sc ale
a) short 100 132 240 131 121 324 haul
b) long 100 105 251 120 79 218 haul
c) number of 100 98 256 calls
1) SIP only; 2) Norway included because of data availability.
These measurements fail to consider the effect of economies
2
of scale, i.e. productivity differences due to network size. Assum
ing increasing returns to scale (assuming cost elasticities
of0.8, i.e. proportional increase in inputs by a factor of
0.8 doubles output) thé productivity advantage is even larger
for the smaller networks of Spain and Norway, but also helps
to bring Spain and Italy in line with BT. 9
9 Obviously, further refinement on these measures are necessary, especially to account for differences in standard or service, waiting time for connections, national topography or social obligations. All the data and measurement concepts employed in computing Table 3.2 show room for improvement and therefore these results are obviously provisiona.

- 309 -
-13-
These calculations so far suggest significant productivity
differences between the PTOs, perhaps as a consequence of
differences in production technology and the degree of x
inefficiency, as well as the result of important outside
constraints on the PTOs that prevent a movement to the least
cost frontier.
The next question was whether ~roductivity differences exhibit
the same pattern over time.We measured total factor
productivity growth for those countries, where data w~re
available (U.K., West Germany) and collected and interpreted
available studies for other countries (U.S.A., Canada,
France, Italy). The results(Table 3.~ show not only large
differences in (average) productivity growth, but also very
sharp yenr-to-year fluctuations. The cause of these
variations is due to different rates of movement of input and
Table 3.3: Rates of Growth of TFP for Selected Countries
------- ---- ----·. --Jt u llt 21 All
19tS 19ob 19o7 196~ 1969 1971 1971 nn 1973 1974 1975 l97t 1977 197~ 1979 198f 19Sl 198~ 19E3 19&• 1985
5.3 7.1 7.8 2.2 1.7 3.~ 4.8
9.7 8.4
6 3.9
9 13 19 21 9
4.6 12.6
llotes: 11 Ttrrt5trl&l tarr1tr5
Alberti &overnaent Tel. ltll tanadi 8r1t1sh tolu1b11 Ttl.
21 lor:·terrestral Carntrs ltleolobE Ttlt5.it
7.9 2.5
1 3.8 5.2 6.5 4.1
4.4
6.7 6.3
6 4.8
··~ 8 4.2 •
6.3
-----------Il &rraany
-----------------Il tBr TFP1 31 TFP2 41 -----------------4.7
2.~ 2.5 1.3 1.5 4.8
-1.1 1.1 1.4 1.4 1.5 ·1.6
·2.1 1.7 ·1.5 2.7 2.4 5.9 5.3 7.7 6.4 11.4 1.2 S.l
·5.4 1. 9 1.5 1.1 1.5 2.1
·1.4
1.7 2.6
3J Usu1! lletho~ 41 "ftho~ I>E1 51 ~1!! 1 ~V5t!l SourCE:
1.1 1.1 1.5 2.9 3.6 6.7 8.4
11.8 5.9 2.8 2.2 1.7 1.2 2.6 1.2
3.4
------USA -------AllT 51
-----2.9 4.3 3.3 4.4 3.8 1.6 1.1 4.1 4.3 3.7 2.8 4.4 3.6 4.8 4.2
3.5
tanidi: Denn\ tt il.t19B!. Frant:e: Jlir.lflc et al. U9BS:
USA: a.nrutunser. tt. il. 11.9851

- 310 -
-14-
output indices within and among the countries. The inter
esting point is that the German growth in total factor
productivity (TFP) almost parallels the evolution in the U.K.
from 1974 up to 1980. France seems to differ significantly
from the other countries, with substantially higher pro
ductivity growth, at least since 1980. 10
What do these measurements tell us about international
productivity differences? They suggest that at least compared
to the U.K., the U.S. and Canadian environment seems to have
supported a higher productivity growth rate. But network size
and speed of expansion also play arole. To analyze these two
factors we note that productivity growth can be divided into
two components:
shifts of the production function as a consequence of
superior production techniques (technical or organiza
tional change), and
better use of inputs with increasing scale, which has a
more than proportionate effect upon output growth (econ
omies of scale) (see Fig. 3.2).
Thus, if Q. is the rate of growth of telecom output, A. the
rate of technical progress, X. the rate of growth of inputs
and E the scale elasticity, the following relationship holds
Q. =A. +EX .. Keeping this relationship in mind, we have
analyzeà the relation between total growth rates of the
telecommunication network in the different countries and
productivity growth (Table 3.4). Productivity growth in the
German network seems to have been faster than in the British
system (2.6 percent p.a. compared to 1.65 to 2.1 percent,
depending on whether the last observation is included). But
the German output also grew faster than the British over much of
10 But the French method of computing total factor productivity growth included an extra contribution to net operating capital. Once this measure was included in the analysis for West Germany, the average growth rate in TFP between 1971 and 1985 rises from 2.6 percent to 3.6 percent and is then in line with the French growth rate during the same period.

- 311 -
-15-
the same period (13o19 percent poao for 1970'to 1985 compared
to 8o74 percent poao for 1964 to 1980), suggesting that the
Bundespost also benefitted more from scale effectso
Table 3o4: International Telecom 'l'FP Growth Comparisons
Input Telecom TFP %growth %output growth
poao growth poao (x 0 ) ( Q 0) (Qo-Xo)
United 6o64 8o75 2oll Kingdom (lo65) (1964-80)
German y 10.59 l3ol9 2o6 (1970-85)
Canada 5o3 8o74 3o44 (1973-81)
Figure 3o2: Changes in Telecom Costs as a Function of Scale
and Te::hnical Change
C' (}
...... v ""' "6 0 ...
0..
1
1
1 Cos
0 ...... Cos~.s . .. ~ooo
-v· 0 .................... .. c
~l'! gg Q 2.000
Scole of Output

- 312 -
-16-
Table. 3.5: Relation between Scale and Technology Shift
Scale elasticity:
1.45
1.30
1.124
Production function
shift factor:
A,~ A.UK
-2.16 -.87
.58 .12
1.287 1.287
The shift in the production function implied by different
scale elasticities may be computed given historical values of
both Q. and X .. Table 3.5 shows that the scale elasticity at
which Gerrnany and British technical progress would have been
equal is 1.124, implying at the sarne time an identical yearly
"technology shift" of 1.287 percent. This shifts the
production function 50 percent faster than the historical
Canadian rate of .83 percent p.a •• It is unlikely that German
and British technical progress was so much higher than
Canadian. Instead, and keeping in mind the higher scale
elasticity estimates for the US and Canada seems to suggest
that the true scale elasticities are higher than 1.124, so
that it is necessary to reduce the estimated German and
British coefficient of technical progress. Because if Germany
and Britain had scale elasticities similar to those estimated
for the United States and Canada, i.e. 1.3 and 1.45, and also
had the historical Canadian rate of technical progress (.83
percent p.a.), productivity growth would have had to be
roughly 25-50 percent higher than it actually was. This too
suggests that the outside constraints put on the British and
German system may have been more significant than in the
situation of Bell Canada.
The importance of creating conditions under which the full
effects of technical progress can be implemented in a
telephone network should not be underestimated. This can be

- 313 -
-17-
illustrated by assuming a 1 percent higher productivity
growth rate between 1988 and 2000. W ith a 12.75 percent
higher productivity rate in 2000, 11.3 percent less inputs
would be needed to produce the same output, as illustrated in
Fig. 3.2, Taking the priee elasticity of telephone demand
also into account enhances this effect. Calculations in the
study show that with a priee elasticity of -.6 and a unit
cost elasticity of -.2 the ultimate effect on telecom output
(an increase f~m· o1988 to o2000 in Fig. 3.2) is 7.7 percent.
Higher scale and priee elasticities raise this number, lower
ones reduce it. Keeping the overall service revenue of 6lb
ECU of 1985 in rnind suggests that the resource savings due to
higher productivity rates are substantial, while the extra
traffic generating effects would also result in resource
savings (due to economies of network fill) and in extra
service output.
3.3 Influence of the Tariff Structure
The overall role of telecommunication tariffs is
to provide rneans for obtaining efficient use of existing
capacity, for example through peak-load pricing,
to give signals for new investment and
to yield revenue on past investment.
Greater network efficiency is not only achieved through lower
cost per given output, but also through better u tilization
as a consequence of a more rational pricing structure, since
current telecommunication tariffs diverge significantly from
costs. As a consequence the priee signals to the users of the
telecommunications network are distorted, causing the users
to rnake allocatively inefficient decisions. 11 For example, to
11 Over longer distances, he may make less use of telecommunication services than the true economie costs would suggest. This leads not only to an underutilization of the productive resource telecommunication, but also to a reduction of the potential geographie market size. These indirect effects - a lessening of the potential competition - may be an important side effect that has so far been overlooked in this discussion.

- 314 -
-18-
these allocative costs for the telephone user, and the
dynamic cost of insufficient market expansion, one has to add
the dynamic costs to potential service producers whose entry
is prohibited, because of the danger of cream-skimming
through arbitrage. 12 While arbitrage may hurt an
administration financially, its prohibition also prevents the
innovative offerings of certain services, or the spreading of
others, because "shared use and resale" of such services,
which could lead to arbitrage, is not permitted. Those
enterprises that have developed certain telecom applications
in-house or between their subsidiaries (or cooperating
partners, for example in the case of airlines, banks, etc.)
are allowed to sell these services to third parties only
under certain restrictions and sometimes not at all. That
implies not only a significant barrier to entry for VAN
services based on the telephone network, but also
discriminates against smaller users that cannot develop or
utilize these services in-house because of their small scale.
Only a rebalancing or "harmonization" of tariffs can reduce
the arbitrage incentive, so that the current restrictions
which are based on the use of leased lines (i.e. •no
connection to the switched network, no use for third
parties") can be removed. Tariffs may be harmonized on the
basis of cost (implying a •rebalancing", i.e. a lowering of
long-distance, and in sorne countries leased line, tariffs and
a raising of local calls to reduce the losses or in relation
to the tariffs of a major service - dialed voice. While this
second option brought about a volume-related tariff on leased linesl3
and also reduces the danger of arbitrage, it still
12 This refers to the incentive that any potential suppliers of telecoms services (either on the basis of leased lines or competitive physical networks) would want to enter mainly in the lucrative long distance market, thereby "skimming" the cream needed to subsidize the deficit services - rentals and local calls. The fact that the tariffs between the different long distance services (i.e. dialed services, leased lines, data services, br~ad band transmission rates) differ significantly may also lead to skimming because of the potential to arbitrage.
13 This is the option which the Bundespost has chosen.

- 315 -
-19-
leaves the allocative problem unresolved, because tariffs now
diverge significantly more from costs than with a rebalancing
on the basis of costs.
To identify the importance of tariff distortions and to
obtain a rough estimate of the current cost of this policy, 14 the economie measure is the consumer surplus foregone.
Table 3.6 shows the four important tariff components, i.e.
for connections, rentals, local and trunk calls in ECU for
switched voice services in all the EEC countries. We observe
indeed a wide variation in tariffs that seems inconsistent
with what is perhaps a more uniform cost structure across
countries that must surely be prevailing, even in the absence
of telecoms services being traded. Connection charges range
from a low of 31 and 36 ECU in Germany and France, where the
use of second telephones has been encouraged in an
essentially saturated network, to the cash-poor
administrations of Ireland, Italy and Greece, where the
residents must pay most of the initial cost of a telephone
connection in the connection fee.
---------14 T~e 7onsumer surplus is how much buyers would have been
w1ll~ng to pay over and above what they actually paid for serv1ces. The measure therefore is to compare tariffs with c?sts and to assure that the loss and gains are proport1onal across countries.

- 316 -
-20-
Actual connection costs are probably in the neighborhood of 250 to 400 ECU, showing that in all countries sorne externality effects (i.e. the benefits to existing subscribers if a new subscriber joins) are still taken into account.15
Comparing rental rates with the actual depreciation costs for the local loop (independent of installation costs) suggests that they are also being subsidized from call charges. The marginal costs for maintaining and depreciating old established lines are perhaps 6 to 8 ECU per month per line, with 8 to 10 ECU in rural areas. The marginal costs for new lines are more in the neighborhood of 15 to 20 ECU, given todays very much higher wage costs. Marginal costs of local (measured) calls are about .03 to .04 ECU per minute, with the initial minute being somewhat higher. This suggests a marginal cost for 3-minute local call in the neighborhood of .1 ECU o~ slightly above, depending on cost conditions and the size of the local calling area. Table 3.6 indicates significant deviations below this figure for Spain, Greece, Pvrtugal, and the Netherlands, but also somewhat higher rates for the U.K. and Italy. Sorne of this differences may be explained by the wide variations in calling area size indicated by the average number of exchange lines there.
Most important in terms of a typical telephone bill are charges for trunk calls (50- 500 km), since they make up 50 to 70 percent of telephone costs. Marginal costs per additional minute in the neighborhood of 0.1 ECU Cwith the initial minute being about .03- .OS ECU higher), suggest a marginal cost for a 3-minute call of .3 to .4 ECU.
Only the Netherlands and Denmark come close to this range (mainly because of the short trunk distances involved) with the U.K., Belgium and Spain somewhat above. The big
15 To make more people join the network, new subscribers receive their connection often significantly below actual connection cost, the rest being paid back in call charges.

- 317 -
-20(1•
'l'able 3.6: Major Tariff Variables in the EEC (1987) in ECU
(includes VA charges where applicable)
Country Connections Monthly Rentais Local Cali (LC) Cali Arca Housholds Business Tariffs Size 1)
(3 min)
Great Britain 150 9.00 14.02 0.21 221
Ital y 151 4.48 11.54 0.20 9
Belgium 116 1050 1050 0.14 78
lreland 235 11.20 15.10 0.14 78
Luxemburg 58 5.78 5.78 o.u na
France 36 5.67 13.82 0.11 uo· West Germany 31 10.80 10.80 0.11 135
Denmark 189 9.88 9.88 0.10 na
Netherlands 97 9.81 9.81 0.06 5
Portugal 66 7.98 7.98 0.05 1
Gree ce 199 2.23 2.23 0.03 s· Spain 83 6.66 7.03 0.03 na
Tariff for Trunk Calls (3-min.) lntem. Cali lntem. Leased TCl TC2
up to 100 Km max. Dist. Index (3 min)2) Lines3l LC LC (TCl) (TC2)
Great Britain 0.56 0.56 0.57 1162 2.7 2.7
Ital y 1.62 1.72 0.94 3500 8.1 8.6
Belgium 0.69 0.69 0.80 1625 4.9 4.9
lreland 1.26 1.26 0.88 1878 9.0 9.0
Luxemburg 0.67 1702
France 0.85 1.59 0.65 1541 7.7 14.5
West Germany LOO L66 0.48 2352 9.1 15.1
Denmark 0.36 0.36 0.41 13U 3.6 3.6
Nctherlands 0.26 0.26 0.41 1743 43 4.3
Ponugal L19 L19 0.90 2889 23.8 23.8
Grecce 0.97 LlS 0.89 2582 323 383
Spain 0.06 1.07 1.00 2A81 20.0 35.6
1) measurcd in average number of excbange lines in 1 000 • estimates 2) refcrs to ca11s bctwecn Madrid and corresponding cOuntry, i.e. calls from Dcnmark arc 41 % of
the tariff in the reverse direction tw tr tl ti. 3) al d • ch . s~ .:wl. ••• d. d 0 ansaanc. rent an conncction arge m &Or ~t pnvatc arcwts to a ~acent country an
ŒM 1987, reproduced in Fmancial Times Business Information
Source: Tclcfonica. Rcvista T, No 16, Oct. 1987; DIW, British Telecom

- 318 -
-21-
distortions arise in Italy, Ireland, West Germany, Portuga~ Spain and Greece, especially over the longer distances. It is here where much of the negative allocative effects and the large welfare losses take place, because the elasticity for long distance calls ((-0.3 to -0.6) is significantly higher than for local calls (-0.02 to -0.2).
As a consequence, an adjustment of tariffs for trunk calls nearer to cost, for example by more than 50 percent in the case of W. Germany, could easily lead to a 20 percent increase in call volume. In the case of international calls, where the deviation of priees from costs is greater, and elasticities are higher (-.8 to -1.5), the allocative distortion and the associated welfare losses are even larger. To raise the charges for local calls on the other hand causes a much smaller proportionate traffic loss. The positive benefits for efficient resource utilization (defined in terms of consumer surplus forgone) form such a move are clear. Effects on the distribution of benefits across the population are best dealt with by explicit, rather than cancelled subsidies.
There have been a number of studies to estimate the welfare gains from a move towards marginal cost pricing. Neumann et al., who have carried out such a study for Germany, concluded that a move from the 1979 German pricing structure to a marginal cost pricing structure would have resulted in a welfare gain of 2b DM, almost 10 percent of income from voice services. This figure is confirmed by our more recent calculations.
3.~ Influence on Service Offerings
Two of the Green Paper's recommandations are bound to influence the variety and range of service offerings if they are fully accepted. The first concerns the proposai to allow competitive services in competition with the "reserved" services provided for by the telephone administrations (they too, of course, may provide competitive services but it is in "reserved" services where they have an exclusive right). The other one concerns open, non-discriminatory network provision which should help to enhance

- 319 -
-22-
access for the value added network market, especially if it is combined with a tariff harmonization that allows the abolition of current restrictions on network use. The effect of the first is not only to increase service offerings, but also to allow sorne elements of "network" competition to creep in, even if only in an indirect way, if that may serve as a check on X-inefficiency of the PTO's.
It is the effect of the second, however, that is of interest here, as from a more harmonized, liberalized VANS market, additional service offerings are bound to arise. The precise effects are difficult to quantify, depending on the actions of the PTO's themselves in this service area. It suffices here to outline sorne of the likely effects, like - the elimination of geographie space as a barrier to the
spreading of certain services; - the spreading of existing services from within organization
or large centres throughout the economy; - the creation of larger geographie markets for already
existing services; the creation of new services made possible by the "economie" linkage of computers through telecommunications, for example through electronic data interexchange;
- the further integration of office functions and the integration of design, manufacturing and component production, leading to the "Office" and the "Factory of the Future" with CAD, CAM, FMS, etc. and their huge potential for electonic data interexchange;
- the increasing cheapness of band-width will alter significantly the cost of transmission, especially for image.
3.5 Influence of Harmonization
Products and services which are standardized may become more valuable if they are compatible with each other or if they can be made compatible (through interfaces) at relatively low cost. But the competitive process might not always lead to such compatibility. In order to correct for these market failure effects, governments must become involved in helping to set up standard-setting institutions. An industry run

- 320 -
-23-
approach alone, which could achieve the same result, brings with it the danger of cartelization. It is in this connection that the attemps of the Green Paper to increase harmonization has to be seen. The economie effects are likely to work similar to those ovserved in VANS: - reduction in barries to entry results in increased market
size. This will accelerate market growth and thereby also create learning and scale effects (for example in mobile radio);
- lower barries to entry imply a lessening of monopoly power, reduced price/cost margins and therefore increase market volume.
4. Results of the Scenarios
4.1 A Status Quo Scenario
The reference scenario, against which to compare the effects of the completion of the internal market will have to be a status quo scenario, in essence the "anti-monde". Network monopoly has only been abandoned in Great Britain. The fact that private cable networks have been allowed to operate in a number of countries might increase the likelihood that private ROES antennaes for satellite reception will also be liberalized, as envisaged in the Green Paper.
Sorne countries have already adopted the Green Paper recommendation of separating the regulatory authority from operating companies or plan to do so in the near future, thereby creating fairer competitive conditions with private firms. Sorne PTO's have set up separate companies to participate in competitive markets (for customer premises equipment, VANS, information services, etc.). Tariffs will continue to diverge significantly form costs. As a consequence, all PTOs still maintain restrictions on the use of leased lines. Both effects will limit the development of value added and information services. In the CPE market, li~klization is progressing only slowly, especially concerning the first telephone apparatus. Except for perhaps in Denmark and Great Britain, industrial policy goals in procurement still play an important role. This means that PTOs are forced to support their domestic

- 321 -
-24-
.industries, sometimes at a considerable cost. This is _characterized by a small reduction in the degree of public ownership of the PTO, a weakened link to mail service and a slight reduced network monopoly.
This overview of the status quo development shows already sorne moves towards the recommendations of the Green Paper, with the most important issues remaining in the area of tariff policy, network access and a liberalization of the CPE market. Improved performance as a consequence of liberalized procurement policies, increased operational efficiency and a move towards a more business like environment remains also a crucial issue.
4.2 Recommandations of the Green Paper Fully Realized
4.2.1 The Effects of Open, Competitive Procurement
One of the objectives of the completion of the internal market by 1992 is community-wide competitive equipment market. At the moment, the procurementrecommendation 84-550 stipulates that only 10% of public contracts are opened to international tender. If this quota is raised to 40 or 50%, as suggested in the Green Paper, the barries to entry that exist as a result of the current preferencial procurement rules would be significally lowered. A complementary INSEAD study16 shows, that depending on the current national procurement policies, savings of 1 to 3 bn ECU in 1985 priees may be realized, to that tariffs may be lowered between 2 and 8%. Since these effects are already accounted for on the equipment side, they must not be double counted on the service side.
However, as we have seen in the discussion about productivity development, lower tariffs also imply a higher traffic volume. That traffic which can be accommodated on current network capacity (due to economies of fill) implies high profits for the PTO that are equivalent to resource savings. On the traffic that has to be accommodated through extra network
16 The Benefits of Completing the Internal Market for Telecommunications Equipment, Fontainebleau, Dec. 1987.

- 322 -
-25-
investment, a 10% profit margin will be used as an indicator of extra benefits. With an overall service revenue of 61 bn ECU for 1985 a 3 bn cost reduction as a consequence of lower equipment priees could lower tariffs by roughly 5%. Ignoring the temporary benefits of economies of fill, and concentrating only on the extra traffic and network size effects results in annual benefits of 0.75 bn ECU; (i.e. 70 percent of 1.5 bn ECU extra traffic revenue because of lower tariff plus an 1 percent overall cost reduction as a result of lower unit costs with increasing network size).
4.2.2 Keeping the Arena of "Reserved Services" Small
The Green Paper recommends that the legal monopoly area for "reserved services" is defined more narrowly. In the extreme it might only entail basic dial ed telephone services while giving up the monopoly on all CPEs. But, even with the emergence of ISDN and increased data and image transmission - the voice segment of the market (as much as 70 percent of total "public" or commercial telephony markets), remains as a "reserved area" for the PTOs. These effects of a small reduction in the size of the regulated area are difficult to assess. Much will depend on the amount of "non reserved service offerings" as a response to "reserved services" and the interface and interaction between them. We expect sorne service enlargement, and more significantly, sorne substitution effect (where private supplies offer a close substitute to "reserved" dial .ed voice service). But there will be little incentive for increased productivity performance, as leased line tariffs are set in such a way that substition effects, and the associated incentive effects to increase performance, will be limited arbitrarily. Our discussion of VANS above suggests also that a more liberal use of "reserved" network services will tend to encourage VANS as well. We state these positive effects without being able to quantify them.
4.2.3 Competitive "Non-reserved" Services: CPE and VANS
Regarding the prevision of competitive "non-reserved" services we are mainly concerned with CPE, VANS and services that arise out of the ONA concept. If uniform EEC-wide type

- 323 -
-26-
approval according to minimal standards was possible for CPE and based exclusively on the safety of the user (avoidance of first-party harm) and the network (avoidance of secondparty harm), a sizeable enlargement of the CPE market, increased product variety and considerable cheapening of products could be expected. Cheaper and more versatile terminals will also generate extra traffic, as more terminal functions may become integrated, leading to a substitution effect from physical communication, but also to a market extension effect, because competition is possible over a wider range. Our interviews and the development in the US suggest as a consequence a slightly higher growth rate in traffic, so that compared to a status quo scenario, a 2-3 percent overall increase in telephone traffic seems plausible. With unchanged telephone tariffs and the same priee elasticity that we discussed above, this would mean 0.6-0.9 bn ECU extra network revenue p.a.
Since sorne of the initial traffic increase will benefit from economies of fill and economies of scale, sorne tariff reductions might be possible, leading to a further tariff stimulus. There will also be sorne additional investment in CPE deviees that may help to reduce telephone use, for example related to telephone answering machines, electronic mail, etc., which may have an offsetting effect.
The direct effects of 0.6-0.9 bn ECU additional traffic will again have to be considered in terms of opportunity costs. This can be interpreted in terms of 0.2-0.4 bn ECU due to economies of fill and economies of scale plus the extra 10 percent profit obtained from this additional service revenue, perhaps 0.05-0.1 bn ECU, resulting in economie gains of 0.25-0.5 bn ECU. The indirect effects of a larger and more diversified CPE base and the associated resource savings in their application could be a further 0.2 bn ECU.
Concerning VANS, exact figures about the European market size are rather vague; even for the U.S.A. only approximate figures are available. A Frost & Sullivan (1984) forecast predicts the market for VANS in Western Europe of $ 5.7 bn (in 1984 priees) by 1990. Of this, $ 2.5 bn is for tele-

- 324 -
-27-
communication services; text and message services are expected to earn S 1.256 bn, and on-line data bases S 1.3 bn. The estimates for revenues accruing to PTO {50 percent) are overly optimistic, however. Our interviews and literature research suggest that most value added networks currently spend at most 10 - 15 percent of their sales volume on PTOs' services, making them less vulnerable to high tariffs and restrictive use of the telephone network. Predicting such high growth rates for services with relatively little value added {compared to costs of carrier services) suggests that the more priee elastic application segment of VANS will eventually dominate the market growth.
To achieve such figures would require not only a full implementation of the Green Paper, a very cooperative approach by the PTTs, but also an increasing coordination of standards and interfaces at the European level. We would attribute at least half of this growth in transmission volume, namly 1.2 bn ECU to achieving the goals of the Green Paper. In terms of opportunity cost, the effects of economies of fill and scale are 0.25 b ECU, plus 10 percent profit on extra network services, i.e. 0.12 b ECU, in total .3 - .4 b ECU. Since these gains only occur in 1990, we can, under status quo consideration, estimate the benefits that would have been possible in 1985, had these recommandations been in place, as closer to 0.1 bn ECU p.a.
In addition to liberal network use and cheap transmission facilities, a further aspect crucial for the growth of VANS is that of "Open Network Architecture" ONA. It allows providera of VAN services an easier access to the public network, employing all the tools of traffic economy in the process, as well as the utilization of the increasing intelligence in the network (such as reversed charging, closed user groups, diagnostic and control options). If the ONA Concept is successfully implemented, we envisage that a number of VAN services, and also information and add-on services that have only a marginal application at the moment (for example, because of high transaction costs), may increasingly become economical. This might also lead to private households becoming more interested in these services, especially on the higher income end, thereby

- 325 -
-28-
greatly increasing the volume for such services and the amount of revenue generated within the network. As a consequence, the estimate of 2.5 bn ECU network revenue for VANS mentioned above could be increased by another 50 percent by 1990. Employing the same calculations as above, yields benefits in the neighborhood of .2 bn ECU by 1990, and 0.05 bn in terms of the 1985 calculation.
4.2.4 Other Effects
The Green Paper also envisages an improved regulatory structure through the separation of the regulatory from the operational responsibility and a strengthening of the antitrust provisions. This should facilitate the interface of competitive services with "reserved" services, thereby encouraging entry and a widerning of service options, whose quantification is, however, beyond the scope of this research report. Simular effects are expected as a result of increased standardization efforts in services. Increased compatibility would have a cost-reducing effect in terms of resources saveé., as well as a market enlargement effect as a consequence of lower service costs. Again we have not attempted to quantify these effects here.
4.2.5 No Provisions for Increased Performance and Tariff Rebalancing
In this "Green Paper" scenario there is little incentive to harmonize tariffs, implying that many of the current allocative costs of tariff distortions are maintained or perhaps even increased, not to speak of the associated dynamic costs. This latter possibility is indeed a real one, as technical change is occurring much faster than tariffs are being adjusted. Furthermore, the existing differences in operating efficiency between different networks will barely be affected by the current regulatory change. This would imply that further welfare and efficiency gains in addition to the above mentioned are still possible. It is for this reason that we explore next a scenario of full network competition, even so this seems at the moment politically unfeasible.

- 326 -
-29-
4.3 Full Network Competition
The potential of network entry or an improved regulatory structure will give established telephone administrations an incentive to adjust tariffs and to improve performance, an incentive which is often missing under the current regula-tory structure. The size of the expected tariff adjustment depends on the difference between the current and future amount of cross-subsidization. 17 The cost estimates and the divergence from cost from section 3.3 suggest that a size-able tariff rebalancing with associated welfare benefits would be possible. In countries, where trunk calls are priced very high and local calls are considerably under-priced, welfare losses might well be above the 10 percent welfare loss as a proportion of total call volume. These effects, excluding the already partially rebalanced U.K. segment, indicate welfare effects in the neighborhood of 4 b ECU p.a. for the EEC as a whole.
The amount of the productivity improvement as a consequence of network competition js difficult to estimate. The productivity comparisons carried out above suggest sizeable productivity differences between PTOs. Our comparisons of the Bundespost and BT with Bell Canada in Section 3.1 suggested that a 25 to 50 percent higher annual productivity growth rate may be possible for these two PTOs. With productivity growth rates currently ranging from 1 to 2 percent, an increase of at most 0.5 to 1 percentage point p.a. seems possible. Equal effects may be possible for Belgium, Italy and Spain. 18 In terms of resources saved, this is equivalent to .5 b ECU p.a. If one assumes that these productivity gains are fully passed on in further tariff reductions beyond the rebalancing effects already mentioned above, a further exploitation of network economies could lower tariff annually by 0.15 percent, yielding extra resource saving of 0.1 bn ECU p.a.
17 If access charges to the local loop are levied on entrants, a certain amount of cross-subsidies may continue.
18 We have no view (yet) on the Netherlands, Portugal, Greece and Ireland.
- 327 -
-30-
4.4 A Summary
Table 4.1 summarizes the main results of the two scenarios. The major difference between the two is the greater effect of a competitive procurement policy and of tariff reform under network competition. Without a network monopoly, entry, even if only on the fringes, forces PTOs towards a more cost concious procurement and operating policy and, as we see under point 6, a policy of tariff rebalancing. The example of the Swedish PTO - Televerket - shows that such policies are also possible without network competition, but our interviews in the different countries suggest that industrial and regional policy considerations, labor market obligations and union pressure prevent the PTOs from carrying them far enough. The increased pressure the EEC is putting on tariff harmonization is therefore a step in the right direction, as is. the policy on VANS and ONA. But only if the regulatory framework can be strengthened to increase performance and if the PTOs are released of the other policy task by pursuing them through more direct policy tools (taxes, subsidies, retraining, etc.) will more rational tariff and operating policies result.
The likely effects of the Green Paper towards the completion of the internal market by 1992 are of a sizeable magnitude, but the remaining policy problems are large enough to warrant further efforts, before the market for telecommunications services are truly integrated in such a way, that their full technology potential can be realized on an EEC-wide basis.

-328 -
-'31-
Table 4.1: Effects of Regulatory Reform on European
Telecommunication Services (1985)
Measures/Effects
1) Lower equipment cost
Implies lower tariffs and through network expansion, utilization of economies of fill and scale
2) Keeping Arena of "Reserved Services" small
Implies increased product spectrum and market enlargement effects
3) More competitive "Nonreserved Services"
3a) easier CPE certificationJincreased product variety, lower CPE priees, increased network use (by 0.6 -0.9 bn ECU)
3b) liberalized VANS
3c) open network provision
4) Improved regulatory structure, facilities entry, competitive interface
5) Standardization, competitive interface
6) Tariff Reforms(closer to cost)
7) Improved operating efficiency
Green Paper Effects Full Network Competition Effect
2-4 bn ECU p.a. 4bn ECU p.a. (not to be double counted)
0.75 bn ECU p.a. slightly larger
not estimated not estimated
0.25 - 0.5 bn ECU direct
plus 0.2 bn ECU indirect resource savings (p.a.)
0.3 - 0.4 bn ECU by 1990 i.e. 0.1 bn ECU p.a.
0.2 bn ECU by 1990 i.e. 0.05 bn ECU p.a.
not estimated
not estimated
marginal effects (no· EEC instruments as yet)
marginal effects (no EEC instruments as yet)
not estimated
larger, because fewer network restrictions
not estimated
same
same
4 bn ECU p.a.
0.6bn ECU p.a.

- 329 -
10.
The Benefits of Completing the Internat Market for Telecommunication Equipment in the Community
INSEAD


Institut Européen d"Administration des Affaires Eu~opean lnstitute of Business Administration Europaisches Institut für Unternehmensführung ._,,.., f'n>i f"E._,... ... , S.pmnr
Boulevard de Constanc:c 77305 Fontainebleau Cedex. Franc:c Telephone (6) 422 48 27 Telex 690389F
The Benefits of Completing the Internai Market for
Telecommunication Equipment in the Community
Executive Sumrnary
Dec. 1987
Subrnitted to the European Commission


-333 -
1. Industry Background
1.1 Goals of Integration
One of the objectives of the European Community in completing
the internai market by 1992 is to eliminate all current
barriers to trade in telecommunications equipment. The 1985
White Paper by the Commission identifies the costs of
physical and technical frontiers that need to be eliminated.
The "Green Paper on the Development of the Common Market for
Telecommunication Services and Equipment" spells these issues
out in detail. Upon closer analysis, it is mainly "technical
frontiers", due to different national equipment and network
standards and certification requirements and nationalist
procurement policies, which account for the delay in
achieving an effective internal European market.
1.2 The Products and their Markets
Telecom~unication equipment is used to construct a
telecommunications network infrastructure, for example with
the aid of transmission and switching equipment and to have
access to such networks with the aid of customer premises
equipment (CPE). These three categories therefore make up the
most important market segmentt, in addition to a small set of
miscellaneous products. Table 2.1 gives an overview over
these four markets in Western Europe for the year 1986. These
data are based on market surveys by the consultancy firm
Frost & Sullivan since no official statistics with a similar
breakdown by products and countries exist. Table 1.1
indicates the dominance of central office (CO) equipment with
~lmost half of the market volume. The total market in 1986 is
estimated at $ 15 bn, to reach $ 19 bn by 1990.

- 334 -
-2-
Table 1.1: European Telecom Equipment Market (1986)
Switching Equipment Terminal Equipment (CPE) Transmission Equipment Other Equipment
in Mill $
7050 3600 1950 2250
Source: Frost & Sullivan, E 882, 1987
in Percent
47 24 13 15
The next significant market, according to the Frost &
Sullivan definition, is terminal or CPE equipment with
roughly 24 percent of total value, followed by transmission
with 13 percent and a set of miscellaneous products with 15
percent. The overall market size was estimated to be 15b US $
in 1986, growing to 19b by 1990.
Different consultancy reports come to different agreements
about the size of the market and the weight to be given to
different product groups (Tables 1.2 and 1.3). The problem is
apparent in Table 1.2, which represents the individual
European markets on the basis of another consultancy study,
in this case by Arthur D. Little (WTIP). Its market estimate
for the EEC Market of the 12 with 17.5b is already above the
Frost & Sullivan Study's market estimate of $ 15b for all W.
European countries.

- 335 -
-3-
Table 1.2: Telecommunications Equipment Market in the BEC, o.s. and Japan
1984 1986*
$bn % of total $bn % of total
Belgium 0.7 1.0 0.8 0.9 Denrnark 0.3 0.4 0.4 0.4 France 3.1 4.4 4.2 4.6 Ire land 0.1 0.1 0.1 0.1 Ital y 1.4 2.0 1.7 1.9 German y 2.9 4.1 3.6 3.9 Gree ce 0.2 0.3 0.2 0.2 Netherlands 0.6 0.8 0.62) 0.7 Portugal 0.2 0.3 0.2 0.2 Spain 1.3 1.9 1.6 1.7 UK 3.3 4.7 4.1 4.5
(Sub total) (14.0) (20.0) (17.5) (19.1)
us 26.41) 37.7 34.5 37.8 Japan 6.8 9.7 7.9 8.6
EC, US, Japan total 47.3 67.4 59.9 65.5 World total 70.0 100.0 91.3 100.0
Source: Arthur D. Little (WTIP)
1) 1985; 2) 1984; * 1986 estimate is in 1985 US dollars.
Table 1.3: Yeleca.munications Bqui~nt Markets in the Principal OECD Coantries, 1984 (in Mill US $)
public private public switching switching transmission CPE
(incl. broadcast)
World Market 10000 9420 14590 6495 France 730 251 650 448 West Germany 457 492 690 400 O.K. 687 361 460 250 Ital y 710 129 400 131 USA 2850 5400 5220 2830 Japan 627 808 1520 316 Canada 327 210 210 72
Source: Rausch (1987, p. 20)

- 336 -
-4-
Other market studies include rouch of the office equipment
market in their figures for CPE equipment (thereby yoising
its significance), even if such equipment is only
occasionally linked to a telephone network. These
distinctions are nevertheless important because different
procurement rules hold in the CPE market, as rouch of the CPE
tends to be procured by private individuals (except for main
telephones) so that restrictive certification rules and
incompatible standards matter more than in the publicly
procured switching and transmission market. Already, an
increasing amount of switching activity is carried out at the
customers' premise in so-called private branch exchanges
(PABX). This segment is being enlarged through the
introduction of local area networks and other data services.
As a consequence, 20 to 30 percent of the switching market
may in the future lie outside the public procurement realm
and be subject to different, more open procurement
conditions.
1.3 Economies of Scale and Benefits from Specialization
The three main product categories to be analyzed, CO,
transmission, and CPE equipment, all allow different degrees
of international specialization, due to varying economies of
scale in equipment production. Economies of scale are highest
for CO equipment. Over 50 percent of value added consists of
software cost that are independent of market size for given
switches. AT&T's Western Electric has the capacity to produce
7m access !ines p.a. at one plant in the USA, compared to a
total market demand below lm access !ines p.a. in sorne large
European countries. Even if a plant also produces large
private branch exchanges (PBX), for which sorne component,
software and testing tools might be simultaneously used, the
European scales are still small, suffering from a cost
disadvantage that is equivalent to 20 - 30 percent, when
comparing a plant of 7m lines capacity p.a. to one of lm
lines p.a ••
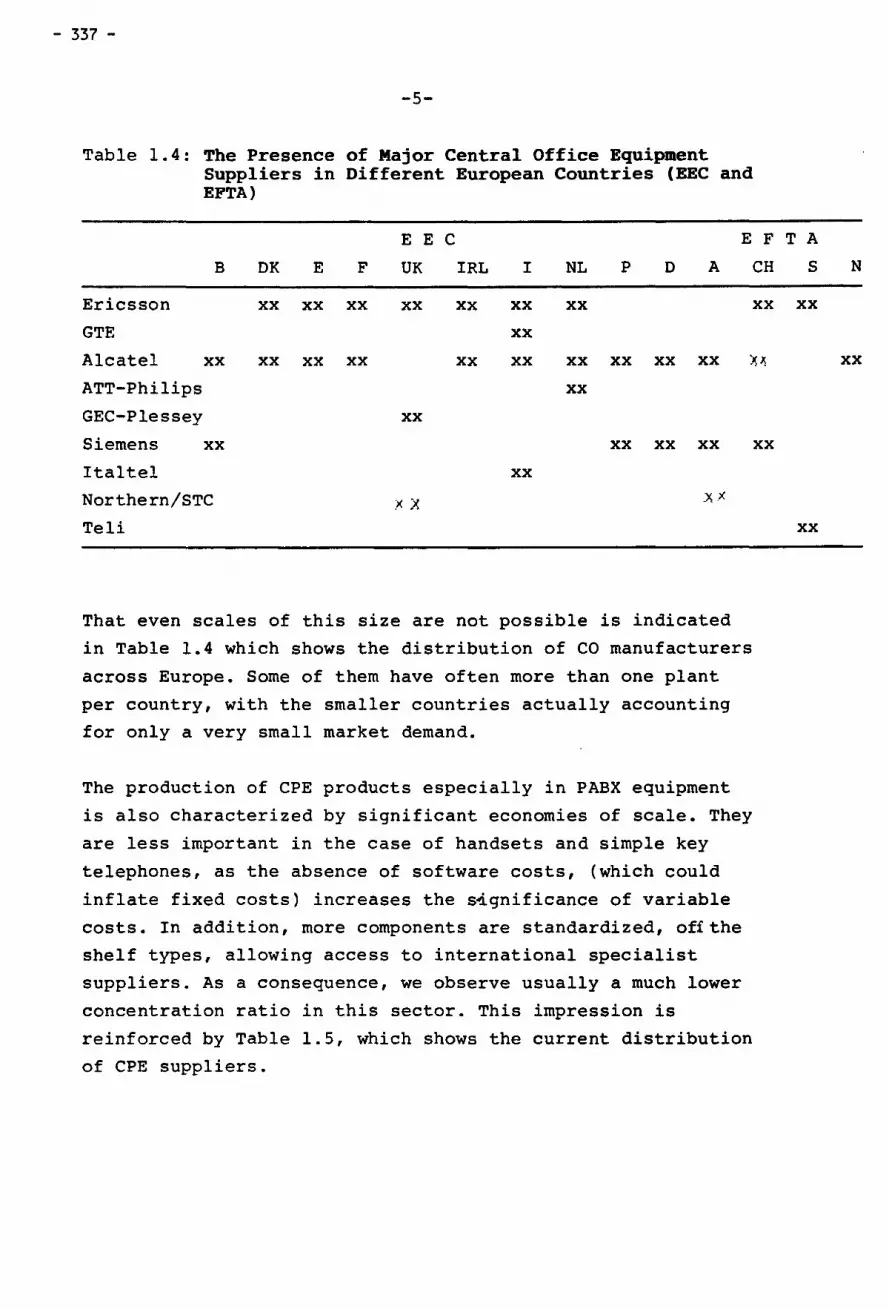
- 337 -
-s-
Table 1.4: The Presence of Major Central Office Equipment Suppliers in Different European Countries (EEC and EFTA)
E E c E F
B DK E F UK IRL I NL p D A CH
Ericsson xx xx xx xx xx xx xx xx
GTE xx
Alcatel xx xx xx xx xx xx xx xx xx xx ~.~~
ATT-Philips xx
GEC-Plessey xx
Siemens xx xx xx xx
Ital tel xx
Northern/STC :x x x.x
Te li
That even scales of this size are not possible is indicated
in Table 1.4 which shows the distribution of CO manufacturers
across Europe. Sorne of them have often more than one plant
per country, with the smaller countries actually accounting
for only a very small market demand.
The production of CPE products especially in PABX equipment
is also characterized by significant economies of scale. They
are less important in the case of handsets and simple key
telephones, as the absence of software costs, (which could
inflate fixed costs) increases the s~gnificance of variable
costs. In addition, more components are standardized, offthe
shelf types, allowing access to international specialist
suppliers. As a consequence, we observe usually a much lower
concentration ratio in this sector. This impression is
reinforced by Table 1.5, which shows the current distribution
of CPE suppliers.
xx
T A
s N
xx
xx
xx
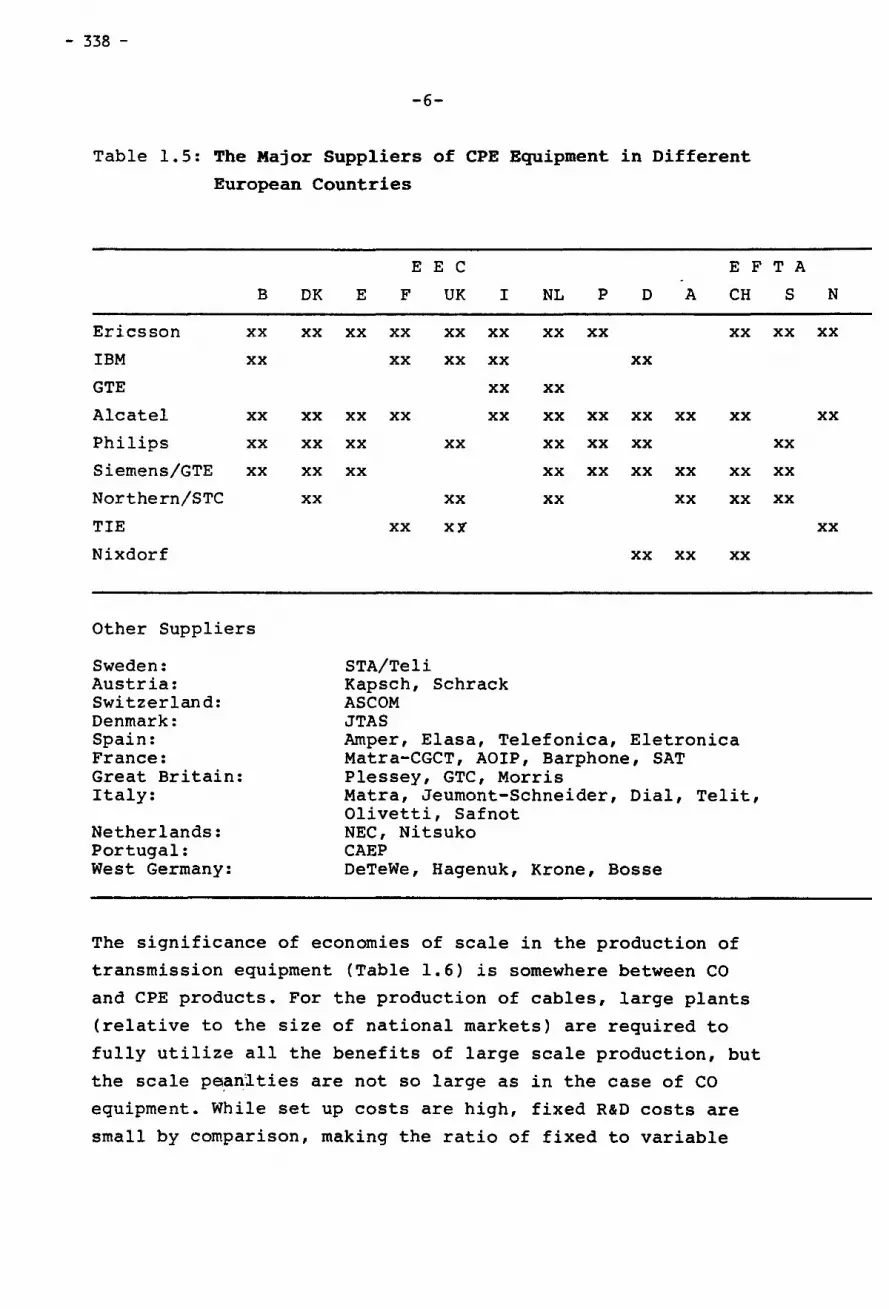
- 338 -
-6-
Table 1.5: The Major Suppliers of CPE Equipment in Different
European Countries
B DK
Ericsson xx xx
IBM xx
GTE
Alea tel xx xx
Philips xx xx
Siemens/GTE xx xx
Northern/STC xx
TIE
Nixdorf
Other Suppliers
Sweden: Austria: Swi tzerland: Denmark: Spain: France: Great Britain: Ital y:
Netherlands: Portugal: West Germany:
E E C
E F UK I
xx xx xx xx
xx xx xx
xx
xx xx xx
xx xx
xx
xx
xx X J'
STA/Teli Kapsch, Schrack ASCOM JTAS
E F
NL p D A CH
xx xx xx
xx
xx
xx xx xx xx xx
xx xx xx
xx xx xx xx xx
xx xx xx
xx xx xx
Arnper, Elasa, Telefonica, Eletronica Matra-CGCT, AOIP, Barphone, SAT Plessey, GTC, Morris Matra, Jeumont-Schneider, Dial, Telit, Olivetti, Safnot NEC, Nitsuko CAEP DeTeWe, Hagenuk, Krone, Bosse
The significance of economies of scale in the production of
transmission equipment (Table 1.6) is somewhere between CO
and CPE products. For the production of cables, large plants
(relative to the size of national markets) are required to
fully utilize all the benefits of large scale production, but
the scale p~anlties are not so large as in the case of co equipment. While set up costs are high, fixed R&D costs are
small by comparison, making the ratio of fixed to variable
TA
s N
xx xx
xx
xx
xx
xx
xx

- 339 -
-7-
costs that much lower. Microwave transmission equipment is
similar to CPE in its scale economies, especially for more
standardized components, like repeaters and amplifiers.
Table 1.6: The Major Suppliers of Transmission Equipment in
Different European Countries
B DK E
Ericsson xx xx
Alcatel xx xx
Marconi xx
Philips xx xx
Siemens xx xx
xx xx
Other Suppliers
Sweden: Austria: Belgium: Spain: France: Great Britain: Portugal: West Germany: Switzerland:
E E c F UK I NL p D A
xx xx xx
xx xx xx xx xx xx
xx xx
xx xx xx xx xx
xx xx xx xx xx
xx
Relicana, STA/Teeli, Noika, NEC Kapsch ACEC Indelec, AEG (Rail) Matra GEC, Ples~, STC CAEP ANT Northern Telecom
E F T
CH
xx
xx
In summing up, most equipment production is characerized by
significant scale economies that would lend itself to
extensive international specialization.
1.4 Limits to International Specialization
A
s
xx
xx
Taking the four major markets together (CO, transmission, CPE
and other products), we currently find highly protected
national markets within each EEC member country. There is
little intra-EEC trade, but a fair amount of exports to
N
xx
xx
xx
xx

- 340 -
-8-
countries outside of the EEC (experts are roughly 23 percent
of output, but only 30 percent of this goes to other EEC
markets). Exports and imports are distributed fairly unevenly ·J
with W. Germany being the greatest exporter to non-EEC
countries, followed by France and the UK; the UK is the
largest importer, followed by W. Germany, Italy and the
Netherlands. Total imports, at the moment, account for much
less than 10 percent of final demand, a further confirmation
of the national orientation of these markets. In addition to
a small amount of intra-EEC trade, more than 50 percent of
imports come from the USA and Japan.
The reasons for this peculiarly "closed" market structure are
threefold: selective procurement and certification policy,
incompatible standards and "input specificity". 1
Selective procurement policy is related to the insistance of
national governments - for industrial policy reasons - on
maintaining a "technology base" in such an advanced
manufacturing sector as telecommunication equipment. As a
consequence there are not only high barriers to entry for
ether suppliers, but also high barriers to exit for firms who
want to centralize their multinational operations in one or
two places. Even if the significance of economies of scale
for certain products increases significantly, and there are
strong signs for this especially in CO equipment, national or
multinational manufacturers might not be allowed to
rationalize and to close sorne national plants in order to
reap the available benefits of economies of scale and
international specialization. Instead, they are forced to
maintain a production site and a technology base in each
national market.
1 The supplier delivers a good or a service which is specifically customized to the user's specification, for example to allow compatibility with previous investment in a complex network system.

- 341 -
-9-
Restrictive certification policy and incompatible
international standards are sometimes also used as
instruments of such a "technology base" policy, but often
they are related more to a specifie technology orientation of
an administration, often in close accordance with domestic
manufacturers, who use their influence in certification and
standard setting to raise entry barriers for outsiders.
"Buyer or input specificity" is especially relevant for CO
equipment. It makes it difficult to open up these national
markets quickly, given the high adjustment costs of moving
from one type of system or standard to another. The degree of
buyer specificity is less strong for transmission equipment,
because the interfaces between different types of equipment
have already been more or less internationally standardized,
allowing specialist suppliers to survive in different
national markets. The same can be said for CPE equipment,
except that here too nationally different certification
standards play a role.
2. Results of the Analysis on the Costs of Non-Europe
2.1 Status Quo Forecast
When analyzing the benefits of European integration, an
"anti-monde" to the completion of the internal market by 1992
must be constructed as a reference point. This reference
scenario is based on what would happen if current industry
trends were to continue without the extra stimulus of
Community policy: We notice that significant structural
changes are already taking place in the face of stagnant
national markets, with increasing international competition
to better exploit the available economies of scale, even as
rouch of each country's industry remains nationalistic in
output. This would imply that sorne of the expected benefits
of completing the internal markets will be realized in any
case. Furthermore, the market already has such an
international dimension, that the large equipment suppliers

- 342 -
-10-
tend to look more at market aggregates when deciding their
new product policy and their overall, long term strategy,
rather than just looking at individual national markets.
2.2 A Scenario in Accordance with the Recornrnendations of
the Community's Green Paper
The next step is to assess the policy effects that would
arise out of an implementation of the recent Green Paper's
Recommendations and to differentiate them against status quo
developments. Under the assumption that the Council of
Ministers will act for these recommendations to take place
before 1992 we would expect the current regulatory change to
take place in a more consistent framework with a preference
for a wider arena for competition and the availablility of
more standardized European-wide services.
The likely effects of such a scenario have to be
distinguished between those recommendations applying to the
market for publi~ procurement (mainly CO and transmission
equipment) and that for customer premises equipment.
2.3 A Scenario of Full Service Competition
The Commission does not question the right of the
telecommunication administrations to maintain their monopoly
provision of infrastructure services. Nevertheless, recent
developments in the UK suggest that a scenario of full
network competition ought also to be considered. It
represents a useful reference point against which to compare
the status quo scenario and that based on the current Green
Paper.

- 343 -
-11-
3. Methodology to Estimate the Costs of Non-Europe
3.1 Priee Comparisons as Indicators of Selective
Procurement Policy and Incompatible Standards
3.1.1 Observed Priee Variations
From the consultancy study on public procurement (WS/Atkins),
plus our own interviews and market surveys, we have obtained
estimates of the priees for different equipment types
currently being paid in Europe and compared them with
"competitive world market priees" •• The resulting differences
in priees may - as a first approximation - be used as an
indicator of the potential savings that could arise with the
competitive effects of the completion of the internal market
by 1992. However, as the main study shows, these differences
must be analyzed more thoroughly before such interpretations
are justified. On the one hand, there may be quality
differences associated with current priee disparities. On the
other, the products being compared differ in their features
and functions. Furthermore R&D costs are often paid out of a
separate budget so that sorne priees reflect only variable
manufacturing cost. The same is true for many export
contracts that form the basis for the observed "competitive
world market priees". The priee deviations in Table 3.1 must
be seen with these caveats in mind.
Table 3.1 also sumrnarizes the 1985 construction budgets of
the telephone companies in the EEC member countries on the
basis of the ITU statistics. These figures often also include
a fair amount of expenditure for buildings, cabling and
vehicles as a comparison with the total market estimate of
ADL indicates. In most countries, the ITU figures would seem
to overestimate the actual public market by 20 to 30 percent
as a comparison with tables 1.2 and 1.3 shows. The figures
for Italy and W. Germany are clearly out of line and must be
adjusted downward, to be more in line with the figures in

- 344 -
-12-
Table 3.1: Total Telecom Equipment Investment and Observed
Priee Deviations (Public Market, 1985)
PTO 1nvestment percent pr1ce dev1at1ons
Country ECU million co transm. CPE (% more than)
Belgium 500.00 120 60 40 Denmark 350.00 30 30 40 France 3,800.00 50 30 40 German y 5,200.00 100 50 80 Greece 325.00 n.a. n.a. n.a. Italy 3,100.00 lOO 30 40 Ireland 200.00 n.a. n.a. n.a. Luxemburg 15.00 n.a. n.a. n.a. Netherlands 550.00 50 n.a. 60 Portugal 235.00 n.a. n.a. n.a. Spain 1,600.00 50 40 30 United Kingdom 3,400.00 40 30 40
Total 19,275.00 ====================================================================== Source: Priee deviation:Country Interviews, investment!ITU
Table 1.2. The next three columns in Table 3.1 represent
estimated priee deviations from competitive world markets.
They are highest in central office (where they are, as in the
case of Belgium and W. Germany, sometimes more than twice the
"competitive" priee level). The deviations are lower for CPE
and transmission equipment.
Sorne of these priee deviations are transitory, however, and
have to be interpreted with great care. The UK has for a long
time been among the high-price countries, but BT hassince 1982,
with a more open internationally oriented procurement policy,
been able to bring down its equipment priees significantly
when it _ decided to abolish its system of "Court
suppliers". Belgium too .tried in 1987 to abandon its
relative high domestic pricing policy, which it needs to
sustain current R&D and export activities in the equipment
industry (almost 50 percent of Belgian output is exported,

- 345 -
-13-
one of the highest ratios in Europe). The relatively low
deviations in France may also be explained by paying
separately for R&D. 2
As a consequence, these deviations are at best indicators of
a structural imbalance between different national markets and
the associated policy of differentiai pricing. A complete
move to competitive world market priee levels may therefore
not be realistic, as the amount of R&D necessary to sustain
technical developments in the industry could be significantly
curt ai led.
3.1.2 The EEC Green Paper fully Implemented
3.1.2.1 The Effects on the Public Market
Two effects are likely to be dominant in the public market:
One of them arising out of increased Community-wide
standardization, another arising out of increasing the
proportion. of public procurement contracts that fall under
the earlier EEC Directive 77/62 3 and its more recent recommendation 84-550.
Concerning standardization, the most important effects will
be felt in central office equipment, where a number of
different non-compatible systems currently exist. Comparing
the EEC's role in addition to that already carried out by the
other international standard-setting bodies would lead us to
suggest sorne priee reductions in future switching costs if
more of the interfaces can already now be standardized and
greater interworkability of different systems is achieved.
Our interviews suggest that savings in the neighbourhood of 5
to 10 percent out of a total European CO switching market of
2 The DGT will very often first pay for the development of a prototype and therefore for most of the initial R&D, so that subsequent equipment tenders can be priced on a different basis.
3 According to the recommendation 84-550, only 10 percent of public procurement contracts in telecoms equipment have to be advertised internationally; that proportion is to be raised to 50 percent as an interim proposai before a full opening of the market by 1992.

- 346 -
-14-
about Sbn ECU would be possible, i.e. 0.25 - O.Sbn ECU p.a.
because of greater compatibility. Indirect dynamic effects
out of the subsequent increased competitive pressure have to
be considered as well. They might in the medium term lower
central office costs by another 5 percent, so that the total
effect could be as high as 0.4 - 0.7bn ECU p.a.
For transmission equipment we expect much smaller effects of
the Community's policy on standardization as much has already
been achieved through other effects. It is only the indirect
effects as a result of more competitive procurement that
might help to reduce transmission costs by 5 percent. Similar
arguments hold with respect to CPE equipment and other
components.
The second effect concerns the opening of the public
procurement sector in telecommunication equipment mainly
regarding network equipment. The EEC recommendation 84-SSO
foresees that 10 percent of total tenders are advertised
internatinally. If this is used selectively, in
other words applied only for those products, for which the
domestic industry does not have to be protected, or where the
size·of the order is so small to not attract international
offers, the effect could be quite minimal. On the other hand,
if it was used to the strategie advantage of the telephone
administration, for example in the area of central office
equipment, the effect could be quite large. This latter
potential could be seen quite clearly by the recent struggle
for the takeover of the French equipment manufacturer CGCT
with a national market share of only about 15 percent.
For this reason we shall make two assumptions. The first
assumes that the 10 percent rule is very restrictively
applied. The second assumes that the envisaged opening up
reaches 40 to 50 percent of public contract volume by 1992
and is used to the greatest advantage of the purchaser.
- 347 -
-15-
In the first case, the effect would essentially be zero. In
the second assumption, the effect could be quite significant,
as is evident from the figures obtained in Table 3.2 on the
basis of the priee deviations in Table 3.1. The possible
priee reductions are calculated on the assumption that the
deviations from world market priees overstate the difference
to a viable long term competitive priee level by 20 percent.
Nevertheless, significant savings might still be possible.
The savings would be largest in the high priee countries
Belgium, Germany, Italy, but also significant in France and
the Netherlands. They would be relatively small in Denmark
and the UK.
While the assumptions underlying Table 3.2 are somewhat crude
and estimates have not been attained for all countries, the
potential savings as a consequence of opening up 40 - 50
percent of the public market could be as high as 3bn ECU (out
of a total of 17.5 ECU).
What is the likelihood of the full exploitation of a 40 to 50
percent open procurement rule? Given the magnitudes involved
and the restructuring necessary to achieve such savings,
considerable political opposition could be expected. This
would make it very difficult for the PT~ to adapt an
aggressive open procurement rule. If they were able to do so,
recourse could nevertheless be taken to extra government
funding from other public sources to maintain the current
level of activity and employment in the industry. As a
consequence, the 3tmECU savings estimated in Table 2.2
represents only the maximum priee reductions possible,
together with the 0.4 - 0.7bn ECU from an effective
European-wide standardization.
But both effects are not likely to be achieved in practice
because of t~e political opposition to a restructuring so
that the savings associated with the implementation of the
recommendations of the Green Paper concerning a more open
procurement policy will be significantly lower. Instead, most

Table 3.2: "-ci._ Priee Reductians for M.jor Product Groups <1985> VI .j:'-00
Possible Prie. ReductiCWl Possible Priee R.O..CtiCWl Total Trans-ttarkwt. • œ - : - Atkins aissiCWl - - : • <• EDJ>: (30 X) in X :in • EaJ : in X lin • ECU (23 X) in X :1n a ECU: in X :in • ECU ------- -------- -· 8 800 240 50 120.0 . 60 144.0 184 25 46.0 . . .
[IC «<l 120 10 12.0 . 92 10 9.2 : . F 4200 1260 20 252.0 . 40 504.0 966 10 96.6 . . . D 3600 1080 «l 432.0 : 70 756.0 829 20 165.6 . . SR 2ŒI 60 : 46 . . 1 1700 510 «l 204.0 . 50 255.0 391 10 39.1 : . IR 100 30 . 23 . . . .._ 600 180 20 36.0 : 138 : p 200 60 . 46 . . . E 1600 480 20 96.0 . 368 15 55.2 : . lJC 4100 1230 15 184.5 : 50 615.0 943 10 94.3 : -------- ----------TOTfl. 11500 5250 : 4025 . .
->
"' Possible Priee ReductiCWl Possible Priee R.O..CtiCWl
Total Total tt.rk.t. • a»E - : -• Atkins - others - : AlldiiCt ion <• EDJ)I <23 X> in X :in a ECU : in X :in a ECU <23 :iC) in X :in a ECU: in X lin • ECU in • ECU ------------------ -:
8 800 184 15 27.6 : 20 36.8 184 15 27.6 : • 221.2 • [IC «<l 92 15 13.8 . 92 15 13.8 : 48.8 . F 4200 966 15 144.9 . 43 415.4 966 15 144.9 . 638.4 . . D 3600 829 30 248.4 . 38 314.6 829 15 124.2 . 910.2 . . GR 200 46 . 46 : . 1 1700 391 15 58.7 . 0 0.0 391 15 58.7 . 360.4 . . IR 100 23 . 23 : . N. 600 138 25 34.5 . 138 15 20.7 . p 200 46 . 46 . . . E 1600 368 10 36.8 : 368 20 73.6 . 261.6 . lJC 4100 943 15 141.5 . 0 0.0 943 15 141.5 . 561.7 . . ----- --------------, TOTfL 11500 4025 : 4025 . .

- 349 -
-17-
administrations will be obliged to apply open procurement
rules much more selectively in areas where structural
adjustments costs are lower and receive more political
support. But even this would still require a fair amount of
prodding by the Commission, a policy not necessarily
conducive to the spirit of collaboration needed to reach
agreement on ether issues, such as standardization and joint
certification.
3.1.2.2 Private Markets
Table 3.2 already included estimates of potential priee
reductions in the market for CPE equipment and ether
telecommunications equipment. These effects are partly
related to the increased competitive effects in the public
market, since the telecommunication administrations will act
as a competitive distributor in these ether markets as well.
There is, however, also a significant dynamic effect to be
considered, namely that of market enlargement and product
diversification as a consequence of Community-wide
certification according to minimal certification criteria.
The likely dynamic implications are illustrated by the recent
growth in the liberalized US CPE market. As a consequence of
private purchasing, depreciation rates dropped considerably,
simple handsets were replaced much more frequently than
before, leading to significantly larger turnovers. Similar
tendencies, though perhaps less dramatic, occurred in PABX
and key systems. As a consequence of faster depreciation,
sales have been rising significantly above the previous
trend. In addition, the increased competition reduced
equipment priees faster making telecommunications
applications rouch more attractive and leading to increased
network utilization as well.
To sum up, the potential dynamic efficiency gains in the CPE
market arise mainly through influencing the innovation
process and the associated market growth effects as a result
- 350 -
-18-
of lower entry barriers. If that can be combined with a
larger market, allowing firms to innovate faster while at the
same adapting a much more aggressive pricing strategy to gain
a long term market share, the increased competitiveness will
have further innovative and priee reducing effects that may
yet further stimulate total demand for both CPE equipment and
network use.
On the basis of these considerations, the dynamic effects
could be equivalent to 50 percent of the static potential for
priee reductions identified in Table 3.2 (i.e. 50 percent of
.7b ECU). In addition, one could envisage an increase in the
market volume of CPE equiprnent by 10 to 20 percent above the
current growth trajectory. If a profit margin of 10 percent
of this market growth is used as an indicator of the extra
economie benefits, a further economie gain of up to .lbn ECU
could be achieved. 4
3.1.4 The Effects of Full Network Competition
We have argued above that the recommendations to open up the
public procurement market might not be carried out because of
political opposition from equipment suppliers, unions and the
regions affected by the subsequent rationalization of the
industry. If network competition were introduced however, the
PTOs would have to behave very differently. Given the threat
of market entry, they could no longer afford to purchase at
preferential rates, thereby weakening their competitive
position, but would have to purchase on commercial terms, as
has been illustrated by the changing behaviour of BT and the
Arnerican long-distance carriers. Only in this case would the
full effects of open procurement be realised that we
indicated in Table 3.2. The effects of network competition,
even if at the moment relatively unrealistic, provide at
least another reference point against which to adjust the
results of the recommendations of the Green Paper.
4 A 10 percent markt increase is equivalent to .4bn extra sales, yielding O.OSbn ECU extra benefits, a 20 percent increase yields O.lbn ECU.

- 351 -
-19-
3.2 An Integrated Approach
Our analysis so far rested on the interpretation of priee
deviations as a consequence of segmented European markets.
Priees in sorne markets are significantly higher than in
others and firms use the different price-cost margins in each
market to sustain their overall production operation. In a
truly integrated market there would be a movement towards a
one-priee area in which priees should not differ
siqnificantly from one area to another or to other outside
markets. Sizeable savings would only be possible if they were
realized through higher productivity in production, increased
specialization because of utilization of economies of scale
and scope and a reduction in the number of products available
overall (even though it is likely that there will be
increased product variety in each national market as a
consequence of increased international trade. Only in such an
environment will a priee drop of the magnitude suggested be
feasible without the firm's in the industry going out of
business or being unable to maintain their R&D effort
necessary to sustain current and future levels of research
and development and product innovation.
To model such an evolution and to compare the outcome with
the results so far, we have analyzed the production structure
of the major equipment firms (CO, CPE, transmission)
and considered what happens under different assumptions about
scale and priee elasticities if a number of countries are
involved in an integration and rationalization process that
may be characterized by the completion of the internal market
by 1992.
The basic idea behind this model, which follows very much an
earlier study on the specialization arising from
international trade in the presence of significant economies
of scale, is derived from Dixit and Norman (1980). Their
basic assumption is that if significant economies of scale
are present which are not exploited in national markets, any

- 352 -
-20-
enlargement of the market (i.e. through a customs union) will
allow further rationalization to take place. The surviving
firms will be able to move along their declining long-run
average cost curve, thereby passing significant productivity
savings on to consumers, until a new equilibrium is reached.
The size of a market is described in conjunction with scale
economies by the number of firms it can support. In order to
keep the model simple we assume equal sized firms. We must
therefore abstract from the actual size distribution of firms
observed above to an "equivalent number" of equal sized
firms. Following the data in tables 1.4 and 1.5, we have used
the following numbers for a typical (large) EEC member
country:
Central Office Equipment
PABX Equipment
Telephone Handsets
2
3
4
The priee elasticity of demand is brought in by assuming that
the size of the market depends not only on the number of
supplying firms but also on their output per head of
population.
If we can assume that the market expansion effects of the
completion of the internai market by 1992 is equivalent to a
customs union of six equal sized European countries,
then integration increases the market size
available to a national firm by a factor of 5. 5 National
producers now face a five times larger market, but five times
as many competitors. With a relatively low priee elasticity
(-.53) and 10 firms per market, we can show that at the new
equilibrium there will be 33 firms remaining (instead of the
previous 60). As a consequence, output per head, the measure
of benefit in this mode!, increases by 30 percent. The
5 This is only an approximation as a comparison with table 1.2 shows. The market expansion effects for a French or W. German manufacturer would be smaller, but larger for an Italian or Spanish firm.
- 353 -
-21-
benefits of integration are then directly consumed in
telecom's output and in other output (as there is to be no
excessive profits).
Further simulations show that the gains in consumption (in
other words, the benefits to the economy) as a consequence of
greater specialization are greater, the smaller the number of
firms in the closed national market and the greater the
expansion of the market. This would imply that small
countries, for example Belgium, the Netherlands or Portugal,
will gain more from market integration than large countries
if they start out with the same number of firms. While this
is not normally the case in other industries, it does seem to
be true in telecommunication equipment, as Tables 1.5- 1.7
show. On the other hand, they may have no national producer
left at all, a conséquence which they may not be willing to
accept for industrial policy considerations.
As long as priee elasticity is below 1 and the number of initial firms large, the larger the number of firms
that will remain in the industry. If priee elasticity is
above 1, and the number of firms is small (an indication of
significant economies of scale), the proportionate change in
the number of firms increases. In other words, a high priee
elasticity indicates that the tradeoff between specialized
and uniform products favours the lower cost uniform products.
As a consequence, the proportional reduction in the nurnber of
firms as a result of a market enlargement increases much more
in those markets where economies of scale are especially
important (for example CO equipment), while the effects are
somewhat smaller for those products, where economies of scale
are exploited earlier. The lesson is clear, however. The
eventual industry structure that emerges depends very much on
the interaction between economies of scale and demand
preferences (as indicated by the relevant priee elasticity):

- 354 -
-22-
- If a national market can support very few firms, because
economies of scale are high, then the benefits of
integration are very high, as in the case of CO equipment.
But welfare gains drop very quickly as the initial number
of firms increases and economies of scale effects lose
their importance.
If the priee elasticity of demand is high, even
monopolists will find it in their interest to bring priees
closer to cost so that the proportionate change in the
number of firms is smaller and the benefits (i.e. the
change in telecom consurnptions) declines.
In other words, the big consumption gains as a result of
integration occur in those sectors where, because of the
fewness of firms, the degree of monopoly is high and, becaue
of "input specificity", priee elasticity is low. This
inëicates not only the assumptions underlying the model, but
also what we will have to look for in the real world. In
other words, it is not sufficient to just look at priee
differences, economies of scale, and the benefits of
integration, but also at what pricing policies are currently
pursued by those equipment suppliers who have a degree of
market power and at the trade-off between economies of scale
and specialization.
3.3 An Assessment
We attempted to identify the effect of the completion of the
internal market by first analyzing the determinants of the
current industry structure, secondly observing significant
priee differences within the EEC (cornpared to the rest of the
world), and on this basis predicted the likely effects of the
full implementations of the Green Paper on market priees and

- 355 -
-23-
volume. The figures were based on two main scenarios: firstly,
a status quo scenario where current trends continue; and,
secondly, based on the Green Paper, a comparative scenario
allowing for the effects of standardisation and with two
levels of procurement liberalisation, one at 40%, the other
at 100%. The gains from standardisation (because of better
exploitation of economies of scale)were estimated at 0.85
billion ECU to 1.1 billion ECU. The additional gains from
competitive procurement are estimated at 2.2 billion ECU
under the 40% scenario and 3.7 billion ECU under the 100%
scenario. So , totalling all effects, these can vary between
3.05 billion ECU and 4.80 billion ECU, depending on the degree
of openness of the procurement market.
Table 3.3: Possible Effects Under the Green Paper Scenario
(in billion ECU)
Effects of Effects from procurement standardis- liberalisation
Products ation: 40% liberalized 100% liberalized Static Dynamic Static Dynamic Static
Central office 0.25/ 0.2 0.8 switching 0.5
Transmission 0.2 0.4
Customer Premises 0.1 0.4 0. -z• Equipment
Other 0.1 0.4
Total 0.25/0.5 0.6 2.0 0.2*
* Market expansion effects
1hese findings were supported in a theoretical model that
analyzes the tradeoffs between market enlargement,
1.3
0.5
0.7
0.7
3.2
Dynamic
0.3*
0.2*
0.5*

- 356 -
-24-
economies of scale and priee elasticity and the likely
equilibrium that would result in terms of industry structure.
Nevertheless, the positive results so far should not hide
further stumbling blocks to integration. It seems that
national industry objectives and differentiated standards
will continue to play a role for a time to come. The full
fruits of integration can only take place, if sorne common
agreement between the governments concerned can accompany
this restructuring, for example, about where centers of R&D
and the relevant national technology base ought to be located
(as in the case of the Airbus Consortium), etc.
4. Other Points
The major effects of completing the European market in
teleco~munications equipment ought not to be seen just in the
industry itself, but also in the users of these products,
that means telecommunication network operators and the users
of their services:
The more efficient and the more flexible and versatile
such services can be provided, the greater will be the
productive benefits at the higher levels of production.
The more competitive and the more flexible the
interlinkage between demand for old and new services and
equipment suppliers can be made, the faster the process
of innovation, the quicker the benefits of the
technology potential inherent in modern
telecommunication equipment can be passed on to the
economy as a whole.
Obviously, the effects of more innovative network provision
are significantly related to the benefits of more efficiently
organized input markets. But telecoms equipment is only one
of the inputs: labor, buildings and land are others, for
which preferential "purchasing" or payment criteria often

- 357 -
-25-
play a role as well, leading to aditional sources of cost
inflation. An analysis of the increased efficiency potential
in this sector must therefore also see to what extent savings
in the ether input markets are possible and how they can be
realized and activated. The result would be not only to
reduce the production cost of a key input into the economy,
but also to free resources for ether, more productive uses.
Opening up an effective internal EEC market to outside
suppliers also implies something about the degree of
international specialization to be realized. Those markets
that have already opened their telecommunications equipment
sector to outside competition (such as the U.S. and to sorne
extent the UK) have found that in the less sophisticated
product markets, for example in simple telephone sets and key
telephones, Far Eastern suppliers have a definite cost
advantage and have therefore gained important market shares.
Is this result also to be expected with the completion of the
internal market? If there was no suitable transition period
and the domestic suppliers were not adequately prepared, such
a scenario ii certainly likely. But our interview evidence
also suggests that already now assembly costs for these types
of product tend to be very low (below 10 percent of f.o.b.
priee). As a consequence, there is little reason to assume
that even for those products a fully rationalized production
system cannet be set up within the Community, which can
compete effectively with low-cost suppliers form the Far East
in order to maintain a significant EEC presence in these
markets as well.
5. Conclusion
In summing up we find significant savings as a result of
moving towards the completion of the European Cornmunity in
telecoms equipment. The reasons are insufficient exploitation
of scale and specialization economies as a result of limited
national markets and the insufficient competitive pressure
- 358 -
-26-
because of protective procurement policies. Trade is also
hampered by insufficient standardization and excessive
certification requirements in the CPE market. In all telecom
applications, the geographical enlargement of the
telecommunications equipment market would have important
consequences. To move from a national regulatory framework to
at least an EEC-wide regulation would help to exploit sorne of
this potential as it creates right away a larger unified
market. As a result a number of marginal applications will
come into the realm of profitability, allowing further
experimentation with technology and demand.
For this reason the issue of the unified European market in
telecommunications equipment must not be seen as a threat but
rather as a potential. The potential lies not only in
increasing the available market area and therefore making
certain applications profitable, which otherwise would have
to be foregone, but it also stimulates the competitive
pressure at each of the different levels of equipment
production and utilization. Increased competitiveness means
painful restructuring for sorne, but it also means lower
priees and an increased application potential for ethers with
important demand expanding effects. Furthermore, since
telecommunications equiprnent is to a large extent an
intermediate input, these competitive effects will be felt
throughout the Community by creating a larger and wider
activity of application. "The relevant geographie markets"
would be extended so that regionally or nationally
concentrated markets may become more competitive within a
more international framework. The benfits of this are
obvious. It seems therefore worthwhile to take on sorne of the
current restructuring costs which are necessary to get there
not only for component and product suppliers but also for the
network providers and their staff.

- 359 -
11.
The EC 92 Automobile Sector
Ludvigsen Associates Limited


P150
LUDVIGSEN ASSOCIATES LIMITED
ros/ ro6 NEw BoND STREET LoNDON wrY 9LG GBBAT BRITAIN TELEPHONE ( 01) 493 7711 TELEX .161376 LOFBND G FACSIMILB ( 01) 491 8997
Report to the Commission of the European Communities
THE EC92 AUTOMOBILE SECTOR
EXECUTIVE SUMMARY
Ludvigsen Associates Limited March 1988
RIIGISTI!RBD OPFrca: 18 GIUINVWJI STUBT, ST Hmnut,JBRSBY, CHANNBL ISLANDS VAT llBGISTRATION NUMBBR .MI4l38 83


- 363 -
I.
II.
III.
IV.
v.
VI.
VII.
THE EC92 AUTOMOBILE SECTOR
EXECUTIVE SUMMARY
CONTENTS
OBJECTIVE AND WORKPLAN
BACKGROUND STUDIES AND EC92 PARAMETERS
A. US Internal Market Characteristics B. Existing Internal Barriers C. Project Parameters for EC92
DIMENSIONS AND CHARACTERISTICS OF THE EUROPEAN MOTOR INDUSTRY
A. Industry Economie Volume B. Trade Flows
DESIGN AND ENGINEERING COSTS AND SAVINGS
AUTOMOBILE PRODUCTION SCALE ECONOMY
A. Vehicle Cost Structure B. Analysis of Production by Platforms C. Auto Production Economies of Scale
DIRECT/DEFERRED EFFECTS OF EC92
DYNAMIC EFFECTS OF EC92
ANNEXE I
SUMMARY OF QUANTITATIVE RESULTS
Page
1
2
2 3 4
6
6 8
9
11
11 14 16
21
28
395
395


- 365 - THE EC92 AUTOMOBILE SECTOR: EXECUTIVE SUMMARY Page 1
I. OBJECTIVE AND WORKPLAN
A. OBJECTIVE
The objective of the work undertaken by Ludvigsen Associates Limited (LAL) under contract to the Commission of the European Communities is the identification and quantification of the economie benefits that will accrue to the EC automobile industry and to its customers through the removal of the fiscal, physical and technical internal barriers that now divide the Community's Member States.
The pro ject has the aim of 'assessing the specifie costs imposed on the Community automotive industries as indeed on consumers as a result of the currently fragmented nature of the EC automobile market.' The sector studied is defined as including the design and manufacture of volume-produced passenger cars in the European Community, the sale of such EC-built cars abroad, and the sale within the Community of passenger cars from all sources.
The principal focus of the work is on two phases of auto industry activity: design and engineering, and manufacturing and assembly. These were selected in consultation with the Commission as having the potential to make important contributions to the benfit of EC92, especially in the area of scale economies, and also because they are of continuing interest and value to the Community and the Commission.
Also referenced in the project are selected findings from a Preliminary Study that LAL conducted under contract to the Commission from January to April 1987. This encompassed a comprehensive search of the existing knowledge on the cost of Non-Europe in the auto industry. In parallel LAL carried out a study of the principal influences on the evolution of the open internal market in automobiles in the United States. A summary of the findings is provided in Section II.A.
B. WORKPLAN
The main elements of the workplan are reported upon in this Summary in the Sections indicated. They are as follows:
A. A programme of questionnaires and interviewing of auto manufacturers and suppliers to ensure that the findings are current and in conformity with industry practice. The results are summarised in Sections II and IV.
B. Determination of the overall economie dimensions and constitution of the sector i~ the Community in the study base year 1985. Findings are reported in Section III.
C. Specifie study of the design and engineering costs in the industry, reported and analysed in Section IV.
D. Research into the cost structure and the economies of scale of the production of components and assembly of cars in the EC industry, as described in Section V.
E. Computation in cost and priee terms of the immediate direct effects, deferred direct effects and indirect dynamic effects of the changes caused by the postulated EC92 conditions, reported in Sections VI and VII.

- 366 -THE EC92 AUTOMOBILE SECTOR: EXECUTIVE SUMMARY Page 2
II. BACKGROUND STUDIES AND EC92 PARAMETERS
As background elements to the present study this section provides reports on three aspects of the work: a summary of the findings of the US market investigation carried out in the Preliminary Study, an overview of the types of barriers experienced in EC85 by the auto industry, and the parameters for EC92 that have been used in the conduct of this study.
A. US INTERNAL MARKET CHARACTERISTICS
The United States automobile industry distributes its products today in essentially the same open integrated market that the industry entered when it was founded at the beginning of the 20th Century. For its first thirty years the American motor industry had the benefit of a laissez-faire attitude on the part of the expansionist federal government.
Federal regulation was impose? on t;he USA motor industry concerning certain of its business, marketing and· labour practices during the Great Depression. The industry adapted successfully to these, and indeed was able to turn sorne of those regulations to its advantage. For example, it secured the suppression of internal technical barriers when state vehicle design laws were essentially superseded by the introduction of federal motor vehicle safety regulations.
The USA motor industry experienced a substantial technical disruption of its national market as a result of the adoption of emissions control. This occurred as a consequence of the state of California's success in convincing the federal government that for specifie health reasons it should be allowed to have stricter exhaust rules than the federallyestablished standards of the other states. Subsequently the values of the standards have converged and the technical requirements across the nation have become similar.
It has been evident from the study that the provision of the USA Constitution giving the federal government the power 'to regula te commerce ••• among the sever al states' has played a key role in ensuring the maintenance of an open internal American market, especially as that provision has since been interpreted and extended by the courts.
Also important, according to the study, is the ease with which a company in one American state can register to d<;> business in other states. This facilitated the evolution of enterprises that thought and acted in national terms.
The USA study has shown that an open internal market is effectively maintained although the states retain significant legal and economie powers. These include the power to impose taxes on businesses and individuals resident in the state in order to pay for those services that the state renders. The states impose taxes in significantly different ways, including sales taxes that range from nought to 7 percent and vehicle use taxes that are based on differing criteria.

- 367 -THE EC92 AUTOMOBILE SECTOR: EXECUTIVE SUMMARY Page 3
The ability of Americans to think and act in national terms has been enhanced by excellent low-cost communications. This has included the rail system, an efficient national telephone system, an integrated highway network, and a competitive deregulated airline system. Without this infrastructure the establishment and operation of national networks of design, production and sales would have been much more difficult in all industries, including the motor industry.
In the USA the trend of legislation has led to a relatively balanced relationship between the manufacturer and the dealer in the auto franchise system. This has given more freedom to the dealers, and less power to the car makers and importers, than is generally granted in Europe.
Best viewed as a form of modified selective distribution, the relationship between maker and dealer in the USA is such that a highly competitive open market exists for both new and used cars that of fers the consumer a very wide choice. The Federal Trade Commission is active at the national level to ensure the maintenance of that freedom of choice.
B. EXISTING INTERNAL BARRIERS
As a consequence of the substantial extent to which it is an integral part of the lives of all the citizens of the Member States, the automobile industry is presently affected by a very broad spectrum of internal Community barriers. These barriers were defined and researched as part of the Preliminary Study and the current project to provide a basis for the work and a reference to the assumptions on which it is founded.
LAL' s researches undertaken among Community auto industry suppliers and manufacturers provided detailed information on many internal barriers in the three categories that are dealt with in the Commission White Paper on the internal market: fiscal, physical and technical barriers. In this Executive Summary sorne specifie barriers are indicated in selective outline form according to those categories, as follows:
1. Fiscal Barriers
* Taxation levels on car sales that differ in virtually all of the EC Member States, from 12 percent in Luxembourg to 200+ percent in Denmark and Greece.
* Policies on the refunding of VAT for company purchases of vehicles that differ from country to country.
* Maintenance by sorne Member States of priee regulations and/or margin controls.
* Distortion of competitive conditions by excessive aid to 'national champion' producers in the form of Member State grants, loans, equity injections and debt writeoffs.
* Inconsistent application of standards for imposition of annual use taxes on cars, and differing tax levels.
* Use of fiscal incentives in sorne Member States (West Germany, Netherlands) to encourage sales of vehicles built to differing emissions and noise standards.
* Inconsistent levels of taxes on motor fuels.

- 368 - THE EC92 AUTOMOBILE SECTOR: EXECUTIVE SUMMARY Page 4
2. Physical Barriers
*
* *
*
Border crossing documentary and inspection requirements, with attendant delays having consequences in the loss of time and money in the shipping of components and vehicles. Customs and immigration checks on persona! movements within the Community. High cost of regulated air travel within the Community, imposing an implicit physical barrier on the volume of travel for business purposes. Differences in communications standards between Member States that present physical barriers to cooperation in vehicle development and production.
3. Technical Barriers
* Lack of a single EC-wide Type Approval procedure, requiring costly and time-consuming duplication of cars and tests.
* Exhaust emissions standards which are not definitively fixed at a common leve! with agreed dates for implementation.
* Unique national vehicle equipment requirements such as side repeater flasher lights in Italy, reclining driver's seat in West Germany, dim-dip lighting in the UK, yellow headlamp bulbs in France and unique rear reflectors in West Germany.
* Maximum speed test required for sorne but noy all Member States (West Germany, Italy, Spain).
C. PROJECT PARAMETERS FOR EC92
To provide a basis for study, LAL drew upon the research findings to set the assumptions and parameters for the work; these are published in full in the Final Report. The intent in this Executive Summary is to provide highlights of those key points which have had a significant effect upon the findings. They include as well sorne of the project assumptions concerning events that will occur as a consequence of EC92. The summary highlights are as follows:
The EC negotiates agreements and understandings with its global trade partners as an unified entity. These unified external trade policies are arrived at so that national restraints, regulations, agreements and understandings on auto imports may be phased out progressively. The leve! of local content that qualifies an automobile to be considered EC-produced is assumed to be 70 percent of the factory cost by value (project assumption).
A new regime permits EC-wide business operations by a single corporate entity. EC member governments cease providing extraordinary aid to 'national champions'. National and local aid to enterprises is still permitted, but brought by EC actions within ranges that do not threaten to distort trade. Competition policies and activities in the Community are strengthened and refined to ensure that EC92 does not lead to the formation of monopolies that will tend to defeat the achievement of higher scale efficiencies.

-369 -THE EC92 AUTOMOBILE SECTOR: EXECUTIVE SUMMARY Page 5
Unilateral use of priee controls by Member States is suppressed by legislative actions taken by Community members in response to requirements of internal market completion. VAT applicable to the sale of autos is approximated at levels ranging from 14 percent to 20 percent. The application of VAT on the sale of used cars is harmonised.
Vehicle use taxes are approximated by the EC at a level which does not distort trade. An EC action achieves harmonisation of taxes on motor fuel throughout the Community at levels per 1, 000 litres of 340 Ecu for leaded petrel, 310 Ecu for unleaded petrel, 17 7 Ecu for diesel fuel and 85 Ecu for liquid petroleum gas (project assumption).
Future technical regulations directly affecting the design of autos are phased in simultaneously by all EC Member States, with adequate lead time, at values agreed either unanimously or by majority under the Single European Act.
Testing and certification standards and procedures for automobiles to be sold in the Community take effect EC-wide and permit EC Type Approval to be achieved through a single national application. Tests and standards for acceptability of replacement parts are harmonised among Member States.
Flexibility of use of hire purchase of automobiles is enhanced throughout the Community by EC measures taken to liberalise competition in services. Liability insurance requirements are consistent among Member States. Procedures for registering in one Member State a vehicle purchased in another are made routine, as are terms for temporary vehicle use in ether than the state of registration.
Research and development activities take place using technical standards and communications that are common to all the EC industry suppliers and manufacturers. Standards are agreed and implemented throughout the Community, among the assemblers and suppliers, for the CAD systems that are used in the design and engineering of vehicles and parts. Manufacturers and their suppliers reach agreement on a protocol for the coordination of in-factory electronics throughout EC vehicle production plants.
Car marketing patterns in Community countries shift under the influence of the new tax regimes and the phasing out of internal market limitations on third-country BU imports·. Vehicle makers and distributors exert central control qf their sales and marketing for all of the Community from a single headquarters.
Parts distribution is streamlined and centrally controlled. All dealer training activities, including service trarning, are conducted on a pan-European basis. Vehicle makers provide a Eurowarranty, fully valid at all their EC dealers.

- 370 -THE EC92 AUTOMOBILE SECTOR: EXECUTIVE SUMMARY
III. DIMENSIONS AND CHARACTERISTICS OF THE EUROPEAN MOTOR INDUSTRY
Page 6
Broadly EC auto manufacturers account for in excess of 85 percent of registrations in their home market. In 1985 Europe was the world's second-largest car market, and by 1986 it had overtaken the USA to become the largest single market. In 1985 the EC manufacturers accounted for 37 percent of world passenger car production.
While the EC car and component manufacturers have shed significant amounts of labour in recent years to gain competitiveness, they still directly employ in excess of 1.7 million people across the Community. The EC motor industry absorbs between 5 and 8 percent of all industrial output and accounts for approximately 20 percent of production of steel and machine tools, 15 percent of rubber production and 5 percent of all glass output.
A. INDUSTRY ECONOMIC VOLUME
In view of the very substantial economie role on the part of the EC auto industry, it was judged necessary to make a fresh determination of the industry's dimensions in the study base year of 1985, the most recent for which adequate EC-wide data are available. An analysis was conducted to determine the retail value of the car markets in Europe, net and gross of tax, and the retail value of car and car component production in the various producing countries.
The findings of the analysis are summarised in separate tables for cars and components. One shows the volumes of cars produced (Table 1). Another defines the total value of this production in billions of Ecu for both retail and wholesale markets (Table 2). Another table defines the value in billions of Ecu of European component production, showing also the value of components used for national production (Table 3).
Table 1: AUTOMOBILE VOLUMES (1985)
Units: millions PRODUCTION % SALES % VARIANCE
Germany 4.17 35.9 2.38 24.9 1.79 France 2.63 22.6 1.77 18.5 0.86 Ital y 1.39 11.9 1.75 18.3 (0.36) Spain 1.23 10.6 0.56 5.9 0.67 UK 1.05 9.0 1.83 19.1 (0.78) Belgium 0.99 8.5 0.39 4.1 0.60 Netherlands 0.11 1.0 0.49 5.1 (0.38) Portugal 0.06 0.5 0.10 1.0 (0.04) Denmark 0.00 0.0 0.16 1.7 (0.16) Gree ce 0.00 0.0 0.08 0.8 (0.08) Eire o.oo 0.0 0.06 0.6 (0.06)
Total 11.63 100 9.57 100 2.06
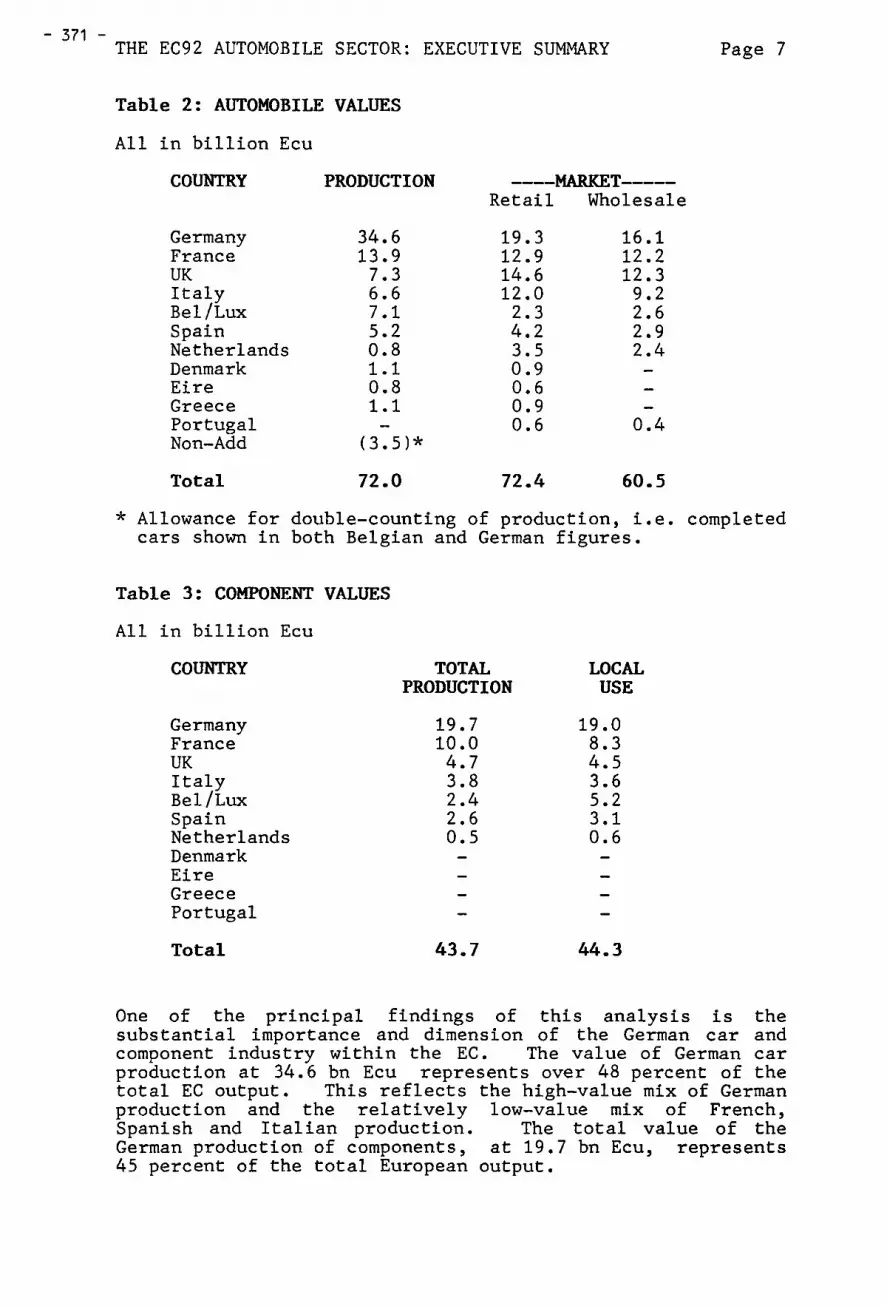
- 371 -THE EC92 AUTOMOBILE SECTOR: EXECUTIVE SUMMARY Page 7
Table 2: AUTOMOBILE VALUES
All in billion Ecu
COUNTRY PRODUCTION ----MARKET-----Retail Wholesale
Germany 34.6 19.3 16.1 France 13.9 12.9 12.2 UK 7.3 14.6 12.3 Ital y 6.6 12.0 9.2 Bel/Lux 7.1 2.3 2.6 Spain 5.2 4.2 2.9 Netherlands 0.8 3.5 2.4 Denmark 1.1 0.9 Eire 0.8 0.6 Greece 1.1 0.9 Portugal 0.6 0.4 Non-Add (3.5)*
Total 72.0 72.4 60.5
* Allowance for double-counting of production, i.e. completed cars shawn in bath Belgian and German figures.
Table 3: COMPONENT VALUES
All in billion Ecu
COUNTRY TOTAL LOCAL PRODUCTION USE
Germany 19.7 19.0 France 10.0 8.3 UK 4.7 4.5 Ital y 3.8 3.6 Bel/Lux 2.4 5.2 Spain 2.6 3.1 Netherlands 0.5 0.6 Denmark Eire Greece Portugal
Total 43.7 44.3
One of the principal findings of this analysis is the substantial importance and dimension of the German car and component industry within the EC. The value of German car production at 34.6 bn Ecu represents over 48 percent of the total EC output. This reflects the high-value mix of German production and the relatively law-value mix of French, Spanish and Italian production. The total value of the German production of components, at 19.7 bn Ecu, represents 45 percent of the total European output.

- 372 -THE EC92 AUTOMOBILE SECTOR: EXECUTIVE SUMMARY Page 8
The production values of the French car and component industries are also of sign1ficant size at 13.9 bn Ecu and 10.0 bn Ecü, representing 19.3 percent and 22.9 percent of their respective EC markets.
B. TRADE FLOWS
In 1985 the EC manufacturers exported 2. 01 million cars to external markets worth 19.1 billion Ecu. The major markets for these were the EFTA countries with 0.69 million, closely followed by the USA with 0. 64 million vehicles. The EC countries imported 1.1 million cars worth 5.41 billion Ecu. The major exporter to the EC was Japan with 0.8 million cars.
The graphs below show that the dominance of Germany in production/sales terms was also reflected in 1985 in terms of both intra- and extra-EC trade. The high value mix of German cars is especially marked in terms of extra-EC experts, in which Germany accounts for 67 percent by value of total EC experts.
Figure 1
Figure 2
1500
1000
500
0
-500
-1000
1500
1000
TRADE FLOWS AND BALANCES INTRA EEC (CARS OOO's)
00~~ ....l:br ~~~ :li: :.:: ..... .... >- .....
~ Vl -' z ~ ::> ~
0: u z: u 0 ~ ~ G:i ~ <{ .... z: ;:)
(3 :::0 :::0 lo.J t:: ~ ë.. Vl -' z 0: a:: ..... .... LI.. LIJ Cl 2:: a::l 0 Cl
TRADE FLOWS AND BALANCES EXTRA EEC (CARS OOO's)
500 ~ ~
orn__~--"bM
-500 :li: :.:: ..... ..... >- .....
~ Vl -' z :..: ::> ~ 0: (..) z: u 0 iS <
~ G:i ~ <{ .... z: :::)
:::0 :::0 lo.J t:: 5 D.. D.. Vl ..... z a:: a::
a::l ..... LI.. LIJ Cl 2: 0 Cl
~ EXPORTS
~ IMPORTS
!Zj BALANCE
~ EXPORTS
~ IMPORTS
!Zj BALANCE
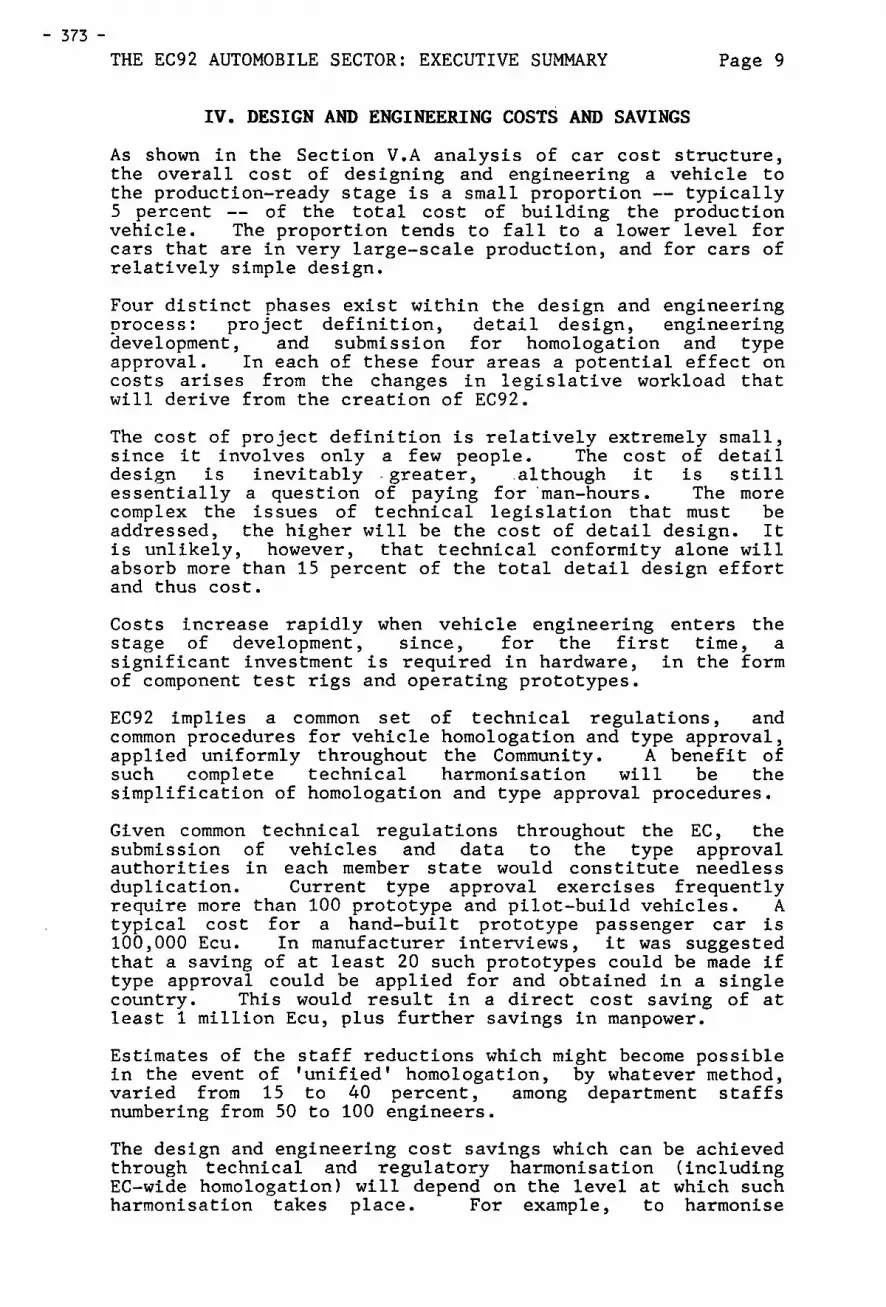
- 373 -
THE EC92 AUTOMOBILE SECTOR: EXECUTIVE SUMMARY Page 9
IV. DESIGN AND ENGINEERING COSTS AND SAVINGS
As shown in the Section V.A analysis of car cost structure, the overall cost of designing and engineering a vehicle to the production-ready stage is a small proportion -- typically 5 percent -- of the total cost of building the production vehicle. The proportion tends to fall to a lower level for cars that are in very large-scale production, and for cars of relatively simple design.
Four distinct phases exist within the design and engineering process: project definition, detail design, engineering development, and submission for homologation and type approval. In each of these four areas a potential effect on costs arises from the changes in legislative workload that will derive from the creation of EC92.
The cost of project definition is relatively extremely small, since it involves only a few people. The cost of detail design is inevitably -greater, .although it is still essentially a question of paying for ·man-hours. The more complex the issues of technical legislation that must be addressed, the higher will be the cost of detail design. It is unlikely, however, that technical conformity alone will absorb more than 15 percent of the total detail design effort and thus cost.
Costs increase rapidly when vehicle engineering enters the stage of development, since, for the first time, a significant investment is required in hardware, in the form of component test rigs and operating prototypes.
EC92 implies a common set of technical regulations, and common procedures for vehicle homologation and type approval, applied uniformly throughout the Community. A benefit of such complete technical harmonisation will be the simplification of homologation and type approval procedures.
Given common technical regulations throughout the EC, the submission of vehicles and data to the type approval authorities in each member state would constitute needless duplication. Current type approval exercises frequently require more than 100 prototype and pilot-build vehicles. A typical cost for a hand-built prototype passenger car is 100,000 Ecu. In manufacturer interviews, it was suggested that a saving of at least 20 such prototypes could be made if type approval could be applied for and obtained in a single country. This would result in a direct cost saving of at least 1 million Ecu, plus further savings in manpower.
Estimates of the staff reductions which might become possible in the event of 'unified' homologation, by whatever method, varied from 15 to 40 percent, among department staffs numbering from 50 to 100 engineers.
The design and engineering cost savings which can be achieved through technical and regulatory harmonisation (including EC-wide homologation) will depend on the level at which such harmonisation takes place. For example, to harmonise

- 374 - THE EC92 AUTOMOBILE SECTOR: EXECUTIVE SUMMARY Page 10
Community technical requirements on the basis of a 'highest common factor' which includes all current national requirements (ether than those which are mutually exclusive) would increase car unit costs by 2 to 5 percent, according to manufacturer interviews. The cost impact would be relatively the highest on the smallest, simplest and cheapest cars.
The larger proportion of the added cost in this case -- as for the car production process as a whole would be accounted for by the higher direct cost of purchasing the extra components needed. According to the interviews, an added cost would also be generated by the need to design and engineer all the elements of every car model to the 'highest common factor' of Community standards. Such cost increases would, however, be offset in whole or in part by savings achieved through simplified homologation and type approval procedures.
Investigation of the design and engineering cost aspects has shown several ways in which EC92 can contribute to savings in this area. EC harmonisation to encourage design cost reduction could proceed along two principal lines, as follows:
One line would be a move toward harmonisation of the national technical 'break points' in fiscal regulations. At present, design and engineering (and production) efforts are forced to be divided among too many specialised car versions by the many 'break points' created by different national fiscal approaches to car purchase and ownership taken by EC member states. A more nearly harmonised fiscal approach could substantially reduce the design and engineering load on the major EC car producers, permitting a smaller number of variants to be engineered to higher standards.
A second line of action suggested by the design and engineering interviews should be in the removal of fiscal and customs barriers, to ease the process by which car manufacturers could exchange common components across internal European borders. This is part of the study findings relating to variable cost savings; it is seen as having a potential for engineering cost reduction as well.
This section of the study showed opportunities for design and engineering cost savings in EC92, as well as certain possible offsetting cost increases. The net effect of the savings is estimated to be 10 percent of the design and engineering cost, or 0.5 percent of the vehicle cost. This saving is incorporated in the calculations in Section V.C.
It should also be noted here that LAL assumes in this study that the EC car industry will reinvest part of the savings achieved in EC92 in more active advanced R&D to keep European cars at the forefront of world technological trends. The amount and disposition of this reinvestment, assumed to be one percent of costs, is addressed in Section VI.!.

- 375 -THE EC92 AUTOMOBILE SECTOR: EXECUTIVE SUMMARY Page 11
V. AUTOMOBILE PRODUCTION SCALE ECONOMY
The research and analysis undertaken in this project have shown relatively few instances of immediate direct effects of the implementation of EC92 that are unique and distinctive to the auto industry. The removal of border controls, for example, will reduce transportation costs, an effect which is generic to EC industry as a whole and which, as such, is covered by separate Commission research.
The principal auto industry effects are those which will be delayed in their implementation, because they will only be realised after the industry has taken actions that the improved internal market conditions will facilitate.
Important cost reductions are expected from the improvements in production economies of scale that will occur when EC92 conditions permit more extensive transborder interpenetration of individual parts, components and assemblies, and built-up vehicles. The levels of scale efficiency achieved in the industries of the USA and Japan have been referred to in this work, as have the best levels currently achieved in Europe.
In this section of the Executive Summary the topic of production scale economies is addressed in three elements. The first element (Section V.A) establishes the segments being studied and the variable and fixed costs of a typical car in each segment. It also discusses the research and findings that show the variations in cost with changing production volume that occur in the making of these cars.
In the second element (Section V. B), the concept of car platforms is introduced as a means of analysing the differences between the annual production volumes of EC85 and EC92. The findings of the platform study and the cost variations are combined in the third element (Section V.C), together with the engineering findings and other fixed cost considerations, to show the overall savings achieved in EC92.
A. VEHICLE COST STRUCTURE
The essential linkage in the production cost element of the study between the cost of components and the economies of scale that are achievable with built-up vehicles is the factory cost structure of the vehicle itself. Because the distribution of passenger car costs differs significantly according to the size and category of the vehicle, separate structures were evolved to suit the five main volume segments for cars that are made and marketed in Europe. The segments, and typical vehicles in each of them, are as follows:
Lower Upper Utility Small Mediwn Mediwn Large
Panda VW Polo VW Golf Peugeot GM Omega Renault 4 Fiesta Escort 405 Renault 25 Cit. 2CV Renault 5 Fiat Ritmo Sierra Fiat Croma

- 376 -
THE EC92 AUTOMOBILE SECTOR: EXECUTIVE SUMMARY Page 12
The total cost structure is divided into variable cost and fixed cost elements. These are discussed in the following sections of this Executive Summary.
1. Variable Costs
The variable cost benefit of EC92 at the supplier level was researched and analysed by means of two parallel programmes. One programme consisted of a direct sourcing and pricing activity, gathering data on priee/volume relationships of a comprehensive menu of parts used in automobiles. The ether programme made use of structured interviews of component producers to gain insight into their actions and attitudes.
a. Component Cost Research and Analysis
A professional automotive component purchasing organisation was engaged to contact European suppliers to obtain priee quetes on the supply of their products at annual volumes of 50,000, 100,000, 200,000, 300,000, 500,000 and 1,000,000 car sets. Approximately ninety items were selected for this research, as being representative of the range of components and sub-assemblies found in European cars.
A study finding was that the incremental volumes used for the research appear, at the high end of the volume scale, to represent the maximum potential output per component now prevailing in Europe. The European supply industry was found to be not tooled or equipped to provide many of the major components at rates beyond levels of 500,000 sets per annum.
An immediate impetus toward greater volume would be generated if car makers were to curtail the practise of awarding the supply of a single part or assembly to several suppliers. The research shows, however, a continuing reluctance among EC auto makers to source major componentry from a sole supplier.
b. Car Variable Cost Structure and Volume Variation
For the purpose of this research the variable cost element of a car has been divided into seven categories, using groupings that are in accord with motor industry practise. The categories are power train, body in white, electrical, chassis, interior, exterior, and paint and assembly.
Although a strict definition would include indirect labour as an element of fixed cost, a necessary simplification has been the decision to show all labour as an element of variable cost. Thus labour is included in the variable cost of producing each group of components shown, with the exception of the separate paint and assembly category.
Making use of industry data and research findings, as detailed in the full report, a base variable cost structure for each of the five segments was established. This is shown in tabular form (Table 4).

- 377 -THE EC92 AUTOMOBILE SECTOR: EXECUTIVE SUMMARY Page 13
Table 4
UNIT VARIABLE COST STRUCTURES IN FIVE EUROPEAN SEGMENTS
Variable Cost Element Utility Small Lower Upper Large (Status: Ecu 1985) Med. Med.
Engine and Transmission 575 715 810 1040 1550 Electrical 130 225 450 680 1160 Chas sis 355 540 855 1040 1545 Interi01:· 250 370 610 835 1235 Exterior 70 110 205 315 465 Body in White t+LL5 535 550 730 925 Paint and Assembly 255 340 485 575 850
Total Variable Cost 2080 2835 3965 5215 7730
From the base costs, the component cast/volume data researched and oth~r industry data have been employed to obtain a view of the typical overall scale volume effects on the costs of volume-produced passenger cars in each of the five study segments. The changes in the variable costs in each segment that occur with changing annual volume are shawn in graphical form (Figure 3).
Figure 3
, 1 1 CHANGé OF VARIABLE COST WITH VOLUME ! S-t--~ '-t---+--t----+---t--- TYPICAL EUROPEAN PLATFORMS rT ~~ r-- l IN FIVE SEG~~ENTS 1
71-t·--t=l ==tl====t=l =-t-1 +==t===i=~~LARG~~ =±+
l ~-~--, t-·1·---+-! --+-,1 ----i--1 -·~-~.___t-l L~-~ --+ 1 1 1 i' -~:J 1 ··1 -~ 1 ! 1 "'T"~ . ~ 4t---t---=t====f===1----t====f====F===~~L~O~WE~R~M~ED~IU~M~
"~ 1 1
31---~~=f==~~=4==+==~~=11-GMALL
2 -· '-_ '- - 1 1 l_UT'Lil ~-1 ""--T--+----+---r--1 ---+1_....,._[ _1 _____ 1 ___ l _..1___,__/
50 100 200 300 400 500 1000
ANNUAL VOLUME (1000)
2. Fixed Costs
Again follmving EC auto industry practise, the fixed costs associated wi th car production have be en researched unàer seven categories, as follows: tooling, engineering, warranty, marketing, sel ling, administration and other fixed costs. Base typical fixed costs for the five EC car segments have been established, and are shawn in tabular form (Table 5).

- 378 -THE EC92 AUTOMOBILE SECTOR: EXECUTIVE SUMMARY Page 14
Table 5
UNIT FIXED COST STRUCTURES IN FIVE EUROPEAN SEGMENTS
Fixed Cost Element Utility Small Lower Upper Large (Status: Ecu 1985} Med. Med.
Tooling 265 3SO 30S 580 680 Engineering 160 210 27S 360 sos Warranty 90 135 175 26S 355 Marketing, Selling, 65S 680 710 75S 830 Administration, Other
Total Fixed Cost 1170 1375 1465 1960 2370
B. ANALYSIS OF PRODUCTION BY PLATFORMS
1. Platform Survey
The vehicle platform was selected as the basic analysis parameter for the study of vehicle variable costs. An unique 'platform' is defined by the motor industry as a single vehicle floorpan design to which common components are attached in the areas of running gear, suspension, and steering. With relatively minor changes, the floorpan may be varied in length without departing from the concept of an unique platform.
It was determined during the research that the analysis of car production according to platforms offers the only method that provides a direct correlation with the data obtained on the cost/volume relationships of car components. In principle, the most tooling-intensive parts of a platform are common to it and to the vehicles built on it. Thus in theory all the mechanical parts of a platform will be alike in all the car models it carries, making component volume equal to platform volume. This provides a direct and clear relationship that is not possible with the study of either marque or model output.
In this phase of the work the base-year 198S European market was analysed in terms of the typical number of platforms produced in each segment and the number of car production facilities that are required to reach the total industry volume. This aspect of the platform analysis is detailed in full in the Final Report.
An EC85 basis for comparison with EC92 conditions was obtained by selecting platform volumes achieved by the typical car models that prevail in each segment, and ad jus ting for non-typical volume factors. The selected method has generated platform numbers and volumes that are taken for the purposes of this study as being representative of industry practise in EC85 (Table 6}.

- 379 -THE EC92 AUTOMOBILE SECTOR: EXECUTIVE SUMMARY Page 15
Table 6
EC85 PLATFORM PRODUCTION VOLUMES BY SEGMENT
Segment Number of Volume Total Platforms Per Platform Production
Utility 3 110,000 330,000 Small 6 440,000 2,640,000 Lower Medium 6 525,000 3,150,000 Upper Medium 6 315,000 1,890,000 Large A 6 140,000 840,000 Large B 3 70,000 210,000
Total 30 9,060,000
2. Factors Affecting Changes in Platform Production Volumes in EC92
In the preceding section, analysis has been conducted of EC85 platform production volumes by segment and typical platform production volumes in EC85. In EC92 the European platforms will be produced according to a different pattern, as a consequence of two main factors: sharing of platforms between makers, and strong specialisation in particular segments by producers.
EC92 conditions will substantially facilitate the sharing of platforms between and among makers, following trends that are already evident and that are forecast to prevail in EC92 (industry interviews). The elimination of physical barriers to joint engineering work, the establishment of common production protocols, the greater ease and lower cost of travel by engineers and executives, and the more rapid and assured movement of parts and assemblies throughout Europe will contribute to this sharing of platforms.
In addition, in EC92 conditions car and component makers will be able to implement more fully a policy of specialising in particular product segments to gain longer annual production runs and hence higher manufacturing efficiency. Such trends are already evident among EC car producers in vehicles such as the Fiat Uno in the Small segment and the VW Golf in the Lower Medium segment.
Taking into account the factors described, and extrapolating from current trends by considering the best performances being achieved by manufacturers in EC87 in the various segments, LAL has forecast the EC92 conditions for platform numbers and volumes (Table 7). To permit direct comparison with EC85 conditions in the subsequent calculations, the total production volumes for both sets of platforms are held at the same level.

- 380 -THE EC92 AUTOMOBILE SECTOR: EXECUTIVE SUMMARY Page 16
Table 7
EC92 PLATFORM PRODUCTION VOLUMES BY SEGMENT
Segment Humber of Volume Total Platforms Per Platform Production
Utility 2 160,000 320,000 Small 4 650,000 2,600,000 Lower Medium 4 800,000 3,200,000 Upper Medium 5 380,000 1,900,000 Large A 4' 220,000 880,000 Large B 2 80,000 160,000
Total 21 9,060,000
C. AUTO PRODUCTION ECONOMIES OF SCALE
This section describes the methodologies that have been employed for the analysis of the economies of scale and, subsequently, the automobile cost and priee changes that are forecast to occur in the change from EC85 to EC92 conditions.
The work described in this section is based on the assumption that no change in overall industry volume occurs in the first iteration of the effects of EC92. Volume changes in later iterations are possible according to the indirect dynamic effects experienced, described and quantified in Section VII.
1. Variable Costs
By applying the findings concerning EC92 platform volumes to the trend data established on variable costs, the total level of car variable cost under EC92 conditions has been established. The change from EC85 thus established can be attributed to the direct effects of EC92, because the overall level of Community production is assumed to remain static. Thus the identified cost savings arise from the structural changes in production for which the catalyst and prime mover is the introduction of EC92 conditions.
The cost/volume graph of variable cost (Figure 3) has been used to establish the levels of variable cost per unit that are applicable at the platform volumes postulated to prevail when EC92 conditions are in existence. The findings, detailed in tables in the full report, show that overall the change to EC92 produces a 2.36 percent reduction in aggregate variable costs, valued at 898.9 million Ecu.
2. Fixed Costs -
The selected approach to quantifying the impact of EC92 on fixed costs is to apply to the fixed cost structure the findings on platform volumes, and to establish the impact that these changes in production methods will have on overheads and fixed costs. The specifie effects of the

- 381 -THE EC92 AUTOMOBILE SECTOR: EXECUTIVE SUMMARY Page 17
projected EC92 platform changes on the fixed cost categories are outlined in the following sections on tooling costs, engineering costs, warranty and ether fixed costs.
a. Tooling Costs
The principal tooling cost savings will result from the economies of scale caused by higher platform volumes in EC92. These savings will take effect at both the component and car producer/assembler levels.
It is envisaged that the development of large basic parts suppliers capable of an arder of magnitude higher production volume will be accelerated by EC92. The economies of scale associated with this development will reduce fixed as well as variable costs.
In EC92 the automobile manufacturers will continue to produce a large number of superficially different- models, with discrete external sheet metal, while at the. same time they share more common platforms. For this study it has been assumed that approximately 50 percent of tooling costs relate to areas which can be commonised, and thus where direct economies of scale will be realised.
Table 8: TOOLING COST COMPARISON Lower Upper
Utility Small Medium Medium Large
EC85 Unit Cast (Ecu) EC92 Unit Cost (Ecu)
Total Tooling Costs
Utility Small
EC85 EC92
87,450 70,720
924,000 756,600
COST SAVING (000 Ecu)
b. Engineering
265 221
Medium
350 291
Lower Medium
305 250
960,750 1,096,200 800,000 997,500
Upper Large
580 525
714,000 585,840
680 551 (a} 631 (b}
Total
3,782,400 3,210,660
571,740
As a consequence of the move to EC92 the benefits in terms of engineering fixed cost reductions are threefold, as follows:
(1} Scale Economy Improvements
As a direct result of the reduction in the number of platforms being utilised, the fixed cost ~lement of engineering will be spread over a higher production volume per platform, bringing about economies of scale. The relevant saving will be reduced by the approximately 50 percent of the componentry of the automobile that is in those areas which will continue to be differentiated.

- 382 -THE EC92 AUTOMOBILE SECTOR: EXECUTIVE SUMMARY Page 18
(2) Component Commonisation
An indirect consequence is forecast to flow from the greater use of common components. This will occur because the actual cost of designing the automobile will fall as a 'learning curve effect' is experienced by using already tried and tested components/designs.
It may be taken from the preceding elements of this study that up to 20 percent of automobile components could be commonised. If the use of common engineering design and testing for these components yields a 2S percent saving in terms of design time/costs, the total engineering cost saving will be in the region of S percent.
(3) Staff/Overhead Savings
An element of the fixed cost of engineering which must be borne by the finished vehicle is the cost o;f retaining an in-house engineering /product maintenance department. As a result of the simplification of type approval procedures and the greater use of common components it would be reasonable to expect sorne savings in this area, as discussed in Section IV. These savings would be in the arder of O.S percent.
Table 9: ENGINEERING COST COMPARISON
Lower Upper Fixed Engineering Utility Small Medium Medium Large Cost Per Unit
EC8S (Ecu) 160 210 27S 360 sos EC92 (Ecu) 127 166 21S 311 390 (a)
447 (b) Total Fixed Engineering Cost
Lower Upper Utility Small Medium Medium Large Total
EC8S S2,800 SS4,400 866,2SO 680,400 S30,2SO 2,684,100 EC92 40,640 431,600 688,000 408,SOO 414,720 1,983,460
COST SAVING (000 Ecu) 700,640
c. Warrant~
The cost of providing warranty caver on automobiles should be reduced by the effects of the change to EC92, as a result of three factors. First, the longer annual production runs should enable the cost of any service failures to be spread more widely, resulting in a lower unit cast. Second, the use of well tried and tested common components and designs should further reduce such failures, especially during the warranty or early-life failure period of a vehicle.
Third, in EC92 the direct communication between dealer and manufacturer will remove a tier of administration in dealing with warranty claims, and also remove an added administrative

- 383 -THE EC92 AUTOMOBILE SECTOR: EXECUTIVE SUMMARY Page 19
cost on the sale of warranty parts in cases where the manufacturer deals directly instead of through a national importer. Overall warranty cost savings in the region of 10 percent could therefore be expected.
Table 10: WARRANTY COST COMPARISON Lower Upper
Warranty Utility Small Medium Medium Large per Unit
EC85 (Ecu) 90 135 175 265 355 EC92 (Ecu) 81 122 158 239 320
Total Warranty Provision Lower Upper
Utility Small Medium Medium Large Total
EC85 29,700 356,400 551,250 500,850 372,750 1,810,950 EC92 25,920 317,200 505,600 454,100 332,800 1,635,320
COST SAVING (000 Ecu) 175,330
d. Other Fixed Costs
(1) Administration and Other Overheads
At present the manufacturers indirectly finance the costs that dealers incur by holding stocks of their automobiles. This is because the national importers, which are often owned and run (albeit with a degree of autonomy) by the manufacturers, directly finance the dealers' inventory. Since the cost of finance is an overhead to be borne by productive output, any steps which· are taken to reduce these stocks and the resulting finance costs will reduce the overhead cost of producing automobiles.
If by exploiting the potential of EC92 for improved shipping and communications the manufacturers and the national importers succeed in reducing the stock inventory period in Europe by one month, the saving to the producers, in their cost of financing, could be as much as 213,333,000 Ecu.
(2) Selling and Marketing
An immediate cost reduction in sales and marketing will be a consequence of the increased interpenetration of the market by car makes and models in EC92. The model ranges offered by makers throughout the EC will differ country-by-country less than they do in EC85. This will allow increased pan-European advertising, promotion and launching of automobiles, which in turn will allow the fixed cost element of preparing the relevant promotional material to be reduced.

- 384 -THE EC92 AUTOMOBILE SECTOR: EXECUTIVE SUMMARY Page 20
It is estimated that a saving of 5 percent in the cost of advertising could be obtained by the centralisation of advertising/marketing budgets and the greater use of common material. This is expected to generate savings in the region of 42,476,000 Ecu.
Table 11: SUMMARY OF FACTORY FIXED COST SAVINGS (000 Ecu)
Tooling Engineering Warranty Provision Administration/Finance Costs Advertising
571,740 700,640 175,330 213,333 42,476
COST SAVING 1,703,519
The total saving thus achieved represents 11.5% of total factory fixed costs.
3. Non-Factory Costs/Overheads
Other costs, including those of distributing vehicles from the factory to the marketplace, have an impact on the priee at which the car is sold to the dealer and eventually to the consumer. Though not a principal focus of the study requested by the Commission, such costs require a brief review.
The principal overhead in this category is the cost of maintaining national importer organisations in the respective EC Member States. The direct business relations between manufacturer and dealer which will be stimulated by EC92 conditions will significantly reduce this cost to the manufacturer by allowing relatively slimmed-down national offices to replace national sales companies. An initial costing of the magnitude of the potential savings in this area suggests a level of 1,600 million Ecu.
Potential savings also derive from an attribute of the current delivery chain, from producer to consumer, which directly impacts upon the retail priee. Referred to is the practise of adding a company charge at each point of transfer. In addition to the variable and fixed cost savings on ex-factory costs/prices already discussed, a company cost is also incurred as part of the de li very charge from the storage compound to the customer.
In EC92 the direct communication between dealer and producer will lead to the dealer taking up functions that were previously within the domain of the national importer. This is likely to include order and payment for vehicles in advance at the factory gate and dockside collection where required. The removal of the intermediate role of the national importer will reduce this layer of cost, which under EC85 conditions has a magnitude of more than 400 million Ecu.

- 385 -THE EC92 AUTOMOBILE SECTOR: EXECUTIVE SUMMARY Page 21
VI. DIRECT/DEFERRED EFFECTS OF EC92
The findings of the project have been organised in accord with a specified EC Commission format, which provides for responses showing the effects of given topic areas in key EC countries and in the Community as a whole. The study findings reported in this section are organised according to the Commission format.
A. SHARE OF VALUE ADDED IN FINAL DEMAND
This establishes the percentage of the retail value of car and component sales within the EC and Member States that is represented by the value added by the home country producers.
Table 12 (percentages)
West Germany France Italy
31.6 21.1 20.2
UK
17.9
Other Total
4.2 20.6
The findings were determined by applying the gross value added (GVA) percentage to the retail value of production retained within each home market and comparing the resulting value to the retail value of total sales in that market.
The results applicable to low value of percentage of
show clearly that the high GVA percentage West German production, when combined with the import penetration, gives a relatively high
GVA in final demand for Germany.
B. SHARE OF VALUE OF PRODUCTION IN TOTAL DEMAND
This establishes the share of retail sales in the home market that is accounted for by home production.
Table 13 West (percentages) Germany France Ital y UK Other Total
79.5 71.2 60.2 51.2 15.8 59.1
C. SHARE OF VALUE ADDED EXPORTED
This establishes what percentage of value added is exported.
Table 14 West (percentages) Germany France Ital y UK Other Total
48.6 38.9 26.0 28.4 79.5 46.5
The findings confirm that West Germany is very exportorientated and also that the other EC producing countries, which are dominated by Belgium and Spain, produce principally for the export market. It also shows the very important role the home market plays for UK and Italian producers and thus the threat which further import penetration would pose to the home producers in these countries.
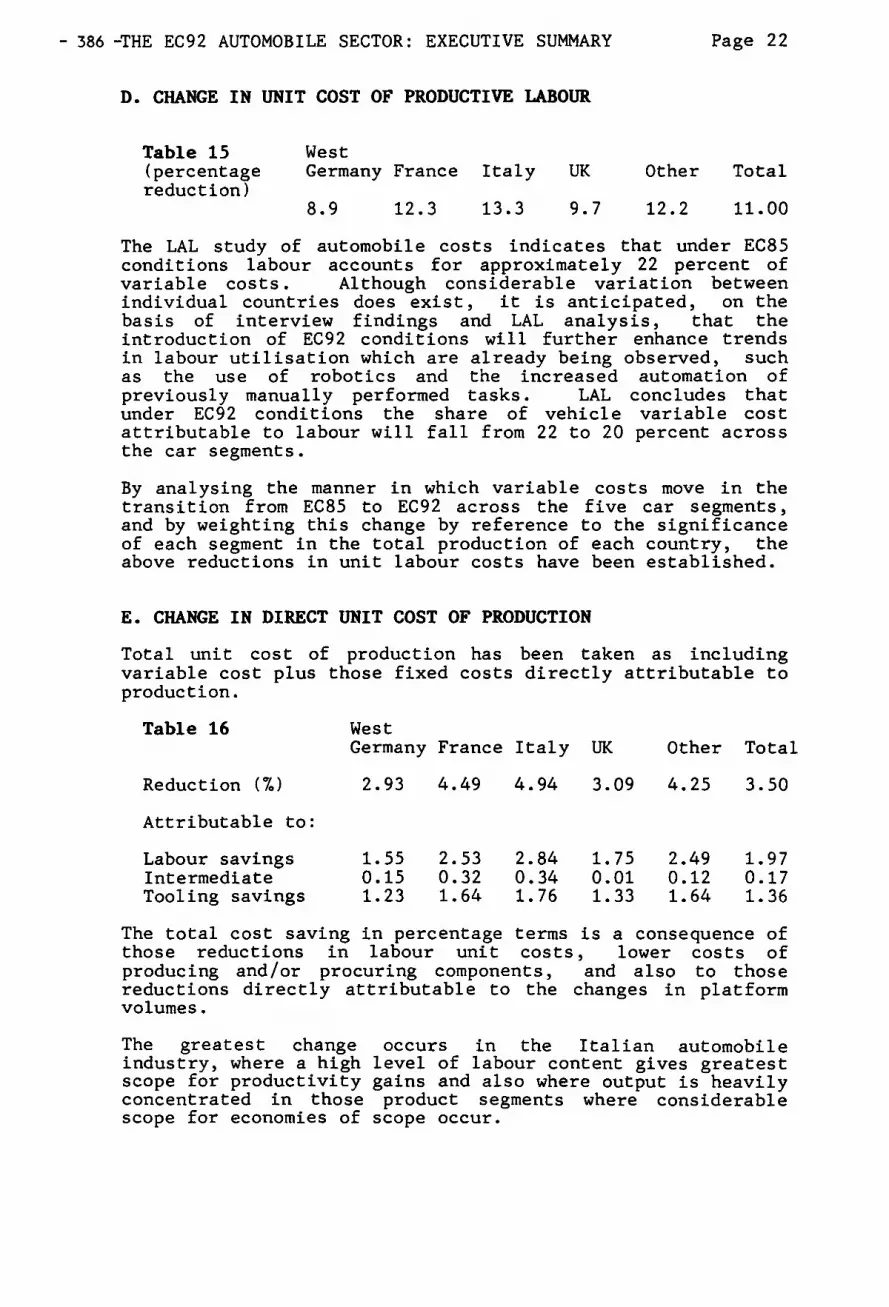
- 386 -THE EC92 AUTOMOBILE SECTOR: EXECUTIVE SUMMARY
D. CHANGE IN UNIT COST OF PRODUCTIVE LABOUR
Table 15 (percentage reduction)
West Germany France Italy
8.9 12.3 13.3
UK
9.7
Page 22
Other Total
12.2 11.00
The LAL study of automobile costs indicates that under EC85 conditions labour accounts for approximately 22 percent of variable costs. Although considerable variation between individual countries does exist, it is anticipated, on the basis of interview findings and LAL analysis, that the introduction of EC92 conditions will further enhance trends in labour utilisation which are already being observed, such as the use of robotics and the increased automation of previously manually performed tasks. LAL concludes that under EC92 conditions the share of vehicle variable cost attributable to labour will fall from 22 to 20 percent across the car segments.
By analysing the manner in which variable costs move in the transition from EC85 to EC92 across the five car segments, and by weighting this change by reference to the significance of each segment in the total production of each country, the above reductions in unit labour costs have been established.
E. CHANGE IN DIRECT UNIT COST OF PRODUCTION
Total unit cost of production has be en ta ken as including variable cost plus those fixed costs directly attributable to production.
Table 16 West German y France Ital y UK Other Total
Reduction (%) 2.93 4.49 4.94 3.09 4.25 3.50
Attributable to:
Labour savings 1. 55 2.53 2.84 1. 75 2.49 1.97 Intermediate 0.15 0.32 0.34 0.01 0.12 0.17 Tooling savings 1.23 1.64 1.76 1.33 1.64 1.36
The total cost saving in percentage terms is a consequence of those reductions ~n labour unit costs, lower costs of producing and/or procuring components, and also to those reductions directly attributable to the changes in platform volumes.
The greatest change occurs in the Italian automobile industry, where a high level of labour content gives greatest scope for productivity gains and also where output is heavily concentrated in those product segments where considerable scope for economies of scope occur.

-387- THE EC92 AUTOMOBILE SECTOR: EXECUTIVE SUMMARY Page 23
F. CHANGE IN TOTAL UNIT COST OF PRODUCTION
This finding reflects the total EC92 change in unit costs/prices. It includes those fixed costs/overheads that are not directly attributable to production, but are included within the ex-factory cost of vehicles in each segment.
West Table 17 (percentage reduction)
Germany France Italy UK Other Total
Total
Attributable to:
Pure Cost Res truc turing
4.34 5.54
4.80 4.90 ( 0. 46) 0. 64
5.68
5.00 0.68
4.30
4.80 (0.50)
5.32
4.90 0.42
5.00
5.09 (0.09)
The magnitude of change is greater than for production costs alone because the fixed cost · element of total unit costs experiences a higher percentage change in the transition from EC85 to EC92 conditions. However the change differentiai between countries is lower because the segments exhibit similar platform volume behavior from one country to another.
Pure cost savings are defined as those savings which would occur as a result of the development of platform sharing, technical advances and other changes brought about by the move to EC92. This excludes the changes in overall segment volumes brought about by a restructuring of production. The overall impact of the restructuring has been to reduce the potential benefits because the restructuring involves a shift in emphasis towards the high-volume lower and upper medium segments. The greatest pure cost reductions occur in the lower volume segments, where the potential economies of scale are greatest. The variations between countries reflects the different segment mixes in their car production.
G. CHANGE IN LABOUR PRODUCTIVITY
West Table 18 (percentage improvement)
Germany France Italy
9.93 14.42 15.76
UK Other Total
10.87 14.09 12.58
Labour productivity is defined as output of vehicles per person employed in the industry. The change in labour cost per unit produced, outlined above, is assumed to occur as a result of the reduction of manning levels. Given the underlying assumption of static production volumes, this brings about the improvements shown in labour productivity.

-388- THE EC92 AUTOMOBILE SECTOR: EXECUTIVE SUMMARY
H. CHANGE IN CAPITAL PRODUCTIVITY
Table 19 (percentage improvement)
West Germany France
16.64 17.63
Ital y
19.33
UK
18.50
Page 24
Other Total
17.41 17.48
Tooling costs have been used as a proxy for productive capital investment. This is judged to be valid because the tooling cost per unit is effectively the aggregate capital investment amortised over the number of automobiles a manufacturer produces. Given that the study assumption at this stage is that the volume produced remains static, any changes in tooling cost per unit reflect the change in aggregate capital invested and thus in productivity.
I. CHANGE IN PRODUCTIVE INVESTMENTS
Productive investments are taken as consisting of the book value of tangible fixed assets plus the level of research and development expenditure. Reductions in the level of capital investment will be possible in EC92 because the increased level of platform sharing will facilitate more efficient utilisation of plant and machinery. To produce the same volumes and model variations in EC92 as those achieved in EC85, fewer production machines will be required.
Table 20 West (percentage German y France Ital y UK Other Total reduction)
Scenario A 14.95 16.73 18.30 16.97 16.12 16.15 Scenario B 12.90 14.90 17.30 14.20 14.90 14.30
In Scenario A, R&D expenditure stays at constant levels. In this Scenario, the change in productive investments will be the change in capital productivity weighted for the importance of tangible fixed as sets. In Scenario B, auto manufacturers will take advantage of the cost savings arising from the move to EC92 conditions to invest one percent of total costs in advanced research and development in order to maintain their products at a high level of international technological competitiveness.
Amounting to 600 million Ecu, the resulting R&D funding is assumed to be distributed amongst producing countries in proportion to the total costs which each accounted for in EC85.
R&D development expenditure has two effects which can be classified into direct and deferred. The direct effect of such expenditure is to reduce auto manufacturers profits, raise ex-factory priees and depress demand. There is, however, a deferred consequence which encourages such expenditure to take place. This is the R&D
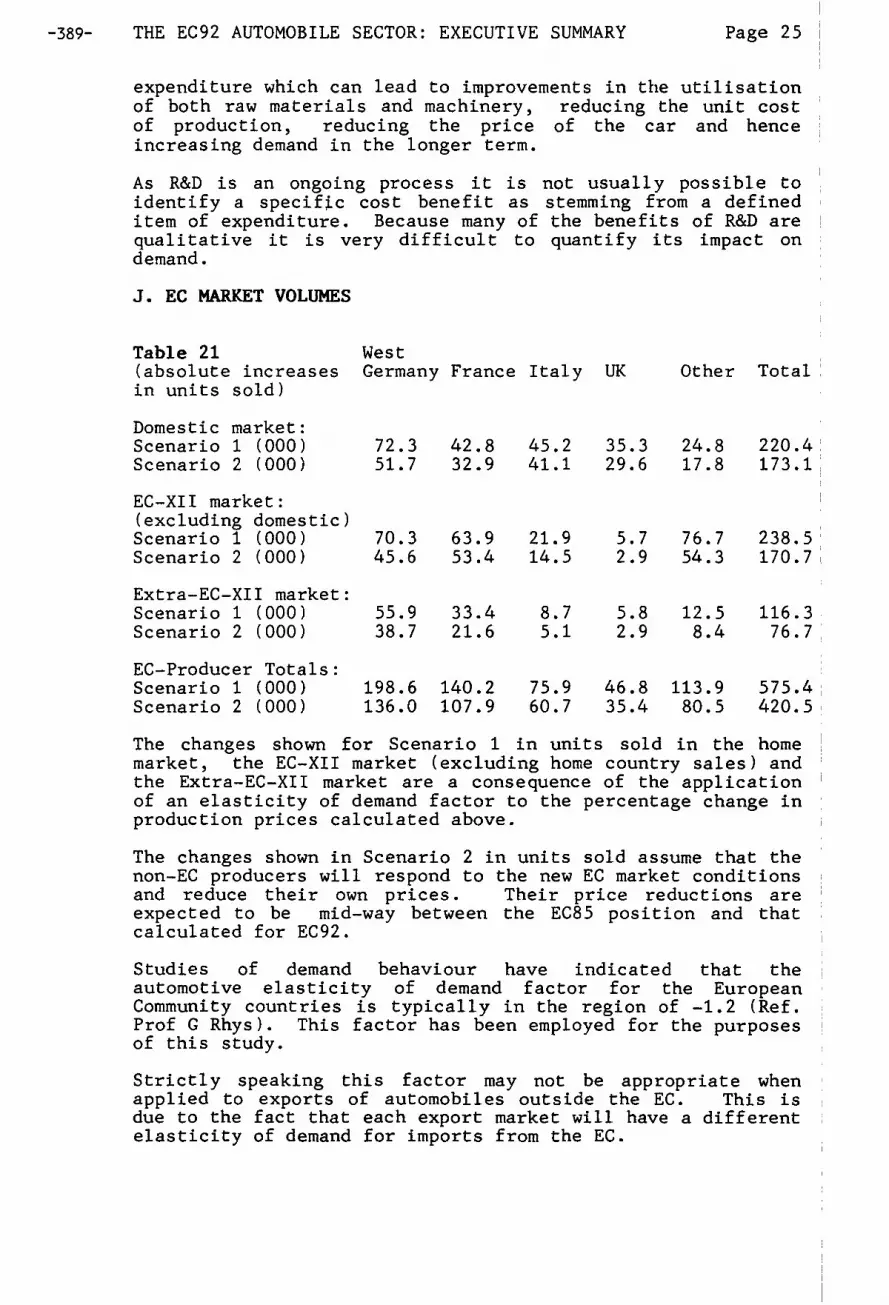
-389- THE EC92 AUTOMOBILE SECTOR: EXECUTIVE SUMMARY Page 25
expenditure which can lead to improvements in the utilisation of both raw materials and machinery, reducing the unit cost of production, reducing the priee of the car and hence increasing demand in the longer term.
As R&D is an ongoing process it is not usually possible to identify a specif~c cost benefit as stemming from a defined , item of expenditure. Because many of the benefits of R&D are 1
qualitative it is very difficult to quantify its impact on demand.
J. EC MARKET VOLUMES
Table 21 (absolute increases in units sold)
Domestic market: Scenario 1 (000) Scenario 2 (000)
EC-XII market: (excluding domestic) Scenario 1 (000) Scenario 2 (000)
Extra-EC-XII market: Scenario 1 (000) Scenario 2 (000)
EC-Producer Totals: Scenario 1 (000) Scenario 2 (000)
West Germany France Italy UK
72.3 51.7
70.3 45.6
55.9 38.7
198.6 136.0
42.8 32.9
63.9 53.4
33.4 21.6
140.2 107.9
45.2 41.1
21.9 14.5
8.7 5.1
75.9 60.7
35.3 29.6
5.7 2.9
5.8 2.9
46.8 35.4
Other Total '
24.8 17.8
76.7 54.3
12.5 8.4
113.9 80.5
220.4 : 173.1 1
238. 5 : 170.7:.
116. 3 . 76.7 '
575.4: 420.5 :
The changes shown for Scenario 1 in units sold in the home market, the EC-XII market (excluding home country sales) and the Extra-EC-XII market are a consequence of the application 1
of an elasticity of demand factor to the percentage change in production priees calculated above.
The changes shown in Scenario 2 in units sold assume that the non-EC producers will respond to the new EC market conditions and reduce their own priees. Their priee reductions are expected to be mid-way between the EC85 position and that calculated for EC92.
Studies of demand behaviour have indicated that the ~ automotive elasticity of demand factor for the European Community countries is typically in the region of -1.2 (Ref. Prof G Rhys). This factor has been employed for the purposes of this study.
Strictly speaking this factor may not be appropriate when , applied to experts of automobiles outside the EC. This is due to the fact that each export market will have a different elasticity of demand for imports from the EC.

-390- THE EC92 AUTOMOBILE SECTOR: EXECUTIVE SUMMARY Page 26
In the absence of specifie information on the elasticity of demand in foreign markets, LAL consider the application of the -1.2 factor is preferable to not providing results for this important source of sales.
In Scenario 1, to assist in the quantification of the effects of priee changes on the structure of consumer demand in the EC, recourse has been made to the following assumptions:
1. That Extra-EC producers of automobiles are unable or unwilling to respond to EC producer priee decreases.
2. That a process of substitution of demand takes place in faveur of EC automobile producers so that existing purchasers of non-EC produced cars will change their purchase decision to EC-produced cars in proportion to the percentage decline in their priees.
K. CHANGES IN NON-EC IMPORTS
Table 22 West (percentage German y France Ital y UK Other Total reduction in sales) Scenario 1 39 100 100 35 23 42 Scenario 2 24 84 90 19 13 28
The findings for bath pricing scenarios shawn in Table 21 illustrate that the priee reduction ~n EC-produced cars developed above for EC92 has the effect of reducing the sales volumes of non-EC producers' imports. The percentage reduction in sales for Scenario 2 is lower due to the non-EC producers responding to EC92 by reducing their priees.
The largest degree of change is forecast in those countries where non-EC imports represent a small percentage of sales in EC85. Thus the effect is most notable in France and Italy, where non-EC imports would effectively cease to hold any meaningful market share.
Full appreciation of the basis for this forecast may be derived from a study of the market conditions that obtain in the affected countries. In Italy, non-EC imports account for only 9 percent of total imports and less than 5 percent of sales. Of the non-EC imports, 60 percent are from East European producers and a further 33 percent are from the developing countries. These producers, often utilising antiquated technology, compete chiefly on priee. Thus it is reasonable to postulate the virtually complete elimination of such demand.
France is another country with a law percentage of non-EC imports and a significant East European content in those imports. Thus similar results to those of Italy will occur.

-391- THE EC92 AUTOMOBILE SECTOR: EXECUTIVE SUMMARY Page 27 '
The 1 other 1 EC countries have a high non-EC import penetration; in Scenario 1, 26 percent of all imports are from outside the EC-XII, of which 76 percent are from Japan and a further 4 percent from EFTA countries. These producers , are not competing solely on priee and therefore the reduction in imports from those sources in response to EC priee reductions will be less marked.
In respect of France and Italy it is possible that the impact of priee reductions may be overstated. This is because the import quotas for Japanese automobiles may distort the pattern of demand. In the absence of a specifie study on the impact of such quotas it would be prudent to regard the results as the best estimates of what is achievable.

-392- THE EC92 AUTOMOBILE SECTOR: EXECUTIVE SUMMARY Page 28
VII. DYNAMIC EFFECTS OF EC92
The cost savings described and computed in Sections V and VI consist of the deferred direct consequences of introducing EC92 conditions. They are the savings/efficiencies that result from the actions taken by the auto industry to make full use of the potential of EC92. As noted they have been calculated on the basis that total EC market volume remains static; thus they omit the dynamic effects that are a consequence of the priee reductions that the lower manufacturing costs make possible.
In this section, the dynamic consequences are analysed and discussed. In a sense, the dynamic consequences are infinitely iterative. Each dynamic improvement has the potential to reduce costs further, and thus to trigger a further dynamic improvement. In order to simplify analysis, LAL eschewed the creation of a multi-period dynamic model of single-market Europe because beyond the initial period it would be increasingly difficult to distinguish between direct EC92 consequences and those ·effects that stem from secondary developments.
It is evident that as a result of the initial direct benefits of EC92 a multiplier effect will be triggered that will be felt for a number of years. In successive stages this multiplier effect will take the following form:
1. The EC92 conditions liberalise internai trade and stimulate commonisation of parts and platforms, leading to lower costs.
2. Due to intense competition and underutilised total industry capacity, the cost savings will be passed on to the consumer through lower real priees, less an allowance for intensified advanced R&D activity.
3. The increased priee competitiveness of EC-produced automobiles vis-a-vis non-EC production leads to increased demand for vehicles from EC production, both inside and outside the Community.
4. The greater EC volumes produced as a result of (3) will allow additional economies of scale to be achieved and exploited and, as a result, a further stimulation of demand will occur.
A domestic direct/dynamic cycle very similar to this, built on an initial advantage of lower net labour costs, allowed the Japanese motor industry to make the inroads into world markets that it achieved, beginning in the 1970s. Now, however, the Japanese compete more on quality, style, technology and reliability than on the priee differentiai that gave them their market entree.
In part as a consequence of the appreciation of the Yen, Japanese makers have restructured their product lines for export. As a result their penetration has been steadily moving up-market, well into the lower and upper medium
-393- THE EC92 AUTOMOBILE SECTOR: EXECUTIVE SUMMARY Page 29
segments, and is forecast to be directed even higher. Thus it is conceivable that under EC92 conditions the European volume producers will be able to regain the grip on the 'value for money' auto market that seemed, in the earl y 1980s, to be lost to them forever.
For these effects to take place as outlined, the demand for EC automobiles must be sufficiently priee elastic to give the manufacturers and their distributors an incentive to pass on cost savings to the retail level. Studies by Prof Garel Rhys of University Col lege at Cardiff, Wales indicate that the European market priee elasticity of demand is approximately -1.2 to -1.3 for consumer goods and for automobiles is in the range of -1.0 to -1.5.
LAL has elected to take a prudent view by selecting a figure of -1.2 for auto priee elasticity across the EC market. On this basis, for every 1.0 percent decline in priee, demand will increase by 1.2 percent. This priee elasticity factor was employed in generating the responses to EC Commission requirements as described in Section VI. It triggered significant changes in the pattern of demand/trade.
The dynamic effects are also highly relevant with respect to the total impact of EC92 on auto industry employment. The response in Section VI dealing with labour productivity in EC92 envisaged that improved labour productivity would occur, with a concomitant reduction in the labour requirement. This finding, however, was based on the direct effect assumption that production remained static in the move to EC92.
As the dynamic effects of EC92 are realised, a proportional increase in the requirement for labour will occur. The priee elasticity calculation indicates that the 5 percent reduction in priee arrived at as a result of the direct effects will (multiplied by the 1.2 elasticity) increase demand for vehicles produced in the EC by at least 6 percent initially. If employment is recouped at the same rate, the employment reduction that would be assumed from the productivity improvement of EC92, would be approximately halved.
A further recoupment of employment is seen as having the potential to occur in EC92. It will be accelerated as the multiplier process outlined earlier begins to take effect. In EC92 demand may prove to be more priee elastic than the -1.2 factor taken for this calculation. Also, the improved export potential of EC production resulting from the priee reduction may outperform the selected priee elasticity factor.
In concert, these considerations off er the potential for a European car industry in EC92 which is a substantially more rationalised and vigorous international competitor, and which at the same time maintains a level of employment that is little changed from the present.

-395-
Annexe I
SUMMARY OF QUANTITATIVE RESULTS
HYPOTHETICAL CHANGE IN UNIT COSTS
1. Variable Cost savings can be broken down as follows:
Labour Cost Other variable Cost
Total
Million Ecu
826.6 72.3
898.9
This re•flects the positive impact of improved labour productivity on variable costs despite representing only approximately 20 percent of variable costs, and highlights the difficulties of reducing costs in an area with a high raw material content.
2. Fixed Cost savings can be broken down as follows:
Tooling Engineering Warranty Provision Administration/Finance Advertising
Total
Million Ecu
571.7 700.7 175.3 213.3 42.5
1 703.5
The Engineering total includes savings that result from rationalised type-approval procedures.
3.
Variable Cost Saving Fixed Cost Saving
Million Ecu
898.9 1703.5
% of Category
2.36 11.50
This indicates that it is in the area of fixed costs that the benefits of the completion of the internal market will be most significant through economies of scale.
4. (percentage reduction)
Total
Attributable to:
Variable Cost Fixed Cost
West Germany France Italy
4.34
1.44 2.90
5.54
2.16 3.38
5.68
2.37 3.31
UK
4.30
1.42 2.88
Other Total
5.32
1.97 3.35
5.00
1. 73 3.27
This represents a saving in value terms of 2602.4 million Ecu.


- 397-
12.
The •cost of Non-Europe•
in the Foodstuffs Industry
Groupe MAC


The Cost of "Non-Europe" in the Foodstuffs lndustry
Executive su rn mary
January 1988
Groupe MAC- 11 Bd latour Maubourg- 75007 PARIS- TEL: (1) 45.55.91.78
Paris Boston San Francisco
Londres Chicago Buenos Aires
Barcelone Washington Hong Kong


- 401 -
ACKNOWLE DGE M ENTS
The MAC Group wou Id like to acknowledge the help provided by Gwen Cozigou
and Pierre Buigues of the European Commission and by Professer Jacques
Pelkmans of the European lnstitute of Public Administration in Maastricht,
Holland, in conducting this research. Ali views and conclusions contained in this
paper belong soiEty' to the authors, and any errors, of course, remain their full
responsibility.


- 403 -
Preface
The European Commission retained the MAC Group to study the completion of the internai market by 1992 in the foodstuffs industry. Four reports and an executive summary resulted from this effort :
Report 1
Report Il
Report Ill
Report IV
Identification of barriers and selection of pilot barriers
Analysis of pilot barriers (Volumes 1 and Il)
Extrapolation of benefits
Consolidation of the European food industry : An implication of the 1992 Common Market.
Executive summary
par3727agro188 /1 1 GROUPE MAC


- 405 -
Contents
1. Introduction
A. Objectives of the study 3
B. Summary of conclusions 4
2. Methodology and scope
A. Design of the study 6
B. Definitions and assumptions 8
C. Product sectors and pilot barriers 9
3. Findings
A. Trade barriers in the foodstuffs industry 12
B. Benefits of removing barriers 19
C. "Missed opportunities" and EEC 29 competitiveness
par3727agro188 1 2 1 GROUPE MAC


- 407 -
1. Introduction
A. Objectives of the study
This study was motivated by the European Commission's "white paper"<1l
and was designed to answer the following question : What will be the
impact of the "1992 Common Market" on the foodstuffs industry 1
ln this context, the 1992 Common Market means a European Community in
which any foodstuff produced and commercialized in one member country
may be freely commercialized in any other member country. Non-tariff
trade barriers represent one of the main obstacles to the 1992 Common
Market. Evaluating the impact of removing these barriers was therefore the
principal objective of this study.
Two corollary objectives followed from the principal objective. The first was
to evaluate and quantify the total net benefits to the EEC from eliminating
trade barriers; and the second was to identify the countries and product
sectors that would be most significantly affected.
(1) "Completing the Internai Market," June 1985.
par3727agro188 /3/
GROUPE MAC

- 408 -
B. Summary of conclusions
• Europeanization in the foodstuffs industry is facing a critical transition.
ln ten product sectors, this study identified over 200 non-tariff trade
barriers. Recent years have witnessed an increase rather th an a decrease
of barriers.
• Creating a single market in the foodstuffs industry will engender
significant benefits. Within the sectors studied, the positive impact will
be on the order of 500-1000 million European currency units (Ecus) in
annual cost savings. These benefits represent two to three percent of
total industry value-added, and correspond to a one- to two-year gain in
industry productivity. The benefits are, however, highly concentrated;
over 80% can be traced to the elimination of six barriers.
• The indirect effects of a single market are likely to considerably enlarge
the benefits that result from the removal of trade barriers. One-third of
the primary 50 product/markets studied will enjoy major positive effects,
the most important of which will be an increase in consumer choice. On a
case-by-case basis, sorne industry restructuri~19 will occur, intra
community trade will increase, and in a few cases extra-community
competitive ness will be enhanced.
• The "missed opportunities" of not achieving the 1992 Common Market
are great. Trade barriers reinforce a national focus among food concerns
that, in turn, creates a fragmented industry. While few EEC food
companies have built strong competitive positions across a majority of
EEC markets, several non-EEC companies have succeeded in doing so.
• Removing trade barriers will encourage EEC food concerns to increase
their geographical coverage and market leadership, both measures
necessary to ensure future EEC competitiveness. As a consequence, a
wide-scale industry restructuring and consolidation among the largest
companies could take place.
par3727agro188 /4/
GROUPE MAC

- 409 -
• While dismantling trade barriers is a necessary prerequisite for
exploiting these opportunities and maintaining EEC competitiveness, it
is not the only one. The overall impact will be hindered or enhanced by
commitment changes in related trade barriers, rules on competition, the
regulation of financial markets, and the attitudes of member
governments.
• Although not sufficient in itself, the advent of a single European market
in the food industry will be necessary to :
- reverse the observable trend of an increase in trade barriers within
the EEC;
allow market forces to provide consumers with a wider choice of
products at a lower cost;
influence positively trade, investment. and the structure of the EEC
food industry to reinforce its compe~~tiveness in the European and
world markets.
par3727agro1 88 151 GROUPE MAC

- 410 -
2. Study methodology and scope
A. Design of the study
The study was conducted in three phases, as illustrated in Exhibit 1.
Phase 1
Defi ne typology of barriers and select pilot barri ers
. ldentify foodstuffs sectors
. Oevel op barrier typology and identify barriers
. Select 20 pilot barri ers
Exhibit 1 Design of the study
Phase Il
Evaluate the impact of removing pilot barriers
. Perform detailed evaluation of pilot barriers
. Gather data for extrapolation
Phase Ill
Estimate total net benefits of achieving the "1992 Common Market"
. Extrapolate results of Phase Il to estimate total net benefits
. ldentify barriers and sectors that will be principally affected
Provide an objective view on the impact of the "1992
Common Market"
The absolute size and diversity of the foodstuffs industry make it especially
complex to analyze thoroughly. Therefore, the study was designed to begin
with a detailed analysis of high-impact trade barriers in a limited number of
sectors, followed by an extrapolation of the analysis to estimate a more
general impact.
Du ring the first phase, ten foodstuff sectors, which became the focus of the
study, were evaluated and selected. Next, specifie barriers were identified
and classified according to barrier type. The objective of this exercise was
not to produce an exhaustive list of ali trade barriers, but rather to identify
the most significant ones. Finally, 20 pilot barriers were chosen from among
the more than 200 barriers identified to serve as case studies for the next phase of the study.
ln the second phase, the 20 pilot barriers were evaluated based on existing
industry information and over 200 interviews with major companies and
industry experts.
par3727agro1 88 /6/ GROUPE MAC

- 411 -
The effects of removing each of these barriers were classified into three
categories
Immediate direct effects :
Principally a measure of the fall in production or distribution cost as an
immediate result of removing a barrier.
Deferred direct effects:
Direct effects of eliminating a barrier which appear gradually over time.
An increase in competition or the realization of scale economies are
examples of this second category of effects.
Indirect dynamic effects :
Long term effects such as changes in intra- or extra-community trade,
increased consumer choice, industry restructuring, etc.
During the study's final phase, the net benefits of removing the pilot
barriers were extrapolated across barriers, countries, and the ten product
sectors to arrive at the total net benefits of achieving the 1992 Common
Market. The direct effects of removing the barri ers were quantified, and the
indirect, longer term efteds were analyzed in a qualitative manner.
par3727agro188 171 GROUPE MAC

- 412 -
B. Definitions and assumptions
Throughout the study, a barrier is defined as a gene rie impediment to trade,
or a regulatory discrepancy, within the EEC. Purity laws or specifie
ingredient restrictions are both examples of barri ers.
A specifie barrier is a combination of a barrier with two other dimensions :
product sector and country. An example of a specifie barrier would be the
"Reinheitsgebot" or the beer purity law in Germany ; a second example
would be the restriction against using aspartame in soft drinks in France.
A pilot barrier is a specifie barrier th at was selected to be studied in-depth in Phase Il of the study, to understand the net benefits of removing the
barrier.
Net costs are the total direct and indirect costs incurred by the existence of a
barrier. Net benefits of removing a barrier are defined as equal to the
elimination of net costs. ln this study, the terms net cost and net benefits
will be used when referring to the existence and the elimination of barriers,
respectively.
Finally, the costs of non-Europe are equal to the sum of ali net costs across the barriers and product sectors covered.
The reader should be aware of two important assumptions made in this
study about the removal of barriers. The first relates to what is meant by
removing a barrier. ln general, this means that a good produced in one
country may no longer be impeded from travefing freely and being
commercialized in another. This is the basis of the principle of mutual recognition, which in a strict sense only concerns intra-Community trade.
However, for some of the cases, in evaluating the effects of removing barriers, the study assumed that barriers are removed within as weil as between countries in the EEC. As an example, the study assumes that the
beer purity law is lifted in German y both for domestic brewers as weil as for importers. Such an assumption is stronger therefore than the simple mutual recognition principle, and is akin to an assumption of a total harmonization of regulations.
par3727agro188 /8/ GROUPE MAC

- 413 -
The second assumption is related to the first in that the study does not take
a position on whether the removal of trade barriers {or the harmonization
of regulations) could undermine public health, safety, or the environment.
These potential "social costs" are not explicitly evaluated, even though
member states often justify the existence of trade barriers for reasons of
protecting the consumer and the environ ment.
C. Product sectors and pilot barriers
The ten product sectors studied were selected based on the importance to
EEC trade, the absolute size, and the likelihood of containing important
trade barriers. ln addition, the study focused on downstream, rather than
upstream, products in arder to avoid the complications introduced by the
Common Agricultural Policy and its related support programs. For this
reason the product sectors were chosen from the four processed food
sectors : breads and cereals, confectionery, beverages, and other grocery
products. Excluded from the study's scope were : meats, fish, fruits and
vegetables, dairy products and eggs. The former group of processed food
seciors accounts for about 40% of total food expenditures in the 5 largest
EEC countries.
par3727agro 188 /9/ GROUPE MAC
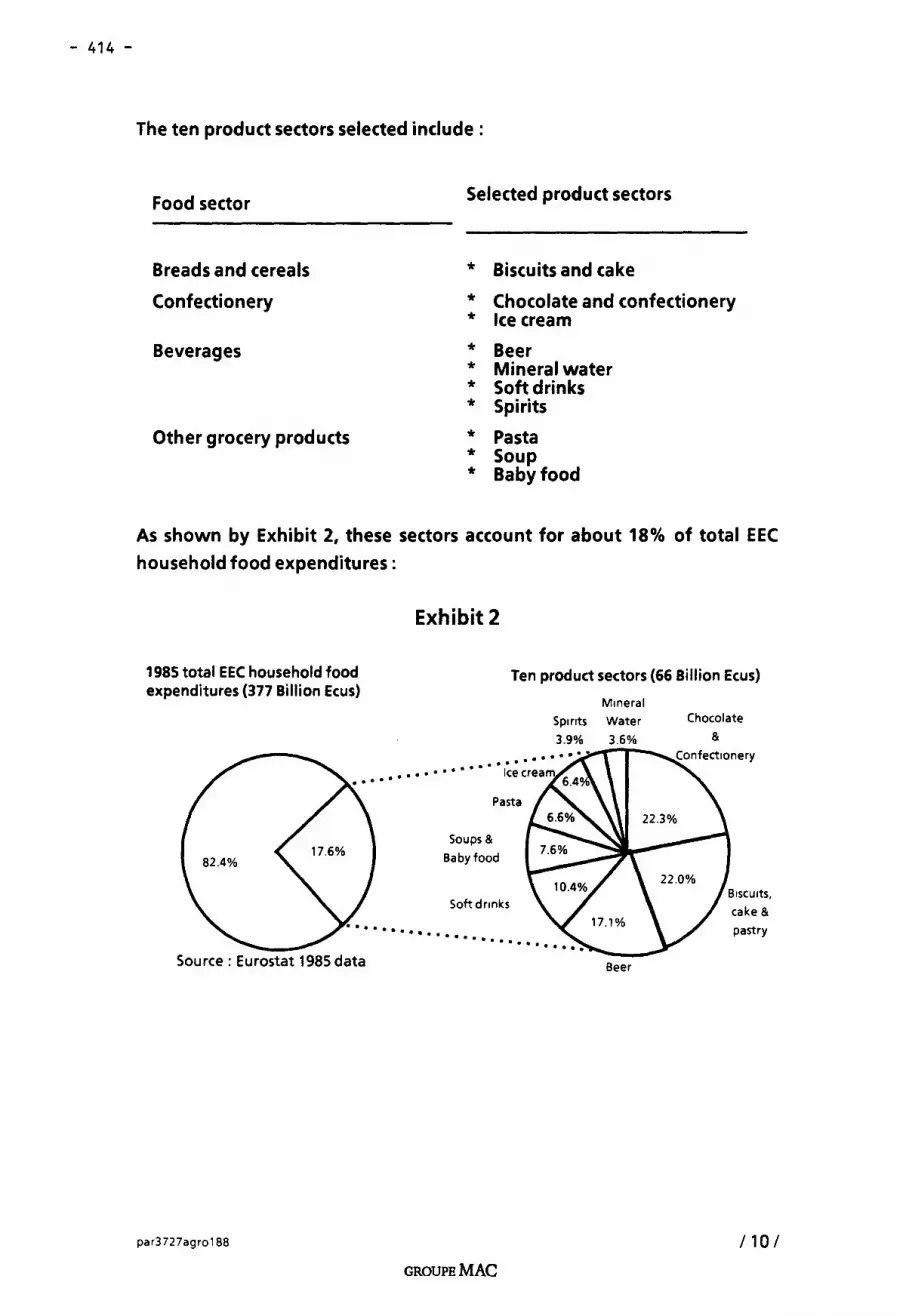
- 414 -
The ten product sectors selected include :
Food sector
Breads and cereals
Confectionery
Beverages
Other grocery products
Selected product sectors
* Biscuits and cake
* Chocolate and confectionery * lee cream
* Beer * Mineral water * Soft drinks * Spirits
* Pasta * Soup * Babyfood
As shown by Exhibit 2, these sectors account for about 18% of total EEC household food expenditures:
1985 total EEC household food expenditures (377 Billion Ecus)
Source: Eurostat 1985 data
par3727agro188
Exhibit 2
Ten product sectors (66 Billion Ecus)
...... . . . . . . . Pasta
Soups &
Baby food
Soft dnnks
GROUPE MAC
M1neral
Sp1nts Water
3.9% 3.6%
Beer
Chocolate
&
BISCUitS,
cake &
pastry
/10/
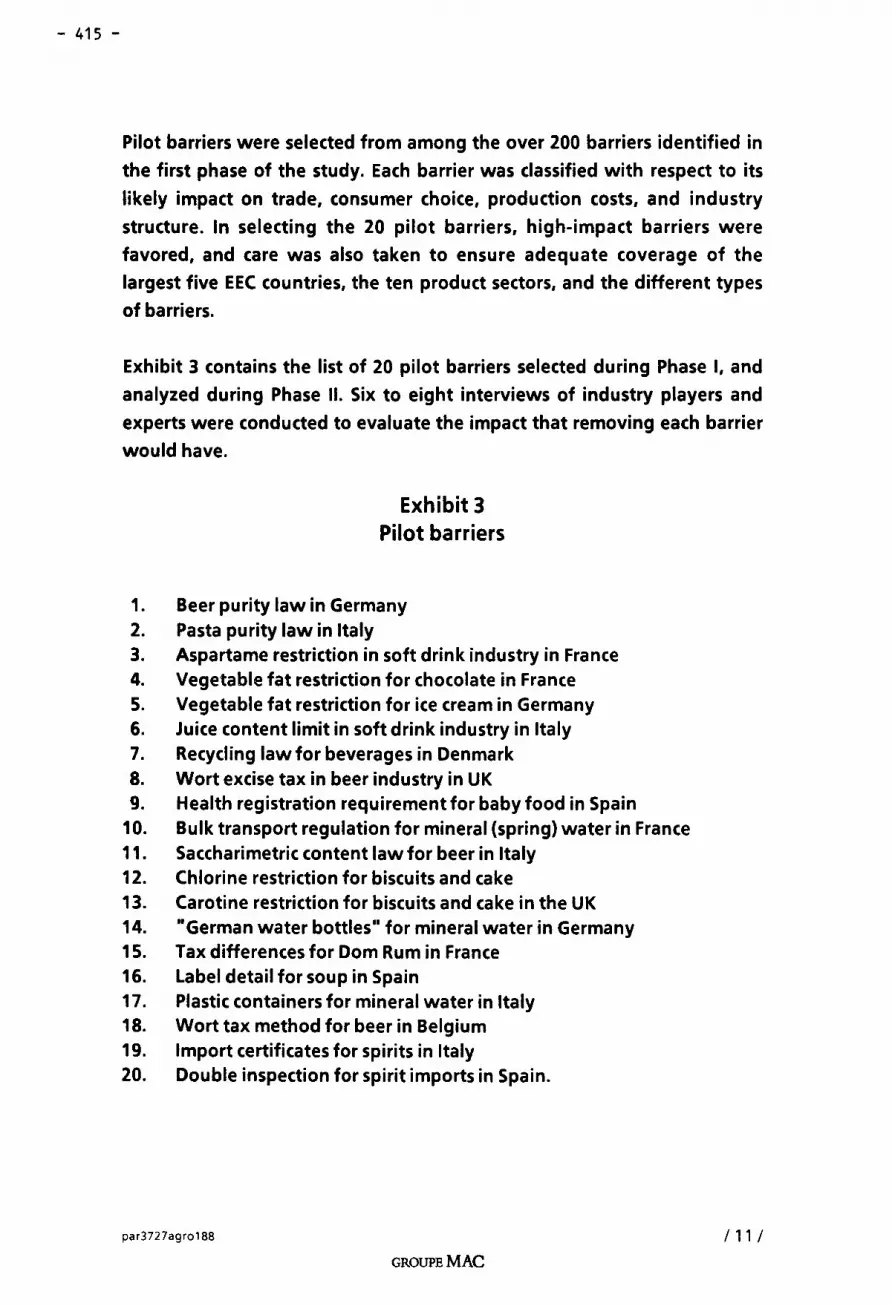
- 415 -
Pilot barriers were selected from among the over 200 barriers identified in
the first phase of the study. Each barrier was classified with respect to its
likely impact on trade, consumer choice, production costs, and industry
structure. ln selecting the 20 pilot barriers, high-impact barriers were
favored, and care was also taken to ensure adequate coverage of the
largest five EEC countries, the ten product sectors, and the different types
of barriers.
Exhibit 3 contains the list of 20 pilot barriers selected during Phase 1, and
analyzed during Phase Il. Six to eight interviews of industry players and
experts were conducted to evaluate the impact that removing each barrier
would have.
Exhibit 3 Pilot barriers
1. Beer purity law in Germany 2. Pasta purity law in ltaly 3. Aspartame restriction in soft drink industry in France 4. Vegeta ble fat restriction for chocolate in France 5. Vegetable fat restriction for ice cream in Germany 6. Juice content li mit in soft drink industry in ltaly 7. Recycling law for beverages in Den mark 8. Wort excise tax in beer industry in UK 9. Health registration requirement for baby food in Spain
1 O. Bulk transport regulation for mineral (spring) water in France 11. Saccharimetric content law for beer in ltaly 12. Chlorine restriction for biscuits and cake 13. Carotine restriction for biscuits and cake in the UK 14. "German water botties" for mineral water in Germany 15. Tax differences for Dom Rum in France 16. Label detail for soup in Spain 17. Plastic containers for mineral water in ltaly 18. Wort tax method for beer in Belgium 19. lmport certificates for spirits in ltaly 20. Double inspection for spirit imports in Spain.
par3727agro188
GROUPE MAC
1 11 1

- 416 -
3. Findings
A. Trade barriers in the foodstuffs industry
i. Over 200 barriers exist in the ten product sectors
Over 200 specifie barriers were identified in the ten product sectors studied.
The barriers identified are diverse, so it is useful classify them into five
categories :
1. Specifie ingredients restrictions
2. Content/denomination regulations
3. Packaging/labeling laws
4. Fiscal discrimination
S. Specifie importing restrictions
Specifie ingredient restrictions. These barriers prohibit the consumption of a
product containing specifie ingredients, such as additives, pesticide
residu es, or vitamins. An example of this type of barrier, which is generally
erected by a country under the auspices of protection of consumer health, is
the restriction of aspartame in the French soft drink industry.
Example : Aspartame
Aspartame is a non-nutritive sweetener used for the "diet" segment of the soft drink industries in North America and in most EEC countries. Aspartame can not be used, however, in soft drinks in France or Spain. One result of the restriction is that in France a mass diet segment does not exist. If the barrier was removed, it is estimated that such a segment would emerge, ultimately capturing 10%-15 % of the soft drink market.
par3727agro1 88 1 12 1 GROUPE MAC

- 417 -
Content/denomination regulations.These barriers prevent a producer from
using a generic name unless its product conforms to certain content
requirements. The most well-know content law is the reinheitsgebot, or
beer purity law, in Germany.
Example : Beer purity law in German y
The Reinheitsgebot, in effect for four and a half centuries, stipulated that beer containing substances other than hops, malted barley, yeast, and water could not be sold in Germany under the name "beer". Partial/y as a result of this law, the German beer market is highly fragmented--over 1200 breweries exist--and imports make up on/y about 1% of consumption. Recent/y, the European Court of Justice ru led that imported beer containing other substances can use the beer product na me.
Packaging and labeling laws make up the third category of barriers. These
laws affect ali aspects of packaging, including the shape, materials, size,
recycling and disposai, as weil as labeling requirements.
Example : Labeling laws
Despite the Community labeling directive (791112/EEC), severa/ EEC countries operate with different label requirements, which implies that an EEC producer is effective/y prohibited from using a uniform label for its EEC sales. ln Spain for instance, labels must contain the followed information :
- Definition of the product List of ingredients
- Netweight Number of units
- Consumption date ("best-before" date) - Conservation instructions - Manufacturer's lot number - lmporter's na me - Manufacturer's na me
Country of origin - Health registration number.
Certain of these requirements (notably the health registration number) differ from the Community labeling directive, and th us form a subtle but effective barrier to trade.
par3727agro188 /13/
GROUPE MAC

- 418 -
Fiscal discrimination is the fourth type of barrier examined. The only fiscal
laws considered in this study are only those that might disadvantage an
importer vis-à-vis a local producer. While wide differences in excise and VAT
taxes between neighboring countries (e.g., Denmark and Germany) will
ultimately have a large impact on the ability to create a single market, they
are not considered in this study. For other reasons, differences in excise
taxes among different types of alcoholic beverages were not included. An
example of a fiscal law th at cou Id discriminate against importers is the wort
taxation method for beer.
Example: Wort tax method for beer
Five EEC countries levy excise taxes on beer prior to fermentation, less a set wastage allowance. Excise taxes for imports into these countries is levied on the final product. If a domestic producer can routine/y beat the pre-set wastage factor, it may derive a cost advantage compared to an importer.
Specifie importing restrictions. This final barrier type captures many of the
diverse and subtle types of discrimination that a producer/exporter must
undergo before the cross-border commercialization of goods. ln the words
of one barrister, these are ali the barriers that "make life difficult for the
producer/exporter". lncluded in this category are import licenses, health
registration requirements, border inspections, and product testing.
Excluded from this study are delays resulting from the monetary
compensatory amounts scheme. While clearly significant based on the
responses from company interviews, they are not considered, because they
are inextricably linked to the Common Agricultural Policy and thus could not be analyzed in isolation.
par3727agro188 1141 GROUPE MAC

- 419 --
Barriers were fou nd in each of the ten product sectors and in each major EEC
country. lnterestingly, a significant number of barriers were found in each
of the barrier c~tegories, which reflects the appropriateness of this
typology (see Exhibit 4).
Exhibit 4 Distribution of specifie barriers by category
(Total number of barriers : 218)
Specifie importing restrictions
(64)
Specifie ingredient restriction
(33)
Content/denom ina ti on regulation
Fiscal discrimination
(14)
Source: MAC Group interviews.
ii. The number of barriers is not diminishing
(39)
Packagi ng/labell i ng (68)
Of concern to EEC food producers and exporters is the fact that the number
of barriers does not appear to be decreasing; on the contrary, new barriers
appear each year as A. Mattera reports, "modern restrictions on free trade
are the new types of frontier barriers wh ose proliferation is one of the most disturbing features of the last few years". (1)
(1) "Protectionism inside the European Community," Journal of World Trade Law, Vol18,
N° 4 {July/August 1984).
par3727agro188 /15/
GROUPE MAC

- 420 --
Seve rai of the 20 pilot barri ers have emerged and evolved over the past few
years. The health registration requirement for food products in Spain was
implemented at about the time Spain entered the Common Market. As one
EEC producer/exporter put it, "our products were readily acceptable by the
Spanish government up until the ti me Spain joined the EC. Now we have to
go through the registration procedure. n
Other barriers are becoming more widespread over time. For instance, 150
municipalities in ltaly now ban the use of plastic botties for soft drinks and
mineral water. This ban limits the ability of sorne foreign producers to
export to these communities because transportation costs for glass botties
make it uneconomic. Moreover, despite the EEC Directive on liquids, which
encourages competition between glass and plastic containers, this ban may
be extended throughout ali of ltaly by 1991, and German y reportedly is
considering a similar law.
iii. Barriers are not easily eliminated
Legal attempts to remove barriers have had sorne striking successes--such
as Cassis de Dijon, and Reinheitsgebot--but in many case i, manoeuvres by
the enforcing states can drag out the process for years. The history of the
recycling laws in Den mark provides a telling example.
Example : Recycling laws in Denmark
ln 1977, the Danish government enacted decree 136, which banned the imports of soft drinks in non-refillable containers. Three years la ter, the European Commission ru led against decree 136 --reasoning that it violated article 30 of the Treaty of Rome--and the Danish go vern ment prompt/y replaced it with decree 397, which banned the sale of soft drinks and beer in non-refillable botties, imported or domestic. While on the surface it wou/d appear this does not discriminate against importers, the transportation costs of two-way botties makes them impractical over about 200 km--a distance easily surpassed when exporting to Den mark.
par3727agro188 /16/
GROUPE MAC

- 421 -
Beer imports into Denmark had been dropping since the mid-1970s. ln 1981, after article 397 was enacted, what low leve/ of beer imports that remained was further reduced by a factor of 10 (see Exhibit 5). Den mark has the lowest leve/ of beer imports of any member of the EEC.
000 Hl
220
165,25
110,5
55,75
1970
Source : CBMC.
1972
Exhibit 5 Beer imports into Den mark
1974 1976
Strike at Tuborg/Carlsburg ; law is temporarly rescinded
Returnable bottle law goes into effect
Taxon botties
!
1978 1980 1982 1984 1986
ln 1982, the European Commission opened a new case against decree 397, but be fore it could be referred to the European Court, the Danish government introduced decree 95, which modified decree 397 by permitting the sale of non-refillable containers, but on/y in limited volumes and on/y if a return and manda tory deposit system on nonrefillables was introduced. Decree 95 went into effect in Apri/1985. This last substitution of one decree for another has su-cceeded in keeping the case out of court at /east to the date of this writing.
par3727agro 188 /17/ GROUPE MAC

- 422 -
iv. Partially as a result of trade barriers, intra-EEC trade has been stable.
lntra-EEC food imports represent about 6% of consumption in the
community (see Exhibit 6). This proportion has been stable over the years. lt
can be surmised that if it were not for trade barriers, the relative a mount of
intra-EEC trade would be higher.
Exhibit 6 lntra EEC imports as a proportion of consumption
10%
5%
0%
1978 1979 1980 1981 1982 1983 1984
Source: Eurostat : Food, beverages and tabacco imports of EEC 9.
ln theory, Article 30 of the Treaty of Rome ensures free trade among
member states of the EEC. ln practice, this is not fully the case. What,
therefore, is the cost of "non-Europe"?
par3727agro188 /18/ GROUPE MAC

- 423 -
B. Benefits of removing barriers
i. The direct benefits of removing trade barriers are significant
The total direct benefits of removing trade barriers in the ten product sectors covered are estimated to be 500-1000 million Ecus per year. This total represents 1% to 2% of total food sales (at manufacturers' priees) or
2% to 3% of total industry value added. Such a savings corresponds to a
one- to-two-year productivity gain for the sectors concerned. (lt is appropriate to state the benefit in terms of a productivity gain, because it is
a benefit that occurs year after year.)
a.) Direct benefits result from three types of cost reductions
Quantifiable direct benefits are classified into three categories:
- use of Jess expensive ingredients, reductions in labeling or packaging costs,
- elimination of "red-tape".
Use of Jess expensive ingredients is the principal source of quantifiable direct benefits engendered by the removal of barriers. The restriction against the use of soft wheat in pasta in ltaly demonstrates such a costs savings.
Example : Pasta purity law
Pasta can be made from two types of wheat--duram or soft. ln /ta/y, France and Greece, pasta made from soft wheat is not permitted. ln other countries--and in ltaly during the 1960s before the law was established--pasta can be made from both duram wheat and from a combination of duram and soft wheat, the latter being less expensive by 10%-15%. lndustry experts believe that if the ltalian law were removed, the penetration of the softlduram combination could rea ch 10%-20% of total pasta consumption, reaching 2 billion Ecus by 1992. Taken together, these estimates suggest that the direct cost savings from the substitution of a less costly ingredient could be 20-60 million Ecus in 1992. The direct cost savings from removing similar pasta purity barriers in France and Greece increase the total net bene fit to 35-100 million Ecus per year.
par3727agro188 /19/ GROUPE MAC

- 424 -
Net benefits due to the substitution of less costly ingredients are also
significant for beer purity laws and for laws concerning the use of
vegeta ble fats in ice cream and chocolate.
The second type of direct cost savings is the reduction in labeling and
packaging costs. ln most cases, however, resulting cost savings are
comparatively low, with one exception--the restriction against plastic
containers in sorne 150 ltalian municipalities. lt is estimated that, due to the
10% to 30% cost savings realized by using plastic botties instead of glass,
removal of this barrier could engender a savings of 5-15 million Ecus by 1992. ln addition, if the ban on plastic is extended throughout ali of ltaly,
the cost savings could rise to 115 million Ecus. As an order of magnitude, if
these savings were ali passed on to consumers, it would be the equivalent
of a 10% rebate on every bottle of mineral water purchased.
Potential cost savings to producers from using a common EEC label for
exports are minimal, mainly because producers/exporters would choose to
use country-specifie labels, even without the various restrictions, for
marketing reasons. As one exporting producer put it, "Foreign languages in
Spain are not weil understood. We would always use a Spanish label to
make sure our product is understood and stands out." Another producer
made a comment echoed by many others polled on this and other barriers: "The requirement to have a separate label for Spain is insignificant
compared to the other marketing and distribution obstacles we face."
The third type of cost saving is the elimination of "red tape" surrounding
the importing process. These cost savings are, in general, difficult to
quantify. However, an estimation is possible regarding the double inspection th at spirit imports must undergo by Spanish customs authorities. While the total quantifiable benefit is small --0.6 million Ecus per year-- it represents just over 1% of the value of spirit imports, and th us redu ces the attractiveness to spirit producers of mounting an export campaign to Spain.
par3727agro188 1201
GROUPE MAC

- 425 -
b) Immediate direct benefits are concentrated.
Quantifiable direct benefits are highly concentrated within the ten product
sectors studied. Over 80% of quantifiable benefits could be generated by
the re moval of six types of barriers (see Exhibit 7).
Exhibit 7 Concentration of immediate direct benefits
among specifie barriers
Total benefits (500-1000 Million Ecus)
Vegetable fat restriction in chocolate
Beer purity laws (Germany, Greece)
(Ali EEC except UK, IRL, OK)
Other barri ers
Plastic containers in ltaly
Vegetable fat restriction in ice cream (Germany, France,
Greece, Luxembourg)
Pasta purity laws (ltaly, France, Greece)
Sacchari metric content in Beer
(ltaly, Spain, Greece)
The restrictions on vegetable fat in chocolate and ice cream alone account
for over 40% of the estimated benefits. Other high-impact barriers are the
purity laws for beer and pasta, the saccharimetric content restrictions in
beer, and restrictions on the use of plastic containers for mineral water and
soft drinks in ltaly.
par3727agro1 88 /21/ GROUPE MAC

- 426 -
c) Deferred direct effects are low.
Reductions in most of the pilot barriers considered would stimulate
imports. Any increase in imports has a positive influence on the degree of
competitive rivalry in an industry. lt is not surprising, therefore that an
increase in competition would result from eliminating eleven of the fifteen
pilot barriers. The subsequent effect on end-user priees is more difficult to estimate, and is tempered by the fact that for many of these industries,
profit margins are so low that significant priee reductions are unlikely. This
is the case, for example, for beer in Germany and for chocolate in France.
The effect on scale economies--which is the second type of deferred direct
effect--is less frequent across the sample of pilot barriers. Removing
barriers would have an appreciable effect on scale economies for only three
out of the fifteen pilot barriers. The Danish recycling law provides an
example of how scale economies could be achieved. Very simply, if the requirement to use refillable botties were dropped, beer exporters into
Denmark could avoid the down-time in their bottling plants that is
necessary to switch to refillable botties.
d) Removing barriers cou Id engender sorne costs.
For each pilot barrier analyzed, consideration was given to possible costs
that would be incurred by its removal. ln ali cases, the types of costs centered on production, such as labor or raw material suppliers. For
example, if aspartame cou Id be used in French soft drinks, sugar producers
might suffer from reductions in demand. For two reasons, however, the net
impact of these costs is arguably zero. First, many of the suppliers affected
are raw material producers outside the EEC. Cocoa producers and sorne sugar producers fall into this category. From a pure EEC standpoint, then,
these effects would occur outside the Community, and can be assumed to have a negligible impact on EEC social welfare (and might, in fact, have a positive impact, notably on the EEC balance of payments). Second, for
affected suppliers within the EEC, their loss is another's gain, so it can be
argued that what is at stake is the distribution of social welfare, not the absolute size. If beer imports from the Netherlands into Germany were to displace sorne German brewery workers, their local unemployment would
be balanced by increased employment in the vicinity of the exporting Du teh breweries, whose volumes would increase.
par3727agro188 1221 GROUPE MAC

- 427 -
ii. The largest benefits from removing barriers are the indirect effects
Although quantifiable direct benefits are significant, amounting to 2% to
3% of total industry value-added, it is in the area of indirect benefits where
the removal of trade barriers cou Id have the most profound impact. ln total,
one third of the fifty product/markets (2) considered in the study would be
significantly affected, including :
- Beer in Germany,ltaly and Spain Pasta in ltaly and France
- Soft drinks 1n France and Spain - Chocolate in Germany, France,ltaly and Spain - lee cream in Germany and France
Mineral water in Germany and ltaly - Spirits in Spain.
a) The most frequent benefit is the broadening of consumer choice
The broadening of consumer choice, emerged as the most frequent indirect
effect. Removing barriers would significantly increase consumer choice for
sixteen of the fifty productlmarkets considered. ln ten cases, this would
result from an increase in imports. Beer imports into Germany, for example
could increase from '1% to 5% of total consumption as the German market
opens up to large European breweries in close proximity to key population
centers. ln six other cases, consumer choice could be enhanced through
product-line extensions by existing domestic producers. Spanish chocolate
producers might begin substituting high-grade vegetable oils, mainly palm
oil, for butter fat in selected li nes of chocolate products if that barrier were
removed.
(2) Formed from the ten product sectors and the five largest EEC countries.
par3727agro188 1231 GROUPE MAC

- 428 -
Product/markets that could benefit from a particularly significant increase
in consumer choice are summarized below:
ln these product/markets ...
Soft drinks in France and Spain
Pasta in ltaly and France
Beer in Germany
Beer in ltaly and Spain
... Consumers would be able to
consume the following products
Diet soft drinks
Less expensive pasta products
Wider range of imported beers
Lighter beers
b) Ten product markets could experience a significant increase in trade
Closely related to the increase in consumer choice is the indirect effect of an
increase in trade. Wh ile sorne trade increase would result from the removal
of nearly every barrier studied, ten product/markets would experience
moderate to large increases in imports. ln two sectors, the increase cou Id be
substantial, with imports rising from negligible levels to 3%-5% of
domestic consumption. These are the beer market in Germany, discussed above, and the pasta market in ltaly, where removing of the pasta purity
law could engender an influx, at least in the short term, of pasta made from
soft wheat from neighboring countries.
c) Removal of barriers cou Id improve the efficiency of selected industries
lmprovement of the efficiency of a domestic industry is a third important
indirect effect of removing barriers. Nine out of fifty product/markets
should experience moderate to large effects, including industry
restructuring and consolidation.
par3727agro188 /24/
GROUPE MAC

- 429 -
Removing trade barriers in the ltalian pasta industry and the German beer
industry could significantly increase the efficiency of these sectors by
reinforcing the industry consolidation currently ta king place.
Example: Consolidation of the German beer industry
The beer industry in German y pro vides a striking example of how the removal of a barrier could help further consolidate an industry already going through consolidation. There are currently about 1200 breweries in Germany, accounting for 75% of al/ breweries in the EEC. Moreover, two thirds of these breweries are located in Ba varia, where the tradition of drin king on/y local/y brewed beer is strong.
As might be expected, the German beer industry is consolidating; each year about 3% of the breweries are closed. Some breweries are rumored to be trying to establish the first national branded beer in German y through acquisition and consolidation of smaller breweries.
par3727agro 1 BB /25/ GROUPE MAC

- 430 -
The relative fragmentation of the German beer industry is demonstrated by a comparison with that of France, shown in ExhibitB:
Exhibit 8 Distribution of beer production by brewery size
% oftotal production
96 volume
0-10 10-60 60-120 120-500
Brewery output (000 hectolitres)
D Germany ~ France Source : CBMC.
89%
500+
ln German y, 45% of output is produced by breweries whose volume is less that 500,000 hectolitres, compared to just 11 % for France.
With the relaxation of the purity law, the consolidation process in the German brewing industry will be augmented. lt is estimated that foreign breweries will begin exporting to Germany, which could displace up to 20 small and medium sized breweries. Domestic producers, sensing this threat, could step up their consolidation efforts, which could lead to the displacement of an additional 30 breweries. Structural changes in the German retail trade could reinforce these effects, as growing retail chains seek out producers willing to supply branded beer on a nationwide basis and promote it with media advertising.
par3727agro188 /26/ GROUPE MAC

- f3 f-
Such a consolidation will most likely affect the medium-sized German breweries (100,000 - 500,000 hectolitres). Sma/1 breweries will probably be able to continue servicing local market niches, whereas medium and sorne larger breweries will be too large to play a niche strategy and yet too sma/1 to benefit from the considerable scale economies in beer production (see Exhibit 9).
Costs per HL (1)
(Ecu)
60
50
40
30
20
10
0
Estimation :
0
Exhibit 9 Economies of scale in beer brewing
Unit cost (Ecus) for a hectolitre of beer
1,000 2,000 3,000 4,000
Brewery output (000 hectolitres)
5,000
• 5.300KHLisminimumefficientscaleforabrewery (Scherer F.M. chal. <M75) The Economies of multiplant operations, Cambridge (MA)
• 5% cost disadvantage for a brewery 1/3 this size • Cast data for smaller breweries: Schwalbach; We111enstephan; interviews.
(1) Production, sales and marketing, administration; transportation costs are not included.
Given these scale economies, the industry restructuring will ultimately genera te a cost savings, as a larger proportion of beer will be produced by scale-efficient breweries. ln total, the net benefits from removing the German puriz law are on the order of 100 to 200 million Ecus per year, or 3% to 7 % of beer industry value-added.
par3727agro188 1271 GROUPE MAC

- 432 -
d) Extra-community effectiveness is the least significant effect
The least important indirect effect from the removal of trade barriers would
be an increase in extra-community effectiveness, where this is taken to
mean the competitive position of EEC food companies vis-a-vis their non
EEC counterparts. ln two product/markets--mineral water in ltaly and beer
in Germany--removing trade barriers could possibly strengthen the
domestic country's ability to compete in the long term. ln both cases, the
market is highly fragmented, and a global producer does not yet exist. An
industry consolidation, resulting in part from the removal of barriers, might
produce large competitors capable of developing strong competitive
positions within and outside the EEC.
Pursuing further the question of extra-community competitive ness requires
an evaluation of how EEC food companies are positioned competitively
within what could become the largest unified market in the world--the EEC.
This question forms the basis of the next and final chapter.
par3727agro1 88 /28/ GROUPE MAC

- 433 -
C. "Missed opportunities" and EEC competitiveness
Exploring the question of missed opportunities required an expanded scope
of study beyond the product sectors and barriers examined so fa~. The
primary conclusion from this broader view is that there cou Id be significant
missed opportunities in not creating a single market in the foodstuffs
industry, and that removing trade barriers is a necessary (but not sufficient)
prerequisite for capitalizing on these opportunities.
i. The world food industry is consolidating, and global food groups are being created.
The last ten years have been a remarkable period for the world food
industry. From 1976 to 1986, over a hundred major mergers of $50 million or
more took place in the food industry. Moreover, the pace of merger activity
seems to be quickening. From 1984 to 1986, nine acquisitions of over $ 1
billion oc cu rred:
Date Acquiring Country Sector Target company Country Sector Priee CS million) company
5/84 Beatrice Foods USA Diversified Es mark USA Diversified 2840 food food products products
9/84 Nestlé Switzerland Diversified Carnation USA Dairy; 3000 food diversified products food
products
5/85 RJ Reynolds USA Tobacco Nabisco USA Biscuits; 4907 canned foods
9/85 Phillip Morris USA Tobacco General Foods USA Diversified 4750 food products
12/85 Han son Trust UK Diversified Imperial Group UK Food and 2800 products tobacco
1186 Guinness UK Brewery Distillers UK Spirits 3481
4/86 Allied Lyons UK Diversified Hiram Walker UK Spirits 1860 food products
6186 Coca-Cola USA Soft drinks BCI Holdings USA Bottier 1000
7186 Coca-Cola USA Soft drinks JTL Corp USA Bottier 1400
par3727agro188 1291 GROUPE MAC

- 434 -
Global food corporations are being formed through acquisition of
increasingly larger companies. ln these days of debt financing, nearly any
large food company could become the target of a takeover bid.
US companies, by and large, have led this consolidation trend, and they
continue to dominate the world food industry. Over thirty US food
companies have annual sales of $1 billion or more. With the exception of
Unilever and Nestlé, the world"s top ten food groups are US-based firms.
Given their importance in the food industry, and given the comparable size
of their home market to that of the EEC, it is useful to examine more closely
the evolution of the US food industry and the strategies of major players.
ln the last five years, US food companies have been pursuing a two-fold
strategy in their domestic market: become the dominant brand in a product
sector, and achieve nationwide coverage. The logic underlying this strategy
is straightforward. Within a product sector, profitability of brand leaders is
grea ter th an th at of ·second-ti er• brands (see Exhibit 1 0), and nationwide
coverage maximizes volume over which fixed costs (such as advertising,
R&D, and marketing)--critical for the food industry--can be amortized,
leading to further increases in profitability:
Exhibit 10 Return on investment for different brand positions
Brand Position
18%
1
1 3%
2
1 -1% -6%
3 4
Source: PIMS Database, Strategie Planning lnstitute, Cambridge, Mass, USA.
par3727agro1 BB
GROUPE MAC 1301

- 435 -
ln recent years, US food groups have been reevaluating their product
portfolios. Rather than dominating a region with a diverse range of
unrelated products, they are now focusing on achieving nationwide brand
dominance with a selected product range. As a result, US companies have
been acquiring new companies and, more importantly, "swapping"
business units with each other to realize their dual objectives. One top-ten
US food manufacturer is a case in point (see Exhibit 11):
Exhibit 11 Portfolio adjustments by a US food manufacturer
Relative 1. 5 market share (1)
1.0
0.5
1984 b.
1987.
DAI~~TS~ P'10DE ASTA
1984 0
0
1979-1981
7 .. 1987
• 1987
0 ~------L-------~--------~------~--20% 40% 60% 80%
Geographie coverage (% pop.)
The company's two strategie thrusts are to dominate a selected number of product sectors and achieve nationwide coverage. ln the last several years,
through acquisition and "swapping'', it has established leadership in snacks, dairy products, and pasta.
(1) Relative market share for a company is equal toits market share divided by the market share of the market leader. If the company is the market leader, the relative market share is equal toits market share divided by the share of the next largest competitor.
par3727agro188 131 1
GROUPE MAC

- 436 -
Statements in its 1986 annual report underscore the brand
dominance/nationwide strategy :
"We are expanding our leading snack brands ... towards nationwide
distribution."
""We purchased (a leading dairy company) ... picking up many well-l<nown
brands and broadening our geographie rea ch substantially"
""We"ve gone most of the way ... in launching our flagship ... pasta brand
a cross the country."
Given this trend in the US, what is the current trend within the EEC among
European food groups 7
ii. European food corn pa nies are nationally focused
By contrast to the US experience, EEC companies operating in the Common
Market do not follow an "EEC-wide"" strategy. Out of a sample of 46 major
EEC-based food companies, half have a presence in only two or less
countries.
Exhibit 12 Average major countries per product line
for EEC-based<1> companies
Total = 46 companies
< 1 country
3-4 countries 1-2 countries
(1) Major countries are EEC-5: France, Germany, Ital y, Spain, UK. ; EEC-based companies are those whose world headquarters are in the EEC.
par3727agro188
GROUPE MAC /32/

- 437 -
Only about one in ten companies follows an EEC-wide strategy with a
presence in the five largest EEC countries. EEC food companies have by and
large remained nati·onally focused, which, in the broader context of the
Common Market, translates into regional coverage. Moreover, EEC
companies tend to diversify into new product sectors within their home
country, rather than diversifying across countries in a limited number of
product categories.
iii The European food industry will likely undergo a restructuring and consolidation
As a result of a national focus, few major EEC companies enjoy high brand
strength with wide geographie coverage. lnstead, many companies ope rate
in one or a small number of countries, with both strong and weak brand
positions.
Exhibit 13 arrays thirty-eight large EEC food companies across two
dimensions: geographie coverage and brand strength. The shaded area in
the upper right corner represents the desirable position of high brand
strength and wide geographie coverage. This is the comparable position
that US firms have been targeting in the North American market.
Exhibit 13 Brand strength versus geographie coverage
~,B-ra-nd:-st-re-ng"""':th-:"(1~'1 for major EEC companies 100%
90%
80%
70% • 60%
__________________________ ! __________________________ ~
50%
40%
30%
20%
10%
0%
0% 10%
Legend : EEC Sales($ 810)
us CH
0 6 . ~
• Â ..... EEC
0 0.5-1.0 • 1.0·2.0 • 2 0. 5.0 • Above5.0
0
0
• •
20%
• 0
• • • 1
• • • • 0 •
•
30% 40% 50%
0 .... i
• •
60%
' ' ~ ' ' ' ' ' ' ' ' ' ' ' ' ' ' Cl ' ' ' ' ' '
70%
•
80% 90% 100%
Geographie coverage of product line(s)l2r
Note : Only those companies in sample with sales above $ 500 million are represented in this graph.
(1) Proportion of products/markets where the company is the brand leader or co-leader (2) Average number of EEC-5 countnes per product line
par3727agro787 GROUPE MAC
1331

- 438 -
lt is apparent from Exhibit 13 that very few companies operating in the EEC
have reached the desirable quadrant, where they would have a dominant
brand position in most or ali major EEC countries. Obvious historical reasons
account for this result. Differences in taste, culture, and language--not to
mention the national characteristics of the retail trade--have ali explicitly
contributed to the national focus, and thus to the relative fragmentation of
the EEC food industry. But additional, less tangible factors, such as trade
barriers and governmental "protection" of domestic companies from
foreign competition and control, have also played a role. With the creation
of a single market in 1992, ali of these elements will be decreasing in importance .
. As the single market is increasingly realized, it is reasonable to expect EEC
food companies to seek to substantially increase both their brand strength
and their geographie coverage to reach the desirable position. Exhibit 14
plots the average food company operating within the EEC and indicates the
relative increases required across the two dimensions.
Exhibit 14 1986 Average position for companies operating in EEC markets
Brand strength
100%
60%
1986 Average EEC (1l
38% --------------
49%
(1) We1ghted average based on sales of all67 compan1es m sample.
par3727agro787 GROUPE MAC
70% Geographie coverage
1341
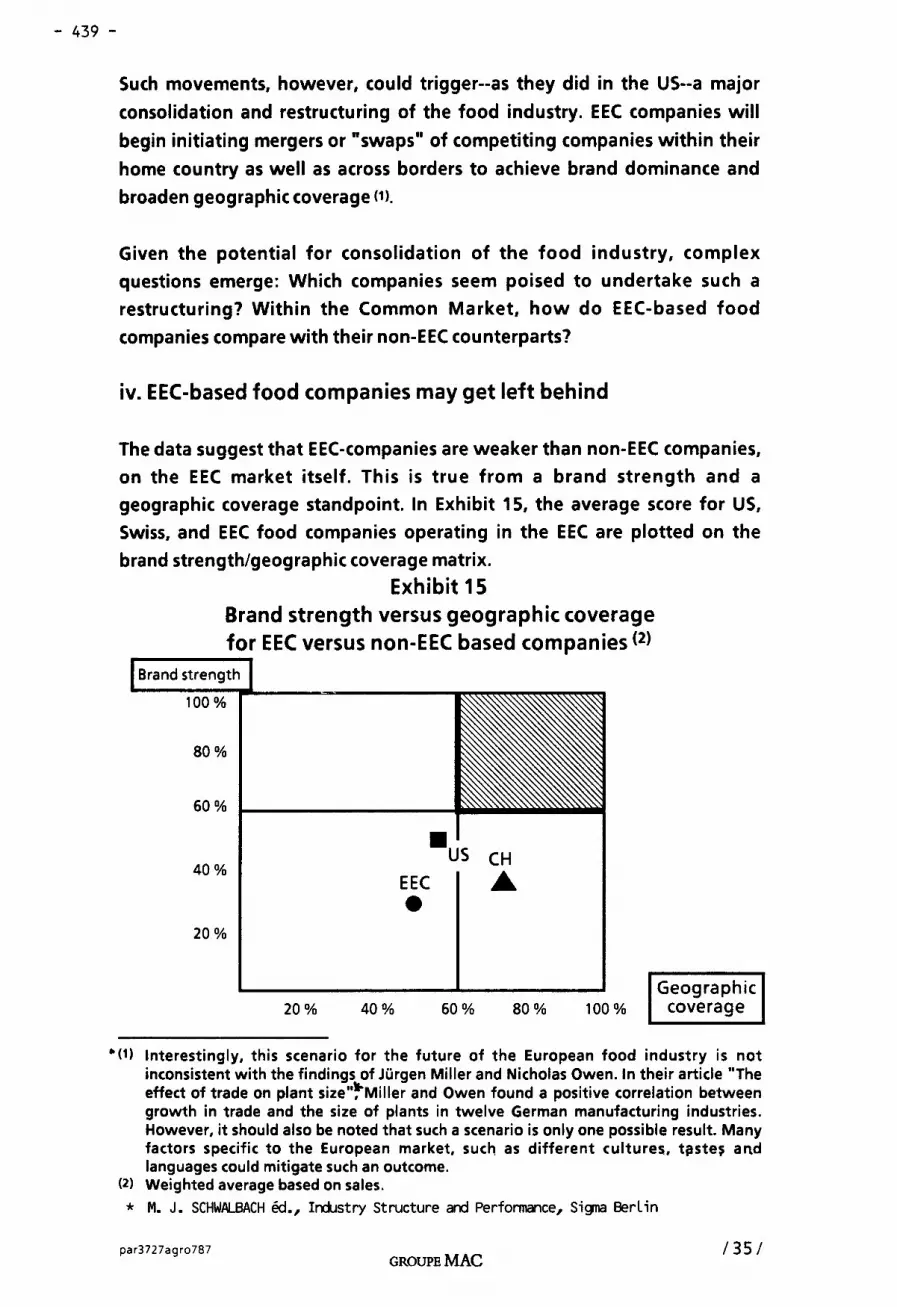
- 439 -
Such movements, however, could trigger--as they did in the US--a major
consolidation and restructuring of the food industry. EEC companies will
begin initiating mergers or "'swaps"' of competiting companies within their
home country as weil as across borders to achieve brand dominance and
broaden geographie coverage (1).
Given the potential for consolidation of the food industry, complex
questions emerge: Which companies seem poised to undertake such a
restructuring? Within the Common Market, how do EEC-based food
companies compare with their non-EEC counterparts?
iv. EEC-based food companies may get left behind
The data suggest that EEC-companies are weaker than non-EEC companies,
on the EEC market itself. This is true from a brand strength and a
geographie coverage standpoint. ln Exhibit 15, the average score for US,
Swiss, and EEC food companies operating in the EEC are plotted on the
brand strength/geographic coverage ma tri x.
Exhibit 15 Brand strength versus geographie coverage for EEC versus non-EEC based companies <2>
.....------, Brand strength
100%
80%
60%
40% •us CH
EEC Â
• 20%
Geographie 20% 40% 60% 80% 100% coverage
• (1) lnterestingly. this scenario for the future of the European food industry is not inconsistent with the findings of Jürgen Miller and Nicholas Owen. ln their article "The effect of trade on plant size"~Miller and Owen found a positive correlation between growth in trade and the size of plants in twelve German manufacturing industries. However. it should also be noted that such a scenario is only one possible result. Many factors specifie to the European market. such as different cultures. tpste~ and languages cou Id mitigate such an outcome.
(2) Weighted average based on sales.
* M. J. SCHWALBACH éd., Industry Structure and Performance, Sigma Berlin
par3727agro787 GROUPE MAC
/35/

- 440 -
Both US and Swiss companies operating in the EEC are doser to reaching
the desirable quadrant than domestic companies. Though they represent
one third of the companies in the sample, non-EEC companies control nearly
half of the strong brand positions within major EEC markets. They account
for over 60% of total equity devoted to the food business. Non-EEC
companies have also been very active in making food acquisitions within
the Common Market.
lt appears, therefore, that in the context of a restructuring of the EEC food
industry, non-EEC firms could be in a relatively stronger position compared
to EEC-firms, and thus could become relatively more successful than their
EEC counterparts.
par3727agro787 /36/ GROUPE MAC
- 441 -
iv. Removal of trade barriers is a necessary but insufficient condition for ensuring EEC competitiveness.
While removing trade barriers is a necessary prerequisite for achieving the
benefits the "1992 Common Market", and for ensuring the continued
competitiveness on a global scale of the EEC food industry, it is not enough.
The removal of trade barriers will have a direct benefit on the order of 2%·
3% of total industry value-added. Indirect benefits will be significant, and
will serve to increase consumer choice and improve the efficiency of
selected industries.
The existence of trade barriers, both those that were the subject of this
study as weil as others, has also served to protect potentially weak
domestic companies, and has encouraged strong companies to expand only
domestically rather than attempt cross-border expansion. These results of
trade barriers have reinforced the relative fragmentation of the EEC food
industry. Removing these barriers should decrease or eliminate these
tendencies.
However, other critical factors have a major impact on achieving the full
benefits of the "1992 Common Market". Among the most important are
ru les on competition, and in particular merger and acquisition laws. If there
were to be a natural trend towards consolidation in the food industry, and
at the same time mergers were restricted, EEC firms could be prevented
from exploiting the full benefits of the Common Market. Given that EEC
firms are relatively behind their non-EEC counterparts, such restrictions
cou Id widen this gap.
Regulations on financial markets must also be considered. Global
companies no longer rely on local financing, but seek funds on a global
basis. Restrictions in cross·border financing could serve as a further
impediment to EEC companies seeking to expand across borders.
Finally, the attitudes of member governments are very important. ln many
cases the attitudes are a deciding factor in the success or failure of a major
cross-border merger. Prevailing nationally-based attitudes cou Id be a major
(albeit invisible) obstacle to EEC companies seeking to expand their
geographie coverage and grow torea ch a global scale.
par3727agro787 1371 GROUPE MAC


- 443 -
13.
Le •toit de la Non-Europe•
des produits de construction
B.I.P.E. avec ses partenaires d'Euroconstruct


e Bureau d'Informations et de Prévisions ll:conomiques
~ ~ LE COUT DE LA NON-EUROPE
DES PRODUITS
DE CONSTRUCTION
Note de sy~thèse
Etude réalisée pour le compte de la Commission des Communautés Européennes par le Département Construction du B.I.P.E. associé à ses partenaires du groupe européen de prospective EUROCONSTRUCT
f4ARS 1988
Bureau d'Informations et de Prévisions Économiques- 122, av. Charles-de-Gaulle 92522 Neuilly-sur-Seine Cedex. Tél. (1) 47 47 11 66 ·Télex BIPE 610602F


- 447 -
SOMMAIRE
page
INTRODUCTION . ...........................•..•.......... . 1
I- DONNEES MACRO-SECTORIELLES: MARCHES ET ECHANGES •••. 3
I .1 - Marchés nationaux . ............................... 3 I. 2 - Commerce extérieur . ............................... 3
II - ANALYSE DES BARRIERES ....•••••••••••••••••..••••.• 6
II.1- Méthode de travail et résultats d'ensemble •..... 6 II.2 - Barrières liées aux normes, agréments
et avis techniques .............................. 6 II.3- Obstacles de nature socio-économique •••.•...... 10
III- SCENARIO D'ACHEVEMENT DU MARCHE INTERIEUR ....... 12
IV- QUANTIFICATION DES EFFETS ••••••••....••••••.•.•.. l6
IV .1 - Méthodologie •........•.......•..•.......•...... 16 IV. 2 - Effets directs . ................................ 18 IV.3- Effets indirects ......•....•••••••.••.....••••• Ll
CONCLUSION . .....•..................................... 24
ANNEXES
Annexe 1: Nomenclature des produits de construction ••. 26 Annexe 2: Produits sélectionnés pour les enquêtes ..••. 27

- 449 -
INTRODUCTION
1 - La spécificité des produits de la construction suggère, a priori, deux argumentations contradictoires quant à f'ampleur du coO.t de la Non-Europe dans ce domaine.
- La première considère la très forte dimension culturelle de la filière construction. Les modes de vie, la répartition des revenus, les préférences esthétiques imposent des particularismes nationaux, régionaux, parfois locaux dans le mode de construire. Chaque ouvrage, et il s'agit toujours d'un prototype, est inséré dans un tissu réglementaire extrêmement contraignant. Pour un produit, passer une ·frontière, c'est changer d'univers sociologique, économique, réglementaire et technique.
Ce mouvement est de plus particulièrement difficile pour les produits de construction qui n'ont pour la plupart pas connu la substitution de l'intelligence à la masse et au volume constatée dans d'autres secteurs: un seul logement pèse généralement plus de 100 tonnes. On connaît beaucoup d'exemples de prix de produits manufacturés destinés à la construction qui doublent tous les 150 kilomètres en raison des frais de transport.
Les tenants de cette thèse producteurs locaux bénéficient sur avantage comparatif dont les entraves sont qu'un aspect marginal.
démontrent ainsi que les leur marché intérieur d'un visées par le Livre Blanc ne
- L'autre argumentation privilégie la dimension exceptionnelle du marché final de la construction dont les 320 milliards d'Ecus représentent, selon l'expression d'un grand industriel, le véritable marché de l'avenir. Pour un industriel qui entre sur un nouveau marché national, le potentiel de chiffre d'affaires est très élevé. De même, "l'industrialisation" du processus de production et la pénétration de l'informatique n'en sont, dans cette filière, qu'à la première phase de développement.
Par ailleurs, les flux d'importation et d'exportation de produits de construction, qui ne sont pas tous pondéreux {équipements électriques, produits manufacturés en plastique et en bois), sont loin d'être négligeables et progressent régulièrement. Les taux de . pénétration {importations/marché intérieur) atteints en 1986 sont de l'ordre de 15% en Italie, 20% en RFA, 30% en France et 50 % au Royaume-Uni.
En l'absence d'entraves, il y aurait donc à la fois un potentiel et une possibilité de développement des échanges des produits de construction entre les pays européens. La perspective de

- 450 -
l'abolition des entraves justifierait les stratégies de conquête du marché européen que s'apprêtent dès maintenant à engager la majorité des industriels rencontrés.
2 - Pour évaluer le coût de la Non-Europe, les instituts membres d'EUROCONSTRUCT se sont efforcés de surmonter la grande difficulté due à la diversité des produits et des situations locales en enquêtant dans les 12 pays de la Communauté un échantillon de plusieurs centaines d'entreprises. Une sélection d'une cinquantaine de produits a résulté d'un compromis difficile entre la nécessité d'une couverture typologique complète des produits utilisés dans la construction et celle d'un choix de produits pour lesquels l'ouverture du marché européen représente un enjeu économique réel.
C'est sur cette base qu'ont été valorisées les variables exogènes des modèles économétriques utilisés par la Commission des Communautés Européennes pour mesurer le coût de la Non-Europe. Les difficultés méthodologiques de cette démarche sont nombreuses, la plus évidente étant l'extrapolation au niveau macro-économique des informations essentiellement qualitatives recueillies au niveau micro-économique.
3 - Cette synthèse comporte quatre parties:
- La première partie établit une évaluation des principales données macro-sectorielles du marché et du commerce extérieur des produits de construction, à partir des informations très fragmentaires disponibles sur un "secteur" qui n'est individualisé dans aucune des sources statistiques existantes.
- La deuxième partie évalue l'importance relative de toutes les entraves qui s'opposent à l'achèvement du marché européen des produits de construction; elle décrit succinctement les entraves les plus lourdes et les plus spécifiques du secteur.
- La troisième partie présente le scénario d'achèvement du marché européen des produits de construction que nous avons retenu; elle précise les échéances de disparition des entraves à la libre ciculation des différentes catégories de produits.
- La dernière partie consacre un chapitre à chacun des deux types d'effets dont les services de la Commission ont souhaité obtenir une quantification distincte: les effets directs qui découlent de la répercussion mécanique sur les prix des économies permises par la suppression des entraves; les effets indirects que l'on peut attendre des efforts de rationalisation et des nouvelles stratégies européennes qu'engageront les entreprises pour répondre à l'accroissement de la pression concurrentielle et aux opportunités créés par la suppression des entraves.
2

- 451 -
I - DONNEES MACRO-SECTORIELLES: MARCHES ET ECHANGES
I.l - MARCHES NATIONAUX
L'estimation globale des marchés intérieure} des produits de construction manière suivante:
nationaux (consommation a été effectuée de la
-la part des consommations intermédiaires de produits de construction de la branche construction (bâtiment et travaux publics} a été évaluée à partir des tableaux entrées-sorties 1980 des 12 pays de la Communauté (source: Eurostat};
-les coefficients techniques ainsi calculés ont été appliqués aux estimations EUROCONSTRUCT concernant la production de la branche B.T.P. des 12 pays de la Communauté en 1985.
Pour les 5 pays sur lesquels a été effectuée une quantification des effets directs et indirects de l'achèvement du marché européen, les marchés nationaux des produits de construction ont été décomposés selon des nomenclatures plus fines en 5 et 60 postes (cf. annexe 1}, à partir des informations partielles obtenues auprès des fédérations professionnelles des industries concernées.
Notre évaluation du marché des produits de construction de l'Europe des 12 s'établit à 110 milliards d'Ecus, soit 29 %du montant total de leur production estimée à 380 milliards d'Ecus (1). La répartition en valeur des consommations intermédiaires de produits de construction des entreprises de BTP dans les 4 plus grands marchés (RFA, Italie, France, UK) est la suivante
.produits à base minérale non métallique: 43 %
.produits à base métallique ••..•.•....•. : 22%
.produits à base de bois •.....••.•.....• : 14%
.produits à base chimique ou textile .••. : 13%
.produits d'équipement électrique •...... : 8%
I.2 - COMMERCE EXTERIEUR
Notre évaluation construction est basée publiées par l'OCDE
sur pour
des échanges extérieurs de produits de une exploitation spécifique des données l'année 1985, par application de
--------------------------------------------------------------------(1} dont 320 milliards d'Ecus de production des entreprises de construction et 60 milliards d'Ecus d'achats directs des clients et d'autoproduction des entreprises hors BTP et des ménages.
3

BIPE/EUROCONSTRUCT
En mi 11 i ards d'Ecus
30
20
10 -
R.F.A. Italie
LES MARCHES NATIONAUX DES PRODUITS DE CONSTRUCTION EN 1985
(Y compris la consommation des entreprises hors BTP et des ménages)
Total
France Roy.-Uni ·Espagne Pays-Bas Belgique Danemark Grèce Portugal Irlande Luxeml>ourg
~ U1 N

- 453 -
coefficients techniques BTP à 11 postes de la nomenclature à deux chiffres {CTCI Rev 2).
Des recoupements ont été effectués avec les chiffres fournis pour le secteur bâtiment par le ministère de l'Equipement de la France, seul pays ayant à notre connaissance effectué une étude détaillée de ses échanges de produits de construction {"tableau de bord bâtiment des industries de la construction 1985-1986").
Le commerce extérieur des 5 plus grands pays est à peu près également réparti entre la CEE et les pays hors CCE, mais il est pratiquement équilibré avec la CEE {taux de couverture = exports/imports = 1,1), alors qu'il est largement bénéficiaire vis-àvis des pays hors CEE {taux de couverture= 1,6). Cette situation d'ensemble recouvre des disparités assez importantes: les soldes commerciaux de la RFA, de l'Italie et de l'Espagne sont assez nettement positifs, tandis que celui du Royaume-Uni est négatif et que celui de la France présente un équilibre précaire {les données disponibles pour 1986 montrent que le solde français est également devenu négatif).
La répartition CEE / hors CEE du commerce de chacun de ces pays est assez significative des positions concurrentielles et des traditions commerciales des uns et des autres. On constate en particulier une nette extraversion des échanges du Royaume-Uni, alors que les importations de l'Espagne, de la France et de l'Italie proviennent très majoritairement de la CEE.
Pour les données relatives suivantes:
4 plus grands pays (RFA, Italie, France, UK), les aux différentes catégories de produits sont les
E-I I/C (E+I)/C .produits à base minérale non métallique: +2,9 Gécus 22% 52 % .produits à base métallique ............. : +1,1 Gécus 25% 55 % .produits à base de bois .•...•.......... : -0,8 Gécus 18% 28 % .produits à base chimique ou textile .... : +1,2 Gécus 47% 105 % .produits d'équipement électrique ....... : +0,7 Gécus 64% 139 %
(E: Exports; !: Imports; C: Consommation intérieure)
Bien que le commerce extérieur des produits minéraux soit limité par les coûts de transport, leur poids économique très important dans l'ensemble des produits de construction (43% en valeur) leur donne une place essentielle dans le solde commercial des 4 pays. L'hypothèse selon laquelle les produits de construction seraient moins concernés par la suppression des barrières à la libre circulation des biens en Europe est réfutée par l'importance des taux d'internationalisation constatés ((E+I)/C).
5
- 454 -
II - ANALYSE DES BARRIERES
II.l - METHODE DE TRAVAIL ET RESULTATS D'ENSEMBLE
L'évaluation du poids des entraves rencontrées sur le marché européen est le résultat d'environ 200 entretiens directifs avec des industriels des 12 pays de la Communauté (30 dans les 5 plus grands pays et 8 dans les autres). 2 à 12 catégories de produits ont été sélectionnées dans chaque pays (cf. annexe 2), avec une représentativité variant de 9 à 19 % pour les grands pays et de 3,5 à 12 % pour les petits pays (nombre de catégories de produits sélectionnées 1 nombre total de catégories de la nomenclature retenue pour l'étude}. La représentativité de l'échantillon étudié en termes de chiffre d'affaires total des entreprises interviewées est de l'ordre de 5 %de l'ensemble de la production communautaire de produits de construction. La pondération des entraves au niveau communautaire a été effectuée en tenant compte de l'importance relative des marchés nationaux.
En interrogeant les industriels sur l'ensemble des obstacles ressentis, on a tenté de mesurer le poids relatif des entraves résultant des réglementations nationales prises en considération par le Livre Blanc et des obstacles de nature sociologique ou économique dont la disparition ou l'affaiblissement éventuels ne pourront être qu'une conséquence indirecte à moyen terme des mesures programmées par le Livre Blanc: exigences diversifiées de la clientèle, coûts des facteurs, etc.
Les deux tableaux ci-joints résument le résultat de cette évaluation; les entraves les plus importantes sont commentées dans les paragraphes suivants. Les résultats globaux par pays doivent être interprétés avec une grande prudence, car il est clair que l'appréciation d'un industriel sur les difficultés de pénétration d'un marché est liée à l'enjeu économique plus ou moins important qu'il représente pour lui.
II.2 - BARRIERES LIEES AUX NORMES,AGREMENTS ET AVIS TECHNIQUES
Parmi les entraves, les problèmes liés aux normes arrivent en tête: 70 % du nombre de produits étudiés connaissent des difficultés dans leurs démarches pour obtenir l'homologation aux normes étrangères et 60% ne sont, d'une manière ou d'une autre, pas conformes à ces normes. Ceci est dû à la multiplicité et à la complexité des normes spécifiques au domaine de la construction, qui traduisent l'ensemble des impératifs pesant sur l'édification d'un ouvrage dans un pays donné; elles sont le reflet des divergences liées à l'art de construire en Europe. C'est pour cette raison que, même si les producteurs citent peu les réglementations nationales
6

- 455 -
BIPE/EUROCONSTRUCT NON-EUROPE DES PRODUITS DE CONSTRUCTION
EVALUATION DES ENTRAVES PRISES EN COMPTE PAR LE LIVRE BLANC
Poids de~ Pays oO sont rencontrées les entraves entraves
en % RFA F I UK E NL B+L OK GR p IR l. -Préférence nationale des
maîtres d'ouvrage 10,5 •••• •••• • • • •• •• • • • • 2 - P~atiques de prescription
9,5 des maîtres d'oeuvre •••• ••• • • • •• •• • 3 - Pratiques et qualifications 6,0 des entreprises •• •• • • • • • 4 - Réglementation de la 11,5 ••• • • • • • • construction
5 - Réglementation et normes rel a-tives aux produits 17,0 •••• •••• • ••• ••• • •• • • ••
6- Agréments et homologations 18,0 •••• •••• • ••• • • •• • • 7 - Assurances et 3,0 contrôles techniques • • • • 8 - Contrôles en douanes 6,5 • • •••• •••• • • ~ - Différences de taux de TVA 2,0 • •
l.O· Circulation des capitaux 5,0 • • l.l.· lenteur d'élaboration des régle- 11,0 • • •• mentations européennes • • •
TOTAL .....•...... 100,0 24 25 6 17 14 11 8 4 7 2 1
BIPE/EUROCONSTRUCT NON-EUROPE DES PRODUITS DE CONSTRUCTION
EVALUATION DES OBSTACLES DE NATURE SOCIO-ECONOMIQUE
Poids der. Pays où sont rencontrées les entraves entraves
en % RFA F I UK E NL B+L OK GR p IR l. - Exigences différentes de la
clientèle finale 27 ••• ••• • • •• 2- Taux de change 17 .. • •• • 3 - Différences de coût de
main-d'oeuvre 21 •• • •••• •• • • 4- Différences de coût des • • •• • •• • • j nputs 35
TOTAL .•...•.. - .. -. 100 6 6 3 7 6 2 0 0 2 3 0
7

- 456 -
relatives à la conception et à la construction des ouvrages où s'insèrent les produits comme une barrière, ces réglementations constituent la partie immergée de la problématique des normes.
Cette complexité des normes est accentuée par l'hétérogénéité des pratiques des organismes de contrôle et d'homologation en matière de test: la résistance au feu est testée différemment en France, en Allemagne Fédérale et en Grande-Bretagne, et, même pour une donnée homogène comme le coefficient de conductibilité, les résultats diffèrent selon les organismes nationaux. La difficulté d'obtention des agréments ou des certificats de conformité aux normes, du fait de la fréquente dispersion géographique des lieux de contrôle, se mesure aussi en termes de coûts et de délais.
Pour la difficulté d'obtention des agréments et avis techniques, comme pour les entraves liées aux normes pesant sur la nature et les caractéristiques des produits, la R.F.A. et la France arrivent largement en tête, en étant citées dans 85 % des enquêtes pour les deux entraves. C'est dans ces pays que les normes sont les plus nombreuses, et c'est aussi dans ces pays qu'elles ont le plus de poids sur le comportement des prescripteurs et acheteurs de produits de construction.
Les exportateurs notent en R.F.A. une vigilance particulière de la part des entreprises utilisatrices et des maîtres d'ouvrage: il est difficile voire impossible d'y vendre des produits hors normes, ou non agréés (produits nouveaux), du fait des contrôles systématiquement effectués lors de l'attribution des permis de construire. Les normes réglementaires liées à des exigences essentielles (sécurité et hygiène) sont également plus sévères en R.F.A. qu'ailleurs (résistance au feu et seuil de dégagement de formol des colles particulièrement).
La difficulté d'obtention des certificats de conformité aux normes françaises semble également constituer une entrave importante à l'exportation pour les divers industriels européens interrogés. Les certificats du Centre Technique du Bois semblent notamment longs, sinon impossibles à obtenir pour les exportateurs européens en France.
Les exportateurs anglais comptent parmi les industriels européens qui sont pénalisés à l'exportation par les niveaux d'exigences techniques très élevés et les systèmes de normalisation sévères et contraignants existant en R.F.A., en France et en Hollande. L'importance de ces obstacles se trouve d'ailleurs accentuée par l'originalité des British Standards en comparaison des autres systèmes de normalisation européens. Les fabricants anglais parviennent, malgré tout, à éviter ce type d'entraves grâce au développement de produits conformes aux normes US et UK qui trouvent
8

- 457 -
des débouchés hors CEE dans les nombreux pays qui ont calqué leur système de normalisation sur les modèles américain ou anglais.
Les autres pays cités fréquemment pour les problèmes de normes sont tous les pays du Nord de la C.E.E.: Grande-Bretagne et Benelux essentiellement. Les pays du Sud, ayant peu de normes en vigueur, acceptent souvent les normes étrangères. Il faut néanmoins citer le cas de l'Espagne, qui, bien qu'étant peu exigeante en général, met en place pour certains produits des homologations difficiles à obtenir {notamment pour les produits d'étanchéité). Dans ces pays, c'est plutôt la lenteur des contrôles, attribuée au sous-dimensionnement des organismes qui les effectuent, qui est dénoncée comme un frein à la pénétration des produits.
D'une manière générale, beaucoup de normes sont particulièrement discriminatoires, parce qu'elles sont déterminées par l'environnement différent d'un pays à l'autre -de la mise en oeuvre des produits de construction. C'est le cas typique de nombreux appareils électriques, comme les prises de courant, les boitiers, ainsi que les chauffe-eau, et aussi de certains appareils sanitaires {robinets): des contraintes extérieures telles que la tension du secteur, l'entre-axe des prises ou la pression de l'eau courante pèsent sur les conditions d'utilisation. Ceci est caractéristique de nombreux produits destinés à l'équipement intérieur des bâtiments.
Face à cette situation, certains producteurs préfèrent fabriquer des gammes aux normes étrangères ou, mieux, internationaliser leur production. Les industriels néerlandais, par exemple, comme d'autres industriels européens, considérant que les entraves liées aux normes et procédures de certification différentes en Europe {notamment en R.F.A., France et Belgique) sont difficiles à surmonter, préfèrent souvent recourir à l'implantation directe de filiales à l'étranger. C'est le cas de certains producteurs de peinture.
L'absence de normalisation ou un certain laxisme dans l'application de la réglementation, ce qui semble être le cas en Italie et en Espagne, ont paradoxalement un effet comparable, puisqu'ils créent des conditions concurrentielles insupportables pour les producteurs étrangers dont la fabrication respecte de sévères spécifications: il ieur faut alors créer une gamme hors normes à prix réduit.
D'après plusieurs producteurs, on peut penser que la convergence par le haut et par le bas des exigences des différents pays et clients vers des normes européennes supprimerait une partie des niches dues aux exigences de certains acheteurs, tels par exemple les hôpitaux qui devraient abandonner leurs exigences trop spécifiques dans un contexte d'unification technique du marché.
9

- 458 -
11.3 - OBSTACLES DE NATURE SOCIO-EOONOMIQUE
II.3.1 - DIFFERENCES DE COUT DE LA MAIN-D'OEUVRE
40 % différences de nuisent à la principalement
des industriels interrogés déclarent que les coQt de la main-d'oeuvre entre les pays de la C.E.E. compétitivité de leurs produits à l'exportation,
les industriels français, anglais et belges.
Des fabricants français, qui proposent des produits de haute technologie incorporant peu de main-d'oeuvre industrielle, déclarent rencontrer des difficultés pour exporter en Espagne, au Portugal et dans une moindre mesure en Italie. Par ailleurs, les entreprises de construction espagnoles ont l'habitude de recourir à des technologies comportant une forte part de valeur ajoutée sur le chantier, ce qui limite les débouchés de produits industriels conçus au contraire pour réduire les temps de mise en oeuvre.
Les industriels anglais soulignent également l'entrave relative à la faiblesse des charges sociales auxquelles sont soumis les fabricants espagnols, portugais et italiens.
Un industriel du verre français donne quelques chiffres pour son secteur:
Coût salarial ouvrier en 1986 {Ecus/heure, toutes charges)
France R.F.A. Belgique Italie Espagne 15,1 15,3 13,4 11,8 9.3
On doit cependant observer que ces différences ne sont pas spécifiques à l'industrie des produits de construction et qu'elles n'interviennent que pour une part seulement dans la compétitivité relative des industries européennes, un autre facteur important étant leur intensité capitalistique. Quelques industriels considèrent en outre que les différences de coQts salariaux disparaitront lorsque les membres récents de la Communauté seront parfaitement intégrés aux mécanismes de concurrence au sein de la c~.
II.3.2 - EXIGENCES DIFFERENTES DE LA CLIENTELE FINALE
Une partie des industriels européens interrogés considère comme un obstacle important la diversité des exigences de la clientèle finale dans les différents pays de la CEE. Certains exportateurs font ainsi de gros investissements dans le design afin de satisfaire les préférences esthétiques variées de leurs clients
10

- 459 -
européens. C'est le cas de revêtements de sols appareil de production divergentes des clients.
des producteurs de carreaux de céramique et par exemple, qui se doivent de posséder un flexible pour s'adapter aux exigences
La clientèle finale semble particulièrement exigeante dans des pays tels la France, la R.F.A. et les Pays-Bas; les producteurs belges se trouvant les seuls à considérer comme un obstacle à l'exportation les exigences spécifiques de la clientèle anglaise.
Pour une partie importante des producteurs européens, toutefois, la diversité de la demande ne représente pas un frein majeur à l'exportation. C'est le cas de ceux qui proposent des produits cachés dans les constructions, tuyaux en plastique et en béton par exemple, pour lesquels le design n'est qu'accessoire. On peut estimer à 55% environ la part du marché communautaire des produits de construction qui échappe ainsi à cet obstacle.
Si les observations des industriels dans ce domaine donnent une idée du prix que doit payer l'Europe pour sa diversité socio-culturelle, il est clair que la réponse à cette diversité fait partie des contraintes auxquelles doit se plier un industriel dans une économie libérale. Ne pourraient être considérées comme des entraves que des références abusives aux préférences d'une clientèle nationale afin de justifier le maintien d'une entrave normative.
II.3.3 - DIFFERENCES DE PRIX DES MATIERES PREMIERES ET DE L'ENERGIE
Les industriels anglais citent comme pays dans lesquels il est difficile d'exporter en raison du faible prix de l'énergie, la R.F.A., la France, l'Italie et l'Espagne. Certains d'entre eux se plaignent de ne pouvoir bénéficier de tarifs préférentiels comparables à ceux qui sont consentis aux gros consommateurs dans des pays comme l'Italie et l'Espagne. D'autres industriels de produits de construction sont affectés par le prix des bitumes, plus élevé en Grande-Bretagne qu'en France et en R.F.A.
En France, le faible prix de ce pays.
certains l'énergie
producteurs remarquent également que en Italie limite les exportations vers
On peut toutefois em1se à propos des coats respectives des différents seulement du prix relatif facteur dans la technologie
faire 1c1 la même remarque que celle salariaux: les positions concurrentielles industriels dans ce domaine dépendent non de l'énergie, mais aussi du poids de ce
de production qu'ils ont adoptée.
11

- 460 -
III - SCENARIO D'ACHEVEMENT DU MARCHE EUROPEEN
La complexité du secteur nous a contraint à faire reposer la quantification des effets directs et indirects sur l'extrapolation raisonnée à l'échelle macro-sectorielle des résultats des enquêtes, plutôt que sur un exercice de modélisation à partir d'une série d'hypothèses théoriques choisies par nous. Les hypothèses retenues concernant le scénario d'achèvement du marché européen sont en fait celles auxquelles se référaient explicitement ou implicitement les industriels interrogés en fonction de leur propre analyse, plus ou moins approfondie, des conséquences possibles de la mise en oeuvre du Livre Blanc.
Bien que les questions posées aient invariablement été précédées de l'énoncé: "Au cas où toutes les barrières visées par le Livre Blanc seraient supprimées ou substantiellement réduites", il est possible de reconstituer assez fidèlement le scénario effectif sur lequel ont reposé les réponses, à partir des commentaires généraux recueillis (cf. graphique à la fin du chapitre).
A - Hypothèses de court terme
Les données essentielles servi de référence à l'évaluation différés sont les suivantes:
du scénario de court terme ayant des effets directs immédiats et
1°) Barrières fiscales fiscalités indirectes, avec administratifs et des coûts simplification des procédures.
pour de
et physiques: harmonisation des conséquence l'allégement des frais
passage aux frontières lié à la
2°) Barrières techniques:
- déréglementation et donc baisse des coûts des transports (liberté des prestations de service);
- libre circulation des capitaux permettant l'accélération de la concentration financière déjà engagée;
- ouverture de la commande publique à la concurrence communautaire, avec des conséquences relativement limitées dans le domaine des produits de construction; l'amélioration de la Directive "travaux" (71/305/CEE) provoquéra une augmentation sensible du pourcentage d'entreprises étrangères remportant des appels d'offres, avec une propension à utiliser des produits de leur pays d'origine; l'amélioration de la Directive "fournitures" (77/62/CEE) augmentera l'ouverture de la commande publique aux produits étrangers, limitée toutefois par la faible importance des achats directs de produits de construction de la part des promoteurs publics(sauf dans les
12

- 461 -
secteurs actuellement exclus du champ de la Directive: énergie, transports, eau et télécommun~cations);
développement de la reconnaissance par les pays de l'équivalence des normes et adoption d'une série limitée de normes harmonisées, essentiellement dans le domaine des demi-produits, notamment sous l'effet de l'émergence de la "nouvelle approche" de la Communauté qui limite l'harmonisation législative à l'adoption par les Directives des seules exigences essentielles de sécurité, de santé ou d'autres intérêts collectifs.
Ces hypothèses de court terme, dont la principale est l'effet encore relativement limité de la directive "produits", devraient conduire à une situation favorable pour certaines catégories de produits: les produits de base et les demi-produits pondéreux pour lesquels des démarches d'harmonisation ou de reconnaissance réciproque des normes sont déjà engagées; les produits destinés au bricolage et plus généralement à l'amélioration et à l'entretien des bâtiments existants, qui sont peu sensibles à l'obstacle des normes et règlements. Ces produits bénéficieront à plein de la réduction des coQts de transport et des facilités accrues de concentration financière {avec un impact immédiat sur les frais de siège et les coQts deR & D).
B - Hypothèses de moyen terme
Les effets indirects dynamiques évoqués par les industriels interrogés, et donc ceux que nous avons quantifiés au niveau macro-sectoriel, doivent être considérés comme situés à l'issue d'une période de l'ordre de cinq ans.
Il est très important de prendre en considération le fait que, pour les produits de construction, cette période ne sera probablement que transitoire, car elle correspondra à une phase de développement- mais pas encore de maturité -de l'harmonisation réglementaire. On sait en effet qu'une des conditions de cette harmonisation est la mise en place de documents techniques intermédiaires {Eurocodes,etc.) nécessaires à l'accélération de la production de normes harmonisées et au fonctionnement efficace de l'Agrément Technique Européen, du fait de l'articulation étroite existant nécessairement entre les textes réglementaires et pararéglementaires relatifs à la construction des ouvrages et ceux relatifs à une partie des produits industriels intégrés dans ces ouvrages {il est fréquent qu'un produit de construction ne puisse être considéré comme satisfaisant à une exigence essentielle qu'en référence à un mode de mise en oeuvre donné}.
Or, les textes intermédiaires précités, même si l'on doit espérer qu'ils seront élaborés rapidement grâce à l'impulsion donnée par la Directive "produits", ne pourront être mis en application que
13

- 462 -
relativement lentement, puisqu'ils supposeront fréquemment la r~mise en cause des savoir-faire de l'ingénierie {méthodes de calcul notamment} et des entreprises de construction (savoir-bâtir} dans un secteur dont la capacité d'adaptation est limitée par son extrême atomisation (95% des entreprises de construction européennes ont moins de 50 salariés}.
Même si l'élimination des barrières techniques n'est pas encore totalement achevée au bout de cinq ans, notre hypothèse principale est toutefois celle d'une diminution importante des barrières liées aux normes et agréments, celles-ci s'abattant pour deux types de produits:
- ceux qui ne comportent pas de spécifications techniques renvoyant à des exigences essentielles, grâce à la disparition des systèmes normatifs de nature descriptive anciennement mis en place à des fins implicites de protection des industries nationales;
- ceux comportant des spécifications techniques renvoyant à des exigences essentielles, mais dont la nature n'implique pas une articulation forte entre normalisation des produits et codification de la construction, notamment les produits de finition {exigences essentielles liées par exemple à la toxicité des fumées} et de cloisonnement, ainsi que certains produits d'équipement et d'enveloppe, pour lesquels on verra apparaître. des normes harmonisées.
Ces produits d'échelle permises par leur production.
pourront bénéficier la standardisation
C - Hypothèses de long terme
pleinement des économies de leur conception et de
Cette phase se situe au-delà industriels interrogés se sont référés. A espérer un rapprochement des savoir-faire en oeuvre suffisant pour que normes s'étendent systématiquement aux produits
du terme auquel les cette échéance, on peut
de conception et de mise et agréments européens
de structure, d'équipement et d'enveloppe non encore atteints d'harmonisation.
par la phase précédente
La généralisation des économies d'échelle et l'accélération de l'innovation qui pourraient résulter de cette troisième phase, et dont on peut penser qu'elles seront favorisées par une plus grande homogénéité de la demande (modes de vie} et de l'environnement (tension électrique, pression de l'eau, etc.}, justifient notre affirmation concernant l'importance des effets dynamiques différés au-delà de ceux quantifiés à l'issue de la deuxième phase.
14

....... (.Tl
BIPE/EUROCONSTRUCT NON-EUROPE DES PRODUITS DE CONSTRUCTION
SCENARIO D'~~OLITION DES BARRIERES TECHNiQUES SPECIFIQUES
% En valeur des produits de construction soumis à des barrières techniques spécifiques
100%
50%
0-1 0
Court terme
1 1
-------- - Sans le livre blanc ---------
Avec le livre blanc
--
Moyen terme----~~r-------~L~o~n~g~t~e~rmm~e---------------3 4 5 Année

- 464 -
IV - QUANTIFICATION DES EFFETS
IV.l - METHODOLOGIE
L'ampleur du champ des activités couvert par l'étude et son extrême diversité en termes de structures des professions, de fonctions de production, d'internationalisation, de sensibilité à la mise en oeuvre du Livre Blanc, posaient un redoutable problème de représentativité statistique de l'échantillon enquêté.
De ce fait, il n'aurait pas été légitime de mener des extrapolations fondées sur des modélisations, faute de bases de données suffisantes pour spécifier ces modèles. On a donc choisi une démarche empirique, en traduisant par des valeurs chiffrées les relations de comportement des industriels: baisses de coûts unitaires associées à des hypothèses d'augmentation de la production (économies d'échelle); augmentation des exportations permise par la baisse des prix unitaires (élasticité prix relatif des exportations);etc.
La quantification des effets directs a été limitée aux quatre plus grands pays: RFA, France, Italie et UK. L'Espagne a également été prise en compte pour la quantification des effets indirects, car la mesure des conséquences de l'entrée récente dans la Communauté de pays de l'Europe du Sud nous a semblé indispensable à la compréhension des enjeux à moyen terme de l'achèvement du grand marché intérieur. La représentativité de l'échantillon étudié dans les cinq pays est d'environ 5 % (production totale des fabricants rencontrés/ production totale des cinq pays).
A - Effets directs
Pour mesurer les effets directs, immédiats et différés, la méthodologie adoptée a comporté plusieurs phases.
1°) Choix de produits, généralement très finement individualisés (par exemple: poutrelles préfabriquées en béton précontraint) qui, dans chaque pays, illustrent les interrogations que soulève le Livre Blanc.
2°) Rattachement des produits choisis aux postes de la nomenclature des produits de construction en 60 postes établie pour l'étude (ci-jointe en annexe 1).
3°) Elaboration pour chaque pays d'une typologie des postes de la nomenclature, sur la base des critères significatifs au regard de l'impact de la suppression des entraves (par exemple: produits manufacturés complexes non pondéreux). Chaque famille de cette typologie peut être quantifiée.
16

- 465 -
4°) Pondération des résultats la typologie, conduisant à l'évaluation coQts de production pour chaque pays.
des enquêtes en foncuion de globale de la réduction des
5o) Ultérieurement, à la demande de la DG II, les effets directs ont été ventilés entre trois macro-secteurs: produits manufacturés intermédiaires, produits manufacturés d'équipement, produits manufacturés de consommation.
B - Effets indirects
S'agissant des effets indirects, on a considéré que chaque pays constitue un ensemble d'acteurs relativement cohérent du point de vue de leurs réactions à moyen terme à la disparition des entraves. Ce "nationalisme" des enjeux et des défis a été considéré comme l'emportant sur le particularisme micro-sectoriel légitimement respecté pour l'observation des effets directs.
Dans un premier temps, on a exploité pays par pays les réponses des entreprises aux questions sur leurs perspectives de ventes sur les marchés nationaux ou à l'exportation, et sur leurs prévisions d'évolution de leurs coûts. Dans la mesure où ces réponses traduisent les conséquences de politiques qui vont être menées par les entreprises, on peut considérer qu'on dispose pour chaque pays d'un "profil stratégique" caractéristique des enjeux de chaque question.
Dans un second temps, on a exploité les questionnaires de base (ensemble des enquêtes menées dans les 12 pays de la Communauté) pour déterminer les seuils quantitatifs qui sous-tendent les réponses qualitatives des entreprises. Par exemple, on a constaté qu'une augmentation des ventes n'est qualifiée de "substantielle" que lorsqu'elle dépasse 15% .
Enfin, on a comparé les "profils stratégiques" recueillis pour les différents pays afin d'arrêter à dire d'expert des chiffres (par exemple: pourcentage d'accroissement des exportations) qui s'efforcent de traduire la hiérarchie des pays au regard de l'importance de l'effet mesuré.
Finalement, les chiffres arrêtés traduisent un ensemble de facteurs complexes dont le poids relatif a été apprécié par les experts d'EUROCONSTRUCT de chaque pays: capacité d'adaptation des industries concernées constatée dans le passé, degré de sensibilité actuel à la problématique de l'achèvement du marché intérieur, capacité financière des entreprises, degré d'internationalisation déjà atteint ...
17

- 466 -
Il est clair qu'une telle démarche méthodologique ne peut conduire qu'à des résultats d'une grande fragilité. Cependant, on doit considérer que la réalité observée, en l'occurrence les intentions stratégiques des entreprises et leurs effets potentiels, manque trop de consistance pour qu'on puisse espérer améliorer la valeur prédictive des résultats par des enquêtes statistiquement représentatives.
IV.2 - EFFETS DIRECTS
Ce chapitre a pour objet de mesurer les répercussions mécaniques des réductions de coat induites par la suppression des entraves. L'hypothèse est que les entreprises, à ce stade initial, répercutent les baisses de coat dans leurs prix sans modification de leurs marges. De même, les entreprises sont supposées ne pas encore réagir par des ajustements de volume ou d'organisation de leur production. Les consommateurs ne modifient pas non plus leur comportement, et le jeu des élasticités prix n'est sensé se manifester qu'ultérieurement au titre des effets indirects.
IV.2.1 - MECANISMES DE GENERATION DES EFFETS
La suppression des entraves ne détermine une baisse des coats, donc des prix, que dans la mesure où les industriels supportent des dépenses quand ils exportent leurs produits. Il peut s'agir de dépenses directes, frais de passage en douane, ou indirectes, coat d'adaptation des produits.
A - Cas des entraves fortes et décourageantes
De nombreux producteurs britanniques renoncent à exporter vers les pays de la C.E.E. du fait d'importantes entraves liées aux formalités d'homologation et d'agrément {cas de normes en France et en R.F.A. pour les produits d'étanchéité et la menuiserie métallique, cas de l'avis du CTB français pour la menuiserie bois).
De même, les producteurs européens de carreaux de céramique sont peu attirés par le marché allemand, régi par des normes très contraignantes {seuil de porosité de la céramique) qui expriment une exigence de qualité élevée de la part de la clientèle finale.
Ainsi, pour toute suppression des entraves ne directs.
cette catégorie de produits, la réduirait pas immédiatement les coats
- 467 -
B - Cas des entraves fortes mais contournées
L'implantation locale constitue pour de nombreuses sociétés la réponse aux contraintes sévères de normalisation ou d'agrément qui pèsent sur certains produits. De même, certains industriels adoptent la fabrication de gammes spécifiques destinées à un ou plusieurs pays particuliers.
Mais, pour ces produits, l'homogénéisation des réglementations aura des effets directs. Les surcoûts suppr1mes immédiatement porteront essentiellement sur l'obtention des homologations et agréments (démarches et délais), les frais de passage en douane et le coût de transport, qui devraient s'abaisser du fait de la suppression du contingentement ·des transporteurs européens.
IV.2.2 - EVALUATION GLOBALE DES EFFETS DIRECTS
L'évaluation des effets directs sur les prix résultant de l'exploitation des enquêtes selon la méthode exposée au paragraphe IV.l conduit à un total de 657 millions ·d'Ecus pour les quatre plus grands pays (RFA, Italie, France et UK), dont la production de 88,4 milliards d'Ecus représente 79.9% du marché communautaire des produits de construction. On peut donc estimer en première analyse que l'économie pour l'ensemble des 12 pays de la Communauté à attendre des effets directs de l'achèvement du marché européen atteindra un montant de 820 millions d'Ecus.
Il convient de rappeler que ces chiffres se rapportent à la suppression de l'ensemble des barrières, y compris les barrières non spécifiques déjà quantifiées par ailleurs (études horizontales engagées par la Commission sur l'ouverture de la commande publique, sur la libéralisation des services financiers, sur l'abolition des contrôles en douane et sur la déréglementation des transports). Nous évaluons à 43 % la part des effets directs dus aux barrières spécifiques, soit 283 millions d'Ecus.
Le tableau de la page suivante prec1se la nature des économies qui découleront de la suppression des barrières, telles qu'elles ont été valorisées par les industiels interrogés.
19
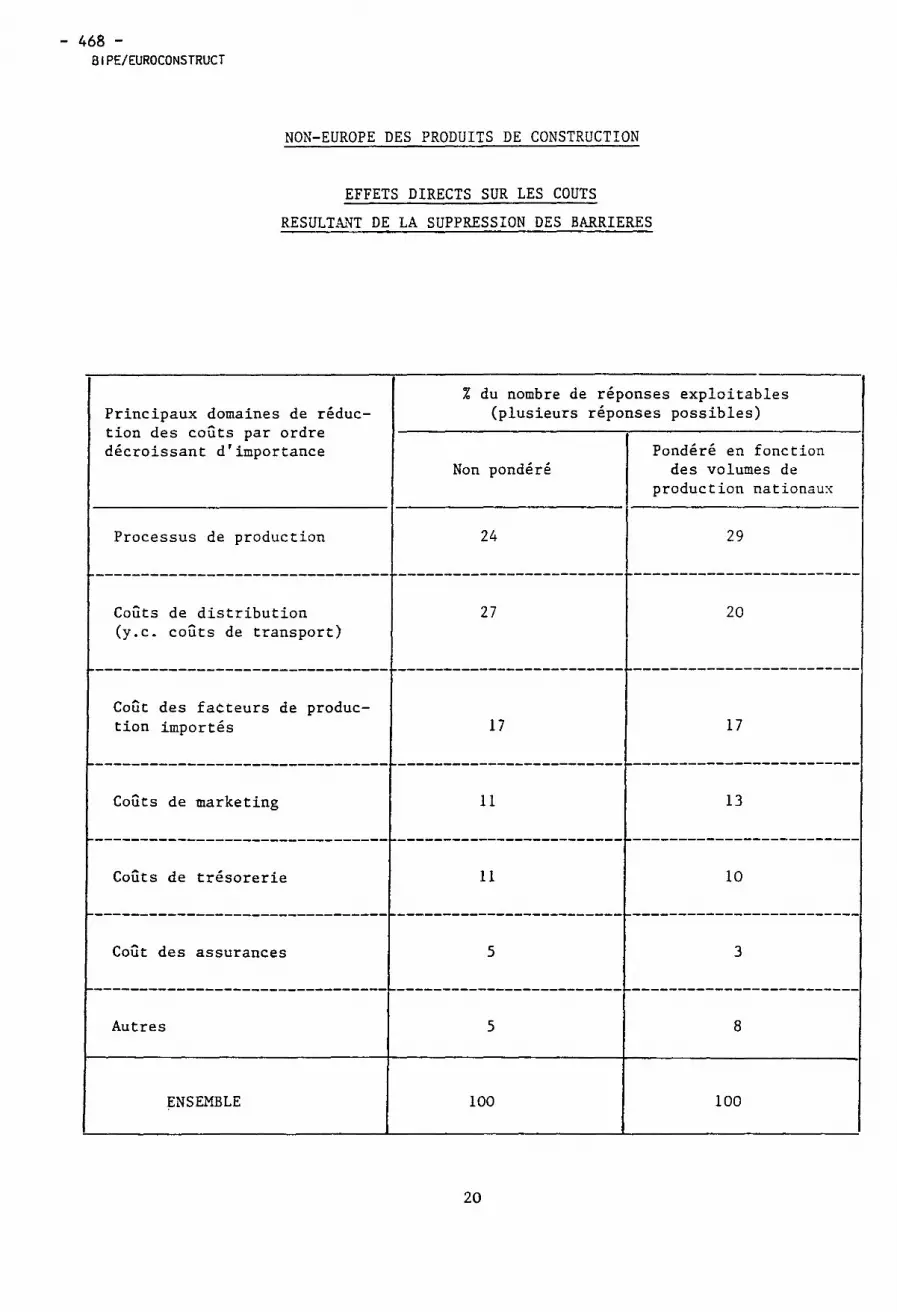
- 468 -BIPE/EUROCONSTRUCT
NON-EUROPE DES PRODUITS DE CONSTRUCTION
EFFETS DIRECTS SUR LES COUTS
RESULT&~T DE LA SUPPRESSION DES BARRIERES
Principaux domaines de réduction des coûts par ordre décroissant d'importance
% du nombre de réponses exploitables (plusieurs réponses possibles)
Non pondéré
Processus de production 24
Pondéré en fonction des volumes de
production nationaux
29
-------------------------------- -------------------------~-------------------------
Coûts de distribution (y.c. coûts de transport)
Coût des facteurs de produc-
27 20
tion importés 17 17
Coûts de marketing 11 13
~--------------------------------~------------------------- -------------------------Coûts de trésorerie 11 10
Coût des assurances 5 3
Autres 5 8
ENSEMBLE lOO lOO
20
- 469 -
IV.3 - EFFETS INDIRECTS
L'objet de ce chapitre est d'établir un diagnostic de ce que seront les réactions secondaires des agents économiques confrontés aux effets directs analysés dans le chapitre précédent.
IV.3.1 - MECANISMES DE GENERATION DES EFFETS
A - Choix stratégiques
En accroissant la menace concurrentielle sur les marchés nationaux, la suppression progressive des barrières provoquera sans aucun doute possible un changement de comportement des industriels, perceptible à travers les enquêtes. Les plus dynamiques mettront en oeuvre des stratégies internationales selon deux axes: un axe défensif, parce que la majorité des industriels s'attendent à un accroissement du taux de pénétration des produits étrangers sur leur marché national; un axe offensif, dans la mesure où l'abaissement des frontières ouvrira des opportunités qu'il est de la fonction de tout industriel d'exploiter.
Dans la mesure où on assisterait à une unification en profondeur des marchés, les stratégies de délocalisation des grandes entreprises pourraient engendrer des spécialisations nationales intra-européennes. Mais, et c'est semble-t-il le point de vue dominant des industriels, les comportements locaux étant fondamentalement spécifiques, c'est l'approche des marchés par des filiales étrangères qui sera généralement préférée à moyen terme. Les seules manifestations physiques {échanges communautaires de produits) ne donneront probablement qu'une idée très partielle de stratégies fortes mais essentiellement financières (prises de contrôle, fusions, etc.).
Les industriels devront aussi faire le choix du type de compétitivité, performances ou prix, qu'ils vont développer. En effet, l'Europe des produits de la construction peut être analysée par rapport à deux modèles.
Le premier, le plus fréquent dans les pays du Nord, se caractérise par une offre de produits à haute technicité répondant à des normes très exigeantes. Leur rapport performances-prix correspond à des prix unitaires relativement élevés, et les industriels s'efforcent de rester compétitifs par des efforts de rationalisation des process, de recherche et développement, de maitrise des marges. Le développement de ce modèle repose sur l'atténuation progressive des différences de charges salariales entre les pays de la Communauté, et une exigence croissante des utilisateurs en qualité et fiabilité.
21

- 470 -
Le second modèle est plus fréquent dans les Pays dû Sud de l'Europe. Il se caractérise par une offre de produits à technicité moyenne ou faible, développée sur des marchés où la réglementation technique est peu contraignante en droit et encore moins en pratique. Le développement de ce modèle sera favorisé par l'approche actuelle de la Commission des Communautés Européennes conduisant à la reconnaissance mutuelle des normes dans le cadre d'exigences essentielles qui renonceront partiellement aux aspects parfois excessivement technicistes que s'efforcent d'imposer les normes des pays du Nord.
Faute de pouvoir mesurer les effets-qualité, il est extrêmement difficile de traduire les modifications dans la répartition de la production et des marchés entre ces deux modèles pour l'ensemble des produits d'un même pays. Mais les contraintes de l'exercice imposaient une quantification de tous les effets, ce qui a conduit à affecter un seul chiffre à des phénomènes multidimensionnels (qualité). Les données proposées expriment donc essentiellement des sens et des ordres de grandeur relatifs.
B - Economies d'échelle
Les conséquences en termes d'évolution ventes et de modification des coQts unitaires européennes qui résulteront de l'abaissement conduisent à une segmentation de l'industrie construction en quatre sous-secteurs.
du des des
des
volume des stratégies barrières
produits de
1°) Les industries qui n'envisagent pas de croissance de leur production, ni d'économies d'échelle: les grands groupes des industries intermédiaires capitalistiques, dont le verre plat est un bon exemple, ont déjà procédé à l'européanisation de leurs structures dans un contexte de concertation professionnelle qui a fait disparaitre les entraves techniques.
2°) Les industries qui n'envisagent pas de croissance de leur production, mais dont les coQts unitaires diminueront: même pour une production des usines nationales inchangée, la concentration financière résultant des croissances externes transfrontalières entrainera une réduction des frais administratifs, de gestion et surtout de recherche et développement.
3°) Les industries qui envisagent une croissance de leur production, mais pas d'économie d'échelle: les fabricants de produits pondéreux, en particulier ceux destinés aux structures des ouvrages, ont de grandes difficultés à prolonger la courbe des coQts marginaux décroissants, les coQts de transport fixant les limites géographiques de leur marché. C'est ce qu'ont démontré par le passé les échecs successifs des politiques d'industrialisation du bâtiment, la standardisation imposée au niveau de la demande n'ayant
22

- 471 -
pas réussi à assurer des longueurs de séries suffisantes au niveau de la production de chaque usine.
4°) Les industries qui envisagent une croissance de leur production et une diminution des coûts unitaires: l'exemple le plus clair de relation entre la suppression des entraves et l'apparition d'économies d'échelle est celui des secteurs où des produits nouveaux bénéficiant d'une compétitivité technique forte et de la liberté de circulation à l'échelle communautaire pourront accroître rapidement leur marché en imposant une accélération de la disparition du quasi-artisanat encore en vigueur dans certains domaines de la fabrication des produits de construction.
Notre évaluation du poids respectif· (valeur de la production) de chacun de ces quatre segments est la suivante :
Pas de croissance Croissance de la production de la production
Pas d'économie d'échelle 23 % 16 %
Economies d'échelle 19 % 42 %
IV.3.2 - EVALUATION GLOBALE DES EFFETS INDIRECTS
L'évaluation des effets indirects sur les prix pour les cinq pays pris en compte (RFA, Italie, France, UK et Espagne), selon la méthode exposée au paragraphe IV.1, conduit à un total de 1722 millions d'Ecus (sur la base des volumes de production de 1985). Ce chiffre ne peut pas être extrapolé aussi simplement à l'ensemble de la Communauté que celui des effets directs.
Il convient de préciser que la vérification de la cohérence des résultats avec le scénario global à moyen terme pour les 12 pays de la Communauté n'a pu être effectuée, puisqu'elle aurait supposé un même niveau d'information et d'a~alyse pour l'ensemble des pays, notamment sur l'évolution de leurs prix relatifs et sur leur commerce extérieur intra et extracommunautaire.
23

- 472 -
CONCLUSION
Par l'importance du nombre de personnes interrogées et de pays pris en compte, l'enquête qui a servi de base à ce rapport est une des premières sources d'information prospective sur le vaste ensemble des fabricants européens de produits de construction. Il s'agit d'une population d'une grande hétérogénéité technique et économique, mais dont on a reconnu 1c1 la communauté de préoccupations stratégiques au regard d'un même marché, celui de la construction.
De cette approche, on peut retenir quelques enseignements importants pour toute réflexion sur l'avenir du grand marché européen.
1 - Avec un excédent des échanges milliards d'Ecus, et personnes, le secteur enjeu considérable pour
marché intérieur de 110 milliards d'Ecus, avec le reste du monde de l'ordre de un emploi total d'environ 1,7 million des produits de construction représente la Communauté Economique Européenne.
un 8
de un
La place croissante des produits industriels dans la construction des ouvrages de bâtiment et de travaux publics est une des manifestations les plus évidentes de la modernisation de tout le secteur de la construction, et l'accroissement des échanges -dont l'étude a montré qu'ils pouvaient atteindre, même pour les grands pays, entre 15 et 50 % de la consommation intérieure - ne pourra qu'accélérer cette modernisation.
2 - La réglementation des procédés de construction génère plus d'entraves aux échanges de produits que celle qui leur est directement appliquée; or les mesures programmées par le Livre Blanc ne feront pas directement disparaitre les particularismes nationaux de l'art de construire. Leur impact sera donc certainement plus lent que dans d'autres secteurs.
Cependant, l'enquête a démontré que les industriels européens sont convaincus que la disparition des entraves imposera des révisions de leurs stratégies actuelles.
D'une part, ils considèrent que les mesures énoncées par le Livre blanc se traduiront par une forte pression concurrentielle sur leurs propres marchés, les pertes de part sur ces marchés leur paraissant la conséquence inéluctable du processus d'européanisation des échanges. Ils ne considèrent pas pour autant qu'ils devront enregistrer passivement cette pénétration de leurs concurrents étrangers , mais, bien au contraire, qu'il leur faudra faire des efforts de rationalisation des processus de production et de
24

- 473 -
réduction des marges. Outre la suppression du coût direct de la NonEurope, de l'ordre de 0,7 % du chiffre d'affaires des industriels sur le marché européen, soit environ 820 millions d'Ecus, l'accroissement de la concurrence déterminera des remises en cause profondes des systèmes d'offre de produits industriels et aussi de leur distribution aux entreprises de construction, aux artisans du bâtiment et aux ménages.
D'autre part, la grande majorité des industriels interrogés considèrent qu'ils pourront compenser leurs pertes de marché intérieur par des suppléments d'exportations vers les autres pays de la Communauté et vers les pays tiers. Cette stratégie se traduira, soit par des délocalisations ou des implantations directes dans les pays où la structure des coûts de production est plus favorable, soit par une participation et des prises de contrôle assurant un supplément de croissance externe, soit par une rationalisation des outils de production nationaux.
Selon les pays, les baisses de coûts et de prix qui résulteront de la mise en oeuvre de ces stratégies, conséquences indirectes de la suppresssion des barrières visées par le Livre Blanc, pourraient s'étager entre 0 et 4 %. et le supplément de production attendu pourrait atteindre 2,5 à 10 % .
3- A l'échelle européenne, les effets macrosectoriels de la mise en oeuvre de ces stratégies modifieront assez sensiblement les positions relatives des différentes industries nationales .
Les pays du Nord de l'Europe qui, soutenus par un marché intérieur porteur, se sont spécialisés dans les produits de haute gamme, à fortes exigences et à niveaux de prix élevés, devraient accroître leur compétitivité en poursuivant la rationalisation de leurs processus de production fondés sur l'emploi d'une main-d'oeuvre chère et très qualifiée. Un élargissement de leurs gammes vers des produits moins sophistiqués et aussi vers une nouvelle clientèle pourrait donner un nouvel élan à des entreprises dont le marché intérieur est menacé de saturation.
La plus grande ouverture de marchés jusqu'ici protégés par des exigences réglementaires parfois excessivement complexes à l'offre des pays du Sud, qui bénéficieront encore pendant plusieurs années de structures de coûts favorables à la production de produits de milieu et de bas de gamme, aura nécessairement des effets bénéfiques sur les industries de pays à fort potentiel de croissance.
Enfin, la déréglementation des transports facilitera le redéploiement du capital productif européen des industries des produits de construction, qui devrait déterminer une spécialisation plus conforme aux avantages compétitifs des différents pays.
25

NOMENCLATURE DES PRODUITS DE CONSTRUCTION
I - PRODUITS A BASE MINERALE NON METALLIQUE
I.l.Ciments et liants hydrauliques I.2.Béton prêt à l'emploi I.3.Blocs edbéton I.4.Tuyaux en béton I.5.Autres petits éléments en béton non armé I.6.Eléments de structure en béton armé ou précontraint I.7.Produits en fibres-ciment I.8.Sables, graviers et concassés de carrière I.9.Pierres de construction I.10.Ardoises I.ll.Chaux aérienne I.12.Plàtre I.13.Produits en plâtre I.14.Briques I.15.Tuiles et autres produits en terre cuite I.16.Carreaux de céramique et terre cuite vernissée ou
émaillée I.17.Eléments sanitaires et autres produits en céramique I.18.Verres, vitrages isolants et autres produits en verre I.19.Laine de verre et autres isolants minéraux I.20.Matériaux et produits divers à base minérale non
métallique
II - PRODUITS A BASE DE BOIS
II.l.Panneaux de bois aggloméré ou contreplaqué II.2.Parquets II.3.Portes, fenêtres et autres éléments de
menuiserie en bois II.4.Charpentes et structures en bois II.5.Matériaux et produits divers à base de bois
III - PRODUITS A BASE METALLIQUE
III.l.Aciers pour béton armé ou précontraint III.2.Eléments de structure métalliques III.3.Eléments de couverture et de bardage métalliques III.4.Portes, fenêtres et autres éléments de menuiserie
métallique III.5.Tuyaux en acier et en fonte
III.6.Chaudières, radiateurs et divers matériels de chauffage
III.7.Eléments sanitaires métalliques III.8.Robinetterie III.9.Serrurerie, ferronnerie, boulonnerie et visserie III.10.Produits en cuivre et dérivés III.ll.Produits en zinc ou en plomb et dérivés III.12.Matériaux et produits divers à base métallique
IV - PRODUITS A BASE CHIMIQUE OU TEXTILE
IV.l.Matériaux et produits à base d'asphalte ou de bitume IV.2.Enduits et mastics IV.3.Colles IV.4.Peintures, vernis et produits de protection IV.5.Matériaux et produits isolants en plastique IV.6.Papiers peints IV.7.Revêtements de murs et sols textiles ou mixtes IV.8.Revêtements de murs et sols en plastique ou en
caoutchouc IV.9.Eléments sanitaires en plastique IV.lO.Tuyaux en plastique IV.ll.Portes, fenêtres et autres éléments de menuiserie
en plastique IV.l2.Eléments et produits divers en plastique IV.13.Eléments et produits divers à base chimique ou
textile
V - PRODUITS D'EQUIPEMENT ELECTRIQUE
V.l.Câbles et filerie électriques V.2.Lampes et matériel d'éclairage V.3.Matériel électrique de chauffage et de climatisation V.4.Ascenseurs, monte-charge et escaliers mécaniques V.5.Moteurs, pompes, transformateurs et divers matériels
électromécaniques V.6.Appareillage électrique et électronique de mesure, de
régulation et de contrôle V.7.Divers équipements électriques

FRANCE
.Tuyaux en b~ton pour assainissement
.Produits en béton léger
.Poutrelles en béton
.Panneaux et plaques de plâtre
.Carreaux de céramique
.Verre plat
.Produits isolants
,Panneaux de particules
.Produits d'étanchéité
.Revêtements de sols
.Tuyaux PVC
.Matériel électrique
ALLEMAGNE FEDERALE
• Produits en b~ton l~gff
'Briques
Tuiles
• Carreaux de céramique
Robinetterie sanitaire
Cumulus électriques
PRODUITS SELECTIONNES POUR LES ENQUETES
GRANDE-BRETAGNE
• Carreaux de c~ramique
, Equipements sanitaires en céramique
, Carreaux d'isolation en fibre minérale
Portes en bois
• Fenêtres en bois
Meubles de cuisine
• Fenêtres en aluminium
• Chaudières et radiateurs
• Serrurerie
• Produits d'étanchéité
• Groupes de conditionnement d'air
• Ascenseurs
ITALIE
• Carreaux de c~ramique
, Rondsà béton
• Fermetures métalliques
Hohinetterie
, Cumulus électriques
Ciment
Plâtre
ESPAGNE
Plaques de plâtre
Equipements sanitaires en céramique
Verre
Parquets en bois
Portes en bois
Baignoires en acier
• Menuiseries en plastique
UNJON BELGOLUXE~1BOURGEO ISE
, Carreaux de revêtement décoratif en b~ton
Planchers et prédalle~ en béton
Briques de parement
Vitrages isolants
Verre cellulaire
Laine minérale
Polyslyrène
Moussesde polyur~thane
PAYS-BAS GRE CE PORTUGAL IRLANDE DANE~!ARK
. Briques . Ciment Marbre Ciment Systèmes de couverture
Peintures . Ronds à béton Equipements sanitaires Tuyaux en fibres-ciment . Systèmes de gestion en céramique Ardoises fibres- dt! l'énergie
en Liège ciment
Carreaux de céramique
Produits isolants
Câbles électriques
Ra<ll.:tl:eurs
lv


- 477 -
14.
The •cost of Non-Europe•
in the Textile-Clothing Industry
IFO-Institut für Wirtschaftsforschung - Prometeia Calcolo Srl


- 479 -
IFO-Institut für Wirtschaftsforschung - Prometeia Calcolo Srl
The Cost of »Non-Europe« in the Textile-Ciothing lndustry
Final Report Executive Summary
By
Michael Breitenacher, Sergio Paba, Gianpaolo Rossini
December 1987

- 480-
We would like to acknowledge the fruitful collaboration of
Wolfgang Gerstenberger, Milena Monterastelli,
Angelo Tantazzi

- 481 -
- 2 -
Contents
I. Introduction
II. The textile and clothing sector: a general picture
1. Market structure
2. An assessment of economies of scale and efficiency
3. Trade creation and diversion
4. The analysis of priees
S. Consumption patterns
6. Barriers to trade
III. Results on the costs of Non-Europe
IV. Conclusions
3
4
4
5
9
14
18
19
22
27
Table 1: Intra-EC Trade in Textiles and Clothing 12
Table 2: Coefficients of Variation of Net Retail Priees of Clothing Products in EC-Countries 15
Figure 1: Relative Priees Clothing-Footwear 17


- 483 -
- 3 -
I. Introduction
1. The Textile and Clothing (T-C) industry is unanimously
considered as the industrial sector which has more benefi
ted from the economie integration to date. It is often
argued that the T-C industry has almost completed the inte
gration process, particularly relative to what other indu
stria! sectors have been experiencing. We shall try to:
i) assess the validity of this argument by discussing the
positive effects of integration in the past;
ii) evaluate the extent and the impact of the existing
barriers to trade;
iii) present the main resulta on the costs of Non-Europe
with an assessment of the direct and indirect impact
of the barriers removal by the end of 1992.
2. Before going into the discussion of the main resulta of
the study, it is important to note that:
i) The I-C industry has been exposed to increasing strong
extra-EC competition from low-wage countries. This
fact makes difficult to disentagle how rouch of the
structural changes which occurred in the EC industry
in the past and will occur in the future are due to
outside-EC competition or intra-EC competition;
ii) The T-C industry is by no means a homogeneous sector.
Sub-sectors have different problems and they experien
ced different adjustment strategies to cope with eco
nomie integration. Nonetheless, we think that sorne
useful insights on the effects of integration can be
gained without too rouch sectoral details.

- 484 -
- 4 -
3. The study is based on three types of data sets:
i) existing national and EC-statistics:
ii) data on quantitative production and trade flows by T-C
products have been processed:
iii) qualitative insights and quantitative information have
been gained from 60 interviews (15 in each of the four
countries: West Germany, France, Italy, United King
dom) to managers and executives of dynamic, Europe
oriented firms of the various sub-sectors of the T-C
industry.
II. The textile and clothing sector: a general picture
1. Market structure
1. The general picture of the EC textile and clothing
industry is still one of a fragmented industry characteri
zed by a high number of small and medium-sized firms. Fur
thermore, there bas been a general reduction in the average
size of the firms in the textile industry since mid-1970s
for all the countries under analysis. The figure for EC
fell from 152 employees in 1975 down to 128 employees in
1981. The decrease bas been particularly strong in Nether
lands, France and Great Britain. The average size of the
firms in the clothing industry (110-114 employees), how
ever, remained basically the same during the period under
analysis.
2. The analysis of concentration based on the GIN! index
shows that the two industries in the 1970s tended to be
less concentrated, at least in terms of employment. The
1981 index for the clothing sector is 17 percentage points
below the 1975 value, while the gap for the textile sector
is 11 points. The past experience of the sector, then,

- 48 5-
- 5 -
shows that 'size• bas not been a crucial strategie vari
able. Concentration bas not proved to be very important for
the competitive performance of the industry in the face of
increased intra-EC and outside-EC competition. In a number
of cases, the overall organization of the industry (e.g.
linkages between firms) bas probably been more important.
Clearly, both size and concentration have played a more
relevant role in sorne particular segments of the market,
and in sorne particular stages of production. The man-made
fibre industry, for example, bas always been strongly oli
gopolistic. High concentration ratio can also be found in
the printing and teinture industry, in the classic branded
jeans, in the production of very standardized clothing
goods.
2. An assessment of economies of scale and efficiency
1. As recognized by severa! studies, product specifie
economies of scale (PSES) are very important in the T-C
industry and, in particular, they are more important than
plant economies of scale (PES) (see Textile Council, 1969;
Pratten, 1971; Scherer et al., 1975; Mariotti, 1982). The
importance of PSES increases as we move from upstream sta
ges of production to downstream stages (particularly from
weaving onwards).
2. The existing literature also shows that PES play a
limited role in the T-C industry. The estimates of the
minimum optimal size of the plants (MOS) for various sub
sectors show that, in general, they account for a modest
share of total domestic production. Furthermore, the esti
mated increase in costs with 1/3 of the MOS is generally
slight.
- 486 -
- 6 -
These results suggest that static production economies of
scale, with sorne exception, do not represent an effective
barriers to entry for the T-C industry, and that for the
majority of sub-sectors concentration processes could not
be based on them.
3. The possibility of exploiting static economies of
scale, both PSES and PES, is strongly limited by the low
level of standardization of products, essentially due to
demand factors. There is a clear trade-off between product
variety and PES, and the choice depends on the market tar
get of the firms (segments with highly variable demand in
terms of product-mix vs. segments with more standardized
demand). Flexibility of production processes, in the sense
of the capability of varying the product mix without strong
increases in costs, is one of the strategie variables for
many T-C subsectors. Static efficiency as such can be of a
limited value if demand is highly variables in quantitative
and qualitative terms.
4. The key factor which allows the firms to obtain sub
stantial efficiency gains in those sectors where PES and
PSES are not important is flexibility. This can be achieved
in two ways:
i) The first one relies entirely on technological innova
tion, particularly by developing flexible manufacturing
systems (FMS) for textile and clothing productions. Poten
tially, these systems can allow significant economies of
scope, in sorne sense solving the problem of the trade-off
between static efficiency and product variety. In the last
decade many firms were investing in these new technolo
gies.
- 487 -
- 7 -
ii) The second one is the development of a flexible orga
nization of the industry. The Italian T-C sector provides a
clear example. In sorne sub-sectors, dynamic, export-orien
ted firms 11 put out 11 a large share of production to a great
number of small production units, which provide the neces
sary flexibility and efficiency in production. The crucial
strategie variable which affects the performance of the
firms is not plant size as such. Far more important is the
power to 11 0rganize 11 production, to set up a network of
production units, both upstream and downstream. The knit
wear industry, for example, is organized in industrial
districts which work as if they were a single firm with
hundreds of small, independent, highly flexible, production
units. The fragmentation of this production system is coun
terbalanced by the concentration of commercial and marke
ting activities in a smaller number of firms, often of a
very large size in terms of turnover, which organize the
whole system of production. This production system has been
at the heart of the good export performance of the Italian
firms of the knitwear, clothing, and wool sectors from the
second half of the 1970s onwards. The Italian mode!, how
ever, is not widespread in Europe, although sorne countries,
like Belgium and France, are moving in this direction.
5. The efficiency and flexibility leve! required by the
EC market could also be obtained by subcontracting either
processes of production or the manufacture of final pro
ducts to productive units in developing and eastern coun
tries. Germany extensively used this strategy in the last
decade with two main resulta. The first one was the gain of
substantial cost reductions which made the German products
very priee competitive across Europe. The second one was a
sort of control of the competitiveness of the imports from
low wage countries, preventing, in this way, a much more

- 488 -- 8 -
devastating impact to these producers on the European T-C
industrial structure. German firms control the commercial
and distributive networks, own brand image and develop
advertising policies. For all these activities, barriers to
entry and economies of scale are very important, and very
few producers from low-wage countries could allow success
ful entry at these levels.
6. The increased intra-EC competitiveness brought about by
the economie integration, together with the competitive
pressure of low-wage not-EC countries, are at the root of
substantial technical improvements in the industry starting
from the early 1970s. Technical improvements have regar
ded:
- single stages of processing, usually in the form of
increasing the speed and the reliability of operations~
- increase in the continuity of the overall productive
cycle with technological innovations~
- greater simplification and rationalization of many pro
cessing stages, with the introduction, whenever possible,
of automated machines~
- introduction of advanced methods of management and con
trol of the productive process {CAD, CADAM systems, etc.)
{see OECD, 1987: Mariotti, 1982).
7. The various subsectors of the T-C industry have been
affected by technical innovations to a different extent.
The more relevant changes have occured in the spinning and
finishing industries, and in the cutting stages of the
clothing industry. Also weaving has been greatly involved
in technical improvements. The German leading position in
sorne sectors of the textile industry is based on an exten
sive use of technical innovations.

- 489 -
- 9 -
8. Technical innovation bas caused a strong increase in
productivity, with significant cost reductions. In the last
decade, this bas been the case for the Italian textile
industry, which showed the highest productivity growth
rates, for the German textile sector, and for the clothing
industry in Italy, France and UK. There is no clear evi
dence of the fact that technical progress has determined a
significant increase in the optimal size of the plants.
9. The existence of a common European market bas been a
crucial factor for the achievement of economies of scale
due to commercial and marketing aspects. These also repre
sent strong barriers to entry for low-cost developing
countries. The main point is that, in order to exploit
these economies, it is not necessary to be a multi-plant
firm. As we have already seen, sub-contracting, both at
national and international level, and "putting out
systems", can do the job probably more efficiently.
3. Trade creation and diversion
1. In the Interim Report we showed with the help of stati
stical ratios that intra-EC trade bad expanded strongly in
the 1960s and the first half of the 1970s. This was prima
rily due to the forces of integration emanating from the
realization of the Common Market. The majority of the firms
interviewed pointed out that without the Common Market
their experts could not have been increased as rouch as was
actually done.
It cannot be ignored, however, that there were other forces
at work besides the integration effects, forces which led
to a strong intensification of trade in textiles and cloth
ing in the Community. They include:

- 490 -
- 10 -
i) The European countries share the same cultural back
ground, which provides favourable conditions for
foreign trade;
ii) after the Second World War there has been a tendency
towards internationalization, favouring international
trade especially of such "individualistic" products as
clothing;
iii) the export markets outside the EC were in part little
absorptive, either because of a lack of purchasing
power (like in the developing countries), or because
of trade barriers which made (and in part still make)
access to these markets difficult (Cf. Wettbewerbsver
haltnisse und Wettbewerbsverzerrungen im Welttextil
handel, Schriften zur Textilpolitik, Vol. 2, ed. by
K. Nenndorfer and E.-H. Stahr for Gesamttextil, Frank
furt/Main 1985).
The newly industrializing countries impose tariffs of 20 to
100 % on imports of textiles and clothing, in addition they
have established non-tariff and non-quantitative trade
barriers (e.g. cash deposits for imports). The state-tra
ding countries purchase, via state foreign-trade monopo
lies, according to set supply priorities and foreign ex
change reserves; textiles and clothing usually rank very
low. But imports of textiles and clothing also face tariff
and non tariff barriers in sorne Non-European industrialized
countries.
2. In the mid-1970s, the European integration process in
the textile and clothing sector entered a late phase. This
is reflected, for example, by the fact that the share of
intra EC imports or exports in total imports or exports of

- 491 -
- 11 -
Gerrnany, France and Italy was generally declining in the
second half of the 1970s and the first half of 1980s (Table
1}. In contrast, during the sarne period the textile and
clothing sector of the United Kingdorn was still in the
rnidst of the integration process (due to her late EC
entry}, which is reflected in rising shares of intra-EC
irnports in total British irnports (British exports of texti
les and clothing to other EC-countries lost in importance,
however}.
In detail, the analysis of foreign trade for the period
1978-1985 yielded the following findings:
i} In the textile sector the rnutual interrelationship of
the EC rnernber countries is higher than in the clothing
industry. This may be traced to the large irnports of
clothing from low-wage countries.
ii} The establishment of the Cornrnon Market - in coopera
tion with other factors - led to trade creation in
sorne subsectors. This benefitted prirnarily the Italian
textile and clothing industry. The French and in par
ticular the British producers were not able to take
equal advantage of the opportunities offered by the
Cornrnon Market.
iii} With respect to specialization in intra-EC exports,
the leading position is held by Italy in the clothing
sector, by Gerrnany in the textile sector.
iv} In the period 1978-1985 trade diversion from third
countries following the establishment of the Economie
Cornrnunity was ascertained only in sorne sub-sectors of
the textile and clothing market. In this period the

- 492 -
- 12 -
Table 1 Intra-EX: Trade in Textiles am Clothing
(Intra-EX: Trade as Percentage of 'Ibtal Exp:>rts or Inportsa))
Exporte Inport.s Cbmtry / Sector
1960 1970 1900 1985 1960 1970 1980 1985
Germany Textiles EX:(6) 20,8 42,3 43,0 31,1 57,7 69,8 50,3 49,5
EX:(9) • • 51,8 44,7 • • 56,1 54,7
Clothing EX:(6) 23,0 59,8 54,0 40,6 55,9 61,2 47,5 29,5 EC(9) • • 60,1 52,0 . • 50,6 32,0
France Textiles EC(6) 30,9 53,7 57,2 49,1 50,6 78,9 61,7 61,4
EX:(9) • • 64,5 61,1 • • 68,5 66,9
Clothing EX:(6) 15,2 57,6 56,6 41,9 76,5 79,7 44,0 42,5 EX:(9) • • 62,1 49,8 . • 49,6 47,7
Italf Text1les EX:(6) 31,1 44,5 48,7 44,6 43,1 63,0 45,5 48,5
EX:(9) • • 58,4 55,9 . • 52,8 55,1
Clothing EX:(6) 36,0 68,0 65,1 37,1 54,5 75,5 32,1 37,3 EX:(9) • • 71,5 45,2 • • 43,3 46,1
United~ Textiles EX:(6) 13,0 14,7 33,4 32,6 32,9 27,2 40,2 52,4
EX:(9) • • 44,6 43,1 . • 50,5 58,9
Clothing EX:(6) 17,0 17,6 34,6 28,5 32,7 11,3 20,0 29,4 EX:(9) • • 55,2 46,8 • • 26,2 34,9
a) Basie: Values in us-$. EX:(6): Belgiœi/I.llxenDourg, Frarx:e, Germany, Italy, Netherlan:is. !X!(9): In addition to EX:(6) Dennark, Irelard, United ~.
Source: CECI>, 'l'rade by CcJmoiities: calculations by the Ifo-Institut.e.

- 493 -
- 13 -
Common Market had therefore no severe protectionistic
effect vis-à-vis third countries, despite the exist
ence of the Multi-Fibre-Agreement {MFA). On the other
hand, imports from developing countries may not have
increased to the same extent as the competitiveness of
low-cost countries has grown.
3. Trade creation in the Common Market - via greater and
more varied supply and increasing competition - has led to
faster growth of the national textile and clothing markets
than would have occured without the stimulus of the tariff
union. Especially the German market has expanded greatly,
whereas the growth of the British market has lagged. The
extent to which market growth affected the distribution of
production in the individual countries will be shown below
for the period 1978-1985.
i) The distribution of textile production among the indi
vidual EC countries did not change much during the
period 1978-1985. Only Italy, Belgium-Luxemburg and
EIRE {only towards the end of the 1970s) were able to
achieve share gains. Losses were primarily suffered by
the British textile industry. French textile producers
suffered quite significant share !osses in the first
half of the 1980s.
At the disaggregated level, the specialization trends
become even more pronounced. In almost all areas of
spinning, weaving, and the production of knitted
fabrics, the Italian textile industry gained conside
rable production shares. German producers were only
able to do so in cotton spinning. Great specialization
occured also in the UK regarding the production of
knitted fabrics (cotton system, man-made) and in
Belgium concerning the production of carpets.
- 494 -- 14 -
ii) The distribution of clothing production capacities
among the member countries of the EC changed, in part,
quite considerably during the period of investigation.
The clear winner was Italy, which was able to raise
its production share to almost one third. Italy was
able to improve its position in most sectors of the
clothing industry. In the production of knitted gar
ments (wool system, man-made), however, it had to
relinguish production shares. Despite the considerable
shifts within the European clothing industry and the
specialization related to it, increasing returns to
scale failed to be realized. That may be traced to the
fact that manufacturing steps in the production of
clothing in the past could not be automated further.
That is also why the manufacture of large runs was
frequently shifted to low-wage countries.
4. The analysis of priees
The aim of this part of the study is twofold. On one hand
we seek to evaluate the extent of residual trade barriers
within the EC by observing the level of priees of sorne
clothing articles all over the EC countries. On the ether
hand we investigate the dynamics of clothing priee indices
to elucidate the movement of relative priees of the clo
thing industry over time in each EC country. We call the
first horizontal analysis and the second time analysis.
Horizontal analysis
The analysis is based on net retail priees for selected
clothing products which in sorne instances are not fully
identical in the member countries. In both 1980 and 1985
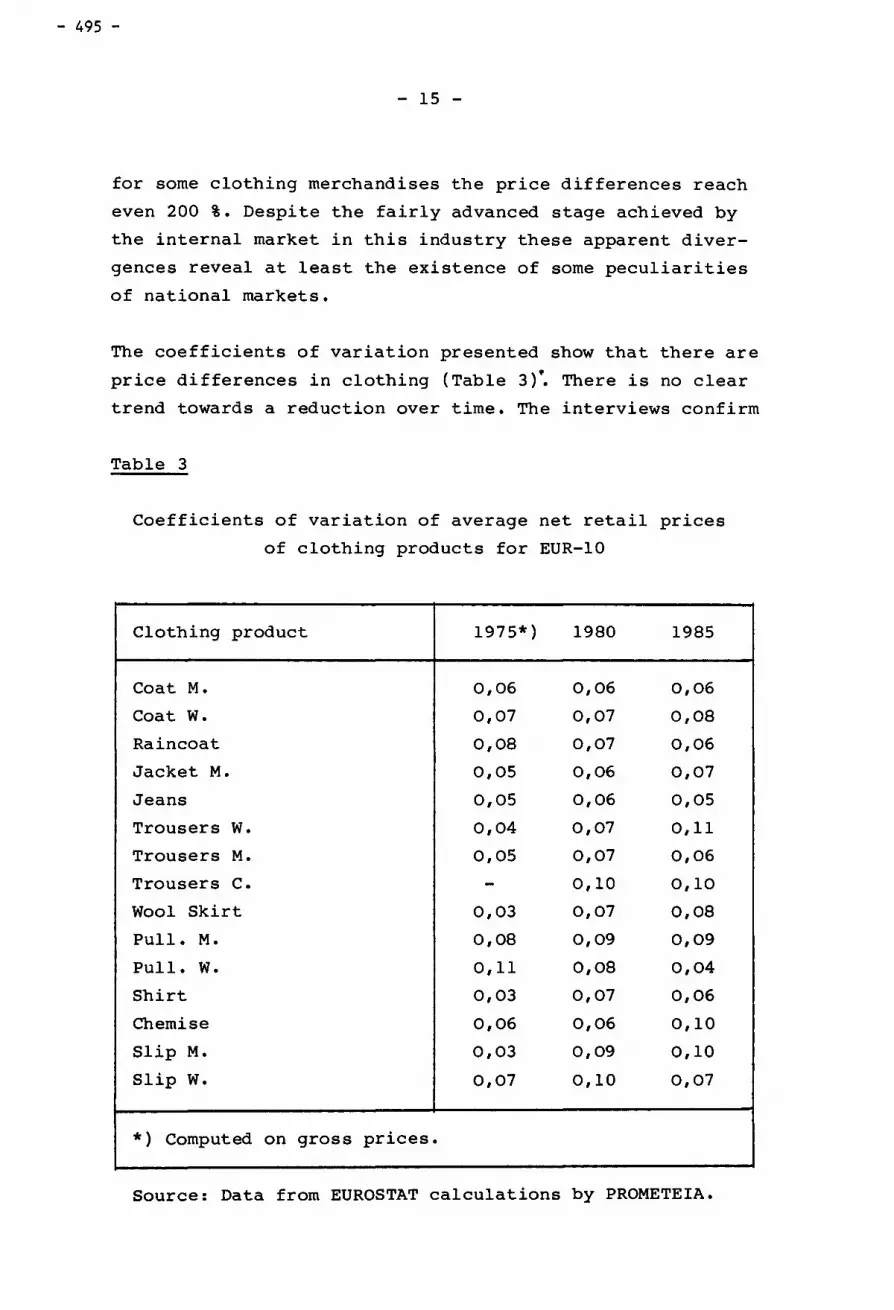
- 495 -
- 15 -
for sorne clothing merchandises the priee differences reach
even 200 %. Despite the fairly advanced stage achieved by
the interna! market in this industry these apparent diver
gences reveal at !east the existence of sorne peculiarities
of national markets.
The coefficients of variation presented show that there are
priee differences in clothing (Table 3f. There is no clear
trend towards a reduction over time. The interviews confirm
Table 3
Coefficients of variation of average net retail priees
of clothing products for EUR-10
Clothing product 1975*) 1980 1985
Coat M. 0,06 0,06 0,06
Coat w. 0,07 0,07 0,08
Raincoat 0,08 0,07 0,06
Jacket M. 0,05 0,06 0,07
Jeans 0,05 0,06 0,05
Trous ers w. 0,04 0,07 0,11
Trou sers M. 0,05 0,07 0,06
Trous ers c. - 0,10 0,10
Wool Skirt 0,03 0,07 0,08
Pull. M. 0,08 0,09 0,09
Pull. w. 0,11 0,08 0,04
Shirt 0,03 0,07 0,06
Chemise 0,06 0,06 0,10
Slip M. 0,03 0,09 0,10
Slip w. 0,07 0,10 0,07
*) Computed on gross priees.
Source: Data from EUROSTAT calculations by PROMETEIA.
- 496 -
- 16 -
these findings. In all four major EC countries there are
businessmen who said that they set priees in the EC within
a discretionary range which represent on average 10 percent
of the net final priee. We have reason to believe that they
purposedly gave a lower figure because they feared legal
consequences. Then if we add priee discrimination made by
retailers we understand why such phenomenon is still so
relevant. A detailed analysis on sorne standard textile
products also shows priee differences.
Priee differences look lower in textiles than in clothing.
The reasons are:
- Product differentiation in textiles is lower and hence
priee differences cannet reflect differen~ consu~er
tastes to a great extent.
- More homogeneous goods in the textile industry make
competition fiercer and priee differences less likely
even if stronger competition is not accompanied by any
decrease in concentration and economies of scale have
still to be fully exploited.
Textile production is more capital intensive, hence the
slight differences in labour costs among the EC countries
have less weight.
- Textile goods are mostly sold directly by producers
leaving less room to different commercial margins which
are sometimes the cause of priee differences among goods
of the same branch across countries.
~y do we observe priee discrimination? Is it really the
sign of a still lagging interna! market in the T-C sec tor?
Will it persist after 1992? First of all priee discrimina-
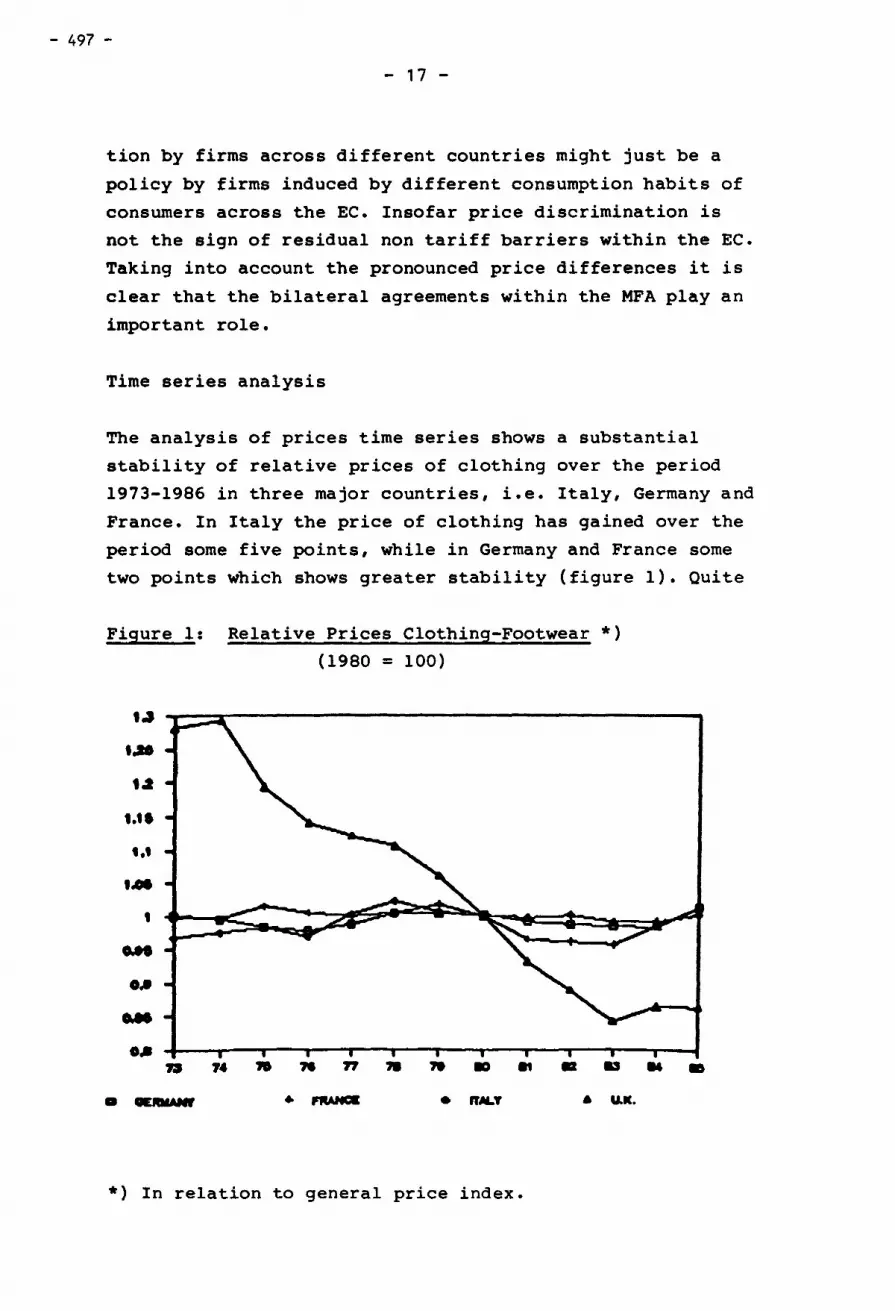
- 497 -
- 17 -
tion by firrns across different countries rnight just be a
policy by firrns induced by different consurnption habits of
consumera across the EC. Insofar priee discrimination is
not the sign of residual non tariff barriers within the EC.
Taking into account the pronounced priee differences it is
clear that the bilateral agreements within the MFA play an
important role.
Tirne series analysis
The analysis of priees tirne series shows a substantial
stability of relative priees of clothing over the period
1973-1986 in three major countries, i.e. Italy, Gerrnany and
France. In Italy the priee of clothing bas gained over the
period sorne five points, while in Gerrnany and France sorne
two points which shows greater stability (figure 1). Quite
Figure 1: Relative Priees Clothing-Footwear *) (1980 = 100)
t.J
, .. t.l
'·'' '·' , .. ' .... ... .... ...
D ,. ,. ,. ., ,. ,. ., ., . .., .. -• -RMANr • f'IWG • lfM..T A U.IC •
*) In relation to general priee index.

- 498 -- 18 -
a different behaviour is displayed by UK priees. Here the
relative priee of clothing has lost sorne 40 points. This is
primarily the signal of cheap imports from third countries
{Commonwealth) and the switch of British consumers towards
lower priee articles.
5. Consumption patterns
From branch data we can easily infer sorne features of the
evolution of private expenditure in the four major EC coun
tries. It appears that from 1973 to 1985 the share of pri
vate consumption expenditure for clothing and footwear in
total private consumption has slightly declined both in
value and quantity terms in Italy, Germany and most in
France. This is due to the inferior nature of clothing
expenditures, that means demand for clothing is rather
income-inelastic. A sharply different picture is provided
by UK. In this country clothing expenditure has diminished
its share over total consumption expenditure only in value
terms, whereas it has increased its share in quantity
terms.
Demand for clothing can be divided into two parts. On the
one hand there is a mass market primarily supplied by im
ports from third countries. Demand for these products is
relatively price-elastic. On the other hand there is a
market for high quality products which is the very domain
of most of the European producers. Demand for these goods
is rather price-inelastic. This is the reason why the role
of priee developments in the determination of clothing
demand in the industrial countries is a controversial issue
in the economie literature. Sorne studies indicate that
priees are important, whereas other studies {mainly Euro
pean) conclude that, according to the available data, pri-
- 499 -
- 19 -
ces are rather insignificant in comparison with other fac
tors in explaining clothing demand. (Cf. GATT, Textiles and
Clothing in the World Economy, Geneva, July 1984, pg. 168).
On the average the elasticity to priees of consumption
expenditure for T-C is a little below o. We consider two
different scenarios according to two different values of
elasticity: -0,6 and -1,0. The lower figure (-0,6) is more
realistic if we take into account the inferiority character
of T-C goods.
The effect of 1992 on concumption
One effect of eliminating the trade barriers will be lower
priees (see chapter II.6). To evaluate the impact of lower
priees on the level of consumption of T-C products we
assume that priees will decrease by 0,8-1 % in Italy,
0,4-0,6 % in Germany and France and 0,6-0,8 % in the UK.
The effects of the completion of the internal market will
be a small increase of consumption in the range of 0,24-1 %
in the period 1985-92. The total increase will be higher
because aggregate consumption will have increased owing to
a higher income in 1992.
6. Barriers to trade
Most of the firms in the sample did not complain about the
existence of significant barriers to intra-community trade.
An Italian firm even said that there are more troubles in ·
selling in Southern Italy than in Germany or France. The EC
market is considered almost perfectly integrated •
. Although there are no significant barriers intra-EC trade
is still hampered by slight barriers. In accordance with

- 500 -
- 20 -
the Cornmission's 1985 White Paper, three categories of
barriers may be distinguished:
- Physical barriers:
One of the most trade barriers within the EC are delays
at the borders, primarly because of exaggerated border
formalities or arbitrary and therefore discriminatory use
of customs rules. In these conncection the surveyed firms
mentioned above all the customs practice in France, but
also in Italy, Greece, Portugal and Spain. To be sure,
the frequency of border delays has declined recently,
according to the firms.
This category of physical barriers includes also the
control of origin of goods in order to ensure that
products from third countries, the imports of which to
the EC has been restricted, have been set against the
relevant Member States quotas. Moreover, Member States
may be authorised by the Commission, on the basis of art.
115 EC treaty, to exclude those imports from Community
treatment.
- Technical barriers:
Of sorne importance are restrictions in cross-border capi
tal flows, which affect merchandise trade as well as
direct investment. Firms' complainte concern primarily
practices in Italy and France. Frequently mentioned was
the lack of a unique European currency; this was said to
cause high hedging costs, especially for exports to the
UK.

- 501 -
- 21 -
In the category of technical trade barriers mention was
also made now and then of a restriction in the case of
public procurement. In many cases, the firms didn•t even
participate in the calls for tenders, as they were sure
of not having a chance.
- Fiscal barriers:
Very frequently the firms mentioned the different value
added tax rates in the member countries as being a trade
barrier. Individual member countries, e.g. Italy, demand
the value added tax at the time of import, which is dis
criminatory in faveur of the domestic competitors.
According to a special survey of German clothing manufac
turers, the trade barriers mentioned above concern in par
ticular small and medium size firms. The barriers have less
grave effects on the large producers.
The trade barriers mentioned did not, however, prevent the
firms from exporting to ether Common Market countries.
These experts might possibly have been even higher, al
though there are many dynamic, Europe-oriented firms which
stopped differentiating between domestic sales and experts
a long time ago. Consequently the elimination of the still
existing trade barriers will only have marginal effects on
quantitative trade flows within the EC. This implies that
economies of scale yet to be realized may also be minimal
for production processes.
Given that the trade barriers will be eliminated, the
interviewed firms expect costs reductions for experts of
sorne 1 to 3 percent. Because of the sharp competition in
the textile and clothing markets one may assume that the
cost reductions will also be passed on priees.

- 502 -
- 22 -
III. Results on the costs of Non-Europe
Immediate direct effects
1. Unit labour costs will drop as a result of the interna!
market simply because the job of monitoring the custom
formalities, filling the custom documents, checking the
labelling requirements, etc., will be no longer necessary.
Part of the staff working on these items can be moved to
ether assignements or fired. Our estimate of the importance
of these jobs in the employment structure of a firm with
substantial export activity, is around 0,5 % to 2 % of the
total number of employees. If these people were fired, the
cost saving would be around 0,5-2 % of the wage bill.
2. There are, however, two possible scenarios. The best
one in terms of cost reduction, is that of lower employment
with the same production level and efficiency, or the
redeployment of the white collars formerly working on
custom formalities to ether interna! jobs which increase
the overall efficiency of the firm. The immediate firing is
quite unlikely. Furthermore, if one of the possible effect
of the interna! market is an increase of the export per
formance of the firm, the marketing staff might need to be
reinforced, so people formerly working on custom formali
ties can still be valuable for the firm.
3. The more likely scenario is that of no significant
changes in the number of white collars, at least in the
short term. So the unit labour cost reduction as a direct
effect, will be accordingly negligible.

- 503 -
- 23 -
Deferred direct effects
1. The completion ot the interna! market can have a psy
chological effect in the sense of making firms more Europe
minded and willing to increase their export and investment
activity in the European community. Harmonization of VAT
and a complete liberalization of movements of capitals and
currenties could make sorne firms even more EC minded. In
this scenario, the strategies of the firms are going to
experience sorne changes even if they already have a Euro
pean orientation, although, in this case, the impact will
be correspondingly smaller. Firms will probably decide
their market strategies at a European level, and not coun
try by country as they usually do now.
2. In any case, the most important expected effects of the
completion of the interna! market come from the estimated
net increase in competitiveness among European producers.
We are talking about net effects because most of the chan
ges that we would expect to occur in the next years will be
mainly a reaction to forces that are in motion now and will
affect the industry structure and performance for many
years to come. According to the interviews• results the
complete barriers-free European Community will affect these
trends only marginally, not more than 10 % of the expected
unit cost reductions.
3. The expected increase in competition in the European
markets will have sorne effects on the mark-up of the firm.
It is very difficult to work out a single estimate of the
expected reduction, because of the strong differences
between the competitive systems of the various sub-sectors
of the industry. Furthermore, the pressure on priees due to
the competitiveness of low wage producers has already been
forcing firms to adapt their strategies to a priee competi
tive environment.

- 504 -
- 24 -
4. The mark-up reduction depends also very much on the
distributive structure of the countries and on the marke
ting and distribution policies of the firms. The more the
distributive structure of T-C goods is concentrated on
independent large units (department stores, mail order
houses etc.) the more priee competition is expected to
reduce the mark-ups of the firms. In this case, however,
nothing guarantees that reductions in the mark-ups will be
passed on consumer priees: the expected mark-up reduction
might simply mean more profits for the distributive sector.
On the other hand, the more fragmented is the distribution
structure, or the more important is the market power of
single brands and labels, in other word, the more oligopo
listic are the T-C sub-sectors, the less strong will be the
effect on priees not only of increased competition but also
of the estimated cost reduction.
S. Countries like Great Britain and Germany, where the
distribution of T-C goods is relatively more concentrated
and the distributive sector is priee-competitive, might
experience the strongest priee reductions. France, and
above all Italy, on the other hand, where the distribution
of T-C goods is very fragmented, are expected to experience
a comparatively smaller priee reduction1 >. Firms which
sell to the branded segments of the market, however, irres
pective of the country, are going to develop strategies
aimed at strengthening their market power, Franchising in
the clothing industry is an example of such a policy. In
this case, the pressure towards priee reductions is compar
ably lower.
1) A la longue in Italy and France there will be a restructuring in the distribution sectors, consequently priee reductions also will be very strong.

- sos -- 25 -
6. A fall in productin costs due to economies of scale has
been indicated as another plausible deferred direct effect.
A scenario might be a tendency towards a homogeneity of
tastes and demand across Europe, which could change the
balance between static efficiency and product variety in
favour of the former. In the United States demand is more
homogeneous and plants are usually larger than in Europe.
Volumes are relatively more important than variety. It
seems very unlikely, however, that demand in Europe will
follow the US pattern. Then flexibility will remain the
main route to efficiency for the European firms. In any
case, even assuming that most of the T-C industry is
currently working at 2/3 of the optimal size of the plants,
the cost reduction due to the full exploitation of static
economies of scale would not exceed, on average, 1,5-2,5
per cent of unit cost of production. The interna! market
effect, at best, might account for only 10 % of this reduc
tion.
7. Marketing economies of scale on the other band, mainly
due to advertising, brand image, and distribution factors,
have still to be fully exploited for many sub-sectors of
the T-C industry. A complete European market can help firms
to reach a European dimension and save on marketing costs.
Assuming that there is still on average a potential gain of
2,5 per cent in the textile and 5 per cent of the unit cost
in the clothing industry, and allowing the interna! market
to account at best for 10 per cent of the expected chan-.
ges1 >, the best scenario for the interna! market effect
is an estimated cost reduction of not more than 0,20-0,30
per cent of unit cost due to multi-plant marketing econo
mies of scale. These figures, added to the static economies
1) See paragraph 2 of this chapter.

- 506 -
- 26 -
of scale effect, give us an idea of the expected cost re
duction due to the completion of the interna! market in the
more favourable hypothesis: 0,3-0,6 percent of the total
unit cost of production and marketing. The highest cost
savings can be expected in France and Great Britain, cur
rently the less efficient T-C industries.
Indirect dynamic effects
Generally speaking, a more larger use of international
sub-contracting, de-centralization of production, and out
ward processing practices with producers of low wage coun
tries, are expected in the future. This will probably re
present the most important structural changes in the next
decade, particularly in the clothing indust~y.
The cost saving due to the de-centralization of the assemb
ly operation in low wage countries can be estimated around
15-25 per cent of the total unit cost of production. The
increased competition effect of the interna! market can
force firms to increase their recourse to outward proces
sing and direct investments in low wage countries. The more
optimistic scenario is that, in the second half of the
1990s, the share of imports of clothing from low-wage coun
tries will be 2-5 percentage points higher of the estimated
trend as a result of the internal market. The additional
saving on unit labour cost can be estimated around -1 per
cent for France, the country which is expected to expe
rience the largest increase in outward processing and di
rect investment in the next years, and roughly -0,2 to -0,5
per cent for Germany, while for Italy and Great Britain the
cost savings will be even less pronounced.

- 507 -
- 27 -
IV. Conclusions
1. The internal market effect will be marginal in the T-C
sector, because of the advanced state of integration
achieved. This statement can be reinforced by observing
that:
1.1 Plant and technical economies of scale have already
been exploited to a large extent.
1.2 Commercial economies of scale have still to be
exploited and their effect will be a further
homogeneity of tastes and priees, with scanty
relevance for the level of priees.
1.3 The proportion of disposable income devoted to T-C is
not going to increase, so the income effects of the
internal market on consumption are rather low.
2. The reduction of production priees due to direct and
indirect effects should range between 0,5 and 1,5 %. How
much of this reduction is going to be passed on to con
sumera depends on the commercial structure which will
prevail after 1992. Great Britain and Germany might
experience the strongest priee reductions, but in all
countries the effect on consumption will be insignifi
cant.
3. What is going to reshape dramatically the T-C sector in
the EC in the years to come is not the internal market
integration, but the fiercer competition from third
countries. Priees, profits, employment will be set where
third countries competition on one side and import pro
tection on the other will compromise. Compared to the
shocks produced by low wage countries import, the inter
nal market effect looks like a grain of sand.

- 508 -
- 28 -
REFERENCES
GATT (1984) Textiles and Clothing in the World Economy,
Geneva
Mariotti s. (1982) Efficienza e struttura economica: il
caso tessile-abbigliamento, Milano
Nenndorfer K. and E.-H. Stahr (ed. for Gesamttextil),
Wettbewerbsverhaltnisse und Wettbewerbsver
zerrungen im Welttextilhandel, Schriften zur
Textilpolitik, Vol. 2, Frankfurt/Main 1985)
OECD (1987) Structural adjustment in industry: study of
the textile industry, Paris
Pratten C.F. (1971) Economies of scale ln manufacturing
~ndustry, Cambridge (UK)
Scherer F.~l. et al. (1975) The economies of multi-plant
operations, Cambridge (MA)

- 509 -
15.
The •tost of Non-Europe•
in the Pharmaceutical Industry
Economists Advisory Group Ltd.


- 511 -
EEC CONTRACT ETD/87/7789/NE/14
This report was prepared with financial assistance from the Commission of the European Communities. The views expressed are those of the consultants and do not represent any official view of the Commission.
35 Albemarle Street London WlX 3FB
Tel: 01-629 7209 Tlx: 299153 AUNGCO Fax: 01-493 1624
E©(Q)~(Q)MO§u§ A[Q)~O§@~V G[gj(Q)QdJ~
~ 4 THE COST OF NON-EUROPE
IN THE PHARMACEUTICAL INDUSTRY
EXECUTIVE SUMMARY
PREPARED BY
ECONOMISTS ADVISORY GROUP LTD
M L Burstall with B G Reuben
January 1988


- 513 -
CONTENTS
Page
1 EXECUTIVE SUMMARY 1
1.1 The nature of the European pharmaceutical market and industry
1.2 Registration and its problems 6 1.3 Pricing systems, priees and priee competition 9
1.4 The operation of the multinational system 14 1.5 The results of unification 16


- 515 - - 1 -
1 EXECUTIVE SUMMARY
1.1 The nature of the European pharmacuetical market and industry
1. In 1984 pharmaceutical sales within the Community, including Spain and Portuga 1 , were approxima te ly ECU25, 750m at manufacturers • pri ces (Table 1), forming 9.5 percent of health care costs and 0.79 percent of combined gross domestic product (GDP). Of this total, 88 percent of sales by value were obtained through a doctor•s prescription, 14 per cent being consumed in hospitals and 74 per cent being dispensed through retai 1 pharmacies. Only 12 per cent were bought over the counter,
2. There are large variations in the consumption of pharmaceuticals between the member states in the Community. Differences in incarne are only partly responsible. Equally important are differences in attitudes to drugs and in traditions of medical practice. These variations affect bath the levels of consumption and the types of product consumed. There are strong similarities between Belgium, France, I ta ly and Spain, on the one ha nd, and Denmark, Ire 1 and, the Netherlands and the UK on the ether. The FRG has elements in common with bath.
3. The supply of pharmaceuticals within the Community is highly internationalised. Taking the Community as a whole, 43 per cent of sales are by indigenous companies to their own national market. In every country the locally owned industry has a disproportionately large share of the local market. Only in France and the FRG, however, does it amount to more than 50 per cent. Supplies from companies based in other Community countries make up a further 23 per cent of the total, while 34 percent come from firms based outside the Community, primarily in the USA and Switzerland.
4. Foreign companies supply drugs either through trade or by local production. In the Community the latter is the more important, amounting to about 40 per cent of all pharmaceuticals supplied. US and Swiss firms depend overwhelmingly on local production to supply their markets, while British and German companies also have substantial foreign facilities. Denmark, Ireland and the Netherlands are the only Community countries which are supplied mainly by imports from abroad.

- 2 --516 -
TABLE 1 PHARMACEUTICAL CONSUMPTION WITHIN THE EUROPEAN COMMUNITY, 1984
Country Total Per As % As % By type and outlet (%) Average Relative sales capita GDP hea lth priee
ECU ECU ca re OTC Ethical (UK=lOO) {1)
BELGIUM 880 90 0.81 DENMARK 370 74 0.50 FRANCE 5600 102 0.81 FRG 7660 125 0.89 GREE CE 449 45 0.95 IRELAND 160 46 0.67 ITAL Y 4440 78 0.91 NETHER- 660 46 0.38
LANDS PORTUGAL 350 35 1.08 SPAIN 1830 48 0.81 UK 3510 62 0.59
TOTAL 25750 o. 78
(1) at manufacturers' priees ( 2) 1983 (3) including dispensing doctors
costs (2)
8.6 7.0 8.8
11.0 20.2 8.8
12.4 4.1
18.9 12.1 9.6
9.5
12 15 9
16
through through retail hospitals pharmacies
{3)
76 12 70 15 78 13 66 18
.--83--+ 17 5 80 15 8 79 13 .. n/a •
+--93--+ 7 +--Ba-. 12
20 67 13
12 74 14
(4) using the 1983 indices of the EC statistieal office (5) per capita spending/average priee.
( 4)
103 154 76
164 73
115 57
145
low low 100
91
volume Per eapita (UK=lOO)
( 5)
140 77
216 122
99 65
221 51
n/a n/a 100
152
Source: Authors• estimates based on IMF and IMS data and OECD: Measuring Health Care 1960-1983

- 517 -- 3 -
5. Production of pharmaceuticals within the European Community amounted in 1984 to ECU39,300m (Table 2). The sector is dominated by large companies with the resources to develop new active substances (NAS). The cast of doing so is currently at least ECU75m per NAS to reach the market, and requires annual sales of ECU150m or more. There are 60 such firms operating in the Community, of which 33 are based there. Of the remainder, 20 are American, four are Swiss and three Swedish.
6. These companies have a strong international orientation and operate on a world-wide basis. They are generally organised on multinational lines. Within the Community, marketing is always organised on a country-by-country basis. The manufacture of active ingredients is con fi ned to a 1 imited number of si tes, but conversion i nto dosage forms is extensively decentralised. Basic and commercially sensitive research is highly centralised most commonly in the country of origin. Clinical and formulation development work, however, is often dispersed.
7. Many smaller companies operate in the Community. Most of them concentrate on generics or OTC products or exploit local markets with well-established remedies. Their innovative capacity is limited, and their focus national rather than international. Firms of this kind have 20-30 per cent of the market in France, the FRG, Italy and Spain, although they have largely disappeared in the UK.
8. On the basis of shares of the world market and of success in innovation, the pharmaceutical industry of the USA leads. That of Switzerland, although much smaller, is also in the first class. Among the compani es based wi thin the European member nations tho se of the FRG and the UK are very strong. French firms are less well placed, being excessively dependent on sales in the home marke't and in the franc zone, and the same is true, mutatis mutandis, of those of Italy. The research-based companies of Belgium, the Netherlands and Denmark have elements of competitive strength but are handicapped by their moderate size. The indigenous companies of the ether Community nations are uniformly weak.
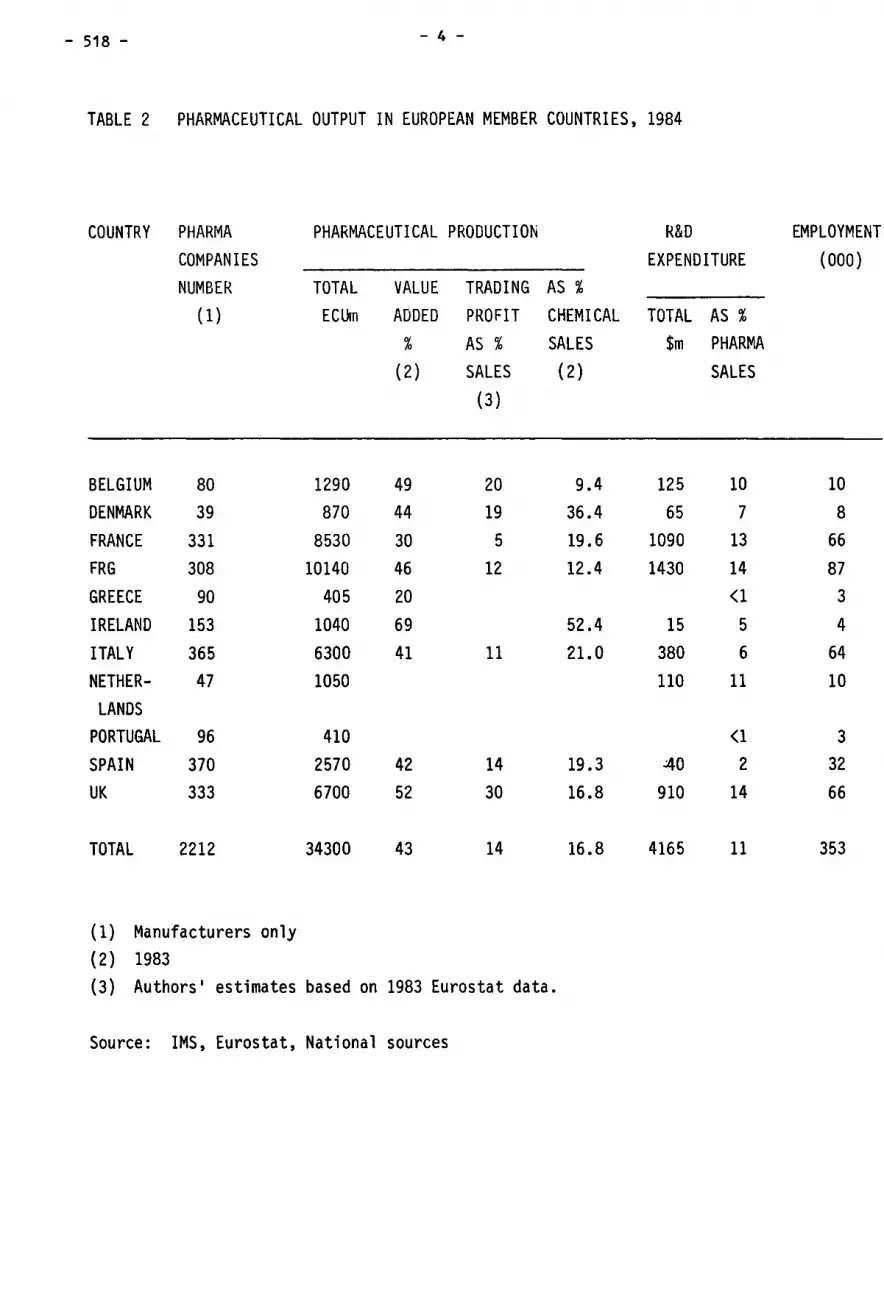
- 518 - - 4 -
TABLE 2 PHARMACEUTICAL OUTPUT IN EUROPEAN MEMBER COUNTRIES, 1984
COUNTRY PH ARMA COMPANIES NUMBŒ
(1)
BELGIUM 80 DENMARK 39 FRANCE 331 FRG 308 GREECE 90 IR ELAND 153 ITAL Y 365 NETHER- 47
LANDS PORTUGAL 96 SPAIN 370 UK 333
TOTAL 2212
(1) Manufacturers only (2} 1983
PHARMACEUTICAL PRODUCTION
TOTAL VALUE TRADING AS % ECUm ADDED PROFIT CHEMICAL
% AS % SALES (2) SALES {2)
(3)
1290 49 20 9.4 870 44 19 36.4
8530 30 5 19.6 10140 46 12 12.4
405 20 1040 69 52.4 6300 41 11 21.0 1050
410 2570 42 14 19.3 6700 52 30 16.8
34300 43 14 16.8
(3} Authors' estimates based on 1983 Eurostat data.
Source: IMS, Eurostat, National sources
R&D EXPENDITURE
TOTAL AS % $rn PHARMA
SALES
125 10 65 7
1090 13 1430 14
<1 15 5
380 6 110 11
<1 .:40 2
910 14
4165 11
EMPLOYMENT (000)
10 8
66 87 3 4
64 10
3 32 66
353

- 519 -- 5 -
9. The pharmaceutical industry is subject to a very large degree of government regulation. The admission of new products to national markets is strictly controlled. Proof of safety, efficacy and quality is universally required. Regulation of this type is carried out on a national basis, although a considerable degree of uniformity within the Community has been attained through the various directives issued by the Commission since 1965.
10. Pricing policies designed to limit pharmaceutical expenditure are also normal in the member countries. They result from the heavy involvement of European governments and national agencies in the provision of health care. Only in the FRG and the Netherlands are priees largely uncontrolled. Elsewhere, they are fixed by various forms of official action (paragraphs 27-32). Positive lists, which limit reimbursement to specified products, and negative lists, which exclude certain drugs or therapeutic categories, are widely used. Average priee levels vary very considerably within the Community. Differences of this kind have existed for many years. Priees are set on a national basis and little progress towards harmonisation has been made.
11. Other barriers towards the unification of the European market and industry are relatively unimportant. Tariffs and direct import restrictions have been eliminated, except in the cases of Portugal and Spain, where they are being phased out. Patent protection has been unified. Direct assistance to the local pharmaceutical industry in the form of subsidies and tax concessions is only significant in the case of Ireland. The discriminatory use of registration procedures and priee controls is considered below.
12. Government regulation of the industry means that it forms apart of . the political agenda. National administrations have divided aims. They wish to limit health care spending, of which pharmaceuticals form a minor but readily controlled part; at the same time they want to promote hign-technology industries, of which the pharmaceutical sector i s a success ful examp 1 e. The re i s therefore an inherent confl i ct of objectives.

- 520 -- 6 -
13. In practice, Greece, Portugal and Spain, without a research-based industry, favour the interests of consumers unambiguously. Belgium and
the Netherlands are inclined in the same direction; although they have such a sector, they appear to attach only a secondary importance to it. The FRG values its major companies, but is committed to a detached attitude to all types of industry. Denmark and the UK have a generally supportive attitude towards their own firms, which, however, make most of thei r sa 1 es abroad. The governments of France, and, to a 1 esser extent Italy, attach an equally strong importance to the interests of both consumers and producers, which have proved difficult to
reconcile.
1.2 Registration and its problems
14. The abject of registration is to make sure that a drug is safe, effective and of adequate quality before it is put on sale. The onus is on the applicant to satisfy the authority; the role of the latter is to evaluate the evidence put before it.
15. During the past 20 years the requirements of national regulatory authorities have converged as a result of action by the European Commission. There are now few differences in technical standards between them. All Community countries accept evidence obtained abroad and follow common guidelines. All provide abbreviated forms of registration for projects based on known ingredients. A uniform 120-day decision period has been agreed, to which 90 days are added if the product is referred to an advisory committee.
16. In practice, however, there are substantial differences between one country and another. Methods of evaluation vary, as do perceptions of the weight to be put on particular kinds of evidence. A large element of judgement is involved, which must be influenced by the local traditions of medical practice. Local clinical trials may not be officially required, but are often advisable to familiarise local opinion leaders with a new product.

- 521 -- 7 -
17. There are also considerable delays in processing applications. Currently only France approaches the 120-day limit on occasion. The FRG and the UK take about two years, and Italy and Spain three or more. The Community average is currently 18-24 months. Such delays have tended to increase in recent years. They are attributed in the main to a lack of resources on the part of national registration authorities, aggravated in several nations by a large increase in the number of applications for generic products.
18. The large research-based companies respond to this situation by preparing the necessary dossier centrally, usually with the US Food and Drug Administration (FDA), the most demanding of authorities, in mind. The experimental work is organised so as to satisfy all requirements; thus, if local clinical testing is needed, it will be included in the overall programme. The dossier is then modified to suit the needs of each authority. They consider this to be a satisfactory if not ideal way to work.
19. The direct costs of multiple registration within the Community are limited. Based on the extra staff employed by the major firms, a figure of ECU40-55m seems reasonable. Extra clinical testing is not considered to be serious burden; as already noted, the results contribute to the central dossier, while the testing itself may help towards a favourable decision by the licensing authority and towards a better reception when the product reaches the market.
20. More important are the effects of delays in the registration process. Since it takes 9-12 years to develop an NAS, the opportunity costs of the money tied up in the process are considerable. A further delay increases the penalty correspondingly. Estimates based on data supplied by the FDA suggest that in 1984/5 the total costs imposed by the general failure to observe the 120-day limit were in the range of ECU30-200m, depending on the discount rate chosen, with a most probable range of ECU57-82m, corresponding to rates of eight and ten per cent respectively.
21. Another serious problem arising from delays in approval is the loss of revenue while the product is in patent. As yet there is no

- 522 - - 8 -
general patent term restoration in the Community, and effective patent lives, weighted by national sales, average nine years. Estimates derived from average sales of new active substances during the years following their introduction suggest that the failure to meet the 120-day limit caused gross lasses of ECU360-640m to their originators. The net lasses are smaller, in part because costs of production must be deducted, and in part because of the continued sales of products which would otherwise be made obsolete.
22. The penalties due to the differences between member nations are less serious. As has been noted, with the partial exception of France, all greatly exceed the 120-day limit. If the minimum practicable time for the approva 1 of an NAS under current candi ti ons i s ta ken to be one year, then the opportunity costs of delay drop to ECU20-28m and the net loss of sales to ECU100-175m. As far as registration is concerned, the total cast of the non-Europe i's therefore ECU160-260m or 0.5-0.6 per cent of industry costs within the Community (table 3). Effective unification of the market would most benefit US companies since they introduce the largest number of new active substances.
23. Approaches to a more unified system of registration have focussed on two major al ternat ives pan-European registration cons ide rab 1 e prob 1 ems wi th
- mu tua 1 recognition between states and agency. Research-based companies see
bath the se approaches. The re a re doubts about the equality of the countries involved. There is sorne feeling that north European agencies carry more weight than south European ones. The differences of medical culture were thought to raise difficulties of mutual acceptability. Registration is not, however, thought to be used in a deliberately discriminatory way.
24. A single European agency would have the advantages of impartiality and uniformity of approach. In principle it could provide rapid decisions. It might, however, be excessively rigid and bureaucratie; the precedent of the FDA, EAG found, was not thought to be encouraging. There was sorne anxiety about the standards to be used; these would have to be high, but many feared a combination of the most severe elements of all national agencies. There was also concern about the political acceptability to the individual nations of a central authority.

- 523 - - 9 -
25. It does not appear that a central registration authority would be much cheaper to run than the present system. The national agencies employ the equivalent about 1500 staff at a cast of ECU55-70m to which accommodation and related overheads should be added. Allowing for the higher salaries prevailing in the USA, this sum is comparable with the cost of the drugs and biologies division of the FDA. The European national registration agencies are generally under-staffed and savings through the creation of a single authority would therefore be limited.
26. From the standpoint of the pharmaceutical industry the key issue is the speed of the registration process. Any change which lengthened it would be opposed. Consumers would also benefit from the more rapid approval of new substances provided that safety standards were not lowered.
27. The CPMP procedure in force between 1978 and 1985 was not widely used because of doubts among large innovative companies about its advantages. The current procedure has arised considerably more enthusiasm, especially as it is thought to be potentially faster than the normal route.
1.3 Pricing systems, priees and priee competition
28. As already noted, policies intended to control pharmaceutical expenditure are found in all member states of the Community. The methods used vary very widely as do average priee levels. The only common factors are that all systems incorporate an element of patient copayment and the over-the-counter ( OTC) products are exempt from regulation.
29. At one extreme, the FRG leaves pharmaceutical firms free ta set priees as they wish. Total expenditure is limited by strong pressure on companies ta limit priee increases and on doctors ta economise and by a negative list which excludes certain categories of comfort drugs from the reimbursement system. The situation in the Netherlands is very similar. Priees are high in bath countries.

- 524 - - 10 -
30. In the UK the profitability of pharmaceutical companies is controlled. A target level is set for the sector as a whole; the target for each fi rm depends on its research effort and on i ts contribution to the British economy. Subject to the se constrai nts companies are allowed to set the priees at which their products are introduced. Irish priees are in practice tied to those in the UK. In both countries they are in the middle range.
31. In principle firms may set their own priees in France, but in practice admission to the national reimbursement system is strictly controlled. Products are dealt with on an individual basis. The priee agreed between the manufacturer and the reimbursement authority depends on those of competitive products and on the company' s local activities in France. Belgium has a similar system. Priees are low in
both countries, and especially in France.
32. Denmark, Greece, Italy, Portugal and Spain control the priees of individual drugs by the use of cost-plus methods, and maintain positive lists. Priees are high in Denmark, below average in Italy and very low in the other three countries.
33. In every Community country except the FRG, the priee at which a product is introduced cannat subsequently be changed without official permission. Such permission is often delayed, refused or made contingent on the company expanding its local activities.
34. As far as the adequacy of priee levels is concerned, the attitude of the research-based companies is that sales in the Community market should ideally make a substantial contribution to world overhead costs, and in particular to the cost of innovation, and to profits. Pri ces in Den mark, the FRG and the Nether 1 ands a re cons ide red to be . 'satisfactory' form this point of view and those in the UK and Ireland 'adequate'.
35. Pri ces e 1 sewhere are cons ide red to be 1 ess th an adequate. Tho se prevailing in France are thought to be strikingly low as were those in Italy until recently. Priees in Portugal and Spain are even lower. Nevertheless, the major firms continue to sell their products in these countries. The reason for this behaviour is that production costs are
- 525 -- 11 -
relatively law, especially at the margin, while most other costs are fixed in the short run. It is therefore worth selling in any market in which direct costs are covered and sorne contribution is made ta overheads.
36. Official data suggests strongly that total costs vary considerably between member countries. In Italy, Portugal and Spain, law priees are offset to sorne extent by 1 ow costs and in the FRG hi gh pri ces are accompanied by high cast. The UK is unusual in combining above average priees with below-average costs, while the reverse is true of France. All measures suggest that priees in France are uncomfortably law from the standpoint of the French-based industry, which depends heavily on its local market. In contrast the UK industry is markedly profitable.
37. Consumer advocates claim, in opposition ta the standpoint of the industry, that pharmaceutical priees are generally excessive and that the industry is inefficient in its use of resources. Central costs are inflated and conceal unnecessary activity, especially in marketing and administration. Priees would be more firmly controlled; alternatively, competition should be stimulated.
38. In relation ta national incarne, total expenditure on pharmaceuticals is relatively law in Denmark and the Netherlands, and, to a lesser extent, in Ireland and the UK. It is high in France, Greece, Italy, Portugal and Spain. These variations result primarily from different attitudes to drugs rather than from differences in priees. For historical and cultural reasons the propensity to consume medicines is unusually high in southern Europe and law in northern Europe (paragraph 2). Such attitudes are difficult to change and must therefore influence national policies concerning the control of pharmaceutical expenditure.
39. In relation to national priee levels, pharmaceutical products are unusually cheap in France, and were so, until recently, in Italy. This is not the case in Greece, Portugal and Spain. It is arguable that in the former countries priees are strictly controlled in arder to limit total expenditure because it is impossible to reduce the volume of consumption. In the latter nations, however, law priees correspond to
- 526 - - 12 -
low incarnes. Priees in Denmark, the FRG and the Netherlands are high compared to other priees, perhaps because of the combination of free pricing, comprehensive health care services and a restrained attitude to medicines (table 1 and paragraph 38).
40. In so far as comparison with other parts of the chemical industry is possible, the pharmaceutical industry of the Community appears to use its resources with equal efficiency. In most member countries, however - France is the principal exception - it appears to be appreciably more profitable.
41. This is probably due to the ways in which priee competition is limited by the arrangements for getting drugs to those who need them. Most products are available only on prescription (paragraph 1) and doctors see their prime duty as well-being of the patient rather than economy. The majority of the bill is paid by the state or the insurance agency. In most countries the distribution system incorporates definite monopoly elements. There is therefore scope for higher than normal profits.
42. To this extent consumer organisations have grounds for their criticisms. As presently constituted, the arrangements for discovering, making and distributing drugs are as a whole rather more expensive than is strictly necessary. The extra profits realised by the industry, however, do not appear large while the future benefits to be derived from its continued activities are very considerable. It is also arguable (paragraph 46) that priee competition is increasing in certain significant parts of the pharmaceutical market. Moreover, it is obvious that radical alterations to the system would require a major political effort.
43. There is clear evidence that pricing systems may operate in a discriminatory way. As already mentioned (paragraphs 30-33}, individual priees and profit margins depend in several member countries on the scale and nature of a company•s local activities. This obviously discriminates in favour of indigenous firms; it also promotes the unnecessary decentralisation of particular functions, with

- 527 -- 13 -
potential lasses in economies of production {paragraphs 53-54).
44. Market distortions arise from the sharp differences in priee level. The most obvious sign is parallel importing from law-priee to high-price areas. It is seen in Denmark, the FRG, the Netherlands and the UK, the main sources of supply being France and Italy. The scale of this practice is quite small, however- it accounts for no more than 0.5 per cent of total Community sales - and has not increased recently. It is seen by the industry as an irritant rather than as a major threat.
45. Although priees do not play a major role in the competition between pharmaceutical products {paragraph 41), they nevertheless have an appreciable if subordinate part. In countries which permit free pricing, in-patent products are introduced at priees explicitly related to those charged by their competitors. Therapeutic advantages justify a premium priee of up to 25 per cent over other medicines in the same therapeutic class.
46. A vigorous market in out-of-patent genric products has recently developed in those member countries where priees are high. Priees have been forced dawn and reductions in expenditure realised. Such products account for eight per cent by value of the UK market and ten per cent of that of the FRG and the Netherlands. It may be noted, however, that the market is highly imperfect and the originator is normally able to retain much of his sales even when charging a premium priee. Official action to encourage generic products has been a sine gua non for the development of a successful generic sector.
47. The industry welcomes the transparency directive which it sees as a step to reduce and perhaps eliminate discriminatory practices and, in particular, pressures to enlarge local activities beyond what is commercially desirable. Progress towards convergence of national priee levels within the Community is widely anticipated. There is sorne anxiety about the basis on which this might take place. The directive has been less enthusiastically received by consumer advocates, who consider that it will do little to limit the profits of the industry.

- 528 - - 14 -
1.4 The operation of the multinational system
48. The major pharmaceutical companies operating organised on a multinational basis {paragraph 4).
in Europe are This coul d be
sub-optimal from an economie standpoint. The need to carry out operations in many locations could give to lasses in economies of scale. The coordination of such an organisation could prove excessively expensive.
49. The research-oriented companies that there would be no worthwhile economies of scale in research from the unification of the Community market. There are indeed such economies in serious innovative research but they have already been realised. Such activity is normally concentrated in the firm's country of origin. Where a company has major research centres abroad, they have been placed there in arder to exploit local expertise. Within the Community such centres are placed in the UK or, less frequen'tly·, in France. In a unified market there would be no immediate change in this policy.
50. Local development work is more decentralised. lt does not appear, however, that this activity would be much affected by unification. Formulation research for specifie markets is best carried out on the spot, where local advice and information is most effective and tests may be most readily arranged. As has already been seen (paragraphs 16, 18), local clinical research has promotional and even political fu net ions as we 11 as sei en ti fic ones, and may therefore be indispensable in practice.
51. The scope for economies in marketing are also very limited. Traditions of medical practice and patterns of consumptions vary markedly between member countries {paragraphs 1, 2) and different approaches are necessary for each market. Even more to the point, the key persan in marketing is the salesman who calls on doctors to promote his company•s products. If he is suitably persuasive, he must by definition be a native of the country in which he works. In practice marketing is always organised on a national basis, and no firm interviewed could see any alternative.

- 529 -
52. The
- 15 -
The possibility of economies in production are more considerable. manufacture of pharmaceuticals involves two stages: the
production of the active materials by extraction, synthesis or fermentation, and the conversion of these substances into dosage forms. The first of these steps is normally confined to a few sometimes a single site in Europe, but the second is often decentralised. A common reason is reported to be pressure from host governments, often expressed in the course of priee negotiations (paragraphs 30-33, 42). Multinational companies agree that to meet these demands is often to sacrifice economies of production.
53. The equipment used for the formulation of active ingredients is relatively cheap but the building in which it is put, which requires elaborate air-conditioning and ultra-clean facilities is not. The total cost of a formulation plant depends not so much on the volume of output as on the product mix and on the technology used. Over a wide range of output, therefore, it may be taken as fixed. The number of such installations within the Community much exceeds need. American multinationals report that their European formulation plants were often working at between one third and one-half their capacity.
54. Assumi ng this to be genera lly true, th en between one-ha 1f and two-thirds of all formulation plants belonging to the multinational companies are surplus to requirements. There are approximately 250 such plants within the Community. If they are conservatively valued at either ECU 10 or 20m each then the extra capital employed is in the range ECU 1250-3333m. If they were eliminated then, assuming a 10-year lifetime for this kind of installation, the annual saving would be ECU 125-333m.
55. If it is further assumed that the extra production could be provided by existing plants with no further labour then the reduction in employment may be tentatively estimated at a maximum of between 12,500 and 16,500 persans. Labour costs would drop by ECU 225-295m. The total saving in production costs \'IOuld then be ECU350-630m, or 1.0-1.9 per cent of unit costs. If priees remained unchanged this would increase the trading profits of the Community industry as a whole by 7-14 per cent; alternatively spending on R & 0 might be raised by 8 - 15 per cent.

- 530 - - 16 -
56. It should, however, be emphasised that these gains are markedly hypothetical. Multinational companies commented that in many cases their local activities were beneficial to them. In sorne countries, notably France, they are a condition of receiving an adequate priee. In Germany, although pressures of this kind were absent, the free market permits relatively high priees which are advantageous in those export markets in which they are linked to those in the country of origin. More generally, firms feel an obligation to behave as corporate citizens of their host countries. Their local plants already exist, and it would be politically unacceptable and commercially damaging to shut them dawn.
57. Multinational companies do not think that there are appreciable direct costs in running Europe-wide networks of subsidiaries. Most of them remarked that the extra staff required to coordinate their operations were few.
58. The unification of the European market would therefore not be followed by large changes in the location of facilities. Sorne degree of concentration is seen as desirable but would happen slowly. Extensive action would have to await changes in pricing systems. Most companies indicated that they would continue to maintain production facilities in the five major countries of the Community.
1.5 The results of unification
59. The savings which might be expected from unification of the Community pharmaceutical market have been estimated in a variety of more or less plausible scenarios on an exploration of company attitudes. They are shawn in table 3. In the first, no concentration of facilities takes place but economies due to unified ànd more rapid registration are realised (paragraph 22). In the second, multinational companies also withdraw all production facilities from Greece and Portugal. In the third, they further reduce the number of formulation plants which they operate by 50 per cent in France and by 25 per cent each in Italy and Spain. The production lost by these countries is transferred to the FRG and the UK.

- 531 - - 17 -
TABLE 3 SAVINGS IN DIRECT COSTS OF OPERATION TO COMPANIES AND COUNTRIES THROUGH THE UNIFICATION OF THE COMMUNITY MARKET ON A 1984 BASIS
(For the three scenarios see para 59)
Origin of firrns FRANCE FRG UK USA SWITZ OTHER TOTAL
SCENARIO 1
Savings to firrns
- rn ECU: lower value 10.7 23.4 17.6 65.6 28.6 14.1 160 upper value 17.2 37.7 28.3 105.6 46.6 25.3 260
- As % unit costs lower value 0.19 0.26 0.51 0.91 1.34 0.22 0.48 upper value 0.30 0.40 0.82 1.47 2.10 0.39 0.77
SCENARIO 2
Absolute saving rn ECU Law value 18.5 29.6 23.8 84.3 31.7 15.7 204 High value 28.9 47.0 37.6 133.6 50.7 27.6 325
Reduction in unit Costs %
Law value 0.32 0.34 0.70 1.17 1.43 0.24 0.61 High value 0.50 0.53 1.09 1.86 2.15 0.43 0.96
SCENARIO 3
Absolute saving rn ECU Law value 22.8 39.3 34.4 116.4 35.8 19.8 269 High value 46.2 88.6 61.9 227.7 65.8 42.7 533
Reduction in unit costs %
Law value 0.40 0.44 1.00 1.62 1.68 0.30 0.79 High value 0.81 1.00 1.81 3.17 3.08 0.66 1.57
Source: Authors' estirnates

- 532 - - 18 -
60. The savings realised range from a minimum of 0.5-0.8 per cent of European unit costs ta a maximum of 0.8-1.6 per cent. These savings would accrue primarily ta companies operating on a multinational basis in a large number of member nations. They are proportionately greatest for US firms followed by those based in Switzerland and, at sorne distance, by the UK. Because these estimates relate ta all companies of a particular nationality it shculd be remembered that this reduction in unit costs might be considerably higher or lower for individual firms, depending on their circumstances.
61. The funds sa liberated might be used ta increase investment in R & D, with a positive effect on competitive strength. For the Community as a whole research budgets could rise by between five and 18 per cent. However, as noted a bave, the main bene fi ts wou 1 d be fe 1 t by companies based outside the Community.
62. The effects of maves towards common pricing have been explored. Cou nt ri es in whi ch this entai 1 ed genera 1 i ncreases in the pri ce of pharmaceuticals would have ta spend more on consumption but would simultaneously become more attractive as centres for production, since local production is always a major source of supply for the local market in the larger member countries of the Community. Countries in which priees fell would experience the reverse. Harmonisation on a basis which maintained total Community expenditure would benefit French and Italian firms and would have adverse effects on those of the FRG. UK, US and Swiss firms would break even. Harmonisation on a basis which reduced expenditure would be unambiguously unfavourable for all.
63. In the longer term the effect of unifying the European market will be to make the strong stronger and the weak weaker. Firms which have depended on the favour of their governments will suffer, while those who are already highly competitive will flourish even more. The elimination of marginal companies should concentrate resources on the more efficient and enable them ta exploit the opportunities of the future the more profitably. Accelerated progress towards a two-tier pharmaceutical industry, in which companies are either very large or relatively small, seems probable.

- 533 -
16.
The Internal Markets of North America. Fragmentation and Integration in the US and Canada
Jacques Pelkmans in cooperation with Marc Vanheukelen


EXECUTIVE SUMMARY AND CONCLUSIONS
THE INTERNAL MARKETS OF NORTH AMERICA
fragmentation and integration in the US and Canada
Jacques PELKMANS
in cooperation with Marc VANHEUKELEN
Maastricht, 8 January 1988
Project: Costs of non-Europe'
=\\ ,,~ Institut Européen d'Administration Publique
European lnstitute of Public Administration


- 537 -
1
PREFACE
The Commission of the EC, strongly supported by the European Parliament, bas
initiated a project on 'The costs of non-Europe', and the benefits of
"completing" the Community' s Interna! Market by the end of 1992. The
steering committee, chaired by Mr Paolo Cecchini, decided that the work
could benefit from an exploratory study of the Internai Markets of the US
and Canada, in particular, their remaining 'incompleteness' as well as the
costs and benefits.
The present paper aims to analyze the nature of the Interna! Market of the
USA, with special attention for its remaining fragmentation, and that of
Canada, with its fragmentation too, as well as the nature and scope of
non-tariff barriers and other distortions discussed in the Canada-US free
trade area talks. A second objective is to come to an assessment of costs
and benefits of the barriers inside the two Internal Markets of the USA and
Canada, respectively, as well as the costs and benefits of the l.anada-US
free trade area for the Canadian economy.
The assignment is to provide an exploratory study, not a fully-f ledged
research product nor a very detailed and minute comparison. A major
limitation of the paper is that no original research was conducted. The
basis of the following is literature, interviews and discussion.
The author is endebted to numerous Canadian and US civil servants, academie
experts and specialists, who generously helped to gather material and to
improve the understanding of the many intricate aspects of market
integration in their countries. Special thanks are due to Mark Vanheukelen
(DG II, EC Commission}. His painstaking efforts to clarify lots of detailed
pieces of economie regulation have been indispensable. His insightful
analytical survey of the empirical economie studies on the impact of the
US-Canada free trade area on the Canadian economy bas greatly increased the
quality of this report. Needless to emphasize, however, that only the author
is responsible for any errors or omissions.
- 538 -
2
EXECUTIVE SUMMARY AND CONCLUSIONS
1. In the framework of the research project 'The costs of non-Europe' it
was considered useful to dispose of a study of the Interna! Market
arrangements in the US and in Canada as well as the recent endeavour
of the two countries to establish one North American market. A second
objective is to provide, whenever possible, a cost/benefit assessment
of still existing 'barriers' in the two countries and of the removal
of 'barriers' between the two neighbours. Since the free trade area
agreement implies an enormous market enlargement for Canada, the
latter cost/benefit analysis will concentrate on the Canadian case.
2. The assignment is to provide an exploratory study. The report
summarized below is not a fully-fledged research product, as no
original research was conducted and sourcing, interviews and the
processing of literature and material were limited by time
constraints.
3. The main features of the report are four:
o the context of market integration in the US and in Canada
o a comparative description of seven 'barriers' within the two
Interna! Markets
o an assessment of the market fragmentation caused by each
'barrier', and its costs, where possible
o an assessment of the (net) economie benefits of North American
market integration, especially for Canada.

- 539 -
3
4. The context of market integration in the two countries studied
differs considerably from that of the European Community today, or
even from the EC in 1993. It is also important to appreciate
essential contextual differences between the US and Canada. The
report highlights a number of non-economie factors, such as
demographie and geographie determinants of market size, some
essential historical, constitutional and legal characteristics, and
key political values. Although the factors are not elaborated, it is
crucial to take them into account before any possible lesson is
drawn from the assessments.
5. The Interna! Markets must also be placed in a wider economie context
before a proper evaluation of the nature and degree of market
integration and fragmentation cao be made. The allocative function
of government - exercized by the choice between the market mechanism
on the one ha nd and the options of regulation and intervention in
markets on the other ha nd - is not full y centralized in the two
federations. However, the degree of delegation of allocative
functions to the market and the degree of decentralization of
regulation/intervention interact with two other economie functions
of government: redistribution and macro-economie stabilization. The
nature and degree of market integration depend on this interaction,
and not solely on allocative decisions.
6. Both Canada and the US have centralized their macro-economie
stabilization policies. They each have one money and the federal
government's budget carries a large weight in the national economy.
There are no interna! exchange controls and the money and capital
markets are fairly well-integrated. Nevertheless, fiscal policy is
not fully centralized and this gives rise to both macro-economie and
allocative issues. The federal governments also assume certain
general redistributive functions both directly and via
(co-)financing welfare programmes at subcentral leve!. In both
countries this central function is closely linked to labour mobility
as citizens anywhere in the nation are always entitled to equal and
free access to social security and related benefits.

- 540 -
4
7. The seven categories of 1 barriers 1 were selected in prior
consultation with the Commission in view of their prominence in the
White Paper and their expected importance in the two countries. 1 Barriers 1 are defined as impediments to or artificial
encouragements of economie mobility between States or Provinces. For
a discussion of the concept used, the reader is referred to section
4.1. The seven categories of barriers selected are: (in) taxation,
public aid, discriminatory public procurement, (in) financial
services, technical barriers, (in) labour mobility and (in)
transport.
8. An elaboration of these barriers for both countries is not possible
in the executive summary. Nonetheless, without some basic
description, the assessment cannat be explained at all. A compromise
is presented in Table EX-1, providing a highly condensed
presentation of the comparative analysis in the chapters 5 and 6 of
the report. The reader is warned that this material does not lend
itself very well to such compression; for a proper understanding it
remains indispensable to consult the main text.
9. Very little research on the quantitative economie costs (and
benefits, if any) has been conducted on the intra-US 1 barriers 1• For
Canada some simple static estima tes exist. Therefore, the report
discusses internai 1 barriers 1 in the two countries almost entirely
in qualitative terms. Hence a 1 ranking 1 of barriers in terms of
costs is not possible and the following impressions are inevitably
partly subjective.
10. In Canada, the most costly 1 barriers 1 are likely to be excises on
alcoholic beverages (including the restrictions of provincial liquor
boards); the administrative burden on road haulage flowing from the
enforcement of the destination principle in fuel taxes; provincial
subsidy competition; and the administrative burden on road haulage
flowing from provincial entry regulation and registration fees. It
is uncertain whether discriminatory public procurement is so costly
to the economy. Interprovincial tax competition in Canada is
unimportant in the retail sales tax and persona! income tax and more

- 541 -
'barriers' or sec tor
1. taxation - sales
- excises
5
TABLE EX-1
THE INTERNAL BARRIERS IN CANADA AND THE US:
a summary of facts and costs
CANADA
provinces levy retail sales tax; rates vary from 0% to 12%; Ontario 7%; Quebec 9%, distances prevent major distortions; fiscal cross-border shopping is exceptional.
excises differ among provinces but the main issues are with alcoholic beverages and motor fuel; local preferences through liquor boards' rules are combined with restrictions to m1n1m1ze cross-border shopping; wine and spirits excises can be much higher than in the US; fuel excises differ also but the major concern of provinces is that miles travelled by trucks in a province are roughly proportional to fuel bought locally (via extra administrative controls).
USA
states and local authorities levy retail sales tax; rates (incl. local) vary from 0% to 9%; many states exempt various basic needs, but often in different ways; certain states tax services, others don' t; geographical distribution and distances prevent major distortions; only few identifiable cases of fiscal cross-border shopping.
states levy excises especially on cigarettes, alcoholic beverages and motor fuel; state cigarettes excises vary from 2 cents a pack up to 29 cents; large scale cigarette bootlegging is a federal crime; individual cross-border shopping is accepted and can be substantial; spirits excises differ enormously from $1.50 to $6.50 (often combined with state monopoly systems); random checks on cross-border shopping of all alcoholic beverages; state motor fuel excises vary from 8 cents to 19 cents a gallon, with cumbersome fuel use administration for trucks (per state).

- 542 -
- corporate
- personal income
2. public aid - subsidies
- tax breaks
6
provincial rates vary from 10% to 16%; federal tax collection agreement for 7 smaller provinces (i.e. identical base); there is uniformity for multi-provincial firms in apportioning tax revenue among provinces.
rates vary somewhat among provinces; base is harmonized through federal tax collection agreement (exc. Québec); progressivity structure is similar; provincial tax credits may differ but not much.
vigorous subsidy competition among provinces; no federal supervision via Ottawa or the Supreme Court; great variety of instruments, frequently 'off-budget' (via 'crown' corporations or special funds); subsidy competition is reduced via federal regional programmes.
numerous; limits (for corporate tax breaks) are set by the federal
state (marginal) rates vary from 0% to 11,5%, ignoring all kinds of special cases; however, states compete via exemptions, too; 5 states have no corporate tax; unitary taxation is not forbidden, though strong pressures discourage it somewhat; altogether, interstate corporate tax competition has reduced average state corporate tax revenue below 5% of all state revenues.
rates vary considerably among states, the highest marginal rates ranging from 10% to 13,5% in nine states and lower in other (bef ore the recent tax ref orms; t o be reduced t o four) states; seven states have no personal income tax and three levy only a tax on interest & dividends; state/local income tax is deductible for federal income tax purposes (reducing the impact of interstate tax competi- tion); federal and states' tax base not harmonized.
all states have inwardinvestment promotion activities, but direct state aids are very modest, major instruments are infrastructural, easier access to capital and various tax exemptions; many states' laws forbid production subsidies; commerce clause enforcement is another major constraint.
numerous; especially on construction, initial outlays for plant and

- 543 -
3. procurement - forma!
- informa!
4. financial services - banking
7
collection agreement for the 7 smaller provinces, but not for the three bigger ones (as they opted out)
complete constitutional freedom for provinces to purchase preferentially; provincial laws usuallyset maximum priee diffe-rences for tendering procedures.
the forma! leeway is materially reduced by interprovincial sensitivities and tax payers' consciousness; nevertheless, numerous informa! local content requirements or 'understandings' are reported. (Note: the provincial purchases are small compared to EC Member States, as major purchase categories are private in Canada or federal).
nation-wide operations with, however, quite sorne provincial regulation; no nation-wide freedom to supply cross-border banking services; efficient national clearing; different banking functions were regulated at federal leve! (banks) and provincial (near-banks and securities); recent deregulation upset this system somewhat; the capital market is truly nation-wide and open to the world; there are 4 stock exchanges in the country; the banks are few
physical capital; also excise and income tax (for immigra ting business executives) exemptions are used.
around 20 states have preference laws (up to 5% priee differentiai in bids); states as purchasers are normally not constrained by the commerce clause.
there are many anecdotes about informa! pressures; tax payers' consciousness in the US is very nigh, however, and blatant discrimination (if costly) can be politically damaging (Note: state purchases are small compared to EC Member States as major purchase categories are priva te in the US or federal).
banks can be chartered at federal or at state level; most supervision is federal, but assigned to a handful of institutions in a complex setting (savings and loans as well); fragmentation arises out of crippling branching restrictions: there are many thousands of 'unit' banks with no branches at all; interstate branching is forbidden, with groups of states sometimes allowing exceptions; intra-state branching prohibitions still exist in a number of states. For the many complexities this

- 544 -
- insurance
5. technical barriers
8
in number (5 big ones gives rise to, see section attract most business) but 6.2.2. Pressures to reduce competition is fierce. this fragmentation are
most regulation at provincial leve!; some at federal level; far-reaching harmonization between provinces has been achieved via uniform laws proposed by the Association of (provincial) Super-intendents of Insurance, close collaboration between industry and regulators at federal leve!, and delegation of the control of the financial integrity of insurers to the federal Dept. of Insurance; in this way, formal provincial powers have nevertheless enabled effective market integration in insurance, with considerable standardization and mutual recognition and 'home province control' where necessary.
formally, provinces have substantive regula tory powers; yet, apart from road haulage and a few instances in agriculture, the re appear to be few problems in technical regulations. Standards are mostly nation-wide; so is certification.
strong: they originate from financial stability concerns, technology, business strategies and consumer sources. The costs of fragmentation have probably decreased for consumers due to technology, but financial instability costs are still high.
regulated at state leve! since Congress has explicitly allowed for this. Licensing of insurers and brokers per state and divergent state regulations lead to serious fragmen- tation, although formally the freedom of services is nation-wide. States refuse 'home state control', so super-vision is expensive and duplicative. Regulation extends to rates (at times very strict), solvency, insurance products, taxes and fees, and licensing -there is reciprocity for licensing agents and brokers. Costs are further increased by almost permanent legislative drift in many states (recently again in response to the problems in product liability insurance).
although standard writing is (privately) organized in an extreme·ly complicated way, the issues arizing are in the antitrust area, not so much in differences among states regulations themselves, or the standards they refer to.

- 545 -
9
6. labour mobility - general constitutional rights to
access travel and to migrate; to labour recourse to provincial markets social security/services;
- professions
nation-wide public pension; incomplete portability of private pensions; some cases of preferential provincial hiring of labour.
extensive regulation of professional licensing at provincial leve!; sometimes the local professional organizations decide on admission; minimum residence requirements are rarely costly (but some are); barriers are serious for lawyers, pharmacists and surveyors, as well as for certain skilled craftsmen; university education is to federal standards in many cases (although restrictions exist in the medical field).
Standards are nation-wide. The major exception is in the building codes. Nevertheless, the commerce clause should not be considered as preventing differences in technical regulations from arising at all, and this cao be costly in individual cases.
constitutional rights to travel and to migrate; recourse to state social security/services; fairly strict case law to prevent preferential hiring.
extensive regulation of professional licensing at state leve!; dependent on state and professions, restrictions cao vary from trivial to very serious; however, higher education in many cases is federally oriented or to federal (university) standards (yet, some states require local exams in some professions); mutual recognition exists in some cases, not in other there is no general rule.
(Note: mobility is (Note: mobility is
7. transport - registra
tien
actually substantial).
At provincial leve!; until '82 license plates for every province; now the re is 'home-province control' with mutual provincial recognition of the home plate, with an inter-
actually substantial).
At state level; registration reciprocity is widespread; registration 'fees' competition is reduced in 'compacts' (more than 30 states), with fees shared

- 546 -
- fuel
- other
10
provincial clearing based on miles travelled per province (i.e. an administrative burden).
fuel taxes differ among provinces; the real problem is the destination principle; fuel tax revenues are shared out among provinces according to miles travelled in the province( s), which imposes cumbersome administrative requirements for road haulage.
licensing before entering the road haulage sector takes place at provincial level (stricter regulations for out-of-province sometimes Supreme reduces right).
truckers are validated by the
Court, which the cabotage
ace. to miles travelled (i.e. an administrative burden).
as in Canada, the destination of the fuel tax revenue is the key issue; truckers are held to fill tanks proportional to miles travelled in the various states (or pay the excise anyway), and file f orms and accounts proving this; random checks are regularly held.
43 states have not deregulated on intra-state transport incl. entry barriers and 'fair competition' rules which can be peculiar;' they can create some costs for firms operating nationwide; property taxes and sales taxes on trucks differ; on axle/distance taxes, there is even tax retaliation among certain states.
NOTE: For a proper evaluation, this list of barriers should be read
together with the assessment in the text. The economie context, the
benefits and minor costs are not indicated in this summary. Details are
ignored.
- 547 -
11
pronounced for corporate taxes.
complications but in reality,
Financial services present sorne
fragmentation has been largely
prevented. The costs of having formai provincial powers in insurance
are negligeable as harmonization is almost complete. There are hardly
any problems with securities, but near-banks cause regulatory and
supervisory costs. Technical barriers are exceptional in Canada.
Migration for the professions can be onerous in sorne cases;
uncertainty exists because of local admission procedures.
11. In the US, the most costly 'barriers' include interstate tax
competition in general, interstate branching prohibitions in banking,
state regulation in direct insurance and administrative burdens
connected to interstate road transport arrangements.
Interstate tax competition is so fierce in the US that it covers
almost any conceivable tax, including death taxes and gambling taxes.
In sales taxes there is only a moderate spread of rates, but this is
likely to be related to transaction costs for non-marginal cross
border shopping, given the absence of fiscal frontiers (so, one could
argue that sales tax competition is also fierce but restrained by
open borders). In excises, competition is stronger, and complemented
by non-fiscal (f. i. administrative) measures to secure tax revenues
for the state of consumption. These measures even lead to cooperation
among the States and, in cigarettes, to federal law enforcement for
the States' purposes! In corporate and persona! income matters, tax
competition is strong; in corporate taxes, exemption policy and other
tax breaks play a role as near-subsidies. State subsidies are of
trivial importance and public procurement discrimination seems only
marginally more costly. Technical barriers in interstate commerce are
effectively minimized (if not removed) by commerce clause case-law
but, to sorne extent, state technical regulation and their differences
may still lead to higher costs for multi-state business; standards
and certification present few problems, however. Interstate mobility
of the professions sometimes seems to be hampered by overly strict
regulation, including licensing and supervision. Since national
standards for professions and university education are well-accepted,
mobility costs are generally not increased more than marginally.

- 548 -
12
12. Finally, in both countries incident al 'barriers' can be identified
outside the selected group of seven categories. They remain outside
the scope of this report (for an impression of this problem, see
sections 5.1 and 6.1).
13. A cost/benefit perspective of the fragmentation and integration of
the interna! markets of the US and of Canada requires, t10wever, a
broader set of criteria. Looking strictly to 'barriers' as
impedimenta to access to state/provincial markets or as artificial
encouragement of inward economie mobilities might provide a singular
emphasis on 'costs'. From this angle, 'benefits' would be identified
only for sectoral or regional interests, with the national economy
presumably suffering an overall welfare loss. Given the nature of the
Commission's research project 'The costs of Non-Europe', this report
does not address the benefits of sectoral groups.
14. The problem is quite different with regional interests. Of course, at
regional leve! sectoral lobbies will attempt to present their case in
terms of 'regional' benefits. If and only if this is all there is to
the political economy of 'barriers', the mere concentration on costs
to the national economy would be proper. But in federal countries,
this cannot always be correct. It is conceivable to design a mode!
federal country where market integration is complete, and where
subcentral governments are only involved in purely regional
expenditure and regulation (with no spill-over effects to other
subcentral economies). Neither the US nor Canada fully respond to
this mode!. Since they do not, 'barriers' must be presumed to
generate certain 'benefits', as elements of political support to the
federalist structure of government.
15. If there are 'benefits' of plurality, variety or diversity, two
questions emerge in the context of this report:
(a) given the constitutionally assigned powers and politically agreed
division of labour between the central and the subcentral
governments - i.e. the 'benefits' - are these powers utilized in
such a way as to achieve the highest degree of market integration?
In other words, given the 'benefits' of a federal structure, are
the 'costs' of fragmentation minimized?

- 549 -
13
(b) The 'benefits' of diversity may include more than the
satisfaction of having one' s own regional government with some
powers to satisfy local preferences. To what extent, then, do
regional regulation and intervention (in the US and Canada) yield
benefits to the national economy, that are not captured by the
focus on their distortive nature as 'barriers'?
16. If the immaterial, but genuine, 'benefits' of a federal structure are
expressed in regional competences with a market-fragmenting
potential, the issue is one of cast minimization. A variety of
approaches are used in the two countries.
o federal judicial review on the kind of measures, allowed to
affect market integration; in the US the commerce clause case-law
goes very far in protecting interstate commerce from state
measures; in Canada, the interprovincial economie mobilities are
also protected but there is more attention to preserve the
effective economie powers of the provinces (the 'benefits').
o a complementary factor in bath countries is the threat of federal
preemption, possible under the constitution but not utilized so
as to increase the 'benefits' of decentralization. The threat
tends to become more credible as the costs of fragmenting
subcentral measures increases, thereby having the effect of
curbing local protectionist pressures. In the insurance market in
the US, states can only retain current powers if they find
mechanisms keeping the costs of fragmentation acceptable, so that
federal pressure to preempt does not build up. In the US banking
market, inters tate branching prohibitions in federal laws have
been threatened a number of times; in the distant past, new
measures bordering on the problem have been used as palliatives
(federal deposit insurance being one); during the last few
decades more and more routes of evasion have been agreed or
condoned at federal leve!, leading at state leve! to a measured
relaxation of the prohibition as a response since 1985. In
Canada, the federal government delegated raad transport
regulation to the provinces in the early 1950's and the mounting
irritation about the costs of fragmentation (against the backdrop

- 550 -
14
of a constitutions! debate on an 'economie bill of rights'
guaranteeing market integration) forced the provinces to reduce
these costs in the early 1980's.
o cooperation among the States or Provinces. For subcentral
governments this has the advantage of retaining powers (and,
whenever relevant, tax revenues), while reducing fragmentation,
duplication or harmful competition. Both countries have developed
legal techniques that greatly reduce costly differences in
regional laws and procedures: the major instrument is Uniform Law
Codes, but sometimes unif orm insurance policies exist or
identical procedures. Cooperation may extend to 'mutual
recognition' (e.g. licensing insurance brokers in US States) but
not frequently (e.g. rarely in licensing insurers). Mutual
recognition is approximated, however, in cases where national
standards (technical; diploma's) are used as references in
regional laws; some costs remain in such cases, as licensing
procedures may still be required. Cooperation is also developing
in joint institutions (cf. solvency investigation of non-US
insurers by the NAIC, seeking licenses in a State), in interstate
compacts (sharing truck registration fees, for instance, or,
allowing limited reciprocal interstate bankbranching) and in
joint lobbying organisations (promoting federal-subcentral
cooperation so
'harmonization').
as to reduce
Cooperation can
fragmentation or enhance
go as far as delegating
administrative execution (tax collection agreements in Canada;
some insurance controls in Canada) or enforcement power (checks
on cigarette bootlegging in the US) to the federal government. In
the case of administrative execution this increases uniformity as
a condition to the federal task (e.g. a uniform tax base). In the
case of cigarette bootlegging, however, it has reduced the
constraint of (illegal) cross-border trade, thereby increasing
the freedom of the States to raise excises.
17. Are there other benefits of regional powers to the national economy,
that are not captured by the focus on their distortive nature as
'barriers'? If so, they would have to be weighed against the 'costs'
of barriers. The report does not discuss this question in any detail.

- 551 -
15
For a good understanding of how Canadians and Americans perceive the
côst/benefit issue, it is nevertheless valuable to identify briefly
these other benefits. This may well have some relevance to the
Community 1 s own assessment of costs and benefits of the 1 remaining 1
fragmentation of its Interna! Market.
o under appropriate conditions, the combination of a high degree of
market integration with some remaining subcentral powers
generates the benefits of 1 competitive federalism 1• The idea is
that citizens and firms can signal dissatisfaction with taxes,
public goods and services and regulation by interstate/provincial
migration. Subcentral governments may also compete with respect
to the nature and intensity of interventions in the goods and
services markets, set ting different objectives or imposing
different costs for given targets. More generally, subcentral
government performance is subject to competitive challenges from
other subcentral governments, and this may prompt policies to be
more responsive. In the Padoa- Schioppa report this idea is
echoed as 1 competition-among-rules 1 • The benefits flowing from
such competition cannot be available when central powers are the
alternative. On the other hand, for the benefits to materialize,
a fairly high degree of market integration must be achieved
(especially for factors of production) for migation to serve as a
disciplining factor. This applies, mutatis mutandis, to product
and services market integration. In other words, in the EC
context, the complet ion of the White Paper is essential bef ore
this benefit could be enjoyed. Note that neither in the US nor in
Canada competition among rules, among tax regimes and public
goods has led to a removal of diversity, or to overall 1 low
standards 1 of whatever activity. For instance, tax competition
accentuates diversity while at the same time finding a minimum
standard in the desired ability everywhere to provide good
infrastructure, certain merit goods and certain public goods.
o decentralization fosters innovation, which may or may not spread
according to its attractiveness. This is a longstanding argument
against coordination or centralization. The argument is used to
rationalize powers which currently carry some costs in terms of
fragmentation. However, it cuts two ways. The mobility of the

- 552 -
16
professions in the US regulated is strie ter than necessary, due
to rapid inters tate imitation of 'innovations', thereby having
made inters tate mobility more costly. On the other hand, where
deregulation is proving successful, a possibly benef~cial
side-product of spreading regional deregulation is improved
market integration (cf. banking in Canada, led by Québec; road
transport deregulation in the US).
o finally, and not surprising for federalist countries, in a number
of policy areas, the mere avoidance of central policies or
regulation is perceived as a benefit, worth some costs of
fragmentation. In Canada this point is related to the peculiar
economie geography of the country (chapter 2 and section .).1),
which causes federal sectoral policies to benefit certain clearly
identifiable provinces at the expense of other equally clearly
identifiable ones. However, in both countries, there are also
political objections which fall outside the scope of this report.
18. The recently signed but still not ratified US-Canadian free trade
agreement is discussed in the last two chapters.
Three questions are addressed. First, was the expectation borne out
that the negotiating parties would move beyond mere free trade to a
kind of common market, possibly the only case comparable to the White
Paper? The answer is clearly no. Although from a GATT perspective,
the agreement is ambitious and may be a helpful exercise for the
Uruguay Round, it falls far short of virtually all the major dossiers
of the White Paper. Trade in services is not tackled, merely the
'right of establishment' combined with 'national treatment'. The
direct investment regime, especially on the Canadian part, is
conditional and has significant exceptions. What exactly will happen
to the mobility of the profession is unclear. Even in product trade
certain restrictions have been 'grandfathered' (i.e. accepted),
notably for beer, and others have been relaxed only conditionally and
incompletely. On subsidies, no agreement was reached but new rules
are nevertheless announced as a basis for 'binding' dispute
settlement; however, all this has to be agreed in the next five to
seven years. In other words, there are reasons to be sceptical about
Congress's willingness to give up its power of countervailing duties

- 553 -
17
bef ore March 3, 1988 (the deadline of the 'fast track' procedure)
without having the slightest idea about the principles and the rules
on subsidies.
19. Second, the North American free trade area (NAFTA) negotiations
called forth the question whether states and provinces would give up
regulatory and subsidy powers for the sake of bilateral economie
intercourse, although these powers are on the whole seen as essential
to federalism. The short answer is that subcentral governments,
especially in Canada, have informally influenced the negotiations in
such a way that competences have hardly or not been undermined.
Possibly, NAFTA may force provinces and states to exercise their
economie powers in a less costly fashion. Thus, it is conceivable
that the cost minimlzation, discussed in para. 16 tinfra), is
facilitated by bilateral or multilateral liberallzation, if only it
is stringent enough. However, it does not imply that the assignment
of economie competences to the two levels ot government in both
federations is called into question.
20. The third reason to study NAFTA is the rich Canadian economie debate
on the impact of the enormous market enlargement it implies for
Canada. The economie methodology as well as the orders of magnitude
found are of obvious interest to the 'cost of non-Europe' project.
Methodological issues are especially important as Canadian economists
have published path-breaking work on NAFTA, using general equilibrium
models with economies of scale and imperfect competition (here: priee
collusion behind protection). This also enables to break out of the
narrow confines of traditional partial-equilibrium estimates (based
on 'welfare triangles'), which are known to yield too low estimates
of welfare effects of trade liberalization, given their assumptions.
21. Chapter 8 discusses in some detail (adapted) partial equilibrium
estimates, general equilibrium model estimates and those from large
macro-econometrie models, including some methodological issues. For
the purpose of this study it is important that these different
approaches produce empirical estimates much larger than the simple
traditional approaches. Nevertheless, the empirical problems are

- 554 -
18
considerable: general equilibrium model estimates vary but go up to a
high of 9% GDP increase, whereas the macro-econometrie estimates
(after 10 years) move between 1.9% and 3.3% GNP increase (as well as
different. employment increases). Amongst a number of empirical
puzzles one has to solve when using these models, the proper
calculation of the 1 height 1 of 1 non-tariff barriers 1 in the product
market - not to spreak of services or factors - and the assumed
reactions on their removal stand out as particularly difficult. All
in all, the work on the economie impact of NAFTA on Canada supports
the methodological direction of the 1 Costs of Non-Europe 1 project
with respect to the goods markets and the empirical results for
Canada lend plausibility to the range of estimates on the EC of 1992.

- 555 -
AIINEXES


- 561 -
Criticism is expected and welcome. Such an enterprise cannot be
immune to imperfection and even perhaps error. However the.
overall outcome of the research, which points to very
significant gains to be derived from European market
integration, seem to be both, accurate and reasonable. It is
highly unlikely that the intellectual input of so many leading
consultants, academies, officials and independent experts would
be unanimously pointing in the wrong direction.

- 562 -
THE RESEARCH ON THE "COST OF NON-EUROPE"
DIRECTOR
Paolo CECCHI.NI
COORDINATOR
Michael LOY
STEERING COMMITTEE
Chairman:
Paolo CECCHINI
External members:
Sergio ALESSANDRINI
Paul CHAMPSAUR
Jean-Michel CHARPIN
Michel DELEAU
Wolfgang GERSTENBERGER
Peter HOLMES
Alexis JACQUEMIN
Jacques PEL:KI4ANS
Carlo SECCHI
Manfred WEG~ER
Special Advisor to the Commission of the European Communities
Commission of the European Communities
Università Bocconi, Milano
Ministère de l'Economie, des Finances et du Budget, Paris
Centre d'Etudes Prospectives et d'Informations Internationales, Paris
European Investment .Bank, Luxembourg
IFO-Institut für Wirtschaftsforschung, München
University of Sussex, Brighton
Université de Louvain-La-Neuve
European Institute of Public Administration, Maastricht
Università Bocconi, Milano
IFO-Institut für Wirtschaftsforschung, München
Commission of the European Communities:
Michel AU JEAN Directorate-General Economie and Fi nan-cial Affairs
Michel AYRAL Directorate-General Interna! Market and Indus trial Affairs
Michel CATINAT Directorate-General Economie and Finan-cial Affairs
Michael EMERSON " Il Il
Philippe GOYBET " Il Il
Michael LOY Directorate-General Interna! Market and Indus trial Affairs
Jean-François MARCHIPONT " Il Il
Former members:
Will i LEIBFRITZ
Geoffrey SHEPHERD
Giovanni RAVASIO
Jacques SOENENS
IFO-Institut für Wirtschaftsforschung, München
University of Sussex, Brighton
Directorate-General Economie and Financ ial Aff airs
Directorate-General Interna! Market and Industrial Affairs

- 563 -
ECONUMIC ANALYSIS TEAM
l\1ichael EMERSON
Michel AUJEAN
Richard CAWLEY Fabienne ILZKOVITZ Marc VANHEUKELEN Marianne KLINGBEIL Morten JUNG-OLSEN
Philippe GOYBET
Michael GREEN Angelo REA TI Brendan CARDIFF Pierre BU IGUES Silvano PRES A
Michel CATINAT 1 ) 2 )
Alexander ITALIANER 2)
Pierre VALETTE 2)
Eric DONNI 2)
Gernot NERB 3)
Christopher SMYTH
COORDINATING TEAM
Michael LOY
Maria BRINDLMAYER Andrea FORTI
3)
Directorate-General Economie and Financial Affairs
tt Il " Il Il Il
Il Il Il
Il Il Il
Il Il Il
Il Il Il
Il Il Il
Il Il Il
Il Il Il
Il Il Il
Il Il Il
Il Il Il
Il Il Il
Il Il Il
Direcorate-General Science, and Development Il .. Il
Directorate-General Economie cial Affairs Il Il Il
Consul tante, Brussels Consultant, Milano
Il
Il
Il
Il
Il
Il
Il
Il
Il
Il
Il
Il
Il
Il
Re se arch
Il
and Finan-
Il
ADMINISTRATIVE COORDINATION:
Ursula NIEBERDING
BOOK
John ROBINSON
1) methodology 2) econometrie modelling
Directorate-General Internai Market and Industrial Affairs
European Research Associates, Brussels
3) industrial ousiness survey

- 564 -
BASIC INFORMATION
The "Cost of NonEurope" in Public Sector Procurement
The "Cost of NonEurope":
Border Related Controls and Administrative Formalities
The "Cost of NonEurope": An illustration in the Road Haulage Sec tor
The Cost of NonEurope: Obstacles to transborder business activity
Technical Barriers in the EC: Illustration in six Industries
'fhe "Cost of NonEurope": Sorne Case Studies on Technical Barriers
The Cost of "NonEurope" in Financial Services
STUDIES AND CONSULTANCIES
CONSULTANT
WS ATKINS MANAGEMENT CONSULTANTS, Epsom/Surrey
ERNST & WHINNEY Management Consultants, London
Il
EUROPEAN RESEARCH ASSOCIATES, Bruxelles/ PROGNOS, Basel
GROUPE MAC, Paris
GEWIPLAN GMBH Gesellschaft für Wirtschaftsforderung und Marktplanung, Frankfurt
PRICE WATERHOUSE, London
SUPERVISION
Philippe GOYBET Pierre BUIGUES Fabienne ILZKOVITZ Robert COLEMAN Reginald SPENCE David WHITE Gerhard LOHAN George W. O'BRIEN
Petee HOLMES
Michel AUJEAN Pierre BUIGUES Merten JUNG-OLSEN Michel AYRAL Jean-Arnold VINOIS Gaspard FRONTINI Dominique PAVARD Christian BOURGIN Raoul PRADO Nikolaus VAULONT Max KRAEMER Pierre FAUCHERAND Geralyn DONALDSON Graham SIMS Paul CHAMPSAUR
Richard CAWLEY lvliche 1 AYRAL Jean-Arnold VINOIS Karl GLEICHMANN
Carlo SECCHI
Marc VANHEUKELEN Thomas GARVEY Ernesto PREVIDI
DG
II.B.3 II. B. 3 II. B. 1 III.F III.A-Co III.F.l III.F.l III.F.l
II.B.l II.B.3 II.B.l III.A.2 III.A.2 III.A.3 VII-PCU VII-PCU XIX.B XXI.B.3 XXI.C.2 XXI.B.l XXI. B.l XXI.C.2
II.B.l III.A.2 III.A.2 XV.B.3
II.B.l III.B III.B.l
Wolfgang GERSTENBERGER
Marc VANHEUKELEN II.B.l Karlheinz ZACHMANN III.B.3 Jean-Charles JANSEN III.B.3 Pablo AYALA FERNANDEZIII.B.3
Wolfgang GERSTENBERGER
Michael GREEN Richard CAWLEY Peter SMITH Olivier RUYSSEN Jean-Pierre DE LAET Peter TROBERG Will. HARRIS-BURLAND Volker HEYD':'
Manfred WEGNER
II. B. 3 II.B.l III.A.4 III.A.4 IV.A.3 XV.A.4 X.V.A.4 XV.A.4

- 565 -
BASIC INFORMATION
The Cost of NonEurope for Business Services
The Benefits of Completing the Interna! Market for Telecommunication - Services and - Equipment in the Community
The Cost of "NonEurope" in the Foodstuff:Sindustry
The EC92 Automobile Sector
The Cost of NonEurope in the Pharmaceutical Industry
Le Coût de la Non-Europe
des produits de construction
The Cost of "NonEurope" in the Textile-Clothing Industry
CONSULTANT
PEAT, MAR\VICK & McLINTOCK, London
INSEAD-Institut Européen d'Administration des Affaires, Fontainebieau
GROUPE MAC, Paris
LUDVIGSEN ASSOCIATES LIMITED, London
EAG-Economists Advisory Group, London
BIPE-Bureau d'Information et de Prévisions Economiques, Neuilly-sur-Seine
IFO - Institut für Wirtschaftsforschung, München 1 PROMETEIA CALCOLO, Bologna
SUPERVISION
Michael GREEN Vict. POU-SERRADELL Peter SNITH Olivier RUYSSEN
Carle SECCHI
Brendan CARDIFF Marianne KLINGBEIL Christian GARRIC Joel LE QUEMENT Alison BIRKETT
Peter HOLMES
Pierre BUIGUES Dorian PRINCE Gwenole COZIGOU
Jacques PELKMANS
Angelo REATI Marianne KLINGBEIL Daniele VERDIANI Roger PEETERS Dorian PRINCE Paul VIGIER
Jean-Michel CHARPIN
Angelo REATI Fernand SAUER
Jacques PELKr'lANS
Silvano PRESA William TULLY Raymond MOURAREAU
Michel DELEAU
Michel AUJEAN Silvano PRESA Daniele VERDIANI Paul RUTSAERT Heinz BERZAU
Sergio ALESSANDRINI
DG
II.B.3 III.A.4 III.A.4 III.A.4
II.B.3 II.B.l XIII.D.l XIII. E. 3 XIII-Exp.
II.B.3 III.B.2 III.B.2
II.B.3 II.B.l III.C III.C.l III.B.2 III.C.l
II.B.3 III.B.6
II.B.3 III.B.5 III.B.5
II.B.l II. B. 3 III.C III.C.2 III.C.2

- 566 -
INDUSTRIAL SURVEY
The Completion of the Internai l'-1arke t:
A survey of European Industry's perception of the likely effects
CONSULTANT SUPERVISION
Banque Nationale de Belgique, Bruxelles
Denmarks Statistik, Kobenhavn
IFO - Institut für Wirtschaftsforschung, München
IEIR - Institute for Economie Research, Athens
Ministerio de Industria y Energia, Madrid
INSEE - Institut National dela Statis~ique et des Etudes Economiques, Paris
CII - Confederation of Irish Industry, and ESRI - EcoP.~mic and Social Research Institute, Dublin
ISCO - Istituto Nazionale per lo studio della congiuntura, Roma
Gernot NERB Christopher SMYTH
IRB - Independent Research Bureau Europe SPRL, Bruxelles/Luxembourg
NIPO - Het Nederlands Instituut voor de Publieke Opinie en het Marketonderzoek BV, Amsterdam
!NE - Instituto Nacional de Estatistica, Lisboa
Confederation of British Industry, London
DG
II-C IL 1 IS

- 567 -
ECONOMIC ANALYSIS
Bibliography on Barriers within the US Internal Market
The Internal Markets of North America - fragmentation and integration in the US and Canada
Commerce Intra-Branche: Performances des firmes et analyse des échanges commerciaux dans· la Communauté europeenne
CONSULTANT
Benedict WELSH, Washington
Jacques PELKMANS, Maastricht
SUPERVISION DG
Marc VANHEUKELEN II.B.l
in cooperation with Marc VANHEUKELEN
C.I.R.E.M. - Club d'Information et de Reflexion sur l'Economie Mondiale, Paris
Michel AUJEAN II.B.l Jean-François MARCHIPONT III.A.3
Sergio ALESSANDRINI

- 568 -
ECONOMIC ANALYSIS A Survey of the Economies of Scale
Economies of Scale and ::::ntra-Community 'J'rade
Competition and Innovation
The Costs of NonEurope: An Assessment based on a Formal Model of Imperfect. Compe.tition·and Economies of Scale
Economies of Scale and European Integration: the Case of Italy
CONSULTANT Cliff PRATTEN, DEPARTMENT OF APPLIED ECONOMICS, University of Cambridge
Joachim SCHWALBACH, International Institute of Management, Berlin
Paul GEROSKI,
SUPERVISION
Michel AUJEAN Fabienne ILZKOVITZ Pierre BUIGUES
Alexis JACQUEMIN
Il
Il
London Business School
Alasdair SMITH./ Anthony VENABLES, University of Sussex
Rot2olfo HELG, Pippo RANCI, ISTITUTO PER LA RICERCA SOCIALE -IRS, Mi lano
Il
Il
Partial Equilibrium Michael DAVENPORT, Calculation of the London
Il
Impact of' Interna! Market Barriers in
in cooper·ation wi th Richard CAWLEY
the European Community
Actualisation partielle de modèles macro-économiques. Préparation de simulations permettant l'évaluation de 1 ' ir11pac t de l'achèvement du marché in té rieur
ESTARTE , Bruxelles
Michel CATINAT Alexander ITALIANER Pierre VALETTE Eric DONNI
DG
II.B.l II.B.l II. B. 3
II.B.l
II-C.Ec. II.C.4 XII.E.S XII.E.S

- 569 -
ECONOMIC ANALYSIS
Utilisation du modèle HERMES Belgique, Royaume-Uni, Italie, France, à l'analyse macroéconomique et sectorielle de l'achèvement du marché intérieur
Conséquences macroéconomiques de l'achèvement
CONSULTANT
ESAP, Bruxelles
CAMBRIDGE ECONOMETRICS, Cambridge
PROMETEIA, Bologna
EURECO, Vanves
du marché intérieur -l'enseignement de~ modèles macroéconomiques
SUPERVISION
Michel CATINAT Alexander ITALIANER Pierre VALETTE Eric DONNI
Michel CATINAT Alexander ITALIANER Eric DONNI
DG
II-C.Ec. II.C.4 XII.E.5 XII.E.5
II-C.Ec. II.C.4 XII.E.5


- 571 -
ANNEX V.2
THE PUBLICATION.PROGRAMME
The European Challenge 1992 The Benefits of a Single Market
Gower Aldershot - Brookfield, USA - Hong Kong - Singapore -Sydney
Danish version: BêRSENS FORLAG K~benhavn
German version: NOMOS VERLAG Baden-Baden
Spanish version: ALIANZA EDITORIAL S.A. Madrid
French version: EDITIONS FLAMMARION Paris
Greek version: GROUPE EXPRESS Ath ina
Italian version: SPERLING & KUPFER Milano
Dutch version: BIRSEN NEDERLAND BV A•sterda•
Portuguese version: EDITORA PERSPECTIVAS E REALIDADES Lisboa
... ..... l

- 572 -
* RESEARCH ON THE ·caST OF NON-EUROPE. *
PUBLICATIONS by the
OFFICE FOR OFFICIAL PUBLICATIONS OF THE EUROPEAN COMHUNITIES
L-2985 Luxembourg
The economies of 1992: an assessment of the potential economie effects of comp~eting the interna~ market of the European Community
EUROPEAN ECONOMY, n° 35, Harch 1988 ISSN 0379.0991
1992: Une Nouve~~e Economie Européenne. Une évaluation des effets économiques potentie~s de l'achèvement du Marché intérieur de la Communauté Européenne
ECONOMIE EUROPEENNE, n° 35, mars 1988 ISSN 0379.0991
EUROPAS ZUKUNFT: BINNENMARKT 1992
EUROPAISCHE WIRTSCHAFT, Nr. ISSN 0379.0991
1992 : UNA NUOVA ECONOMIA EUROPEA
ECONOMIA EUROPEA, no. ISSN 0379.0991
(in lJ rq .. •d. ra ti on)

