physiological, nutritional, and immunological role of dietary β 1-3 glucan and ascorbic acid...
TRANSCRIPT
www.elsevier.com/locate/aqua-online
Aquaculture 224 (2003) 223–243
Physiological, nutritional, and immunological
role of dietary h 1-3 glucan and ascorbic acid
2-monophosphate in Litopenaeus vannamei juveniles
Nelda Lopeza, Gerard Cuzonb, Gabriela Gaxiolac,Gabriel Taboadac, Manuel Valenzuelac, Cristina Pascualc,
Ariadna Sanchezc, Carlos Rosasc,*
aUniversidad Centroamericana, Managua, NicaraguabCentre Oceanologique du Pacifique (COP), IFREMER, BP 700, BP 7004, Taravao, Tahiti, French Polynesia
cGrupo de Biologıa Marina Experimental, Fac. de Ciencias UNAM, Apdo. Post. 69,
Cd. del Carmen, Campeche, Mexico
Received 30 September 2002; received in revised form 27 February 2003; accepted 28 February 2003
Abstract
The present study was designed to determine the effect of dietary h 1-3 glucan (BG) and a
megadose of vitamin C on the nutrition (growth and survival, blood glucose, lactate, acylglycerides,
cholesterol, hemocyanin [Hc], digestive gland glycogen [DGG]) and the immunological system
(blood cells, prophenoloxidase [ProPO]) in Litopenaeus vannamei juveniles. Each treatment was
replicated five times. Nutritional condition and immunological response of shrimp were recorded
after 40 days of feeding with specific diets and during 48 h after a salinity shock (35–0x). A
significantly greater growth rate was observed in shrimp fed with BG or vitamin C diets than in the
control group. Higher blood protein, total blood cells, granular cells, and ProPO activity were
recorded in shrimp fed with vitamin C as compared to the remaining treatments. That means that BG
was degraded in the digestive gland by h-glucanases to produce energy, permitting the use of more
proteins for growth, whereas vitamin C was used to improve animal health, enhancing general
metabolism in shrimp. The salinity stress induced a rapid use of reserves, triacylglycerols (TAGs),
and cholesterol were reduced in blood and probably used as a source of energy or synthesis in the
digestive gland. The increase in digestive gland glycogen 24 h after the salinity shock evidenced the
use of these reserves by shrimp fed with all diets. In general, after the salinity, shock blood cells
increased in shrimp fed with glucans and decreased in shrimp fed with vitamin C, whereas ProPO
decreased in all shrimp after the salinity shock. This could mean that after the salinity, shock shrimp
0044-8486/03/$ - see front matter D 2003 Elsevier Science B.V. All rights reserved.
doi:10.1016/S0044-8486(03)00214-X
* Corresponding author. Tel./fax: +52-938-38-28730.
E-mail address: [email protected] (C. Rosas).
N. Lopez et al. / Aquaculture 224 (2003) 223–243224
fed with glucans could synthesize cells and ProPO, whereas in shrimp fed with vitamin C, blood
cells were just used to respond to the stress. After the salinity shock, an increment in the ProPO/
granular cell ratio was observed in shrimp fed with vitamin C, indicating that these shrimp could
rapidly increase the components of their immune system. In contrast, a continuous reduction in
ProPO/granular cell ratio was observed in shrimp fed with glucans, revealing that with this type of
immunostimulant, shrimp drive their immunological equipment to respond continuously to the
stress. These results could explain why shrimp fed with immunostimulants presents immunological
fatigue in contrast to shrimp fed with additives that improve their nutritional status, like vitamin C.
D 2003 Elsevier Science B.V. All rights reserved.
Keywords: h-glucans; Vitamin C; L. vannamei; Shrimp; Immune response; Growth rate; Physiological response
1. Introduction
World production of farmed shrimp has been increasing during the last 20 years, mainly
as a result of an increase in farming areas and due to higher stocking densities. In the
process, environmental conditions have deteriorated both inside and outside these farms in
many regions, inducing increments in disease incidence and, consequently, affecting
production negatively. The environmental stress caused by farm discharges into estuaries
and bays and the stress induced in ponds by high densities are factors predisposing the
animals to become more receptive to pathogens (Xu et al., 2001). According to Bachere
(2000), the long-term sustainability of the shrimp industry depends on the equilibrium
among (1) environmental quality, (2) prevention of diseases by adequate diagnoses and
epidemiological surveys of the pathogens, and (3) the health status of the shrimp, as well
as selection programs to obtain disease-resistant animals.
To reduce stress, the shrimp industry has been using antibiotics, immunostimulants, and
diverse types of feed additives (carotenoids, kelp powder, Spirulina, vitamin E, C, etc.)
trying to offer an adequate diet to maintain the health of cultured shrimp. Bacteriosis can
be controlled by antibiotic treatment, but the use of antibiotics represents environmental
hazards and spreads antibiotic-resistant genes. Additionally, the viral origin of some
epizootics limits the efficiency of this treatment (Alday-Sanz et al., 1998).
Biological compounds, called immunostimulants, are available as alternative treat-
ments, playing the role of alarm molecules that activate the immune system. h 1-3 glucan
has successfully been used as immunostimulant to enhance resistance of shrimp against
bacterial or viral infections. Itami et al. (1998) reported that dietary administration of the
peptidoglycan (h 1-3 glucan) derived from Bifidobacterium thermophilum increases the
resistance of Marsupenaeus japonicus against vibriosis. Using a different glucan, h 1-3-1-
6 glucan extracted from the yeast cell wall, Sung et al. (1998) demonstrated enhanced
resistance of P. monodon to vibriosis and white spot syndrome virus (WSSV) infection.
Chang et al. (2000) showed that h 1-3 glucan enhances hemocyte phagocytic activity, cell
adhesion, and superoxide anion production when added to P. monodon diets.
Peptidoglycans are cell wall fragments of microorganisms that render animals more
resistant to microbial infections. Shrimp fed with peptidoglycans responds to an immu-
nostimulant in the same manner as to a microbe aggression. Shrimp immune system has a
N. Lopez et al. / Aquaculture 224 (2003) 223–243 225
strong proteinic base. Proteins are involved in recognizing foreign glucans through
lipopolysaccharide binding protein (LPSBP) and h glucan binding protein (BGBP)
(Vargas-Albores and Yepiz-Plascencia, 2000). The clotting protein is involved in engulfing
foreign invading organisms and prevents blood loss upon wounding (Hall et al., 1999;
Montano-Perez et al., 1999). Defense reactions in shrimp are often accompanied by
melanization. ProPO activating system, mediated by hemocytes, is a zymogen of
phenoloxidase (PO) enzyme that catalyzes both o-hydroxylation of monophenols and
oxidation of phenols to quinones leading to the synthesis of melanin (Sritunyalucksana
and Soderhall, 2000). Conversion of ProPO to PO is through a serine protease called
prophenoloxidase (ProPO) activating enzyme (ppA) that is regulated by another protein,
the a-2 macroglobulin, a trypsin inhibitor (Perazzolo and Barracco, 1997). The innate
immune response of shrimp also relies upon the production, in hemocytes, of antimicrobial
peptides called penaeidins that are active against a large range of pathogens essentially
directed against Gram-positive bacteria via a strain-specific inhibition mechanism (Des-
toumieux et al., 2000).
Nutritional status is considered one of the important factors that determines the ability
of animals to withstand infections; hence, nutritional status is considered a good health
indicator of shrimp (Merchie et al., 1998; Bachere, 2000). In previous studies, we
determined some blood metabolites and hemocyanin, together with growth and survival
in Litopenaeus vannamei, L. stylirostris, and L. setiferus to assess the nutritional role of
dietary carbohydrates and proteins (Rosas et al., 2000, 2001a,b, 2002). The results
demonstrated that blood glucose, triacylglycerides, cholesterol, and lactate together with
blood protein, hemocyanin [Hc], and osmotic pressure are good indicators of nutritional
health, the latter understood as a dietary and environmental condition in which shrimp
growth is maximal under experimental conditions.
Vitamin C plays an important role in animal health as an antioxidant by inactivating
damaging free radicals produced through normal cellular activity and diverse stressors
(Halver, 1995). Inadequate dietary levels of vitamin C in juvenile shrimp may result in
black dead syndrome, reduced growth rates, poor feed conversion ratios, decreased
resistance to stress, and reduced capability to heal wounds (Lightner et al., 1979; Magarelli
et al., 1979). According to Catacutan and Lavilla-Pitogo (1994) and Merchie et al. (1998),
vitamin C plays a role as immunostimulant, as evidenced by the ability of P. monodon
postlarvae and juveniles to avoid vaculovirus and to resist disease (Vibrio harveyi) and
saline shock. Teshima (1998) reported that vitamin C was effective in increasing resistance
of F. japonicus to Vibrio spp. Although the optimal supplemental level of vitamin C for L.
vannamei shrimp is around 100 mg kg� 1 diet, a level of 2000 mg kg� 1 has been proposed
to ensure high resistance of shrimp postlarvae to stressful environmental conditions and as
protection against bacterial infection (Kontara et al., 1995; Montoya and Molina, 1995;
Lavens et al., 1999). The mode of action of vitamin C as an immunostimulant is not clear,
although its antioxidant role and in consequence cell protection could be a mechanism to
preserve hemocytes, improving the general immunological system of shrimp.
One of the problems with the application of dietary immunostimulants or vitamin C is
the lack of information about the optimal doses (frequency and quantity) to be included in
diets. Immunostimulatory fatigue was reported after 24 days in P. monodon brooders,
when a diet with 2 g kg� 1 of h 1-3 glucan was administered permanently during 40 days
N. Lopez et al. / Aquaculture 224 (2003) 223–243226
(Itami et al., 1998). In a study with F. japonicus, a positive increase in disease resistance
was reported using 0.2 mg h 1-3 glucan per kg of diet fed with different feeding
schedules: permanently for 95 days, 7 days h 1-3 glucan diet—7 days of control diet, and
2 days h 1-3 glucan diet—5 days of control diet (Rengpipat et al., 1998). In another study,
enhanced immune response was observed in P. monodon fed for 30 days with fresh
Bacillus S11 mixed with a commercial feed at 1:3 wet weight proportion (Rengpipat et al.,
2000).
The present paper was aimed at assessing the effect on nutrition (growth and
survival, blood glucose, lactate, triacylglycerols, cholesterol, hemocyanin, digestive
gland glycogen) and on the immunological system (blood cells, ProPO) of dietary h1-3 glucan and a megadose of vitamin C in L. vannamei juveniles fed in different
feeding schedules: permanently and 7 days experimental diet—7 days control diet. A
diet without h 1-3 glucan supplemented with an optimal vitamin C level was used as
the control diet.
2. Material and methods
2.1. Preparation of diets
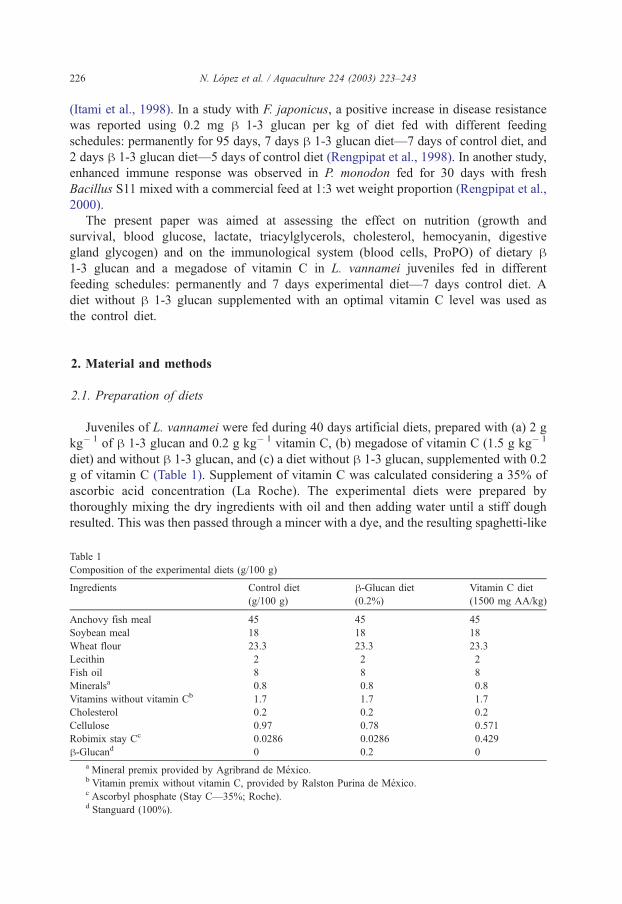
Juveniles of L. vannamei were fed during 40 days artificial diets, prepared with (a) 2 g
kg� 1 of h 1-3 glucan and 0.2 g kg� 1 vitamin C, (b) megadose of vitamin C (1.5 g kg� 1
diet) and without h 1-3 glucan, and (c) a diet without h 1-3 glucan, supplemented with 0.2
g of vitamin C (Table 1). Supplement of vitamin C was calculated considering a 35% of
ascorbic acid concentration (La Roche). The experimental diets were prepared by
thoroughly mixing the dry ingredients with oil and then adding water until a stiff dough
resulted. This was then passed through a mincer with a dye, and the resulting spaghetti-like
Table 1
Composition of the experimental diets (g/100 g)
Ingredients Control diet
(g/100 g)
h-Glucan diet
(0.2%)
Vitamin C diet
(1500 mg AA/kg)
Anchovy fish meal 45 45 45
Soybean meal 18 18 18
Wheat flour 23.3 23.3 23.3
Lecithin 2 2 2
Fish oil 8 8 8
Mineralsa 0.8 0.8 0.8
Vitamins without vitamin Cb 1.7 1.7 1.7
Cholesterol 0.2 0.2 0.2
Cellulose 0.97 0.78 0.571
Robimix stay Cc 0.0286 0.0286 0.429
h-Glucand 0 0.2 0
a Mineral premix provided by Agribrand de Mexico.b Vitamin premix without vitamin C, provided by Ralston Purina de Mexico.c Ascorbyl phosphate (Stay C—35%; Roche).d Stanguard (100%).
N. Lopez et al. / Aquaculture 224 (2003) 223–243 227
strings were air dried at 60 jC. After drying, the material was broken up and sieved to a
convenient pellet size and stored at � 4 jC. Five tanks were randomly assigned to each
diet.
2.2. Growth and survival experiments
A group of 250 shrimp (2.01F 0.02 g wet weight) were used. L. vannamei were
obtained from Pecis Industries S.C., in Yucatan, Mexico. Shrimps were reared for 40 days
in 90-l tanks (10 shrimp/tank) and fed with different types of diet and feeding schedules:
permanently experimental and control diets (treatment 1: h 1-3 glucan diet; treatment 2:
vitamin C diet; treatment 3: control diet), 7 days with h 1-3 glucan diet—7 days control
diet (treatment 4), and 7 days megadose of vitamin C diet—7 days control diet (treatment
5). Each treatment was repeated five times. The photoperiod was 12:12 h, water temper-
ature was 28F 1 jC, dissolved oxygen was >5.0 mg l� 1, salinity was 35 x, and pH was
>8.1. Shrimp were fed ad libitum two times a day (0800 and 2000). Uneaten food particles
and feces were removed regularly.
Growth rate was evaluated as the difference between wet weight at the beginning and the
end of the experiment and calculated as daily growth coefficient (DGC, %) (Bureau et al.,
2000):
DGC ¼ 100½ðfinal weightÞ1=3 � ðinitial weightÞ1=3Þ�=timeðdaysÞ
Survival was calculated as the difference between the number of live animals at the
beginning and the end of the experiment.
After day 40, nine shrimp per treatment were sampled for nutritional (hemolymph,
glucose, lactate, cholesterol, triacylglycerol, proteins, hemocyanin, and digestive gland
glycogen), immunological (ProPO oxidase activity in degranulated hemocytes and blood
cells), and physiological (osmotic pressure) evaluations. These results were considered as
the base line before the salinity challenge.
2.3. Salinity challenge
After day 40, all 40 shrimp per treatment were separated in two groups: one was
maintained in 35x(10 shrimp; one experimental tank per treatment) and the other one
(30 shrimp; three experimental tanks per treatment) was exposed to a rapid change of
salinity, from 35xto fresh water (0x). For this, the seawater volume of every tank was
reduced in 50%, letting fresh water to flow in until 0xsalinity was reached. The change
in salinity took 30 min. A similar procedure was applied to shrimp maintained in 35xbut using only seawater (35x) and were used as a control group. Once 0xsalinity was
obtained, survival, as well as the physiological, nutritional and immunological status of
shrimp, was followed at 4, 24, and 48 h (n= 10 shrimp per experimental time). During this
time, shrimp were fed only once every 24 h with the experimental diets, just after the time
of sampling. Survival was expressed as the cumulative stress index (CSI) (Merchie et al.,
1998) and calculated as the average value of cumulative mortalities obtained from each
replicated diet in relation to the experimental time.
2.4. Physiological, nutritional, and immunological evaluations
2.4.1. Blood constituents
Blood metabolite measurements were made in living fasted (12 h) shrimp. Only shrimp
in stage C were used for physiological, nutritional, and immunological evaluations. Before
sampling, shrimp were placed in prechilled (18 jC) and aerated seawater for 5 min to
reduce the effect of manipulation before hemolymph extraction. Only shrimp in inter-molt
stage (C stage) were used. Hemolymph (approximately 200–300 Al per shrimp) was
individually sampled through a prechilled syringe needle inserted at the base of the fifth
pereiopod after the shrimp had been dried with a paper towel. The individual weight
(F 0.05 g) was recorded and molting stage was observed using uropod characteristics
(Drach and Tchernigovtzeff, 1967).
Osmotic pressure of the hemolymph and water was measured in a micro-osmometer
with 20 Al of sample per titration (3 MO-PLUS; Advanced Instruments, USA). The
osmotic capacity (OC) was defined as the difference between the osmotic pressure of
hemolymph and the external medium (Lignot et al., 1999).
For hemocyanin [Hc] measurements, 10 Al hemolymph were immediately diluted with
990 Al distilled water in a 10-mm cuvette; absorbance was measured at 335 nm.
Hemocyanin concentration was calculated using an extinction coefficient of e = 17.26calculated on the basis of the 74000 Da functional subunit (Chen and Cheng, 1993).
Commercial kits were used for glucose (GH) (GOD-PAD, Merck-740393), lactate
(Sigma-cat. 735), triacylglycerol (TAG; GPO-PAP, Merck, cat. 14354), and cholesterol
(CHOD-PAP, Merck, cat. 14349). Determinations were adapted to a micro-plate using 20
Al of plasma obtained at 8000 g centrifugation and 200 Al of enzyme chromogen reagent.
Absorbance was recorded in a micro-plate reader (BIO-RAD model 550) and concen-
trations were calculated from a standard substrate solution. Plasma was further diluted
1:500 for protein (HP) determination by the Bradford (1976) technique adapted to a micro-
plate method using commercial chromogen reagent (Sigma, cat. 610) and bovine serum
albumin as standard.
Glycogen in digestive gland was extracted in the presence of sulfuric acid and
phenol (Dubois et al., 1965). The digestive gland was first homogenized in trichloro-
acetic acid (TCA, 5%) for 2 min at 3,340 g. After centrifugation (7000� g), the
supernatant was quantified; this procedure was done twice. Supernatant (1 ml) was
pipetted into a tube and mixed with five volumes of 95% ethanol. The tubes were
placed in an oven at 37–40 jC for 3 h. After precipitation, the tubes were centrifuged
at 7000� g for 15 min. The glycogen (pellet) was dissolved by adding 0.5 ml of
boiling water, then 5 ml of concentrated sulfuric acid and phenol (5%) were added and
mixed. The content of the tubes was transferred to a cuvette and read at 490 nm in a
spectrophotometer.
2.5. Immune response
Because the ProPO system can be activated by endotoxins, all glassware was washed
with E-Toxa-Clean@ and all solutions were prepared using pyrogen-free water. Shrimp salt
solution was prepared according to Vargas-Albores et al. (1993): 450 mM NaCl, 10 mM
N. Lopez et al. / Aquaculture 224 (2003) 223–243228
N. Lopez et al. / Aquaculture 224 (2003) 223–243 229
KCl, 10 mM HEPES, pH 7.3, 850 mosMol kg� 1. The anticoagulant solution for
hemolymph extraction was prepared by adding 10 mM of EDTA–Na2 to the shrimp salt
solution. A sodium cacodylate buffer (Cac, 10 mM cacodylate, 10 mM CaCl2, pH 7.0) was
used to determine phenoloxidase activity.
2.5.1. Prophenoloxidase activity
A sample of 50 Al was incubated 3 min at 25 jC with 50 Al of trypsin type IX (0.1
mg ml� 1). Then, 50 Al of L-DOPA (3 mg ml� 1 in Cac buffer) was added and
incubated for 10 min. The absorbance at 490 nm was measured (Hernandez-Lopez et
al., 1996).
2.5.2. Hemocyte counting
A sample of 150 Al of hemolymph was mixed with an Alsever solution (113 mM
glucose, 27.2 mM sodium citrate, 2.8 mM citric acid, 71.9 mM NaCl) and 10%
formaldehyde (v/v). This sample was stored frozen until analysis. Hemocyte counting
was done with a microscope and a Neubauer chamber. Cellular characterization was
done taking into account size, form, and granular content of the cells (Le Moullac et al.,
1997).
2.6. Statistical analysis
ANOVA was applied to results of immunological and nutritional parameters. A
comparison was made first to know the differences between type of diet and type of
feeding after the salinity challenge. A two-way ANOVAwas applied to assess the effect of
the salinity challenge in relation to exposure time on immunological and nutritional
parameters.
3. Results
3.1. Growth rate and survival
The DGC, %, was affected by the type of diet and the type of feeding (Fig. 1; P < 0.05).
A significantly lower DGC, %, was observed in shrimp fed with control diet as compared
to the other treatments (P < 0.05). Survival was not affected by diet or type of feeding. A
mean value of 90% survival was obtained with all treatments.
3.2. Salinity challenge
3.2.1. Physiological, nutritional, and immunological evaluations
Before the saline shock, glucose and lactate blood levels in shrimp fed with control
diet were significantly higher than those observed in shrimp fed with any of the
remaining treatments (P < 0.05; Table 2). Triacylglycerols, cholesterol, and oxyhemo-
cyanin (mean value of 2.34 mmol l� 1) did not show significant changes among
treatments (P>0.05). In contrast, blood protein of shrimp that fed permanently (VCP
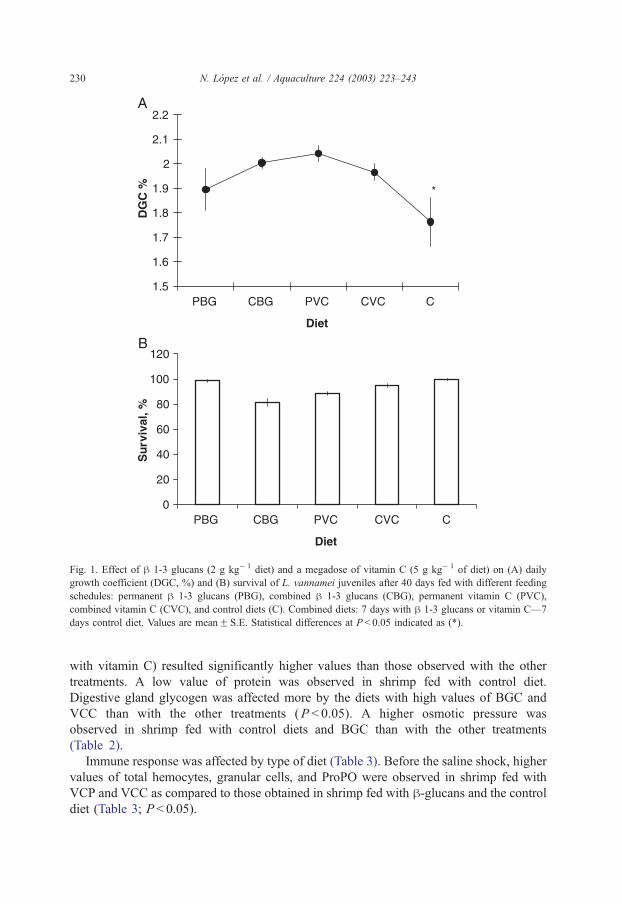
Fig. 1. Effect of h 1-3 glucans (2 g kg� 1 diet) and a megadose of vitamin C (5 g kg� 1 of diet) on (A) daily
growth coefficient (DGC, %) and (B) survival of L. vannamei juveniles after 40 days fed with different feeding
schedules: permanent h 1-3 glucans (PBG), combined h 1-3 glucans (CBG), permanent vitamin C (PVC),
combined vitamin C (CVC), and control diets (C). Combined diets: 7 days with h 1-3 glucans or vitamin C—7
days control diet. Values are meanF S.E. Statistical differences at P < 0.05 indicated as (*).
N. Lopez et al. / Aquaculture 224 (2003) 223–243230
with vitamin C) resulted significantly higher values than those observed with the other
treatments. A low value of protein was observed in shrimp fed with control diet.
Digestive gland glycogen was affected more by the diets with high values of BGC and
VCC than with the other treatments (P < 0.05). A higher osmotic pressure was
observed in shrimp fed with control diets and BGC than with the other treatments
(Table 2).
Immune response was affected by type of diet (Table 3). Before the saline shock, higher
values of total hemocytes, granular cells, and ProPO were observed in shrimp fed with
VCP and VCC as compared to those obtained in shrimp fed with h-glucans and the controldiet (Table 3; P < 0.05).
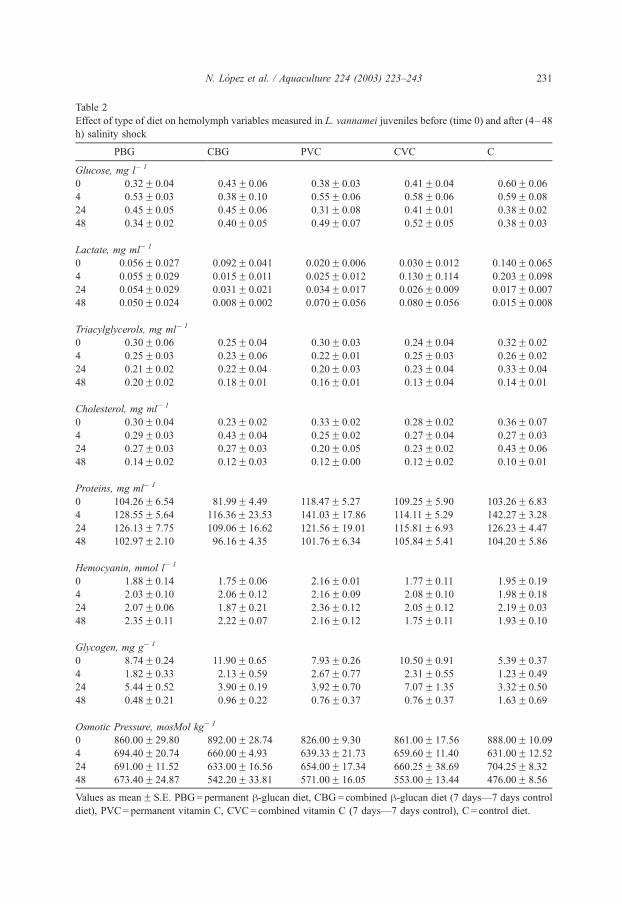
Table 2
Effect of type of diet on hemolymph variables measured in L. vannamei juveniles before (time 0) and after (4–48
h) salinity shock
PBG CBG PVC CVC C
Glucose, mg l� 1
0 0.32F 0.04 0.43F 0.06 0.38F 0.03 0.41F 0.04 0.60F 0.06
4 0.53F 0.03 0.38F 0.10 0.55F 0.06 0.58F 0.06 0.59F 0.08
24 0.45F 0.05 0.45F 0.06 0.31F 0.08 0.41F 0.01 0.38F 0.02
48 0.34F 0.02 0.40F 0.05 0.49F 0.07 0.52F 0.05 0.38F 0.03
Lactate, mg ml� 1
0 0.056F 0.027 0.092F 0.041 0.020F 0.006 0.030F 0.012 0.140F 0.065
4 0.055F 0.029 0.015F 0.011 0.025F 0.012 0.130F 0.114 0.203F 0.098
24 0.054F 0.029 0.031F 0.021 0.034F 0.017 0.026F 0.009 0.017F 0.007
48 0.050F 0.024 0.008F 0.002 0.070F 0.056 0.080F 0.056 0.015F 0.008
Triacylglycerols, mg ml� 1
0 0.30F 0.06 0.25F 0.04 0.30F 0.03 0.24F 0.04 0.32F 0.02
4 0.25F 0.03 0.23F 0.06 0.22F 0.01 0.25F 0.03 0.26F 0.02
24 0.21F 0.02 0.22F 0.04 0.20F 0.03 0.23F 0.04 0.33F 0.04
48 0.20F 0.02 0.18F 0.01 0.16F 0.01 0.13F 0.04 0.14F 0.01
Cholesterol, mg ml� 1
0 0.30F 0.04 0.23F 0.02 0.33F 0.02 0.28F 0.02 0.36F 0.07
4 0.29F 0.03 0.43F 0.04 0.25F 0.02 0.27F 0.04 0.27F 0.03
24 0.27F 0.03 0.27F 0.03 0.20F 0.05 0.23F 0.02 0.43F 0.06
48 0.14F 0.02 0.12F 0.03 0.12F 0.00 0.12F 0.02 0.10F 0.01
Proteins, mg ml� 1
0 104.26F 6.54 81.99F 4.49 118.47F 5.27 109.25F 5.90 103.26F 6.83
4 128.55F 5.64 116.36F 23.53 141.03F 17.86 114.11F 5.29 142.27F 3.28
24 126.13F 7.75 109.06F 16.62 121.56F 19.01 115.81F 6.93 126.23F 4.47
48 102.97F 2.10 96.16F 4.35 101.76F 6.34 105.84F 5.41 104.20F 5.86
Hemocyanin, mmol l� 1
0 1.88F 0.14 1.75F 0.06 2.16F 0.01 1.77F 0.11 1.95F 0.19
4 2.03F 0.10 2.06F 0.12 2.16F 0.09 2.08F 0.10 1.98F 0.18
24 2.07F 0.06 1.87F 0.21 2.36F 0.12 2.05F 0.12 2.19F 0.03
48 2.35F 0.11 2.22F 0.07 2.16F 0.12 1.75F 0.11 1.93F 0.10
Glycogen, mg g� 1
0 8.74F 0.24 11.90F 0.65 7.93F 0.26 10.50F 0.91 5.39F 0.37
4 1.82F 0.33 2.13F 0.59 2.67F 0.77 2.31F 0.55 1.23F 0.49
24 5.44F 0.52 3.90F 0.19 3.92F 0.70 7.07F 1.35 3.32F 0.50
48 0.48F 0.21 0.96F 0.22 0.76F 0.37 0.76F 0.37 1.63F 0.69
Osmotic Pressure, mosMol kg� 1
0 860.00F 29.80 892.00F 28.74 826.00F 9.30 861.00F 17.56 888.00F 10.09
4 694.40F 20.74 660.00F 4.93 639.33F 21.73 659.60F 11.40 631.00F 12.52
24 691.00F 11.52 633.00F 16.56 654.00F 17.34 660.25F 38.69 704.25F 8.32
48 673.40F 24.87 542.20F 33.81 571.00F 16.05 553.00F 13.44 476.00F 8.56
Values as meanF S.E. PBG= permanent h-glucan diet, CBG= combined h-glucan diet (7 days—7 days control
diet), PVC= permanent vitamin C, CVC= combined vitamin C (7 days—7 days control), C = control diet.
N. Lopez et al. / Aquaculture 224 (2003) 223–243 231
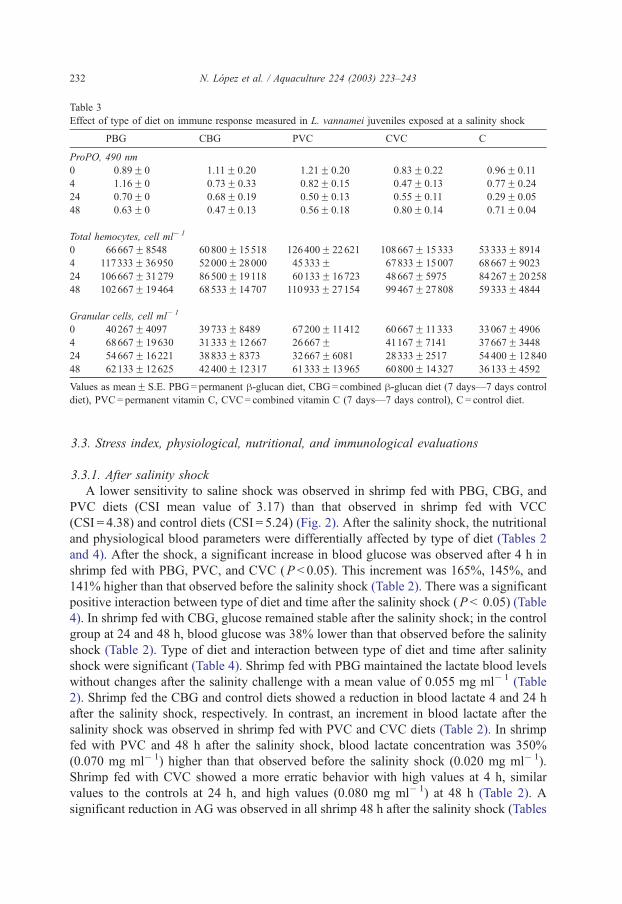
Table 3
Effect of type of diet on immune response measured in L. vannamei juveniles exposed at a salinity shock
PBG CBG PVC CVC C
ProPO, 490 nm
0 0.89F 0 1.11F 0.20 1.21F 0.20 0.83F 0.22 0.96F 0.11
4 1.16F 0 0.73F 0.33 0.82F 0.15 0.47F 0.13 0.77F 0.24
24 0.70F 0 0.68F 0.19 0.50F 0.13 0.55F 0.11 0.29F 0.05
48 0.63F 0 0.47F 0.13 0.56F 0.18 0.80F 0.14 0.71F 0.04
Total hemocytes, cell ml� 1
0 66667F 8548 60800F 15518 126400F 22621 108667F 15333 53333F 8914
4 117333F 36950 52000F 28000 45333F 67833F 15007 68667F 9023
24 106667F 31279 86500F 19118 60133F 16723 48667F 5975 84267F 20258
48 102667F 19464 68533F 14707 110933F 27154 99467F 27808 59333F 4844
Granular cells, cell ml� 1
0 40267F 4097 39733F 8489 67200F 11412 60667F 11333 33067F 4906
4 68667F 19630 31333F 12667 26667F 41167F 7141 37667F 3448
24 54667F 16221 38833F 8373 32667F 6081 28333F 2517 54400F 12840
48 62133F 12625 42400F 12317 61333F 13965 60800F 14327 36133F 4592
Values as meanF S.E. PBG= permanent h-glucan diet, CBG= combined h-glucan diet (7 days—7 days control
diet), PVC= permanent vitamin C, CVC= combined vitamin C (7 days—7 days control), C = control diet.
N. Lopez et al. / Aquaculture 224 (2003) 223–243232
3.3. Stress index, physiological, nutritional, and immunological evaluations
3.3.1. After salinity shock
A lower sensitivity to saline shock was observed in shrimp fed with PBG, CBG, and
PVC diets (CSI mean value of 3.17) than that observed in shrimp fed with VCC
(CSI = 4.38) and control diets (CSI = 5.24) (Fig. 2). After the salinity shock, the nutritional
and physiological blood parameters were differentially affected by type of diet (Tables 2
and 4). After the shock, a significant increase in blood glucose was observed after 4 h in
shrimp fed with PBG, PVC, and CVC (P < 0.05). This increment was 165%, 145%, and
141% higher than that observed before the salinity shock (Table 2). There was a significant
positive interaction between type of diet and time after the salinity shock (P < 0.05) (Table
4). In shrimp fed with CBG, glucose remained stable after the salinity shock; in the control
group at 24 and 48 h, blood glucose was 38% lower than that observed before the salinity
shock (Table 2). Type of diet and interaction between type of diet and time after salinity
shock were significant (Table 4). Shrimp fed with PBG maintained the lactate blood levels
without changes after the salinity challenge with a mean value of 0.055 mg ml� 1 (Table
2). Shrimp fed the CBG and control diets showed a reduction in blood lactate 4 and 24 h
after the salinity shock, respectively. In contrast, an increment in blood lactate after the
salinity shock was observed in shrimp fed with PVC and CVC diets (Table 2). In shrimp
fed with PVC and 48 h after the salinity shock, blood lactate concentration was 350%
(0.070 mg ml� 1) higher than that observed before the salinity shock (0.020 mg ml� 1).
Shrimp fed with CVC showed a more erratic behavior with high values at 4 h, similar
values to the controls at 24 h, and high values (0.080 mg ml� 1) at 48 h (Table 2). A
significant reduction in AG was observed in all shrimp 48 h after the salinity shock (Tables
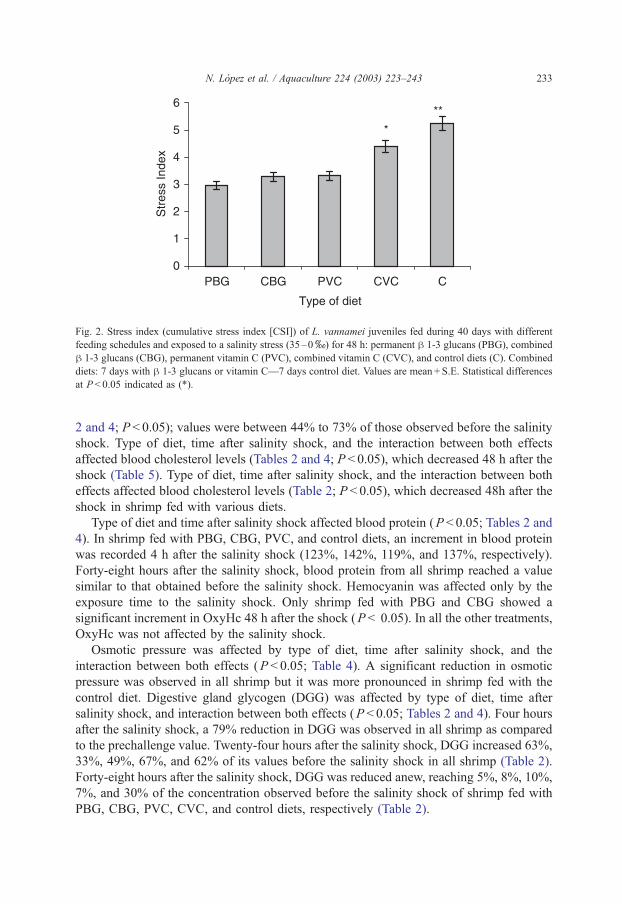
Fig. 2. Stress index (cumulative stress index [CSI]) of L. vannamei juveniles fed during 40 days with different
feeding schedules and exposed to a salinity stress (35–0x) for 48 h: permanent h 1-3 glucans (PBG), combined
h 1-3 glucans (CBG), permanent vitamin C (PVC), combined vitamin C (CVC), and control diets (C). Combined
diets: 7 days with h 1-3 glucans or vitamin C—7 days control diet. Values are mean + S.E. Statistical differences
at P < 0.05 indicated as (*).
N. Lopez et al. / Aquaculture 224 (2003) 223–243 233
2 and 4; P < 0.05); values were between 44% to 73% of those observed before the salinity
shock. Type of diet, time after salinity shock, and the interaction between both effects
affected blood cholesterol levels (Tables 2 and 4; P < 0.05), which decreased 48 h after the
shock (Table 5). Type of diet, time after salinity shock, and the interaction between both
effects affected blood cholesterol levels (Table 2; P < 0.05), which decreased 48h after the
shock in shrimp fed with various diets.
Type of diet and time after salinity shock affected blood protein (P < 0.05; Tables 2 and
4). In shrimp fed with PBG, CBG, PVC, and control diets, an increment in blood protein
was recorded 4 h after the salinity shock (123%, 142%, 119%, and 137%, respectively).
Forty-eight hours after the salinity shock, blood protein from all shrimp reached a value
similar to that obtained before the salinity shock. Hemocyanin was affected only by the
exposure time to the salinity shock. Only shrimp fed with PBG and CBG showed a
significant increment in OxyHc 48 h after the shock (P < 0.05). In all the other treatments,
OxyHc was not affected by the salinity shock.
Osmotic pressure was affected by type of diet, time after salinity shock, and the
interaction between both effects (P < 0.05; Table 4). A significant reduction in osmotic
pressure was observed in all shrimp but it was more pronounced in shrimp fed with the
control diet. Digestive gland glycogen (DGG) was affected by type of diet, time after
salinity shock, and interaction between both effects (P < 0.05; Tables 2 and 4). Four hours
after the salinity shock, a 79% reduction in DGG was observed in all shrimp as compared
to the prechallenge value. Twenty-four hours after the salinity shock, DGG increased 63%,
33%, 49%, 67%, and 62% of its values before the salinity shock in all shrimp (Table 2).
Forty-eight hours after the salinity shock, DGG was reduced anew, reaching 5%, 8%, 10%,
7%, and 30% of the concentration observed before the salinity shock of shrimp fed with
PBG, CBG, PVC, CVC, and control diets, respectively (Table 2).
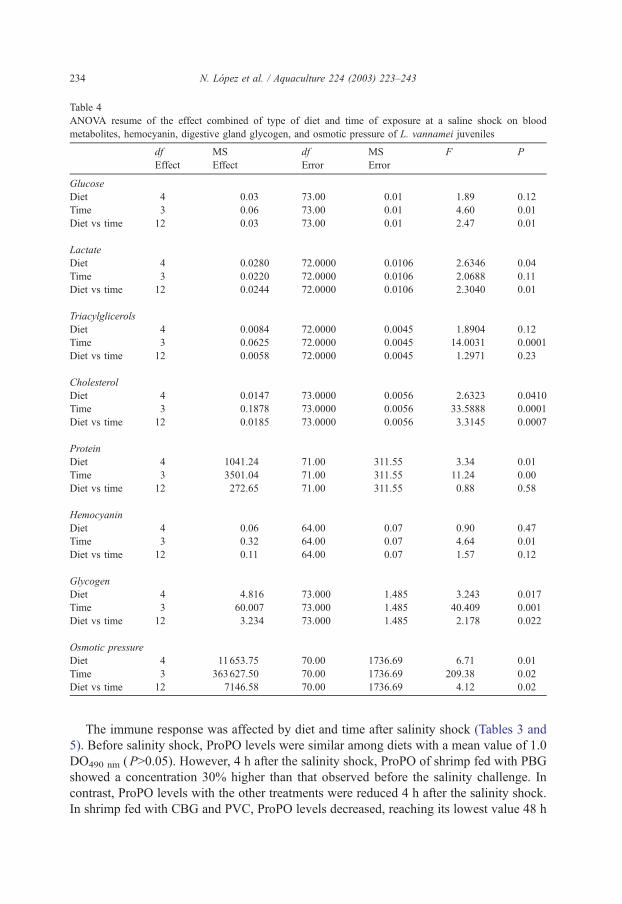
Table 4
ANOVA resume of the effect combined of type of diet and time of exposure at a saline shock on blood
metabolites, hemocyanin, digestive gland glycogen, and osmotic pressure of L. vannamei juveniles
df MS df MS F P
Effect Effect Error Error
Glucose
Diet 4 0.03 73.00 0.01 1.89 0.12
Time 3 0.06 73.00 0.01 4.60 0.01
Diet vs time 12 0.03 73.00 0.01 2.47 0.01
Lactate
Diet 4 0.0280 72.0000 0.0106 2.6346 0.04
Time 3 0.0220 72.0000 0.0106 2.0688 0.11
Diet vs time 12 0.0244 72.0000 0.0106 2.3040 0.01
Triacylglicerols
Diet 4 0.0084 72.0000 0.0045 1.8904 0.12
Time 3 0.0625 72.0000 0.0045 14.0031 0.0001
Diet vs time 12 0.0058 72.0000 0.0045 1.2971 0.23
Cholesterol
Diet 4 0.0147 73.0000 0.0056 2.6323 0.0410
Time 3 0.1878 73.0000 0.0056 33.5888 0.0001
Diet vs time 12 0.0185 73.0000 0.0056 3.3145 0.0007
Protein
Diet 4 1041.24 71.00 311.55 3.34 0.01
Time 3 3501.04 71.00 311.55 11.24 0.00
Diet vs time 12 272.65 71.00 311.55 0.88 0.58
Hemocyanin
Diet 4 0.06 64.00 0.07 0.90 0.47
Time 3 0.32 64.00 0.07 4.64 0.01
Diet vs time 12 0.11 64.00 0.07 1.57 0.12
Glycogen
Diet 4 4.816 73.000 1.485 3.243 0.017
Time 3 60.007 73.000 1.485 40.409 0.001
Diet vs time 12 3.234 73.000 1.485 2.178 0.022
Osmotic pressure
Diet 4 11653.75 70.00 1736.69 6.71 0.01
Time 3 363627.50 70.00 1736.69 209.38 0.02
Diet vs time 12 7146.58 70.00 1736.69 4.12 0.02
N. Lopez et al. / Aquaculture 224 (2003) 223–243234
The immune response was affected by diet and time after salinity shock (Tables 3 and
5). Before salinity shock, ProPO levels were similar among diets with a mean value of 1.0
DO490 nm (P>0.05). However, 4 h after the salinity shock, ProPO of shrimp fed with PBG
showed a concentration 30% higher than that observed before the salinity challenge. In
contrast, ProPO levels with the other treatments were reduced 4 h after the salinity shock.
In shrimp fed with CBG and PVC, ProPO levels decreased, reaching its lowest value 48 h
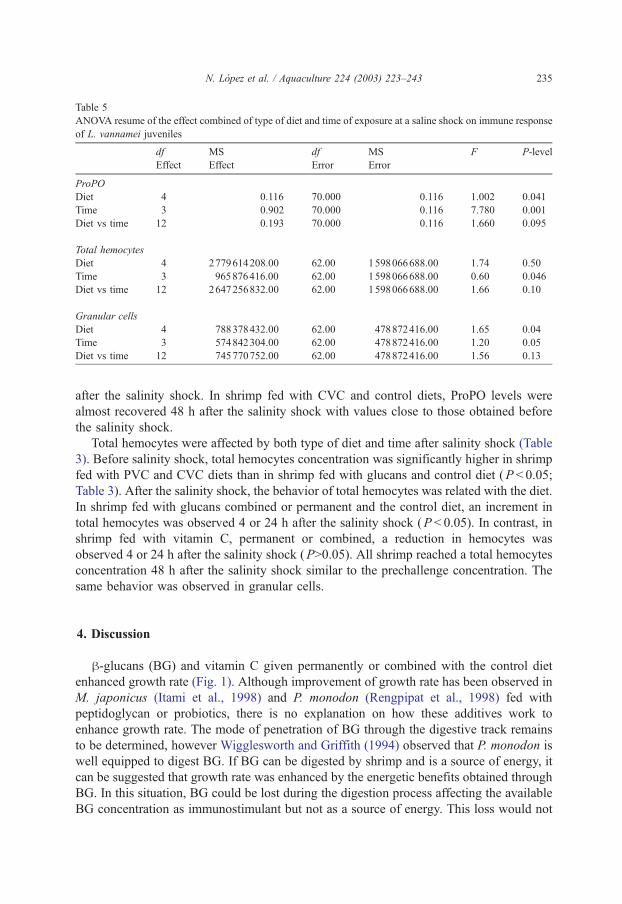
Table 5
ANOVA resume of the effect combined of type of diet and time of exposure at a saline shock on immune response
of L. vannamei juveniles
df MS df MS F P-level
Effect Effect Error Error
ProPO
Diet 4 0.116 70.000 0.116 1.002 0.041
Time 3 0.902 70.000 0.116 7.780 0.001
Diet vs time 12 0.193 70.000 0.116 1.660 0.095
Total hemocytes
Diet 4 2779614208.00 62.00 1598066688.00 1.74 0.50
Time 3 965876416.00 62.00 1598066688.00 0.60 0.046
Diet vs time 12 2647256832.00 62.00 1598066688.00 1.66 0.10
Granular cells
Diet 4 788378432.00 62.00 478872416.00 1.65 0.04
Time 3 574842304.00 62.00 478872416.00 1.20 0.05
Diet vs time 12 745770752.00 62.00 478872416.00 1.56 0.13
N. Lopez et al. / Aquaculture 224 (2003) 223–243 235
after the salinity shock. In shrimp fed with CVC and control diets, ProPO levels were
almost recovered 48 h after the salinity shock with values close to those obtained before
the salinity shock.
Total hemocytes were affected by both type of diet and time after salinity shock (Table
3). Before salinity shock, total hemocytes concentration was significantly higher in shrimp
fed with PVC and CVC diets than in shrimp fed with glucans and control diet (P < 0.05;
Table 3). After the salinity shock, the behavior of total hemocytes was related with the diet.
In shrimp fed with glucans combined or permanent and the control diet, an increment in
total hemocytes was observed 4 or 24 h after the salinity shock (P < 0.05). In contrast, in
shrimp fed with vitamin C, permanent or combined, a reduction in hemocytes was
observed 4 or 24 h after the salinity shock (P>0.05). All shrimp reached a total hemocytes
concentration 48 h after the salinity shock similar to the prechallenge concentration. The
same behavior was observed in granular cells.
4. Discussion
h-glucans (BG) and vitamin C given permanently or combined with the control diet
enhanced growth rate (Fig. 1). Although improvement of growth rate has been observed in
M. japonicus (Itami et al., 1998) and P. monodon (Rengpipat et al., 1998) fed with
peptidoglycan or probiotics, there is no explanation on how these additives work to
enhance growth rate. The mode of penetration of BG through the digestive track remains
to be determined, however Wigglesworth and Griffith (1994) observed that P. monodon is
well equipped to digest BG. If BG can be digested by shrimp and is a source of energy, it
can be suggested that growth rate was enhanced by the energetic benefits obtained through
BG. In this situation, BG could be lost during the digestion process affecting the available
BG concentration as immunostimulant but not as a source of energy. This loss would not
N. Lopez et al. / Aquaculture 224 (2003) 223–243236
be important since the shrimp immune system can react with very small amounts of BG (in
the range of picograms) (Johansson et al., 2000).
An excess of vitamin C either combined with the control diet or given permanently
produced a significant greater growth rate than that observed in shrimp fed with the control
diet. Although vitamin C in excess enhanced the growth rate of several shrimp species,
there are no reports showing an increment in growth rate according to its concentration.
Lavens et al. (1999) reported a significantly increased growth rate and survival for
postlarvae of L. vannamei fed with ascorbic acid (AA), between 100 and 2000 mg AA/kg
diet. Merchie et al. (1998) observed a significant increment in biomass production of P.
monodon postlarvae fed with 1700 or 3400 mg AA/kg diet. In another study, Shiau and
Hsu (1994) reported similar growth rates in P. monodon juveniles fed between 500 and
2000 mg AA/kg diet showing that for postlarvae or juveniles of this species, ascorbate
absorption could be limited in the digestive gland, justifying the growth rate plateau
observed when shrimp are fed with vitamin C in excess of 100 mg kg� 1 diet. Whether
vitamin C in excess is limited or not in the digestive gland, it is clear that growth rate was
enhanced in L. vannamei by the improved physiological conditions of the shrimp fed with
these diets through the role of vitamin C in ‘‘reducing stress’’ (Itami et al., 1998).
Triacylglycerols and cholesterol were not modified by the type of diet revealing that the
differences in growth rate were not associated with either type of nutrients. In contrast,
blood glucose presented an inverse relation with growth rate, i.e., low values of blood
glucose in shrimp fed with BG and vitamin C and high values in shrimp fed with the
control diet. Inversely, the digestive gland glycogen and blood protein were higher in
shrimp fed with BG and vitamin C than in shrimp fed with the control diet. According to
these results, two different metabolic routes could be involved in the effect of dietary
immunostimulants or vitamin C on glycogen synthesis and protein metabolism. The first
one could be related to BG degradation in the digestive gland by h-glucanases (Wiggles-
worth and Griffith, 1994) to produce energy and of glucose to glycogen through the UDP-
glucose pathway (Rosas et al., 2002). In this situation, the high amount of dietary protein
could be absorbed through the digestive gland passing to the blood without having been
used as a source of energy. The second one could be related to the role of vitamin C in
biological functions. According to Shigueno and Itoh (1988), vitamin C improves the
general physiological status of shrimp through its role in animal health as antioxidant by
inactivating damaging free radicals produced through normal cellular activity and as a
cofactor in carnitine synthesis. Taking into account that carnitine, synthesized from lysine
and methionine, is involved in the effective utilization of stored lipid for energy
(Masumoto et al., 1991; Catacutan and Lavilla-Pitogo, 1994), it can be suggested that
the increment in glycogen observed in shrimp fed with vitamin C in excess is related with
the improvement of the general metabolism of shrimp, including glycogen synthesis
(favored by carnitine synthesis and lipid metabolism) (Abdel-Rahman et al., 1979) and
protein metabolism (Reddy et al., 1999).
Vitamin C and BG have been demonstrated to have immunostimulant properties in
shrimp (Itami et al., 1998; Merchie et al., 1998). The main problem is that the minimum
effective dose of both additives to enhance the immune system remains to be determined.
In the present study, we used a dose of 2 g kg� 1 (0.2%) of BG and 2000 mg kg� 1 of
vitamin C as recommended to enhance the immune response in L. vannamei shrimp
N. Lopez et al. / Aquaculture 224 (2003) 223–243 237
(Kontara et al., 1995; Rodriguez et al., 2000). Before the saline challenge and using 2g
kg� 1 diet of BG, total hemocytes and granular cells were not different from shrimp fed
with the control diet, with BG, or 7 days combined with the control diet (Table 3). In
contrast, a significantly higher concentration of total cells and granular cells was observed
in shrimp fed with vitamin C permanently and combined with the control diet. ProPO
activity was higher in shrimp fed with vitamin C combined with 7 days of control diet,
indicating that both hemocytes and ProPO content in shrimp that fed these diets were
positively improved.
According to Bachere (2000), the immune response needs to be analyzed under stress
conditions in cultured shrimp. In this sense, we used a salinity shock as stressor as has
been described before for both P. monodon (Merchie et al., 1998) and L. vannamei
(Kontara et al., 1995) fed excess vitamin C. An increased resistance to the salinity shock
was observed in relation with the use of BG or vitamin C. Although there are no reports of
enhanced stress resistance in shrimp fed with BG, this type of response has been observed
in shrimp fed with vitamin C in excess and astaxanthin (Merchie et al., 1998). Blood
lactate has been used as an index of stress in L. vannamei when values exceed 0.5 mg
ml� 1 (Racotta and Palacios, 1998). Taking into account that in the present work we
observed values lower than in stressed shrimp, it can be expected that the observed lactate
concentration has a metabolic role during the stress, probably through the gluconeogenic
pathway (Vinagre and Da Silva, 1992).
Several physiological and immunological functions are activated during a saline shock.
In low salinity, shrimp need to use protein as a source of amino acids to maintain osmotic
pressure (Claybrook, 1983). During salinity acclimation, a very rapid change in free
amino acid content occurs (Gerard and Gilles, 1972) suggesting that the regulation of cell
volume after a hypo-osmotic change is a rapid process. Although in L. vannamei, the final
free amino acid pool (FAA) level is reached 24 h after a hypo-osmotic shock from 37.5xto 28xsalinity (Richard, 1974), in the present study, there was a decrease in blood
osmotic pressure in all shrimp fed with all diets, indicating that with the applied saline
shock, extracellular regulation is not powerful enough to ensure homo-osmoticity, and the
tissue will, in consequence, undergo osmotic stress. According to Rosas et al. (2001a),
protein metabolism is basic to ensure FAAs allowing shrimp to compensate its homo-
osmoticity; for this reason, shrimp are more dietary protein-dependent in diluted environ-
ments. Recently, Shiau (1998) showed that protein requirements of P. monodon reared at
16xsalinity was higher (44%) than that observed in shrimp maintained in 40xsalinity
(40%).
Protein in hemolymph was elevated 4 h after the salinity shock, returning to initial
values 48 h after in all shrimp, evidencing that dietary protein level was adequate to ensure
a rapid response to the saline shock. Marangos et al. (1989) and Dall (1975) have
suggested that high hemolymph protein concentration indicates that hemolymph, through
hemocyanin, is able to store proteins after salinity acclimation. After a salinity change, the
loss of FAAs from muscle results from their excretion into the blood. This must impose an
additional osmotic load on the blood, which would increase water inflow from an external
medium. Transfer of FAAs to the gastric fluids of the digestive gland (Dall, 1975;
Marangos et al., 1989) or the synthesis of hemocyanin (Van Holde et al., 2001) provides
means of minimizing this additional load. The digestive gland is thought to be an
N. Lopez et al. / Aquaculture 224 (2003) 223–243238
important synthesizing organ of hemocyanin, and products of this synthesis might cause
an increase in hemolymph protein content when the FAAs are transferred from blood
(Rosas et al., 2002). In the present study, an increment in hemocyanin concentration was
observed 48 h after the salinity shock in shrimp fed with BGP or BGC. Although we do
not know why hemocyanin is enhanced in shrimp fed with BGP or BGC and not in PVC-
or CVC-fed shrimp, we propose that this response is related with the stimulating role of
glucans on the immune system of shrimp. According to Johansson et al. (2000), shrimp
hemocytes are synthesized in the hematopoietic tissue located in the paired epigastric
nodules just over the digestive gland where hemocyanin is synthesized (Gellisen et al.,
1991). If glucans enhance the synthesis of hemocytes (Itami et al., 1998; Rengpipat et al.,
2000), it is possible to think that glucans could stimulate at the same time the sites of
protein synthesis, such as the digestive gland where hemocyanin is synthesized. Consid-
ering that hemocyanin’s antifungal (Destoumieux et al., 2001) and ProPO activity (Adachi
et al., 2003) was demonstrated recently, it can be inferred that during the saline stress
shrimp, fed glucans stimulated all the immunological equipment, including protein,
hemocyanin, and hemocytes synthesis. It is interesting to note that vitamin C is apparently
not involved in this process because shrimp fed with vitamin C in excess had similar
variations in blood protein and hemocyanin than those observed in shrimp fed with control
diet.
During salinity stress, a rapid use of reserves was observed; triacylglycerols and
cholesterol were reduced in blood and were probably used as a source of energy or
synthesis in the digestive gland. An increment in digestive gland glycogen 24 h after the
salinity shock could evidence the use of these reserves by all shrimp independently from
the diets.
Circulating hemocytes are essential for immunity because of their role in phagocytosis,
encapsulation, and lysis of foreign cells (Johansson et al., 2000). Recent results have
demonstrated that in stressed shrimp, hemocytes are produced continuously reaching their
maximum level of immunological role every 2–3 days indicating that they are released
continuously (Pascual et al., in press). Depending on the diet, total hemocytes, granular
cells, and ProPO responded differently after the salinity shock. In general, after the salinity
shock, an increment in blood cells was observed in shrimp fed with glucans, whereas their
decrease was observed in shrimp fed with vitamin C. Besides, a reduction in ProPO was
observed in all shrimp after the salinity shock. Only shrimp fed with CVC recovered their
ProPO levels after 48 h of the salinity shock, meaning that after the salinity shock, shrimp
fed with glucans could synthesize cells and ProPO, whereas blood cells were used by those
fed with vitamin C. After the salinity shock, shrimp fed with control diet synthesized cells
but not ProPO, indicating that a well-nourished shrimp can respond adequately to the
salinity stress. The difference between immunostimulated (glucans) and control shrimp
was that shrimp fed with glucans responded faster than shrimp fed with the control diet.
Different responses were observed between shrimp fed with glucans or vitamin C,
evidencing that these dietary additives work differently. According to Sritunyalucksana
and Soderhall (2000), ProPO is synthesized in hemocytes whereas hemocytes are
synthesized in the hematopoietic tissue; hence, both processes develop at different times.
Using a relation between ProPO and granular cells, it is possible to know how both
additives used in the present study are related with both components of the immune system
N. Lopez et al. / Aquaculture 224 (2003) 223–243 239
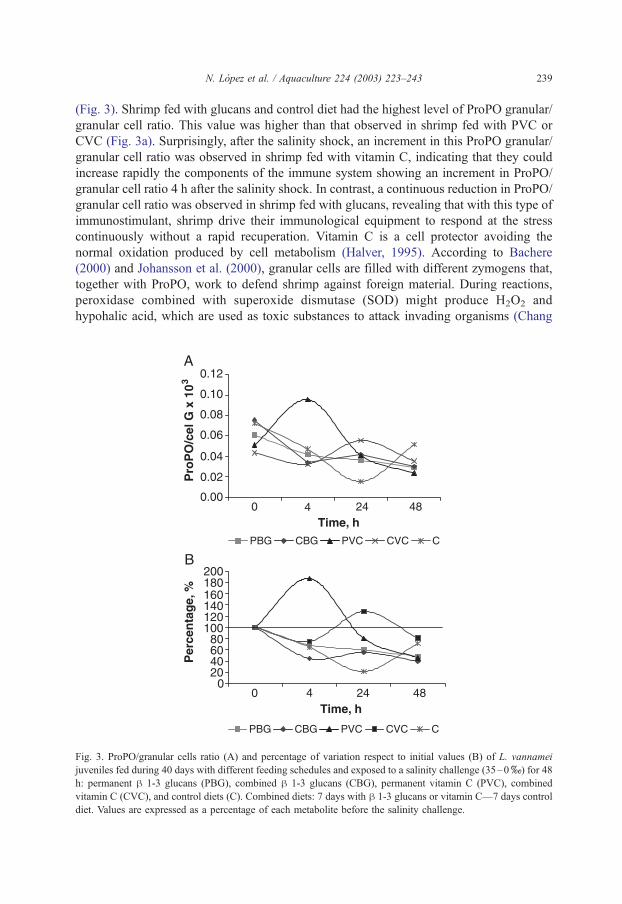
(Fig. 3). Shrimp fed with glucans and control diet had the highest level of ProPO granular/
granular cell ratio. This value was higher than that observed in shrimp fed with PVC or
CVC (Fig. 3a). Surprisingly, after the salinity shock, an increment in this ProPO granular/
granular cell ratio was observed in shrimp fed with vitamin C, indicating that they could
increase rapidly the components of the immune system showing an increment in ProPO/
granular cell ratio 4 h after the salinity shock. In contrast, a continuous reduction in ProPO/
granular cell ratio was observed in shrimp fed with glucans, revealing that with this type of
immunostimulant, shrimp drive their immunological equipment to respond at the stress
continuously without a rapid recuperation. Vitamin C is a cell protector avoiding the
normal oxidation produced by cell metabolism (Halver, 1995). According to Bachere
(2000) and Johansson et al. (2000), granular cells are filled with different zymogens that,
together with ProPO, work to defend shrimp against foreign material. During reactions,
peroxidase combined with superoxide dismutase (SOD) might produce H2O2 and
hypohalic acid, which are used as toxic substances to attack invading organisms (Chang
Fig. 3. ProPO/granular cells ratio (A) and percentage of variation respect to initial values (B) of L. vannamei
juveniles fed during 40 days with different feeding schedules and exposed to a salinity challenge (35–0x) for 48
h: permanent h 1-3 glucans (PBG), combined h 1-3 glucans (CBG), permanent vitamin C (PVC), combined
vitamin C (CVC), and control diets (C). Combined diets: 7 days with h 1-3 glucans or vitamin C—7 days control
diet. Values are expressed as a percentage of each metabolite before the salinity challenge.
N. Lopez et al. / Aquaculture 224 (2003) 223–243240
et al., 2000). At the same time, O2� is released during respiratory burst that can be
enhanced 15.7 times when shrimp are fed with glucans (Chang et al., 2000). If shrimp are
immunostimulated by glucans, all these substances could be delivered all the time,
maintaining the shrimp in a constant immunological alert but at the same time inducing
toxicity in its cells. At the end, when shrimp fed with glucans are exposed to stress, they
are able to respond, but many studies have demonstrated that this response occurs only
once; afterwards, immunostimulants are no longer efficient, indicating immunologic
fatigue (Le Moullac et al., 1998; Chang et al., 2000). On the contrary, if the shrimp diet
is optimal and includes a megadose of vitamin C, shrimp will be prepared for the stress
because all the system is working adequately, and at the same time, is protected by the
joint action of vitamin C and good nutrition.
Oral administration of BG can enhance the production of cell activating factors in the
hemocytes thus increasing ProPO activity (as shown in this study) and phagocytosis (Itami
et al., 1998). At present, evidences exist that demonstrate that shrimp fed with BG can
respond only once to the stress because immunostimulation produces immunological
fatigue. The capacity of shrimp to respond to successive stress when fed vitamin C will be
proven when well-nourished shrimp respond better than immunostimulated shrimp.
Acknowledgements
This project was partially supported by Direccion General de Atencion al Personal
Academico—UNAM (IN206199), and CONACYT (31137-B). We thank Ingrid Mascher
for editing the English text. Thanks also to Secretarıa de Relaciones Exteriores, Mexico for
the fellowship provided to Nelda Lopez.
References
Abdel-Rahman, S.H., Kanazawa, A., Teshima, S., 1979. Effects of dietary carbohydrate on the growth and the
level of the hepatopancreatic glycogen and serum glucose of prawn. Bull. Jpn. Soc. Sci. Fish 45, 1491–1494.
Adachi, K., Hirata, T., Nishioka, T., Sakaguchi, M., 2003. Hemocyte components in crustaceans convert hemo-
cyanin into a phenoloxidase-like enzyme. Comp. Biochem. Physiol. 134B, 135–141.
Alday-Sanz, V., Thaikua, S., Yousif, A.N., Albright, L.J., Flegel, T.W., 1998. Studies on IgY for passive
immunization of shrimp against white spot syndrome virus. In: Flegel, T.W. (Ed.), Advances in Shrimp
Biotechnology. Center for Genetic Engineering and Biotechnology, Bangkok, pp. 141–143.
Bachere, E., 2000. Shrimp immunity and disease control. Aquaculture 191, 3–11.
Bradford, M.M., 1976. A refined and sensitive method for the quantitation of microgram quantities of protein
utilizing the principle of protein-dye binding. Anal. Biochem. 72, 248.
Bureau, D.P., Azevedo, P.A., Tapia-Salazar,M., Cuzon, G., 2000. Pattern and cost of growth and nutrient deposition
in fish and shrimp: potential implications and applications. In: Cruz-Suarez, E., Ricque-Marie, D., Tapia-
Salazar, M., Civera-Cerecedo, R. (Eds.), Memorias del V Simposium Internacional de Nutricion Acuıcola.
Avances de Nutricion Acuıcola, vol. V. CINVESTAV-Merida, Merida, Yucatan, Mexico, pp. 25–49.
Catacutan, M.R., Lavilla-Pitogo, C.R., 1994. L-ascorbyl-2-monophosphate Mg as a source of vitamin C for
juvenile Penaeus monodon. Isr. J. Aquac.-Bamidgeh 46, 40–47.
Chang, C.F., Chen, H.Y., Su, M.S., Liao, I.-C., 2000. Immunomodulation by dietary a 1-3 glucan in the brooders
of the black tiger shrimp Penaeus monodon. Fish Shellfish Immunol. 10, 505–514.
Chen, J.C., Cheng, S.-Y., 1993. Hemolymph PCO2, hemocyanin, protein level and urea excretions of Penaeus
monodon exposed to ambient ammonia. Aquat. Toxicol. 27, 281–292.
N. Lopez et al. / Aquaculture 224 (2003) 223–243 241
Claybrook, D.L., 1983. Nitrogen metabolism. In: Mantel, L.H. (Ed.), The Biology of Crustacea, Internal Anat-
omy and Physiological Regulation, vol. 5. Academic Press, New York, pp. 163–213.
Dall, W., 1975. The role of ninhydrin-positive substances in osmoregulation in the western rock lobster Panulirus
longipes (Milne Edwards). J. Exp. Mar. Biol. Ecol. 19, 43–58.
Destoumieux, D., Monoz, M., Bulet, P., Bachere, E., 2000. Peneidins, a family of anitimicrobial peptides from
penaeid shrimp (Crustace, Decapoda). Cell. Mol. Life Sci. 57, 1260–1271.
Destoumieux, D., Saulnier, D., Garnier, J., Jouffrey, C., Bulet, P., Bachere, E., 2001. Antifungal peptides are
generated from the C terminus of shrimp hemocyanin in response to microbial challenge. J. Biol. Chem. 276,
47070–47077.
Drach, P., Tchernigovtzeff, C., 1967. Sur le method de detrmination des stades d’intermue et son application
generale aux crustaces. Biol. Mar. 8, 595–610.
Dubois, M.K., Lilles, L.A., Hamilton, J.C., Rebers, P.A., Smith, F., 1965. Cholorimetric method for determi-
nation of sugars and related substances. Anal. Chem. 28, 350–356.
Gellisen, G., Hennecke, R., Spindler, K.D., 1991. The site of synthesis of hemocyanin in the crayfish Astacus
leptodactilus. Experientia 47, 194–195.
Gerard, J.F., Gilles, R., 1972. The free amino-acid pool in Callinectes sapidus (Rathbun) tissues and its role in the
osmotic intracelular regulation. J. Exp. Mar. Biol. Ecol. 10, 125–136.
Hall, M., Wang, R., Van Antwerpen, R., Sottrup-Jensen, L., Soderhall, K., 1999. The crayfish plasma clotting
protein: a vitellogenin-related protein responsible for clot formation in crustacean blood. Proc. Natl. Acad.
Sci. U. S. A. 96, 1965–1970.
Halver, J.E., 1995. Vitamin requirement study techniques. J. Appl. Ichthyol. 11, 215–224.
Hernandez-Lopez, J., Gollas-Galvan, T., Vargas-Albores, F., 1996. Activation of the prophenoloxidase system of
brown shrimp (Penaues californiensis Holmes). Comp. Biochem. Physiol. 113C, 61–66.
Itami, T., Asano, M., Tokushige, K., Jubono, K., Nakagawa, A., Takeno, N., Nishimura, H., Maeda, M.,
Kondo, M., Takahashi, Y., 1998. Enhacement of disease resistance of karuma shrimp, Penaeus japonicus,
after oral administration of peptidoglycan derived from Bifidobacterium thermophilum. Aquaculture 164,
277–288.
Johansson, M.W., Keyser, P., Sritunyalucksana, K., Soderhall, K., 2000. Crustacean hemocytes and haematopoi-
esis. Aquaculture 191, 45–52.
Kontara, E.K.M., Merchie, G., Lavens, P., Nelis, H., Leenheer, A., Sorgeloos, P., 1995. Improved larviculture
outputs of postlarval shrimp Penaeus vannamei through supplementation of L-ascorbyl-2-polyphosphate in
the diet. Eur. Aquac. Soc. Spec. Publ. 24, 230–233.
Lavens, P., Merchie, G., Ramos, X., Leon-Hing, A., Van Hauwaert, A., Pedrazzoli, A., Nelis, H., Leenheer, A.,
1999. Supplementation of ascorbic acid 2-monophosphate during the early postlarval stage of the shrimp
Penaeus vannamei. Aquac. Nutr. 5, 205–209.
Le Moullac, G., Le Groumellec, M.L., Ansquer, D., Froissard, S., Levy, P., Aquacop., 1997. Heamatological and
phenoloxidase activity changes in the shrimp Penaeus stylirostris in relation with the moult cycle: protection
against vibriosis. Fish Shellfish Immunol. 7, 227–234.
Le Moullac, G., de Labori, L.P., Saulnier, D., Goarant, C., Dehasque, M., 1998. Principles and problems involved
in the evaluation of immunostimulants on juvenile shrimpSimposio Internacional de Nutricion Acuıcola,
November 15–18, La Paz, BCS, Mexico, vol. IV. Centro de Investigaciones Biologicas del Noreste, Mexico,
pp. 1–10.
Lightner, D.V., Hunter, B., Magarelli, P.C., 1979. Ascorbic acid: nutritional requirement and role in wound repair
in penaeid shrimp. Proc. World Maric. Soc. 10, 513–528.
Lignot, J.H., Cochard, J.C., Soyez, C., Lemaire, P., Charmantier, G., 1999. Osmoregulatory capacity according to
nutritional status, molt stage and body weight in Penaeus stylirostris. Aquaculture 170, 79–92.
Magarelli, P.C., Hunter, B., Lightner, D.V., 1979. Black death: an ascorbic acid deficiency disease in penaeid
shrimp. Comp. Biochem. Physiol. 63A, 103–108.
Marangos, C., Brogren, C.H., Alliot, E., Ceccaldi, H.J., 1989. The influence of water salinity on the free amino acid
concentration in muscle and hepatopancreas of adult shrimps, Penaeus japonicus. Biochem. Syst. Ecol. 17,
589–594.
Masumoto, T., Hosokawa, H., Shimeno, S., 1991. Ascorbic acid’s role in aquaculture nutrition. Proc. Aquac.
Feed Process. 1, 42–48.
N. Lopez et al. / Aquaculture 224 (2003) 223–243242
Merchie, G., Kontara, E.K.M., Lavens, P., Robles, R., Kurmaly, K., Sogeloos, P., 1998. Effect of vitamin C and
astaxanthin on stress and disease resistance of postlarval tiger shrimp Penaeus monodon (Fabricius). Aquac.
Res. 29, 579–585.
Montano-Perez, K., Yepiz-Plascencia, G., Higuera-Ciapara, I., Vargas-Albores, F., 1999. Purification and char-
acterization of the clotting protein from the white shrimp Penaeus vannamei. Comp. Biochem. Physiol. 122,
381–387.
Montoya, N., Molina, C., 1995. Optimum supplemental level of L-ascorbyl-2-phosphate-Mg to diet for white
shrimp Penaeus vannamei. Fish. Sci. 61, 1045–1046.
Pascual, C., Gaxiola, G., Rosas, C., 2003. Blood metabolites and hemocyanin of the white shrimp Litopenaeus
vannamei: the effect of culture conditions and a comparison with other crustacean species. Mar. Biol. (in press).
Perazzolo, L.M., Barracco, M.A., 1997. The prophenoloxidase activating system of the shrimp Penaeus paulensis
and associated factors. Dev. Comp. Immunol. 21, 385–395.
Racotta, I.S., Palacios, E., 1998. Hemolymph metabolic variables in response to experimental manipulation stress
and serotonin injection in Peneues vannamei. J. World Aquac. Soc. 29, 351–356.
Reddy, S.J., Ganapathi, N., Annappaswamy, T.S., 1999. Evaluation of the dietary essentiality of vitamins for
Penaeus monodon. Aquac. Res. 5, 267–275.
Rengpipat, S., Phianphak, W., Piyatiratitivorakul, S., Manasveta, P., 1998. Effects of a probiotic bacterium on
black tiger shrimp Penaeus monodon survival and growth. Aquaculture 167, 301–313.
Rengpipat, S., Rukpratanporn, S., Piyatiratitivorakul, S., Menasaveta, P., 2000. Immunity enhancement in black
tiger shrimp (Penaeus monodon) by a probiont bacterium (Bacillus S11). Aquaculture 191, 271–288.
Richard, P., 1974. Contribution a letude du developpement larvaire et de l’ organogeneses chez Palaemon
serratus et du metabolisme de acides animes libres chez sette espece et chez Penaeus keraturus. These Doct.
Oceanologie, Universite Aix-Marseille II, 1–139.
Rodriguez, J., Cedeno, R., Molina, C., Otero, V., Valenzuela, V., Sotomayor, M.A., 2000. Efecto de la calidad de
la dieta sobre la respuesta inmune del camaron blanco Litopenaeus vannamei. In: Cruz-Suarez, L.E., Ricque-
Marie, D., Tapia-Salazar, M., Olvera-Novoa, M., Civera, R. (Eds.), Avances en Nutricion Acuıcola V, Merida
Yucatan, Mexico. Centro de Investigaciones y Estudios Avanzados-IPN, Mexico, pp. 57–71.
Rosas, C., Cuzon, G., Arena, L., Arena, L., Lemaire, P., Soyez, C., Van Wormhoudt, A., 2000. Influence of dietary
carbohydrate on the metabolism of juvenile Litopenaeus stylirostris. J. Exp. Mar. Biol. Ecol. 249, 181–198.
Rosas, C., Cuzon, G., Gaxiola, G., LePriol, Y., Pascual, C., Rossignyol, J., Contreras, F., Sanchez, A., Van
Wormhoudt, A., 2001a. Metabolism and growth of juveniles of Litopenaeus vannamei: effect of salinity and
dietary carbohydrate levels. J. Exp. Mar. Biol. Ecol. 259, 1–22.
Rosas, C., Cuzon, G., Taboada, G., Pascual, C., Gaxiola, G., Van Wormhoudt, A., 2001b. Effect of dietary protein
and energy levels (P/E) on growth, oxygen consumption, hemolymph and digestive gland carbohydrates,
nitrogen excretion and osmotic pressure of Litopenaeus vannamei and L. setiferus juveniles (Crustacea,
Decapoda; Penaeidae). Aquac. Res. 32, 1–20.
Rosas, C., Cuzon, G., Gaxiola, G., Pascual, C., Taboada, G., Arena, L., VanWormhoudt, A., 2002. An energetic
and conceptual model of the physiological role of dietary carbohydrates and salinity on Litopenaeus vannamei
juveniles. J. Exp. Mar. Biol. Ecol. 268, 47–67.
Shiau, S.-Y., 1998. Nutrient requirements of penaeid shrimp. Aquaculture 164, 77–93.
Shiau, S.-Y., Hsu, T.S., 1994. Vitamin C requirement of grass shrimp, Penaeus monodon as determined with L-
ascorbyl-2-monophosphate. Aquaculture 122, 347–357.
Shigueno, K., Itoh, S., 1988. Use of Mg-L-ascorbyl-2phosphate as a vitamin C source in shrimp diets. J. World
Aquac. Soc. 19, 168–174.
Sritunyalucksana, K., Soderhall, K., 2000. The proPO and clotting system in crustaceans. Aquaculture 191, 53–69.
Sung, H.H., Chang, H.J., Her, C.H., Chang, J.C., Song, Y.L., 1998. Phenoloxidase activity of hemocytes derived
from Penaeus monodon and Macrobrachium rosenbergii. J. Invertebr. Pathol. 71, 26–33.
Teshima, S.I., 1998. Nutrition of Penaeus japonicus. Rev. Fish. Sci. 6, 97–111.
Van Holde, K., Miller, K.I., Decker, H., 2001. Hemocyanins and invertebrate evolution. J. Biol. Chem. 276,
15563–15566.
Vargas-Albores, F., Yepiz-Plascencia, G., 2000. Beta glucan binding protein and its role in shrimp immune
response. Aquaculture 191, 13–21.
Vargas-Albores, F., Guzman, M.A., Ochoa, J.L., 1993. An anticoagulant solution for haemolymp collection and
N. Lopez et al. / Aquaculture 224 (2003) 223–243 243
prophenoloxidase studies of penaeid shrimp (Penaeus californiensis). Comp. Biochem. Physiol. 106A,
299–303.
Vinagre, A.S., Da Silva, R.S., 1992. Effects of starvation on the carbohydrate and lipid metabolism in crabs
previously maintaned on a high protein or carbohydrate-rich diet. Comp. Biochem. Physiol. 102A, 579–583.
Wigglesworth, J.M., Griffith, D.R.W., 1994. Carbohydrate digestion in Penaeus monodon. Mar. Biol. 120,
571–578.
Xu, Z., Primavera, J.H., de la Pena, L.D., Pettit, P., Belak, J., Alcivar-Warren, A., 2001. Genetic diversity of wild
and cultured black tiger shrimp (Penaeus monodon) in the Phillipines using microsatellites. Aquaculture 199,
13–40.