physical validation of a patient-specific contact finite element model of the ankle
TRANSCRIPT
ARTICLE IN PRESS
0021-9290/$ - se
doi:10.1016/j.jb
$2006 ASB�Correspond
Westlawn, The
Tel.: +319 335
E-mail addr
Journal of Biomechanics 40 (2007) 1662–1669
www.elsevier.com/locate/jbiomech
ASB/ISB award paper
Physical validation of a patient-specific contact finiteelement model of the ankle$
Donald D. Andersona,b,�, Jane K. Goldsworthyb, Wendy Lib,M. James Ruderta, Yuki Tochigia, Thomas D. Browna,b
aDepartments of Orthopaedics and Rehabilitation, The University of Iowa, Iowa City, IA, USAbBiomedical Engineering, The University of Iowa, Iowa City, IA, USA
Accepted 27 January 2007
www.JBiomech.com
Abstract
A validation study was conducted to determine the extent to which computational ankle contact finite element (FE) results agreed with
experimentally measured tibio-talar contact stress. Two cadaver ankles were loaded in separate test sessions, during which ankle contact
stresses were measured with a high-resolution (Tekscan) pressure sensor. Corresponding contact FE analyses were subsequently
performed for comparison. The agreement was good between FE-computed and experimentally measured mean (3.2% discrepancy for
one ankle, 19.3% for the other) and maximum (1.5% and 6.2%) contact stress, as well as for contact area (1.7% and 14.9%). There was
also excellent agreement between histograms of fractional areas of cartilage experiencing specific ranges of contact stress. Finally, point-
by-point comparisons between the computed and measured contact stress distributions over the articular surface showed substantial
agreement, with correlation coefficients of 90% for one ankle and 86% for the other. In the past, general qualitative, but little direct
quantitative agreement has been demonstrated with articular joint contact FE models. The methods used for this validation enable
formal comparison of computational and experimental results, and open the way for objective statistical measures of regional correlation
between FE-computed contact stress distributions from comparison articular joint surfaces (e.g., those from an intact versus those with
residual intra-articular fracture incongruity).
r 2007 Elsevier Ltd. All rights reserved.
Keywords: Ankle; Finite element; Validation; Articular joint contact
1. Introduction
1.1. Validation of articular joint contact models
Historically, the methods used and the rigor exercised infinite element (FE) validation studies of articular jointcontact analysis have varied substantially. In an FE modelof a metal-on-metal hip resurfacing prosthesis, validity wasestablished by comparing pressure distributions from themodel with those computed using a Hertzian contactmechanics solution (Udofia et al., 2004). In another study,
e front matter r 2007 Elsevier Ltd. All rights reserved.
iomech.2007.01.024
MicroStrain Award Paper.
ing author. Orthopaedic Biomechanics Laboratory, 2181
University of Iowa, Iowa City, IA 52242, USA.
8135; fax: +319 335 7530.
ess: [email protected] (D.D. Anderson).
in which computer-assisted methods were used to calculatecontact pressures and areas in dysplastic and normal hips,validity of the computational method was established bycomparing contact pressures with those reported inliterature (Hipp et al., 1999). In an FE model of patello-femoral contact (reporting contact stress, patellar kine-matics and relevant tendon forces), validation metricsinvolved comparing computed kinematics (resulting frominput muscle forces) with kinematics reported from anexperimental test, supplemented by comparison of com-puted patellar tendon force magnitudes with those found inliterature (Heegaard et al., 1995). A recent review articlewent so far as to state that many, if not most numericalmodels of articular joint contact have been publishedwithout any attempt whatsoever at experimental confirma-tion (Brand, 2005).
ARTICLE IN PRESSD.D. Anderson et al. / Journal of Biomechanics 40 (2007) 1662–1669 1663
While comparing FE results with values cited inpreviously published work or with corroborative resultsfrom other analytical methods serves to establish at leastgeneral confidence, comparison with data from a directphysical experiment can provide a more robust anddefinitive validation (Brown, 2004). Current experimentalcapabilities afford relatively high-resolution mapping ofcontact stress distributions in an articular joint, althoughthis is generally restricted to cadaveric specimen testing(Baratz et al., 1996; Brown et al., 2004; McKinley et al.,2004). Most previous studies have chosen to base theirvalidity assessment upon global-reduced scalar measures ofthe three-dimensional contact stress distribution, such asmean or maximum contact stress and/or contact area(Anderson et al., 2005; Haut Donahue et al., 2003; Huber-Betzer et al., 1990). In those few cases where full-fieldcontact stress comparisons have indeed been made, theyhave generally been only qualitative (Anderson et al.,2005). While arguably reasonable in the past, with thepresent convergence of biomechanics, mechanobiology,molecular biology and genetics to meaningfully addressphenomena at the tissue, cell and even molecular levels, it iscritically important now more than ever that the ‘‘source’’mechanical data be reliable in an absolute and rigoroussense.
1.2. The rationale for validation: the FE model
The role of altered contact mechanics in the pathology ofpost-traumatic osteoarthritis (OA) following intra-articularfracture remains poorly understood. One of severalproposed etiologies is that residual incongruities (i.e.,anatomical irregularities in the articular surfaces) remain-ing after the injury and treatment lead to aberrations in thejoint contact stress distributions which, over time, predis-pose to post-traumatic OA (Lefkoe et al., 1993; Wagneret al., 1996). The FE method provides an ideal vehicle bywhich to study joint contact stresses on a patient-specificbasis. Toward testing this proposed mechanopathology, anFE model has been developed to predict patient-specificjoint contact stresses in the ankle throughout the entirestance phase of gait (Anderson et al., 2006).
The broader scope of study has involved FE modelsgenerated from segmented CT data for fractured andsurgically treated ankles, as well as for the uninjuredcontralateral ankles, from a series of patients withunilateral intra-articular fractures of the tibial plafond.FE meshes of the articulating surfaces have been generatedand gait simulation performed, allowing computation ofthe contact stresses across the articulating ankle surfaces atmultiple instances throughout gait. Boundary conditionswere applied so as to allow the ankle to rotate not as a fixedhinge, but rather in multiple planes, as dictated by thetibio-talar articulation (Leardini et al., 2000; Tochigi et al.,2005). The resulting ankle motions and computed contactstresses were shown to be consistent with those previouslymeasured experimentally (Bottlang et al., 1999; Vrahas
et al., 1994). Computed contact stresses were then summedover time to calculate contact stress exposures for eachintact and fractured ankle. For a given patient, differencesin contact stress exposures between the healed fracturedankle and the intact contralateral reflect propensity forarticular degeneration.The purpose of the present study was to validate the FE
modeling approach used in that work, by direct compar-ison with physical measurements from correspondingcadaver loading tests. Successful cadaver validation ofcomputed contact stress distributions, across the articularsurface, provides a strong base of support for FE modelbiofidelity.
2. Methods
In separate test sessions, two fresh–frozen cadaver ankle specimens
(University of Iowa Deeded Body Program) were prepared and loaded in a
custom fixture, first to establish a neutral load-bearing joint apposition,
then later with a pressure sensor placed within the joint to measure contact
stresses. A CT scan of the ankle was acquired to record the precise loaded
joint apposition. Stainless steel Kirschner wires (K-wires) were drilled
across the joint, piercing the still-loaded pressure sensor, to index sensor
orientation relative to the joint surfaces. An FE model of each ankle was
generated, with boundary conditions applied to replicate the experimental
loading. Finally, experimental and computational contact stress distribu-
tions were spatially registered and compared over the entire contact patch.
2.1. Specimen preparation, CT scan acquisition and physical
testing
The joint capsule and ligaments of the thawed cadaver ankles were left
intact. For one specimen, in order to eliminate motion at the talo-
calcaneal joint, the talus was rigidly fixed to the calcaneus with two
cemented-in fiberglass rods. (This step was omitted in the preparation of
the second test specimen, as the influence of this factor was found to be
minor.) The calcaneus and forefoot were potted in polymethyl-methacry-
late, and rigidly attached to an aluminum base plate.
Each cadaver ankle was placed in a loading fixture in neutral flexion/
extension, and a material testing machine (MTS Bionix 858) was used to
apply a 600N compressive load across the joint (Fig. 1). This step was
necessary in order to establish the neutral load-bearing apposition for each
ankle. Flexion/extension rotations of the foot/talus construct were fixed
during force application, but all other translational and rotational degrees
of freedom were free. The foot inversion/eversion angle, tibial internal/
external rotation angle, and the tibial medial/lateral and anterior/posterior
positions were recorded in the loaded apposition. The specimen was then
transferred to a plastic mounting fixture (identical to the loading fixture,
except machined from plastic), where the apposition was carefully
reproduced.
CT scans of the ankles within the plastic fixture were acquired at
0.3mm slice thickness in a Siemens Sensation 64-slice scanner, with a field
of view selected to provide an in-plane spatial resolution of 0.3mm. The
specimens were then returned to the loading fixture and the joint capsule
opened. A Tekscan Model #5033 pressure sensor (Tekscan Inc.; Boston,
MA) was calibrated (Baer et al., 2005) and inserted into the tibio-talar
joint (McKinley et al., 2004). This sensor measures pressure at 1472
sensing elements (46� 32 sensels), with a resolution of 144 sensels/cm2.
The 600N load was once again applied, and the position was recorded to
verify restoration of the same neutral load-bearing apposition. Tekscan
sensor readings were recorded, obtaining 10 frames at 10Hz (i.e., 1 s). Two
1mm diameter stainless-steel K-wires were then drilled through the tibia,
across the joint piercing the sensor, and into the talus. Bi-planar

ARTICLE IN PRESS
Fig. 1. Schematic of ankle loading, showing the bones of an ankle
specimen, the Tekscan 5033 pressure sensor, and the loading fixture with
noted constraints.
D.D. Anderson et al. / Journal of Biomechanics 40 (2007) 1662–16691664
radiographs were then taken with the K-wires in place to record the
relative locations of the tibia, talus, and the Tekscan pressure sensor.
2.2. FE model generation and spatial registration
The CT scan data from each ankle specimen were segmented in
MATLAB (The MathWorks Inc., Natick, MA), using a custom-written
program (Anderson et al., 2004), and the results were exported as a bone
boundary point cloud for the tibia and for the talus. Geomagic Studio
software (Geomagic Inc., Research Triangle Park, NC) was used first to
create detailed polygonal surfaces from the bone boundary point cloud
data, and subsequently to smooth the noisy surface data. The accuracy of
the final smoothed surface fits relative to the original point cloud data
were constrained, using Geomagic Studio’s tolerance functionality, to be
within 70.15mm.
Articular cartilage regions were extruded along local bone surface
normals at the tibio-talar articulation to a uniform thickness of 1.7mm
(Anderson et al., 2006). In our intended clinical application of patient-
specific contact FE modeling, we are presented with CT studies from
ankles for which the distribution of articular cartilage thickness is not
known. For this reason, and based on preliminary work with the FE
models, we chose to use a uniform cartilage thickness, with the actual
thickness value based upon previous work (El-Khoury et al., 2004).
Finally, the bone and cartilage surface data were imported into TrueGrid
software (XYZ Scientific Applications Inc., Livermore, CA) to generate an
all-hexahedral FE mesh.
The plastic mounting fixture was segmented from CT so that its
geometry could be imported into a virtual environment (Data Manager
software—Van Sint Jan et al., 2004), along with the bone surfaces, to
execute a definitive spatial registration. The bone surfaces were
interactively positioned and oriented based upon their known locations
with respect to the loading fixture, in order to replicate the loading/
rotational axes for FE modeling purposes. Spatial registration of the
Tekscan sensor readings and the FE results enabled a comprehensive
comparison of the experimentally measured versus computationally
predicted contact stress distributions. To facilitate registration, a virtual
representation of the Tekscan sensor including the sensor’s individual
sensels, was imported into Data Manager. The curvature of the virtual
sensor was chosen to nominally match the curvature of the tibio-talar
articulation (Fig. 2), assuming that the highly flexible sensor would
conform to the joint surfaces. The two K-wires were modeled in the virtual
environment by cylinders of appropriate dimensions, positioned and
oriented to match their silhouettes on the bi-planar radiographs. Finally,
the Tekscan sensor was rotated and translated so that the K-wires pierced
it at the correct locations.
FE solutions were obtained using a commercially available code
(ABAQUS Standard 6.6, ABAQUS Inc., Providence, RI, USA). Each FE
model included a distal segment of the tibia, and the entire talus.
Deformable contact zones were defined across the entire apposing tibial
and talar articular cartilage surfaces, and the cartilage was assigned
isotropic linear elastic material properties (E ¼ 12MPa and n ¼ 0.42).
Boundary conditions of the FE models were selected to replicate the
experimental loading. Ankle ligaments were not explicitly included, as
only minor relative translation of the two bones was expected in the axial-
only loading simulation. Soft tissue constraints across the ankle joint
were instead modeled in the FE analysis with a single-linear spring
(k ¼ 50N/mm) placed to resist anterior–posterior translation.
A mesh convergence study was performed in the first of the two
validation cases, to ensure that mesh resolution-independent FE results
were obtained while exercising a reasonable expenditure of computational
resources. The ratio of tibial to talar element size (1:3) was maintained,
and the element aspect ratios were held constant, as the number of total
elements was varied. Thirteen FE simulations were completed, each with a
different number of elements. The minimum number of elements tested
was 2997 and the maximum was 293,402 elements.
The registered Tekscan-measured and FE-computed contact stress
distributions were imported into MATLAB to allow formal comparisons
of the contact stress distributions. As the two data sets were at different
spatial resolutions, and registered to grids that did not coincide, formal
comparison required linear interpolation of the data, appropriately re-
sampled to a common spatial grid (the Tekscan sensel grid was used for
this purpose). Once this was accomplished, point-by-point comparisons
between the computed and measured contact stress distributions were
made.
Mean and maximum contact stress values, as well as the contact area,
were first compared. Next, the contact stress distributions were post-
processed to generate area engagement histograms, corresponding to the
fractional areas of cartilage experiencing specific ranges of contact stress
(0.5MPa increments—Maxian et al., 1995), and compared. Then absolute
point-by-point differences in the computed and measured contact stresses
were evaluated, first in terms of their correlation over the 1472 sensel
locations, then in terms of the distribution of discrepancies over the
surface. Finally, probability density functions were calculated for the
differences between the computed and measured contact stress values,
allowing confidence intervals to be formulated for each of the two
validation ankles.
3. Results
Using maximum contact stress and total contact area asmetrics of convergence, a mesh of approximately 50,000elements was judged as being adequate to assure aconverged FE solution. Computation times (HP rx4640;4-CPU, 1.5GHz Itanium (64 bit) system; 12GB RAM/438GB disk) ranged from 1.3min for 2997 elements to nearly40 h for 293,402 elements (90min for the converged FEsolution). All subsequent FE simulations were run usingthe 50,000-element converged level of mesh refinement.
ARTICLE IN PRESS
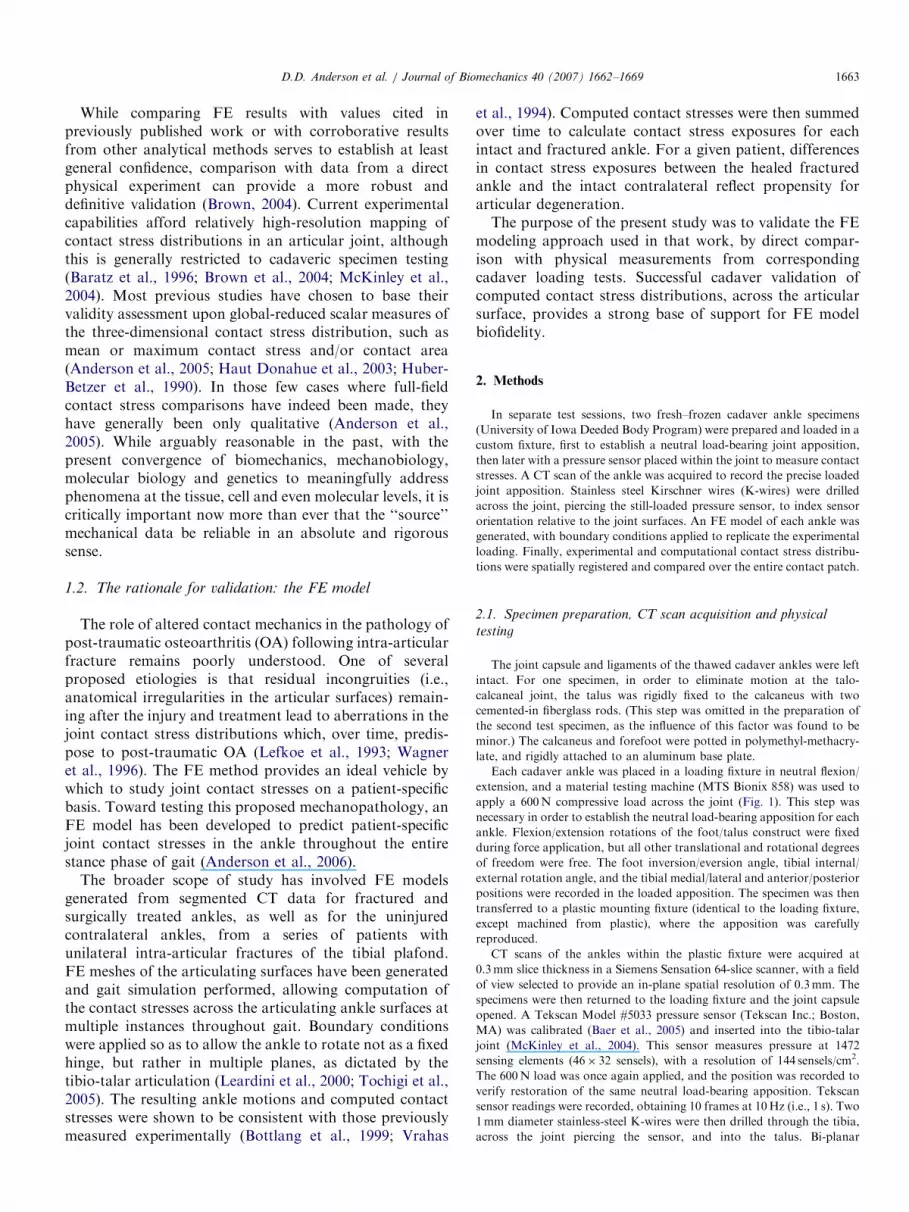
Fig. 2. (a) Anterior and lateral view radiographs of the loaded cadaver tibia and talus, with K-wires in place, enabled definitive registration. (b) Antero-
lateral view of the Tekscan sensor (green) and the finite element mesh (blue), registered with K-wires (gray) drilled through the tibia and talus (exploded
view, for visualization).
D.D. Anderson et al. / Journal of Biomechanics 40 (2007) 1662–1669 1665
The Tekscan-measured and FE-computed contact stressdistributions are shown in Fig. 3. In both validation ankles,contact spanned most of the lateral half of the tibialsurface. The physical validation established confidence inresults from the FE models, beginning with global scalarmetrics of contact stress (Table 1). For validation ankle #1,the maximum contact stress computed from the FEsimulations was within 1.5% of that measured, the meancomputed contact stress was within 3.2%, and the contactarea was within 1.7%. For validation ankle #2, thecomputed maximum contact stress was within 6.2% ofthat measured, the mean within 18.3%, and the contactarea within 14.9%.
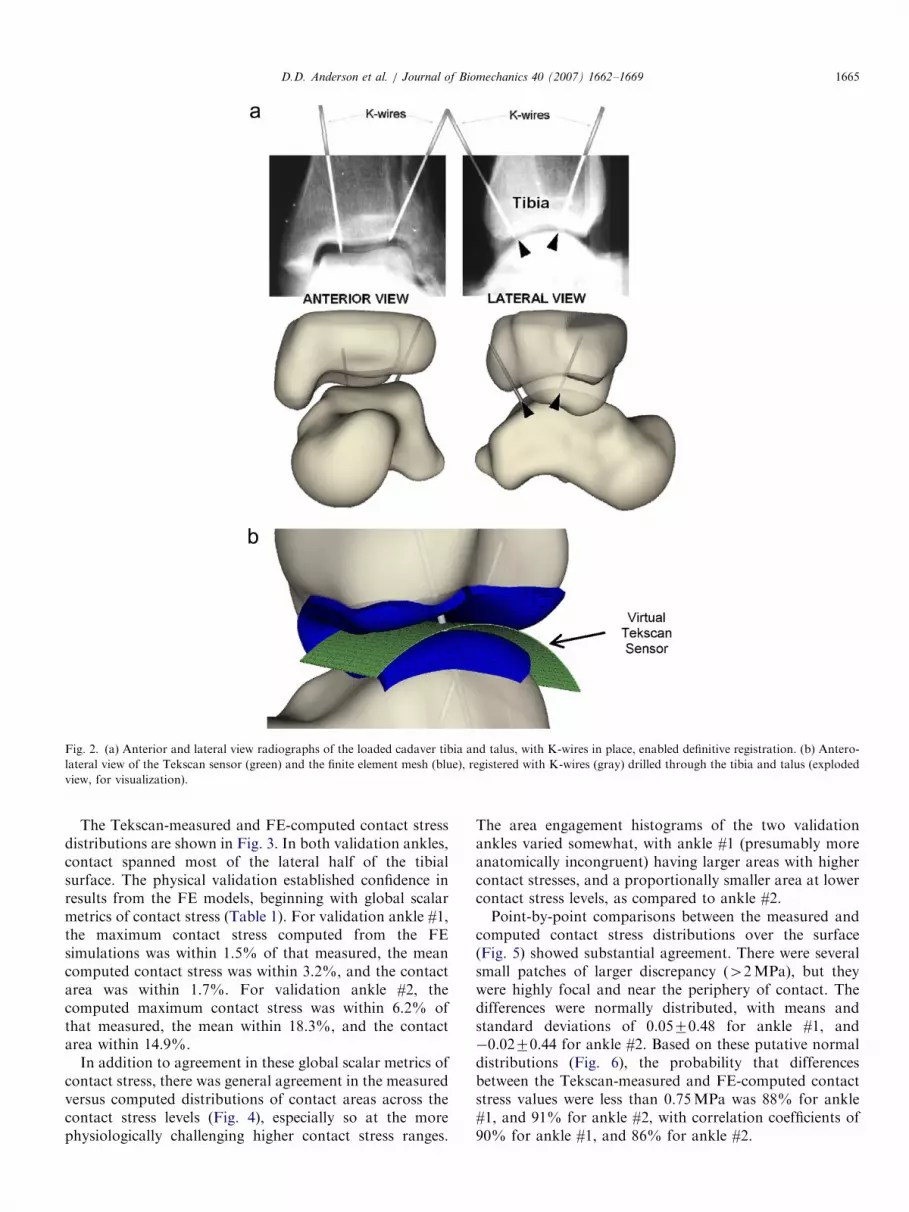
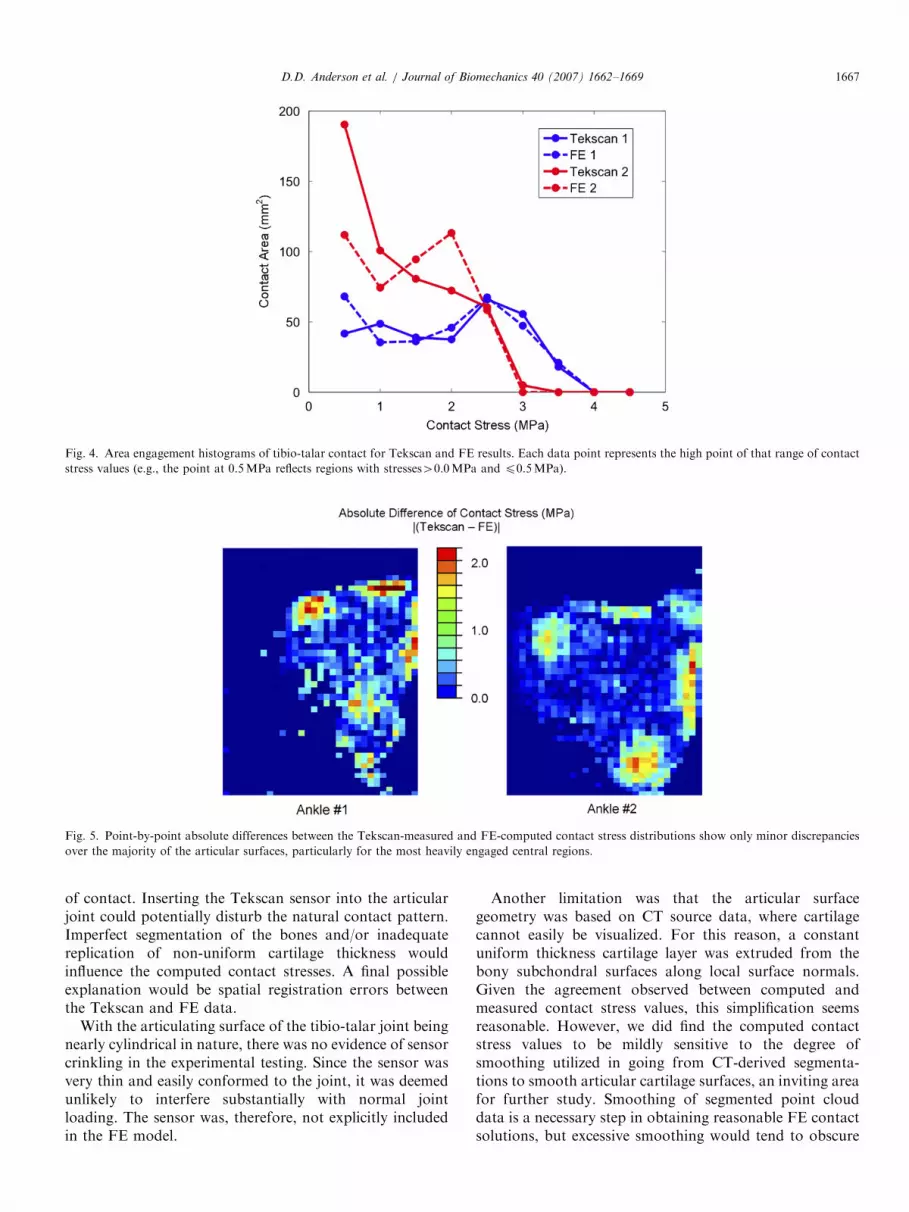
In addition to agreement in these global scalar metrics ofcontact stress, there was general agreement in the measuredversus computed distributions of contact areas across thecontact stress levels (Fig. 4), especially so at the morephysiologically challenging higher contact stress ranges.
The area engagement histograms of the two validationankles varied somewhat, with ankle #1 (presumably moreanatomically incongruent) having larger areas with highercontact stresses, and a proportionally smaller area at lowercontact stress levels, as compared to ankle #2.Point-by-point comparisons between the measured and
computed contact stress distributions over the surface(Fig. 5) showed substantial agreement. There were severalsmall patches of larger discrepancy (42MPa), but theywere highly focal and near the periphery of contact. Thedifferences were normally distributed, with means andstandard deviations of 0.0570.48 for ankle #1, and�0.0270.44 for ankle #2. Based on these putative normaldistributions (Fig. 6), the probability that differencesbetween the Tekscan-measured and FE-computed contactstress values were less than 0.75MPa was 88% for ankle#1, and 91% for ankle #2, with correlation coefficients of90% for ankle #1, and 86% for ankle #2.

ARTICLE IN PRESS
Fig. 3. Inferior view of tibia, overlaid with spatially aligned Tekscan pressure results (left) and FE results (right) for each validation ankle.
Table 1
This simple comparison of global metrics for the two cadaver ankles included in the physical validation study establishes general agreement between the
Tekscan-measured and FE-computed contact stress distributions
Ankle #1 Ankle #2
Tekscan Finite element Tekscan Finite element
Maximum contact stress (MPa) 3.69 3.74 2.92 2.74
Mean contact stress (MPa) 1.96 2.02 1.15 1.36
Contact area (mm2) 295.1 290.5 493.6 419.9
D.D. Anderson et al. / Journal of Biomechanics 40 (2007) 1662–16691666
4. Discussion
The present direct comparisons between physical mea-surements and the FE model of ankle loading convincinglyestablish the computational model’s validity. This valida-tion exercise not only showed reasonable comparisonbetween the global metrics of contact stress and contactarea, but also in the regional and spatial distributions ofcontact stress. Because OA usually initiates regionally, itseems especially important that contact FE models bevalidated regionally, rather than just in terms of globalsummary measures. Based upon these validation results,FE stresses could be reported over the whole articulatingsurface with a very reasonable degree of confidence(conservatively, within 10–15% of those measured experi-mentally).
Tekscan was chosen for this study from among a numberof other potential pressure sensors. Fuji pressure sensitivefilm is one type of sensor frequently used because of itsreasonable accuracy (710%), low cost, and ease of use(Brown et al., 1988; Ishii et al., 1998). Fuji film cannot,however, be used to measure dynamic effects, as would beexpected in unstable articular joints (McKinley et al.,2004). A Tekscan pressure sensor design (Model #5033)was specifically developed in our laboratory for use in theankle (Brown et al., 2004). When appropriately calibrated,the Tekscan sensor enables dynamic pressure measure-ments at spatial resolutions comparable to those from Fujifilm (Baer et al., 2005).There are several plausible explanations for the modest
focal discrepancies that were observed between measuredand computed contact stress distributions at the periphery
ARTICLE IN PRESS
Fig. 4. Area engagement histograms of tibio-talar contact for Tekscan and FE results. Each data point represents the high point of that range of contact
stress values (e.g., the point at 0.5MPa reflects regions with stresses40.0MPa and p0.5MPa).
Fig. 5. Point-by-point absolute differences between the Tekscan-measured and FE-computed contact stress distributions show only minor discrepancies
over the majority of the articular surfaces, particularly for the most heavily engaged central regions.
D.D. Anderson et al. / Journal of Biomechanics 40 (2007) 1662–1669 1667
of contact. Inserting the Tekscan sensor into the articularjoint could potentially disturb the natural contact pattern.Imperfect segmentation of the bones and/or inadequatereplication of non-uniform cartilage thickness wouldinfluence the computed contact stresses. A final possibleexplanation would be spatial registration errors betweenthe Tekscan and FE data.
With the articulating surface of the tibio-talar joint beingnearly cylindrical in nature, there was no evidence of sensorcrinkling in the experimental testing. Since the sensor wasvery thin and easily conformed to the joint, it was deemedunlikely to interfere substantially with normal jointloading. The sensor was, therefore, not explicitly includedin the FE model.
Another limitation was that the articular surfacegeometry was based on CT source data, where cartilagecannot easily be visualized. For this reason, a constantuniform thickness cartilage layer was extruded from thebony subchondral surfaces along local surface normals.Given the agreement observed between computed andmeasured contact stress values, this simplification seemsreasonable. However, we did find the computed contactstress values to be mildly sensitive to the degree ofsmoothing utilized in going from CT-derived segmenta-tions to smooth articular cartilage surfaces, an inviting areafor further study. Smoothing of segmented point clouddata is a necessary step in obtaining reasonable FE contactsolutions, but excessive smoothing would tend to obscure

ARTICLE IN PRESS
Fig. 6. The probability distributions for differences between the Tekscan-measured and FE-computed contact stress values show excellent agreement, with
roughly 90% probability that differences are within 0.75MPa. The two smoothed curves are idealized probability distributions based upon the binned data
(n ¼ 1472 samples; m ¼ mean; s ¼ standard deviation). Note: a majority of central zero-valued differences are for locations where contact stress values are
zero.
D.D. Anderson et al. / Journal of Biomechanics 40 (2007) 1662–16691668
the influence of residual surface incongruity, our point ofdeparture in this study. We chose to err on the conservativeside, opting for less smoothing.
The computational investigation of altered contactmechanics associated with clinically observed residualincongruity following treatment and healing of intra-articular fractures depends upon faithful regional repro-duction of the prevailing contact stress distributions.Simply establishing general agreement between computedand measured mean and maximum contact stresses andcontact areas would not have been sufficient in this regard.In other studies similarly reliant upon accurate localprediction of contact stress, it will likewise be criticallyimportant that these ‘‘source’’ mechanical data be vali-dated in an absolute and rigorous sense.
Acknowledgments
The technical assistance of Dr. Douglas Pedersen(Tekscan calibration) and Mr. Thaddeus Thomas (imagesegmentation) are gratefully acknowledged. Dr. MarcoViceconti and Dr. Fulvia Taddei provided assistance with
the Data Manager software. This work was supported byGrants from the NIH (AR46601 and AR048939).
References
Anderson, D.D., Muehling, V.L., Marsh, J.L., Brown, T.D., 2004. Precise
identification of bone fragment boundaries to assist in reduction of
highly comminuted fractures. Computer Aided Surgery 9 (3), 116.
Anderson, D.D., Deshpande, B.R., Daniel, T.E., Baratz, M.E., 2005.
A three-dimensional finite element model of the radiocarpal joint:
distal radius fracture step-off and stress transfer. Iowa Orthopaedics
Journal 25, 108–117.
Anderson, D.D., Goldsworthy, J.K., Shivanna, K., Grosland, N.M.,
Pedersen, D.R., Thomas, T.P., Tochigi, Y., Marsh, J.L., Brown, T.D.,
2006. Intra-articular contact stress distributions at the ankle through-
out stance phase—patient-specific finite element analysis as a metric of
degeneration propensity. Biomechanical Model Mechanobiol 5 (2–3),
82–89.
Baer, T.E., Pedersen, D.R., Rudert, M.J., Kallemeyn (Vos), N.A.,
Grosland, N.M., Brown, T.D., 2005. Traveling-wave calibration of
sheet array sensors for intra-articular pressure measurements. In: 51st
Annual Meeting of the Orthopaedic Research Society, February
20–23. Presentation #1701.
Baratz, M.E., Des Jardins, J., Anderson, D.D., Imbriglia, J.E., 1996.
Displaced intra-articular fractures of the distal radius: the effect of

ARTICLE IN PRESSD.D. Anderson et al. / Journal of Biomechanics 40 (2007) 1662–1669 1669
fracture displacement on contact stresses in a cadaver model. Journal
of Hand Surgery [American volume] 21 (2), 183–188.
Bottlang, M., Marsh, J.L., Brown, T.D., 1999. Articulated external
fixation of the ankle: minimizing motion resistance by accurate axis
alignment. Journal of Biomechanics 32 (1), 63–70.
Brand, R.A., 2005. Joint contact stress: a reasonable surrogate for
biological processes? Iowa Orthopaedics Journal 25, 82–94.
Brown, T.D., 2004. Finite element modeling in musculoskeletal biome-
chanics. Journal of Applied Biomechanics 20, 336–366.
Brown, T.D., Anderson, D.D., Nepola, J.V., Singerman, R.J., Pedersen,
D.R., Brand, R.A., 1988. Contact stress aberrations following
imprecise reduction of simple tibial plateau fractures. Journal of
Orthopaedic Research 6 (6), 851–862.
Brown, T.D., Rudert, M.J., Grosland, N.M., 2004. New methods for
assessing cartilage contact stress after articular fracture. Clinical
Orthopaedics and Related Research (423), 52–58.
El-Khoury, G.Y., Alliman, K.J., Lundberg, H.J., Rudert, M.J., Brown,
T.D., Saltzman, C.L., 2004. Cartilage thickness in cadaveric ankles:
measurement with double-contrast multi-detector row CT arthrogra-
phy versus MR imaging. Radiology 233 (3), 768–773.
Haut Donahue, T.L., Hull, M.L., Rashid, M.M., Jacobs, C.R., 2003. How
the stiffness of meniscal attachments and material properties affect tibio-
femoral contact pressure computed using a validated finite element model
of the human knee joint. Journal of Biomechanics 36 (1), 19–34.
Heegaard, J., Leyvraz, P.F., Curnier, A., Rakotomanana, L., Huiskes, R.,
1995. The biomechanics of the human patella during passive knee
flexion. Journal of Biomechanics 28 (11), 1265–1279.
Hipp, J.A., Sugano, N., Millis, M.B., Murphy, S.B., 1999. Planning
acetabular redirection osteotomies based on joint contact pressures.
Clinical Orthopaedics and Related Research (364), 134–143.
Huber-Betzer, H., Brown, T.D., Mattheck, C., 1990. Some effects of
global joint morphology on local stress aberrations near imprecisely
reduced intra-articular fractures. Journal of Biomechanics 23 (8),
811–822.
Ishii, S., Palmer, A.K., Werner, F.W., Short, W.H., Fortino, M.D., 1998.
Pressure distribution in the distal radioulnar joint. Journal of Hand
Surgery [American volume] 23 (5), 909–913.
Leardini, A., O’Connor, J.J., Catani, F., Giannini, S., 2000. The role of
the passive structures in the mobility and stability of the human ankle
joint: a literature review. Foot and Ankle International 21 (7),
602–615.
Lefkoe, T.P., Trafton, P.G., Ehrlich, M.G., Walsh, W.R., Dennehy, D.T.,
Barrach, H.J., Akelman, E., 1993. An experimental model of femoral
condylar defect leading to osteoarthrosis. Journal of Orthopaedic
Trauma 7 (5), 458–467.
Maxian, T.A., Brown, T.D., Weinstein, S.L., 1995. Chronic stress
tolerance levels for human articular cartilage: two nonuniform contact
models applied to long-term follow-up of CDH. Journal of Biome-
chanics 28 (2), 159–166.
McKinley, T.O., Rudert, M.J., Koos, D.C., Brown, T.D., 2004.
Incongruity versus instability in the etiology of posttraumatic arthritis.
Clinical Orthopaedics and Related Research (423), 44–51.
Tochigi, Y., Rudert, M.J., Amendola, A., Brown, T.D., Saltzman, C.L.,
2005. Tensile engagement of the peri-ankle ligaments in stance phase.
Foot and Ankle International 26 (12), 1067–1073.
Udofia, I.J., Yew, A., Jin, Z.M., 2004. Contact mechanics analysis of
metal-on-metal hip resurfacing prostheses. Proceedings of the Institu-
tion of Mechanical Engineers [H] 218 (5), 293–305.
Van Sint Jan, S., Viceconti, M., Clapworthy, G., 2004. Modern
visualization tools for research and education in biomechanics. In:
Eighth International Conference on Information Visualization (IV’04).
IEEE Computer Society, pp. 9–14.
Vrahas, M., Fu, F., Veenis, B., 1994. Intraarticular contact stresses with
simulated ankle malunions. Journal of Orthopaedic Trauma 8 (2),
159–166.
Wagner Jr., W.F., Tencer, A.F., Kiser, P., Trumble, T.E., 1996. Effects of
intra-articular distal radius depression on wrist joint contact char-
acteristics. Journal of Hand Surgery [American] 21 (4), 554–560.