phylogeography and alpha taxonomy of the common dolphin (delphinus sp
TRANSCRIPT
Phylogeography and alpha taxonomy of the common dolphin(Delphinus sp.)
A. NATOLI,* A. CANADAS,� V. M. PEDDEMORS,� A. AGUILAR,§ C. VAQUERO,–
P. FERNANDEZ-PIQUERAS– & A. R. HOELZEL*
*School of Biological and Biomedical Sciences, University of Durham, Durham, UK
�Alnitak. Nalon 16, 28240 Hoyo de Manzanares, Madrid, Spain
�Discipline of Zoology, School of Biology, University of Durban-Westville, Durban, South Africa and Natal Shark Board, Umhlanga Rocks, South Africa
§Departamento de Biologia animal, Universitad de Barcelona, Barcelona, Spain
–Grupo de Investigacion de Cetaceos de la Universidad Autonoma de Madrid, Laboratorio de Genetica Humana, Unidad de Biologıa, Universidad Autonoma de Madrid,
Madrid, Spain
Introduction
The relationship between morphology and genetic dif-
ferentiation has been explored in numerous studies (see
review by Foote, 1997). Although many comparative
studies suggest similar phylogenetic reconstructions
using morphological and molecular data (see Patterson
et al., 1993), it is clear that the rate and pattern of
evolution can differ considerably at neutral and quanti-
tative markers (e.g. Rocha-Olivares et al., 2001). The rate
of morphological change can be very rapid in both plants
and animals, especially under artificial selection (see
review by Roopnarine, 2003). Therefore, conspecific
populations have the potential to adapt to local habitats
over a timeframe that is short enough to not be reflected
in patterns of neutral genetic differentiation accumulated
by drift. At the same time, populations not under strong
selection for morphological characters, and geographic-
ally isolated, may be expected to show greater corres-
pondence between morphological and genetic
differentiation. In this study we explore this question
with an investigation of a genus within a group of taxa
Correspondence: A. Rus Hoelzel, School of Biological and Biomedical
Sciences, University of Durham, South Road DH1 3LE Durham, UK.
Tel.: +44 (0)191 334 1325; fax: +44 (0)191 334 1201;
e-mail: [email protected]
J . E V O L . B I O L . 1 9 ( 2 0 0 6 ) 9 4 3 – 9 5 4 ª 2 0 0 5 E U R O P E A N S O C I E T Y F O R E V O L U T I O N A R Y B I O L O G Y 943
Keywords:
common dolphin;
convergence;
evolution;
microsatellites;
mtDNA;
phylogeography;
population genetic.
Abstract
The resolution of taxonomic classifications for delphinid cetaceans has been
problematic, especially for species in the genera Delphinus, Tursiops and
Stenella. The frequent lack of correspondence between morphological and
genetic differentiation in these species raises questions about the mecha-
nisms responsible for their evolution. In this study we focus on the genus
Delphinus, and use molecular markers to address questions about speciation
and the evolution of population structure. Delphinus species have a
worldwide distribution and show a high degree of morphological variation.
Two distinct morphotypes, long-beaked and short-beaked, have been
considered different species named D. capensis and D. delphis, respectively.
However, genetic differentiation between these two forms has only been
demonstrated in the Pacific. We analysed samples from eight different
geographical regions, including two morphologically defined long-beaked
form populations, and compared these with the eastern North Pacific
populations. We found high differentiation among the populations described
as long-beaked instead of the expected monophyly, suggesting that these
populations may have evolved from independent events converging on the
same morphotype. We observed low genetic differentiation among the
short-beaked populations across a large geographical scale. We interpret
these phylogeographical patterns in the context of life history and
population structure in related species.
doi:10.1111/j.1420-9101.2005.01033.x
that tend to be highly polytypic across their geographical
ranges: the delphinid cetaceans.
The evolutionary radiation of the family Delphinidae
(oceanic dolphins; see Rice, 1998) is likely to date back
to the Middle Miocene, though much of the speciation
in this group probably dates to the Pliocene (e.g.
Barnes, 1976). A previous phylogenetic study based on
the mtDNA cytochrome b locus proposed division into
five subfamilies, but these have yet to be confirmed
(LeDuc et al., 1999). This same study suggested
polyphyly within the Delphininae (a subfamily desig-
nation that has been supported by various authors;
Rice, 1998). This was especially the case among the
genera Delphinus, Tursiops and Stenella. Both Delphinus
and Tursiops have been historically divided (based on
morphology) into multiple species, though modern
classifications had indicated just one species in each
genus (see Rice, 1998) until recent genetic studies
indicated subdivision into at least two species for each
genus. For Tursiops we recently proposed a third species
based on genetic analyses of a broader geographical
range of specimens (Natoli et al., 2004).
In this study we focus on the genus Delphinus.
Delphinus species are widely distributed in all oceans,
from temperate to tropical waters and show high mobil-
ity across their habitat. Morphological diversity had led to
more than 20 different species being described in the
past, although they were all subsequently considered
local variations of a single species Delphinus delphis
(Hershkovitz, 1966). The present classification within
this genus is still uncertain, although two different
species are generally accepted: a long-beaked form
(Delphinus capensis) and a short-beaked form (D. delphis).
Our objective in this study is to use the example of this
genus to explore the relationship between morphotypic
differentiation, habitat use, demographic history and
genetic differentiation, to gain insight into the mecha-
nisms that underlie population differentiation and spe-
ciation in these marine taxa.
The separation between the long- and short-beaked
forms is based on both external morphological charac-
ters, such as the colour pattern and overall body size, and
skeletal morphological characters, including the length of
the rostrum, the tooth and the vertebra counts (Heyning
& Perrin, 1994). Specific status for these two forms was
based largely on the morphological and genetic analysis
of two sympatric populations occurring along the coast of
California. In this area, the bigger long-beaked form
prefers shallow coastal waters, whereas the smaller short-
beaked form occurs mainly in deeper oceanic waters.
From the analysis of mtDNA control region sequences,
Rosel et al. (1994) found reciprocal monophyly, genetic
divergence of 1.11%, and fixed differences. Comparison
between short-beaked individuals from southern Cali-
fornia and short-beaked individuals from other oceans
(eastern tropical Pacific and the Black sea) differed by
only 0.02% (Rosel et al., 1994).
However, the classification D. delphis vs. D. capensis
remains controversial. High variability of the rostral
length-zygomatic width ratio is observed both in the
North Pacific and North Atlantic (see Bell et al., 2002;
Murphy, 2004). The South African long-beaked form,
although very similar to the Pacific long-beaked form
in coloration, rostral length, and tooth count, differs for
the average total vertebra count (Heyning & Perrin,
1994). In the Indo-Pacific (from the Middle East to
China) an extreme long-beaked form has been
observed with evidence of clinal variation in the size
as one moves east or west from India. This form has
been named Delphinus delphis tropicalis by Van Bree
(1971), though it has also been suggested that it could
be a subspecies of D. capensis (Jefferson & van
Waerebeek, 2002). Possible paraphyly of the Indian
and Pacific long-beaked form has also been suggested
by LeDuc et al. (1999) and reinforced by Jefferson &
Waerebeek (2002), suggesting differentiation between
the eastern Pacific long beaked common dolphin and
the Indo-Pacific D. capensis.
Most data suggest different geographical distributions
for the two forms and few areas where they overlap
(Perrin, 2002). The short-beaked common dolphin
shows a continuous distribution north–south along
both the eastern and the western coasts of the Atlantic
Ocean, and the eastern coast of the Pacific Ocean. It is
also present from central Japan to Taiwan, around New
Caledonia, New Zealand and Tasmania in the western
Pacific, and in the Mediterranean and Black Seas.
Conversely the long-beaked form has a disjunct distri-
bution along the western coast of Africa, South Africa
and Madagascar, along the eastern coast of South
America (from Venezuela to Argentina), from southern
California to central Mexico in the eastern Pacific,
around Korea, southern Japan and Taiwan in the
western Pacific. The form D. d. tropicalis is observed
only in the northern Indian Ocean and Southern Asia
(Perrin, 2002).
Our earlier results suggest possible mechanisms for
the evolution of population structure and speciation in
highly mobile and social marine organisms. This has
been based on comparing population structure among
morphotypes and species with contrasting behaviours
(e.g. for the closely related Tursiops truncatus; Natoli
et al., 2004, 2005). In this study we assessed the
molecular phylogenetics of recognized morphotypes,
and tested the hypothesis that the long-beaked and
short-beaked forms represent separate species through-
out their distributional range. Reciprocal monophyly
would have suggested early divergence and subsequent
expansion into their modern distribution. However our
data instead suggest that the long-beaked form origin-
ated independently in different regions, which implies
that selection for this morphotype represents adapta-
tion to local environments, and may be driving local
speciation.
944 A. NATOLI ET AL.
J . E V O L . B I O L . 19 ( 2 0 0 6 ) 9 4 3 – 9 5 4 ª 2 0 0 5 E U R O P E A N S O C I E T Y F O R E V O L U T I O N A R Y B I O L O G Y
Materials and methods
Sample collection and DNA extraction
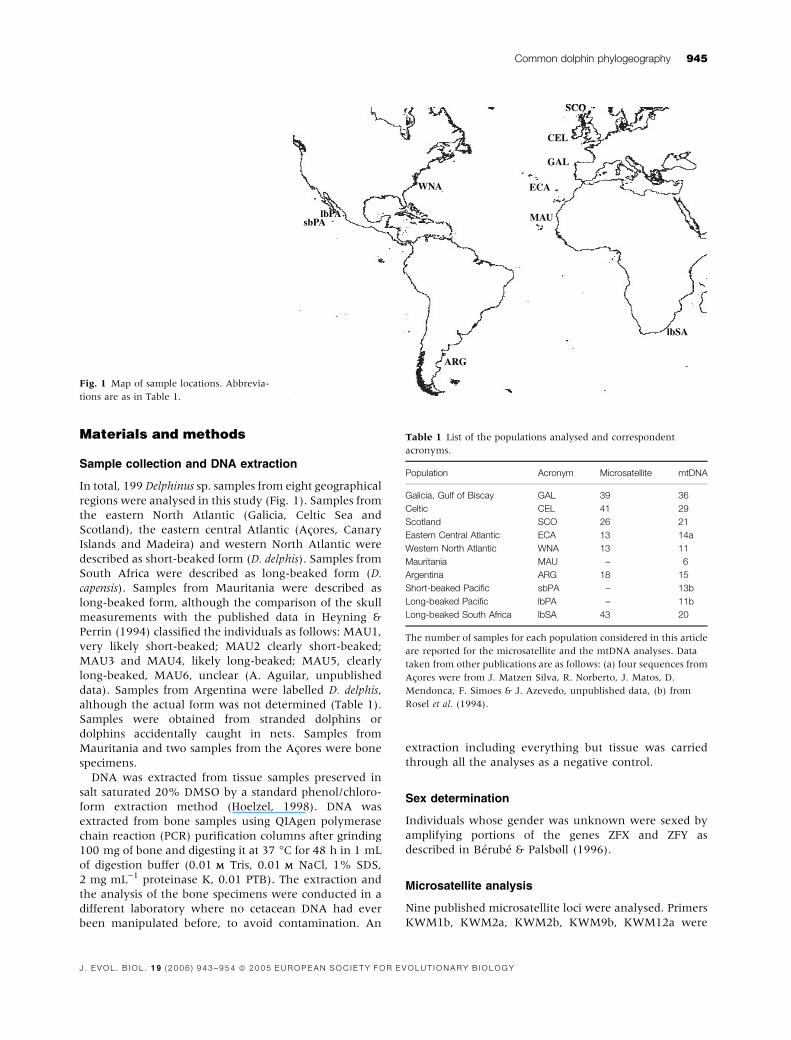
In total, 199 Delphinus sp. samples from eight geographical
regions were analysed in this study (Fig. 1). Samples from
the eastern North Atlantic (Galicia, Celtic Sea and
Scotland), the eastern central Atlantic (Acores, Canary
Islands and Madeira) and western North Atlantic were
described as short-beaked form (D. delphis). Samples from
South Africa were described as long-beaked form (D.
capensis). Samples from Mauritania were described as
long-beaked form, although the comparison of the skull
measurements with the published data in Heyning &
Perrin (1994) classified the individuals as follows: MAU1,
very likely short-beaked; MAU2 clearly short-beaked;
MAU3 and MAU4, likely long-beaked; MAU5, clearly
long-beaked, MAU6, unclear (A. Aguilar, unpublished
data). Samples from Argentina were labelled D. delphis,
although the actual form was not determined (Table 1).
Samples were obtained from stranded dolphins or
dolphins accidentally caught in nets. Samples from
Mauritania and two samples from the Acores were bone
specimens.
DNA was extracted from tissue samples preserved in
salt saturated 20% DMSO by a standard phenol/chloro-
form extraction method (Hoelzel, 1998). DNA was
extracted from bone samples using QIAgen polymerase
chain reaction (PCR) purification columns after grinding
100 mg of bone and digesting it at 37 �C for 48 h in 1 mL
of digestion buffer (0.01 MM Tris, 0.01 MM NaCl, 1% SDS,
2 mg mL)1 proteinase K, 0.01 PTB). The extraction and
the analysis of the bone specimens were conducted in a
different laboratory where no cetacean DNA had ever
been manipulated before, to avoid contamination. An
extraction including everything but tissue was carried
through all the analyses as a negative control.
Sex determination
Individuals whose gender was unknown were sexed by
amplifying portions of the genes ZFX and ZFY as
described in Berube & Palsbøll (1996).
Microsatellite analysis
Nine published microsatellite loci were analysed. Primers
KWM1b, KWM2a, KWM2b, KWM9b, KWM12a were
SCO
CEL
GAL
ECA
MAU
lbSA
WNA
ARG
lbPAsbP
SCO
CEL
GAL
ECA
MAU
lbSA
WNA
ARG
lbPAsbPA
Fig. 1 Map of sample locations. Abbrevia-
tions are as in Table 1.
Table 1 List of the populations analysed and correspondent
acronyms.
Population Acronym Microsatellite mtDNA
Galicia, Gulf of Biscay GAL 39 36
Celtic CEL 41 29
Scotland SCO 26 21
Eastern Central Atlantic ECA 13 14a
Western North Atlantic WNA 13 11
Mauritania MAU – 6
Argentina ARG 18 15
Short-beaked Pacific sbPA – 13b
Long-beaked Pacific lbPA – 11b
Long-beaked South Africa lbSA 43 20
The number of samples for each population considered in this article
are reported for the microsatellite and the mtDNA analyses. Data
taken from other publications are as follows: (a) four sequences from
Acores were from J. Matzen Silva, R. Norberto, J. Matos, D.
Mendonca, F. Simoes & J. Azevedo, unpublished data, (b) from
Rosel et al. (1994).
Common dolphin phylogeography 945
J . E V O L . B I O L . 1 9 ( 2 0 0 6 ) 9 4 3 – 9 5 4 ª 2 0 0 5 E U R O P E A N S O C I E T Y F O R E V O L U T I O N A R Y B I O L O G Y
derived from Orcinus orca (Hoelzel et al., 1998), EV37Mn
from Megaptera novaeangliae (Valsecchi & Amos, 1996),
TexVet5, TexVet7 and D08 from T. truncatus (Shinohara
et al., 1997; Rooney et al., 1999). Microsatellites were not
successfully amplified on the Mauritania samples, due to
the highly degraded status of the DNA extracted from these
samples and the relatively large size of most of the
microsatellite markers. Amplified DNA was analysed for
length variation on 6% polyacrylamide denaturing gels
using fluorescent imagining on an automated ABI PRISM
377 DNA sequencer, after incorporation of 1/10 fluores-
cent labelled primer (PCR reaction conditions: 100 lMM
dNTPs, 0.75–1.5 mMM MgCl2, 10 mMM Tris-HCl pH 8.4,
50 mMM KCl, 200 nMM of each primer, 0.02 U lL)1 Taq
polymerase. PCR cycling profile: 5 min at 95 �C; then 35
cycles of 40 s at 94 �C, 1 min at the T�ann, 1 min at 72 �C;
then 10 min at 72 �C). The annealing temperatures
(T�ann) were as follows: KWM1b: 48 �C; KWM2a:
48 �C; KWM2b: 44 �C; KWM9b: 62 �C; KWM12a: 56 �C;
EV37Mn: 52 �C; TexVet5: 49 �C; TexVet7: 49 �C; D08:
57 �C. An internal standard marker (Genescan-500 ROX,
Applied Biosystems, Warrington, UK) was used to deter-
mine the allele sizes.
For microsatellite loci, the level of polymorphism was
estimated as the number of alleles per locus, observed
heterozygosity (Ho), expected heterozygosity (He) and
allelic richness. Allelic richness controls for variation in
sample size by a rarefaction method, and was calculated
using the program FSTAT 2.9.3FSTAT 2.9.3 (Goudet, 2001). Evaluation
of possible deviations from the expected Hardy–Weinberg
(HW) equilibrium (overall deviation, heterozygote defi-
ciency and heterozygote excess) were performed using
Fisher’s exact test and the Markov chain method
(dememorization number, number of batches, iteration
per batch set at 1000, Bonferroni correction applied).
Genetic differentiation among populations was as-
sessed based on both the infinite allele model using FST,
and the stepwise mutation model using RhoST. The level
of differentiation between population pairs was estimated
as FST (Weir & Cockerham, 1984) using the program
ARLEQUIN 2.0ARLEQUIN 2.0 (Schneider et al., 1999) and RhoST using the
program RSTCALCRSTCALC (Goodman, 1997). The significance of
the difference of FST and RhoST values from zero was
tested by permutation analysis. A permutation test
to assess differentiation for allele size was performed for
FST and RhoST using the program SPAGEDISPAGEDI (Hardy &
Vekemans, 2002).
The most probable number of putative populations (K)
that best explains the pattern of genetic variability was
estimated using the program STRUCTURE 2.1STRUCTURE 2.1 (Pritchard
et al., 2000). We assumed the admixture model and
performed the analysis considering both the independent
and the correlated allele frequency model. Burn in length
and length of the simulation was set at 100 000 and
1 000 000 repetitions, respectively. To test the conver-
gence of the priors and the appropriateness of the chosen
burn in and simulation lengths, we ran a series of
independent runs for each value of K (for 1 £ K ‡ 7) as
suggested by Pritchard et al. (2000). We tested whether
any particular individual was an immigrant or had an
immigrant ancestor, by using the model with prior
population information, subdividing the individuals into
K populations, according to the results of the previous
analysis. We assumed v (migration rate) ¼ 0.05 and 0.1,
and testing for 0 £ number of generations (G) ‡ 2.
Sex-biased dispersal was tested using the program
FSTAT 2.9.3FSTAT 2.9.3 based on sex-specific expectations with
respect to FIS, FST and a likelihood assignment index
(see Goudet, 2001). Only adult individuals (a total of
187: 73 females and 114 males) were considered for this
analysis.
An asymmetric estimate of the migration rate (M ¼4Nem) between pairwise populations, based on micro-
satellite and mtDNA data, was calculated using
MIGRATEMIGRATE (Beerli, 1997–2002). The length of the runs
was optimized for both markers (acceptance–rejection
>2%, R < 1.2). Initial runs were set estimating h and M
with FST and allowing M to be asymmetric. Reruns were
set using the parameter estimated found with the first
run and lengthening the MCMC chains. In order to verify
the result a final run was set using longer chains. For
comparison the migration rate was also calculated
according to FST ¼ 1/(4Nm + 1).
mtDNA analysis
The first 369 bp at the 5¢ end of the mtDNA control
region were sequenced in a total of 148 samples, whereas
other sequences were obtained from the published
databases (Table 1). In total 176 sequences of Delphinus
sp. were available.
The mitochondrial DNA control region was amplified
either with universal primers MTCRf (5¢-TTC CCC GGT
GTA AAC C) and MTCRr (5¢-ATT TTC AGT GTC TTG CTT
T) after Hoelzel (1998), or with the primers 5¢-ACA CCA
GTC TTG TAA ACC-3¢ and 5¢ -TAC CAA ATG TAT GAA
ACC TCA G-3¢ after Rosel et al. (1994).
The PCR reaction conditions were as follows: 100 lMM
dNTPs, 1.5 mMM MgCl2, 10 mMM Tris-HCl pH 8.4, 50 mMM
KCl, 200 nMM of each primer, 0.02 U lL)1 Taq polymerase.
The PCR cycling profile was 4 min at 95 �C, 35 cycles of
45 s at 94 �C, 1.5 min at 50 �C, and 1.5 min at 72 �C,
followed by 8 min at 72 �C. PCR products were purified
with QIAgen PCR purification columns and sequenced
directly using the ABI dye-terminator method.
Mitochondrial DNA from the Mauritania samples was
amplified using two sets of primers designed in order to
amplify two overlapping portions of the control region of
approximately 200 bp each (Dmtcrf: 5¢-TTA GTC TCT
CCT TGT AAA T-3¢ and Dmtcrr: 5¢-GGT GAT TAA GCT
CGT GAT-3¢; Nichols, 2004. MTCRf and mtancr: 5¢-AAA
ATA AAT GAA TGC ACA ATA-3¢, designed by the
author). The PCR reaction conditions were as follows:
100 lMM dNTPs, 2.5 mMM MgCl2, 10 mMM Tris-HCl pH 8.4,
946 A. NATOLI ET AL.
J . E V O L . B I O L . 19 ( 2 0 0 6 ) 9 4 3 – 9 5 4 ª 2 0 0 5 E U R O P E A N S O C I E T Y F O R E V O L U T I O N A R Y B I O L O G Y
50 mMM KCl, 200 nMM of each primer, 0.4 lg lL)1 BSA,
0.02 U lL)1 Taq polymerase. The PCR cycling profile was
15 min at 95 �C, 45 cycles of 45 s at 94 �C, 1.5 min at
47 �C and 1.5 min at 72 �C, followed by 8 min at 72 �C.
Sequences were compared with 25 published se-
quences from two populations of common dolphins from
the Pacific Ocean described as short-beaked and long-
beaked form, respectively (Rosel et al., 1994). Another
four published sequences from Acores were also included
in the analysis (Matzen Silva et al., 2002).
Sequence alignment was performed using ClustalX
(Thompson et al., 1997). The degree of differentiation
(FST and UST) and Tajima’s D were estimated using
ARLEQUIN 2.0ARLEQUIN 2.0 (Schneider et al., 1999). Estimates of UST
used the Tamura-Nei genetic distance model (Tamura &
Nei, 1993).
Genetic distance (Da) was estimated using Tamura-Nei
with the SENDBSSENDBS programme, written by N. Takezaki
(National Institute of Genetics, Mishima, Shizuoka, Japan;
http://www.cib.nig.ac.jp/dda/ntakezak-j.html). SENDBSSENDBS was
also used to estimate p.
Individual haplotypes were compared by the Neigh-
bour-Joining method using PAUP* 4.0B10PAUP* 4.0B10 (Swofford,
1997) and rooted with homologous sequence from
Stenella attenuata. Majority-rule consensus trees were
constructed from 1000 bootstrap replications and a 50%
criterion for the retention of nodes was applied. Distances
were based on Tamura-Nei as above. The ti/tv ratio was
set at 6.5, based on observed values. A phylogenetic
reconstruction based on a Bayesian approach was also
implemented using the programme MRBAYES 3.0B4MRBAYES 3.0B4
(http://mrbayes.csit.fsu.edu/index.php). We used the
general time reversible rate model, with gamma distri-
buted rate variation across sites. The number of gener-
ations for the MCMC method was set to 500 000 and a
tree was saved every 100 generations. The consensus tree
was produced using PAUP* 4.0B10PAUP* 4.0B10 (Swofford, 1997)
retaining branches with 50% support or greater. A
median-joining network was generated to infer phylo-
genetic relationships among the mtDNA haplotypes using
the program NETWORK 4001NETWORK 4001 (Bandelt et al., 1999; http://
www.fluxus-engineering.comfluxe02.htm).
Results
Microsatellite analysis
Population differentiation
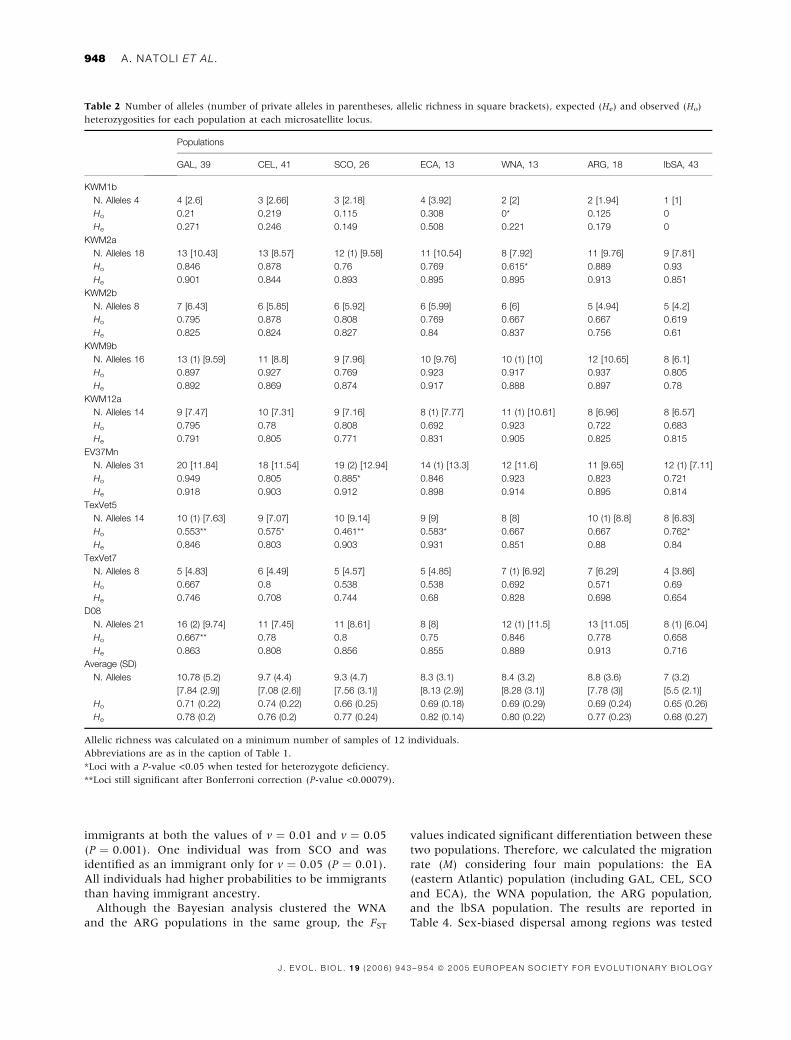
Expected (He) and observed (Ho) heterozygosities were
calculated for each population at each locus (Table 2).
Loci that significantly deviated from the HW equilibrium
were found in all populations with the exception of ARG.
In all cases deviation from HW equilibrium was due to
significant heterozygosity deficiency (P-values <0.05).
The locus TexVet5 significantly deviated from the HW
equilibrium in the largest number of populations.
Omission of this locus did not change the pattern of
differentiation among populations (FST and RHOST tests;
data not shown), so data are presented based on all loci.
The locus KWM1b was monomorphic in the lbSA
population. The lbSA population showed the lowest
average observed and expected heterozygosities and the
lowest allelic diversity. The other populations showed
similar values for both the average heterozygosities and
allelic diversity parameters.
Genetic differentiation among pairwise populations
was estimated using FST and RhoST (Table 3). The lbSA
population showed the highest differentiation compared
to all the other populations, with both FST and RhoST
analyses. The ARG population was also significantly
differentiated from all the other populations based on
FST. The eastern Atlantic populations (GAL, CEL, SCO
and ECA) clustered together showing low or no genetic
differentiation. The WNA population was significantly
differentiated from all populations except SCO for FST.
We tested the role of allele size in determining
population differentiation comparing FST and RhoST
values (after Hardy & Vekemans, 2002). This suggested
that allele size does not contribute to the differentiation
of the populations we analysed, and therefore FST should
be preferred to RhoST.
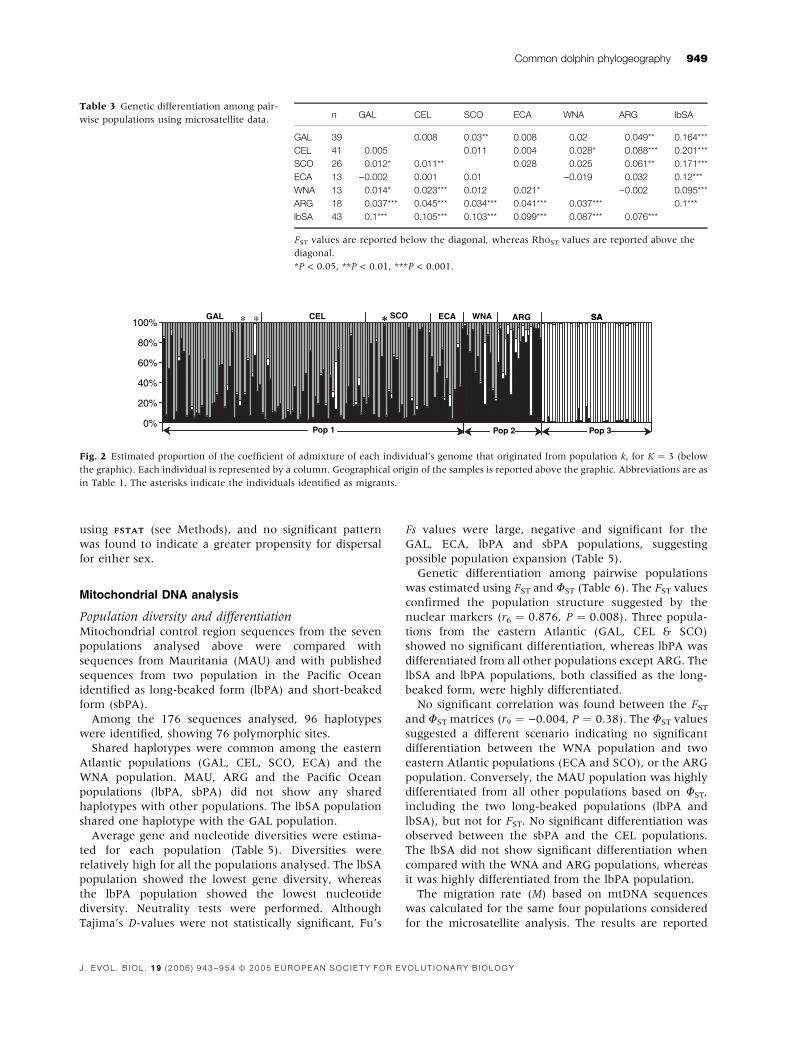
Bayesian analysis was used as an alternative approach
to test for population structure. The number of popula-
tions (K) that best explained the genetic variability
observed across our samples was found to be three (the
estimated ln probability of K for K ¼ 2 was )6497.2; for
K ¼ 3 was )6475.8; and for K ¼ 4 was )6587.1; posterior
probability of K ¼ 3 is 1.00). Given the lack of confor-
mation to HW expectations for one locus (TexVet5) in
several populations, we repeated the analysis omitting
this locus, and K ¼ 3 retained the highest likelihood
(K ¼ 2: )5704.7; K ¼ 3: )5699.7; K ¼ 4: )5899.7; pos-
terior probability of K ¼ 3 is 0.98). Consistency among
different runs was observed for the estimate of P(X/K)
and the prior a, indicating that the burn-in length and
the length of the runs were appropriate. The same result
was found using both correlated allele frequency and
independent allele frequency models. The Bayesian
analysis identified three main clusters of populations
(Fig. 2). The lbSA population highly differentiated from
all the others, a western Atlantic cluster (including WNA
and ARG), and an eastern Atlantic cluster (including
GAL, CEL, SCO, ECA).
Migrants and sex-biased dispersalWe analysed whether individuals were possible immi-
grants or descendants of recent immigrants considering
the three populations identified by the Bayesian analysis.
Three possible immigrant individuals were identified. All
individuals were migrants from the second cluster (WNA,
ARG) to the first cluster (GAL, CEL, SCO). Two individ-
uals were from GAL and they were identified as possible
Common dolphin phylogeography 947
J . E V O L . B I O L . 1 9 ( 2 0 0 6 ) 9 4 3 – 9 5 4 ª 2 0 0 5 E U R O P E A N S O C I E T Y F O R E V O L U T I O N A R Y B I O L O G Y
immigrants at both the values of v ¼ 0.01 and v ¼ 0.05
(P ¼ 0.001). One individual was from SCO and was
identified as an immigrant only for v ¼ 0.05 (P ¼ 0.01).
All individuals had higher probabilities to be immigrants
than having immigrant ancestry.
Although the Bayesian analysis clustered the WNA
and the ARG populations in the same group, the FST
values indicated significant differentiation between these
two populations. Therefore, we calculated the migration
rate (M) considering four main populations: the EA
(eastern Atlantic) population (including GAL, CEL, SCO
and ECA), the WNA population, the ARG population,
and the lbSA population. The results are reported in
Table 4. Sex-biased dispersal among regions was tested
Table 2 Number of alleles (number of private alleles in parentheses, allelic richness in square brackets), expected (He) and observed (Ho)
heterozygosities for each population at each microsatellite locus.
Populations
GAL, 39 CEL, 41 SCO, 26 ECA, 13 WNA, 13 ARG, 18 lbSA, 43
KWM1b
N. Alleles 4 4 [2.6] 3 [2.66] 3 [2.18] 4 [3.92] 2 [2] 2 [1.94] 1 [1]
Ho 0.21 0.219 0.115 0.308 0* 0.125 0
He 0.271 0.246 0.149 0.508 0.221 0.179 0
KWM2a
N. Alleles 18 13 [10.43] 13 [8.57] 12 (1) [9.58] 11 [10.54] 8 [7.92] 11 [9.76] 9 [7.81]
Ho 0.846 0.878 0.76 0.769 0.615* 0.889 0.93
He 0.901 0.844 0.893 0.895 0.895 0.913 0.851
KWM2b
N. Alleles 8 7 [6.43] 6 [5.85] 6 [5.92] 6 [5.99] 6 [6] 5 [4.94] 5 [4.2]
Ho 0.795 0.878 0.808 0.769 0.667 0.667 0.619
He 0.825 0.824 0.827 0.84 0.837 0.756 0.61
KWM9b
N. Alleles 16 13 (1) [9.59] 11 [8.8] 9 [7.96] 10 [9.76] 10 (1) [10] 12 [10.65] 8 [6.1]
Ho 0.897 0.927 0.769 0.923 0.917 0.937 0.805
He 0.892 0.869 0.874 0.917 0.888 0.897 0.78
KWM12a
N. Alleles 14 9 [7.47] 10 [7.31] 9 [7.16] 8 (1) [7.77] 11 (1) [10.61] 8 [6.96] 8 [6.57]
Ho 0.795 0.78 0.808 0.692 0.923 0.722 0.683
He 0.791 0.805 0.771 0.831 0.905 0.825 0.815
EV37Mn
N. Alleles 31 20 [11.84] 18 [11.54] 19 (2) [12.94] 14 (1) [13.3] 12 [11.6] 11 [9.65] 12 (1) [7.11]
Ho 0.949 0.805 0.885* 0.846 0.923 0.823 0.721
He 0.918 0.903 0.912 0.898 0.914 0.895 0.814
TexVet5
N. Alleles 14 10 (1) [7.63] 9 [7.07] 10 [9.14] 9 [9] 8 [8] 10 (1) [8.8] 8 [6.83]
Ho 0.553** 0.575* 0.461** 0.583* 0.667 0.667 0.762*
He 0.846 0.803 0.903 0.931 0.851 0.88 0.84
TexVet7
N. Alleles 8 5 [4.83] 6 [4.49] 5 [4.57] 5 [4.85] 7 (1) [6.92] 7 [6.29] 4 [3.86]
Ho 0.667 0.8 0.538 0.538 0.692 0.571 0.69
He 0.746 0.708 0.744 0.68 0.828 0.698 0.654
D08
N. Alleles 21 16 (2) [9.74] 11 [7.45] 11 [8.61] 8 [8] 12 (1) [11.5] 13 [11.05] 8 (1) [6.04]
Ho 0.667** 0.78 0.8 0.75 0.846 0.778 0.658
He 0.863 0.808 0.856 0.855 0.889 0.913 0.716
Average (SD)
N. Alleles 10.78 (5.2)
[7.84 (2.9)]
9.7 (4.4)
[7.08 (2.6)]
9.3 (4.7)
[7.56 (3.1)]
8.3 (3.1)
[8.13 (2.9)]
8.4 (3.2)
[8.28 (3.1)]
8.8 (3.6)
[7.78 (3)]
7 (3.2)
[5.5 (2.1)]
Ho 0.71 (0.22) 0.74 (0.22) 0.66 (0.25) 0.69 (0.18) 0.69 (0.29) 0.69 (0.24) 0.65 (0.26)
He 0.78 (0.2) 0.76 (0.2) 0.77 (0.24) 0.82 (0.14) 0.80 (0.22) 0.77 (0.23) 0.68 (0.27)
Allelic richness was calculated on a minimum number of samples of 12 individuals.
Abbreviations are as in the caption of Table 1.
*Loci with a P-value <0.05 when tested for heterozygote deficiency.
**Loci still significant after Bonferroni correction (P-value <0.00079).
948 A. NATOLI ET AL.
J . E V O L . B I O L . 19 ( 2 0 0 6 ) 9 4 3 – 9 5 4 ª 2 0 0 5 E U R O P E A N S O C I E T Y F O R E V O L U T I O N A R Y B I O L O G Y
using FSTATFSTAT (see Methods), and no significant pattern
was found to indicate a greater propensity for dispersal
for either sex.
Mitochondrial DNA analysis
Population diversity and differentiationMitochondrial control region sequences from the seven
populations analysed above were compared with
sequences from Mauritania (MAU) and with published
sequences from two population in the Pacific Ocean
identified as long-beaked form (lbPA) and short-beaked
form (sbPA).
Among the 176 sequences analysed, 96 haplotypes
were identified, showing 76 polymorphic sites.
Shared haplotypes were common among the eastern
Atlantic populations (GAL, CEL, SCO, ECA) and the
WNA population. MAU, ARG and the Pacific Ocean
populations (lbPA, sbPA) did not show any shared
haplotypes with other populations. The lbSA population
shared one haplotype with the GAL population.
Average gene and nucleotide diversities were estima-
ted for each population (Table 5). Diversities were
relatively high for all the populations analysed. The lbSA
population showed the lowest gene diversity, whereas
the lbPA population showed the lowest nucleotide
diversity. Neutrality tests were performed. Although
Tajima’s D-values were not statistically significant, Fu’s
Fs values were large, negative and significant for the
GAL, ECA, lbPA and sbPA populations, suggesting
possible population expansion (Table 5).
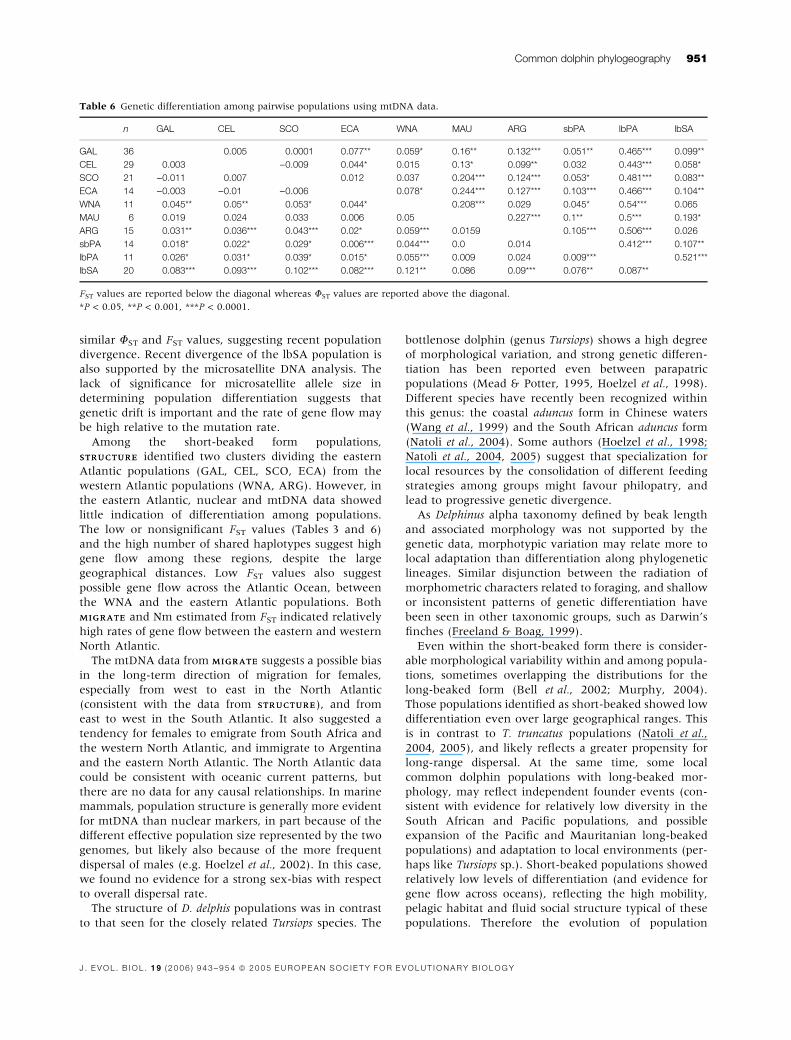
Genetic differentiation among pairwise populations
was estimated using FST and UST (Table 6). The FST values
confirmed the population structure suggested by the
nuclear markers (r6 ¼ 0.876, P ¼ 0.008). Three popula-
tions from the eastern Atlantic (GAL, CEL & SCO)
showed no significant differentiation, whereas lbPA was
differentiated from all other populations except ARG. The
lbSA and lbPA populations, both classified as the long-
beaked form, were highly differentiated.
No significant correlation was found between the FST
and UST matrices (r9 ¼ )0.004, P ¼ 0.38). The UST values
suggested a different scenario indicating no significant
differentiation between the WNA population and two
eastern Atlantic populations (ECA and SCO), or the ARG
population. Conversely, the MAU population was highly
differentiated from all other populations based on UST,
including the two long-beaked populations (lbPA and
lbSA), but not for FST. No significant differentiation was
observed between the sbPA and the CEL populations.
The lbSA did not show significant differentiation when
compared with the WNA and ARG populations, whereas
it was highly differentiated from the lbPA population.
The migration rate (M) based on mtDNA sequences
was calculated for the same four populations considered
for the microsatellite analysis. The results are reported
Table 3 Genetic differentiation among pair-
wise populations using microsatellite data.n GAL CEL SCO ECA WNA ARG lbSA
GAL 39 0.008 0.03** 0.008 0.02 0.049** 0.164***
CEL 41 0.005 0.011 0.004 0.028* 0.088*** 0.201***
SCO 26 0.012* 0.011** 0.028 0.025 0.061** 0.171***
ECA 13 )0.002 0.001 0.01 )0.019 0.032 0.12***
WNA 13 0.014* 0.023*** 0.012 0.021* )0.002 0.095***
ARG 18 0.037*** 0.045*** 0.034*** 0.041*** 0.037*** 0.1***
lbSA 43 0.1*** 0.105*** 0.103*** 0.099*** 0.087*** 0.076***
FST values are reported below the diagonal, whereas RhoST values are reported above the
diagonal.
*P < 0.05, **P < 0.01, ***P < 0.001.
0%
20%
40%
60%
80%
100%GAL CEL SCO ECA WNA ARG SA* * *
Pop 1 Pop 2 Pop 3
SA*
Fig. 2 Estimated proportion of the coefficient of admixture of each individual’s genome that originated from population k, for K ¼ 3 (below
the graphic). Each individual is represented by a column. Geographical origin of the samples is reported above the graphic. Abbreviations are as
in Table 1. The asterisks indicate the individuals identified as migrants.
Common dolphin phylogeography 949
J . E V O L . B I O L . 1 9 ( 2 0 0 6 ) 9 4 3 – 9 5 4 ª 2 0 0 5 E U R O P E A N S O C I E T Y F O R E V O L U T I O N A R Y B I O L O G Y
in Table 4. Estimates using mtDNA suggest some direc-
tional bias in dispersal, especially between WNA and
EA, and between ARG and SA. Our theta estimates
from MIGRATEMIGRATE ranged from 0.012 to 0.155 for the
mtDNA data. Simulation studies showed that theta of
0.025 gave good estimates of migration rates under
similar conditions (see Table 3 in Abdo et al. 2004).
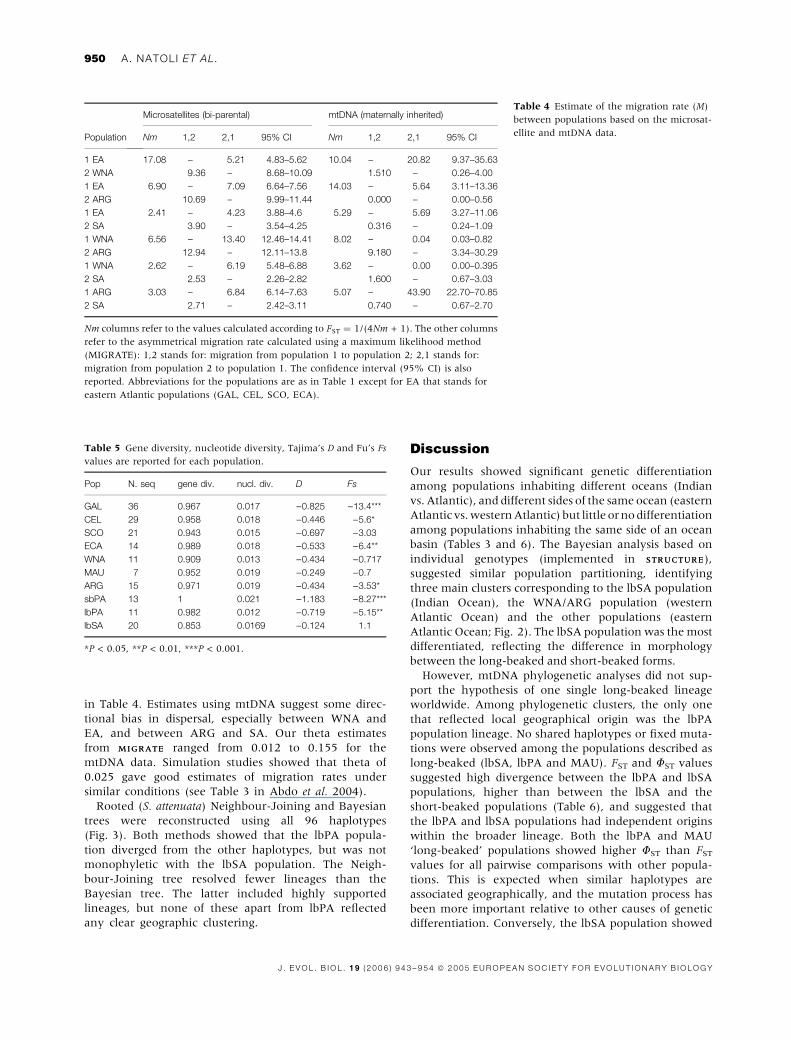
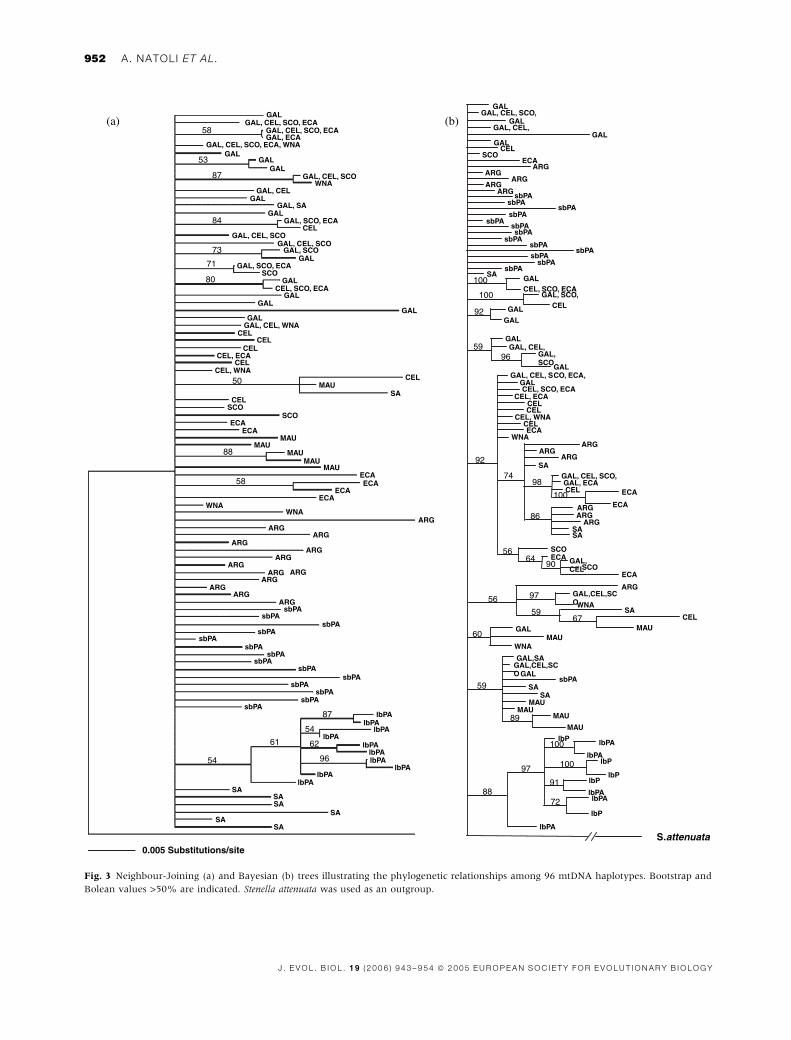
Rooted (S. attenuata) Neighbour-Joining and Bayesian
trees were reconstructed using all 96 haplotypes
(Fig. 3). Both methods showed that the lbPA popula-
tion diverged from the other haplotypes, but was not
monophyletic with the lbSA population. The Neigh-
bour-Joining tree resolved fewer lineages than the
Bayesian tree. The latter included highly supported
lineages, but none of these apart from lbPA reflected
any clear geographic clustering.
Discussion
Our results showed significant genetic differentiation
among populations inhabiting different oceans (Indian
vs. Atlantic), and different sides of the same ocean (eastern
Atlantic vs. western Atlantic) but little or no differentiation
among populations inhabiting the same side of an ocean
basin (Tables 3 and 6). The Bayesian analysis based on
individual genotypes (implemented in STRUCTURESTRUCTURE),
suggested similar population partitioning, identifying
three main clusters corresponding to the lbSA population
(Indian Ocean), the WNA/ARG population (western
Atlantic Ocean) and the other populations (eastern
Atlantic Ocean; Fig. 2). The lbSA population was the most
differentiated, reflecting the difference in morphology
between the long-beaked and short-beaked forms.
However, mtDNA phylogenetic analyses did not sup-
port the hypothesis of one single long-beaked lineage
worldwide. Among phylogenetic clusters, the only one
that reflected local geographical origin was the lbPA
population lineage. No shared haplotypes or fixed muta-
tions were observed among the populations described as
long-beaked (lbSA, lbPA and MAU). FST and UST values
suggested high divergence between the lbPA and lbSA
populations, higher than between the lbSA and the
short-beaked populations (Table 6), and suggested that
the lbPA and lbSA populations had independent origins
within the broader lineage. Both the lbPA and MAU
‘long-beaked’ populations showed higher UST than FST
values for all pairwise comparisons with other popula-
tions. This is expected when similar haplotypes are
associated geographically, and the mutation process has
been more important relative to other causes of genetic
differentiation. Conversely, the lbSA population showed
Table 4 Estimate of the migration rate (M)
between populations based on the microsat-
ellite and mtDNA data.Population
Microsatellites (bi-parental) mtDNA (maternally inherited)
Nm 1,2 2,1 95% CI Nm 1,2 2,1 95% CI
1 EA 17.08 – 5.21 4.83–5.62 10.04 – 20.82 9.37–35.63
2 WNA 9.36 – 8.68–10.09 1.510 – 0.26–4.00
1 EA 6.90 – 7.09 6.64–7.56 14.03 – 5.64 3.11–13.36
2 ARG 10.69 – 9.99–11.44 0.000 – 0.00–0.56
1 EA 2.41 – 4.23 3.88–4.6 5.29 – 5.69 3.27–11.06
2 SA 3.90 – 3.54–4.25 0.316 – 0.24–1.09
1 WNA 6.56 – 13.40 12.46–14.41 8.02 – 0.04 0.03–0.82
2 ARG 12.94 – 12.11–13.8 9.180 – 3.34–30.29
1 WNA 2.62 – 6.19 5.48–6.88 3.62 – 0.00 0.00–0.395
2 SA 2.53 – 2.26–2.82 1.600 – 0.67–3.03
1 ARG 3.03 – 6.84 6.14–7.63 5.07 – 43.90 22.70–70.85
2 SA 2.71 – 2.42–3.11 0.740 – 0.67–2.70
Nm columns refer to the values calculated according to FST ¼ 1/(4Nm + 1). The other columns
refer to the asymmetrical migration rate calculated using a maximum likelihood method
(MIGRATE): 1,2 stands for: migration from population 1 to population 2; 2,1 stands for:
migration from population 2 to population 1. The confidence interval (95% CI) is also
reported. Abbreviations for the populations are as in Table 1 except for EA that stands for
eastern Atlantic populations (GAL, CEL, SCO, ECA).
Table 5 Gene diversity, nucleotide diversity, Tajima’s D and Fu’s Fs
values are reported for each population.
Pop N. seq gene div. nucl. div. D Fs
GAL 36 0.967 0.017 )0.825 )13.4***
CEL 29 0.958 0.018 )0.446 )5.6*
SCO 21 0.943 0.015 )0.697 )3.03
ECA 14 0.989 0.018 )0.533 )6.4**
WNA 11 0.909 0.013 )0.434 )0.717
MAU 7 0.952 0.019 )0.249 )0.7
ARG 15 0.971 0.019 )0.434 )3.53*
sbPA 13 1 0.021 )1.183 )8.27***
lbPA 11 0.982 0.012 )0.719 )5.15**
lbSA 20 0.853 0.0169 )0.124 1.1
*P < 0.05, **P < 0.01, ***P < 0.001.
950 A. NATOLI ET AL.
J . E V O L . B I O L . 19 ( 2 0 0 6 ) 9 4 3 – 9 5 4 ª 2 0 0 5 E U R O P E A N S O C I E T Y F O R E V O L U T I O N A R Y B I O L O G Y
similar UST and FST values, suggesting recent population
divergence. Recent divergence of the lbSA population is
also supported by the microsatellite DNA analysis. The
lack of significance for microsatellite allele size in
determining population differentiation suggests that
genetic drift is important and the rate of gene flow may
be high relative to the mutation rate.
Among the short-beaked form populations,
STRUCTURESTRUCTURE identified two clusters dividing the eastern
Atlantic populations (GAL, CEL, SCO, ECA) from the
western Atlantic populations (WNA, ARG). However, in
the eastern Atlantic, nuclear and mtDNA data showed
little indication of differentiation among populations.
The low or nonsignificant FST values (Tables 3 and 6)
and the high number of shared haplotypes suggest high
gene flow among these regions, despite the large
geographical distances. Low FST values also suggest
possible gene flow across the Atlantic Ocean, between
the WNA and the eastern Atlantic populations. Both
MIGRATEMIGRATE and Nm estimated from FST indicated relatively
high rates of gene flow between the eastern and western
North Atlantic.
The mtDNA data from MIGRATEMIGRATE suggests a possible bias
in the long-term direction of migration for females,
especially from west to east in the North Atlantic
(consistent with the data from STRUCTURESTRUCTURE), and from
east to west in the South Atlantic. It also suggested a
tendency for females to emigrate from South Africa and
the western North Atlantic, and immigrate to Argentina
and the eastern North Atlantic. The North Atlantic data
could be consistent with oceanic current patterns, but
there are no data for any causal relationships. In marine
mammals, population structure is generally more evident
for mtDNA than nuclear markers, in part because of the
different effective population size represented by the two
genomes, but likely also because of the more frequent
dispersal of males (e.g. Hoelzel et al., 2002). In this case,
we found no evidence for a strong sex-bias with respect
to overall dispersal rate.
The structure of D. delphis populations was in contrast
to that seen for the closely related Tursiops species. The
bottlenose dolphin (genus Tursiops) shows a high degree
of morphological variation, and strong genetic differen-
tiation has been reported even between parapatric
populations (Mead & Potter, 1995, Hoelzel et al., 1998).
Different species have recently been recognized within
this genus: the coastal aduncus form in Chinese waters
(Wang et al., 1999) and the South African aduncus form
(Natoli et al., 2004). Some authors (Hoelzel et al., 1998;
Natoli et al., 2004, 2005) suggest that specialization for
local resources by the consolidation of different feeding
strategies among groups might favour philopatry, and
lead to progressive genetic divergence.
As Delphinus alpha taxonomy defined by beak length
and associated morphology was not supported by the
genetic data, morphotypic variation may relate more to
local adaptation than differentiation along phylogenetic
lineages. Similar disjunction between the radiation of
morphometric characters related to foraging, and shallow
or inconsistent patterns of genetic differentiation have
been seen in other taxonomic groups, such as Darwin’s
finches (Freeland & Boag, 1999).
Even within the short-beaked form there is consider-
able morphological variability within and among popula-
tions, sometimes overlapping the distributions for the
long-beaked form (Bell et al., 2002; Murphy, 2004).
Those populations identified as short-beaked showed low
differentiation even over large geographical ranges. This
is in contrast to T. truncatus populations (Natoli et al.,
2004, 2005), and likely reflects a greater propensity for
long-range dispersal. At the same time, some local
common dolphin populations with long-beaked mor-
phology, may reflect independent founder events (con-
sistent with evidence for relatively low diversity in the
South African and Pacific populations, and possible
expansion of the Pacific and Mauritanian long-beaked
populations) and adaptation to local environments (per-
haps like Tursiops sp.). Short-beaked populations showed
relatively low levels of differentiation (and evidence for
gene flow across oceans), reflecting the high mobility,
pelagic habitat and fluid social structure typical of these
populations. Therefore the evolution of population
Table 6 Genetic differentiation among pairwise populations using mtDNA data.
n GAL CEL SCO ECA WNA MAU ARG sbPA lbPA lbSA
GAL 36 0.005 0.0001 0.077** 0.059* 0.16** 0.132*** 0.051** 0.465*** 0.099**
CEL 29 0.003 )0.009 0.044* 0.015 0.13* 0.099** 0.032 0.443*** 0.058*
SCO 21 )0.011 0.007 0.012 0.037 0.204*** 0.124*** 0.053* 0.481*** 0.083**
ECA 14 )0.003 )0.01 )0.006 0.078* 0.244*** 0.127*** 0.103*** 0.466*** 0.104**
WNA 11 0.045** 0.05** 0.053* 0.044* 0.208*** 0.029 0.045* 0.54*** 0.065
MAU 6 0.019 0.024 0.033 0.006 0.05 0.227*** 0.1** 0.5*** 0.193*
ARG 15 0.031** 0.036*** 0.043*** 0.02* 0.059*** 0.0159 0.105*** 0.506*** 0.026
sbPA 14 0.018* 0.022* 0.029* 0.006*** 0.044*** 0.0 0.014 0.412*** 0.107**
lbPA 11 0.026* 0.031* 0.039* 0.015* 0.055*** 0.009 0.024 0.009*** 0.521***
lbSA 20 0.083*** 0.093*** 0.102*** 0.082*** 0.121** 0.086 0.09*** 0.076** 0.087**
FST values are reported below the diagonal whereas UST values are reported above the diagonal.
*P < 0.05, **P < 0.001, ***P < 0.0001.
Common dolphin phylogeography 951
J . E V O L . B I O L . 1 9 ( 2 0 0 6 ) 9 4 3 – 9 5 4 ª 2 0 0 5 E U R O P E A N S O C I E T Y F O R E V O L U T I O N A R Y B I O L O G Y
S.attenuata
GALGAL, CEL, SCO,
GALGAL, CEL,
GALGAL
CELSCO
ECAARG
ARGARG
ARGARG
sbPAsbPA
sbPAsbPA
sbPAsbPAsbPA
sbPAsbPA
sbPAsbPA
sbPAsbPA
SA
GAL, SCO, CELGAL
GAL
GALCEL, SCO, ECA
GAL, CEL, SCO, ECA, GALCEL, SCO, ECA
CELCEL, ECA
CELCEL, WNA
CELECA
WNAARG
ARGARG
SAGAL, CEL, SCO, GAL, ECACEL ECA
ECAARGARG
ARGSASA
SCOECA GAL,
CELSCOECA
lbPA
lbP lbPA
lbPAlbP
lbPlbP
lbPAlbPA
lbP
SACEL
MAU
ARGGAL,CEL,SCOWNA
GALGAL, CEL,
GAL, SCO
GAL
GAL,SAGAL,CEL,SCO GAL
MAUMAU
sbPASA
SA
MAU
MAU
GALMAU
WNA
100
100
92
5996
92
7498
100
86
5664
90
56 97
5967
60
59
89
88
97
91
72
100
100
(a) (b)58
53
87
84
73
71
80
50
88
58
54
61
87
54
62
96
GAL, CEL, SCO, ECAGAL, CEL, SCO, ECAGAL, ECA
GAL, CEL, SCO, ECA, WNA
GAL
GALGAL
GALGAL, CEL, SCO
WNAGAL, CEL
GALGAL, SA
GALGAL, SCO, ECA
CELGAL, CEL, SCO
GAL, CEL, SCOGAL, SCO
GALGAL, SCO, ECA
SCOGAL
CEL, SCO, ECAGAL
GALGAL
GALGAL, CEL, WNA
CELCEL
CELCEL, ECA
CELCEL, WNA
CELMAU
SACEL
SCOSCO
ECAECA
MAUMAU
MAUMAU
MAUECAECA
ECAECA
WNAWNA
ARGARG
ARGARG
ARGARG
ARGARG
ARGARG
ARGARG
ARGsbPA
sbPAsbPA
sbPAsbPA
sbPAsbPA
sbPAsbPA
sbPAsbPA
sbPAsbPA
sbPAlbPA
lbPAlbPA
lbPAlbPA
lbPAlbPA
lbPASA
SASA
SASA
0.005 Substitutions/site
SA
lbPA
lbPA
Fig. 3 Neighbour-Joining (a) and Bayesian (b) trees illustrating the phylogenetic relationships among 96 mtDNA haplotypes. Bootstrap and
Bolean values >50% are indicated. Stenella attenuata was used as an outgroup.
952 A. NATOLI ET AL.
J . E V O L . B I O L . 19 ( 2 0 0 6 ) 9 4 3 – 9 5 4 ª 2 0 0 5 E U R O P E A N S O C I E T Y F O R E V O L U T I O N A R Y B I O L O G Y
structure and eventual speciation in these taxa may be
based on local founding events and subsequent adapta-
tion of some coastal populations, originating from relat-
ively panmictic oceanic populations.
If selection for beak length and related characters is
determining morphology in coastal dolphin populations
(both the long-beaked Delphinus and Tursiops forms
inhabit nearshore waters), then this may be related to
prey capture in that environment. Beak length tends to
be longer in dolphin species that live in relatively
shallow, turbid environments (most extreme in the river
dolphin species), but we know of no data directly
demonstrating this relationship. By this scenario the
morphological similarity of long-beaked forms in differ-
ent parts of the world would be an example of
convergence. Convergence almost certainly explains
the morphotypic similarity between the genetically
highly differentiated ‘aduncus-type’ bottlenose dolphins
off Asia and South Africa (Natoli et al., 2004), and
numerous examples of convergence based on feeding
morphology have been proposed for marine fish in the
family Labridae (Westneat et al., 2005). Further studies
should be undertaken to investigate this possibility,
together with studies including other polytypic delphi-
nid species (e.g. Stenella sp. see Perrin et al., 1981) to test
the hypothesis that habitat choice is an important
mechanisms leading to population structure and speci-
ation in these mobile marine animals.
Acknowledgments
Special thanks to everyone who kindly provided
samples: Marina Sequeira, Alfredo Lopez, Emer Rogan,
Nick Tregenza, Bob Reid, Rui Prieto, Claude Joiris,
Krishna Das, Angel Guerra, Vidal Martın, Luis Freitas,
Enrique Crespo. Thanks to David Goldstein, Nicole
Soranzo, Ian Barnes (UCL, University College London)
for their logistical support. Thanks to the director &
staff of the Natal Sharks Board for their support in
collecting the South African samples. Thanks to the
Spanish Ministry of Environment for their financial
contribution. Special thanks to the University of
Milano scholarship and Marion Zunz Award to Ada
Natoli, the CNR (Centro Nazionale Ricerche – Italy)
grants to Ada Natoli and the University of Durham for
their financial contribution.
References
Abdo, Z., Crandall, K.A. & Joyce, P. 2004. Evaluating the
performance of likelihood methods for detecting population
structure and migration. Mol. Ecol. 13: 837–851.
Bandelt, H.-J., Foster, P. & Rohl, A. 1999. Median joining
networks for inferring intraspecific phylogenies. Mol. Biol. Evol.
16: 37–48.
Barnes, L.G. 1976. Outline of eastern North Pacific cetacean
assemblages. Syst. Zool. 25: 321–343.
Beerli, P. 1997–2002. MIGRATEMIGRATE: Documentation and Program,
Part of LAMARC. Version 1.5. Revised August 7, 2002. http://
popgen.csit.fsu.edu
Bell, C.H., Kemper, C.M. & Conran, J.G. 2002. Common
dolphins Delphinus delphis in southern Australia: a morpho-
metric study. Aust. Mammal. 24: 1–10.
Berube, M. & Palsbøll, P. 1996. Identification of sex in cetaceans
by multiplexing with three ZFX and ZFY specific primers. Mol.
Ecol. 5: 283–287.
Foote, M. 1997. The evolution of morphological diversity. Ann.
Rev. Ecol. Syst. 28: 129–152.
Freeland, J.R. & Boag, P.T. 1999. Phylogenetics of Darwin’s
finches: paraphyly in the tree-finches, and two divergent
lineages in the warbler finch. Auk 116: 577–588.
Goodman, S.J. 1997. RSTCALCRSTCALC: a collection of computer pro-
grams for calculation estimates of genetics differentiations
from microsatellite data and determining their significance.
Mol. Ecol. 6: 881–885.
Goudet, J. 2001. FSTATFSTAT, a Program to Estimate and Test Gene
Diversities and Fixation Indices (version 2.9.3). Available from
http://www2.unil.ch/popgen/softwares/fstat.htm
Hardy, O.J. & Vekemans, X. 2002. SPAGEDISPAGEDI: a versatile computer
program to analyse spatial genetic structure at the individual
or population levels. Mol. Ecol. Notes 2: 618–620.
Hershkovitz, P. 1966. A catalogue of living whales. Bull. US Nat.
Mus. 246: 1–259.
Heyning, J.E. & Perrin, W.F. 1994. Evidence for two species of
common dolphins (genus Delphinus) from the eastern North
Pacific. Contrib. Sci. 442: 1–35.
Hoelzel, A.R. 1998. Molecular Analysis of Populations: A Practical
Approach. Oxford University Press, Oxford.
Hoelzel, A.R., Dahleim, M. & Stern, S.J. 1998. Low genetic
variation among killer whales (Orcinus orca) in the Eastern
North Pacific and genetic differentiation between foraging
specialists. J. Hered. 89: 121–128.
Hoelzel, A.R., Goldsworthy, S.D. & Fleischer, R.C. 2002.
Population genetics. In: Marine Mammal Biology: An Evolu-
tionary Approach. (A. R. Hoelzel, ed.), pp. 325–352. Blackwell
Science, Oxford.
Jefferson, T.A. & van Waerebeek, K. 2002. The taxonomic status
of the nominal dolphin species delphinus tropicalis van Bree,
1971. Mar. Mam. Sci. 18: 787–818.
LeDuc, R.G., Perrin, W.F. & Dizon, A.E. 1999. Phylogenetic
relationships among the delphinid cetaceans based on full
cytocrome b sequences. Mar. Mam. Sci. 15: 619–648.
Matzen Silva, J., Norberto, R., Matos, J., Mendonca, D., Simoes
F. & Azevedo, J., 2002. Mitochondrial DNA analysis of common
dolphins (Delphinus delphis) from the Acores Islands. Biotechnol-
ogy, INETI, Estrada do Paco do Lumirar, 22, Lisbon 1649-038
Lisboa, Portugal.
Mead, J.G. & Potter, C.W. 1995. Recognizing two populations of
the bottlenose dolphin (Tursiops truncatus) off the Atlantic
coast of North America: morphologic and ecology considera-
tions. IBI Rep. 5:31–44.
Murphy, S. 2004. The Biology and Ecology of the Common Dolphin
(Delphinus delphis) in the North-east Atlantic. PhD Thesis,
University College of Cork, Ireland.
Natoli, A., Peddemors, V.M. & Hoelzel, A.R. 2004. Population
structure and speciation in the genus Tursiops based on
microsatellite and mitochondrial DNA analyses. J. Evol. Biol.
17: 363–375.
Common dolphin phylogeography 953
J . E V O L . B I O L . 1 9 ( 2 0 0 6 ) 9 4 3 – 9 5 4 ª 2 0 0 5 E U R O P E A N S O C I E T Y F O R E V O L U T I O N A R Y B I O L O G Y
Natoli A., Birkun A., Aguilar A., Lopez A. & Hoelzel A.R. 2005.
Habitat structure and the dispersal of male and female
bottlenose dolphins (Tursiops truncatus). Proc. R. Soc. B 272:
1217–1226.
Nichols, C. 2004. Population Genetics of Bottlenose Dolphins (Tursiops
truncatus) from an Anglo-Saxon Archaeological Site in Comparison
with Modern Populations. MPhil Thesis, University of Durham,
UK.
Patterson, C., Williams, D.M. & Humphries, C.J. 1993. Con-
gruence between molecular and morphological phylogenies.
Ann. Rev. Ecol. Syst. 24: 153–188.
Perrin, W.F., Mitchell, E.D., Mead, J.G., Caldwell, D.K. &
Vanbree, P.J.H. 1981. Stenella-clymene, a rediscovered tropical
dolphin of the Atlantic. J. Mammal. 62: 583–598.
Perrin, W.F. 2002. Common dolphins. In: Encyclopedia of Marine
Mammals (W. F., Perrin, B., Wursig & J. G. M., Thewissen,
eds), pp. 245–248. Academic Press, San Diego.
Pritchard, J.K., Stephen, M. & Donnelly, P. 2000. Inference of
population structure using multilocus genotype data. Genetics
155: 945–959.
Rice, D.W. 1998. Marine Mammals of the World; Systematics and
Distribution. Special Publication No. 4. Society for Marine
Mammalogy, Allen Press, Lawrence, KS, USA.
Rocha-Olivares, A., Fleeger, J.W. & Foltz, D.W. 2001. Decou-
pling of molecular and morphological evolution in deep
lineages of a meiobenthic harpacticoid copepod. Mol. Biol.
Evol. 18: 1088–1102.
Rooney, A.P., Merritt, D.B. & Derr, J.N. 1999. Microsatellite
diversity in captive bottlenose dolphins (Tursiops truncatus).
J. Hered. 90: 228–231.
Roopnarine, P.D. 2003. Analysis of rates of morphologic evolu-
tion. Ann. Rev. Ecol. Syst. 34: 605–632.
Rosel, P.E., Dizon, A.E. & Heyning, J.E. 1994. Genetic analysis of
sympatric morphotypes of common dolphins (genus Delphinus).
Mar. Biol. 119: 159–167.
Schneider, S., Roessli, D. & Excoffier, L. 1999. Estimation of past
demographic parameters from the distribution of pairwise
differences when the mutation rates vary among sites: applica-
tion to human mitochondrial DNA. Genetics 152: 1079–1089.
Shinohara, M., Domingo-Roura, X. & Takenaka, O. 1997.
Microsatellite in the bottlenose dolphin Tursiops truncatus.
Mol. Ecol. 6: 695–696.
Swofford, D.L. 1997. PAUP*PAUP* (Phylogenetic Analysis Using Parsi-
mony), version 4.0b10. Smithsonian Institution, Washington
DC, USA.
Tamura, K. & Nei, M. 1993. Estimation of the number of
nucleotide substitutions in the control region of mitochondrial
DNA in humans and chimpanzees. Mol. Biol. Evol. 10: 512–
526.
Thompson, J.D., Gibson, T.J., Plewniak, F., Jeanmougin, F. &
Higgins, D.G. 1997. The ClustalX windows interface: flexible
strategies for multiple sequence alignment aided by quality
analysis tools. Nucleic Acids Research 24: 4876–4882.
Valsecchi, E. & Amos, B. 1996. Microsatellite markers for the
study of cetacean populations. Mol. Ecol. 5: 151–156.
Van Bree, P.J.H. 1971. Delphinus tropicalis, a new name for
Delphinus longirostris G. Cuvier, 1829. Mammalia 35: 345–346.
Wang, J.Y., Chou, L-S. & White, B.N. 1999. Mitochondrial
DNA analysis of sympatric morphotypes of bottlenose
dolphins (genus: Tursiops) in Chinese waters. Mol. Ecol. 8:
1603–1612.
Weir, B.S. & Cockerham, C.C. 1984. Estimating F-statistics for
the analysis of population structure. Evolution 38: 1358–
1370.
Westneat, M.W., Alfaro, M.E., Wainwright, P.C., Bellwood,
D.R., Grubich, J.R., Fessler, J.L., Clements, K.D. & Smith, L.L.
2005. Local phylogenetic divergence and global evolutionary
convergence of skull function in reef fishes of the family
Labridae. Proc. Royal Soc. B 272: 993–1000.
Received 29 June 2005; revised 15 September 2005; accepted 19
September 2005
954 A. NATOLI ET AL.
J . E V O L . B I O L . 19 ( 2 0 0 6 ) 9 4 3 – 9 5 4 ª 2 0 0 5 E U R O P E A N S O C I E T Y F O R E V O L U T I O N A R Y B I O L O G Y