photographic observations of the hayabusa re-entry
TRANSCRIPT

arX
iv:1
108.
6006
v1 [
astr
o-ph
.EP]
30
Aug
201
1
Photographic and Radiometric Observations of the
Hayabusa Re-entry
Jirı Borovicka
Astronomical Institute of the Academy of Sciences, Fricova 298, CZ-25165 Ondrejov Observatory,
Czech Republic
Shinsuke Abe
Institute of Astronomy, National Central University, 300 Jhongda Road, Jhongli, Taoyuan, 32001,
Taiwan
Lukas Shrbeny
Astronomical Institute of the Academy of Sciences, Fricova 298, CZ-25165 Ondrejov Observatory,
Czech Republic
Pavel Spurny
Astronomical Institute of the Academy of Sciences, Fricova 298, CZ-25165 Ondrejov Observatory,
Czech Republic
Philip A. Bland
IARC, Department of Earth Science and Engineering, Imperial College London, London SW7 2AZ,
UK
(Received 2011 May 26; accepted 2011 July 19)
Abstract
We analyzed photographic observations of the re-entry of the Hayabusa spacecraft
and capsule over Southern Australia on June 13, 2010, 13:52 UT. Radiometric mea-
surements of the brightness of the associated fireball were obtained as well. We derived
the trajectories and velocities of the spacecraft, its four fragments and the capsule.
The capsule trajectory was within a few hundred meters of the trajectory predicted by
JAXA prior the re-entry. The spacecraft trajectory was about 1 km higher than the
capsule trajectory. Two major fragments separated from the spacecraft at a height
of about 62 km with mutual lateral velocity of 250 m/s. The maximum absolute
magnitude of the fireball of −12.6 was reached at a height of 67 km. The dynamic
pressures acting on the spacecraft at the fragmentation points were only 1 – 50 kPa.
No spacecraft fragment was seen to survive below the height of 47 km. The integral
luminous efficiency of the event was 1.3%. As expected, the capsule had a very low
luminous efficiency and very low ablation coefficient. The ablation coefficients and
1

masses of the major spacecraft fragments are discussed.
Key words: Meteors, meteoroids — space vehicles — astrometry
1. Introduction
We present results of photographic observation of the Hayabusa reentry from two tempo-
rary stations and two stations of the Desert Fireball Network located in Southwestern Australia.
All cameras used wide field (fish-eye) lenses and captured the artificial fireball produced by the
reentry of Hayabusa on single sheets of films. The Desert Network observatories are also
equipped with all-sky radiometers measuring the fireball luminosity. Standard astrometric and
photometric procedures could be used to obtain the trajectory, velocity and brightness of the
fireball. However, most of the spacecraft fragments were not resolved. Only a few widely
separated and bright enough fragments could be tracked individually.
2. Observation and data reduction
Two temporary stations were set up in the desert of South Australia by a ground ob-
servation team of the Japan Aerospace Exploration Agency (JAXA) (Fujita et al. 2011) to
observe the re-entry. They were located to the north and to the south of the expected tra-
jectory, respectively. Among other instruments, the stations were equipped by photographic
cameras MAMIYA 6×7 carrying the fish-eye lens f =17 mm, f/4 (GOS3) and f =24 mm f/2.8
(GOS4) and using Fujifilm color 400 ASA. The northern station Coober Pedy, designed GOS4
and operated by Y. Kakinami and Y. Shiba, was equipped with a rotating shutter placed in
front of the camera lens and producing 10 breaks per second for measuring the fireball velocity.
The southern station Tarcoola, GOS3, was operated by S. Abe. At both stations the cameras
were tilted from zenith toward the fireball trajectory (by 33◦ and 45◦, respectively).
The Desert Fireball Network (DFN) is located in the Nullarbor Plain in Western
Australia and consists of four Autonomous Fireball Observatories (Bland et al. 2010). The
purpose of the network is to observe natural fireballs and possible meteorite falls. The obser-
vatories are equipped with Zeiss Distagon 3.5/30 mm fish-eye lenses, producing 8-cm-diameter
all-sky images on Ilford FP 125 black-and-white films. A rotating shutter is located inside of
the cameras and produces 15 breaks per second. The radiometers based on photomultipliers
measure the total brightness of the sky 500 times per second.
Despite the relatively large range to the Hayabusa trajectory (400–600 km), all four
stations of the DFN captured at least part of the fireball. In this paper, we use data from the
two closest stations, DFO2, Forrest, and DFO4, Mundrabilla. The positions of the observing
stations are shown in Fig. 1 and listed in Table 1.
Figure 2 shows the photograph from station GOS4; Fig. 3 from station DFO2. The
2

Fig. 1. The positions of observing stations GOS3, GOS4, DFO2, and DFO4 on the map of southern
Australia. The photographed part of Hayabusa trajectory is shown as well. The ground projection of the
photographed trajectory is 365 km long.
Fig. 2. Hayabusa re-entry as photographed from station GOS4. The exposure was 27 minutes long, from
13:37:00 to 14:04:00 UT. The fireball flew from left to right and was interrupted be the rotating shutter
10 times per second. The closest horizon lies upwards. The fragments mentioned in the text are identified
in the insets.
3

Fig. 3. All-sky image from DFO2 camera showing the Hayabusa re-entry fireball above the ENE
horizon (top) and enlargement of the fireball (bottom). The fireball flew from left to right. The
exposure was 11 hours 55 minutes long (9:30 – 21:25 UT). Shutter breaks (15 per second) are
visible on original records along most of the image. The fireball ends only 3.2◦ above horizon.
4

Table 1. Coordinates of the observing stations
Station Longitude Latitude Altitude
deg deg km
GOS3 134.55858 −30.69911 0.152
GOS4 134.71819 −29.03392 0.224
DFO2 128.11506 −30.85808 0.161
DFO4 127.84869 −31.83564 0.085
original photographs were scanned on photogrammetric scanner Vexcel Ultrascan 5000 and
measured manually with our computer program Fishscan. The method of Borovicka et al.
(1995) was used for positional reduction of fish-eye images. Photometry was done by measuring
the image darkening with Fishscan in comparison with star trails (see Spurny et al. 2007 for
discussion of the method).
The GOS images resolved the re-entry capsule from the spacecraft (see Fig. 2). The
spacecraft split into three fragments. Two of them (designed B and C) were bright but short-
lived. The fragment A was the most durable. Later, other fragments (Aa, Ab, Ac) separated
from the A trajectory. However, Aa and Ab were visible only on the GOS4 image. On the other
hand, GOS3 showed Ac to split in three trails at a later stage but this splitting was not visible
in GOS4. In summary, the trajectories of six objects observed from at least two stations (the
capsule, the spacecraft before fragmentation, and fragments A, B, C, and Ac) were determined
independently. The trajectory of each object was computed by the least squares method of
Borovicka (1990). The method, in its ususal form, assumes the fireball trajectory to be a
straight line and computes it by minimizing the distances between the trajectory and the lines
of sight. However, the straight line assumption is not valid for long nearly horizontal fireballs,
which was the case of Hayabusa, in particular the spacecraft, the capsule and fragment A.
Trajectory curvature caused by Earth gravity was significant. We therefore used a modification
of the method assuming that the trajectory is a circular arc lying in the vertical plane. For
the capsule, even this approximation proved insufficient and we had to split the trajectory into
several parts and compute them separately. All computations were performed in the inertial
coordinate system with the origin at the center of Earth. In this system, the coordinates of the
observing stations varied with time due to Earth rotation. Photographic data do not provide
absolute timing because of long exposures. Only relative time from counting of shutter breaks
is available. However, the radiometers provided the fireball light curve as a function of absolute
time. By adjusting the photographic and radiometric light curves, we were able to obtain the
absolute timing of shutter breaks with the precision of about 0.1 second. This method was,
nevertheless, available only for the spacecraft. The capsule was on an independent trajectory
and no separate radiometric light curve for the capsule exists.
5
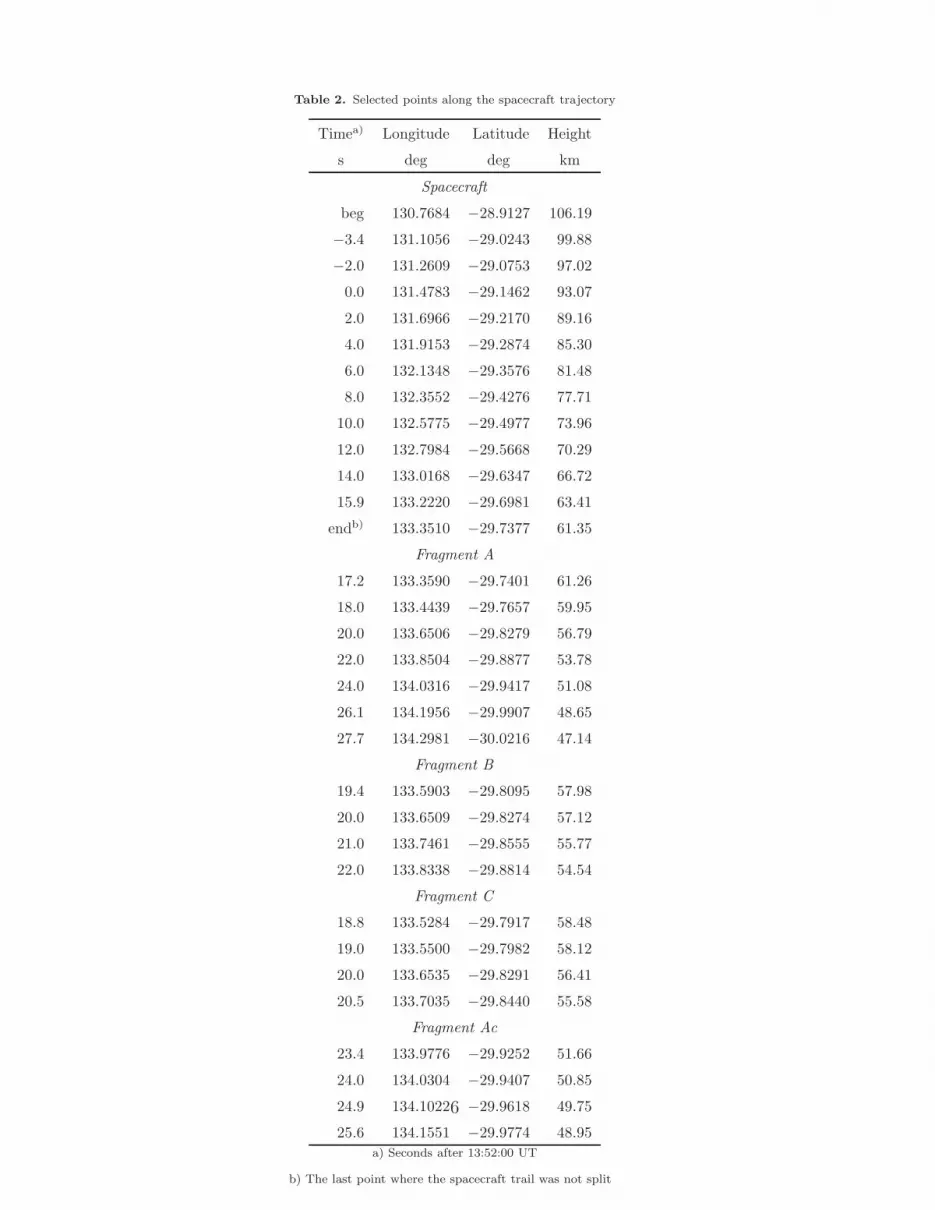
Table 2. Selected points along the spacecraft trajectory
Timea) Longitude Latitude Height
s deg deg km
Spacecraft
beg 130.7684 −28.9127 106.19
−3.4 131.1056 −29.0243 99.88
−2.0 131.2609 −29.0753 97.02
0.0 131.4783 −29.1462 93.07
2.0 131.6966 −29.2170 89.16
4.0 131.9153 −29.2874 85.30
6.0 132.1348 −29.3576 81.48
8.0 132.3552 −29.4276 77.71
10.0 132.5775 −29.4977 73.96
12.0 132.7984 −29.5668 70.29
14.0 133.0168 −29.6347 66.72
15.9 133.2220 −29.6981 63.41
endb) 133.3510 −29.7377 61.35
Fragment A
17.2 133.3590 −29.7401 61.26
18.0 133.4439 −29.7657 59.95
20.0 133.6506 −29.8279 56.79
22.0 133.8504 −29.8877 53.78
24.0 134.0316 −29.9417 51.08
26.1 134.1956 −29.9907 48.65
27.7 134.2981 −30.0216 47.14
Fragment B
19.4 133.5903 −29.8095 57.98
20.0 133.6509 −29.8274 57.12
21.0 133.7461 −29.8555 55.77
22.0 133.8338 −29.8814 54.54
Fragment C
18.8 133.5284 −29.7917 58.48
19.0 133.5500 −29.7982 58.12
20.0 133.6535 −29.8291 56.41
20.5 133.7035 −29.8440 55.58
Fragment Ac
23.4 133.9776 −29.9252 51.66
24.0 134.0304 −29.9407 50.85
24.9 134.1022 −29.9618 49.75
25.6 134.1551 −29.9774 48.95
a) Seconds after 13:52:00 UT
b) The last point where the spacecraft trail was not split
6

Table 3. Selected points along the capsule trajectory
Timea) Longitude Latitude Height
s deg deg km
beg 132.9673 −29.6209 66.47
16.0 133.0768 −29.6545 64.71
19.0 133.4016 −29.7532 59.60
22.0 133.7122 −29.8466 54.81
25.0 134.0014 −29.9328 50.43
28.0 134.2593 −30.0092 46.58
32.0 134.5429 −30.0921 42.39
34.8 134.6962 −30.1367 40.09
endb) (134.7368) (−30.1486) (39.47)
a) Relative time
b) Coordinates are less relaible because of uncertain timing
3. Results
3.1. Trajectory
Table 2 gives the resulting coordinates of selected points measured along the trajectories
of the Hayabusa spacecraft and its fragments. Table 3 gives the analogous data for the re-
entry capsule. In the latter case the timing is only relative. The estimated precision of our
coordinates is 100 meters.
We compared our results with the trajectory of the capsule predicted by JAXA just
before the re-entry (Fujita et al. 2011). Both our computation and the JAXA prediction
were performed in the WGS 84 coordinate system. Figure 4 shows the difference between
the observed and predicted latitude (expressed in km, i.e. as the deviation in the North-South
direction) as a function of longitude. Similarly, Fig. 5 shows the difference between the observed
and predicted height above the surface. In the N-S direction, both the spacecraft, its fragments
and the capsule remained within 250 meters of the predicted trajectory in the observed parts
of the trajectories. After the spacecraft fragmentation, all observed fragments turned a little
bit to the north. Such an asymmetry may be due to spacecraft rotation. As for the height, the
spacecraft moved about 1 km higher than the capsule and the capsule was about 300 meters
lower than predicted. After the spacecraft fragmentation, fragment B turned up while fragment
C turned down. This geometrical separation, together with their high brightness, made both
fragments easily resolvable in our data. The divergence angle between fragments B and C was
1.2 ± 0.3 degrees, corresponding to their mutual velocity of separation of 250 ± 60 m/s. The
source of the lateral velocity may be a momentum gained during the explosion or differences
in the lift coefficients of various spacecraft components. Fragments A and Ac followed more
7

Fig. 4. Deviation of the observed latitude of the spacecraft, its fragments and the capsule from the JAXA
prediction for the capsule as a function of observed longitude. The error of trajectory determination is
about 0.1 km. Note that fragment A was in fact a whole swarm of fragments not resolved in photographic
data.
closely the original direction of the spacecraft. Video data published on the JAXA digital
archive (Osaka Science Museum/National Central University/GOTO Inc./JAXA)1 show that,
in fact, large number of fragments was present in this region; most of them remained unresolved
in our photographs.
3.2. Velocity
Figure 6 shows the observed velocities as a function of height. In order to smooth the
velocity profile, running averages computed from 9 consecutive shutter breaks were plotted,
with the step of 3 shutter breaks. The velocity relative to the Earth’s center is given (the
velocity relative to the surface was about 0.37 km/s lower because of Earth’s rotation). The
initial velocity of the spacecraft was 12.04 km/s. This value was computed as the average
velocity between the heights 95 and 75 km, i.e. in the interval where the data were good and
the deceleration was negligible. Below 75 km the deceleration started to be noticeable.
The capsule was a much fainter object and started to be visible on the photographs at
the height of 66.5 km, when the deceleration was already in progress. The velocity data at the
1 http://jda.jaxa.jp
8

Fig. 5. Deviation of the observed height of the spacecraft, its fragments and the capsule from the JAXA
prediction for the capsule as a function of observed longitude. The error of trajectory determination is
about 0.1 km.
beginning are rather uncertain. The first good data point is at the height of 63 km, where the
velocity was 11.75 km/s. The deceleration was then smooth and closely followed the JAXA
prediction, although the velocity was systematically higher by about 0.1 km/s than predicted
over the whole observed arc down the height of 40 km. The last measured velocity was 5.63
km/s at the height of 40.4 km.
The last piece of fragment A ceased to be visible on our photographs at the height of 47
km; its velocity at that time was about 7 km/s. The bright fragments B and C disappeared at
heights around 55 km. Fragment B decelerated much more than fragment C.
The trajectory and initial velocity of the spacecraft were used for computation of geo-
centric and heliocentric orbits of Hayabusa at the moment of re-entry. The data are given in
Table 4.
3.3. Brightness
We performed photometric measurements at stations DFO2 and DFO4, where the in-
dividual fragments and the capsule were not resolved and total brightness of the fireball was
therefore measured, and at station GOS3, where the fragments were measured individually.
The fragment measurement was, however, possible only after the fragments became well sep-
9
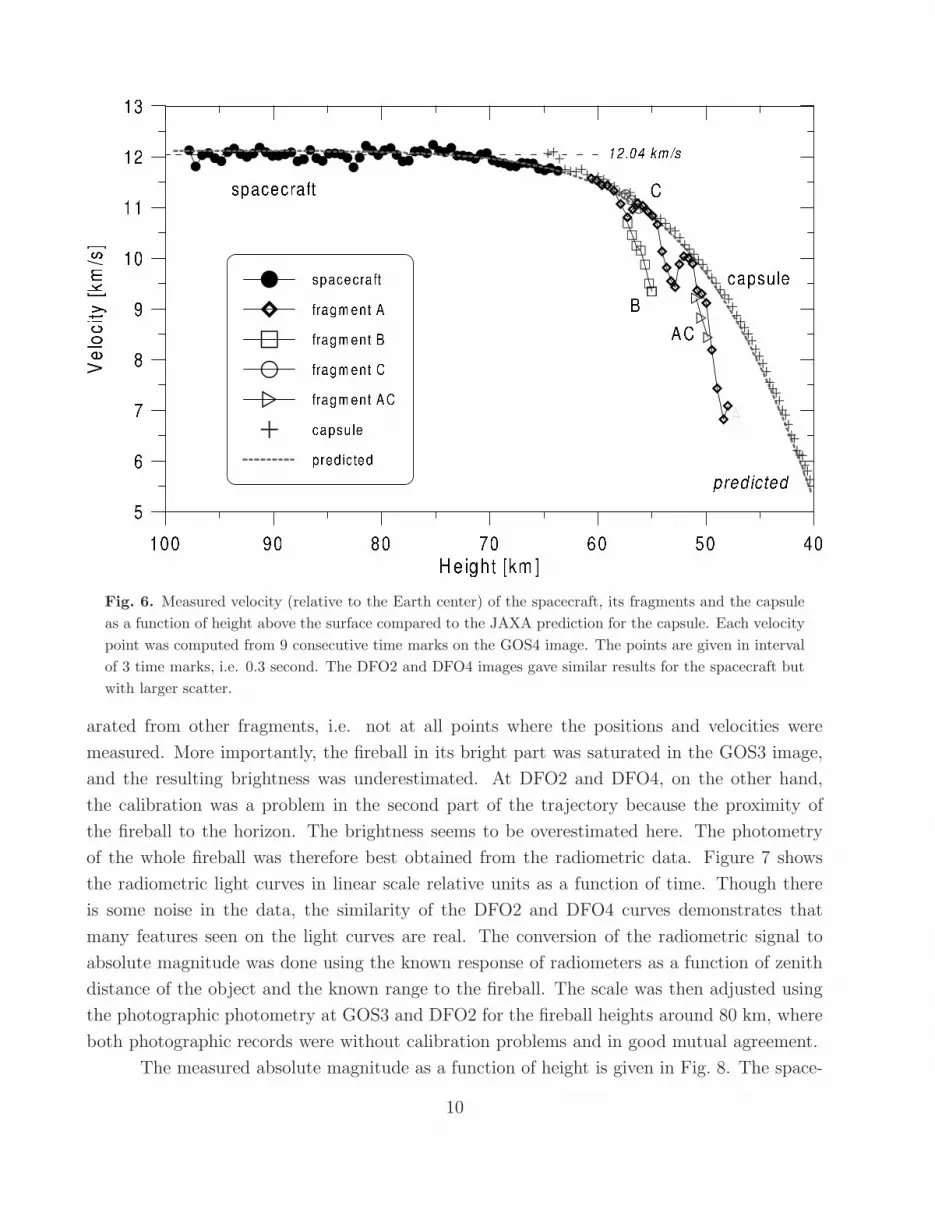
Fig. 6. Measured velocity (relative to the Earth center) of the spacecraft, its fragments and the capsule
as a function of height above the surface compared to the JAXA prediction for the capsule. Each velocity
point was computed from 9 consecutive time marks on the GOS4 image. The points are given in interval
of 3 time marks, i.e. 0.3 second. The DFO2 and DFO4 images gave similar results for the spacecraft but
with larger scatter.
arated from other fragments, i.e. not at all points where the positions and velocities were
measured. More importantly, the fireball in its bright part was saturated in the GOS3 image,
and the resulting brightness was underestimated. At DFO2 and DFO4, on the other hand,
the calibration was a problem in the second part of the trajectory because the proximity of
the fireball to the horizon. The brightness seems to be overestimated here. The photometry
of the whole fireball was therefore best obtained from the radiometric data. Figure 7 shows
the radiometric light curves in linear scale relative units as a function of time. Though there
is some noise in the data, the similarity of the DFO2 and DFO4 curves demonstrates that
many features seen on the light curves are real. The conversion of the radiometric signal to
absolute magnitude was done using the known response of radiometers as a function of zenith
distance of the object and the known range to the fireball. The scale was then adjusted using
the photographic photometry at GOS3 and DFO2 for the fireball heights around 80 km, where
both photographic records were without calibration problems and in good mutual agreement.
The measured absolute magnitude as a function of height is given in Fig. 8. The space-
10

Table 4. Geocentric and heliocentric orbits of the spacecraft at the beginning of re-entry
Geocentric orbit
Eccentricity 1.32
Inclination 34.52◦
Right ascension of the ascending node 7.58◦
Pericenter distance 6310 km
Longitude of pericenter 255.58◦
Heliocentric orbit (J2000.0)
Semimajor axis 1.278 AU
Perihelion distance 0.9824 AU
Eccentricity 0.231
Inclination 1.59◦
Argument of perihelion 145.63◦
Longitude of the ascending node 82.360◦
craft was first observed at a height of about 100 km, where it was of magnitude −2. The
brightness then gradually increased, with two minor peaks at 85.1 and 77.5 km, until the broad
maximum which started at 68.5 km. The maximal magnitude of −12.6 was reached at a height
of 66.9 km. The fireball brightness then fluctuated but remained high until the final peak at
56.7 km. During this period, the spacecraft disintegrated. After that, the brightness rapidly
decreased.
Table 5 lists the positions of the most pronounced peaks on the light curve. Each
peak likely corresponds to a fragmentation event. Our photographs do not show geometrically
separated fragments above the height of 61.5 km but the major release of small fragments must
have occurred at the main flare at 66.9 km. The trajectories (see Fig. 5) suggest that the major
fragments A and B separated most likely at the flare at 62.8 km. The brightness of fragments B
and C could be first measured at heights around 57 km, where both of them were of magnitude
about −9. Fragment B then weakened while fragment C remained bright until its end.
The brightness of the capsule was measured on the GOS3 image. The light curve was
smooth with a broad maximum of −3.5 mag between heights 55–50 km. The measurements at
larger heights are sparse and have large error because the proximity of the capsule trail to the
bright spacecraft.
From the predicted apparent magnitudes of the capsule at different stations (Fujita et
al. 2011), it can be inferred that the predicted absolute (100 km distance) brightness of the
capsule was −5.5 mag at a height of 50 km. The actual brightness was by 2 magnitudes (factor
of 6) lower. The expected brightness of the spacecraft was not published.
11

Fig. 7. Radiometric light curves of the Hayabusa fireball recorded on the DFO2 (upper black curve) and
DFO4 (lower gray curve) stations.
Table 5. Positions of local maxima on fireball light curve
Time Height Mag Velocity Dyn. pressure
s km km/s kPa
4.1 85.1 −6.6 12.05 1.1
8.1 77.5 −9.3 12.05 3.6
12.9 68.5 −12.3 11.9 13
13.9 66.9 −12.6 11.85 16
16.2 62.8 −11.3 11.65 27
17.1 61.3 −11.8 11.6 32
19.8 56.7 −10.8 11.1 54
12

Fig. 8. Absolute magnitude of the spacecraft, its fragments and the capsule as measured on the GOS3
photograph as a function of height and the total brightness of the fireball as measured on DFO2 pho-
tograph and DFO2 radiometer. Formal error bars are given for GOS3. Note that the brightness near
maximum is underestimated on the GOS3 image because of saturation and the brightness toward fire-
ball end is overestimated on DFO2 image because of uncertain calibration corrections near the horizon.
4. Discussion
Our data confirm that the capsule re-entry trajectory predicted by JAXA was correct
within few hundreds of meters. It is in agreement with the expected accuracy of the prediction,
which was estimated to 500×200 m (2σ) at a height of 50 km. The expected error in velocity, 30
m/s (3σ), seems to have been underestimated, since the observed deviation was 100 m/s. The
spacecraft followed almost the same trajectory as the capsule, the most significant difference
being that the spacecraft was about one kilometer higher at a given longitude.
To our knowledge, our observation provided the first wide-field, multi-station photo-
graphic data for a re-entering object with good independent telemetry available. Similar ob-
servation of the Stardust re-entry used different techniques (Desai and Qualls 2010). Our
work provided an excellent validation of astrometric and reduction procedures used in fireball
networks for determination of trajectories and velocities of natural fireballs.
The Hayabusa re-entry can be compared with the entries of natural meteoroids in several
13

aspects: luminous efficiency, dynamic pressure acting at the moment of fragmentation, and
apparent ablation coefficient.
The integral luminous efficiency is defined as the ratio of the total radiated energy to the
initial kinetic energy of the object. Using the radiometric light curve (Fig. 8) and taking into
account that zero magnitude meteor radiates about 1500 W at all wavelengths to all directions
(Ceplecha et al. 1998), the total radiative output of the Hayabusa fireball was determined to
3.6× 10⁸ J. Using the mass of the spacecraft of about 400 kg and the velocity, relative to
the atmosphere, of 11.7 km/s, the luminous efficiency was found to be 1.3%. Note that the
used conversion from magnitudes to watts is valid for plasma temperature 4500 K. The actual
temperatures inferred from Hayabusa spectroscopy were in the range 4500 – 6000 K (Abe et al.
2011). For 6000 K the radiative output and the luminous efficiency would be about 25% lower.
For natural fireballs, the luminous efficiency is a poorly known parameter, which depends
on meteoroid velocity, mass, and structure. The empirical formula of Brown et al. (2002), based
on more energetic events, predicts 4% for the Hayabusa energy. On the other hand, the formula
of Pecina & Ceplecha (1983), valid for relatively small meteoroids, gives only 0.5%. ReVelle &
Ceplecha (2001) gave the average luminous efficiency for type I fireballs 5.57% and for more
fragile type II fireballs 1.35%. We can therefore say that the luminous efficiency of Hayabusa
was in the range expected for natural fireballs of similar parameters.
The total radiative output of the capsule was only 2.8× 10⁵ J. The capsule lost only
small part from its initial mass of about 20 kg during the re-entry, but it decelerated from
11.7 km/s to just few km/s during the ablation phase, so it deposited about 109J into the
atmosphere. Only about 0.03% of this energy was radiated out. The low luminous efficiency
was due to the special material used for the ablation shield. The spectroscopy revealed that the
capsule spectrum was dominated at visible wavelengths by black body radiation of the capsule
surface (Abe et al. 2011). Without ablation products, no large radiating plasma envelope,
which normally provides most luminosity of fireballs, developed around the capsule.
The dynamic pressure p = ρv2, where ρ is atmospheric density and v is velocity, acts
on objects moving in the atmosphere. If the dynamic pressure exceeds the material strength,
fragmentation occurs. Fragmentation is often accompanied by a flare on the light curve. The
last column of Table 5 lists the dynamic pressures at the flares during the Hayabusa re-entry.
The pressures are quite low and comparable only to the most fragile natural meteoroids of
cometary origin (Borovicka 2006). This is not surprising because the spacecraft was not a
compact solid body but in fact a quite porous object. Nevertheless, it may be surprising that
no piece survived below 47 km.
Finally, the dynamics (deceleration) of fireballs can be fitted using the classical meteor
equations (Ceplecha et al. 1998). The most interesting parameters of the fit are the ablation
coefficient, σ, and the combination Km−1/3 = ΓAδ−2/3m−1/3, where Γ is the drag coefficient
and A, δ, and m are meteoroid shape coefficient, bulk density, and mass, respectively. The
14

dynamic mass of the meteoroid can therefore be determined if we know or assume Γ, A, and δ.
The typical ablation coefficient of natural fireballs varies from 0.014 s2/km2 for not-so-
much fragmenting type I fireballs to about 0.2 s2/km2 for the most fragile type IIIB fireballs
(Ceplecha et al. 1998). We fitted the dynamics of the capsule and spacecraft fragments B
and C. For the capsule, we obtained σ = 0.0014± 0.001 s2/km2, a very low value, which is,
nevertheless, understandable for a specially designed re-entry object. For fragment B, we got
σ = 0.07± 0.02 s2/km2 and for fragment C extremely high σ = 1.1± 0.1 s2/km2.
The resulting Km−1/3 for the capsule can be separated, for example, into the following
reasonable values: ΓA = 0.7, δ = 0.63 g/cm3 and m = 21 kg (almost constant mass). For
fragments B and C we have no idea about their shape and density. They may in fact represent
clouds of small fragments. Formally, we assumed ΓA= 1.0 and δ = 2 g/cm3 for both B and C.
Then the mass of B was 0.12 kg at the height of 58 km. Such mass, however, cannot explain the
observed high luminosity. Either there were more fragments or the density was about 10 times
lower and mass 100 times higher. For C, we obtained 12 kg at 58.5 km, which can provide the
observed luminosity at that point. However, the computed mass was rapidly decreasing toward
the lower heights while the luminosity remained high. This discrepancy can be explained if the
object was continuously flattened by the ablation, i.e. the shape coefficient was changing.
Acknowledgements. We thank JAXA team members who organized and participated in the
recovery operations, especially Kazuhisa Fujita (JAXA) who is the chief coordinator of the
ground-based observation, Yoshihiro Kakinami (Hokkaido University), Yasuo Shiba (Nippon
Meteor Society), Masaharu Suzuki (GOTO INC.), and other members who assisted in observing
at GOS3 and GOS4 stations. The work on the Czech side was supported by GACR grants no.
205/08/0411 and P209/11/1382. SA was supported by the JAXA and the National Science
Council of Taiwan (NSC 97-2112-M-008-014-MY3). PAB would like to thank the Science
and Technology Facilities Council. This work was supported under grants ST/F003072/1 and
ST/H002464/1. We thank the referee, P. Brown, for useful comments, which helped us to
improve the paper.
References
Abe, S., Fujita, K., Kikinami, Y. et al. 2011, PASJ, this Volume
Bland, P.A., Spurny, P., Shrbeny, L. et al. 2010, Meteorit. Planet. Sci. 45, A16 (abstract #5209)
Borovicka, J. 1990, Bull. Astron. Instit. Czechoslovakia 41, 391
Borovicka, J. 2006, in Asteroids, Comets, Meteors, eds. D. Lazzaro, S. Ferraz-Mello, J.A. Fernandez
(Cambridge Univ. Press.), IAU Symp. 229, p. 249
Borovicka, J., Spurny, P., Keclıkova, J. 1995, A&AS 112, 173
Brown, P., Spalding, R.E., ReVelle, D.O., Tagliaferri, E., Worden, S.P. 2002, Nature 420, 294
Ceplecha, Z., Borovicka, J., Elford, W.G. et al. 1998, Space Sci. Rev. 84, 327
15

Desai, P.N., and Qualls, G.D. 2010, J. Spacecraft & Rockets 47, 736
Fujita, K., Yamamoto, M., Abe, S. et al. 2011, PASJ, this Volume
Pecina, P., Ceplecha, Z. 1983, Bull. Astron. Instit. Czechoslovakia 34, 102
ReVelle, D.O., Ceplecha, Z. 2001, in Proc. Meteoroids 2001 Conf., ed. B. Warmbein, ESA-SP 495, p.
507
Spurny, P., Borovicka, J., Shrbeny, L. 2007, in Near Earth Objects, our Celestial Neighbors:
Opportunity and Risk, eds. A. Milani, G. B. Valsecchi and D. Vokrouhlicky (Cambridge Univ.
Press.), IAU Symp. 236, p. 121
16