photographic but not line-drawn faces show early perceptual neural sensitivity to eye gaze direction
TRANSCRIPT

ORIGINAL RESEARCHpublished: 10 April 2015
doi: 10.3389/fnhum.2015.00185
Photographic but not line-drawnfaces show early perceptual neuralsensitivity to eye gaze directionAlejandra Rossi 1,2*†, Francisco J. Parada 2,3,4†, Marianne Latinus 3,5 and Aina Puce 1,2,3
1 Cognitive Science Program, Indiana University, Bloomington, IN, USA, 2 Program in Neuroscience, Indiana University,Bloomington, IN, USA, 3 Department of Psychological and Brain Sciences, Indiana University, Bloomington, IN, USA,4 Department of Psychiatry, Harvard Medical School, Boston, MA, USA, 5 Institut de Neurosciences de la Timone, UMR7289,CNRS, Aix-Marseille Université, Marseille, France
Edited by:Davide Rivolta,
University of East London, UK
Reviewed by:Christine Parsons,
University of Oxford, UKJohn Towler,
Birkbeck, University of London, UK
*Correspondence:Alejandra Rossi,
Cognitive Science Program, IndianaUniversity, 1900 East Tenth St.,Bloomington, IN 47405, [email protected]
†These authors have contributedequally to this work.
Received: 29 April 2014Accepted: 19 March 2015Published: 10 April 2015
Citation:Rossi A, Parada FJ, Latinus M and
Puce A (2015) Photographic but notline-drawn faces show early
perceptual neural sensitivity to eyegaze direction.
Front. Hum. Neurosci. 9:185.doi: 10.3389/fnhum.2015.00185
Our brains readily decode facial movements and changes in social attention, reflectedin earlier and larger N170 event-related potentials (ERPs) to viewing gaze aversionsvs. direct gaze in real faces (Puce et al., 2000). In contrast, gaze aversions in line-drawn faces do not produce these N170 differences (Rossi et al., 2014), suggestingthat physical stimulus properties or experimental context may drive these effects. Herewe investigated the role of stimulus-induced context on neurophysiological responses todynamic gaze. Sixteen healthy adults viewed line-drawn and real faces, with dynamiceye aversion and direct gaze transitions, and control stimuli (scrambled arrays andcheckerboards) while continuous electroencephalographic (EEG) activity was recorded.EEG data from 2 temporo-occipital clusters of 9 electrodes in each hemisphere whereN170 activity is known to be maximal were selected for analysis. N170 peak amplitudeand latency, and temporal dynamics from Event-Related Spectral Perturbations (ERSPs)were measured in 16 healthy subjects. Real faces generated larger N170s for avertedvs. direct gaze motion, however, N170s to real and direct gaze were as large asthose to respective controls. N170 amplitude did not differ across line-drawn gazechanges. Overall, bilateral mean gamma power changes for faces relative to controlstimuli occurred between 150–350 ms, potentially reflecting signal detection of facialmotion. Our data indicate that experimental context does not drive N170 differences toviewed gaze changes. Low-level stimulus properties, such as the high sclera/iris contrastchange in real eyes likely drive the N170 changes to viewed aversive movements.
Keywords: N170 ERP, real faces, line-drawn faces, gaze aversion, apparent motion
Introduction
Successful social behavior requires evaluating incoming sensory information and mergingit with situationally relevant behavioral responses. Though a part of our social life may relyon purely reflexive behaviors, specialized neural activity is needed in evaluating social cues(Stanley and Adolphs, 2013). Over the past two decades social neuroscience, the study ofsocial and cognitive influences on biological processes (Cacioppo, 1994; Cacioppo et al., 2000;Ochsner and Lieberman, 2001), has aimed to generate a brain-based understanding of socialbehaviors. An individual’s social cognitive understanding of the world is likely to not becontext-invariant, however, the effects of task and experimental context on social cognition areseldom studied. In the case of social attention, in daily life a gaze change will occur in the context of
Frontiers in Human Neuroscience | www.frontiersin.org 1 March 2015 | Volume 9 | Article 185

Rossi et al. ERPs to changing gaze
directed emotions and actions from not only one’s self, butfrom others around us. This social environment, with manymultisensory cues and continually changing context, is difficultto reproduce in a controlled laboratory setting. However, evenin a controlled laboratory setting, experimental context canpotentially modulate neural responses to particular stimulusconditions or tasks, and may underlie some of the differencesobserved between studies in the literature. In a laboratorysetting, experimental context can be created within a trial, acrosstrials or conditions, or across experimental sessions. Contexteffects could potentially be driven by the characteristics ofthe stimuli (bottom-up), or by task demands/instructions tosubjects (top-down).
One particularly striking experimental context effect has beenreported to viewing faces. It has long been known that theN170 event-related potential (ERP) is strongly driven by thephysical or structural characteristics of a face stimulus (Bentinet al., 1996). In an elegant experimental manipulation, Bentinand Golland (2002) recorded an N170 ERP evoked to (static)schematic line-drawings of faces, scrambled versions of thesame faces, and line-drawings of common objects. In theirdesign different subject groups were exposed to the stimuli withdifferent block orders. The scrambled, or jumbled, versions ofthe line-drawn face stimuli had recognizable features, whoseposition relative to the outline of the face was altered. Asexpected, N170s were elicited to all stimulus categories, andwere significantly larger to the intact schematic faces in bothexperiments. Critical to the current discussion, significantlylarger N170s occurred to jumbled schematic faces but onlywhen that stimulus block directly followed the schematic faceblock (Bentin and Golland, 2002), indicating how importantstimulus-induced context effects can be in a laboratory setting.In a different study, N170 amplitude elicited to Moonee facesdecreased by priming with photographic images of the sameindividuals represented in the Moonee faces (Jemel et al., 2003).The strongest priming effect occurred to images that werethe actual photographic image of the Moonee face stimulus(a bottom-up effect), however, priming was also observed todifferent real images of the same individual relative to theMoonee faces (top-down effect) (Jemel et al., 2003). As a thirdexample of the importance of experimental context effects,differences in the lateralization of N170 to faces can occur asa function of stimulus conditions used in the experiment. Forexample, the classic right lateralization of N170 is seen when facesare randomly presented among other object classes (e.g., Bötzelet al., 1995; Bentin et al., 1996; Eimer, 1998; Itier and Taylor,2004) compared to a bilateral or even left-lateralization patternwhen faces are presented in series with other faces (Deffkeet al., 2007). These findings caution how important experimentalcontext can be on N170s elicited to faces (Maurer et al., 2008).Indeed, N170 is larger to ambiguous face-like stimuli that areperceived as faces relative to the same stimuli when they are notseen as faces (George et al., 1996; Sagiv and Bentin, 2001; Bentinand Golland, 2002; Latinus and Taylor, 2005, 2006). These effectshave been proposed to be driven by stimulus context by a numberof investigators (Bentin and Golland, 2002; Latinus and Taylor,2006).
Isolated eyes evoke larger and delayed N170s relative to fullfaces (Bentin et al., 1996; Jemel et al., 1999; Puce and Perrett,2003). Hence, the context of the face itself (e.g., outline andother face parts) may affect the neural response elicited to theeye stimulus—an effect that does not occur to presenting otherface parts in isolation. Due to its sensitivity to dynamic gazetransitions (Puce et al., 2000; Conty et al., 2007), N170 has beenposited to be a neural marker of communicative intent (Puce,2013). Relevant for the present study, N170s to dynamic gazeaversions are larger and earlier than those to gaze transitionslooking directly at the observer (Puce et al., 2000;Watanabe et al.,2002; but see Conty et al., 2007). This effect occurs to full imagesof faces, and isolated eyes (Puce et al., 2000), suggesting thatN170 signals changes in social attention, and reflects the potentialsalience of gaze direction (Puce and Perrett, 2003; Conty et al.,2007).
N170 modulation to dynamic facial movements is notexclusive to eyes: larger N170s occur to mouth opening vs.closing movements—potentially reflecting a response to apending utterance (Puce et al., 2000), and this effect occurs inboth real and line-drawn faces (Puce et al., 2003; Rossi et al.,2014). Unlike in dynamicmouthmotion, N170s to gaze aversionsare strongly modulated by stimulus type: real faces show N170differences to averted vs. direct gaze (Puce et al., 2000), whereasline-drawn faces do not (Rossi et al., 2014). These differencesbeg the question about effects of stimulus-driven context effectson the N170 elicited to dynamic facial movements. Hence,here we recorded N170 ERPs to dynamic gaze transitions toboth real and line-drawn dynamic face images, and scrambledcontrols within the same experiment (using an experimentalstructure similar to that of Puce et al., 2003). We performed astandard ERP peak analysis, focusing on N170, and reasonedthat if stimulus-context effects were driving N170 modulation,we would expect to observe larger N170s to gaze aversion vs.direct gaze for both real and line-drawn faces. In contrast, if theN170 effect was driven by low-level stimulus features only inthe eye stimuli e.g., high iris/sclera contrast in the real imagesof faces, then the N170 effect would be seen only to dynamicimages using real faces and not to line-drawn face images. ThisN170 modulation would not be predicted to occur for realcontrol stimuli, in line with our previous studies. Finally, if theN170 effect was driven by a general low-level effect of localstimulus contrast change (occurring in both face and controlstimuli), then we might expect to observe larger N170s to thereal faces and their respective controls, relative to the line-drawnstimuli.
As well as examining averaged ERP activity, we alsoinvestigated oscillatory electroencephalographic (EEG) behaviorpost-motion onset to all stimulus types at electrode sitedgenerating maximal N170 activity in a frequency range of5–50 Hz. Previous studies evaluating facial motion effects havefocused exclusively on averaged ERPs, which represent linearlysummed EEG trials that are phase-locked to a relevant event(e.g., motion onset), and that are independent of ongoing EEGactivity (Jervis et al., 1983). It has been proposed that thetransient phase-resetting of ongoing oscillatory EEG activityunderlies ERP generation (Brandt and Jansen, 1991). However,
Frontiers in Human Neuroscience | www.frontiersin.org 2 March 2015 | Volume 9 | Article 185

Rossi et al. ERPs to changing gaze
oscillatory EEG activity that is not phase-locked can also occurto a stimulus event, and will not be seen in an averaged ERP(Makeig et al., 2004). Oscillatory EEG activity expressed bothas a function of EEG frequency and time relative to stimulusonset and/or execution of motor response can be identified usingtime-frequency decomposition of EEG signals, and displayedas Event-Related Spectral Perturbation (ERSP) plots (Makeiget al., 2004). Changes in a given EEG frequency band can occurfrom more than one process or underlying mechanism (e.g.,see Sedley and Cunningham, 2013). Modulation of alpha band(8–12 Hz) power has been linked to changes in attentionalstate (Worden et al., 2000; Sauseng et al., 2005; Thut et al.,2006; Fries et al., 2008), and performance on visual perceptiontasks (Ergenoglu et al., 2004; Babiloni et al., 2006; Thut et al.,2006). Alpha may act as an inhibitory brain signal (Klimesch,2012), which might enable timing of processing, and gatedaccess to knowledge, and orientation in time, place, andcontext (Basar et al., 1997; Palva and Palva, 2007; Klimesch,2012). Increases in beta band power (12–30 Hz) may reflectmaintenance of current behaviorally relevant sensorimotor orcognitive states (Engel and Fries, 2010), whereas gamma bandpower (>30 Hz) increases may facilitate cortical processing,cognitive control and perceptual awareness (Ray and Cole,1985; Tallon-Baudry and Bertrand, 1999; Grossmann et al.,2007; Engel and Fries, 2010; but see Sedley and Cunningham,2013).
Ideally, ERSP and ERP analyses performed in parallel couldmore completely characterize neural activity to different taskdemands and conditions. However, the relationship betweenoscillatory EEG activity and ERP activity complex (see Rossi et al.,2014) and is not typically studied. Our previous comparisonsof ERP and ERSP activity to viewed dynamic eye and mouthmovements in dynamic line-drawn faces showed statisticallysignificant differences for apparent motion in the beta andgamma bands between facial motion conditions, which differedtiming and frequency content relative to control motion stimuli(Rossi et al., 2014). Given our previous study, here, we expectedto observe oscillatory EEG changes in beta and gamma bands thatwould occur at different post-motion onset times for facial andcontrol motion stimuli.
Materials and Methods
ParticipantsSeventeen healthy participants provided written informedconsent to participate in the study. All participants had normalor corrected-to-normal vision, and were free of a history ofneuropsychiatric disorders. The study protocol was approvedby the Institutional Review Board at Indiana University,Bloomington (IRB 1202007935).
High-density (256 channel) EEG and behavioral data werecollected from all participants, and data from 1 individual hadto be excluded from further analysis due to a large amountof artifactual EEG contamination from facial/neck muscleactivity, as well as line noise. Hence, data from 16 participants(7 males, 9 females) with an average age of 26 years (range21–34 years) were submitted for analysis. The 16 participants
were right-handed, as assessed by the Edinburgh HandednessInventory (mean: R64.6, SD: 19) (Oldfield, 1971).
StimuliParticipants viewed four different types of visual displaysalternating between natural images of facial motion andrespective motion controls, as well as motion of line-drawn facesand their respective motion controls. The real face, with eyesaverting and looking directly at the observer, had a respectivemotion control that consisted of a colored checkerboardwith checks moving towards the left and right in the samevisuospatial position as the eyes in the real face (similarto that used in Puce et al., 1998). A line-drawn face, witheyes averting and looking at the observer, had a respectivemotion control in which line segments in the scrambledstimulus moved with a similar spatial excursion to the eyes,with the same number of pixels contributing to the motion(Figure 1).
Stimulus CreationReal faces had been originally created from still 8-bit colorphotographs of posed direct and extreme averted (30 degree)gaze positions in both left and right directions. The stimulusface was superimposed on a background of concentric grayscalecircles of different luminance. The images were originallycreated to be presented sequentially to depict dynamic gazetransitions, and mouth motion (see Puce et al., 1998). Thecorresponding non-facial motion controls consisted of a coloredcheckerboard pattern that was constructed from hues takenfrom the original head. Separate corresponding control stimuliwere created to that sequential presentation resulted in checksalternating their position in the same regions of the visual fieldas the eyes in the real face (Puce et al., 1998), and to ensurethat subjects did not visualize a ‘‘face’’ in the dynamic controlstimulus.
White line-drawn faces on a black background had beenoriginally created from a multimarker recording of facialexpressions using specialized biological motion creation softwarefrom which lines were generated between some of the pointlights [Elite Motion Analysis System (BTS, Milan, Italy)].The black and white control stimuli had originally beencreated by extracting line segments from the line-drawn faceand spatially re-arranging them in the visual space in anearlier version of Photoshop (Adobe Systems, Inc.), so thatthe face was no longer recognizable (Puce et al., 2003).The existing line-drawn faces were modified for Rossi et al.(2014) in Photoshop CS5 (Adobe Systems, Inc.) by addinga schematic iris to the face which when spatially displacedcould signal a gaze change on the stimulus face. A directgaze consisted of a diamond-shaped schematic pupil positionedin the center of each schematic eye. Averted gaze consistedof an arrow-shaped schematic pupil that was moved to theextremity of the schematic eye (Figure 1). Thus, by togglingthe two schematic eye conditions, observers reported seeinga convincing ‘‘direct’’ vs. ‘‘averted’’ gaze transition in theline-drawn face. Similarly, line-drawn control stimuli werecreated, using a rearranged ‘‘scramble’’ of the lines making
Frontiers in Human Neuroscience | www.frontiersin.org 3 March 2015 | Volume 9 | Article 185

Rossi et al. ERPs to changing gaze
FIGURE 1 | Materials and methods. (A) Illustration of the visual stimulationsequence, with example stimuli. Each viewing condition had a 20 s durationand consisted of the alternation of the three images with different gazedirection: direct, away to the left and away to the right. The REAL CNTLcondition consists of apparent motion of a checkerboard pattern to simulateeyes moving toward or away from the participant depicted in the REAL FACE
condition. A similar correspondence exists (highlighted on red circles for displaypurposes only) for the LINE CNTL and LINE FACE conditions, where line-drawnimages are alternated to display apparent motion in a control and face stimulus.(B) Timeline for an experimental trial. An example of a trial sequence in theREAL FACE stimulus block. Participants pressed a mouse button wheneverthey saw a target (a negative image of the stimulus).
up the eye movements on the face stimuli, ensuring that allstimuli presented would be equiluminant, and have similarmotion excursions, as well as contrast and spatial frequencycharacteristics (Figure 1A). On debriefing post-experiment,subjects did not report seeing ‘‘eye’’ stimuli in the line-drawncontrol stimulus.
For all stimulus types, the effect of smooth movement wasgenerated and no side-switch transition was possible (e.g., eyeslooking to the right followed by eyes looking to the left).Negative-contrast versions (inverse colors) of all the stimulusversions were constructed to be used as infrequently presentedtargets (Figure 1B).
ProcedureParticipants viewed the stimuli displayed on a 24-inch monitor(Dell Ultra Sharp U2412M, refresh rate of 60 Hz) resulting inan overall visual angle of 5 × 3 (vertical × horizontal) degrees.Participants completed four experimental runs in total; each runlasted approximately 6 min to allow participants to remain stillfor the EEG recording and maintain their level of alertness. Aftereach run, participants had a self-paced break.
All stimulus types were always presented in each experimentalrun, with a run consisting of the repeated presentation of thefollowing alternating 20 s stimulus blocks (Figure 1A; followingthe procedure used in Puce et al., 2003):
1. REAL FACE. Three versions of male face with eyes directlylooking at the observer, eyes averted to the left, or eyes avertedto the right (Figure 1B) were presented in alternation toproduce apparent motion depicting change in gaze positionfrom a direct gaze to an averted gaze position to the left or tothe right [gaze aversions: eyes-away] and from an averted gazeback to a direct gaze position [eyes-direct] similar to that usedin Puce et al. (1998).
2. REAL CONTROL. Checkerboard patterns were alternated toproduce an apparentmotion stimulus varying in the same partof the visual field as the eyes in the REAL FACE similar to thatused in Puce et al. (1998).
3. LINE FACE. Three versions of line-drawn face stimuliwere alternated to change gaze position to look directly atparticipants [eyes-direct] or avert gaze either to the left orright [eyes-away] as for the REAL FACE condition, similar tothat used in Rossi et al. (2014).
Frontiers in Human Neuroscience | www.frontiersin.org 4 March 2015 | Volume 9 | Article 185

Rossi et al. ERPs to changing gaze
4. LINE CONTROL. The spatially ‘‘scrambled’’ versions of theLINE FACE were alternated to produce apparent motion inthe same part of the visual field as the eyes in the LINE FACEcondition, similar to that used in Rossi et al. (2014).
Stimulus onset asynchrony was randomly varied between 1000and 1500 ms on each experimental trial (i.e., between twoconsecutive apparent motion onsets). A total of 210 trials wereacquired per stimulus type (LINE FACE, LINE CONTROL,REAL FACE, REAL CONTROL).
The experiment was run using Presentation Version 14(NeuroBehavioral Systems, 2010). Participant reaction times andaccuracy were logged, and time stamps for different stimulustypes (as well as button press responses for detected targetstimuli) for each trial were automatically sent to the EEG systemand stored in the EEG file.
Participants were instructed to press a button indicating thepresence of a target stimulus. Target stimuli were negative-contrast versions of all stimuli used in the experiment(Figure 1B). Targets were randomly assigned to each alternatingblock (20% of trials). Trials with targets were not includedin ERP/EEG analyses. Similarly, so as to remove potentialconfounds created by changes in stimulus type (i.e., for thefirst stimulus of each block, as well as for stimuli immediatelyfollowing targets), trials following a target and the first stimuliof each block were not included in ERP/EEG analyses. Thepurpose of the target detection task was to keep participantsattentive. All participants completed a short practice run (36trials) at the beginning of the session and were given feedbackregarding detection of target stimuli. All participants completedthe practice run with 100% accuracy. EEG trials from the practicerun were not included in subsequent analyses.
EEG Data Acquisition and PreprocessingEEG Data AcquisitionA Net Amps 300 high-impedance EEG amplifier and NetStationsoftware (V4.4) were used to record EEG from a 256-electrodeHydroCel Geodesic Sensor Net (Electrical Geodesics Inc.) whilethe participant sat in a comfortable chair and performedthe task in a dimly lit, humidified room. Continuous 256-channel EEG data were recorded with respect to a vertexreference using a sampling rate of 500 Hz and bandpassfilter of 0.1–200 Hz (the ground electrode was sited onthe midline parietal scalp). Stimulus delivery and subjectbehavioral responses were time-stamped onto all EEG files.Impedances were maintained below 60 kΩ as per themanufacturer’s recommended guidelines. Impedances weretested at the beginning of the experimental session andthen once more at the half-way point of the experiment,allowing any high-impedance electrode contacts to be adjustedif necessary.
EEG Data PreprocessingEEG data were first exported from EGI Net Station softwareas simple binary files. The same pre-processing procedure wasapplied to the ERP and ERSP analyses. All EEG pre-processingprocedures were performed using functions from the EEGLABtoolbox (Delorme and Makeig, 2004) running under MATLAB
R2010b (The Mathworks, Natick, MA). EEG data were firstsegmented into 1700 ms epochs: 572 ms pre-stimulus baselineand 1082 ms after apparent motion onset. EEG amplitude ateach trial was normalized relative to the pre-stimulus baselinebased on the event-markers, identifying each trial type. ERP datawere displayed using a 200 ms pre-motion onset and 600 msafter the motion transition—see Figure 3. [A manufacturer-specified latency correction factor was applied to all behavioraldata and epoched ERP data. In our case, given a sampling rateof 500 Hz, a correction of 18 ms was made, as per manufacturerguidelines].
EEG epochs were first visually inspected to identify andexclude bad channels from each individual subject EEG dataset.The electrodes identified as bad differed between subjects;average number of ‘‘bad’’ electrodes was 22 ± 2.15 (standarderror of mean) out of 256 channels. Epochs with very largeartifacts (e.g., very large subject movements and channel drifts)were manually rejected prior to subjecting the EEG datasubsequent artifact detection analyses.
Independent Component Analysis (ICA) was used to identifyand subtract components representing artifacts such as eyemovements, eye blinks, carotid pulse, muscle activity andline-noise (Bell and Sejnowski, 1995; Delorme and Makeig,2004). This allowed trials with eyeblinks to be adequatelycorrected, and allowed these trials to be included in theanalysis. A total of 32 ICA components were generated for eachparticipant’s EEG dataset. Eyeblinks, cardiac artifact and muscleactivity were identified in isolated ICA components. Followingremoval of artifactual ICA components and reconstitution ofthe EEG signal, interpolation of bad channels was performedto regenerate a 256-channel EEG dataset. Bad channels wereinterpolated using a spherical interpolation: electrical activity wasinterpolated with respect to the surrounding nearest neighborelectrodes.
Data were re-referenced to a common average reference. ERPcomponents such as the N170 and the vertex positive potential(VPP) amplitude have previously been shown to be very sensitiveto reference location (Joyce and Rossion, 2005). The averagereference has been suggested as being optimal as it captures finerhemispheric differences and shows the most symmetry betweenpositive and negative ERP peaks for face-related stimuli (Joyceand Rossion, 2005). Only behaviorally correct EEG trials, i.e., nofalse alarms for targets, were included in subsequent analyses.
EEG/ERP Data AnalysesTwo temporo-occipital 9 electrode clusters including equivalent10–10 system sites P07/P9 and P08/P10 were chosen for furtheranalyses, based on inspection of the grand averaged data fromthe current study and previously reported maxima in N170amplitudes that used 4 electrode clusters for 64- and 128-channelEEG derivations, and P09 and P10 for smaller electrode arrays of10–10 system sites (Puce et al., 2000, 2003; Carrick et al., 2007;Brefczynski-Lewis et al., 2011; Rossi et al., 2014; Figures 2, 3).Averaged data from the 9 electrodes in each hemispheric clusterwere used in all subsequent ERP analyses. Similarly, single-trial EEG data recorded from the same 9 electrodes in eachhemispheric cluster were used for ERSP analysis.
Frontiers in Human Neuroscience | www.frontiersin.org 5 March 2015 | Volume 9 | Article 185

Rossi et al. ERPs to changing gaze
FIGURE 2 | Group data: Topographic voltage maps of peak N170activity. The N170 is distributed across the bilateral occipitotemporal scalpand appears in all conditions, including the control conditions. Thetopographic maps are displayed in a top-down view with nose at top and lefthemisphere on the left. Color scale calibration bars depict amplitude inmicrovolts. Red circles on the maps depict the 9 electrodes in eachhemispheric cluster that provided input for N170 statistical analyses. Smallblack dots depict additional sensor locations.
Analysis of Event-Related PotentialsA digital 40 Hz infinite impulse response (IIR) low-pass filterwas applied to the artifact-free behaviorally correct EEG data.Average ERPs were generated for each of the eight conditionsand for each subject (about 200 trials per condition per subject onaverage). The ERPs from all subjects were averaged to generate agrand-average set of ERP waveforms for each condition and EEGchannel.
Data from each 9 electrode temporo-occipital cluster wereextracted and the average time-course for each electrode clusterwas generated for subject and condition, and was subsequentlyused for calculating N170 amplitude and latency. In line withprevious work (Puce et al., 2003), we focused on the N170 as aneural marker of the perception of facial motion. In our data,consistent with previous studies, the N170 showed a lateralizedposterior scalp distribution (Figure 2). Using an automatedpeak detection procedure within a search time window of150–250 ms after apparent motion onset, N170 peak amplitudes
FIGURE 3 | Group data: ERPs from left (L) and right (R)occipitotemporal electrode clusters as a function of stimulus type.An epoch of activity is shown from 200 ms pre-stimulus onset to 600 mspost-stimulus. Legend: Line colors indicate corresponding stimulus typeshown LINE CONTROLS in blue, LINE FACES in red, REAL CONTROLS ingreen and REAL FACES in gray. The vertical black bar superimposed on theERP waveforms denotes motion onset. Vertical and horizontal calibration barsdenote amplitude in microvolts and time in milliseconds, respectively.
and latencies were extracted for each condition, each subject, andeach electrode cluster independently.
Analysis of Event-Related Spectral PerturbationsAll analyses were performed using custom in-house routineswritten using the EEGLAB toolbox (Delorme and Makeig, 2004)running underMATLAB. Artifact-free, behaviorally correct EEGsegments were convolved with a linearly increased Morlet-wavelet on a trial-by-trial basis for each condition and subject.Specifically, the length of the wavelet increased linearly from1 to 12 cycles across the frequency range of 5–50 Hz (theta, alpha,beta, and low-gamma). The linear increment of wavelet cycles isa commonly used practice when calculating spectral componentsin neurophysiological data, so that temporal resolution canbe comparable for lower and higher EEG frequencies (LeVan Quyen et al., 2001) (for a detailed account on spectralanalyses of EEG see Herrmann et al., 2005). After the EEGsignals in each trial were convolved with a Morlet wavelet,they were transformed into power, and the resulting valueswere then averaged across trials. We analyzed the spectralpower of components in the theta (5–8 Hz), alpha (8–12 Hz),beta (12–30 Hz), and low-gamma (30–50 Hz) EEG frequency-bands as they evolved over the post-movement epoch. Inorder to extract even-related spectral power from raw power, astandard baseline procedure was applied in a trial by trail basis(Grandchamp and Delorme, 2011). The window used as baselinecomprised data points between −200 and 0 ms pre-stimulusrange.
Induced activity is defined as EEG activity that is elicited tothe stimulus, but may not be precisely time- or phase-lockedto the stimulus transition (in this case apparent motion onset).However, each individual EEG epoch will also contain evoked
Frontiers in Human Neuroscience | www.frontiersin.org 6 March 2015 | Volume 9 | Article 185

Rossi et al. ERPs to changing gaze
activity, hence a calculation of ‘‘total power’’ (i.e., sum of evokedand induced activity) in each frequency band was made for EEGepochs in our study (see Tallon-Baudry et al., 1996).
As we have previously noted differences between facialmotion stimulus type for eye and mouth movements (Rossiet al., 2014), we performed a similar analysis and generateddifferential ERSP plots between pairs of conditions: LINECONTROL Direct vs. Away, LINE FACE Direct vs. Away,REAL CONTROL Direct vs. Away and REAL FACE Direct vs.Away.
Statistical Testing for Significant DifferencesERP peak analysisDifferences in temporo-occipital N170 peak amplitude andlatency were evaluated using a 4-way repeated-measuresANOVA with Hemisphere (Left, Right), Configuration (Face,Control), Stimulus Type (Real, Line) and Motion (Away,Toward) as within-subjects factors using SPSS for MAC 18.0(SPSS Inc.). Significant main effects were identified at P values ofless than 0.05 (after Greenhouse-Geisser correction). Contrastswere evaluated using the Bonferroni criterion to correct formultiple comparisons with P values of less than 0.05 identifyingsignificant effects.
Furthermore, to specifically assess the specificity of the effectto REAL FACE stimuli, we performed paired t-tests between eachmotion conditions for each stimulus condition. Four t-tests wereperformed (i.e., REAL FACE AWAY × REAL FACE DIRECT,REAL CONTROL AWAY × REAL CONTROL DIRECT, LINEFACE AWAY × LINE FACE AWAY, LINE CONTROL AWAY× LINECONTROLDIRECT). The level of statistical significance(a priori two-tailed) was set at p< 0.05.
ERSP analysisTo measure the complete temporal extent of effects overfrequency, we used a bootstrap approach (N = 1000 bootstraps),identifying time-frequency data points of statistically significantdifferences based on data-driven 95% confidence intervals (asdescribed and implemented in Pernet et al., 2011) from the dataof the two 9 electrode clusters. Non-parametric permutationwas used to estimate the distribution under the null hypothesisof no differences in oscillatory amplitude between the pair ofconditions.
Due to our paired design, when a subject was selectedrandomly, results from all his or her conditions were includedin that sample. For each condition, we averaged the dataacross (resampled) participants and computed differencesbetween conditions. Thus, for each one of the observedmean differences between conditions for a given frequencyat each time-point, a t-statistic was calculated. At thisstage, time points were evaluated according to a thresholdset if their t-statistic corresponded to a value below 0.05according to the Student’s t-distribution. This procedurewas repeated for all ERSP time-points at each frequency.Temporally contiguous threshold time points were grouped intotemporal clusters. At each bootstrap iteration, the temporalcluster mass was computed as the sum of the t-statisticsover consecutively significant time-points, with the maximum
cluster mass being recorded. Finally, temporal clusters inthe observed data were deemed significant if their massexceeded the maximum cluster mass of 95% of all bootstrapreplicates (corresponding to a significance level of 0.05). Thismethod allowed correction for multiple comparisons. Thus,the cluster mass statistic identified temporal regions withsignificant differences while avoiding false-positives arising frommultiple comparisons (Pernet et al., 2011). This approachis comparable to false-discovery rate (FDR; Benjamini andHochberg, 1995).
Results
Behavioral DataParticipants identified the target stimulus (image negative) with99% accuracy by button press. Mean reaction time for targetdetection by stimulus type was 557± 94 ms (s.d.) for REAL faces,577 ± 112 ms for REAL controls, 607 ± 113 ms for LINE facesand 560 ± 92 ms for LINE controls. A 2-way (Configuration ×
Stimulus Type) repeated-measures ANOVA showed a significantmain effect of Stimulus Type (F(1,15) = 11.067, P < 0.001) and aninteraction effect of Configuration by Stimulus (F(1,15) = 26.24,P < 0.001).
For the significant main effect of Stimulus Type, REAL stimuli(real faces and real controls) generated faster responses relativeto LINE stimuli (line-drawn faces and line-drawn scrambledcontrols, mean difference: 30± 9ms). The significant interactioneffect of Configuration by Stimulus type indicated that real facesgenerated a faster response compared to REAL controls (meandifference: 47 ± 11 ms), while the opposite was seen for line-drawn stimuli, line-drawn controls were identified fastest (meandifference: 47 ± 13).
The current behavioral task was used to help participants payattention to the display. EEG epochs from these target trials werenot included in subsequent analyses.
Peak Analysis of the N170 ERPN170 amplitudes and latencies were extracted from each ofthe two temporo-occipital scalp electrode clusters for eachparticipant and condition for subsequent statistical testing. N170was maximal over the temporo-occipital scalp, as demonstratedby the topographic voltage maps (Figure 2) plotted at the timepoint at which the N170 was maximal in amplitude. N170 waselicited in all stimulus conditions (Figure 3).
N170 latency and amplitude data for each conditionand hemisphere are shown in Table 1. A 4-way repeated-measures ANOVA for N170 peak amplitude differences revealeda significant main effect for hemisphere (F(1,15) = 11.265,P < 0.001) and stimulus type (Real vs. Line; F(1,15) = 46.289,P < 0.001). The main effects for configuration (Face, Control)and motion (Away, Direct) were not significant. A significantinteraction effect was observed between stimulus type andmotion (F(1,15) = 5.143, P < 0.05).
For the significant main effect of hemisphere, post hocpaired comparisons revealed that N170 amplitude was greaterfor the Right hemisphere relative to the Left Hemisphere(mean difference: 0.66 ± 0.26 µV). The main effect of
Frontiers in Human Neuroscience | www.frontiersin.org 7 March 2015 | Volume 9 | Article 185

Rossi et al. ERPs to changing gaze
TABLE 1 | Group N170 peak amplitude (µV) and latency (ms) data: Mean and Standard Errors (Std) as a function of hemisphere (Hem) and Condition.
Hem Condition Peak Ampl (µV) Std Peak Lat (ms) Std
Left REAL FACE away −1.45 0.24 209.68 10.97REAL FACE direct −1.13 0.15 216.75 8.97REAL CTRL away −0.12 0.26 207.25 10.12REAL CTRL direct −1.14 0.20 200.87 8.91LINE FACE away −1.66 0.25 236.06 8.89LINE FACE direct −1.73 0.30 232.81 6.35LINE CTRL away −1.63 0.16 234.37 9.65LINE CTRL direct −1.87 0.24 233.18 7.28
Right REAL FACE away −2.24 0.25 218.12 7.72REAL FACE direct −1.64 0.20 223.18 8.96REAL CTRL away −1.86 0.28 203.06 7.52REAL CTRL direct −1.69 0.26 200.81 7.25LINE FACE away −2.54 0.34 246.81 7.37LINE FACE direct −2.64 0.27 236.50 6.97LINE CTRL away −2.18 0.32 236.62 8.44LINE CTRL direct −2.42 0.36 231.87 5.87
Legend: Ampl = amplitude; Lat = latency.
stimulus type showed that N170 amplitude was greater for theline-drawn stimuli relative to the real stimuli (mean difference:0.55 ± 0.08 µV, Figure 3). Post hoc comparisons for theinteraction effect between stimulus type andmotion revealed thatamong the REAL stimuli (i.e., real faces and real controls) theN170 for averted gaze was significantly larger than that to directgaze (mean difference: 0.29 ± 0.13 µV) (Figure 3); an effect notseen for line-drawn stimuli.
One could argue that our 4-way ANOVA would reveal a3-way interaction between stimulus type, configuration, andmotion. This was not the case. When we compare our currentdata to those of Puce et al. (2000); we note that the authorsalso did not find interaction effects on N170 amplitude asassessed by means of 3-way ANOVAs performed at isolatedhemispherically homologous electrode sites in a study thatwas performed using only 22 EEG electrodes. To try andinvestigate potential differences and similarities between thetwo studies, we further explored our current high-densityEEG data by running paired t-tests on N170 amplitude forthe Away and Direct motion transition for each stimulustype and configuration in the right occipitotemporal cluster(given that the main differences in the original study werereported in the right hemisphere). These analyses indicatedthat N170 amplitude was significantly larger for Away relativeto Direct for REAL FACES (t(15) = −2.229, P = 0.04,mean difference = 0.46 µV), consistent with the differencereported in Puce et al., 2000. In contrast, N170 amplitudesfor LINE faces were not significantly different [LINE FACEAway relative to LINE FACE Direct (t(0.15) = 0.411, P = 0.69,mean difference = 0.08 µV)]. Similar comparisons across thecontrol conditions were also not significant: REAL controlsshowed no differences between conditions [REAL CONTROLAway relative to Direct (t(15) = −0.85, P = 0.41, meandifference = −0.11 µV] and LINE controls also showed nosignificant differences in N170 amplitudes [LINE CONTROLAway relative to Direct (t(15) = 0.241, P = 0.12, meandifference = 1.6 µV].
The 4-way repeated-measures ANOVA for N170 latencyrevealed a significant main effect of Stimulus type (F(1,15) = 39.49,P < 0.001) and Configuration (F(1,15) = 7.773, P < 0.05).No other statistically significant main effects of hemisphereor motion, or interaction effects were observed for N170latency. For the significant main effect of Stimulus type,post hoc comparisons indicated that the effect might havebeen driven by the shorter latencies to REAL faces comparedto LINE faces (mean difference: 26 ± 4 ms, Figure 3).For the significant main effect of Configuration, post hoccomparisons suggested that N170s for CONTROL (bothREAL and LINE) were shorter compared to FACE stimuli(mean difference: 9 ± 3 ms, Figure 3). To statisticallyevaluate these differences, four paired t-tests were performed(see Section Materials and Methods). None of these latencydifferences were found to be statistically significant [REALFACE Away relative to REAL FACE direct (t(15) = 0.979,P = 0.343, mean difference = 6.06 ms; LINE FACE Awayrelative to LINE FACE direct (t(15) = 1.563, P = 0.139,mean difference = 6.78 ms; REAL CONTROL away relativeto REAL CONTROL direct (t(15) = 1.140, P = 0.272,mean difference 4.31 ms; LINE CONTROL away relative toLINE CONTROL direct (t(15) = 0.457, P = 0.654, meandifference = 2.96 ms)].
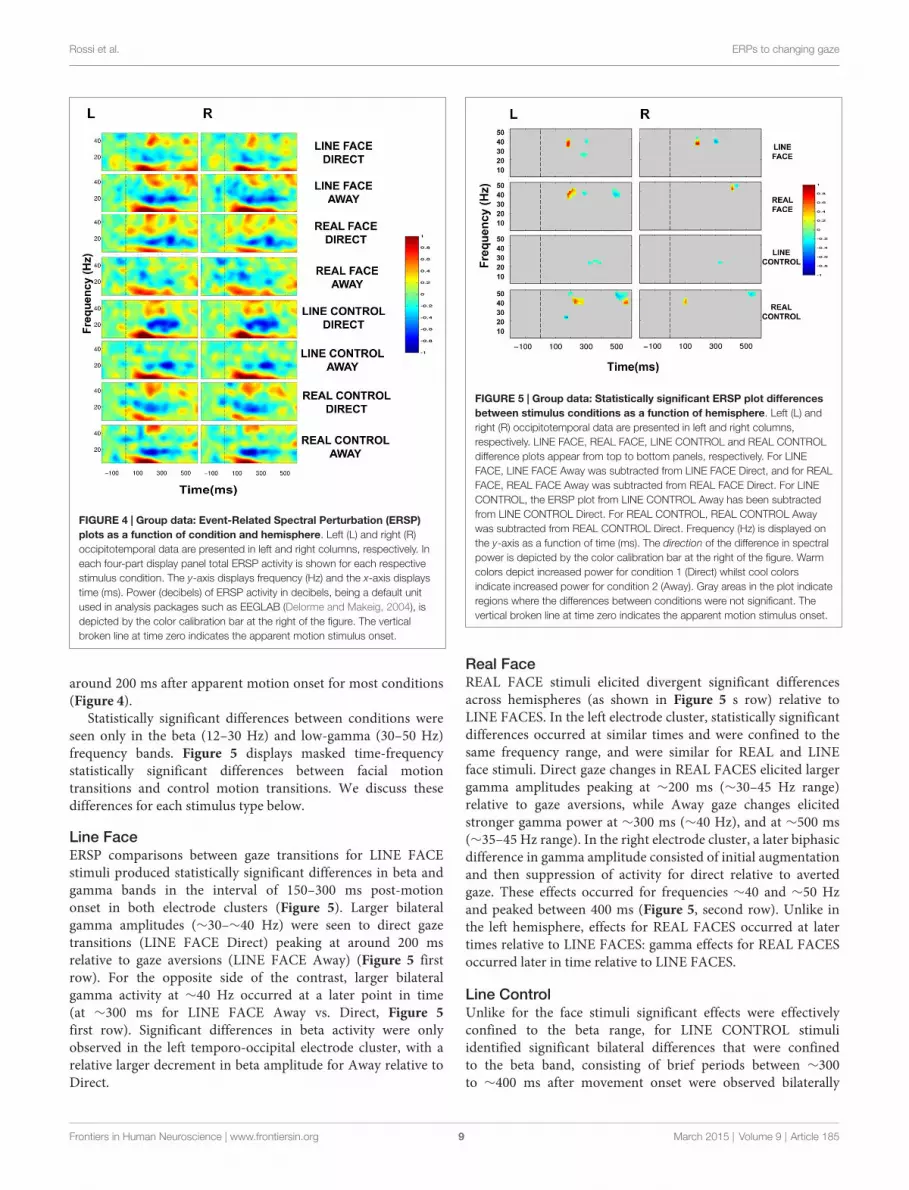
Temporal Dynamics: ERSP PlotsERSP plots demonstrated clear activity in selected EEG bandsin all conditions in the post-motion onset period (Figure 4).The activity profile was similar across all conditions, includingactivity spanning over multiple time points and frequency bands.A common feature across all conditions was a prolonged burstof activity in the theta (5–8 Hz) and alpha (8–12 Hz) frequencybands in both electrode clusters extending from ∼100–400 ms.Moreover, a consistent decrease in amplitude in the beta range(12–30 Hz) was also seen for most conditions extending from∼150–400 ms. An additional feature in the ERSP plots wasactivity in the low-gamma band (30–50 Hz) peaking roughly
Frontiers in Human Neuroscience | www.frontiersin.org 8 March 2015 | Volume 9 | Article 185
Rossi et al. ERPs to changing gaze
FIGURE 4 | Group data: Event-Related Spectral Perturbation (ERSP)plots as a function of condition and hemisphere. Left (L) and right (R)occipitotemporal data are presented in left and right columns, respectively. Ineach four-part display panel total ERSP activity is shown for each respectivestimulus condition. The y-axis displays frequency (Hz) and the x-axis displaystime (ms). Power (decibels) of ERSP activity in decibels, being a default unitused in analysis packages such as EEGLAB (Delorme and Makeig, 2004), isdepicted by the color calibration bar at the right of the figure. The verticalbroken line at time zero indicates the apparent motion stimulus onset.
around 200 ms after apparent motion onset for most conditions(Figure 4).
Statistically significant differences between conditions wereseen only in the beta (12–30 Hz) and low-gamma (30–50 Hz)frequency bands. Figure 5 displays masked time-frequencystatistically significant differences between facial motiontransitions and control motion transitions. We discuss thesedifferences for each stimulus type below.
Line FaceERSP comparisons between gaze transitions for LINE FACEstimuli produced statistically significant differences in beta andgamma bands in the interval of 150–300 ms post-motiononset in both electrode clusters (Figure 5). Larger bilateralgamma amplitudes (∼30–∼40 Hz) were seen to direct gazetransitions (LINE FACE Direct) peaking at around 200 msrelative to gaze aversions (LINE FACE Away) (Figure 5 firstrow). For the opposite side of the contrast, larger bilateralgamma activity at ∼40 Hz occurred at a later point in time(at ∼300 ms for LINE FACE Away vs. Direct, Figure 5first row). Significant differences in beta activity were onlyobserved in the left temporo-occipital electrode cluster, with arelative larger decrement in beta amplitude for Away relative toDirect.
FIGURE 5 | Group data: Statistically significant ERSP plot differencesbetween stimulus conditions as a function of hemisphere. Left (L) andright (R) occipitotemporal data are presented in left and right columns,respectively. LINE FACE, REAL FACE, LINE CONTROL and REAL CONTROLdifference plots appear from top to bottom panels, respectively. For LINEFACE, LINE FACE Away was subtracted from LINE FACE Direct, and for REALFACE, REAL FACE Away was subtracted from REAL FACE Direct. For LINECONTROL, the ERSP plot from LINE CONTROL Away has been subtractedfrom LINE CONTROL Direct. For REAL CONTROL, REAL CONTROL Awaywas subtracted from REAL CONTROL Direct. Frequency (Hz) is displayed onthe y-axis as a function of time (ms). The direction of the difference in spectralpower is depicted by the color calibration bar at the right of the figure. Warmcolors depict increased power for condition 1 (Direct) whilst cool colorsindicate increased power for condition 2 (Away). Gray areas in the plot indicateregions where the differences between conditions were not significant. Thevertical broken line at time zero indicates the apparent motion stimulus onset.
Real FaceREAL FACE stimuli elicited divergent significant differencesacross hemispheres (as shown in Figure 5 s row) relative toLINE FACES. In the left electrode cluster, statistically significantdifferences occurred at similar times and were confined to thesame frequency range, and were similar for REAL and LINEface stimuli. Direct gaze changes in REAL FACES elicited largergamma amplitudes peaking at ∼200 ms (∼30–45 Hz range)relative to gaze aversions, while Away gaze changes elicitedstronger gamma power at ∼300 ms (∼40 Hz), and at ∼500 ms(∼35–45 Hz range). In the right electrode cluster, a later biphasicdifference in gamma amplitude consisted of initial augmentationand then suppression of activity for direct relative to avertedgaze. These effects occurred for frequencies ∼40 and ∼50 Hzand peaked between 400 ms (Figure 5, second row). Unlike inthe left hemisphere, effects for REAL FACES occurred at latertimes relative to LINE FACES: gamma effects for REAL FACESoccurred later in time relative to LINE FACES.
Line ControlUnlike for the face stimuli significant effects were effectivelyconfined to the beta range, for LINE CONTROL stimuliidentified significant bilateral differences that were confinedto the beta band, consisting of brief periods between ∼300to ∼400 ms after movement onset were observed bilaterally
Frontiers in Human Neuroscience | www.frontiersin.org 9 March 2015 | Volume 9 | Article 185

Rossi et al. ERPs to changing gaze
(Figure 5, third row). This difference was driven by stronger betasuppression in the Away condition in both hemispheres.
Real ControlREAL CONTROL stimuli generated a much more diversepattern of differences extending between ∼100 to ∼600 msafter movement onset in beta and gamma activity in theleft hemisphere (Figure 5, fourth row) relative to LINECONTROL stimuli. First, significantly stronger activity for theREAL CONTROL Away condition consisted of an early betacomponent peaking right before 200 ms (∼20–25 Hz), and agamma component at ∼200 ms (∼45–50 Hz). In this sametime range, gamma at ∼35–40 Hz between ∼200–300 ms,was significantly larger for Direct condition. Later in time,gamma burst extending from ∼40–50 Hz occurred between∼500–600 ms and was stronger for the Away condition,while a lower frequency gamma component extending between∼35–40 Hz was significantly stronger between ∼550–600 msfor the Direct condition (Figure 5, fourth row). Unlike theleft electrode cluster, the right cluster showed more limitedsignificant differences in oscillatory activity between conditions.Specifically, a very early gamma band response peaked at∼100 ms, being stronger for the Direct condition, and a laterhigher frequency gamma component at ∼45 Hz peaking at∼500 ms was stronger for the Away condition.
Discussion
ERP Data: N170 EffectsOur main purpose for the experiment was to look for stimulus-induced context effects that might produce modulations of theN170 by gaze transition in line-drawn faces, when presentedwith real images of faces in the same experiment. For a stimuluscontext effect to be present, we would expect to observe paralleleffects in the form of larger N170s to gaze aversions vs. directgaze for both real and line-drawn faces. Given our experimentaldesign, this would translate to a significant interaction effect ofMotion [Away, Direct] × Config [Face, Control]. If, however,N170 modulation occurred only to gaze changes in real faces,then we would expect to see a significant interaction effect ofMotion [Away, Direct] × Config [Face, Control] × Stimulus[Real, Line]. Finally, if N170 modulation was driven by generallow-level effects of stimulus luminance and contrast, then wemight expect to observe a significant main effect of Stimulus type[Real, Line].
Interestingly, our analysis generated effects that were morecomplex than predicted for N170 amplitude. We observed asignificant main effect of Motion [Away, Direct] × Stim [Real,Line]—which was not what we had predicted. The nature ofthese differences was clarified with paired t-tests, which indicatedthat N170 was larger for averted vs. direct gaze only for realfaces—consistent with our previous study (Puce et al., 2000).Also consistent with our previous work (Rossi et al., 2014) therewas no effect of gaze aversion on N170 in our line-drawn facestimuli (or control stimuli). Having said that, there were otherstriking differences in the current dataset that resulted fromour initial predictions not being upheld. These, results raise
a number of interesting questions about the nature of stimuliand experimental designs, which we subsequently discuss indetail.
However, relative to our original experimental question,based on the above findings we would argue that, stimulus-context effects from real faces were not present for viewedeye movements in impoverished faces, when both stimuluscategories are presented within the same experiment. Thissuggests that the difference in N170 amplitude gaze changesin real faces might be driven by a different neural mechanismrelative to N170 modulation by mouth movements. Wepreviously reported to mouth opening vs. closing movementsin both real and line-drawn faces produce N170 amplitudemodulations (Puce et al., 2003). Consistent with what we hadpreviously postulated, it appears that information from mouthmovements can be accessed from both real and impoverishedimages, unlike information from the eyes that appears to requirereal faces.
Why would ERPs elicited to impoverished mouth movementsbehave so differently to those observed to gaze transitions?Bassili (1978, 1979) originally reported behavioral data to viewedemotional expressions on point-light face stimuli. Success inrecognizing different emotions was driven by the subject focusingon either the upper or lower regions of the impoverishedface (i.e., eyes/brows vs. mouth, respectively) (Bassili, 1979).The line-drawn stimuli in this study can also be regarded asbiological motion stimuli (see Oram and Perrett, 1994, 1996).Most typically, these impoverished forms of stimuli are used torepresent very effectively the articulated motion of the jointsof the body—where information related to the type of activitybeing observed can be readily identified from seeing theseminimalist displays (Blake and Shiffrar, 2007). There is a verylarge literature demonstrating the sensitivity of the human brainto biological motion stimuli (see reviews by Giese and Poggio,2003; Puce and Perrett, 2003; Blake and Shiffrar, 2007). Despitethis, very few research groups have studied brain responses tobiological motion stimuli involving the face (see the originalstudies of Bassili, 1978, 1979). Similar to movements of thebody, mouth movements are a type of articulated motion. Mouthopening and closing occurs due to the actions of the articulatedmandible. Hence, we argue that our previously reported ERPdata that demonstrate differences between mouth opening andclosing are representing a brain response to articulated biologicalmotion (e.g., see Beauchamp et al., 2002; Peuskens et al.,2005).
Other facial movements involving the forehead and eyesdo not require the movements of articulated joints, and gazeaversions also fall into this category. Changes in the eyes,either associated with gaze aversions, or with emotions suchas fear, surprise, and happiness alter the amount of seeneye white area, which can modulate the brain’s response tothese types of stimuli even when these observed changes aretask-irrelevant (Whalen et al., 2004; Hardee et al., 2008).This is likely to be driven by the high-contrast human iris-sclera complex. A gaze change, such as a lateral gaze shift,produces a local visuospatial luminance/contrast change. Thistype of stimulus, which can readily be seen at a distance,
Frontiers in Human Neuroscience | www.frontiersin.org 10 March 2015 | Volume 9 | Article 185

Rossi et al. ERPs to changing gaze
is thought to have evolved for the purposes of facilitatingsocial interactions (Emery, 2000; Rosati and Hare, 2009).Human eyes are unique among primates with respect tothis attribute, with most other species showing very littledifference in contrast between irises and sclera (Rosati and Hare,2009).
The lack of demonstrated N170 differences to gaze aversionsrelative to direct gaze transitions in this and our previous studyusing line-drawn faces (Rossi et al., 2014) supports the ideathat neural activity to eye gaze transitions in real faces mightbe triggered by low-level stimulus features. Specifically, changesin local visual contrast and increased eye white area (see alsoWhalen et al., 2004; Hardee et al., 2008) as irises/pupils movefrom a direct to an averted position likely drive the N170differences previously reported by Puce et al. (2000) and alsoseen to the real faces in the current study. This is likely tobe driven by the high-contrast human iris-sclera complex. Wefound only a 2-way interaction on N170 amplitude suggestingthat a contribution of low-level visual features on the modulationof the N170 cannot be ruled out—as indicated by a discernableERP to the motion control stimuli. The real control stimulialso presented a high local luminance/contrast difference in thesame part of the visual space as did the eye stimulus in thereal face. However, based on the paired t-test data the localhigh contrast effect cannot totally account for the observedmodulation of N170 amplitude to gaze motion: no differenceswere seen between N170s to the ‘‘Away’’ and ‘‘Direct’’ transitionsfor real control stimuli. The local high-contrast of the iris/scleracomplex probably contributes to the N170, but cannot explaindifferential effect seen on the N170 to the real face stimuli. Itmay well be that the actual configuration of the eye plays arole in the response. This, in some ways, could be regarded asa low-level feature also: a feature that is embedded in a morecomplex stimulus (the dynamic face). A set of studies withparametric manipulations of these variables would be requiredto get to the bottom of this effect. Additionally, it would beinteresting to investigate the relative effect of iris/sclera contrastand the configuration effect on the N170 by using for instancefaces where human eyes were replaced by non-human primateeyes (Dupierrix et al., 2014), or examining responses to non-human primate gaze changes, as typically the iris/sclera complexin the eyes of the non-human primate do not show thesehigh local contrast differences (Emery, 2000; Rosati and Hare,2009).
Viewing the gaze changes of another individual are thoughtto produce reflexive changes in one’s visuospatial attention(Hietanen et al., 2008; Itier and Batty, 2009). It could be arguedthat both the eyes and their respective scrambled controls mightcue participants’ visual attention in the motion direction. Thispossibility has been discussed in the literature (Grossmannet al., 2007; Hadjikhani et al., 2008; Straube et al., 2010). Ourline-drawn controls in their ‘‘averted’’ state looked like arrows(facing left and then right), and N170 did not differ betweenthe ‘‘arrow’’ control and the direct gaze control condition (adiamond shape). Behavioral and ERP studies of visuospatialcueing paradigms using Posner-like tasks (Posner, 1980) inhealthy subjects have demonstrated similar behavioral effects
for both arrows and schematic eyes, but different ERP-relatedeffects that most typically occur beyond the P100 and N170that are specific to these visuospatial cueing tasks. Specifically,anterior and posterior negativities have been described to arrowand schematic gaze-cues respectively (Hietanen et al., 2008;Brignani et al., 2009). Interestingly, when real faces are usedin a gaze-cueing paradigm, differences in early ERPs, such asP100 and N170 (P1 and N1) have been reported, producinglarger amplitudes for valid trials (Schuller and Rossion, 2001).These experimental results, despite being generated in differentexperimental designs, are consistent with the current study inthat schematic eyes do not elicit changes in earlier sensory ERPssuch as N170. This finding bears further investigation, giventhat the schematic eyes in the visuospatial cueing studies didhave contrast between ‘‘irises’’ and ‘‘sclera’’, unlike those in ourcurrent study.
A further point needs to be made on the issue of theschematic representation of faces. Our participants all reportedthat they found the gaze transitions in both types of faces to becompelling. However, some interesting differences in behaviorand neurophysiology were observed for the impoverishedstimulus categories. Subjects detected target stimuli thatconsisted of image negatives for all presented stimulus types.Participants were slower at detecting impoverished face targetsrelative to real face targets, and were the slowest for impoverishedfaces relative to impoverished controls. For real stimuli, facetargets were identified faster relative to controls. We cannotdirectly relate our behavioral data to our ERP findings: theERPs were recorded to trials where no behavioral responsewas recorded, so we can only speculate about the potentialnature of our ERP findings to the impoverished stimuli. Oneconsiderationmight be that the impoverished faces in the currentstudy might not be treated as faces by the brain. A stimulussuch as an impoverished face might be ambiguous, and wouldhence take a longer time to be evaluated and might requiremore detailed processing. This might manifest as increasedresponse time (for the detection of targets), as well as increasedN170 latencies (which were seen as a main effect for line-drawn vs. real stimuli). Coupled with the longer latency isalso an increased N170 amplitude (seen as a main effect forstimulus type for line faces and controls). The increased N170latencies and amplitudes observed here might potentially reflectthe more effortful processing that might be required of thesestimuli.
Some intriguing differences in N170 activity relating to dataof our control stimuli need to be addressed. In our originalstudy, the checkerboard controls had movements that were notcongruous with one another i.e., checks changed in two locationscorresponding to each eye in the real face, but moved in oppositelateral directions (Puce et al., 1998). The control stimuli werecreated deliberately in this fashion, as in the piloting of datafor the earlier study, subjects reported a very convincing andpersistent illusion of eyes that the checkerboard control stimulicreated. This created the unwanted confound of visualization inthe study. This effect was abolished by introducing a movementcondition where checks reversed in opposite directions, andwe used this control stimulus in our previous study (see
Frontiers in Human Neuroscience | www.frontiersin.org 11 March 2015 | Volume 9 | Article 185

Rossi et al. ERPs to changing gaze
Puce et al., 1998). In the current study we were concernedthat differences in the type of presented motion (congruousvs. incongruous) across the stimulus conditions may have, inpart, contributed to the differences in the neurophysiologicalresponse between faces and controls. Therefore, we chose tohave congruous motion for all stimulus types. Interestingly, indoing so we may well have created a stimulus-context effectfor the control stimuli—and have potentially allowed subjectsto ‘‘see’’ eyes in the control stimuli (as we had previouslyexperienced). This occurred only for the REAL CONTROLstimuli, and not for the LINE CONTROL stimuli—there wereno differences related to movement direction. So, we mighthave actually created an unexpected effect of stimulus-contextin this experiment, with the REAL FACES providing a contextfor the REAL CONTROLS (not unlike that seen by Bentinand Golland, 2002). Our original purpose for running theexperiment was to explore context effects related to eye gazechanges in LINE FACES in the presence of REAL FACES. Inthis latter case, we can state that no effect of stimulus context wasobserved.
The effects that are induced in N170 activity here underscorehow important low-level stimulus manipulations relatedto luminance/contrast and also motion can be, and thesehave the potential to interact with task-related variables.Hence, control stimuli of multiple types may have to beused in an experiment so as to understand the nature ofobserved differences in neurophysiological data across differentconditions.
EEG Spectral PowerTotal EEG spectral power to the very brief apparent motiontransition generated consistent prolonged bursts of activity intheta, beta and gamma EEG frequency bands which overallbehaved similarly across conditions in a task requiring detectingnegatives of the stimuli (see Figure 4). We expected to observeoscillatory EEG changes in beta and gamma bands that wouldoccur at different post-motion onset times for facial and controlmotion stimuli when statistical comparisons were made betweenconditions, in line with our previous study where participantsdetected color changes in line drawn face and control motionstimuli (Rossi et al., 2014). Statistically significant differencesbetween stimulus conditions were confined to the beta andgamma bands only. The main significant change in gammaactivity occurred at ∼200 and ∼300 ms post-motion onset forLINE faces bilaterally, but only in the left electrode cluster forREAL faces. Direct gaze transitions elicited stronger gammaamplitudes at ∼200 ms (for LINE and REAL faces), whereasaverted gaze elicited stronger gamma amplitudes at ∼300 ms.We speculate that these bursts of activity reflect processing offacial information, as these changes were not present in therespective control conditions (compare first and second rows ofFigure 5). REAL controls showed a gamma amplitude increment(∼40–50 Hz) for the Direct condition, which occurred ∼100 mslater than the gamma burst seen for REAL faces (compare secondand last rows, Figure 5). It may be that this gamma burstto the controls might be a general coherent motion effect indata that were sampled from our occipito-temporal electrode
clusters in a task where negative images of stimuli had to bedetected.
In our previous study, we examined ERSP changes toimpoverished line-drawn faces and controls only, where facialmovements included eye and mouth movements in a colordetection task that required a behavioral response for allpresented stimuli (Rossi et al., 2014). In that study we alsoobserved significant transient increases in the beta and gammaranges to the facial motion stimuli, but these changes inoscillatory activity tended to occur at different time pointsrelative to those seen in the current study. Gamma range changesto eye and mouth movements, if present, occurred much later intime relative to the current study e.g., after 400 ms post-motiononset relative to the changes at∼150–300ms in the current studyand favored direct gaze and mouth closing movements. Betarange changes, if present, showed a short burst at ∼100 ms anda more prolonged burst between 350–550 ms favoring avertedgaze (Rossi et al., 2014). In our previous study (Rossi et al.,2014) subjects viewed line-drawn face displays where the colorof the lines could be either white or red, with subjects havingto make a color decision on every seen motion transition. Inour current study, as we had both line-drawn and real faces inthe same experiment, we elected to use a target detection taskwhere subjects had to identify negatives of all stimulus types,to try to ensure that equal attention was given to all stimulustypes. Taken together, the ERSP findings of both studies wouldindicate that the significant differences in oscillatory behaviorwe observed at sites producing maximal ERP activity mightbe driven rather by task differences/decisions rather than themotion characteristics of the stimuli per se. Having said that, inboth studies, changes in oscillatory activity were different acrossfaces and respective controls, suggesting that changes in totaloscillatory activity post-motion onset may reflect a complex mixof task and stimulus-related properties. At this point in timemuch more data are needed to make sense of these changes inoscillatory activity to facial motion stimuli and their relationshipto ERP activity—it is not yet customary to perform both types ofanalysis in studies.
Caruana et al. (2014) performed an intracranial EEG studywhere ERPs and oscillatory activity were examined side-by-side.They presented epilepsy surgery patients with faces showingdynamic gaze changes while intracranial EEG was recordedfrom electrodes sited in the posterolateral temporal cortex.Intracranial N200 ERP activity (the analog of the scalp N170) andtransient broadband high frequency gamma band activity (outto 500 Hz) occurring at around the same time as the N200 wassignificantly larger when patients viewed averted gaze relative toeither direct gaze or lateral switching movements (Caruana et al.,2014). Lachaux et al. (2005) reported intracranial gamma-bandactivity in left fusiform gyrus, occipital gyrus and intraparietalsulcus for a static face detection task. Gamma band amplitude(40–200 Hz) significantly increased between 250–500 ms post-stimulus onset, and these condition differences were not presentin the ERP (Lachaux et al., 2005). In contrast, intracranialN200 activity and high frequency gamma activity in ventraltemporal cortex to viewing static faces has been documented(Engell and McCarthy, 2011). The presence of gamma activity
Frontiers in Human Neuroscience | www.frontiersin.org 12 March 2015 | Volume 9 | Article 185

Rossi et al. ERPs to changing gaze
in the ERSP predicted the presence and size of the N200 at aparticular site. Relevant to this study, however, N200 activitywas elicited to impoverished face stimuli, but notably gammaactivity was absent (Engell and McCarthy, 2011), indicating thatthe relationship between intracranial ERP activity and gammaactivity can be a very complex one. It is difficult to make acomparison between intracranial and scalp EEG studies, becausewith intracranial EEG high frequency gamma band activity canbe sampled, whereas in scalp EEG studies the skull effectivelyacts as a low pass filter so that gamma frequencies typicallywill be recorded only under 100 Hz (Srinivasan et al., 1996).Interestingly, impoverished face stimuli, as used in Engell andMcCarthy (2011) study and our study, do not appear to generateprominent gamma activity. In our study, stimuli tended to evokesustained activity in frequency ranges below gamma), gammaactivity was transient and was seen at around 200 ms post-motion onset in electrodes sited over lateral temporal scalp(Figure 4), similar to the broadband gamma reported in theintracranial EEG studies (e.g., Lachaux et al., 2005; Engell andMcCarthy, 2011; Caruana et al., 2014). In another scalp EEGstudy, Zion-Golumbic and Bentin (2007), noted that activity inthe 25–45 Hz range between 200–300 ms post-stimulus onset,was largest for (static) real faces compared to scrambled realfaces in midline parieto-occipital locations (Zion-Golumbic andBentin, 2007).
In our study, it is not entirely clear if the gamma activitycould be related to configurality, movement, or a combinationof both. However, we believe that the gamma responsesat ∼200 and ∼300 ms present both for LINE and REALstimuli reflect a preferential response to facial movement. Analternative explanation is that as a gamma response was seenfor LINE and REAL faces and controls, albeit at different post-motion onsets, these gamma responses might be correlatesof motion perception in the horizontal axis (see Figure 5).However, in our previous study we included mouth movements(with a large vertical component) in an impoverished face,and recorded gamma activity to both stimulus types (Rossiet al., 2014). From the relatively few existing studies in theliterature, it is clear that the relationship between oscillatoryEEG activity, including gamma, and stimulus and task typeis complex. Much further work to viewing motion stimuliwith different attributes (e.g., linear vs. non-linear, inward vs.outward radial, looming vs. receding) where ERP and ERSPactivity are directly compared will be needed to disentangle theseissues.
As noted earlier, LINE FACES and CONTROLS differ inconfiguration, but produce identical movements. A commonspectral change between LINE FACES and CONTROLS wasa decrement in beta power, maximal at ∼25 Hz for theconditions producing direct gaze (FACES) and a diamondshape (CONTROLS), albeit at slightly different time intervals(FACES from ∼215–300 ms, CONTROLS ∼300–400 ms). Sincethe common feature between these stimulus types is apparentmotion of identical numbers of pixels, these beta componentsmight be related to the encoding of the movement. Beta spectralpower has been previously associated with the perception andproduction of movement per se (Pfurtscheller et al., 1996;
Müller et al., 2003; Müller-Putz et al., 2007). However, the betachange for LINE FACES occurred earlier than that for LINECONTROLS. We have previously seen similar decreases in the20–30 Hz beta range for line-drawn faces producing identicallateral eye movements as those used in the current study (Rossiet al., 2014). However, in Rossi et al. (2014) decrements inbeta spectral power occurred later (∼400–550 ms). In these twostudies, participants were asked to respond to very differentstimulus attributes, and with different stimulus probability. InRossi et al. (2014) participants responded on every trial toindicate the color of the line-drawn stimulus (which variedrandomly fromwhite to red, and vice-versa). In the current study,participants responded to infrequent targets that were negativesof all stimuli. Hence, at this stage it is not possible to clarify thenature of the observed beta power change to the apparent motionstimulus.We do believe that these differences were driven by taskdemands, and will have to explicitly test this in future studies.
General Conclusions
We would advocate that future studies evaluate ERP and ERSPactivity in parallel, so that we can develop an understanding ofthe functional significance of each type of neurophysiologicalactivity, and how one might affect the other. Gaze changesproduced gamma activity irrespective of face type: direct gazeelicited more gamma at an earlier latency relative to avertedgaze. Overall, our N170 ERP peak analysis argues for theidea that gaze changes/eye movements in impoverished line-drawn faces do not trigger the neural responses that havebeen associated to the perception of socially relevant facialmotion (relevant for communicative behavior), replicating datain an earlier study (Rossi et al., 2014). In contrast, real facesin this study as well as others (e.g., Puce et al., 2000, 2003;Conty et al., 2007; Latinus et al., revised and resubmitted)show N170 sensitivity to gaze changes. Interestingly, differencesbetween our real faces and control stimuli were not as strongas we had previously demonstrated (Puce et al., 2000), andthis may be due to ability to potentially visualize our currentcontrols as faces. Overall our data indicate that N170s elicitedto social attention manipulations are not modulated by top-down processes (such as priming or context) for impoverishedfaces.
Taking together the findings of our previous and currentstudies, N170s to gaze changes appear to be generatedby different processes relative to mouth movements. Eyemovements/gaze changes in real faces generate local visuospatialluminance/contrast changes producing an N170 that altered bythe luminance/contrast change that occurs between changinggaze conditions. When gaze changes are presented in animpoverished face, there is no differential luminance/contrastchange and the N170 does not show modulation across gazeconditions. In contrast, mouth opening and closing movementsare a type of articulated biological motion, whose moving formmodulates N170 irrespective of whether the movement occursin a real or an impoverished face (Puce et al., 2003; Rossi et al.,2014), therefore largely independent of luminance/contrast. Yet,the motion of both face parts happens to elicit ERP activity at the
Frontiers in Human Neuroscience | www.frontiersin.org 13 March 2015 | Volume 9 | Article 185

Rossi et al. ERPs to changing gaze
same latency with a similar scalp topography that likely reflectsan aggregate of neural activity from various parts of motion-sensitive, as shown clearly by fMRI studies (e.g., Puce and Perrett,2003). The functional dynamics from this very heterogeneousbrain network will likely only be disentangled by aggregating thedata from a number of different investigations such as functionalconnectivity using fMRI, intracranial EEG and scalp EEG/MEGstudies which examine evoked and induced neurophysiological
activity in healthy subjects and individuals with neuropsychiatricdisorders.
Acknowledgments
AP, FJP, and AR were supported by NIH grant NS-049436.We also thank our participants, who made this experimentpossible.
References
Babiloni, C., Vecchio, F., Bultrini, A., Luca Romani, G., and Rossini, P. M.(2006). Pre- and poststimulus alpha rhythms are related to conscious visualperception: a high-resolution EEG study. Cereb. Cortex 16, 1690–1700. doi: 10.1093/cercor/bhj104
Basar, E., Schürmann, M., Basar-Eroglu, C., and Karakas, S. (1997). Alphaoscillations in brain functioning: an integrative theory. Int. J. Psychophysiol. 26,5–29. doi: 10.1016/s0167-8760(97)00753-8
Bassili, J. N. (1978). Facial motion in the perception of faces and of emotionalexpression. J. Exp. Psychol. Hum. Percept. Perform. 4, 373–379. doi: 10.1037//0096-1523.4.3.373
Bassili, J. N. (1979). Emotion recognition: the role of facial movement and therelative importance of upper and lower areas of the face. J. Pers. Soc. Psychol.37, 2049–2058. doi: 10.1037//0022-3514.37.11.2049
Beauchamp, M. S., Lee, K. E., Haxby, J. V., and Martin, A. (2002). Parallel visualmotion processing streams for manipulable objects and human movements.Neuron 34, 149–159. doi: 10.1016/s0896-6273(02)00642-6
Bell, A. J., and Sejnowski, T. J. (1995). An information-maximization approachto blind separation and blind deconvolution. Neural Comput. 7, 1129–1159.doi: 10.1162/neco.1995.7.6.1129
Benjamini, Y., and Hochberg, Y. (1995). Controlling the false discovery rate: apractical and powerful approach to multiple testing. J. Royal Stat. Soc. SeriesB Methodological 57, 289–300.
Bentin, S., Allison, T., Puce, A., Perez, E., and McCarthy, G. (1996).Electrophysiological studies of face perception in humans. J. Cogn. Neurosci.8, 551–565. doi: 10.1162/jocn.1996.8.6.551
Bentin, S., and Golland, Y. (2002). Meaningful processing of meaningless stimuli:the influence of perceptual experience on early visual processing of faces.Cognition 86, B1–B14. doi: 10.1016/s0010-0277(02)00124-5
Blake, R., and Shiffrar, M. (2007). Perception of human motion. Annu. Rev.Psychol. 58, 47–73. doi: 10.1146/annurev.psych.57.102904.190152
Bötzel, K., Schulze, S., and Stodieck, S. R. (1995). Scalp topography and analysisof intracranial sources of face-evoked potentials. Exp. Brain Res. 104, 135–143.doi: 10.1007/bf00229863
Brandt, M. E., and Jansen, B. H. (1991). The relationship between prestimulusalpha-amplitude and visual evoked-potential amplitude. Int. J. Neurosci. 61,261–268. doi: 10.3109/00207459108990744
Brefczynski-Lewis, J., Berrebi, M. E., McNeely, M. E., and Puce, A. (2011).In the blink of an eye: neural responses elicited to viewing the eye blinksof another individual. Front. Hum. Neurosci. 5:68. doi: 10.3389/fnhum.2011.00068
Brignani, D., Guzzon, D., Marzi, C. A., and Miniussi, C. (2009). Attentionalorienting induced by arrows and eye-gaze compared with an endogenouscue. Neuropsychologia 47, 370–381. doi: 10.1016/j.neuropsychologia.2008.09.011
Cacioppo, J. T. (1994). Social neuroscience: autonomic, neuroendocrine andimmune responses to stress. Psychophysiology 31, 113–128. doi: 10.1111/j.1469-8986.1994.tb01032.x
Cacioppo, J. T., Berntson, G. G., Sheridan, J. F., and McClintock, M. K. (2000).Multilevel integrative analyses of human behavior: social neuroscience and thecomplementing nature of social and biological approaches. Psychol. Bull. 126,829–843. doi: 10.1037/0033-2909.126.6.829
Carrick, O. K., Thompson, J. C., Epling, J. A., and Puce, A. (2007). It’s all inthe eyes: neural responses to socially significant gaze shifts. Neuroreport 18,763–766. doi: 10.1097/wnr.0b013e3280ebb44b
Caruana, F., Cantalupo, G., Lo Russo, G., Mai, R., Sartori, I., and Avanzini,P. (2014). Human cortical activity evoked by gaze shift observation: anintracranial EEG study. Hum. Brain Mapp. 35, 1515–1528. doi: 10.1002/hbm.22270
Conty, L., N’Diaye, K., Tijus, C., and George, N. (2007). When eye createsthe contact! ERP evidence for early dissociation between direct and avertedgaze motion processing. Neuropsychologia 45, 3024–3037. doi: 10.1016/j.neuropsychologia.2007.05.017
Deffke, I., Sander, T., Heidenreich, J., Sommer, W., Curio, G., Trahms, L., et al.(2007). MEG/EEG sources of the 170-ms response to faces are co-localizedin the fusiform gyrus. Neuroimage 35, 1495–1501. doi: 10.1016/j.neuroimage.2007.01.034
Delorme, A., and Makeig, S. (2004). EEGLAB: an open source toolbox for analysisof single-trial EEG dynamics including independent component analysis.J. Neurosci. Methods 134, 9–21. doi: 10.1016/j.jneumeth.2003.10.009
Dupierrix, E., de Boisferon, A. H., Méary, D., Lee, K., Quinn, P. C., Di Giorgio, E.,et al. (2014). Preference for human eyes in human infants. J. Exp. Child Psychol.23, 138–146. doi: 10.1016/j.jecp.2013.12.010
Eimer, M. (1998). Does the face-specific N170 component reflect the activity of aspecialized eye processor? Neuroreport 9, 2945–2948. doi: 10.1097/00001756-199809140-00005
Emery, N. J. (2000). The eyes have it: the neuroethology, function and evolutionof social gaze. Neurosci. Biobehav. Rev. 24, 581–604. doi: 10.1016/s0149-7634(00)00025-7
Engel, A. K., and Fries, P. (2010). Beta-band oscillations–signalling the status quo?Curr. Opin. Neurobiol. 20, 156–165. doi: 10.1016/j.conb.2010.02.015
Engell, A. D., and McCarthy, G. (2011). The relationship of gamma oscillationsand face-specific ERPs recorded subdurally from occipitotemporal cortex.Cereb. Cortex 21, 1213–1221. doi: 10.1093/cercor/bhq206
Ergenoglu, T., Demiralp, T., Bayraktaroglu, Z., Ergen, M., Beydagi, H., and Uresin,Y. (2004). Alpha rhythm of the EEG modulates visual detection performancein humans. Brain Res. Cogn. Brain Res. 20, 376–383. doi: 10.1016/j.cogbrainres.2004.03.009
Fries, P., Womelsdorf, T., Oostenveld, R., and Desimone, R. (2008). The effectsof visual stimulation and selective visual attention on rhythmic neuronalsynchronization in macaque area V4. J. Neurosci. 28, 4823–4835. doi: 10.1523/JNEUROSCI.4499-07.2008
George, N., Evans, J., Fiori, N., Davidoff, J., and Renault, B. (1996). Brain eventsrelated to normal and moderately scrambled faces. Cogn. Brain Res. 4, 65–76.doi: 10.1016/0926-6410(95)00045-3
Giese, M. A., and Poggio, T. (2003). Neural mechanisms for the recognitionof biological movements. Nat. Rev. Neurosci. 4, 179–192. doi: 10.1038/nrn1057
Grandchamp, R., and Delorme, A. (2011). Single-trial normalization for event-related spectral decomposition reduces sensitivity to noisy trials. Front. Psychol.2:236. doi: 10.3389/fpsyg.2011.00236
Grossmann, T., Johnson, M. H., Farroni, T., and Csibra, G. (2007). Socialperception in the infant brain: gamma oscillatory activity in response to eyegaze. Soc. Cogn. Affect. Neurosci. 2, 284–291. doi: 10.1093/scan/nsm025
Hadjikhani, N., Hoge, R., Snyder, J., and de Gelder, B. (2008). Pointing with theeyes: the role of gaze in communicating danger. Brain Cogn. 68, 1–8. doi: 10.1016/j.bandc.2008.01.008
Hardee, J. E., Thompson, J. C., and Puce, A. (2008). The left amygdala knows fear:laterality in the amygdala response to fearful eyes. Soc. Cogn. Affect. Neurosci.3, 47–54. doi: 10.1093/scan/nsn001
Frontiers in Human Neuroscience | www.frontiersin.org 14 March 2015 | Volume 9 | Article 185
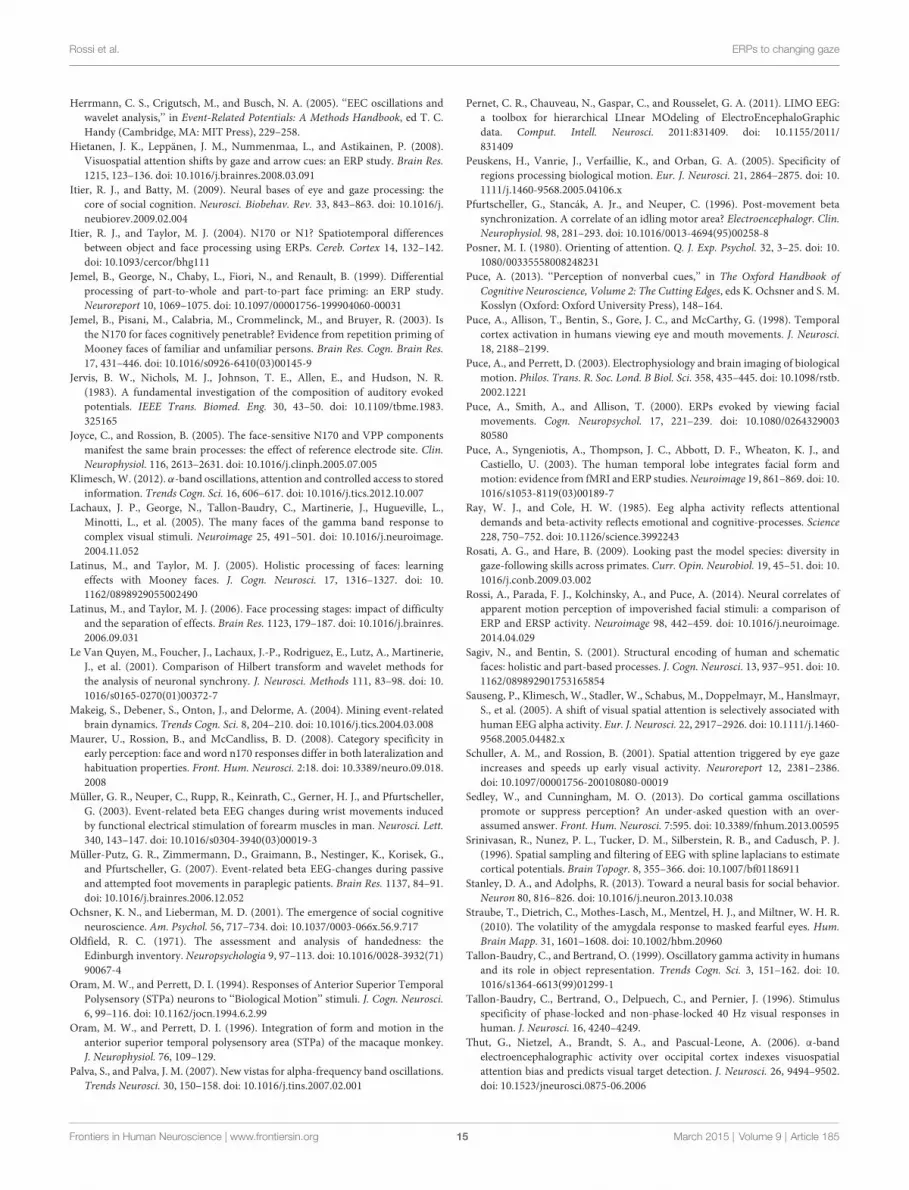
Rossi et al. ERPs to changing gaze
Herrmann, C. S., Crigutsch, M., and Busch, N. A. (2005). ‘‘EEC oscillations andwavelet analysis,’’ in Event-Related Potentials: A Methods Handbook, ed T. C.Handy (Cambridge, MA: MIT Press), 229–258.
Hietanen, J. K., Leppänen, J. M., Nummenmaa, L., and Astikainen, P. (2008).Visuospatial attention shifts by gaze and arrow cues: an ERP study. Brain Res.1215, 123–136. doi: 10.1016/j.brainres.2008.03.091
Itier, R. J., and Batty, M. (2009). Neural bases of eye and gaze processing: thecore of social cognition. Neurosci. Biobehav. Rev. 33, 843–863. doi: 10.1016/j.neubiorev.2009.02.004
Itier, R. J., and Taylor, M. J. (2004). N170 or N1? Spatiotemporal differencesbetween object and face processing using ERPs. Cereb. Cortex 14, 132–142.doi: 10.1093/cercor/bhg111
Jemel, B., George, N., Chaby, L., Fiori, N., and Renault, B. (1999). Differentialprocessing of part-to-whole and part-to-part face priming: an ERP study.Neuroreport 10, 1069–1075. doi: 10.1097/00001756-199904060-00031
Jemel, B., Pisani, M., Calabria, M., Crommelinck, M., and Bruyer, R. (2003). Isthe N170 for faces cognitively penetrable? Evidence from repetition priming ofMooney faces of familiar and unfamiliar persons. Brain Res. Cogn. Brain Res.17, 431–446. doi: 10.1016/s0926-6410(03)00145-9
Jervis, B. W., Nichols, M. J., Johnson, T. E., Allen, E., and Hudson, N. R.(1983). A fundamental investigation of the composition of auditory evokedpotentials. IEEE Trans. Biomed. Eng. 30, 43–50. doi: 10.1109/tbme.1983.325165
Joyce, C., and Rossion, B. (2005). The face-sensitive N170 and VPP componentsmanifest the same brain processes: the effect of reference electrode site. Clin.Neurophysiol. 116, 2613–2631. doi: 10.1016/j.clinph.2005.07.005
Klimesch,W. (2012). α-band oscillations, attention and controlled access to storedinformation. Trends Cogn. Sci. 16, 606–617. doi: 10.1016/j.tics.2012.10.007
Lachaux, J. P., George, N., Tallon-Baudry, C., Martinerie, J., Hugueville, L.,Minotti, L., et al. (2005). The many faces of the gamma band response tocomplex visual stimuli. Neuroimage 25, 491–501. doi: 10.1016/j.neuroimage.2004.11.052
Latinus, M., and Taylor, M. J. (2005). Holistic processing of faces: learningeffects with Mooney faces. J. Cogn. Neurosci. 17, 1316–1327. doi: 10.1162/0898929055002490
Latinus, M., and Taylor, M. J. (2006). Face processing stages: impact of difficultyand the separation of effects. Brain Res. 1123, 179–187. doi: 10.1016/j.brainres.2006.09.031
Le Van Quyen, M., Foucher, J., Lachaux, J.-P., Rodriguez, E., Lutz, A., Martinerie,J., et al. (2001). Comparison of Hilbert transform and wavelet methods forthe analysis of neuronal synchrony. J. Neurosci. Methods 111, 83–98. doi: 10.1016/s0165-0270(01)00372-7
Makeig, S., Debener, S., Onton, J., and Delorme, A. (2004). Mining event-relatedbrain dynamics. Trends Cogn. Sci. 8, 204–210. doi: 10.1016/j.tics.2004.03.008
Maurer, U., Rossion, B., and McCandliss, B. D. (2008). Category specificity inearly perception: face and word n170 responses differ in both lateralization andhabituation properties. Front. Hum. Neurosci. 2:18. doi: 10.3389/neuro.09.018.2008
Müller, G. R., Neuper, C., Rupp, R., Keinrath, C., Gerner, H. J., and Pfurtscheller,G. (2003). Event-related beta EEG changes during wrist movements inducedby functional electrical stimulation of forearm muscles in man. Neurosci. Lett.340, 143–147. doi: 10.1016/s0304-3940(03)00019-3
Müller-Putz, G. R., Zimmermann, D., Graimann, B., Nestinger, K., Korisek, G.,and Pfurtscheller, G. (2007). Event-related beta EEG-changes during passiveand attempted foot movements in paraplegic patients. Brain Res. 1137, 84–91.doi: 10.1016/j.brainres.2006.12.052
Ochsner, K. N., and Lieberman, M. D. (2001). The emergence of social cognitiveneuroscience. Am. Psychol. 56, 717–734. doi: 10.1037/0003-066x.56.9.717
Oldfield, R. C. (1971). The assessment and analysis of handedness: theEdinburgh inventory. Neuropsychologia 9, 97–113. doi: 10.1016/0028-3932(71)90067-4
Oram, M. W., and Perrett, D. I. (1994). Responses of Anterior Superior TemporalPolysensory (STPa) neurons to ‘‘Biological Motion’’ stimuli. J. Cogn. Neurosci.6, 99–116. doi: 10.1162/jocn.1994.6.2.99
Oram, M. W., and Perrett, D. I. (1996). Integration of form and motion in theanterior superior temporal polysensory area (STPa) of the macaque monkey.J. Neurophysiol. 76, 109–129.
Palva, S., and Palva, J. M. (2007). New vistas for alpha-frequency band oscillations.Trends Neurosci. 30, 150–158. doi: 10.1016/j.tins.2007.02.001
Pernet, C. R., Chauveau, N., Gaspar, C., and Rousselet, G. A. (2011). LIMO EEG:a toolbox for hierarchical LInear MOdeling of ElectroEncephaloGraphicdata. Comput. Intell. Neurosci. 2011:831409. doi: 10.1155/2011/831409
Peuskens, H., Vanrie, J., Verfaillie, K., and Orban, G. A. (2005). Specificity ofregions processing biological motion. Eur. J. Neurosci. 21, 2864–2875. doi: 10.1111/j.1460-9568.2005.04106.x
Pfurtscheller, G., Stancák, A. Jr., and Neuper, C. (1996). Post-movement betasynchronization. A correlate of an idling motor area? Electroencephalogr. Clin.Neurophysiol. 98, 281–293. doi: 10.1016/0013-4694(95)00258-8
Posner, M. I. (1980). Orienting of attention. Q. J. Exp. Psychol. 32, 3–25. doi: 10.1080/00335558008248231
Puce, A. (2013). ‘‘Perception of nonverbal cues,’’ in The Oxford Handbook ofCognitive Neuroscience, Volume 2: The Cutting Edges, eds K. Ochsner and S. M.Kosslyn (Oxford: Oxford University Press), 148–164.
Puce, A., Allison, T., Bentin, S., Gore, J. C., and McCarthy, G. (1998). Temporalcortex activation in humans viewing eye and mouth movements. J. Neurosci.18, 2188–2199.
Puce, A., and Perrett, D. (2003). Electrophysiology and brain imaging of biologicalmotion. Philos. Trans. R. Soc. Lond. B Biol. Sci. 358, 435–445. doi: 10.1098/rstb.2002.1221
Puce, A., Smith, A., and Allison, T. (2000). ERPs evoked by viewing facialmovements. Cogn. Neuropsychol. 17, 221–239. doi: 10.1080/026432900380580
Puce, A., Syngeniotis, A., Thompson, J. C., Abbott, D. F., Wheaton, K. J., andCastiello, U. (2003). The human temporal lobe integrates facial form andmotion: evidence from fMRI and ERP studies.Neuroimage 19, 861–869. doi: 10.1016/s1053-8119(03)00189-7
Ray, W. J., and Cole, H. W. (1985). Eeg alpha activity reflects attentionaldemands and beta-activity reflects emotional and cognitive-processes. Science228, 750–752. doi: 10.1126/science.3992243
Rosati, A. G., and Hare, B. (2009). Looking past the model species: diversity ingaze-following skills across primates. Curr. Opin. Neurobiol. 19, 45–51. doi: 10.1016/j.conb.2009.03.002
Rossi, A., Parada, F. J., Kolchinsky, A., and Puce, A. (2014). Neural correlates ofapparent motion perception of impoverished facial stimuli: a comparison ofERP and ERSP activity. Neuroimage 98, 442–459. doi: 10.1016/j.neuroimage.2014.04.029
Sagiv, N., and Bentin, S. (2001). Structural encoding of human and schematicfaces: holistic and part-based processes. J. Cogn. Neurosci. 13, 937–951. doi: 10.1162/089892901753165854
Sauseng, P., Klimesch, W., Stadler, W., Schabus, M., Doppelmayr, M., Hanslmayr,S., et al. (2005). A shift of visual spatial attention is selectively associated withhuman EEG alpha activity. Eur. J. Neurosci. 22, 2917–2926. doi: 10.1111/j.1460-9568.2005.04482.x
Schuller, A. M., and Rossion, B. (2001). Spatial attention triggered by eye gazeincreases and speeds up early visual activity. Neuroreport 12, 2381–2386.doi: 10.1097/00001756-200108080-00019
Sedley, W., and Cunningham, M. O. (2013). Do cortical gamma oscillationspromote or suppress perception? An under-asked question with an over-assumed answer. Front. Hum. Neurosci. 7:595. doi: 10.3389/fnhum.2013.00595
Srinivasan, R., Nunez, P. L., Tucker, D. M., Silberstein, R. B., and Cadusch, P. J.(1996). Spatial sampling and filtering of EEG with spline laplacians to estimatecortical potentials. Brain Topogr. 8, 355–366. doi: 10.1007/bf01186911
Stanley, D. A., and Adolphs, R. (2013). Toward a neural basis for social behavior.Neuron 80, 816–826. doi: 10.1016/j.neuron.2013.10.038
Straube, T., Dietrich, C., Mothes-Lasch, M., Mentzel, H. J., and Miltner, W. H. R.(2010). The volatility of the amygdala response to masked fearful eyes. Hum.Brain Mapp. 31, 1601–1608. doi: 10.1002/hbm.20960
Tallon-Baudry, C., and Bertrand, O. (1999). Oscillatory gamma activity in humansand its role in object representation. Trends Cogn. Sci. 3, 151–162. doi: 10.1016/s1364-6613(99)01299-1
Tallon-Baudry, C., Bertrand, O., Delpuech, C., and Pernier, J. (1996). Stimulusspecificity of phase-locked and non-phase-locked 40 Hz visual responses inhuman. J. Neurosci. 16, 4240–4249.
Thut, G., Nietzel, A., Brandt, S. A., and Pascual-Leone, A. (2006). α-bandelectroencephalographic activity over occipital cortex indexes visuospatialattention bias and predicts visual target detection. J. Neurosci. 26, 9494–9502.doi: 10.1523/jneurosci.0875-06.2006
Frontiers in Human Neuroscience | www.frontiersin.org 15 March 2015 | Volume 9 | Article 185

Rossi et al. ERPs to changing gaze
Watanabe, S., Miki, K., and Kakigi, R. (2002). Gaze direction affects faceperception in humans. Neurosci. Lett. 325, 163–166. doi: 10.1016/s0304-3940(02)00257-4
Whalen, P. J., Kagan, J., Cook, R. G., Davis, F. C., Kim, H., Polis, S., et al. (2004).Human amygdala responsivity to masked fearful eye whites. Science 306:2061.doi: 10.1126/science.1103617
Worden, M. S., Foxe, J. J., Wang, N., and Simpson, G. V. (2000). Anticipatorybiasing of visuospatial attention indexed by retinotopically specific alpha-bandelectroencephalography increases over occipital cortex. J. Neurosci. 20:RC63.
Zion-Golumbic, E., and Bentin, S. (2007). Dissociated neural mechanisms forface detection and configural encoding: evidence from N170 and inducedgamma-band oscillation effects. Cereb. Cortex 17, 1741–1749. doi: 10.1093/cercor/bhl100
Conflict of Interest Statement: The authors declare that the research wasconducted in the absence of any commercial or financial relationships that couldbe construed as a potential conflict of interest. The Guest Associate Editor DavideRivolta declares that, despite having collaborated with author Ania Puce, thereview process was handled objectively and no conflict of interest exists.
Copyright © 2015 Rossi, Parada, Latinus and Puce. This is an open-accessarticle distributed under the terms of the Creative Commons Attribution License(CC BY). The use, distribution and reproduction in other forums is permitted,provided the original author(s) or licensor are credited and that the originalpublication in this journal is cited, in accordance with accepted academic practice.No use, distribution or reproduction is permitted which does not comply withthese terms.
Frontiers in Human Neuroscience | www.frontiersin.org 16 March 2015 | Volume 9 | Article 185