phonon interference effects in molecular junctions
TRANSCRIPT
Phonon Interference Effects in Molecular Junctions
Troels Markussen1, ∗
1Center for Atomic-scale Materials Design (CAMD), Department of Physics,Technical University of Denmark, DK-2800 Kgs. Lyngby, Denmark
(Dated: August 13, 2013)
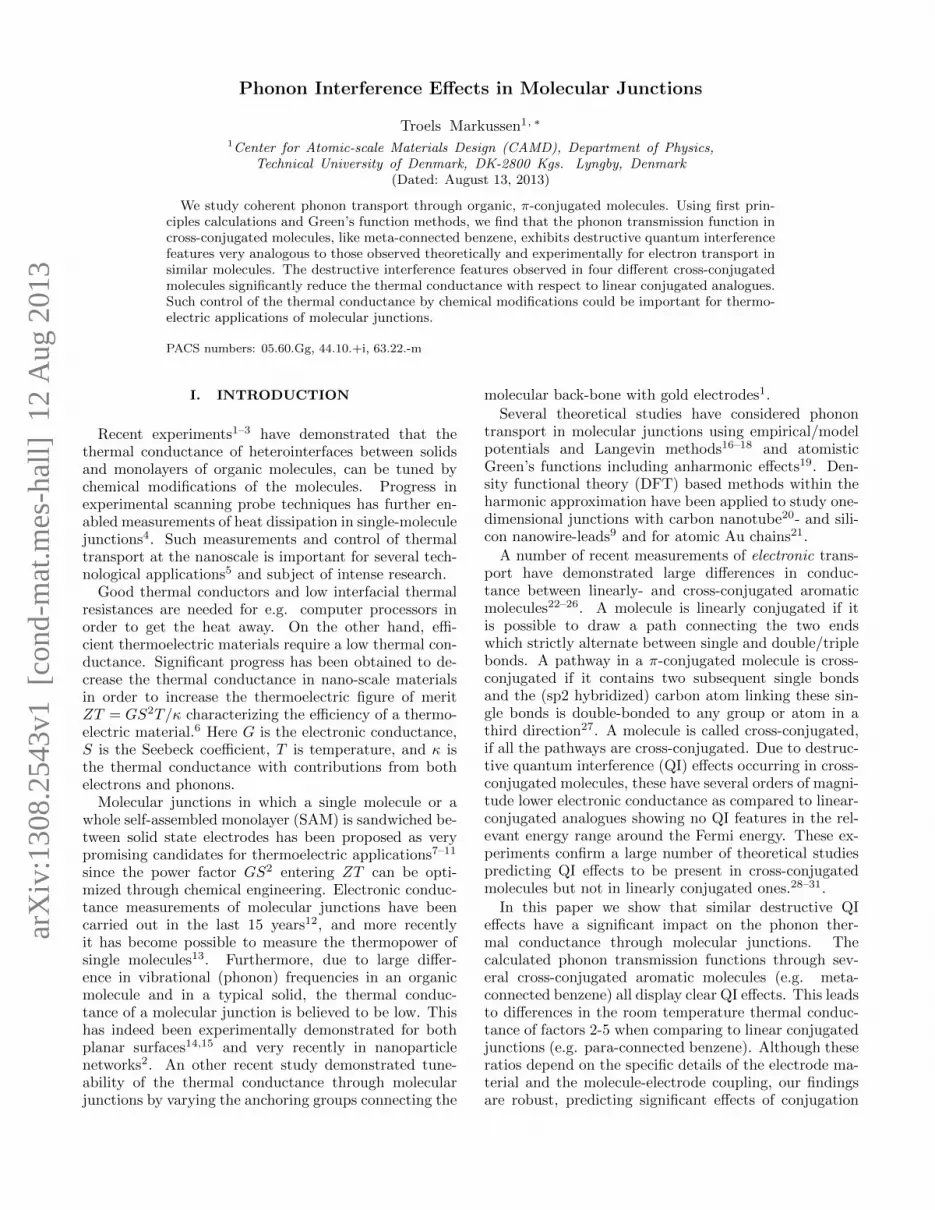
We study coherent phonon transport through organic, π-conjugated molecules. Using first prin-ciples calculations and Green’s function methods, we find that the phonon transmission function incross-conjugated molecules, like meta-connected benzene, exhibits destructive quantum interferencefeatures very analogous to those observed theoretically and experimentally for electron transport insimilar molecules. The destructive interference features observed in four different cross-conjugatedmolecules significantly reduce the thermal conductance with respect to linear conjugated analogues.Such control of the thermal conductance by chemical modifications could be important for thermo-electric applications of molecular junctions.
PACS numbers: 05.60.Gg, 44.10.+i, 63.22.-m
I. INTRODUCTION
Recent experiments1–3 have demonstrated that thethermal conductance of heterointerfaces between solidsand monolayers of organic molecules, can be tuned bychemical modifications of the molecules. Progress inexperimental scanning probe techniques has further en-abled measurements of heat dissipation in single-moleculejunctions4. Such measurements and control of thermaltransport at the nanoscale is important for several tech-nological applications5 and subject of intense research.
Good thermal conductors and low interfacial thermalresistances are needed for e.g. computer processors inorder to get the heat away. On the other hand, effi-cient thermoelectric materials require a low thermal con-ductance. Significant progress has been obtained to de-crease the thermal conductance in nano-scale materialsin order to increase the thermoelectric figure of meritZT = GS2T/κ characterizing the efficiency of a thermo-electric material.6 Here G is the electronic conductance,S is the Seebeck coefficient, T is temperature, and κ isthe thermal conductance with contributions from bothelectrons and phonons.
Molecular junctions in which a single molecule or awhole self-assembled monolayer (SAM) is sandwiched be-tween solid state electrodes has been proposed as verypromising candidates for thermoelectric applications7–11
since the power factor GS2 entering ZT can be opti-mized through chemical engineering. Electronic conduc-tance measurements of molecular junctions have beencarried out in the last 15 years12, and more recentlyit has become possible to measure the thermopower ofsingle molecules13. Furthermore, due to large differ-ence in vibrational (phonon) frequencies in an organicmolecule and in a typical solid, the thermal conduc-tance of a molecular junction is believed to be low. Thishas indeed been experimentally demonstrated for bothplanar surfaces14,15 and very recently in nanoparticlenetworks2. An other recent study demonstrated tune-ability of the thermal conductance through molecularjunctions by varying the anchoring groups connecting the
molecular back-bone with gold electrodes1.Several theoretical studies have considered phonon
transport in molecular junctions using empirical/modelpotentials and Langevin methods16–18 and atomisticGreen’s functions including anharmonic effects19. Den-sity functional theory (DFT) based methods within theharmonic approximation have been applied to study one-dimensional junctions with carbon nanotube20- and sili-con nanowire-leads9 and for atomic Au chains21.
A number of recent measurements of electronic trans-port have demonstrated large differences in conduc-tance between linearly- and cross-conjugated aromaticmolecules22–26. A molecule is linearly conjugated if itis possible to draw a path connecting the two endswhich strictly alternate between single and double/triplebonds. A pathway in a π-conjugated molecule is cross-conjugated if it contains two subsequent single bondsand the (sp2 hybridized) carbon atom linking these sin-gle bonds is double-bonded to any group or atom in athird direction27. A molecule is called cross-conjugated,if all the pathways are cross-conjugated. Due to destruc-tive quantum interference (QI) effects occurring in cross-conjugated molecules, these have several orders of magni-tude lower electronic conductance as compared to linear-conjugated analogues showing no QI features in the rel-evant energy range around the Fermi energy. These ex-periments confirm a large number of theoretical studiespredicting QI effects to be present in cross-conjugatedmolecules but not in linearly conjugated ones.28–31.
In this paper we show that similar destructive QIeffects have a significant impact on the phonon ther-mal conductance through molecular junctions. Thecalculated phonon transmission functions through sev-eral cross-conjugated aromatic molecules (e.g. meta-connected benzene) all display clear QI effects. This leadsto differences in the room temperature thermal conduc-tance of factors 2-5 when comparing to linear conjugatedjunctions (e.g. para-connected benzene). Although theseratios depend on the specific details of the electrode ma-terial and the molecule-electrode coupling, our findingsare robust, predicting significant effects of conjugation
arX
iv:1
308.
2543
v1 [
cond
-mat
.mes
-hal
l] 1
2 A
ug 2
013
2
pattern on the phonon thermal conductance. Phononinterference effects have recently been studied theoret-ically for alkane SAM interfaces as function of SAMthickness18,32. However, the observed Fabry-Perot likeinterference effects are constructive and the linear alka-nes do not lead to complete destructive QI as is the casefor the cross-conjugate aromatic molecules studied here.
In the remaining parts of the paper we first describeour computational methods. This is followed by a resultssection where we first consider a prototypical model inthe case of benzene described with a simple model. Wenext consider the more realistic OPE3 molecule as wellas other molecules using DFT and empirical potentialmethods. We end up with a discussion and conclusion.
II. METHODS
In this work we limit ourself to the harmonic approx-imation, thus neglecting anharmonic phonon-phononscattering. This is a reasonable approximation sinceanharmonic scattering is of limited importance due tothe shortness of the molecular junction16. In the har-monic approximation, the phononic system is fully de-termined by the force constant matrix, K, which con-tains the spring constants between atoms I and J in di-rections µ and ν. We calculate K using either densityfunctional theory (DFT) or the semi-empirical Brennerforce field33 as implemented in the ’general utility lat-tice program’ (GULP)34. For the DFT calculations weuse GPAW35, which is an electronic structure code basedon the projector-augmented wave method. The DFTcalculations are performed with a double zeta polarizedatomic orbital basis set and the exchange correlation po-tential described by the Perdew-Burke-Ernzerhof (PBE)functional36.
After an initial relaxation, each atom, I, is displacedby QIµ in direction µ = {x, y, z} to obtain the forces,FJν(QIµ), on atom J 6= I in direction ν. The structureis initially relaxed with a maximum residual force of 0.01eV/A. The ions are displaces by QIµ = ±0.05 A. Theforce constant matrix, K, is then found by finite differ-ences
KIµ,Jν =∂2E
∂RIµ∂RJν=FJν(QIµ)− FJν(−QIµ)
2QIµ, (1)
with E being the total energy. The intra-atomic ele-ments are calculated by imposing momentum conserva-tion, such that KIµ,Iν = −
∑K 6=I KIµ,Kν . From the
force constant matrix we obtain the dynamical matrix,D, with DIµ,Jν = KIµ,Jν/
√MIMJ , where MI is the
mass of atom I. The phonon eigen-frequencies, ωi andeigenmodes, ui are obtained from the equation of motion
Dui = ω2i ui. (2)
The phonon transmission function is calculated as19
T (ω) = Tr [Gr(ω)ΓL(ω)Ga(ω)ΓR(ω)] , (3)
where Gr(ω) = (ω2 − D − ΣL − ΣR)−1 is the retarded(advanced) Green’s function, and ΓL,R(ω) = i(ΣrL,R(ω)−ΣaL,R(ω)) describes the coupling to the left and right
leads expressed in terms of the lead self-energies ΣL,R(ω).We have used the Brenner potential33 to simulate sili-con nanowire (SiNW) and graphene nanoribbon (GNR)leads. In this case we get an atomistic description of theleads and the self-energies. In addition to this, we alsotake a simpler approach, where we compute the dynam-ical matrix for a free molecule with DFT, and followingMingo19 we model the lead surface density of states usingan analytical form ρ(ω) = − 1
π Img0(ω) = 3ω2ω3
DΘ(ωD − ω)
for the imaginary part of the surface Green’s functiong0(ω). The corresponding real part is obtained from aHilbert transformation. We thus characterize the bareleads with a single parameter, ωD. Unless otherwise no-ticed, we use ~ωD = 70meV , thus resembling a phonondensity of states similar to that of e.g. silicon. We alsouse the atomic mass of silicon for the lead mass, ML. Aplot of the real- and imaginary part of g0(ω) is providedin Appendix A. The surface Green’s functions g0(ω) donot include the coupling to the molecule. To include this,we use the Dyson equation19 to get
g(ω) = g0(ω)[1 + γg0(ω)]−1, (4)
where γ = γ/√McML is the mass-scaled coupling force
constant between the leads and the molecule, and Mc andML are the carbon- and lead atomic masses. We char-acterize the molecule-lead coupling with two adjustableparameters describing the out-of-plane motion (γz) andthe in-plane motion (γxy). In all calculations shown be-
low we use γz = −4.0 eV/A2. For some calculations weonly consider out-of-plane (z-direction) motion, in whichcase we set γxy = 0. Otherwise we use γxy = γz. Thelead self-energy on the molecule is finally
Σν(ω) = γ2νg(ω), (5)
for each degree of freedom ν = {x, y, z}. Assuming thatsite 1 and N on the molecule are connected to the leftand right leads, we have for the self-energy matrices[ΣL(ω)]1ν,1ν = Σν(ω) and [ΣR(ω)]Nν,Nν = Σν(ω) withzeros elsewhere. After coupling the molecule and theleads, the force constant matrix from the free moleculeis corrected in order to fulfill momentum conservation.Assuming again that site 1 (N) are connected to the left(right) leads we change on-site elements K1(N)ν,1(N)ν →K1(N)ν,1(N)ν − γν with ν = {x, y, z}. While the simpli-fied description of the leads does not capture all detailsof a real surface, the focus in this paper is on the intrin-sic phonon transport properties of the molecule, whichare robust against the specific coupling to the leads, asshown below.
From the phonon transmission function T (ω), thephonon thermal conductance is calculated as
κph(T ) =~2
2πkBT 2
∫ ∞0
dω ω2 T (ω)e~ω/kBT
(e~ω/kBT − 1)2, (6)
3
where T is the average temperature of the left- and rightleads.
III. RESULTS
A. Benzene - simple model
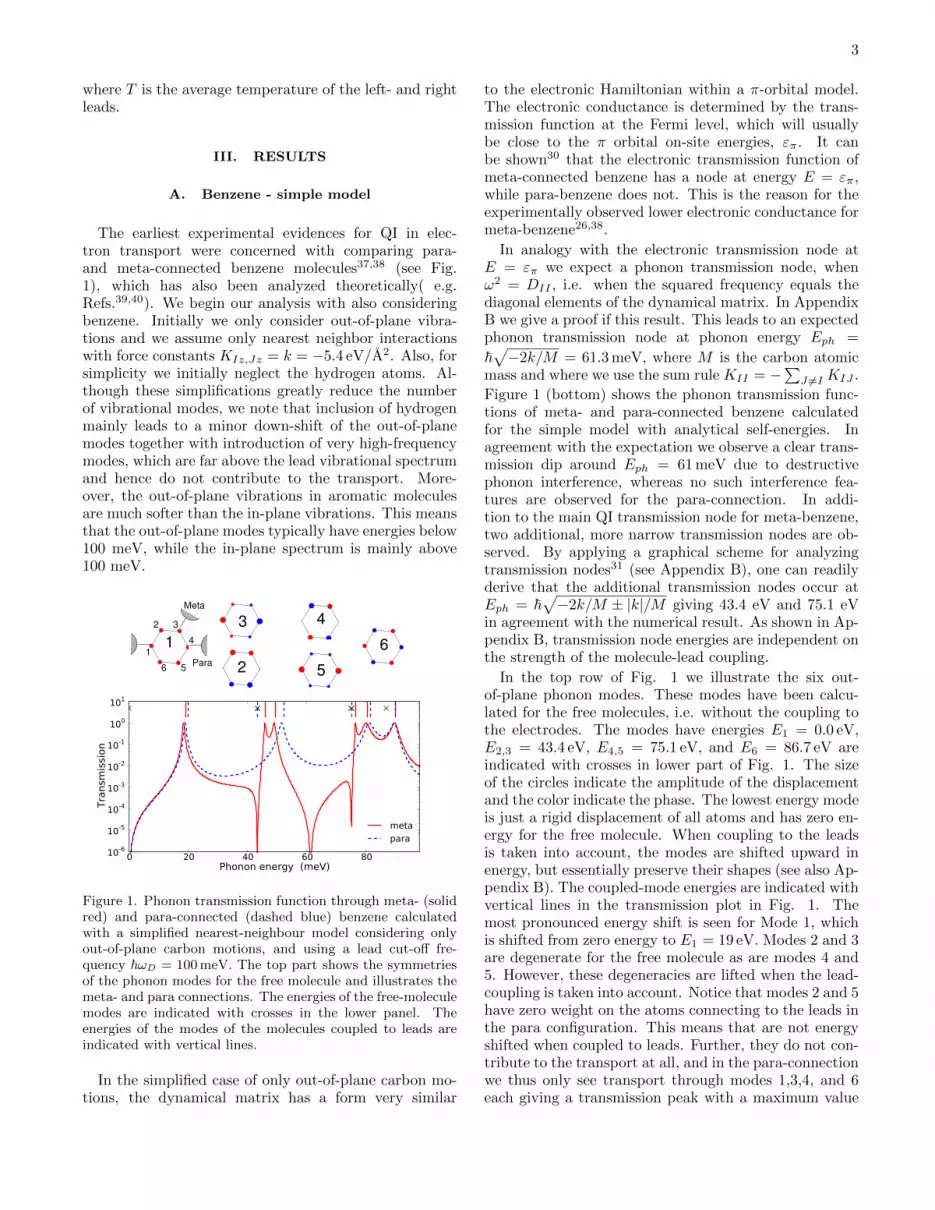
The earliest experimental evidences for QI in elec-tron transport were concerned with comparing para-and meta-connected benzene molecules37,38 (see Fig.1), which has also been analyzed theoretically( e.g.Refs.39,40). We begin our analysis with also consideringbenzene. Initially we only consider out-of-plane vibra-tions and we assume only nearest neighbor interactionswith force constants KIz,Jz = k = −5.4 eV/A2. Also, forsimplicity we initially neglect the hydrogen atoms. Al-though these simplifications greatly reduce the numberof vibrational modes, we note that inclusion of hydrogenmainly leads to a minor down-shift of the out-of-planemodes together with introduction of very high-frequencymodes, which are far above the lead vibrational spectrumand hence do not contribute to the transport. More-over, the out-of-plane vibrations in aromatic moleculesare much softer than the in-plane vibrations. This meansthat the out-of-plane modes typically have energies below100 meV, while the in-plane spectrum is mainly above100 meV.
0 20 40 60 80Phonon energy (meV)
10-6
10-5
10-4
10-3
10-2
10-1
100
101
Tra
nsm
issi
on
meta
para
3
2 5
4
611
2 3
4
6 5Para
Meta
Figure 1. Phonon transmission function through meta- (solidred) and para-connected (dashed blue) benzene calculatedwith a simplified nearest-neighbour model considering onlyout-of-plane carbon motions, and using a lead cut-off fre-quency ~ωD = 100 meV. The top part shows the symmetriesof the phonon modes for the free molecule and illustrates themeta- and para connections. The energies of the free-moleculemodes are indicated with crosses in the lower panel. Theenergies of the modes of the molecules coupled to leads areindicated with vertical lines.
In the simplified case of only out-of-plane carbon mo-tions, the dynamical matrix has a form very similar
to the electronic Hamiltonian within a π-orbital model.The electronic conductance is determined by the trans-mission function at the Fermi level, which will usuallybe close to the π orbital on-site energies, επ. It canbe shown30 that the electronic transmission function ofmeta-connected benzene has a node at energy E = επ,while para-benzene does not. This is the reason for theexperimentally observed lower electronic conductance formeta-benzene26,38.
In analogy with the electronic transmission node atE = επ we expect a phonon transmission node, whenω2 = DII , i.e. when the squared frequency equals thediagonal elements of the dynamical matrix. In AppendixB we give a proof if this result. This leads to an expectedphonon transmission node at phonon energy Eph =
~√−2k/M = 61.3 meV, where M is the carbon atomic
mass and where we use the sum rule KII = −∑J 6=I KIJ .
Figure 1 (bottom) shows the phonon transmission func-tions of meta- and para-connected benzene calculatedfor the simple model with analytical self-energies. Inagreement with the expectation we observe a clear trans-mission dip around Eph = 61 meV due to destructivephonon interference, whereas no such interference fea-tures are observed for the para-connection. In addi-tion to the main QI transmission node for meta-benzene,two additional, more narrow transmission nodes are ob-served. By applying a graphical scheme for analyzingtransmission nodes31 (see Appendix B), one can readilyderive that the additional transmission nodes occur atEph = ~
√−2k/M ± |k|/M giving 43.4 eV and 75.1 eV
in agreement with the numerical result. As shown in Ap-pendix B, transmission node energies are independent onthe strength of the molecule-lead coupling.
In the top row of Fig. 1 we illustrate the six out-of-plane phonon modes. These modes have been calcu-lated for the free molecules, i.e. without the coupling tothe electrodes. The modes have energies E1 = 0.0 eV,E2,3 = 43.4 eV, E4,5 = 75.1 eV, and E6 = 86.7 eV areindicated with crosses in lower part of Fig. 1. The sizeof the circles indicate the amplitude of the displacementand the color indicate the phase. The lowest energy modeis just a rigid displacement of all atoms and has zero en-ergy for the free molecule. When coupling to the leadsis taken into account, the modes are shifted upward inenergy, but essentially preserve their shapes (see also Ap-pendix B). The coupled-mode energies are indicated withvertical lines in the transmission plot in Fig. 1. Themost pronounced energy shift is seen for Mode 1, whichis shifted from zero energy to E1 = 19 eV. Modes 2 and 3are degenerate for the free molecule as are modes 4 and5. However, these degeneracies are lifted when the lead-coupling is taken into account. Notice that modes 2 and 5have zero weight on the atoms connecting to the leads inthe para configuration. This means that are not energyshifted when coupled to leads. Further, they do not con-tribute to the transport at all, and in the para-connectionwe thus only see transport through modes 1,3,4, and 6each giving a transmission peak with a maximum value
4
of 1. In the meta-configuration all modes are coupled tothe electrodes and we observe six distinct peaks in thetransmission function.
(a)
(b)
3 3+4
3−44
Fano model
Phonon eigen−modes Localized phonons
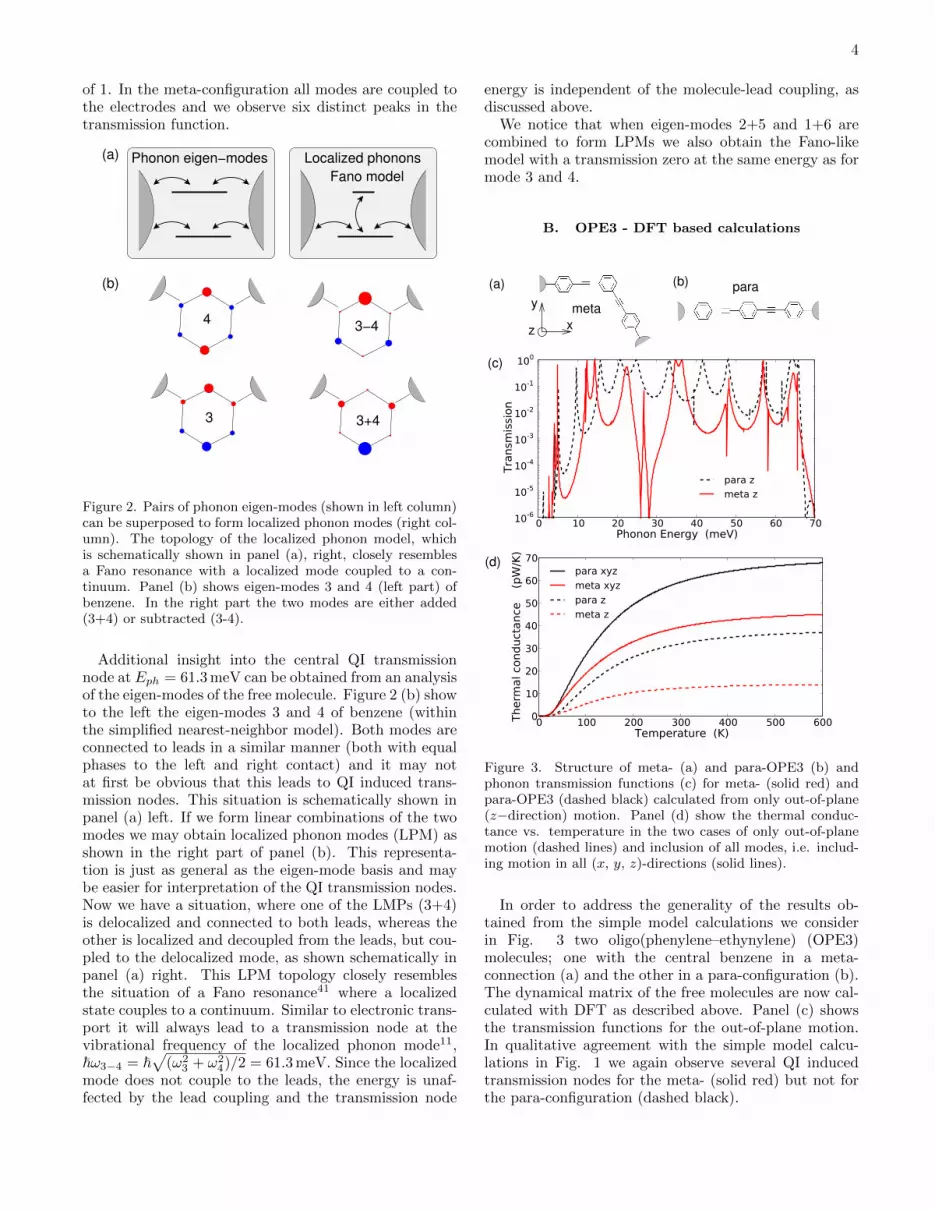
Figure 2. Pairs of phonon eigen-modes (shown in left column)can be superposed to form localized phonon modes (right col-umn). The topology of the localized phonon model, whichis schematically shown in panel (a), right, closely resemblesa Fano resonance with a localized mode coupled to a con-tinuum. Panel (b) shows eigen-modes 3 and 4 (left part) ofbenzene. In the right part the two modes are either added(3+4) or subtracted (3-4).
Additional insight into the central QI transmissionnode at Eph = 61.3 meV can be obtained from an analysisof the eigen-modes of the free molecule. Figure 2 (b) showto the left the eigen-modes 3 and 4 of benzene (withinthe simplified nearest-neighbor model). Both modes areconnected to leads in a similar manner (both with equalphases to the left and right contact) and it may notat first be obvious that this leads to QI induced trans-mission nodes. This situation is schematically shown inpanel (a) left. If we form linear combinations of the twomodes we may obtain localized phonon modes (LPM) asshown in the right part of panel (b). This representa-tion is just as general as the eigen-mode basis and maybe easier for interpretation of the QI transmission nodes.Now we have a situation, where one of the LMPs (3+4)is delocalized and connected to both leads, whereas theother is localized and decoupled from the leads, but cou-pled to the delocalized mode, as shown schematically inpanel (a) right. This LPM topology closely resemblesthe situation of a Fano resonance41 where a localizedstate couples to a continuum. Similar to electronic trans-port it will always lead to a transmission node at thevibrational frequency of the localized phonon mode11,~ω3−4 = ~
√(ω2
3 + ω24)/2 = 61.3 meV. Since the localized
mode does not couple to the leads, the energy is unaf-fected by the lead coupling and the transmission node
energy is independent of the molecule-lead coupling, asdiscussed above.
We notice that when eigen-modes 2+5 and 1+6 arecombined to form LPMs we also obtain the Fano-likemodel with a transmission zero at the same energy as formode 3 and 4.
B. OPE3 - DFT based calculations
0 100 200 300 400 500 600Temperature (K)
0
10
20
30
40
50
60
70
Therm
al co
nduct
ance
(p
W/K
)
para xyz
meta xyz
para z
meta z
x
y
z
0 10 20 30 40 50 60 70Phonon Energy (meV)
10-6
10-5
10-4
10-3
10-2
10-1
100
Tra
nsm
issi
on
para z
meta z
(c)
(a)
meta
(b) para
(d)
Figure 3. Structure of meta- (a) and para-OPE3 (b) andphonon transmission functions (c) for meta- (solid red) andpara-OPE3 (dashed black) calculated from only out-of-plane(z−direction) motion. Panel (d) show the thermal conduc-tance vs. temperature in the two cases of only out-of-planemotion (dashed lines) and inclusion of all modes, i.e. includ-ing motion in all (x, y, z)-directions (solid lines).
In order to address the generality of the results ob-tained from the simple model calculations we considerin Fig. 3 two oligo(phenylene–ethynylene) (OPE3)molecules; one with the central benzene in a meta-connection (a) and the other in a para-configuration (b).The dynamical matrix of the free molecules are now cal-culated with DFT as described above. Panel (c) showsthe transmission functions for the out-of-plane motion.In qualitative agreement with the simple model calcu-lations in Fig. 1 we again observe several QI inducedtransmission nodes for the meta- (solid red) but not forthe para-configuration (dashed black).
5
7
ω=1.23
10
ω=5.27
11
ω=6.47
13
ω=15.46
14
ω=17.75
17
ω=33.14
19
ω=34.67
20
ω=46.78
21
ω=47.18
22
ω=48.15
23
ω=48.21
25
ω=56.58
29
ω=63.52
30
ω=64.07
33
ω=73.05
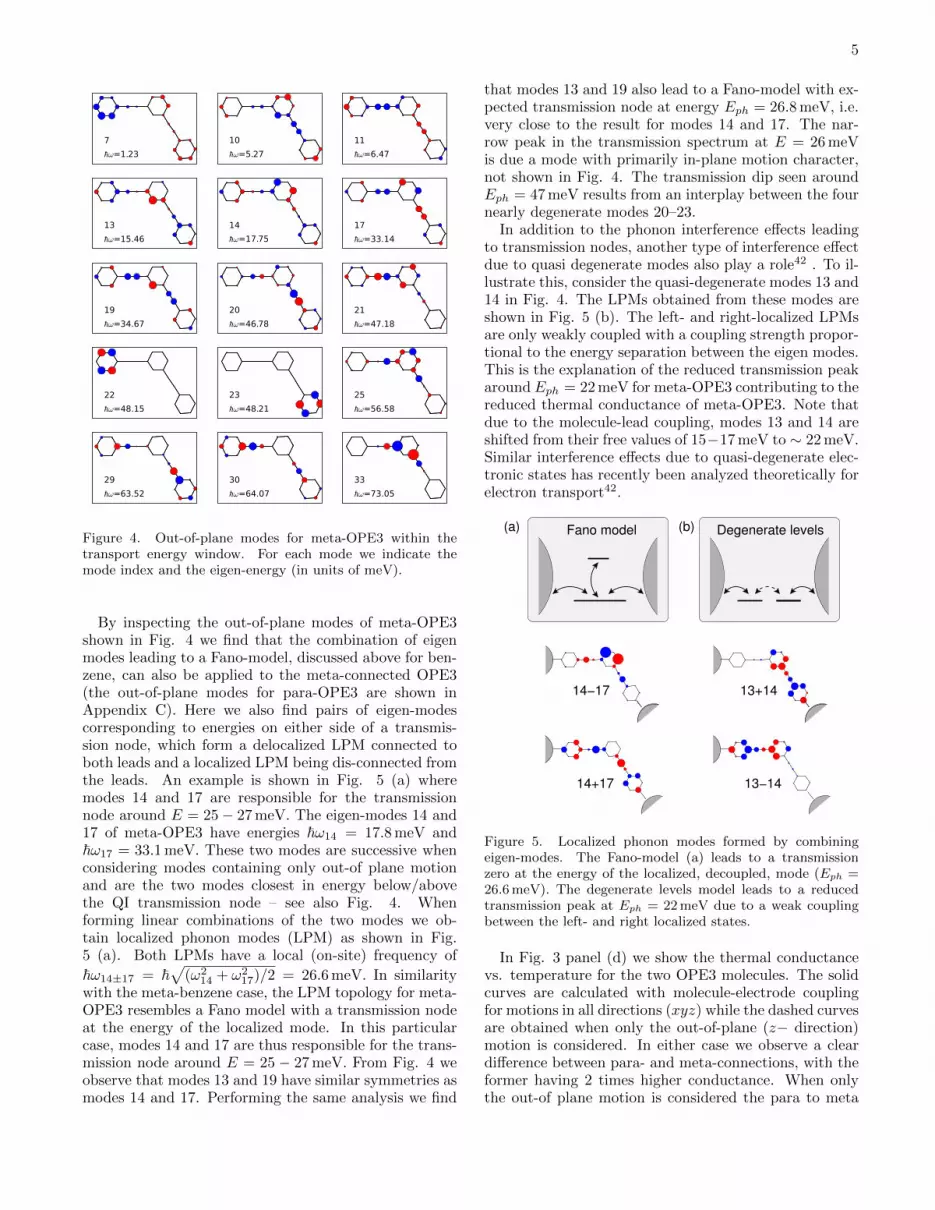
Figure 4. Out-of-plane modes for meta-OPE3 within thetransport energy window. For each mode we indicate themode index and the eigen-energy (in units of meV).
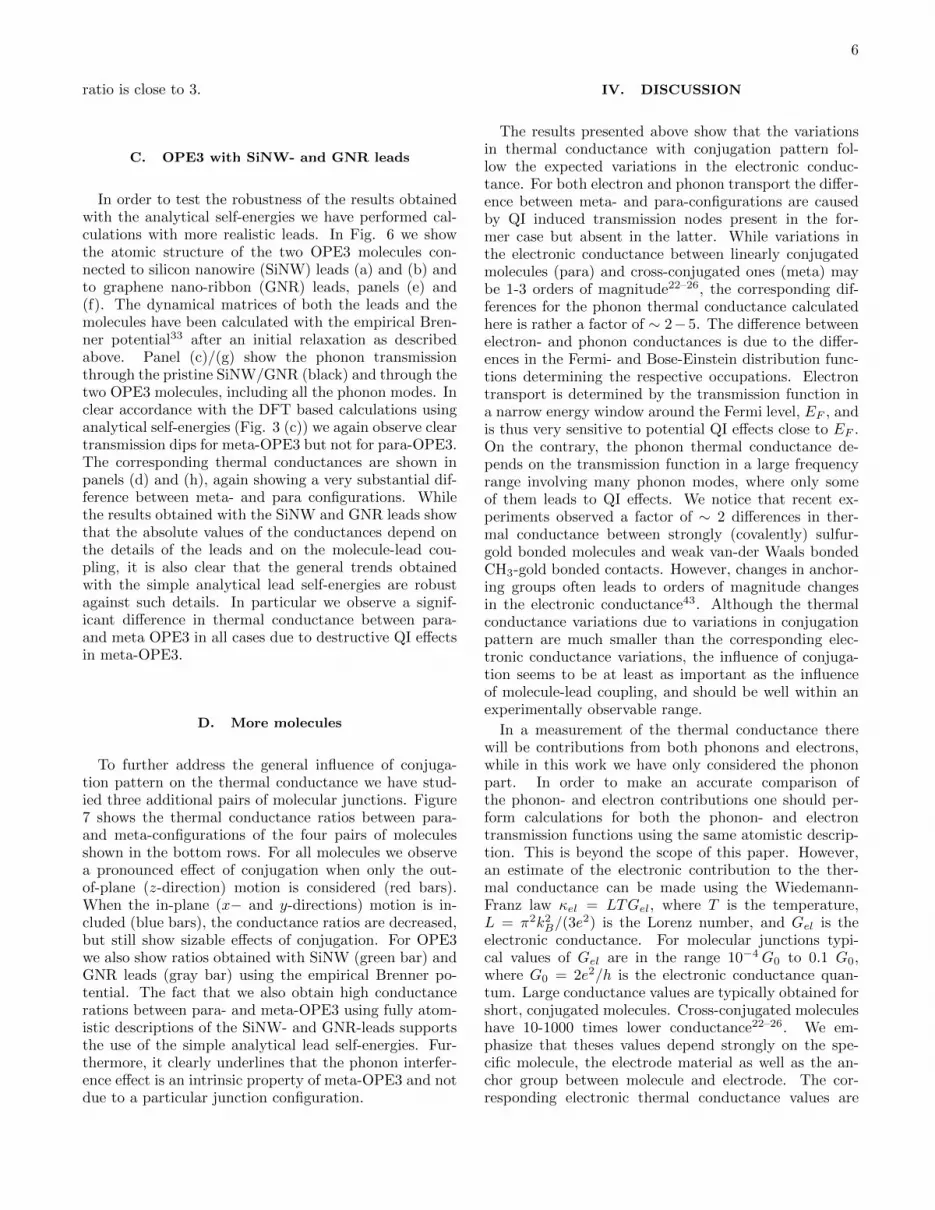
By inspecting the out-of-plane modes of meta-OPE3shown in Fig. 4 we find that the combination of eigenmodes leading to a Fano-model, discussed above for ben-zene, can also be applied to the meta-connected OPE3(the out-of-plane modes for para-OPE3 are shown inAppendix C). Here we also find pairs of eigen-modescorresponding to energies on either side of a transmis-sion node, which form a delocalized LPM connected toboth leads and a localized LPM being dis-connected fromthe leads. An example is shown in Fig. 5 (a) wheremodes 14 and 17 are responsible for the transmissionnode around E = 25− 27 meV. The eigen-modes 14 and17 of meta-OPE3 have energies ~ω14 = 17.8 meV and~ω17 = 33.1 meV. These two modes are successive whenconsidering modes containing only out-of plane motionand are the two modes closest in energy below/abovethe QI transmission node – see also Fig. 4. Whenforming linear combinations of the two modes we ob-tain localized phonon modes (LPM) as shown in Fig.5 (a). Both LPMs have a local (on-site) frequency of
~ω14±17 = ~√
(ω214 + ω2
17)/2 = 26.6 meV. In similaritywith the meta-benzene case, the LPM topology for meta-OPE3 resembles a Fano model with a transmission nodeat the energy of the localized mode. In this particularcase, modes 14 and 17 are thus responsible for the trans-mission node around E = 25 − 27 meV. From Fig. 4 weobserve that modes 13 and 19 have similar symmetries asmodes 14 and 17. Performing the same analysis we find
that modes 13 and 19 also lead to a Fano-model with ex-pected transmission node at energy Eph = 26.8 meV, i.e.very close to the result for modes 14 and 17. The nar-row peak in the transmission spectrum at E = 26 meVis due a mode with primarily in-plane motion character,not shown in Fig. 4. The transmission dip seen aroundEph = 47 meV results from an interplay between the fournearly degenerate modes 20–23.
In addition to the phonon interference effects leadingto transmission nodes, another type of interference effectdue to quasi degenerate modes also play a role42 . To il-lustrate this, consider the quasi-degenerate modes 13 and14 in Fig. 4. The LPMs obtained from these modes areshown in Fig. 5 (b). The left- and right-localized LPMsare only weakly coupled with a coupling strength propor-tional to the energy separation between the eigen modes.This is the explanation of the reduced transmission peakaround Eph = 22 meV for meta-OPE3 contributing to thereduced thermal conductance of meta-OPE3. Note thatdue to the molecule-lead coupling, modes 13 and 14 areshifted from their free values of 15−17 meV to ∼ 22 meV.Similar interference effects due to quasi-degenerate elec-tronic states has recently been analyzed theoretically forelectron transport42.
14−17
14+17
13+14
13−14
(b)(a) Fano model Degenerate levels
Figure 5. Localized phonon modes formed by combiningeigen-modes. The Fano-model (a) leads to a transmissionzero at the energy of the localized, decoupled, mode (Eph =26.6 meV). The degenerate levels model leads to a reducedtransmission peak at Eph = 22 meV due to a weak couplingbetween the left- and right localized states.
In Fig. 3 panel (d) we show the thermal conductancevs. temperature for the two OPE3 molecules. The solidcurves are calculated with molecule-electrode couplingfor motions in all directions (xyz) while the dashed curvesare obtained when only the out-of-plane (z− direction)motion is considered. In either case we observe a cleardifference between para- and meta-connections, with theformer having 2 times higher conductance. When onlythe out-of plane motion is considered the para to meta
6
ratio is close to 3.
C. OPE3 with SiNW- and GNR leads
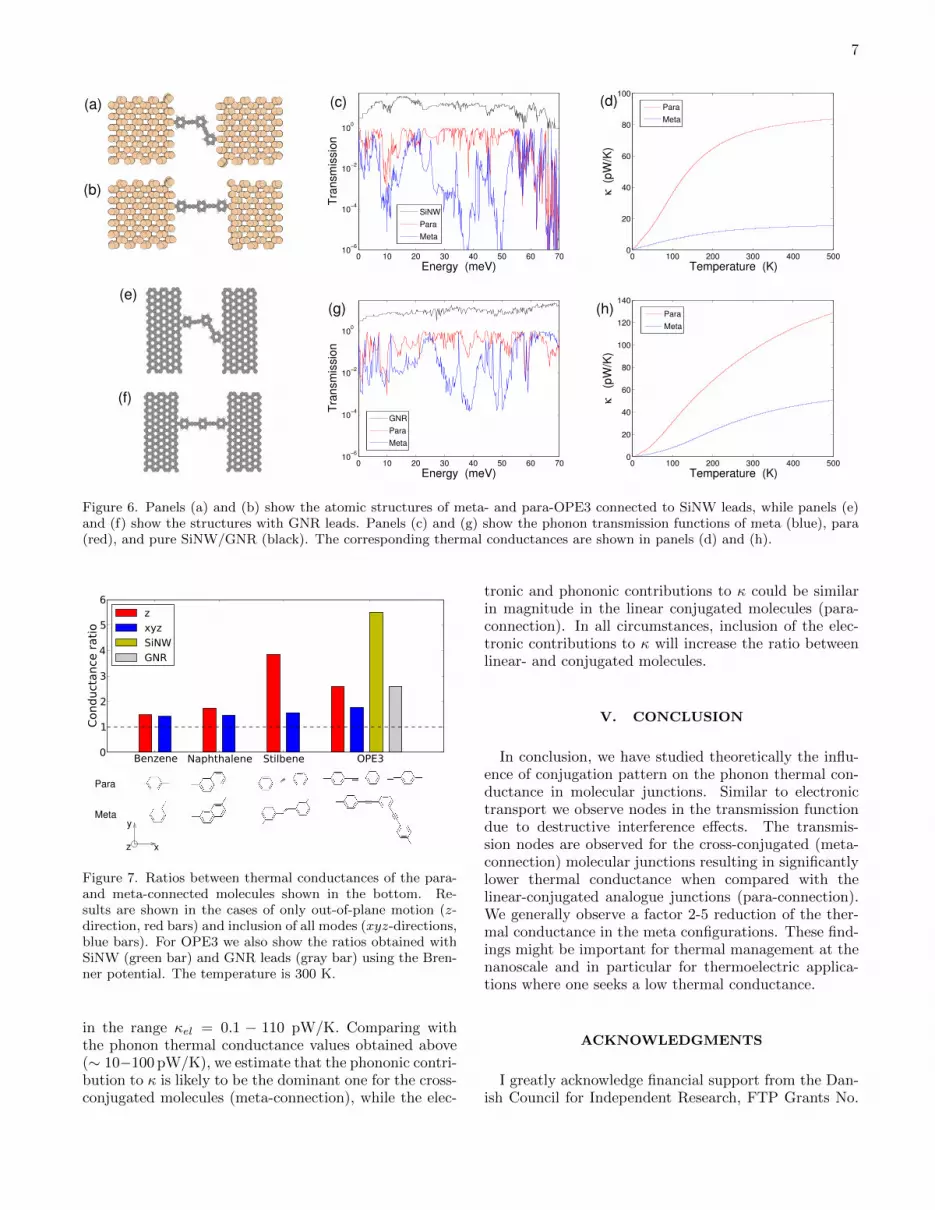
In order to test the robustness of the results obtainedwith the analytical self-energies we have performed cal-culations with more realistic leads. In Fig. 6 we showthe atomic structure of the two OPE3 molecules con-nected to silicon nanowire (SiNW) leads (a) and (b) andto graphene nano-ribbon (GNR) leads, panels (e) and(f). The dynamical matrices of both the leads and themolecules have been calculated with the empirical Bren-ner potential33 after an initial relaxation as describedabove. Panel (c)/(g) show the phonon transmissionthrough the pristine SiNW/GNR (black) and through thetwo OPE3 molecules, including all the phonon modes. Inclear accordance with the DFT based calculations usinganalytical self-energies (Fig. 3 (c)) we again observe cleartransmission dips for meta-OPE3 but not for para-OPE3.The corresponding thermal conductances are shown inpanels (d) and (h), again showing a very substantial dif-ference between meta- and para configurations. Whilethe results obtained with the SiNW and GNR leads showthat the absolute values of the conductances depend onthe details of the leads and on the molecule-lead cou-pling, it is also clear that the general trends obtainedwith the simple analytical lead self-energies are robustagainst such details. In particular we observe a signif-icant difference in thermal conductance between para-and meta OPE3 in all cases due to destructive QI effectsin meta-OPE3.
D. More molecules
To further address the general influence of conjuga-tion pattern on the thermal conductance we have stud-ied three additional pairs of molecular junctions. Figure7 shows the thermal conductance ratios between para-and meta-configurations of the four pairs of moleculesshown in the bottom rows. For all molecules we observea pronounced effect of conjugation when only the out-of-plane (z-direction) motion is considered (red bars).When the in-plane (x− and y-directions) motion is in-cluded (blue bars), the conductance ratios are decreased,but still show sizable effects of conjugation. For OPE3we also show ratios obtained with SiNW (green bar) andGNR leads (gray bar) using the empirical Brenner po-tential. The fact that we also obtain high conductancerations between para- and meta-OPE3 using fully atom-istic descriptions of the SiNW- and GNR-leads supportsthe use of the simple analytical lead self-energies. Fur-thermore, it clearly underlines that the phonon interfer-ence effect is an intrinsic property of meta-OPE3 and notdue to a particular junction configuration.
IV. DISCUSSION
The results presented above show that the variationsin thermal conductance with conjugation pattern fol-low the expected variations in the electronic conduc-tance. For both electron and phonon transport the differ-ence between meta- and para-configurations are causedby QI induced transmission nodes present in the for-mer case but absent in the latter. While variations inthe electronic conductance between linearly conjugatedmolecules (para) and cross-conjugated ones (meta) maybe 1-3 orders of magnitude22–26, the corresponding dif-ferences for the phonon thermal conductance calculatedhere is rather a factor of ∼ 2−5. The difference betweenelectron- and phonon conductances is due to the differ-ences in the Fermi- and Bose-Einstein distribution func-tions determining the respective occupations. Electrontransport is determined by the transmission function ina narrow energy window around the Fermi level, EF , andis thus very sensitive to potential QI effects close to EF .On the contrary, the phonon thermal conductance de-pends on the transmission function in a large frequencyrange involving many phonon modes, where only someof them leads to QI effects. We notice that recent ex-periments observed a factor of ∼ 2 differences in ther-mal conductance between strongly (covalently) sulfur-gold bonded molecules and weak van-der Waals bondedCH3-gold bonded contacts. However, changes in anchor-ing groups often leads to orders of magnitude changesin the electronic conductance43. Although the thermalconductance variations due to variations in conjugationpattern are much smaller than the corresponding elec-tronic conductance variations, the influence of conjuga-tion seems to be at least as important as the influenceof molecule-lead coupling, and should be well within anexperimentally observable range.
In a measurement of the thermal conductance therewill be contributions from both phonons and electrons,while in this work we have only considered the phononpart. In order to make an accurate comparison ofthe phonon- and electron contributions one should per-form calculations for both the phonon- and electrontransmission functions using the same atomistic descrip-tion. This is beyond the scope of this paper. However,an estimate of the electronic contribution to the ther-mal conductance can be made using the Wiedemann-Franz law κel = LTGel, where T is the temperature,L = π2k2B/(3e
2) is the Lorenz number, and Gel is theelectronic conductance. For molecular junctions typi-cal values of Gel are in the range 10−4G0 to 0.1 G0,where G0 = 2e2/h is the electronic conductance quan-tum. Large conductance values are typically obtained forshort, conjugated molecules. Cross-conjugated moleculeshave 10-1000 times lower conductance22–26. We em-phasize that theses values depend strongly on the spe-cific molecule, the electrode material as well as the an-chor group between molecule and electrode. The cor-responding electronic thermal conductance values are
7
0 10 20 30 40 50 60 7010
−6
10−4
10−2
100
Energy (meV)
Tra
nsm
issio
n
SiNW
Para
Meta
0 10 20 30 40 50 60 7010
−6
10−4
10−2
100
Energy (meV)
Tra
nsm
issio
n
GNR
Para
Meta
0 100 200 300 400 5000
20
40
60
80
100
Temperature (K)
κ (p
W/K
)
Para
Meta
0 100 200 300 400 5000
20
40
60
80
100
120
140
Temperature (K)
κ (
pW
/K)
Para
Meta
(a)
(b)
(c) (d)
(h)(g)(e)
(f)
Figure 6. Panels (a) and (b) show the atomic structures of meta- and para-OPE3 connected to SiNW leads, while panels (e)and (f) show the structures with GNR leads. Panels (c) and (g) show the phonon transmission functions of meta (blue), para(red), and pure SiNW/GNR (black). The corresponding thermal conductances are shown in panels (d) and (h).
Benzene Naphthalene Stilbene OPE30
1
2
3
4
5
6
Conduct
ance
rati
o
z
xyz
SiNW
GNR
Meta
Para
y
xz
Figure 7. Ratios between thermal conductances of the para-and meta-connected molecules shown in the bottom. Re-sults are shown in the cases of only out-of-plane motion (z-direction, red bars) and inclusion of all modes (xyz-directions,blue bars). For OPE3 we also show the ratios obtained withSiNW (green bar) and GNR leads (gray bar) using the Bren-ner potential. The temperature is 300 K.
in the range κel = 0.1 − 110 pW/K. Comparing withthe phonon thermal conductance values obtained above(∼ 10−100 pW/K), we estimate that the phononic contri-bution to κ is likely to be the dominant one for the cross-conjugated molecules (meta-connection), while the elec-
tronic and phononic contributions to κ could be similarin magnitude in the linear conjugated molecules (para-connection). In all circumstances, inclusion of the elec-tronic contributions to κ will increase the ratio betweenlinear- and conjugated molecules.
V. CONCLUSION
In conclusion, we have studied theoretically the influ-ence of conjugation pattern on the phonon thermal con-ductance in molecular junctions. Similar to electronictransport we observe nodes in the transmission functiondue to destructive interference effects. The transmis-sion nodes are observed for the cross-conjugated (meta-connection) molecular junctions resulting in significantlylower thermal conductance when compared with thelinear-conjugated analogue junctions (para-connection).We generally observe a factor 2-5 reduction of the ther-mal conductance in the meta configurations. These find-ings might be important for thermal management at thenanoscale and in particular for thermoelectric applica-tions where one seeks a low thermal conductance.
ACKNOWLEDGMENTS
I greatly acknowledge financial support from the Dan-ish Council for Independent Research, FTP Grants No.
8
11-104592 and No. 11-120938.
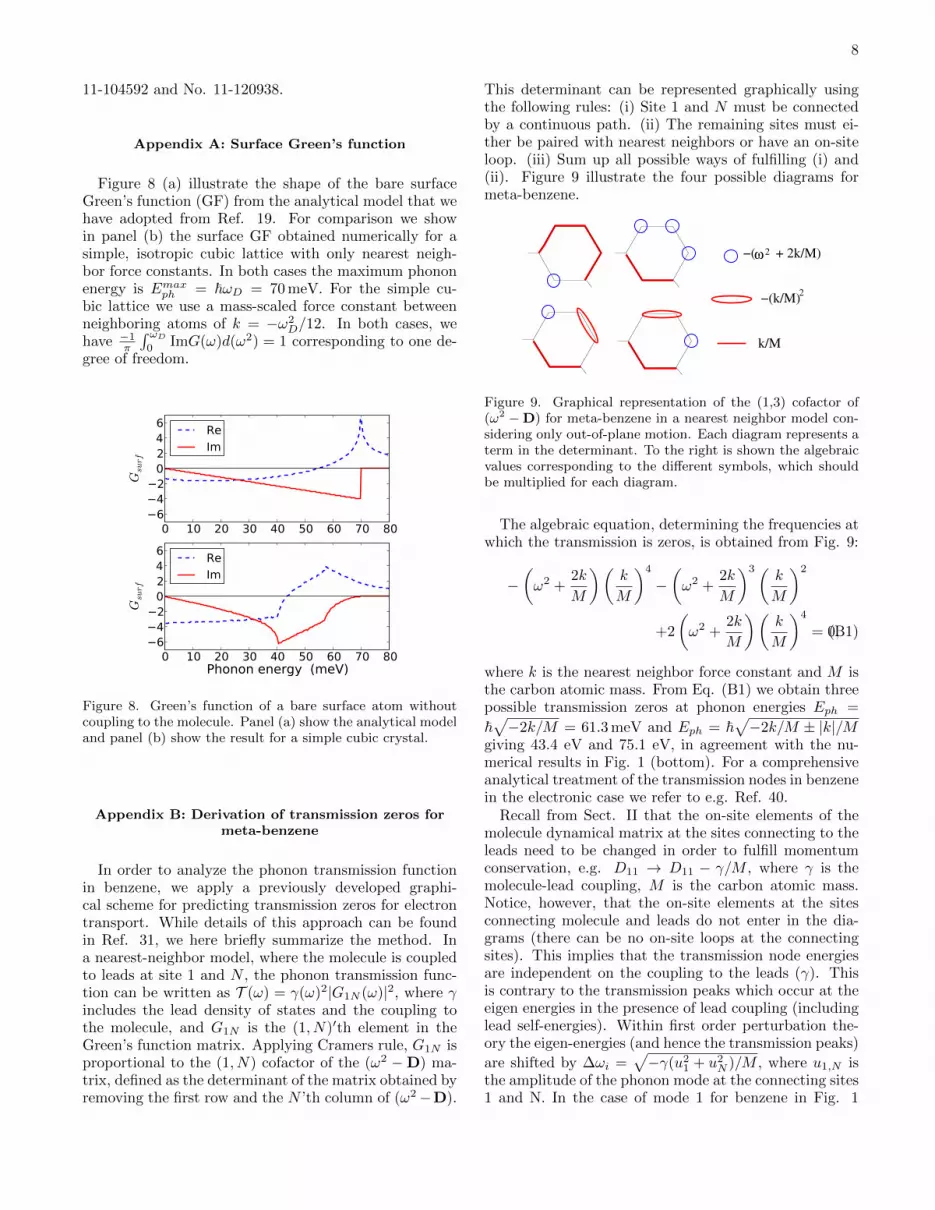
Appendix A: Surface Green’s function
Figure 8 (a) illustrate the shape of the bare surfaceGreen’s function (GF) from the analytical model that wehave adopted from Ref. 19. For comparison we showin panel (b) the surface GF obtained numerically for asimple, isotropic cubic lattice with only nearest neigh-bor force constants. In both cases the maximum phononenergy is Emaxph = ~ωD = 70 meV. For the simple cu-bic lattice we use a mass-scaled force constant betweenneighboring atoms of k = −ω2
D/12. In both cases, wehave −1π
∫ ωD
0ImG(ω)d(ω2) = 1 corresponding to one de-
gree of freedom.
0 10 20 30 40 50 60 70 806420246
Gsurf
Re
Im
0 10 20 30 40 50 60 70 80Phonon energy (meV)
6420246
Gsurf
Re
Im
Figure 8. Green’s function of a bare surface atom withoutcoupling to the molecule. Panel (a) show the analytical modeland panel (b) show the result for a simple cubic crystal.
Appendix B: Derivation of transmission zeros formeta-benzene
In order to analyze the phonon transmission functionin benzene, we apply a previously developed graphi-cal scheme for predicting transmission zeros for electrontransport. While details of this approach can be foundin Ref. 31, we here briefly summarize the method. Ina nearest-neighbor model, where the molecule is coupledto leads at site 1 and N , the phonon transmission func-tion can be written as T (ω) = γ(ω)2|G1N (ω)|2, where γincludes the lead density of states and the coupling tothe molecule, and G1N is the (1, N)′th element in theGreen’s function matrix. Applying Cramers rule, G1N isproportional to the (1, N) cofactor of the (ω2 −D) ma-trix, defined as the determinant of the matrix obtained byremoving the first row and the N ’th column of (ω2−D).
This determinant can be represented graphically usingthe following rules: (i) Site 1 and N must be connectedby a continuous path. (ii) The remaining sites must ei-ther be paired with nearest neighbors or have an on-siteloop. (iii) Sum up all possible ways of fulfilling (i) and(ii). Figure 9 illustrate the four possible diagrams formeta-benzene.
−( + 2k/M)
k/M
ω2
−(k/M)2
Figure 9. Graphical representation of the (1,3) cofactor of(ω2 −D) for meta-benzene in a nearest neighbor model con-sidering only out-of-plane motion. Each diagram represents aterm in the determinant. To the right is shown the algebraicvalues corresponding to the different symbols, which shouldbe multiplied for each diagram.
The algebraic equation, determining the frequencies atwhich the transmission is zeros, is obtained from Fig. 9:
−(ω2 +
2k
M
)(k
M
)4
−(ω2 +
2k
M
)3(k
M
)2
+2
(ω2 +
2k
M
)(k
M
)4
= 0,(B1)
where k is the nearest neighbor force constant and M isthe carbon atomic mass. From Eq. (B1) we obtain threepossible transmission zeros at phonon energies Eph =
~√−2k/M = 61.3 meV and Eph = ~
√−2k/M ± |k|/M
giving 43.4 eV and 75.1 eV, in agreement with the nu-merical results in Fig. 1 (bottom). For a comprehensiveanalytical treatment of the transmission nodes in benzenein the electronic case we refer to e.g. Ref. 40.
Recall from Sect. II that the on-site elements of themolecule dynamical matrix at the sites connecting to theleads need to be changed in order to fulfill momentumconservation, e.g. D11 → D11 − γ/M , where γ is themolecule-lead coupling, M is the carbon atomic mass.Notice, however, that the on-site elements at the sitesconnecting molecule and leads do not enter in the dia-grams (there can be no on-site loops at the connectingsites). This implies that the transmission node energiesare independent on the coupling to the leads (γ). Thisis contrary to the transmission peaks which occur at theeigen energies in the presence of lead coupling (includinglead self-energies). Within first order perturbation the-ory the eigen-energies (and hence the transmission peaks)
are shifted by ∆ωi =√−γ(u21 + u2N )/M , where u1,N is
the amplitude of the phonon mode at the connecting sites1 and N. In the case of mode 1 for benzene in Fig. 1
9
we have u1 = uN = 1/√
6, γ = −4 eV/A2 leading to~∆ω1 = 21 meV, in good agreement with the positionof the first transmission peak in Fig. 1, which in ad-dition to the upward shift ∆ω also includes a (smaller)downward shift due to the (negative) real part of the leadself-energy.
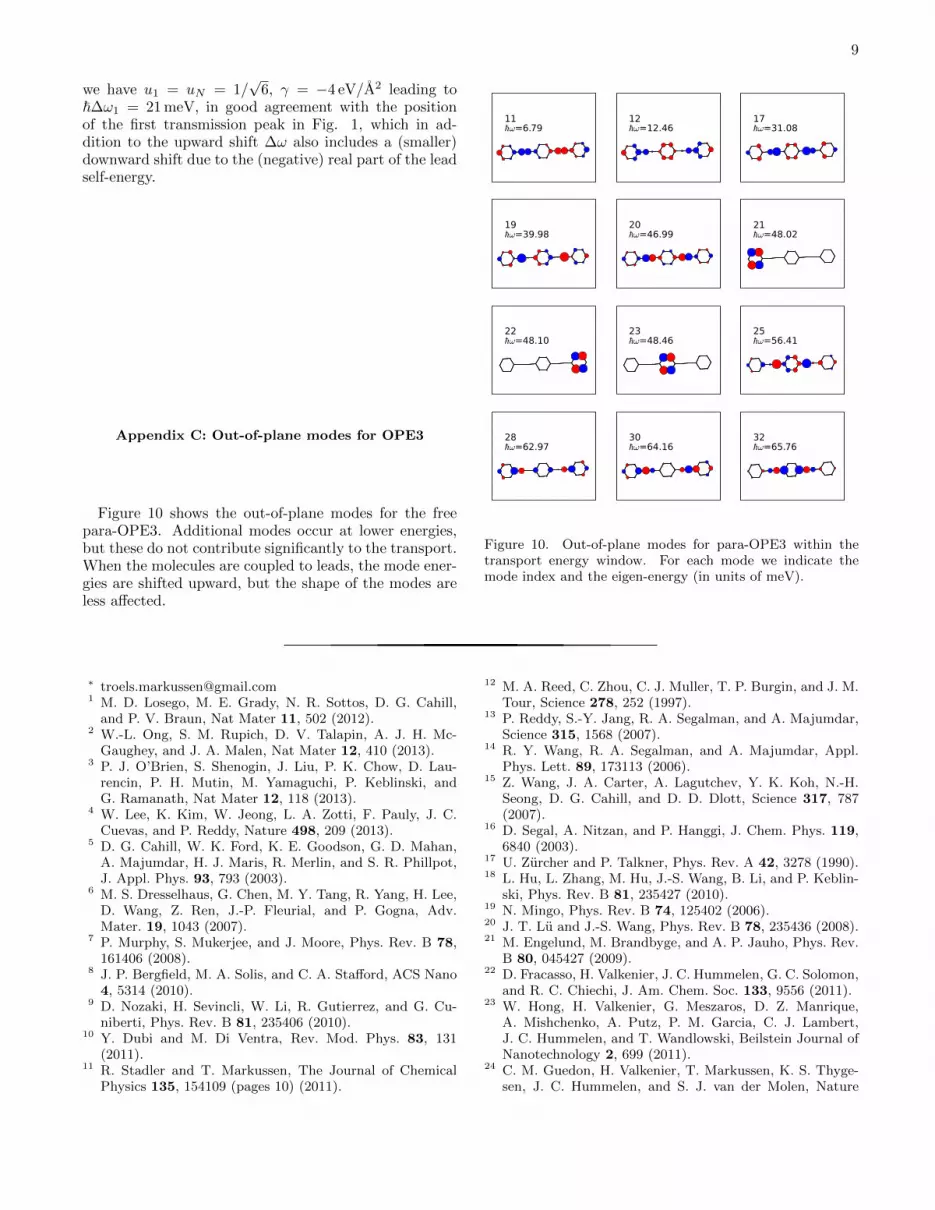
Appendix C: Out-of-plane modes for OPE3
Figure 10 shows the out-of-plane modes for the freepara-OPE3. Additional modes occur at lower energies,but these do not contribute significantly to the transport.When the molecules are coupled to leads, the mode ener-gies are shifted upward, but the shape of the modes areless affected.
11ω=6.79
12ω=12.46
17ω=31.08
19ω=39.98
20ω=46.99
21ω=48.02
22ω=48.10
23ω=48.46
25ω=56.41
28ω=62.97
30ω=64.16
32ω=65.76
Figure 10. Out-of-plane modes for para-OPE3 within thetransport energy window. For each mode we indicate themode index and the eigen-energy (in units of meV).
∗ [email protected] M. D. Losego, M. E. Grady, N. R. Sottos, D. G. Cahill,
and P. V. Braun, Nat Mater 11, 502 (2012).2 W.-L. Ong, S. M. Rupich, D. V. Talapin, A. J. H. Mc-
Gaughey, and J. A. Malen, Nat Mater 12, 410 (2013).3 P. J. O’Brien, S. Shenogin, J. Liu, P. K. Chow, D. Lau-
rencin, P. H. Mutin, M. Yamaguchi, P. Keblinski, andG. Ramanath, Nat Mater 12, 118 (2013).
4 W. Lee, K. Kim, W. Jeong, L. A. Zotti, F. Pauly, J. C.Cuevas, and P. Reddy, Nature 498, 209 (2013).
5 D. G. Cahill, W. K. Ford, K. E. Goodson, G. D. Mahan,A. Majumdar, H. J. Maris, R. Merlin, and S. R. Phillpot,J. Appl. Phys. 93, 793 (2003).
6 M. S. Dresselhaus, G. Chen, M. Y. Tang, R. Yang, H. Lee,D. Wang, Z. Ren, J.-P. Fleurial, and P. Gogna, Adv.Mater. 19, 1043 (2007).
7 P. Murphy, S. Mukerjee, and J. Moore, Phys. Rev. B 78,161406 (2008).
8 J. P. Bergfield, M. A. Solis, and C. A. Stafford, ACS Nano4, 5314 (2010).
9 D. Nozaki, H. Sevincli, W. Li, R. Gutierrez, and G. Cu-niberti, Phys. Rev. B 81, 235406 (2010).
10 Y. Dubi and M. Di Ventra, Rev. Mod. Phys. 83, 131(2011).
11 R. Stadler and T. Markussen, The Journal of ChemicalPhysics 135, 154109 (pages 10) (2011).
12 M. A. Reed, C. Zhou, C. J. Muller, T. P. Burgin, and J. M.Tour, Science 278, 252 (1997).
13 P. Reddy, S.-Y. Jang, R. A. Segalman, and A. Majumdar,Science 315, 1568 (2007).
14 R. Y. Wang, R. A. Segalman, and A. Majumdar, Appl.Phys. Lett. 89, 173113 (2006).
15 Z. Wang, J. A. Carter, A. Lagutchev, Y. K. Koh, N.-H.Seong, D. G. Cahill, and D. D. Dlott, Science 317, 787(2007).
16 D. Segal, A. Nitzan, and P. Hanggi, J. Chem. Phys. 119,6840 (2003).
17 U. Zurcher and P. Talkner, Phys. Rev. A 42, 3278 (1990).18 L. Hu, L. Zhang, M. Hu, J.-S. Wang, B. Li, and P. Keblin-
ski, Phys. Rev. B 81, 235427 (2010).19 N. Mingo, Phys. Rev. B 74, 125402 (2006).20 J. T. Lu and J.-S. Wang, Phys. Rev. B 78, 235436 (2008).21 M. Engelund, M. Brandbyge, and A. P. Jauho, Phys. Rev.
B 80, 045427 (2009).22 D. Fracasso, H. Valkenier, J. C. Hummelen, G. C. Solomon,
and R. C. Chiechi, J. Am. Chem. Soc. 133, 9556 (2011).23 W. Hong, H. Valkenier, G. Meszaros, D. Z. Manrique,
A. Mishchenko, A. Putz, P. M. Garcia, C. J. Lambert,J. C. Hummelen, and T. Wandlowski, Beilstein Journal ofNanotechnology 2, 699 (2011).
24 C. M. Guedon, H. Valkenier, T. Markussen, K. S. Thyge-sen, J. C. Hummelen, and S. J. van der Molen, Nature
10
Nanotechnology 7, 304 (2012).25 S. V. Aradhya, J. S. Meisner, M. Krikorian, S. Ahn,
R. Parameswaran, M. L. Steigerwald, C. Nuckolls, andL. Venkataraman, Nano Lett. 12, 1643 (2012).
26 C. R. Arroyo, S. Tarkuc, R. Frisenda, J. S. Seldenthuis,C. H. M. Woerde, R. Eelkema, F. C. Grozema, and H. S. J.van der Zant, Angew. Chem. 125, 3234 (2013).
27 N. F. Phelan and M. Orchin, J. Chem. Educ. 45, 633.(1968).
28 G. C. Solomon, C. Herrmann, T. Hansen, V. Mujica, andM. A. Ratner, Nat Chem 2, 223 (2010).
29 G. C. Solomon, D. Q. Andrews, R. H. Goldsmith,T. Hansen, M. R. Wasielewski, R. P. Van Duyne, and M. A.Ratner, J. Am. Chem. Soc. 130, 17301 (2008).
30 T. Markussen, R. Stadler, and K. S. Thygesen, Nano Lett.10, 4260 (2010).
31 T. Markussen, R. Stadler, and K. S. Thygesen, Phys.Chem. Chem. Phys. 13, 14311 (2011).
32 L. Zhang, P. Keblinski, J.-S. Wang, and B. Li, Phys. Rev.B 83, 064303 (2011).
33 D. W. Brenner, Phys. Rev. B 42, 9458 (1990).34 J. Gale, JCS Faraday Trans. 93, 629 (1997).
35 J. Enkovaara, C. Rostgaard, J. J. Mortensen, J. Chen,M. Dulak, L. Ferrighi, J. Gavnholt, C. Glinsvad,V. Haikola, H. A. Hansen, et al., J. Phys Condens. Matter22 (2010).
36 J. P. Perdew, K. Burke, and M. Ernzerhof, Phys. Rev.Lett. 77, 3865 (1996).
37 C. Patoux, C. Coudret, J. P. Launay, C. Joachim, andA. Gourdon, Inorg. Chem. 36, 5037 (1997).
38 M. Mayor, H. B. Weber, J. Reichert, M. Elbing, C. vonH??nisch, D. Beckmann, and M. Fischer, Angew. Chem.Int. Ed. 42, 5834 (2003).
39 P. Sautet and C. Joachim, Chemical Physics Letters 153,511 (1988).
40 T. Hansen, G. C. Solomon, D. Q. Andrews, and M. A.Ratner, The Journal of Chemical Physics 131, 194704(pages 12) (2009).
41 A. E. Miroshnichenko, S. Flach, and Y. S. Kivshar, Rev.Mod. Phys. 82, 2257 (2010).
42 R. Hartle, M. Butzin, O. Rubio-Pons, and M. Thoss, Phys.Rev. Lett. 107, 046802 (2011).
43 F. Chen, X. Li, J. Hihath, Z. Huang, and N. Tao, J. Am.Chem. Soc. 128, 15874 (2006).