phenotypic and functional characteristics of rat spleen lymphocytes during suckling
TRANSCRIPT
Developmental& ComparativeImmunology
ARTICLE IN PRESS
0145-305X/$ - se
doi:10.1016/j.dc
Abbreviations
antibodies; FIT
PerCP, peridinin
saline; ELISPO
immunoglobulin
pokeweed mitog
3,305,50-tetramet�Correspondi
fax: +34934035
E-mail addre
Developmental and Comparative Immunology 31 (2007) 1264–1277
www.elsevier.com/locate/devcompimm
Phenotypic and functional characteristics of rat spleenlymphocytes during suckling
Francisco J. Perez-Cano, Cristina Castellote, Silvia Marın-Gallen,Ana Gonzalez-Castro, Angels Franch, Margarida Castell�
Department of Physiology, Faculty of Pharmacy, University of Barcelona, Spain
Received 6 November 2006; received in revised form 9 March 2007; accepted 10 March 2007
Available online 9 April 2007
Abstract
The aim of this study is to characterize the rat spleen lymphoid tissue during the suckling period by means of lymphocyte
composition and their functionality. Lymphocyte phenotype was determined by immunofluorescence and flow cytometry.
The proliferative ability and the antibody secretion activity were considered as functional markers. During the first 2 weeks
of life, rat spleen mainly contained B cells (CD45RA+ or Igk+). In this period, T (TCRab+CD4+, TCRab+CD8+
and TCRgd+CD8+) and NK/NKT (NKR-P1A+) cell proportions were far less than those of adult rats. Moreover, the
spleen immune functionality proved to be very low. In the second half of the suckling period, CD4+ and CD8+ cells in
the spleen increased in number and proportion, with immature cells progressively displaced by phenotypic mature
lymphocytes containing CD3, TCRab, CD5 and CD2 molecules on their surface. Additionally, although B and T
lymphocyte developed their proliferative ability during this period, it was not fully developed at weaning.
r 2007 Elsevier Ltd. All rights reserved.
Keywords: Spleen; Suckling; Lymphocyte; Immunoglobulins; Phenotype; ELISPOT; Proliferation; Rat
1. Introduction
Early life in mammals is characterized by thegradual acquisition of an immune status thatprovides defences against myriad pathogens
e front matter r 2007 Elsevier Ltd. All rights reserved
i.2007.03.004
: FBS, foetal bovine serum; MAb, monoclonal
C, fluorescein isothiocyanate; PE, phycoerythrin;
chlorophyll-a protein; PBS, phosphate-buffered
T, enzyme-linked immunospot assay; Ig-SC,
-secreting cell; ConA, concanavalin A; PWM,
en; BrdU, 5-bromo-20-deoxyuridine; TMB,
hylbenzidine
ng author. Tel.: +34 934024505;
901.
ss: [email protected] (M. Castell).
throughout life. Foetal and neonatal lymphoidorgans present a lower number of immunocompe-tent cells than their adult counterparts. In rats, thenumber of thymus cells was very low before day 14of foetal life, increasing exponentially during days15–20, at birth remained constant and from day 2 ofpostnatal life onwards the rat thymus underwent anew exponential growth to reach adulthood [1]. Inparallel fashion, the peripheral expansion of T cellsbegins around the time of birth and is dependentupon the thymus [2,3]. Thus, neonatal thymectomyin the first few days of a mouse’s life not onlyproduces fewer circulating cells in the blood andsecondary lymphoid tissues, but also impairs cell-mediated immunity [4].
.

ARTICLE IN PRESSF.J. Perez-Cano et al. / Developmental and Comparative Immunology 31 (2007) 1264–1277 1265
Neonatal immune responses are limited, lesscompetent and functionally deficient than in adultanimals [5,6]. Because of these limitations, neonatallife is characterized by heightened sensitivity toinfectious agents [7]. During the early postnatalperiod, a large array of antigens, from both theenvironment and diet, influences lymphocyte devel-opment and immunological memory; or alterna-tively, tolerance is established in the peripheraltissues [8,9].
Although neonatal adaptive immune function hastraditionally been considered as immature, it isbecoming increasingly clear that under certaincircumstances mammals’ neonates are sufficientlycompetent to mount adult-level T-cell responses[7,10]. It is now accepted that neonatal adaptiveresponses show a great deal of variability, rangingfrom non-responsiveness to fully mature function.In this sense, infants develop lower Th1 type, buthigher antibody, responses than adults against somevaccines (e.g., hepatitis B, poliovirus) [11,12],whereas other pathogens (e.g., BCG) induce amature Th1 response [13]. The reason for thesedifferences is thought to reside in the interactionsbetween dendritic cells and T lymphocytes [14].Therefore, it is believed that under certain stimula-tory conditions neonatal T lymphocytes can mounta mature immune response [10]. In addition, there isan overlap in the generation of T cells by foetal andadult haematopoietic precursors in neonatal mice[15,16], producing a mixture of foetal- and adult-derived peripheral T cells during the first stages oflife. For example, foetus-derived cells preferentiallymount Th2-cell responses [17,18].
On the other hand, neonatal antibody responsesare delayed at onset, reach lower peak levels, are ofshorter duration, differ in the distribution of IgGisotypes and exhibit lower average affinity andreduced heterogeneity than adult counterparts[19,20]. These characteristics may be a consequenceof the immaturity of Th cells or could stem fromdifferences between neonatal B cells and those ofadults. In this sense, B-cell development in foetal/neonatal age is different from lymphopoesis in adultanimals [21]. Besides having a distinct origin, theB-cell response may be impaired by a lack of therequisite microarchitecture: i.e., lymphoid follicles,follicular-dendritic cell networks and germinalcentres. These structures are absent at birth in miceand develop during the first few days or weeks oflife. A temporal coincidence in the appearance ofgerminal centres at around 3 weeks of age in mice
and the ability to mount adult-like antibodyresponses has also been noted [22].
To better understand neonatal lymphocyte com-position in a secondary lymphoid tissue, we took inconsideration the changes in the spleen, which inneonatal animals is anatomically much moreevident than lymph nodes, and efficiently reactsagainst blood antigens. We characterized thephenotypes of rat spleen lymphocytes that deter-mine the main subsets (B, T, NK), the mainco-receptors (CD4, CD8), some costimulatorymolecules (CD3, CD5), an adhesion/activationmarker (CD2) together with negative markers ofmaturation (IgM on B cells and CD90 on T cells).We also evaluated the basic function of B and Tsplenocytes; i.e., antibody secretion and the mito-genic proliferative ability.
2. Materials and methods
2.1. Animals
Pregnant Lewis rats and 10-week-old femaleLewis rats (used as reference adults) were obtainedfrom Harlan (Barcelona, Spain). Pregnant rats werehoused in individual cages under controlled tem-perature and humidity conditions in a 12 h:12 hlight:dark cycle. They were monitored daily untildelivery and allowed to deliver naturally. The day ofbirth was identified as day 1 of life. Litters wereunified to eight pups per mother, with free access tothe nipples and rat diet. Therefore, pups sponta-neously began combining breast milk with pelletfood during days 15–17. Reference adult rats werehoused (2–3 per cage) using the same conditions aspregnant rats. Adult rats were fed a commercial dietand water ad libitum. Studies were performed inaccordance with the institutional guidelines for thecare and use of laboratory animals established bythe Ethical Committee for Animal Experimentationat the University of Barcelona.
2.2. Splenocyte isolation
Adult rats and pups aged 1, 3, 5, 7, 11, 14 and 21days (suckling period) were euthanized usinghumane methods. The abdomen was opened andthe spleen was removed under sterile conditions.Mononuclear cells were prepared following me-chanical spleen disruption on a stainless steel meshusing complete RPMI medium (RPMI 1640 med-ium supplemented with 1% foetal bovine serum
ARTICLE IN PRESSF.J. Perez-Cano et al. / Developmental and Comparative Immunology 31 (2007) 1264–12771266
(FBS), 50 mM 2-mercaptoethanol, 100U/mL peni-cillin, 100 mg/mL streptomycin, 2mM L-glutamine;Innogenetics, Barcelona, Spain). Splenocytes wereisolated by Nycopreps gradient centrifugation(Nycomed, Oslo, Norway).
Cell numbers and viability were determined afterstaining dead cells with ethidium bromide (SigmaChemical Co., St. Louis, MO, USA) and live cells withacridine orange (Sigma). Splenocytes were then im-mediately stained by fluorochrome-conjugated mono-clonal antibodies (MAb) for flow cytometry analysis,incubated for ELISPOT assays, or stimulated withmitogens and incubated for proliferation assays.
2.3. Immunofluorescence staining and flow cytometry
analysis
Splenocytes (2� 105) were stained using immuno-fluorescence techniques. The mouse anti-rat MAbconjugated to fluorescein isothiocyanate (FITC),phycoerythrin (PE) or peridinin chlorophyll-a pro-tein (PerCP) used here included anti-CD3 (1-F4),anti-CD4 (OX-35), anti-CD5 (OX-19), anti-CD8a(OX-8), anti-TCRab (R73), anti-TCRgd (V65) andanti-NKR-P1A (10/78) all obtained from BD Phar-mingen (San Diego, CA, USA); anti-CD2 (OX-34),anti-CD45RA (OX-33) and anti-CD90 (OX-7) pur-chased from Caltag (Burlingame, CA, USA) andanti-m Ig chain (G53-238) and anti-k Ig chain(OX-12) from Serotec (Kidlington, Oxford, UK).Cells were incubated with a mixture of saturatingconcentrations of fluorochrome-conjugated MAb ina phosphate-buffered saline (PBS) solution contain-ing 2% FBS and 0.1% NaN3 (Merck, Darmstadt,Germany) at 4 1C in darkness for 20–30min. Afterwashing, cells were fixed with 0.5% p-formaldehyde(Merck) and stored at 4 1C in the dark until analysisby flow cytometry. For each sample, a negativecontrol staining, using an isotype-matched MAb,was included. Analyses were performed with anEpics XL flow cytometer (Coulter Corporation,Hialeah, USA). It was considered as spleen lympho-cytes all the cells included in a gate established on thebasis of the cluster defined by TCRab+ andCD45RA+ cells from adult rat samples. Resultsfrom CD4, CD8, NKR-P1A, CD45RA and surfaceIgk stainings were expressed as the percentage ofpositive cells with respect to total gated lymphocytes.Other cytometry data were expressed as the percen-tage of positive cells with respect to a particularlymphocyte subset (CD45RA+, CD4+, CD8+ orNKR-P1A+ cells).
2.4. Enzyme-linked immunospot (ELISPOT) assays
An ELISPOT technique was used to enumerateimmunoglobulin-secreting cells (Ig-SC) from theneonatal and adult spleen. An ELISPOT assay wascarried out using a modification to a previouslydescribed protocol [23]. The 96-well nitrocelluloseplates (MultiScreen MAHAN 4510, Millipore,Eschborn, Germany) were coated with 100 mL/wellanti-rat IgA, IgG or IgM MAb (A93-2, G53-238and G28-5 clones, respectively; BD Pharmingen) at15 mg/mL in PBS (overnight at 4 1C in humidifiedchamber). After washing, the remaining bindingsites were blocked with 10% FBS in RPMI mediumfor 1 h at 37 1C. Thereafter, serial dilutions ofsplenocytes (2� 105, 1� 105, 5� 104 and 2.5� 104
alive cells) were incubated for 20 h at 37 1C and a5% CO2 atmosphere in humidified air. The platesthen were washed with PBS that contained 0.25%Tween-20 (PBS-Tw, 10 washes) and with distilledH2O (1 wash) to remove the cells. Biotin conjugatedanti-rat IgA, IgG or IgM MAb (2 mg/mL, BDPharmingen) were then added to the correspondingwells and incubated for 2 h at room temperature.After washing (5�PBS-Tw), 100 mL/well of extra-vidin-peroxidase conjugate (4 mg/mL in PBS, Sigma)was added over 1 h. Plates were washed again(5�PBS) and the substrate solution (3-amino-9-ethylcarbazole, Sigma in 0.1M acetate solution plusH2O2) was added. The enzyme reaction wasvisualized after 30min, and the reaction wasstopped using tap water. Spots were enumeratedautomatically via the ELISPOT-reader system (AIDDiagnostica, Strassberg, Germany) and expressedas the number of Ig-SC per 106 cells.
2.5. Mitogen stimulation and proliferation assays
Splenocytes (105/200 mL) were incubated in quad-ruplicate in complete RPMI 1640 medium withconcanavalin A (ConA, Sigma, 1 mg/mL) or poke-weed mitogen (PWM, Sigma, 2 mg/mL) or withoutstimulus in the 96-well plates over 72 h at 37 1C anda 5% CO2 atmosphere in humidified air. Proliferat-ing cells were identified by means of the BiotrakTM
cell proliferation system (Amersham Biosciences,Freiburg, Germany) following the manufacturer’sinstructions. For the last 2 h, 5-bromo-20-deoxyur-idine (BrdU) was added. Plates were then centri-fuged (300g for 10min), supernatants were removedby tapping, and cells were fixed. BrdU incorpora-tion was quantified by subsequent incubation with
ARTICLE IN PRESSF.J. Perez-Cano et al. / Developmental and Comparative Immunology 31 (2007) 1264–1277 1267
peroxidase-labelled anti-BrdU and 3,305,50-tetra-methylbenzidine (TMB)/H2O2. Absorbance, pro-portional to BrdU uptake, was measured afterstopping the enzyme reaction with 3M H2SO4.Results form suckling rats are expressed asfollows:
% Proliferative response ¼ (S/A)� 100, where
S ¼ ½ðAbsstimulated cells �Absnon�stimulated cellsÞ
=Absnon�stimulated cells�during suckling,
A ¼ ½ðAbsstimulated cells �Absnon�stimulated cellsÞ
=Absnon�stimulated cells�adult animals.
2.6. ELISA for sera IgG, IgM and IgA
quantification
Sera samples were separated from blood obtainedby cardiac puncture. Sera IgG, IgM and IgAconcentration was determined using a sandwichELISA technique [24]. Polystyrene microELISAplates (Nunc Maxisorp, Wiesbaden, Germany) wereincubated with adequate dilution of capture anti-bodies (mouse anti-rat IgG, IgM or IgA MAb, thesame clones as in the ELISPOT assay). Afterincubating sera samples, Ig isotypes were detected byadding biotin-conjugated anti-rat IgG, IgM or IgAMAb (the same clones as in the ELISPOT assay)followed by extravidin-peroxidase (Sigma). IgG, IgMand IgA standards were provided by BD Pharmingen.
2.7. Statistical analysis
Statistical analysis was performed by conven-tional ANOVA. For each dependent variable wetreated animal age as an independent variable.When age had a significant effect on the dependentvariable, post-hoc comparisons (LSD test) wereperformed. Differences between adult and 21-day-old animals were analysed by means of theMann–Whitney U-test. Differences were consideredsignificant at po0.05.
3. Results
3.1. Time-course of the main lymphocyte subsets in
the neonatal spleen
Percentages of B, T and NK cells with forward-scatter/side-scatter (FSC/SSC) lymphocyte characteris-
tics were obtained from neonatal and adult splenocytesuspensions after staining B cells (CD45RA+ or Igk+cells), T cells (TCRab+CD4+, TCRab+CD8+ andTCRgd+CD8+ cells) and NK cells (NKR-P1A+cells) (Fig. 1). As the addition of these percentages didnot achieve 100%, we calculated the difference anddesignated it as ‘‘negative cells’’. These splenocytescorrespond to cells displaying flow cytometric beha-viour characteristic of lymphocytes, but without any ofthe main lineage markers described above. Thesenegative cells constituted the main population duringthe first 2 weeks of life in the rat spleen (Fig. 1). Duringthe third week of life they decreased and at weaningday were present in the same proportion as in adultanimals.
After negative splenocytes, B cells constitutedthe second main population in neonatal spleensduring the suckling period; i.e., 20% of spleenlymphocytes on the day of birth and approximately40% on weaning day. This percentage was higherthan that observed in adult rats (about 30%,po0.05). However, it is remarkable that, duringsuckling, the proportion of spleen B lymphocytes,rather than T and NK cells, was closer to adultvalues.
T cells appeared in neonatal spleens more slowlythan did B cells, and during the first 14 days of life,did not amount to 10% of total spleen lymphocytes(Fig. 1). During the third week of life, T cellsproportion grew, although at weaning, their levelswere far away from those typically found in adultrats (about 50%, po0.05).
Table 1 summarizes the ratio between thepercentages of B and T cells in neonatal spleensand illustrates the higher frequency of B cells than Tcells during the suckling period in contrast withwhat occurred in adult life (po0.05 on days 1–21).
The NK cell population (i.e., NKR-P1A+ cells)constituted a low and variable percentage ofFSC/SSC-gated splenocytes, ranging between 5%and 15%, both in neonatal and adult animals(Fig. 1).
3.2. Time-course for the neonatal spleen B-cell
phenotype and immunoglobulin secretion capacity
B cells were detected by the surface expression ofeither the CD45RA molecule or the k Ig chain(Fig. 2A). The percentage of CD45RA+ cells werehigher than that of Igk+ cells during sucklingexcept during the first 3 days of life. These resultsshow that the surface molecule of CD45RA appears

ARTICLE IN PRESS
Table 1
Ratio between B and T spleen lymphocytes during suckling and
in adult rats
Age B/T ratio
(mean 7 E.E.M. (n))
Day of birth Day 1 2.8270.14 (5)
First week of life Day 3 6.9970.66 (7)
Day 5 5.4171.25 (6)
Day 7 8.8072.15 (4)
Second week of life Day 11 8.9571.11 (4)
Day 14 3.6270.39 (4)
Third week of life Day 21 1.5970.20 (5)
Adult 0.5770.04 (9)
adult
B cells
T cells
NK cells
negative cells
age (days)
1 11 13 15 17 19 21
% p
ositiv
e c
ells
0
10
20
30
40
50
60
70
80
∗
∗
3 5 7 9
Fig. 1. Percentage of B, T, NK and negative cells in spleen during the suckling period and in adult rats with respect to total spleen
lymphocytes. Results correspond to the mean7SEM of 4–9 values, with each derived from one animal or pools of two suckling animals.
*po0.05 day 21 vs. adult.
F.J. Perez-Cano et al. / Developmental and Comparative Immunology 31 (2007) 1264–12771268
on spleen B cells later than surface Ig during the firstpostnatal days. In addition, we studied the surfaceexpression of IgM in CD45RA+ splenocytes(Fig. 2B). Throughout suckling, most B cellsexhibited surface expression of IgM though of lowdensity (sIgMdull). After weaning, the proportion ofsIgM+ B cell increased from �65% to �90% and,some of these cells exhibited then CD45RA+sIgMbright phenotype (Fig. 2B).
As B cells were a predominant subset duringsuckling, we studied the spleen’s ability to sponta-neously secret antibodies belonging to IgG, IgM andIgA isotypes by means of ELISPOT. Spleen neonatalcells did not spontaneously secret IgG or IgA butwere able to produce IgM (Fig. 2C). The number ofIgM-SC depended on age (po0.01). During the firstweek of life, this proportion was very low, increasingthereafter. On weaning day, there was a relativelyhigh number of IgM-SC which was not statisticallydifferent from that observed in adult rats.
Because of the limited ability of neonatalsplenocytes to secret Ig, we studied the seraconcentration of IgG, IgM and IgA during suckling(Fig. 2D). Although IgG- and IgA-SC were notfound in the spleen during suckling, the three Igisotypes were already present in sera during the firstweeks of life. IgG was the predominant isotypefound (concentrations ranging between 0.7 and2mg/mL). During suckling, there was a highincrease in sera IgM levels from day 5 (about5 mg/mL) to day 21 (about 150 mg/mL), in a similarfashion as the time-course determined by ELISPOTanalysis. Sera IgA levels remained similar during thefirst 2 weeks of life and rose during the last week ofsuckling (from about 75 to 1000 ng/mL).

ARTICLE IN PRESS
adult
Igκ+ cells
CD45RA+ cells
age (days)
1 5 9 11 13 15 17 19 21
% p
ositiv
e c
ells
0
10
20
30
40
50
Ig-S
C/1
06 s
ple
nocyte
s
adultage (days)
1 5 9 11 13 15 17 19 21
0
500
1000
1500
2000
2500
age (days)
sera
[Ig
] (n
g/m
L)
5 7 14 21101
102
103
104
105
106
107
IgGIgMIgA
∗
IgMIgA
IgG
IgM fluorescence intensity
63%
68%
88%
day 5
day 21
adult
CD45RA + cells
3 7
3 7
Fig. 2. (A) Spleen B-cell phenotype based on the expression of Igk and CD45RA in suckling and adult rats. Results expressed as the
mean7SEM of 4–9 values, with each derived from one adult animal or pools of two suckling animals. (B) Representative histograms of
surface IgM expression in CD45RA+ splenocytes. Dashed lines represent the limit between negative and positive cells determined by
cytometer after negative staining (black peak). In the upper part of each histogram, the percentage of IgM+ cells with respect to all
CD45RA+ cells is detailed. (C) Spleen IgG�, IgM�, IgA-SC (in 106 splenocytes) in suckling and adult rats. Results expressed as the
mean7SEM of 4–9 values, with each derived from one adult animal or pools of two suckling animals. (D) Sera immunoglobulin levels
throughout the suckling period. Results expressed as the mean 7 SEM of 8–9 animals. *po0.05 day 21 vs. adult.
F.J. Perez-Cano et al. / Developmental and Comparative Immunology 31 (2007) 1264–1277 1269
3.3. Time-course for CD4+ lymphocytes in the
neonatal spleen
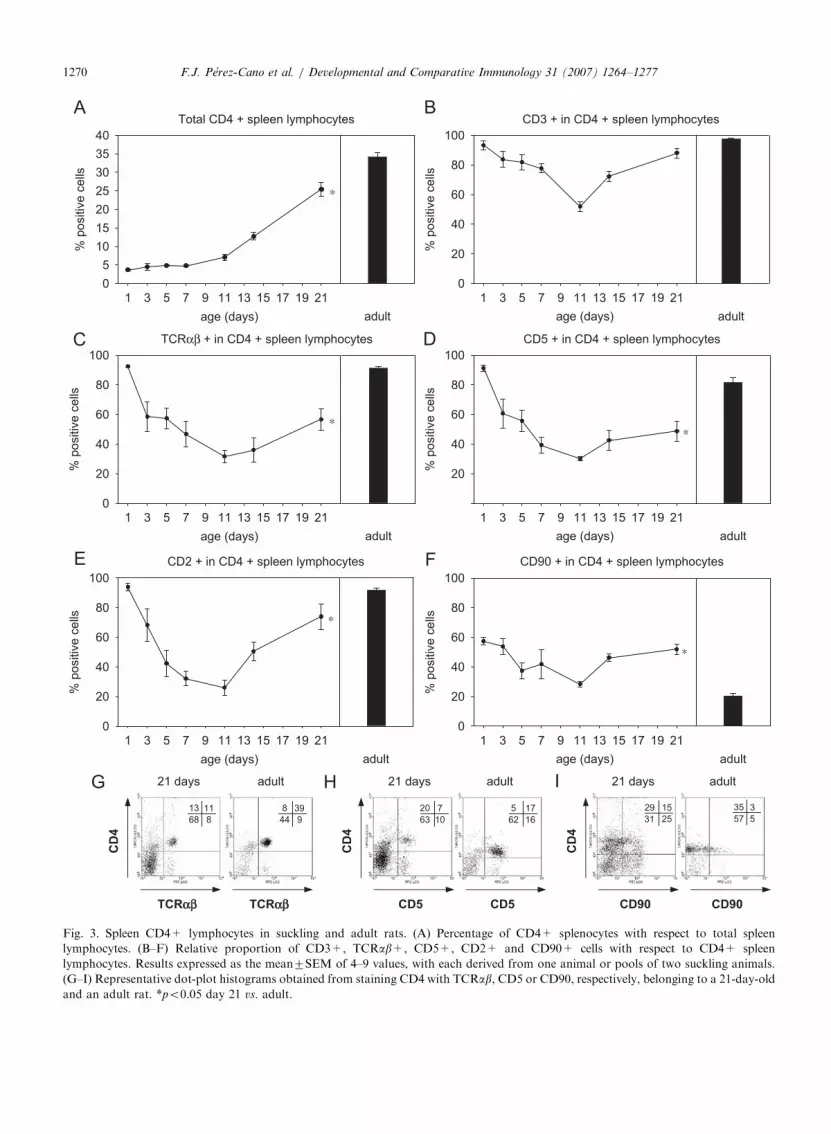
During the suckling period, the proportion ofCD4+ splenocytes depended on age (po0.01;Fig. 3A). CD4+ cells represented less than 5% ofspleen lymphocytes during the first week of life,increasing up to about 13% during the second weekwhile at weaning, 25% of spleen lymphocytes were
CD4+. However, this percentage was lower thanthat present in adult animals (about 34%; po0.05).
By means of double-positive staining, we studiedthe phenotype of CD4+ spleen lymphocytes(Fig. 3B–F). During the first few days of life, mostCD4+ cells co-expressed CD3, TCRab, CD5 andCD2molecules. Although the total percentage ofCD4+ splenocytes remained constant, the relativeproportion of CD4+ cells co-expressing these
ARTICLE IN PRESS
21 days adult
TCRαβαβ TCRαβαβ CD5
21 days adult
CD90 CD90
CD
4
68
13 11
8 44
8 39
9
CD
4
CD
4
21 days adult
CD5
63
20 7
10 62
5 17
16 31
29 15
25 57
35 3
5
adult
Total CD4 + spleen lymphocytes
adultage (days)
1 5 9 11 13 15 17 19 21
% p
ositiv
e c
ells
0
5
10
15
20
25
30
35
40
CD3 + in CD4 + spleen lymphocytes
age (days)
% p
ositiv
e c
ells
0
20
40
60
80
100
TCRαβ + in CD4 + spleen lymphocytes
% p
ositiv
e c
ells
0
20
40
60
80
100
CD5 + in CD4 + spleen lymphocytes
% p
ositiv
e c
ells
20
40
60
80
100
CD2 + in CD4 + spleen lymphocytes
% p
ositiv
e c
ells
0
20
40
60
80
100
CD90 + in CD4 + spleen lymphocytes
% p
ositiv
e c
ells
0
20
40
60
80
100
∗
∗∗
∗
∗
3 7 1 5 9 11 13 15 17 19 213 7
adultadultage (days)
1 5 9 11 13 15 17 19 21
age (days)
3 7 1 5 9 11 13 15 17 19 213 7
adultadultage (days)
1 5 9 11 13 15 17 19 21
age (days)
3 7 1 5 9 11 13 15 17 19 213 7
Fig. 3. Spleen CD4+ lymphocytes in suckling and adult rats. (A) Percentage of CD4+ splenocytes with respect to total spleen
lymphocytes. (B–F) Relative proportion of CD3+, TCRab+, CD5+, CD2+ and CD90+ cells with respect to CD4+ spleen
lymphocytes. Results expressed as the mean7SEM of 4–9 values, with each derived from one animal or pools of two suckling animals.
(G–I) Representative dot-plot histograms obtained from staining CD4 with TCRab, CD5 or CD90, respectively, belonging to a 21-day-old
and an adult rat. *po0.05 day 21 vs. adult.
F.J. Perez-Cano et al. / Developmental and Comparative Immunology 31 (2007) 1264–12771270

ARTICLE IN PRESSF.J. Perez-Cano et al. / Developmental and Comparative Immunology 31 (2007) 1264–1277 1271
molecules decreased during the first 11 days of life.Thus, in the middle of rat suckling period, CD4+spleen lymphocytes presented minimum values ofCD3+, TCRab+, CD5+ and CD2+ cells. Sub-sequently, and coinciding with the expansion ofCD4+ cells in the spleen, there was a high increasein spleen CD4+ lymphocytes co-expressing CD3and CD2molecules, although the adult proportionwas not achieved in CD2+CD4+ cells (po0.05).Moreover, the proportion of TCRab+ andCD5+CD4+ cells also increased from day 11,although at weaning these proportions were far lessthan those of adult rats (po0.05) as can also beobserved in the corresponding dot plots (Fig. 3Gand H).
The expression of CD90 (Thy-1) molecule(a marker that progressively disappeared throughlymphocyte maturation) in neonatal spleen CD4+cells did not match the same time-course as theother surface markers. During suckling, the propor-tion of CD90+CD4+ cells fluctuated between 30%and 60%, whereas only 20% of adult CD4+ cellspresented this marker of immaturity. At weaning,the proportion of CD90+ cells in CD4+ spleno-cytes was still significantly higher than that found inadult rats (po0.01, Fig. 3F and I).
3.4. Time-course for CD8+ cells in the neonatal
spleen
In a manner similar to that of CD4+ splenocytes,CD8+ cells represent only a small percentage ofspleen lymphocytes during the first 11 days of life(Fig. 4A). Thereafter, we observed an age-depen-dent expansion (po0.01), with these cells reachingabout 17% on weaning day. However, as found inCD4+ lymphocytes, the proportion of spleenCD8+ cells was already significantly less than thatobserved in the adult rat spleen (about 27%,po0.05).
By means of double-positive staining, we studiedthe phenotype of CD8+ splenocytes (Fig. 4B–H. Inadult rats, CD8+ spleen cells were almost 80%CD3+, about 70% CD2+, while about half wereTCRab+ and CD5+. In addition, about 40% wereNKR-P1A+ cells and less than 10% were TCRgd+and CD90+. Our time-course study of the CD8+spleen lymphocyte phenotype revealed that theproportion of those cells co-expressing CD3,TCRab, CD2, CD5 and CD90 was at its lowestlevel during the second week of life (between days 7and 14). During the last week of suckling, which
coincided with a rise in the total percentage ofCD8+ cells in the spleen, there was an increase inthe percentage of CD8+ splenocytes co-expressingthose molecules. At weaning, the proportion ofCD8+CD3+, CD8+TCRab+ and CD8+CD2+spleen lymphocytes was similar to those found inthe adult spleen. In contrast, as occurred in CD4+cells, a relatively high proportion of spleen CD8+lymphocytes still retained CD90molecule (po0.05day 21 vs. adult, Fig. 4G). Our study of CD8+ cellswith the phenotype TCRgd+ recorded valuesranging between 5% and 20% during suckling. Atweaning, the proportion of TCRgd+ in CD8+spleen cells was significantly higher than thatpresent in adult rats (po0.05, Fig. 4D).
CD8+ splenocytes also include some NK cells.Considering the whole population of CD8+ sple-nocytes, NKR-P1A+ cells increased during the firstfew days of life, and therefore remained in a similarproportion as in the adult spleen (�40%, Fig. 4H).
3.5. NK cells in neonatal and adult spleens
NK cells constituted a low percentage of spleenlymphocytes both in neonatal as well as in adultanimals (Fig. 1). At any age, most (70–85%) co-expressed CD8molecule (Fig. 5A and B) althoughNK/CD8 dot plots showed two subpopulations:NKR-P1AhighCD8+ and NKR-P1AlowCD8+ cells(R2 and R3, respectively, in Fig. 5A and B).
Analysis of TCRab in NKR-P1A+CD8+ spleencells revealed further two subsets: NKR-P1A+TCRab+CD8+, i.e., NKT cells, and NKR-P1A+TCRab�CD8+, i.e., CD8+ NK cells, whichwere found at �40% and �60%, respectively, inboth suckling and adult rats (Fig. 5C). NKR-P1AhighCD8+ cells did not express TCRab, whereasmost NKR-P1AlowCD8+ cells were TCRab+ cells(NKT cells; Fig. 5C). Further analysis of spleenNKR-P1AlowCD8+ cells showed that most of theselymphocytes were CD8ab+CD5+, whereas NKR-P1AhighCD8+ cells were predominantly CD8aa+CD5� (Fig. 5D and E).
3.6. Proliferative capacity of neonatal splenocytes
To determine the functional capacity of neonatalsplenocytes, we studied the lymphoproliferativeresponse after the addition of either Con A orPWM (T and B stimulus, respectively) duringsuckling.

ARTICLE IN PRESS
TCRαβ + in CD8 + spleen lymphocytes
% p
ositiv
e c
ells
0
20
40
60
80
100
∗
∗
Total CD8 + spleen lymphocytes CD3 + in CD8 + spleen lymphocytes
% p
ositiv
e c
ells
0
20
40
60
80
100
∗
age (days)
1 9 11 13 15 17 19 21
% p
ositiv
e c
ells
0
5
10
15
20
25
30
35
40
45
50
adult
TCRγδ + in CD8 + spleen lymphocytes
% p
ositiv
e c
ells
0
20
40
60
80
100
CD2 + in CD8 + spleen lymphocytes
% p
ositiv
e c
ells
0
20
40
60
80
100CD5 + in CD8 + spleen lymphocytes
% p
ositiv
e c
ells
0
20
40
60
80
100
∗
CD90 + in CD8 + spleen lymphocytes
% p
ositiv
e c
ells
0
20
40
60
80
100NKR-P1A + in CD8 + spleen lymphocytes
% p
ositiv
e c
ells
0
20
40
60
80
100
3 5 7
age (days)
1 9 11 13 15 17 19 21
adult
3 5 7
age (days)
1 9 11 13 15 17 19 21
adult
3 5 7
age (days)
1 9 11 13 15 17 19 21
adult
3 5 7
age (days)
1 9 11 13 15 17 19 21
adult
3 5 7
age (days)
1 9 11 13 15 17 19 21
adult
3 5 7
age (days)
1 9 11 13 15 17 19 21
adult
3 5 7
age (days)
1 9 11 13 15 17 19 21
adult
3 5 7
Fig. 4. Spleen CD8+ cells in suckling and adult rats. (A) Percentage of CD8+ cells with respect to total spleen lymphocytes. (B–H)
Relative proportion of CD3+, TCRab+, TCRgd+, CD5+, CD2+, CD90+ and NKR-P1A+ cells with respect to CD8+ spleen
lymphocytes. Results expressed as the mean 7 SEM of 4–9 values, with each derived from one animal or pools of two suckling animals.
*po0.05 day 21 vs. adult.
F.J. Perez-Cano et al. / Developmental and Comparative Immunology 31 (2007) 1264–12771272

ARTICLE IN PRESS
Fig. 5. Phenotype of spleen NK cells in suckling and adult rats. Representative cytograms obtained by CD8a/NKR-P1A MAb labelling
from (A) adult, and (B) 21-day-old rat splenocytes. CD8+NKR-P1A+ cells (R1 gate both in A and B) showed two phenotypes:
CD8+NKR-P1Alow cells (R2 gate) and CD8+NKR-P1Ahigh cells (R3 gate). Representative fluorescence intensity histograms after
staining with fluorochrome-conjugated monoclonal antibodies to TCRab (C), CD8b (D) and CD5 (E) in R1, R2 or R3 regions defined
from CD8a/NKR-P1A staining of 21-day-old rat splenocytes.
F.J. Perez-Cano et al. / Developmental and Comparative Immunology 31 (2007) 1264–1277 1273
As can be seen in Fig. 6, a low T and Bproliferative response was initially detected insplenocytes obtained at day 11 (o5% of adultresponse). The proliferative capacity of both spleen
cell subsets rose markedly during the last week ofsuckling. However, the T and B proliferativeresponse at weaning was far less than that of adultrats (o55% of adult response, po0.05; Fig. 6).

ARTICLE IN PRESS
age (days)
7 11 16 19 21
pro
lifera
tive r
esponse (
%)
0
10
20
30
40
50
60
70
80
90
100
110
Con A
PWM
adult
∗
∗
Fig. 6. Time-course of splenocyte proliferative response. Results
expressed as the percentage of the lymphoproliferative response
of an adult rat studied at the same time. Results are expressed as
the mean 7 SEM of 4–9 values, with each derived from
quadruplicates of one adult animal or pools of two suckling
animals.
F.J. Perez-Cano et al. / Developmental and Comparative Immunology 31 (2007) 1264–12771274
4. Discussion
We described here the developmental changesthat occurred in Lewis rat spleens during postnatallymphocyte expansion. This study focussed onspleen lymphocyte composition and two basicfeatures of the adaptive immune response: prolif-eration ability under stimulatory conditions andantibody production capacity.
As is well known in both mice and humans, Blymphocytes similarly constitute in rats the earliestoccurring population in the spleen after birth. Inour study, while the most precocious B cellsexpressed surface Igk, only a few cells wereCD45RA+. During the suckling period, these cellspresented an immature phenotype characterized bylow surface IgM expression. These results agreewith those of Adkins et al. [7] who reportedphenotypic immaturity in the spleen B cells ofneonatal mice.
This study also shows that the suckling period ischaracterized by the low proliferative response of Bsplenocytes , with an ability to produce antibodiesvery low. On the other hand, serum IgG, IgM andIgA were already detected in 5-day-old rats. IgGmay reflect the transference from the mother inaddition to a neonatal production in the moremature lymph nodes or bone marrow, although thisactive secretion remains to be studied. The low Igproduction by neonatal splenocytes agrees withAdkins et al. [25] who demonstrated that anti-body production in early life were unaffected by
splenectomy. The progressive increase in bothspleen IgM secretion ability and sera IgM levelsduring suckling could reflect the maturation of thespleen immune system. As in other mammals, IgAwas the last Ig isotype to appear in rat sera.Previous studies on Lewis suckling rats revealedthe appearance of IgA-SC in intestinal laminapropria around the weaning day [23]. The kineticsof IgA appearance in sera may result from these gutIgA-plasma cells challenged by the progressivemicrobiota colonization of mucosal surfaces [26],in tandem with the solid diet that is introducedduring the last week of the rat suckling periodcoinciding with the rise of sera IgA.
T lymphocytes in the neonatal spleen werefound in very low proportions during the first 2weeks of life. In neonatal mouse lymph nodes,CD3+ T cells have been described as occurring inlow numbers during the first 1–2 days of life, witha sharp increase beginning at postnatal day 3 [2].All of these results agree with those of Adkins et al.[27,28] who showed that neonatal spleen T-cellresponses are weak and that T-cell maturation inlymph nodes is faster than in the spleen. The slowerexpansion of T cells vs. those of B lymphocytescould stem from T-cell development in the thymus,which incorporates multiple stages extendingacross many cell cycles and over a long period oftime [29].
Our time-course analysis on the phenotypicalcomposition of both CD4+ and CD8+ T cells, aswell as the proportion of ‘‘negative cells’’ (i.e., cellslacking CD4, CD8, TCRab, TCRgd, CD45RA, Igkand NKR-P1A molecules), allowed us to divide thesuckling period into two phases: early neonatal life(first half) and late suckling period (second half).These two periods may result from a dynamicequilibrium among cell precursors generated byfoetal (first wave) and neonatal (second wave)haematopoietic organs.
Early neonatal life is characterized by a lowproportion of CD4+ and CD8+ cells in the spleen.The low percentage of these cells during the firstdays of life corresponded to cells bearing CD3,TCRab, CD5 and CD2molecules. These cells maycome from foetal rat thymocytes which are de-scribed as CD2+, CD5+, CD3+ and TCRab+ atthe end of the foetal period [1]. From birth until day11, these spleen CD4+ and CD8+ populationsdecreased whereas the percentage of CD4+ andCD8+ cells lacking those markers (immature cells)progressively increased. Thus, we have found that
ARTICLE IN PRESSF.J. Perez-Cano et al. / Developmental and Comparative Immunology 31 (2007) 1264–1277 1275
on day 11 after birth 50% CD4+ and CD8+splenocytes lack CD3. In this sense, it has beensuggested that these cells mature into NK cells ordendritic cells but not into T or B lymphocytes [30].
In the second half of the suckling period, CD4+and CD8+ cells in the spleen increased both innumber and in proportion, appearing lymphocytesbearing CD3, TCRab, CD5 and CD2molecules.This increase in the number of spleen lymphocytesbearing the phenotype TCRab+ coincided with asudden increase of TCRab+ cells and a decreasein CD4�CD8� cells in the thymus by the beginningof the second week of life [1]. Analogously, inneonatal lymph nodes, a rapid diminution ofCD4+CD3� T cells has been noted to occurduring post-natal life [2].
The CD90 (Thy-1) molecule is considered amarker of the early stages of lymphocyte develop-ment [31]. We found that the proportion of CD90+cells in CD4+ and CD8+ spleen subsets, althoughranged widely during suckling, always involvedhigher percentages than those present in adultspleen cells. Thus, the presence of CD90 in thesecells again indicates that T lymphocytes did notachieve a mature adult phenotype at weaning day.
In regards to the capacity of neonatal spleenlymphocytes to proliferate, we observed a limitedability during early life, with an age-dependentincrease occurring during suckling. The proliferativeresponse increased in the third week of life coincid-ing with the CD4+ and CD8+ T-cell expansion.However, as the lymphocyte phenotype, this func-tional capacity did not reach the adult level atweaning. The lower spleen lymphoproliferativeresponse during suckling must play a key role inthe maintenance of tolerance during this period andcould be attributed not only to lymphocyte im-maturity but also to the influence of other popula-tions involved in this activity. Thus, it may stemfrom the lower capacity of dendritic cells to producecytokines [10] or from the predominance of acontrolling mechanism; e.g., regulatory T lympho-cytes already present in newborns exerting aninhibitory effect on proliferation [32,33].
Spleens from suckling rats also contained NKcells. We had already detected NKR-P1A+ sple-nocytes in the first days of life, and during thesuckling period they were present in proportionssimilar to those seen in adult life. In the first 2 weeksof suckling, spleen NKR-P1A+ cells were asabundant as T cells, suggesting that these pivotalcells in innate immunity [34], play a key role during
early life. The phenotypic study of NKR-P1A+cells showed the presence of NKT cells in neonataland adult rat spleens. These NKT cells observed inearly life may exert some regulatory function and aplay role in peripheral tolerance such as has beendescribed for NKT cells in adult animals [35].Although exhaustive information regarding NKTcells in human and mouse abounds [36], only a fewstudies have focussed on rats [37,38], and even lesson the spleen in early life. Our results on neonatalanimals agree with those of Matsuura et al. [37],which described splenic NKT cells in the adult ratbearing CD8molecules, albeit differentially withother species [39]. Moreover, we establish here thatspleen NKT cells, throughout suckling and adultage, were mainly NKR-P1Alow CD5+ andCD8ab+, whereas NK cells exhibited the NKR-P1AhighCD5�CD8aa+ phenotype.
In summary, the results of the present study showage-related changes in the composition and func-tionality of lymphocytes in the neonatal rat spleen.NK–NKT cell innate immunity and B cell acquiredimmunity seem to develop earlier than T-cell-mediated immunity, although B cells were not fullyfunctional at weaning. The principal changesoccurred during the second half of the sucklingperiod, when spleen T cells matured dramaticallyboth in their phenotype and proliferative abilityalthough the adult pattern was not achieved atweaning.
Acknowledgements
We thank Laura Colell and Encarna Tovar fortheir help in laboratory work. We also thank the‘‘Serveis Cientıfico-Tecnics’’ of the University ofBarcelona, especially Dr. J. Comas, for expertassistance in flow cytometry.
This study was supported by grants from theMinisterio de Ciencia y Tecnologıa (AGL 2000-0913) and from the Generalitat de Catalunya(SGCR-2005-00833). FJPC was the recipient of afellowship from the Generalitat de Catalunya (200000340 FI), SMG from the University of Barcelonaand AGC from the Ministerio de Ciencia yTecnologıa.
References
[1] Vicente A, Varas A, Acedon RS, Jimenez E, Munoz JJ,
Zapata AG. Appearance and maturation of T-cell subsets
during rat thymus ontogeny. Dev Immunol 1998;5:319–34.

ARTICLE IN PRESSF.J. Perez-Cano et al. / Developmental and Comparative Immunology 31 (2007) 1264–12771276
[2] Kelly KA, Scollay R. Seeding of neonatal lymph nodes by T
cells and identification of a novel population of CD3-CD4+
cells. Eur J Immunol 1992;22:329–34.
[3] Modigliani Y, Coutinho G, Burlen-Defranoux O, Coutinho
A, Bandeira A. Differential contribution of thymic outputs
and peripheral expansion in the development of peripheral T
cell pools. Eur J Immunol 1994;24:1223–7.
[4] Miller JF, Osoba D. Current concepts of the immunological
function of the thymus. Physiol Rev 1967;47(3):437–520.
[5] Adkins B. T-cell function in newborn mice and humans.
Immunol Today 1999;20:330–5.
[6] Piguet PF, Irle C, Kollatte E, Vassalli P. Post-thymic T
lymphocyte maturation during ontogenesis. J Exp Med
1981;154:581–93.
[7] Adkins B, Leclerc C, Marshall-Clarke S. Neonatal adaptive
immunity comes of age. Nat Rev Immunol 2004;4(7):
553–64.
[8] Moser JM, Altman JD, Lukacher AE. Antiviral CD8+ T
cell responses in neonatal mice: susceptibility to polyoma
virus-induced tumors in associated with lack of cytotoxic
function by viral antigen-specific T cells. J Exp Med 2001;
193(5):595–606.
[9] Da Silva J, de Sousa D, Carmona D, Isaura J, Russo M,
Monteiro N, et al. Stimulation by food proteins plays a
critical role in the maturation of the immune system. Int
Immunol 2003;15:447–55.
[10] Marchant A, Goldman M. T cell-mediated immune
responses in human newborns: ready to learn? Clin Exp
Immunol 2005;141:10–8.
[11] Vekemans J, Ota MO, Wang EC, Kidd M, Borysiewicz LK,
Whittle H, et al. T cell responses to vaccines in infants:
defective IFNg production after oral polio vaccination. Clin
Exp Immunol 2002;127:495–8.
[12] Ota MO, Vekemans J, Schlegel-Haueter SE, Fielding K,
Whittle H, Lambert PH, et al. Hepatitis B immunisation
induces higher antibody and memory Th2 responses in new-
borns than in adults. Vaccine 2004;22:511–9.
[13] Marchant A, Goetghebuer T, Ota MO, Wolfe I, Ceesay SJ,
De Groote D, et al. Newborns develop a Th1-type immune
response to Mycobacterium bovis bacillus Calmette-Guerin
vaccination. J Immunol 1999;163:2249–55.
[14] Tonon S, Goriely S, Aksoy E, Pradier O, Del Giudice G,
Trannoy E, et al. Bordetella pertussis toxin induces the
release of inflammatory cytokines and dendritic cell activa-
tion in whole blood: impaired responses in human newborns.
Eur J Immunol 2002;32:3118–25.
[15] Jotereau F, Heuze F, Salomon-Vie V, Gascan H. Cell
kinetics in the fetal mouse thymus: precursor cell input,
proliferation, and emigration. J Immunol 1987;138:
1026–30.
[16] Douagi I, Andre I, Ferraz JC, Cumano A. Characterization
of T cell precursor activity in the murine fetal thymus:
evidence for an input of T cell precursors between
days 12 and 14 of gestation. Eur J Immunol 2000;30:
2201–10.
[17] Adkins B, Bu Y, Vincek V, Guevara P. The primary
responses of murine neonatal lymph node CD4+ cells are
TH2-skewed and are sufficient for the development of TH2-
biased memory. Clin Dev Immunol 2003;10:45–51.
[18] Prescott SL, Macaubas C, Holt BJ, Smallacombe TB, Loh
R, Sly PD, et al. Transplacental priming of the human
immune system to environmental allergens: universal skew-
ing of initial T cell responses toward the TH2 cytokine
profile. J Immunol 1998;160(10):4730–7.
[19] Marshall-Clarke S, Reen D, Tasker L, Hassan J. Neonatal
immunity: how well has it grown up? Immunol Today
2000;21:35–41.
[20] Siegrist CA. Neonatal and early life vaccinology. Vaccine
2001;19:3331–46.
[21] Lu LS, Tung J, Baumgarth N, Herman O, Gleimer M,
Herzenberg LA. Identification of a germ-line pro-B cell
subset that distinguishes the fetal/neonatal from the adult B
cell development pathway. Proc Natl Acad Sci USA
2002;99:3007–12.
[22] Pihlgren M, Tougne C, Bozzotti P, Fulurija A, Duchosal
MA, Lambert PH, et al. Unresponsiveness to lymphoid-
mediated signals at the neonatal follicular dendritic cell
precursor level contributes to delayed germinal center
induction and limitations of neonatal antibody responses
to T-dependent antigens. J Immunol 2003;170:2824–32.
[23] Perez-Cano FJ, Castellote C, Marın-Gallen S, Franch A,
Castell M. Neonatal immunoglobulin secretion and lym-
phocyte phenotype in rat small intestine lamina propria.
Pediatr Res 2005;58:164–9.
[24] Pelegri C, Morante MP, Castellote C, Franch A, Castell M.
Treatment with an anti-CD4 monoclonal antibody strongly
ameliorates established rat adjuvant arthritis. Clin Exp
Immunol 1996;103:273–8.
[25] Adkins B, Bu Y, Vincek V, Guevara P. The primary
responses of murine neonatal lymph node CD4+ cells are
TH2-skewed and are sufficient for the development of TH2-
biased memory. Clin Dev Immunol 2003;10:45–51.
[26] Cummins AG, Thompson FM. Postnatal changes in
mucosal immune response: a physiological perspective of
breast feeding and weaning. Immunol Cell Biol 1997;75:
419–29.
[27] Adkins B, Du RQ. Newborn mice develop balanced
Th1/Th2 primary effector responses in vivo but are biased
to Th2 secondary responses. J Immunol 1998;160(9):
4217–24.
[28] Adkins B, Bu Y, Cepero E, Perez R. Exclusive Th2 primary
effector function in spleens but mixed Th1/Th2 function in
lymph nodes of murine neonates. J Immunol 2000;164(5):
2347–53.
[29] Rothenberg EV, Taghon T. Molecular genetics of T cell
development. Annu Rev Immunol 2005;23:601–49.
[30] Mebius RE, Rennert P, Weissman L. Developing lymph
nodes collect CD4+CD3-LTb+ cells that can differentiate
to APC, NK cells, and follicular cells but not T or B cells.
Immunity 1997;7:493–504.
[31] Kroese FG. Immunology of the rat. In: Pastoret PP, Griebel
P, Bazin H, Govaerts A, editors. Handbook of vertebrate
immunology. San Diego, CA: Academic Press; 1998.
p. 137–98.
[32] Takahata Y, Nomura A, Takada H, Ohga S, Furuno K,
Hikino S, et al. CD25+CD4+ T cells in human cord blood:
an inmunoregulatory subset with naive phenotype and
specific expression of forkhead box p3 (Foxp3) gene. Exp
Hematol 2004;32(7):622–9.
[33] Thornton CA, Upham JW, Wikstrom ME, Holt BJ, White
GP, Sharp MJ, et al. Functional maturation of
CD4+CD25+CTLA+CD45RA+ T regulatory cells in
human neonatal T cell responses to environmental antigens/
allergens. J Immunol 2004;173:3084–92.

ARTICLE IN PRESSF.J. Perez-Cano et al. / Developmental and Comparative Immunology 31 (2007) 1264–1277 1277
[34] Hamerman JA, Ogasawara K, Lanier LL. NK cells in innate
immunity. Curr Opin Immunol 2005;17:29–35.
[35] Taniguchi M, Harada M, Kojo S, Nakayama T, Wakao H.
Annu Rev Immunol 2003;21:483–513.
[36] Berzins SP, Smyth MJ, Godfrey DI. Working with NKT
cells—pitfalls and practicalities. Curr Opin Immunol 2005;
17:448–54.
[37] Matsuura A, Kinebuchi M, Chen HZ, Katabami S, Shimizu
T, Hashimoto Y, et al. J Immunol 2000;164:3140–8.
[38] Shao H, Kaer LV, Sun SL, Kaplan HJ, Sun D. Infiltration of
the inflamed eye by NKT cells in a rat model of experimental
autoimmune uveitis. J Autoimmun 2003;21:37–45.
[39] Godfrey DI, MacDonald HR, Kronenmberg M, Smyth MJ,
Van Kaer L. Nat Rev Immunol 2004;4:231–7.