phase–shift of polysaccharide capsule expression in group b streptococci type iii
TRANSCRIPT

Microbial Pathogenesis 1995; 18: 401–415
Phase-shift of polysaccharide capsule expression ingroup B streptococci, type III
Mats Sellin,1* Stellan Hakansson2 and Mari Norgren1
Departments of Clinical Bacteriology1 and Pediatrics2, Umea University,
S-901 85 Umea Sweden
(Received January 20, 1995; accepted in revised form May 13, 1995)
—––––––––––––––––––––––––––––––––––––––––––––––––––––––––––––––––––––––––––––Sellin, M. (Dept of Clinical Bacteriology, Umea University, S-901 85 Umea, Sweden), S. Hak-
ansson and M. Norgren. Phase-shift of polysaccharide capsule expression in group B strep-
tococci, type III. Microbial Pathogenesis 1995; 18: 401–415.
The type-specific polysaccharide capsule is an important virulence determinant in group B
streptococci (GBS). The previously described inverse relationship between the buoyant density
of a GBS-isolate and the capsular thickness was used to assess the frequencies of poly-
saccharide capsular phase-shift in clinical GBS, type III strains. Shift from intermediate density
(ID) of parental strains, to high density (HD), i.e. shift from intermediate capsule thickness to
poor encapsulation, was found to range from 1.2×10⁻³ to 4.8×10⁻⁶. Shift from ID to low
density (LD), i.e. shift to abundant encapsulation, ranged from 1.9×10⁻⁴ to 1.1×10⁻⁷. Shifts
were reversible in all cases, either directly (HD : LD or vice versa) or through intermediate
forms. Reversion frequencies were in some isolates as high as 10−1. Phase-shift frequencies
differed more than a thousand-fold between compared strains. Differences in phenotypic
shift between strains were validated using flow cytometry. Possible modulation of capsule
expression by changes in culture conditions was assessed. Variation of temperature, oxygen-
tension, and presence of human serum did not affect capsule expression. However, growth at
pH below 5.5 decreased the amount of capsule bound native type III polysaccharide, probably
through phenotypic modification rather than genetic shift. IS861, an insertion sequence which
has been proposed a regulatory function on the GBS capsule expression, was found in multiple
copies in the isolates investigated. No differences in copy number or location of IS861 between
the differently encapsulated phenotypes were found.
Key words : Group B streptococci; polysaccharide capsule; buoyant density; phase-shift.
—––––––––––––––––––––––––––––––––––––––––––––––––––––––––––––––––––––––––––––
Introduction
Group B streptococci (GBS) are currently the most common etiologic agent to neo-
natal bacteraemia and meningitis.1 The pathogenic process of invasive early onset
GBS-disease involve host-bacterial interactions at several levels. The child commonly
acquires GBS at birth during or before passage through the birth canal. Bacteria
eventually gain access to the blood through invasion of respiratory epithelium and
capillary endothelial cells.2,3 One significant virulence factor in GBS is the expression
of type specific polysaccharide capsule. Type III GBS which produce high levels of
polysaccharide, exhibit higher virulence than isolates producing low levels.4 Fur-
thermore, capsule deficient GBS have exhibited diminished virulence compared to
their isogenic original strains.5,6
*Author to whom correspondence should be addressed.
0882-4010/95/060401+15 $08.00/0 = 1995 Academic Press Limited

M. Sellin et al.402
Fig. 1. Schematic drawings of linear hypotonic Percoll® gradients with endpoints 1.13 mg/l (bottom) and
1.0 mg/l (top), before and after centrifugation. F1, F2, and F3 are the designation of the fractions that were
isolated for separate viable count (VC) calculations. Following formulas were used to assess the ratio of
the number of bacteria with deviant phenotype (M) devided by the total number of bacteria in the gradient
(N).
Shift from ID to HD: M/N =VCF3
VCF1+F2+VCF3
Shift from ID to LD: M/N =VCF1
VCF1+VCF2+F3
For the calculation of reversion frequencies the M/N ratios were calculated as follows
Reversion from HD to LD: M/N =VCF1
VCF1+VCF2+VCF3
Reversion from HD to ID and LD: M/N =VCF1+VCF2
VCF1+VCF2+VCF3
Reversion from LD to HD: M/N =VCF3
VCF1+VCF2+VCF3
Reversion from LD to ID and HD: M/N =VCF2+VCF3
VCF1+VCF2+VCF3
The study of capsule expression in GBS is hampered by the fact that presence or
absence of capsule does not correlate with gross colony morphological features. In
other potentially invasive encapsulated bacteria, for instance Streptococcus pneu-
moniae and Haemophilus influenzae type b, distinguishing morphological traits
facilitate this issue.7,8 A method to estimate capsular phenotype in GBS, based on
the inverse correlation between capsule thickness and buoyant density, has pre-
viously been reported by us.9 GBS with poor encapsulation have high density (HD)
while GBS with abundant encapsulation have low density (LD) (Fig. 1). Commonly
clinical GBS isolates with seemingly homogeneous gross morphology have an inter-
mediate density (ID) but also fractions of bacteria with aberrant capsular thickness
can be found after buoyant density centrifugation.10 The significance of this pheno-
typic variation remains unknown. However, this phenomenon may be of importance
in the pathogenesis of invasive GBS disease since GBS with high density exhibit
Phase shift of capsule expression in GBS 403
increased adhesive capacity and diminished capability to withstand phagocytosis as
compared to GBS with low density.10,11
Feasible screening methods for phenotype assessment have promoted elucidation
of the regulatory mechanisms for capsule expression in H. influenzae type b. Studies
based on colony iridescence have identified gene-amplification as one regulatory
component where increasing amount of capsule is expressed with increasing num-
ber of copies of the cap locus, flanked by insertions-sequence, IS1016.12,13 It is not
yet known how capsule expression in GBS is regulated. Also in GBS the influence
on encapsulation by an insertions-sequence, IS861, has been discussed.14 To this
end the presence and copy number of insertion sequence IS861 in GBS with different
capsular phenotype were investigated in this study.
With methods based on buoyant density centrifugation, we also aimed to charac-
terize the dynamic features of the phenotypic variation such as frequency, reversi-
bility and whether it is influenced by environmental factors. To further validate the
results based on buoyant density other phenotyping methods such as flow cytometry
and immunogold electron microscopy were designed.
Results
Buoyant density distribution
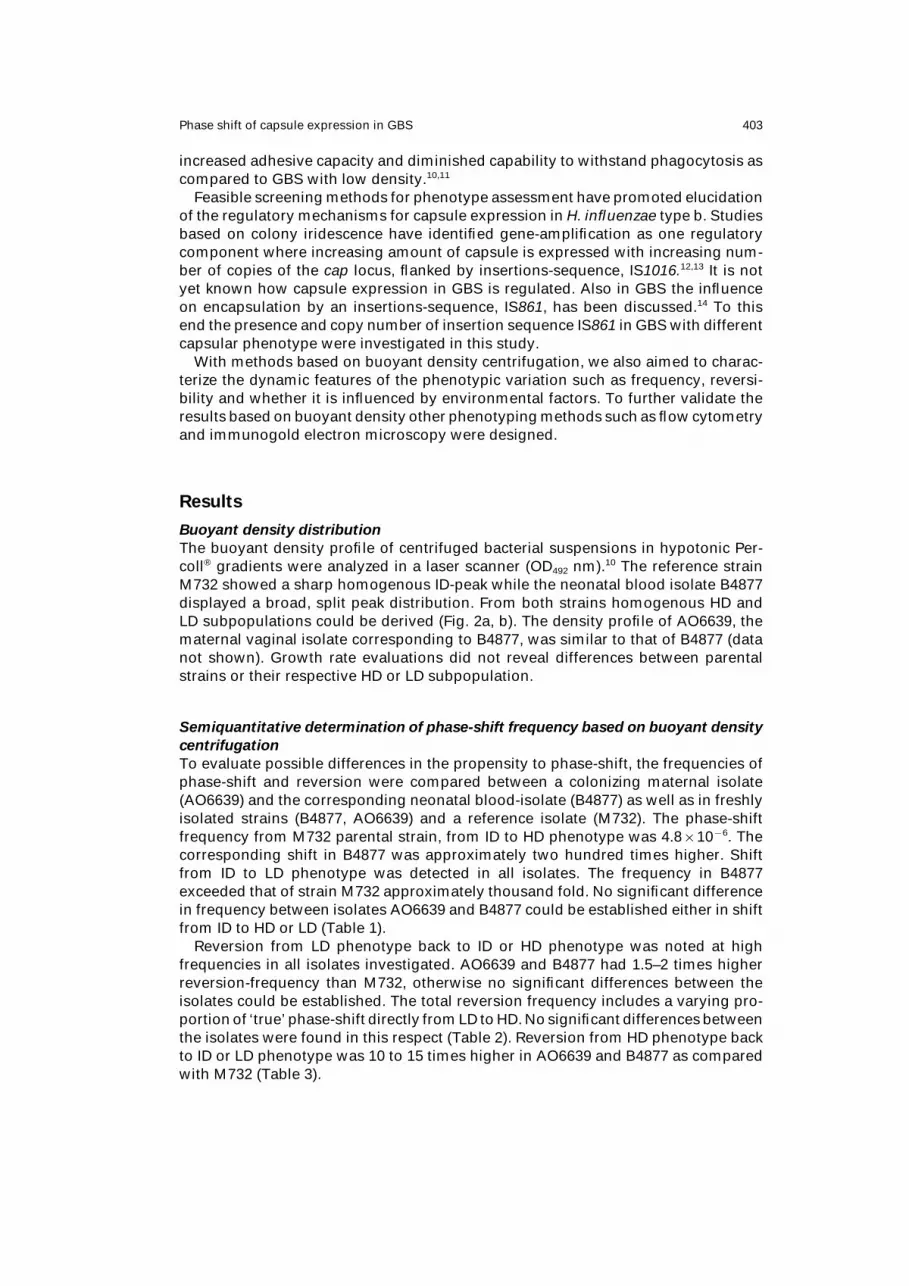
The buoyant density profile of centrifuged bacterial suspensions in hypotonic Per-
coll® gradients were analyzed in a laser scanner (OD492 nm).10 The reference strain
M732 showed a sharp homogenous ID-peak while the neonatal blood isolate B4877
displayed a broad, split peak distribution. From both strains homogenous HD and
LD subpopulations could be derived (Fig. 2a, b). The density profile of AO6639, the
maternal vaginal isolate corresponding to B4877, was similar to that of B4877 (data
not shown). Growth rate evaluations did not reveal differences between parental
strains or their respective HD or LD subpopulation.
Semiquantitative determination of phase-shift frequency based on buoyant density
centrifugation
To evaluate possible differences in the propensity to phase-shift, the frequencies of
phase-shift and reversion were compared between a colonizing maternal isolate
(AO6639) and the corresponding neonatal blood-isolate (B4877) as well as in freshly
isolated strains (B4877, AO6639) and a reference isolate (M732). The phase-shift
frequency from M732 parental strain, from ID to HD phenotype was 4.8×10⁻⁶. The
corresponding shift in B4877 was approximately two hundred times higher. Shift
from ID to LD phenotype was detected in all isolates. The frequency in B4877
exceeded that of strain M732 approximately thousand fold. No significant difference
in frequency between isolates AO6639 and B4877 could be established either in shift
from ID to HD or LD (Table 1).
Reversion from LD phenotype back to ID or HD phenotype was noted at high
frequencies in all isolates investigated. AO6639 and B4877 had 1.5–2 times higher
reversion-frequency than M732, otherwise no significant differences between the
isolates could be established. The total reversion frequency includes a varying pro-
portion of ‘true’ phase-shift directly from LD to HD. No significant differences between
the isolates were found in this respect (Table 2). Reversion from HD phenotype back
to ID or LD phenotype was 10 to 15 times higher in AO6639 and B4877 as compared
with M732 (Table 3).
M. Sellin et al.404
(a)
(b)
Fig. 2. Panel a: Laserscan of tubes after hypotonic Percoll® gradient centrifugation displaying buoyant
density profile of GBS strain M732, the low density variant M732LD, and the high density variant M732HD.
Panel b: Buoyant density profile of strain B4877, B4877HD, and B4877LD.
Flow cytometry
To substantiate the frequency estimations of the phase-shift based on buoyant
density, a flow cytometry method for assessing capsule phenotype was designed.
This method is based on the affinity of wheat germ agglutinin (WGA) to sialic acid
and N-acetylglucosamine, two elements of the pentasaccharide which after assembly
into a polymer form the type III GBS capsule.16 After labeling GBS with WGA coupled
to FITC (fluorescein-isothiocyanate), HD and ID subpopulations could be dis-
tinguished by monitoring side-scatter and fluorescence intensity in flow cytometry.
In reference isolate M732 a homogenous pattern was displayed. M732HD was

Phase shift of capsule expression in GBS 405
Table 1 The frequency of buoyant density phase-shift in GBS—–––––––––––––––––––––––––––––––––––––––––––––––––––––––––––––––––––––––––––––––––––––––––––––––––––
Shift from ID to HD Shift from ID to LD
—–––––––––––––––––––––––––––––––––––––––– —–––––––––––––––––––––––––––––––––––––
Frequency Frequency
Isolate M/Na (M/N)/g M/Na (M/N)/g
—–––––––––––––––––––––––––––––––––––––––––––––––––––––––––––––––––––––––––––––––––––––––––––––––––––
M732 3.423.0×10−5 4.8×10⁻⁶ 7.926.8×10−7 1.1×10⁻⁷
AO6639 5.522.6×10−3 1.2×10⁻³ 2.622.1×10−4 5.6×10⁻⁵
B4877 4.520.95×10−3 9.0×10⁻⁴ 9.7212×10⁻⁴ 1.9×10⁻⁴
—–––––––––––––––––––––––––––––––––––––––––––––––––––––––––––––––––––––––––––––––––––––––––––––––––––
Shift from the intermediate buoyant density (ID) of original isolates to high density (HD) indicating shift
from medium to poor encapsulation or from ID to low density (LD), indicating shift from medium to
abundant encapsulation.
Frequencies were calculated according to Eisenstein et al,15 by the formula (M/N)/g where ‘M/N’ either
is the ratio of the number of bacteria with HD-phenotype to total number of cells in the examined
gradient, or LD-phenotype to total number of cells and where ‘‘g’’ is the mean number of generations from
inoculation to harvest. M/N ratios are the means2SD of three independent experiments.aM/N ratios of AO6639 or B4877 are significantly (P ³ 0.05) higher than that of M732.
Table 2 Frequency of reversion from low buoyant density (LD) phase in GBS—–––––––––––––––––––––––––––––––––––––––––––––––––––––––––––––––––––––––––––––––––––––––––––––––––––
Reversion from LD : HD Reversion from LD : ID or HD
—–––––––––––––––––––––––––––––––––––––––– —–––––––––––––––––––––––––––––––––––––
Frequency Frequency
Isolate M/N (M/N)/g M/Na (M/N)/g
—–––––––––––––––––––––––––––––––––––––––––––––––––––––––––––––––––––––––––––––––––––––––––––––––––––
M732 4.325.8×10−2 6.2×10⁻³ 4.422.1×10−1 6.3×10⁻²
AO6639 1.921.9×10−2 3.9×10⁻³ 7.022.4×10−1 1.4×10⁻¹
B4877 6.729.1×10−2 1.5×10⁻² 8.921.1×10−1 1.9×10⁻²
—–––––––––––––––––––––––––––––––––––––––––––––––––––––––––––––––––––––––––––––––––––––––––––––––––––
Reversion from low buoyant density to high buoyant density (LD : HD) or to high or intermediate
buoyant density (LD : ID or HD). M/N ratios are the means 2SD of three independent experiments.aM/N ratios of AO6639 or B4877 are significantly (P ³ 0.05) higher than that of M732.
Table 3 Frequency of reversion from high buoyant density (HD) phase in GBS—–––––––––––––––––––––––––––––––––––––––––––––––––––––––––––––––––––––––––––––––––––––––––––––––––––
Reversion from HD : LD Reversion from HD : ID or LD
—–––––––––––––––––––––––––––––––––––––––– —–––––––––––––––––––––––––––––––––––––
Frequency Frequency
Isolate M/Na (M/N)/g M/Na (M/N)/g
—–––––––––––––––––––––––––––––––––––––––––––––––––––––––––––––––––––––––––––––––––––––––––––––––––––
M732 1.221×10⁻⁶ 1.6×10⁻⁷ 3.220.7×10−2 4.5×10⁻³
AO6639 2.320.3×10−5 5.4×10⁻⁶ 3.223×10⁻¹ 7.5×10⁻²
B4877 2.321×10⁻⁵ 5×10⁻⁶ 4.823.1×10−1 1.0×10⁻¹
—–––––––––––––––––––––––––––––––––––––––––––––––––––––––––––––––––––––––––––––––––––––––––––––––––––aM/N ratios of AO6639 or B4877 are significantly (P ³ 0.05) higher than that of M732.
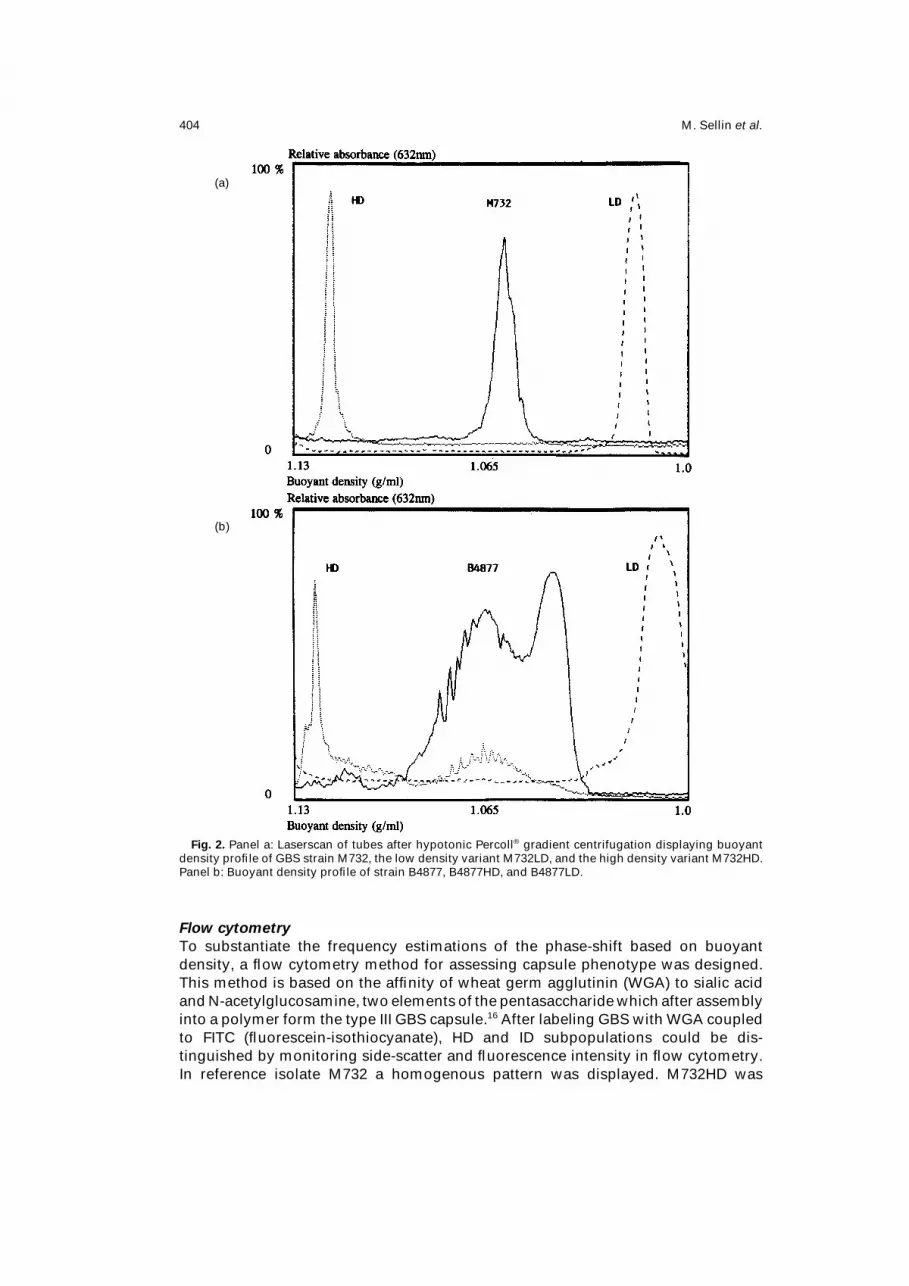
detected as a distinct population down to dilutions of 10−2 mixed in a suspension of
M732 (Fig. 3a–d). In B4877 two populations were distinguishable already in the flow
cytometry pattern of primary isolates (Fig. 4a), and the population with low intensity
was identical with the selected HD-subpopulation, B4877HD (Fig. 4b).
Immunogold electron microscopy
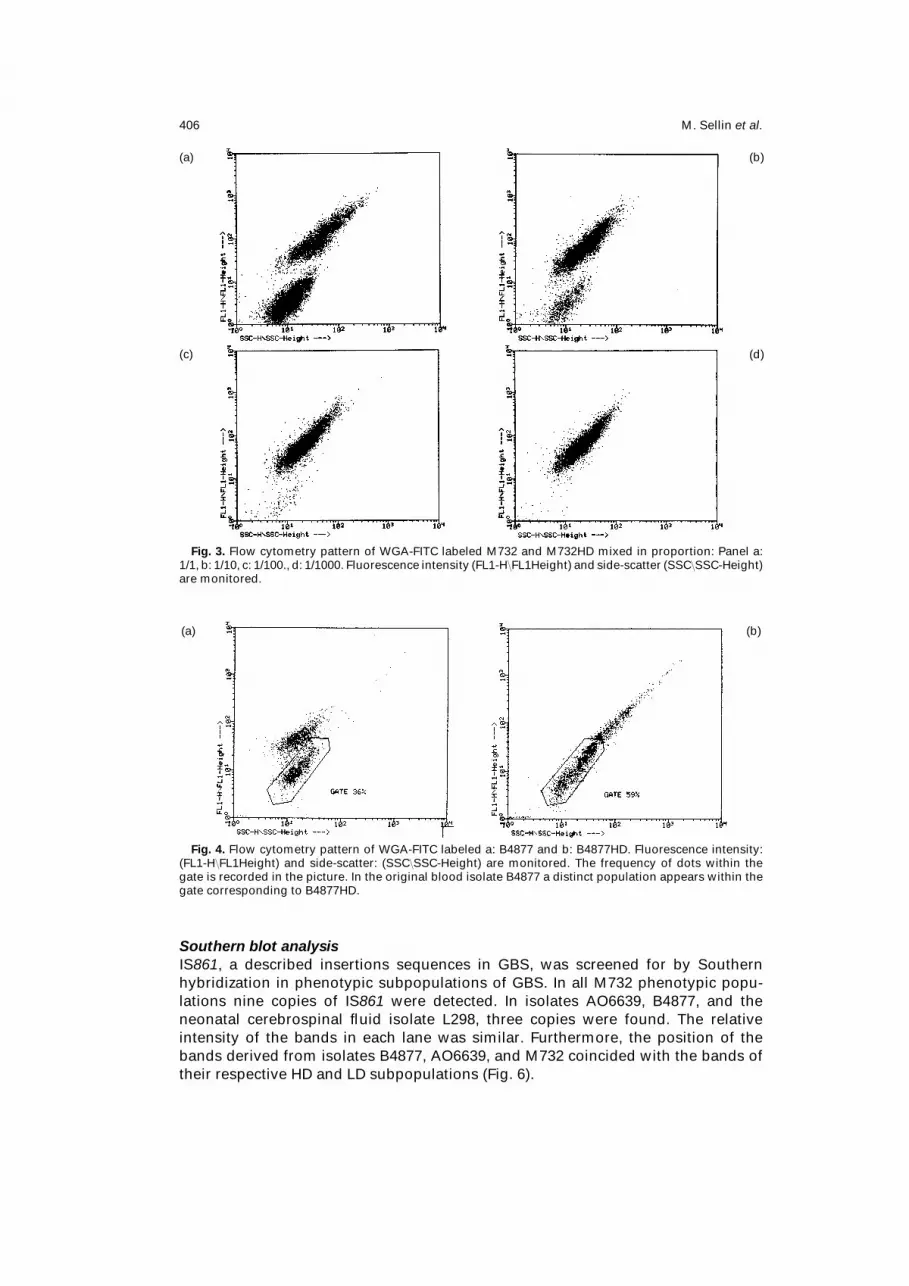
The inverse relationship between encapsulation and buoyant density of GBS was
confirmed by immunogold electron microscopy, i.e. HD subpopulations had low or
no capsular antigen while ID subpopulations showed intermediate, and LD sub-
populations extensive labeling with immunogold (Fig. 5a–c).
M. Sellin et al.406
(a) (b)
(c) (d)
Fig. 3. Flow cytometry pattern of WGA-FITC labeled M732 and M732HD mixed in proportion: Panel a:
1/1, b: 1/10, c: 1/100., d: 1/1000. Fluorescence intensity (FL1-H FL1Height) and side-scatter (SSC SSC-Height)
are monitored.
(a) (b)
Fig. 4. Flow cytometry pattern of WGA-FITC labeled a: B4877 and b: B4877HD. Fluorescence intensity:
(FL1-H FL1Height) and side-scatter: (SSC SSC-Height) are monitored. The frequency of dots within the
gate is recorded in the picture. In the original blood isolate B4877 a distinct population appears within the
gate corresponding to B4877HD.
Southern blot analysis
IS861, a described insertions sequences in GBS, was screened for by Southern
hybridization in phenotypic subpopulations of GBS. In all M732 phenotypic popu-
lations nine copies of IS861 were detected. In isolates AO6639, B4877, and the
neonatal cerebrospinal fluid isolate L298, three copies were found. The relative
intensity of the bands in each lane was similar. Furthermore, the position of the
bands derived from isolates B4877, AO6639, and M732 coincided with the bands of
their respective HD and LD subpopulations (Fig. 6).
Phase shift of capsule expression in GBS 407
(a)
(b)
(c)
Fig. 5. Immunogold electron microscopy. Bacteria were labeled with anti-type III antibodies and anti-
rabbit antibody conjugated to 10-nm colloidal gold. Panel a: M732LD, panel b: M732, and panel c: M732HD.
Magnification 36000×. The bar represents 0.1 mm.
Streptococcal chain length
Streptococcal chain length estimations were performed to consider the possible
effect of chain-formation on viable count and in flow cytometry. HD subpopulations

M. Sellin et al.408
Fig. 6. Southern blot of Hind III restricted chromosomal DNA hybridized with digoxigenin labeled probe
for IS861. The probe has no Hind III recognition site, consequently, each band is equivalent to one copy of
IS861. Molecular weight markers inserted to the left, from top 2178 bp, 1766 bp, and 1033 bp.
formed significantly (P ³ 0.005) longer chains than parental isolates (1.8–4.4 times)
(Table 4).
Environmental modulation
GBS buoyant density subpopulations were exposed to controlled changes in culture
conditions to evaluate modulation of capsule expression as assessed by changes in
buoyant density. Variations in temperature, oxygen tension, or presence of human
serum did not influence the buoyant density in the investigated strain, M732. Culture
in broth at pH below 5.5 increased the buoyant densities of the ID and LD sub-
Table 4 Mean streptococcal chain length of parental
GBS isolates with buoyant density sub-
populations—–––––––––––––––––––––––––––––––––––––––––––––––––––––––––––––
Isolate ID LD HDa
—–––––––––––––––––––––––––––––––––––––––––––––––––––––––––––––
M732 5.423.5 4.723.6 9.526.9
B4877 2.721.3 3.322.5 10.926.8
AO6639 2.621.5 8.626.5 11.528.2
—–––––––––––––––––––––––––––––––––––––––––––––––––––––––––––––
ID, parental isolate with intermedium buoyant density, LD low
density, and HD high density subpopulation. Mean chain length
2SD. In each group more than 250 chains were calculated.aThe HD subpopulation produced significantly longer chains
than ID (P ³ 0.005).

Phase shift of capsule expression in GBS 409
(a)
(b)
Fig. 7. Laserscan of tubes after hypotonic Percoll® gradient centrifugation displaying buoyant density
profile after culture at pH 7.2, pH 5.5, and pH 4.5. Panel a: M732LD, panel b: M732.
populations considerably (Fig. 7a, b), and the amount of capsular sialic acid
decreased (Fig. 8).
Discussion and conclusions
It seems reasonable to assume that the described variation of buoyant density
reflects mechanisms responsible for the regulation of encapsulation in GBS. The term
phase-shift has previously been applied to GBS by Gray et al.17 and the phenotypic
variation in this study meet the definition suggested by Robertson et al. of phase-

M. Sellin et al.410
Fig. 8. Capsule bound sialic acid, assayed by the thiobarbituric acid method, of M732 and subpopulations
M732HD and M732LD after culture at pH 7.2, pH 5.5, and pH 4.5. Mean value of three experiments +SD.
shift.18 However, the variation of capsule expression does not merely act as an on-
off phenomenon. Direct shifts from one extreme level of buoyant density to another,
HD : LD and LD : HD were observed (Table 2, 3). Still capsule phenotype-shift in
GBS often seem to pass through the frequently encountered intermediate form
(Table 1). Subpopulations with buoyant density in between the ID and HD were
also detected in the density profile (data not shown). This suggests that several
populations with different capsule thickness may exist or be derived from one isolate,
which in turn may indicate several regulatory levels. All buoyant density shifts were
reversible, i.e. 1 cfu with HD phenotype derived after one culture cycle from ID
phenotype could again give rise to an ID or LD phenotype after a single culture cycle.
The comparable, opposite shift was seen in the LD phenotype. Since frequencies of
reversion both from HD and LD phase, exceeds that of phase-shift from ID, the ID
phenotype seems to be the most favorable under the conditions tested. The extreme
HD and LD populations of GBS may be apt to revert, but can be maintained homo-
genous with a minimum of culture passages and regular monitoring of the pheno-
type.
The propensity to phase-shift may vary between strains. Comparable phase-shifts
frequencies differed up to thousand fold between investigated isolates (Table 1). The
comparison of flow cytometry patterns between B4877 and M732 (Fig. 3 and 4), also
points in favor of a substantial difference in frequency of ID to HD phase-shift.
However, phase-shift frequency based on flow cytometry in B4877 (Fig. 4) seems to
be 10−2–10−1 rather than 10−3 as determined by buoyant density. The discrepancy
between frequencies based on buoyant density and flow cytometry may in part be
due to the difficulty to assign a fraction level for the exact separation of sub-
populations in the hypotonic Percoll® gradient (Fig. 1). Also, since chain formation
influences the relationship between viable count and cell count, estimation of the
number of HD based on viable count may be too low. Hence the frequency of ID to
HD shift may be at most four times higher and we can not rule out that frequencies
based on gradient centrifugation are somewhat underestimated.
Gene expression may be influenced by environmental cues. In some cases the
signal, the transmembrane transducing system, as well as the regulatory effect
on structural genes have been revealed.19,20 Changes in culture conditions such as
Phase shift of capsule expression in GBS 411
temperature, pH, and osmotic stress during growth can affect the encapsulation in
various bacterial species.21–23 In the present study temperature, oxygen tension, or
presence of human serum did not induce change of the buoyant density of GBS.
Growth in broth supplemented with human serum has previously been reported to
confer shift from scarcely to highly encapsulated phenotype in GBS, but this may be
an effect of selection since serial passage was necessary.24
Culture in broth at pH below 5.5 retarded growth and increased the buoyant
densities of ID and LD subpopulations considerably. The terminal sialic acid in the
type III polysaccharide is acid labile25 and removal of sialic acid by enzymatic treat-
ment with neuraminidase is known to increase the buoyant density of GBS.26 HD
isolates derived from culture at low pH entirely resumed their initial buoyant density
after renewed culture in broth at pH 7. This was not seen with centrifugation selected
HD populations which were treated similarly (data not shown). Furthermore, LD and
ID populations cultured at pH 7.2 which were resuspended and stored in TY-broth at
pH 4.5 at 4°C for 24h did retain their respective phenotypes (data not shown). Hence,
the effect of low pH is probably not an example of active regulation but could be
caused by passive solubilization or defective assembly of sialic acid to the poly-
saccharide during growth at low pH. However distinct from the phase-shift phenom-
enon, the modification of capsular phenotype due to low pH still may be worth
notifying since GBS may encounter drastic differences in pH during passage from
vaginal colonization to the blood stream.
In early onset disease, it has previously been reported that the maternal GBS
isolates have smaller capsules as compared with the corresponding invasive neo-
natal isolates.4,9 Animal studies supporting capsular phase-shift of GBS have been
made.27 Furthermore, phase variants of GBS have been isolated from adult endo-
carditis.28 This suggest that phase-shifts occur in vivo as well as in vitro. In the
pathogenesis of early onset disease, colonization and adhesion to epithelial mucous
membranes precedes invasive entry after which the need for an antiphagocytic
capsule presumably is greater. For GBS it has been found that invasion of respiratory
epithelial cells was attenuated by the presence of a capsule.29 We have previously
reported on great differences in surface properties between GBS subpopulations with
different capsule thickness.11 GBS with abundant encapsulation exhibit increased net
negative charge, hydrophilicity, and adheres poorly to epithelial cells, while GBS
with no or sparse encapsulation have reduced negative charge, are more hydro-
phobic, and adhere avidly. This inverse relationship between encapsulation and
adherence has also been pointed out in other bacterial species, for instance H.
influenzae, Neisseria meningitidis and S. pneumoniae.30–32 Thus, capsular phase-
shift may serve to fine tune adhesive, invasive, and antiphagocytic properties to befit
the different steps in the pathogenesis of invasive GBS disease.
The phase-shift frequency from ID to HD phenotype in AO6639 and B4877 com-
pares with the high frequency, irreversible loss of capsule reported in H. influenzae
type b. However, in the present study shifts were always reversible, contrary to what
is described for H. influenzae.33 Insertion sequences are known to be able to exert an
effect on gene regulation often due to gene-amplification.34 Southern blot detection
of IS861 showed no difference in hybridization pattern between different sub-
populations. Thus, encapsulation in the investigated strains does not seem to cor-
relate with copy number or localization of IS861.
The use of isogenic GBS with different capsular phenotype, derived from buoyant
density centrifugation, may serve as a model to analyze differences in expression
either due to gene dosage or transcriptional regulation. The common finding, irres-
pective of culture conditions, of fractions with different capsular phenotypes makes
M. Sellin et al.412
programmed DNA-rearrangement an interesting underlying mechanism to pursue.35–
37 A regular formation of subpopulations with different phenotypes could serve to
render GBS preadapted to variable environmental demands during different stages
in the pathogenesis of invasive GBS disease.
Material and methods
Bacterial strains and culture media. M732: a GBS type III reference strain was originally
isolated from a case of neonatal meningitis.23 B4877 and L298: GBS type III isolates were
recently isolated at our department, from blood and cerebrospinal fluid of a case of early onset
disease and AO6639: the corresponding maternal cervical isolate. The bacteria were cultured
in trypticase yeast (TY) broth pH 7.238 or Todd-Hewitt (TH) broth pH 7.0 (Difco Laboratories,
Detroit, MI, U.S.A.). As solid medium, Columbia II agar base (BBL, Cockeysville, MD, U.S.A.)
supplemented with 5% horse blood, was used.
The mean number of generations during an 8 h culture cycle were estimated from the slope
of the exponential portion of the growth curves analyzed with linear regression.39,40 Growth
curves were assessed by monitoring OD492 by a Bioscreen computerized culture system (Lab-
systems OY, Helsinki, Finland).
Hypotonic Percoll® gradient centrifugation. Linear hypotonic gradients (HPG), with endpo-
ints 1.0 and 1.13 g/ml, were prepared in a multi-channel gradient mixer from sterile water and
Percoll® (Pharmacia Biotech Norden AB, Sollentuna, Sweden). Calibration beads number 3
and 6 (Pharmacia Biotech Norden AB, Sollentuna, Sweden) were used to assure uniformity of
the gradients and to aid separation of the fractions. The tubes were sealed with rubber stoppers
at both ends, which allowed access to both top and bottom for application or collection of
samples (Fig. 1).
Bacteria applied at the bottom were resuspended in Percoll® and after centrifugation
(4000×g, 4h, 4°C) in a swing-out rotor, fractions were collected from the top of the gradient.
Bacteria applied at the top were resuspended in water and after centrifugation fractions were
collected from the bottom of the gradient. By this method HD and LD subpopulations were
selected from parental strains M732, B4877, and AO6639. For analysis of the buoyant density
pattern by laser scanner, the bacterial pellet from 1 ml broth culture was sufficient to form
detectable bands as previously described.10 For the estimation of buoyant density of 1 cfu,
small volume hypotonic gradients mixed in 12×75 mm glass tubes were used. Verification of
the buoyant density of randomly selected individual cfu in each fraction, through small volume
gradient centrifugation, was regularly performed.
Semiquantitative estimation of subpopulations with higher buoyant density than the par-ental strain. Approximately 108 cfu from an overnight culture originating from one colony,
were resuspended in 0.1 ml sterile, deionized water, and layered on top of a HPG. After
centrifugation fractions F3 and F1+F2 (Fig. 1) were collected separately from the bottom,
through a cannula with a 1 ml syringe. Each fraction was mixed and appropriately diluted for
subsequent viable count (VC).
Semiquantitative estimation of subpopulations with lower buoyant density than the par-ental strain. Approximately 108 cfu were resuspended in 0.1 ml Percoll® and applied at the
bottom of the gradient. After centrifugation fraction F1 and F2+F3 (Fig. 1) were collected
separately from the top of the gradient. After collection fractions were handled as above.
Reversion from HD phenotype. One HD colony, isolated from the semiquantitative experi-
ment above, was used to inoculate TY-broth. Approximately 108 cfu from an overnight culture
resuspended in 0.1 ml Percoll®, were applied at the bottom of a HPG, and centrifuged. After
centrifugation, fraction F1 was collected from the top of the gradient while fraction F2 and F3
were aspirated from the bottom in separate tubes. After collection the fractions were handled
as above.
Reversion from LD phenotype. A LD colony isolated from the semiquantitative experiment
above, was used to inoculate TY-broth. Approximately 108 cfu, resuspended in water, were
layered on top of a HPG before centrifugation. Fractions F2 and F3 were aspirated through the
Phase shift of capsule expression in GBS 413
bottom stopper and fraction F1 was aspirated from the top. VC was performed for quanti-
fication of the different fractions.
Assessment of environmental modulation of phase-shift. TY-broth was inoculated from an
overnight culture, originating from one cfu, and incubated without agitation. The following
strains and subpopulations were used; M732HD, M732, and M732LD. At early stationary phase,
samples were prepared for HPG centrifugation and subsequent laser scanning was performed
as described above.
Temperature. Growth curves were assessed by monitoring OD492 at 25, 37, and 40°C by the
Bioscreen culture system.
pH. Growth at pH 7.2, 5.5, and 4.5 at 37°C was compared. Batches of TY-broth with low pH
were prepared through HCl titration. Growth curves were monitored through the Bioscreen
system as above. The bacterial pellet was analyzed for buoyant density and sialic acid content.
Oxygen tension. Bacteria were cultured on blood agar plates and incubated at 37°C in air,
6% carbon dioxide in air, or in an anaerobic chamber (85% nitrogen with 10% hydrogen
and 5% carbon dioxide). After incubation, 10–15 cfu were resuspended in water and HPG
centrifugation was performed.
Growth in the presence of human serum. Human serum, pooled from six healthy donors,
was tested and found normal for IgG, IgM, IgA, C3, C4, and total hemolytic activity. The serum
pool contained a moderate level of anti-type III antibodies (3.1 mg/ml). The pool was aliquoted
and stored at −70°C. The bacterial pellet from an overnight culture was resuspended in TY-
broth with 20% human serum and opsonized at 37°C for 30 min.41 After 1 h at room temperature
to allow phenotypic expression, inoculation of TY-broth which contained 5% human serum
was made.
Estimation of streptococcal chain length. Overnight cultures in TY-broth of M732, AO6639,
and B4877 and their respective subpopulations were examined in a Burker counter-chamber
with phase contrast microscopy after appropriate dilution. The length of bacterial chains in
five visual fields (×50 chains/field) were registered.
Relative sialic acid estimations. The thiobarbituric acid assay was performed after mild acid
hydrolysis of bacterial pellets.42 The results were related to a standard curve made with N-acetyl
neuraminic acid (Sigma, St Louis, MO, U.S.A.), and to protein concentration as determined by
the method of Bradford43 (Biorad Laboratories, Richmond, CA, U.S.A.).
Electron microscopy. Electron microscopy was performed with an JEOL 100 B, or Zeiss 900
EM electron microscope. Formvar coated, 200 mesh copper EM grids were precoated with a
0.01% solution of wheat germ agglutinin (WGA) (Dako A/S, Glostrup, Denmark) in 0.03 M Tris-
HCl pH 7.5. 10–15 ml of bacteria in a water suspension (108–109 cfu/ml) was allowed to sediment
on a grid. After a wash in Tris buffer the grid was floated on top of a drop of undiluted rabbit
anti-type III serum. The grid was once again washed and then floated on a suspension of 10
nm colloidal gold marked anti-rabbit Ig conjugate diluted in 0.03 M Tris-HCl pH 7.5 (Biocell
Research Laboratories, Cardiff, U.K.) and then finally washed in water. As negative controls,
grids processed in parallel without sera or with type Ia antisera were used.
Flow cytometry. TY-broth was inoculated with 1 cfu and the pellet from 1 ml from an over
night culture was washed once in phosphate buffered saline (PBS) pH 7.2. The pellet was
resuspended and incubated at room temperature for one hour, in a PBS solution containing
conjugated WGA FITC (Vector laboratories, Burlingame, CA, U.S.A.). The bacteria were washed
once in PBS before analysis. Flow cytometry was performed on a FACScan instrument (Becton
Dickinson Immunocytometry Systems, San Jose, CA, U.S.A.) initially calibrated with flu-
orescein Calibrite beads (Becton Dickinson Immunocytometry Systems, San Jose, CA, U.S.A.).
Side-scatter and fluorescence intensity, were analyzed. The samples were also examined by
UV-microscopy for determination of the degree of aggregation and chain formation.
DNA techniques. For preparation of chromosomal DNA the method of Nagano et al. was
used.44 IS861 DNA was amplified by polymerase chain reaction (PCR) from a mixture of

M. Sellin et al.414
chromosomal DNA prepared from clinical type III GBS-strains. Oligonucleotide primers used
were, position 156–175 of IS861, 5?AGAAAGATCGGGATGTCCTG3?. 3?primer was comp-
lementary to position 1351–1380; 5?CTGTGATAGCTTGCTCAAGG3?.11 The amplification reac-
tion mixture consisted of 2.5 units of Taq DNA polymerase (Boehringer Mannheim, Mannheim,
Germany) in the supplied buffer, with 20 pmol of each primer in a reaction volume of 50 ml.
The PCR reaction was performed as follows, one cycle, 1 min at 94°C; 30 cycles 1 min at 94°C,
1 min at 55°C, 2 min at 72°C; and one cycle 72°C 2 min. The reaction yielded a ¼1200 base
pair (bp) fragment. The IS861 identity was verified by restriction enzyme analysis using Alu1,
Xho1, and Hind III. DNA was extracted from agarose gel with Gene Clean (Bio 101, LaJolla, CA,
U.S.A.). The DNA fragment was digoxigenin labeled according to the manufacturer (Boehringer
Mannheim) and used as a probe in Southern hybridization. Chromosomal DNA from M732,
M732HD, M732LD, AO6639, AO6639HD, B4877, and B4877HD was restricted with Hind III,
separated on agarose gel, and transferred to Hybond-N, nylon filter (Amersham International
plc, Amersham, U.K.) according to the method of Southern.45 Hybridization was performed at
high stringency at 65°C with digoxigenin labeled IS861-probe in buffers recommended by the
manufacturer.
Statistical evaluation. The Mann-Whitney U-test was used to calculate levels of significance
with the SPSS for Windows 5.0 software (SPSS Inc. Chicago, MI, U.S.A.). A value of P less
than 0.05 was regarded as significant.
This work was supported by grants from the Swedish Medical Research Council (No. 08675)
to MN and SH and from the Umea University Medical Faculty to MN and MS, and from the JC
Kempe fundation to MS. This work was also supported by funds from the University Hospital
of Umea. We thank Anette Contardo for technical assistance, Leonor Johansson and Rolf
Sjoberg for assistance with the electron microscopy, Dr Morven Edwards, for type III antibody
determination, and Dr Marie-Louise Hammarstrom for introduction to flow cytometry.
References
1. Baker CJ, Edwards MS. Group B streptococcal infections. In: Remington J, Klein J, Eds. Infectious
diseases of the fetus and newborn infant. 3rd ed. Philadelphia: W. B. Saunders Co, 1990: 742–811.
2. Rubens CJ. Type III capsular polysaccharide of group B streptococci: role in virulence and the molec-
ular basis of capsule expression. In: Miller VL, Kaper JB, Portnoy DA, Isberg RR, Eds. Molecular
genetics of bacterial pathogenesis. Washington: American Society of Microbiology, 1994: 327–39.
3. Payne NR, Burke BA, Day DL, Christenson PD, Thompson TR, Ferrieri P. Correlation of clinical and
pathologic findings in early onset neonatal group B streptococcal infection with disease severity and
prediction of outcome. Pediatr Infect Dis J 1988; 7: 836–47.
4. Yeung MK, Mattingly SJ. Biosynthetic capacity for type-specific antigen synthesis determines the
virulence of serotype III strains of group B streptococci. Infect Immun 1984; 44: 217–21.
5. Rubens CE, Wessels MR, Heggen LM, Kasper DL. Transposon mutagenesis of group B streptococcal
type III capsular polysaccharide: correlation of capsule expression with virulence. Proc Natl Acad Sci
USA 1987; 84: 7208–12.
6. Wessels MR, Rubens CE, Benedi VJ, Kasper DL. Definition of a bacterial virulence factor: sialylation
of the group B streptococcal capsule. Proc Natl Acad Sci USA 1989; 86: 8983–7.
7. Catlin B. Haemophilus influenzae in cultures of cerebrospinal fluid. Amer J Dis Child 1970; 120: 203–
10.
8. MacLeod CM, Krauss MR. Relation to virulence of pneumococcal strains for mice to the quantity of
capsular polysaccharide formed in vitro. J Exp Med 1950; 92: 1–9.
9. Hakansson S, Holm SE, Wagner M. Density profile of group B streptococci, type III, and its possible
relation to enhanced virulence. J Clin Microbiol 1987; 25: 714–8.
10. Hakansson S, Granlund-Edstedt M, Sellin M, Holm SE. Demonstration and characterization of buoyant
density subpopulations of group B streptococcus type III. J Infect Dis 1990; 161: 741–6.
11. Granlund-Edstedt M, Sellin M, Holm A, Hakansson S. Adherence and surface properties of buoyant-
density subpopulations of group B streptococcus, type III. APMIS 1993; 101: 141–8.
12. Hoiseth SK, Moxon ER, Silver RP. Genes involved in Haemophilus influenzae type b capsule
expression are part of an 18-kilobase tandem duplication. Proc Natl Acad Sci USA 1986; 83: 1106–10.
13. Kroll JS, Loynds, BM, Moxon ER. The Heamophilus influenzae capsulation gene cluster: a compound
transposon. Mol Microbiol 1991; 5: 1549–60.
14. Rubens CE, Heggen LM, Kuypers JM. IS861, a group B streptococcal insertion sequence related to
IS150 and IS3 of Escherichia coli. J Bacteriol 1989; 171: 5531–5.
Phase shift of capsule expression in GBS 415
15. Eisenstein BI, Sweet DS, Vaughn V, Friedman DI. Integration host factor is required for the DNA
inversion-controlling phase variation in Escherishia coli. Proc Natl Acad Sci USA. 1987: 84; 1–4.
16. Wessels MR, Pozsgay V, Kasper DL, Jennings HJ. Structure and immunochemistry of an oligo-
saccharide repeating unit of the capsular polysaccharide of type III group B streptococcus. J Biol
Chem 1987; 262: 8262–7.
17. Gray MG, Pritchard DG. Phase variation in the pathogenesis of group B streptococcal infections. In
G. Orefici, Ed. New perspective on Streptococci and Streptococcal Diseases. Stuttgart: Gustav Fisher
Verlag, 1992: 452–4.
18. Robertson BD, Meyer TF. Genetic variation in pathogenic bacteria. Trends Genet 1992; 8: 422–7.
19. Mekalanos JJ. Environmental signals controlling expression of virulence determinants in bacteria. J
Bacteriol 1992; 174: 1–7.
20. Stout V, Gottesman S. RcsB and RcsC: a two-component regulator of capsule synthesis in Escherichia
coli. J Bacteriol 1990; 172: 659–69.
21. Bortolussi R, Ferrieri P, Quie PG. Influence of growth temperature of Escherichia Coli on K1 capsular
antigen production and resistance to opsonization. Infect Immun 1983; 39: 1136–41.
22. Masson L, Holbein BE. Influence of nutrient limitation and low pH on serogroup B Neisseria men-
ingitidis capsular polysaccharide levels: correlation with virulence for mice. Infect Immun 1985; 47:
465–71.
23. Terry JM, Pina SE, Mattingly SJ. Environmental conditions which influence mucoid conversion in
Pseudomonas aeruginosa PAO1. Infect Immun 1991; 59: 471–7.
24. Anderson DC, Edwards MS, Baker CJ. Luminol-enhanced chemiluminescence for evaluation of type
III group B streptococcal opsonins in human sera. J Infect Dis 1980; 141; 370–81.
25. Baker CJ, Kasper DL. Microcapsule of type III strains of group B streptococcus: production and
morphology. Infect Immun 1976; 13: 189–94.
26. Hakansson S, Holm S. Influence of polysaccharide capsule and ionic strength on buoyant density of
group B streptococci. APMIS Sect B 1986; 94: 139–43.
27. Hakansson S, Bergholm AM, Holm SE, Wagner B, Wagner M. Properties of high and low density
subpopulations of group B streptococci: enhanced virulence of the low density variant. Microb Pathog
1988; 5: 345–55.
28. Sellin M, Linderholm M, Norgren M, Hakansson S. Endocarditis caused by a group B streptococcus
strain, type III in a nonencapsulated phase. J Clin Microbiol 1992; 30: 2471–3.
29. Hulse M, Smith S, Chi YE, Pham A, Rubens CE. Effect of type III group B streptococcal capsular
polysaccharide on invasion of respiratory epithelial cells. Infect Immun 1993; 61: 4835–41.
30. StGeme III JW, Falkow S. Loss of capsule expression by Haemophilus influenzae type b results in
enhanced adherence to and invasion of human cells. Infect Immun 1991; 59: 1325–33.
31. Craven DE, Peppler MS, Frasch CE, Mocca LF, McGrath PP, Washington S. Adherence of isolates of
Neisseria meningitidis from patients and carriers to human buccal epithelial cells. J Infect Dis 1980;
142: 556–8.
32. Selinger DS, Reed WP. Pneumococcal adherence to human epithelial cells. Infect Immun 1979; 23;
545–8.
33. Hoiseth KS, Connely JC, Moxon R. Genetics of spontaneous, high-frequency loss of b capsule
expression in Haemophilus influenzae. Infect Immun 1985; 49: 389–95.
34. Iida S, Meyer J, Arber W. Prokaryotic IS elements. In Mobile genetic elements. Academic press Inc.,
1983: 159–221.
35. Dybvig K. DNA rearrangements and phenotypic switching in prokaryotes. Mol Microbiol 1993; 10:
465–71.
36. Borst P, Greaves DR. Programmed gene rearrangements altering gene expression. Science 1987; 235:
658–67.
37. DiRita VJ, Mekalanos JJ. Genetic regulation of bacterial virulence. Ann Rev Genet 1989; 23: 455–82.
38. Holm SE, Falsen E. An antigen-free medium for cultivation of b-hemolytic streptococci. APMIS 1967;
69: 264–76.
39. Caufield PW, Shah GR, Hollingshead S. Use of transposon Tn916 to inactivate and isolate a mutacin
associated gene from Streptococcus mutans. Infect Immun 1990; 58: 4126–35.
40. Neidhardt FC, Ingraham JL, Schaechter M. Physiology of the bacterial cell. Sunderland, Mas-
sachusetts: Sinauer Ass Inc. Publishers, 1990, 197–225.
41. Baker CJ, Edwards MS, Webb BJ, Kasper DL. Antibody-independent classical pathway-mediated
opsonophagocytosis of type Ia, group B streptococcus. J Clin Invest 1982; 69: 394–404.
42. Skoza L, Mohos S. Stable thiobarbituric chromophore with dimethyl sulphoxide. Biochem J 1976;
159: 457–62.
43. Bradford M. A rapid and sensitive method for the quantitation of microgram quantities of protein
utilizing the principle of protein-dye binding. Anal Biochem 1976; 72: 248–55.
44. Nagano Y, Nagano N, Takahashi S, Murono K, Fujita K, Taguchi F, Okuwaki Y. Restriction endonuclease
digest patterns of chromosomal DNA from group B b-haemolytic streptococci. J Med Microbiol 1991;
35: 297–303.
45. Southern EM. Detection of specific sequences among DNA fragments separated by gel electro-
phoresis. J Mol Biol 1975; 94: 503–17.