pharmacogenetics and pharmacogenomics in rheumatology
TRANSCRIPT

The Journal of Rheumatology
http://www.jrheum.org/content/early/2012/03/25/jrheum.110961DOI: 10.3899/jrheum.110961 Varadi, Andras Guttman and Laszlo NagyBertalan Mesko, Szilard Poliska, Szilvia Szamosi, Zoltan Szekanecz, Janos Podani, Csaba of Tocilizumab Treatment in Rheumatoid ArthritisPeripheral Blood Gene Expression and IgG Glycosylation Profiles as Markers
1. Sign up for our monthly e-table of contents
http://www.jrheum.org/cgi/alerts/etoc
2. Information on Subscriptions
http://jrheum.com/subscribe.html
3. Have us contact your library about access options
4. Information on permissions/orders of reprints
http://jrheum.com/reprints.html
rheumatology and related fields.Gordon featuring research articles on clinical subjects from scientists working in
is a monthly international serial edited by Duncan A.The Journal of Rheumatology

1Mesko, et al: Effects of TCZ in RA
Personal non-commercial use only. The Journal of Rheumatology Copyright © 2012. All rights reserved.
Peripheral Blood Gene Expression and IgGGlycosylation Profiles as Markers of TocilizumabTreatment in Rheumatoid ArthritisBERTALAN MESKO, SZILARD POLISKA, SZILVIA SZAMOSI, ZOLTAN SZEKANECZ, JANOS PODANI,
CSABA VARADI, ANDRAS GUTTMAN, and LASZLO NAGY
ABSTRACT. Objective. Tocilizumab, a humanized anti-interleukin-6 receptor monoclonal antibody, has recently
been approved as a biological therapy for rheumatoid arthritis (RA) and other diseases. It is not known
if there are characteristic changes in gene expression and immunoglobulin G glycosylation during ther-
apy or in response to treatment.
Methods. Global gene expression profiles from peripheral blood mononuclear cells of 13 patients with
RA and active disease at Week 0 (baseline) and Week 4 following treatment were obtained together with
clinical measures, serum cytokine levels using ELISA, and the degree of galactosylation of the IgG N-
glycan chains. Gene sets separating responders and nonresponders were tested using canonical variates
analysis. This approach also revealed important gene groups and pathways that differentiate responders
from nonresponders.
Results. Fifty-nine genes showed significant differences between baseline and Week 4 and thus correlat-
ed with treatment. Significantly, 4 genes determined responders after correction for multiple testing. Ten
of the 12 genes with the most significant changes were validated using real-time quantitative polymerase
chain reaction. An increase in the terminal galactose content of N-linked glycans of IgG was observed in
responders versus nonresponders, as well as in treated samples versus samples obtained at baseline.
Conclusion.As a preliminary report, gene expression changes as a result of tocilizumab therapy in RA
were examined, and gene sets discriminating between responders and nonresponders were found and
validated. A significant increase in the degree of galactosylation of IgG N-glycans in patients with RA
treated with tocilizumab was documented. (J Rheumatol First Release April 1 2012; doi: 10.3899/
jrheum.110961)
Key Indexing Terms:
TOCILIZUMAB GENE EXPRESSION IgG GLYCOSYLATION
DRUG RESPONSE ANTI-INTERLEUKIN-6 RECEPTOR
From the Department of Biochemistry and Molecular Biology, Apoptosisand Genomics Research Group, Hungarian Academy of Sciences;Research Center for Molecular Medicine, Medical and Health SciencesCenter, University of Debrecen; Clinical Genomics Center, Medical andHealth Sciences Center, University of Debrecen; Department ofRheumatology, Institute of Medicine, Medical and Health Sciences Center,University of Debrecen, Debrecen; and Biological Institute, EötvösUniversity, Budapest, Hungary.
Dr. Nagy is an International Scholar of Howard Hughes Medical Instituteand holds a Wellcome Trust Senior Research Fellowship in BiomedicalSciences. He is supported by grants from the Hungarian Science Research Fund (OTKA NK72730), the Hungarian Ministry of Health (ETT294-07), MOLMEDREX (FP7-REGPOT-2008-1. #229920), and TAMOP-4.2.2/08/2, and TAMOP-4.2.1/B-09/1KONV-2010-0007 imple-mented through the New Hungary Development Plan co-financed by theEuropean Social Fund and the European Regional Development Fund.
B. Mesko, MD, Department of Biochemistry and Molecular Biology; S. Poliska, PhD, Department of Biochemistry and Molecular Biology andResearch Center for Molecular Medicine, Medical and Health SciencesCenter, University of Debrecen; S. Szamosi, MD; Z. Szekanecz, MD, PhD,Department of Rheumatology, Institute of Medicine, Medical and HealthSciences Center, University of Debrecen; J. Podani, PhD, BiologicalInstitute, Eötvös University; C. Varadi, BSc; A. Guttman, PhD, HorváthLaboratory of Bioseparation Sciences, Medical and Health SciencesCenter, University of Debrecen; L. Nagy, MD, PhD, Department ofBiochemistry and Molecular Biology and Research Center for MolecularMedicine, Medical and Health Sciences Center, University of Debrecen.
Address correspondence to Dr. L. Nagy. E-mail: [email protected]
Accepted for publication December 14, 2011.
Biological therapies brought a new era in the treatment ofrheumatoid arthritis (RA) and other chronic inflammatory dis-eases. Because their use is expensive, identification of mark-ers or establishment of scoring systems allowing prediction ofthe outcome of treatment and/or disease progression would behighly desirable.
Besides the many tumor necrosis factor-α (TNF)inhibitors1, other emerging biotherapies such as inhibitors ofthe interleukin 1 (IL-1) or IL-6 pathways have also been infocus recently.
IL-6 can activate cells through binding to membrane-bound (IL-6R) and soluble receptors (sIL-6R), which has beenfound to play a key role in acute and chronic inflammation;joint destruction, pannus development, and increased boneresorption2; and inflammatory cell migration3. As many of thearticular and systematic manifestations could be explained bythe effect of IL-6, the inhibition of IL-6R rapidly became avalidated therapeutic target in RA.
Tocilizumab, a humanized anti-IL-6R monoclonal anti-
body blocking IL-6-mediated signal transduction, in combina-
tion with methotrexate (MTX) is approved as a biological
therapy for moderate to severe RA in adult patients with inad-
equate response to prior disease-modifying antirheumatic

drugs (DMARD) or TNF inhibitors4 or those who do not tol-
erate that therapy. In such cases tocilizumab causes a signifi-
cant reduction in disease activity5,6.
There are an increasing number of gene expression studies
focusing on the pathomechanism of RA using either peripher-
al blood mononuclear cells (PBMC)7 or synovial tissue8. As
PBMC are easy to access and analyze and are considered key
cells of inflammation, it is particularly intriguing to assess
whether predicting responsiveness to biological therapies is
possible by the combination of PBMC gene expression pat-
terns and clinical measures. This approach has been proven
successful in other diseases such as breast cancer9.
We extended this approach to patients treated with
tocilizumab and performed global gene expression profiling
and scoring of clinical measures using canonical variates
analysis (CVA) to identify gene sets that can differentiate
responders from nonresponders.N-glycosylation of human immunoglobulins, especially
IgG1, plays a critical role in the bioactivity of this group ofimportant proteins; and in patients with RA a decrease in ter-minal galactose content of the N-linked glycans at the con-served Fc region (Asn 297) glycosylation site of IgG occurs ascompared to a corresponding age-matched control popula-tion10. Interestingly, infliximab, a chimeric monoclonal anti-body that binds soluble TNF-α, reducing its biological activi-ty and inflammation, can reduce the concentration of agalac-tosyl (G0) glycan of IgG1 in patients with active RA who clin-ically improved according to the American College ofRheumatology (ACR) criteria following the infliximab/MTXtreatment11. It is particularly interesting to determine whetherother biologic therapies such as tocilizumab can produce thesame effect. This and the transcriptomics data obtained ongalactosyl transferase expression and its effects on response totreatment prompted us to investigate changes in the relativeamount of agalactosyl glycan of IgG1 in RA.
MATERIALS AND METHODS
Patients. The Research Ethics Committee of University of Debrecen Medical
and Health Science Center approved the clinical protocol and the study, which
was in compliance with the Helsinki Declaration. Signed informed consent
was obtained from all individuals who provided blood samples.
Thirteen white patients (9 women, 4 men) who met the ACR criteria for
RA were included in the study; all had active disease at the time of blood draw.
Two additional patients were excluded later in the study due to allergic reac-
tions or elevated liver enzyme levels. After subjects fasted for 12 h overnight,
all blood samples were obtained locally between 8:00 AM and 9:00 AM before
the first administration of tocilizumab at Week 0 (baseline) and the second at
Week 4, and were processed within 1 hour after sample collection.
Details of medications, which remained unchanged during the study, and
comorbidity are shown in Tables 1 and 2. Comedication was given after blood
was taken.
Clinical measures including Disease Activity Score (DAS) were assessed
at the time of the first tocilizumab infusion (baseline), at the second infusion
(Week 4), and at Week 14 when remission was determined based on national
protocols using ACR criteria. Dosage of tocilizumab was 8 mg/kg body
weight per infusion.
The inclusion criteria in our study were (1) fulfillment of the 1987
American Rheumatism Association criteria; (2) receiving concomitant MTX
treatment of maximum 20 mg/wk; (3) age between 30 and 60 years; (4) fail-
ure to respond to at least 2 DMARD; (5) active disease defined as having
DAS evaluated in 28 joints (DAS28) > 3.2; (6) having stable MTX, pred-
nisolone, and nonsteroidal antiinflammatory drug doses during the previous 4
weeks before inclusion in the study; and (7) having discontinued previous
DMARD at least 4 weeks prior to inclusion. Exclusion criteria were (1) preg-
nancy or breastfeeding; (2) current or recent malignancies; (3) active infec-
tious disease; or (4) history of acute inflammatory joint disease of a different
origin. All patients were TNF-blocking therapy-naive.
PBMC and RNA isolation. Venous peripheral blood samples were collected
(10 ml) in vacuum collection tubes containing EDTA (BD Vacutainer
K2EDTA; Becton-Dickinson, Franklin Lakes, NJ, USA) and 10 ml in native
tubes for the extraction of serum. PBMC were separated by Ficoll gradient
centrifugation. Total RNA was extracted from PBMC using Trizol reagent
(Invitrogen, Carlsbad, CA, USA), according to the manufacturer’s protocol,
on the day of blood sampling. RNA quality was checked on Agilent
Bioanalyser 2100 (Agilent Technologies, Palo Alto, CA, USA), all samples
had a 28S/18S ratio between 1.5 and 2.0 and the RNA integrity number was
between 9 and 10. Quantity was determined by NanoDrop.
Microarray analysis. Affymetrix GeneChip Human Gene 1.0 ST array was
used to analyze global expression pattern of 28,869 well annotated genes.
Ambion WT Expression Kit (Applied Biosystems, Foster City, CA, USA) and
GeneChip WT Terminal Labeling and Control Kit (Affymetrix, Santa Clara,
CA, USA) were used for amplifying and labeling 250 ng of RNA samples.
Samples were hybridized at 45°C for 16 h, and then standard washing proto-
col was performed using GeneChip Fluidics Station 450, and arrays were
scanned on GeneChip Scanner 7G (Affymetrix). CEL files of microarrays
were uploaded to the Gene Expression Omnibus (GSE25160).
Univariate data analysis. Microarray data (Gene Expression Omnibus acces-
sion number: GSE25160) were analyzed with Genespring GX10 (Agilent
Biotechnologies). Affymetrix data files were imported using the Robust
Multi-array Analysis algorithm, and median normalization was performed.
Regarding the baseline versus Week 4 comparison, 26 samples (13 samples at
baseline and 13 at Week 4) were used, and 20% of probe sets with the lowest
expression levels were filtered out in the first step (5733 probe sets filtered
out). Then the list of 23,136 probe sets was filtered by fold change (1.2-fold
cutoff), and statistical analysis was performed using paired Mann-Whitney U
test with Benjamini-Hochberg multiple-testing correction.
Regarding the responder versus nonresponder comparison, 13 samples
(from baseline) were used; 20% of probe sets with the lowest expression lev-
els were filtered out in the first step (5679 probe sets). Then the list of 23,190
probe sets was filtered by fold change (1.2-fold cutoff) and statistical analy-
sis was performed using unpaired t test with Benjamini-Hochberg correction
for multiple testing.
Functional categorization of genes was performed with Panther
Classification System (http://www.pantherdb.org/).
Validation by RT-QPCR. Real-time quantitative polymerase chain reaction
(RT-QPCR) was performed to validate a subset of differently expressed tran-
scripts identified by microarray analysis. Individual gene expression assays
(Applied Biosystems) of 12 genes selected for validation were used.
Reactions were performed in an ABI Prism HT 7900 machine (Applied
Biosystems) in triplicate, and all samples (n = 26) were included in the vali-
dation set. Relative gene expression levels were calculated by comparative Ct
method that results in normalizing to GAPDH expression for each sample.
Unpaired and paired t tests were used for statistical analysis (p < 0.05 was
considered significant).
ELISA. Concentrations of IL-6, IL-1ß, and IL-8 in serum were determined
with an ELISA kit (Amersham, UK), and the results were given in pg/ml by
the Regional Immunology Laboratory, Third Department of Internal
Medicine, Medical and Health Science Centre, University of Debrecen.
Measuring decrease in degree of galactosylation of IgG N-glycans. IgG was
isolated from 9 of the 13 samples from patients with RA using protein A affin-
ity pulldown. The N-glycans were released by peptide-N-glycanase F
(PNGase F). The released glycans were then fluorescently labeled with
2 The Journal of Rheumatology 2012; 39:5; doi:3899/jrheum.110961
Personal non-commercial use only. The Journal of Rheumatology Copyright © 2012. All rights reserved.

aminopyrene-trisulfonate and analyzed by capillary gel electrophoresis with
laser-induced fluorescence detection. The aim of this part of the study was to
investigate the changes in the relative amount of agalactosylated (G0) glycans
before and after the treatment.
Protein A affinity. Protein A is a surface protein originally found in the cell
wall of the bacteria Staphylococcus aureus with the ability to bind
immunoglobulins via their Fc region. In our experiments, Phytip (PhyNexus,
San Jose, CA, USA) columns were used with 20 µl protein A resin bed vol-
ume. In the first step 100 µl serum was dissolved in 200 µl Phynexus protein
A capture buffer (50 mM NaH2PO4, 0.7 M NaCl, pH 7.4). The IgG molecules
were captured by passing the sample through the resin bed (4 cycles at flow
rate 100 µl/min). During purification steps 500 µl Wash Buffer I (50 mM
NaH2PO4, 0.7 M NaCl, pH 7.4) was rinsed through the resin bed (1 cycle at
flow rate 250 µl/min) followed by a second wash step with 1000 µl Wash
Buffer II (150 mM NaCl) rinsed through the resin bed (1 cycle at flow rate
250 µl/min). After washing steps, captured IgG was recovered from the pro-
tein A column by rinsing with 150 µl enrichment buffer (200 mM NaH2PO4,
140 mM NaCl, pH 2.5; 4 cycles at flow rate 100 µl/min). Since the pH of the
elution buffer was 2.5, a buffer exchange was necessary using 10 kDa
Microcon spin filters (Millipore, Billerica, MA, USA).
PNGase F digestion. PNGase F [peptide-N4-(acetyl-ß-glucosaminyl)-
asparagine amidase] cleaves asparagine-linked glycan structures from glyco-
proteins. While PNGase F deaminates the asparagine to aspartic acid, it leaves
the released oligosaccharide intact.
First, the glycoproteins were denaturated by addition of 5 µl denaturation
buffer (New England Biolabs, Ipswich, MA, USA) at 98°C for 10 min. After
denaturation, 35 µl HPLC water, 12.5 µl G7 buffer, 12.5 µl NP40, and 10 µl
PNGase F (Prozyme, Hayward, CA, USA) were added to the solution and
digested overnight at 37°C.
APTS labeling. 8-aminopyrene-1,3,6-trisulfonic acid (Beckman Coulter,
Brea, CA, USA) was used as perfect fluorescent dye for all capillary gel elec-
trophoresis (CGE) analysis. The glycans were labeled via reductive amination
by the addition of 1 µl 0.2 M APTS in 15% acetic acid and 1 µl 1 M
NaBH3CN. The labeling reaction was incubated overnight at 37°C.
CGE-laser induced fluorescence analysis. For CGE analysis of the labeled
glycans, 60 cm NCHO-coated capillary columns (Beckman Coulter) with 50
µm diameter were used with the ProteomeLab carbohydrate sieving matrix
(Beckman Coulter). All injections were accomplished by 1 psi (pounds per
square inch) for 10 s and the separation voltage was 30 kV.
Data were analyzed using paired and unpaired t tests in GraphPad Prism
(p < 0.05 was considered statistically significant).
Multivariate exploratory analysis. Because the number of patients was 13, the
number of features describing patients was 22, and the number of probe sets
was 28,869, structure hidden in the data could be recovered only by multi-
variate methods.
Principal components analysis (PCA). This method reduces the dimensional-
ity of the data so that the smallest number of artificial and uncorrelated
dimensions and principal components explains as much variation as possi-
ble12. The success of variance compression is data-dependent and is measured
3Mesko, et al: Effects of TCZ in RA
Personal non-commercial use only. The Journal of Rheumatology Copyright © 2012. All rights reserved.
Table 1A. Patient measures.
Patient
Characteristic 3 6 10 4 5 7 8 9 11 2 12 13 1
Response at Week 14 R R R R R R R R R NR NR NR NR
ACR response at 70 70 70 50 50 50 50 50 50 20 20 20 0
Week 14
Gender F F F F F F M F F M M M F
Duration of disease, mo 36 480 204 24 192 24 60 156 96 48 156 180 300
Smoking (Brinkman 0 0 0 0 0 0 0 0 0 150 375 240 0
index)
DAS28 at Week
0 5.36 5.06 5.2 4.36 5.07 5.21 5.15 6 5.82 7 4.62 5.21 6.42
4 3.33 3.62 2.39 2.53 6 3.75 3.86 4.88 2.8 6.21 3.1 1.21 3.98
14 0.16 1.21 1.64 2.54 2.68 3.2 3.82 3.21 1.97 4 2.72 3.37 5.82
HAQ at Week
0 1.375 2.25 0.75 1.375 2.62 2.125 1 2.75 2.25 1.75 1.75 1.875 0.75
4 1.625 1.125 0.5 0.5 2.125 2 1 2.625 1.875 2.25 1.875 1.25 1.5
14 0.25 0.125 0.375 0.625 1.5 1.75 0.5 1.25 2 1.875 1.625 1.25 1.5
CRP at Week
0 8.02 23.2 12.4 4.7 12 0.4 40.25 15.6 7.77 45.4 178.18 2.34 12.5
4 0.5 2.51 0.52 1.5 4 0.6 22.81 8.7 0.5 45.4 161.81 0.5 3.87
14 0.5 0.54 0.9 0.5 0.5 0.5 16.7 5.4 0.5 129.56 59.6 0.5 3.2
ESR at Week
0 8 22 22 14 40 10 50 40 50 23 90 10 38
4 2 8 2 5 11 6 19 28 2 33 76 2 6
14 1 4 4 7 9 3 18 4 2 80 20 8 28
Previous DMARD 2 3 3 5 4 2 3 3 5 4 6 2 3
MTX dose, mg/wk 15 15 7.5 20 10 15 12.5 20 15 7.5 15 20 10
Prednisone use, mg/wk 0 0 0 0 0 0 0 0 8 4 0 4 0
Comorbidity None HT None None None HT None HT CD None None None HT
Data are shown as mean ± SD regarding the total group; and mean ± range in both responders and nonresponders. ACR: American College of Rheumatology
criteria; R: responder, NR: nonresponder, Brinkman index: no. cigarettes smoked per day × smoking years, calculated by summing separate Brinkman indices
in 3 age periods; DAS28: Disease Activity Score; HAQ: Health Assessment Questionnaire; CRP: C-reactive protein; ESR: erythrocyte sedimentation rate;
DMARD: disease-modifying antirheumatic drug; MTX: methotrexate, HT: hypertension, CD: Crohn disease.

by the relative percentages pertaining to each component. Often, 2–3 compo-
nents explain 60%–70% of variation, allowing graphic display of results by
biplot, which is a simultaneous arrangement of study objects and original
variables for a given pair of components. The role of variables in influencing
data structure can be evaluated on the basis of length and directionality of
arrows pointing to variable positions. These are obtained after arbitrary
rescaling of component correlations to allow for effective visualization.
Canonical variates analysis. Whereas PCA recovers underlying structures in
the data without any a priori grouping of objects, separation between predefined
groups of objects is best revealed by CVA. CVA was used to determine whether
the groups of responders and nonresponders are separable in the multidimen-
sional space spanned by the genetic variables, and if so, which gene subsets
have the best discriminatory power. The results of CVA are the so-called canon-
ical scores obtained from the canonical functions derived through eigenanaly-
sis, which serve as coordinates of observations in the canonical space.
Since the maximum number of canonical axes is 1 less than the number
of groups, in our study CVA did not allow graphic display, and separation
of responders and nonresponders is expressed merely by a list of scores for
observations on a single canonical axis. If the observations are taken at ran-
dom and the variables satisfy multivariate normality, then statistical proce-
dures are available to test the significance of group separation.
Nevertheless, if these criteria are not met, as in our case, examination of the
2 groups as to whether they overlap on the canonical axis or not provides
equally meaningful information. A partial limitation of CVA is that the num-
ber of variables cannot exceed the number of observations (patients).
Therefore, many CVA runs were carried out using different subsets of
genes, each subset defined on a logical basis. As a control, we used several
sets of genes selected randomly from a set of genes known to have no influ-
ence on group separation.
Computations were performed using the Syn-Tax 2000 package13.
RESULTS
Clinical characteristics. We used a binary outcome variable to
assess clinical responder status: patients with ACR0 or
ACR20 scores were classified as nonresponders (Patients 1, 2,
12, 13); and patients with ACR50 or ACR70 scores were clas-
sified as responders (Patients 3 to 11). Within 4 and 14 weeks
of tocilizumab therapy, disease activity of all patients
decreased significantly when all patients were considered as a
single group (Table 1A and 1B).
Figure 1A shows distribution of the patient population
according to a combination of ACR categories, DAS28
improvement between baseline and Week 14 when responder
status was assessed, and DAS28 at Week 14. PCA of clinical
measures can also differentiate between groups of responders
and nonresponders although there is a clear transition zone,
and results were most influenced by 2 patients (Figure 1B;
Appendix, Supplementary Figure 1). These suggest that the
clinical characteristics of the patient groups do not allow clear
differentiation between various stages of responsiveness to
therapy. ELISA analyses of serum from this group of patients
did not reveal significant differences in IL-6 or IL-8 serum
cytokine levels (Appendix, Supplementary Figure 2), there-
fore these data were not used for further analyses (levels of
IL-1ß could not be detected).
Global gene expression analyses and validation. Microarray
analysis of all samples at baseline and Week 4 (n = 26)
revealed 59 genes that showed significant differences between
baseline and Week 4 after correction for multiple testing. The
list of genes and their functional categories, such as response
to external stimulus, immune system process or regulation of
4 The Journal of Rheumatology 2012; 39:5; doi:3899/jrheum.110961
Personal non-commercial use only. The Journal of Rheumatology Copyright © 2012. All rights reserved.
Table 1B. Patient measures in responders and nonresponders.
Characteristic Total, mean ± SD Responders (range) Nonresponders (range)
Response at Week 14, n 13 9 4
Gender, F/M 9/4 8/1 1/3
Age, yrs 47.31 ± 8.81 48.2 (37–60) 45.2 (35–53)
Duration of disease, mo 150.46 ± 130.13 141.3 (24–480) 171 (48–300)
Smoking (Brinkman index) 58.85 ± 121.01 0 191.2 (0–375)
DAS28 at baseline 5.42 ± 0.72 5.25 (4.36–6) 5.81 (4.62–7)
Week 4 3.66 ± 1.4 3.68 (2.39–6) 3.62 (1.21–6.21)
Week 14 2.79 ± 1.41 2.27 (0.16–3.82) 3.97 (2.72–5.82)
HAQ at baseline 1.74 ± 0.66 1.83 (1–2.75) 1.53 (0.75–1.875)
Week 4 1.55 ± 0.65 1.48 (0.5–2.62) 1.71 (1.25–2.25)
Week 14 1.12 ± 0.66 0.93 (0.12–2) 0.56 (1.25–1.87)
CRP at baseline 27.9 ± 47.17 13.8 (0.4–40.2) 59.6 (2.34–178)
Week 4 19.47 ± 44.67 4.62 (0.5–22.81) 52.89 (0.5–161.81)
Week 14 16.83 ± 37.6 2.89 (0.5–16.7) 48.21 (0.5–129.56)
ESR at baseline 32.08 ± 22.96 28.4 (8–50) 40.2 (10–90)
Week 4 15.38 ± 20.87 9.22 (2–28) 29.25 (2–76)
Week 14 14.46 ± 21.3 5.77 (1–18) 34 (8–80)
Previous DMARD 3.46 ± 1.27 3.33 (2–5) 3.75 (2–6)
MTX dose, mg/wk 14.04 ± 4.39 14.44 (7.5–20) 13.13 (10–20)
Prednisone use, mg/wk 1.23 ± 2.52 0.89 (0–8) 2 (0–4)
ACR: American College of Rheumatology criteria; R: responder, NR: nonresponder, Brinkman index: no. ciga-
rettes smoked per day × smoking years, calculated by summing separate Brinkman indices in 3 age periods;
DAS28: Disease Activity Score; HAQ: Health Assessment Questionnaire; CRP: C-reactive protein; ESR: ery-
throcyte sedimentation rate; DMARD: disease-modifying antirheumatic drug; MTX: methotrexate.
5Mesko, et al: Effects of TCZ in RA
Personal non-commercial use only. The Journal of Rheumatology Copyright © 2012. All rights reserved.
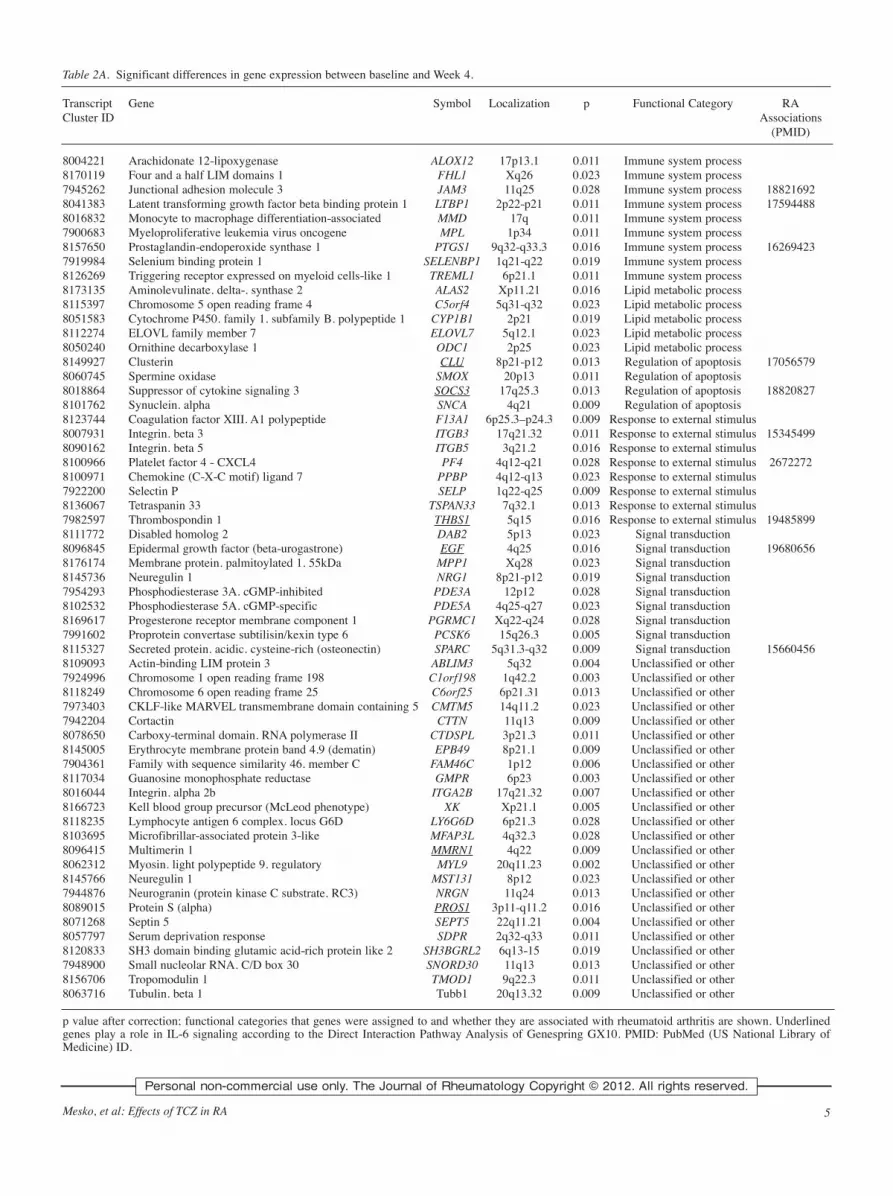
Table 2A. Significant differences in gene expression between baseline and Week 4.
Transcript Gene Symbol Localization p Functional Category RACluster ID Associations
(PMID)
8004221 Arachidonate 12-lipoxygenase ALOX12 17p13.1 0.011 Immune system process8170119 Four and a half LIM domains 1 FHL1 Xq26 0.023 Immune system process7945262 Junctional adhesion molecule 3 JAM3 11q25 0.028 Immune system process 188216928041383 Latent transforming growth factor beta binding protein 1 LTBP1 2p22-p21 0.011 Immune system process 175944888016832 Monocyte to macrophage differentiation-associated MMD 17q 0.011 Immune system process7900683 Myeloproliferative leukemia virus oncogene MPL 1p34 0.011 Immune system process8157650 Prostaglandin-endoperoxide synthase 1 PTGS1 9q32-q33.3 0.016 Immune system process 162694237919984 Selenium binding protein 1 SELENBP1 1q21-q22 0.019 Immune system process8126269 Triggering receptor expressed on myeloid cells-like 1 TREML1 6p21.1 0.011 Immune system process8173135 Aminolevulinate. delta-. synthase 2 ALAS2 Xp11.21 0.016 Lipid metabolic process8115397 Chromosome 5 open reading frame 4 C5orf4 5q31-q32 0.023 Lipid metabolic process8051583 Cytochrome P450. family 1. subfamily B. polypeptide 1 CYP1B1 2p21 0.019 Lipid metabolic process8112274 ELOVL family member 7 ELOVL7 5q12.1 0.023 Lipid metabolic process8050240 Ornithine decarboxylase 1 ODC1 2p25 0.023 Lipid metabolic process8149927 Clusterin CLU 8p21-p12 0.013 Regulation of apoptosis 170565798060745 Spermine oxidase SMOX 20p13 0.011 Regulation of apoptosis8018864 Suppressor of cytokine signaling 3 SOCS3 17q25.3 0.013 Regulation of apoptosis 188208278101762 Synuclein. alpha SNCA 4q21 0.009 Regulation of apoptosis8123744 Coagulation factor XIII. A1 polypeptide F13A1 6p25.3–p24.3 0.009 Response to external stimulus8007931 Integrin. beta 3 ITGB3 17q21.32 0.011 Response to external stimulus 153454998090162 Integrin. beta 5 ITGB5 3q21.2 0.016 Response to external stimulus8100966 Platelet factor 4 - CXCL4 PF4 4q12-q21 0.028 Response to external stimulus 26722728100971 Chemokine (C-X-C motif) ligand 7 PPBP 4q12-q13 0.023 Response to external stimulus7922200 Selectin P SELP 1q22-q25 0.009 Response to external stimulus8136067 Tetraspanin 33 TSPAN33 7q32.1 0.013 Response to external stimulus7982597 Thrombospondin 1 THBS1 5q15 0.016 Response to external stimulus 194858998111772 Disabled homolog 2 DAB2 5p13 0.023 Signal transduction8096845 Epidermal growth factor (beta-urogastrone) EGF 4q25 0.016 Signal transduction 196806568176174 Membrane protein. palmitoylated 1. 55kDa MPP1 Xq28 0.023 Signal transduction8145736 Neuregulin 1 NRG1 8p21-p12 0.019 Signal transduction7954293 Phosphodiesterase 3A. cGMP-inhibited PDE3A 12p12 0.028 Signal transduction8102532 Phosphodiesterase 5A. cGMP-specific PDE5A 4q25-q27 0.023 Signal transduction8169617 Progesterone receptor membrane component 1 PGRMC1 Xq22-q24 0.028 Signal transduction7991602 Proprotein convertase subtilisin/kexin type 6 PCSK6 15q26.3 0.005 Signal transduction8115327 Secreted protein. acidic. cysteine-rich (osteonectin) SPARC 5q31.3-q32 0.009 Signal transduction 156604568109093 Actin-binding LIM protein 3 ABLIM3 5q32 0.004 Unclassified or other7924996 Chromosome 1 open reading frame 198 C1orf198 1q42.2 0.003 Unclassified or other8118249 Chromosome 6 open reading frame 25 C6orf25 6p21.31 0.013 Unclassified or other7973403 CKLF-like MARVEL transmembrane domain containing 5 CMTM5 14q11.2 0.023 Unclassified or other7942204 Cortactin CTTN 11q13 0.009 Unclassified or other8078650 Carboxy-terminal domain. RNA polymerase II CTDSPL 3p21.3 0.011 Unclassified or other8145005 Erythrocyte membrane protein band 4.9 (dematin) EPB49 8p21.1 0.009 Unclassified or other7904361 Family with sequence similarity 46. member C FAM46C 1p12 0.006 Unclassified or other8117034 Guanosine monophosphate reductase GMPR 6p23 0.003 Unclassified or other8016044 Integrin. alpha 2b ITGA2B 17q21.32 0.007 Unclassified or other8166723 Kell blood group precursor (McLeod phenotype) XK Xp21.1 0.005 Unclassified or other8118235 Lymphocyte antigen 6 complex. locus G6D LY6G6D 6p21.3 0.028 Unclassified or other8103695 Microfibrillar-associated protein 3-like MFAP3L 4q32.3 0.028 Unclassified or other8096415 Multimerin 1 MMRN1 4q22 0.009 Unclassified or other8062312 Myosin. light polypeptide 9. regulatory MYL9 20q11.23 0.002 Unclassified or other8145766 Neuregulin 1 MST131 8p12 0.023 Unclassified or other7944876 Neurogranin (protein kinase C substrate. RC3) NRGN 11q24 0.013 Unclassified or other8089015 Protein S (alpha) PROS1 3p11-q11.2 0.016 Unclassified or other8071268 Septin 5 SEPT5 22q11.21 0.004 Unclassified or other8057797 Serum deprivation response SDPR 2q32-q33 0.011 Unclassified or other8120833 SH3 domain binding glutamic acid-rich protein like 2 SH3BGRL2 6q13-15 0.019 Unclassified or other7948900 Small nucleolar RNA. C/D box 30 SNORD30 11q13 0.013 Unclassified or other8156706 Tropomodulin 1 TMOD1 9q22.3 0.011 Unclassified or other8063716 Tubulin. beta 1 Tubb1 20q13.32 0.009 Unclassified or other
p value after correction; functional categories that genes were assigned to and whether they are associated with rheumatoid arthritis are shown. Underlinedgenes play a role in IL-6 signaling according to the Direct Interaction Pathway Analysis of Genespring GX10. PMID: PubMed (US National Library ofMedicine) ID.

apoptosis, and their relation to IL-6 signal pathways is shown
in Table 2A.
We then examined gene expression differences determin-
ing clinical response. Microarray analysis of samples at base-
line (n = 13) identified 787 probe sets showing significant dif-
ferences between responders (n = 9) and nonresponders (n =
4). As the female/male ratio is 1/3 in the group of nonrespon-
ders, we sought to remove the differences caused by the dise-
quilibrium in gender-specific gene expression; therefore
probe sets differentiating between men and women and
responders and nonresponders were compared, resulting in a
list of 686 probe sets devoid of gender differences (Figure
2A). Expression changes of 4 genes, CCDC32, DHFR,
EPHA4, and TRAV8-3, remained statistically significant after
correction for multiple testing. Future analyses should con-
firm if these genes can be used as predictors of the clinical
outcome.
Next, as our study was based on an exploratory approach,
we used a technical validation, RT-QPCR, to determine the
expression levels of 12 genes (4 genes from the nonresponders
vs responders; and 8 genes from the baseline vs Week 4 com-
parisons) for each sample (n = 26). In 10 out of 12 genes
6 The Journal of Rheumatology 2012; 39:5; doi:3899/jrheum.110961
Personal non-commercial use only. The Journal of Rheumatology Copyright © 2012. All rights reserved.
Table 2B. Pearson correlations (r) and p values of genes used in correla-
tion analyses. Numbers in bold type represent significant correlations.
Baseline Week 4
p r p r
DAS28 and gene expression
ALAS2 0.0001 0.78 0.42 0.05
DDX4 0.0001 0.75 0.29 0.09
DYRK3 0.0001 0.75 0.84 0.003
EPB42 0.0002 0.74 0.59 0.02
GMPR 0.001 0.64 0.25 0.11
ITGB3 0.35 0.07 0.04 0.32
PTX3 0.0001 0.75 0.87 0.002
RGL1 0.0001 0.77 0.05 0.29
RUNDC3A 0.0001 0.74 0.61 0.02
SLC25A39 0.0001 0.76 0.47 0.04
TMEM56 0.0002 0.74 0.08 0.24
TMOD1 0.0001 0.75 0.28 0.1
DAS28 (Week 14) and gene expression (baseline)
MAP7D1 0.0003 0.7
PDAP1 0.0002 0.73
ZIC3 0.0001 0.8
DAS28: Disease Activity Score.
Figure 1. Clinical assessment of patients by ACR criteria;
DAS28 improvement and PCA analysis. A. Circles and squares
indicate female and male patients, respectively. Numbers repre-
sent individual patients based on assessment included in Table
1. Patients are classified by ACR criteria (ACR0–20 to ACR70,
y-axis from bottom to top); by DAS28 improvement between
baseline and Week 14 (0–6, x-axis, from right to left); and by
DAS28 value at Week 14 (at right, lowest to highest values,
from top to bottom in each horizontal section). B. Principal
component analysis (PCA) was performed on data from all
patients as 1 group using measures such as responder status,
age, gender, smoking status, duration of disease, DAS28, ery-
throcyte sedimentation rate (ESR), C-reactive protein (CRP),
and Health Assessment Questionnaire (HAQ) at Week 0, 4, and
14. Black circles represent nonresponders.

selected (CCDC32, EPHA4, and TRAV8-3 between nonre-
sponders and responders; ALAS2, CLU, GMPR, ITGB3,
ITGA2B, SH3BGRL2, and TREML1 between baseline and
Week 4), the normalized mRNA levels showed significant dif-
ferences validating the microarray data (Figure 2B; Appendix,
Supplementary Figure 3).
Correlation with clinical measures. We also sought to merge
the gene expression data with clinical measures such as
DAS28. Gene expression levels of 9 genes, ALAS2, DYRK3,
EPB42, PTX3, RGL1, RUNDC3A, SLC25A39, TMOD1, and
TMEM56, at baseline showed significant correlation with
DAS28 scores at baseline (r > 0.74, p ≤ 0.0002). In addition,
RGL1 showed significant correlation after treatment since the
gene expression level and DAS28 at Week 4 correlated (r =
0.29, p = 0.05). ITGB3 was the only gene that showed corre-
lation between gene expression and DAS28 at Week 4 after
failing to correlate with DAS28 at baseline (r = 0.32, p =
0.04). Gene expression levels at baseline of 3 genes (MP7D1,
PDAP1, and ZIC3) showed significant correlation with
DAS28 scores at Week 14 (r > 0.70, p ≤ 0.0003; Table 2B).
Canonical variates analysis. Univariate statistics may be used
to compare expression levels gene by gene, disregarding
potential interactions between them. It is often the case, how-
ever, that while individual genes cannot separate the 2 groups
of patients, the same genes used simultaneously do provide
perfect segregation in the multidimensional space (with genes
as axes and patients as points). Therefore, we wanted to iden-
tify groups of genes that can potentially be used as best dis-
criminators between the 2 groups of patients. Using CVA, we
were able to detect a set of genes with the highest discrimina-
tory power.
Nine gene lists were selected for CVA (Figure 3). A list
containing IL-6 pathway-related genes (column 4); and 4 lists
obtained from the set of genes showing significant differences
between responders and nonresponders, such as a list contain-
ing genes with the lowest corrected p value; a list containing
genes with the highest fold change; a randomly generated list
from this comparison; and the 4 genes whose changes
remained significant after correction for multiple testing
showed sufficient discrimination between responders and
nonresponders (columns 1, 2, 3, 5). Gene sets derived from
this study (columns 1–3, Figure 3) showed remarkable dis-
criminatory power, especially the set (column 1) containing
genes with the most statistically significant changes. Gene
lists compiled by other authors13a, such as PBMC studies in
infliximab treatment for RA (column 6) and genes related to
synovium, showed moderate separation (column 7), while
lists generated by the highest p values or randomly selected
genes served as negative controls (columns 8 and 9, Figure 3;
and Appendix, Supplementary Table 1).
Degree of galactosylation of IgG N-glycans increases after
treatment and in responders versus nonresponders. As the
expression levels of the B4GALT1 gene encoding the beta 1,4-
galactosyltransferase enzyme that plays a critical role in the
glycosylation of IgG14 showed significant differences
between responders and nonresponders without correction for
multiple testing, we turned our attention to other genes coding
for enzymes related to this process, such as α1,6-fucosyl-
transferase (FUT8) and ß1,4-N-acetylglucosaminyltransferase
III (MGAT3) and found clear differences regarding the respon-
der status (Appendix, Supplementary Figure 4). Thus we
measured the degree of galactosylation of the N-glycans of
IgG. We analyzed and compared the glycosylation patterns in
RA samples to reveal a potential correlation between IgG1
N-glycan profile, galactosyl transferase expression, and the
pathogenesis of RA (Figure 4).
7Mesko, et al: Effects of TCZ in RA
Personal non-commercial use only. The Journal of Rheumatology Copyright © 2012. All rights reserved.
Figure 2. Gene expression differences between responders and nonresponders. A. Gene expression differences based on
microarray experiments between responders and nonresponders. Gender-specific gene expression differences were sub-
tracted, leading to a list of 686 probe sets differentiating between responder statuses without differences caused by gender.
Changes in 4 genes, CCDC32, DHFR, EPHA4, and TRAV8-3, remained statistically significant after correction for multi-
ple testing (Benjamini-Hochberg). B. Normalized mRNA levels of genes CCDC32, DHFR, EPHA4, and TRAV8-3 (with
SD) showing significant differences between responders and nonresponders were validated by RT-QPCR measurements.
Normalized mRNA levels of the indicated genes for each patient are shown.

8 The Journal of Rheumatology 2012; 39:5; doi:3899/jrheum.110961
Personal non-commercial use only. The Journal of Rheumatology Copyright © 2012. All rights reserved.
Figure 3. Nine gene lists were evaluated by canonical variates analysis. The power of canonical correlation decreases from left to right. Red bars represent respon-
ders, blue bars represent nonresponders. The bigger the space between the groups and the less the overlap among samples, the higher the power of separation of
the gene list.

The percentage of the area under the curve of IgG G0 is
lower in the group of responders compared to that of nonre-
sponders at baseline (Figure 4A) and after treatment (Figure
4B). Comparing the ratio of IgG G0 and G1+G1’+G2, which
is the ratio of agalactosylated and galactosylated IgG glycans,
there was a decrease in responders compared to nonrespon-
ders at baseline and after treatment (Appendix, Supple -
mentary Figure 5A and 5B).
Regarding the comparison of all baseline samples and the
treated ones, IgG G0 area% (Figure 4C) and the
G0/(G1+G1’+G2) ratio (Appendix, Supplementary Figure
5C) showed a decrease after treatment compared to the base-
line values, and this decrease was statistically significant in
the case of IgG G0 area%. These data mean that the degree of
galactosylation increases in responding patients, and this
shows no correlation with expression changes of the mRNA
levels of enzymes in PBMC.
DISCUSSION
In our study, we provided 3 pieces of proof of concept evi-
dence to show that (1) gene expression changes associated
with tocilizumab therapy can be derived from peripheral
blood cells; (2) some baseline gene expression changes, par-
ticularly if combined with clinical measures, determine clini-
cal outcome; and (3) a significant increase in the degree of
galacto sylation of N-glycans of IgG occurs after tocilizumab
therapy.
Thirty percent of patients included in this study were non-
responders, which is in agreement with the findings of others
in relation to TNF inhibitors15. It is also interesting that PCA
can separate responders from nonresponders to some extent
by using only clinical measures. It underscores the notion that
physical characteristics and clinical markers obtained from
patients could and should be used in combination with genom-
ic markers such as gene expression arrays. This might be the
9Mesko, et al: Effects of TCZ in RA
Personal non-commercial use only. The Journal of Rheumatology Copyright © 2012. All rights reserved.
Figure 4. Measuring the degree of galactosylation of N-glycans of IgG. A.
Percentage of area under the curve (AUC) of IgG G0 at baseline shows a
decrease in responders compared to nonresponders. B. Percentage of AUC of
IgG G0 after treatment at Week 4 shows a decrease in responders compared
to nonresponders. C. Percentage of AUC of IgG G0 at baseline shows a sig-
nificant decrease in samples obtained after treatment at Week 4 compared to
those obtained at baseline. Matching samples from the same patients are con-
nected to each other between baseline and after treatment.

only rational scenario for the identification of clinically rele-
vant pathways, gene sets, and predictor markers.
The effects of tocilizumab resulted in changes in the
expression of 59 genes between baseline and Week 4, many of
them associated with RA, such as CLU (clusterin), coding for
a secreted protein with multiple activities related to inflam-
mation, immunity and a regulatory activity on complement;
EGF; ITGB3 (integrin beta 3); JAM3; LTBP1; PF4; PTGS1
(prostaglandin-endoperoxide synthase 1), which has a widely
recognized role in inflammation; SOCS3; SPARC; and
THBS1. That these genes showed significant differences
between baseline and second infusion of infliximab under-
lines how important inflammation-related pathways are in the
contribution to the effects of therapy.
Regarding the 4 genes that determined responder status at
baseline, single nucleotide polymorphism (SNP) of DHFR
(dihydrofolate reductase) was identified as a putative predic-
tor for MTX response, efficacy, and side effects in RA16,
which suggests that tocilizumab response is related to MTX
response. TRAV8-3 (T cell receptor alpha variable 8-3) was
mentioned in relation to CD8+ T cell response against an HIV-
1 epitope17; EPHA4 (ephrin receptor A4) plays a role in the
nervous system; while the functionality of CCDC32 is
unknown.
From genes showing correlation with disease activity and
which might explain the effects of tocilizumab, PTX3 (pen-
traxin 3) was associated with RA and is expressed in response
to IL-1ß and TNF-α, but not to IL-6 in synovial tissue18. The
other 3 genes (MAP7D1, PDAP1, and ZIC3) showing correla-
tion between baseline gene expression and Week 14 DAS28
might be considered as potential markers of response since at
baseline they predicted disease activity at Week 14 (time of
determining remission).
Evidence indicating an important link between glycosyla-
tion changes and autoimmune rheumatic disease has been pre-
sented10. The effect of infliximab biologic therapy on the
galactosylation of N-glycans of IgG has also been shown11.
Attention has been focusing on the interrelationship between
reduced galactosylation of the oligosaccharides of IgG,
autosensitization, which is thought to be of central importance
in the pathogenesis of RA, and the enzyme ß1,4-galactosyl-
transferase that catalyzes the addition of galactose to the
oligosaccharide chains on IgG14. We showed that the normal-
ized mRNA levels of the gene encoding this enzyme differen-
tiate in a statistically significant way between responders and
nonresponders at baseline to tocilizumab therapy, and the
degree of galactosylation of the N-glycans of IgG increases
significantly after treatment, in responders versus nonrespon-
ders. The change in galactosylation corroborates a previous
report14 and goes further by showing that it can be used to
determine responder status.
In conclusion, the combination of peripheral blood gene
expression analyses, clinical scores, and IgG galactosylation
can be used to predict clinical response to tocilizumab thera-
py in RA. Fifty-nine genes showed significant differences
between baseline and Week 4 and thus correlated with treat-
ment. Significantly, 4 genes determined responders after cor-
rection for multiple testing. Ten of the 12 genes with the most
significant changes were validated using RT-QPCR.Our data also suggest that CVA is a powerful and widely
applicable mathematical tool to identify gene sets with thehighest discriminatory power. We had access to only a rela-tively small patient group (n = 13), which remains a limitationof our study; therefore these results need further validation onindependent, larger sample sets.
The normalized mRNA values of B4GALT1 encodingß1,4-galactosyltransferase, which catalyzes the addition ofgalactose to human IgG, differentiates between respondersand nonresponders at baseline in a statistically significantway, and the degree of galactosylation of the N-glycans ofIgG increases significantly after treatment.
To our knowledge, this is the first examination of geneexpression changes resulting from tocilizumab therapy in RA;gene sets discriminating between responders and nonrespon-ders were found and validated; and a significant increase inthe degree of galactosylation of N-glycans of IgG was docu-mented; however, these results have to be tested in largerindependent cohorts.
ACKNOWLEDGMENT
We thank Ibolya Fürtos for help in processing samples; Prof. Sandor Sipka for
the ELISA experiment and analysis; and Emese Petoné for help with sample
collection. Microarray analysis was carried out by the Microarray Core of the
Debrecen Clinical Genomics Center.
REFERENCES
1. Tracey D, Klareskog L, Sasso EH, Salfeld JG, Tak PP. Tumor
necrosis factor antagonist mechanisms of action: A comprehensive
review. Pharmacol Ther 2008;117:244-79.
2. Dayer JM, Choy E. Therapeutic targets in rheumatoid arthritis: The
interleukin-6 receptor. Rheumatology 2010;49:15-24.
3. Suzuki M, Hashizume M, Yoshida H, Mihara M. Anti-inflammatory
mechanism of tocilizumab, a humanized anti-IL-6R antibody:
Effect on the expression of chemokine and adhesion molecule.
Rheumatol Int 2010;30:309-15.
4. Oldfield V, Dhillon S, Plosker GL. Tocilizumab: A review of its use
in the management of rheumatoid arthritis. Drugs 2009;69:609-32.
5. Nishimoto N, Yoshizaki K, Miyasaka N, Yamamoto K, Kawai S,
Takeuchi T, et al. Treatment of rheumatoid arthritis with humanized
anti-interleukin-6 receptor antibody: A multicenter, double-blind,
placebo-controlled trial. Arthritis Rheum 2004;50:1761-9.
6. Smolen JS, Beaulieu A, Rubbert-Roth A, Ramos-Remus C,
Rovensky J, Alecock E, et al. Effect of interleukin-6 receptor
inhibition with tocilizumab in patients with rheumatoid arthritis
(OPTION study): A double-blind, placebo-controlled, randomised
trial. Lancet 2008;371:987-97.
7. Mesko B, Poliska S, Szegedi A, Szekanecz Z, Palatka K, Papp M,
et al. Peripheral blood gene expression patterns discriminate among
chronic inflammatory diseases and healthy controls and identify
novel targets. BMC Med Genomics 2010;3:15.
8. van Baarsen LG, Wijbrandts CA, Timmer TC, van der Pouw Kraan
TC, Tak PP, Verweij CL. Synovial tissue heterogeneity in
rheumatoid arthritis in relation to disease activity and biomarkers in
peripheral blood. Arthritis Rheum 2010;62:1602-7.
10 The Journal of Rheumatology 2012; 39:5; doi:3899/jrheum.110961
Personal non-commercial use only. The Journal of Rheumatology Copyright © 2012. All rights reserved.

9. van ’t Veer LJ, Dai H, van de Vijver MJ, Wesseling
J, Nuyten DS, van Krimpen C, et al. Gene expression profiling pre-
dicts clinical outcome of breast cancer. Nature 2002;415:530-6.
10. Axford JS, Sumar N, Alavi A, Isenberg DA, Young A, Bodman KB,
et al. Changes in normal glycosylation mechanisms in autoimmune
rheumatic disease. J Clin Invest 1992;89:1021-31.
11. Croce A, Firuzi O, Altieri F, Eufemi M, Agostino R, Priori R, et al.
Effect of infliximab on the glycosylation of IgG of patients with
rheumatoid arthritis. J Clin Lab Anal 2007;21:303-14.
12. Podani J. Introduction to the exploration of multivariate biological
data. Leiden: Backhuys; 2000.
13. Podani J. Syn-Tax 2000 computer programs for data analysis in
11Mesko, et al: Effects of TCZ in RA
Personal non-commercial use only. The Journal of Rheumatology Copyright © 2012. All rights reserved.
Supplementary Table 1. Canonical correlation, chi-square, and Wilks’
lambda values of gene lists used for canonical variates analysis (Figure 3).
The higher the canonical correlation and chi-square, and the lower the
Wilks’ lambda, the stronger the gene list.
List Canonical Chi-square Wilks’
Correlation Lambda
R vs NR (p) 0.99 21.83 0.02
R vs NR (fold change) 0.97 18.33 0.05
R vs NR (random) 0.94 13.74 0.12
IL-6 pathway 0.94 13.68 0.12
R vs NR (after MTX) 0.88 13.70 0.22
Infliximab PBMC 0.88 11.14 0.23
Synovium 0.86 7.22 0.27
Lowest p 0.193 0.23 0.96
Random genes 0.014 0 0.99
R: responder; NR: nonresponder; IL-6 interleukin 6; MTX: methotrexate;
PBMC: peripheral blood mononuclear cells.
Supplementary Figure 1. Disease Activity Score 28
joint (DAS28) values at baseline and at Week 4 for
comparison of responders and nonresponders.
Supplementary Figure 2. Serum cytokine levels of interleukin 6 (IL-6), IL-1ß, and IL-8 were meas-
ured by ELISA from samples obtained from all patients at baseline and Week 4. Cytokine levels of
IL-6 and IL-8 showed no significant change in responders versus nonresponder, or samples at base-
line versus at Week 4. Cytokine levels of IL-1ß were below measurement limit.

12 The Journal of Rheumatology 2012; 39:5; doi:3899/jrheum.110961
Personal non-commercial use only. The Journal of Rheumatology Copyright © 2012. All rights reserved.
Supplementary Figure 3. Fold change between responders
and nonresponders (first 4 sets of bars); baseline and Week 4
(second 8 sets of bars) by microarray experiments (grey
bars) and RT-QPCR (black bars). *Statistically significant
comparison (only gene expression changes of DHFR and
SPARC by RT-QPCR were not significant).
Supplementary Figure 4. Normalized mRNA values of genes coding for enzymes that play a
role in the galactosylation of the N-glycans of IgG. Left column shows baseline versus treated
comparisons for all 3 genes; right column shows responder versus nonresponder comparisons
in all 3 genes.
Supplementary Figure 5. A. Ratio of IgG G0 and
G1+G1’+G2, the ratio of agalactosylated and galactosylated
IgG glycans at baseline, shows a decrease in responders com-
pared to nonresponders. B. Ratio of IgG G0 and
G1+G1’+G2, the ratio of agalactosylated and galactosylated
IgG glycans after treatment at Week 4, shows a decrease in
responders compared to nonresponders. C. Ratio of IgG G0
and G1+G1’+G2, the ratio of agalactosylated and galactosy-
lated IgG glycans after treatment at Week 4, shows a decrease
in samples obtained after treatment at Week 4 compared to
those obtained at baseline. Matching samples from the same
patients are connected to each other between baseline and
after treatment.

ecology and systematics. User’s manual. Budapest: Scientia; 2001.
13a. Sekiguchi N, Kawauchi S, Furuya T, Inaba N, Matsuda K, Ando S,
et al. Messenger ribonucleic acid expression profile in peripheral
blood cells from RA patients following treatment with an
anti-TNF-a monoclonal antibody, infliximab. Rheumatology
2008;47:780-8.
14. Alavi A, Axford J. Evaluation of beta 1,4-galactosyltransferase in
rheumatoid arthritis and its role in the glycosylation network
associated with this disease. Glycoconj J 1995;12:206-10.
15. Braun-Moscovici Y, Markovits D, Rozin A, Toledano K, Nahir AM,
Balbir-Gurman A. Anti-tumor necrosis factor therapy: 6 year
experience of a single center in northern Israel and possible impact
of health policy on results. Isr Med Assoc J 2008;10:277-81.
16. Sharma S, Das M, Kumar A, Marwaha V, Shankar S, Singh P, et al.
Purine biosynthetic pathway genes and methotrexate response in
rheumatoid arthritis patients among north Indians. Pharmacogenet
Genomics 2009;19:823-8.
17. Miyazaki E, Kawana-Tachikawa A, Tomizawa M, Nunoya
J, Odawara T, Fujii T, et al. Highly restricted T-cell receptor
repertoire in the CD8+ T-cell response against an HIV-1 epitope
with a stereotypic amino acid substitution. AIDS 2009;23:651-60.
18. Luchetti MM, Piccinini G, Mantovani A, Peri G, Matteucci C,
Pomponio G, et al. Expression and production of the long pentraxin
PTX3 in rheumatoid arthritis (RA). Clin Exp Immunol
2000;119:196-202.
13Mesko, et al: Effects of TCZ in RA
Personal non-commercial use only. The Journal of Rheumatology Copyright © 2012. All rights reserved.