ph-dependent immobilization of proteins on surfaces functionalized by plasma-enhanced chemical vapor...
TRANSCRIPT

pH-Dependent Immobilization of Proteins on Surfaces Functionalizedby Plasma-Enhanced Chemical Vapor Deposition of Poly(acrylic acid)-
and Poly(ethylene oxide)-like Films
Serena Belegrinou,† Ilaria Mannelli, Patricia Lisboa, Frederic Bretagnol, Andrea Valsesia,Giacomo Ceccone, Pascal Colpo, Hubert Rauscher,* and Francois Rossi
Institute for Health and Consumer Protection, European Commission, Joint Research Centre, Via E.Fermi, 21027 Ispra (VA), Italy
ReceiVed January 31, 2008. ReVised Manuscript ReceiVed March 30, 2008
The interaction of the proteins bovine serum albumin (BSA), lysozyme (Lys), lactoferrin (Lf), and fibronectin (Fn)with surfaces of protein-resistant poly(ethylene oxide) (PEO) and protein-adsorbing poly(acrylic acid) (PAA) fabricatedby plasma-enhanced chemical vapor deposition has been studied with quartz crystal microbalance with dissipationmonitoring (QCM-D). We focus on several parameters which are crucial for protein adsorption, i.e., the isoelectricpoint (pI) of the proteins, the pH of the solution, and the charge density of the sorbent surfaces, with the !-potentialas a measure for the latter. The measurements reveal adsorption stages characterized by different segments in the plotsof the dissipation vs frequency change. PEO remains protein-repellent for BSA, Lys, and Lf at pH 4-8.5, while weakadsorption of Fn was observed. On PAA, different stages of protein adsorption processes could be distinguished undermost experimental conditions. BSA, Lys, Lf, and Fn generally exhibit a rapid initial adsorption phase on PAA, oftenfollowed by slower processes. The evaluation of the adsorption kinetics also reveals different adsorption stages,whereas the number of these stages does not always correspond to the structurally different phases as revealed bythe D-f plots. The results presented here, together with information obtained in previous studies by other groups onthe properties of these proteins and their interaction with surfaces, allow us to develop an adsorption scenario for eachof these proteins, which takes into account electrostatic protein-surface and protein-protein interaction, but also thepH-dependent properties of the proteins, such as shape and exposure of specific domains.
Introduction
The adsorption of proteins is important for numerousinterdisciplinary scientific fields, such as biomaterial andbiomedical science, biosensor development, or nanobiotechnol-ogy, because proteins tend to accumulate spontaneously atsolid-liquid interfaces and attach to surfaces as tightly boundadsorbates.1,2 Irreversible and uncontrolled accumulation ofproteins has a detrimental influence on a wide range oftechnological applications. For instance, biomedical devices andmany implants in contact with biological media, in particularwith blood, must consist of materials with low potential for proteinadsorption and cellular interactions.3 Otherwise, there is the riskof adverse biological reactions in the living host system, suchas acute and chronic inflammation or fibrous encapsulation.Medical devices which are in daily use, for instance contactlenses, are subject to fouling processes as well. Furthermore,bioadhesion is also relevant for nonbiomedical areas, e.g., systemsfor water purification, transport, and storage which acquirebiofilms as well.4
On the other hand, protein adsorption can be desirable if itproceeds under controlled and well-characterized conditions.Well-controlled interactions between surfaces and biomolecules
are crucial for the development and optimization of biomaterials,biosensors, and other bioanalytical in vivo applications. Theinteraction between a biological recognition element (e.g.,proteins) and an inorganic transducer surface is one of the keyaspects in biosensor technology, since it directly affects thesensitivity and specificity of biosensors.5 Many chromatographicseparations are also based on differences in binding affinities ofproteins to the support material.1 Therefore, a detailed under-standing of protein adsorption on functionalized surfaces isnecessary for the development and improvement of bioanalyticalapplications.
However, protein-surface interactions are complex and notyet well understood due to the different forces interacting betweenthe protein domains and the substrate, as well as the complexdynamic adsorption processes. Furthermore, there are multipleprotein, solution, and surface variables which affect proteinadsorption.6–9 In this study, we therefore focus on severalparameters which are crucial for protein adsorption, i.e., theisoelectric point (pI) of the proteins, the molecular weight, thepH of the solution, and the charge density of the sorbent surfaces,with the !-potential as a measure for the latter. The selection ofthese parameters is driven by the goal of this study, namely tocorrelate the charge density of surfaces functionalized via plasma-enhanced chemical vapor deposition (PE-CVD) with the netcharge of four different proteins between pH 4 and 8.5.* To whom correspondence should be addressed. E-mail: hubert.rauscher@
jrc.it.† Present address: University of Basel, Department of Chemistry,
Klingelbergstrasse 80, 4056 Basel, Switzerland.(1) Haynes, C. A.; Norde, W. Colloids Surf., B 1994, 2, 517.(2) Horbett, T. A, Proteins: structure, properties, and adsorption to surfaces.
In Biomaterials science: An introduction to materials in medicine; Ratner, B. D.,Hoffman, A. S., Schoen, F. J., Lemons, J. E. , Eds.; Academic Press: San Diego,1996.
(3) Lazos, D.; Franzka, S.; Ulbricht, M. Langmuir 2005, 21, 8774.(4) Kingshott, P.; Griesser, H. J. Curr. Opin. Colloid Interface Sci. 1999, 4,
403.
(5) Marco, M.-P.; Barcelo, D. Meas. Sci. Technol. 1996, 7, 1547.(6) Andrade, J. D. Surface and Interfacial Aspects of Biomedical Polymers,
Vol. 2: Protein adsorption; Plenum Press: New York, 1985.(7) Andrade, J. D.; Hlady, V. L.; Van Wagenen, R. A. Pure Appl. Chem. 1984,
56, 1345.(8) Dee, K. C.; Puleo, D. A.; Bizios, R. An introduction to tissue-biomaterial
interactions; Wiley-Liss: Hoboken, 2003.(9) Latour, R. A. Biomaterials: Protein-Surface Interactions. In Encyclopedia
of Biomaterials and Biomedical Engineering; Bowlin, G. L., Wnek, G., Eds.;Taylor and Francis: New York, 2005; pp 1.
7251Langmuir 2008, 24, 7251-7261
10.1021/la8003454 CCC: $40.75 2008 American Chemical SocietyPublished on Web 06/13/2008

The PE-CVD method was chosen for surface modification, asit offers the possibility to obtain different tightly adherent filmson a wide variety of substrates.10 The deposited films are, on theone hand, a protein resistant, poly(ethylene oxide)-like (PEO-like) coating and, on the other hand, a protein adsorbing,poly(acrylic acid) (PAA) surface. Earlier !-potential measure-ments on such surfaces revealed that these two surface typescarry a negative charge at neutral pH.11
A property which is particularly important for this study is thepI of proteins, i.e., the pH at which the protein exhibits net zerocharge. At a pH below the pI, proteins are positively charged,while they carry a negative net charge above it. Hence, if theprotein-surface interaction is dominated by electrostatic forces,adsorption on a negatively charged surface should be morefavorable at a pH below the pI’s of the proteins.
In addition to ionic or electrostatic forces, the adsorption ofproteins is affected by other interaction mechanisms, such ashydrophobic interactions or hydrogen bonding. To understandthe interaction of biomolecules with functionalized surfaces indetail, it is desirable to realize whether one of the mechanismsis dominating the protein surface interaction in a certain pHrange. An objective of this study is therefore to find out whetherthere is a direct correlation between the surface charge, themolecule charge, and the pH of the solution or whether othermechanisms dominate the adsorption process under specificconditions.
To tackle these questions, we have chosen four differentproteins and investigated their pH dependent adsorption behaviorby quartz crystal microbalance with dissipation monitoring(QCM-D). The proteins are bovine serum albumin (BSA),lysozyme (Lys), lactoferrin (Lf), and fibronectin (Fn), whichdiffer in size, molecular weight, and pI. The measurements revealdifferent adsorption stages and allow conclusions on theadsorption kinetics and on structural changes which are probablyongoing during the formation of the adsorbate layer. Inconjunction with the !-potential results, these measurementsprovide information relevant to the understanding of theinteraction between biomolecules and bioactive surfaces.
Materials and MethodsSubstrate Preparation. Polished AT-cut and SiO2-coated sensor
quartz discs (14 mm in diameter, 0.30 mm thick) with a fundamentalfrequency of 5 MHz (Q-Sense AB, Gothenburg, Sweden) were usedfor the QCM-D experiments. The quartz crystals were cleaned bysequential immersion in 1 M NaOH, 1 M HCl, acetone, and ethanolfor 10 min at a time.
For the !-potential measurements, double-sided polished siliconwafers (N-type doping with P, (100) orientation, thickness 280 µm( 25 µm; Institute of Electronic Materials Technology, Warsaw,Poland) and glass microslides (76 mm ! 26 mm; Forlab, Brussels,Belgium) were used. The cleaning procedure consisted of sequentialsonication (5 min per cycle) in trichloroethane, acetone, and ethanol.
Plasma Polymerization via PE-CVD. PEO-like and PAAcoatings, both deposited via PE-CVD, were chosen as substratesthat are resistant to protein adsorption (PEO) or that promote theadsorption of proteins (PAA). These coatings have been characterizedearlier, including some aspects regarding their interaction withbiomolecules.10–22
The PEO-like coatings used in this work were produced in acustom built, capacitively coupled plasma source within a stainless-steel reactor. Two parallel plate electrodes were mounted in theinterior with a distance of 5 cm. The bottom electrode was groundedand acted as a sample holder, while the upper electrode was connectedto a radio frequency power source generator (13.56 MHz). Thedepositions were performed with an input power of 5 W in continuousmode for 25 s, and were then continued in pulsed mode with 10%duty cycle for 80 min, which led to films with a thickness of "25nm as measured by ellipsometry. Diethylene glycol dimethyl ether(DEGDME; Sigma-Aldrich, purity g99.5%) was used as a poly-(ethylene glycol)-like monomer precursor with a flow rate of 3 sccm(standard cubic centimeters), at a working pressure of 12 mTorrduring the deposition. The pressure was monitored by a baratron(MKS). As DEGDME has a relatively high boiling point (162 °C),the connecting gas pipe between the monomer storage vessel andthe reaction chamber was heated to avoid condensation. The cleaningprocedure between each deposition consisted of 15 min of pureoxygen plasma, followed by 10 min of pure argon plasma, bothapplied in continuous mode. From earlier studies it is known thatlayers produced in such a way are resistant to protein adsorption.16
The PAA films for this study were produced in a home-builtcapacitively coupled plasma reactor (13.56 MHz excitation fre-quency). In contrast to the reactor described above, the bottomelectrode, which served as sample holder, was connected to thepower source. The upper, grounded electrode had a “showerhead”design to admit the gas mixture, which consisted of 5 sccm acrylicacid (Sigma-Aldrich, g99%) and 5 sccm argon. The depositionswere carried out for 1 min at an input power of 50 W in pulsed modewith 10% duty cycle and 4 ms “time on” and led to films with athickness of "30 nm. Between each deposition the chamber wasplasma-cleaned with a mixture of 5 sccm argon and 5 sccm oxygenin continuous mode (24 W) for 15 min. PAA films produced thisway promote protein adsorption.23
Both types of PE-CVD functionalized surfaces were characterizedby X-ray photoelectron spectroscopy (XPS) after 12 h of immersionof the coated samples in 10 mM phosphate buffered saline (PBS)solution in the investigated pH range, as well as after immersion indeionized water. The photoelectron spectra did not indicate anychange of the film by the immersion procedure. Furthermore,corresponding ellipsometry measurements before and after immersionshowed that the layers are stable in solution, and swelling of thefilms could be excluded. These results indicate that changes in thedissipation and the film thickness as measured by QCM-D uponexposure to the protein solutions must be due to the adsorption ofproteins and is not caused by changes of the PAA- or PEO-likefilms.
!-Potential Measurements. The !-potential is defined as thepotential which arises at the shear plane between a bulk electrolytesolution and a surface when there is a relative movement betweenthe liquid and the solid phase.24 It is affected by the dissociation of
(10) Johnston, E. E.; Bryers, J. D.; Ratner, B. D. Langmuir 2005, 21, 870.(11) Valsesia, A.; Colpo, P.; Meziani, T.; Bretagnol, F.; Lejeune, M.; Rossi,
F.; Bouma, A.; Garcia-Parajo, M. AdV. Funct. Mat. 2006, 16, 1242.(12) Candan, S.; Beck, A. J.; O’Toole, L.; Short, R. D. J. Vac. Sci. Technol.
A 1998, 16, 1702.(13) Sardella, E.; Gristina, R.; Senesi, G. S.; d’Agostino, R.; Favia, P. Plasma
Process. Polym. 2004, 1, 63.(14) Sardella, E.; Gristina, R.; Ceccone, G.; Gilliland, D.; Papadopoulou-
Bouraoui, A.; Rossi, F.; Senesi, G. S.; Detomaso, L.; Favia, P.; d’Agostino, R.Surf. Coat. Technol. 2005, 200, 51.
(15) Sardella, E.; Favia, P.; Gristina, R.; Nardulli, M.; d’Agostino, R. PlasmaProcess. Polym. 2006, 3, 456.
(16) Bretagnol, F.; Lejeune, M.; Papadopoulou-Bouraoui, A.; Hasiwa, M.;Rauscher, H.; Ceccone, G.; Colpo, P.; Rossi, F. Acta Biomater. 2006, 2, 165.
(17) Bretagnol, F.; Kylian, O.; Hasiwa, M.; Ceriotti, L.; Rauscher, H.; Ceccone,G.; Gilliland, D.; Colpo, P.; Rossi, F. Sens. Actuat. B 2007, 123, 283.
(18) Bretagnol, F.; Ceriotti, L.; Lejeune, M.; Papadopoulou-Bouraoui, A.;Hasiwa, M.; Gilliland, D.; Ceccone, G.; Colpo, P.; Rossi, F. Plasma Process.Polym. 2006, 3, 30.
(19) Rossini, P.; Colpo, P.; Ceccone, G.; Jandt, K. D.; Rossi, F. Mater. Sci.Eng., C 2003, 23, 353.
(20) Valsesia, A.; Manso Silvan, M.; Ceccone, G.; Gilliland, D.; Colpo, P.;Rossi, F. Plasma Process. Polym. 2005, 2, 334.
(21) Favia, P.; Sardella, E.; Gristina, R.; d’Agostino, R. Surf. Coat. Technol.2003, 707, 169–170.
(22) Muir, B. W.; Tarasowa, A.; Gengenbach, T. R.; Menzies, D. J.; Meagher,L.; Rovere, F.; Fairbrother, A.; McLean, K. M.; Hartley, P. G. Langmuir 2008,DOI: 10.1021/la702689t.
(23) Lejeune, M.; Valesia, A.; Kormunda, M.; Colpo, P.; Rossi, F. Surf. Sci.2005, 583, L142.
(24) Hunter, R. J. Foundations of colloid science, 2nd ed.; Oxford UniversityPress: New York, 2005.
7252 Langmuir, Vol. 24, No. 14, 2008 Belegrinou et al.

surface groups or the adsorption of ions.25 Since there is no directway to directly determine the surface potential or the surface chargedensity, the !-potential, which is accessible to measurements, canbe used as a measure for both of these quantities.26 It can in turnbe used to gain information on the dissociation of surface groupsor the adsorption of cations or anions.25
Here we use the streaming potential to measure the !-potentialby applying a flow of liquid under a pressure gradient along thesample. The potential difference generated along the sample ismeasured and used to determine the !-potential of the surface fromthe Smoluchowski equation27 ! ) (dUSr/dp)("/##0)(L/QR), whereUSr is the streaming potential, p the pressure, " the viscosity, # thedielectric constant, L and Q the capillary length and cross-sectionarea, and R the electric resistance. By using a very diluted electrolytesolution, we can apply the Fairbrother-Mastin28approach, wherethe term L/QR is substituted by the conductivity of the electrolytesolution ! )L/(QR).
Before measuring the !-potential, the plasma polymer coatedsamples were washed by immersion in deionized water for 12 h andthen dried under nitrogen flow. The measurements were made withan electrokinetic analyzer (Anton Paar, Graz, Austria), using aclamping cell for solid samples connected to the instrument. Insidethe cell, the sample was pressed against a PMMA spacer with sevenrectangular channels. Therefore, the measured !-potential includesa contribution from the PMAA spacer, which can, however, beeliminated by measuring a reference PMAA surface. For this purpose,a PMMA reference curve was determined by measuring the!-potential of a PMMA reference plate under the same measuringconditions, under which the coated samples were investigated.Starting at pH 9, the raw !-potential values for each sample, as wellas for the PMMA reference curves, were read in steps of 0.5 pHunits. From these measurements, the !-potential values, !s, of thesample surfaces were determined by using the equation !s ) 2!m- !PMMA, where !m and !PMMA are the raw values measured againstthe PMMA reference and the !-potential values of the PMMAreference plate itself, respectively.
The measurements were performed with 450 mL of a 1 mM KClsolution. The pH was initially adjusted to "10 by adding 0.1 MNaOH solution. During the measurement, the pH was loweredstepwise ("0.5 pH units) by automatic titration with a 0.1 M HClsolution until pH"2 was reached. During the measurement, a pressureramp in the range of 0-600 mbar was applied. In order to ensuregood statistics, the !-potential value at a certain pH was the averageof four single measurement points.
Protein Samples. The proteins used in this study are listed inTable 1, together with those features which are most important forthis study, i.e., molecular weight (Mw) and pI.29–31 The proteins arebovine serum albumin, (BSA, Sigma Aldrich, A7906), lysozymefrom chicken egg white (Lys, Fluka, 62971), lactoferrin, isolatedfrom bovine colostrum (Lf, Sigma Aldrich, L4765), and fibronectinfrom bovine plasma (Fn, Sigma Aldrich, F4759). The proteins wereused without further purification. PBS solutions (10 mM) at differentpH were used for preparing protein solutions with concentrationsof 50 µg/mL for interaction with PAA coatings and 100 µg/mL forthe PEO coatings. The pH of the PBS solution was preadjusted by
adding aqueous NaOH or HCl solution until the desired pH valuesof approximately 4, 5.5, and 8.5 were reached. For the measurementsat pH "7, pure, unadjusted PBS (pH "7.3) was used.
Quartz Crystal Microbalance with Dissipation Monitoring.The interaction between proteins and PE-CVD functionalized surfaceswas investigated utilizing the QCM-D technique, by monitoringboth frequency and dissipation changes simultaneously in real timeduring adsorption. Rigidly bound adlayers can precisely follow thecrystal’s oscillatory motion, while weakly bound layers cannot andconsequently induce dissipative losses. In this way it is possible todistinguish individual adsorption stages and to detect structuralchanges, such as spreading or cluster formation of the adsorbedprotein films.32–34 The instrument was a QCM-D E4 (Q-Sense AB,Gothenburg, Sweden), which uses four temperature-stabilizedmeasurement cells (in parallel configuration in our case). The QCMinstrument was able to record frequencies up to the 13th overtone.All graphs presented in this study show the fifth overtone, whichis little sensitive to variations of the mounting conditions of differentcrystals.
After coating the quartz crystals by PE-CVD, they were immersedin deionized water for 12 h to remove the surplus of monomer andphysisorbed material. They were then assembled into the QCM andthe functionalized surfaces were first exposed to 10 mM PBS solutionin order to stabilize the system for at least 20-30 min. Once stablefrequency and dissipation signals were recorded, the protein solutionwas pumped through the measurement chamber by applying a flowof 50 µL/min. The frequency and dissipation changes due toadsorption of proteins were monitored until stable signals wererecorded at saturation. If strict saturation was unattainable, themeasurement was continued until the frequency and the dissipationcurves did not shift by more than 1-2 Hz per 30 min. The last stepof the experiments was a rinsing step with PBS solution to removeweakly bound or physisorbed material from the surface. Thefrequency differences obtained by subtracting the frequency valuerecorded just before the injection of the protein solution from theone after the final PBS rinsing were used for further evaluation, e.g.,conversion of the frequency shift (!f) into mass (!m) adsorbed onthe active electrode surface area ("0.2 cm2). All QCM-D adsorptionexperiments were performed at 25 ( 0.02 °C and repeated at leasttwice. The reagents used for preparing working or buffer solutionswere KCl and NaOH from Fluka and HCl and PBS from Sigma-Aldrich.
Results and Discussion!-Potential Measurements. In order to ascertain the repro-
ducibility of the !-potential results, both the PEO-like and thePAA coatings were measured at least six times. As electrokineticmeasurements are highly sensitive toward changes in theenvironmental conditions, the measurement conditions have tobe controlled carefully.35 Therefore, for one set of samples, theplasma polymerized coating was deposited in the same run andelectrolyte solution from the same batch was used. This resultedin a very good reproducibility regarding the shape of the curve,the location of the point of zero charge (PZC) and the !-potentialvalues. For instance, at any measured pH the maximum deviationof the !-potential values of the PEO-like coatings was "3 mVand the PZCs diverge at most by 0.5 units in differentmeasurements. For the PAA samples, maximum differences of8 mV were obtained for the !-potential values and the PZCs hadthe same uncertainty as in the measurements with the PEO-like
(25) Jacobasch, H.-J. Progr. Org. Coat. 1989, 17, 115.(26) Bellmann, C.; Klinger, C.; Opfermann, A.; Bohme, F.; Adler, H.-J. P.
Prog. Org. Coat. 2002, 44, 93.(27) Jacobasch, H.-J.; Simon, F.; Werner, C.; Bellmann, C. Technisches Messen
1996, 63, 439.(28) Fairbrother, F.; Mastin, H. J. Chem. Soc. Trans. 1924, 125, 2319.(29) Wadu-Mesthridge, K.; Amro, N. A.; Liu, G.-Y. Scanning 2000, 22, 380.(30) Levay, P. F.; Viljoen, M. Haematologica 1995, 80, 252.(31) McArthur, S. L.; McLean, K. M.; Kingshott, P.; St John, H. A. W.;
Chatelier, R. C.; Griesser, H. J. Colloids Surf., B 2000, 17, 37.
(32) Keller, C. A.; Glasmastar, K.; Zhdanov, V. P.; Kasemo, B. Phys. ReV.Lett. 2000, 84, 5443.
(33) Reimhult, E.; Hook, F.; Kasemo, B. Langmuir 2003, 19, 1681.(34) Rodahl, M.; Hook, F.; Fredriksson, C.; Keller, C. A.; Krozer, A.; Brzezinski,
P.; Voinova, M. V.; Kasemo, B. Faraday Discuss. 1997, 107, 229.(35) Hinze, F.; Ripperger, S.; Stintz, M. Chem. Ing. Technik. 1999, 71, 338.(36) McFadyen, P. Int. Labmate 2002, 27, 26.(37) Temmel, S.; Kern, W.; Luxbacher, T. Prog. Colloid Polym. Sci. 2005,
132, 83.
Table 1. Molecular Weights and pI’s of the Proteins Used forThis Study
BSA Lys Lf Fn
Mw [kDa] 66.0 14.7 90.0 450pI 4.5 11 8.7 5.0
pH-Dependent Immobilization of Proteins Langmuir, Vol. 24, No. 14, 2008 7253

coatings (0.5 units). The absolute magnitude of the measured!-potentials varied slightly for a series of samples, but suchdifferences are usually of little consequence.36
Figure 1 shows typical results of the !-potential measurementsfor the PEO-like films and for the PAA films, respectively, alreadycorrected for the contribution of the PMAA spacer. The PZC ofthe PEO-like surface is located at pH 3.7, which is typical forpolymeric surfaces without dissociable functional groups.37 Thenegative surface charge above the PZC arises from preferentialadsorption of chloride and hydroxyl anions. The PAA coatinghas the PZC at pH 2.7, one unit below the one of the PEO film.For PAA, the !-potential depends more strongly on the pH thanfor PEO since dissociation of the carboxylic functional groupscontributes to the formation of the electrochemical double layer(EDL), in addition to the adsorption of anions. As the PZC canalso serve as a measure of acidity and alkalinity of solid surfaces,38
the low PZC value of the PAA coating confirms its strongeracidity compared to the PEO surfaces. The dissociation of thecarboxylic groups also affects the shape of the !-potential curvesand the values at large pH. A clear plateau in the alkaline range(pH 8-9), which is the result of complete dissociation ofcarboxylic functional surface groups, can be observed for thePAA sample. The !-potential values in this range reach-85 mVand are much more negative than those for PEO, which do notexceed -30 mV.
These results show that in the pH region between 4 and 8.5,in which the protein adsorption experiments were performed,both surfaces carry a negative surfaces charge while the PAAfilms are more negative than the PEO-like films. Hence, ifelectrostatic interactions are the main driving forces for proteinadsorption on the investigated surfaces, proteins are expected toadsorb readily on PAA at a working pH below their pI’s.
QCM-D Measurements. BSA Adsorption on PAA. Thefrequency, !f (Figure 2a), and the dissipation, !D (Figure 2b),shifts of a PAA-coated QCM sensor upon exposure to BSA areshown in figure 2 as a function of time. The arrows indicate thestart of the exposure to the BSA solution and later the start ofthe rinsing step with PBS. The rinsing confirms that the adsorptionof BSA is irreversible under these experimental conditions forall investigated pH values, since rinsing induces almost no changesof the frequency or of the dissipation.
A summary of the frequency and dissipation shifts is presentedin table 2. From these values, the adsorbed mass, !m, and the
resulting thickness of the films, dSauerbrey, were calculated via theSauerbrey equation !m )-C!f/n, where C ) 17.7 ng/cm2 ·Hzat f ) 5 MHz, and n is the overtone number (here n ) 5).Alternatively, the film thickness, dfit, was also calculated byapplying a viscoelastic, single-layer Voight model to the !f and!D response as implemented in the QCM software and describedin detail by Voinova et al.39 Results obtained from both modelsand the number of adsorbed molecules, nBSA, per unit areacalculated from these results are also included in Table 2.Generally, the values obtained from fitting with the Voight modeland those from the Sauerbrey equation are in good agreement,with the exception of those for pH 5.5.
At pH 4, the adsorption is fast and saturation is achievedrapidly (Figure 2a). The relatively small dissipation value obtainedat saturation (Figure 2b) indicates that the adlayer is rigidly boundunder these conditions. At pH above 4 the adsorption rates aresmaller and saturation requires more time with increasing pH
(38) Bismarck, A.; Kumru, M. E.; Springer, J. J. Colloid Interface Sci. 1999,217, 377.
(39) Voinova, M. V.; Rodahl, M.; Jonson, M.; Kasemo, B. Phys. Scr. 1999,59, 391.
Figure 1. !-potential results for PEO-like and PAA surfaces preparedby PE-CVD.
Figure 2. !f (a) and !D (b) vs time plot for the adsorption of BSA onPAA. Black, data for pH 4; red, pH 5.5; blue, pH 7; green, pH 8.5. Thearrows in (a) indicate the start of the exposure to the BSA solution (!f) 0 Hz) and the start of the rinsing step with PBS. (c) !D vs !f plotobtained from these data.
7254 Langmuir, Vol. 24, No. 14, 2008 Belegrinou et al.

value. The adsorption maximum for BSA is reached at pH 5.5,while adsorption at pH 8.5 yields the smallest frequency shift(see Table 2 and Figure 2a). At pH 7 the frequency shift atsaturation is almost the same as at pH 4, but the adsorption isslower and the dissipation at pH 7 is more than 3 times largerthan for pH 4.
These findings are in agreement with previous studies on pH-dependent adsorption of BSA on other surfaces which showedmaximum adsorption close to the pI.40–42 At its pI, and particularlyon a hydrophilic surface43 such as PAA, BSA will undergo verylittle conformational change40 which allows adsorption in itsnormal, compact conformation, leading to a compact layer. AtpH >4.5, i.e., below pI, the conformation (R-helix content)changes more pronouncedly than at larger pH,40 and therefore,the amount of adsorbed BSA decreases sharply below pI due to(i) the expanded conformation which BSA adopts at low pH and(ii) stronger intermolecular repulsion. The expanded conformationof BSA at pH >4.5 prevents the adsorption of a larger amountof BSA due to steric hindrance. In contrast, the loss of R-helixcontent is moderate at higher pH,44 which allows the same amountof BSA adsorption at pH 7 and 4.
As discussed above, under the adsorption conditions employedhere, the !-potential of the PAA surface is negative, whichindicates that the surface carries a net negative charge. However,since the pI of BSA is around 4.5, the molecules carry only littlenet positive charge at pH 4 which should not lead to strongelectrostatic interaction with PAA. At a pH close to the pI, onthe other hand, proteins generally exhibit a high surface activity8
because under these conditions electrostatic repulsive interactionsare significantly reduced in favor of hydrophobic attractiveinteractions. Considering also that BSA is close to its normal,compact shape at pH not too much above the pI, with only littleloss ofR-helix content, it is not surprising that the largest amountof BSA is accumulated on the surface at pH 5.5. It appearstherefore that from pH 4 up to at least pH 7 electrostatic interactionbetween BSA and the surface plays a minor role.
Notwithstanding the fact that pH 8.5 is relatively far from thepI of BSA, the protein still has its normal configuration underthese conditions,44 and therefore, the formation of a compactlayer should not be hindered by steric reasons at this pH. Thedecrease of the adsorbable amount of BSA at higher pH musttherefore have other reasons. At that pH, the protein and thePAA film carry a negative net charge. Hence, repulsiveelectrostatic interactions are expected between the moleculesand the surface and also between the individual molecules. Thisleads to less adsorption as the pH increases, although it is obviousthat adsorption still proceeds at pH 8.5. Therefore, at high pHelectrostatic interaction becomes more dominating, but other
(40) Peng, Z. G.; Hidajat, K.; Uddin, M. S. Colloids Surf., B Biointerfaces2004, 33, 15.
(41) Hu, J.; Li, S.; Liu, B. Biochem. Eng. J. 2005, 23, 259.(42) Giacomelli, C. E.; Avena, M. J.; De Pauli, C. P. J. Colloid Interface Sci.
1997, 188, 387.(43) Wertz, C. F.; Santore, M. M. Langmuir 2001, 17, 3006.(44) Foster, J. F. In Albumin Structure, Function and Uses, Rosenoer, V. M.,
Oratz, M., Rothschild, M. A.,Eds. Pergamon: Oxford, 1977; pp 53.
Table 2. Compilation of Data Obtained for the Interaction of BSA with PAA (see Figure 2a-c) and Fitted Dataa
pH 4 pH 5.5 pH 7 pH 8.5
!f [Hz] 24.7 38.6 24.8 11.6!D ! 10-6 0.35 0.92 1.17 0.80"D/"ft ) 1 ! 10-9 [Hz-1] 8.7 27.1 79.8 80.5"D/"ft ) 2 ! 10-9 [Hz-1] 28.5 15.9 43.5 51.0D/"ft ) 3 ! 10-9 [Hz-1] - - 16.5 -k1 [s-1] 1.4 ! 10-2 ( 2.7 ! 10-4 2.7 ! 10-3 ( 4.9 ! 10-5 4.2 ! 10-3 ( 2.8 ! 10-4 7.9 ! 10-4 ( 3.8 ! 10-6
k2 [s-1] 1.0 ! 10-3 ( 1.3 ! 10-4 7.5 ! 10-4 ( 3.9 ! 10-5 1.3 ! 10-3 ( 3.9 ! 10-5 9.8 ! 10-5 ( 1.2 ! 10-6
k3 [s-1] - - 3.5 ! 10-4 ( 1.0 ! 10-4 -dSauerbrey [nm] 4.3 6.8 4.4 2.1dfit [nm] 4.4 10.3 4.5 2.3!m [ng/cm2] 429 677 439 208nBSA ! 1012 3.9 6.2 4.0 1.9
a The indices t ) 1-3 of the slopes "D/"f refer to possible different adsorption stages apparent in Figure 2c, while the indices of the kinetic constants,k, refer to kinetically different adsorption processes used for the fitting.
Figure 3. !f (a) and !D (b) vs time plot for the adsorption of lysozymeon PAA. Black, data for pH 4; red, pH 5.5; blue, pH 7; green, pH 8.5.(c) !D vs !f plot obtained from these data.
pH-Dependent Immobilization of Proteins Langmuir, Vol. 24, No. 14, 2008 7255
types of attractive interactions, e.g. hydrophobic, may still enableprotein adsorption at high pH.45
In order to gain more information on the adsorption behavior,!D is plotted against !f in a D-f plot. This way of plottingeliminates the time as an explicit parameter and can be used toobtain additional information on the adsorption processes via ananalysis of the slopes "D/"f.46–49 The D-f plots for BSAadsorption on PAA are shown in Figure 2c. All !D vs !f curves,except the one for pH 8.5, show segments with different,approximately constant slopes, highlighted by the colored arrows,which indicates that there are different adsorption phases.
In the initial phase, the D-f plot for pH 4 is linear with a smallslope. The distant data points indicate a fast initial adsorptionphase. The initial phase is terminated by steric restrictions ofadsorbed BSA which tends to spread at low pH to adopt a moreexpanded form.40,43 The slope "D/"ft ) 2 for the second adsorptionphase is 3.3 times larger than in the initial phase, which pointstoward the formation of an adlayer with higher dissipation peradded mass. It indicates that the adsorbed BSA molecules aremobile enough to allow insertion of additional molecules intothe layer after the first, rapid adsorption step and that reorientationprocesses, as suggested earlier,43 may also take place. In contrastto pH 4, the slopes of the D-f plots for pH 5.5 and 7 decreaseas the adsorption proceeds because the dissipation per addedmass is small near saturation. In the case of pH 5.5, the slopein the final adsorption phase is close to zero, i.e., at this stagethe addition of mass does not change the dissipation anymore.Obviously, under these conditions a very rigid protein layer isformed near saturation. This finding is in agreement with theview that BSA, at least at pH 5.5 and 7, i.e., not too much aboveits pI, adsorbs in its native, compact conformation which leadsto a compact layer. Finally, at pH 8.5 it is not possible to clearlydistinguish different adsorption stages because the D-f plot hasno clear break in the slope, although the latter slightly changesas the adsorption proceeds.
The kinetics of the different adsorption stages as indicated bythe D-f plots also were also analyzed by modeling the adsorptioncurves using different simple kinetic models. In the calculations,we assumed that the protein uptake is adsorption limited andirreversible, i.e., desorption processes were neglected. Forinstance, the initial part of the adsorption curve at pH 8.5 couldbe fitted very well with an exponential model of the form !f )C1 exp(-tk1) + f0 with k1 ) 7.9 ! 10-4 s-1, which correspondsto the finding from the D-f plot that there is only one adsorptionprocess at pH 8.5. On the other hand, and taking into accountalso later adsorption stages, it is also possible to model the data
with a sum of two exponential functions of the form !f ) C1
exp(-tk1) + C2 exp(-tk2) + f0, with a slightly modified k1 (k1
) 7.5 ! 10-4 s-1) and k2 ) 9.8 ! 10-5 s-1, respectively. Thelatter constant points toward a very slow, additional adsorptionprocess. However, at this late stage of film formation, thedesorption of molecules may not be negligible anymore. In thiscase only the fit to the initial part of the adsorption curve wouldrepresent the actual adsorption kinetics.
The adsorption curves for pH 4 and 5.5 could be fitted withtwo exponential functions each, corresponding to the twoadsorption stages which are indicated by the two segments ofconstant slope in the D-f plot. For pH 7, the best fit could beachieved by applying a model comprising three exponentialfunctions, in agreement with the three segments in the D-f plotfor pH 7. The results of the kinetic modeling are summarizedin Table 2. The largest kinetic constant k1 for the adsorption ofBSA on PAA of 1.4 ! 10-2 s-1 was obtained for the initialadsorption phase at pH 4.
Lysozyme Adsorption on PAA. The frequency and dissipationcurves of the lightest protein, lysozyme, are presented in Figure3a and b. The adsorption of lysozyme is characterized by aninitial rapid frequency decrease for all investigated pH values.For pH 4, the frequency remains nearly constant after the firstinitial decrease, whereas for pH 5.5, 7, and 8.5 there are subsequentslower adsorption phases. Hence, under these conditions,saturation is reached only at pH 4. Unlike BSA, lysozyme adsorbspartly reversibly at all pH values. During the washing step, thelayers deposited at the lower pH values 4 and 5.5 have the highestlosses (corresponding to an increase of "5 Hz in frequency)whereas the frequency of the curves at pH 7 and 8.5 increasesonly by 3 and 2 Hz, respectively.
As the investigated range of pH is below the pI of lysozyme,electrostatic attraction between the surface and the molecules isassumed to be relevant for all investigated pH values, particularlyon a hydrophilic surface,50 such as PAA. This view is in agreementwith the earlier finding that adsorption of this protein is facilitatedby predominantly electrostatic interaction between lysozyme anda surface covered by a -COOH-terminated self-assembledmonolayer.29
Our experimental results show that in the initial phase, theadsorption is very fast at pH 4 and 5.5 and the initial frequencychange is larger than at higher pH, which is in agreement withthe view that electrostatic interactions are dominating, as theprotein is strongly positively charged at these pH values. Inaddition to a strong electrostatic interaction, rapid adsorption ofthe globular protein lysozyme is facilitated by its low electricdipole moment ("300 D at pH 5 in water51), which allows the
(45) Belfort, G.; Lee, C. S. PNAS 1991, 88, 9146.(46) Fredriksson, C.; Kihlman, S.; Rodahl, M.; Kasemo, B. Langmuir 1998,
14, 248.(47) Hook, F.; Rodahl, M.; Brzezinski, P.; Kasemo, B. Langmuir 1998, 14,
729.(48) Hook, F.; Rodahl, M.; Kasemo, B.; Brzezinski, P. PNAS 1998, 95, 12271.(49) Oetzen, D. E.; Oliveberg, M.; Hook, F. Colloids Surf., B 2003, 29, 67.
(50) Lu, J. R.; Su, T. J.; Howlin, B. J. J. Phys. Chem. B 1999, 103, 5903.(51) Bonincontro, A.; De Francesco, A.; Onori, G. Colloids Surf., B 1998, 12,
1.
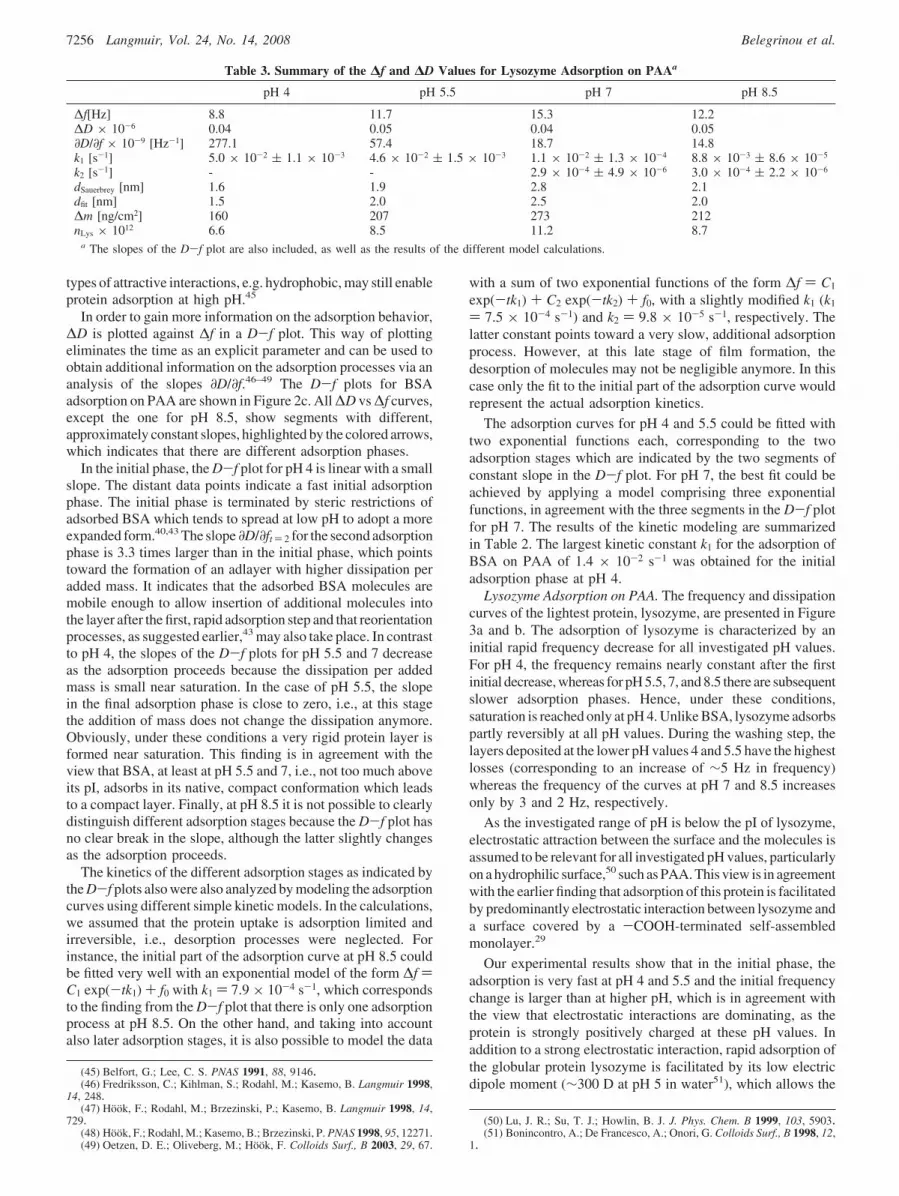
Table 3. Summary of the !f and !D Values for Lysozyme Adsorption on PAAa
pH 4 pH 5.5 pH 7 pH 8.5
!f[Hz] 8.8 11.7 15.3 12.2!D ! 10-6 0.04 0.05 0.04 0.05"D/"f ! 10-9 [Hz-1] 277.1 57.4 18.7 14.8k1 [s-1] 5.0 ! 10-2 ( 1.1 ! 10-3 4.6 ! 10-2 ( 1.5 ! 10-3 1.1 ! 10-2 ( 1.3 ! 10-4 8.8 ! 10-3 ( 8.6 ! 10-5
k2 [s-1] - - 2.9 ! 10-4 ( 4.9 ! 10-6 3.0 ! 10-4 ( 2.2 ! 10-6
dSauerbrey [nm] 1.6 1.9 2.8 2.1dfit [nm] 1.5 2.0 2.5 2.0!m [ng/cm2] 160 207 273 212nLys ! 1012 6.6 8.5 11.2 8.7
a The slopes of the D-f plot are also included, as well as the results of the different model calculations.
7256 Langmuir, Vol. 24, No. 14, 2008 Belegrinou et al.

molecule to approach the PAA surface in random orientation52
without the need for reorientation due to the interaction with thecharged surface. A rapid initial decrease has also been observedearlier for lysozyme adsorption on a hydrophilic TiO2 surface.53
The higher pH values 7 and 8.5 also exhibit a fast initial adsorptionphase with subsequent slower phases. As a trend for lysozymethe slower adsorption phase starts earlier when the pH is higher.
Concerning hydrophobic protein-surface interaction it wasshown that exposed, freely accessible amino acids, such as Trp62,can interact with apolar surfaces through hydrophobic interac-tions.52 Interaction with a hydrophobic surface causes perturbationof the molecule and leads to slow structural changes in thesecondary structure of the molecule.52,54 On the other hand itwas found that adhesive forces due to hydrophobic interactionbetween lysozyme and wettable (hydrophilic) surfaces are low.55
Hence, they are not expected to dominate the interaction betweenlysozyme and PAA under our conditions. In addition, it has beenfound that Lys, as a small globular protein, has a lowcompressibility and tends to retain a robust, compact conformationon the surface.55 This taken together confirms the view that theinteraction between lysozyme and the PAA surface under ourexperimental conditions is predominantly electrostatic.
Lysozyme, with a relatively high pI ("11), carries a net positivecharge in the entire investigated range of pH. Therefore,electrostatic intermolecular repulsion8 weakens the adsorptionand tends to destabilize the adsorbate layer, which is probablythe reason for the loss of adsorbed mass during the rinsing step.This is supported by the fact that the smallest amount of adsorbedmass is lost during the washing step at pH 8.5, which is closestto the pI of lysozyme. At pH 4 and 5.5 lysozyme should be morepositively charged than at pH 7 and 8.5, and therefore, the lossof adsorbed lysozyme is larger at lower pH values. Further, afterrinsing the smallest frequency shift is obtained at pH 4. As bothadsorbed and free lysozyme molecules exhibit a strong positivenet charge at pH 4, the surface may not be covered completelyanymore by the protein after the rinsing step. In addition, it wassuggested that far from the pI, at pH <4-5, intramolecularinteractions become significant, which lead to a partial expansionby electrostatic repulsion among positively charged groups.51
Such an expansion can additionally lead to a reduction of thesaturation coverage.
The dissipation shifts for lysozyme adsorption are very smalland almost constant for all pH values (Figure 3b), indicating thatrigid protein layers are formed, in agreement with the findingthat smaller proteins tend to form denser layers than larger ones53
Slightly negative values in the graphs are due to transients caused
by the exchange of the pure buffer solution with the proteinsolution, which has a slightly different viscosity. Table 3summarizes the !f and !D results for lysozyme adsorption onPAA.
In the D-f plot (Figure 3c), all curves show one main adsorptionphase with a positive slope. Initial stages with a negative slopein the first phase of the adsorption process are a consequence ofthe slight change of the dissipation in time and can be consideredas artifact here. On the other hand, the plot for pH 4 has almostzero slope in the beginning, i.e., there is almost no dissipationshift per added mass. This again indicates that the protein layeris attached very rigidly to the surface. As the adsorption oflysozyme at pH 4 occurs considerably fast due to strong attractiveelectrostatic forces, the actual adsorption process may alreadybe finished within the first 5 min of exposure to the proteinsolution. This is confirmed by the !f vs time plot in Figure 3a,where the frequency hardly changes anymore after a frequencyshift of "13 Hz in the initial phase. Therefore, the large, almostvertical slope in the D-f plot observed at pH 4 derives from analmost constant frequency and a slightly increasing dissipation("0.05 ! 10-6), and therefore has rather a mathematical thana physical origin (cf. also the smaller !D scale in Figure 3ccompared to the D-f plots of the other proteins). The fastadsorption kinetics at pH 4 is also obvious by the rather largekinetic constant k1 of 5.0 ! 10-2 s-1 obtained from the kineticmodeling (using a Boltzmann function of the form !f ) k1/[1+ e(t - t0)/dt] + f0); it is around 3.6 times larger than the one forBSA, which confirms again the very strong attractive electrostaticinteractions of lysozyme with PAA at pH 4. The frequency changeat pH 5.5 could also be fitted with a Boltzmann function and alsoprovided a large kinetic constant of 4.6 ! 10-2 s-1. For both pH7 and 8.5 the slow adsorption process cannot be neglected, andtherefore, a kinetic model consisting of a sum of two exponentialfunctions was used. All results are summarized in Table 3.
Lactoferrin Adsorption on PAA. Similar to BSA, lactoferrinadsorbs irreversibly on the substrate (see Figure 4), and the finalwashing step has almost no influence on the adsorbate layer. AtpH 4, saturation is achieved immediately after a rapid initialadsorption step, consistent with the action of strong attractiveelectrostatic forces between the oppositely charged PAA surfaceand lactoferrin (pI # 8.7). At pH 5.5 and higher, the initial, fastadsorption step is followed by slower stages. As observed forother proteins (e.g., BSA adsorption on PAA at pH 4), the surfacecoverage at pH 4 is lower than for the higher pH values, sincein the latter case molecules in solution are repelled by alreadyadsorbed protein molecules. At higher pH values, electrostaticrepulsion between adsorbed molecules and molecules in solution,as well as within the adsorbed film, is less pronounced andtherefore the surface coverage can be higher than at pH 4.
(52) Sethuraman, A.; Vedantham, G.; Imoto, T.; Przybycien, T.; Belfort, G.Proteins Struct. Funct. Bioinform. 2004, 56, 669.
(53) Voros, J. Biophys. J. 2004, 87, 553.(54) Sethuraman, A.; Belfort, G. Biophys. J. 2005, 88, 1322.(55) Sethuraman, A.; Han, M.; Kane, R. S.; Belfort, G. Langmuir 2004, 20,
7779.
Table 4. Results Obtained for Adsorption of Lactoferrin on PAA
pH 4 pH 5.5 pH 7 pH 8.5
!f [Hz] 33.5 47.9 50.9 47.4!D ! 10-6 0.43 0.38 0.27 0.50"D/"ft ) 1 ! 10-9 [Hz-1] 23.4 29.0 32.3 31.5"D/"ft ) 2 ! 10-9 [Hz-1] 7.1 -18.8 -20.6 -18.3"D/"ft ) 3 ! 10-9 [Hz-1] - 39.7 22.8 42.5k1 [s-1] 4.0 ! 10-2 ( 6.5 ! 10-4 1.8 ! 10-2 ( 1.3 ! 10-4 1.3 ! 10-2 ( 2.1 ! 10-4 1.5 ! 10-2 ( 1.9 ! 10-4
k2 [s-1] - 6.0 ! 10-4 ( 2.0 ! 10-5 3.1 ! 10-4 ( 6.2 ! 10-5 3.4 ! 10-4 ( 4.6 ! 10-4
dSauerbrey [nm] 5.9 8.5 9.0 8.4dfit [nm] 7.3 8.9 8.5 8.0!m [ng/cm2] 589 849 901 841nLf ! 1012 3.9 5.7 6.0 5.6
pH-Dependent Immobilization of Proteins Langmuir, Vol. 24, No. 14, 2008 7257
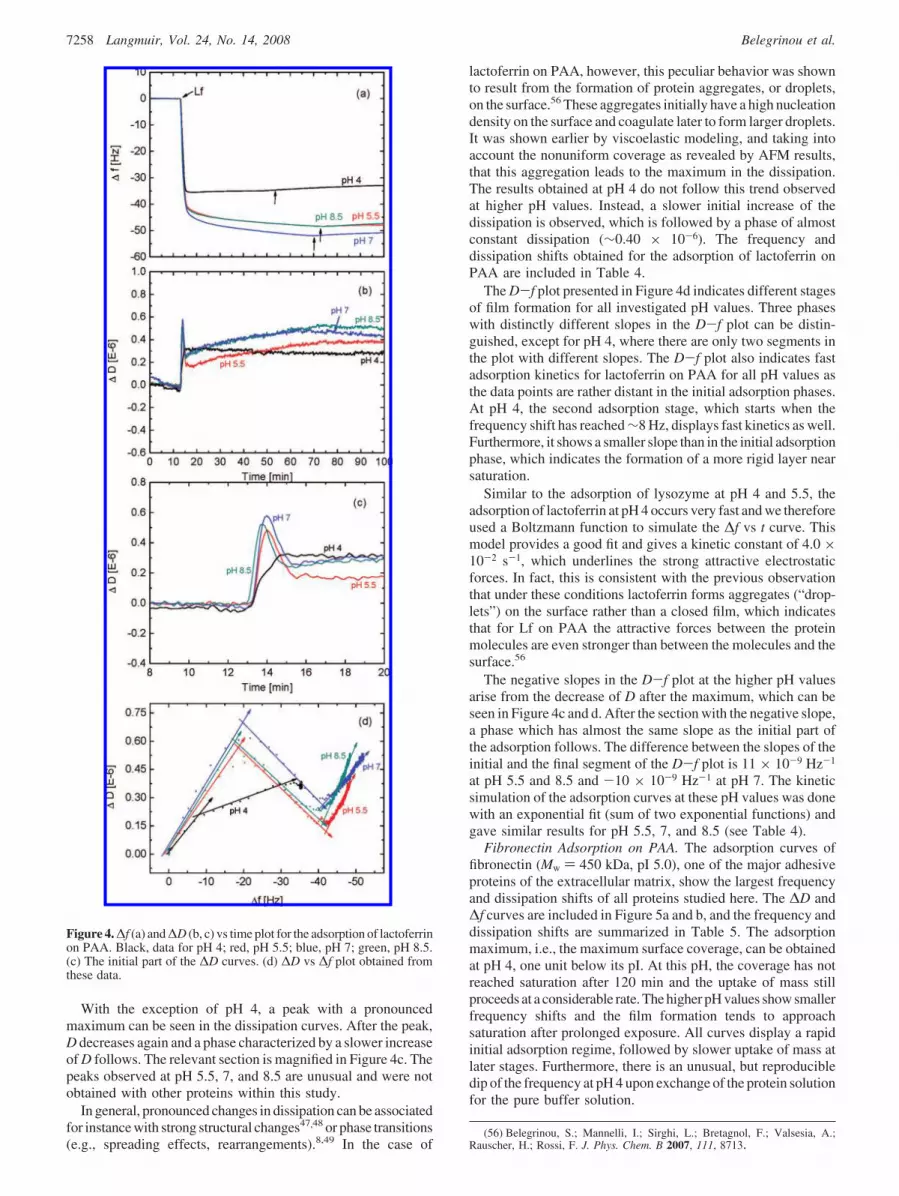
With the exception of pH 4, a peak with a pronouncedmaximum can be seen in the dissipation curves. After the peak,D decreases again and a phase characterized by a slower increaseof D follows. The relevant section is magnified in Figure 4c. Thepeaks observed at pH 5.5, 7, and 8.5 are unusual and were notobtained with other proteins within this study.
In general, pronounced changes in dissipation can be associatedfor instance with strong structural changes47,48 or phase transitions(e.g., spreading effects, rearrangements).8,49 In the case of
lactoferrin on PAA, however, this peculiar behavior was shownto result from the formation of protein aggregates, or droplets,on the surface.56 These aggregates initially have a high nucleationdensity on the surface and coagulate later to form larger droplets.It was shown earlier by viscoelastic modeling, and taking intoaccount the nonuniform coverage as revealed by AFM results,that this aggregation leads to the maximum in the dissipation.The results obtained at pH 4 do not follow this trend observedat higher pH values. Instead, a slower initial increase of thedissipation is observed, which is followed by a phase of almostconstant dissipation ("0.40 ! 10-6). The frequency anddissipation shifts obtained for the adsorption of lactoferrin onPAA are included in Table 4.
The D-f plot presented in Figure 4d indicates different stagesof film formation for all investigated pH values. Three phaseswith distinctly different slopes in the D-f plot can be distin-guished, except for pH 4, where there are only two segments inthe plot with different slopes. The D-f plot also indicates fastadsorption kinetics for lactoferrin on PAA for all pH values asthe data points are rather distant in the initial adsorption phases.At pH 4, the second adsorption stage, which starts when thefrequency shift has reached "8 Hz, displays fast kinetics as well.Furthermore, it shows a smaller slope than in the initial adsorptionphase, which indicates the formation of a more rigid layer nearsaturation.
Similar to the adsorption of lysozyme at pH 4 and 5.5, theadsorption of lactoferrin at pH 4 occurs very fast and we thereforeused a Boltzmann function to simulate the !f vs t curve. Thismodel provides a good fit and gives a kinetic constant of 4.0 !10-2 s-1, which underlines the strong attractive electrostaticforces. In fact, this is consistent with the previous observationthat under these conditions lactoferrin forms aggregates (“drop-lets”) on the surface rather than a closed film, which indicatesthat for Lf on PAA the attractive forces between the proteinmolecules are even stronger than between the molecules and thesurface.56
The negative slopes in the D-f plot at the higher pH valuesarise from the decrease of D after the maximum, which can beseen in Figure 4c and d. After the section with the negative slope,a phase which has almost the same slope as the initial part ofthe adsorption follows. The difference between the slopes of theinitial and the final segment of the D-f plot is 11 ! 10-9 Hz-1
at pH 5.5 and 8.5 and -10 ! 10-9 Hz-1 at pH 7. The kineticsimulation of the adsorption curves at these pH values was donewith an exponential fit (sum of two exponential functions) andgave similar results for pH 5.5, 7, and 8.5 (see Table 4).
Fibronectin Adsorption on PAA. The adsorption curves offibronectin (Mw ) 450 kDa, pI 5.0), one of the major adhesiveproteins of the extracellular matrix, show the largest frequencyand dissipation shifts of all proteins studied here. The !D and!f curves are included in Figure 5a and b, and the frequency anddissipation shifts are summarized in Table 5. The adsorptionmaximum, i.e., the maximum surface coverage, can be obtainedat pH 4, one unit below its pI. At this pH, the coverage has notreached saturation after 120 min and the uptake of mass stillproceeds at a considerable rate. The higher pH values show smallerfrequency shifts and the film formation tends to approachsaturation after prolonged exposure. All curves display a rapidinitial adsorption regime, followed by slower uptake of mass atlater stages. Furthermore, there is an unusual, but reproducibledip of the frequency at pH 4 upon exchange of the protein solutionfor the pure buffer solution.
(56) Belegrinou, S.; Mannelli, I.; Sirghi, L.; Bretagnol, F.; Valsesia, A.;Rauscher, H.; Rossi, F. J. Phys. Chem. B 2007, 111, 8713.
Figure 4. !f (a) and !D (b, c) vs time plot for the adsorption of lactoferrinon PAA. Black, data for pH 4; red, pH 5.5; blue, pH 7; green, pH 8.5.(c) The initial part of the !D curves. (d) !D vs !f plot obtained fromthese data.
7258 Langmuir, Vol. 24, No. 14, 2008 Belegrinou et al.

At pH 7 and 8.5 the adsorption takes place almost irreversibly,whereas at lower pH values some of the adsorbate is lost duringthe PBS washing step. The dissipation at pH 4, like the frequency,does not reach saturation, even after several hours of exposure.This behavior is very different from that at the other pH valuesand also from that of the other proteins. The value for thedissipation shift after 180 min exposure is at least 8 times largerthan for the other pH values and "140 times larger than forlactoferrin, which has the largest !D value at pH 4 among theinvestigated proteins.
The D-f plot in figure 5 is split up into two parts. Figure 5cshows pH 4, and Figure 5d displays the other pH values. At pH
4 two different adsorption phases can be distinguished. Initially,a rigidly attached layer is formed, as indicated by a moderateslope in the first phase, i.e., the dissipation changes and thefrequency shifts are comparable. The slope of the second phaseis almost 13 times larger than the initial phase, which indicatesthat the dissipation change per added mass is much larger, andthe adlayer becomes less rigidly attached to the surface in thisphase.
The kinetic simulation gives the smallest kinetic constants forfibronectin adsorption at pH 4. An exponential fit (two processes)provides two constants, k1 ) 4.3 ! 10-3 s-1 for the initial phaseand k2 ) 1.1 ! 10-4 s-1 for the second stage. For the other pHvalues three different adsorption stages are suggested from theD-f plot, where the first and last ones show a larger slope thanthe one in between. For these pH values each of the individualsegments of the D-f plot has an approximately linear behavior.These three stages in the fibronectin film formation are discussedbelow.
The evaluation of the kinetic data reveals interesting informa-tion. Even though three stages can be distinguished for pH 5.5and 7 in the D-f plot, the curves in Figure 5a could be fitted bestwith an exponential model consisting of a sum of two exponentialfunctions. This result indicates that two of the three stagesobserved may follow very similar kinetics. The constants obtainedfor pH 7 are also remarkable. The values 1.1 ! 10-2 and 2.1 !10-3 s-1 indicate that the initial adsorption of fibronectin occursas fast the adsorption of lysozyme at pH 7. At pH 8.5, anexponential model consisting of a sum of three single exponentialfunctions yields the following kinetic constants: k1 ) 7.0 ! 10-2
s-1, k2 ) 7.0 ! 10-3 s-1, and k3 ) 2.9 ! 10-4 s-1. Thus, theadsorption of fibronectin at this pH occurs faster in the initialstep than the adsorption of the other proteins investigated. Therate constants obtained from the calculations are included inTable 5.
Since the behavior of the dissipation during Fn adsorption pH4 is very different to that at pH 5.5, 7, and 8.5, the mechanismsof film formation are likely to be different as well. We thereforediscuss these two cases separately. Fn is a glycoprotein composedof two nearly identical subunits connected near their carboxytermini via two disulfide bonds.57,58 In its compact form it isrigid in the sense that the two subunits cannot rotate against eachother.59 Since it is stabilized by intersubunit ionic interactionsbetween different domains,60 extension of the molecule may,however, be triggered upon adsorption onto hydrophilic surfacessuch as PAA. Indeed, in addition to the compact structure moreflexible and extended conformations have been found onhydrophilic surfaces.61,62 If such a transition is of sufficient extent,it could also allow the exposure of self-association domainsrequired for fibril growth. It has been suggested that on hydrophilicsurfaces in the early stages of adsorption, i.e., at low coveragewith little intermolecular interactions, multiple Fn conformationsexist.63 As the surface density of the proteins increases, multipleintermolecular interactions lead to a semiaggregated state, wherethe proteins adopt a more rigid conformation.63 At pH 5.5, 7, and8.5 the Fn molecules (pI ) 5.0) carry a negative charge, and
(57) Plasma Fibronectin, Structure and Function; McDonagh, J., Ed.; Dekker:New York, 1985.
(58) Biology of Extracellular Matrix: A Series Fibronectin; Mosher, D., Ed.;Academic Press: San Diego, 1989.
(59) Benecky, M. J.; Wine, R. W.; Kolvenbach, C. G.; Mosesson, M. W.Biochemistry 1991, 30, 4298.
(60) Pellenc, D.; Beny, H.; Gallet, O. J. Colloid Interface Sci. 2006, 298, 132.(61) Bergkvist, M.; Carlsson, J.; Oscarsson, S. J. Biomed. Mater. Res. A 2003,
64, 349.(62) Baugh, L.; Vogel, V. J. Biomed. Mater. Res. A 2004, 69, 525.(63) Meadows, P. Y.; Walker, G. C. Langmuir 2005, 21, 4096.
Figure 5. !f (a) and !D (b) vs time plot for the adsorption of fibronectinon PAA. (c) D-f plot for pH 4 (black), (d) D-f plot for pH 5.5 (red),7 (blue), and 8.5 (green).
pH-Dependent Immobilization of Proteins Langmuir, Vol. 24, No. 14, 2008 7259

therefore, electrostatic repulsive forces between the moleculesand between the PAA surface and the Fn molecules exist. Underour experimental conditions these electrostatic repulsive forcesare clearly not dominant and do not prevent the adsorption ofFn on PAA. It therefore seems that the extension of Fn uponinteraction with the hydrophiclic PAA favors the interaction withhydrophilic domains of Fn, at least at low coverage. This iscorroborated by the earlier finding that Fn can adopt multipleconformations on hydrophilic surfaces, for instance on mica andSiO,61 but also on-COOH-terminated SAMs.63 As the coverageincreases, the higher protein density results in a more stableprotein conformation and prevents protein denaturation on thesurface, presumably by protecting the domains from interactingwith the surface.64 These findings help to interpret our QCM-Dresults for pH 5.5, 7, and 8.5. The !D vs !f curves (Figure 5d)obtained for these pH values show three linear regimes. The firstregime (at low coverage) can be associated with the formationof a nondense layer, where Fn is adsorbed in various conforma-tions.61–63 The second, transitional regime can be seen ascharacterized by rearrangement of Fn molecules and the transitionto a more stable conformation as the coverage increases. In thethird regime, the layer is completed by Fn molecules in thecompact form.61–63 Under these conditions, the exposure of self-association domains and consequently the formation of fibrils isprevented by the stabilization of the compact Fn conformation.
At low pH, on the other hand, it was shown that Fn adoptsan unfolded structure consisting of two connected but indepen-dently rotating disk-shaped subunits.59 The fact that adsorptiondoes not saturate and the drastically different behavior of the !Dvs !f signal as compared to the higher pH values can berationalized by considering the changed Fn conformation. It issuggested that Fn adsorbs already in the unfolded conformation,which is indicated by the relatively large increase of the dissipationper added mass already in the first adsorption phase (Figure 5c).Under these conditions it is expected that the self-associationdomains are readily exposed and consequently the formation offibrils should be facilitated. The formation of fibrils is alsosuggested by the very large slope of the !D vs !f curve in thesecond adsorption regime, which, together with the absence ofa saturation of the surface, indicates continuous growth of theprotein film. The large difference between the Sauerbrey massand the mass calculated with the Voight model at pH 4 can alsobe understood by the formation of fibrils. In this case the proteinfilm is expected to contain a considerably higher amount of wateras compared to the more compact film at higher pH.
It is clear that for Fn adsorption on PAA and for the pH valuesstudied here, electrostatic interactions do not dominate. Theyare, however, important to retain the compact or semicompactconformation at pH 5.5, 7, and 8.5, where most probably the
formation of fibrils is suppressed under these conditions. Ifelectrostatic interactions were dominating, the adsorption shouldbe fastest at pH 4 because this pH is below the pI of 5 andtherefore attractive electrostatic forces should dominate theadsorption process. Instead, the fastest adsorption step occurs atpH 8.5, where repulsive forces should work between the equallycharged protein and the substrate.
Protein Adsorption on PEO. The PEO-like films producedunder soft plasma conditions, i.e., low input power, low pressure,and temperature, are considered as antiadhesive coatings whichgenerally resist the adsorption of proteins to a large extent.16–18,22
The PEO films employed here exhibited a strongly repellentbehavior toward BSA, lysozyme, and lactoferrin over the entireinvestigated range of pH (the corresponding curves are not shown).Although the exact mechanisms leading to protein resistance arenot yet completely understood, several parameters, such as chaindensity, length, and conformation, seem to exert influence onthe protein repellent properties of PEO-like coatings. Mostly,the protein rejecting properties are ascribed to self-repulsionof the chains in water16 and the presence of ether groups in thePEO-like layer.9,16,22
Unlike BSA, lysozyme, and lactoferrin, adsorption of fi-bronectin on PEO-like coatings could be detected. The corre-sponding frequency and dissipation shifts are presented in Figure6. The curves indicate that the adsorption of fibronectin on PEO-like film proceeds relatively slowly. After washing with PBS,the adsorption maximum is reached at pH 8.5. Washing withPBS at pH 4 removes most of the adsorbate, and consequently,the remaining frequency shift at that pH is very small (4 Hz).Nevertheless, it is remarkable that fibronectin adsorption ispossible on the PEO-like surface, which is expected to be protein-repellent. Prior investigations revealed that the extent offibronectin adsorption is linked to the PEO character degree ofthe layer,14 and it appears that fibronectin is more sensitive todeviations from the monomer retention that other proteins.
Notwithstanding the protein-repellent properties, one wouldhave expected more adsorbed mass at pH 4 or 5.5 than at higherpH, because those pH values are below or close to the pI offibronectin ("5.0). In this way, adsorption could have beenfavored at pH 4 by attractive electrostatic interactions betweenthe negatively charged PEO-like surface (c.f. !-potential results)and the positively charged fibronectin. Instead, the higher pHvalues show larger frequency shifts. It was reported earlier thatFn adsorbed on a PEG surface has a much higher interfacialstiffness than on surfaces that are more favorable for proteinadsorption, and it was concluded that Fn exists in a volume-restricted state on PEG, if it adsorbs at all.63 A transition froman unfolded state to a volume-restricted state, which would benecessary according to this view, when adsorption takes placeat pH 4, may therefore have a rather high entropic cost, which(64) Grinnell, F.; Feld, M. K. J. Biomed. Mater. Res. 1981, 15, 363.
Table 5. Compilation of Experimental and Calculated Data for Adsorption of Fibronectin on PAA
pH 4 pH 5.5 pH 7 pH 8.5
!f [Hz] 195 135 112 102!D ! 10-6 60.0 7.2 6.1 5.1"D/"ft ) 1 ! 10-9 [Hz-1] 64.6 38.1 69.2 81.2"D/"ft ) 2 ! 10-9 [Hz-1] 822.6 23.2 20.0 19.4"D/"ft ) 3 ! 10-9 [Hz-1] - 47.8 77.4 62.9k1 [s-1] 4.3 ! 10-3 ( 3.2 ! 10-5 7.5 ! 10-3 ( 7.2 ! 10-5 1.1 ! 10-2 ( 9.7 ! 10-5 7.0 ! 10-2 ( 6.5 ! 10-3
k2 [s-1] 1.1 ! 10-4 ( 1.6 ! 10-6 2.8 ! 10-4 ( 3.5 ! 10-6 2.1 ! 10-4 ( 2.4 ! 10-6 7.0 ! 10-3 ( 5.6 ! 10-5
k3 [s-1] - - - 2.9 ! 10-4 ( 2.1 ! 10-6
dSauerbrey [nm] 34.4 24.0 19.5 18.1dfit [nm] 93.2 28.6 19.9 18.7!m [ng/cm2] 3.4 ! 103 2.4 ! 103 1.9 ! 103 1.8 ! 103
nFn ! 1012 4.5 3.2 2.5 2.4
7260 Langmuir, Vol. 24, No. 14, 2008 Belegrinou et al.

in turn reduces the adsorbable amount of Fn at this pH. This isprobably the reason why more Fn can adsorb at higher pH values.
A closer look at Figure 6 shows that the dissipation increasesas the frequency decreases. The smaller frequency shifts at lowerpH values are accompanied by smaller dissipation shifts, and theD-f plots show a linear behavior for all pH values (Figure 6c).This indicates that the adsorption process does not change underthese conditions.
In summary, the PEO-like coatings exhibit repulsive propertiestoward BSA, lysozyme, and lactoferrin. Adsorption of theadhesive fibronectin on PEO was detected (!f # 4 Hz) but toa much lesser extent than on PAA (!f # 100-200 Hz).
ConclusionsIn this study we investigated the pH-dependent adsorption of
proteins on plasma polymerized PAA and PEO coatings usingthe QCM-D technique. In parallel, the !-potential of the twotypes of coatings was determined as a function of the pH.Simultaneous monitoring of frequency and dissipation change
during the QCM-D measurements provided information aboutthe adsorbed mass and possible structural changes in the adsorbedprotein films. Under most experimental conditions, different stagesof protein adsorption processes could be distinguished. Theinvestigated proteins bovine serum albumin, lysozyme, lactoferrin,and fibronectin, different in molecular weight and pI, generallyexhibited a rapid initial adsorption phase on PAA, often followedby slower processes.
Distinct adsorption regimes were also revealed in the D-fplots, where adsorption phases with different increase of thedissipation per added mass indicated different structural filmproperties in the individual adsorption stages. Further, theevaluation of the adsorption kinetics revealed kinetically differentadsorption stages, whereas the number of these stages sometimesdiverged from the (structurally) different phases, as revealed bythe D-f plots.
It was found that BSA, Lys, Lf, and Fn adsorb readily on PAAbut the adsorption process strongly depends on the properties ofthe individual proteins. On the basis of our results and on previousstudies by other groups on the properties of these proteins andtheir interaction with surfaces, the results are consistent with thefollowing, more detailed scenario: For BSA, steric restrictionslimit the adsorption at pH 4, where the molecules tend to spreadon the surface. At pH 5.5-7, the formation of compact layersis possible, due to the compact shape of BSA and weakelectrostatic BSA-surface and intermolecular interactions. AtpH 8.5 stronger electrostatic repulsion lowers the adsorbableamount of BSA. For Lys, electrostatic protein-surface interactionis dominant at pH 4-8.5, due to the high pI of Lys. Due to thesmall electric dipole of Lys, there is no need for rearrangementupon interaction with the PAA surface, which leads to fastadsorption. At higher coverage electrostatic intermolecularrepulsion weakens the binding to the surface and leads to partiallyreversible adsorption. For Lf strong intermolecular interactionleads to aggregates (“droplets”) on the surface at pH 5.5-8.5,while at pH 4 the stronger Lf-surface interaction prevents theformation of aggregates. At pH 5.5-8.5 Fn initially adsorbs ina nondense layer, adopting various conformations. With increasingcoverage, rearrangement takes place, and at highest coveragedenaturation on PAA is prevented and Fn adopts its most compactform. In this pH region, electrostatic forces are not dominant.At pH 4 Fn has the unfolded conformation already in solutionand also adsorbs in that shape. Most probably this enables theformation of fibrils due to the exposure of self-associationdomains, which allows continuous attachment of Fn moleculeswithout saturation.
The ability of PEO-like films deposited by plasma-assistedCVD to prevent the adsorption of proteins is again evident fromthis study. Only Fn, the largest protein, was found to adsorb onthe PEO surface to a very limited extent.
Acknowledgment. This work was supported by the JRC Action“NanoBiotechnology for Health”.
LA8003454
Figure 6. !f (a) and !D (b) vs time plot for the adsorption of fibronectinon PEO-like film. Black, data for pH 4; red, pH 5.5; blue, pH 7; green,pH 8.5. (c) !D vs !f plot obtained from these data.
pH-Dependent Immobilization of Proteins Langmuir, Vol. 24, No. 14, 2008 7261