pet/ct artifacts
TRANSCRIPT

(2011) 49–63
Clinical Imaging 35PET/CT artifacts☆,☆☆
Todd M. Blodgetta,⁎, Ajeet S. Mehtaa, Amar S. Mehtaa, Charles M. Laymona,Jonathan Carneya, David W. Townsendb
aDepartment of Radiology, University of Pittsburgh, PA, USAbSingapore Bioimaging Consortium, Singapore 138667
Received 10 December 2009; accepted 21 February 2010
Abstract
There are several artifacts encountered in positron emission tomography/computed tomographic (PET/CT) imaging, including attenuationcorrection (AC) artifacts associated with using CT for AC. Several artifacts can mimic a 2-deoxy-2-[18F] fluoro-D-glucose (FDG) avidmalignant lesions and therefore recognition of these artifacts is clinically relevant. Our goal was to identify and characterize these artifactsand also discuss some protocol variables that may affect image quality in PET/CT.© 2011 Elsevier Inc. All rights reserved.
Keywords: PET/CT; Artifact; Attenuation correction; Image quality; Protocol variable
1. Introduction
There are several artifacts inherent to 2-deoxy-2-[18F]fluoro-D-glucose (FDG) positron emission tomography(PET) imaging that have been reported in the literature,including photopenic areas due to metallic devices or otherhigh attenuation materials [1,2]. There are several PET/computed tomographic (CT) artifacts as well; however, theirappearances are different from those seen on dedicated PETscanners, and there are a number of new artifacts that areunique to combined PET/CT scanners. Most of these uniqueartifacts are generated by the CT-based attenuation correc-tion (AC) protocol that is currently in use in most PET/CTscanners. This article will discuss the most common typicaland atypical appearances of artifacts encountered in PET/CTimaging and some potential solutions to avoid or correctthem. In addition, it will also include a discussion of the mostcommon non-AC-related PET/CT artifacts.
☆ Work for this article was performed at: Hillman Cancer Center,UPMC Department of Radiology.
☆☆ Funding received: NIH Grant Number R21 EB002622, NationalCancer Institute Grant Number P30 CA47904.
⁎ Corresponding author. Hillman Cancer Center, UPMC Department ofRadiology, 5115 Centre Ave., Pittsburgh, PA, 15232, USA. Tel.: +1 412680 0581.
E-mail address: [email protected] (T.M. Blodgett).
0899-7071/$ – see front matter © 2011 Elsevier Inc. All rights reserved.doi:10.1016/j.clinimag.2010.03.001
2. CT attenuation-correction and related artifacts
There are several AC methods for PET and PET/CTscanners [3–6]. One of the advantages of using PET/CT isthat the AC is easily performed using the CT portion of theexam, rather than having to perform a separate transmissionscan, which is necessary to perform AC on dedicated
Fig. 1. Current CT based attenuation correction algorithm: The transforma-tions in current CT-based attenuation correction algorithms used to convertHU into 511 keV linear attenuation values for attenuation correction in PET.The threshold model (solid line) is described in [5] and the mixing model(dashed line) is described in [6]. Both perform well in transforming bone andsoft tissue values.

50 T.M. Blodgett et al. / Clinical Imaging 35 (2011) 49–63
PET systems. Using CT for AC thus permits a significantreduction in the amount of time it takes to complete an exam.Although counterintuitive, it may take up to 40% less time tocomplete a whole body PET/CT scan than it does tocomplete a dedicated PET study. Furthermore, Halpern et al.have described a weight-based protocol, in whom patientsbelow 59 kg can be scanned in approximately 7 min (1 minfor CT and 6 for PET using 6 bed positions at 1 min perbed position) without any diagnostic compromise (usinglutetium oxyorthosilicate crystal technology) [7].
However, when using CT-based AC, the measured CTHounsfield units (HU), related to the linear attenuation seen
Fig. 2. Linear IV contrast AC artifact: coronal PET image (A) shows a focal area ofnode (arrow). Inspection of the axial CT, fused PET/CT and AC PET images (B–contrast in the left subclavian vein (arrows). The non-AC PET image (E) proves thPET/CT fused images.
by the X-ray beam, must be transformed into thecorresponding quantity at the higher PET photon energy of511 keV. Most current CT-based AC algorithms eithersegment image pixels into soft tissue or bone based on theHU and transform those tissues using unique scale factors[5], or treat image pixels as a mixture of two well-definedmaterials and transform them accordingly (Fig. 1) [6]. TheseAC algorithmswork well for most applications in the majorityof patients. However, these algorithms tend to overcorrectobjects, including contrast agents, chemotherapy ports andother dense structures that have higher HU but are not truebone pixels. Many of the AC artifacts encountered are
apparent FDG uptake in the left axilla that would be suspicious for a lymphD) show that the area of FDG activity to be linear and in the area of the IVat the apparent FDG activity is an AC artifact only seen on AC PET and AC
51T.M. Blodgett et al. / Clinical Imaging 35 (2011) 49–63
typically readily appreciated by the experienced reader;however, occasionally, these artifacts can have atypicalappearances leading to a more challenging interpretation [8].
3. Intravenous contrast and AC artifacts
There are three primary ways to perform the CT portion ofa combined PET/CT examination. It can be done with: (1)
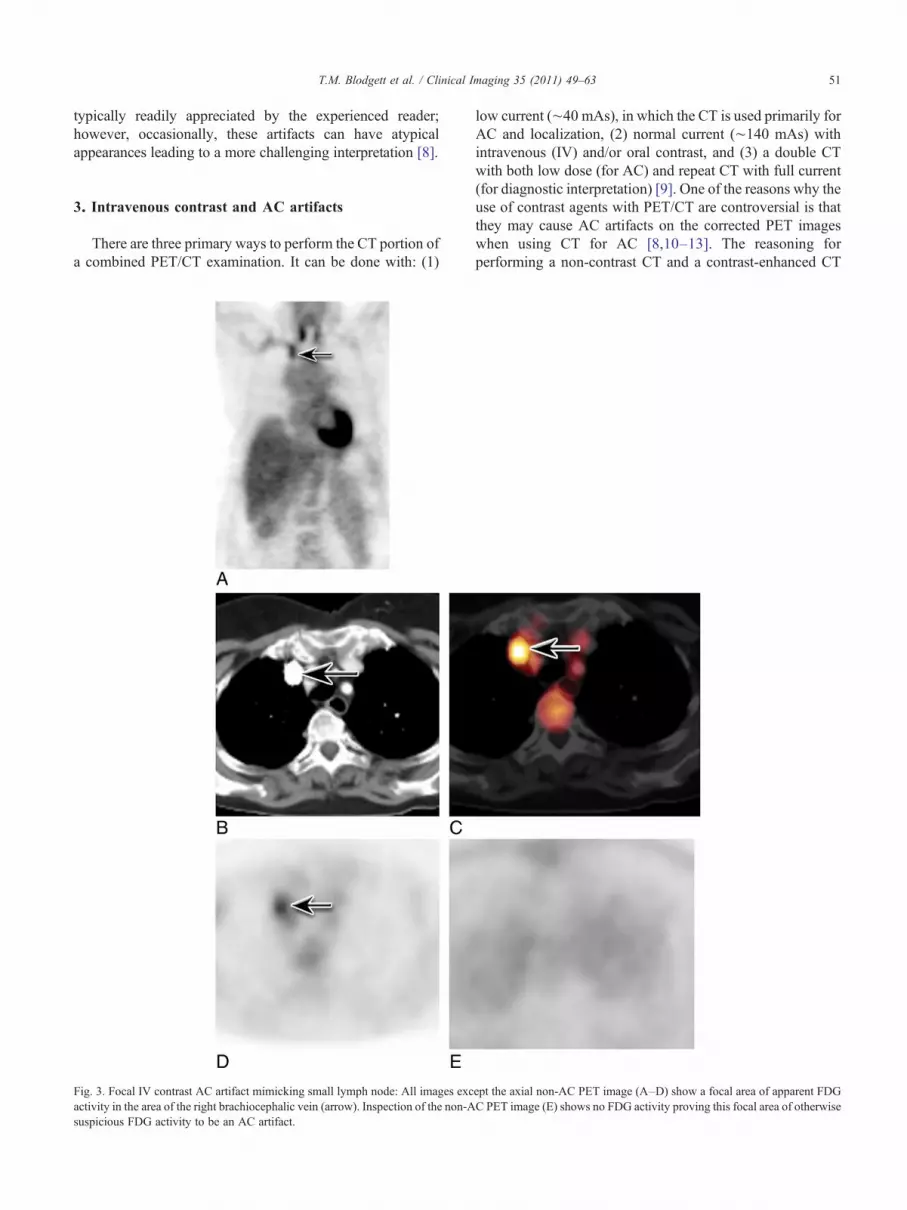
Fig. 3. Focal IV contrast AC artifact mimicking small lymph node: All images excactivity in the area of the right brachiocephalic vein (arrow). Inspection of the non-Asuspicious FDG activity to be an AC artifact.
low current (∼40 mAs), in which the CT is used primarily forAC and localization, (2) normal current (∼140 mAs) withintravenous (IV) and/or oral contrast, and (3) a double CTwith both low dose (for AC) and repeat CT with full current(for diagnostic interpretation) [9]. One of the reasons why theuse of contrast agents with PET/CT are controversial is thatthey may cause AC artifacts on the corrected PET imageswhen using CT for AC [8,10–13]. The reasoning forperforming a non-contrast CT and a contrast-enhanced CT
ept the axial non-AC PET image (A–D) show a focal area of apparent FDGC PET image (E) shows no FDG activity proving this focal area of otherwise

52 T.M. Blodgett et al. / Clinical Imaging 35 (2011) 49–63
(in Method 3 above) is to avoid many of the artifactssecondary to IV and oral contrast. When dense contrastmaterial is present in venous structures during the CTacquisition, there tends to be an overcorrection of the PETdata. This mismatch causes areas of linear artifact (mimickingintense FDG accumulations) on the AC PET images (Fig. 2)[14]. Occasionally, these artifacts are clinically significantwhen they are in the vicinity of a real lesion. Atypically, thisartifact can appear focal and mimic a metastatic lymph nodein the axilla or supraclavicular area (Fig. 3) [8]. For instance, asmall malignant lymph node or small soft-tissue abnormalitycan lie within or directly adjacent to a contrast artifact,partially or completely obscuring the abnormality [14]. Inaddition, artifacts can have atypical appearances that canconfound image interpretation (Fig. 4). A relatively simplesolution to diagnostic uncertainty regarding the presence of aCT-based AC artifact is to inspect the non-AC PET images.
Fig. 4. Focal IV contrast AC artifact mimicking nodal spread: coronal PET imagprimary squamous cell carcinoma of the larynx (arrowhead). Axial CT and fused PEto correlate to part of an area of IV contrast in the left subclavian area (arrow). AlthPET image (E) shows no FDG activity in this area compatible with a focal IV co
Unfortunately, it can be cumbersome to switch between theAC and non-AC PET data using many PET/CT viewingsystems; and some fusion viewing systems will not allowside-by-side comparison of AC and non-AC PET images.
One way to avoid CT-based AC artifacts due to IVcontrast is to perform a low dose non-contrast CT that can beused for AC first. Then, following the PET portion of theexam, a contrast-enhanced CT can be done for diagnosticpurposes. However, depending on the CT parameters used,this dual-CT approach usually results in an increase in theradiation exposure to the patient [15].
In summary, there is no “right” way to perform the CTportion of a PET/CT scan. Whether to give contrast will alsodepend in large part on the clinical indication, as well as onadequate physician and technologist coverage. Another issueto consider is whether the patient will be billed for the CTportion of the exam. However, pitfalls associated with IV
e (A) shows apparent nodal spread (arrows) adjacent to and to the left of aT/CT images (B and C) show the apparent focal area of intense FDG uptakeough there is apparent FDG activity on the AC PET image (D), the non-ACntrast AC artifact.

Fig. 5. Two focal oral contrast AC artifacts: axial CT (A and D), fused PET/CT with AC PET (B and E), and fused PET/CT with non-AC PET (C and F)images show two areas of dense contrast remaining in the bowel after an upper gastrointestinal study performed with barium (arrows). The fused PET/CTwith non-AC PET shows no FDG activity in the artifactual areas that appear to have very intense FDG uptake on the fused PET/CT with AC PET. This is agood example of an oral contrast AC artifact.
53T.M. Blodgett et al. / Clinical Imaging 35 (2011) 49–63
contrast AC artifacts can be minimized either by inspectionof the non-AC PET images and/or by adding a non-contrastCT for AC.
A software solution with a new CT-based AC algorithmthat does not generate artifacts is certainly the mostappealing solution for AC artifacts. A possible approach tothis problem presents itself by noting that the use of an ACwith inaccuracies results in an image set (attenuation andemission image) that is less consistent with the measuredsinogram than is the image set obtained with the correctattenuation. Efforts to exploit this consistency difference arebeing investigated. In one method, artifact identification andcorrection algorithms based on the likelihood function, a
function of the image set values and the measured sinogram,are used. A second, related method is also being studied inwhich identification and correction algorithms are based on acalculation of the internal consistency of the attenuation-corrected sinogram. This work is at an early stage ofdevelopment but has shown promising results. Thesemethods could be used in conjunction with other methodsfor artifact correction.
4. Oral contrast and AC artifacts
Several oral contrast agents are available for clinical usein diagnostic imaging. In general, barium or iodine-based

Fig. 6. Modified AC algorithm: depiction of a software-based modified ACalgorithm applied to oral-contrast enhanced studies. True bone voxels in theCT images are segmented from oral-contrast enhanced voxels using aregion-growing algorithm, followed by the replacement of the enhancedvoxels with the HU for water. Finally, the modified CT images can then betransformed in the usual way appropriate for bone and soft tissue (e.g., usingone of the methods in Fig. 1).
Fig. 7. Oral contrast AC artifact: coronal CT image showing an area of highattenuation material in the stomach (arrow, close to ∼3000 HU). Non-ACcoronal PET image shows no significant activity (arrow). Using the standardAC algorithm, there is a focal area of apparent FDG activity correspondingto the area of high attenuation material (AC, arrow). Using the modified ACalgorithm of Fig. 6, this area is correctly displayed without focal FDGactivity (modified AC).
54 T.M. Blodgett et al. / Clinical Imaging 35 (2011) 49–63
oral contrast agents that are highly attenuating at CT energieswill tend to cause some degree of AC artifact on the PETimages, while negative or water-based oral contrast agentsgenerally do not [16–22]. Most of the time, there is overlapof physiologic and artifactual bowel activity, and as long asthe appearance of bowel activity is linear, it typically is oflimited clinical importance. However, when the oral contrastAC artifacts are more focal or irregular, they can be adiagnostic challenge. It is imperative to check the non-ACPET images in these instances to be sure that a suspectedlesion is not an AC artifact (Fig. 5).
A study from Essen, Germany, has reported that the use oforal contrast media does not usually cause clinicallysignificant AC artifacts [22]; however, it has also beennoted by a different group that areas of barium-based oralcontrast material within the bowel can cause artifacts andoverestimate FDG activity in the bowel by as much as 20%[22,23]. In the case of oral contrast agent, adopting a regiongrowing approach appears to correct most, if not all CT-basedAC artifacts (Figs. 6, 7). However, no PET/CT scanners todate use this alternative method of AC. Another approach isto transform all higher HU as if they were enhanced due tocontrast agents, although this approach is necessarily acompromise as values corresponding to bone will betransformed incorrectly, and it is not always clear forenhanced structures what the HU would be in the absenceof enhancement.
There remains some debate about the added clinical valueof oral contrast with PET/CT given the additional informa-tion that is obtained by having FDG from the PET portion of
the exam. However, when there are focal or irregularly-shaped areas of FDG uptake in the abdomen adjacent to aloop of bowel, having well-opacified bowel may be essentialfor differentiating physiologic from pathologic uptake. Itmay be helpful to create contrast protocols based onindications, where patients being evaluated for head andneck cancer and other malignancies in which the incidence ofabdominal and pelvic metastases is less would be donewithout oral contrast, while any patient being evaluated foran abdominopelvic malignancy would be given oral contrast.
5. Ports and other high attenuation devices
Metallic objects, including various orthopedic devicesand chemotherapy ports typically cause areas of photopeniaon images obtained on a dedicated PET scanner. Whencorrecting for attenuation with Germanium or other pointsources, these areas remain photopenic on the AC images. Incontrast, when using the current CT-based AC algorithms,these areas usually demonstrate falsely elevated FDG uptake(Fig. 8) [13,24–26]. It is usually easy to correlate the area ofapparent FDG uptake with the metallic device on PET/CT byinspecting the fused PET/CT images. However, clinicallyrelevant lesions adjacent to a port or metallic device can bemore difficult to detect. Also, increased uptake aroundprosthetic devices on PET/CT due to small amounts ofpatient movement between the CT and PET portions of theexam can easily be misinterpreted as infection or loosening(Fig. 9) [26].

Fig. 8. CT AC artifact from port: coronal PET, axial CT and fused PET/CT images (A–C) show a focal area of intense FDG accumulation (arrows) that appears tocorrelate to the area of a chemotherapy port in the right upper chest wall. Although present on the axial AC PET image (D), the non-AC image (E) showscorrectly that this area is an AC artifact due to the high attenuation composition of the material in the port.
55T.M. Blodgett et al. / Clinical Imaging 35 (2011) 49–63
In addition, some dental implants or fillings can alsocause an AC artifact and can severely confound imageinterpretation by obscuring real lesions or creating apparentlesions (artifacts) in patients with head and neck malignan-cies involving the oral cavity or tonsils (Fig. 10) [13,24].
6. Calcified lymph nodes and ac artifacts
Perhaps the most clinically significant but underreportedCT-based AC artifacts are ones caused by calcified lymphnodes (Fig. 11). This is particularly true, for example, in apatient who is being evaluated for lung cancer and has falselyelevated uptake of FDG in a normal calcified lymph node. Ina patient with a right-sided primary squamous-cell carcinomaof the lung and a single contralateral calcified paratracheallymph nodewith falsely elevated FDG uptake, this could lead
to nonsurgical management (Stage IIIB) if the artifact is notsuspected. A high degree of clinical suspicion should bemaintained when calcified lymph nodes are seen on the CTportion of the exam, because unlike many other AC artifacts(e.g., IV contrast), these have more focal configurations(rather than linear) of apparent FDG uptake. However, aswith the other AC artifacts, it is relatively easy to prove thepresence of an AC artifact caused by a calcified lymph nodeby careful inspection of the non-AC PET images (as long as itis suspected).
7. Diaphragmatic respiratory artifacts
Non-AC-based artifacts specific to PET/CT imaging havealso been observed. Diaphragmatic motion during the CTacquisition can cause large portions of the liver to appear

Fig. 9. Orthopedic device causing AC artifact: coronal PET (A) demonstrates apparent areas of intense FDG uptake (arrows) that correlate to a metallic left hipprosthesis on CT and fused PET/CT images (B–C). AC PET (D) shows a focal area of apparent FDG activity lateral to the prosthesis, but inspection of the non-AC image (E) shows the area in question to be an AC artifact. This could easily be mistaken as inflammation, loosening or infection around the prosthesis.
56 T.M. Blodgett et al. / Clinical Imaging 35 (2011) 49–63
displaced to the thorax (Fig. 12) [27–30]. Because CT istypically acquired with deep inspiration and PET is typicallyacquired during tidal respiration, there is an inherentmismatch in the diaphragmatic position, which is most severewhen the patient is instructed to hold their breath in deepinspiration. The magnitude of these diaphragmatic breathingartifacts is dependent on how long it takes to acquire the datain this region as well as the breathing instructions given to thepatient. Therefore, with single and dual-slice CT scanners,this artifact is seen in up to 80% of patients when the CT datais acquired with tidal breathing [29,31]. This number is muchless with 16-slice CT scanners where the data acquisition time
is significantly reduced. Another way to reduce breathingartifacts is to use a modified breathing algorithm as describedby Beyer et al. [29]. This algorithm involves instructing thepatient to breathe with shallow tidal respiration until thedetector is near the bottom of the thorax, at which time thepatient is instructed to stop breathing wherever they are intheir respiratory cycle until the detector has passed throughthe liver. Breath-holding until the CT detectors are throughthe liver minimizes respiratory motion and thus reducessubsequent diaphragmatic breathing artifacts.
These diaphragmatic artifacts are the most clinicallysignificant when there are lesions in the superior liver or in

Fig. 10. Dental hardware AC artifact: coronal PET (A) demonstrates areas of intense FDG accumulation in the area of the oral cavity (arrow). Axial CT and fusedPET/CT with AC PET (B and C) show the apparent uptake to correlate to areas of streak artifact on CT from dental fillings. Non-AC PET (D) shows areas ofphotopenia proving these areas on the attenuation corrected coronal PET to be an artifact generated during the attenuation correction process.
57T.M. Blodgett et al. / Clinical Imaging 35 (2011) 49–63
the lower thorax. Often lesions in these areas will beimproperly displaced on one modality to the wrong locationor even to the wrong organ, which can lead to misdiagnosis[32]. Radiotherapy applications also become significantlymore difficult because of the mismatch in the anatomicalstructures. Some groups have begun work evaluatingrespiratory and cardiac gating for radiation purposes toreduce the amount of normal tissue exposure and improvethe accuracy of radiation delivery to the affected areas [33].
Breathing artifacts can also be clinically significant if theyobscure, either wholly or partially, a lesion that could bemisconstrued as simply artifact (Fig. 13). Many of theselesions within or adjacent to an artifact can easily be
overlooked without systematic inspection of the non-ACPET images on every patient where an artifact is suspected.
8. Other variables affecting image quality
8.1. Lymphangiogram effect
The FDG used for PET studies is injected intravenouslyinto patients. Occasionally, a portion or the entire dose maybe infiltrated accidentally into the subcutaneous tissues.When this occurs, FDG may be taken up into the lymphaticsystem. This can be problematic because it can cause
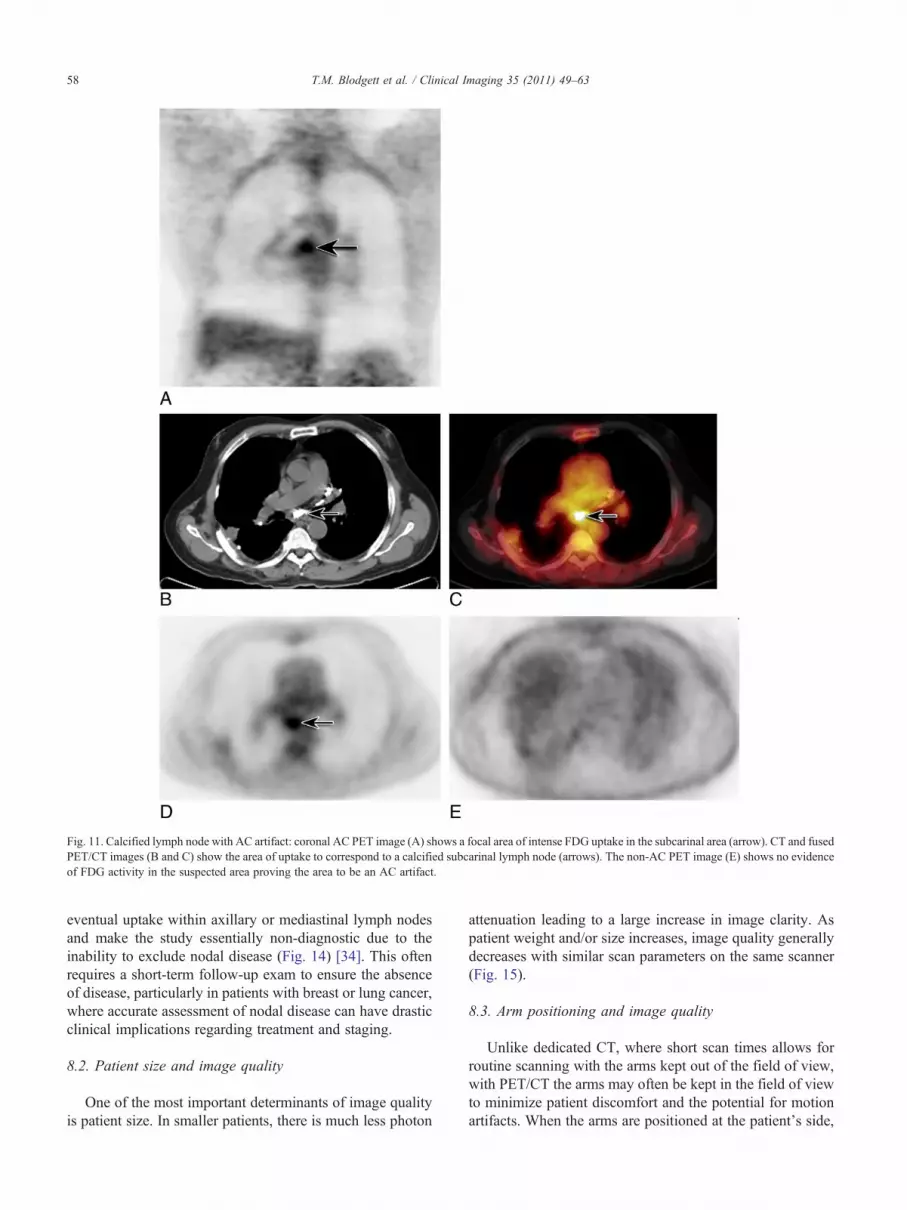
Fig. 11. Calcified lymph node with AC artifact: coronal AC PET image (A) shows a focal area of intense FDG uptake in the subcarinal area (arrow). CT and fusedPET/CT images (B and C) show the area of uptake to correspond to a calcified subcarinal lymph node (arrows). The non-AC PET image (E) shows no evidenceof FDG activity in the suspected area proving the area to be an AC artifact.
58 T.M. Blodgett et al. / Clinical Imaging 35 (2011) 49–63
eventual uptake within axillary or mediastinal lymph nodesand make the study essentially non-diagnostic due to theinability to exclude nodal disease (Fig. 14) [34]. This oftenrequires a short-term follow-up exam to ensure the absenceof disease, particularly in patients with breast or lung cancer,where accurate assessment of nodal disease can have drasticclinical implications regarding treatment and staging.
8.2. Patient size and image quality
One of the most important determinants of image qualityis patient size. In smaller patients, there is much less photon
attenuation leading to a large increase in image clarity. Aspatient weight and/or size increases, image quality generallydecreases with similar scan parameters on the same scanner(Fig. 15).
8.3. Arm positioning and image quality
Unlike dedicated CT, where short scan times allows forroutine scanning with the arms kept out of the field of view,with PET/CT the arms may often be kept in the field of viewto minimize patient discomfort and the potential for motionartifacts. When the arms are positioned at the patient's side,

Fig. 12. Respiratory diaphragmatic artifact: coronal PET, CT and PET/CT images (A–D) show severe displacement and apparent detachment of a large portionof the liver (arrows) from using tidal respiration breathing protocol during the CT acquisition.
Fig. 13. Focal bronchioloalveolar cell carcinoma adjacent to breathing artifact: coronal PET, CT and fused PET/CT images and axial fused PET/CT image (A–D)from a combined PET/CT exam show an area of FDG uptake (arrows) adjacent to a small diaphragmatic breathing artifact in which the top of the liver appears tobe displaced into the thorax. Although easily overlooked because of its proximity to the artifact, this abnormality was eventually biopsied because it did notresolve over time. The biopsy was positive for bronchioloalveloar cell carcinoma.
59T.M. Blodgett et al. / Clinical Imaging 35 (2011) 49–63

Fig. 14. Lymphangiogram effect: coronal PET images (A–C) show infiltration of FDG dose in the left forearm and subsequent uptake into the lymphatics(arrows) as well as several axillary and mediastinal lymph nodes (arrowhead). Although the FDG activity in the nodes was secondary to the infiltrated dose, thepatient was brought back for a repeat scan 2 weeks later because of the inability to differentiate between FDG taken up by the lymphatics versus malignant lymphnodes. The follow-up scan was negative.
60 T.M. Blodgett et al. / Clinical Imaging 35 (2011) 49–63
there can be significant beam hardening and streak artifacts inthe CT images (Fig. 16), which can be especially problematicwhen the artifact overlaps with the area of interest. Onepotential solution is to scan all patients with arms up, therebyexcluding such artifact from the chest and abdomen. Inpatients with head and neck malignancies or clinical concernof neck involvement, a second focused exam of the neck canbe performed with the arms down if there is artifact in theneck area with the arms in the up position.
8.4. Glucose, insulin and image quality
Diabetic patients and other patients with conditionscausing temporarily elevated blood glucose levels are a
Fig. 15. Effect of patient size on image quality: coronal PET images (A–C) from thrpatient weighing 142 kg (cC) compared to patients weighing 61 (A) and 103 (B)
challenge for physicians referring or interpreting PET orPET/CT scans. Because FDG competes with glucose forintracellular entry, when blood glucose levels are elevated,less FDG enters cells and more is excreted in the urine.Therefore, in general, as blood glucose levels increase,image quality decreases. It may seem logical, then, thatgiving insulin to reduce blood glucose levels prior to FDGinjection may improve image quality. However, insulin notonly facilitates glucose entry into cells, it also facilitatesFDG entry into adipose and muscle cells preferentially(Fig. 17). This can cause diffuse linear FDG uptake withinskeletal muscle and make identification of a lesion that maybe located next to muscle difficult to visualize. Unfortunate-ly, there is no good way to quickly reduce glucose levels and
ee patients of varying weight shows severe degradation of image quality in akg acquired with similar imaging protocols and on the same scanner.

Fig. 16. Effect of arm positioning on image quality: coronal (B and D) and axial (A and C) CT images in the same patient with arms up and arms down showsignificant beam hardening artifact and image quality degradation with arms up compared to that of arms down.
61T.M. Blodgett et al. / Clinical Imaging 35 (2011) 49–63
typically good-quality FDG PET and PET/CT scans rely ongood glucose management prior to being scanned.
9. Conclusion
There are several artifacts unique to combined PET/CTimaging, including AC-based artifacts as well as protocol-based artifacts. For the experienced reader, many typicalappearances of these artifacts will not be clinicallysignificant. However, atypical patterns of artifacts even forthe experienced reader can be challenging. For theinexperienced reader, it is imperative to become familiarwith the common and atypical appearances of the most
common artifacts and be diligent about inspecting the non-AC PET images when an AC artifact is suspected.
References
[1] Cook GJ, Fogelman I, Maisey MN. Normal physiological and benignpathological variants of 18-fluoro-2-deoxyglucose positron-emissiontomography scanning: potential for error in interpretation. Semin NuclMed 1996;26:308–14.
[2] Puthenpurayil K, Blodgett TM, Meltzer CC. Photopenic defects inFDG PET scanning. AUR2002, 2002.
[3] Carney JP, Towsend DW. CT-based attenuation correction for PET-CT scanners. In: von Schultess G, editor. Clinical PET, PET-CT andSPECT/CT: combined anatomic-molecular imaging. Lippincott:Williams and Wilkins, 2003. p. 46–58.

Fig. 17. Glucose, insulin and image quality: coronal PET/CT (A) and axialCT and fused PET/CT (B and C) images in a patient with an elevated bloodglucose level who was given IV insulin in an attempt to bring blood glucoselevels down. Note the multiple linear areas of intense FDG accumulationcorresponding to areas of muscle (arrows). This is because insulin has thesame effect on FDG that it does on glucose; it facilitates the entry of bothinto muscle and fat cells.
62 T.M. Blodgett et al. / Clinical Imaging 35 (2011) 49–63
[4] Kotzerke J, Guhlmann A, Moog F, Frickhofen N, Reske SN. Role ofattenuation correction for fluorine-18 fluorodeoxyglucose positronemission tomography in the primary staging of malignant lymphoma.Eur J Nucl Med 1999;26:31–8.
[5] Kinahan PE, Townsend DW, Beyer T, Sashin D. Attenuationcorrection for a combined 3D PET/CT scanner. Med Phys 1998;25:2046–53.
[6] Burger C, Goerres G, Schoenes S, Buck A, Lonn AH, Von SchulthessGK. PET attenuation coefficients from CT images: experimentalevaluation of the transformation of CT into PET 511-keV attenuationcoefficients. Eur J Nucl Med Mol Imaging 2002;29:922–7.
[7] Halpern BS, Dahlbom M, Quon A, Schiepers C, Waldherr C,Silverman DH, et al. Impact of patient weight and emission scanduration on PET/CT image quality and lesion detectability. J Nucl Med2004;45:797–801.
[8] Antoch G, Freudenberg LS, Egelhof T, Stattaus J, Jentzen W, DebatinJF, et al. Focal tracer uptake: a potential artifact in contrast-enhanceddual-modality PET/CT scans. J Nucl Med 2002;43:1339–42.
[9] Beyer T, Antoch G, Muller S, Egelhof T, Freudenberg LS, Debatin J,et al. Acquisition protocol considerations for combined PET/CTimaging. J Nucl Med 2004;45(Suppl 1):25S–35S.
[10] Yau YY, Chan WS, Tam YM, Vernon P, Wong S, Coel M, et al.Application of intravenous contrast in PET/CT: does it reallyintroduce significant attenuation correction error? J Nucl Med 2005;46:283–91.
[11] Beyer T, Antoch G, Bockisch A, Stattaus J. Optimized intravenouscontrast administration for diagnostic whole-body 18F-FDG PET/CT.J Nucl Med 2005;46:429–35.
[12] Ravizzini G, Nguyen M, Schuster DM, Halkar RK. Central lineinjection artifact simulating paratracheal adenopathy on FDG PETimaging. Clin Nucl Med 2004;29:735–7.
[13] Goerres GW, Hany TF, Kamel E, von Schulthess GK, Buck A. Headand neck imaging with PET and PET/CT: artefacts from dental metallicimplants. Eur J Nucl Med Mol Imaging 2002;29:367–70.
[14] Blodgett TM, Fukui MB, Snyderman CH, Branstetter BF, McCookBM, Townsend DW, et al. Combined PET-CT in the head and neck:part 1. Physiologic, altered physiologic, and artifactual FDG uptake.Radiographics 2005;25:897–912.
[15] Brix G, Lechel U, Glatting G, Ziegler SI, Munzing W, Muller SP, et al.Radiation exposure of patients undergoing whole-body dual-modality18F-FDG PET/CT examinations. J Nucl Med 2005;46:608–13.
[16] Bockisch A, Beyer T, Antoch G, Freudenberg LS, Kuhl H, Debatin JF,et al. Positron emission tomography/computed tomography —imaging protocols, artifacts, and pitfalls. Mol Imaging Biol 2004;6:188–99.
[17] Antoch G, Kuehl H, Kanja J, Lauenstein TC, Schneemann H, Hauth E,et al. Dual-modality PET/CT scanning with negative oral contrastagent to avoid artifacts: introduction and evaluation. Radiology 2004;230:879–85.
[18] Nehmeh SA, Erdi YE, Kalaigian H, Kolbert KS, Pan T, Yeung H, et al.Correction for oral contrast artifacts in CT attenuation-corrected PETimages obtained by combined PET/CT. J Nucl Med 2003;44:1940–4.
[19] Cohade C, Wahl RL. Applications of positron emission tomography/computed tomography image fusion in clinical positron emissiontomography — clinical use, interpretation methods, diagnosticimprovements. Semin Nucl Med 2003;33:228–37.
[20] Visvikis D, Costa DC, Croasdale I, Lonn AH, Bomanji J, Gacinovic S,et al. CT-based attenuation correction in the calculation of semi-quantitative indices of [18F]FDG uptake in PET. Eur J Nucl Med MolImaging 2003;30:344–53.
[21] Cohade C, Osman M, Nakamoto Y, Marshall LT, Links JM, FishmanEK, et al. Initial experience with oral contrast in PET/CT: phantom andclinical studies. J Nucl Med 2003;44:412–6.
[22] Dizendorf EV, Treyer V, Von Schulthess GK, Hany TF. Application oforal contrast media in coregistered positron emission tomography-CT.AJR Am J Roentgenol 2002;179:477–81.
[23] Carney JP, Beyer T, Brasse D, Yap JT, Townsend DW. Clinical PET/CT scanning using oral CT contrast agents. J Nucl Med 2002;45:57.
[24] Kamel EM, Burger C, Buck A, von Schulthess GK, Goerres GW.Impact of metallic dental implants on CT-based attenuation correctionin a combined PET/CT scanner. Eur Radiol 2003;13:724–8.
[25] Goerres GW, Ziegler SI, Burger C, Berthold T, Von Schulthess GK,Buck A. Artifacts at PET and PET/CT caused by metallic hipprosthetic material. Radiology 2003;226:577–84.
[26] Bujenovic S, Mannting F, Chakrabarti R, Ladnier D. Artifactual 2-deoxy-2-[(18)F]fluoro-D-glucose localization surrounding metallicobjects in a PET/CT scanner using CT-based attenuation correction.Mol Imaging Biol 2003;5:20–2.

63T.M. Blodgett et al. / Clinical Imaging 35 (2011) 49–63
[27] de Juan R, Seifert B, Berthold T, von Schulthess GK, Goerres GW.Clinical evaluation of a breathing protocol for PET/CT. Eur Radiol2004;14:1118–23.
[28] Goerres GW, Burger C, Schwitter MR, Heidelberg TN, Seifert B, vonSchulthess GK. PET/CT of the abdomen: optimizing the patientbreathing pattern. Eur Radiol 2003;13:734–9.
[29] Beyer T, Antoch G, Blodgett T, Freudenberg LF, Akhurst T, MuellerS. Dual-modality PET/CT imaging: the effect of respiratory motion oncombined image quality in clinical oncology. Eur J Nucl Med MolImaging 2003;30:588–96.
[30] Osman MM, Cohade C, Nakamoto Y, Wahl RL. Respiratorymotion artifacts on PET emission images obtained using CTattenuation correction on PET-CT. Eur J Nucl Med Mol Imaging2003;30:603–6.
[31] Romer W, Chung M, Chan A, Townsend DW, Torok F, McCook B,et al. Single-detector helical CT in PET-CT: assessment of imagequality. AJR Am J Roentgenol 2004;182:1571–7.
[32] Osman MM, Cohade C, Nakamoto Y, Marshall LT, Leal JP,Wahl RL. Clinically significant inaccurate localization of lesionswith PET/CT: frequency in 300 patients. J Nucl Med 2003;44:240–3.
[33] Townsend DW, Yap JT, Carney JPJ, Long M, Hall NC, Bruckbauer T,Howe WC, Lohmann KA, Smith BC, Bendriem B, Theirfelder C.Respiratory gating with a 16-slice LSO PET-CT scanner. J Nucl Med2004;45:165 (abstract).
[34] Chiang SB, Rebenstock A, Guan L, Burns J, Alavi A, Zhuang H.Potential false-positive FDG PET imaging caused by subcutaneousradiotracer infiltration. Clin Nucl Med 2003;28:786–8.