personalization in future tv - citeseerx
TRANSCRIPT
Personalization in Future TV
Proceedings of the AH’2002 Workshop onWorkshop on Personalization in Future TVMálaga, Spain, May 2002Selected papers
Liliana Ardissono and Anna Buczak (Eds.)
Universidad de Málaga
Departamento de Lenguajes y Cienciasde la Computación

Volume editors
Liliana ArdissonoDipartimento di InformaticaUniversità di TorinoCorso Svizzera 185, I-10149 Torino, Italye-mail: [email protected]
Anna BuczakPhilips Research USA345 Scarborough RdBriarcliff Manor, NY 10510-2099email: [email protected]
© The authors
ISBN: 699-8197-8Depósito Legal: MA-583-2002Impreso en España - Printed in Spain

Table of Contents
Preface
Section 1: Recommender Systems for EPGs
Personalization: Improving Ease-of-Use, Trust and Accuracy of aTV show RecommenderAnna L. Buczak, John Zimmerman and Kaushal Kurapati
A Multi-Agent System for a Personalized Electronic ProgramGuideAngelo Difino, Barbara Negro and Alessandro Chiarotto
Prediction Strategies: Combining Prediction Techniques toOptimize PersonalizationMark van Setten, Mettina Veenstra and Anton Nijholt
Celebrity RecommenderJohn Zimmerman, Lesh Parameswaran and Kaushal Kurapati
Improving the Quality of the Personalized Electronic ProgrammeGuideBarry Smyth, David Wilson and Derry O’ Sullivan
An Agent Based Elelctronic Program GuideGulden Uchyigit and Keith Clark
………………………………………………………………………..
Section 2: Interactive TV
Reality Instant Messenger: the Promise of iTV Delivered TodayMei Chuah
Design of a Personalization Service for an Interactive TVEnvironmentNuno Correia and Marlene Peres
Interactive Documentaries: First Usability StudiesMarianna Nardon, Fabio Pianesi and Massimo Zancanaro

Section 3: Stereotypical Knowledge in TV Services
Speeding up Recommendation SystemsByron Bezerra, Francisco Carvalho, Geber Ramalho and Jean-DanielZucker
Family Stereotyping – A Model to Filter TV Programs for MultipleViewersDina Goren-Bar and Oded Glinansky
TV Personalization through StereotypesKaushal Kurapati and Srinivas Gutta
Delivering Personalized Advertisements in Digital Television: AMethodology and Empirical EvaluationGeorgios Lekakos and George M. Giaglis
………………………………………………………………………..
Section 4: User Interfaces for EPGs
Personal Media Services: A View of Emerging Media ExperiencesAndrew Fano, Anatole Gershman and Christopher Chung
Personalized Contents Guide and Browsing Based on UserPreferenceHee-Kyung Lee, Han-Kyu Lee, Jeho Nam, Beetnara Bae, MunchurlKim, Kyeongok Kang and Jinwoong Kim
Time-Pillars: a 3D Cooperative Paradigm for the TV DomainFabio Pittarello
TV Scout: Guiding Users from Printed TV Program Guides toPersonalized TV RecommendationPatrick Baudisch and Lars Brueckner
Evolving the Personalized EPG – An Alternative Architecture forthe Delivery of DTV ServicesBarry Smyth, Paul Cotter and James Ryan
Real Time Television Content Platform: PersonalizedProgramming Over Existing Broadcast InfrastructuresKelly Dempsky

Preface
The first edition of the Personalization in Future TV workshop (TV'01) wasorganized in Sonthofen, Germany, in 2001, as a forum in which researchers fromdiverse areas such as machine learning, knowledge engineering, cognitive sciences,adaptive user interfaces, and business intelligence could share their experiences in thedesign, development and exploitation of user interfaces for future TV services. TheTV'01 workshop attracted the attention of academic and industrial researchers andprovided an excellent overview of the on-going international work in the area ofdigital TV.
The Second Workshop on Personalization in Future TV, to be held in Malagawithin the 2nd International Conference on Adaptive Hypermedia and Adaptive WebBased Systems, presents an interesting overview of the evolution of the internationalresearch carried on during the last year in the Interactive TV area. Moreover, itincludes some visions suggesting challenging topics to be addressed in the futureresearch.
This volume includes the contributions that will be presented at the TV'02workshop. We received 25 papers, each paper was reviewed by two senior researchersin the field, 19 papers were accepted and after being revised by the authors wereincluded in these Proceedings. The papers represent current academic and industrialwork in the Interactive TV area and cover a broad list of topics including theexploitation of user modeling techniques to enhance the recommendation of TVevents in Electronic Program Guides (EPGs), the organization of EPGs and theiradaptive (or adaptable) presentation, personalized advertising, architectures forpersonalized EPGs, interactive TV, the future of TV in ubiquitous environments andthe provision of new tools for producing TV services.
We hope that this workshop will generate interesting discussions and will give youthe inspiration for new research directions.
Finally, we want to thank Yassine Faihe, who co-organized the TV'01 workshopand actively contributed to the organization of TV'02.
Liliana Ardissono and Anna L. BuczakMalaga, May 28, 2002.


Section 1: RecommenderSystems for EPGs


Personalization: Improving Ease-of-Use, Trust andAccuracy of a TV Show Recommender
Anna L. Buczak, John Zimmerman, Kaushal Kurapati
Philips Research USA345 Scarborough Rd.
Briarcliff Manor, NY 10510(anna.buczak, john.zimmerman, kaushal.kurapati)@philips.com
tel. 914-945-6169
Abstract. The plethora of content available to TV viewers has becomeoverwhelming creating a need to help the viewers to find the programs that arethe most interesting for them to watch. Towards this end we are developing apersonalization system that recommends TV shows to users based on theknowledge of their preferences. For a quicker adoption of the personalizationsystem by users, there is a need for the system to be easy to use, providerecommendations with high accuracy and build trust in the recommendationsdelivered. The user interface and recommender engine work hand in hand inorder to provide all three items. In this paper we describe our system and showhow it addresses each of the three issues mentioned.
Introduction
The arrival of Personal Video Recorders (PVRs) has begun to change the way peoplewatch TV. PVRs enable consumers to record TV shows via an electronic programguide (EPG) in a digital format on a huge hard disk. In observing users with PVRs(TiVo and ReplayTV) in their homes, we noticed that within two to three days peopleshifted from watching live TV to watching recorded TV programs. This change ismotivated by both the freedom from broadcasters’ schedules and the ability to fast-forward through commercials. However, this change in viewing behavior increasesthe difficulty of selecting TV programs. Instead of selecting a single program from100+ channels, PVR users must select a small set of programs to record from 15,000+on each week. A TV show recommender can aid PVR users by prioritizing these largenumber of shows. The PTV work of Cotter at al. [1], EPG work of Ardissono et al.[2] and our Multi-agent system [3] stand out in this area as the earliest TVrecommender systems.
From our earlier user tests [3], we have learnt that a personalized EPG shouldprovide:• Ease-of-Use: An intuitive, easy-to-use, interface to browse and search through
TV-show listings.• Trust: Explanations of recommendations in a simple, conversational manner to
enable building of consumers' trust in the recommender system.

• Accuracy: An accurate recommender system that can track users' viewingpatterns and automatically personalize the interface presentation so as to aid theviewer in making viewing or recording decisions.
One of the key contributions of our work reported in this paper is that our systemintegrates all the above three requirements for a personalized EPG and improves uponour earlier TV-recommender system. The issues of ease-of-use, trust and accuracy ofrecommendations are not separate but rather all of them need to be addressed in orderfor the viewer to feel comfortable about using the system. Ease-of-use is necessary sothat all users, regardless of how much they want to get involved and interact with thesystem, be able to easily find shows interesting for them and feel at ease with thesystem's everyday use. The issue of trust came about when we noticed that when anunknown show was highly recommended to users, they tended to believe that therecommender was defective. Our goal was to create a method that would give usersthe activation energy to try a new program when the mood strikes. Thus wedeveloped a novel approach called "reflective view history" that explains in aconversational manner why certain shows, unknown to the user, are highlyrecommended. Of course in order for the "trust building" mechanism to be able towork, the recommendations given by our system need to be very accurate. If theaccuracy is not high enough, the system making even the best explanations of why aprogram is recommended will still be seen as flawed. We developed a new methodfor achieving the high accuracy: neural network fusion of results from individualrecommender engines that we developed over the years.
System Architecture
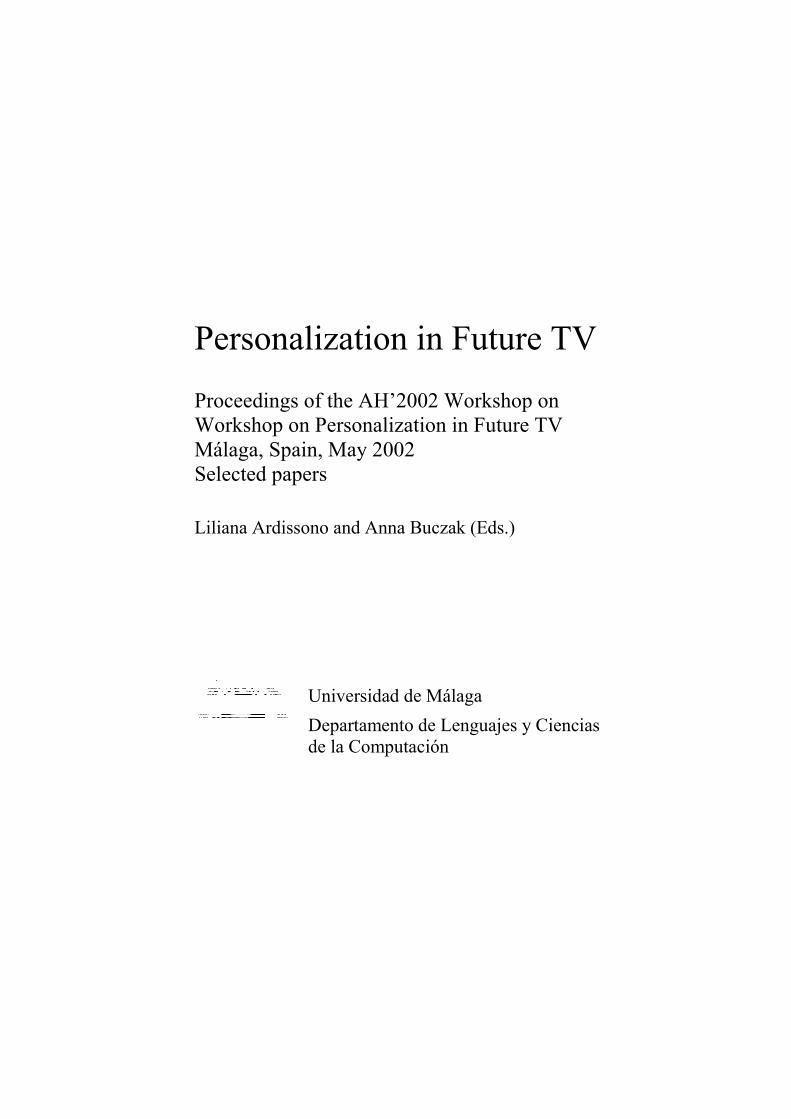
The complete recommender system under development is comprised of severalcomponents (Fig. 1). The main parts are an explicit (E) recommender and two typesof implicit recommenders: Bayesian (B) and Decision Tree (DT). The explicitrecommender allows users to directly input their likes and dislikes. The explicitrecommender has two different interfaces, the feedback interface and the explicitprofile interface. Implicit recommenders use the viewing histories of the subjects inorder to make recommendations. For each subject there is an individual viewinghistory and a household viewing history. Based on the view histories, Bayesian andDT recommenders build user profiles (one for the individual and one for thehousehold). When current shows are presented to the system, each recommendergenerates a set of recommendations. Those recommendations are fused by anartificial neural network (ANN).
Recommenders
Explicit Recommender
The explicit recommender relies on explicit profiles of TV viewers. These profilesresult from a question-answer session with the viewer, wherein the viewers’ explicit
likes and dislikes towards particular TV channels, show genres and preferred days andtimes of TV viewing have been gathered [3]. The feedback prong gathers userfeedback on specific TV shows and feeds that information to the implicit and explicitprongs and refines their recommender output.
Fig. 1. Recommender System Architecture.
Implicit Recommenders
The implicit recommenders use a viewer's implicit profile, which is built from theviewing history of a TV viewer. The implicit nature of our profiling method stemsfrom the fact that the process does not involve any interaction with TV viewers,regarding their likes and dislikes, other than collecting what shows have beenwatched. There are two types of viewing histories that these recommenders can useto build the user profile: individual and household. Individual viewing historycontains the shows that a given person has watched. Household history consists ofshows that the given household has watched. We could see as the history of the TVbox - all shows that were watched on a given box are included in the householdhistory. We have developed two implicit recommender agents, one based onBayesian statistics [3] and one on Decision Trees [4]. Each of the recommenderagents can work with the individual or with the household viewing profile resulting intwo different sets of recommendations.
Improving Ease of Use with Recommender
During demonstrations and user testing of our recommender interfaces, many usersindicated that they wanted either minimal or even no interaction with the system.They did not want to answer a bunch of questions in order to make the recommenderwork. These users wanted to quickly find something to watch and return to watching

TV. Other users, however, said they wanted to take control of the recommender. Theywanted to tweak the system until it produced precise recommendations. Based on thisdiverse input, we created the following user models:1. Do it for me–These users want a completely automated system. They do not
really care how the recommender works; they just want to watch TV.2. Let's do it together–These users want to take some control, but they do not want
to spend too much time adjusting parameters.3. Let me drive–These users want complete control of the recommender.
Do it For Me Users
The implicit recommender works well for the Do it for me users. The system monitorsviewing behavior and then makes recommendations. All the users need to do is watchTV. In addition, the interface automatically presents results based on rating. Whenusers activate the system, they see upcoming programs sorted by rating. Placinghighly recommended programs at the top of the list reduces the number of showsusers need to browse in order to find something they like.
Let’s Do it Together Users
The feedback interface (Fig. 2) for the explicit recommender supports the Let’s do ittogether users as well as the Let me drive users. This interface allows users to modifytheir explicit profile in small chunks. Instead of displaying attributes for all programs,the feedback interface allows users to rate the program title, channel, genres, actors,and the director for the currently selected program. The interface can also work as a“just in time” explicit profile. When users see a recommendation they disagree withor when they just want to understand why a show has a certain rating, they canquickly see the results and make any changes they want.
Fig. 2. Feedback Interface expanded. Fig. 3. Explicit profile interface.
Let Me Drive Users
Let me drive users can take more control by accessing their explicit profile interface(Fig. 3) and rating individual program attributes on a 0 to 100 scale. The systeminitially gives all items a neutral rating of 50. Users can quickly look through thelisted items and change as few or as many as they want. Users can adjust all or noneof the items, taking as much or as little control of the recommender as they desire.
In the feedback interface, the channel and genre ratings map directly to the explicitprofile interface. Users can change the rating of these items without ever visiting theexplicit profile interface. Program title, actors, and directors work differently. Initiallythese items do not appear in the explicit profile interface. The lists would be too longfor users to navigate. For example, a complete listing of all actors could easily contain10,000 names, most of which would be unfamiliar to any specific user. Unlikechannel and genre, users do not know enough about all actors, directors and titles toaccurately rate them.
When users launch the feedback interface, the program title, actors, and directorfor the highlighted program are immediately added to their explicit profile. The nexttime they view their explicit profile interface they can see and modify the rating forthese added items.
Improving Trust through Reflective History
During testing of our TV show recommender we encountered a problem. When oursystem recommended programs users regularly watched, they thought therecommender worked great. However, when the system recommended programs theydid not know, they felt the recommender was broken. Therefore, we designed aunique feature in our UI/Recommender system, called reflective view history, thatexplains recommendations in conversational manner thus enabling users to improvetrust in the recommendations provided by our system. Previously Herlocker et al. [5]have reported research on explaining recommendations, but they did not focus on a'conversational' explanation, rather they approached the problem by trying to explainthe rationale behind the score derivation.
The reflective history displays a conversational sentence justifying highlyrecommended, new TV shows (Fig. 4). The recommender generates a rating for aweek of upcoming shows. The system then looks for highly rated new programs(programs not already in a user's viewing history). Next, it searches for a commonperson between the new program and programs the user has seen. When it finds anappropriate match, the system generates a conversational sentence:
<NewProgram> <NewTask> <Person> who <OldTask> <OldProgram>.
Example: Boston Public stars Jeri Ryan who plays Seven of Nine in Star Trek:Voyager.

Table 1. Text strings used in reflective history
Task NewTask OldTaskDirector is directed by directed the TV showProducer is produced by Produced the TV showWriter is written by wroteActor stars plays <Character> in
The sentence uses a conversational structure, making it sound like something onefriend might say to another. This builds on Reeves and Nash's theory [6] that peopleinteract with computers as if they were people. The sentence reveals some of what thesystem knows about the user. This is a type of self-disclosure that can build trust [7].The short, conversational sentence works well with our TV recommender. (For amore detailed description of this feature, see [8].)
Fig. 4. User Interface with "Reflective View History".
Improving the Accuracy of Recommendations by Fusion
One of necessary elements for user's trust in a recommender system to be achieved isfor the system to provide very accurate recommendations, closely matching userslikes and dislikes. No explanation of why the show was recommended will builduser's trust if the recommendations provided are inappropriate. The third thrust of ourresearch, as described in this paper, was therefore to increase the accuracy ofrecommendations.
Results of testing our various recommenders (explicit, implicit Bayesian, implicitDecision Tree, heuristic combinations of explicit and implicit) with real users [3]suggest reasonable recommender accuracy. However various recommenders seemedto perform well for various users with no easy way to pre-determine which

recommender might be the right choice for a particular user. Careful consideration ofthe test results also indicated that different recommenders performed well for verydifferent sets of shows. To improve overall recommender accuracy we fused(combined) recommendations from various constituent recommendation algorithmsusing a neural network that might be able to detect correlations that simple heuristicscannot.
The fusion system combines five individual recommenders in order to obtain thefinal recommendation. They are:
• Implicit Bayesian based on individual view history• Implicit Bayesian based on household view history• Implicit Decision Tree based on individual view history• Implicit Decision Tree based on household view history• ExplicitOur approach for fusing recommendations uses a Radial Basis Function (RBF)
artificial neural network. The inputs to the network are the outputs from the singlerecommender mechanisms. This network is trained on partial data from a subset ofusers. This particular approach has the advantage that it can be developed usingground truth data only from the subjects in our study.
Radial Basis Function Neural Networks
Radial Basis Function networks were chosen for the fusion process. This choice wasdetermined by the fact that RBF nets are universal approximators and train rapidly(usually orders of magnitude faster than backpropagation). Their rapid trainingmakes them suitable for applications where on-line incremental learning is desired.RBF networks usually have three layers: an input layer, a pattern (hidden layer) andan output layer. The nodes in the pattern layer perform a radial basis functiontransformation, such as Gaussian. The input layer is fully connected to the hiddenlayer, and the hidden layer units are fully connected to output units. Output unitshave a linear transfer function. Detailed description of RBF nets and their learningmechanisms can be found in [9].
Data SetData from 7 subjects (referred to as A, C, D, F, G, H and I) from our second user testwas utilized. Each user rated about 300 shows as “would watch” (1), “wouldn’twatch” (0), “may watch” (0.5) and “do not know” (DNK). Users marked shows as“don’t know” (DNK) when they were not familiar with the show’s title and thereforecould not make a decision about being interested/not being interested in watching it.In the study only the shows known to the user were utilized. The total number ofknown shows with user ratings (1, 0, or 0.5) was 1348.
MetricsThe following three metrics are used in analyzing the fusion results:• Hit Rate (HR)• False Positive Rate (FPR)

• Mean Squared Error (MSE)Hit Rate and False Positive Rate can be computed for all shows that were classified
by the user as 0 or 1. For the shows classified as 0.5 it is disputable whether theyshould be recommended or not. Therefore we computed HR and FPR only on showsthat were crisply classified as 1 or 0. However, we included all the shows in the thirdmetric: Mean Squared Error (MSE). For computing HR and FPR, a threshold valueneeds to be chosen. A higher threshold value will lead to both lower HR and FPR,and a lower threshold will result in higher HR and FPR. The main advantages ofMSE metric are that it can be computed for all three types of shows and that it doesnot require a determination of a threshold value, which can be quite cumbersome.Therefore this is the metric on which we relied the most.
Fusion ResultsSeveral RBF networks with differing number of hidden nodes were trained on datasets from multiple users. 15% to 40% of data from subjects A, C, and D was used asthe training set (this represents 26% of the whole data set). For networks’ cross-validation 14% to 45% of data from subjects D, F, and G was used (this represents13% of the whole data set). All the data was used for recall. Data from users H and Iwas neither used in training nor in cross-validation (these users are also not a part ofhouseholds of any other users). The cross-validation was performed using HR andFPR metrics. A threshold of 0.5 was employed to compute HR and FPR. The bestperformance of RBF networks in terms of HR and FPR was obtained by the cross-validation process for a network with 15 hidden nodes. During cross-validation thebest network is chosen from about 10 networks with different number of hidden nodesthat were trained with data from the training set.
Fig. 5 shows MSE for all subjects. The RBF net fusion MSE varies for differentusers from 0.07 to 0.18 per pattern. The average MSE for nine individualrecommenders is much higher (it varies from 0.17 to 0.32 per pattern). For all users,with the exception of user F, fused MSE is better than the non-fused one. For user Fnon-fused MSE is better by 0.01.
0.00
0.10
0.20
0.30
0.40
A C D F G H I
User
MSE
One RBF Net MSE no fusion
Fig. 5. Comparison of No Fusion MSE and RBF Net MSE.

Overall, these constitute excellent results. They show that the fused system workswell both for users who were partially known to the system (some information used inthe training set) and users completely new to the fusion mechanism. It is especiallyimportant to notice that fused results are superior to the average of non-fused ones forusers whose data was neither used in training nor in cross-validation. This proves thatthe system can be developed using ground truth data only from the subjects in ourstudy and used for other subjects that were not known to the system when developingthe fusion mechanism. The fusion network can be viewed as a stereotype network thatcould be tuned later during system operation to individual user characteristics.
Subjects whose subset of data was used in training of fusion networks can beviewed as those subjects for whom the stereotype network was already almost tuned.The tuning in a real world scenario would take place by using user's feedback tosystem recommendations.
The behavior of MSE for user F needs some explanation: user F is an outlierwhose behavior is completely different from the other users. This is the only user forwhich recommenders based on individual watching history were much better thanrecommenders based on household viewing history. Since user F’s data was not usedin training, RBF network performing fusion adapted its weights giving more impact tothe recommenders based on household viewing history than to the ones based onindividual history. These weights were the right choice for all users with theexception of the outlier F. The network also adapted its weights for the ExplicitRecommender to be high, since Explicit Recommenders usually gave very goodrecommendations. However F is an outlier here as well: Explicit Recommender is theworst recommender for this user.
Conclusions
In this paper, we are addressing the problem of helping TV viewers to navigatethrough the plethora of content available and finding programs that are the mostinteresting for them to watch. We are developing a personalized EPG recommendersystem that recommends TV shows to users based on the knowledge of theirpreferences. The system consists of several recommender engines and a userinterface.
The main thrust of this paper was to develop methodologies for improving threemain issues identified in our user tests: ease-of-use, user's trust in therecommendations and their accuracy. We approached the problem from two angles:UI and recommender engine. The ease-of-use is obtained by creating a UI that allowsboth novice to expert users to achieve the desired amount of interaction with thesystem, while being able to easily find shows interesting to them.
Increased trust is provided through unique characteristic of our UI & recommenderengine called "reflective viewing history" that explains in a conversational mannerwhy certain shows, unknown to the user, are highly recommended. It allows buildingboth trust and forgiveness into the system. In future work the effectiveness of thisparticular method needs to be numerically determined in a user test.

Trust in recommendations cannot be achieved by their conversational explanationalone. Rather, the system needs to provide a very high accuracy of recommendationsand only then explaining them will build the necessary trust in users to try new,highly recommended programs. Improved recommendation accuracy is achieved byperforming fusion of results from individual recommender engines by Radial BasisFunction neural network. The power of this method is that such a fusion network canbe developed based on the data from subjects in our study, whose behavior conformsto the mainstream, and then deployed in the field. When deployed, it will performwell for users that it has not encountered earlier. Later this fusion network could beadapted to individual users by using their feedback to system recommendations. Thefusion network can be viewed as a prototype network that could be tuned later duringsystem operation to individual user characteristics.
References
[1] P. Cotter, B. Smyth, "PTV: Intelligent Personalized TV Guides", Proceedings of the 17th
National Conference on Artificial Intelligence, AAAI 2000, July 30-Aug. 3, pp. 957-964,Austin, Texas, 2000.
[2] L. Ardissono, F. Portis, P. Torasso, "Architecture of a System for the generation ofpersonalized Electronic Program Guides", Workshop on Personalization in Future TV, UserModeling 2001, Sonthofen, Germany, July 2001.
[3] K. Kurapati, S. Gutta, D. Schaffer, J. Martino, J. Zimmerman, “A Multi-Agent TVRecommender”, Workshop on Personalization in Future TV, User Modeling 2001,Sonthofen, Germany, July 2001.
[4] S. Gutta, K. Kurapati, K.P. Lee, J. Martino, J. Milanski, D. Schaffer, J. Zimmerman, “TVContent Recommender System”, Proceedings of the 17th National Conference of AAAI,Austin, TX, 2000.
[5] J. Herlocker, J. Konstan, J. Riedl, "Explaining Collaborative Filtering Recommendations",Proceedings of ACM 2000 Conference on Computer Supported Cooperative Work, pp. 241-250, December 2-6, 2000.
[6] B. Reeves, C. Nass, "The Media Equation: How People Treat Computers, Television, andNew Media Like Real People and Places", Cambridge University Press, New York, NY,1999.
[7] L. Wheeless, J. Grotz,, "The Measurement of Trust and Its Relationship to Self-disclosure",Communication Research, 3, 3, Spring 1977, pp. 250-257.
[8] J. Zimmerman, K. Kurapati, " Exposing Profiles to Build Trust in a Recommender",Proceedings of CHI 2002 (Minneapolis, MN, April 2002), AMC Press, pp. 608-609, 2002.
[9] J. Moody, C.J. Darken, “Fast Learning in Networks of Locally Tuned Processing Units”,Neural Computation, vol. 1, pp. 281-294, 1989.

A Multi-Agent System for a Personalized ElectronicProgram Guide
Angelo Difino, Barbara Negro and Alessandro Chiarotto
Telecom Italia Lab{difino,negro,chiarotto}@tilab.com
http://www.telecomitalialab.com
Abstract. With the recent diffusion of the digital TV and the rapid increase ofthe number of channels, the TV system has to be reviewed. A new support hasto be realized to assist the consumer using the new generation’s TV. In this pa-per we present a system demonstrator that provides a personalized ElectronicProgram Guide, basing on the user’s profile and the user’s interests.
1 Introduction
With the expansion of digital networks and TV devices, people are exposed to aninformation overload, due to the presence of several hundreds of alternative programsto watch. Therefore, personalized TV listings services are needed to support searchfor considerable options [1, 2, 3]. This paper presents the multi-agent architecture of asystem for the generation of adaptive Electronic Program Guides (EPGs), which filterthe information about TV events depending on the user’s interests and on the visiontime.The system builds upon the JADE agent platform, an agent framework that supports arich set of agent platform services and provides some tools that simplify agent devel-opment and system debugging [4].This paper follows the article presented to the first Workshop on Personalization inFuture TV, “Architecture of a system for the generation of personalized ElectronicProgram Guides" [5], and shows the new features realized and the new resultsreached.This paper is organized as following: section 2 describes the system architecture,taking back some arguments already presented in the previous paper; section 3 focusesdeeply on the new entity realized for the demonstrator; section 4 describes the set-upof the demonstrator and section 5 presents the future works and concludes the paper.
2 System architecture
In this section both the details of the agent architecture used and the implementedagents are given with some brief descriptions. The distributed architecture of the com-

plete system is depicted in the Figure 1 and follows the architecture presented in theprevious paper [5], specializing some entities and adding some others. The systemresides in the user’s Set Top Box and is based on a multi-agent architecture, wherespecialized agents cooperate to generate personalized EPGs on the user’s TV device.In the figure the main rectangle delimits the architecture and the rounded squareshows the EPG displayed on the user’s TV. The agents are represented by thick rec-tangles and the dynamic data structures they manage are depicted as ellipses. Thearrows represent the flow of data during the agents’ activities and the domain-specificknowledge is shown as parallelograms.
Fig.1. The system architecture
The main component of the system is represented by the User Model Component(UMC), the core of the personalization system. It maintains the profile of the regis-tered users and provides a list of preferences for them. The UMCManager collectsthese preferences querying the different user-modelling modules (called in our appli-cation Experts) and combining their responses (in section 3 this problematic will beanalyzed more deeply). The three experts realized are the Stereotypical UM Expert[6], the Explicit Preferences Expert and the Dynamic UM Expert. Any of themfocus their predictions on a different “face” of the user: the first of one analyses thestereotype belonging to him/her and provide an ad-hoc list of preferences, the secondone retrieves his/her explicit preferences and suggest the specified categories and thelast one observe the dynamic behavior of the user using the application and suggestthe most-observed categories the user focus on. This is an innovative point of view of
Stereotypical UMExpert
Explicit PreferencesExpert
Dynamic UM Expert
Stereotype KB
UMC Manager
USERS DB
UM:- personal data- preferences
UMC
SP ref
DP ref
EP ref
TV EventsExtractor
TV EVENTSDB
UserInterfaceManager
UIMcontext
DomainOntology
TV EventsCollector
SatelliteDVB DataFlow
SpecificData aboutTV events
UserActivitiesMonitor
EPG
ProactiveModule

our application, because it doesn’t exploit only one suggestion method. Personaliza-tion based only in stereotypical suggestion is problematic because people normallydon’t exactly match with only one stereotype or he/she doesn’t follow the viewingindication associated with his/her stereotype. Explicit suggestion, instead, can bewrongly trained: for example, in the registration form, the user can say “I like art”when s/he never watches art programs (often happens that the users are not able todeclare their preferences). Finally, the dynamic expert, for its nature, doesn’t purposealternative choices that can be anyway interesting. The contribution and merging ofthe indications of three (or more) experts, allows getting better predictions.In plain English, the experts are agents with this specific task: retrieve and provide, onrequest, the predictions about a specific user. The user’s profile required by each ex-pert are not directly sent to it, but explicitly required to the UMC.The UMC Manager caches the preferences collected until now to allow a quickeraccess for future requests. The service provided by the UMC is used by the TV EventExtractor, which label the available TV events, retrieved from a local database, withan opportune rank (in section 3 this activity is better specified). Finally the TV eventsso ranked are showed to the user.The second main work provided by the system is the monitoring of the user activity.Users interact with the application using a simply GUI that presents the main functionsof the system. The User Interface Manager, beside present all functionalities of thesystem and respond to the user requests, tracks the user’s behavior using the GUI andsend these behaviors (called user-events) to the User Activities Monitor. These user-events finally are forwarded to the interested modules of the system and used locally(e.g. the dynamic expert can use it to update its local knowledge base, giving moreimportance to the preferences often focused by the user).The proactive suggestion is the third main activity realized by the system and it’sperformed by the Proactive Module. An intelligent system must help the user to havegood choices and, eventually, focus his/her attentions on TV events which have notbeen considered yet. This module, for each registered user, analyzes if interesting TVevents are available and, eventually, signal or record it for them.Last main activity, realized by the TV Event Collector, is to collect the available TVevents which will be presented to the user. It analyzes the MPEG-2 satellite stream toretract the TV event’s information and subsequently, where needed, enrich it withauxiliary information, retrieved with additional sources like web sites.
3 Focus on new improvements
3.1 Domain Ontology and Channel Ontology
As described in the previous paper [5] a Domain Ontology was defined to integratedescriptions coming from heterogeneous sources. It extends the DVB standard [7]with super and sub-categories, some of them replacing the standard one.In addition to the Domain Ontology, we also considered another ontology concerningthe channels. This means that the system manages also a list of all the available chan-

nels from the satellite stream or from the other information sources. This type of da-tum is relevant since some channels are specialist in one domain rather than another(for example, a channel transmits preferably cartoons and another channel prefersdocumentaries). What’s more, the users tend towards to watch a set of few preferredchannels and the dynamic belief is important in the generation of the personalizedprograms guide.
3.2 From Expert predictions to a personalized EPG
When necessary, the different experts are contacted by the UMCManager to propose,on their local knowledge base, predictions on the specified user, contextualized on aparticular day and time band. The predictions returned are a list of preferences (list ofCategories, list of Subcategories and list of Channels) - each of them reached with acouple of value. The first one, called rank, is a value into the interval [0,1] and it rep-resents how much the expert believe that the user will appreciate the preference speci-fied (0 means that the expert doesn’t believe that the user will appreciate this specifiedpreference at all; otherwise 1 means that the expert believes that the user will com-pletely appreciate this specified preference). The second one, called confidence, isstill a value into the interval [0,1] and it represents how much the expert believe thatits prediction is consistent (0 means that expert is not so sure about its prediction atall; 1 means that the experts absolutely believes in this prediction). So far, for theexperts, it’s really easy to communicate uncertain value (e.g. if the expert communi-cate for MOVIE_DRAMATIC the rank=0.5 and confidence=0 it means that hedoesn’t know anything about this preference, but if he communicates rank=0 andconfidence=1 it means that the expert it’s absolutely sure that the user doesn’t likeevery TV events categorized as MOVIE_DRAMATIC).The predictions returned from the Experts are combined by the UMCManager ana-lyzing their confidence on all predictions using the formula (1). It simply merges thedifferent predictions, weighted on the base of the confidence returned.
.
*
1,
1,,
∑
∑
=
== n
eie
n
eieie
i
Conf
RankConfRank
(1)
The ranked preferences are finally used by the TV Event Extractor, which uses thesevalues to rank the available TV events. First of all, it analyses the TV events categoryand use the suggested rank proposed in the “Subcategories” predictions. The “Cate-gory” predictions are not still used, but we’re thinking to combine it with the subcate-gory prediction to rank the TV events categorized as “others” (the TV event that notbelongs to a predefined subcategory, e.g. MOVIE_OTHERS). Next, the “Channel”predictions are used to refine the rank previously generated increasing or reducing therank if the TV event is transmitted on a channel that the user watches very often or, atthe opposite, hardly ever.

In the Figure 2 we show how much the category prediction is updated (y-axis) ana-lyzing channel predictions (x-axis). If the UMC returns a “Channel” prediction greaterthan 0.85 (the user, in the specified context, often watches the channel that are trans-mitting the analyzed TV event) or smaller than 0.15 (the user, in the specified context,doesn’t watch at all the analyzed channel), the category prediction is relating updated.Otherwise update is not introduced.
Fig.2. Channel prediction refining
3.3 Personalizing GUI layout
The demonstrator realized is able to present itself in many different graphical layouts.The personalization is made, at the moment, simply by using different skins (graphicalappearances), but for next improvement we’re going to consider to change the presentlayout and to decide whether to get visible or not some functionalities.At the first login the system analyzes the profile of the user logged and retrieves itsbest matching stereotype, simply contacting the Stereotypical UM Expert via UM-CManager. Since each stereotype has a predefined skin, the system presents itself tothe user in the better way. So far an user belonging to “students” stereotype will havea modern skin, otherwise a “house wives” stereotype user will have a more clear skin.Of course each user can modify the skin suggested manually.
3.4 Dynamic Expert Agent
In the Dynamic Expert Agent (DEA) the user preference component is approachedprobabilistically, in terms of discrete random variables encoding two different types ofinformation: preferences and contexts. The sample space of the preference variablescorresponds to the domain of objects on which the user holds preferences; the corre-sponding probability distributions represent a measure of such preferences (likingdegrees). The sample space of every context variable is the set of all possible contexts.
+0.1
+0.085
-0.085
-0.1
0.15
0.85 1
Update category rank
Channel prediction

Among the probabilistic frameworks existing in literature [8, 9], Bayesian Belief Net-works (BBNs) appear particularly suited to encode this kind of information. In Figure3, the structure of the BBN used to represent the user preferences in our application isshown.The network takes in account the contextual information by means of appropriatecontext variables, which are meant to represent the conditions in which user prefer-ences about the TV event may occur; they are not intended to represent the conditionsaround the contents of the TV event. We have decided to describe a context withtemporal conditions, represented by the two variables “DAY” and “VIEWINGTIME”:they encode, respectively, the 7 days of the week and the 5 intervals of time in whichthe day can be subdivided (morning, noon, afternoon, evening and night). Therefore35 different specific contexts are represented. The context variables are the root nodesin the network, since they are not influenced by any other information.To use this model in our application, we simply ask to the BBN the probabilities forevery categories, subcategories and channels and normalize these three different dis-tributions to the interval [0,1]. To keep the BBN updated, the DEA ask to the UserActivities Monitor to be informed about the behaviors of the user using the GUI.
Fig.3. Structure of the BBN used by DEA
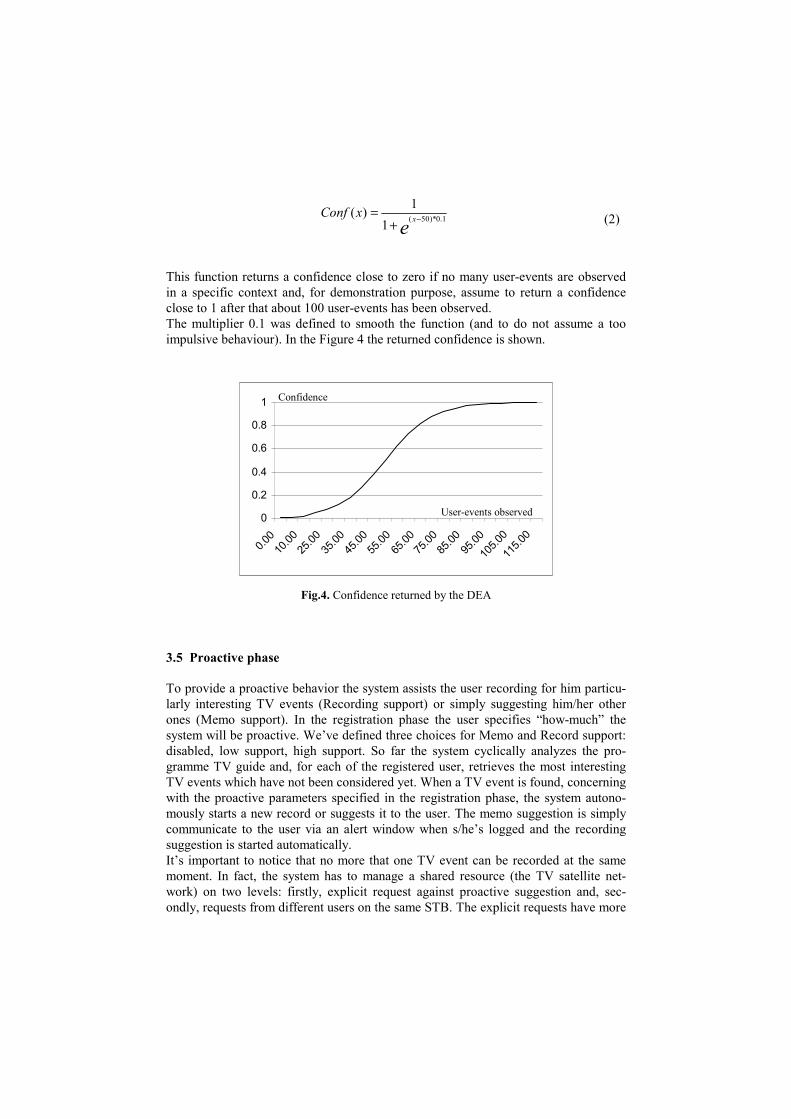
When an user-event is communicate to the DEA, it extracts the category and the chan-nel of the TV events specified and updates the BBN adding a new case on the contextobserved (every user-events has different weight, meaning that playing a TV Event ismore important in the learning phase than just focusing on it).The DEA calculates the confidence of its predictions counting how many user-eventswere observed for a specific context. A sigmoidal function is used to convert the num-ber of events observed. This function is normalized in the interval [0,1] and is definedin (2).
DAY
SUBCATEGORY
sport_footballmovie_horrormusic_metaletc…
CONTEXTVariables
PREFERENCEVariables
VIEWINGTIME
CATEGORY
sportmoviemusicetc…
CHANNEL
rai_unorai_duemtv_italiaetc…
ex
xConf1.0)*50(
1
1)( −+
= (2)
This function returns a confidence close to zero if no many user-events are observedin a specific context and, for demonstration purpose, assume to return a confidenceclose to 1 after that about 100 user-events has been observed.The multiplier 0.1 was defined to smooth the function (and to do not assume a tooimpulsive behaviour). In the Figure 4 the returned confidence is shown.
0
0.2
0.4
0.6
0.8
1
0.00
10.0
025
.00
35.0
045
.00
55.0
065
.00
75.0
085
.00
95.0
0
105.
00
115.
00
Fig.4. Confidence returned by the DEA
3.5 Proactive phase
To provide a proactive behavior the system assists the user recording for him particu-larly interesting TV events (Recording support) or simply suggesting him/her otherones (Memo support). In the registration phase the user specifies “how-much” thesystem will be proactive. We’ve defined three choices for Memo and Record support:disabled, low support, high support. So far the system cyclically analyzes the pro-gramme TV guide and, for each of the registered user, retrieves the most interestingTV events which have not been considered yet. When a TV event is found, concerningwith the proactive parameters specified in the registration phase, the system autono-mously starts a new record or suggests it to the user. The memo suggestion is simplycommunicate to the user via an alert window when s/he’s logged and the recordingsuggestion is started automatically.It’s important to notice that no more that one TV event can be recorded at the samemoment. In fact, the system has to manage a shared resource (the TV satellite net-work) on two levels: firstly, explicit request against proactive suggestion and, sec-ondly, requests from different users on the same STB. The explicit requests have more
User-events observed
Confidence

importance than the suggestions and the user competes on the network card using aFIFO paradigm.The Proactive module, at the start-up, creates an instance of a Personal Agent (notshow in the Figure 1, but logically included in the Proactive Module) for every regis-tered user in the system. If a new user registers into the system a new instances iscreated for him. This Personal Agent requests (via UMCManager) the profile of therepresented user (and keeps it consistent if this profile change) and the TV eventsalready considered by the user (TV events explicitly put in the recording or in thememo queue). Finally, it asks to the TV Event Extractor the list of interesting TVevents for the represented user. If some TV events not yet considered are founded itwill notify to the user or it will automatically record (according to the specified sug-gestion parameters signaled in the register-user phase).
4 Set-up of the demonstrator
Since many personalization features presented above request a complex system to bevalidated, we provided a demonstrator for a pc environment that implement the archi-tecture shown in the Figure 1. Philips Research LAB also provided a demonstrator fora STB scenario inside the EUROPA (End User Resident Open Platform Architecture)project [10].As previous mentioned, the application was build on the JADE framework [4] and thecomponents of the architecture was implemented as JADE agents.JADE is flexible enough to allow the selection of the configuration of agents to occurat the run time, according to the needs (development, debugging or deployment). Insome cases, and with some constraints, the configuration can even change dynamicallywhere, at execution time, a single agent can be stopped on one host and resumed onanother one.For demonstration purpose the EPGs retrieved by web provider are cached locally, aswell for the content video.The software configuration of the user’s equipment is shown in the Figure 5. In graythe component that has been implemented, in white color all those components thathave been interfaced.
TILab MPEG Player
Java VM Run Time
JADE
Multi-agent architecture
Windows 2000
Netica BBN libraries

Fig. 5. Software configuration of the user’s equipment
The TILab MPEG Player is used to play the MPEG video files. The Netica librariesare used by the system in order to generate and manage the dynamic portion of theusers’ profiles (the BBN in the Dynamic UM Expert). For the rest, the agents just usethe JADE framework and the Java VM Run Time.The demonstration shows the capabilities of the system and also of its components:- the full system is shown starting with a registration of a new user, its initial inter-
action that allows to learn its profile, and, finally, the system suggestions, the de-livery and play of the MPEG video streams;
- the personalization capability of the system is shown by providing to each usersuggestions about which TV programmes to watch, suggestions that are, ofcourse, matched against the user profile;
- the analysis of the BBN network trained with a real user (as a result of the TV-poll experiment) allows to show the learning capability of the system and allowsto show the support that the BBN is able to provide;
- the stereotypical classification is shown and the extent to which the registeredusers “match” a specified stereotypical description is available;
- the capability of the JADE agent platform is shown by demonstrating the persis-tence of agent names and, by using the JADE tools, to debug agent interactionand to visualize interaction patterns.
5 Conclusion and future works
With the new TV technology a review of the TV paradigm is becoming necessary[11]. User modeling and personalization are needed to assist the user in the TV choicein a more proactive way. Too many TV events are simultaneously available and it’simpossible to assume whether the user want/can surf on them. We’ve presented adescription of the demonstrator which is still under development, but that has alreadyreached a mature stage. Different user models are used in competition and the sugges-tion is reached using different information sources (category of the TV events andchannel of transmission).Lots of work is still necessary. First of all a TV-oriented layout has to be realized. ThePC-layout is absolutely unsuitable for a STB scenario. Secondly, the merging of theexperts prediction has to be refined, adding to the confidence of the experts a value ofreputation on them (comparing predictions proposed from the expert in a short term tothe user choices, realizing, de facto, a system feedback of the predictions reached).Finally new tools to personalization have to be realized and integrated to the presentsystem, as keyword refining.The demonstrator described in this paper was developed in cooperation with theDipartimento di Informatica of the University of Torino and partly founded by theEUROPA (End User Resident Open Platform Architecture) project inside theEUREKA/ITEA Programme [10]. We thank Prof. Torasso, L. Ardissono, C. Gena and

F. Portis for the important contributed reached. Moreover, we thank F. Bellifemine forhis helpful advice.
References
1. The Forrester Brief, TV Recommendation Engines (2000): Beyond EPGs.2. PTVPlus, Personalized TV Listings web site: http://www.ptv.ie.3. Patrick Baudisch, Lars Brueckner (2002): TV Scout: Lowering the entry barrier to personal-
ized TV program recommendation.4. Developing multi agent systems with a FIPA-compliant agent framework (2001). In Soft-
ware - Practice And Experience, no. 31, pagg 103-128. JADE home page: http://jade.cselt.it.5. Ardissono L., Portis F., Torasso P., Bellifemine F., Chiarotto A., Difino A. (2001): Archi-
tecture of a system for the generation of personalized Electronic Program Guides. UM2001Workshop on Personalization in Future TV, Sonthofen, Germany.
6. Gena C., Ardissono L. (2001): On the construction of TV viewer stereotypes starting fromlifestyle surveys. UM2001 Workshop on Personalization in Future TV, Sonthofen, Ger-many.
7. DVB, Digital Video Broadcasting: http://www.dvb.org.8. Alexander Pretschner (1999): Ontology Based Personalized Search.9. Ramón Sangüesa, Ulises Cortés, Mario Nicolás: WebProfile or agents the other way round.10. EUROPA, End User Resident Open Platform Architecture: http://www.itea-
office.org/projects/europa_fact.html11. Barry Smith, Paul Cotter (1999): Surfing the digital wave, Generating Personalized TV Listings using Collaborative, Case-Based Recommendation, Lecture Notes in Computer Science.

Prediction Strategies: Combining Prediction
Techniques to Optimize Personalization
Mark van Setten1, Mettina Veenstra1, Anton Nijholt2
1 Telematica Instituut, P.O. Box 589, 7500 AN, Enschede, The Netherlands {mark.vansetten, mettina.veenstra}@telin.nl
2University of Twente, P.O. Box 217, 7500 AE, Enschede, The Netherlands
Abstract. An important step in providing personalized information, such as
personalized electronic program guides, is predicting the level of interest for a
specific user in information, such as TV programs. This paper describes a
model that can be used to combine prediction techniques, which predict the
level of interest, into prediction strategies. Our hypothesis is that prediction
strategies optimize the prediction quality and that they lead to more reliable
predictions, because they take into account the state of the system, the users and
the information. Results of an initial experiment support this hypothesis.
1 Introduction
In this age, more and more information is made electronically available and is accessible to many people. This results in the problem of information overload.
People have difficulties in getting information that is relevant and interesting for
them. This problem exists in several fields, such as electronic stores, digital news
provision, digital libraries, and TV systems. One of the solutions for this problem is making information systems adaptable to the user, assuring that only information
interesting for the user is retrieved and presented in a way that is suitable for that user.
Our research is applied in the domain of future personalized TV systems [10] and
encompasses more than research into personalization [9]. It also includes research into new user interfaces, distributed search and retrieval and efficient video browsing.
However, the focus of this paper is on personalized selection of information. We
present a model that makes it possible to combine prediction techniques in order to
optimize prediction quality and which results in more reliable predictions. After discussing the model, results of an initial experiment with this model are provided.
2 Personalized Information Selection
Personalized selection of information is part of several tasks, e.g. determining what
programs to record, ordering and filtering electronic program guide (EPG) data and
ordering and filtering search results. Personalized selection consists of two phases:

1. Predict the level of interest a user will have in a piece of information;
2. Adapt the information based on those predictions, such as re-ordering and/or
filtering the set of information.
We focus on predicting the level of interest for a user. There are several types of
techniques to do this. On one hand, there are content-based techniques: structured
querying (e.g. SQL), information filtering [5], case-based reasoning (CBR) [6] and
content-based category selection (e.g. selection based on genres). All these techniques look inside information (content and metadata) to determine how interesting it is for a
user. The other techniques are social techniques, which do not look inside
information, but base their predictions on (opinions of) other users: social filtering [2]
[7], item-item filtering [3], social CBR (CBR that calculates similarity between users based on characteristics), Top-N (average opinion of all users) and social-based
category selection (e.g. stereotypes [1]). Another technique is association rules [11],
which is neither a specific content technique nor a specific social technique.
2.1 Prediction Strategies
Most of the currently available personalized information systems and research into
these systems focus on the use of a single selection technique or a fixed combination
of techniques [3] [8]. We believe that combining different techniques in a dynamic
and intelligent way can provide better and more reliable prediction results. By dynamic and intelligent combinations we mean that the combination of
techniques should not be fixed within a system and that the combination ought to be
based on knowledge about strengths and weaknesses of each technique and that the
choice of techniques should be made at the moment a prediction is required, taking into account the three factors that cause the dynamics of personalization:
1. The usage lifecycle: When a new user starts using a personalized system, there is
no knowledge available about him, making prediction techniques that rely heavily
on knowledge about the user unsuitable. For new users, it is better to use techniques that rely less on knowledge about the user.
2. The information lifecycle: The lifecycle of information (content and metadata) also
influences the suitability of techniques. On one hand, the amount and
characteristics of available metadata determines the suitability of content-based techniques. On the other hand, the lack of user ratings makes social techniques
unsuitable for new pieces of information.
3. The system lifecycle: The lifecycle of the system itself also determines the
suitability of techniques. Several techniques rely on a certain amount of active users and/or an amount of available metadata that may not yet be available in new
systems. In this situation, alternative techniques should be used.
Due to these dynamic factors, a model is needed that allows prediction techniques to be easily combined. Each combination should be chosen based on the most actual
knowledge about the users, the information and the system at the moment of
predicting. A combination of prediction techniques is called a prediction strategy. The
next section describes our model for combining individual techniques into strategies.

2.2 Prediction Technique Model
Even though individual prediction techniques are quite different, it is possible to create a model in which all techniques can be embedded due to the basic nature of
each prediction technique: each technique can calculate a predicted interest value for
a piece of information for a given user (even structured querying, resulting in binary
predictions). This forms the basis of our model. Naturally, each technique must normalize its predictions. We use the bipolar range from –1 to +1 (zero being neutral).
Several techniques, such as social filtering and CBR, are capable of learning from
users in order to optimize their predictions. They learn from feedback provided by
users. This means that feedback should also be incorporated in our model. In order to make informed decisions within strategies, each technique exposes so-
called validity indicators. These indicators are used within a strategy to decide to what
extent a technique should be used. Because of differences in prediction techniques,
most techniques have unique and different validity indicators. E.g. where social filtering provides the number of similar users that rated the piece of information, CBR
provides the number of similar rated programs by the user.
Optionally, prediction techniques can provide explanation data. Explanations
provide transparency, exposing the reasoning and data behind a prediction and can increase the acceptance of prediction systems [4]. Explanations help users to decide
whether to accept a prediction or not. However, we will not discuss explanations here.
The discussed aspects of prediction techniques result in our generic model shown
in figure 1.
Prediction
Technique
Information
User Profile
Prediction
Explanation
Validity Indicators
Feedback
Fig. 1. Generic model of prediction techniques.
Prediction strategies consist of one or more prediction techniques and a set of rules
to determine which technique(s) to use. These rules use the validity indicators of each prediction technique, which are based upon the user profile, the information for which
a prediction must be made and the current state of the system. When using more than
one technique, validity indicators also help to determine the weights between
techniques when combining individual predictions into one prediction. However, in our initial experiment, predictions are not combined: strategies only select between
techniques. Combining predictions will be investigated in future experiments. Within
our generic model, a prediction strategy itself can be treated again as a prediction
technique, allowing strategies to be nested. This nesting property also allows the creation of a so-called root strategy that encompasses the major prediction strategies.
In our TV system, we created a root strategy that uses three other strategies, namely a
parental guidance strategy, a taste strategy (for entertainment-oriented programs) and

a rational strategy (for information-oriented programs). It also uses one individual
prediction technique that checks if the user has already rated the specific program.
Figure 2 shows a prediction strategy for predicting the level of interest in
entertainment programs on TV. We believe that such programs, like movies and soaps, mainly appeal to people’s tastes instead of their rational interests. It uses two
prediction techniques (social filtering and CBR) and also includes another prediction
strategy (first-time user strategy). This first-time user strategy is also nested within
another main strategy of our TV system, namely the rational strategy.
Taste Strategy
Number of rated items by user
Number of similar
users that rated item
Number of rated
similar programs
Social Filtering
enough
not enough
CBR
enough
First Time User
not enough
enough
not enough
Combine results
User Profile + information
prediction
Social Filtering
Number of rated
items by user
Number similar users
that rated item
Number of rated similar
programs by user
CBR
First Time User
Fig. 2. Example prediction strategy for taste preferences of entertainment programs.
Two validity indicators of social filtering are used: the number of items rated by
the user and the number of similar users that rated the item. These validity indicators are chosen based on research into social filtering techniques [2]. Social filtering only
works well when the user has rated at least a certain amount of items and when there
are enough similar users who rated the item to base a prediction on. From the CBR
technique, the validity indicator is the number of similar items rated by the user. No validity indicators are used from the first-time user strategy, as this strategy is used as
a fallback when other techniques are not suitable. The taste strategy exposes an
indicator that shows how much an item appeals to the users’ taste instead of their
rational interests. Of course, the threshold values for these indicators, such as “enough”, have to be instantiated before implementing the strategy. There are three
ways to determine the thresholds: using results of existing research, determining them
via experiments and/or by automatically learning them within the system.
3 Experiments
In order to test our model and validate the usefulness of prediction strategies, we
performed an experiment in which individual prediction techniques were compared with a strategy. Because this was a first experiment for our model, we wanted to
make sure that our prediction techniques and results were comparable with other

research projects. For this reason, we decided to use the MovieLens data set of the
GroupLens project 1.
In our experiment, we implemented a set of prediction techniques using our model.
The prediction techniques we implemented were: a base technique that simulates a system without predictions (always returns the neutral value); Top-N technique that
calculates the average rate over all users; the user average technique that calculates
the average rate given by the user; social filtering as used in the MovieLens system
[2]; genre user average, which is a content-based category prediction technique, where for each genre the average rating by the user is calculated, which is then used
to predict the interest for a movie by looking at the genres that movie belongs to; and
a simple CBR technique based on genres, where movie genres are used to calculate
the level of similarity between movies. The strategies implemented are the taste strategy (see figure 2) and a first-time user strategy that uses the Top-N, user average
and genre user average techniques. In these strategies, only a selection between
prediction techniques is made. In future research, we will experiment with combining
predictions of individual techniques, instead of only selecting between techniques.
3.1 Evaluation Measures
According to Herlocker [2], there are two good measures to evaluate prediction
techniques:
1. The mean absolute error (mae): this measures the average absolute deviation between a predicted rating and the user’s actual rating. The lower the mae, the
better the performance of a prediction technique;
2. Coverage: percentage of items for which a technique could generate a prediction.
Some techniques cannot always provide a prediction. E.g. social filtering only generates a prediction when similar users can be found for the current user.
We believe that in some systems coverage is more important than in others. E.g. in
a rental movie recommendation system, it is less important if a prediction cannot be made, as long as actual predictions are correct: it is not important if users rent a
certain movie this week or in several months, as long as they will like the currently
recommended movies. However, in a TV system, coverage is more important because
most TV programs are only available at the moment of broadcasting. This means that we are interested in both prediction quality and coverage at the same time. For this
reason, we combined both measures into a new measure: the global mean absolute
error (gmae). This measure is the same as mae, but when a prediction cannot be made
the neutral value is assumed (which is how users probably see a non prediction). To distinguish it from the original mae measure, we call the original measure the
prediction mean absolute error (pmae). The pmae measure only calculates errors for
predictions when all techniques can produce a prediction.
To compare the prediction techniques and the strategy throughout the system’s life cycle, we divided the set of ratings into five groups of 20,000 ratings each. Group A
1 http://www.grouplens.org - the dataset consists of 100,000 ratings, 943 users and 1682
movies. The rating scale of 1 to 5 has been normalized in our experiment to –1 to +1.

consisted of the first 20,000 ratings (in time), Group B of the next 20,000 ratings, etc.
When testing each group, the ratings of all previous groups were used for training.
To evaluate the prediction techniques throughout the user usage cycle, we looked
in each of the five groups for users who started using the system within the time period of that group and who rated at least 150 movies in that same period. The
ratings of these users where divided into two groups: the first 100 ratings and the
remaining ratings. The first 100 ratings where used to evaluate how techniques
perform for new users of whom little knowledge is available, the others to evaluate how techniques perform for users of whom more knowledge is available, i.e.
established users (using the first 100 ratings as training data).
For all fifteen groups, we calculated the pmae and gmae for each technique and the
taste strategy and performed paired samples T-tests (using a 95% confidence interval) to determine if differences between the results are statistically significant. In the next
section, the main results are presented 2.
3.2 Results and Discussion
When comparing the results within the five groups of the system’s lifecycle (figure 3), in every group, the taste strategy is significantly better than the individual
techniques. Also for the first 100 predictions of new users (figure 4), the taste strategy
performs significantly better or at least as good as the best individual technique. In
groups B, C and E, there is statistically no significant difference between the taste strategy and the Top-N technique, but both are better than other techniques. This is
acceptable, as the current implementation of the taste strategy only selects between
techniques. This means that for each single prediction it can never perform better than
the best individual technique. In turn, the gmae of the strategy should be statistically better or the same as the best technique in each group.
System Life Cycle
0.3000
0.3500
0.4000
0.4500
0.5000
0.5500
0.6000
Group A
(20000)
Group B
(20000)
Group C
(20000)
Group D
(20000)
Group E
(20000)
GMAE
TasteStrategy
Social
Filtering
Top-N
User Avg
Genre User
Avg
Genre CBR
Base
Fig. 3. Global Mean Absolute Error for the system’s lifecycle test. The numbers below each
group indicate the sample size (number of predictions).
2 Detailed data results can be found at: https://doc.telin.nl/dscgi/ds.py/View/Collection-4586

New Users First 100 Predictions
0.3000
0.3500
0.4000
0.4500
0.5000
0.5500
0.6000
Group A
(4400)
Group B
(4100)
Group C
(3300)
Group D
(3700)
Group E
(3400)
GMAE
Fig. 4. Global Mean Absolute Error for the user usage’s lifecycle test of the first 100
predictions of new users.
The same argument applies to the test for the predictions for new users after the
first 100 predictions (figure 5). In the first three groups, the taste strategy is
statistically the same as the best techniques (the genre CBR technique in group A and the Top-N technique in groups B and C). In the last two groups the taste strategy is
statistically better than any of the individual prediction techniques.
New Users After First 100 Predictions
0.3000
0.3500
0.4000
0.4500
0.5000
0.5500
0.6000
Group A
(6569)
Group B
(6133)
Group C
(5771)
Group D
(6860)
Group E
(4962)
GMAE
Fig. 5. Global Mean Absolute Error for the user usage’s lifecycle test of the predictions after
the first 100 for new users.
We also looked at the prediction accuracy only (pmae) in the three tests. The taste
strategy performs almost always statistically better or at least as good as the best

prediction technique. There are two exceptions. In two situations, the taste strategy
does not predict as accurately as an individual technique. In the first stage of the
system’s lifecycle, genre CBR performs better. Social filtering also predicts
statistically better in the second and third group for new users after the first 100 predictions. We believe this is not a reason to dismiss the idea of using strategies, but
a reason to optimize the strategy. This can be done, because the current rules that
select between techniques are not all based upon research into individual techniques,
some are educated guesses using knowledge of how an individual technique works.
System Life Cycle
0.3000
0.3500
0.4000
0.4500
0.5000
0.5500
0.6000
Group A (2909) Group B (5634) Group C (6326) Group D (7091) Group E (7264)
PMAE
Fig. 6. Prediction Mean Absolute Error throughout the system’s lifecycle.
Due to the very low coverage of social filtering for new users, the results of the
pmae on the first 100 predictions of new users (figure 6) is statistically less valid, as
the sample size (number of predictions) in those groups was much smaller than in any
other stage. In the results of that test, there is almost no statistical difference between any of the techniques and the strategy.
New Users First 100 Predictions
0.3000
0.3500
0.4000
0.4500
0.5000
0.5500
0.6000
Group A (111) Group B (407) Group C (280) Group D (428) Group E (556)
PMAE
Fig. 7. Prediction Mean Absolute Error for the first 100 predictions of new users.
New Users After First 100 Predictions
0.3000
0.3500
0.4000
0.4500
0.5000
0.5500
0.6000
Group A
(3643)
Group B
(4428)
Group C
(3799)
Group D
(4664)
Group E
(3505)
PMAE
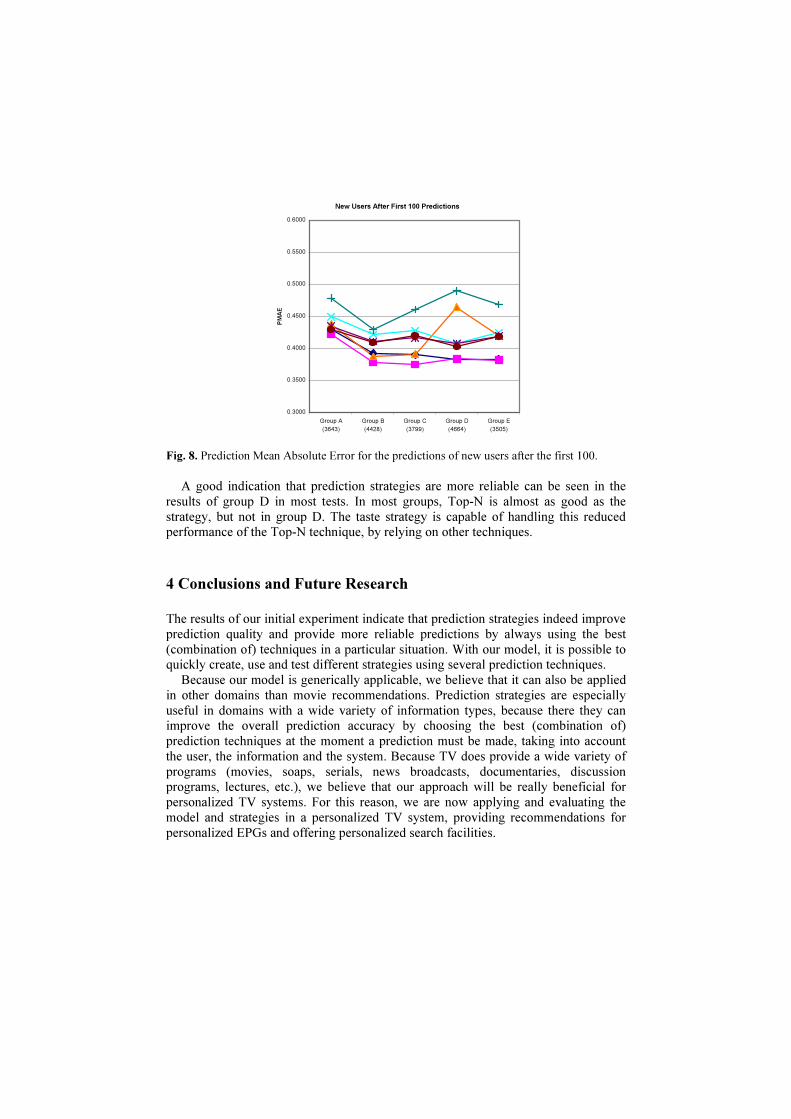
Fig. 8. Prediction Mean Absolute Error for the predictions of new users after the first 100.
A good indication that prediction strategies are more reliable can be seen in the
results of group D in most tests. In most groups, Top-N is almost as good as the
strategy, but not in group D. The taste strategy is capable of handling this reduced performance of the Top-N technique, by relying on other techniques.
4 Conclusions and Future Research
The results of our initial experiment indicate that prediction strategies indeed improve
prediction quality and provide more reliable predictions by always using the best
(combination of) techniques in a particular situation. With our model, it is possible to quickly create, use and test different strategies using several prediction techniques.
Because our model is generically applicable, we believe that it can also be applied
in other domains than movie recommendations. Prediction strategies are especially
useful in domains with a wide variety of information types, because there they can improve the overall prediction accuracy by choosing the best (combination of)
prediction techniques at the moment a prediction must be made, taking into account
the user, the information and the system. Because TV does provide a wide variety of
programs (movies, soaps, serials, news broadcasts, documentaries, discussion programs, lectures, etc.), we believe that our approach will be really beneficial for
personalized TV systems. For this reason, we are now applying and evaluating the
model and strategies in a personalized TV system, providing recommendations for
personalized EPGs and offering personalized search facilities.

Acknowledgements
This research is part of the PhD project Duine, for which most of the work is done in the GigaPort project (http://www.gigaport.nl) at the Telematica Instituut
(http://www.telin.nl). The authors like to thank Betsy van Dijk, Andrew Tokmakoff
and Harry van Vliet for their helpful comments. Also thanks to the researchers at the
university of Minnesota for making the MovieLens dataset publicly available.
References
1. Gena, C.: Designing TV Viewer Stereotypes for an Electronic Program Guide. In:
Bauer, M., Gmytrasiewicz, P.J. and Vassileva, J.: User Modeling 2001. Springer,
Sonthofen, Germany (2001) 274-276
2. Herlocker, J.: Understanding and Improving Automated Collaborative Filtering
Systems. University of Minnesota (2000)
3. Herlocker, J. and Konstan, J.A.: Content-Independent Task-Focused Recommendation.
IEEE Internet Computing, Vol. 5 (2001) 40-47
4. Herlocker, J., Konstan, J.A. and Riedl, J.: Explaining Collaborative Filtering
Recommendations. Proceedings of CSCW'2000. ACM, Philadelphia, PA (2000)
5. Houseman, E. M. and Kaskela, D. E.: State of the art of selective dissemination of
information. IEEE Trans Eng Writing Speech III (1970) 78-83
6. Jackson, P.: Introduction to Expert Systems. Addison-Wesley, Reading, MA (1990)
7. Shardanand, U. and Maes, P.: Social information filtering: algorithms for automated
"Word of Mouth". Proceedings of Human factors in computing systems 1995. ACM,
New York (1995) 210-217
8. Smyth, B. and Cotter, P.: A personalised TV listings service for the digital TV age.
Knowledge-Based Systems, Vol. 13 (2000) 53-59
9. Tokmakoff, A. and van Vliet, H.: Home Media Server Content Management. In: Smith,
J.R., Panchanathan, S., Jay Kuo, C.-C. and Le, C. Internet Multimedia Management
Systems II, Volume 4519 (2001) 168-179
10. van Setten, M., Tokmakoff. A. and van Vliet, H.: Designing Personalized Information
Systems - A Personal Media Center. Proceedings of workshop Personalisation in Future
TV, Sonthofen, Germany (2001). http://www.di.unito.it/~liliana/UM01/vanSetten.pdf
11. Witten, I. H. and Frank, E.: Data mining: practical machine learning tools and
techniques with Java implementations. Morgan Kaufmann Publishers, San Diego (2000)
Celebrity Recommender
John Zimmerman, Lesh Parameswaran*, and Kaushal Kurapati
Philips Research and Philips Design*345 Scarborough Road
Briarcliff Manor, NY 10510 USA1.914.945.6000
Abstract. This paper presents both a rationale and a pilot study for usingcelebrities to present computer generated content recommendations. Therationale explores how people's parasocial relationships with celebritiesinfluence decision-making. The pilot study examines if celebrity presentation ofrecommendations influences subjects' qualitative assessment of a recommender.Statistical tests on a small sample indicate that the use of a celebrity did notsignificantly enhance users’ perceptions of a recommender. However, theresults suggest that influence between same-sex and cross-sex matches ofsubjects and celebrities should be further explored.
Introduction
The increasing number of channels from digital cable and satellite and the availabilityof entertainment content via the Internet have significantly increased consumers’content options. At the same time, the arrival of TV hard disk recorders such as TiVoand ReplayTV, and the availability of downloadable audio have begun to change theway people select content. For instance, where users once selected a TV programfrom 100 or so channels, disk-based storage in the home now requires users to select aprogram from the 15,000+ broadcast each week. Similarly, downloadable audiorequires users to select individual songs instead of CDs and albums, creating a 15 foldincrease in the number of options. How can people find the content they want fromthe swelling sea of choices?
The rapid growth in communication technologies has also led to an increase in thenumber of celebrities [8, 9, 11]. Traditionally, people have trusted celebrities to helpthem make content decisions. Music, movie, and TV stars appear in magazines, onradio, and on television where they promote their latest projects. Popular disc andvideo jockeys recommend the music they play and the artists and bands theyinterview. Celebrity critics rate movies, music, and TV shows. Even TV Guide, amagazine designed to list TV program times and channels, sells itself through thecelebrities who appear on the cover. Celebrities are the content, and celebrities sell thecontent. And as the amount of content increases, so do the number of celebrities.
Recently, technology companies have been developing “content recommenders” tohelp users manage the increasing number of entertainment choices. Amazon.com

operates one of the most well known recommenders. Registered users on theAmazon.com system automatically see recommendations for books, music, videos,and even electronic equipment. Our research project at Philips focuses on thedevelopment of a TV show recommender. Our recommender combines the explicitratings users make with an implicit method that tracks the TV shows users watch (fordetailed information on how the recommender works, please see [10, 7]). While usertesting, we discovered that people do not inherently trust computer recommenders.With this fact in mind, we began to explore building on users’ trust of celebrities toincrease their trust in our recommender. We designed and executed a user test to see ifusing a celebrity would increase people’s perception of how well our TV showrecommender performs. In other words, using the same content recommendations, wewanted to see if users trusted our system more when a celebrity appeared to make therecommendations versus when a computer makes those same recommendations.
Celebrity Background
In his 1961 book The Image, Daniel Boorstin defined celebrities as people wellknown for their “well-knowness” [4]. His definition works well, because it capturesthe most important aspect of being a celebrity: not being forgotten. However, bydefining celebrities as people he fails to recognize the full range of modern celebrities.Instead, we suggest considering celebrities as well known characters. This modifiesthe definition to include both “real” celebrities and fictional characters.
Real celebrities generally appear more like characters than like people. Forexample, consider Tom Cruise and Tom Hanks. These popular celebrities commandhigh salaries because they guarantee a strong box office draw: their success comesfrom the consistent delivery of a character. Tom Cruise plays a character one couldcall “the best.” He is the best spy in Mission Impossible; the best fighter pilot in TopGun; the best brother in Rainman, the best bartender in Cocktail, etc. Tom Hanks is a“regular guy” who encounters extraordinary circumstances. He is a regular guy whofalls in love with a mermaid in Splash; a regular prison guard who witnesses miraclesin The Green Mile; a regular guy of lower intelligence who leads an incredible life inForest Gump, etc. When people decide to go to a Tom Hanks or a Tom Cruise movie,they know what character to expect.
The character of James Bond offers an excellent example of a fictional celebrity.James Bond possesses as much or more celebrity than the actors who play him. Hecan appear on the cover of a magazine as a silhouette and textual name, providing thesame power to get people to pick up the magazine as Sean Connery. In addition, whenpeople state they are going to see a Tom Cruise movie, their statement communicatesas much meaning as when they say they are going to see a James Bond movie.
From this perspective one can view celebrities as merely products instead ofcharacters. Why is Herbie [14], the Volkswagen Beetle who stars in several Disneymovies, a celebrity while any other Volkswagen Beetle is not? What makes celebritiescharacters instead of merely products is the fact that they participate in a narrative.Simba, the heroic, animated lion from Disney’s The Lion King, offers a goodexample. This movie generated 1.3 billion dollars in film and video release. It

generated three billion dollars in merchandise [1]. Disney sold a lot of stuffed lions.People did not want to own just any stuffed lion; they wanted to own Simba. Theywanted to participate in the story.
Human Need
People create celebrities. And they create them because celebrities fulfill a humanneed for relationships [3, 13]. Celebrities offer parasocial relationships, interactingwith people through televisions, radios, and print. People benefit from and enjoy theserelationships because they are safe, one-way relationships, where people can select(and dump) celebrities without any fear of rejection.
People most often form parasocial relationships with celebrities, whom they onlyexperience media. They attach their identity to the identity of the star with the hope ofrising as the celebrity rises [3]. This phenomenon can be observed with popular musicfans. Fans want to be known as having liked a band before it became popular. Theypublicly state that they have identified with this band for a long period of time. Thisincreases their status with the other fans, because they appear to have “risen” with theband’s fame. Similarly, sports fans identify with players and feel they have won when“their” team wins.
People begin and grow these relationships by consuming content featuringcelebrities [13] and by allowing these celebrities to influence them [3]. A great deal ofwork has been done in the medical community on the effectiveness of celebrities toinfluence behavior. Evidence clearly indicates that people take actions based oncelebrity recommendation [5]. David Basil in his study of celebrity identification andthe dissemination of HIV information, found that people more willingly accept advicefrom celebrities (in this case the basketball star Magic Johnson) than they accept theadvice of medical experts [3].
Content recommenders offer a unique environment for exploring the power ofparasocial relationships between people and celebrities. Computer basedrecommenders can observe a user’s selection of books, music, movies, clothing, TVshows, etc. Recommenders can get to know a user and tailor their interactions andrecommendations to match the user’s tastes. These recommenders can extend the one-way relationships users currently have with celebrities, making them more like a two-way relationship but with no fear of rejection. Celebrity recommenders also offer agood structure for building parasocial relationships by creating many opportunities fora user to take a celebrity’s advice. These enhanced one-way relationships may even bemore attractive to users than the one-way relationships available today.
Celebrity Pilot Study
With the long-range goal of building a celebrity recommender, we tested to see ifusing a celebrity would increase the perceived quality of our TV show recommender.This pilot study tested to see if adding a celebrity’s photo to a list of recommendationsmade a difference in how participants rated the recommender.

The pilot study included 30 subjects (15 male, 15 female) ranging in age from 15 to25. Research has shown that adolescents are more influenced by celebrities [2]. Inaddition, teenagers perceive celebrities of the opposite sex more positively thancelebrities of the same sex [6]. By using an equal number of males and females wehoped to see if this effect held true with respect to a recommender system.
A few days before the test we had the participants rate 45 TV show genres and 74channels on a scale between 1 and 10. A rating of 1 indicates genres and channelsthey hate, a rating of 5 indicates items they are neutral about, and a rating of 10indicates items they love. These ratings became their profile. We fed these profilesinto our TV show recommender, which produced an individual list of twenty highlyrated programs from the 2000 programs broadcast the day of the test.
We randomly placed participants into three groups(Text, Generic Photo, andCelebrity) made up of five females and five males each. Group(Text) saw their twentyrecommendations along with the following text:
“Hi ParticipantName,I’ve looked at all of the shows on today and here are the top twenty I
thought you might like to watch.”
Group(Generic Photo) saw the same text, but in addition the text was signed withthe name Paul. A photo of an attractive, young man who is not well known (not acelebrity) appeared above the text. Group(Celebrity) saw the same text as group(Text)and group(Generic Photo), but this text was signed with the name Will, and a photo ofthe celebrity Will Smith appeared above the text. Figure 1 displays how therecommendations appeared to the three different groups.
Fig. 1. Presentation of recommendations for Group(Text, Generic Photo, and Celebrity) fromleft to right.
We used these three groups to control for the effect of a photo. If we tested only thecelebrity against the text, it would be difficult to determine if the celebrity made a

difference or if merely the addition of a human face made a difference in subject’sperceived quality of the recommendations.
We selected Will Smith after initial polling suggested that he had both highrecognition and positive association with our targeted age group. He is also perceivedas an expert in the TV domain due to his status as a television, movie, and music star.Research indicates that celebrities who are knowledgeable about the products theyendorse are more effective [12]. For the non-celebrity we selected the image of ayoung, attractive, African American, male-model for the GAP. Choosing a photo of aperson of the same race and sex as Will Smith helped controlled for these variables.
During the test, subjects first viewed their personal set of twenty recommended TVshows. The listings included the TV show title and a description, but no scores toindicate that one show might be more recommended than another. After reviewingtheir recommendations, subjects answered a series of qualitative questions focusingon the quality, usefulness, and trustworthiness of the recommender. They rated eachquestion on a 1 to 5 scale indicating a qualitative value of 1 poor, 3 neutral, or 5 good.Next we asked the subjects which of the twenty recommended TV shows they wouldactually watch. Again using a 1 to 5 scale, subjects indicated they 1 “would not watchit”, 3 “might watch it”, or 5 “would watch it”.
We hypothesized that using a celebrity would increase subjects’ perceptions of therecommender. We expected subjects who saw their recommendations with WillSmith’s face to rate the quality, usefulness, and trustworthiness higher than the othersubjects. However, we had no hypothesis as to how a celebrity might affect TV showsusers would actually watch. By asking both sets of questions we could determine ifthese two aspects of the recommender are related.
Test results
The results showed a slight increased perception of the recommender forgroup(Celebrity) with respect to both the qualitative questions and to the TV showsparticipants indicated they “would watch”. However, these scores were only slightlyabove the scores for group(Text). Group(Generic Photo) stood out most from theother two groups with the lowest scores.
Table 1. Averaged ratings for qualitative questions and “would watch” TV Shows divided bygroup and sex. (Subjects‘ answers conformed to a 1 to 5 scale.)
Sex Qualitative Q by Sex Would Watch WW by Sex
F 3.25 3.26Text
M3.25
3.253.20
3.13
F 3.05 3.10Generic Photo
M2.80
2.552.84
2.58
F 3.65 3.52Celebrity
M3.35
3.053.23
2.94

The difference between males and females proved to be the most interesting. Onaverage, females liked the recommender more than males. In addition, femalespreferred the celebrity presentation to both the text and generic photo. Males, on theother hand, preferred the text presentation of their recommendations. This patternappeared for both the qualitative questions and for the “would watch” ratings of thetwenty individual TV shows.
The means of participants’ responses indicate that females generally liked therecommender more than males. However, viewing the results as bar charts illustratesa different story (see figures 2 and 3). When the females and males seerecommendations presented as text, their reactions are quite similar. However, whenthey see recommendations presented with a generic photo or with a celebrity photo,females appear to like the results more than males. The charts also reveal that thisreaction is similar for both the qualitative questions and the “would watch” ratings.
Fig. 2. Averaged results for qualitative questions concerning quality, usefulness, andtrustworthiness of the recommender. Error bars display 2 times the standard error of the mean.

Fig. 3. Averaged results for the “would watch” questions, indicating how likely subjects wouldwatch the recommended TV shows. Error bars display 2 times the standard error of the mean.
We performed a two-way (sex by groups) analysis of variance (ANOVA) on eachset of questions. None of the main effects or interactions reached the .05 level ofsignificance. This is possibly due to the small sample size of 5 participants for eachsex-group.
Table 2. Averaged ratings for qualitative questions and “would watch” TV Shows divided bygroup and sex. Subject answers conformed to a 1 to 5 scale.)
Qualitative p-scores Would Watch p-scoresGroups 0.32 0.44Sex 0.25 0.14
Conclusion
The results from the pilot study did not match our expectations. We hypothesized thatusing a celebrity would have a positive influence on users' perception of therecommender. Instead our results hint that same-sex/cross-sex matching betweenparticipants and the recommender (as either a celebrity or generic person) might be amore influential feature. Female participants tended to respond more favorably torecommendations presented by a male celebrity than male participants. In addition,female participants tended to respond more favorably to recommendations presentedby an attractive, generic male than male participants. This leads us to believe that therelationship between the sex of the recommendation presenter and the sex of the usermakes a difference. These findings also support the results of Greene and Adams-Price [6]. They discovered that teenagers have a more positive reaction to celebritiesof the opposite sex than to celebrities of the same sex.
Our next step will be to run this same test again, but this time use a femalecelebrity and female generic photo. It will be interesting to see if this test producessimilar results with the male participants liking the female celebrity and generic photomore than the female participants. It will also be interesting to see if the differencebetween perceptions of males and females is larger or smaller. Are males or arefemales more influenced by the sex of the recommendation presenter?
While our results about the use a celebrity are not statistically significant, we arenot yet ready to abandon our hypothesis. A small sample size might be partiallyresponsible for the weak scores. In addition, we have developed a concept we call“celebrity distance” that forms a scale from “far” to “near”. A far celebrity distancemight be a name on a piece of paper. A near distance could be a user sitting next to acelebrity, having a conversation. We predict that there is an upper and lower thresholdfor celebrity distance, where the effect will increase dramatically (see figure 5). Withrespect to our pilot study, we feel using a celebrity name and a small photo falls alittle below the threshold for significantly influencing recommendations.

Fig. 4. This figure shows the relationship between celebrity distance and the influence acelebrity has on recommendations.
In addition, we are interested in how other dimensions of celebrity affect users inaddition to the celebrity’s sex. In the future we plan to focus on both age and race. Wefeel these additional dimensions might play a role in increasing a celebrity’s influenceon recommendations. Finally we want to explore the role of user selection. Allowingusers to select the celebrity they want to present recommendations may increase theirperception of the recommender.
References
1. Abraham, R. S. Information, Blockbusters, and Stars: A Study of the Film Industry, Journalof Business, October 1999.
2. Atkin, C. and Block, M. Effectiveness of Celebrity Endorsers, Journal of AdvertisingResearch, (1983) vol. 23, 57-61.
3. Basil, M. D. Identification as a Mediator of Celebrity Effects, Journal of Broadcasting andElectronic Media, (Fall 1996), 478-495.
4. Boorstin, D. The Image: A Guide to Pseudo-Events in America, New York: Harper andRow, 1961.
5. Corbett, J., and Mori, M. Medicine, Media, and Celebrities: News Coverage of BreastCancer, 1960-1995, Journalism and Mass Communication Quarterly, (Summer 1999), 229-249.
6. Greene, A. L. and Adams-Price, C. Adolescents’ Secondary Attachments to CelebrityFigures, Sex Roles, Journal of the American Psychological Association, (1990) vol. 23, 335-347.
7. Gutta, S., Kurapati, K., Lee, K. P., Martino, J., Milanski, J., Schaffer, D., and Zimmerman,J. TV Content Recommender, AAAI-2000, IAAI-2000 Proceedings, (Austin, Texas USA,August 2000), AAAI Press, 1121-1122.
8. Henderson, A. Media and the Rise of Celebrity Culture, OAH Magazine of History, (Spring1992), 49-54.
9. Kelly, C. Why do we need celebrities?, Utne Reader, (May-June 1993), 100-101.

10. Kurapati, K., Gutta, S., Schaffer, D., Martino, J., and Zimmerman, J. A Multi-Agent TVRecommender, User Modeling 2001: Personalization in Future TV Workshop (Sonthofen,Germany, July 2001).
11. Neimark, J. The Culture of Celebrity, Psychology Today, (May-June 1995), 54-56 & 86-87& 90.
12. Ohanian, R. The Impact of Celebrity Spokespersons’ Perceived Image on Consumers’Intention to Purchase, Journal of Advertising Research, (1991) Vol. 31, 46-54.
13. Rubin, R. B., and McHugh, M. P. Development of Parasocial Relationships, Journal ofBroadcasting and Electronic Media, (1987) Vol. 31, 279-292.
14. Walsh, Bill (producer), Stevenson, Robert (Director), The Love Bug, Disney, 1969.

Improving the Quality of thePersonalized Electronic Programme Guide?
Barry Smyth1,2, David Wilson1, and Derry O’ Sullivan1
1 Smart Media InstituteDepartment of Computer Science
University College Dublin{barry.smyth,david.wilson,dermot.osullivan }@ucd.ie
2 ChangingWorlds Ltd.Trintech Building
South County Business ParkLeopardstown, Dublin 18
Abstract. The availability of rich programme metadata is critically important forthe development of next-generation personalized electronic programme guides(pEPG). However, current metadata standards for the TV domain offer only lim-ited information. In this position paper we outline a technique for automaticallylearning new metadata by using data mining techniques.
1 Introduction
Digital TV services promise consumers an unprecedented level of programming choicethrough the availability of hundreds of channels. However, the reality is that this level ofprogramming choice is often hampered by the problem that users experience in locatinglistings information quickly and easily. The traditional, static electronic programmeguide, which provides the end-user with an on-screen source of listings, provides onlya partial solution since users must still invest considerable effort in browsing throughpotentially hundreds of screens of listings information as they search for interestingprogrammes. The promise of the personalized EPG is that it removes this burden ofsearch from the user by automatically learning about a user’s viewing preferences inorder to promote relevant content more directly. Typically, for example, a pEPG willprovide a user with his/her personalized channel containing information on programmesthat are particularly relevant to his or her tastes.
PTVplus (www.ptvplus.com) is an established online recommender system deployedin the television listings domain that combines content-based and collaborative filteringtechniques in order to generate personalized TV guides (see Fig 1). While PTVplus hasproved successful in accurately capturing and responding to its users viewing prefer-ences its ability to do so is limited by a number of factors. Currently, the content-based
? The support of the Informatics Research Initiative of Enterprise Ireland is gratefully acknowl-edged

Fig. 1. PTVplus System.
and collaborative filtering techniques are integrated by interleaving the individual rec-ommendations from each technique. And while this means that each set of recommen-dations can make up for the shortfalls of the other set’s personalization strategy [1], itstill means that each set is limited by its own personalization strategy and the informa-tion that it has at its disposal.
For example, content-based methods rely on the availability of meta-data about theprogramming content. However, TV listings producers provide very little in the wayof meta-data; coarse genre information, country of origin, language are available butlittle else. This limited information can disguise differences and similarities betweenprogrammes. For instance, two programmes may be classified as comedies, but mayappeal to very different audiences (eg.,Friends and Last of the Summer Wine) andso may tend to be mistakenly recommended together. Similarly, collaborative filteringmethods rely on direct profile overlap as the basis for profile similarity. However, manysimilar users will not exhibit direct overlap and collaborative filtering methods willtherefore miss legitimate recommendation opportunities; a user who enjoysX-FilesandFrasier is likely to be similar to a user who enjoysFriendsandER, but this will bemissed by many collaborative filtering systems.
We believe that a solution to these problems exists by looking at ways of moretightly integrating content-based and collaborative filtering techniques. In this paperwe focus on two such integration possibilities. First, in Section 2, we outline how newprogramme meta-data may be discovered, which can be used to enhance content-basedfiltering. Second, in Section 3, we show how data-mining techniques can be used toextract programme association rules from user profiles, and how these association rulescan be used to circumvent the overlap problem that exists with traditional collaborativefiltering.
2 Learning Programme Metadata
As pEPG’s and value-added television services mature, programme metadata is play-ing a more important role in helping users find content. Existing metadata structures(e.g., genre, description, etc.) provide straight-forward descriptions about individual

programmes (e.g., Friends, comedy, USA, English, Jennifer Aniston, as in Fig 1). Suchstructures can be used for content-based recommendation, but they may not captureimportant, but as yet unknown, relationships among programmes and in television con-sumer preferences. For example, by analyzing user profile data, it may be possible todiscover that people tending to likeScrubsalso tend to likeER, which would pointtoward a new, hybrid medical-comedy genre.
Discovering new types of metadata affords better opportunities to tailor more on-point programme recommendations and to provide assistance in the opportunistic nav-igation of programme content. We envision that many types of metadata (e.g., hybridgenre hierarchies, national tastes for genre and timeslot, seasonal preference variationsfor serial programmes, successful sequencing of programmes) will be drawn from var-ious sources of information (e.g., user indicated preferences, behavioural data, pro-gramme teletext). This research provides an initial demonstration of how new types ofmetadata can be generated and successfully deployed in systems like PTVplus.
Fig. 2. Extending Metadata.
Our overarching goal is to evolve new metadata structures (see Fig 2) into a richerformat and to provide a flexible client architecture that can easily adapt various sourcesof relational programme and preference metadata to enhance value-added televisionservices. Our experiments have demonstrated a successful application of data miningtechniques to discover direct relationships between programmes (of the form “likesScrubs” implies “likes ER”) based on user profiles. We could also use both positiveand negative rules preference to further improve recommendation (e.g., “likesER” im-plies “dislikesNewsnight”). By taking this information a step further, using existingprogramme genre and cast information, we expect to develop hybrid-genre clusters.
3 Data Mining for PTVplus Metadata
Our initial approach to the problem of discovering new metadata information [2] is toapply data mining techniques, in particular theApriori algorithm [3], to extract associ-ation rules between programmes in PTVplus user-profile cases. By discovering hiddenrelationships between TV programmes, we may be able to cover more potential profilematches and, at the same time, make more informed recommendations. For example,under conventional collaborative filtering techniques, a person that likesX-Files andFrasier would not normally be comparable to a person that likesFriendsandER, butdiscovering a relationship betweenFrasier andFriendswould provide a basis for pro-file comparison. We further increase the utility of our approach by introducing a rulechaining paradigm (e.g. the rule “likesX-Files” implies “likes Frasier” could be com-

bined with the rule “likesFrasier” implies “like Seinfeld” to create a new rule “likesX-Files” implies “likes Seinfeld”).
Using these “hidden relationships” between programmes in recommendation givesus increasing ability to discern similar users as well as favored programmes. Resultsconducted on a PTVplus dataset (622 user profiles) demonstrate increased accuracy onexisting recommender techniques (Fig 3); further experiments have shown this increaseis dependent on dataset density. In this graph, “direct rules” refer to rules generatedusing theApriori algorithm and “indirect rules” refer to rules found using our chainingtechnique described above. We divide each profile into recommend/test sets, runningour recommender over the recommend set to see how many of the resulting programmeswere in the test set. Accuracy is calculated by finding the number of profiles in whichat least one of the test set items were recommended.
Fig. 3. PTVplus accuracy comparison.
4 Conclusion
In this position paper, we have discussed the problems currently facing recommendersystems in the context of PTVplus, a pEPG operating in the TV listings domain. Wehave shown the benefits derived by using programme association rules to enhance meta-data featured in recommendation as well as discussing how such metadata structurescould be evolved to further augment such systems.
References
1. Smyth, B., Cotter, P.: Personalized electronic programme guides. Artificial Intelligence Mag-azine21 (2001)
2. O’Sullivan, D., Wilson, D., Smyth, B.: Using collaborative filtering data in case-based recom-mendation. In: Proceedings of the 15th International FLAIRS Conference. (2002) To Appear.
3. Agrawal, R., Mannila, H., Srikant, R., Toivonen, H., Verkamo, A.I.: Fast discovery of associa-tion rules. In Fayyad, U.M., Piatetsky-Shapiro, G., Smyth, P., Uthurusamy, R., eds.: Advancesin Knowledge Discovery and Data Mining. AAAI Press (1996) 307–328

�������������� ���������������������! "�$#%�������� '& (*)! ��!�
+-,/.10325476�8:9<;>=@?A=CB�DE4F07GH25=IBJ9!KL.1DEMJN
O�P:Q<R�SUTWV�P:XYT�Z5[]\�Z5V�Q>^ATW_IXa`abcdV�Q3PeSW_CR"fg\�ZhfifiP:`hPjZ5[]kEl:_iP:X>lJPhb3mnPJleoaX>ZhfiZ5`5pR5X<qrPsqa_il:_iXaPhb
tgZhX>qaZ5XukEvxw�y5z�{| `5^g}hb ~Efil"�5��qAZYlh� _ilh� R5lh� ^>~
�'���:�:���<�5�h� c�X�TWoa_I��Q>R5Q3PJS���P�QaSWP:�UPJXET�R5X�_iXYTWP:fifi_I`5P:XYTsb�Q3PeSW�UZhX<R"fi_I�UP:q��]fiP:le�TUSWZ5X>_il-��SWZh`"S�R5V���^>_IqaP���_�TWouR5XuR"`hP:XYTL�<R"�UPsq�_IXA[@S�R"��TUSW^>lJTW^ASWP�TWo>R"TLQaSWZ��E_IqaP:�TWoaP�^>�UPJS��3Z5TWo���_�TWo�l:ZhXYTWP:XYT'�<R"�UPsq�R"X<q�l:Z5fifCR"�3Z5S�R�TW_I�hP SWP:lJZhV�V�P:X>q>R"TW_iZ5X>��>R5�UPsquZhX�TWo>Pj^>�UPeSs¡ ���A_iPJ��_iXa`�QASWZ5¢<fiPhb3��oa_ileou_i��Zh^AS�V�ZEqAP:f£Z5[]TWo>Pj^>�UPeSs�3v7PSWP:QASWP:�UP:XYT-TWoaP'�A_iPJ��_iXa` QASWZ5¢>fIP�^>�U_iXa`��UP:Q<R�S�R"TWPl:R"TWP:`5Z5SW_iP:�HZ"[L_iXYTWPJSWP:��T-�U^>l�oR"��qAS�R"V'R5��R"X<q�`¤R"V�P��UoaZs���:bF��oaPJSWP-P:R5l�o l:R"TWP:`5Z5SUpu_iX�TW^aSWXu_i��V'RhqAPj^aQuZ5[QASWZh`5S�R"V��]TWo>R"T¥TWo>P�^>�UPJS¦fi_I~hPsqHR5X>qHqa_i�Ufi_i~¤Psq/�¤m�oaP§QASWZ5¢>fIP�_i�]l:ZhXYTW_iXE^>Z5^>�Uf�p-^aQa�qaR"TWPsq-�E_IR�[1PJPsqa�>R5l�~jTWZ�TWoaP��E_IPe��PJSW��R5`hPJXETs�hm�o>P�fi_i~¤PsqHR"X<qHqA_i�UfI_i~¤P:q-QaSWZ5`5S�R5V��R�SWP§TWoaP:X�qa_i��TW_ififiPsq�_iXYTWZ�R���PJ_I`5oYTWPsqHTW^>Q>fiP�Z5[F~¤Pep���Z5S�qa�¦QaSWZEqA^>l:Psq-[CSWZhV¨TWo>P:_�SqAP:�UlJSW_iQaTW_iZhXa�:�Em�o>_i�]��P:_i`hoYTWPsq-TW^aQ>fiP�_i�]TWoaP:XH^>�UP:q-TWZ�V'R5~¤P�SWP:lJZhV�V�P:X>q>R"TW_iZ5X>��>R5�UPsq-Z5X-TWo>P�qAP:�UlJSW_iQaTW_iZ5X>�¥Z5[/XaPJ��QaSWZh`"S�R5V��:�h�¥SWZ5`5S�R"V��]��oaZh�UP§qaP:�UleSW_IQATW_iZhX>�R�SWPj¡ l:fiZh�UP5¡ATWZ�TWoaP§^a�UPJSs¡ ��fi_i~¤PsqHQASWZ5¢<fiP�[1Z"S��UZhV�P�lsR�TWP:`hZ"SUp'R"SWP�SWP:l:Z5V�V�P:X<qAPsqF�v©P©R"fI�UZ��aSW_iPJªap�qAP:�UlJSW_i�3P«Z5^aS�V-^afiTW_LV�ZEq>R"f�_iXETWPeSU[¬R5lJP ��oa_Il�oxR5fifiZs����^>�UPJS_iXYTWPJS�R5leTW_IZ5X��E_IR��UQ3P:P:l�o'_IXaQ>^AT�R"X<qHZh^ATWQ>^AT�_iX�Rhqaqa_�TW_iZhX�TWZ�TWo>P§^>�U^<R"f<�aSWZs���UPJS_iXYTWPJSU[¬R"l:P���_�TWo~¤PJpA�3Z¤R�S�q�_iXYTWPJS�R5leTW_IZ5Xg�
® ¯>°§±3²/³�´�µj¶n±/·W³§°
¸ =IBJ9�Be9/2j2"¹A25M�=@4F8�MJ25Daº�=@4/?H4<,/»�¼n2"ML½E¾£Be25MeMJ25º�BeMJ=@DA./ºeDEB�BJ2".@=IBJ2jDE4F0�85DE¼/.@2�8:9FDA4/4/2".1º�»�DA0/2D¤¹¤DA=C.1DE¼F.C2a¿�Be9/2�,Fº�25Mu9FDaº D�À�=1032�M:DE4/?a27½E¾�Á/MJ½A?AM:DE»�ºBJ½xº�25.C2h8sBu¾ÂMJ½A»7ÃLÄ32".@258sBJ=C½a4Å=@ºBe=@»2�8"½A4Fºe,/»=C4F?�DE4g0u=CB�=1º�½E¾¬BJ2"4uBJ9/2�8"Daº�2jBe9FDEB�=@4>Be2"MJ25º�Be=@4/?Á/MJ½A?AM:DE»�º�?a½�,F4/4/½EBJ=@8"250�ÃÆ =@?A=CBJDA.¦Ç�È%ºe,/Á/Á/.@=@2"M:º�9FD¤¹A2HMJ258"½A?A4F=@ºe250«Be9F=@ºjÁ/Me½a¼/.@2"»É½A¾�ʬËhÌ�ÍYÎsÏ�ÐYÑdÊÒÍYËxÍEÓ¤Ô"ÎsÕCÍhÐAÖ!DA4F0DA0/03MJ25ºJºe250xBe9/=1ºu=1ºeºe,/2!¼<;xÁFMe½Y¹<=103=C4F?�BJ9/2"=@M ,Fºe2"M:ºÀ�=CBe9¨×�.@258�BeMJ½A4/=187Ø�MJ½A?aMJDA»Ù+-,/=@0/2Ú ×§Ø�+�Û§ºe2"MJ¹<=@8"25º5Ã>Ç�9F25ºe2�8�,FMeMJ2"4>B�?A2"4F2"M:DYBe=@½A4�½A¾¦×�.@258�BeMJ½A4/=18�ÁFMe½a?AM:DE»�?A,/=10325ºL?A½ºe½A»2À�D¤;�=@4©Daºeºe=1ºWBJ=C4/?�,Fºe2"M:ºL¼<;u½AÜn25Me=@4/?½A4/.@=@4/2�º�2hDEM:8:9/=C4F?'Be9FMe½a,/?A9«Á/Me½a?AM:DE»Ý.@=@º�Be=@4/?aº�DA4F0ºe8:9/2h03,/.@25º�¼<;�?a2"4/MJ2A¿hBJ=IBJ.C2�½aM�0/DYBJ2AÃEÞj½YÀL25¹A2"Mh¿hBe9/2�,gº�25M�=@º�º�Be=@.@./.C2"¾¬B�À�=IBJ9Be9/2�¼/,FMJ03254½E¾4FD¤¹<=C?>DYBe=@4/?�BJ9/MJ½A,/?a9ßÁFDE?a25ºj½E¾§Á/MJ½A?aMJDA»�ºJ8:9/2h03,/.@25º�À�=IBJ9ßBe9F2�9/½aÁg2½E¾�àg4F03=@4/?©ºe½A»2"áBe9/=@4/?7=C4>BJ2"MJ25º�Be=@4/?©Be½7À�DEBJ8:9¥Ã�â�º'D«ºe½A.@,3BJ=C½a4�BJ½«BJ9/=1ºHÁ/Me½a¼/.@2"»�À�29FD¤¹A2032"¹a2".@½AÁn250ãDÁg25MJºe½A4FDA.C=1ºe250 ×LØL+�À�=CBe9!DA4©DA?A2"4>B�¼FDaº�2h0u=@43¾ÂMJDaºWBJMe,g8sBe,FMe2-Be9gDYB�8�½a4aBJ=C4<,/½a,Fºe.C;�?>DYBe9F2"M:ºÇ�ÈäÁ/MJ½A?AM:DE»å0/DYB:D¾ÂMe½a»å¹YDEMJ=@½A,Fº�½a4/.C=@4/2�Ç�È%?A,/=1032�ºe½A,/M:8�2hº�DE4F078"½A»ÁFDEMJ25º�Be9/25»ÉBJ½D�Á/MJ2"¹<=C½a,Fºe.C;�8"½A4Fº�BeMJ,F8�Be2507æ<ç"Ô"Î�ènÎJÍWé�Õ@Ô�¿<0325ºJ8�MJ=@¼/=C4F?HBe9/2�,gº�25M5ê º§Ç�ȨÁFMe2"¾Â2"MJ2"4F8"25º5¿E=C4uDA4DYB�BJ2"»Á3B�Be½�032"Be25Me»=@4/2HÀ�9/=@8:9©,/Á£8�½a»=@4/?Á/MJ½A?AM:DE»�ºL»�D¤;�¼g2H½E¾�=C4>BJ2"MJ25º�BLBJ½�BJ9/2�,Fºe2"MhÃ
ë ì$µ�íU±/·�îYìï³�´�ð�íñ¨ò>ó¥²ô¯a°L±3ó¥²/õ:ð�¶£ó
Ç�9/2�º�;3º�Be2"»É9FDAº�D»�,F.IBJ=Iá�»½<0FDE.�,Fºe2"M�=@4>Be2"Me¾ÒDA8"2A¿<=CB�,Fº�2hº�º�;<4>Be9F25ºe=@ºe250©º�Án2"2h8:9 BJ½Me2hDA0Ç�ÈäMe25¹<=C25Àö=@43¾Â½AMJ»�DYBJ=C½a4 BJ½�Be9/2�,Fº�25MjDE4g0©Da8"8"2"Á3B:º�º�=@»Á/.@2�º�Án2"2h8:97=C4/ÁF,3B5Ãnâjº�ÁgDEMeB�½E¾

½A,/M�,gº�25Mj=@4aBJ2"Me¾ÒDA8"2�ÀL2',gº�2�DA4ßDE4/=@»�DYBJ250©BJDA.CN<=@4/?�9/2hDA07=@4aBJ2"?aMJDEBe250©À�=CBe9��ß=@8"Me½>º�½A¾¬B5ê ºº�Án2"2h8:9u2"4/?a=C4F2�� �����d¿>À�9/=18:9u9FD¤¹A2j¼g252"4 ÁFMe½Y¹<=103250�¼<;uÄ���Ç�×� �� ������à /½AM�ºeÁg25258:9u=@4/Á/,3BÀL2H,Fºe2 Æ M:DE?a½A4 Æ =18sB:DYBe2hº�ºeÁg25258:9©=C4/ÁF,3B�ºe½E¾¬BWÀ�DEMJ2AÃ
âÉMJ258"½A»»2"4F032h0 .@=@º�B½E¾jÁ/MJ½A?aMJDA»�º'=1º0/=@ºeÁ/.1D¤;A250 Be½ãBe9/2©,Fºe2"M,/Án½A4 Me2��a,F25º�B½aMMe25?A,/.1DEMJ.C;ãDYB�à��3250�=@4>Be25Me¹YDE.1º5¿]0/DE=@.@;A¿¥À�2"25N>.@;�2"BJ8A¿¦DAº�032�BJ2"MJ»=@4/2h0�¼>;�Be9/2 ,Fº�25M5æÇ�9/=@º=C43¾Â½aMe»�DEBe=@½A4�85DE4½AÁ3BJ=C½a4FDE.@.@;'¼g2�MJ25Da0'½A,/B�BJ½-Be9/2�,Fºe2"M�¼<;�BJ9/2�DE4/=@»�DYBJ250�BJDE.@N<=C4F?�9/2hDA0�ÃÇ�9/2�,Fºe2"M�8"DA4�DE.1º�½H»�DENa2�DH¹a2"MJ¼FDE.<½aM�¼/,3B�BJ½A4�MJ2��>,/2hºWB�¾Â½AM§»½aMe2�032"BJDA=C.@250032hºe8"Me=@Á3Be=@½A4gº½AM�MJ2"¹<=C25À�º�½E¾�Be9/2�MJ258"½A»»2"4F0/250©Á/MJ½A?AM:DE»�º§Be½�¼n2'MJ25DA0«½A,/B�½AM�03=1º�ÁF.@D¤;a250�Ã/Ç�9/2�,gº�25M=@º«DAºeNA250ôBJ½ ?A=@¹A2ß¾Â2"250/¼FDA8:N ½A4ÅBJ9/2ßÁ/MJ½A?aMJDA»º�Be9FDEBuBe9/25; 9FD¤¹A2!À�DYB:8:9/250�¿LÀ�9/2�BJ9/2"M½AM4/½EBBe9F2";�À�2"MJ2 Á/MJ2"¹<=@½A,Fºe.C;�MJ258"½A»»2"4F032h0�¿�Be9/274/2��<B�BJ=C»2©Be9/25; DEMJ2«?a=C¹a2"4 4F2"ÀMe2h8�½A»»2"4g0/DYBJ=C½a4Fº"Ã5Ç�9/=@º¦=1º¦03½a4/2�¼<;Hº�25.C2h8sBe=@4/?�25DA8:9�À�DYB:8:9/250HÁFMe½a?AM:DE»Å¾ÂMJ½A» D�03=1ºeÁ/.@D¤;DE4F0BJ9/2"4 ºe2".@258�Be=@4/?�¾ÂMJ½A»ÝD�»2"4<,u½A¾£25¹YDE.@,FDYBJ=C½a4�½AÁ3BJ=C½a4Fº�½aMLºeÁg2hDEN<=C4F?'D'º�9F½AMeB§Á/9/M:DAºe2º�,F8:97DAº��e.C=@NA2h0 =CB��FÃ
� � ²F¶��j·W±<ó¦¶n±3µj²/ð�í��! §ó¥²� �·�ó#"�³�õ�±���ó%$'&�òa±3ó)(
â 4F2�BWÀ�½AMJN!½E¾�DA?A254aB:º-ÀL½aMeN!¼n2"9/=@4F0ãBe9F2ºJ8�254/25º5¿¥8�½a»Á/.C2"Be25.C;ß9F=@0/0/2"4ã¾ÂMe½a» Be9/2�,gº�25MBe½�»½3032".-DE4F0ô.@25DEMJ4 ,Fºe2"M�Á/MJ2�¾Â25Me254F8�2hº�=C4ŽaMJ0/2"MBe½�ÁFMe½Y¹<=1032©Be9/2ßÁFMe½a?AM:DE»ïMJ258�½a»á»254F0/DEBe=@½A4Fº5ÃFâ Á/=18sBJ½AMJ=@DA.¥½Y¹A25Me¹<=@2"Àö½E¾�Be9/2�DA?A254aBjDAMJ8:9F=IBJ258sBJ,/MJ2-=1º�?a=C¹a2"4©=C4* �=@?A,/MJ2+�AÃ
ExtractorAgent
InformationFacilitator
InformationAgent
ExtractorAgent
Web accessibletelevision programdata.
Web accessibletelevision programdata.
InterfaceAgent
InformationAgent
Agent
AgentRecommender
Collaboration
Agent AgentAgentRecommenderRecommenderRecommender
,.-0/ �21<��3 �¤PJSW�E_iPJ� Z5[�TWoaP54L`5P:XYT�4§SWl�o>_�TWP:lJTW^ASWP
/½AM2hDA8:9x,gº�25M=@4>Be25MJDa8sBe=@4/?�À�=IBJ9xBJ9/2!º�;3º�Be25»ïBe9/25Me2©=1º�DE4 DAºJº�½38�=1DYBJ250ÅʬËgÑ�Ô"ÎÂÌ�Ð�6:ÔÐ�7>Ô�ËgѦDE4g0�D'ÎJÔ�6:ÍEÏ�Ï�Ô�Ë£ÖAÔ"Î�Ð�7>Ô�ËgÑ�ÃYÇ�9/2�=C4>BJ2"Me¾ÒDA8�2�DE?a2"4>B¦9FDA4F03.@25º�DE.@.<,Fº�25M¦=@4>Be25MJDa8sBe=@½A4gº

À�=IBJ97Be9/2�ºe;3ºWBJ2"» DE4F0«BJ9/2'»�,F.IBJ=Iá�»½<0FDE.¥,Fºe2"Mj=C4>Be25M�¾ÒDa8�2aÃ��Bj=1ºjDE.1ºe½DA¼/.@2�Be½�»�DEÁ!,gº�25MMe2��a,F25º�BJºuDA4F0 DA8sBJ=C½a4Fº�=@4>Be½xD�¾Â½aMe» ,/4F0325MJº�BJDA4F0/DA¼/.C2!¼<;xBe9/2ßMJ258"½A»»2"4F0/2"M DA?A2"4>BhÃÇ�9/2�MJ258"½A»»2"4F0325M©DA?A254aBh¿§½a4ÅBe9/2�½EBJ9/2"M©9FDA4F0�¿�03½<25º«4/½EB!03=@Me2h8sBe.@; =C4>BJ2"M:DA8sB«À�=IBJ9Be9/2ß,gº�25Mu¼/,3B =CB«=1ºBJ9/2ß½A4F.C;ôDE?A254>Bu=C4 BJ9/2�ºe;<º�Be25»ÙBJ9FDYB«N>4F½YÀ�º�DE¼n½A,3BuBJ9/2ß,Fºe2"Mhê º¹>=@2"À�=@4/?�Á/MJ2�¾Â25Me254F8�2hº"ÃnÄ<=C4g8�2�BJ9/2'MJ258�½a»»254F0325MjDE?a2"4>B�9FDAº�Be½uDA858�½a»ÁF.C=1º�974<,/»2"MJ½A,gº8�½A»Á/.@2 �«BJDaº�N3º�MJ2".1DYBe2h0©¼g½ABe9©Be½BJ9/2',Fºe2"M�DA4F0«Be9/2�½ABe9/25MjDE?a2"4>BJº5¿3=IB�4/2"2h0/º�Be½9FD¤¹a2�DÁ/=@8�Be,/MJ2�½A¾nBJ9/2j8",/MeMJ2"4>B§º�BJDEBe2�½A¾�DEÜ£DA=CM:º5à U4�ÁFDEMeBe=18�,F.@DAM�=IB:º�N<4/½YÀ�.@2503?a2�8�½a»Án½A4F2"4>B§9FDaºD�MJ2"ÁFMe2hº�254aB:DYBJ=C½a4u¾Â½AM �
� Ñ��FÔæ<ç"Ô�Î�� ç��§ÍEÎsÕCÖY¿£BJ9/2�N<=@4F0!½A¾�¹>=@2"À�=@4/?u9gDE¼/=CBJº-Du,Fºe2"M�9FDAº5¿F9F=@º-8�,/MJMJ2"4>Bj¹<=C25À�=C4F?=C4>BJ2"MJ25º�BJºuDA4F0ô9/=@ºuÁFDAº�B 9/=1ºWBJ½AMJ; À�=CBe9ÅMJ25ºeÁg2h8sB�Be½�BJ9/2ß¹<=@2"À�250ôÁ/MJ½A?AM:DE»�º5Ã�Ç�9/=@º=C4/¾Â½AMJ»DEBe=@½A4©=@º�Me25Á/Me2hº�254>Be250 =C4©BJ9/2H¾Â½AMJ»�½E¾�D,Fºe2"M�Á/MJ½EàF.@2AÃ
� Ñ��FÔ�ÐEÓ¤ÐEʬÕCÐ"ÕCÔÐ�7>Ô�ËgÑÒçHDE4F0uBe9/25=CM�85DEÁFDA¼/=C.@=CBe=@25º5à �B�=1º�DA¼/.@2jBJ½8"½>½aMJ0/=C4FDEBe2-D'4<,/»�¼n2"M½E¾�DE?A254>BJºHDE4F0ãN<4/½YÀ�º-À�9FDYB�B:DAºeN3ºjBJ9/2";ã8"DE4�DA858�½a»ÁF.C=1º�9]¿�À�9FDYB�MJ25ºe½A,/M:8�2hº�BJ9/2";9FD¤¹A2�DA4F0uBJ9/2"=@MjD¤¹[email protected]¼/[email protected]=CBW;AÃ
Ç�9/2ߺ�;3º�Be25» DE.1ºe½�ºe,/Á/Án½AMeBJº D�8�½A.@.@258sBJ=C½a4 ½A¾-=@43¾Â½aMe»�DYBJ=C½a4ź�=CBe2hº"çÇ�9F2!4/½EBJ=C½a4ô½A¾HDA4=C43¾Â½aMe»�DEBe=@½A4uºe=IBJ2j=1º§,Fºe250�Be½�0/25ºJ8�MJ=C¼n2�D�.@½[email protected]"4>Be=CBW;Be9FDEB�8�½a4>BJDE=@4FºLD�ºe2�BL½A¾ ¸Å¸Å¸º�=CBe2hº"ÃAâ�BL25DA8:9�ºe=IBJ2�Be9/25Me2�=1º�DA4!Ô��aÑ�ÎJÐ�6"Ñ�ÍEÎ�Ð�7>Ô�ËgÑ�DE4F0�DA4©Ê¬ËhÌ�ÍYÎsÏ�ÐYÑdÊÒÍYËßÐ�7>Ô"ËFÑdÃaÇ�9/2�MJ½A.@2½E¾�Be9/2H¾Â½aMe»2"M�=1º�BJ½2��<BeM:DA8sBjǦ2".@2"¹<=1º�=@½A4©?A,F=@032H=@43¾Â½AMJ»�DYBJ=C½a4¥¿3Be9F2�Me½a.C2H½E¾¦Be9/2�.@DEB�Be25M�=@ºBe½©»DA=C4>B:DE=@4�D 0/DEBJDA¼FDAºe2'½E¾L2 �<BeM:DA8�Be250ß=C43¾Â½aMe»�DEBe=@½A4¥Ã /½aM-DA.C.¦Be9/2ºe=IBJ25º�Be9/25Me2�=@º�½A4F.C;½A4/2�ʬËhÌ�ÍYÎsÏ�ÐYÑdÊÒÍYË'Ì�Ð�6"ʬÕiʬÑUÐYÑUÍYÎ'Ð�7>Ô"ËFÑ�Be9FDEBL=1º�DE¼F.C2�BJ½'DA858�2"Á/B'�>,/2"MJ=C2hº�¾ÂMJ½A»äBJ9/2�4/2"BWÀL½aMeN½E¾]MJ258"½A»»2"4F0325M�DA?A254aB:º"à �B�=@ºLBe9F2"47DE¼/.@2jBJ½�MJ½A,/Be2�BJ9/25ºe2 �a,F2"MJ=C2hº�BJ½�BJ9/2H=C43¾Â½aMe»�DEBe=@½A4DE?A254>BJº�BJ9FDYB�DEMJ2§DE¼F.C2§Be½�DA4FºeÀL25M�Be9/2 �>,/2"MJ;AÃhÇ�9/2§=@4>Be25M�áUDE?a2"4>B]8�½a»»�,/4/=18"DEBe=@½A4'=1º]¼gDAºe250½A47ºWB:DE4F0/DAMJ0©GH4/½YÀ�.@2503?a2� �,F2"MJ; �ßDE4F=CÁ/,F.@DEBe=@½A4 Ú G� ���¦Û � ��� ��Ág25M�¾Â½aMe»�DEBe=@¹A25º5Ã
/½AM«Be9F2�8"½A.@.@DA¼g½aMJDEBe=@¹A2!MJ258�½a»»254F0/DEBe=@½A4¨8�½a»Ág½a4/2"4>B7½A4/2 6JÍEÕ¬ÕCÐ:ÍEÎeÐYÑdÊÒÍYË Ð�7aÔ"ËFÑ2 �3=IB:º"Ã���258"½A»»2"4F0/2"M�DA?A254aB:º�MJ2"?A=1º�Be2"M�Be9/25=CM�,Fº�25M5ê º�=@4>Be2"MJ25º�BjÁ/MJ½Eàg.C2'À�=CBe97BJ9/=1º�DA?A2"4>BhÃ�B�BJ9/2"4ß,gº�2hº�BJ9/25ºe2�MJ2"?a=@º�Be25Me2h07=C4>Be25Me2hºWB-Á/MJ½EàF.@25º�Be½«DA,3Be½a»�DYBe=18"DA.C.@;7DE4F0ß0/;>4gDE»=@[email protected];8�MJ25DYBJ2!DE4F0 »�DE=@4>BJDA=C4 =@4aBJ2"MJ25º�Bu?AMJ½A,/ÁgºÀ�=IBJ9/=C4Å»�DA=C4Å8"DEBe25?A½AMJ=@25º½E¾�Á/MJ½A?aMJDA»º5à /½aM2 �/DE»Á/.@2A¿gBe9/25Me2�=@º-D ºe2�B-½E¾§=@4>Be25Me2hºWB-?AMJ½A,/ÁFº�¾Â½AM�ç:ʬÑdæFÐYÑdÊÒÍYË 6:ÍEÏÔ:ÖYÊÒÔ�çs¿�DE4/½ABe9/25M-ºe2�B-½E¾=C4>Be25Me2hºWBL?AMJ½A,/ÁFº�¾Â½AM�ÖaÍ�6"æ3ÏÔ"ËFÑUÐYÎsÊÒÔ�ç�DA4F0�º�½�½A4¥Ã ¸ 9/2"4u½a4/2�½E¾�BJ9/2�,Fºe2"M:º�MJ2"Án½AMeBJº�Be9FDEBBe9/25; 9FD¤¹a2-,F4/2 �3Án258sBJ2503.@;©2"4��W½Y;a250©DÁ/Me½a?AM:DE» Ú ,/4/2 �3Án258�Be250/.C;©¼g2h8"DA,Fº�2HBJ9/2�Á/MJ½A?aMJDA»À�Daº¦4F½EB�Me2h8�½a»»254F03250�¼<;HBe9/25=CM�DA?A2"4>BsÛ�BJ9/2"=@M�Me2h8�½a»»254F032"M�DA?A2"4>B�À�[email protected]=@»»[email protected];=C43¾Â½aMe»�BJ9/2�8"½A.@.@DA¼g½aMJDEBe=@½A4ßDE?a2"4>B5ÃnÇ�9/=1ºjÀ�[email protected].¦Be9F2"4�MJ½A,/Be2�BJ9/=@º-=@43¾Â½AMJ»�DYBJ=C½a47Be½«DA.C.¦Be9F2Me2h8�½A»»2"4g032"M�DE?a2"4>BJº�=@4Be9/2�ºJDE»2�=C4>Be25Me2hºWB�?aMe½a,/Á¥ÃEקDa8:9�½A¾FBe9F25ºe2�DA?A254aB:º�À�[email protected]�½a»á»254F0«Be9/=1º�4/25ÀöÁFMe½a?AM:DE»�Be½�=CBJº�,Fºe2"M�=C¾�Be9/2�,Fºe2"M�9gDAºe4¥ê B�;a2�B�ºe2"2"47=CB5ÃFÇ�9F2"; 85DE4«Be9/2548"DYB:8:9 BJ9/2HÁ/MJ½A?AM:DE»Ý½a4©DMJ2"Án25DYB�½aM�½a4«=CBJº�4F2 �<B�2"Á/=1ºe½<0/2A¿3=C¾¦=CB�=@º�Dºe2"MJ=C2hºL½aM�Dºe2"MJ=1DE.dÃ�!½AMJ2u?A254/2"M:DE.@.@;A¿¥2hDA8:9�Be=@»2 BJ9/2 ,gº�25M�?A=@¹A2hº�¾Â252503¼FDa8:Nã½a4�Be9/2©Á/MJ½A?aMJDA»º-BJ9/2";�9FD¤¹a2À�DEBJ8:9/2h0uBJ9/2HMe2h8�½A»»2"4g032"M�DA?A2"4>B�,/Á£0/DYBJ25º�BJ9/2H,Fº�25M5ê º�Á/MJ½EàF.@2H,Fºe=C4/?�032hºe8"Me=@Á3BJ=C½a4Fº�½E¾Be9/2'¹<=@2"À�2507Á/MJ½A?aMJDA»�º"Ã/Ç�9/=1º�=@47Be,FMe4ß85DE,Fºe25º�BJ9/2�=@4>Be25Me2hºWB�?aMe½a,/ÁFº�BJ½u¼g2�,/Án0FDYBe2h0�à �B»D¤;«¼g2�Be9/28"Daº�2HBJ9FDYB�DA4!,/Á£0/DYBJ250!,Fºe2"MjÁ/Me½AàF.@2'=@ºj»½Y¹A250«¾ÂMJ½A»�½A4/2�=@4>Be25Me2hºWBj?aMe½a,/ÁBe½uDE4F½EBe9F2"M�¼<;uBe9F2'8�½[email protected]¼n½AM:DYBe=@½A4©DE?a2"4>B5¿3½aM�=CBj»�D¤;u¼n2�,Fºe250 Be½¾Â½AMJ» BJ9/2'4<,F8�.@2",gº�½E¾D�4F2"À ?AMJ½A,/Á/=@4/?gÃ

� ìï³�´jó]í�íe·�°�� ð�°j´��'ó]ð�²g°j·�°�� ñ¨ò>ó¥² ¯a°L±3ó¥²/ó]òa±/ò
¸ 9/2"4©»½<0/2"[email protected]=@4/?D�,Fºe2"Mhê º§¹<=@2"À�=@4/?�9gDE¼/=CBJºLBe9F2"MJ2-DAMe2jBWÀL½�BW;>Án25º�½A¾]=C4/¾Â½AMJ»DEBe=@½A4 Be9FDEB4/2"2h0 BJ½¼g2'8"½A4Fºe=@0/2"MJ250�Ã� �=CM:º�Be.@;uBe9F2"MJ2HDAMe2HÁ/MJ½A?aMJDA»�º�BJ9FDYBjDAMe2H8�½a4FºWB:DE4>Be.@;uMJ2"Án25DEBe=@4/?º�,F8:9 DAººe2"MJ=C2hº�Be9FDEB�Be9/27¹<=C25ÀL25MuDE.@À�D¤;3º�À�DEBJ8:9/2hº"¿�DA4F0xÀ�DE4>B:º�BJ½�¼g2!MJ2"»=@4F03250 ½E¾WÃÄ<258"½A4F03.@;A¿EBe9/25Me2�DAMe2�Á/MJ½A?aMJDA»º¦BJ9FDYB§DAMe2�4/25À ¼/,/B§À�=C.@./Á/MJ½A¼gDE¼/.@;'¼n2�.C=@NA2h0�¼<;�Be9/2�,gº�25Mº�=@4F8�2�Be9F2";�9FD¤¹a2jÁ/MJ2"¹<=@½A,Fºe.C;.@=CNa250!çsʬÏʬÕCÐYÎ�Á/Me½a?AM:DE»�º5à ¸ 2�MJ2"Á/MJ25ºe2"4>BLBe9/2-,Fºe2"M�Á/MJ½EàF.@2DAº�ºe2"ÁFDAMJDEBe2�Á/MJ25032"àF4/2h0�8"DYBJ2"?a½AMJ=C2hº¦½A¾�=C4>Be25Me2hºWBh¿Aºe,F8:9�DAº�03M:DE»�Daº�DE4F08"½A»2503=@25º5ÃA×LDA8:9=C4>Be25Me2hºWB�8"DEBe25?A½AMJ;=C4 Be,/MJ4©=@º�»½3032"[email protected]«DaºLBWÀL½8�½A»Án½A4/254>BJº5Ã<Ç�9F2�àgMJº�B�=1º�D�»½30325.�½E¾DE.@.�Á/MJ½A?AM:DE»�BJ=IBJ.C2hº�Be9gDYB�Be9F2�,Fº�25M�9FDAºH¹<=@2"À�250�DE4g0ã?a=C¹a2"4ã¾Â2"2h03¼FDA8:N�½A4¥¿£BJ9/2 ºe258�½a4F0DEMJ2Be9/2uNa2";�¾Â25DYBJ,/MJ25º�½A¾�BJ9/2 032hºe8"Me=@Á3BJ=C½a4Fº�½E¾�BJ9/25ºe2uÁ/MJ½A?aMJDA»º5à ¸ 2 ,Fº�2uBe9/2�¾Â½aMe»25M=C43¾Â½aMe»�DEBe=@½A4«Be½»½<0/2".]D,Fºe2"Mhê º�¹<=@2"À�=@4/?¼g259FD¤¹<=C½a,/M�DE4F0«,Fºe2HBe9/2�.1DYBeBe25M�=C43¾Â½aMe»�DEBe=@½A4=C47.@25DEMJ4/=@4/?�Be½�MJ258�½a»»254F0«4/2"À Á/MJ½A?AM:DE»�º§Be½Be9F2�,Fº�25M5Ã
��� � ������������������������ �"!�����#$�����&%'��(�)+*,���.-��â ,Fº�25M5ê º�¹<=C25À�=C4F?-¼n2"9gD¤¹>=@½A,FM�=@º�»½30325.C.@250�¾Â½AM�2hDA8:98"DEBe2"?a½AMJ;�½E¾n=C4>Be25Me2hºWB§Daº�BWÀL½HÁFDA=CM:º �/�Ú1032546037 Û 45Ú1892646897 Û;:s¿<À�9/25Me2a¿ 0�2 8�½a»ÁFMe=1º�2hº�½E¾£Á/MJ½A?AM:DE» BJ=IBJ.C2hº�À�9/=18:9MJ258"2"=@¹A2h0'Án½aºe=IBJ=C¹a2¾Â2"250/¼FDA8:N£¿ 0�7 8�½A»Á/MJ=1º�2hº'½E¾�BJ9/½aºe2 ÁFMe½a?AM:DE»�ºHBe9gDYBMe2h8�2"=@¹A2h0�4/2"?>DYBJ=C¹a2�¾Â2"2h03¼FDA8:N£Ã 892DE4F0 897 DEMJ2ºe,/¼Fºe2�B:ºH½E¾�BJ9/25ºe2BWÀL½©.C=1º�BJº-Be9gDYB'DEMJ2�MJ2"?a,/.1DEMJ.C;7MJ2"Án25DYBJ250�Á/Me½a?AM:DE»�º5¿F¾Â½aM2 �/DE»Á/.@2�D�ºe½aDAÁ�½AÁn2"M:DjBe9FDEB�=@º�¼/MJ½aDa0/8"DaºWBJ250HBWÀ�=18�2�D-À�2"2"N£ÃYÞ�25Me2�BJ9/2�DE?a2"4>B�=1º�»�DEN<=@4/?Be9/2�9/25,/Me=1º�Be=18LDaºeºe,/»Á3Be=@½A4�Be9FDEB�=C4?A254/2"M:DE.aBe9/2hº�2�Á/MJ½A?aMJDA»�º¥9FD¤¹a2�Be9F2�?a2"4/25MJDA.aÁgDYB�BJ2"MJ4Be9FDEB�Be9/25; À�[email protected].¥MJ2"Án25DEB�½Y¹A2"M�DÁn2"MJ=C½30«½E¾�Be=@»2aÃ
Ç�9/2-DA.C?a½AMJ=IBJ9/»ÝBe½»�DE=@4>BJDA=C4 Be9/2 Ú�8<2646897 Û�8�½A»Án½A4/254>B�=1º�032"àF4/250©DAº�=@4 �=@?A,/MJ2 �3Ã
=?>�@�ACBDEBGF�,H /�-?I
-KJMLON Ts¡ P�Q«SWf.RSN Ts¡ PUTQ«S�q'VXW.Y �,H /�-?IBGFZ=K[]\^[`_;a6=1\cb d,ae_5f5g�h3hi_;>�j
H IkW HZl1�`H LON Ts¡ P�QuS�q$RmN Ts¡ P5TQ SWfkVBGFZ=K[]\^[`_;a6=1\cb d�j<gn>oF B�ae_5f5g�h3hi_;>�j
-KJMLON Ts¡ P�Q«��f.RmN Ts¡ PpTQ«�§q"VXW.Y �,H /�-?Iqcrts N uwvxPEy7SWfj9_zb{_;B_�BGF6|;awg�h }~b
H IkW HZl1�`H LON Ts¡ P�Qu�§q$RmN Ts¡ PpTQ«��fkVq��3s N u v PEy7S�qj9_zb{_;B_�BGF6|;awg�h }�j
H IkW
,�- / ���F� m�o>P 4§fi`hZ5SW_�TWoaV�[1Z5SLl:Z5V�Q3ZhX>PJXET�}
����� �U��)o�<�������S���S�����+���������������+#����9�.�t�9)o���Ç]½'9gDE4F03.@2�4/½a43á�Me25Ág2hDYBe=@4/?�Á/MJ½A?aMJDA»�º"¿EÀ�2�9FD¤¹a2�032"¹a2".@½AÁn250�DA4uDE.@?A½AMJ=CBe9/»%Be9FDEB§Á/MJ½A¼FDEá¼/=C.@=1ºWBJ=@[email protected];�MJ2"Á/MJ25ºe2"4>B:º¦Dj,Fº�25M5ê º�=C4>BJ2"MJ25º�BJº]¾ÂMe½a»�Be9/2�8�½a4aBJ2"4>BJº�½A¾FÁ/MJ½A?AM:DE»�032hºe8"Me=@Á3Be=@½A4gº

Be9FDEB]Be9F2L,Fºe2"M¦9FDAº¦À�DYBJ8:9F250�DE4g0�MJDEBe2h0�Ã5Ç�9/2�DE?a2"4>B¥Be9F2"4�.@25DAMe4gº�Be9F=@º¦Á/MJ½A¼FDA¼/=C.@=1ºWBJ=@8�ÁFMe½AáàF.C2�=@4F8"Me25»254>BJDE.@.@;�DE4F08�½a4>Be=@4>,F½A,Fºe.C;�,Fº�=@4/?�D-4FDE=@¹A2���D¤;A2hº�=1DE4�Á/MJ½A¼FDA¼/=C.@=1ºWBJ=@8�8�.1DAºJº�=CàF25MDE4F0«Me2h8�½a»»254F0/º�4/25ÀöÁ/MJ½A?aMJDA»�º�BJ½Be9/2�,Fºe2"Mh¿3¼FDaº�2h0 ½a4 BJ9/2�Á/MJ½EàF.@2AÃ
¸ 27MJ2"Á/MJ25ºe2"4>BDã,Fºe2"Mhê º=@4>Be2"MJ25º�B=C4ô25Da8:9x8"DEBe2"?a½AMJ;�DAºNA25;>À�½AM:0/º'Be9FDEB¼n25º�Bu032�áºe8"Me=@¼g2�Be9F28"½A4>Be254>BJº-½E¾�BJ9/2Á/MJ½A?AM:DE»�º�Be9FDEB-BJ9/2,Fºe2"MH9FDAº-.@=CNa250�¿�ºe=C»=@.@DAMe.@;!À�2�,Fºe2Dº�2"B�½A¾�Na2";<À�½AM:0/º§À�9F=@8:9©¼g2hºWBj0/25ºJ8�MJ=C¼n2-Be9/2�Á/MJ½A?aMJDA»�º�BJ9FDYB�BJ9/2H,Fº�25M�03=1º�.@=CNa250«=C472hDA8:98"DYBJ2"?a½AMJ;AÃAǦ½�03½�BJ9/=1º§À�2j,Fºe2�½a,/M§4/½Y¹a2".3¾Â2hDYBJ,/Me2-º�25.C2h8sBJ=C½a4uDE.@?A½AMJ=CBe9/»7Ã���,/M�DE.@?A½aMe=CBe9/»ÀL½aMeN3º�=@4�BJ9/2�¾Â½a.C.@½YÀ�=C4F?-À�D¤;AÃEÇ�9F2�,Fºe2"M�=1º�=@4/[email protected].@;�Daº�Na250�Be½'8".@Daºeºe=I¾Â;DHMe25Á/MJ25ºe2"4>BJDEBe=@¹A2ºeDA»ÁF.C2L½E¾gÇ�ÈôÁ/MJ½A?AM:DE»�º¥Daº]½a4/25º]Be9gDYB�Be9/25;�.C=@NA2L½AM�03=@ºe.@=CNa2AäÇ�9/2�0/25ºJ8�MJ=CÁ3BJ=C½a4Fº¥½A¾/Be9F25ºe2Á/Me½a?AM:DE»�º§DAMe2�Be9/254«ÁFDAMJºe250 DE4F0BJ9/2"=@M�ºWBJ½AÁ«ÀL½aMJ0/º Ú ½aML4/½a43á�=C43¾Â½aMe»�DEBe=@¹A2jÀ�½AM:0/º:Û�ºe,F8:9DAº �JD��/¿5�JDE4F0 �/¿ �e=IB �72�BJ8AæDAMe2�MJ2"»½Y¹A2h0�Ã¥Ç�9/2uÀ�½AM:0/º�DAMe2BJ9/2"4 º�Be25»»2h0�¿],Fºe=@4/?!Be9F2Ág½aM�BJ2"MHºWBJ2"»»2"MHDE.@?A½AMJ=CBe9/» � ���2��¿£º�,F8:9ßBe9FDEB�BJ9/2�À�½AM:0��J8�½A»Á/,/Be2"M:º��uDE4F0 �e8"½A»Á/,3Beá=C4/? ��¼n½EBJ9©º�Be25» Be½BJ9/2HÀL½aMJ0 �e8�½a»Á/,3B�� ¸ 2-,gº�2-Be9F2-2��3Á/Me2hºeºe=@½A4 ¼n2".@½YÀÅBJ½85DE.18�,/.1DYBJ2Be9/2�À�2"=@?A9>B 0�� ¾Â½AM§DHÀ�½AM:0� � DEÁ/Án25DAMe=@4/?H=@4Be9/2j0/25ºJ8�MJ=CÁ3BJ=C½a4½E¾�DH.C=@NA2h0�ÁFMe½a?AM:DE» ¾Â½aM�D8"DYBJ2"?a½AMJ;��À�=IBJ9 DE4uDA4FDE.@½A?a½A,Fº�2��<ÁFMe2hºeºe=C½a4¾Â½AM�BJ9/2�À�2"=@?A9>B§½A¾�DHÀ�½AM:0�¾Â½AM§Be9/2j0/=@ºe.C=@NA2h0Á/Me½a?AM:DE»�º5Ã
0�� � Ú���Ú ���� � � Û��������AÛ����! #"%$ Ú $'&�(/Û Ú �¤ÛÞ�2"MJ2A¿ ��Ú � � � � Û�=@º-BJ9/2uÁ/MJ½A¼FDA¼/[email protected]=CBW;ß½E¾�D7Á/MJ½A?AM:DE» ¼n2".@½A4F?A=@4/?©Be½7Be9F2�.C=@NA2hº�º�,/¼gº�2"B'½E¾8"DYBJ2"?a½AMJ;)�?A=@¹A254 BJ9FDYB�=CBj8�½a4aB:DE=@4FºLBe9/2HÀ�½AM:0*� � ¿3Be9F=@º�=1º�8"DA.@8",/.@DEBe2h0u¾ÂMJ½A»ÝBJ9/2'º�=@»Á/.@2��D¤;a25ºL¾Â½AMJ»�,F.@DEBe=@½A4
��Ú ��+� � � Û � ��Ú � � � � Û ��Ú � Û��Ú � � � ���Û ��Ú ���Û-, ��Ú � � � %.hÛ ��Ú '/sÛ Ú �aÛ
À�9/2"MJ2A¿ ��Ú � � � ��ÒÛ�¿§=1ºBe9/2!ÁFMe½a¼FDE¼/=@.@=IBW;�BJ9FDYB�BJ9/2!Á/MJ½A?aMJDA»$0325ºJ8�MJ=CÁ/Be=@½A4Å8�½a4aB:DE=@4FºBe9F2ÀL½aMJ0�¿0� � ?a=C¹a2"4 BJ9FDYB�=CBu¼g25.C½a4/?aº�BJ½ãBJ9/27.C=@NA2h0xºe,/¼Fºe2�B�½E¾H8"DEBe2"?a½AMJ;1Yà ��Ú ��dÛ�=1ºBe9F2Á/Me½a¼FDE¼F=C.@=IBW;�½E¾�.@=CNa250Á/MJ½A?aMJDA»º�=@4u8"DEBe2"?a½AMJ;� Ú =dà 2A¿aBe9/2�M:DYBJ=C½�½A¾�.C=@NA2h0Be½�DA.C./ÁFMe½a?AM:DE»�º=C4�Be9FDEB§8"DEBe2"?a½AMJ;/ÛsÃYÄ<=C»=@.@DAMe.@; ��Ú � � � %.¤Ûs¿Y=1º�Á/MJ½A¼FDA¼/=C.@=CBW;�Be9FDEB�Be9/2�Á/MJ½A?aMJDA» 0325ºJ8�MJ=CÁ/Be=@½A48�½A4>B:DE=@4Fº�BJ9/2ÀL½aMJ0¥¿!� � ?A=@¹A254ßBJ9FDYBH=IB�¼n2".@½A4/?>º�BJ½ BJ9/2�03=1º�.@=CNa25º-º�,F¼Fº�2"B�½E¾L85DYBe25?A½aMe;2DE4F0 ��Ú � Û�=1º-Be9/2Á/MJ½A¼gDE¼/[email protected]=CBW;!½E¾�03=1º�.@=CNa250ãÁ/MJ½A?AM:DE»�ºj=C4�8"DEBe2"?a½AMJ;�YÃ¥Ç�9/2¹YDE.@,/25º-¾Â½aM��Ú � � � � Ûs¿ ��Ú � � � . Û�¿ ��Ú � Û-DE4g0 ��Ú . Û-DEMJ2�DA.C.�8"½A»Á/,3BJ250�0/=CMJ258�Be.@;7¾ÂMe½a»åBJ9/2BeM:DE=@4/=@4/?º�2"B5Ã
Ç�9/23$%&4(u¹YDE.@,/2H=1º�8"DA.@8",/.@DEBe2h0 ¼<;�BJ9/2H¾Â½AMJ»�,/.1DYBJ=C½a4 �$'&�( � 5768 6 � 5:98 9; < 5 6>= 5 98 6 = 8 9�? � <
��� 5 6@= 5 98 6 = 8 9A? � <B8 6 ,B8 9�?
Ú �>ÛÀ�9/2"MJ2A¿'C B =1º�BJ9/2�4<,/»�¼n2"M]½E¾<Be=@»25º¥À�½AM:0D� � ½38"8",/MJº¥=C4HBJ9/2§ºe2�B]½A¾>Á/MJ½A?aMJDA» 032hºe8"Me=@Á3Be=@½A4gºBe9FDEB�BJ9/2�,Fºe2"M-.@=CNa250!=@4ßBJ9FDYB-ÁFDEMeBe=18�,/.1DEM-8"DEBe2"?a½AMJ;A¿!CFE�=@ºjBe9/24<,/»�¼n2"M-½E¾§Be=@»2hºjÀ�½AM:0� � ½38"8�,FMJº�=@4©Be9/2'ºe2�B�½E¾�Á/MJ½A?aMJDA»ºL½E¾�Be9F2'ºeDA»2�85DYBe25?A½aMe;BJ9FDYB�Be9F2�,Fº�25M�03=1º�.@=CNa250�ÃFG BDE4F0HG E DEMJ2�MJ25ºeÁg2h8sBe=@¹A25.C;a¿nBe9/2�4<,/»�¼g25M-½A¾LÀ�½AM:0/º�=C4ãBe9/2uºe2�BH½E¾�Á/MJ½A?AM:DE»�º�.C=@NA2h0�DA4F003=@ºe.@=CNa250�=@4�Be9FDEB�ÁFDAM�BJ=@8",/.1DEM�85DYBJ2"?A½aMe;aÃ¥â�.@.�Be9/2«¹¤DA.C,F25º�85DE4�¼n2«8"½A»Á/,3BJ250�¾ÂMJ½A» Be9F2BeM:DE=@4/=C4F?ãºe2�B5Ã�Ç�9/2©9/=@?A9/25MBe9/2©ÀL25=C?a9>B�Be9F2«»½AMJ27º�=@?A4/=Càg85DE4>B�BJ9/2«À�½AM:0�Ã�6jºe=C4F?�BJ9/=@ºDEÁ/Á/MJ½aDa8:9 À�2'8"DA.@8",/.@DEBe2-Be9F2IGã¼n25º�B�¾Â25DEBe,/MJ25º�BJ9FDYBj0/25ºJ8�MJ=C¼n2HBe9/2�ÁFMe½a?AM:DE»�º�.C=@NA2h0«DA4F003=@ºe.@=CNa250ß=@4�25DA8:9�8"DEBe2"?a½AMJ;AãǦDA¼/.@2 �=@º�D©ºe½A»2�2��/DE»Á/.@25º-½E¾�¾Â2hDYBJ,/Me2À�½AM:0/º-,Fº�2h0!BJ½

Me25Á/Me2hº�254>BLBJ9/2�,Fºe2"Mhê º�=@4>Be2"MJ25º�B�Á/MJ½EàF.@2�À�9F=@8:979FD¤¹a2�¼n2"254©2��<BeM:DA8sBJ250 ¾ÂMe½a» Be9F2H8"½A4>Be254>B½E¾ Æ M:DE»�D�Á/Me½a?AM:DE»�º�.C=@NA2h0«DA4F0©03=@ºe.@=CNa250©¼<;�Be9/2�,gº�25M5Ã
� �a�ElKH 1<��� P:R"TW^aSWPL��Z5S�qA�§TWZ�SWP:QaSWP:�UPJXET�TWoaP�O�S�R"V'R�lsR�TWP:`hZ"SUpZ5[�R-^>�UPJSs¡ �§�E_IPe��_IXa`HQaSWZ"¢<fiP� =��<_ej
o>Zh�UQa_�Tßqa_i�UPsR"� �Uo>ZYl�~ P:V�PJSW`5P:XqaZYlJTWZ"S��UP:lJSWPJT qa_i�WR"��T �U^>�UQ3P:Xa�[1PsR�S Q<R"_IX �>fiZYZEq QaSWP:�U�U^ASqaPsR5qafi_uq>R"X>`hPeS R��FR"_�S TUS�R5`5_IlTWPJSUSW_�¢$qa_ifiP:V�V'R�R5Xa`hPJS lsR"T�R"��TUSWZhQaoqaP:��TUSWZ5_3qaZYZ5V Q>oYpA�U_iZhfiZh`jSWZhV'R"X>l
� =?[6b =��<_ej�>fIR5l�~EV'R5_if�^>qa` lJSW_iV�_IX'fIR:�lJSW_iV�P _iXE�¤P:��TW_i`�TUSW_CR"f l:Z5^aSUT�A_ilJTW_iV �E_iZhfiP:XYTxQ3Zhfi_il oaZh��T�R5``h^>_if�TW_ ��R�S oA^aXYT V�^aS�qaPeS��T�R5fi~¤PJS Q>fiZ"T P:�E_If ¢>`hoYTo>Zh��T�R"` �E_ilJTW_iV ~A_ififiPJS Vjpa��TWPeSW_IZ5^
����� �U��)o�<������� )�-������� ��9���X��� #$�1�c( �c(��m��)t�1*��m%')����������9���X)��X������n�c���� ��)t���c���X���¸ 2L,Fº�2§Be9/2L4FDE=@¹A2���D¤;a25ºe=@DA4HÁ/Me½a¼FDE¼F=C.@=@º�Be=18�8".@Daºeºe=Iàg2"M � �2�aBe½-032�BJ2"MJ»=@4/2§Be9/2LÁ/Me½a¼FDE¼F=C.@=IBW;Be9FDEB-D�?a=C¹a2"4!Á/MJ½A?aMJDA»å032hºe8"Me=@Á3Be=@½A4!À�=@.@.¦¼n2".@½A4/?uBe½�BJ9/2�ºe2�B-½E¾�Á/MJ½A?aMJDA»º�.@=@NA2507½aM�BJ½Be9/2�ºe2�B�½A¾nÁ/MJ½A?aMJDA»�º¦03=1ºe.C=@NA2h0�=@4�DE4<;'?A=@¹A25485DYBJ2"?A½aMe;a¿¤?A=@¹A2"4�Be9F2�¾Â25DYBJ,/MJ2�¹¤DA.C,F25º�½E¾nBe9F2½E¾£Be9/2�Á/MJ½A?AM:DE» 0325ºJ8�MJ=CÁ/Be=@½A4¥Ã>Ç�9/=@ºL»25DA4Fº�BJ9FDYB§À�2jDAMe2�=@4>Be25Me2hºWBJ250=@4Be9/2�Á/Me½a¼FDE¼F=C.@=IBW;½E¾¥D�Á/MJ½A?aMJDA»ä¼g25=C4F?'=C4>BJ2"MJ25º�Be=@4/?'½AM§,/4/=@4aBJ2"MJ25º�Be=@4/?F¿a?A=@¹A254�BJ9FDYB�=IB�8�½A4>B:DE=@4Fº�½aM§03½<25ºe4¥ê B8�½A4>B:DE=@4«BJ9/2�ºeÁg2h8�=Càg8�Na2";<ÀL½aMJ0Fº�Be9FDEB�DEMJ2�Á/MJ25ºe2"4>B�=C47BJ9/2',Fºe2"MjÁ/Me½AàF.@2AÃgǦ½u032"Be2"MJ»=C4F2Be9/2�ÁFMe½a¼FDE¼/=@.@=IBW;�Be9FDEB�DHÁ/MJ½A?aMJDA»%0325ºJ8�MJ=@Á3Be=@½A4�¼n2".@½A4/?>º�Be½�2"=CBe9/25M�Be9F2�.C=@NA2h0½AM§0/=@ºe.C=@NA2h0º�,/¼gº�2"B�½E¾�D85DYBJ2"?A½aMe;a¿<ÀL2H,Fºe2'×��>,FDEBe=@½A4 �g¿3À�9/=@8:97=1º�Be9F2�4FDE=@¹A2I��D¤;A2hºLÁFMe½a¼FDE¼/=@.@=@º�Be=188�.1DAºJº�=CàF2"MhÃ
����� � 8 ( »�D2����! #" �%$�&('*) .+$�, �%$�&('.- ��Ú � � Û�/ $ ��Ú 0$ � � � Û Ú �<Û
À�9/2"MJ2A¿ � ��� 032"4F½EBe2hºLBe9/2HB:DEMJ?A2�B�¹YDE.@,/2H½E¾]BJ9/2H4FDE=@¹A2D��D¤;A2hº�=1DE4 8".@Daºeºe=CàF2"Mh¿ ��Ú $ � � � ÛL=@ºBe9/2�Á/MJ½A¼FDA¼/[email protected]=CBW;HBe9FDEB�DjÁ/MJ½A?aMJDA» 0325ºJ8�MJ=CÁ/Be=@½A4�8"½A4>BJDA=C4gº¥BJ9/2�ÀL½aMJ0 $ ?a=C¹a2"4'BJ9FDYB�=CB�À�DaºÕiÊ�1AÔ:Ö�½AM�ÖEÊ1ç:ÕIÊ�1AÔ:ÖYÃ<Ç�9/2�4FDA=C¹a2���D¤;A2hº�=1DE4�Á/Me½a¼FDE¼F=C.@=@º�Be=18�8�.1DAºJº�=CàF2"M�9FDaº�¼g252"48:9/½aºe2"4º�=@4F8"2Á/Me25¹<=C½a,FºjMJ25ºe25DAMJ8:9ãº�,/?a?A2hºWB:º�BJ9FDYBH=IB�=1º-¾ÒDAº�Be25M-DEBH.@25DAMe4F=C4/? Be9FDA4ã½ABe9/25M-8".@Daºeºe=Càg8"DEBe=@½A4»2"Be9/½30/º5çâj.@ºe½F¿�=CBJº.@25DAMe4F=C4/?�BJ=C»2!=1º�.C=@4/2hDEM�=@4 BJ9/2!4<,/»�¼n2"M ½E¾�2��/DE»Á/.@25º�DE4g0 =CBJºÁ/Me2h03=18sBe=@½A4«Be=@»2�=@º�=C4F0/2"Án2"4F03254>B�½E¾�Be9/2�4<,/»�¼g25M�½E¾�2 �/DE»Á/.@25º � 22��Ã
3 46587�ó¥²F· ( ó¦°§±3ð�í $�ó�±<±/·�°��%ð�°j´94 �ð�íeµ�ð�±/·W³§°�ò:E� ���9�,�+����-��<�Ç]½7032�BJ2"MJ»=C4/2À�9/2"Be9/25MH=IB�=1ºHÁg½>ºeºe=C¼F.C2�Be½©.C2hDEMJ4�,Fºe2"MHÁ/MJ2�¾Â25Me254F8�2hº�¾Â½aM�Ç�È�ÁFMe½a?AM:DE»�ºDA8"8",/M:DYBe25.C;a¿¤ÀL2�8�½a.C.@258�Be2h0�0/DEBJDj¾ÂMe½a» àF¹a2�,gº�25MJº�½A4D�Be½ABJDE.3½A¾FBJ2"4�03=CÜn25Me254aB�85DYBe25?A½aMe=@25º5ÃקDA8:9©,Fºe2"M�4F½EBe2h0©Be9/2�Á/Me½a?AM:DE»�ºLBe9/25; À�DYB:8:9/2507DE4g0«.@=@NA2507½aM�03=1º�.@=CNa250©½Y¹A25M�DÁg25Me=@½30½E¾�BJ9/Me252 »½A4>BJ9Fº"à �j½EB�DE.@.�,gº�25MJº�MJDEBe2h0�Á/MJ½A?AM:DE»�º�=@4x25¹A25Me;�8"DEBe25?A½AMJ;A¿]¾Â½AM=C4gºWB:DE4F8"2½A4/2,Fºe2"M-½A4/.@;7MJDEBe250ã03M:DE»�DuÁ/MJ½A?aMJDA»�º"ÃFÇ�9F2DA?A2"4>B-=@º-=@4aBJ2"4F0/250�Be½ ¼n2,Fºe250!BJ½ àg4F0

Á/Me½a?AM:DE»�º�Be9gDYB-DAMe2�Me25.C25¹¤DA4>B�Be½�BJ9/2�,gº�25M5ê º�=@4>Be2"MJ25º�BJº5ÃgǦ½u25¹¤DA.C,gDYBe2�Be9/2�2�Ü£258�Be=@¹A2"4F25ºJº½E¾�Be9F2�.@25DAMe4/=@4/?�DA.C?a½AMJ=IBJ9/»7¿A=CBL=1º§4F258�2hºeºJDEMJ;�Be½�MJ,/4�2��<Án2"MJ=@»254>BJº§Be½�ºe2"2�=I¾]Be9/2-DE?A254>B5ê ºÁ/Me2h03=18sBe=@½A4�DA?AMJ2"25ºHÀ�=CBe9�BJ9/2u,Fºe2"M:º�Á/MJ2�¾Â25Me254F8�2hº"æÇ�9/2"MJ2�¾Â½aMe2À�2u,Fºe2uD!º�,/¼gº�2"B�½E¾�Be9F2MJDEBe250¨ÁFDE?a25º ¾Â½AM©BeM:DE=@4/=@4/? BJ9/2�DA.C?a½AMJ=IBJ9/» DE4F0 2"¹YDE.@,FDEBe2ßBJ9/2�2�Ü£258�Be=@¹A2"4F25ºJº ½a4¨Be9F2Me25»DA=C4F=C4/?7M:DYBJ250�ÁFDE?a25º5à /½aM�DE4�=@4F03=@¹>=103,FDA.�BJMe=1DE.�½A¾�DA4�2 �3Ág25Me=@»2"4>B5¿]ÀL2�M:DE4F0/½A».C;º�25.C2h8sBe2h0GßÁFDA?A2hº�Be½�,Fºe2�DAº�D�BJMJDA=C4F=C4/?�º�2"B5¿3DE4F0uMe2hº�25Me¹a250�Be9/2-MJ2"»�DE=@4F0325M§½E¾]Be9/2-0/DYB:DDAº�BJ9/2�Be2hºWB-º�2"B5Ã� �=@?A,/MJ2 �uºe9/½YÀ�º�Be9/2�Me2hº�,F.IB:º�½A¼3B:DE=@4/250«¾Â½aMj2"¹YDA.C,FDEBe=@4/?Be9F2'.C2hDEMJ4/=@4/?
35
40
45
50
55
60
65
70
75
80
85
0 10 20 30 40 50 60 70 80 90 100
Acc
urac
y
Training set size
Evaluation of the Learning Algorithm
DramasFilms
ComediesSports
,.-0/ ���F� �]�5R5fi^<R�TW_iZhXZ"[£TWo>P�fiPsR�SWX>_iX>`'R"`hP:XYT
DE?A254>B�½a4�Ì�ÍYæ3ÎH03=IÜ£2"MJ2"4>B§85DYBe25?A½aMe=@25º�Ç�9/2�0/=@ºeÁ/.1D¤;A250�MJ25ºe,/.IB:º�ºe9/½YÀ BJ9/2jDA858�,/M:DA8";�½E¾£Be9F2Á/Me2h03=18sBe=@½A4gº Ú =�à 2-Be9/2-Án½AMeBe=@½A4 ½A¾�8"½AMJMe2h8sBe.@;8�.1DAºJº�=CàF250 Á/MJ½A?AM:DE»�º�¾Â½AM�[email protected]/2H,Fºe2"M:º§À�9F½MJDEBe250uÁ/Me½a?AM:DE»�º�=@4«Be9FDEB�85DYBe25?A½aMe;/Û�DA4F0�BJ9/2H4>,F»�¼n2"M�½E¾]Á/MJ½A?aMJDA»�º�,Fºe250uBe½�BeM:DE=@4uBe9F2DE.@?A½AMJ=CBe9/» À�=CBe9/=@47Be9gDYBj8"DEBe25?A½AMJ;AÃ
� � ó]í�ð¦±3ó]´�� ³�²��
Ç�9/2"MJ2ßDEMJ2!º�25¹A2"M:DE.�8"½A»»2"M:8�=1DE.�ק.C2h8sBeMJ½A4F=@8©Á/MJ½A?aMJDA»ï?A,/=10325º º�,F8:9ÅDaºu+-,/=@0/2�áUØ�.@,Fº"¿ÄF� ��Çö?a,/=1032A¿FÇ�=@È�½F¿nâ � ��Ç�È Be9gDYBj9FD¤¹a2H¼g252"4!2"»�¼g2h0/032h07=C4ßÇ�È�ê º�DE4F0©È�K ��ê º�¾Â½aM.C2hDA03=@4/?!¼/M:DE4F0Fº�½E¾�8�½a4Fº�,F»25M'2".@258�BeMJ½A4/=18"º'2��>,/=@Á/»2"4>B5Ã�Ä<½A»2�½E¾�BJ9/2�¾Â,/4F8�Be=@½A4FDA.C=CBe=@25ºBe9FDEB©BJ9/2";ÅÁFMe½Y¹<=1032�DAMe2 � ¼FMe½YÀ�ºe=C4F? Be9F2�Ç�È*?a,/=@0/2ãÀ�9/=@.@2ãÀ�DYB:8:9/=C4F?ôÇ�È�¿�Be½ô»DAMeN

¾ÒD¤¹A½A,FMe=CBe2Á/MJ½A?aMJDA»º-DE4g0ã¼n2uMJ2"»=@4F03250�À�9/254�Be9/25;ãº�BJDEMeB5¿¥Be½ßDE,/Be½A»�DEBe=18"DE.@.@;!Me2h8�½AM:0¾ÒD¤¹A½A,FMe=CBe2Hº�½>DEÁFº5Ã
��258"2"4>B¦;a25DEM:º�9FD¤¹a2§ºe2"2"4'Be9/2�032"¹a2".@½AÁ/»254aB¦½E¾/=@4aBJ2"[email protected]=@?A254>B�DE4g0�Ág25MJºe½A4gDE.@=@ºe250�×LØL+ê º¾Â½AML0/=C?a=IB:DE.gÇ�È�Ã>ØLÇ�È � � � � �2�g=1º§D'ºe;3ºWBJ2"»�Be9FDEBLÁ/MJ½Y¹<=@0/25º�BJ9/2j,Fºe2"MLÀ�=IBJ9 D�9<;<¼/MJ=@0MJ258�á½A»»2"4F0/DEBe=@½A4FºH8"½A»Ág½a4/2"4>BHÀ�9/2"MJ2=IBH2"»Á/.@½Y;3º�¼n½EBJ9�85DAºe2�¼FDaº�2h0�DA4F0�8"½A.@.@DA¼g½aMJDEBe=@¹A2àF.IBJ2"MJ=C4F? Be2h8:9/4/= �>,/25º5Ã�Ç�9F2ã,Fºe2"M©Á/MJ½EàF.@2ß=@4/=CBe=1DE.@=@ºe250öDYB«MJ2"?a=@º�BeM:DYBJ=C½a4Å2"4F8"½30325º«=C4/¾Â½AMeá»DEBe=@½A4�ºe,F8:9�Daº�Ç�È�Á/MJ2�¾Â25Me254F8�2hº�.@=@º�Be=@4/?aº5¿£8:9FDE4/4F2".�=C43¾Â½aMe»�DEBe=@½A4¥¿nÁ/MJ2�¾Â2"MJMJ2507¹<=C25À�=C4F?Be=@»2hº"¿¦Á/MJ½A?AM:DE» ?a2"4/MJ2�2�B:8Eà ��,FM'Me2h8�½a»»254F0/DYBJ=C½a4Fº�8�½a»Ág½a4/2"4>B'=1º�¹A25Me;�º�=@»=C.1DEMHBJ½Ø§Ç�È�=@4�Be9FDEB�=CB�DE.1º�½7Á/MJ½Y¹<=@0/25ºHBJ9/2u,Fºe2"M'À�=CBe9�9<;<¼/MJ=@0�MJ258"½A»»2"4F0/DEBe=@½A4Fº5Ã]Ç�9/2«03=I¾¬á¾Â2"MJ2"4F8"25º�½A¾-½a,/M ºe;<º�Be25»Ù=1º�BJ9FDYBu=CB =1º DE¼F.C27BJ½�.C2hDEMJ4ô,gº�25M�=C4>Be25Me2hºWB«½Y¹A2"MBJ=C»2�DA4F0Be9/=1ºj=1º-DE.1º�½uMJ2��g258sBJ250!À�=CBe9F=C4�Be9/28�½[email protected]¼n½AM:DYBe=@¹A2�MJ258"½A»»2"4F0FDYBe=@½A4ß8"½A»Án½A4/254aBhà ��4F2º�,F8:9ãº�;3º�Be2"»åBe9gDYB�,gº�2hº�Duºe=@»[email protected].@25DAMe4F=C4/?«8�½A»Án½A4/254>Bj=@º � � ��ÃgÇ�9/=1º�ºe;3ºWBJ2"» 2"4g8"DEÁ/áº�,/.1DYBJ25º�Be9FMe252 ,Fºe2"M=@43¾Â½AMJ»�DYBe=@½A4 ºWBJMe2hDE»�º"à U»Á/.@=@8"=IB�¹<=C25À�9/=1ºWBJ½AMJ;A¿�2 �3Á/.@=@8"=IB¹<=C25À�=C4F?Á/Me2"¾Â2"MJ2"4F8"25º�DA4F0�¾Â2"2h03¼FDA8:N�=C4/¾Â½AMJ»DEBe=@½A4½A4uºeÁn258�=Càg8�ºe9/½YÀ�º5ÃEâ�.CBe9/½a,/?A9uDEB§Á/MJ25ºe2"4>B�½A,FMº�;3º�Be2"»å,Fºe25º�2��<ÁF.C=18�=CBj,Fºe2"M�¾Â252503¼gDA8:N ½a4/2�½E¾�½a,/M�¾Â,3Be,FMe2'À�½AMJN3º�=@º�Be½u2��<ÁF.C½aMe2-Be9F2',Fºe2½E¾�=C»Á/.@=@8"=IB�¾Â252503¼gDA8:N�BJ258:9/4/= �>,/25º5Ã
U4 � �2��Du»�,F.IBJ=IáUDE?a2"4>B�¼FDaº�2h0ßקØ�+�=@º�Á/MJ25ºe2"4>Be2h07Be9gDYBHMe2hº�=10325º�½A4ãD ºe2�B�ádBe½aÁß¼n½��£ÃÄ<Ág2h8�=1DE.@=@ºe250ãDE?a2"4>BJºH8�½<½aÁg25MJDEBe2'BJ½7Me2"BeMJ=C25¹A2�DA4F0ß»25Me?a2�=@43¾Â½AMJ»�DYBJ=C½a4�¼/MJ½aDa0/8"DaºWBJ250!=@4Be9/2�ºJDYB�BJ2".@=IBJ2�ºWBJMe2hDE» À�=CBe9�8�½a4aBJ2"4>BH2 �<BeM:DA8�Be250ß¾ÂMe½a» ¸ 2"¼�DA8"8"25ºJº�=@¼/.@2Ç�ÈÝ?a,/=@0/25º5Ã#�B.C2hDEMJ4Fº�,Fºe2"M:º�Á/MJ2�¾Â25Me254F8�2hº�DE4g0!¹<=C25À�=C4/? ¼g259FD¤¹<=C½a,/M�Be½«º�,/?a?A2hºWBj=@4>Be25Me2hºWBJ=C4/?�ÁFMe½a?AM:DE»�ºBe½Be9F2-,gº�25M5Ã
Ä<½A»2�À�2"[email protected]<4/½YÀ�4HMe2h8�½A»»2"4g032"M¥ºe;3ºWBJ2"»�º¥DEMJ2¦ènæ3ÎeÔ 6:ÍYËgÑ�Ô"ËFÑ�� :Фç"Ô:Ö-º�;3º�Be2"»�º.� 22��¿�� �:�2�d¿� �22��¿�� �2��¿�� ������¿Yè£æ3ÎeÔ 6:ÍYÕ¬ÕCÐ :ÍYÎeÐEÑ�ʬÓYÔ�ºe;<º�Be25»�º � ���2��¿�� �����d¿ � ������¿�� �'�2�£DE4F0 ���ÎsÊÒÖ º�;3º�Be25»º� ���d¿ � �A�2��à $�µ ( (�ð�²�&Éð�°j´���µ�±/µ�²/ó � ³�² �
U4uBe9F=@º�ÁFDAÁg25MLÀ�2-Á/Me2hº�254>Be250 DE4«DA?A254aB�¼FDAºe250«×�.@258�BeMJ½A4/=18jاMe½a?AM:DE»�+-,F=@032-BJ9FDYB�?A=@¹A2hº,Fº�25MJº§Ç�ȨÁ/MJ½A?AM:DE»%Me2h8�½A»»2"4g0/DYBJ=C½a4Fº"ÃaÇ�9/2jºe;<º�Be25» .@25DAMe4gº�DH,Fºe2"Mhê º�MJ2"?a,/.1DEM�¹<=C25À�=C4F?¼g259FD¤¹<=C½a,/M5¿3À�9F=@8:9!DEMJ2HBe9F2�Á/Me½a?AM:DE»�ºLBe9FDEB�Be9F2',Fºe2"M�MJ2"?A,F.@DAMe.@;uÀ�DYBJ8:9F25º5Ã��Bj,Fºe25º�BJ9/=@ºÁ/Me½AàF.@2�BJ½?A=@¹A2H,Fºe2"M�DE,/Be½A»�DEBe=18�MJ2"»=@4F0325MJº5Ã/Ç�9/2'DE?a2"4>B�DE.1º�½Á/MJ½A¼FDA¼/[email protected]=1ºWBJ=@[email protected];�MJ2"ÁFMe2"áº�254aB:º�DE4F0 .C2hDEMJ4Fº�D,Fº�25M5ê º�=C4>BJ2"MJ25º�B�Á/MJ½Eàg.C2-¾ÂMJ½A»ÝBe9F2H8"½A4>Be254>BJº�½E¾¦Be9/2�032hºe8"Me=@Á3BJ=C½a4Fº�½E¾Be9/2-Á/MJ½A?AM:DE»�º�BJ9/2-,Fº�25ML9gDAºLÁ/Me25¹<=C½a,Fº�.@;MJDEBe250¥Ã ��2h8�½a»»254F032"M�DE?a2"4>BJºLDE.1º�½�,Fºe2�Be9F25ºe2Á/Me½AàF.@25º-Be½7MJ2"?a=@º�Be25MHBe9/25=CM�,Fºe2"M:ºH=@4aBJ2"MJ25º�BJºHÀ�=CBe9�D!8�½a.C.1DE¼n½AM:DYBJ=C½a4ãDA?A2"4>B-Be9FDEB'?AMJ½A,/Ágº,Fº�25MJº§DA8"8"½AM:03=@4/?jBJ½�Be9F2�º�=@»=C.1DEMJ=IBW;�½E¾nBe9/25=CML=C4>BJ2"MJ25º�BJº5à ¸ 9/2"4�½a4/2�,Fºe2"M�=@4�DHÁFDEMeBe=18�,F.@DAM?AMJ½A,/Á�àF4F0Fº'D!4/25À =CBe25»�BJ9FDYB�BJ9/2";�9FD¤¹a2�À�DEBJ8:9/2h0�DA4F0�.C=@NA2h0�Be9/254�2"¹a2"MJ;ß»2"»�¼n2"MÀ�=IBJ9/=C4«Be9gDYB�?AMJ½A,/Á«=@º�=@43¾Â½AMJ»250�Ã/Ç�9F=@º�À�D¤;�BJ9/2�8�½a.C.1DE¼n½AM:DYBJ=C¹a2jMJ258�½a»»254F0/DEBe=@½A4Fº�DEMJ203=@ºJºe2"»=C4gDYBe2h0uBJ½uDE.@.�»2"»�¼n2"M:º�À�=CBe9/=@47Be9/2�?aMe½a,/Á¥Ã
U4ô½a,/M�¾Â,3BJ,/MJ2ßÀL½aMeN�À�2ß=@4>Be2"4g0xBJ½�¾Â,/MeBe9/25M 8�½a4>Be=@4>,F27Be9/2ß0325¹A25.C½aÁ/»2"4>Bu½E¾HBe9F28�½[email protected]¼n½AM:DYBe=@¹A2MJ258"½A»»2"4F0/DEBe=@½A4�8�½a»Ág½a4/2"4>B�DE4g0�2"¹YDE.@,FDYBJ2�=IB:º'Án2"Me¾Â½AMJ»�DE4F8"2!æâ�.1ºe½ÀL2!=@4>Be2"4g0xBJ½�2 �3Á/.@½AMJ27,Fº�=@4/?�=@»ÁF.C=18�=CB«DAºuÀL25.C.�Daº�2 �3Á/.@=@8"=IB�¾Â252503¼gDA8:N�BJ½�2".@=@8"=IB ,gº�25M=C4>Be25Me2hºWB:º"Ã

�ôó]õJó]²/ó]°j¶£ó¦ò
}5���£��\�Z5TUTWPJSR5X>q�zL��kAVjpATWo�LÒy������cVe���]m����¦cdXYTWP:fifi_I`5P:XYT��£PJSW�UZhX>R5fi_i�UPsq m�� ��^>_IqAP:�:����SWZ5�l:PJPsqa_iX>`5��Z5[�TWoaP�}�ysTWo©c�X>X>Z��5R"TW_i�¤P 4LQ>Qafi_Il:R"TW_iZhXa��Z5[.4�SUTW_i¢>l:_IR5f]cdXYTWP:fifi_i`hP:Xal:P"L¬c 4'4LcÒ��y������<V\�Z5Xa[1PeSWP:X>l:P5��4 4'4Lc¦�¥SWP:�U�
yY��zL�<kAVjpETWoR"X<q�£�>\�Z5TUTWPeS L�}�����cVe�/kE^aSU¢<Xa`jTWoaP�O�_i`h_�T�R5f/v!Rs�¤P��3��P:XaPJS�R"TW_iXa`��£PJSW�UZhX>R5fi_i�UPsqmnPJfIPJ�A_i�U_iZhX���^>_IqaP:�n^>�U_iX>`�\�ZhfifIR5�3Z"S�R"TW_i�¤PhbY\�R5�UPJ�Ò�<R"�UPsq�§P:l:Z5V�V�P:X<qaR"TW_iZhXF�scdX�QASWZYl:P:PsqA_IXa`h�Z"[�TWo>P�TWoa_iS�q�cdXYTWPJSWX>R"TW_iZhX>R5fn\�ZhXa[@PJSWP:Xal:P�ZhXu\�R"�UPJ�Ò�<R5�UP:q�LP:R5�UZhXa_iX>`a�3r^>Xa_Il�ogb<��PJSWV'R"XEp
� ��t¥� 4�qASW_i�U�UZ5X>Zab � �3�£Z5SUTW_i�:bF�£�FmnZ¤R"�U�UZab � �/z�P:fifi_�[1P:V�_iXaPhb�4j�F\�oa_CR�SWZ5TUTWZ�R5X>q 4��3O�_�¢<XaZ 4§SU�l�o>_�TWP:lJTW^ASWP�v©Z5SW~E�Uo>Z5Q Z5X©�£PeSW�UZhX<R"fi_I�WR�TW_iZhX7_iX � ^aTW^ASWP-m�� _iXul:ZhX��^>XalJTW_iZhXu��_�TWo� �TWo«c�Xa�TWPJSWX>R"TW_iZhX>R5f£\�ZhXa[@PJSWP:Xal:P�ZhX��L�UPJSLrZEqaP:fifi_iX>`�y����A}�kEZhXYTWo>Z"[1P:X�LÒ��PJSWV'R5XYp�Ve�
�A���H����^AS�R5QaTW_¬bgk3�g��^aTUT�RAbFO-�gkEleo>R��/PJSsb��A�£rR�SUTW_iX>ZR"X<q��a�n{/_iV�V�PJSWV'R"Xg�4ör^af�TW_i� 4§`hP:XYTm���LP:lJZhV�V�P:X>qaPJSs�5v7Z5SW~E�UoaZhQ�ZhX��£PJSW�UZhX>R5fi_i�WR"TW_iZhX�_iX � ^aTW^aSWPLm��ô_iX�l:ZhX��^aX>lJTW_iZhX���_�TWo �TWocdXYTWPJSWX>R"TW_iZhX>R5fn\�ZhXa[@PJSWP:Xal:P�ZhX��L�UPJS�rZEqaP:fifi_iX>`�y����A}-kEZhXYTWo>Z"[1P:X�LÒ��PJSWV'R5XYp�Ve�
� ��O-�¤z�_ifi�U^>��R"X<q'r«�E��R���sR5Xa_¬� 4��LpA�aSW_Iq��L�UPJS�rZEqaP:f>[@Z5S���PJ����kETWZ5SUp�\�fIR5�U�U_�¢<lsR�TW_iZhXg�a��SWZ5�l:PJPsqa_iX>`5�LZ"[£TWo>P�kAP:�¤PJXETWo�cdXYTWPJSWX>R"TW_iZhX>R5fn\�ZhXA[1PJSWP:Xal:P�ZhX��L�UPJS�rZEqaP:fifi_iX>`A�n} �����E�
! ��r«�¥��R���sR"X>_�R5X>q7O-�¥z�_ifi�U^>�:�¦kYpA�U~A_ifif�R"X<q©v7PJ�3PJSUT �£cdqaP:XYTW_�[@pA_iX>`�c�XETWPeSWP:��TW_iX>`�v7P:�!�U_�TWP:�:���SWZYl:P:PsqA_iX>`h�LZ5[�} � TWo���R"TW_iZhX>R5fn\�ZhXA[1PJSWP:Xal:P�_iX+4Lc��aQaQg� � �"� ! }h��4 4 4§c§}��� ! �
wY��r«�5z�R"fI�>R5XaZ"�E_il�R5X>q#"��5kAoaZho<R"V� � R"�$�5\�ZhXYTWP:XYTU��z�R"�UPhbY\�Z5fifCR"�3Z5S�R�TW_I�hP%LP:lJZhV�V�P:X>q>R"TW_iZ5Xg�\�Z5V�V-^>Xa_ilsR"TW_iZhXa��Z5[�TWoaP54§\�r«�3rR�SWleo©}���hwE�
E��r«��z�R5fi�<R"X>Z��E_Il«R5X>q&"-��kAoaZho<R"V�¦tgPsR�SWX>_iX>`ßcdXA[1Z"SWV'R"TW_iZhX'§PJTUSW_iP:�5R5f'4L`hPJXETW����)(AQ3PJSW_��V�P:XYTW�]��_iTWo�R5^ATWZhV'R�TWPsqHv7P:��z¦SWZs���U_iX>`A�4'4Lc�} ��� � kEQaSW_iX>`�kYpaXaZhQa�U_I^aVöZ5X�c�Xa[@Z5SWV'R"TW_iZ5X��R�TWo>PJSW_iX>` � SWZhV*�LPJTWPJSWZh`5P:X>Z5^>�§O�_i��TUSW_i�>^aTWP:q�¥XA�E_�SWZhXaV�P:XYTW�:��4 4'4Lc���SWP:�U��} ��� � �
�E����nO�^<q>RR5X<q©���+��R�SUTs�£��R�TUTWPJSWX!l:fIR5�U�U_�¢<l:R"TW_iZhX�R5X>q!kAlJP:X>P 4§X<R5f�pA�U_i�:�,�hZ5o>X7v�_ifiPJp©R5X>qkEZhX>�:b-��Pe�."¦Z5SW~3�/} �hw � �
}�A��t¥�n\�o>P:X©R5X<q��H� kEpAlJS�RA�/v©P:�3rR�TWP�� 4 �£PJSW�UZ5X<R5f 4L`5P:XYT�[1Z5S�z¦SWZs���U_iX>`R5X<q©kAPsR�SWleoa_iX>`a�4§^aTWZhXaZhV�Z5^>�.4L`5P:XYTW�:�4§\�r r_iX>XaPsR5Q3Z5fi_I��r��/��k/�F} ���� A�
}5}h��t¥�YmnPeSW�¤P:P:XFb¤v �0�L_ifIf¬bEz§� 4LV�P:XYTWZAb¤O-�Yrl:O�ZhX>R5fIq'R5X>q1�a�A\¦SWPJTWPJSs�Y�2� 3 43�jk4�24�kYpA��TWP:V[@Z5S�kAo<R�SW_iX>`5§P:l:Z5V�V�P:X<qaR"TW_iZhXa�:�a\�ZhV�V-^aX>_ilsR�TW_IZ5X>��Z"[�TWo>P54§\�r«�<rR"SWl�o©} ���¤wE�
}syE�6�j�7��R5^AT8�hbAzL�>kAPJfIV'R"X�R5X<q�r«�akAo>R5oF�9LP*�/PeS�R5f<v7PJ�$�A\�Z5V-�>_iXa_IXa`HkEZYl:_IR5f���PeTd��Z"SW~E��R5X>q\�Z5fIfIR"�3Z5S�R"TW_i�¤P � _if�TWPJSW_iX>`a�3\�ZhV�V�^>X>_ilsR�TW_iZhX>��Z"[�TWo>P54§\�r«�<rR"SWl�o©} ���¤wY�
} � �#�A�6��ZhXa��T�R5Xgb�zL�jr_ififiPJSsb�O-�jrR"fiT8�5b#�a�6�LPJSWfiZYle~¤PeSsb t¥����Z5S�qAZhX¨R5X>q:�a� L_iPsqAf¬�;���LSWZ5^a�Q>tgP:Xa�� 4§Q>QafipA_iX>`!\�ZhfifIR5�3Z5S�R�TW_i�¤P � _if�TWPJSW_iX>`7TWZ<�L�UP:X>PeT=�LPJ���:��\�Z5V�V-^aX>_ilsR"TW_iZ5X>��Z5[�TWoaP4§\�r«�/rR�SWleo«} ���hwE�
}>�a��m�� � _iX>_iXFb "-�"tnR"�aSWZ5^HR5X>q��A�¤rR:pE¢<PJfCq/�?�6@�rt�R5�¥R"X-R"`hP:XYT¥l:Z5V�V-^>Xa_ilsR"TW_iZhXa�nfIR5Xa`h^>R5`hP5�kEZ5[@T���R�SWP 4§`hP:XYTW��PsqA_�TWPsq�Yp=�a�<z]S�Rhqa�Uo>R:� 4'4 4Lc¦��SWP:�U�BAhrcdm ��SWP:�U�:�n}���hw�QF� � �A}e� � } ! �

} � ��O�� rfIqaR5X>_ilh�<�£PJSW�UZhX>R5fnv©P:�av7R"TWl�o>PJS �acdV�QafiP:V�P:XYT�R"TW_iZhX�R5X>qO�P:�U_i`hXF�3mnPJleoaX>_ilsR5f$LPJQ3Z5SUTc �YkE�ÒO����dw��Yw5yEb>O�P:QaT�Z"[]\�ZhV�Qa^aTWPJSLkEl:_iP:X>lJPhb �A�/kETWPe[¬R5X�cdXa��TW_iTW^ATWPh�F} ��� ! �
} ! �6�H�FtgR5Xa`a����Pe����v7P:PsqAPJS �gtgPsR�SWX>_iX>`'TWZ � _If�TWPJS#�LPJTWX>Pe���:�F�¥SWZYl:PJPsqa_iX>`5��Z5[�}sy�TWo cdXYTWPJSWX>R"�TW_iZhX>R5f£\�ZhXa[@PJSWP:Xal:P�ZhX�rR"leoa_iX>PjtgPsR�SWX>_iX>`Ab3rZ"SW`¤R"X ��R5^a[@V'R5XaXgb>kaR"X � S�R"X>�U_i�Ul:Zabg} ��� � �
}swE�6���4§SWV���TUSWZ5X>`§PJT]R5f¬�"v7P:�Av!R�TWleoaPJS ��4ãtFPsR"SWXa_iX>` 4§Q>QASWP:XYTW_IlJP¦[1Z"S¥TWo>P¦v©Z5SWfIqjv�_CqAP¦v©P:�g�4'4 4Lc�}��� � ��kEQaSW_iX>`kEpAXaZhQ>�U_i^aV�ZhX cdXA[1Z"SWV'R"TW_iZhX7��R"TWo>PeSW_IXa`�[CSWZhV �LPJTWPJSWZh`5P:X>Z5^>��O�_i���TUSW_i�>^ATWPsq�¥XE�E_iSWZ5X>V�P:XYTW� 4'4 4§c���SWP:�U�:�
} A���£�£rR5P:�:� 4L`5P:XYTW��TWo<R"T §Psqa^al:P-v©Z5SW~ R5X>q©cdXA[1Z5SWV'R�TW_iZhX 3 �hPJSWfiZ¤Rhq/��\�Z5V�V-^aX>_ilsR"TW_iZ5X>�Z"[�TWo>P54§\�r«b-�¦Z5fI^aV�P � wYb �LZa�<wEb �h^>f�pu} �����a�<Q>Qg� � �"� �0�E�
}�A��z§� ��SW^afi��_il�og�>tg_�[1PJ��TdpAfiP � _iX>qaPJSs� 4Lc�rR5`¤R��:_iX>Phb �¦Z5fi^>V�P-} A�-��Za�<yEbg} ���¤wE�y��A�j���£kaR"f�TWZhX!R"X<q7r«�£��_ififÂ�ncdXYTUSWZEqa^alJTW_iZhX TWZurZEqaPJSWX©cdXa[@Z5SWV'R�TW_IZ5X�§PJTUSW_iP:�5R5f¬��rls�LS�Rs���
�L_Ifif¬b �LPJ� "�Z"SW~3bF}�� � �yY}h��oYTUTWQ�� A�A�������� V�_ilJSWZh�UZ"[@Ts� l:Z5V A"_i_�T A
y5yE��oYTUTWQ�� A�A�������� �U_iV'RA� �U_iXYTWPJ[d� X>Z0A
y � ���£Z"SUTWPJSsbAr«��L�} �� ��<V 4§X 4Lfi`5Z5SW_�TWo>VÅ[1Z"S��U^ � (H��TUSW_iQ>Qa_iX>`a�¤�¥SWZ5`5S�R"V L 4L^ATWZhV'R�TWPsq-tF_I�AS�R"SUpR"X<qc�Xa[1Z"SWV'R"TW_iZhXkEpA��TWP:V��6Veb/}�+L � V �i} � �"�W} � w


Section 2: Interactive TV


Reality Instant Messenger:The Promise of iTV Delivered Today
Mei Chuah
Accenture Technology Labs, Accenture,
1661 Page Mill Road,Palo Alto 94304, USA.
[email protected]://www.accenture.com/techlabs
Abstract. It is 2002, and still the promise of interactive TV (iTV) has not ar-rived. But perhaps it has; we just have not recognized it. Instant messaging (IM) services have 130 million users[5] currently, and that number is expected to quadruple in the next few years. However our current instant messagingin-frastructure is reality unaware (it is not aware of real time events or activities within the physical world). We believe that by making that infrastructure "real-ity conscious" (syncing it to real-time and current events) we will be able to stimulate new services and new opportunities for commerce. One interesting opportunity is to deliver interactive TV services through the instant messaginginfrastructure. For example, by tying instant messaging to live sports events, we can chat with our friends and compete against them for points and prizes even though they may be physically distant. By melding instant messaging with our physical world, we enable many interactive TVservices to be delivered today,through a simple, mobile, freely available platform thatalready has 130 million users.
Keywords: instant messaging, interactive television, interactive TV, impulse purchasing, play-by-play sports, reality syncing.
1 Introduction
Instant messenger (IM) services are extremely popular today, boasting a user base of 130 million peopleon the public servers alone. What’s more, users are not just in the consumer space; there are a significant number of enterprise users as well. Despite the popularity of instant messaging (IM) services, the environment today remains fairly impoverished, especially as a social setting. This is especially true when onecontrasts IM chat to real-world chat. In the real world, we are constantly surrounded by fascinating, dynamic, colorful content that can serve as “conversation props” to facilitate social interactions. We may be in a café watching the crowds pass and the street musicians entertain, we may be in a stadium watching an exciting sports game unfold, or we may be resting at home, watching our favorite drama on television. All

this real world content ismissing from the current instant messaging environmentforcing users to constantly struggle to tie their activities in the physical world into their online social context. We believe that injecting these “reality streams” into the online chat world will significantly enhance user experience and open the door to a broad range of services that hereto have not been considered, or have been too expen-sive and difficult to deploy.
In particular, reality IM allows the promise of iTV to be realized today, with rela-tively low effort and cost. Based on research in the domain, there are three factors that have limited the success of iTV thus far: availability, price, and functionality. Unlike iTV, IM i s widely deployed and boasts a user base of 130 million people. Unlike iTV, IM services are currently offered for free. And unlike iTV, IM has a very compelling functionality (chat) that already draws a large number of users. By delivering iTV through IM, we also expand our reach to consumers through more channels than just the television set. IM operates on a large range of devices, including cellular phones, PDAs, tablets, laptops, and desktops. This enables consumers to access reality IM services, whether they are at home watching a sports event on television1, or at the sports stadium with their IM-enabled cellular phones. Reality IM allows consumers to access relevant services that are synced to their current activity, wherever they may be, within their existing social context. Delivery of iTV services also presents compa-nies with an opportunity to directly generate revenue from their IM technology -something they have been struggling to achieve since IM gained popularity.
In this paper, we discuss and show example scenarios that illustrate how reality IM enables “iTV now” (section 2 & 3). Section 2 outlines how a popular iTV service, such as aplay-by-play sportscompetition, is synced to user activity and delivered through IM, and section 3 outlines how user activity can also be synced through real-ity IM to products (e.g. impulse purchases such as music CDs, DVDs, and toys). In section 4, we lay out the system architecture that enables reality IM services. Finally,we conclude by briefly discussing how reality IM may impact businesses and what aresome future directions.
2 Play-by-Play Sports
We sync real-world events with IM to enhance the IM social environment by in-creasing user awareness of their friends' activities, so that they not only know that their friends are online, but they also know that their friends are watching the very same live competitive sports game as they are. Figure 1 shows a play-by-play interac-tive sports service that is delivered to consumers through IM. Sports lends itself well to reality IM because it is a social activity that is widespread, real-time, and “lean forward” (it encourages audience participation). When users subscribe to the reality
1 Studies show that 25 million people multi-task and browse the web while watching television [4].

IM bot, they receive a list of their friends who are also currently watching the event (Figure 1, section A).
Fig. 1. A reality IM application featuring a play-by-play sports service. The IM session on the right is synced on a play-by-play basis to the real-time golf stream on the left. As events occur on the left, the IM window on the right automatically updates with those events. The system also allows users to interact with the real-time stream. In the example above, the user is given the opportunity to guess how well the current player is going to perform.
By tying users’ buddy lists to the current live television stream, we also introduce the new notion of “buddy surfing.” We are all very familiar with the concept of “channel surfing.” Buddy surfing allows us to quickly skim through different televi-sion channels and check not just what content is currently available for viewing, but also which individuals in our buddy list are on each of the different channels (Figure 1, section A). Television viewing tends to be a very social activity: friends often watch television together, and co-workers congregate around the water cooler to discuss television content. So it is only natural that users would want the ability to surf chan-nels not purely based on content but also on the social context surrounding that con-tent.
In addition to tying the real-time sports stream to our online social network, we can also make that stream interactive. As is shown in Figure 1, the IM session is synced to the real-time golf stream on a play-by-play or event-by-event basis. As events occur in the stream, they get transmitted to each user’s reality IM window as text. Users may also interact with that real-time stream whenever they desire. When a new player comes up to the tee, users are given the opportunity to guess whether that player will be able to meet par, in the current hole (Figure 1, section B, D). Once the play has begun, users may still interact at any time they choose to cancel their existing guess.

Of course, a cancellation will incur a certain score penalty. The size of the score pen-alty will depend on the lateness of the cancellation, as well as the current status of the play. This reality IM service allows users to enjoy continuous passive participation. Users get to socialize and compete for points continuously throughout the event; how-ever, participation is not required. Users may actively interact with the service, or choose to stay passive, let the messages scroll by, focus on the game, and only partici-pate occasionally.
Note that the interactive game is also tied into the social context of the users. In particular, whenever users make a new entry, that information may be broadcast to their buddies (Figure 1, section C). In this way, the application allows groups of friends to participate together, or to compete against each other for points, as if they were all in the same living room. Reality IM services like this are compelling because they allow social groups to come together around an activity that is of interest to all participants, no matter where they may be.
3 Impulse Purchasing
Some Song, Album (2002)Some Artist
Fig. 2. A reality IM application that ties impulse purchases (e.g. music CDs) to real-time music streams such as a concert, or a music video channel.The IM session on the right is synced on a song-by-songbasis to the music stream on the left. The system also allows users to interact with the real-time stream. In the example above, the user is given the opportunity to purchase the CD containing the current song, listen to other songs on the CD that they are about to pur-chase, or get comments on the CD from friends.
Shopping is one of the most popular social activities. In addition to tying services to the reality streams as is described in section 2, we can tie products to those reality streams as well. Figure 2 shows a music channel that could be airing a list of sched-uled music videos or a live music concert. The IM session to the right is synced to the

music stream so that as different songs get played, information about the songs gets displayed in the IM session to the right (Figure 2, section A) and users are given the option to: 1) buy the associated music CD (Figure 2, section D), 2) listen to other songs on the album (Figure 2, section B), or 3) get comments from their friends (Fig-ure 2, section C). Other services can be easily added, such as news about the different artists, trivia games where viewers get to answer questions about the current artist and compete with each other for prizes, as well as live auctions.
Activity-based social shopping is compelling because it only exposes consumers to goods that are of interest to them, at the time of interest. This is in contrast to tradi-tional advertisements or banner advertisements where the ad content is not synced to current user activity and preferences. In addition, consumers may poll friends to gather opinions, and perhaps “show off” by discussing their intent of purchasing a product before making the purchase. Finally, the experience becomes even more com-pelling when users compete in purchases of limited-edition goods through a live-bid auction service. Note that as before, reality IM services are non-intrusive and enable passive interaction: consumers may simply sit back, let the messages scroll by, and only participate when they want to. However, when they choose to participate, all the relevant information and services are readily available and can be easily executed with a simple click. In addition, the services are built on top of the chat functionality that is already very popular with consumers.
4 System Architecture
Figure 3 shows the general transactional flow for the reality IM applications de-scribed in sections 2 and 3. First, we extract events from the relevant real-time streams. This can be achieved manually, automatically, or semi-automatically. Manual extraction involves hiring humans to watch the live stream and then entering the events as they happen based on some predefined framework. Automatic extraction involves the use of sensors to capture the live stream state. The raw sensor readings are further translated into higher-level events that are relevant to the game. This trans-lation process may occur automatically through the use of smart categorization en-gines in a fully automatic system, or it may be achieved manually through the help of a human in a semi-automatic system.
Two classes of sensors are used today. Positional sensors (e.g., GPS– global posi-tioning systems) may be attached to vehicles, objects, and players, to detect their spa-tial coordinates [8]. While such sensors are appropriate for vehicles and objects, there is some worry that they may impede or disrupt a human player’s movement, fall off, or stop working during rigorous play. Thus for events that primarily involve human players (e.g., baseball, golf, soccer) it may be appropriate to use a camera or vision system [6]. In some circumstances, the real-time stream may not be live. For example, in the impulse purchasing scenario (section 3), the music events are completely pre-scheduled or predetermined, so that nothing unexpected may occur. Thus, information

need not be extracted in the same way as in the live sports service in section 2. In situations where the scheduled information is unavailable, it is also possible to derive that information automatically by applying voice recognition or image processing (e.g., OCR) technologies on the television stream [3]. In our prototype system, the event capture component operates off of a taped, pre-scheduled stream.
IM bot1. Extract events from
real-time stream.
Events
Real-time stream
2. Process events;determine audience;format & package content;broadcast.
Processed & formatted content
User response
4. Update internal user profile and/or contact external system (e.g., online ticket/music retailer) to execute relevant actions.
3. Users interact with the reality IM service.
Fig. 3. Transactional flow for delivering reality IM services. Initially, events are extracted from the real-time stream (e.g. the real-time sports game). This may be achieved manually by hiring people to enter the events. The process may also be partly or fully automated through the use of GPS sensors and smart categorization systems. Once extracted, the real-time events are fed into the IM bot, which packages the information and transmits it to the relevant audience. Upon user interaction, the IM bot may take independent action, or alternatively link to an appropriate external system to execute the user request.
Events are represented as objects. The content of the events depend on the real-time stream being captured. Figure 4 shows the event schemas for the golf scenario described in section 2. There is a start event (Golf_start_event), which gets generated before a player starts a swing, and an end event (Golf_end_event), which gets gener-ated when a swing ends and the ball lands on the course. Every Golf_start_eventis followed by a Golf_end_event, which is subsequently followed by another Golf_start_event, and so on. A stream is represented by a sequence of these schemas that reside in a list structure. The Golf_start_event schema contains the player that is currently up on tee, a time stamp, the product or golf equipment the player is currently using, and the current hole that is in play. The Golf_end_event schema contains the player who made the stroke, a time stamp, and the result of the stroke (e.g., “Nice drive, almost of mid-fairway).

class Golf_start_event : pu blic TV_event {
public: string player; int time; string product; int hole;
};
class Golf_end_event : public TV_event {
public: string player; int time; string result;
};
Fig. 4. Example event schemas for the golf reality IM scenario described in section 2.
Once the real-time events are collected, they get transmitted to an IM bot, as is shown in Figure 3, step 2. To properly parse the events, the bot must understand the event schema used to represent the real-time event streams. In our prototype system,we designed both the event capture component and the bot component; thus, it was trivial for both components to operate using the same event schema protocol. We envision that in an actual implementation the event capture component and the bot component may be run by separate entities, in which case the event component mustpublish its event protocol. This protocol can then be intercepted by the bot, which may contain a different parser for each different protocol stream (assuming that different broadcast streams may have different event formats).
Once the events are parsed the IM bot determines which users to broadcast the events to. To support this ability we keep track of which users currently have active reality IM conversation windows open.The IM bot is represented just like any otherIM user and it is implemented using the same functions as an IM client. For users to access the bot services, they merely add it as a “buddy” and then start a conversation window. Currently, our demo works with the MSN messenger as well as the AOL instant messenger TOC protocols. Under both protocols, the bot receives invita-tion/join events from the IM host when users attempt to “chat” or start a conversation window. Similarly, when the conversation windows are closed, the bot receivesgood-bye/closed events. Through these events, the bot can automatically track who it should send its broadcast stream to.In addition to keeping state about whether users are in-terested in receiving the reality streams, we also keep product and service state for each user, such as the current number of points in the golf example in section 2. Also, to allow transactions, such as CD purchasing, the system may need to track certain user information, such as their preferred vendor or their mailing address.
When users receive the bot streams, they may choose to interact with it by entering a bet (in the sports scenario in section 2) or a purchase command (in the impulse pur-chasing scenario in section 3). Different services require a different processing unit to accommodate for the different operations that a user may perform. In the case of the play-by-play sports service described in section 2, the bot is able to process point bets from players that indicate whether they believe the current player will perform well. In golf, this may be an indication of whether the current player will meet par on the cur-rent hole, on the other hand, in baseball, this may be an indication of whether the current batter will get to first base or strike out. In the impulse purchasing scenario

(section 3), the user gets to purchase and experience various products. When users initiate the buy operation, the IM bot contacts a relevant external system that can exe-cute that action rather than re-implementing common transactions. For example, to purchase a CD, the IM bot could contact an online music retailer, or to participate in auctions, the IM bot could contact an existing auction system. In general, when a user types in a command, that command gets interpreted by the bot according to the current service attached to the user. Based on that information, the bot takes some action,which may include updating the internal user profile with a new score count, or con-tacting some other system (e.g., an online ticket retailer) to execute an action.
The type of service that is attached to a user depends on the real-time channel that the user is currently subscribing to. There may be different bots that represent differ-ent real-time channels so that users may open conversations with multiple bots and receive multiple streams simultaneously. Alternatively, there may be a meta-bot that accepts channels from users and, based on user entry, broadcasts the proper event stream. Rather than requiring the user to enter the proper channel, that information may also be automatically captured by an existing television recording box (e.g., TiVo[7]) and then automatically conveyed to the reality IM bot.
Note that IM is supported on a variety of platforms including cellphones, PDAs, tablets, laptops, and desktops; thus, it may be appropriate to package content to each of these devices differently depending on their independent constraints such as screen size and processing speed. In the current implementation, the bot does not have this functionality because such information is not transmitted through the IM protocolsused. An alternative method is for users to specify their desired format to the bot, e.g.,small-screen phone format, mid-sized PDA format or large computer format, with the default being computer or laptop.
By extracting and tying reality events to a user’s online social environment, we en-hance user experience in the following ways:• We provide better awareness of user buddies.• We integrate exciting and colorful real-time content (e.g., a sports game) that can
act as conversational props or conversation fillers for facilitating social interac-tion.
• We enrich the social experience with interactive activities. Users may interact with traditionally more passive activity streams, as a group or individually, using a very familiar interface. Participation is not required so users only interact as of-ten as they desire.
• We enhance a user’s reality streams by connecting them to the user’s social con-text.

5 Conclusion & Future Work
Reality IM allows the promise of iTV to be fulfilled today. It provides a low-cost method of delivering iTV services to consumers, on infrastructure that is already de-ployed and popular. The beauty of using IM is that there is already an enormous user base, the interface is simple, and users already know how to use it. In addition, the application runs not just on television sets but also on wireless and mobile devices, as well as laptops and desktops.Finally, there is already an established social infrastruc-ture built into the application that will facilitate certain services including commerce and entertainment. In fact, by 2005 Gartner predicts that IM use will surpass that of electronic mail [2].
Due to its simplicity, reality IM could potentially bring significant impact to many
businesses today:• Reality IM allows companies to start generating revenue from their popular IM
technology, which is something that they have been struggling to do since IM started gaining popularity.
• Reality IM is a good illustration of the integration of old-style and new-style media, something that many media companies have been trying to achieve since the boom of the internet.
• Reality IM opens up new channels of access to consumers. Online businesses tend to target consumers while they are at their desktop, surfing the web. Reality IM provides the ability to target consumers at their moments of greatest impulse. For example, the moment in which consumers are most likely to purchase a music CD is when they are experiencing that music over the radio, television, movie screen, or a live concert. In addition, reality IM works across a variety of devices;thus, consumers can access the service even when they are not in front of their television sets but are at the sports stadium with their cell phones.
• Reality IM enhances existing real-time channels (e.g., television streams)through the integration of sociability, activity synced commerce, and other interactive content such as mini-games and trivia competitions.
• Reality IM creates a wider back channel from consumers so that companies can gain better customer insight by tracking and identifying the interests and prefer-ences of their customer base.
While the concept of “iTV now” is significant, reality IM also enables a large vari-ety of new services. Reality IM establishes “activity synced channels” that are dy-namic and social, with greater user presence and awareness. By tying real-time streams into IM we not only allow sociability, commerce, and entertainment to be attached to current user activity but we also enable virtual reality syncing, and context syncing.
Virtual Reality Syncing: While many of us spend a large portion of our time engaged in activities in the physical world, there are some of us who also spend a significant amount of time in virtual gaming worlds. The introduction of console boxes (e.g.,

Sony’s Playstation, Microsoft’s Xbox, or Nintendo’s Gamecube) into the consumers’ living rooms has brought on an interesting convergence between the internet, televi-sion, and gaming. These console boxes are very popular, and they have promoted gaming to a large number of users. There is currently one Playstation in at least every four American homes [1]. Thus, j ust as some of us want to be aware that our friends are watching the same baseball game as we are, others of us may want to be aware that our friends are hunting rabbits on a fantasy world, or virtually racing motorcycles on the Bay Bridge. Presence and awareness should not simply stop where the physical world ends, but rather should extend to wherever consumers are spending their time, including online virtual environments. Just as it makes sense to allow users to share their “real world” experiences in online chat environments, it also makes sense to allow them to share their virtual experiences, especially since actions can be more easily tracked and stored in a virtual digital world.
Context Syncing: Currently, IM context consists solely of whether a user is available for chat, online but unavailable (e.g., out to lunch), or not online. Through reality syncing, we can significantly enhance context awareness by automatically addingphysical context (e.g., time of day, weather, and location) or mental context (e.g.,mood as captured by current financial status, number and urgency of items on calen-dar or timbre of recent messages and postings as determined by their emoticons, as well as positive and negative phrases). In addition, presence can also be enhanced so that users leave a “trailing scent” (e.g., the last time they logged on, their last mental and physical context, and any current significant events) whenthey are not online.
Reality IM underscores the coming of a large trend, namely the establishment of services or products that sit between the three worlds that we live in today: the real/physical world, the digital textual data world, and the 3D graphical virtual worlds. Throughout these three environments, the social network remains constant amongst its participants. This puts technologies like instant messaging in a unique position to tie together all three worlds. Reality IM illustrates how the stitching between the worldsmay occur, and what new opportunities emerge from this new integration.
References
1. Berst, J., Playstation to TV: You’re Dead, ZDNet AnchorDesk, May 12, 2000.2. Caterinicchia, D., IM-ing will overtake e-mail, Federal Computer Week, May 14,
2001.3. Kanade, S., Hughes, T., and Smith, M. Video OCR for Digital News Archive, in
Proc. Workshop on Content-Based Access of Image and Video Databases, Los Alamitos, CA, Jan 1998, 52-60.
4. NewMedia Staff, Showtime Finds 39 Percent Growth in Simultaneous Use of TV and the Web,Business Design Technology, August 15, 2000.
5. Ochwat, J., Knocking on AIM’s Door, O’Reilly OpenP2P.com, Oct 27, 2000.6. Sport Universal, http://www.sport-universal.com.7. TiVo, http://www.tivo.com.8. Virtual Spectator, http://www.virtualspectator.com.

Design of a Personalization Service for an Interactive TV Environment
Nuno Correia1, Marlene Peres2
1 Computer Science Department, Faculty of Sciences and Technology, New University of Lisbon, Portugal
[email protected] 2 Faculty of Engineering,
University of Porto, Portugal [email protected]
Abstract. The paper presents a prototype personalization service for interactive television. It describes the design principles that were the basis for the prototype application. This application is a study based on a commercial interactive television system. Based on the experience gathered with this prototype, the paper stresses the fundamental role of personalization in interactive TV environments and outlines general principles for designing this type of services. These principles will be the basis for further work on this area.
Keywords: UI Design, Personalization, Interactive TV.
1 Introduction
This paper presents a prototype for a personalization service in an interactive TV environment. The design paradigm and issues are discussed along with the preliminary results. The experiment was done as a study on a commercial TV system and it is a personalization service, named MyTV. The service allows the user to customize different aspects of the look and feel of the user interface. It is a first approach for personalizing an interactive TV environment and it includes some basic personalization functions. There are different personalization approaches, ranging from totally automatic to totally manual. We believe that a mixed approach will provide the best results. The system can suggest different options but the user should have the opportunity to override these choices. In our first approach the user has total control but there are some predefined templates that will help to make the choices. The concept of personalization is a global trend, in many aspects of human activities. Among these are electronic (and off-line) commerce and information delivery (for

example, clipping services provide a personalized view on an individual or an organization). In interactive information and entertainment systems personalization is a fundamental aspect that has to be handled. This is caused by the fact that too many options, services and tools are available. Mechanisms for quickly choosing the best options for a given user are fundamental. In interactive TV environments, where the TV is shared by several users this is even more relevant. The following describes personalization approaches and propose design principles that should be followed when building tools that will be used to customize interactive environments. There are different types of personalization [1] in interactive services and applications. They can be classified accordingly to the following categories:
Personalization of Presentation: allowing to personalize different aspects of the user interface, including colors, position of interface items and fonts.
Personalization of Content: where different content can be generated for
different users. For example, for a news on demand system the user would only receive the news about sports. The commercials would also be about sports, but considering the previous purchases of the user.
For the two types of personalization approaches there are different tools and methods. There are two main methods that can be identified: one that relies on the user to provide profile/configuration information and other where it is the system that gathers the necessary data. For this last method the data can be from just one user or from a set of users (collaborative filtering). The interactive TV project in Portugal was implemented by TV Cabo, a Portugal Telecom Company. The service of TV Cabo is based on the network of TV Cabo as the communications infrastructure, on digital set top boxes (STBs) designed by OctalTV and Pace and it uses the Microsoft TV Platform. This platform is split in two main components: the client running on the STB and the server that manages the service. The client runs Windows CE and the main applications are the browser and clients for other services such as EPG and Mail. All this is integrated in the TV Cabo Service in a “TV Portal”. The Microsoft TV platform combines the video signal with additional interactive content. The video signal includes the links or scripts that will trigger the pages containing interactive materials. This interactive content use the same technologies that are commonly used on the Web, namely HTML, CSS and Java Script. As such the architecture and tools for the applications are also quite similar to what is currently used on the Web. This is the environment that was considered in the work described in this paper.
2 Design Principles and Prototype
This section presents design guidelines, for interactive TV, that were followed during the development of the prototype. Research revels that consumers want convenient
and personalized systems while watching and interacting with different television content. It is vital that interfaces are conceived according to their target and are flexible enough for users to adapt to their personal preferences. Before developing any graphical concept, designers must understand the technology and identify the basic features of Interactive Television. Surfing on the television is not the same thing as surfing on a computer. People at home are not used to using scroll bars or look for information in a complex system. Simple, direct and graphical interfaces that answer to the needs of the users resolve problems in a clear and economical form. A lot of information on the screen is tiresome and confusing. Well planned and elegant solutions facilitate the learning process and recognition of figures, icons, signs and images and minimize the need of memorization. The design of interactive programs should consider the habits of users, people use their mental model to make associations between information (words, images, sounds), they interpret information according to what they know.
The correct use of color can improve the visual communication. The visual system of each person responds differently to different colors. The code of color used in an interface should support its function positively and require the minimum effort of the television viewer. Different feelings are associated to different colors that transport different messages. A user friendly interface on interactive television should be easy to use, easy to learn, easy to understand, easy to avoid errors, easy to support and easy to share in a group. People normally watch TV at a distance of three meters accompanied by someone, rarely alone. Creating interactive television as a collective experience implies the adoption of a new position in terms of communication processes. TV viewers are not used to waiting and are demanding. The possibility of personalizing the interactive environment is one of consequences of the principles above. They can change different presentation options and services. This kind of service can influence positively the motivation of public in general in the use of interactive television. In interactive TV, even more than the Internet, personalization and customization are fundamental services. A personal computer is, most of the times, only used by one person. The TV is, in general, shared by different people. As such the ability to customize the environment to a given type of user is more crucial. The application, named MyTV, allows each person to adapt the interactive TV browser to its personal preferences. There is a list of pre-defined interfaces reflecting different typical environments. If the user does not like any of the available interfaces, it can create its own user interface from a list of options. These are the background, font and size for text, position for the menus and buttons. Besides the configuration of the user interface elements it is also possible to configure which services will be visible and how these services will appear. The prototype is very simple and a first approach to personalization in interactive TV. Even so, the design was carefully planned according to the design principles above. The set of available fonts was chosen so that they work well on TV screens (san serif), the pre-defined layouts obey to the navigation rules in an environment without a mouse, there is freedom for the user to

configure the pre-defined layouts and the user can choose the most appropriate services for its needs.
Figure 1: Screen for customizing different aspects of the user interface
3 Conclusions and Future Work
The preliminary evaluation with users indicates that they are interested in these possibilities and that they liked the interface that was provided. A fundamental difference from the traditional Web browser is that several people, with different interests and preferences, typically share the TV set. This implies that personalization mechanisms are necessary. Future developments, that are planned, include semi-automatic (based on the user profile) generation of content for a given user or set of users, integrated with annotation tools. The profile can either be input manually or it can be learned by the system. Based on the preferences, the system will select content (video and other materials) and combine this in structured multimedia documents that will be sent to the user.
References
1. Correia N., Boavida M.: Towards an Integrated Personalization Framework: A Taxonomy and Work Proposals, Workshop on Personalization Techniques in Electronic Publishing on the Web: Trends and Perspectives, Malaga, Spain, (2002)

Interactive Documentaries: First Usability Studies Marianna Nardon, Fabio Pianesi, Massimo Zancanaro
ITC-irst Panté di Povo, Trento Italy
{nardon,pianesi,zancana}@itc.it
Introduction
Today, research on i-TV focuses primarily on added services, such as interactive advertising [Lekakos et al., 2001] and alternative program suggestion [Ardissono et al., 2001]. Yet new technological improvements on video-on-demand and the success of streaming technology for video delivery on the web will also make feasible, in the near future, video content adaptation.
The present work attempts to set the basis for further studies on interactive video productions, such as interactive documentaries. We propose and test a model in which video and audio material can be organized in such a way that the user can choose his/her path through the documentary.
While there are plenty of usability studies on standard hypermedia, which are mainly text-based, there are no studies on the kind of hypermedia where text plays a minor role with respect to time-based media, such as video and audio (one exception is [Merlino and Maybury, 1999]). In this work we focus on (the issue of) providing the user with the optimal follow-up, at any given moment in an interactive document.
Four different ways of presenting follow-ups have been tested in a controlled experiment with 58 users in a between-subject design. The i-TV scenario was simulated using a RealAudio player embedded in a standard web browser (Netscape Navigator).
The results, although preliminary, show that the best way of organizing information is to provide the user with a clear path through the documentary (and therefore limiting his possibility of freely exploring the content) and allowing follow-ups to be selected even when not contextually appropriate.
A Model for Interactive Documentaries
We used a standard model of hypermedia, through the web, which dictates an organization of the content around the notion of a page. In this model, text plays the main role and follow-ups are suggested by embedding a link to a related page in a portion of the text (called an anchor for the link). In this way, all anchors are accessible as long as the page is accessible. This model can be easily extended to other static media, such as images like in standard HTML, which allows the creation of image maps where portions of a static image can function as anchors.

This model of hypermedia, however, is not adequate for truly dynamic hypermedia; although dynamic content can be played on a web page by embedding a plug in, there is no standard way or reference models for dealing with links or for what to use as anchors.
Historically, another model of hypermedia was proposed: the Amsterdam model [Hardman et al., 1994], based on the notion of objects evolving on a timeline. This model is very similar to those employed today by Flash and Director and it is compatible with the SMIL standard.
We define a model for interactive documentaries as a sequence of scenes where the
content of each scene is in the form of a time-based media (such as video, audio, animation or a combination of those). There are two kinds of scenes: main and additional scenes. Main scenes are collected in a sequence that forms a complete documentary. Each main scene can have one or more additional scenes that provide further details.
Figure 1 illustrates a portion of the graph of interactive documentary scenes we used for the experiment (squares represent main scenes, ovals additional scenes and an arc represents a link between two scenes)
Fig. 1. A portion of the graph of scenes used in the experiment
Follow-up links are shown on the interface as clickable items using the scene title as anchor. In all the interfaces we have designed (see below), we clearly separate the two different kinds of links: (i) from one main scene to another one and (ii) from a main scene to an additional scene (or between additional scenes).
This model has been implemented using RealAudio embedded in a Netscape Browser and it would be possible to implement it using Flash or Director as well. As can be see, our model is in fact a simplified version of the Amsterdam model, yet it can be easily employed for DVD productions and for video-on-demand services.

An interactive documentary with 13 scenes was prepared in the domain of the animal kingdom.
We designed 4 different interfaces, all similar in that the content of each scene is played in the central frame . They differed, on the other hand, in the way follow-ups were presented, and whether the user had to go through the main scenes sequentially or could exploit a strategy of her choice.
Interface 1: Table of Content + contextual follow-ups
In this interface, the table of content (links to other main scenes) is displayed in the left frame, and the anchors correspond to the main scene titles. The user is therefore free to access the main scenes in whichever order he/she chooses.
Follow-up links are displayed in the bottom frame, and only when relevant to the current scene.
Fig. 2. Snapshot of interface 1
Interface 2: Table of Content + follow-ups always-present
As in the previous interface, the table of content is displayed in the left frame as clickable scene titles. All follow-up links are displayed in the bottom frame, but they are always present, regardless of their relevance to the scene currently being played.
Fig. 3. Snapshot of interface 2

Interface 3: Sequential scenes + contextual follow-ups
In this interface, the table of content is not displayed. The scenes can only be played sequentially. In order to retain the possibility of comparisons across conditions, we implemented the sequential mode through explicit “next scene” buttons. As in interface 1, only the relevant follow-up links are displayed in the bottom frame.
Fig. 4. Snapshot of interface 3
Interface 4: Sequential scenes + follow-ups always-present
As in the previous interface, the table of content is not displayed and the scenes can only be played sequentially. As in interface 2, all of the follow-up links are displayed in the bottom frame, regardless of whether they are relevant for the scene currently being played.
Fig. 5. Snapshot of interface 4
The Experiment
The goal of the experiment was to determine which, among the previously described ways of organizing the material, supported a better and more complete

exploration of the hypermedia. To this end, we used two indices: the number of scenes seen1, and the overall time spent in exploring the hypermedia.
Design
The experimental design was a 2x2 between-groups factorial one. Subjects were randomly assigned to the 4 conditions consisting of the four interface settings.
Fifty-eight subjects participated in the experiment. The average age was 26,24 years, from which 41.38% were between the ages of 11 and 18 years, 25.86% between 19 and 29 and 32.76% between 30 and 51.
All participants had enough computer and Internet surfing skills to successfully complete the task, as tested by means of a questionnaire (see below). It was our hypothesis that beyond an established (and very low) threshold of computer literacy task completion would not be significantly affected. The independent variables were (a) the organization of information: table of content (T) vs. sequential presentation (S) and (b) the organization of follow-up links: always present (AP) vs. only relevant links that disappeared after the scene was finished (D). The 2x2 design corresponds to the 4 interfaces introduced above.
The dependent variables were (a) the time spent in navigation, and (b) the number of the links visited.
Procedure
Participants were tested individually. Each session lasted approximately 40 minutes. Each subject was asked to first compile a questionnaire on the Internet and multimedia systems expertise, then to navigate on the assigned interface, and finally to complete the usability questionnaire.
Questionnaire on Internet and multimedia systems expertise
The questionnaire includes 6 items (Likert scale) measuring familiarity with the PC, Internet and multimedia systems, 6 items assessing the amount of time spent (in terms of number of hours) using PC, Internet and multimedia systems, and 6 items addressing personal data.
Usability questionnaire
The usability aspects investigated were the following: “pleasant/not pleasant to use”, “easy/difficult to learn/understand”, “good/bad organization of information”.
1We simply recorded the number of scenes delivered to the user as we did not have the
possibility of checking whether the user actually watched a scene completely or not.

The questionnaire encompassed 40 items based on a Likert scale (agreement/disagreement degree from +2 to –2), 2 yes/no items, and 4 open-answer items that served to collect users’ comments (see Appendix for the complete questionnaire).
In realizing this questionnaire, we took into account the heuristics proposed by Nielsen [Nielsen, 1993] and some of the WAMMI features (Web Usability Questionnaire) [Kirakowsky, 1998]. The questionnaire was evaluated in a pilot study with 22 subjects.
Results
Table 1 reports the average number of the total links navigated in each of the 4 experimental groups, together with their standard deviations. An F-test (F= 5.56, df = 3, P = 0.006) reveals a significant difference between the 4 groups. A post-hoc analysis (Sheffe Test, p = 0.05) shows that this is mostly due to the differences between interface 2 (T+AP) and interface 4 (S+AP).
Mean % Std. Deviation
Interface 1 (T+D) 73.33 18.69
Interface 2 (T+AP) 66.67* 23.80
Interface 3 (S+D) 79.44 17.21
Interface 4 (S+AP) 89.88* 16.40
*Reliable differences to Sheffe Test, p = 0.05
Table 1. Total number of links navigated
Table 2 presents the number of links among main scenes that were navigated, whereas table 3 focuses on follow-up links.
Mean % Std. Deviation Interface 1 (T+D) 93.33 15.14 Interface 2 (T+AP) 82.65* 19.55 Interface 3 (S+D) 100* 0.00 Interface 4 (S+AP) 96.94* 8.27
*Reliable differences to Sheffe Test, p = 0.05
Table 2. Number of links between main scenes navigated

Mean % Std. Deviation Interface 1 (T+D) 45.33 38.15 Interface 2 (T+AP) 40.00* 36.79 Interface 3 (S+D) 50.67 41.31 Interface 4 (S+AP) 80.00* 36.79
*Reliable differences to Sheffe Test, p = 0.05
Table 3. Number of follow-up link navigated
By observing links among main scenes, it becomes clear that Interfaces 1, 3 and 4 do support a good level of exploration and do not differ significantly. It can also be noted that the performance of Interface 3 is remarkable while Interface 2 is significantly weaker (F =7.18, df = 3, P = 0.002). When follow-up links are considered, Interface 4 offers the best support, with all others more or less at the same level, even though the effect is significant only between Interface 2 and Interface 4 (F=4.47, df = 3, P = 0.016). Putting these considerations together, and comparing them with the results at the general level in Table 1, we can conclude that Interface 4 offers the best support for navigation. The worst combination is seen in Interface 2, where the table of content mode for main scenes and the always-present mode for follow-up links are combined. It seems that the presence of the entire set of links throughout the entire interaction hampers navigation, perhaps by disorienting users. However no independent confirmation for this hypothesis, has yet been provided.
With respect to the total time spent on exploring the documentary, no significant differences were found across the four different conditions.
Usability Questionnaire
Most of the items of the usability questionnaire did not show any significant difference between the four experimental conditions. Particularly interesting, nonetheless, was the trend in the item “I felt free to choose the information that seems more interesting to me”. There is a strong tendency towards agreement by users in condition T and a weaker agreement by users in condition S. An Anova test proved a significant difference between the four groups (F=4.61, df = 3, P = 0.006). The Sheffe test showed that T+D and S+D (respectively the strongest agreement and the strongest disagreement) were significantly different (p=0.05).
This result contradicts the quantitative observations on actual users’ behavior. One possible explanation is that the users’ perception of having less freedom in the S condition was due to the presence of the “next scene” button, even if the sequencing was imposed on main scenes only. The T condition, on the other hand, while providing a greater set of choices might have rendered the entire structure of the hypermedia more difficult to understand and consequently creating a greater disorientation: this may explain the lower navigation rate observed empirically.

Conclusions
The present work attempts to set the basis for further studies on interactive video productions, such as interactive documentaries.
We have defined a model of an interactive documentary as a sequence of scenes where the content of each scene is in the form of a time-based media (such as video, audio, animation or a combination of these). There are two kinds of scenes: main and additional scenes. Main scenes are collected in a sequence that forms a complete documentary. Each main scene can have one or more additional scenes that provide additional details.
We think that this model can be exploited in conjunction with the new technological improvements on video-on-demand and the streaming technology for video delivery on the web to implement new forms of adaptation on video content.
The present work introduces a first usability study on interactive documentaries. Four different interfaces have been designed to study the best way to present to the user the links between the scenes. Thus far, the results show that the configuration that leads to the best navigation (in terms of link traversed) is the one that constrained the main scenes in a sequence while allowing an unconstrained possibility of choosing among additional scenes.
This work is at a preliminary level and in particular the model has to be tested with a larger sample of scenes for documentaries.
Acknowledgment
We would like to thanks Elena Not for the help that she gave us in the initial phases of the experiments and for the many invaluable discussions.
This work has been partly supported by the project PEACH.
References
Ardissono, L., Portis, F., Torasso, P., Bellifemine, F., Chiaretto, A., Difino, A.: Architecture of a System for the Generation of Personalized Electronic Program Guides. In proceedings of Workshop on Personalization in Future TV. Sonthofen, (July 13th and 14th, 2001)
Hardman, L., Bultermann, D.C.A., van Rossum, G.: The Amsterdam Hypermedia Model: Adding Time and Context to the Dexter Model. In Communication of the ACM, Vol. 37, n. 2. (February 1999) 50-62
Kirakowsky, J., Claridge, N., Whitehand, R.: Human Centred Measures of Success in Web Site Design. 4th Conference on Human Factors and the Web, Basking Ridge, NJ. AT&T (1998)
Lekakos, G., Papakyriakopoulos, D., Chorianopoulos, K.: An Integrated Approach to Interactive and Personalized TV Advertising System. In proceedings of Workshop on Personalization in Future TV. Sonthofen (July 13th and 14th, 2001)
Merlino, A., Maybury, M.: An Empirical Study of the Optimal Presentation of Multimedia Summaries of Broadcast News. In I. Mani and M. Maybury (eds.) Automated Text Summarization. MIT Press (1999)
Nielsen, J.: Usability Engineering. Academic Press (1993)

Appendix: Usability Questionnaire
With the following questionnaire we intend to evaluate the usability of the system you have just used. We ask you to read the following statements and to express your personal opinion about them (from complete agreement=+2 to complete disagreement=-2).
Thank you for you precious contribution!
1. I found difficult to understand the use of the icons and the buttons present on the screen.
Complete Complete agreement disagreement
+2 +1 0 -1 -2 2. I found familiar the interface with witch I have interacted. 3. The contents presented were well articulated. 4. I performed an action obtaining an effect/behavior by the system completely
unexpected to me. 5. This interface looks like other interfaces I have used in the past. 6. I immediately understood how the system worked. 7. The pen was difficult to use. 8. The artificial voice was annoying. 9. I felt free to choose the information that seemed more interesting to me. 10. I felt obliged to listen to information that was not interesting to me. 11. I felt free to stop and replay the audio files I was listening to trough the headphones. 12. I liked the graphics. 13. It was difficult to understand how the system worked. 14. I felt bored during the interaction. 15. I paid attention to the images’ succession. 16. There was coherence between text and images. 17. The monitor was difficult to use. 18. The system tied down my choices 19. I heard information that I had never heard before. 20. I heard information that I found interesting. 21. I enjoyed using the system. 22. The voice was quite natural. 23. I enjoyed using the pen. 24. The texts were understandable. 25. The length of the texts was appropriate. 26. I enjoyed using the monitor. 27. The system let me make the choices that I found more useful or interesting. 28. The quality of the images was good. 29. The audio-video synchronization was adequate. 30. The proposed follow-ups made me curious. 31. I would have preferred to use the mouse. 32. I was able to access all the available information. 33. The follow-ups were useful. 34. This system was quite annoying. 35. It is difficult to find what I really want in this system. 36. Using this system is a waste of time. 37. This system could use a preliminary explanation. 38. I’m not sure I heard all the available information. 39. This system is too slow. 40. Did you revisited some pages?

yes no 41. Did you listen to the audio files until the end?
yes no
Personal comments
42. Do you think that this system could be useful as: (it is possible to check more than one option)
electronic guide in a natural science museum electronic guide in a natural park didactic tool for a primary school didactic tool for the secondary school didactic tool for a high school didactic tool for the university guide for personal use (for example on a C-D rom) it is not useful at all
43. Which aspect of the system did you like most?

Section 3: StereotypicalKnowledge in TV Services


Speeding up Recommendation Systems
Byron Bezerra1, Francisco Carvalho1, Geber Ramalho1 and Jean-Daniel Zucker2
1 Centro de Informatica - CIn / UFPE, Av. Prof. Luiz Freire, s/n - Cidade Universitaria,
CEP 52011-030 Recife - PE, Brazil {bldb, fatc, glr}@cin.ufpe.br 2 PeleIA – LIP6 – Universite Paris VI,
4, Place Jussieu, 75232 Paris, France {Jean-Daniel.Zucker}@lip6.fr
Abstract. Recommender Systems aims to furnish automatic recommendations based on information recorded about user preferences and uses Information Fil-tering techniques to manage this information and provide the user with options, which will present greater possibility to satisfy the user. Content-based filtering is one of the most useful approaches used for Information Filtering. Often in this approach, the recommendation is based on a comparison between a user profile and the items. Therefore, the system selects those items that score the best ac-cording to a particular criterion. This paper presents an approach where each user profile is modeled by a meta-prototype and the comparison between an item and a profile is based on a suitable matching function which possess two components: position and content.
1 Introduction
Information systems, which filter in relevant information for a given user based on his profile, are known as Recommendation Systems (RS). Such systems may use two sort of information filtering techniques for this purpose: the content-based filtering (CBF) and the collaborative filtering (CF). It is known these two techniques are complemen-tary [1]. Therefore, several filtering approaches have utilized combined content-based and collaborative filters [2, 3].
Experiments have been shown good results with the k Nearest Neighbors (kNN) technique in CBF [4]. For this reason, this algorithm is very used in RS. Nevertheless, there is a special problem with CBF techniques: the speed of generating the recom-mendations. This problem becomes very significant mainly in web-systems, which may have millions of users. Additionally, in a movie recommendation web-system this is one of the most difficult problems to cope with. Techniques such as k-d trees [5] can reduce the time required to find the nearest neighbor(s) of an input vector but suffer a reduction of the precision accuracy (PA).
This paper discuss a new approach of CBF, the Meta-Prototypes (MP), which im-proves a lot the speed of RS maintaining the PA equivalent to the kNN method. This

method had been developed in the framework of the Symbolic Data Analysis [10] and had been firstly successfully applied in classification of a special kind of SAR simu-lated image [6]. In this sense, our work has the main contribution of, for the first time, adapt the MP technique to the movie domain in an original way which improves the speed of recommendations without degrading the PA.
2 Speeding up Content-Based Filtering
The idea behind all variants of CBF is to suggest items that are similar to those items that the user has liked in the past. The notion of user profile used in this work is a set of examples of items associated with his classes. So, it is in fact the notion of an ex-tension user profile. For convention, we will refer only to user profile (UP) instead of extension user profile. Particularly, in the movie domain the UP is a set of movies with their respective grades.
2.1 Classical Content-Based: kNN
In the kNN [7], the exemplars are original instances of the training set (items of the UP). These systems use a distance function to determine how close a new input vector y is to each stored instance, and use the nearest instance(s) to predict the output class of y. Some problems can be inferred in the kNN method. The first one is that it is very expensive specially if we consider a web-system with millions of users and movies. Moreover, every item in a UP needs to be compared with every item in the query set to make sure it is good or not for this user.
2.2 Speed up
There is a lot of studies concerning with the speed up of the training algorithm. One choice in designing a training set reduction algorithm is to decide whether to retain a subset of the original instances [8] or whether to modify the instances using a new representation [7, 14]. The RISE method [9] proposes a new representation for the training set but it is not able to take into account multi-valued nominal attributes like cast attribute, for example. The Drop method [8], which reduces the exemplar set, by removing irrelevant instances of this set may be applied before the MP approach.
2.3 K-D Tree
The speed of recommendations systems can be improved with exemplar set indexing methods such as k-d trees. The main idea is to build binary search trees with instances of training set in the nodes, using the attributes of the instances as keys in a conven-tional alternating sequence. In order to alleviate the imbalance of k-d trees, the attrib-

ute chosen for each dimension is the one, which better divides the instances of the respective sub-tree.
3 Symbolic Data Analysis
Symbolic data are more complex than standard data as they contain internal variation and they are structured. They come from many sources, for example in summarizing huge relational databases or as expert knowledge. The need to introduce new tools to analyze symbolic data is increasing and it is why Symbolic Data Analysis (SDA), which extends Data Analysis in Knowledge Analysis, has been introduced [10].
SDA is a new domain in the knowledge discovery, related to multivariate analysis, pattern recognition, data bases and artificial intelligence. SDA provides, suitable tools to work with complex, aggregated, relational and higher-level data described by multi-valued variables where the entries of a data table are sets of categories or of numbers, intervals or probability distributions, related by rules and taxonomies.
SDA methods generalize classical exploratory data analysis methods, like factorial techniques, decision tree, discrimination, regression, neuronal methods, multidimen-sional scaling, supervised classification, clustering and conceptual lattices.
In classical data analysis, the input is a data table where the rows are the descrip-tions of the individuals, and the columns are the variables. One cell of such data table contains a single quantitative or categorical value.
However, sometimes in the real world the information recorded is too complex to be described by usual data. That is why different kinds of symbolic variables and symbolic data have been introduced [10]. For example, an interval variable takes, for an object, an interval of its domain, whereas a categorical multi-valued variable takes, for an object, a subset of its domain. A modal variable takes, for an object, a non-negative measure (a frequency or a probability distribution or a system of weights).
A symbolic description of an item is a vector whose descriptors are symbolic vari-ables. In the approach explained in the next section, the UP is a vector whose descrip-tors are modal symbolic variables (meta-prototype). The comparison between a UP and a item to be recommended is accomplished by a suitable matching function, which possesses two components: position and content. This approach has been applied suc-cessfully on image recognition [6].
4 Meta-Prototype Approach on Movie Domain
This section discusses the problems of adapting the MP to the movie domain. To start with, it is needed to introduce the domain characteristics itself.
The table of relevant attributes in the movie domain according with an expert is presented in the table below. Additionally, the importance (weight µ) of each attribute was fixed by an expert and was the same for every experiment made.

Table 1. Attributes in movie domain
Attribute Type µ Example Genre Multi-valued qualitative 1,0 Drama
Country Nominal single valued qualitative
0,3 EUA
Director Nominal single valued qualitative
0,5 Steven Spielberg
Cast Multi-valued qualitative 0,8 Tom Hanks, David Morse, Bonnie Hunt, Michael Clarke
Year Ordinal single valued qualitative
0,3 1999
Description Textual 1,0 The USA government offers one million dollars for some informa-tion about a dangerous terrorist.
The user of the movie recommendation system considered in this work evaluates
the movie itself in the range 1 to 5, where 1 means very bad and 5 means very good. Because this interval is small there is no needed for normalization of user grades.
4.1 Meta-Prototype
The construction of a UP is based on the set of items already evaluated positively or not by the user. In order to construct the UP, we will consider two steps in the learning process: pre-processing and generalization.
4.1.1 Pre-processing Each item (example) is described as a vector of attributes. This description may in-clude several kinds of attributes: single valued qualitative (nominal or ordinal), multi-valued qualitative (ordered or not) and textual.
The aim of the pre-processing step is to represent each item as a modal symbolic description, i.e., a vector of vectors of couples (value, weight). The items are the input of the learning step.
The couples of (value, weight) are formed according to the type of the descriptors: i) if the descriptor is single valued or multi-valued qualitative or single valued quanti-tative discrete, each value is weighted by the inverse of the cardinal of the set of val-ues from its domain taken by an individual; ii) if the descriptor is textual some Infor-mation Retrieval methods are applicable, such as Centroid and TFIDF [11].
Example. The meta-prototype of the movie in table 1, for the attributes Cast and Description, is shown in table 2.
Table 2. Meta-prototype of the example of table 1.
Attribute Movie Meta-Prototype (x)

Cast (0.25 Tom Hanks, 0.25 David Morse, 0.25 Bonnie Hunt, 0.25 Mi-chael Clarke,
Description (0.125 USA, 0.125 government, 0.125 offers, 0.125 million, 0.125 dollars, 0.125 information, 0.125 dangerous, 0.125 terrorist
The textual attribute is processed through its centroid, which is a classical method
of Information Retrieval (IR). So, the centroid can be thought as a multi-valued quali-tative attribute like Cast one. Moreover, this attribute can be very useful if explored appropriately. TFIDF [11] has been achieved good results in IR systems and could not be different in our case. In order to support this technique just change the weight of each value in the centroid by the respective TFIDF equation. Other improvements of IR were tested in our experiments, such as Stemming [12] and Synonyms [11]. Whereas it is out of the scope of this paper discuss this results, the best configuration for textual attribute was made for all experiments.
4.1.2 Generalization This step aims to represent each UP as a modal symbolic object (Meta-Prototype). The symbolic description of each UP is a generalization of the modal symbolic de-scription of its segments.
The meta-prototype representing the UP is also a vector of vectors of couples (value, weight). The values, which are present on the description of at least an item already evaluated by the user, are also present in the UP description (meta-prototype). The corresponding weight is the average of the weights of the same value presenting in the item descriptions.
Example. Suppose there are two movies in the UP where the Cast attribute is pre-sented in table 3.
Table 3. Examples of movies evaluated by some user.
Attribute Movie 1 Movie 2
Cast Tom Hanks, Michael Clarke, James Cromwell, Ben Kingsley, Ralph Fiennes
Caroline Goodall, Jonathan Sagall, Liam Neeson, Michael Clarke
Table 4 shows the MP of the UP, for the Cast attribute, exemplified in the table 3.
Table 4. The meta-prototype concerning with the UP exemplified in the table 3
Attribute User Meta-Prototype (u)
Cast ((0.2 Tom Hanks, (0.2+0.25) Michael Clarke, 0.2 James Crom-well, 0.2 Ben Kingsley, 0.2 Ralph Fiennes, 0.25 Caroline Goodall, 0.25 Jonathan Sagall, 0.25 Liam Neeson)∗0.5)

4.2 Comparing an item with a UP
The recommendation of an item to a user is based on a matching function, which compares the symbolic description of the item with the symbolic description of the user. The matching function measures the difference in contents and in position be-tween a item and a user descriptions. The difference in position is measured by a con-text free component, whereas the difference in content is measured by a context de-pendent component.
Let x = (x1,…,xp) and u = (u1,…,up) be the meta-prototypes of the item and of the user respectively, where xj = ((xj1,wj1), …, (xjk(j),wjk(j))) and uj = ((uj1,Wj1), …, (ujm(j),Wjm(j))), j = 1, …, p.
The comparison between the item x and the user u is accomplished by the following matching function:
)),(),((),(1
jjcd
p
jjjcf uxuxux φφφ ∑
=
+= (1) The matching function.
The context free component of the matching function φcf is defined as,
jj
jjjj
jjcfUX
UXUXux
⊕
⊕∩∩=
)(),(φ (2) The context free component of the
matching function.
where Xj = {xj1, …, xjk(j)}, Uj = {uj1, …, ujk(j)} and Xj ⊕ Uj is the join as defined by Ichino and Yaguchi [13].
The context dependent component of the matching function φcd is defined as,
+= ∑∑
∩∈∩∈ jjmjjk UXumm
UXxkkjjcd Wwux
//2
1),(φ (3) The context dependent component of the
matching function.
The meta-prototype does not have to be created again if a new item is evaluated.
4.3 Improvements
In this section we discuss some improvements of this model, well adapted to the movie domain.
4.3.1 Two Meta-Prototypes The movie domain has some additional information, which has not yet been consid-ered, such as the user evaluations. So, how to use the “negative” (i.e., the movies which got a grade 1 or 2) evaluations of the user? One way to use the negative user evaluations is to construct a brand new meta-prototype to incorporate these negative

items. Therefore, the UP is represented by two MP: a positive meta-prototype (u+) and
a negative meta-prototype (u-). An item with grade 1 and 2 goes in u-, and an item
with grade 4 and 5 goes in u+. It was constated empirically that items with grade 3 do
not contribute for the PA. The matching function of equation 3 becomes:
2
)),(1(),(),(
−+ −+=Φ
uxuxux
φφ
(4) The matching function Φ considering two MP, where φ is defined in equation 3.
4.3.2 Replication The user grades have other hypothesis, which may be stronger than the later discussed in section 4.4.1. It is clear that a grade 5 means very good whereas a grade 4 is just good, and a grade 1 means very bad whereas a grade 2 is not bad enough. One way to model this behavior in our approach is: i) items with grade 5 has a higher proportion than the items with grade 4 in u+, and, equivalently, ii) items with grade 1 has a higher
proportion than the items with grade 2 in u-.
5 Experiments and Results
The following experiments are based on a subset of EachMovie database [15] consist-ing of 22.867 users and 1.572.965 numeric ratings between 1 to 5 (1:very bad, 2:bad, 3:reasonable, 4:good, 5:very good) for 638 movies. The original movie table was matched with a second database of movies, the latter having a complete description of movies in Portuguese language. The original database from EachMovie has no de-scription of movies and for this reason it would not be possible to test CBF on the whole base. After this process all movies have description and, therefore, it is possible to work with all users
5.1 Refinements
The problems discussed in Sections 4.3.1 and 4.3.2 suggested some previous experi-ments in order to refine our model, before attempt the main experiments. Because it is not the scope of this paper we just present the conclusions of this previous experi-ments. The first conclusion is that two MP, as described in section 4.3.1, improve the prediction accuracy if compared with the original MP approach. Additionally, the replication (Section 4.3.2) improves the prediction accuracy. Finally, the results showed the items with grade 3 degrade the prediction accuracy in any case. Then items with this grade will be ignored.
Therefore, the refinements of our model is summarized as: i) items with grade 1 are added 3 times in u-; ii) items with grade 2 are added twice in u-; iii) items with grade 4 are added twice in u+; and iv) items with grade 5 are added 3 times in u+. After these refinements, the MP method showed a prediction accuracy as good as kNN one.

5.2 Results and Discussion
The aim of the experiments discussed in this section is to compare the performance concerning with the precision and the speed of the kNN, k-d Tree and MP methods. For all experiments it was considered the following settings: i) the kNN and k-d Tree with 5 or 11 nearest neighbors; ii) the prediction accuracy was measured according to Breese1 criterion, which is very appropriate for this subject in Recommender Systems; and iii) the speed was measured by the average time spent for produce the suggestions in seconds.
In each experiment, 50 users with at least 300 evaluations were randomly chosen. For each user, it was chosen from the evaluated items: i) 200 items for the query set and ii) 100 distinct items for the training set. Moreover, the number of items (m) of the training set was varied with m ∈ {5,10,20,40,60,80,100}. Finally, it was compared for each user the speed and prediction accuracy of the recommendation through the query set. The figures 1 and 2 show the results of this experiment.
0
5
10
15
20
m=5 m=10 m=20 m=40 m=60 m=80 m=100
se
con
ds
kNN k=5
kNN k=11
k-d Tree k=5
k-d Tree k=11
MP
Fig. 1. The speed results.
0
10
20
30
40
m=5 m=10 m=20 m=40 m=60 m=80 m=100
KNN k=5
KNN k=11
KDTree k=5
KDTree k=11
MP
Fig. 2. The precision accuracy results according to Breese.
The figure 2 indicates that MP method shows the best prediction accuracy among the evaluated methods. The figure 1 shows that m higher than 60 the response time of
1 The Breese criterion measures the utility of a sorted list produced by a recommendation sys-
tem for a particular user. The main advantage of this criterion for real systems is that the es-timated utility takes into account the user generally consumes only the first items in the sorted list. See [16] for details.

kNN is higher than 10 seconds, which maybe considered a bad behavior. The figure 1 also shows that MP performance is lower than k-d Tree whereas his response time is not bad enough as the kNN one. However, in a real recommender system the predic-tion accuracy is as critical as the response time. Therefore, the MP method is very useful for this sort of systems, because it achieves the best prediction accuracy with a good response time, which is just a bit worst than k-d Tree method.
Nevertheless, if the one favors the prediction accuracy instead of response time, we note that the MP and k-d Tree methods are closer concerning the response time. In order to support this conclusion, we considere figures 3 and 4, which were inferred from the results presented in figures 1 and 2. According to figure 3, the value of 29 for prediction accuracy (in Breese metric) is achieved with 80 items concerning with k-d Tree (k=5) whereas it is achieved just with a half of these items, e.g. 40 items, for MP approach. As another example, suppose the recommendation system requires a predic-tion accuracy of 27. So, it is sufficient to use a training set with 10 items for MP and, consequently, spent just about 2 seconds for generating the recommendations. Never-theless, for a prediction accuracy of 27, it is needed 40 items which implies about 3.8 seconds for the same task with k-d Tree. According these two examples, it seems that the difference in response time between both methods showed in figure 1 disappear if the system goal is to furnish recommendations with a fixed level of accuracy.
020406080
100
24 25 26 27 28 29
Breese
nu
mb
er
of
ite
ms
MP
k-d Tree k=5
Fig. 3. The relation of the number of items in the training set versus the prediction accuracy according to Breese criterion for MP and k-d Tree (k=5).
0123456
24 25 26 27 28 29
Breese
se
con
ds
MP
k-d Tree k=5
Fig. 4. The relation of the speed in seconds versus the prediction accuracy according to Breese criterion for MP and k-d Tree (k=5).

6 Conclusions
CBF techniques, such as kNN, which is commonly used in Recommender Systems, suffer from speed problems. There are some works proposing a solution for this prob-lem, but, among those applicable to the domain, none of them improves the speed without degrading the prediction accuracy. The Meta-Prototype fulfills this require-ment. In the future, we plan to use techniques such as the Drop method [8] before applying Meta-Prototype modeling in order to assess its impact. We also will include the analysis of storage gain using Meta-Prototype, since we think that it can provide a significant reduction, which is not the case of techniques such as kd-trees.
References
1. M. Claypool, A. Gokhale, T. Miranda, P. Murnikov, D. Netes, and M. Sartin. Combining Content-Based and Collaborative Filters in an Online Newspaper. In Proceedings of ACM SIGIR Workshop on Recommender Systems, August 19 1999.
2. Joshua Alspector, Aleksander Kolcz, and Nachimuthu Karunanithi. Comparing Feature-Based and Clique-Based User Models for Movie Selection. In Proceedings of the Third ACM Conference on Digital Libraries, pages 11-18, 1998.
3. Smyth, B. & Cotter, P. (1999) Surfing the Digital Wave: Generating Personalised TV List-ings using Collaborative, Case-Based Recommendation. Proceedings of the 3rd International Conference on Case-Based Reasoning, Munich, Germany, 561-571.
4. Arya S.: Nearest Neighbor Searching and Applications, Ph.D. thesis, University of Maryland, College Park, MD, 1995.
5. Bentley J., "Multidimensional binary search trees used for associative searching", Communi-cations of the ACM, Vol.18, pp. 509-517, 1975.
6. De CARVALHO, F.A.T., Souza, R.M.C.M. and Verde, R. (submitted): A Modal Symbolic Pattern Classier.
7. Cover, T. M., and P. E. Hart (1967). Nearest Neighbor Classifiers. IEEE Transactions on Computers, 23-11, November, 1974, pp. 1179-1184.
8. D. R. Wilson and T. R. Martinez. Reduction techniques for exemplar-based learning algo-rithms. Machine Learning, 38(3):257-268, 2000.
9. Domingos, Pedro (1995). Rule Induction and Instance-Based Learning: A Unified Approach. to appear in The 1995 International Joint Conference on Artificial Intelligence (IJCAI-95).
10. Bock, H. H. and Diday, E. (2000): Analysis of Symbolic Data. Springer, Heidelberg. 11. Baeza, Y. and Ribeiro, N. Modern Information Retrieval. 12. Orengo, V. and Huyck, C. A Stemming Algorithm for the Portuguese Language. 13. Ichino, M. and Yaguchi, H. (1994): Generalized Minkowsky Metrics for Mixed Feature
Type Data Analysis. IEEE Transactions system, Man and Cybernetics, 24, 698-708 14. Verde, R., De Carvalho, F.A.T. and Lechevallier, Y. (2000): A Dynamical Clustering Algo-
rithm for Symbolic Data, in 25th Annual Conference of the Germany Classification Society, Munich (Germany), 59-72
15. McJones, P. (1997). EachMovie collaborative filtering data set. DEC Systems Research Center. http://www.research.digital.com/SRC/eachmovie/
16. Herlocker, Jonathan Lee. Understanding and Improving Automated Collaborative Filtering Systems, cp 3.

Family Stereotyping – A Model to Filter TV Programsfor Multiple Viewers
Dina Goren-Bar and Oded Glinansky
Department of Information Systems Engineering, Ben-Gurion University of the Negev,P.O.B. 653, Beer-Sheva, 84105, Israel.{dinag, glinansk}@bgumail.bgu.ac.il
Abstract. The proliferation of TV channels requires the viewer to investsubstantial effort in searching for interesting programs. TV watching is ussuallya “family” event requiring from a recommendation system to represent theindividual preferences of the family members and identify them forrecommending the preferred programs. This work deals with the representationand adaptation of family member preferences without the need for useridentification. The Family Interactive TV system (FIT) filter TV programsaccording to the different viewers’ preferences. FIT constructs stereotypegroups, in order to create an adaptive programming guide. Implicit relevancefeedback is assessed through the actual program the viewer has chosen forwatching. FIT checks its prediction and updates the stereotype preferencesaccordingly. We evaluated FIT predictions by comparing it with two otheralgorithms. Simulation results indicate that FIT performance is close to thesystem that asks for user identification, and considerably outperforms therandom system.
1 Introduction
The privatization of TV stations encourages competition over viewer preferences.Ratings become a crucial issue. Therefore, stations invest many efforts to fulfillviewer demands.
How can these companies predict the most interesting options for each user, whenthere is so much variance of user types? Several viewers may prefer a new actionmovie with Al Pacino and Robert De Niro, while others will definitely choose acomedy to alleviate the stress of daily life. These preferences are probably linked tothe viewer’s stereotype. Stereotypes are a very popular approach in user modeling.This approach is based on grouping certain features that tend to appear together ingroups of people [11]. TV watchers may be classified according to their age,occupation, financial status, country of residence, sex, etc. A stereotype systemshould also include a classification mechanism to determine which stereotypes areapplicable to the current user [3] [1].
However, several viewers usually watch TV at the same time, and these users mayhave only a few preferred programs in common, which requires taking all the currentviewers’ preferences under consideration. Even if one person has control of the

remote, and the others present are relatively passive, the recommendation can’t beconsidered successful if the interests of others present are not taken into account [9].
Some users may prefer different programs at different times. In a “worst case”scenario, when a user wakes up at the wrong side of the bed (s)he may prefer aprogram (s)he very rarely chooses to watch.
The Family Interactive TV (FIT) system intends to solve most of the above-mentioned problems. FIT guesses the identification of the current user and suggestsseveral programs in various topics that reflect the user’s stereotype preferences. Theapplication assigns users to existing stereotypes characterized by viewer age,occupation and marital status. FIT learns from previous typical behavior to predictuser wishes. FIT saves data on previous user selections and updates the relevantstereotype’s preferences according to actual user behavior. FIT has to cope with twoadditional main challenges:1. There might be a variety of viewer preferences within the same group.2. The number of viewers required for the learning stage should be low (10 or less)
without substantially raising the error rate.Furthermore, our target is to achieve predictions results that are not far beyond the
optimal system that has full knowledge of the user id.
As mentioned above, FIT implements user stereotyping to build user profiles.Stereotypes may be regarded as pre-programmed models that fit a specific group ofusers. The stereotype approach has been used for many years (see [11]). It is veryuseful for application areas in which quick but not necessarily completely accurateassessments of the user's background knowledge are required. In the present study, inorder to build the stereotype preferences vector, each individual will grade all theprogram categories. In addition, we will request the user to tell us what is theprobability to be in front of the TV in any given 2-hour slot. The stereotypepreferences/hours vector will be generated according to these two inputs. Thestereotypes will be classified according to age and occupation groups. Persons that arein the same age group and work in the same field probably have common interests.One of these interests can be their movie preference. However, this is just anestimation model. Their preferences do not have to be precisely the same. Therefore,the application will calculate the average score for every topic in each category.
In case that the in-group stereotype variance falls below a certain threshold, wecan reflect the individual’s wishes according to the group he belongs to.
2 Related Studies
During the past years, several systems have been built in order to help viewers dealwith large amounts of programs coming from many stations. Some systems enabledviewers to select on-line programs from a schedule. TV-Advisor makes use of explicittechniques to generate recommendations for a TV viewer [5]. PTV uses a combinedcontent-based and collaborative filtering approach to generate TV showrecommendations [4]. Both techniques require the user to take the initiative andexplicitly specify their interests, in order to get high quality recommendations. Most

of the explicit profile based techniques do not adapt to changing user tastes and are‘static’. Implicit techniques, on the other hand, lessen the burden on the user and try toinfer the user’s preferences from a viewer’s TV viewing history. The multi-agent TVrecommender system combines explicit and implicit methods by encapsulating threeuser information streams--implicit view history, explicit preferences, and feedbackinformation on specific shows to generate program recommendations for a TVviewer. They include a ‘dynamic’, learning algorithm that tracks a person’s changingTV preferences over time [7], [8]. This adaptive system aims to record the user’spreferred TV programs for later viewing. It will track the user's preferences and assisthim/her in choosing programs during the week from the pre-recorded ones.Adaptability is achieved through the analysis of actual user behavior and feedbackinformation. However, this system faces two problems: First, when the user “wakesup on the wrong side of the bed” and makes an atypical choice, the multi-agentprobably will not be able to show the movie if it was not pre-recorded. Second, thesystem needs to gather lots of information on every user.
Another system (similar to ours) filters the broadcasted programs by constructingstereotypes in order to generate an adaptive electronic programming guide (EPG) [2],[6]. Their stereotype consists of two main parts: a profile that contains the classifieddata for individuals who belong to the represented stereotype and a prediction part,which contains the typical preferences of those individuals.
A different kind of application, Let’s Browse is a Web agent that tries to assist agroup of people in browsing, by suggesting new material likely to be of commoninterest [9]. Let’s Browse features automatic detection of the presence of users byusing electronic badges that communicated the user’s identity, transmitted through aninfrared link. User profiles were previously constructed by running an off-line Webcrawler that scanned a breadth-first search around each attendee’s page.
They found that, in contrast to a single user, who often has the patience to wait awhile until the system learns his or her preferences, groups are far less patient, and itis important that the system be able to demonstrate its capability to make goodchoices quickly.
Another similar recommending system, Silhouettell use machine vision foridentifying users and user-provided keywords to recommend single pages of commoninterest [l0].
All the above-mentioned systems require user identification in order to classifyhim/her into stereotype groups or match their preferences with those from others.While Let’s browse and Silhouettell cope with recommendations to a group of peoplefor Web browsing, the described TV recommending systems reflect the preferences ofjust one of the viewers at any given time. FIT system copes with these issues.
3 The FIT Model
FIT consists of three main components:1. Stereotype construction2. Prediction3. Learning and Adaptation

3.1 Algorithm for Stereotype construction:
This algorithm deals with three processes: assigning a user to a stereotype, buildingthe Stereotype Program Vector and building the Stereotype Time Vector.
1. Assigning a viewer to a stereotype: Age and occupation define the assignment of auser to a certain stereotype. The first time the user enters the system he isrequested to fill in his age. FIT will retrieve a list of related occupation and askthe user to choose the relevant one (see picture 1). The viewer may change hisprofile or add a new one.
2. Building the Stereotype Program Vector (SPV): At this stage, the viewer will beasked to evaluate the degree of priority of each program category, such as news,drama, soap opera, geographic films, etc. Priority grades range from 0 to 10,respectively meaning “will never watch this movie” to “definitely wants to watchthis movie”.For each stereotype we calculate an average vector of terms (SPV).Ai1 represents the average of the priority degrees given by people from the istereotype group to the first program category (News).PVi will be vector of the average priority grades to each film category which weregiven by people from the i stereotype.SPV will be defined as the vector of all the PVi vectors of each stereotype:SPV =(PV1, PV2 , … PVn)
Fig. 1 - Assigning viewer stereotype
3. Building Stereotype Times Vector (STV): At the last stage the viewing hours formwill be presented to the user to assess the probability of the user sitting in front ofthe TV at specified hours. Grades range from 0 (there is no chance to watch TV atthat specific time) to 10 (he is absolutely sure that he will watch TV during thattime slot). The grades will be transformed into probabilities.For each stereotype we calculate an average vector of times (STV).

Ti1 is the average of all the probabilities for the first time slot given by peoplefrom the i stereotype group.TVi will be the vector of average probabilities for each time slot that were givenby people from the i stereotype.STV will be defined as the vector of all the TVi vectors for each stereotype:STV =(TV1, TV2, … TVn)
3.2 Predicting family favorite programs
When the simulation clock is activated (see section 4.1) the system should look forthe SPV vector and will pick up from each PVi vector the proper value for that timeslot: TVnj. We will choose the Max probability of TVij among all these values andwe will compare it to its biggest competitors. This action intends to verify if the useris watching the T.V alone or if is the "Family Event" case. While in the first case wewill only consider a single-user preferences vector, in the second we will calculateeach "competitor" (family member) by its proper weight (probability). Then we willget a weighted vector of the grade of each category in the specific time slot – M (F1,F2…Fn). We will multiply this vector by the number of movies on the schedule ofeach field - for example, if there were 2 Drama movies, 3 Action movies and 5Comedy movies on that time slot: (2*F1, 3*F2, 5*F3, …). For the purpose of thesimulation, the selection of movies is presently done from our (static) DB usingrandom rules.
We will then choose the Max value from this vector and we will fix the propervalue of the selection by subtracting the Fi value from that Fi *n value. In case that aspecific film category is dominant the system will be able to recommend the userseveral films from this type.
We will repeat the same procedures 2 more times. At the end of this process wewill have 3 preferred options and the rest of the options.
3.3 The Learning Stage
The system suggests the viewers the 3 most preferred programs according to themaximum Fi*n value arranged in descending order. The rest of the movies that are notrecommended by the system are presented in the lower part of the screen. When theuser makes a selection, the system will evaluate the FIT “guess” of the current useridentification. We will compare the user’s actual program selection with the systemsuggestion. If they match, then no action will be taken. Otherwise, the system willinfer that its suggestion was not the most suitable one, probably due to a mistake inthe identification. Then it will add a relative value to the STP vector in the properstereotype at the current time by analyzing in a backward process the vieweridentification. The "matching level" will consider the location of the chosen programin the recommended list.

4 The simulation
4.1 Description
First, we gathered data from the users. We had 9 groups. Each group had at least 10users. This threshold intended to reduce the relative weight of a “random mistake”,caused by a person with very different preferences from those of his stereotype (highvariance).
The second stage was to choose 3 different groups that were similar in theirstructure, each one containing 10 people chosen at random. On the first group, we rana random algorithm that does not consider any preferences of the group the personbelongs to (therefore it does not attempt to predict the identification of that person).The second group will use our FIT application, and the third group will use anapplication that asks the user for its identification selects his exact group and suggestsaccordingly his favorite films.
The Simulation Clock: The SIF algorithm is based on the clock function as well asthe stereotype preferences of that hour. SIF uses two different clocks: the currentclock will be used to implement a real system (and later for usability testing) and thesimulation clock that enables the user to change the clock to its preferred time
4.2 Simulation results
We gave the grade 100 to FIT accurate guess of the user preferences (the first choice),50 for having suggested this category as the second option, 25 as the third and 0 to allthe rest. The simulation was repeated 20 times. The score is the average FIT correctguess.
The user identification algorithm, which asks the user for his I.D, got a ~95 score.Although in this case the system knows precisely the preferable films, which theviewer likes the most it can sometimes fail due "Change Mood" symptom. Our FITalgorithm received an 81 score, and the completely random algorithm result was 19.5(100+50 +25) * 3/27). In other words, the FIT Algorithm match is ~14% lower thanthe optimal result (with full user identification) while it outperformed significantly therandom algorithm.
Graph 1 – Comparison of FIT results with user identification and randon algorithms.
19.5
7995
0
20
40
60
80
100
1 2 3
Method
Score
Methods:1- Random Algorithm2- FIT3- User Identification
5 Discussion and further research
The study aimed to achieve two main targets:1. To reflect the current user’s preferences without annoying him with the need to
identify each time he wishes to watch TV.2. To find an algorithm that can deal with multiple TV viewers at once, as in the case
of family stereotyping, with considerable success.Both targets were achieved.
Dealing with the first one requires a trade-off matrix in mind, with two-axes:partial information vs. full information, and high vs. low prediction results. We knewwe would not be able to overcome the performance of a system that uses explicitviewer identification. Our target was to achieve prediction results that were not farbeyond the optimal system that has full knowledge of the user id. The upper bound ofthe FIT performance is the fully randomized system. If the FIT results were below thefully randomized algorithm, then there would be no justification for its existence.Results indicate that FIT achieved considerable success in reflecting the users’preferences well without annoying them.
The second target relates to the ability to reflect several family members’preferences without requiring any of them to identify while giving a properproportional representation. Many systems handle the individual stereotype problemwhile ignoring the fact that these stereotypes have to be gathered into a familystereotype due to the fact that most of the times there is more than one viewer aroundthe TV. FIT was requested to fulfill the demands of several users simultaneously. Theresults were better than the fully random algorithm and similar to the algorithm thatasks the user to identify.
Although the application usually renders good results, it should overcome severalobvious cases:1. There might be a variety of viewer preferences within the same group over time.
In this case the preference vector values and probabilities might be quite similar,considerably lowering the ability to predict user preferences based on thestereotype values. At present, the learning process updates F*n value. It will beinteresting to develop an adaptation mechanism for the stereotype preferences too,in order to reflect changing family interests.
2. In case we do not get 10 users from the same group (as in the simulation), thevariance may be high. User stereotypes were built as fully dynamic. If a userinitializes a new stereotype, the system can start predicting based on this user’sindividual information. Obviously, this will be a low probability prediction.Nevertheless, we decided to implement a generic model that will probablyperform better as the system acquires more users.
3. Closely related to the prior argument, if a user starts working with the systembefore it reaches minimal performance (usually several runs), the viewer may nottrust the system after the first few imperfect trials.
Further research will involve developing a prototype system with realcomponents. This means to embed FIT in a real environment that will have two mainadvantages: a real EPG (Interactive Programming Guide), continuously updatedknowledge base, and real users to test empirically the FIT algorithm. In addition, we

intend to improve the learning stage to include adaptation of the viewers preferredcategories (at the same time of adapting the Time Stereotype vector). In this advancedsystem we will be able to locate the viewer in another group if his preferences’changes will be radical. Moreover, further analysis of the relevance feedback willenable to assess if there are several preferences that remain constant while others aremore susceptible to mood or contextual changes. Event driven alarms to prevent fromsome groups watching specific contents will be added to the system in the nextversion as well.
References
1. Allen R.B. (1990). User Models: Theory, Method, and Practice. International Journal ofMan-Machine Studies, 32: 511-543.
2. Ardissono L., Portis F., Torasso P., Bellifemine F., Chiarotto A., Difino A. (2001):Architecture of a system for the generation of personalized Electronic Program Guides.The First Workshop on Personalization in Future TV in conjunction with User Modeling2001, Sonthofen, Germany, July 13-14, 2001
3. Chin, D.N. (1989). Knome: Modeling What the User Knows in UC. In Wahlster, W. &Kobsa, A. (Eds.) User Models in Dialog Systems. Berlin - New York. Springer - Verlag.pp 74-107.
4. Cotter P., Smyth B. (2000): A Personalized Television Listing Service. Communicationsof the ACM 43 (8).
5. Das, D. and ter Horst, H. (1998) Recommender Systems for TV. In Proceedings ofSixteenth National Conference on Artificial Intelligence.
6. Gena, C. Designing TV Viewer Stereotypes for an Electronic Program Guide. The FirstWorkshop on Personalization in Future TV in conjunction with User Modeling 2001,Sonthofen, Germany, July 13-14, 2001.
7. Gutta, S., Kurapati, K., Lee, K., P., Martino, J., Schaffer, D., and Zimmerman, J. TV(2000) Content Recommender System. In Proceedings of Seventeenth NationalConference on Artificial Intelligence, pp. 1121-1122, AAAI, Austin, July 2000.
8. Kurapati K., Gutta, S. Schaffer, D. Martino, J. Zimmerman J. (2001) A Multi-Agent TVRecommender. The First Workshop on Personalization in Future TV in conjunction withUser Modeling 2001, Sonthofen, Germany, July 13-14, 2001
9. Lieberman, H. Van Dyke, N.W., Santarosa Vivacqua, A. Let's Browse: A CollaborativeWeb Browsing Agent. Intelligent User Interfaces 1999: 65-68
10. Okamoto, M., Nakanishi, H., Ishida, T., Silhouettell: Awareness Support for Real-WorldEncounter, Community Computing and Support Systems, Lecture Notes in ComputerScience, Springer-Verlag, 1998.
11. Rich, E. (1989). Stereotypes and User models. In Wahlster, W. & Kobsa, A. (Eds.) UserModels in Dialog Systems. Berlin - New York. Springer - Verlag. pp 35-51.

TV Personalization through Stereotypes
Kaushal Kurapati, Srinivas Gutta
Adaptive & Interactive Systems DepartmentPhilips Research USA345 Scarborough Road
Briarcliff Manor, NY 10510, USAPhone: 1-914-945-6231
E-mail: [email protected]
Abstract. Personal Television is here via the advent of a new class of devicescalled personal video recorders (PVRs). For a PVR to provide an enriched TVexperience to the user, personalization is the key. One of the thorny problemsfacing a recommender system is that of cold-start: how does one capture theuser preferences quickly and effectively and provide user-specificpersonalization "out-of-the-box"? To address the cold-start problem, wepropose a stereotype-enabled personalization framework that evolves a user'sTV profile from a stereotypical, initial profile, to a personalized, more relevantone. The stereotypes have been derived from a sample set of 7 users who havebeen contributing their TV viewing histories to us for periods ranging from 5months to 2 years. We conducted 3 sets of experiments, each with a differentset of stereotypes applied to all the users. The results show that the averagelower and upper error bounds for the best case performance over all users andstereotypes used in the experiments are 26.7% and 37.6% respectively. The bestcase performance, in the case of 2 users, is in the range of 11% error. Thisperformance compares favorably with the best we have got to date onrecommenders trained on user-specific data. The best initial (cold-start) errorswere around 30%: a good starting point for a personalization system.
Keywords: Stereotypes, Cold-start problem, Bootstrapping, TV Recommenders.
1. Introduction
Personal Television is here via the advent of a new class of devices called personalvideo recorders (PVRs). For a PVR to provide an enriched TV experience to the userpersonalization is the key. PVRs need to be equipped with sophisticated recommendersystems that track and recognize user preferences and help them select good contentto fill the hard disk.
Much work has been done in the area of recommender systems and they havebeen applied to a wide range of disciplines. Many systems have been built in recentyears to help users deal with large quantities of information coming from varioussources: e-mail (Maxims [6]), usenet news (NewT [9]), the web (Syskill & Webert[7]) and TV (TV-Advisor [3], PTV [2], Multi-Agent TV-Recommender [4][5]). TV-Advisor and one prong of the multi-agent TV recommender make use of explicit

techniques to generate recommendations for a TV viewer. Such techniques require theuser to take the initiative and explicitly specify their interests, in order to get highquality recommendations. Implicit techniques, on the other hand, lessen the burden onthe user and try to infer the user’s preferences from a viewer’s TV viewing history.The multi-agent TV-recommender uses 3 sources of user information: explicit,implicit and any feedback the user might give on shows.
Irrespective of the type of technique used, all of them suffer from twoproblems. Either they are very tedious to initialize, requiring new viewers to fill inlengthy questionnaires specifying their preferences at a coarse level of granularity(explicit), or they derive a profile completely unobtrusively from observing viewingbehaviors (implicit) and thus require a long time to become accurate. The questionthen becomes "how to bootstrap a TV recommender system quickly and effectively?"This is the crux of the “cold-start problem.” The central issue in this problem is howto learn about a new user? Rashid [8] et. al., have explored various techniques'effectiveness in learning about new users, but their work focuses mainly oncollaborative filtering recommender systems, while our work focuses on a content-based approach.
We propose a stereotypes-based personalization framework to address thecold-start problem. Stereotypes are a set of pre-derived profiles designed to reflect the“stereotypical” patterns of TV shows watched by real viewers. A stereotype is usuallydefined in terms of the clusters where each cluster consists of a particular segment ofTV-shows exhibiting a specific pattern. A new viewer then chooses the stereotype(s)believed to be closest to his/her own interests to jump-start his/her profile. Thestereotypical profile then adjusts and “evolves” towards the specific, personal viewingbehavior of each individual user, depending on their recording patterns, and thefeedback given on shows.
The paper is organized as follows: sections 2 and 3 provide details regardingthe generation of stereotypes and the profile transformation framework. Extensiveexperiments that were carried out are discussed in section 4. Conclusions from ourwork are presented in section 5, including the future directions for this research.
2. Stereotypes Generation
The process of deriving stereotypes--clusters of TV shows that are ‘similar’ to oneanother--begins with the application of an unsupervised data clustering algorithmsuch as “k-means” to the view history data set. The algorithm proceeds bypartitioning the example data set into clusters such that points (TV shows) in onecluster are closer to the mean (centroid) of that cluster than any other cluster. Themean of the cluster becomes the representative TV show for the entire cluster. Todetermine closeness of a TV show to a cluster, we need to be able to computedistances between TV shows. In the next sub-section we describe the distance metricthat has been used in the clustering algorithm. The sub-sections following thatdescribe the clustering algorithm and the clustering results.

Distance Metric for Symbolic Features
All clustering methods use some kind of distance metric to quantify the distinctionbetween the various examples in a sample data set and decide on the extent of acluster. To be able to cluster TV user profiles, we need to compute distances betweenany two TV shows in different viewers’ view histories. TV shows that are ‘close’ toone another tend to fall into one cluster. It is relatively straightforward to computedistances between numerical valued vectors: Euclidean distance, Manhattan distance,and Mahalanobis distance are some of the methods most commonly used. However,we cannot use those methods in the case of TV show vectors because TV showscomprise of ‘symbolic’ feature values. Consider two TV shows such as “Friends”,which aired on NBC at 8 pm on March 22, 2001, and “Simpsons”, which aired onFOX at 8 pm on March 25, 2001. One cannot use any known numerical distancemetric to compute the distance between “NBC” and “FOX”, for instance. Therefore,in order to compute distances between symbolic features we use the Modified ValueDifference Metric (MVDM) that takes into account the overall similarity ofclassification of all instances for each possible value of each feature [1]. Using thismethod, a matrix defining the distance between all values of a feature is derivedstatistically, based on the examples in the training set. We have adopted the MVDMfor our purpose of computing distance between feature values between two TVshows. According to MVDM, the distance � between two values for a specific feature(V1, V2) is given by:
For our case, we transformed the above equation to deal specifically with the classes,“watched” and not-watched”, as shown below.
�(V1, V2)=totalC
watchedC
totalC
watchedC
_2
_2
_1
_1� +
totalC
watchednotC
totalC
watchednotC
_2
__2
_1
__1�
In this equation, V1 and V2 are two possible values for the feature underconsideration: V1 = NBC, V2 = FOX, for the feature ‘channel’. The distance betweenthe values is a sum over all classes, into which the examples are classified. Therelevant classes for us are class Watched and class Not-Watched. C1i is the number oftimes V1 (NBC) was classified into class i (i = 1 implies class Watched) and C1(C1_total) is the total number of times V1 occurred in the data set.
The idea behind this metric is that values are similar if they occur with thesame relative frequency for all classifications. The term C1i/C1 represents thelikelihood that the central residue will be classified as i given that the feature inquestion has value V1. Thus, we say that two values are similar if they give similarlikelihoods for all possible classifications. The δ equation above computes overallsimilarity between two values by finding the sum of differences of these likelihoodsover all classifications. The distance between two TV shows is the sum of thedistances between corresponding feature values of the two TV-show vectors.
22#
1 11)2,1(
CiCclasses
i CiCVV ��
�
��

Clustering Algorithm
We derive stereotypes by applying an unsupervised clustering algorithm, "k-means,"to a composite view history data set that is a collection of all the shows watched byour sample set of users. The algorithm we used to generate clusters of TV shows isshown below in figure 1. A key step in the clustering algorithm of figure 1 is thecomputation of the symbolic mean of a cluster. For numerical data, the mean is thevalue that minimizes the variance. Extending the concept to symbolic data, we candefine the mean of a cluster by finding the value of x� that minimizes intra-clustervariance [1] (and hence the radius or the extent of the cluster),
Var (J) = � i � J (xi - x�)2 ; Cluster radius R(J) = )(JVar
where J is a cluster of TV shows from the same class (watched or not-watched), xi isa symbolic feature value for show i, and x� is a feature value from one of the TVshows in J such that it minimizes Var (J). Computationally, each symbolic featurevalue in J is tried as x� and the symbolic value which minimizes the variance becomesthe mean for the symbolic attribute under consideration in cluster J. There are twotypes of mean computation that are possible: show-based mean and feature-basedmean. In the feature-based case, the cluster mean is made up of feature values drawnfrom the examples in the cluster because the mean for symbolic attributes must be oneof its possible values. It is important to note that the cluster mean, however, might bea “hypothetical” TV show. The feature values of this “hypothetical show” couldinclude a channel value drawn from one of the examples (say, NBC) and the titlevalue drawn from another of the examples (say, BBC World News, which, in realitynever airs on NBC).
Start with k = 2 clusters.Repeat Increment cluster size k to k + 1 Initialize k clusters (say, the first k TV shows in the View history) Repeat (Re)Compute cluster means ( �i ) For each show in view history pool if closest cluster to show � current cluster of show, move show to closest cluster. Until (no shows have moved from clusters) Until (classification performance improves OR an empty cluster is found)Output k, the stable cluster size, and the cluster contents
Fig. 1. K-means algorithm to cluster TV shows.
Alternately, in the formula for the variance, xi could be the TV-show i itself andsimilarly x� is the show in cluster J that minimizes the variance over the set of showsin J. In this case, the distance between the shows and not the individual featurevalues, is the relevant metric to be minimized. Also, the resulting mean in this case isnot a hypothetical show, but is a show picked right from the set J. We haveimplemented both versions for the mean computation.

Clustering Results
We have found that the clustering process is very sensitive to the initializationparameters that are used as input to the k-means algorithm. After experimenting witha wide range of parameters (show-based versus feature-based mean, number of initialshows per cluster, etc.), we arrived at a set of 18 clusters that seemed to reasonablyreflect the viewing patterns of the sample user set that we used to cluster the TVshows. These 18 clusters were derived using the 'show-based mean computation'method. These clusters were the basis for deriving the stereotypical profiles used inour experiments (section 4). Following are the key details on some of the clusters:� The most popular categories among clusters are "crime drama" and "drama",
spanning 5 clusters. Again, finer distinctions such as "science fiction" (X-files),"fantasy" (Touched by an Angel), and "medical" (ER), in addition to the base"drama" or "crime drama" separate clusters from one another.
� The second most popular category mix among clusters are "comedy, situation",spanning 4 clusters. The finer distinctions among them are based on "channel"(NBC or CBS or other: TBS, Fox) or "day+time combination". Tue 8 pm andThu 8:30 pm seem to be the dominant features for one cluster; Mon 8 pm vs.Mon 9 pm distinguishes 2 clusters; Tue & Thu 9 pm dominate another cluster.
� The third most popular category mix among clusters is "Talk, Magazine, News".The categories of "game" (Jeopardy! and Who Wants to be a Millionaire) and"biography" also find place in these clusters, albeit sparsely.
� Finally, there is one cluster that has "Children, Animated" as its dominant themeand another cluster which has a sprinkling of "Comedy" and "Drama, Fantasy",etc. in it. This last cluster, with miscellaneous categories mixed in it has to domainly with channel distinction than genre distinction, in our opinion.
3. Profile Transformation Framework
All recommender systems face the cold-start problem: how to bootstrap arecommender system quickly and effectively? We have taken the approach of seedinga user's initial profile with a stereotypical profile, and thereafter transforming thestereotypical profile into a personal profile by using feedback from the user. Theframework is depicted in figure 2. We 'simulate' the user feedback based on ground-truth (GT) data from users from an earlier test [5]. The simulation is necessary tovalidate our framework; from the simulations, we can map the performancecharacteristics of our profile transformation framework and further refine it. The GTwas collected from the users, on several shows based on the following question:would you watch this show? In a real deployed solution, we expect the simulatedfeedback to be replaced by explicit or implicit actions by the users.
A stereotypical profile is chosen as the seed to initialize user profiles. Thestereotypical profile is a union of clusters that the user perceives to be close to his/herTV viewing behavior. The system first computes the recommender scores for all theshows in the user's ground-truth set based on the stereotype-initialized user profile.The errors between the ground-truth and the recommender scores form the basis forsimulating the feedback. The profile transformation then proceeds in an iterative

fashion. In each cycle, the ground-truth show with the largest error is picked as thecandidate for feedback. Depending on that show's GT value, the feedback is generatedautomatically and applied to the show's features, thereby updating the user profile. Ifthe ground-truth on a candidate show was +1, the user presumably loves that showand the profile is appropriately updated with a certain 'force' (in the case of aBayesian profile [4][5], the feature counts were incremented by +3). In the nextiterative loop, the updated user profile is used to generate recommender scores andcompare with the ground-truth data. If the total sum-squared error during eachiterative cycle is being reduced, it is an indication that the user profile is getting morepersonalized and is tracking the user's TV watching behavior better.
Fig. 2. Framework for profile transformation: stereotypes to personal profiles.
4. Experiments
We have conducted the profile transformation experiments over a sample set of 10real users. These users have contributed their view histories to us for periods rangingfrom 5 months to 2 years. We used 7 users' view histories to construct thestereotypical profiles for our experiments. We then tested the profile transformationframework by testing on 'unseen' data of 3 users: K, J, and O. The number of ground-truth shows that could be used for our experiments varied from user to user. This wasmainly due to the variable number of shows marked by each user as "don't know".The number of ground-truth shows used in our experiments ranged between 70 (userK) to 267 (user F). We eliminated duplicate shows present in the ground-truth data.
Stereotypical Profiles
We tested our profile transformation framework with stereotypes that were randomlyconstructed from various cluster combinations to get an initial feel for how well ourframework performed. In the future, we hope to conduct similar experiments with realusers choosing the stereotypes instead of randomly chosen ones. We builtstereotypical profiles out of combinations of 3, 4, and 5 cluster sets. We randomly
Errors
Scores
Recommender
GroundTruth
Feedback
Stereotypes

selected 3 clusters and labeled them as 'positive clusters'. Next we automaticallyselected a set of 3 clusters such that they were farthest from the positive cluster set(labeled as 'negative clusters'). Together, the 3 positive and 3 negative clusters formeda stereotypical profile. The same process applies to cluster sets of 4 and 5.
Experimental Runs
To evaluate the profile transformation framework, we ran 3 sets of experiments. Weused the Bayesian TV recommender [4][5] to generate recommendation scores in theprofile transformation process. � Experiment 1: Stereotypes built from 3 randomly selected positive and 3 negative
clusters were used as seed profiles. The stereotype selection process was repeated10 times, with different sets of 3 clusters being considered each time. The sameset of stereotypes was applied to all users.
� Experiment 2: Stereotypes consist of 4 positive and 4 negative clusters.� Experiment 3: Stereotypes consist of 5 positive and 5 negative clusters.
The errors reported are normalized based on the number of ground-truth showsthat could be used in the experiments for each user. The normalization of the totalsum-squared error gives the mean squared error. We further normalize the mean-squared error to adjust for the errors being computed on a [-1.0, 1.0] scale, to arrive atthe percentage errors.
Results: Cold-start performance
Our goal in constructing this stereotype-based profile transformation framework wasto achieve a quick and effective way of initializing TV-recommender systems viastereotypes. To that extent, we observed the 'initial % errors' in each experiment (table4). User K comes out top with best initial error % ranging between 28 to 32% forexperimental runs 1 through 3. This means that stereotypes start out at a point that isvery close to some of the best performing recommender systems we have built todate. On an average, the stereotypes seem to start out at an error of 40%. In the worstcase, the average initial errors are around 62.6%. The users' perception of a 40%average initial, out-of-the-box error needs to be tested out in focus groups for us to geta good handle on the issue of whether these initial error rates are acceptable or not.We believe that given more view histories, drawn from a wider population pool, asinput to the clustering algorithms, the stereotypes would better reflect the typicalviewer's tastes leading to a better out-of-the-box performance.
User A C F G H J K Aver-age
Out ofthe box% error
40-6040-6040-58
37-6837-7038- 64
37-6038-5843-62
38-6739-6543-60
41-5841-5841-56
43-6943-7044-68
28-6630-6532-65
39.87- 62.6
Table 4. Initial--out of the box--error % ranges for various users in experimentalruns 1, 2, and 3.

Results: Best Performance
Table 5 below gives the overall best and worst amongst the best performances forselected users for all stereotypes (constructed from 3+3, 4+4, and 5+5 clusters). Thebest performance is the minimum of all the minimum errors for a particular user, overall stereotypes that were generated using a specified number of clusters. The 'worstamongst the best' performance is the maximum of all the minimum errors for aparticular user, over all the stereotypes that were generated using a specified numberof clusters.
The overall conclusion is that, performance we obtain at this stage is thesame as that was obtained if a recommender was trained on each user's view history[5]. For example, we observed earlier that using our Bayesian and Decision Treebased TV show recommenders, we had an error rate of 22 % for ‘K’. By using 3positive and 3 negative clusters, for user K, with the profile transformationframework, we were able to drive the error down to 13%. User K is second inperformance in the cases when a higher number of clusters (4+4 and 5+5) were usedto generate the stereotypes. User F is the first in performance in the cases when 4+4and 5+5 clusters were used to generate stereotypes and is third in performance when3+3 clusters were used. Averaging across all users and all stereotypes used in ourexperiments (total of 30 data points: 10 users, 3 experimental runs), we get theaverage best performance to be 26.7% error. The average upper bound for the bestperformance over all the data points yields a 37.63% error.
The worst case amongst the best minimums yielded a 45% error (user J).This error rate is still quite high and only slightly better than flipping an unbiased coin(50% success rate). It is encouraging to see that user K, who was one of the users thatwere left out of the clustering process, came out as one of the best performers in ourprofile transformation experiments, thus validating our framework for application to abroader population. However, it is also disturbing to note that users J and O, whowere also left out of the clustering process, were two of the worst cases amongst thebest performances across all users. While no statistically significant inferences can bedrawn from these results, it points out the need for expanding our user set and also theneed to derive clusters from a wider and deeper data pool.
For all the users except users H and K, we observe that there is almost nodifference in the best performances as the number of clusters that were used to buildstereotypes increased. In the case of the 'worst amongst the best' performance, thedifference in the number of clusters used to build the stereotypes made no differenceat all. These results imply that, the additional clusters that were being used to buildthe stereotypes were very similar to the clusters that were already being used to buildthe stereotypes.
Best (worst) performanceFor runs 1, 2, and 3
User F User H User J User K
Run1: 3 pos + 3 neg 17 (33) 11 (36) 39 (45) 13 (34)Run2: 4 pos + 4 neg 19 (33) 28 (38) 38 (43) 22 (34)Run3: 5 pos + 5 neg 18 (38) 30 (38) 38 (44) 20 (33)
Table 5. Overall best & worst among best performance across selected users andexperimental runs.

Results: Rate of personalization
The question of how long it takes to get to the best minimum error points (shown intable 5) is worth exploring. The answer to this depends on how fast a user consumesTV shows. The average show watching rate, across all users in our data set, is 10.8shows/week.. For the best performing users, F, H, K (table 5), the rates of show-watching are 19.9, 7.15, and 13.4 shows/week. User F is the closest to the typical USTV viewer, in our sample set. For these users, it took 210 (F), 135 (H), and 70 (K)shows (feedback cycles) to reduce the mean-squared error to their best minimumpoints (those in table 5). If these users were to watch at the rate they have beenwatching, and if they were to give feedback on every show they watched, then itwould take the system 10.5, 18.8, and 5.22 weeks respectively, to achieve the bestperformance. We believe that experimenting with various empirical feedbackschemes and richer stereotypes would yield faster rates of personalization.
5. Conclusion
We have developed a practical, viable, TV-recommender and profiling framework.This framework provides a solution to the cold-start problem: how to jump start TV-recommender systems quickly and effectively? Our approach is to build a library ofstereotypical TV viewer profiles, which reflect the viewing behavior of a majority ofthe population, and populate boxes (STBs, PVRs) with these profiles. Users canchoose a collection of these stereotypes to initialize their profiles and start gettingrecommendations 'out-of-the-box'. In this paper we quantified the 'out-of-the-box'performance for our initial set of stereotypes derived from a set of 7 sample users.The best initial error rates we got were around 30%. This is an excellent starting pointfor a recommender system; and from the user's perspective, the perceivedperformance 'out-of-the-box' is very good (we have not validated that from user tests,but this is an educated guess).
The other important issue we investigated was to figure out how good--meaning personalized--these stereotypes could become? We used user providedground truth data to simulate feedback and guide the stereotypical initial profilestowards personal profiles. We measured the error rates over the ground truth data. Theaverage lower and upper bounds for the best case performances are 26.7% and 37.6%respectively. The best case and worst case performances ranged between 11% and43% error. While the 11% error rates are quite encouraging, faring better than all ofthe recommender systems we built to date that were trained on user-specific viewhistories, the 43% error rates point to a need for further improvement. Even here, theerror rates are around the same levels as that can be achieved from recommenderstrained on user-specific data alone. These are the first-cut research results and wehave identified areas of improvement.
The rate of personalization of stereotypes seemed to vary widely in ourexperiments. The three users (F, H, K) who had the best results (error rates: 18%,11%, 13% respectively) required 10, 18, 5 weeks respectively to get to that level ofrecommender accuracy. Given this wide range for rates of personalization on a

limited data set, we feel further experimentation is warranted to determine the reasonsfor faster and slower personalization.
We have identified several areas for improvement in our framework: buildricher stereotypes from a wider and deeper pool of user data, such as from NielsenMedia Research, and experiment with asymmetric and accelerated feedback empiricalschemes and identify those that work the best for a given situation.
References
1. Cost, S., and Salzberg, S (1993). A weighted nearest neighbor algorithm forlearning with symbolic features. Machine Learning, volume 10, pp. 57-58.Boston, MA: Kluwer Publishers.
2. Cotter, P., and Smyth, B., PTV: Personalised TV Guides. In Proceedings of the 12th
Conference on Innovative Applications of Artificial Intelligence, IAAI, Austin,Texas, 2000.
3. Das, D. and ter Horst, H. Recommender Systems for TV. In Proceedings of the15th National Conference of AAAI, 1998.
4. Gutta, S., Kurapati, K., Lee, K.P., Martino, J., Milanski, J., David S. andZimmerman. TV Content Recommender System, In Proceedings of the 17thNational Conference of AAAI, Austin, Texas, 2000.
5. Kurapati, K., Gutta, S., Schaffer, D., Martino, J., and Zimmerman, J. A Multi-Agent TV Recommender, Workshop on “Personalization in Future TV”, UserModeling 2001, Sonthofen, Germany, July 2001.
6. Lashkari, Y., Metral, M., and Maes, P. Collaborative Interface Agents. InProceedings of the National Conference on Artificial Intelligence. AAAI, Seattle,August 1994. .
7. Pazzani, J., Muramatsu, M., and Billsus, D. Syskill and Webert: IdentifyingInteresting Web Sites. In Proceedings of the 13th National Conference of AAAI,pp. 54-61. 1996.
8. Rashid, A. M., et. al. Getting to Know You: Learning New User Preferences inRecommender Systems. Intelligent User Interfaces Conference, San Francisco,Jan. 13-16, 2002.
9. Sheth, B. and Maes, P. Evolving Agents for Personalized Information Filtering. InProceedings of Ninth Conference on Artificial Intelligence for Applications,IEEE Computer Press, March 1993.

Delivering Personalized Advertisements in Digital Television: A Methodology and Empirical Evaluation
Georgios Lekakos1, George M. Giaglis2
Department of Management Science & Technology
Athens University of Economics and Business Athens, Greece
e-mail: [email protected]
Department of Financial and Management Engineering, University of the Aegean,
Chios, Greece e-mail: [email protected]
Abstract. This paper presents a stereotype-based approach for the delivery of personalized advertisements in digital interactive television. The theoretical basis of the approach is analyzed, and a methodology is proposed for the development of user models based on classification rules. Results from an empirical validation, in the form of a laboratory experiment, are also presented in order to provide further evidence on the feasibility and usefulness of the proposed methodology. It is argued that the methodology does not only achieve valid and effective personalization at the stereotype level, but it also includes built-in mechanisms for the continuous re-appraisal of classification rules and adaptation of the user model based on dynamic data. Future research towards extending this approach towards the ultimate goal of personalization at the individual level is also discussed.
1 Introduction
Personalization has been analyzed in the context of a number of research areas such as recommender systems, adaptive hypermedia, information filtering, and user modeling. Various definitions of the concept of personalization have been proposed in the literature [1]. For example, according to Mulvenna et al. [15], the basic goal of personalization systems is to provide users with what they want or need without requiring them to ask for it explicitly. Defined in a similar way, personalization expresses the ability to provide content and services tailored to individuals on the basis of knowledge about their preferences and behaviour [1].

The vast majority of extant research on personalization is concerned with computer-
based systems of some kind or other. In this paper, we discuss the potential application of personalization principles in the context of advertisements shown to viewers in a television environment. Personalization of advertisements in Interactive TV (iTV) refers to the delivery of advertisements tailored to the individual viewer’s profile on the basis of knowledge about user preferences. Personalizing advertisements, i.e. providing viewers with messages that they are most likely to be interested in, offers marketers the opportunity to increase the accuracy of their targeting, while at the same time providing viewers with messages that increase their satisfaction in terms of interest in the advertised product. Several studies have revealed (10; 11) that less than 20% of the viewers are happy with the broadcasted advertisements. Indeed, the majority of viewers find them annoying and intrusive to their primary objective, which is to be entertained or informed through watching TV programs.
There has been very little work on personalization in the iTV environment, restricted only to the recommendation of TV programs that match viewer’s interests where the application platform is the Web (18; 7; 9). Furthermore, the developments in adaptive hypermedia research concern either classic pre-Web hypertext and hypermedia systems (earlier research) or they are devoted to Web-based adaptive hypermedia systems (5). In the following we discuss an approach for the delivery of personalized advertisements over iTV, and present empirical results from testing our approach. More specifically, in section 2 a review of current approaches in personalization is presented, while in section 3 the user modeling concept and methods are discussed. Then, in section 4 an approach to the personalization of advertisements in the Interactive TV environment is analyzed while experimental results are presented in section 5, before concluding the paper in section 6 with a discussion on achievements and further research.
2 Personalization: A Review of Approaches
Adaptation Data
The first consideration towards the implementation of personalization concerns the user features that the system will adapt to. Typically, personalization systems should exploit user’s data in terms of their goals or tasks, preferences and knowledge related to the application domain [4], such as user’s personal characteristics, interactive behaviour as well as environment data [13]
A personalized system should take into account the more appropriate features that should be modeled, always with reference to the particular application domain to which the system will be applied. For example in SETA (3), a prototype for the construction of adaptive Web stores, information exploited in user modeling includes the personal and identification data, domain–independent data, such as user characteristics (e.g. receptivity), domain-dependent preferences for product properties, and information for the classification of the user in predefined classes (stereotypes – see section 3).
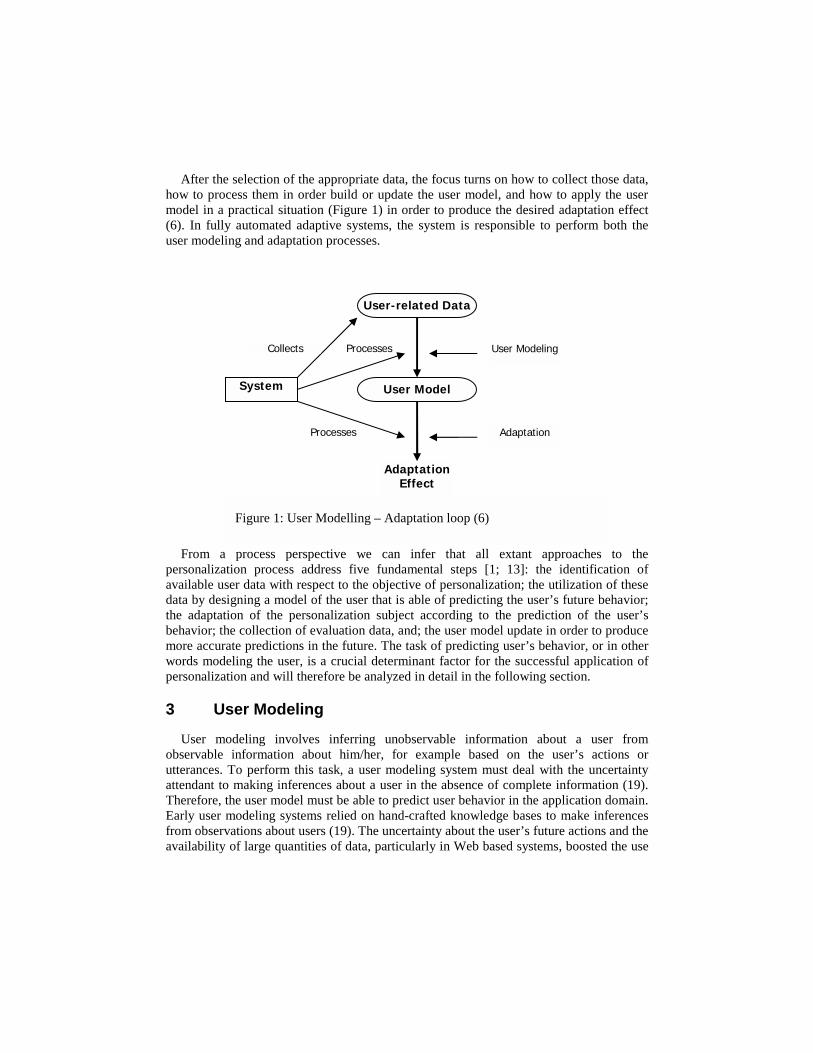
After the selection of the appropriate data, the focus turns on how to collect those data,
how to process them in order build or update the user model, and how to apply the user model in a practical situation (Figure 1) in order to produce the desired adaptation effect (6). In fully automated adaptive systems, the system is responsible to perform both the user modeling and adaptation processes.
From a process perspective we can infer that all extant approaches to the
personalization process address five fundamental steps [1; 13]: the identification of available user data with respect to the objective of personalization; the utilization of these data by designing a model of the user that is able of predicting the user’s future behavior; the adaptation of the personalization subject according to the prediction of the user’s behavior; the collection of evaluation data, and; the user model update in order to produce more accurate predictions in the future. The task of predicting user’s behavior, or in other words modeling the user, is a crucial determinant factor for the successful application of personalization and will therefore be analyzed in detail in the following section.
3 User Modeling
User modeling involves inferring unobservable information about a user from observable information about him/her, for example based on the user’s actions or utterances. To perform this task, a user modeling system must deal with the uncertainty attendant to making inferences about a user in the absence of complete information (19). Therefore, the user model must be able to predict user behavior in the application domain. Early user modeling systems relied on hand-crafted knowledge bases to make inferences from observations about users (19). The uncertainty about the user’s future actions and the availability of large quantities of data, particularly in Web based systems, boosted the use
User-related Data
User Model System
Adaptation Effect
Collects Processes
Processes
User Modeling
Adaptation
Figure 1: User Modelling – Adaptation loop (6)

of so-called predictive statistical models that exploit statistical methods in order to predict user’s future behavior. The most important methods to achieve this goal are collaborative filtering, which is based on the assumption that individuals behave similarly with others having the same characteristics or when facing similar circumstances. and content based filtering, which is based on the assumption that an individual behaves similarly under analogous circumstances
The collaborative filtering approach is widely used in recommender systems where items are recommended on the basis of ratings provided from users belonging to the same group.
Stereotypes One of the well-known methods of predicting a user’s behavior is the classification of
users into stereotypes. Stereotypes are predefined classes of users where assumptions about their behavior are attached to the stereotype (17). It is a very powerful and simple tool for making initial predictions on user’s behavior. The method involves the identification of the standard classes of users, the classification of each user into one of the stereotypes, and the derivations of the behavior of a specific user from the attributes of the stereotype.
The effectiveness of stereotyping depends on the quality of the stereotypes, the accuracy of assignment of users to stereotypes, and the quality of inferences that are drawn from stereotype membership. These, in return, depend on the quality of information about the user population, and the extent to which subgroups with different application-relevant characteristics can be empirically distinguished (13).
In the next section, we discuss a stereotype-based approach to personalization within the context of a case study in the domain of TV advertisements. The discussion revisits some of the theoretical findings of the review presented in sections 2 and 3 (for example, regarding the personalization process, filtering methods, and approaches to stereotype definitions), and exemplifies the characteristics, strengths, and drawbacks of some of the current approaches, which are then encapsulated in a novel methodology for delivering personalized TV advertisements.
4 Delivering Personalized TV Advertisements
Application Domain Characteristics Interactive TV is an environment with important differences from other interactive
environments, such as the Internet or mobile platforms, since it is based on the 1-to-many broadcasting model, thus applying personalization techniques over interactive television is a contradiction in terms. Personalization enabling techniques typically involve a set-top box that stores personalized content and controls the interactivity. A second challenge relates to the viewing environment. Whereas the personal computer typically has only one user as a time, the television is often viewed by groups of people in both private and

public areas. Consequently, personalizing and targeting advertisements effectively presents technological, business-related and practical challenges. Even if we only consider household viewership, it remains a difficult issue how to identify and target individual household members or whether to target the whole household as a group. While it is technically possible to identify which member(s) of the household is (are) currently watching TV (e.g. through ‘hidden eye’ technologies or remote-control functionality), this is something not perceived positively by viewers. Thus, in this paper we make the assumption that viewers actively select their profile by some form of system logon.
The task of personalizing product advertisements in the iTV environment is analogous to the recommendation of products in Internet recommender systems (see section 3), since it involves the selection of the appropriate products in accordance with the viewers’ needs and goals. Currently, the task of viewing TV advertisements is a passive activity, as in information filtering systems. TV Viewers do not typically wish to watch advertisements and moreover they may find them intrusive to their primary objective, which is to get informed or entertained when watching TV (10; 11). Thus, task-based adaptation is not applicable in our case and the focus should instead be on the identification of viewer needs and goals. In this light, Ardissono and Goy (3) argue that advertisements should be selected on the basis of the user’s interest and lifestyles.
Developing the User Model: A Stereotype Approach In order to develop a user model for advertisements in the iTV domain, theories and
tools from advertising and marketing were utilized. Marketers exploit such tools - for example the consumer behaviour model [10] - and use market segments that divide the market into classes of consumers with similar characteristics in order to target the consumers. This stereotype-based approach offers an effective way (according to the definition of effectiveness of stereotypes given in section 3 of this paper) to predict the viewers’ attitude against advertised products.
Although the selection of market segments depends on the advertiser of the product, for testing purposes, a version of the VALS2 (Values and Lifestyles) segmentation has been used, which is ‘by far the most popular lifestyle and psychographic research’ (10) and divides the whole population into nine clusters of consumers. In order to use this approach, we must develop classification rules that assign each viewer into one of the clusters. Traditionally, the assignment of each viewer into a cluster is performed by means of a psychographic questionnaire that measures certain variables and classifies the viewer. Taking into account that enforcing the user of a personalized system to fill in such questionnaires is rather difficult and annoying (4; 13), we use a portion of the population as a sample who provides input for the classification process, and the psychographic questionnaire is answered only by this sample.
A critical issue in the case of iTV advertisements is the definition of user interest concerning an advertisement. In recommender systems explicit ratings provided by the users are used, while in adaptive systems user selective actions, such as link or page selection (12) are employed as expression of user’s interest. In our approach, a user may be interested in either the information concerning the product or the aesthetic (or creative) part of the advertisement. However, we focus our attention on the information concerning

the advertised product, since advertising is defined as "a form of controlled communication that attempts to persuade consumers, through use of a variety of strategies and appeals, to buy or use a particular product or service" (8). This means that, even if the user is attracted by the aesthetic part of an advertisement this will ultimately affect his purchasing behavior, i.e. it will positively influence his/her interest for the product.
Designing the Interactive Advertisements In order to decide on the type of data that we will employ to monitor the viewer’s
interest, we must incorporate the requirement that in the iTV environment, the interface should be minimal, as revealed by a number of usability tests (14). This affects the interactive overlay of the advertisements, i.e. the interactive buttons or icons appearing over the advertisement video. In a user requirements survey we have carried out for iTV applications (among 476 respondents in Greece) we found out that the user’s most desired form of interactivity over advertisements is buttons that provide viewers with the ability to bookmark the advertisements in a list of favorites ads or to initiate an interaction with the advertiser or the product supplier in order to get more information. The former type of interaction has been implemented through a ‘Bookmark’ button (‘B’ button for short) and the latter with a ‘Contact me’ (‘C’ for short) button, which appear on every TV advertisement. Although it seems natural that interactive advertisements should engage the user into interactive sessions ‘on the fly’, the two forms of interaction presented above also satisfy a fundamental requirement from both User and Advertiser communities: Users do not wish to deviate from watching the TV program (engaged into an interactive session) but rather to be able to review an interactive advertisement at their convenience, while Advertisers wish to nullify the possibility of viewers missing advertisements within an ad break as a result of interacting with a previous commercial.
Developing the User Model: Scope and Data Included As a result of the aforementioned analysis, the following types of data have been
incorporated in our research: a) Demographic data provided by the user (either upon subscription to the service or
in the form of on-line menus). b) User preferences concerning products and / or product features. These preferences
can be matched against certain product attributes, features or functionalities using the ‘importance’ factor, provided by the user or derived by the system (3).
c) User-Advertisement Interaction by means of Bookmark and Contact-me buttons, which are utilized as an assessment of the user’s interest in a product.
d) Media consumption data, such as ‘programs watched’ and zapping actions, which may further inform the user model and can be used for the prediction of the user’s behavior against advertised products.
User Model Functionality: Achieving Personalization through Classification Rules

Based on the above analysis, we have developed a method for delivering personalized
iTV advertisements based on stereotypes and associated user classification rules. This method is illustrated in Figure 2.
System Training(Seed Data)
Data Mining(Classification
Rules)
Personalizationof ads
Classification ofUsers into
stereotypes
Upload Apply
Collect Interactive Data
Retrieve andDisplay Ads
Figure 2: A Methodology for Delivering Personalized TV Advertisements
The stereotypical approach presented earlier in this section requires that a sample of users provide psychographic data by means of questionnaire completion. Such data are then utilized to classify the sample into lifestyle clusters (stereotypes). Having this classification, we are able to provide the sample-viewers with advertisements that fulfill their needs and goals as soon as they start using a personalized system that employs this approach. Then, through an ongoing collection of the dynamic usage data (for example, interaction with advertisements, preferences, and media consumption), data mining techniques can be employed. These will produce classification rules of the form (X ! Y) where X includes the interaction activities and/or preferences and/or media consumption data, and Y denotes the cluster that a user belongs to. Such rules are then continuously applied to the above data monitored by the system for each individual, so that the segment to which the viewer belongs can be determined dynamically and re-assessed if needed. The advertisements that correspond to each cluster are shown to the viewers accordingly. As the amount of data that are being monitored for each viewer increases (through usage), updated classification rules are developed and applied, thus adjusting the classification into clusters.
5 Empirical Validation
Objective and methodology In what follows, we present preliminary results regarding the evaluation of certain
aspects of the proposed methodology outlined in the previous section. More specifically, our primary concern is to produce valid classification rules capable of classifying a user into one of the pre-defined market segments, since we aim to establish the accuracy the personalization approach through the accuracy of the classification rules. Using statistical methods (e.g. production of classification rules using data mining) requires performing a ‘machine learning’ test and consequently a user modeling test (19). Typically, machine learning evaluations consist of dividing data set into a training set and a test set, using the former to learn the model, and the latter to evaluate the model's performance. Contrary to

machine learning evaluations, at present, there is no generally accepted methodology for the evaluation of systems that employ a user model (19). However, current practice in user modeling involves the evaluation of the personalization mechanism by assessing the adaptation effect as perceived by the users compared to using a system with no personalization features.
Research Design For the purposes of this experiment, which was conducted in laboratory conditions, a
sample of 81 individuals was used. The environment set-up consisted of a number of televisions networked locally with content players where both advertisements and TV programmes were stored. Remote controls were given to viewers to facilitate the interaction with the system (advertisement interactions and channel zapping actions). Each user was given a brief introduction to the system functionality and was initially allowed to use it until he/she was satisfied regarding his/her ability to utilize the functionality without problems (especially regarding the ability to effectively interact with advertisements of interest). Then, the user was engaged in a monitored session of about 30 minutes where TV content and advertisement breaks were shown.
Trial steps The Lifecycle of the personalization trial consists of five steps (illustrated in Figure 3).
ClassificationRules
DomainExpert: Adsto Clusters
Classify NewUsers
LifestyleQuestionnaire
Colect User'sdata
Market expert:sample toclusters
validate rules
Show adsand
measuresatisfaction
1
2
3 4 5
Figure 3: Personalization trial steps
The user’s lifestyle data were pre-collected (step 1) by means of a standard psychographics questionnaire used by AGB Hellas, a major multinational market research company and used to classify the users into one of the nine VALS2 lifestyle clusters (namely, Domestic, Withdrawn, Comme Il Faut, Unsatisfied, Conventional, Socially Aware, Carefree, Upcoming, Critical), according to the current market practices. Users’ were shown a number of TV advertisements in 30-minute individual sessions where they expressed their interest against the advertised product by selecting ‘B’ or ‘C’ overlying the advertisement video. The results from the two previous processes (i.e. the segment that user is classified and his/her interaction data) were loaded to a data mining engine (in this experiment we used the ‘Darwin’ Data Mining which offers 3 alternative implementation

algorithms: regression trees, neural networks, k-nearest neighbour algorithms) which produced the classification rules (Figure 4). With the 80% of the sample used as a training set and the 20% as the evaluation set we were able to validate rules independently from the lifestyle parameters, based only on the data provided from their interaction with the advertisements and the set top box (step 3). IF interaction_subcategory in {BOOKMARK_AUTO/MOTO BOOKMARK_CARS BOOKMARK_DRINKS, BOOKMARK_FASHION BOOKMARK_INFORMATION BOOKMARK_MOBILE BOOKMARK CONTACT-ME-AND-BOOKMARK_CARS CONTACT-ME_AUTO/MOTO CONTACT-ME_CARS CONTACT-ME_MOBILE CONTACT-ME_PIZZA } THEN CLUSTERNAME = CRITICAL-9
Figure 4: Classification rule produced by the Data Mining Engine
The remaining steps 4 and 5 constitute the second part of the experiment, which is still ongoing. After the validity of the classification rules has been proven, these steps aim at validating the personalization effect achieved by the proposed method, through measuring the satisfaction of the users with the ‘personalized’ advertisements in contrast to their satisfaction when shown a ‘generic’ advertisement break:
6 Conclusions and Discussion
In this paper we have discussed a stereotype-based approach for the delivery of personalized advertisements in digital interactive television. We have argued for the theoretical potential of the approach and showed how valid classification rules can be produced, that are capable of classifying TV viewers into predefined clusters based on a combination of static and dynamic data. The use of extant (and thus proven) market clusters is a fundamental constituent of our approach as they provide a practical, market validated, way to identify a viewer’s lifestyle needs and goals upon which personalized product recommendation is based. Empirical validation, in the form of a laboratory experiment, was also pursued in order to provide further evidence on the feasibility of the approach and the validity of the classification rules produced.
The basic data used for the construction of the classification rules stems from user-system interaction, since these data have been shown to provide an appropriate indicator of a user’s interest in the advertised products. Furthermore, other types of data that can be observed or explicitly ‘registered’ by the user (such as media consumption, channel zapping, generic user preferences, demographics), are also used for the construction and/or elaboration of more ‘detailed’ classification rules according to the confidence factor that each rule is associated with. However, an innovative aspect of our approach is that the accuracy of the personalization can be improved with time, as more dynamic data are collected and stored regarding the ongoing interactions of the user with the system and the continuous monitoring and re-assessment of the user’s satisfaction with the personalized advertisement break.. Indeed, subsequent iterations of the method result into updated classification rules, which, when applied, may re-classify the user, thus improving the personalization effect.

It must however be noted that the volatility of the approach is limited from the fixed
number of stereotypes being used. The ultimate goal of the personalization process in the television environment is to move from the current ‘one-to-many’ TV broadcasting model towards a flexible and dynamic targeting process hopefully in the form of ‘one-to-one’ marketing. The ‘one-to-cluster’ approach advocated in this paper is a first step towards this direction, as the ‘one-to-one’ personalization can be considered as a special case of the ‘one-to-cluster’ method, when the number of clusters approaches the number of viewers.
Acknowledgements
The work presented in this paper was partially funded and developed in IST -11038 project iMedia (http://imedia.intranet.gr) as well as in IST-33400 project Gemini (http://gemini.intranet.gr) which supports this research.
References
1. Adomavicius G., Tuzhilin A.: Using Data Mining Methods to Build Customer Profiles. IEEE Computer 34(2): 74-82 (2001).
2. Alspector, J., Kolcz, A. and Karunanithi, N.. Feature-based and Clique-based User Models for Movie Selection: a Comparative Study. User Modeling and User-Adapted Interaction 7(4): 279-304 (1997).
3. Ardissono Liliana and Goy Anna: Tailoring the Interaction with Users in Web Stores. User Modeling and User-Adapted Interaction 10: 251-303, (2000).
4. Balabanovic, M. and Shoham, Y.: Fab: Content-based, collaborative recommendation. Communications of the ACM, 40(3):66-72, (1997).
5. Brusilovsky Peter: Adaptive Hypermedia. User Modeling and User-Adapted Interaction 11: 87-110, (2001).
6. Brusilovsky Peter: Methods and techniques of adaptive hypermedia. User Modeling and User Adapted Interaction, vol 6, n 2-3, pp 87-129, (1996).
7. Das, D. and Horst, H.,: Recommender Systems for TV, In Proceedings of AAAI, (1998).
8. DeFleur, M.L. & Dennis, E.E.. Understanding Mass Communication. Boston: Houghton Mifflin Company, (1996).
9. Gutta, S., Kuparati, K., Lee, K., Martino, J., Schaffer, D. and Zimmerman J.: TV Content Recommender System. In Proceedings of the 17th National Conference on Artificial Intelligence, Austin, Texas, (2000).
10. Hawkins I., Best Roger J. and Coney Kenneth A.: Consumer Behavior: Building Marketing Strategy. Irwin/McGraw-Hill, (1998).
11. iMedia Deliverables: Intelligent Mediation Environment for Digital Interactive Advertising, IST-1999-11038 (available at http://imedia.intranet.gr), (2001).
12. Joachims, T., Freitag, D., and Mitchell, T.: Webwatcher: A Tour Guide for the World Wide Web. In Proceedings of the Fifteenth International Joint Conference on Artificial Intelligence. Palo Alto, CA, (1997)

13. Kobsa, A., J. Koenemann and W. Pohl: Personalized Hypermedia Presentation
Techniques for Improving Online Customer Relationships. The Knowledge Engineering Review 16(2), 111-155 (2001).
14. Lekakos G, Chorianopoulos K, Spinellis D,: Information Systems in the Living Room: A Case Study of Personalized Interactive TV Design. In Proceedings of the 9th European Conference on Information Systems, June 27-29, Bled, Slovenia (2001).
15. Mulvenna M., Sarabjot S. Ananad and Alex G. Buchner: Personalization on the Net using Web Mining. Communications of the ACM, August 2000/Vol. 43, No. 8, 80-83 (2000).
16. Pramataris K., Papakyriakopoulos D., Lekakos G., Mylonopoulos N.: Personalized Interactive TV Advertising: The IMEDIA Business Model. Journal of Electronic Markets, Volume 11 (1): 1– 9. (2001).
17. Rich Elaine: Stereotypes and User Modeling. In A. Kobsa and W. Wahlster, editors, User Models in Dialog Systems, pages 35–51. Springer, 1989
18. Smith Barry and Cotter Paul: A Personalized Television Listings Service. Communications of the ACM, August 2000/Vol. 43, No. 8, 107-111 (2000).
19. Zukerman Ingrid and. Albrecht David W: Predictive Statistical Models for User Modeling. User Modeling and User-Adapted Interaction 11: 5-18, (2001).


Section 4: User Interfaces forEPGs


Personal Media Services: A View of Emerging Media Experiences
Andrew Fano, Anatole Gershman, and Christopher Chung
Accenture Technology Labs 161 North Clark
Chicago, IL 60601, USA www.accenture.com/techlabs
(312)693-6606 {Andrew.E.Fano, Anatole.V.Gershman, Christopher.K.Chung}@Accenture.com
Abstract: Technology improvements have provided us with capabilities to capture media content that far exceed those we have available to use and experience media. We argue that the emerging possibilities in interactive television provide compelling opportunities to create new forms of programming based on a combination of a consumer’s media in combination with professional third party content. At Accenture Technology Labs we are creating prototypes that demonstrate this form of programming in the context of a next-generation living room equipped with a large screen television along with several wall mounted digital picture frames, and a coffee table embodying a large display. The technological constraints that have governed television have largely led to the programming we see today: a few expensively produced programs each intended for an audience of millions. We use our media environment to demonstrate the opportunities at the opposite extreme: the possibility of millions of cheaply produced programs each intended to appeal to an audience of just a few. For example, given such an environment, what would a “show” of my vacation media be like? We believe great opportunities lie ahead in services that provide programming that address such questions.
Recent improvements in technology have led us to the state where our ability to
capture and amass media content is far greater than our ability to use and experience it. Digital cameras are increasingly filling our hard drives with thousands of pictures where we used to take a few dozen. Yet online photo albums preserve the old metaphors and do little to cope with changes in scale. Digital photo services are still primarily centered on photo printing, but most people print a small percentage of their digital pictures. Our camcorders have filled our closets with raw video of birthday parties, vacations, and children’s first steps, but these tapes stay in our closets because unedited they are marginally watchable. Many have amassed large collections of mp3 music files, but acquiring these files and managing them is a tedious administrative task. As we look at these trends and consider new media delivery capabilities in coming years we conclude that an important area of opportunity for interactive television lies in providing interactive programming based on a consumer’s own

content in combination with professional third party content.
For example, consider the following scene:
You arrive home on a cold winter day and settle down in your living room with a drink. A glance at one of your various digital frames on the wall shows a few snapshots from your Hawaii vacation among other things. Yes, you’d rather be in Maui. You tap your remote to see more. Very gently your favorite island music begins to play. Nearby screens in the room begin to present related content. You see the video you took at the Luau – or maybe that’s the Luau’s own video. What difference does it make? Soon the pictures appear that you took on the bike ride down the volcano annotating the map provided by the tour guide company. A live web camera from the hotel you stayed in shows you the scene at the beach and pool right now on your TV, alongside pictures taken by the Stevens -friends you made there. It looks like they’ve been back. The music fades to a favorite song your friend Bill has wanted you to listen to for weeks. You sip your drink and leaf through a magazine, listening to music and taking an occasional glance at a screen or two. After a few minutes of no direct interaction, the screens start to wander. Earlier trips to Hawaii appear, and soon other vacations and family pictures. Interests other than diving arise: a challenging chess situation, your buddies in a virtual world, aviation history, current movie and TV show posters, other friends and family pictures. You can even share the experience with your friends using a screen in the coffee table as a form of messenger client. If you do nothing, some of the screens settle onto scenic vistas of mountains with only the subtlest changes – a bird flies by, a leaf falls from a tree, the sun begins to set. The music gradually changes from island music to soft latino music, and soon wanders over to classic jazz. You notice but a small portion of all this , as you leaf through your magazines and play with your kids.
We believe scenarios such as this embody the natural results of emerging technology trends in television and media combined with broader technology trends towards “ubiquitous computing”, which Mark Weiser has characterized as deploying technology so that “m achines fit the human environment, instead of forcing humans to enter theirs, [making] using a computer as refreshing as taking a walk in the woods” [1]. At Accenture Technology Labs we are building prototype systems that demonstrate the functionality described in this scenario. We are building a model next -generation living room equipped with a large plasma TV screen, several picture frames with embedded flat panel displays mounted on walls, a coffee table with a large embedded flat panel display, and a tablet pc. The intent is to create an environment that can deliver novel immersive experiences in a manner consistent with a person’s natural living environment. But is this even TV?
Our current conception of television is based on the programming we see today, which is largely the result of technology constraints that have mostly prevailed since the advent of television. These constraints include:

Broadcasting (vs. narrowcasting) limits choices The same small number of programs must be broadcast to large audiences. Synchronous broadcasts Programs are broadcast at fixed times to large audiences. Viewers must know the schedule and plan accordingly. Fixed length programs The need for broadcast schedules results in mostly fixed length programs. Programming with virtually no viewer interaction Because there has typically been no way for viewers to communicate back, combined with the previously mentioned constraints, programming involves virtually no interaction, which means the content must “do all the work” and the viewing experience is largely passive. Only highly produced content created by production companies Because only a few programs can be broadcast at any given time and each program must appeal to hundreds of thousands or millions of people, content creation is an expensive proposition performed by a relatively small set of professional production companies. Viewing on one screen TV monitors are expens ive and large so most rooms have at most one. This fact, combined with the previous constraints has led to a situation where TV viewing is an activity that requires the viewer to seek out their desired programs at particular times and focus their attention on the one screen showing the selected program. Many of these constraints are being eased or lifted altogether, presenting a wealth of opportunities. As narrowcasting becomes possible we can start considering audiences of one rather than millions. Eliminating the need to adhere to a fixed schedule means we can have variable length programs. This is a necessary feature if we are to have meaningful interactivity as two way communications becomes possible. These emerging capabilities enable us to change our notion of what a program is. Consider the content of a program, for example. Today media companies produce a few very expensive new and entertainment shows each targeting millions of users. What’s the alternative? Our intent is to explore the other end of the spectrum. As we start to have multiple screens in a room including such things as digital picture frames, some of the content we see will act as background content, perhaps closer in function to wallpaper than a traditional TV show. And what will the content be? Consumers today as a whole are creating far more content than professional media companies. As this content moves from our hard drives and closets to online hosting services we can begin to consider light production services. Furt hermore narrowcasting lets us ask the question, in addition to the few expensively produced shows intended for millions, can we have millions of cheaply or “lightly” produced shows each intended for an audience of a very few? Today consumers either spend a

few thousand dollars on video for their daughter’s wedding, or nothing to watch their unedited home movies. A key question we are exploring is what is possible for price points in between? Can I produce a vacation “show” for $1 or $10? An approach we’re exploring in this direction is the use of templates for frequent experiences like birthday parties and vacations. A trip I take to a popular destination like Hawaii is unlikely to be radically different from those of others, and may result in similar structuring with shared content from third party sources. These productions will blend personal pictures and videos with professionally produced ones. For example, the hotel where I was staying may supply pictures and videos of their facilities that will be integrated into my vacation “show”. We anticipate a spectrum of content production services from inexpensive automatically constructed shows that are little more than screensavers, to more expensive presentations edited by human editors. There are, of course, other promising approaches to immersive media experience, such as interactive story telling (e.g. [2]). These types of applications provide valuable and fully engaging activity in and of themselves. Our emphasis, however, is on exploring “light” interactions that are designed to complement the physical environment in which they are presented and the activities that occur there. We of course are not arguing that current programming will go away. People like the content we see today. We simply believe that the greater flexibility in delivery and interface technologies we will see in coming years, combined with the dramatic growth in personal media will lead both to the need and opportunity to provide services of the type described here. We are therefore currently focused on demonstrating how such media can be used to deliver economically feasible immersive experiences for audiences of one in a manner consistent with a viewer’s physical environment. We believe such approaches will be of increasing interest as we enter what has been described as the “ experience economy” in which experiences themselves will increasingly be products [3].
References:
1. Weiser, M. (1991). The computer for the 21st Century. Scientific. American. 265, 3 , pp. 94-104.
2. Stienstra, M. A., (2001). Creating an immersive broadcast experience. In Proceedings of
the Ninth ACM interna tional conference on Multimedia. ACM Press New York, NY, USA. Pp. 455 – 456
3. Pine, B. J., and Gilmore, J. H. (1999). The experience economy: work is theatre and every
business a stage. Harvard Business School Press, Boston, MA.

Personalized Contents Guide and Browsing based onUser Preference
Hee-Kyung Lee1, Han-Kyu Lee1, Jeho Nam1, Beetnara Bae2, Munchurl Kim2,Kyeongok Kang1, Jinwoong Kim1
1 ETRI, 161 Gajeong-dong, Yusong-Gu, Daejon, 305-350, Korea{ lhk95, hkl, namjeho, kokang, jwkim }@etri.re.kr
http://www.etri.re.kr2 ICU, 58-4, Hwaam-Dong, Yuseong-gu, Daejeon, 305-732, Korea
{ beetnara, mkim }@icu.ac.krhttp://www.icu.ac.kr
Abstract. Main objectives of metadata usage on the side of set-top shall beeasy access to contents or certain parts of contents that user wants. Based onmetadata description compatible to the TV-Anytime Forum specifications, weimplement advanced electronic program guide (EPG) useful for consumers onbroadcasting services ; electronic content guide, table of content browser,event-based summary viewer, etc. Electronic content guide, which supportsgroup of contents information such as episodes or related materials. And tableof content browser can provide easy access and browsing along withhierarchical structure of content. Event-based summary viewer can show userthe selected event’s or subjects’ sequential summary, and provide segment-based access for summary segment also. And user’s behaviors interacting toprograms are monitored, and the user’s preference is automatically updatedaccordingly. Based on the updated user’s preference, EPG recommends user’sfavorite genre and channel, so user can decide easily whether or not a programbeing broadcast is his/her interested program.
1 Introduction
With the advent of digital broadcasting, a large number of program channels andprograms become available at the user’s terminals such as set-top-box or PC. Programnavigation and searching become difficult at TV terminal sides using a conventionaldevice such as a TV remote controller. As a result, EPG service is provided bybroadcasters or service providers in the digital TV(DTV).But usual EPG just informs user when and on what channel a program is broadcasting.Even though some EPG contain recommender system, but there are missing points.Das et al. (1998) make use of explicit feedback to generate recommendations [4]. Thistechnique requires users to explicitly specify their interests for high qualityrecommendation. Oard et al. (1998) proposed three potential sources for implicitfeedback and described two strategies those sources could be used by recommendersystems [5]. But methods for inference, prediction that are important two parts of the

strategies are not sufficiently explained. Baudisch (1998) tried to make user effort forrecommendation zero, so audience size of a program and opinion leaders are used [6].But the two data are not personalized.In this paper, we propose an advanced EPG which provide affluent information aboutprogram and program contents such as group of contents information, hierarchicalstructure of content, event’s or subjects’ sequential summary, segment-based access,etc. We call it advanced contents guide (ACG). In addition, the developed ACGrecommends the user’s favorite genre and channel based on the user preference whichis calculated by monitored user’s behaviors interacting to program.To verify the efficiency of the proposed ACG, we implement an application system asset-top emulation software. In that system, metadata is stored and managed bydatabase tool. The structure of database tables and their columns are designedaccording to the TV-Anytime metadata and content referencing specifications. Theapplication system shows that the proposed ACG is effective for program and contentbrowsing and navigation by reducing user’s decision time and the frequency of access.In section 2, the system structure of ACG, in section 3 user preference models, and insection 4 services provided by ACG are explained.
2 The system structure of ACG
ACG consists of 6 function modules ; Search & Navigation Module, LocationResolving Module, User Preference Manager, Storage Manager, Contents Handler,and User Interaction.Search & Navigation Module takes charge of accessing and retrieving the datastructure of metadata. The database tables for Search & Navigation Module arefollows.
Table 1. Database Table used by Search & Navigation Module
Database Table InformationPITable DS of program, relation to groupGITable DS of program groupPLTable The location of programSITable Service InformationCLTable Actors, producer etc. About items for creationSegITable Segment InformationSCITable Segment Group Information
Location Resolving Module works for contents referencing which determine thelocation of program and extract a group of identifier by the input of CRID (ContentReference ID). User Preference Manager is in charge of storing and managing user’sbehaviors interacting to programs, and extracting user’s preference information fromthat. Storage Manager is in charge of storing contents and metadata, changing thoseinformation into proper type for the consumption in a terminal, and providing controlfunction to user. Contents Handler is in charge of contents playback. User Interaction

provides user interface for user’s interaction to system. Fig. 1 shows the relationamong modules.
StorageManagement
UserInteraction
ContentPresentation
LocationResolution
Consumer
i2
i4
E1
i5
Search andNavigation
i1
Metadata DeMux C1/ I1
MetaData Client
Search andNavigation
Service Provider
Location ResolutionService Provider
i1'
i2'
UserPreference
i3
Fig. 1 The relation among modules
Important relations among function modules follow.Between User Interaction and Search & Navigation Module, i1 is interface fordelivering control signal from User Interaction to Search & Navigation Module andthe result from Search & Navigation Module to User Interaction. i1’ is interfacebetween Search & Navigation Modules on the service provider and Search &Navigation Modules on the terminals using bi-directional channel. Between UserInteraction and Location Resolving Module, i2 is interface for delivering controlsignal from User Interaction to Location Resolving Module and the result fromLocation Resolving Module to User Interaction. I2’ is interface between LocationResolving Module on the service provider’s and Location Resolving Module on theterminals using bidirectional channel. Between User Interaction and User PreferenceManager, i3 is interface for inputting the user’s usage information from UserInteraction to User Preference Manager and presenting the events and informationrelated to the user’s preference. Between User Interaction and Storage Manager, i4 isinterface for delivering control signal and status information of content and metadatastorage between User Interaction and Storage Manager. Between User Interaction andContents Handler, i5 is interface for delivering control signal and status information ofContents Handler between User Interaction and Contents Handler.
3. User preference models
The paradigm shift from the conventional broadcasting to digital broadcastingenvironment allows users to watch what they want in their preferred ways. MPEG-7Multimedia Description Schemes (MDS) and TV Anytime specifications specifydescription models of user preference and usage history. The user preference

description scheme defines a structured description model for user’s preference inbrowsing preference, and filtering/searching preference [1, 2]. The usage historydescription scheme defines a structured description model for describing usage historyof content users. The description data for user’s preference and content usage historycan be used in TV terminals such a set-top box and PC.The user’s preference is very valuable information for user oriented or personalizedapplications. However, the preference needs to be defined in somewhat quantitativeway. One simple solution is to let users set preference values for given items. In thiscase, the users are interrupted and should be aware of the semantics of specific valuesthey set to. Therefore, it is more appropriate to compute user’s preference based onusage history of program contents. By analyzing the usage history data, the user’spreference values can be adaptively computed according to the user’s preferencechange in time.The MPEG-7 MDS and TV Anytime metadata specifications just define the syntaxand semantics of user preference schema but the extraction methods of that value arenot specified in standardized ways.In this paper, we address user preference updating method by monitoring andanalyzing user’s behavior on content usage of programs. After collection of usageinformation, user’s preference values is automatically computed and updated.
3.1 Computation of user preference values
3.1.1 Statistical approachThe preferences based on categories can be modeled with probabilities in a statisticalframework. In Fig. 2, the genre can be represented in a tree structure. So thepreference on each genre can be represented as its probability that reflects thefrequency of the genre visited.
�Genre NewsSports
Baseball
Drama
Economy
Political
Soccer
Basketball Society
WeatherSubgenre
Fig. 2 An example of Genre Tree
The probability )( igP of the ith genre ig is expressed as,
G
gi T
TgP i=)( . (1)
whereigT is the total time taken in watching program contents of the ith genre, and GT
indicates the total time for viewing program contents of all the genres. Note that
1)( =∑i
igP . For the probabilities of the subgenres, the conditional probability
)( ij gsgP of the jth subgenre jsg given the ith genre ig is expressed as,
i
j
g
sg
ij T
TgsgP =)( . (2)
wherejsgT is total time taken in watching program contents of the jth subgenre.
A probability density function of the content watching time can be used to model itspreference. The higher the probability density function values the more preferred thecontent watching time. The probability density function values can be obtained byhistogram computation over the content watching time. This preference can becombined with the probability value of the subgenre preference to support therecommendation functionality for preference genres at the preferred times.
3.1.2 Rule-based approachThe preference such genre/subgenre, actors and directors can be modeled as theprobability. Sometimes, the user behaviors need to be interpreted for the computationof the preference values. For example, the user action such “record” while watchingthe program content implies the relative importance for the content. On the other hand,the user action types such as FastForward indicates relatively less importance for thecontent. Such a series of user action types are very common and can be utilized inreasoning the preference degree on a specific program content.We set up a rule in order to interpret such user action types taken in a series asfollows:
Table 2 Action Type and significance on action sequences
Case 1: Preview -> Play (high)Case 2: Play -> Stop (Middle):: refreshCase 3: Play -> Preview (Middle):: refreshCase 4: Play -> Fast Backward -> Play (high)Case 5: Play -> Fast Forward -> Play (Middle)Case 6: Play -> Fast Backward -> Pause -> Play (high)Case 7: Play -> Pause -> Fast Backward -> Play (high)Case 8: Play -> Fast Forward -> Pause -> Play (middle)Case 9: Play -> Pause -> Fast Forward -> Play (middle)Case 10: Any other action: Low
In Table 2, the user action types are Play, Pause, Stop, FastForward, FastBackward,Skip one frame, and Back to one frame. The Case 1 through 10 indicate the possible

combinations of user actions in order and their corresponding significances on thecontent being played.
4 Services provided by ACG
ACG allows users to access easily program contents of their interest by presentingvarious type of information about contents and user preference information. Therepresentative types of services are electronic content guide, table of content browser,event-based summary viewer, and genre and channel recommendation based on theuser preference. In the sub-section, the details of the services are explained.
4.1 Electronic content guide (ECG)
Electronic content guide service (ECG) supports a list of programs which arescheduled to be broadcasted on the date selected by user. Changing a date and time byinput device, the cells in the calendar are marked if there are programs to bebroadcasted and program list bar is updated by the scheduled program information.And user can see certain part of programs which belong to a genre and a gradepreferred by himself /herself. The genre is classified into eight groups such as news,education, documentary, drama, show, music, entertainment, science. An additionalitem of genre is “My favorite” which is used to see the programs categorized intouser’s favorite genre. The grade is also classified into nine groups such as “availableto seven age”, “available to nineteen age”, “available to boys”, “available to adults”,“unavailable to minority”.The user interface for ECG service consists of calendar, genre and grade list andprogram list. In the program list, program information is presented in terms of channel,broadcasting station, start and end time, title, whether the contents is stored or not. Fig.3 shows the screen of the ECG service.
Fig. 3 User interface of ECG Fig. 4 Screen of program group information
�

ECG also presents program group information. The program group means thecollection of programs which have the same subjects or belong to the same series.Programs, group synopsis, group genre, group grade is presented in the program groupinformation screen. Fig. 4 shows the screen of program group information service.
4.2 Table of content browser (TOC)
The TOC service provides easy access and browsing along with hierarchical structureof content. As shown in Fig. 5, the contents of a program are leveled and presentedaccording to a hierarchical order. The user interface of a level consists of fourwindows. Each one informs TOC segment information, such as title, synopsis, andrepresentative image.
Fig. 5 Screen of table of content browser
Fig. 6 Screen of event-based summary viewer
(a) The first level (b) The second level
(a) EbS screen (b) Playback of contents

4.3 Event-based summary viewer (EbS)
Event-based summary viewer can show user the selected events’ or subjects’sequential summary, and provide segment-based access for summary segment also.The user interface of EbS consists of four windows for presentation of differentsubjects. Each one informs the title of subject, original playing time and summarizedplaying time. Fig. 6 shows the screen of event-based summary viewer.
4.4 Genre and channel recommendation based on the user preference
When a user initiates the ACG system, the ACG checks the user’s preference from thedatabase and presents the program content information accordingly.At first, ACG recommends the user’s favorite channel by presenting the channelnumber on the cells of calendar. And when a user chooses “My favorite” item in thegenre lists, the programs, belonging to the upper favorite three genres, aredifferentially colored and positioned from top to bottom in the program list. Becauseof this recommendation information, a user can easily access program contents andreduced time consumption.And for the preference update, when the program content is replayed, user actionssuch as “Fastforward”, “Fastbackward”, “Pause” and “Stop” are recorded in the UserHistory DS. The User History DS is then analyzed in the Usage History Analysismodule and the analyzed results are used to update the user preference values.Fig. 7 shows an example of genre recommendation based on the user preference.
Fig. 7 An example of genre recommendation based on the user preference

5 Result and future work
We implement an application system as set-top emulation software to verify theefficiency of the proposed ACG. In that system, metadata is stored and managed bydatabase tool. We use program metadata of 4channels per each hour, 18hours per eachday, 14days. Main genres for TOC and EbS service are drama and news. The systemenvironment is as follows,
OS : Windows 2000 ProfessionalLanguage : C++RAM : 512MBHDD : 30Gbyte for 6contents with one hour duration
578Kbyte for ECG metadata117Kbyte for TOC and EbS metadata
User control interface : Keyboard, and PDADisplay : TV monitor
It seems that the system needs too much storage for metadata. But there areprogressive researches to reduce the amount of metadata with XML document type. Ifthe technique is applied, the metadata can be reduced to 80% of the original amount.A lot of examinations show that the proposed ACG is effective for program andcontent browsing and navigation by reducing user’s decision time and the frequencyof access. In the future, we will extend this system to multiple PDR environment.
Acknowledgements
This work was supported by the Ministery of Information and Communication (MIC)of Korean government under the title of "A Study on MPEG-7 based BroadcastingContents Metadata Technology". We, authors, faithfully thank to the project fundingmanagers.
References
1. TV Anytime: Specification Series: S-3 Metadata, SP0003v1.1, August 17, 20012. MPEG-7 : Text of 15938-5 FCD Information Technology – Multimedia Content Description
Interface, ISO/IEC JTC 1/SC29/WG11/N3966, March 2001, Singapore3. Munchurl Kim, Geewoong Ryu, Beetnara Bae, Jeho Nam, kyungok Kang, Jinwoong Kim :
Intelligent Program Guide for Digital Broadcasting, IWAIT(2002), Jan. 20024. Duco Das, Herman ter Horst : Recommender Systems for TV, 15th AAAI Workshop on
Recommender Systems, July 1998, Madison, Wisconsin5. Douglas W. Oard, Jinmook Kim : Implicit Feedback for Recommender System, 15th AAAI
Workshop on Recommender Systems, July 1998, Madison, Wisconsin6. Patrick Baudisch : Recommending TV Programs (How far can we get at zero user effort ?),
15th AAAI Workshop on Recommender Systems, July 1998, Madison, Wisconsin

7. Srinivas Gutta, Kaushal Kurapati, KP Lee, Jacquelyn Martino, John Milanski, David Schaff-er, John Zimmerman : TV Content Recommender System, 17th AAAI, July-August 2000,Austin, Texas

Time-Pillars: a 3D Cooperative Paradigmfor the TV Domain
Fabio Pittarello1
1 Dipartimento di Informatica, Università Ca’ Foscari di Venezia,Via Torino 155, 30123 Venezia, Italia
Abstract. This work analyses the points of weakness of the current interactionparadigm for the TV user and proposes a new model based on interaction insidea 3D information-rich environment. We introduce a new artifact, the time-pillar, to populate the 3D environment; we propose it as a mark-up of specificTV channels, representing the basis of a new interaction metaphor that allowthe user to explore and to summarize the contents of the TV domain. If we con-sider the digital TV domain, another important issue for the average user it isthe difficulty to find information related to all the available channels. Thereforewe propose, as a further step, a cooperative approach that uses convergencebetween different media (TV, personal computer, Internet) to share TV infor-mation among different subjects (broadcasters, groups of interest, private us-ers).
1 Introduction
If we consider the European panorama, terrestrial analogical TV broadcasting cur-rently offers, even in the most advanced countries, a low number of channels; researchregarding interaction with domestic TV box has not evolved too much from the intro-duction of television. The most significant advance in all these years has been theintroduction of the remote control, which simply replicates commands available on theTV box for switching channels. The use of on-screen displays has increased, in recentyears, the number of available functions (e.g. scrolling list of channels) and a modestlevel of feedback for the user.
Analogical satellite broadcasting hasn’t brought any novelty in the way we use theTV box. The number of channels available for a specific country hasn’t grown signifi-cantly and, consequently, this has not led to change the interaction paradigm. Only arestricted number of enthusiasts has used analogical satellite receivers connected tomotorized dishes in order to receive a wider number of channels.
Recently the introduction of digital technology (DVB-S [5]) and the launch of newgenerations of satellites has widened the number of channels for the average user. InEurope the Eutelsat [6] and Astra [1] consortiums have a significant number of satel-lites and offer more than 1000 channels on the two major orbital positions. Besides,during the last year, the introduction of new simplified low-cost motorized systems

based on the Diseqc protocol [4] has brought at last the opportunity to automaticallyand seamlessly switch between channels broadcasted from different satellites, hidingto the user the complexity of orbital alignments and synchronization mechanisms.
In parallel, the evolution of terrestrial broadcast towards digital technology (DVB-T [5]) is bringing to the masses a further opportunity to access a significant number ofchannels.
This new scenario has given the chance to depart from the generalist TV model,based on the scheduling of programs for a wide undifferentiated audience; today thereare a wide number of thematic channels (wheatear forecast, news, sports, etc.) or con-ceived for specific classes of audience (cooking, motors, sailing, local news, etc.).
Besides, dynamism characterizes the current satellite broadcasting. Channelschange weekly; for the average user it is difficult to keep track of all the changes andupdate the settings of his/her receiver.
Recording of TV content is today available for the average user: VHS analogicaltechnology provides an affordable means to record video streams, even if the qualityis lower than the original broadcast. Besides, some manufactures are proposing digitaldevices that allow to record digital MPEG [13] streams and to play back the contentswithout losses of quality [11]. Unfortunately, users may schedule the recording time,but they have no means to have a summarization of the broadcast.In parallel with the evolution of the broadcast technology, there has been a comple-mentary activity concerning the so-called interactive TV [12]. A first range of solu-tions allows the user to choose among different cameras related to a specific show(e.g. Formula 1 races) or to explore interactive program guides.
The effort of these initiatives seems to be focused on interactivity related to a spe-cific channel rather than on providing a different paradigm for managing the wholeTV channels domain. A more sophisticated category of receivers promises to bring ina near future the power of bi-directional communication.Convergence among different media is a key point of the proposed software andhardware architectures: in particular the integration of satellite broadcast and Internettechnology is one of the most explored scenarios. The announced Mediaterminal [16]is a significant step towards this direction. In spite of that, even in this case the maineffort has been devoted to the definition of the software and hardware architecture, butso far no significant novelty about the user interface has been announced.
2 Related work
For what concerns recent work related to user interface issues, WebTV [24] is anattempt to explore convergence between different media, but it is more a simplifiedmethod for giving web access to TV users rather than a new paradigm for TV content.
An interesting attempt to combine seamlessly video and 2D/3D graphics is givenby the NewsNow prototype from Sony [10]; the project is related to the efforts of theWeb3D Rich Media Group [23], and explores the scenario of a new content paradigmfor interactive TV; the project NewsNow breaks the traditional video presentation andproposes personalized and up-to-the minute news combining video fragments in a 3D

scenario. Again, the attention of the prototype is devoted to the contents of a specificbroadcaster, rather than to the proposal of new metaphors for organizing channels.
If we consider the evolution of the audio-video streaming standards, there is a con-sistent ongoing work aimed to give a structure to the video stream and to allow theretrieval of information inside it. The effort of the MPEG4 [14] and MPEG7 [15]working groups is the most significant for what concerns this issue, but it is still awork in progress (especially for what concerns MPEG7).
Finally, for what concerns the diffusion of TV content related information, printedguides are still the main channel. There are also Internet web sites that offer informa-tion related to TV channels. Typically information coming from all these sources isrelated only to a subset of TV channels.
An interesting service is given by the Lyngsat web site [9], that displays technicalinformation and links to broadcasters that maintain Internet sites related to their pro-grams. Besides, this service allows the user to choose among a set of satellites and todownload the related settings to update the digital receiver. We may consider thisservice as a first effort towards convergence between different media; besides, thisservice offers information related to all the broadcasters, although consulting the website and watching TV are still separated activities.
3 The target area of our proposal
The discussion given so far puts in evidence the inadequacy of the current interac-tion paradigm for the TV user in a number of significant areas. In the following para-graphs we’ll discuss our proposal, oriented towards a different way to consider theinteraction with the TV medium. In particular the focus of our proposal concerns twomain areas:
1. content exploration and summarization; we introduce a new paradigm that allowssophisticated exploration behaviors inside a specific channel (including deferredvisualization and preview of future content) with a simple user interface; besides,our work suggests a new metaphor for browsing across the whole panorama of TVchannels;
2. information sharing; today there is no comprehensive information source for con-tent; we suggest a cooperative approach that uses convergence between differentmedia to coordinate information coming both from the broadcasters and from otherindividual users, allowing the TV user to have a less fragmented vision of the TVdomain.
4 The time-pillars
Our approach, while it still offers a simplified way for people wanting to access aspecific TV channel, proposes a different paradigm for the exploration of the wide TVpanorama that already characterizes satellite broadcasting and that in a near future will
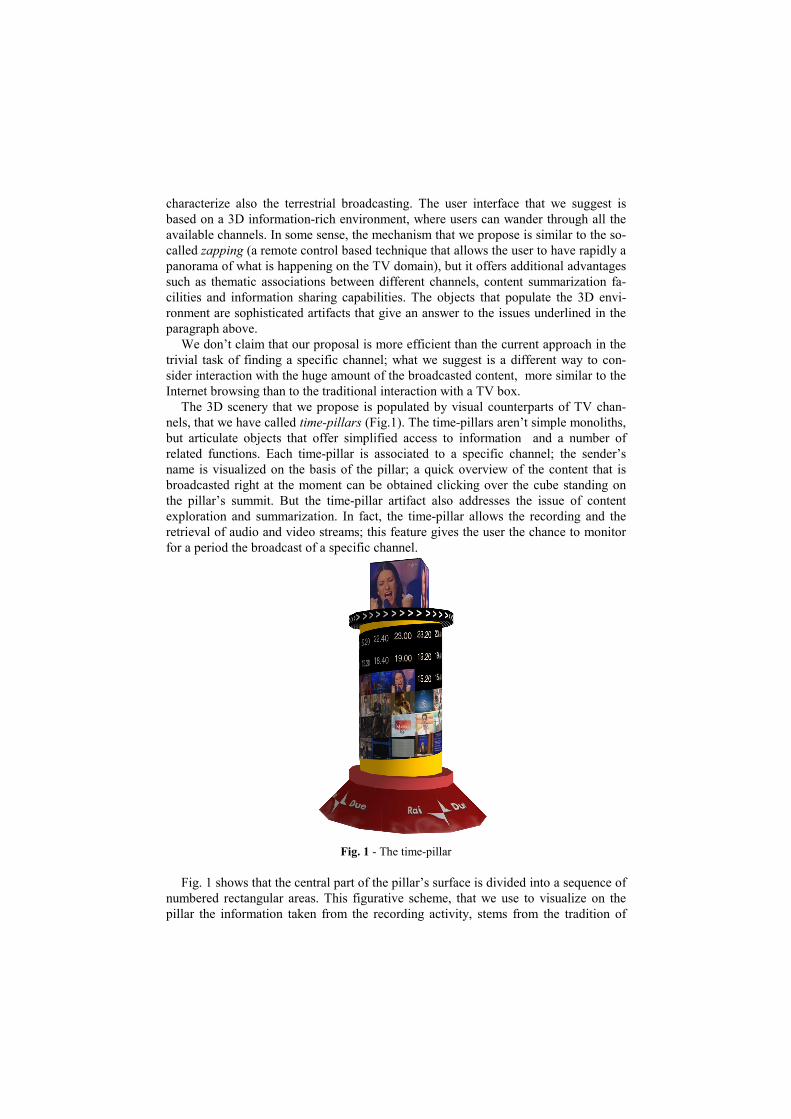
characterize also the terrestrial broadcasting. The user interface that we suggest isbased on a 3D information-rich environment, where users can wander through all theavailable channels. In some sense, the mechanism that we propose is similar to the so-called zapping (a remote control based technique that allows the user to have rapidly apanorama of what is happening on the TV domain), but it offers additional advantagessuch as thematic associations between different channels, content summarization fa-cilities and information sharing capabilities. The objects that populate the 3D envi-ronment are sophisticated artifacts that give an answer to the issues underlined in theparagraph above.
We don’t claim that our proposal is more efficient than the current approach in thetrivial task of finding a specific channel; what we suggest is a different way to con-sider interaction with the huge amount of the broadcasted content, more similar to theInternet browsing than to the traditional interaction with a TV box.
The 3D scenery that we propose is populated by visual counterparts of TV chan-nels, that we have called time-pillars (Fig.1). The time-pillars aren’t simple monoliths,but articulate objects that offer simplified access to information and a number ofrelated functions. Each time-pillar is associated to a specific channel; the sender’sname is visualized on the basis of the pillar; a quick overview of the content that isbroadcasted right at the moment can be obtained clicking over the cube standing onthe pillar’s summit. But the time-pillar artifact also addresses the issue of contentexploration and summarization. In fact, the time-pillar allows the recording and theretrieval of audio and video streams; this feature gives the user the chance to monitorfor a period the broadcast of a specific channel.
Fig. 1 - The time-pillar
Fig. 1 shows that the central part of the pillar’s surface is divided into a sequence ofnumbered rectangular areas. This figurative scheme, that we use to visualize on thepillar the information taken from the recording activity, stems from the tradition of

roman art, in particular the one related to the narration of historical events, such as inthe well famous Traian’s column. The Traian’s column, still existing in Rome, wasconceived in the 2nd century A.D.; it contains more than 2.000 figures illustratingepisodes of the Dacian war won by Traian and culminating in the death of the Dacianking Decebalus. The novelty of this monument was the idea of representing the warscenes using an helicoidal band of figures spiraling up. The summit of the column canby reached by a spiral staircase and originally bore the statue of Traian.
Our artifact, the time-pillar, uses the same spiral tape paradigm of the Traian’s col-umn. Each pillar is the visual counterpart of a specific channel and each recordedvideo sequence has a counterpart in a snapshot inserted on the spiral. The insertionorder on the pillar’s surface reflects the temporal order of the recorded video events.Besides, pictures are active artifacts that the user may click to visualize the relatedvideo fragment.
The time-pillar interface can be used by the TV user that encounters it inside the3D environment to monitor the activity of a specific channel (in this case the ItalianRAI2 channel). The user activates the recording activity just clicking on the pillar’sbase (Fig. 1): at regular time intervals, video fragments of the selected channels arerecorded by the underlying hardware architecture; for each fragment a snapshot of therecording is generated and visualized on the time-pillar surface. In 24 hours the wholepillar’s surface is textured with the snapshots taken from the recordings. The user canthen examine the pillar and run the stored video fragments just clicking over the re-lated snapshot on the surface.
The time-pillar artifact is conceived for being inserted in a 3D environment that canbe freely navigated by the user; that is the reason why, instead of using linear schemessuch as the ones proposed in previous works related to information visualizationproblems [21], we have proposed an artifact that can be examined from different di-rections. Of course, the partial visual occlusion of the spiral is the complementaryshortcoming of this visualization paradigm. That is the reason why the user has theopportunity, just clicking over the upper part of the pillar’s cylinder (Fig.1), to rotatethe central part of the time-pillar in order to examine the content of the spiral.
5 Walking into the TV domain
The 3D scenery is characterized by two classes of objects: the higher scale objects,(mainly architectural entities such as a theatre, a stadium, a bank, a school, a privatebuilding, etc.) that are visible from a distance and mark the scenery giving to each partof the environment a specific connotation; the time-pillars or lower scale objects.
The time-pillars are divided by the interface designer in homogeneous groups, forexample according to thematic criteria, and placed on the environment associatingthem to specific buildings (for example the time-pillars representing channels relatedto the theme theatre may be disposed by the designer next to a simplified representa-tion of a theatre). The result is a 3D environment articulated in venues, put in relationin a clear visual topology and connected by paths that define the main connections.
The user can explore this 3D information space using three modalities: guidedtour, automated tour and free walk.
The first option (guided tour) allows the user to follow a predefined path; this ex-ploration modality allows the user to reach sequentially all the significant views of the3D scene, controlling each step of the path. This approach allows the user to system-atically explore all the content of the TV domain. We can consider this modality as the3D counterpart of the scrolling lists of channels given by the current TV interfaces.The user can optionally memorize specific views for switching rapidly to the favoritechannels.
The second option (automated tour) has been suggested by users experimenting the3D environments built in our previous works [20]; this modality allows the explora-tion of the entire 3D scene with only an initial mouse click.
The last modality (free walk) is conceived for the free wandering through the TVdomain. For this option, our proposal takes advantage of the so-called method of loci,based on the human capability to remember objects when they are placed in a struc-tured visual context1. The underlying idea is to let the user free to wander and to en-counter information without any pre-ordinate plan, but at the same time to let him/herprogressively build a mental map of the scenery, of the time-pillars and of their mutualspatial relationships. In other words the idea is to conjugate freedom of explorationwith the progressive accumulation of knowledge related to the part of the TV domainalready investigated by the user.
6 The prototype
The hardware required for allowing the user to interact in the 3D environment de-scribed above is not much sophisticated; a prototype, currently under development,uses an average personal computer with a 3D accelerated graphics card and a low-costDVB-S card.
The recording scheme based on fixed scheduling is very simple and probably incertain cases is not able to monitor all the events; of course the shortest transmissions,like weather forecast, are the most problematic. But even this simple mechanism canbe a valuable tool. This technique, for example, allows the user to build visual maps ofthe content broadcasted by small channels. It allows the user to see, at a glance, which
1 The poet Simonides of Ceos astounded his contemporaries with his memory skills. Si-
monides was hired by a noble to attend a banquet; after his performance, while he was outsidethe banquet hall, the roof fell; the hall was destroyed so badly that no direct identification of thevictims was possible, but Simonides was able to resolve this problem because, he claimed,during the banquet he had associated the images of the diners to their spatial position. The useof spatial locations to help humans to memorize information had proved to be effective; thismethod, that was called method of loci, and its derivations were extensively used during theclassic period by orators; further development occurred during the Renaissance, when memoryspecialists developed complicated schemes to help memorization [26]; in recent times thememory empowerment given by vision has been confirmed by the modern neurosciences [2].

are the broadcast hours and to roughly identify the typology of information (news,entertainment, films, etc.). The first level of information given by the visual map canthen be refined clicking over the snapshots, that activate the video fragments.
A more accurate approach, for what concerns discrimination of content, can begiven by techniques that allow a more sophisticated summarization of video streams[27]. These techniques could be integrated in our system as an alternative to fixedscheduling.
For what concerns the standards and the languages suitable for building our 3Dmetaphor for the TV domain, MPEG4 [14] can be considered one of the most inter-esting and promising candidates. MPEG4 allows to develop applications that useaudio, video, 2D and 3D content. Advances in the standard continue to be made, in-cluding the definition of a subset of VRML language that enable minimal 3D func-tionality for MPEG4 (VRML is a ISO language conceived for building networked 3Dinteractive applications [22]). Unfortunately research performed so far has not led toimplementations useful for allowing us to build a prototype. That is the reason why wedecided to take advantage, for building a first rough prototype, of the existing VRMLimplementations; in particular we are using a proprietary extension of the languageproposed by Parallelgraphics [18] that allows to embed audio-video streams into 3Dscenes.
The main purpose of our prototype is to have a first visualization of our approach,and in particular of the navigation metaphor. Users are given a pre-defined 3D envi-ronment where they can walk and they can find a number of time-pillars. The mainfeatures of the interface include the use of auditory signals to help identification ofplaces [20] and a simplified navigation paradigm. Users can use basic commands tonavigate in the 3D space and to approach the time-pillars. Fig. 2 illustrates the visualinterface. The right part of the screen is occupied by the 3D environment and by thenavigation bar. A more advanced prototype will use for user input a programmableremote controller [19]. A zone for the broadcast playback occupies the left part of thescreen; each time the user selects the cube on the top of a pillar or a snapshot belong-ing to its spiral, the related video stream is played on this area.
Fig. 2 - The prototype interface

7 Towards a cooperative approach
So far we have examined our paradigm with reference to a stand-alone system. Butthe potentialities of the system can be greatly enhanced by the network connection.That is the reason why we are planning an enhanced prototype connected to the Inter-net. In this context the time-pillars that populate the 3D environment can be filled withcontent brought by additional sources, such as broadcasters, groups of interest andother individual users.
Information sharing through the network can greatly improve the amount and thequality of information available on the pillars’ surface; in this scenario the averageuser would find in his/her system a wide number of pillars already filled with content,ready to be explored. He/she could then concentrate on monitoring unexplored oroutdated channels and then share the result with the other users on the net.
For the broadcasters, such a system would offer the opportunity to diffuse contentsummarizations realized with manual or automatic mechanisms. While personal re-cordings done on local systems can be used only to monitor current transmissions,broadcasters would have the opportunity to diffuse information related to future TVprograms (excluding, of course, the live shows), giving an additional service to the TVuser.
Therefore, in this enhanced context, the TV user could explore with a unique inter-face (the time-pillar) not only his/her own archives, but also the additional officialsamples summarized by broadcasters and offered through an Internet service.
Nevertheless, we have already pointed out that it is not realistic to expect such aservice from all the broadcasters. But the network and the convergence between mediaoffer again additional advantages; in particular, using a cooperative approach, thesummarization efforts of different users that use similar systems can be shared on thenetwork; this hypothesis can be realistically applied, given the capabilities given bythe recent video compression schemes (MPEG4 [14]) and the progressive diffusion ofDSL technologies for the network.
Resuming, if we consider the context of a 3D interface browsed by a user con-nected to the network, we may distinguish on the spirals of the time-pillars three dif-ferent types of content:
1. personal content, result of the user personal TV recording on the local system;2. official broadcaster content, diffused on the network by the owners of specific TV
channels;3. other users content, result of personal recordings done by other users and shared on
the network.
It is important to note that one of the key features of this proposal is that eventhough each of the sources can contribute to the overall amount of available informa-tion, the lack of any of these subjects don’t prevent the system from working.

In other words what we propose can be defined as a true, de-centralized coopera-tive system for retrieving and sharing TV content on the network.
8 Extending the architecture of the system
Fig. 3 shows the underlying architecture of our system and its planned extensiontowards the network. Private users share information related to the 3D environment onthe Internet. Pointers to shared information (i.e. pointers to the snapshots and to theMPEG video fragments) may be contained in one or more public servers that eachuser may query to get TV related information.
Fig. 3- Architecture of the system
We are currently planning a prototype that uses coordination technology to ex-change information between the server and the clients. Coordination languages offeran easy paradigm for coordinating activities and sharing information [7]. There are anumber of implementations that extend the coordination approach on the web; we arecurrently considering implementations that provide additional security features pro-vided to access data on a specific server. The implementation of security features is afundamental component of a system that could be extended towards business (e.g.,broadcasters could give basic information to everyone connecting to their servers andmore extensive services to the subscribers of TV channels).
decoder encoder
dish
Internet
rec. device
3D environment
User
scheduler
personal video receiver and recorder

9 Conclusions and further work
Work performed has led to the proposal of a new 3D interaction metaphor and tothe identification of an underlying software and hardware architecture that supports it.A basic prototype to experiment the new interface is being implemented. Further workwill include a more advanced client prototype with extensive recording capabilities.For what concerns the network extension, we are working on a coordination server totest the points of strength and of weaknesses related to the cooperative approach.
References
1. Astra Consortium http://www.astra.lu2. Baddeley, A.: Human Memory: Theory and Practice. Allyn & Bacon, New York (1998)3. Bianchi Bandinelli, R.: Rome: The Center of Power. Arts of Mankind. Braziller, New
York (1970)4. Diseqc 1.2 Protocol http://www.eutelsat.org5. DVB Specification http://www.dvb.org/dvb_technology/index.html6. Eutelsat Consortium http://www.eutelsat.org7. Gelertner, D.: Generative Communication in Linda. In ACM Transactions on Program-
ming Languages and Systems. 7(1):80-112 (1985)8. IBM Tspaces http://www.almaden.ibm.com/cs/TSpaces/9. LyngSat/Nokia MM 9800 Chart MPEG-2 in Europe http://www.lyngsat.com/nokia/10. Marrin, C., Myers, R., Kent, J., Broadwell, P.: Steerable Media: Interactive Television via
Video Synthesis. In Proceedings of Web3D Conference, Paderborn, (2001)11. Micronik Multimedia http://www.micronik.de12. Multimedia Home Platform http://www.mhp.org13. MPEG http://www.mpeg.org14. MPEG4 Specification, International Standard ISO/IEC 14496-1
http://garuda.imag.fr/MPEG4/syssite/syspub/docs/w2201.zip 199815. Nack, F., Lindsay, A. T.: Everything you wanted to know about MPEG-7. In IEEE Mul-
timedia, 6(4)-7(1), (1999-2000)16. Nokia http://www.nokia.com17. OpenTV http://www.opentv.com18. Parallelgraphics http://www.parallelgraphics.com19. Philips Pronto http://www.pronto.philips.com20. Pittarello, F.: Multi sensory 3D Tours for Cultural Heritage: the Palazzo Grassi Experi-
ence. In Proceedings of ICHIM 2001, Milano (2001)21. Robertson, G.G., Card, S.K., Mackinlay, J.D.: Information Visualization Using 3D Inter-
active Animation. CACM 36 (4): 56-71 (1993)22. Web3D Consortium http://www.web3d.org23. Web3D Rich Media Working Group http://groups.yahoo.com/group/rm3d24. WebTV http://www.webtv.com25. Yahoo Groups http://groups.yahoo.com26. Yates, F.: The Art of Memory. University of Chicago Press, Chicago (1966)27. Ying Li, Jay Kuo, C.C: Semantic video content abstraction based on multiple cues. In
Proceedings of ICME 2001, August, Tokyo 2001

TV Scout: Guiding Users from Printed TV Program Guides to Personalized TV Recommendation
Patrick Baudisch1
Inf. Sciences and Technologies Lab. Xerox Palo Alto Research Center
Palo Alto, CA 94304, U.S.A. +1 (650) 812 4656
Lars Brueckner1
IT Transfer Office (ITO) Darmstadt University of Technology
64283 Darmstadt, Germany +49 (6151) 16-6217
In this paper, we present TV Scout, a recommendation system providing users with personalized TV schedules. The TV Scout architecture addresses the “cold-start” problem of information filtering systems, i.e. that filtering systems have to gather information about the user’s interests before they can compute personalized recommendations. Traditionally, gathering this information in-volves upfront user effort, resulting in a substantial entry barrier. TV Scout is designed to avoid this problem by presenting itself to new users not as a filter-ing system, but as a retrieval system where all user effort leads to an immediate result. While users are dealing with this retrieval functionality, the system con-tinuously and unobtrusively gathers information about the user’s interests from implicit feedback and gradually evolves into a filtering system. An analysis of log file data gathered with over 10,000 registered online users shows that over 85% of all first-time users logged in again, suggesting that the described archi-tecture is successful in lowering the entry barrier.1
Introduction
Information filtering systems [7] suffer from a bootstrapping problem. Before they can give personalized recommendations to a user, they have to find out what the user’s interests are. Only then can filtering systems build user profiles and compute personalize recommendations. The problems resulting from this undesirable order of required user effort and delayed benefit is a well-known phenomenon in collaborative filtering, the so-called cold start problem [17]. Users are reluctant to invest effort, especially if they don’t know whether the offered service will be worth the effort. This approach bears the risk that users will avoid the gamble and stick with a system offering more immediate benefit, such as a retrieval-oriented system. Users making this decision, however, will never come to discover the long-term benefits the filter-ing system would have offered. For additional studies on incentive structures and the results of the lack of incentives see [13].
In this paper, we describe an architecture designed to address this incentive prob-lem and we will demonstrate this architecture at the example of our TV program recommendation system TV Scout. We will begin by briefly introducing the field of
1 The work presented in this paper was carried out during the authors’ affiliation at GMD-IPSI

TV recommendation. We will then discuss TV Scout and its user interface and dis-cuss the underlying filtering architecture. Finally, we will report results of an analysis of TV Scout online usage data, discuss our findings, and present conclusions and future work.
Recommending TV Programs
In 1992, Belkin and Croft wrote “In particular, applications such as the recreational use of television programming pose special problems and opportunities for research in filtering” [7, p.37]. Several current trends make TV an interesting application area for information filtering. TV viewers are facing an information overload situation [10]. A number of technical improvements, such as cable, satellite, and digital TV technology have resulted in an increasing number of available TV channels. Today, hundreds of channels broadcast thousands of programs every day. Since the amount of content that is of interest for a given viewer has not increased proportionally, planning ones TV consumption has become a challenge. The amount of TV programs will soon exceed the limits of what can reasonably be printed and channel surfing is no longer fast enough to allow getting an overview of all channels [11]. Attempting to meet the changing requirements, web-based TV program guides (e.g. TV Guide, http://www.tvguide.com), set-top boxes with electronic program guides (EPGs, [20]), and digital VCRs (e.g. Tivo http://www.tivo.com) have emerged in the past few years.
There have been several research projects around TV recommendation in the past [11, 9], but most of them focused on set-top boxes and on the technical possibilities for monitoring user behavior rather then on web-based systems and usability. Current research in personalized TV evolves still around personalized EPGs [1], but also around new concepts, such as multi-agent recommender systems [14]. A more thor-ough overview of current research in the field of personalized TV recommendation can be found in [18].
TV Scout
TV Scout [3, 4] is a web-based TV recommendation system. Its goal is to support users in planning their personal TV consumption.
In order to understand the design requirements for such a system, we began our re-search with an informal survey among students [3]. The survey indicated that expecta-tions about the functionality of an ideal TV recommendation system were dominated by experiences with printed TV program guides. While our goal was to eventually provide users with a personalized TV program at a single mouse click, our survey indicated that only a minority of the users we had interviewed would be willing to invest the required effort. We concluded that in order to attract users, a successful TV recommendation system would first have to emulate the expected print-like function-ality, as well as the straightforward usage of printed guides: pick up the TV guide, find today’s listing, pick a program, and watch TV. The challenge was to provide a seamless transition from this scenario to the filtering functionality we had in mind. To prevent the filtering functionality from conflicting with the user expectations and system learnability, we decided to create a system that would progressively disclose its filtering features to users.
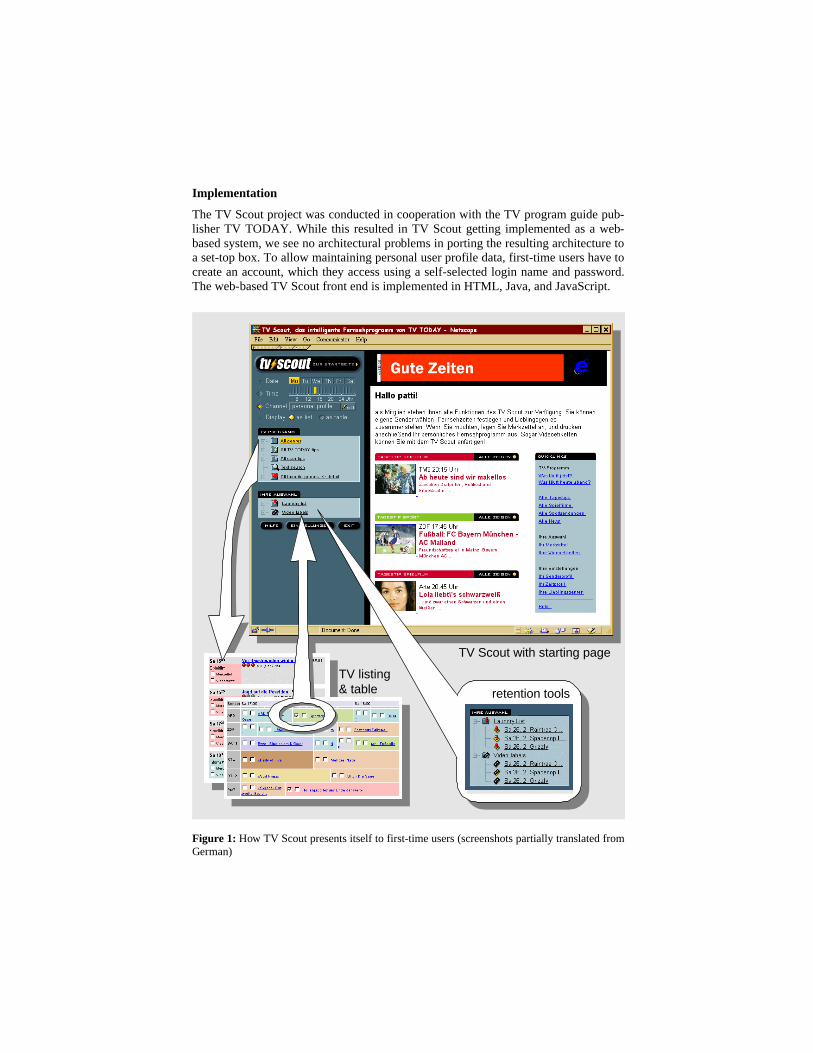
Implementation
The TV Scout project was conducted in cooperation with the TV program guide pub-lisher TV TODAY. While this resulted in TV Scout getting implemented as a web-based system, we see no architectural problems in porting the resulting architecture to a set-top box. To allow maintaining personal user profile data, first-time users have to create an account, which they access using a self-selected login name and password. The web-based TV Scout front end is implemented in HTML, Java, and JavaScript.
TV Scout with starting page
TV listing& table retention tools
a
Figure 1: How TV Scout presents itself to first-time users (screenshots partially translated from German)

Retrieving Program Descriptions
To users entering TV Scout for the first time, the system presents itself as a retrieval system. Its functionality at this stage restricts itself to the functionality of a printed TV program guide, with a graphical user interface. Users specify a query (or simply hit a button for the default “what’s on now”), sort through the resulting list and select pro-grams to watch. Users can also print the list of selected programs for later use.
Figure 1 shows how users accomplish that using the TV Scout user interface. The interface consists of the menu frame on the left and the content frame on the right. The menu frame provides users with access to all retrieval and filtering functions and is permanently visible. The content frame is used to display various types of TV list-ings and all profile editing tools.
The system is used as follows. Users execute a query by picking a query from the query menu. Figure 2 shows several close-ups of this menu. In its current version, TV Scout offers four query groups: text search, genres, user tips, and TV TODAY tips, plus a favorites group that we will explain later. Text search allows users to search for keywords using optional Boolean syntax. The other three submenus are executed by picking the corresponding menu entry. To provide more precise queries, theses query groups contain hierarchies of submenus that can be browsed in a file system explorer-like fashion. Genres contains a historically grown genre classification of TV pro-grams, such as sports, comedy, and series [14]. User tips contains recommendations volunteered by users who serve as self-proclaimed editors, so-called opinion leaders [4]. Finally, TV TODAY tips, are recommendations provided by the editors of TV Scout’s printed counter part.
a
c
d
e
b
Figure 2: The query menu offers four groups of queries
By default, all queries are restricted to the programs starting within the current hour, but TV Scout provides customized controls that allow specifying arbitrary time

and date intervals using mouse drag interactions (Figure 4a). Channels can be selected from two predefined sets or can be selected in detail using a paintable interface (Figure 4b) [6].
When a query is executed, the resulting set of TV program descriptions (Figure 1 bottom left) is displayed in the content area. Descriptions consist of the program title, a rating describing how well the program matches the query, an extract of the pro-gram description, and links to a more detailed description. Users can choose between the display styles ranked list and table.
Two toggle switches per program description allow users to retain programs they plan to watch in the so-called retention tool (Figure 1 bottom left, circled). The reten-tion tool laundry list can be used to print a list of programs; video labels are designed to retain and print programs to be videotaped. The retention menu allows users to display the content of their retention tools for reviewing or printing. The printed list can be used to remind users of the programs that they plan to watch.
Filtering Functionality: Creating “Bookmarks”
Using the functionality described so far, the effort for repeated usage is the same each time the service is used. The next step therefore is for the system to reduce the effort required of the user when querying, since the primary purpose of IF systems is to be “time-saving devices” [2].
When a user enters a query that is broader than necessary, the user is forced to sort through an unnecessarily long listing when trying to find desired programs. When the system detects that the user has used such a sub-optimal query repeatedly while an-other query with better precision exists, it makes a suggestion. Figure 3 shows an example. Let’s assume that the user has repeatedly used the query “movies” to exclu-sively find and retain comedies and horror movies. By computing the overlap between the retained programs and all available queries [3], the system detects that the retained programs can also be covered by the more specific queries “horror movies” and “comedies”. A dialog box opens and suggests using these queries instead. The user can execute the suggested queries like any other query, i.e. by clicking their names.
The more important function of the dialog box, with respect to our filtering con-cept, is that it also suggests retaining these queries as bookmarks. Users can do this by clicking the toggle switch that accompanies each query (a folder symbol with a check mark, see Figure 3a). Retained queries pop up in the user’s favorites (Figure 3b). The favorites folder is collocated with the other query groups and can be executed the same way. Retained queries are listed in a flat hierarchy, thereby providing the users with convenient access to queries that would otherwise be hidden in multiple different submenus. This functionality corresponds to the bookmark folder in a web browser. Unlike web bookmarks these bookmarks are stored on the TV Scout server, allowing TV Scout to use them as input for additional computation.
Retention check boxes accompany all queries in the system (see Figure 3b), so us-ers can bookmark queries anytime, independent of suggestions. The primary purpose of query suggestions is to inform users about the bookmaking concept and to encour-age its usage.
Note the special importance of the retention tools. Although the declared purpose of the retention tools is to allow users to memorize programs and print schedules,

their primary purpose from the system’s point of view is to serve as an information source about the user’s interests. The content of the retention tools is considered an implicit positive rating for the retained programs, making the retention tools serve as a source of implicit retention feedback [16]. Although implicit feedback is commonly agreed to be a less reliable source of rating information than explicit feedback, it has the benefit of being unobtrusive, which we considered essential for this type of filter-ing system. See [3, 4] for how TV Scout uses the same implicit input for various types of filtering functionality based on collaborative filtering.
ab
ab
Figure 3: By clicking a checkmark-shaped button, queries can be retained in All favorites.
Filtering Functionality: One-click Personalized TV Schedules
To provide a container for bookmarked queries is not the only purpose of the favorites folder. The real value of this folder lies in the fact that users can execute it as a whole by clicking the top menu entry labeled all favorites. This executes all retained queries at once. The result listings of the individual queries, however, are not appended to each other—they are merged into a single relevance-ordered result list. This is the most powerful function of the TV Scout system—it fulfills the initial goal of generat-ing personalized TV schedule with a single mouse click.
How are the individual query results merged in order to obtain a useful result? When the query profile all favorites is executed, a script running inside the TV Scout server executes all contained queries. This is done by delegating each query to the corresponding subsystem; text search, for example, is executed by FreeWAIS, while genre queries are executed by a relational database. As a result, the subsystems de-liver sets of pairs (program, rating). The task of the query profile script is to merge all these results into a single ranked list. This requires transforming the individual ratings such that they include the user’s perceived importance of the interest represented by the query. In order to express this perceived importance, the query profile stores a linear function (i.e. a factor and an offset) for each retained query. The resulting rat-ings are computed by transforming the ratings returned by the subsystem using this function. If a TV program is returned by multiple queries its ratings are summed up. Finally, programs are sorted by their result rating and returned to the user.
The critical factor is the parameters of the linear transformation. The system ac-quires these parameters through initialization, learning, and manual updating. When

queries are bookmarked, their functions are initialized using Zipf’s law [19, p. 60]. This means that more specific queries are given positive offsets, propagating the re-sults of these queries towards the top ranks of the resulting listings, thus preventing them from being buried inside the large result sets of less specific queries.
After initialization, the parameters of the rating transformations can be improved by two means. First, TV Scout continuously optimizes the query profile based on the same implicit retention feedback that was already used for suggesting queries. See [3] for a description of the algorithm. Second, interested users are allowed to manually inspect and update their profile. Clicking the “>>details” link in the all favorites menu invokes a profile editor. The simplest version of this editor provides users with a single pull-down menu per query (Figure 4c), allowing users to assign a symbolic rating to each query, such as “Action movies are [very important] to me” [3, 5].
Through the use of relevance feedback the query profile improves continuously, so that the quality of the rankings obtained by clicking all favorites increases over time.
c
a
b
Figure 4: The TV Scout profile editing tools (a) viewing time profile editor, (b) channel profile editor, and (c) query profile editor.
Summary
Figure 5 summarizes how the usage of TV Scout by a given user can evolve over time. Each transition to a more personalized phase can be suggested by the system (T1-T3) or initiated by the user (U1-U3). However, users are not forced through these phases and may equally well settle with the functionality of one of the earlier phases. 1. Query phase (S1): Users can pick predefined queries (T1) or can formulate
queries, such as text searches, manually (U1). 2. Bookmark/reuse phase (S2): If the system detects reoccurring or sub-optimal
queries it proposes better-suited queries and suggests retaining them as favorites (U2). Independent of suggestion, users can bookmark queries anytime (T2). Profile creation (T∗): The user’s query profile is created automatically when the first query is bookmarked.
3. Profile phase (S3): Initially, the query profile provides users with a convenient way of executing all their bookmarks with a single click. Continuous supply of relevance feedback (T3) or manual profile manipulation (U3) improves the profile.

bookmarks(reuse state)
bookmarks(reuse state)bookmarks
(reuse state)
bookmarks(reuse state)queries
(one shot state)
queries(one shot state)queries
(one shot state)
queries(one shot state)
system suggests system compiles system learns
query profile(filtering state)
query profile(filtering state)
S1 S2 S3
U1 U2
T1 T2 T∗ T3
U3U1 U2
T1 T2 T∗ T3
U3
startstart
system provides
user defines user updatesuser writes
Figure 5: Evolving usage of a proposed filtering architecture
TV Scout Usage Data
The purpose of the TV Scout design is to reduce the entry barrier for new users by using a progressive disclosure of the filtering functionality. How can we verify the success of our interaction design? A controlled experimental comparison with a com-peting system would be problematic because of the vast amount of interface variables that would be difficult to control. In addition, modeling a realistic web-usage scenario in a lab setting is challenging. Alternatively, a naturalistic study of web use would provide more realistic data, but we would be unable to measure factors such as sub-jective satisfaction. Ultimately, we decided to conduct an informal analysis of log file data from actual web usage.
When we conducted our data analysis April 20, 2000, TV Scout had been publicly available at for 18 months. The entire 18 months of log file data are included in this study. All usage data was extracted from the web server log files and the system’s database. With respect to the filtering functionality, this data was slightly biased, in that the suggestion feature became available later. Because of this, we expected that the usage of bookmarking would be underrepresented.
The main purpose of the analysis was to verify whether our filtering system design fulfilled the primary goal, namely to provide a low entry barrier. If our design was appropriate, then TV Scout would meet the expectations of first-time users and would not overwhelm them. Repeated usage would indicate that users had taken the entry hurdle; one-shot users would suggest the opposite.
We were also interested in learning more about the users’ demand for the offered filtering functionality. How many users would adopt bookmarking functionality; how many would make use of their personal query profiles? Based on our informal survey, we expected the majority to be satisfied with the initial retrieval functionality, but we had no clear expectations about the percentages. Finally, we were interested in seeing how useful users would find the query profile. Once they had created one, would they continue to use it or would they abandon it rapidly?
Results
At the day we examined the log data, TV Scout had 10,676 registered users. In total, users had executed 48,956 queries. 53% of all queries (25,736 queries) were specific queries different from the default query.

Repeated log-ins: We found that 9,190 of the 10,676 registered users had logged in repeatedly, i.e. twice or more. This corresponds to a percentage or 86% repeated us-ers. The most active user with 580 logins had logged in almost daily.
Bookmarks: 1770 users had bookmarked one or more queries. Together, these us-ers had bookmarked 4383 queries, mostly genres. The most frequently executed que-ries were the genres movies (736 times) and information (364 times), and TV TO-DAY Movie tips (369 times). Over 300 text searches were bookmarked.
Query profiles: Out of the 1770 users who had bookmarked at least one query, 270 users (about 15%) executed their query profile at least once to obtain personalized listings. These users executed their query profiles a total of 5851 times, which corre-sponds to an average of 21 times per user. These users manually fine-tune their pro-files a total of 1213 times, with an average of 4.5 times per user. These results indi-cate that query profiles were highly appreciated by those who used them.
Conclusions We interpret the measured percentage of repeated users as a confirmation of our de-sign. 86% of all first time users logged in repeatedly; we consider this to be a very high percentage for a web-based system. This indicates that presenting first-time users with a retrieval setting is a successful approach to keeping the entry barrier for first-time users low.
Only 17% of users made use of the bookmark feature; out of these, only 15% made used of the query profile. These numbers seem low even taking into account that the suggestion feature was not available most of the logged time. Does this result indicate that the filtering functionality is inappropriate or difficult to learn? Why did the ma-jority of the users not reach the “goal” of the system?
This is not how we interpret these results. In an earlier TV usage survey we con-ducted [3] we found TV users to plan their TV consumption for very different time-frames. Most of these users only planned a TV schedule for the following day or they did not plan at all. Many users only used a guide to determine what was currently on TV. Only 12% of the users planned a TV schedule for the entire week. Considering that the filtering functionality of TV Scout addresses the relatively small subgroup of users who plan their TV consumption, the observed results seem appropriate. The majority of users who only used the retrieval functionality may have found the re-trieval functionality of TV Scout to be the appropriate support for their information seeking strategy. An online survey as well as an experimental study should help to verify this interpretation.
Acknowledgements We would like to thank Dieter Böcker, Joe Konstan, Marcus Frühwein, Michael Brückner, Gerrit Voss, Andreas Brügelmann, Claudia Perlich, Tom Stölting, and Diane Kelly.
References 1. L. Ardissono, F. Portis, P. Torasso. F. Bellifemine, A. Chiarotto and A. Difino Architec-
ture of a system for the generation of personalized Electronic Program Guides. In Pro-ceedings of the UM 2001 workshop “Personalization in Future TV”, July 13 to July 17, 2001, Sonthofen, Germany.

2. P.E. Baclace. Information intake filtering. In Proceedings of Bellcore Workshop on High-Performance Information Filtering, Morristown, NJ, November 1991.
3. P. Baudisch. Dynamic Information Filtering. Ph.D. Thesis. GMD Research Series 2001, No. 16. GMD Forschungszentrum Informationstechnik GmbH, Sankt Augustin. ISSN 1435-2699, ISBN 3-88457-399-3. Also at http://www.patrickbaudisch.com/publications
4. P. Baudisch. Recommending TV Programs on the Web: how far can we get at zero user effort? In Recommender Systems, Papers from the 1998 Workshop, Technical Report WS-98-08, pages 16-18, Madison, WI. Menlo Park, CA: AAAI Press, 1998.
5. P. Baudisch. The Profile Editor: designing a direct manipulative tool for assembling pro-files. In Proceedings of Fifth DELOS Workshop on Filtering and Collaborative Filtering, pages 11-17, Budapest, November 1997. ERCIM Report ERCIM-98-W001.
6. P. Baudisch. Using a painting metaphor to rate large numbers of objects. In Ergonomics and User Interfaces, Proceeding of the HCI '99 Conference, pages 266-270, Munich, Ger-many, August 1999. Mahwah: NJ: Erlbaum, 1999.
7. N.J. Belkin and W.B. Croft. Information filtering and information retrieval: two sides of the same coin? CACM, 35(12):29-37, Dec. 1992.
8. A. Borchers, J. Herlocker, J. Konstan, and J. Riedl. Ganging up on information overload. Computer, 31(4):106-108, April 1998.
9. D. Das and H. ter Horst. Recommender systems for TV. In Recommender Systems, Papers from the 1998 Workshop, Technical Report WS-98-08, pages 35-36, Madison, WI. Menlo Park, CA: AAAI Press, 1998.
10. P. Denning. Electronic junk. CACM, 23(3):163-165, March 1982.
11. M. Ehrmantraut, T. Härder, H. Wittig, and R. Steinmetz. The Personal Electronic Program Guide—towards the pre-selection of individual TV Programs. In Proc. of CIKM'96, pages 243-250, Rockville, MD, 1996.
12. L. Gravano and H. García-Molina. Merging ranks from heterogeneous Internet sources. In Proceedings of the 23rd VLDB Conference, pages 196-205, Athens, Greece, 1997.
13. J. Grudin. Social evaluation of the user interface: who does the work and who gets the BENEFIT? In Proc. of INTERACT’87: pages 805-811, 1987.
14. M. Kuhn. The New European Digital Video Broadcast (DVB) Standard. ftp://ftp.informatik.uni-erlangen.de/local/cip/mskuhn/tv-crypt/dvb.txt.
15. K. Kurapati, S. Gutta, D. Schaffer, J. Martino and J. Zimmerman. A multi-agent TV re-commender. In Proceedings of the UM 2001 workshop “Personalization in Future TV”, July 13 to July 17, 2001.
16. D.M. Nichols. Implicit ratings and filtering. In Proceedings of Fifth DELOS Workshop on Filtering and Collaborative Filtering, pages 31-36, Budapest, November 1997. ERCIM Report ERCIM-98-W001. Le Chesnay Cedex, France, European Research Consortium for Informatics and Mathematics, 1998.
17. P. Resnick and H. Varian (Eds.). Special issue on Recommender Systems. Communica-tions of the ACM, 40(3):56-89, March 1997.
18. Proceedings of the UM 2001 workshop “Personalization in Future TV”, July 13 to July 17, 2001, Sonthofen, Germany. Online at http://www.di.unito.it/~liliana/UM01/TV.html
19. G. Salton and M.J. McGill. Introduction to Modern Information Retrieval. New York: McGraw-Hill, 1983.
20. H. Wittig and C. Griwodz. Intelligent media agents in interactive television systems. In Proc. of the International Conference on Multimedia Computing and Systems ’95, pages 182-189, Boston, May 1995. Los Alamitos, CA: IEEE Computer Science Press, 1995.

Evolving the Personalized EPG – An AlternativeArchitecture for the Delivery of DTV Services
Barry Smyth(1,2), Paul Cotter(1,2), James Ryan(1)
1ChangingWorlds Ltd.Trintech Building
South County Business ParkLeopardstown, Dublin 18, IRELAND
2Smart Media InstituteDepartment of Computer Science
University College DublinBelfield, Dublin 4 , IRELAND
{barry.smyth, paul.cotter, james.ryan}@ChangingWorlds.com
Abstract. With hundreds of channels available on today’s Digital TV (DTV)services, users are finding it increasingly difficult to locate programmeinformation. The static electronic programme guide (EPG) is only a partialsolution since most users are unwilling to browse through hundreds of screensof listings content in the pursuit of their favourite show. The personalized EPGthat automatically adapts to the needs of the individual holds more promise. Inthis paper we focus on a unique operator-independent personalized EPGsolution that serves as an innovative alternative to the on-screen EPG and thatrequires no changes or upgrades to existing DTV infrastructure. In doing so wealso introduce an alternative architectural paradigm for the delivery of a rangeof DTV services.
1 Introduction
The need for personalized EPGs (pEPGs) is clear as DTV operators recognize thedifficulty that users have in quickly locating relevant programming informationamong the sea of available listings. The personalized EPG promises to ease thisinformation-overload problem by automatically learning about a viewer’s TVpreferences (the programmes they tend to like, the times they watch TV, the channelsthey prefer) and pre-compiling personalized guides that reflect these preferences.
PTVPlus1 (www.PTVPlus.com) is a good example of such a pEPG for the UK andIrish markets [2,3]. It provides personalized listings to tens of thousands of users on adaily basis and covers approximately 100 different TV channels. However, at thepresent time PTVPlus is limited by the fact that it operates in a disconnected modewith respect to the TV. That is, personalized listings are provided through the web site(to a range of devices, including desktop PC, PDA and mobile phone), rather than
1 Special thanks must go to the dedication and hard work shown by the PTVPlus and ClixSmart
DTV development teams, including Paul Heffernan, Mary Nolan, Ian McNally, and KevinMcCarthy.

directly to the TV screen2. Ideally the PTVPlus technology3 would be deployed in thesame way as a traditional EPG – through the set-top box – so that the user couldbenefit from personalized listings and control the channels directly through thePTVPlus interface. For a variety of reasons this is not always possible, or even ideal.In particular, the availability of a back-channel (in order to carry user inputinformation from the set-top box back to the operator’s head-end or servers) is notalways guaranteed. In this case there is no way for the PTVPlus personalization serverto capture a user’s activity as part of the profiling process.
In addition to deploying the personalized EPG technology in the traditional manner(by integrating with the set-top box and the operator’s servers), we have also exploredalternative deployment routes that do not depend directly on the DTV operator. Theobjective of this position paper is to briefly outline recent work on the integration of apersonalized EPG in an intelligent remote control device (branded as GuideRemote),which is capable of delivering TV listings to users through a small LCD display andas such offers an alternative connection between the user, the listings, and the TV.
While the focus of this paper is server-side personalization, where the need for aback-channel is vital, other forms of personalization do exist that limit the need forback-channel feedback. For example, client-side technologies that reside fully in theset-top box can manage the personalization process without the need to connect to acentral server [1]. While the ClixSmart and PTVPlus personalization can bearchitected to operate on the client-side, in this paper we will focus on server-sidepersonalization issues only.
2 PTVPlus and the GuideRemote
PTVPlus is an evolution of the successful PTV TV listings service [2,3] and isavailable to users in Ireland and the UK through a range of devices (PC, PDA, WAPphone). The unique feature of PTVPlus is its ability to learn about a user’s short- andlong-term viewing preferences by capturing explicit ratings feedback that users areencouraged to provide as they interact with their personalized guides.
GuideRemote (Evolve Communications Inc.) is an interactive universal remotecontrol that integrates the Internet and LCD technology to offer consumers acombined handheld EPG and remote control facility. Figure 1 shows an example ofthe GuideRemote displaying a 30-minute viewing slot over 4 channels. The user canscroll through the EPG using the device’s main navigation keys to switch directly to aprogramme that is currently showing or to set up a reminder for a show that is soon toair. The EPG offers a 7-day listings service and a range of added-value servicesincluding advertising messages, retail coupons for t-commerce services, interactivegames, voting services for shows, plus the ability to request more information for agiven show from the Internet. The consumer “synchs” their GuideRemote with a base 2 In fact PTVPlus has been deployed directly to the TV set via set-top box, but for the purpose
of this work we are assuming no such connection in order to explore alternative routes.3 PTVPlus is implemented using the ClixSmart DTV platform developed by ChangingWorlds
Ltd. (www.changingworlds.com). This award-winning technology supports the rapiddevelopment of carrier-grade personalized TV listings and EPG services.

web site, through their PC, on a weekly basis, to download new listings andinformation (including coupons and advertisements) and to upload their recentactions; thus an always-on Internet connection is unnecessary.
3 Evolving PTVPlus
The familiar EPG information-overload problem takes on an even more acute form inthe context of the GuideRemote. With its single screen able to present a 30-minutelistings window across only 4 channels, a week’s worth of viewing over 100 channelswill require more that 8000 screens of information, and even a single day’s viewingmay require up to 1200 screens, and this covers only the programme titles.
Fig 1. The PTVPlus-GuideRemote Architecture.
By using PTVPlus as the GuideRemote base web site, and provider of TV listings,this overload problem can be significantly reduced since PTVPlus can downloadpersonalized guides to each device at synchronization time, in addition to the staticlistings information. In this way PTVPlus acts as a proxy, mediating the interactionbetween the device and the back-end listings content, and prioritizing relevant contentfor the particular target device (see Figure 1).
Moreover, the GuideRemote integration also solves the disconnect problemmentioned earlier in relation to PTVPlus. For example, GuideRemote can allow users
Home PC PTVplus
Prog
ram
me
Sele
ctio
ns
Votin
g, In
fo R
eque
sts
TV L
istin
gsC
oupo
ns e
tc
Programme selections, etc.
Formatted listings, etc.
GuideRemote DB
Listings
Profiles

to vote/grade specific programmes using the device’s “vote” button and thisinformation can be interpreted by PTVPlus as grading information. However, this canbe taken one step further. GuideRemote can capture the selections that users make asthey use the EPG, including switching to a specific programme for viewing, orrequesting more information, for example. This information can be used by PTVPlusas a source of grading data, obviating the need for the programme voting that iscurrently supported as the dominant form of feedback. In other words, instead ofexpecting users to grade a programme positively (or negatively) it is possible tocapture the same information by determining whether they have switched channels totune into (or tune out of) that programme when it airs. From a usability perspectivethis will allow users to benefit fully from PTVPlus’s personalization facilities withoutthe need to elicit extra user information.
4 Conclusions
Although brief, this position paper serves to highlight a number of key ideas. Firstly,the TV itself is no longer the only home for the EPG. Secondly, a new generation ofso-called coffee-table devices, such as the GuideRemote, can be used to compete withthe need for sophisticated and dedicated DTV equipment as a means of deliveringDTV-like services. And thirdly, such devices solve the disconnect problem currentlyexperienced by PTVPlus and also provide an alternative return-path for DTVservices. The unique combination of PTVPlus and GuideRemote brings a new breedof intelligent device to the market that serves as the starting point for a whole range ofintelligent and personalized entertainment services.
The integration above is just the starting point for what can be achieved oncepersonalization services are available to GuideRemote users. For example, asPTVPlus develops rich user profiles covering the preferences of individual viewersand communities of like-minded individuals, so it will become possible toautomatically personalize other forms of content such as, advertisements or shoppingcoupons. For example, users with a keen interest in gardening (recognizable by theirgardening and DIY-orientated programme preferences) can be targeted with relevantgardening advertisements and coupons rather than less relevant offers. This willenable GuideRemote to offer a more relevant content delivery mechanism as the basisfor premium content and advertising deals in the future.
References
1. Ardissono, L., Portis, F., Torasso, P., Bellifemine, F, Chiarotto, A., Difino, A. (2001)Architecture of a System for the Generation of Personalized Electronic Progam Guides.UM2001: Workshop on Personalization in Future TV. Sonofon, Germany.
2. Smyth, B. & Cotter, P. (2000) A personalized television listings service. Communicationsof the ACM, 43(8), 107-111.
3. Smyth, B. & Cotter, P. (1999) Surfing the Digital Wave: Generating Personalized TVListings using Collaborative, Case-Based Recommendation. In: Proceedings of theInternational Conference on Case-Based Reasoning, Munich, Germany, pp. 561-571.
Real Time Television Content Platform:
Personalized Programming Over Existing Broadcast Infrastructures
Kelly L. Dempski
Accenture Technology Labs
161 N. Clark St. Chicago, IL 60601 USA
Abstract. The success of personalized and interactive television programming has been largely hindered by the prohibitive cost of rolling out the necessary infrastructure to a large population. Most interactive TV infrastructures are based on a thin client model and it is very costly to update the transmission infrastructure. It is also costly to supply each customer with a set top box capable of receiving the interactive programming. As content providers are struggling to implement these architectures, the adoption of powerful next generation consoles is sharply increasing. This, combined with the recent introduction of inexpensive consumer electronics devices such as TiVo and ReplayTV, creates an opportunity to exploit media creation and manipulation capabilities in a “thick client” model using the existing broadcast infrastructure. This paper explains the concept of the Real Time Television Content Platform and discusses how this concept can deliver custom experiences with very few infrastructural changes.
Keywords. Personal Video Recorder (PVR), Data casting, Digital asset management, Personalized content.
Introduction There are many that believe that the value of convergence is in the ability to create personalized programming [1]. The definition of “personalized” can be quite broad, ranging from content that is easily accessible on-demand, to content that is generated on the fly based on user preferences and interaction. Currently, the greatest impediment to delivering any type of personalized media is the delivery mechanism itself. Interactive services are limited by the relatively low performance of the current generation of set top boxes. On demand services are limited by the lack of ubiquitous broadband service. Since its inception, television has used a broadcast model to reach the widest audience for the least cost. This model is very appropriate in a world of limited, generalized content, but it leaves very little room for the delivery of personalized or customized content. Over time, content providers addressed the varied tastes of viewers by supplying more and more broadcast channels. Currently, cable and satellite networks feature channels such as the Cartoon Network, the History Channel, and others that appeal to niche interests. This is a double-edged sword. These channels supply a wide range of content, but they also create churn by forcing the viewer to surf through hundreds of channels to find something

they want to watch. There is more content available, but it has become more difficult to find it. Content providers have addressed this problem by attempting to create and deploy new transmission paradigms that break out of the broadcast and channel model. One approach has been to change the infrastructure itself. An example is Video on Demand (VoD) over the Internet. The switch to a data networking model creates more opportunities for narrowcasting, but the difficulty here is expense [2] The cost of rolling out the backend infrastructure, the transmission infrastructure, and the client hardware is frequently much higher than the foreseeable revenues from video on demand. These new systems also introduce new technical problems such as latency, scalability, and quality of service. Also, high bandwidth networks are nowhere near as ubiquitous as cable or satellite service. These are very difficult problems, and they must be overcome for the new systems to gain acceptance. The focus on new transmission methods allows the content provider to deliver services to homes through low performance “thin client” set top boxes. The dependence on thin-client solutions stems from the historical fact that televisions have until very recently been very thin clients. Also, “thick client” set top boxes have been expensive and difficult to roll out to the mass market. Therefore, any changes to services have necessarily been done to the backend or transmission infrastructure. This paper proposes an alternative solution. Instead of making changes to the transmission channel, we suggest leveraging the power of a new set of inexpensive consumer electronics devices such as gaming consoles, home media servers, and personal video recorders (PVRs). We have generalized the functionality of these devices to a hypothetical composite device dubbed the Real Time Television Content Platform (RTTCP). At present, no single device incorporates all of the functionality of the RTTCP, but several devices such as Sony’s PS2 [3] and Nokia’s MediaTerminal [4] have begun incorporating these features into one platform. There are many companies making significant investments in the development of very inexpensive, yet very powerful consumer devices. A device like the RTTCP would be capable of creating and manipulating media at the destination point. This allows the content provider to broadcast a set of primitives to everyone over the broadcast channel. The RTTCP can receive these primitives and use them to create personalized content. The result is the ability to create narrowcast content over the broadcast channel, resulting in very inexpensive personalized content. The remainder of this paper will discuss two instantiations of this approach using two very different types of media as the basic primitive. The First Prototype: An Interactive Car Commercial Many television commercials feature products that are actually computer-generated models. In many cases, it is less costly to manipulate a virtual model than to film an actual product. As with film, the computer has become a very powerful tool to easily manipulate objects and generate special effects in commercials. Currently, the virtual model is used to produce one commercial that is then broadcast to everyone because it is very time consuming to render realistic scenes. This is changing. Today’s newest graphics chips are capable of rendering realistic scenes very quickly. The first example of RTTCP content demonstrates the 3D graphics processing power found in next generation gaming consoles such as the Microsoft Xbox [5] or the Sony PS2. Both are very inexpensive consumer electronics devices capable of producing very realistic imagery in real time. This first prototype shows how this power is used to generate custom content based on 3D models and other media that are broadcast to the client machine. The RTTCP is used to generate a custom car commercial based on the viewer’s interests and interactions. With the appropriate architecture, the RTTCP can create virtual commercials that can replace broadcast content when appropriate.

Before any content can be rendered, a system must be devised that can interject the custom content into the normal flow of the broadcast stream. This is done very simply through the thin data channel of the standard television stream. This data channel exists in the vertical blanking interval of the television signal and is used for data services such as closed captioning and Intel’s Intercast. In this first scenario, the data stream includes command messages that can be received and interpreted by the RTTCP. These command messages tell the RTTCP that a commercial break is coming and where it can download the appropriate content. When the RTTCP receives this message, it can contact the provider and download the appropriate media primitives. Alternately, the primitives could be sent in the data stream if the primitives were small enough. If the receiver were not RTTCP compliant, it would ignore the commands and do nothing. Figure 1 below shows how this might work.
Figure 1: Broadcast data drives the RTTCP and is ignored by other devices.
When it is time for a commercial break, the broadcast channel sends a generalized, broadcast version of the commercial to maintain compatibility with older devices. The overall system does not force viewers to upgrade their hardware. Viewers with standard televis ions will see a standard commercial. Viewers who have an RTTCP device will see something very different. When the programming switches to a commercial break, the RTTCP will take over the television set and render a custom commercial based on the 3D models that it has obtained. If the viewer has no interest in the commercial, the rendered scene will continue for the duration of the commercial and then end. It will be very similar to the standard broadcast version. If the viewers choose to, they can interact with the content via their remote controls. Figure 2 below shows scenes from a virtual car commercial.

Figure 2: Screenshots from a very realistic virtual commercial rendered in real time by the RTTCP.
In this commercial, a viewer can interrupt the normal flow of the ad and change the color of the paint, change the color and style of the interior, and try out different accessories. The commercial is fully interactive and fully configurable. It is not a series of prerendered video scenes. When the viewer is done, the commercial shows them the suggested price based on their selections, ends, and the RTTCP rejoins the standard broadcast stream. If the viewer has spent a long time experimenting with options, the RTTCP will record the broadcast stream to allow for time shifting. The ability to render virtual imagery on a television screen is not a new idea. This has been done since the earliest game consoles. However, recent advances in graphics technology had made it possible to render extremely realistic scenes in real time on very inexpensive equipment. Figure 3 below demonstrates this with side by side screenshots of a real NASCAR race and a virtual scene from NASCAR Heat, a recently released video game for the Xbox.
Figure 3: Real cars and their virtual counterparts.
This new technology creates the opportunity to render content that rivals real content in terms of quality and fidelity. These graphics are no longer blocky and cartoonish. Interactive rendered content of many products will have the same production quality as a

static video image. The rendered content will be far more interesting because it can be modified in real time. The Benefits of Client Side Rendering The ability of the viewer to interact is only half of the equation. Most viewers watch television in a sedentary way. They do not want to be forced to continually interact. With this in mind, the car commercial prototype has been built to interact with the viewer in very subtle ways. Normally, commercials are very generalized. Even if a viewer wants a given product, chances are that they want a slightly different model or style than what is shown in the commercial. The RTTCP enabled commercial remembers the viewer’s options and shows that exact model on every subsequent showing of the commercial. A viewer need not interact every time the commercial is shown. Instead, the commercial is tuned to show them exactly what they are interested in. In effect, it continually reminds them of how much they like the product. The ability to render completely customizable content could completely change the nature of commercials. Commercials today are mostly static. They cannot learn from the viewer. Content rendered on the fly can be very dynamic. For instance, if a viewer picks all of the performance options in a given commercial, the next showing of that commercial can portray a higher performance model of the car. Likewise, once the system knows that the viewer like a blue car, it can show every model in blue. This idea also extends beyond simple advertising. Once viewer buys a car, the commercial time slot could be used to render scenes that give maintenance tips or other content that serves to build the relationship between the vendor and the customer. This car commercial is just one example of one of the core capabilities of the RTTCP. This ability to create individualized content enables narrowcasting in the most literal definition. One of the biggest obstacles to true narrowcasting is scalability. The limitation to scalability is typically in the transmission medium. It is very difficult to deliver many custom streams in a timely manner. This architecture is based from the beginning on using the broadcast infrastructure. Broadcasting content to millions of viewers is a solved problem. Broadcasting primitives to a powerful device creates a system that is both extremely scalable and highly personalizable. This system is capable of delivering unique experiences to a very large number of viewers with almost no infrastructural changes. Much of the discussion above has ignored forthcoming advances such as MPEG7 and other media delivery innovations. These innovations may augment portions of the architecture and become core components of the RTTCP. They have been omitted from the discussion to show that the RTTCP concept can work independently of these new technologies and standards. The second prototype continues on this thread. The car commercial relies on the RTTCP’s ability to create media. The second prototype shows how it can manipulate media. The Second Prototype: MyNews The car commercial is a demonstration of how the graphics power found in the current generation of gaming consoles can be harnessed to create new media. However, in many cases it is preferable to have actual video of actual events and objects. In this case, personalization can be achieved through manipulation of the media. To do this, the RTTCP includes a second piece of technology found in new consumer electronic devices – the personal video recorder. Personal Video Recorders (PVRs) such as TiVo [6] and ReplayTV [7] are a relatively new phenomenon that combines inexpensive computing and storage in a consumer device that is capable of recording broadcast content according to a viewer’s preferences. Users typically use the device to create their own personal channels.

PVRs consolidate programming by recording shows from multiple channels and presenting them through one consistent interface. In effect, the PVR strips away all notions of channel or timeslot, allowing users to watch what they want, when they want. The MyNews prototype takes the idea of a personalized channel one step further. The goal is to create a PVR enabled experience that delivers a single personalized program in addition to the personalized set of programs. It does this by recording small segments based on viewer preferences and compiles these segments into one program. This approach is well suited to news programming, but can also add value to sports, music, infotainment, reality shows, and other forms of content that can be naturally segmented. The opportunities for personalization go far beyond simple compilation, as the viewer preferences can also be used to drive program flow, targeted advertisements, etc. This concept drives personalization to the next level – moving from personalized channels to personalized programs using the capabilities of the PVR and the existing broadcast infrastructure. The MyNews prototype is built on the idea that a PVR based agent can be used to assemble a customized news program based on broadcast content. Currently, both PVRs and content broadcasters are closed systems. Therefore, this prototype assumes that the news broadcaster has some control over the software on the RTTCP. The MyNews agent would run as an added service on top of the usual PVR functionality. This agent stores viewer preference data (described in the next section) on the local PVR. It then “watches” the broadcast news stream from the news source. News content is broadcast over the same transmission medium as usual. In this way, the same content also feeds viewers who do not have the agent or the PVR. The news provider includes codes in the data segment of the broadcast that define the subject matter of the current story. The agent uses this information to record and compile only the stories of interest. It also uses the same information to record segues between stories to give the compilation the proper flow and production quality. The agent can operate in two modes. It can record all the programming and sort the news stories according to preference. It can also record only the news items that fall within a certain threshold and create a concise news program of a user specified length. In either case, the recorded program includes a menu for random access to all the news items. Finally, the preference data can also be used to insert commercials that more closely match the viewer’s interests. The end result is a news program that includes only the stories that are of interest to the viewer. The compilation is customized, but the snippets are blended together such that the quality of the experience is the same as any single produced show. This system enables the content provider to deliver high quality content over existing broadcast channels and uses local manipulation to customize the content. The following sections describe the components that make this possible. A Look at the MyNews Preference Interface Before one can talk about personalized programming, one needs to figure out the best way to get personal preferences from the user. This involved striking a balance between the relatively broad and deep taxonomy of news subjects and the need to create an interface that was easily navigable on a television. The result was a sparse interface that represents news topics in terms of categories, places, and people. Screenshots of this interface are shown in Figure 4 below.

Figure 4: Three screens from the MyNews user interface. Items are rated using a simple
remote control. A full taxonomy of news items could be fairly broad and detailed. It might have thousands of different items. For most content providers, the development of this taxonomy is an ongoing problem. Even if the taxonomy were complete, forcing the user to input preferences based on the full taxonomy would be overwhelming for the typical user. For these reasons, the preference interface presents only a small representative sample of the taxonomy to the user. The user rates items of interest on a –2 to +2 scale. Any items that are not rated are assumed to have a neutral rating of 0. In cases where the rated item represents a deeper hierarchy, all child items are given the same rating. These preferences provide the first set of data needed to build a viewer profile. The system builds a richer profile using two additional techniques. First, the system infers demographic data from the user’s selections. This demographic data can be used to infer a more detailed profile. For example, a user who picks “Business” and “Alan Greenspan” may be more interested in US stock market data than someone who picks “Business” and “Tony Blair”. Likewise, the person who picks “Paul McCartney” is probably of a different demographic than the person who picks “Britney Spears”. The system can use these inferences to rate subcategories and to build a more detailed profile of the user [8]. Because of this, many of the items in the interface might be chosen to develop a demographic profile more than an explicit rating about that one topic. Secondly, the system can refine its detailed profile by monitoring user interactions. A user’s actions, such as skipping a given story, can drive the system to update the profile. For example, one of the categories on the interface is “Sports”. Internally, the system contains the subcategories of “baseball”, “soccer”, etc. When the user rates “Sports” as +2, that rating is applied to all subcategories. If the user skips every baseball story the system decrements the preference for “Baseball”. Eventually, usage patterns will tune the profile to accurately reflect the user’s preferences. This shallow system of preference gathering satisfies two design goals. First, it enables the system to develop a rich profile without asking too many questions. In fact, the user could skip the preference interface entirely and rely on usage patterns to build the profile. Secondly, it acknowledges the fact that content tagging is an ongoing problem. This system allows an evolution from a sparse backend taxonomy to something richer and more detailed over time. This will allow content providers to roll out applications before final systems are in place. Systems can begin to generate revenue before the taxonomy is actually finalized. Matching Preferences to Content Compiling client side preferences is only half the battle. The content itself must be tagged using the same taxonomy. Many news providers are currently working on content tagging systems for the purposes of archiving and retrieving their assets. This system could also

be used for a MyNews type of application. In order to match the user preferences with the content, information about the current news story would need to be supplied along with the content. In many cases, this information already exists in electronic form and could be included in the broadcast stream. At the very least, some metadata exists in the form of production and scheduling directives. The prototype application reads these tags and matches them against the user preferences. Currently, the prototype uses simple vector dot product techniques to match content to the user’s preference profile. The method is very simple, but seems to be very effective in tests involving several hours of tagged broadcast news footage. If needed, the matching scheme could be updated as tagging and preference data becomes more complex. Currently, the matching methods do not employ any collaborative filtering to help develop preference or matching data. This could lead to improvements or more interesting applications. One final point to be addressed is how to match the preferences to an individual viewer in a shared television environment. This problem can be solved in a number of ways. One way would be a simplified “login” using a simple set of buttons on a remote control. The MyNews demo largely ignores this problem. The assumption is that the preferences are household preferences. In most cases, a family or a couple will watch the evening news together. In this case, the preferences should be the preferences of the set of viewers instead of a singular viewer. The development of both the indexing systems and the preference systems is an ongoing task. There is still much research to be done to determine the best taxonomies, indexing methods, and retrieval methods. However, the MyNews prototype is flexible enough to accommodate an evolving tagging scheme. A first release might rely on a very shallow scheme that concentrates only on high level categories. Over time, further details could be added and the agent could be updated accordingly over either a network or with additional data on the broadcast stream. The next generation of PVRs will be network-ready. One advantage of a networked device is that the software can be easily updated by the service. The tagging and matching schemes can continually evolve without requiring the user to update the hardware or manually patching their software. It is noteworthy to mention that evolving broadband networks may ease the transport of content and preference data, but the broadcast channel will remain the most appropriate and ubiquitous transport for the video content for the foreseeable future. Value to the Consumer and Content Provider Personalized content is always valuable consumers because it enables them to consume better content in less time. This is especially true with news content because of the possibility of a low signal to noise ratio. A system like MyNews creates a better and more informative experience for the user because it strips out unwanted content and allows the viewers to concentrate on what they feel is most important. This creates added value for the content provider in terms of viewer loyalty and brand appeal. This could be translated into subscription-based models where the general broadcast is available for free, but the personalized content costs a small subscription fee. This is analogous to the current model for the TiVo service. In this context, there are many possible business models that could focus on getting revenue from the consumer. Another model is to focus on the more traditional revenue routes such as advertising. The existence of a viewer profile (and inferred demographic data) creates many opportunities for targeted advertising. There are many possibilities for business models that draw more revenue from the advertiser. These types of models concern privacy advocates because

this could lead to abuse of the preference data. However, all the content manipulation occurs on the client PVR. Therefore, it is technically possible to create targeted advertising without the preference data ever leaving the viewer’s home. This is demonstrated by the car commercial prototype. The car can be modified and tuned to the viewer’s preferences without the preference data ever leaving the home. This would complicate the revenue model, but it does create possibilities that do not necessarily abuse privacy. Future Work The capabilities of a platform such as the RTTCP represent new challenges in the areas of content tagging, user profiling, privacy, usability, and a host of other areas. Future development of the RTTCP will concentrate on developing more applications that highlight the capabilities and provide a test bed for solving these new challenges. There is also a significant amount of work to be done in educating the content providers about the capabilities that are made possible by this new breed of inexpensive “thick client” devices. The consumers have already begun to embrace this technology, but the adoption and uptake of the RTTCP will depend heavily on the acceptance of the content providers. Conclusion The MyNews and car commercial prototypes are two of several Accenture prototypes that fall under the broader project name “Real Time Television Content Platform”. These prototypes concentrate on how client side processing can be used to augment current broadcast infrastructures. MyNews is an example of how quality personalized content can be supplied with very little cost by leveraging devices that are already in the homes of the content consumers. The car commercial demonstrates the power of the device to actually create new content at the client side. These two capabilities applied separately or in combination create many new opportunities for content providers. These prototypes are not meant to singular examples of the technology. They represent the most basic examples of how low cost client side technology can be used to create rich personalized multimedia experiences. References 1. Stroud, Jim. 2001. TV Personalization: A Key Component of Interactive TV. The
Carmel Group. 2. Hua, Kien A., Ying Cai, Simon Sheu. 1998. Patching: A Multicast Technique for
True Video-on-Demand Services. ACM Multimedia 98. 3. http://www.us.playstation.com/ 4. http://www.nokia.com/multimedia/mediaterminal.html 5. http://www.xbox.com/ 6. http://www.tivo.com 7. http://www.replaytv.com 8. Gena, Cristina, Liliana Ardissono. 2001. On the Construction of TV Viewer
Stereotypes Starting from Lifestyles Surveys. Workshop on Personalization in Future TV 2001.