perimeter @ the center - future focus
TRANSCRIPT
Perimeter @ The Center - Future Focus
FUNDED BY: Perimeter Community Improvement Districts (PCIDs) and Atlanta Regional Commission
PREPARED BY: Sizemore Group in collaboration with Huntley Partners and Kimley-Horn and Associates
NOVEMBER 2011
2011 - A Ten Year LCI Update

Perimeter @ The Center - Future Focus
FUNDED BY: Perimeter Community Improvement Districts (PCIDs) and Atlanta Regional Commission
PREPARED BY: Sizemore Group in collaboration with Huntley Partners and Kimley-Horn and Associates
NOVEMBER 2011
2011 - A Ten Year LCI Update
PERIMETER COMMUNITY IMPROVEMENT DISTRICTSCentral (DeKalb) PCID Board John Heagy - ChairKay Younglove –Vice ChairDean J. Patterson - Board TreasurerRobert P. Voyles - Board MemberDale Hughes - Board MemberDavid Canaday – Board MemberJohn Lundeen – Board MemberDennis Kemp – Board MemberCody Partin – Board MemberDuane Sherman – Board Member
Fulton PCID Board Chuck Altimari - ChairDale Hughes - Vice ChairDiane S. Calloway - TreasurerAdam Orkin - SecretaryDonald Mabry - Board MemberDean J. Patterson - Board MemberTad Leithead - Board MemberKris Miller - Board Member
StaffYvonne Williams, President & Chief Executive OfficerDonna Mahaffey, Chief of External AffairsDavid M. Purcell, Chief Operating OfficerJennifer Harper, Program ManagerKate Sloan, External Affairs Manager
ATLANTA REGIONAL COMMISSIONRob LeBeau, Senior Principal Planner, Land Use DivisionBeth Hawes, Senior Planner, Land Use Division
CORE TEAMYvonne Williams, PCIDs Donna Mahaffey, PCIDsDavid Purcell, PCIDsJohn McDonough, Sandy SpringsGarrin Coleman, Sandy SpringsCedric Clark, Sandy SpringsMark Moore, Sandy SpringsWarren Hutmacher, DunwoodyHoward Koontz, DunwoodyMichael Smith, DunwoodyMike Tuller, DunwoodyMichael Starling, DunwoodyJonathan Weintraub, DeKalb CountyTed Tarantino, MARTABeth Hawes, ARCRob LeBeau, ARC
Credits
CONSULTANTS
Sizemore GroupWilliam de St. Aubin, Principal-in-Charge
Venky Babu, Associate Principal/Project Manager
Julie Saunders, Planner
Huntley PartnersRick Padgett, Partner
Kimley-Horn and AssociatesEdward Ellis, PE, PrincipalRob Ross, P.E, Project ManagerJames Fowler, Transportation Analyst
Our thanks to the following people for their vision, insight, support and leadership throughout the LCI process.

Table of Contents
ExECUTIVE SUMMARY
1.0 INTRODUCTION
1.1 OVERVIEW
1.2 REVIEW OF PERIMETER FOCUS -2005 LCI UPDATE
1.3 STUDY AREA
2.0 VISIONING
2.1 METHODOLOGY
2.2 PROCESS
2.3 COMMUNITY INPUT
2.4 GOALS & VISION
3.0 MARKET ANALYSIS
3.1 MARKET CONDITIONS AND PROJECTED DEMAND
3.2 IMPACT ANALYSIS
4.0 RECOMMENDATIONS
4.1 ANALYSIS AND AREAS OF FOCUS
4.2 DEVELOPMENT POTENTIAL
4.3 FRAMEWORK PLAN
4.4 RETROFIT ILLUSTRATION
5.0 IMPLEMENTATION
5.1 IMPLEMENTATION STRATEGIES
5.2 WORK PROGRAM
5.3 25 YEAR PROJECTIONS
6.0 APPENDIx
6.1 COMMUNITY SURVEY
6.2 LOCATION OF LCI PROJECTS
6.3 FUTURE TRANSIT CORRIDOR- ASHFORD DUNWOODY ROAD
TO ROSWELL ROAD
6.4 IMPLEMENTATION STRATEGY

Executive Summary

Perimeter @ The Center - Future Focus - 2011 LCI Update - Final Report
Prepared by Sizemore Group In Collaboration with Huntley Partners and Kimley-Horn and Associates 9
Perimeter, the premier regional center in the Southeastern United States, has grown over the last decade from a successful suburban office market to a vibrant mixed-use community. The LCI (Livable Centers Initiative) planning efforts in 2001 laid the foundation for transformation of Perimeter from a suburban regional center to a livable mixed use community. The Perimeter Community Improvement Districts (PCIDs) have been aggressively implementing the projects that were recommended in the 2001 LCI study as well as the 2005 LCI update (Perimeter Focus LCI Update). Perimeter continues to attract good corporations, businesses, hotels, and high quality retail and residences. The PCIDs recognize many assets and resources in Perimeter that offer tremendous potential for greater growth in the future. The desire to remain successful, competitive and sustainable for generations remains strong among all of the stakeholders as well as community. The PCIDs leadership and the surrounding community are committed to following the liviability goals over the next ten years.
• multi-use greenways
• cultural amenities
• civic gathering places
The market analysis projects significant demand over the next 25 years for Perimeter. The demand for office and retail is expected to almost equal the current inventory and the demand for residential is expected to increase five times that of today. The focus in the coming decades for Perimeter is to manage its growth as well as focus on livability enhancements and connectivity.
The framework of the “Perimeter @ The Center - Future Focus” - 2011- a ten year LCI update - is to focus on three areas:
•sustainable growth management
•livability enhancements
•connectivity
Meeting these goals will assist Perimeter, as well as the region and demonstrate to the nation a model for sustainable growth for the next century.
Sustainable Growth Management
The Framework Plan recommends the implementation of the original LCI vision to build Transit Station Areas around transit stations. Focusing the future growth demand around the transit stations creates high density mixed use environments to meet the goals of the Perimeter community and the region. These Transit Station Areas will offer housing choices, walkable livable neighborhoods with access to transit and provide opportunities to live and work in close proximity. This will reduce single occupancy transportation demand and improve air quality, economy and quality of life.
Livability Enhancements
The Framework Plan recommends improvements to create the following:
• A robust civic realm, providing access to diverse cultural, art and entertainment activities
• An Amenity Rich Boulevard that supports shopping, dining and entertainment activities
• A Civic Square that provides public gathering space that supports passive and active recreation, cultural activities, and fosters an overall sense of place
All of these improvements will help create a premier livable commuity.
Another critical component to livability is neighborhood design and walkability. Retrofitting the existing large suburban street grid with a walkable compact street grid lined with buildings and civic gathering spaces will tie into the
Executive Summary
VISION
To transform Perimeter from suburban character to urban character with well articulated civic realm, amenities and facilities that provide a greater sense of place and creates a thriving active high quality of life and place that attracts diverse group of people, corporations, businesses and institutions and makes Perimeter the first choice in metro Atlanta and the Southeast. The evolution from a suburban regional center to a premier livable center that ensures long term economic, social and environmental sustainability of Perimeter.
“to be a premier livable center”
Perimeter @ The Center - Future Focus - 2011 LCI Update - Final Report
Prepared by Sizemore Group In Collaboration with Huntley Partners and Kimley-Horn and Associates10
Goals
The Framework Plan section of the report is guided by the following community goals:
• Perimeter to be a premier market in the Southeast
o to be the first choice for companies to locate and grow
o to retain existing businesses and attract new quality businesses for long term economic sustainability
o to be a diverse market that caters to different market sectors
o to offer diverse choices and opportunities for residents, visitors and companies
• Future Growth
o appropriate land use and mix of uses
o sustainable growth management
o to integrate transit station area improvements at MARTA stations.
• Livability Enhancements
o enhance walkable and pedestrian friendly environments
o create a strong sense of place
o to be a sustainable community – mobility and livability integrated with green infrastructure
o offer cultural and recreational facilities and activities
o civic realm with way finding and art works
• Connectivity
o to create well connected – pedestrian, bike, shuttle, transit modes to and between various uses, nodes and neighborhoods
o to create well connected greenways, parks and open space systems that enhances the natural terrain
o to integrate waterways, lakes and ponds which are green assets to be used and leveraged
o easy and convenient access to transit
o reduce transportation demand
o enable appropriate ‘complete streets’
• Stakeholder participation and support
• Collaborative partnerships with private and public sector to implement the vision
• Retrofitting the regional center to an urban center
• To be a successful model for other suburban communities to emulate
transformation of Perimeter from a suburban to urban community.
Connectivity
The Framework Plan provides three layers of connectivity between the various activities within Perimeter and the surrounding neighborhoods. The first layer addresses connectivity within the connected districts (distrcits as established by PCIDs) that are centered around high density nodes with pedestrian improvements. The second layer addresses connectivity between the connected districts and Transit Station Areas with pedestrian walkways, a shuttle system, multi-use paths and bike lanes (multiple modes of alternate transportation) that facilitate mobility within Perimeter. The third layer addresses connectivity between the various districts to the surrounding neighborhoods with multi-use paths for pedestrians, bikes and Neighborhood Electric Vehicles (NEVs) and a shuttle system.
Perimeter @ The Center - Future Focus - 2011 LCI Update - Final Report
Prepared by Sizemore Group In Collaboration with Huntley Partners and Kimley-Horn and Associates 11
Executive Summary
The implementation of the Framework Plan will require continued collaboration with various stakeholders and partners in both the public and private sectors. It will require working with private property owners and businesses to facilitate enhancements. It will require coordination with the multi-jurisdictional regulatory framework, incentives, guidelines for development, funding and detail implementation studies and plans. In particular, several transportation projects are identified to move forward with the implemenation of “Perimeter @ The Center - Future Focus” transformation and this document provides a framework as the PCIDs seeks implementation funds to continue to build a better region.

Perimeter @ The Center - Future Focus - 2011 LCI Update - Final Report
Prepared by Sizemore Group In Collaboration with Huntley Partners and Kimley-Horn and Associates12
Perimeter @ The Center - Future Focus - 2011 LCI Update - Final Report
Prepared by Sizemore Group In Collaboration with Huntley Partners and Kimley-Horn and Associates 13
1 Introduction

Perimeter @ The Center - Future Focus - 2011 LCI Update - Final Report
Prepared by Sizemore Group In Collaboration with Huntley Partners and Kimley-Horn and Associates14
Perimeter @ The Center - Future Focus - 2011 LCI Update - Final Report
Prepared by Sizemore Group In Collaboration with Huntley Partners and Kimley-Horn and Associates 15
“Perimeter @ The Center - Future Focus” is the next evolution of ‘Perimeter Focus’, A Livable Centers Initiative (LCI) planning efforts that began in 2001 and was updated in 2005. ‘Perimeter Focus’ was the project name given to the 2001 planning effort that was jointly sponsored by the Perimeter Community Improvement Districts and Atlanta Regional Commission, Fulton and DeKalb Counties. Since the ‘Perimeter Focus LCI Update’ part of the PCIDs area has been incorporated into two cities, namely Sandy Springs and Dunwoody in 2005 and 2008 respectively. The PCIDs area includes three jurisdictions; City of Sandy Springs, City of Dunwoody and unincorporated area of DeKalb County. This current planning effort “Perimeter @ The Center - Future Focus” is the ten year LCI update for Perimeter’s next transformation.
Perimeter is a major regional center in metro Atlanta and the premier office market in the southeast. It is the largest suburban office district in metro Atlanta. What was a farm land in the late 1960’s, suburban residential and shopping in the 1970’s, is now home to retail centers and office parks; world headquarters to global corporations such as UPS, Newell Rubbermaid, Cox Enterprises, and others; high rise office buildings; several educational institutions; and premier health-care center for metro Atlanta, with three hospitals, hundreds of physician practices, multiple outpatient centers and support services. Perimeter is now becoming an active mixed use district with many new high end apartments and condos including high rise condo towers, such as the Manhattan.
Perimeter is connected to Buckhead, Midtown, Atlanta and the worlds busiest Hartsfield International Airport via MARTA heavy-rail rapid transit. There
are three MARTA train stations in the PCIDs area; Medical Center Station, Dunwoody Station, and Sandy Springs Station. Just at the north edge of the PCIDs boundary is the fourth station; North Springs Station, the end of the north line.
LCI Projects
PCIDs have been aggressively implementing the projects that were recommended in the ‘Perimeter Focus’ as well as ‘Perimeter Focus LCI Update’. Since the completion of the ‘Perimeter Focus LCI Update’ in March 2005, the PCIDs have completed most of the projects that were recommended. Out of the total thirty-nine projects in the five year work program, twenty-seven projects have been completed, five are currently underway and seven are awaiting funding. They have had unprecedented success in acquiring state and federal dollars for executing these projects. Besides these they have undertaken numerous initiatives to improve the traffic, mobility, walkability, safety, connectivity and visual and aesthetic quality and experience of the Perimeter market. These initiatives not only address the issues of Perimeter but also benefit the Atlanta region and set a model for other suburban communities throughout the country.
The PCIDs boundaries overlap three local municipal jurisdictions; Sandy Springs, Dunwoody, and DeKalb County. The PCIDs will continue to work with these partners as well as regional and state partners such as ARC, GRTA, GDOT and others on implementing the “Perimeter @ The Center - Future Focus”
Other Transportation Projects
Along with obtaining LCI funds, the
1.0 :: Introduction
1.1 Overview

Perimeter @ The Center - Future Focus - 2011 LCI Update - Final Report
Prepared by Sizemore Group In Collaboration with Huntley Partners and Kimley-Horn and Associates16
Perimeter @ The Center - Future Focus - 2011 LCI Update - Final Report
Prepared by Sizemore Group In Collaboration with Huntley Partners and Kimley-Horn and Associates 17
PCIDs have also received funds through Transportation Enhancement (TE) Grants. Besides the improvements of PCIDs internal streets, there are a few freeway projects underway. The first is a new half diamond interchange at Hammond Drive and GA 400 that opened to the public in Fall 2011. The second is a diverging diamond interchange at Ashford Dunwoody and I-285, which is about to begin construction and is the first of its kind in the state. There are a few high profile projects in planning stages; managed lane system along GA 400, interchange improvements at Abernathy and GA 400, interchange improvements at GA 400 and I-285, Revive 285 with potential light rail transit connecting east west from Doraville MARTA Station to Cumberland with a link to Dunwoody MARTA Station. These regional initiatives will further strengthen the transportation infrastructure, access and linkage to Perimeter.
Regulatory Framework
Collaborating with Sandy Springs, Dunwoody and DeKalb, PCIDs has successfully enabled the adoption of Perimeter Focus LCI Update vision into the Comprehensive Plans. The Comprehensive Plans of Dunwoody and Sandy Springs have been incorporated into the vision and the land use recommendations. PCIDs continue to work with these partners to construct a regulatory framework to facilitate the implementation of the LCI vision. Land-use decisions fall under the authority of the local municipality where the parcel is located. As such, should a question arise regarding the appropriate land-
use in an area, refer to local municipality comprehensive plan.
Private Development
The LCI plan and implementation of projects has attracted a significant amount of private development including residential, commercial, office and hotels. Several of these projects are mixed-use developments. During the midst of this economic downturn, construction is still under way in PCIDs with the expansion of office buildings and new apartment and office buildings. Due to the economic downturn some of the planned projects are on hold and are anticipated to get back on line when the economic recovery begins.
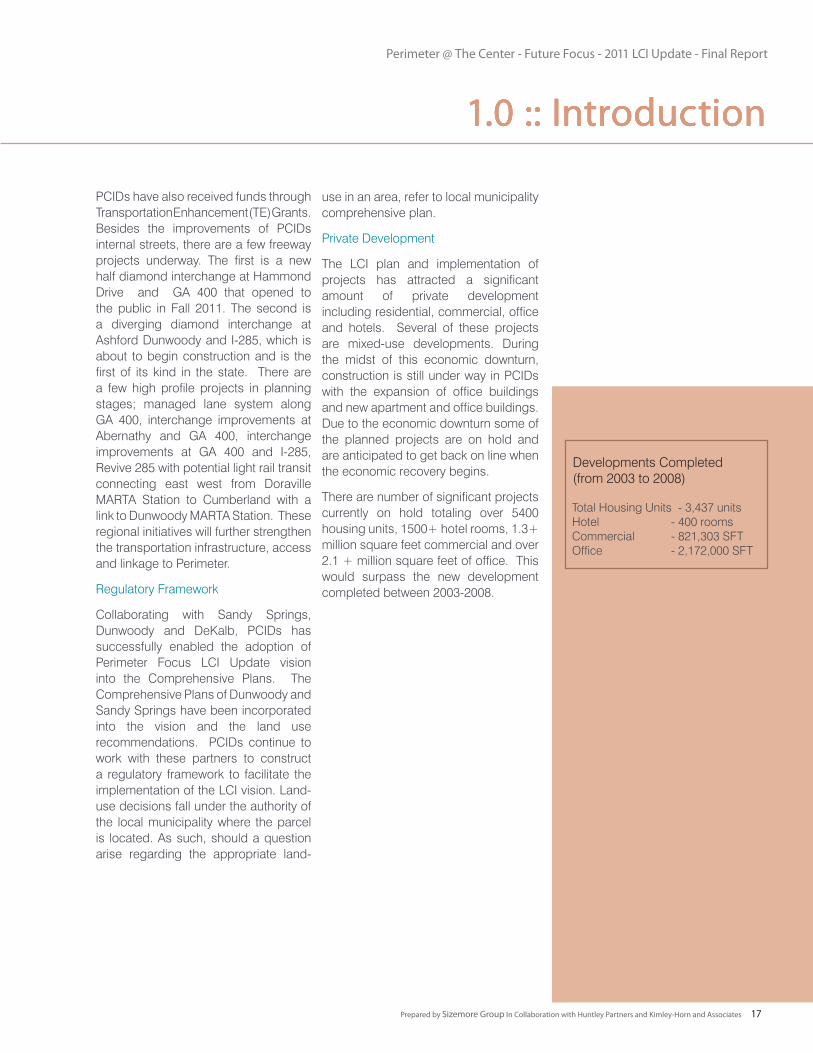
There are number of significant projects currently on hold totaling over 5400 housing units, 1500+ hotel rooms, 1.3+ million square feet commercial and over 2.1 + million square feet of office. This would surpass the new development completed between 2003-2008.
Developments Completed (from 2003 to 2008)
Total Housing Units - 3,437 units Hotel - 400 rooms Commercial - 821,303 SFT Office - 2,172,000 SFT
1.0 :: Introduction1.0 :: Introduction1.0 :: Introduction1.0 :: Introduction
Perimeter @ The Center - Future Focus - 2011 LCI Update - Final Report
Prepared by Sizemore Group In Collaboration with Huntley Partners and Kimley-Horn and Associates18
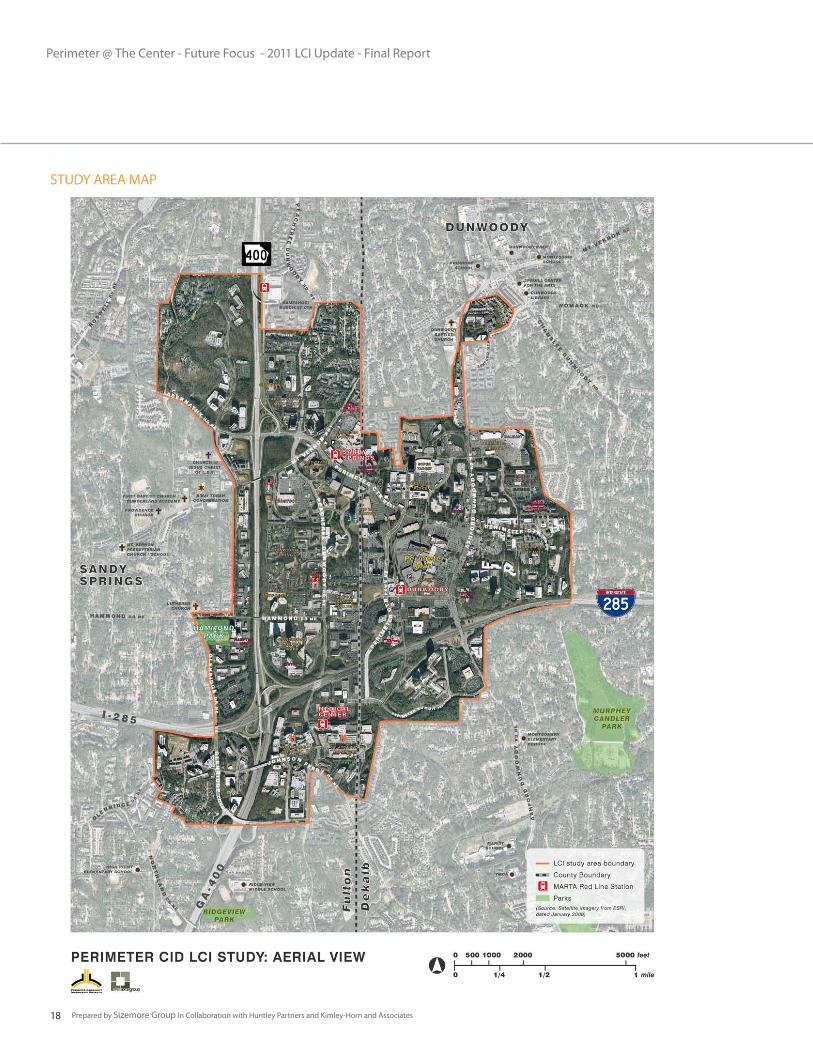
STUDY AREA MAP
Perimeter @ The Center - Future Focus - 2011 LCI Update - Final Report
Prepared by Sizemore Group In Collaboration with Huntley Partners and Kimley-Horn and Associates 19
The study area includes the complete boundary of the PCIDs. It includes three jurisdictions; Sandy Springs, Dunwoody and unincorporated DeKalb County. The area is approximately 4.2 square miles. It includes three MARTA stations within the study area and one at the northern edge of the study area boundary. The study area includes major freeways – GA 400 and I-285 with exits at Peachtree Dunwoody, Ashford Dunwoody, Hammond and Abernathy and several major arterials; Perimeter
Center Parkway, Perimeter Center East/West, Hammond Drive, Mt.Vernon and Glenridge Connector. The presence of these major freeways and arterials provides good access to Perimeter from all four directions. It effectively has 10-12 gateways into the Perimeter. Perimeter includes diverse uses and activities; office, commercial (shopping and restaurants), hotels, educational institutions, medical services and residential. It is rapidly becoming a mixed-use district.
1.2 Study Area
1.0 :: Introduction

Perimeter @ The Center - Future Focus - 2011 LCI Update - Final Report
Prepared by Sizemore Group In Collaboration with Huntley Partners and Kimley-Horn and Associates20

Perimeter @ The Center - Future Focus - 2011 LCI Update - Final Report
Prepared by Sizemore Group In Collaboration with Huntley Partners and Kimley-Horn and Associates 21
2 Visioning

Perimeter @ The Center - Future Focus - 2011 LCI Update - Final Report
Prepared by Sizemore Group In Collaboration with Huntley Partners and Kimley-Horn and Associates22
Perimeter @ The Center - Future Focus - 2011 LCI Update - Final Report
Prepared by Sizemore Group In Collaboration with Huntley Partners and Kimley-Horn and Associates 23
The 2011 LCI update takes the overall vision and recommendations of the original LCI plan and the 2005 update to the next step. The process of creating recommendations for the Framework plan began with tracking progress made on the original LCI and update vision and projects, assessing the current and future needs, assessing the issues of the community and areas of focused effort, and tracking future growth potential for Perimeter. The research informed recommendations for a Framework Plan for implementation of projects. The Framework Plan is a road map to the next generation transformation of Perimeter.
Assessment
A review of previous LCI update, the projects implemented and currently underway, regional initiatives, plans of other jurisdictions, studies and other initiatives by PCIDs along with a windshield survey of the study area was conducted to assess the overall status of existing conditions and issues of importance. GIS data and aerial images were used for documentation of the assessment.
Stakeholder Input
Planning team conducted meetings with the stakeholders that included the three jurisdictions (Sandy Springs, Dunwoody, and DeKalb), PCIDs, MARTA, ARC and others to understand the various issues that need to be addressed. Public meetings were conducted to solicit input from the community to understand their issues and needs.
Community Survey
A community survey was conducted online to solicit community input that centered on issues of green space, culture, art, the civic realm, connectivity and sustainable initiatives. Through analysis of the survey results and the input from stakeholders and community,
goals and the areas of focus were identified for the framework plan to address
Development Potential
As one of the fastest growing areas in the region, Perimeter has multiple projects underway and planned. As a premier office market in the southeast and the largest in metro Atlanta, it is anticipated to continue to have significant growth potential. A market analysis was conducted to update the 2009 RCLCOs (Robert Charles Lesser and Company) market study to take into account the current economic environment and the recovery. Through this analysis, potential market demand for residential, commercial and office uses is projected for the Perimeter over a 25 year horizon. This provided guidance to the future planning and development efforts and guidance to the framework plan.
Framework Plan
The Framework Plan provides recommendations to address the various issues, goals and the future aspired vision. The Plan lays out a framework and a methodology for land use, development patterns, connectivity, civic realm, green space, culture, walkability and retrofit of existing suburban development pattern and the tools to enable implementation of the Plan.
Implementation
Following the development of T he Framework Plan, various projects and initiatives both short term and long term are identified to set the stage for implementation of the Plan. PCIDs continued collaboration with the three jurisdictions and various other partners and the success of attracting funds and implementation of projects will result in realizing the vision of the Framework Plan.
Visioning
2.1 Methodology
2.0 :: Visioning
Perimeter @ The Center - Future Focus - 2011 LCI Update - Final Report
Prepared by Sizemore Group In Collaboration with Huntley Partners and Kimley-Horn and Associates24
Stakeholder Input
Two meetings were held to gather input from the stakeholders on the various issues, challenges, needs and aspirations of the community.
Community Input
Two community meetings were held to gather community input in the various stages of the planning process. A community visioning meeting was held on January 18, 2011 to solicit input on the key issues, concerns and the long-term vision for Perimeter. Another community meeting was held on February 8, 2011 to solicit input on the Framework Plan concepts.
The planning team, Sizemore Group, used input from the stakeholder and community meetings and incorporated them into the recommendations of the Framework Plan.
Studies of this nature involve many participants and stakeholders. For the successful development of a Plan, it is imperative to hear all of the voices and integrate them in the planning process and efforts. We divided this large group of participants into three teams; Project Team, Core Team, and Community.
Project Team
The Project Team is created to monitor the logistics of the study and schedule. The team consisted of representatives from the consultant team, PCIDs, and ARC. The Project Team met with the Core Team to review documents, study findings and organize the various elements of the planning process.
Core Team
This is a larger group of community stakeholders who have a stake in the study area, the knowledge of the area and its vicinity, key challenges and issues. This team provided guidance to the Project Team throughout the planning process. They previewed the materials for the community meetings to ensure that materials reflected the interest of the community during the planning process.
Community
An extended group of people in the community; residents, business owners, visitors, property owners, employers, employees, and others who are interested in Perimeter.
Community Survey
As part of the public input a community survey was conducted on-line to solicit the community input that centered on issues of green spaces, culture, art and civic realm, connectivity and sustainable initiatives. Survey results are included in the appendix.
2.2 Public Participation Process
2.0 :: Visioning
Perimeter @ The Center - Future Focus - 2011 LCI Update - Final Report
Prepared by Sizemore Group In Collaboration with Huntley Partners and Kimley-Horn and Associates 25
2.3 Community Input
3 MARTA stations within the PCIDs
Known as a premier office market in the region, is aesthetically attractive and has good branding, reputation and a stable market.
It is a major employment center
Northside Medical employs more medical than any other in the region, possibly the Southeast
It is connected to great neighborhoods with good sense of community
Perimeter’s trend toward making it the in-town living community
Good regional and local connectivity, freeways and arterials both north-south and east-west connections
Has potential to grow due to its assets, availability of land and location
Surrounding neighborhoods have strong demographic profile and has educated residents
Perimeter area has many entryways into the Perimeter market
Attractive office buildings and competitive rates - 29+ million square feet of office space
Diversity of market and uses, lot of services – shopping, restaurants and other amenities are available
Significant new infrastructure investments are evident in the transformation the Perimeter have been making.
Good multi-modal connectivity
Good institutions – colleges and schools.
Potential for livable/urbanized place
PCIDs leadership and the PCIDs board’s focused, relentless, unified and committed efforts to enhance Perimeter
Multi-jurisdictions that PCIDs constitute is a strength, draws more investments
Presence of hospital and medical center offers market potential for medical sector – biotech, bio-medical, nursing, etc.
18+ million visitors come to Perimeter annually – 60% of them are outside of the surrounding areas, Perimeter has a regional draw
Regional projects; Managed lanes on I-285 and the Revive 285 will improve access and traffic congestion
Perimeter been a model of success for other similar communities in the region.
Strength, Challenges, Opportunities and Threats (SCOT)Following is the summary of SCOT from the stakeholders and the community
Strengths
2.0 :: Visioning
Perimeter @ The Center - Future Focus - 2011 LCI Update - Final Report
Prepared by Sizemore Group In Collaboration with Huntley Partners and Kimley-Horn and Associates26
Lacks green space connectivity
Needs more pedestrian connectivity
More residential
Traffic congestion at some locations impedes traffic flow, some locations are tricky to negotiate, need better signage – intersections at Mt.Vernon and Perimeter East and Ashford Dunwoody. The transition of travel lanes into turn lanes is confusing. Signs on the ground are not helpful, will need overhead or vertical signs that are clearly visible.
Lacks inter-parcel connectivity and connection to transit
Need to enhance hotel inventory, current inventory seems inadequate for convention and meeting events
Need cultural assets and activities that can draw visitors
Walkable link from MARTA to various activities
Hotels within walking distance from MARTA
Paying attention to walking districts within PCIDs
Finer grain pedestrian connectivity to get rid of long blocks
Inter-market circulation is a challenge - external freeway traffic affects accessibility and impacts the market
Freeways divide the neighborhoods
Not completely bike friendly
Needs ‘place making’ and way finding to go to another level
Short term there is more retail than demand
Mall trends are changing
Apartments are not desired by Dunwoody
Breaking down the large scale auto dependant block sizes to create a more pedestrian accessible environment
Improve way finding. In particular within a third of a mile of each transit stop is critical.
Multi-jurisdictions – it is a challenge and as well an opportunity
Retention of existing businesses
Safety – there have been car break-in’s in some locations – mall area surroundings
Challenges
2.0 :: Visioning
Perimeter @ The Center - Future Focus - 2011 LCI Update - Final Report
Prepared by Sizemore Group In Collaboration with Huntley Partners and Kimley-Horn and Associates 27
Has potential to complete a robust bike connectivity within the Perimeter and to other regional trail systems
Opportunity to make streets ‘Complete Streets’ concept that allows streets for diverse modes of transportation
Can create parks and greenways and a system of green space connectivity that links the entire system, internal as well as external
Potential to add new markets, - bio-tech, bio-medical, nursing, entertainment, convention, etc.
Potential to fill existing markets.
To create an active life – night life, a theatre district (like Broadway, etc.)
Opportunity to relieve choke point within Perimeter transportation system.
Opportunity to partner with Art Institute and Spruill Center for Arts to attract cultural activities, facilities or design schools, galleries, etc.
Several development projects are planned for the area, which will come back on line when the market comes back.
Potential for office campus expansion
To be a model for suburban to urban retrofit – developing parking lots and under utilized assets
Changing demographics offers opportunities – baby boomers, millennials, etc. – how do you appeal to these segments
Asphalt and under developed areas offer potential for re-use. Perimeter Mall is thinking of some initiatives to redevelop some of the parking areas.
Trolley or shuttle system (MARTA buses are too long a wait, not enough headway to be effective)
Educating people about walking and biking
Shared parking district-wide would help reduce the amount of parking lots
Way finding signage – hotels, visitors, patrons
Making it easier for development – permit process, approvals, etc.
Capture the spending that goes out of Perimeter area for various services and amenities
Opportunities
2.0 :: Visioning
Perimeter @ The Center - Future Focus - 2011 LCI Update - Final Report
Prepared by Sizemore Group In Collaboration with Huntley Partners and Kimley-Horn and Associates28
Need to address current vacancies
The economic recovery and market uncertainty in general
Short term threat from competitive markets that have price advantage
Competition from urban environments such as Buckhead and Midtown markets
Retaining the companies such as UPS, etc. and ensuring their growth could be accommodated here
Educating the community and local governments about TOD – need for housing densities, diverse product types and rental apartments
Aging retail
Insolvency of MARTA
Complacency – need to make sure quality is maintained – all aspects of quality
An on-line survey was conducted to solicit community preferences with regard to three specific areas; cultural activities and facilities, recreational activities and facilities and sustainable design. Following is the summary of the survey results. See the appendix section for detailed results.
Respondents: 74 percent of the respondents were those who shopped in Perimeter area, followed by 64.5 percent who worked in Perimeter and 26 percent who lived in Perimeter
Age Group of Respondents: 44 percent of respondents belong to age group of 25-45 years, 38 percent to 46-60 years of age group and 17 percent to 60+ years.
Cultural activities preferred to be added to Perimeter area: 60 percent preferred concerts, followed by 50 percent preferring festivals, art and craft shows, followed by 44 percent preferring museums, visual arts and galleries, followed by 36 percent and 37 percent preferring live theatre and wine and dine respectively.
Recreational activities preferred to be most needed in the Perimeter area: 73 percent preferred multi-purpose trails and greenways, followed by 69 percent preferring pocket parks and picnic areas, followed by 61 percent preferring civic plazas and gathering spaces, followed by 51.5 percent preferring biking trails, followed by 45.5 percent preferring festivals, fair grounds and concert venues
Willing to pay fees for acquisition of land and maintaining of recreational facilities: 56 percent said yes and 44 percent said no.
Sustainable design components that are important: All of the four components; water quality and conservation, energy conservation and efficiency and transportation issues and air quality ranked high between 74 percent to 81 percent.
Threats
Community Survey Results
Three main preferences emerged from the survey; need for multi-use green-ways, need for cultural activities and need for gathering places. Two other issues were brought up by the respon-dents; safety and housing options for diverse group of people.
2.0 :: Visioning
Perimeter @ The Center - Future Focus - 2011 LCI Update - Final Report
Prepared by Sizemore Group In Collaboration with Huntley Partners and Kimley-Horn and Associates 29
2.4 Goals
Perimeter to be a premier market in the Southeast
to be the first choice for companies to locate and grow
to retain existing businesses and attract new quality businesses for long term economic sustainability
to be a diverse market that caters to different market sectors
offer diverse choices and opportunities for residents, visitors and companies
Future Growth
appropriate land use and mix of uses
planned growth management
to integrate transit station area improvements at MARTA stations.
Livability Enhancements
enhance walkable and pedestrian friendly environments
create a strong sense of place
to be a sustainable community – mobility and livability integrated with green infrastructure
offer cultural and recreational facilities and activities
civic realm with way finding and art works
Connectivity
to create a well connected – pedestrian, bike, shuttle, transit modes to and between various activities, nodes and neighborhoods.
to create well connected greenways, parks and open spaces systems that enhances the natural terrain
to integrate waterways, lakes and ponds which are green assets to be used and leveraged.
easy and convenient access to transit
transportation demand reduction
enable appropriate complete streets
Stakeholder participation and support
Collaborative partnerships with private and public sector to implement the vision
Retrofitting the regional center to an urban center
To be a successful model for other suburban communities to emulate
Following are the goals that emerged from the stakeholder and community input participation sessions.
VISION
To transform Perimeter from subur-ban character to urban character with well articulated civic realm, amenities and facilities that provide a greater sense of place and cre-ates a thriving active high quality of life and place that attracts diverse group of people, corporations, busi-nesses and institutions and makes Perimeter the first choice in metro Atlanta and the Southeast. The evolution from a suburban regional center to a premier livable center that ensures long term economic, social and environmental sustain-ability of Perimeter.
“to be a premier livable center”
2.0 :: Visioning

Perimeter @ The Center - Future Focus - 2011 LCI Update - Final Report
Prepared by Sizemore Group In Collaboration with Huntley Partners and Kimley-Horn and Associates30
Perimeter @ The Center - Future Focus - 2011 LCI Update - Final Report
Prepared by Sizemore Group In Collaboration with Huntley Partners and Kimley-Horn and Associates 31
3 Market Analysis

Perimeter @ The Center - Future Focus - 2011 LCI Update - Final Report
Prepared by Sizemore Group In Collaboration with Huntley Partners and Kimley-Horn and Associates32
Perimeter @ The Center - Future Focus - 2011 LCI Update - Final Report
Prepared by Sizemore Group In Collaboration with Huntley Partners and Kimley-Horn and Associates 33
The purpose of this analysis is to arrive at a common understanding of the Perimeter Community Improvement Districts’ (PCIDs’) existing economic strengths and challenges. This analysis is expressed in the context of the national and metro Atlanta economies as a means of understanding the PCIDs’ relative position within metro Atlanta and highlighting its potential competitive advantages over ten-year and twenty-five-year time frames.
This analysis does identify current conditions and projected demographic and real estate conditions within the specific boundaries of the PCIDs – a 4.19 square mile area reflected in the map. (see Figure.1). The potential for new office, retail and residential development within the PCIDs does refer specifically to development demand that could occur within the boundaries of the PCIDs based purely on (1) the market areas from which demand is generated, (2) the projected growth in demand within these market areas and (3) the likely share of the total market demand (share of market or “SOM”) that the PCIDs physical area could reasonably be expected to attract.
It is critical to the overall LCI update, however, that one understand that the demand projections contained in this Market Analysis component relate only to the demand itself. It does not assume that all demand can be accommodated physically within the physical boundaries of the PCIDs, nor does it assume that all such demand-driven demand is desired by the PCIDs and its membership.
3.0 :: Market Analysis
3.1 PCIDs Existing Market Conditions and Projected Demand
Perimeter @ The Center - Future Focus - 2011 LCI Update - Final Report
Prepared by Sizemore Group In Collaboration with Huntley Partners and Kimley-Horn and Associates34
Definitions of Perimeter CIDs Market Areas
“address” – an intangible combination of perceived image, quality, safety, convenience, culture, visual appeal and emotional satisfaction. With respect to the fundamental driver – area employment growth – the PCIDs office market is clearly defined in Atlanta’s real estate community as the Central Perimeter Submarket and in the Atlanta Regional Commission’s definition of the “Sandy Springs Superdistrict.”
Industrial
The PCIDs area is not considered an industrial market, nor is such development considered either appropriate given the area’s higher-end commercial and residential product mix or cost-effective given the higher cost
of land. The Industrial market is not considered in this market analysis.
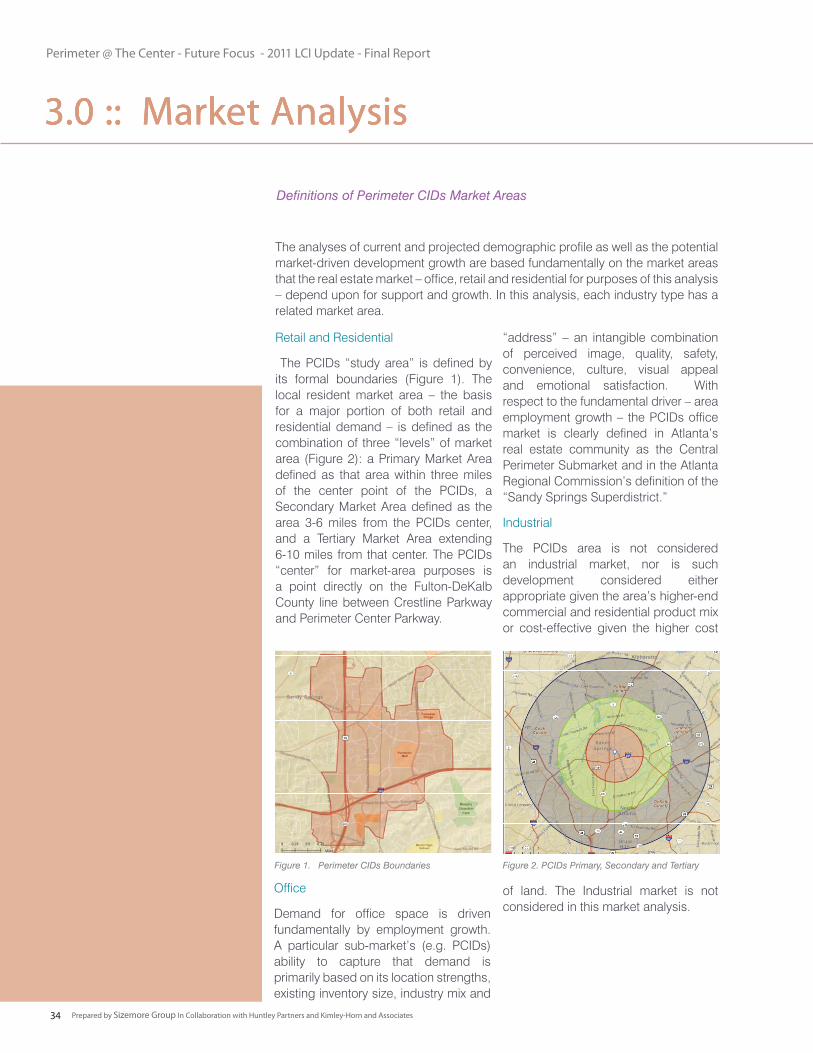
Retail and Residential
The PCIDs “study area” is defined by its formal boundaries (Figure 1). The local resident market area – the basis for a major portion of both retail and residential demand – is defined as the combination of three “levels” of market area (Figure 2): a Primary Market Area defined as that area within three miles of the center point of the PCIDs, a Secondary Market Area defined as the area 3-6 miles from the PCIDs center, and a Tertiary Market Area extending 6-10 miles from that center. The PCIDs “center” for market-area purposes is a point directly on the Fulton-DeKalb County line between Crestline Parkway and Perimeter Center Parkway.
Office
Demand for office space is driven fundamentally by employment growth. A particular sub-market’s (e.g. PCIDs) ability to capture that demand is primarily based on its location strengths, existing inventory size, industry mix and
The analyses of current and projected demographic profile as well as the potential market-driven development growth are based fundamentally on the market areas that the real estate market – office, retail and residential for purposes of this analysis – depend upon for support and growth. In this analysis, each industry type has a related market area.
3.0 :: Market Analysis
Figure 1. Perimeter CIDs Boundaries Figure 2. PCIDs Primary, Secondary and Tertiary
3.0 :: Market Analysis3.0 :: Market Analysis
Perimeter @ The Center - Future Focus - 2011 LCI Update - Final Report
Prepared by Sizemore Group In Collaboration with Huntley Partners and Kimley-Horn and Associates 35
Perimeter CIDs and Market Area Demographic and Income Profile: Key Characteristics - Summary
Definitions of Perimeter CIDs Market Areas
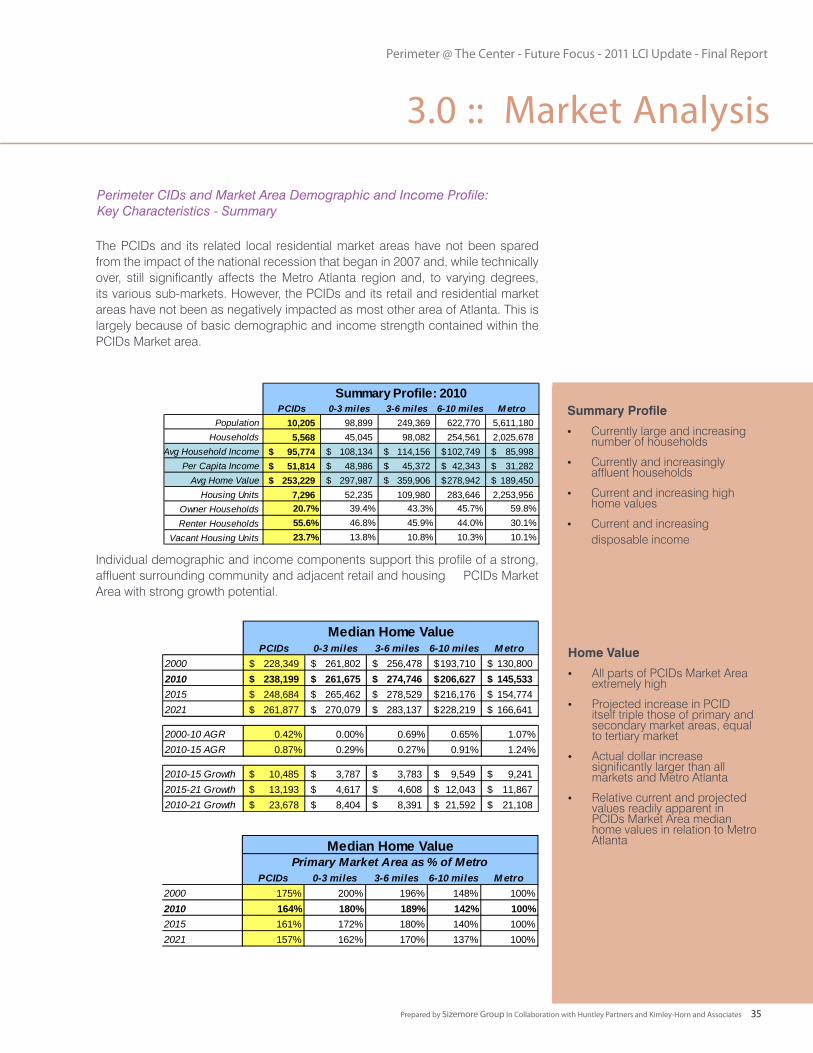
The PCIDs and its related local residential market areas have not been spared from the impact of the national recession that began in 2007 and, while technically over, still significantly affects the Metro Atlanta region and, to varying degrees, its various sub-markets. However, the PCIDs and its retail and residential market areas have not been as negatively impacted as most other area of Atlanta. This is largely because of basic demographic and income strength contained within the PCIDs Market area.
Individual demographic and income components support this profile of a strong, affluent surrounding community and adjacent retail and housing PCIDs Market Area with strong growth potential.
PCIDs 0-3 miles 3-6 miles 6-10 miles M etroPopulation 10,205 98,899 249,369 622,770 5,611,180
Households 5,568 45,045 98,082 254,561 2,025,678 Avg Household Income 95,774$ 108,134$ 114,156$ 102,749$ 85,998$
Per Capita Income 51,814$ 48,986$ 45,372$ 42,343$ 31,282$ Avg Home Value 253,229$ 297,987$ 359,906$ 278,942$ 189,450$
Housing Units 7,296 52,235 109,980 283,646 2,253,956 Owner Households 20.7% 39.4% 43.3% 45.7% 59.8%Renter Households 55.6% 46.8% 45.9% 44.0% 30.1%
Vacant Housing Units 23.7% 13.8% 10.8% 10.3% 10.1%
Summary Profile: 2010 Summary Profile
Currently large and increasing • number of households
Currently and increasingly • affluent households
Current and increasing high • home values
Current and increasing • disposable income
Home Value
All parts of PCIDs Market Area • extremely high
Projected increase in PCID • itself triple those of primary and secondary market areas, equal to tertiary market
Actual dollar increase • significantly larger than all markets and Metro Atlanta
Relative current and projected • values readily apparent in PCIDs Market Area median home values in relation to Metro Atlanta
PCIDs 0-3 miles 3-6 miles 6-10 miles M etro2000 228,349$ 261,802$ 256,478$ 193,710$ 130,800$ 2010 238,199$ 261,675$ 274,746$ 206,627$ 145,533$ 2015 248,684$ 265,462$ 278,529$ 216,176$ 154,774$ 2021 261,877$ 270,079$ 283,137$ 228,219$ 166,641$
2000-10 AGR 0.42% 0.00% 0.69% 0.65% 1.07%2010-15 AGR 0.87% 0.29% 0.27% 0.91% 1.24%
2010-15 Growth 10,485$ 3,787$ 3,783$ 9,549$ 9,241$ 2015-21 Growth 13,193$ 4,617$ 4,608$ 12,043$ 11,867$ 2010-21 Growth 23,678$ 8,404$ 8,391$ 21,592$ 21,108$
Median Home Value
PCIDs 0-3 miles 3-6 miles 6-10 miles M etro2000 175% 200% 196% 148% 100%2010 164% 180% 189% 142% 100%2015 161% 172% 180% 140% 100%2021 157% 162% 170% 137% 100%
Median Home ValuePrimary Market Area as % of Metro
3.0 :: Market Analysis
Perimeter @ The Center - Future Focus - 2011 LCI Update - Final Report
Prepared by Sizemore Group In Collaboration with Huntley Partners and Kimley-Horn and Associates36
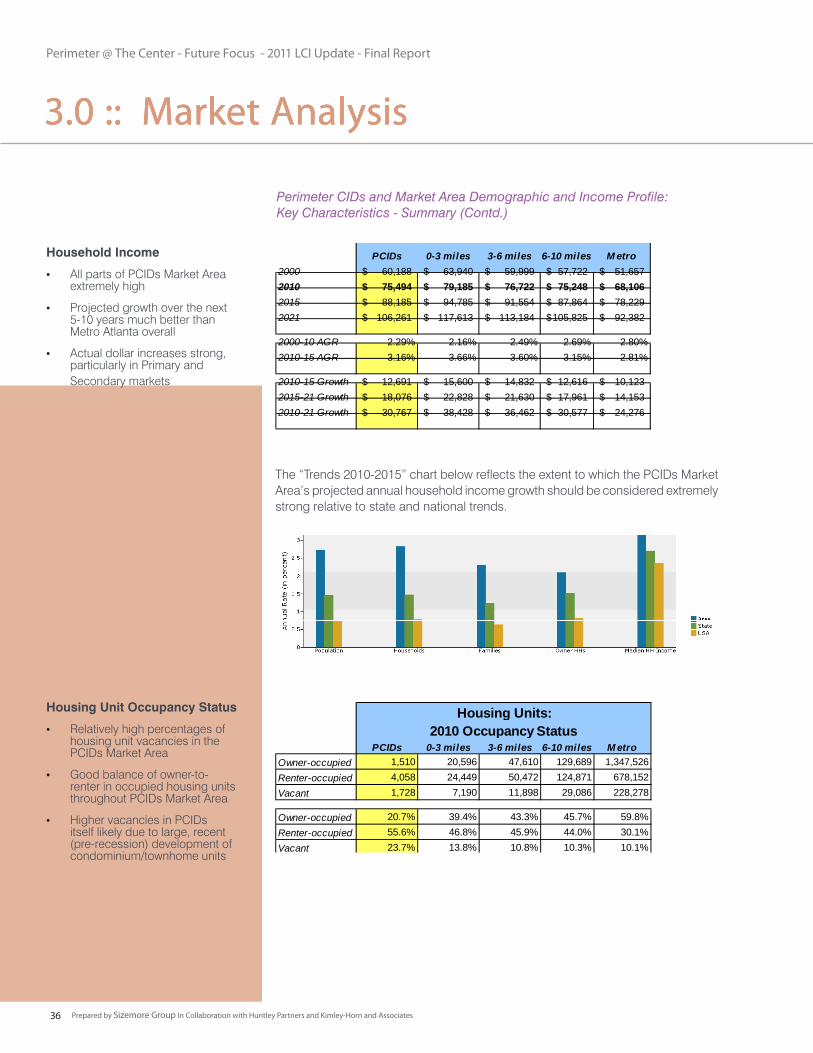
The “Trends 2010-2015” chart below reflects the extent to which the PCIDs Market Area’s projected annual household income growth should be considered extremely strong relative to state and national trends.
Household Income
All parts of PCIDs Market Area • extremely high
Projected growth over the next • 5-10 years much better than Metro Atlanta overall
Actual dollar increases strong, • particularly in Primary and Secondary markets
Housing Unit Occupancy Status
Relatively high percentages of • housing unit vacancies in the PCIDs Market Area
Good balance of owner-to-• renter in occupied housing units throughout PCIDs Market Area
Higher vacancies in PCIDs • itself likely due to large, recent (pre-recession) development of condominium/townhome units
PCIDs 0-3 miles 3-6 miles 6-10 miles M etro
2000 60,188$ 63,940$ 59,999$ 57,722$ 51,657$ 2010 75,494$ 79,185$ 76,722$ 75,248$ 68,106$ 2015 88,185$ 94,785$ 91,554$ 87,864$ 78,229$ 2021 106,261$ 117,613$ 113,184$ 105,825$ 92,382$
2000-10 AGR 2.29% 2.16% 2.49% 2.69% 2.80%2010-15 AGR 3.16% 3.66% 3.60% 3.15% 2.81%
2010-15 Growth 12,691$ 15,600$ 14,832$ 12,616$ 10,123$ 2015-21 Growth 18,076$ 22,828$ 21,630$ 17,961$ 14,153$ 2010-21 Growth 30,767$ 38,428$ 36,462$ 30,577$ 24,276$
Median Household Income
PCIDs 0-3 miles 3-6 miles 6-10 miles M etroOwner-occupied 1,510 20,596 47,610 129,689 1,347,526Renter-occupied 4,058 24,449 50,472 124,871 678,152Vacant 1,728 7,190 11,898 29,086 228,278
Owner-occupied 20.7% 39.4% 43.3% 45.7% 59.8%Renter-occupied 55.6% 46.8% 45.9% 44.0% 30.1%Vacant 23.7% 13.8% 10.8% 10.3% 10.1%
Housing Units:2010 Occupancy Status
Perimeter CIDs and Market Area Demographic and Income Profile: Key Characteristics - Summary (Contd.)
3.0 :: Market Analysis3.0 :: Market Analysis3.0 :: Market Analysis
Perimeter @ The Center - Future Focus - 2011 LCI Update - Final Report
Prepared by Sizemore Group In Collaboration with Huntley Partners and Kimley-Horn and Associates 37
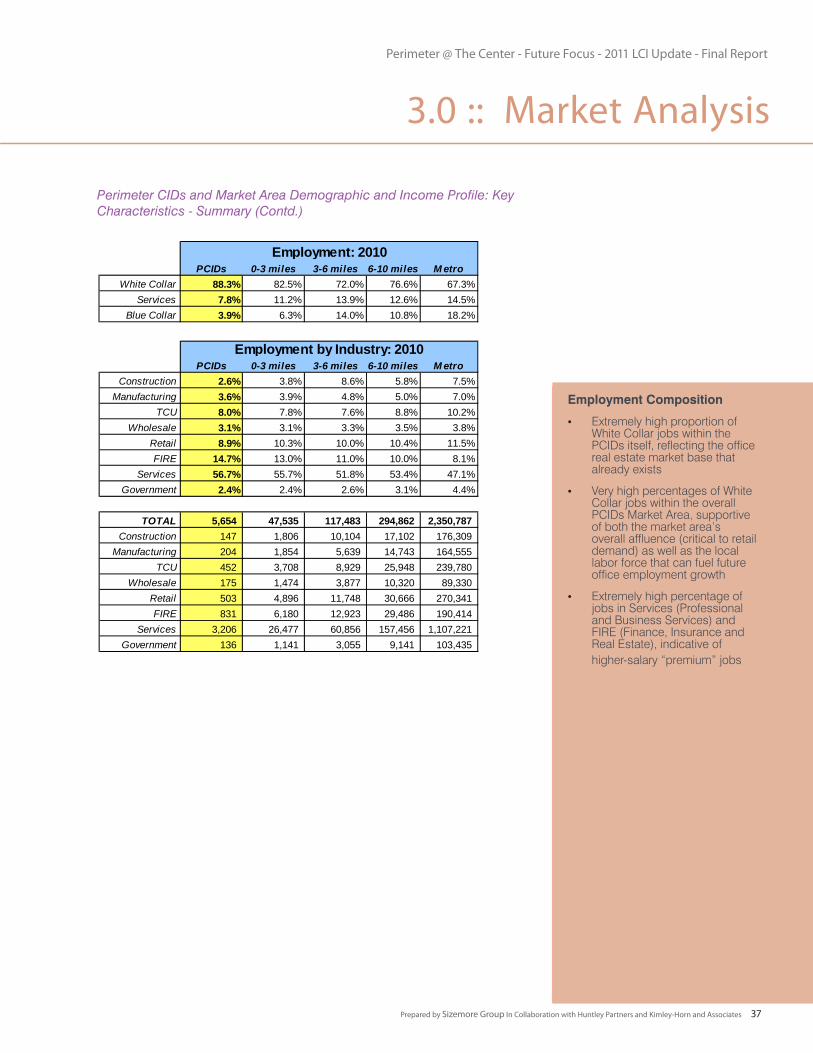
Perimeter CIDs and Market Area Demographic and Income Profile: Key Characteristics - Summary (Contd.)
PCIDs 0-3 miles 3-6 miles 6-10 miles M etroWhite Collar 88.3% 82.5% 72.0% 76.6% 67.3%
Services 7.8% 11.2% 13.9% 12.6% 14.5%Blue Collar 3.9% 6.3% 14.0% 10.8% 18.2%
Employment: 2010
PCIDs 0-3 miles 3-6 miles 6-10 miles M etroConstruction 2.6% 3.8% 8.6% 5.8% 7.5%
Manufacturing 3.6% 3.9% 4.8% 5.0% 7.0%TCU 8.0% 7.8% 7.6% 8.8% 10.2%
Wholesale 3.1% 3.1% 3.3% 3.5% 3.8%Retail 8.9% 10.3% 10.0% 10.4% 11.5%FIRE 14.7% 13.0% 11.0% 10.0% 8.1%
Services 56.7% 55.7% 51.8% 53.4% 47.1%Government 2.4% 2.4% 2.6% 3.1% 4.4%
TOTAL 5,654 47,535 117,483 294,862 2,350,787 Construction 147 1,806 10,104 17,102 176,309
Manufacturing 204 1,854 5,639 14,743 164,555 TCU 452 3,708 8,929 25,948 239,780
Wholesale 175 1,474 3,877 10,320 89,330 Retail 503 4,896 11,748 30,666 270,341 FIRE 831 6,180 12,923 29,486 190,414
Services 3,206 26,477 60,856 157,456 1,107,221 Government 136 1,141 3,055 9,141 103,435
Employment by Industry: 2010
Employment Composition
Extremely high proportion of • White Collar jobs within the PCIDs itself, reflecting the office real estate market base that already exists
Very high percentages of White • Collar jobs within the overall PCIDs Market Area, supportive of both the market area’s overall affluence (critical to retail demand) as well as the local labor force that can fuel future office employment growth
Extremely high percentage of • jobs in Services (Professional and Business Services) and FIRE (Finance, Insurance and Real Estate), indicative of higher-salary “premium” jobs
3.0 :: Market Analysis
Perimeter @ The Center - Future Focus - 2011 LCI Update - Final Report
Prepared by Sizemore Group In Collaboration with Huntley Partners and Kimley-Horn and Associates38
The impact of the global economic recession in 2009 was experienced by commercial real estate markets around the world, according to the 24th annual Global Market Report released by NAI Global. Rising vacancy rates and declining rental rates defined nearly every market and sector here in the United States. Eroding demand and increasing supplies of sublease space further impacted the market, leading to a near standstill in transaction volume.
Banks and financial institutions are expected to clean up their balance sheets and move more aggressively to dispose of commercial real estate loans and financially distressed real estate assets in the coming year. As a result, investors who have been sidelined by economic uncertainty will see tremendous acquisition opportunities
The commercial real estate market in the United States continues to face a long road to recovery. According to the NAI report, office property vacancy rates are continuing to rise, and severe job losses have resulted in increasing shadow or sublease space along with tenant inducements. In the past six months, multi-family starts have fallen 75% and are expected to remain low due to the shortage of available construction capital. According to the report, the sector will take longer to rebound and will not see a recovery until mid-2011 or later.
Retail vacancies continue to rise across the nation, and construction in the retail sector dropped nearly 50% from its peak in 2007. In addition, the vacancy rate for areas sought out by the big-box retailer segment, soared to 9.8% last year, and the average rental rate fell to $19.46 per square foot per year.
In a recent (Feb 15 2011) report, Marcus & Millichap Real Estate Investment Services predicted that retail properties In a recent (Feb 15 2011) report, Marcus & Millichap Real Estate Investment Services predicted that retail properties were “poised to rebound as economic conditions strengthened.” The report stated further: “In spite of short-term fears including unrest in the Middle East, a spike in commodities prices and concerns over the nation’s growing budget deficit, the U.S. economy continues to strengthen. Corporate balance sheets have improved significantly, consumer confidence is building and retail sales improved markedly during the 2010 holiday season. These positive factors bode well for the U.S. retail real estate sector, which recently reached bottom.
According to the U.S. Department of Housing and Urban Development, Housing market conditions are showing signs of stabilization during the first quarter of 2010, after a downward trend that began in the first quarter of 2006 and just started to reverse itself in the second quarter of 2009. This recovery is tenuous as single-family housing permits and starts increased in the first quarter of 2010, but the number of single-family housing completions fell. Also, the marketing sector performed poorly as the sale of new and existing homes both fell.
Current National Real Estate Markets
3.0 :: Market Analysis
Perimeter @ The Center - Future Focus - 2011 LCI Update - Final Report
Prepared by Sizemore Group In Collaboration with Huntley Partners and Kimley-Horn and Associates 39
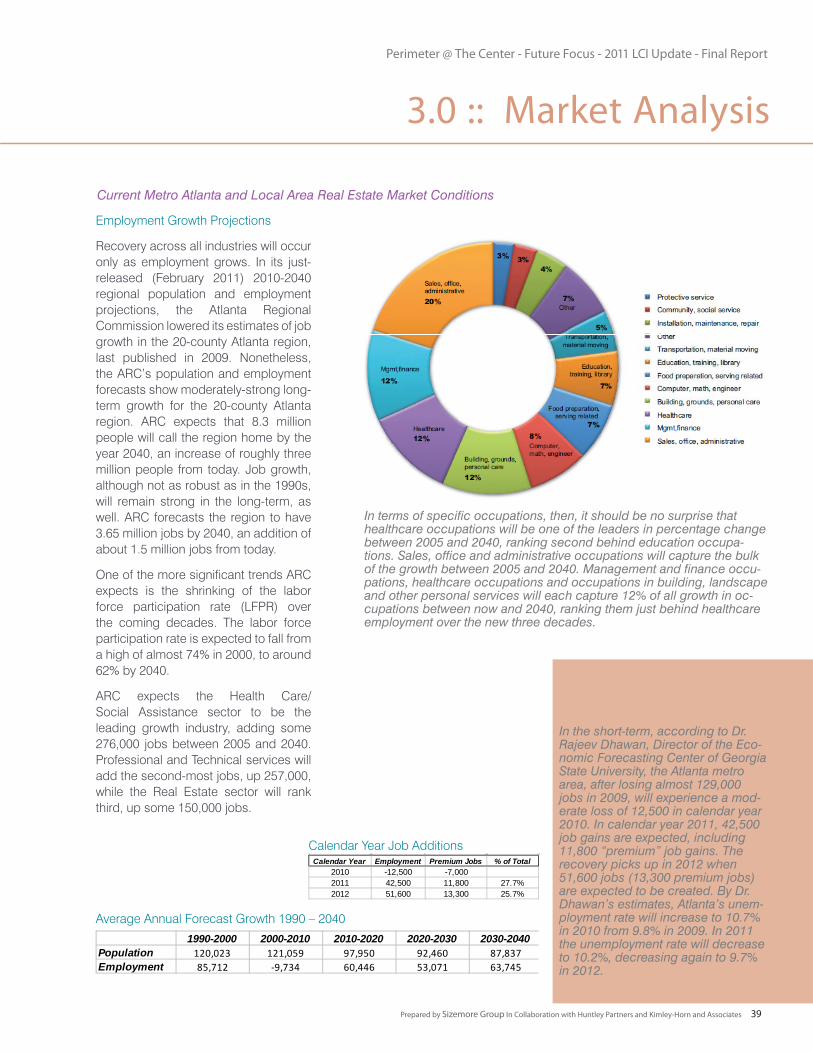
Employment Growth Projections
Recovery across all industries will occur only as employment grows. In its just-released (February 2011) 2010-2040 regional population and employment projections, the Atlanta Regional Commission lowered its estimates of job growth in the 20-county Atlanta region, last published in 2009. Nonetheless, the ARC’s population and employment forecasts show moderately-strong long-term growth for the 20-county Atlanta region. ARC expects that 8.3 million people will call the region home by the year 2040, an increase of roughly three million people from today. Job growth, although not as robust as in the 1990s, will remain strong in the long-term, as well. ARC forecasts the region to have 3.65 million jobs by 2040, an addition of about 1.5 million jobs from today.
One of the more significant trends ARC expects is the shrinking of the labor force participation rate (LFPR) over the coming decades. The labor force participation rate is expected to fall from a high of almost 74% in 2000, to around 62% by 2040.
ARC expects the Health Care/Social Assistance sector to be the leading growth industry, adding some 276,000 jobs between 2005 and 2040. Professional and Technical services will add the second-most jobs, up 257,000, while the Real Estate sector will rank third, up some 150,000 jobs.
Current Metro Atlanta and Local Area Real Estate Market Conditions
In terms of specific occupations, then, it should be no surprise that healthcare occupations will be one of the leaders in percentage change between 2005 and 2040, ranking second behind education occupa-tions. Sales, office and administrative occupations will capture the bulk of the growth between 2005 and 2040. Management and finance occu-pations, healthcare occupations and occupations in building, landscape and other personal services will each capture 12% of all growth in oc-cupations between now and 2040, ranking them just behind healthcare employment over the new three decades.
In the short-term, according to Dr. Rajeev Dhawan, Director of the Eco-nomic Forecasting Center of Georgia State University, the Atlanta metro area, after losing almost 129,000 jobs in 2009, will experience a mod-erate loss of 12,500 in calendar year 2010. In calendar year 2011, 42,500 job gains are expected, including 11,800 “premium” job gains. The recovery picks up in 2012 when 51,600 jobs (13,300 premium jobs) are expected to be created. By Dr. Dhawan’s estimates, Atlanta’s unem-ployment rate will increase to 10.7% in 2010 from 9.8% in 2009. In 2011 the unemployment rate will decrease to 10.2%, decreasing again to 9.7% in 2012.
3.0 :: Market Analysis
Calendar Year Employment Premium Jobs % of Total2010 -12,500 -7,0002011 42,500 11,800 27.7%2012 51,600 13,300 25.7%
1990-2000 2000-2010 2010-2020 2020-2030 2030-2040Population 120,023 121,059 97,950 92,460 87,837Employment 85,712 -9,734 60,446 53,071 63,745
Calendar Year Job Additions
Average Annual Forecast Growth 1990 – 2040
Perimeter @ The Center - Future Focus - 2011 LCI Update - Final Report
Prepared by Sizemore Group In Collaboration with Huntley Partners and Kimley-Horn and Associates40
Source: CoStar
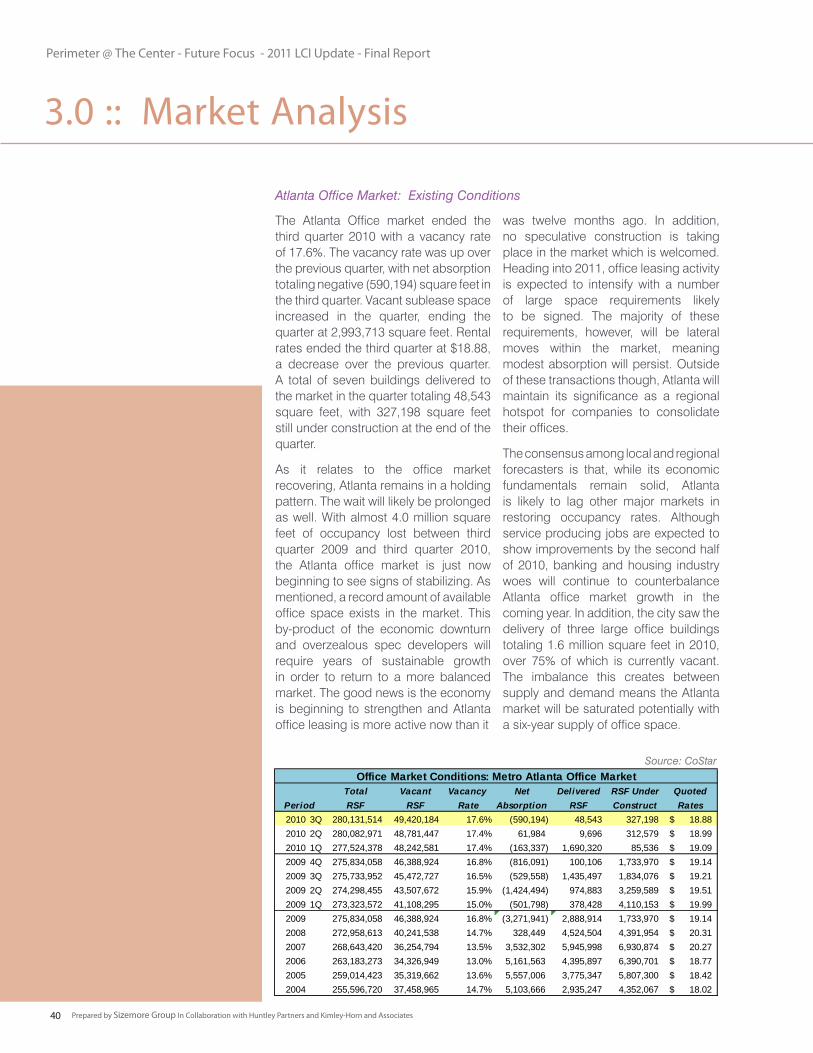
The Atlanta Office market ended the third quarter 2010 with a vacancy rate of 17.6%. The vacancy rate was up over the previous quarter, with net absorption totaling negative (590,194) square feet in the third quarter. Vacant sublease space increased in the quarter, ending the quarter at 2,993,713 square feet. Rental rates ended the third quarter at $18.88, a decrease over the previous quarter. A total of seven buildings delivered to the market in the quarter totaling 48,543 square feet, with 327,198 square feet still under construction at the end of the quarter.
As it relates to the office market recovering, Atlanta remains in a holding pattern. The wait will likely be prolonged as well. With almost 4.0 million square feet of occupancy lost between third quarter 2009 and third quarter 2010, the Atlanta office market is just now beginning to see signs of stabilizing. As mentioned, a record amount of available office space exists in the market. This by-product of the economic downturn and overzealous spec developers will require years of sustainable growth in order to return to a more balanced market. The good news is the economy is beginning to strengthen and Atlanta office leasing is more active now than it
was twelve months ago. In addition, no speculative construction is taking place in the market which is welcomed. Heading into 2011, office leasing activity is expected to intensify with a number of large space requirements likely to be signed. The majority of these requirements, however, will be lateral moves within the market, meaning modest absorption will persist. Outside of these transactions though, Atlanta will maintain its significance as a regional hotspot for companies to consolidate their offices.
The consensus among local and regional forecasters is that, while its economic fundamentals remain solid, Atlanta is likely to lag other major markets in restoring occupancy rates. Although service producing jobs are expected to show improvements by the second half of 2010, banking and housing industry woes will continue to counterbalance Atlanta office market growth in the coming year. In addition, the city saw the delivery of three large office buildings totaling 1.6 million square feet in 2010, over 75% of which is currently vacant. The imbalance this creates between supply and demand means the Atlanta market will be saturated potentially with a six-year supply of office space.
Atlanta Office Market: Existing Conditions
Total Vacant Vacancy Net Delivered RSF Under QuotedRSF RSF Rate Absorption RSF Construct Rates
2010 3Q 280,131,514 49,420,184 17.6% (590,194) 48,543 327,198 18.88$ 2010 2Q 280,082,971 48,781,447 17.4% 61,984 9,696 312,579 18.99$ 2010 1Q 277,524,378 48,242,581 17.4% (163,337) 1,690,320 85,536 19.09$ 2009 4Q 275,834,058 46,388,924 16.8% (816,091) 100,106 1,733,970 19.14$ 2009 3Q 275,733,952 45,472,727 16.5% (529,558) 1,435,497 1,834,076 19.21$ 2009 2Q 274,298,455 43,507,672 15.9% (1,424,494) 974,883 3,259,589 19.51$ 2009 1Q 273,323,572 41,108,295 15.0% (501,798) 378,428 4,110,153 19.99$ 2009 275,834,058 46,388,924 16.8% (3,271,941) 2,888,914 1,733,970 19.14$ 2008 272,958,613 40,241,538 14.7% 328,449 4,524,504 4,391,954 20.31$ 2007 268,643,420 36,254,794 13.5% 3,532,302 5,945,998 6,930,874 20.27$ 2006 263,183,273 34,326,949 13.0% 5,161,563 4,395,897 6,390,701 18.77$ 2005 259,014,423 35,319,662 13.6% 5,557,006 3,775,347 5,807,300 18.42$ 2004 255,596,720 37,458,965 14.7% 5,103,666 2,935,247 4,352,067 18.02$
Office Market Conditions: Metro Atlanta Office Market
Period
3.0 :: Market Analysis
Perimeter @ The Center - Future Focus - 2011 LCI Update - Final Report
Prepared by Sizemore Group In Collaboration with Huntley Partners and Kimley-Horn and Associates 41
Vacancy
Absorption
Construction
Rental Rates
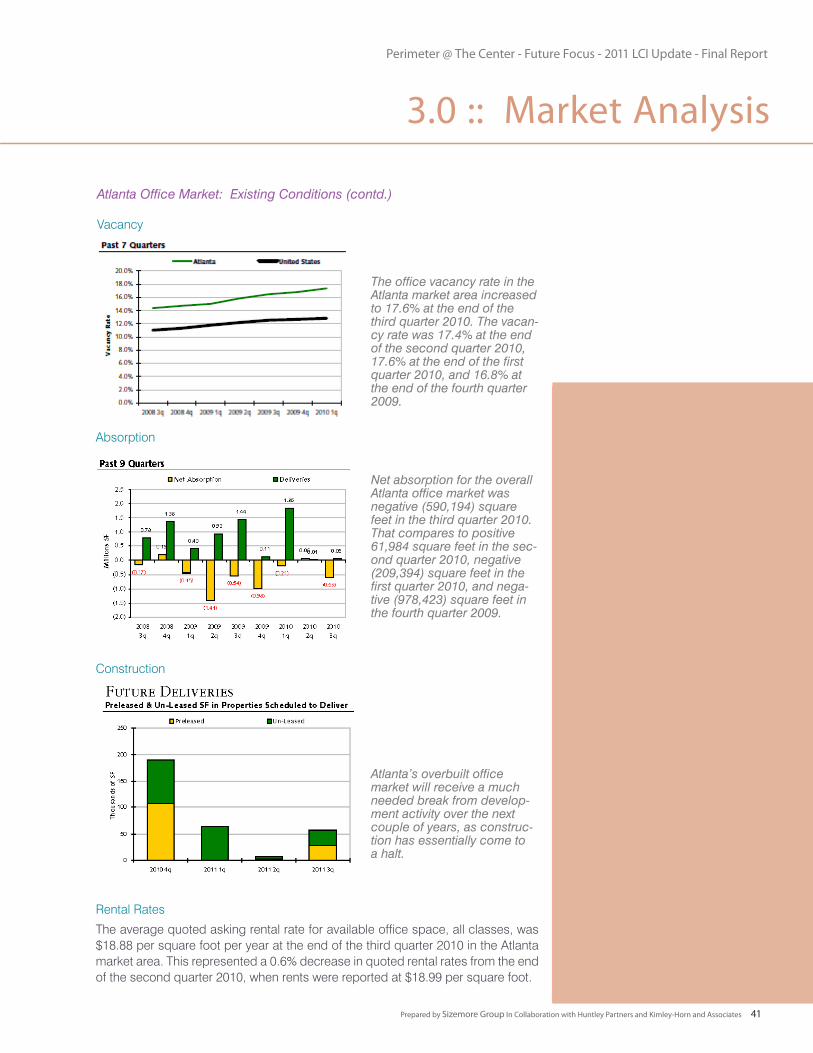
The office vacancy rate in the Atlanta market area increased to 17.6% at the end of the third quarter 2010. The vacan-cy rate was 17.4% at the end of the second quarter 2010, 17.6% at the end of the first quarter 2010, and 16.8% at the end of the fourth quarter 2009.
Net absorption for the overall Atlanta office market was negative (590,194) square feet in the third quarter 2010. That compares to positive 61,984 square feet in the sec-ond quarter 2010, negative (209,394) square feet in the first quarter 2010, and nega-tive (978,423) square feet in the fourth quarter 2009.
Atlanta’s overbuilt office market will receive a much needed break from develop-ment activity over the next couple of years, as construc-tion has essentially come to a halt.
Atlanta Office Market: Existing Conditions (contd.)
The average quoted asking rental rate for available office space, all classes, was $18.88 per square foot per year at the end of the third quarter 2010 in the Atlanta market area. This represented a 0.6% decrease in quoted rental rates from the end of the second quarter 2010, when rents were reported at $18.99 per square foot.
3.0 :: Market Analysis
Perimeter @ The Center - Future Focus - 2011 LCI Update - Final Report
Prepared by Sizemore Group In Collaboration with Huntley Partners and Kimley-Horn and Associates42
Central Perimeter Office Submarket: Existing Conditions
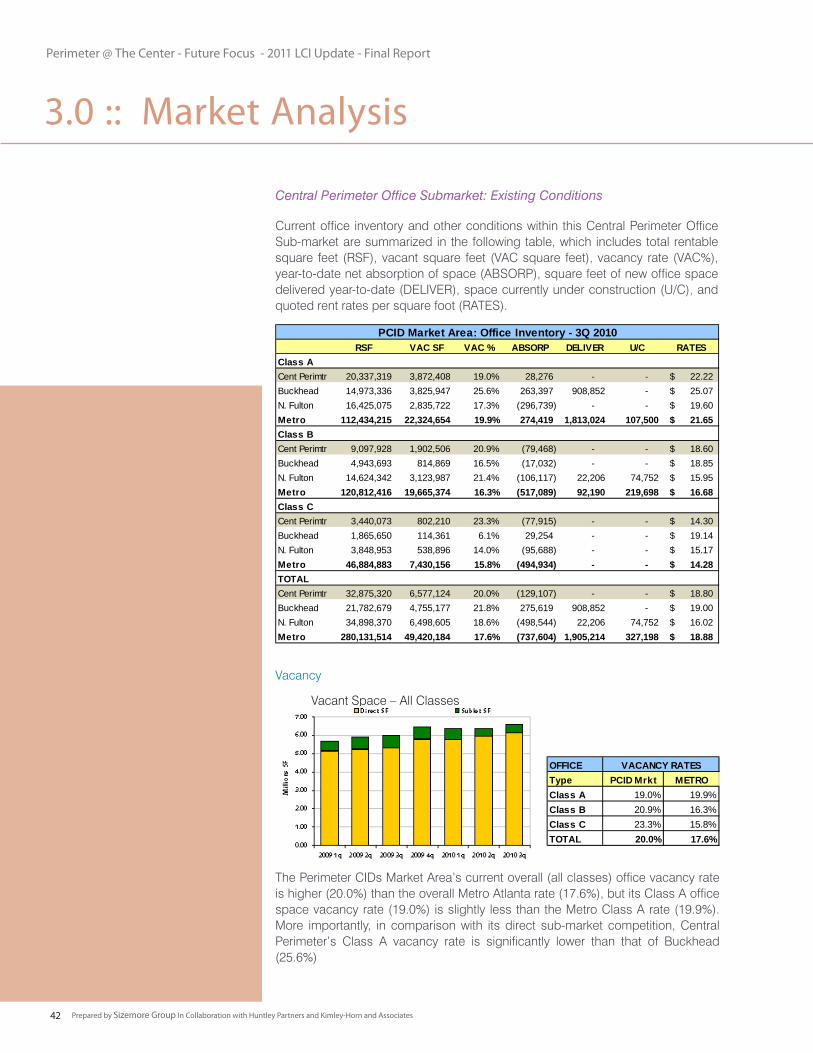
The Perimeter CIDs Market Area’s current overall (all classes) office vacancy rate is higher (20.0%) than the overall Metro Atlanta rate (17.6%), but its Class A office space vacancy rate (19.0%) is slightly less than the Metro Class A rate (19.9%). More importantly, in comparison with its direct sub-market competition, Central Perimeter’s Class A vacancy rate is significantly lower than that of Buckhead (25.6%)
Current office inventory and other conditions within this Central Perimeter Office Sub-market are summarized in the following table, which includes total rentable square feet (RSF), vacant square feet (VAC square feet), vacancy rate (VAC%), year-to-date net absorption of space (ABSORP), square feet of new office space delivered year-to-date (DELIVER), space currently under construction (U/C), and quoted rent rates per square foot (RATES).
Vacancy
Vacant Space – All Classes
OFFICEType PCID Mrkt METROClass A 19.0% 19.9%Class B 20.9% 16.3%Class C 23.3% 15.8%TOTAL 20.0% 17.6%
VACANCY RATES
3.0 :: Market Analysis
RSF VAC SF VAC % ABSORP DELIVER U/C RATES
Class A 164,169,945 32,858,731 Cent Perimtr 20,337,319 3,872,408 19.0% 28,276 - - 22.22$ Buckhead 14,973,336 3,825,947 25.6% 263,397 908,852 - 25.07$ N. Fulton 16,425,075 2,835,722 17.3% (296,739) - - 19.60$ Metro 112,434,215 22,324,654 19.9% 274,419 1,813,024 107,500 21.65$ Class B 149,478,379 Cent Perimtr 9,097,928 1,902,506 20.9% (79,468) - - 18.60$ Buckhead 4,943,693 814,869 16.5% (17,032) - - 18.85$ N. Fulton 14,624,342 3,123,987 21.4% (106,117) 22,206 74,752 15.95$ Metro 120,812,416 19,665,374 16.3% (517,089) 92,190 219,698 16.68$ Class C 515,283,811 Cent Perimtr 3,440,073 802,210 23.3% (77,915) - - 14.30$ Buckhead 1,865,650 114,361 6.1% 29,254 - - 19.14$ N. Fulton 3,848,953 538,896 14.0% (95,688) - - 15.17$ Metro 46,884,883 7,430,156 15.8% (494,934) - - 14.28$ TOTAL 369,687,883 Cent Perimtr 32,875,320 6,577,124 20.0% (129,107) - - 18.80$ Buckhead 21,782,679 4,755,177 21.8% 275,619 908,852 - 19.00$ N. Fulton 34,898,370 6,498,605 18.6% (498,544) 22,206 74,752 16.02$ Metro 280,131,514 49,420,184 17.6% (737,604) 1,905,214 327,198 18.88$
PCID Market Area: Office Inventory - 3Q 2010
Perimeter @ The Center - Future Focus - 2011 LCI Update - Final Report
Prepared by Sizemore Group In Collaboration with Huntley Partners and Kimley-Horn and Associates 43
Central Perimeter Office Sub-market: Existing Conditions (contd.)
Rental Rates
Deliveries, Absorption & Vacancy
Quoted Rental Rates
Absorption and Deliveries/Construction
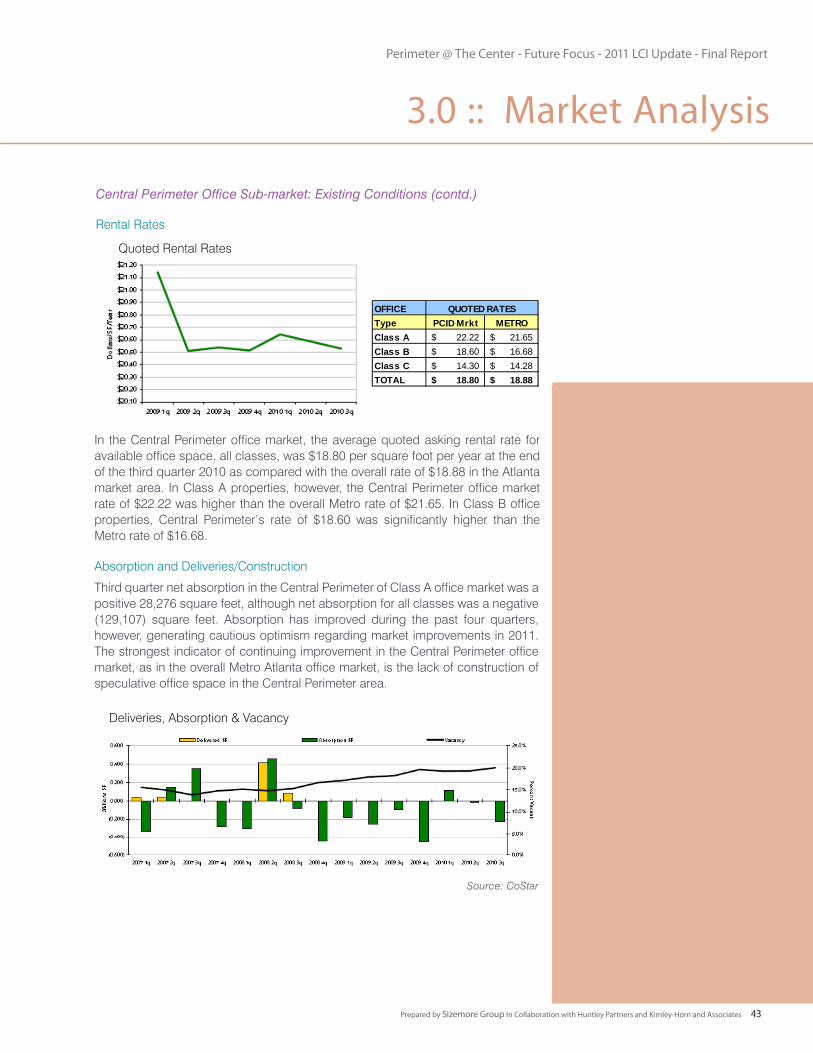
In the Central Perimeter office market, the average quoted asking rental rate for available office space, all classes, was $18.80 per square foot per year at the end of the third quarter 2010 as compared with the overall rate of $18.88 in the Atlanta market area. In Class A properties, however, the Central Perimeter office market rate of $22.22 was higher than the overall Metro rate of $21.65. In Class B office properties, Central Perimeter’s rate of $18.60 was significantly higher than the Metro rate of $16.68.
Third quarter net absorption in the Central Perimeter of Class A office market was a positive 28,276 square feet, although net absorption for all classes was a negative (129,107) square feet. Absorption has improved during the past four quarters, however, generating cautious optimism regarding market improvements in 2011. The strongest indicator of continuing improvement in the Central Perimeter office market, as in the overall Metro Atlanta office market, is the lack of construction of speculative office space in the Central Perimeter area.
OFFICEType PCID Mrkt METROClass A 22.22$ 21.65$ Class B 18.60$ 16.68$ Class C 14.30$ 14.28$ TOTAL 18.80$ 18.88$
QUOTED RATES
Source: CoStar
3.0 :: Market Analysis
Perimeter @ The Center - Future Focus - 2011 LCI Update - Final Report
Prepared by Sizemore Group In Collaboration with Huntley Partners and Kimley-Horn and Associates44
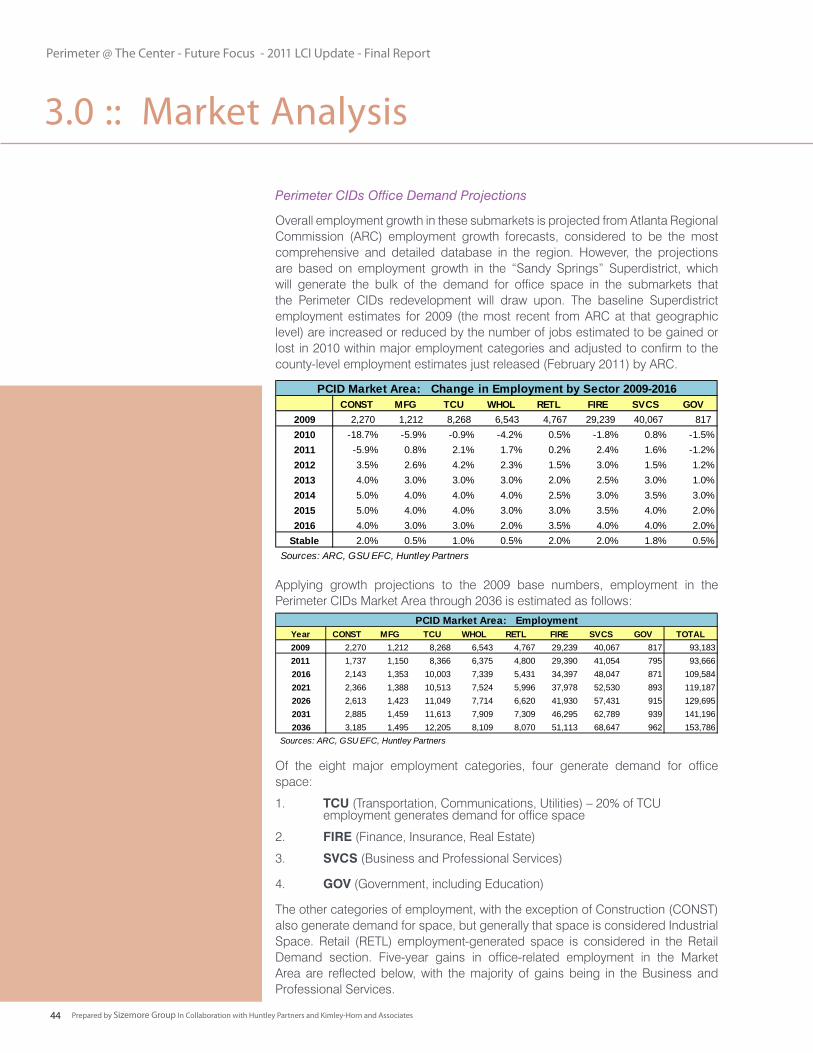
Perimeter CIDs Office Demand Projections
Overall employment growth in these submarkets is projected from Atlanta Regional Commission (ARC) employment growth forecasts, considered to be the most comprehensive and detailed database in the region. However, the projections are based on employment growth in the “Sandy Springs” Superdistrict, which will generate the bulk of the demand for office space in the submarkets that the Perimeter CIDs redevelopment will draw upon. The baseline Superdistrict employment estimates for 2009 (the most recent from ARC at that geographic level) are increased or reduced by the number of jobs estimated to be gained or lost in 2010 within major employment categories and adjusted to confirm to the county-level employment estimates just released (February 2011) by ARC.
Applying growth projections to the 2009 base numbers, employment in the Perimeter CIDs Market Area through 2036 is estimated as follows:
Of the eight major employment categories, four generate demand for office space:
1. TCU (Transportation, Communications, Utilities) – 20% of TCU employment generates demand for office space
2. FIRE (Finance, Insurance, Real Estate)
3. SVCS (Business and Professional Services)
4. GOV (Government, including Education)
The other categories of employment, with the exception of Construction (CONST) also generate demand for space, but generally that space is considered Industrial Space. Retail (RETL) employment-generated space is considered in the Retail Demand section. Five-year gains in office-related employment in the Market Area are reflected below, with the majority of gains being in the Business and Professional Services.
3.0 :: Market Analysis
CONST MFG TCU WHOL RETL FIRE SVCS GOV
2009 2,270 1,212 8,268 6,543 4,767 29,239 40,067 817 2010 -18.7% -5.9% -0.9% -4.2% 0.5% -1.8% 0.8% -1.5%2011 -5.9% 0.8% 2.1% 1.7% 0.2% 2.4% 1.6% -1.2%2012 3.5% 2.6% 4.2% 2.3% 1.5% 3.0% 1.5% 1.2%2013 4.0% 3.0% 3.0% 3.0% 2.0% 2.5% 3.0% 1.0%2014 5.0% 4.0% 4.0% 4.0% 2.5% 3.0% 3.5% 3.0%2015 5.0% 4.0% 4.0% 3.0% 3.0% 3.5% 4.0% 2.0%2016 4.0% 3.0% 3.0% 2.0% 3.5% 4.0% 4.0% 2.0%
Stable 2.0% 0.5% 1.0% 0.5% 2.0% 2.0% 1.8% 0.5% Sources: ARC, GSU EFC, Huntley Partners
PCID Market Area: Change in Employment by Sector 2009-2016
Year CONST MFG TCU WHOL RETL FIRE SVCS GOV TOTAL2009 2,270 1,212 8,268 6,543 4,767 29,239 40,067 817 93,1832011 1,737 1,150 8,366 6,375 4,800 29,390 41,054 795 93,6662016 2,143 1,353 10,003 7,339 5,431 34,397 48,047 871 109,5842021 2,366 1,388 10,513 7,524 5,996 37,978 52,530 893 119,1872026 2,613 1,423 11,049 7,714 6,620 41,930 57,431 915 129,6952031 2,885 1,459 11,613 7,909 7,309 46,295 62,789 939 141,1962036 3,185 1,495 12,205 8,109 8,070 51,113 68,647 962 153,786
Sources: ARC, GSU EFC, Huntley Partners
PCID Market Area: Employment
Perimeter @ The Center - Future Focus - 2011 LCI Update - Final Report
Prepared by Sizemore Group In Collaboration with Huntley Partners and Kimley-Horn and Associates 45
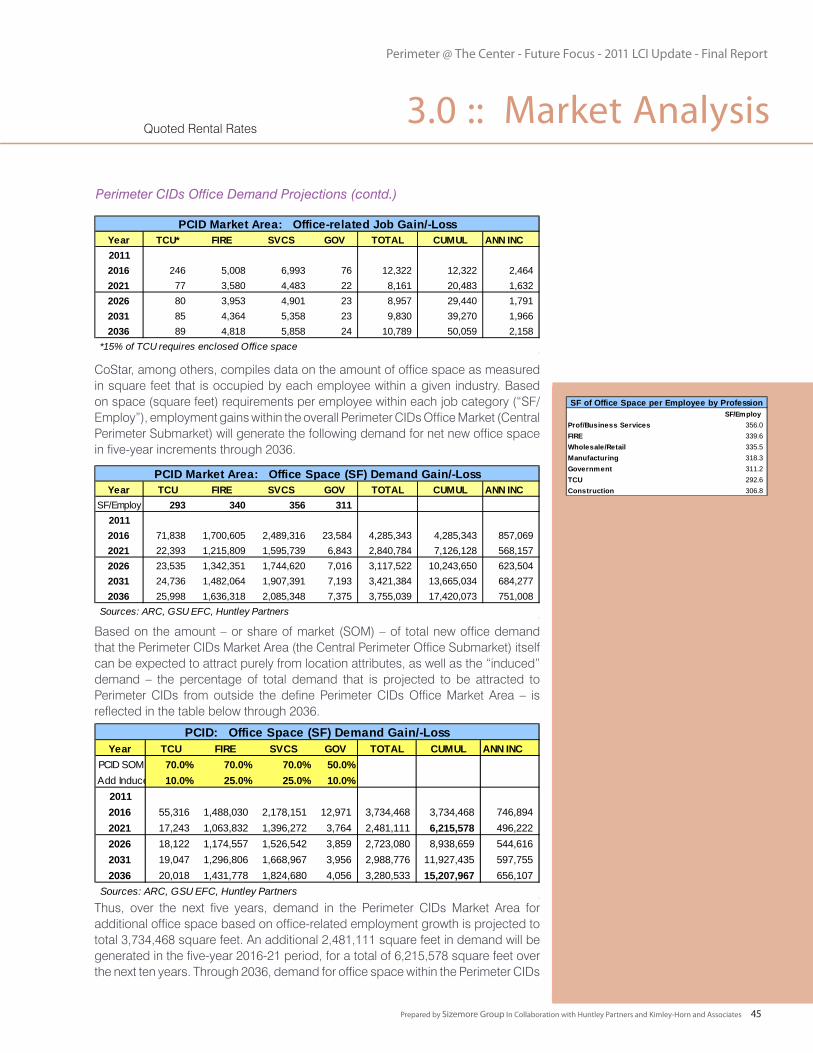
Perimeter CIDs Office Demand Projections (contd.)
CoStar, among others, compiles data on the amount of office space as measured in square feet that is occupied by each employee within a given industry. Based on space (square feet) requirements per employee within each job category (“SF/Employ”), employment gains within the overall Perimeter CIDs Office Market (Central Perimeter Submarket) will generate the following demand for net new office space in five-year increments through 2036.
Based on the amount – or share of market (SOM) – of total new office demand that the Perimeter CIDs Market Area (the Central Perimeter Office Submarket) itself can be expected to attract purely from location attributes, as well as the “induced” demand – the percentage of total demand that is projected to be attracted to Perimeter CIDs from outside the define Perimeter CIDs Office Market Area – is reflected in the table below through 2036.
Thus, over the next five years, demand in the Perimeter CIDs Market Area for additional office space based on office-related employment growth is projected to total 3,734,468 square feet. An additional 2,481,111 square feet in demand will be generated in the five-year 2016-21 period, for a total of 6,215,578 square feet over the next ten years. Through 2036, demand for office space within the Perimeter CIDs
Quoted Rental Rates3.0 :: Market Analysis
Year TCU* FIRE SVCS GOV TOTAL CUMUL ANN INC20112016 246 5,008 6,993 76 12,322 12,322 2,464 2021 77 3,580 4,483 22 8,161 20,483 1,632 2026 80 3,953 4,901 23 8,957 29,440 1,791 2031 85 4,364 5,358 23 9,830 39,270 1,966 2036 89 4,818 5,858 24 10,789 50,059 2,158
*15% of TCU requires enclosed Office space
PCID Market Area: Office-related Job Gain/-Loss
SF/Employ
Prof/Business Services 356.0 FIRE 339.6 Wholesale/Retail 335.5 Manufacturing 318.3 Government 311.2 TCU 292.6 Construction 306.8
SF of Office Space per Employee by Profession
Year TCU FIRE SVCS GOV TOTAL CUMUL ANN INC
SF/Employ 293 340 356 311 20112016 71,838 1,700,605 2,489,316 23,584 4,285,343 4,285,343 857,069 2021 22,393 1,215,809 1,595,739 6,843 2,840,784 7,126,128 568,157 2026 23,535 1,342,351 1,744,620 7,016 3,117,522 10,243,650 623,504 2031 24,736 1,482,064 1,907,391 7,193 3,421,384 13,665,034 684,277 2036 25,998 1,636,318 2,085,348 7,375 3,755,039 17,420,073 751,008
Sources: ARC, GSU EFC, Huntley Partners
PCID Market Area: Office Space (SF) Demand Gain/-Loss
Year TCU FIRE SVCS GOV TOTAL CUMUL ANN INC
PCID SOM 70.0% 70.0% 70.0% 50.0%Add Induced 10.0% 25.0% 25.0% 10.0%
20112016 55,316 1,488,030 2,178,151 12,971 3,734,468 3,734,468 746,894 2021 17,243 1,063,832 1,396,272 3,764 2,481,111 6,215,578 496,222 2026 18,122 1,174,557 1,526,542 3,859 2,723,080 8,938,659 544,616 2031 19,047 1,296,806 1,668,967 3,956 2,988,776 11,927,435 597,755 2036 20,018 1,431,778 1,824,680 4,056 3,280,533 15,207,967 656,107
Sources: ARC, GSU EFC, Huntley Partners
PCID: Office Space (SF) Demand Gain/-Loss
Perimeter @ The Center - Future Focus - 2011 LCI Update - Final Report
Prepared by Sizemore Group In Collaboration with Huntley Partners and Kimley-Horn and Associates46
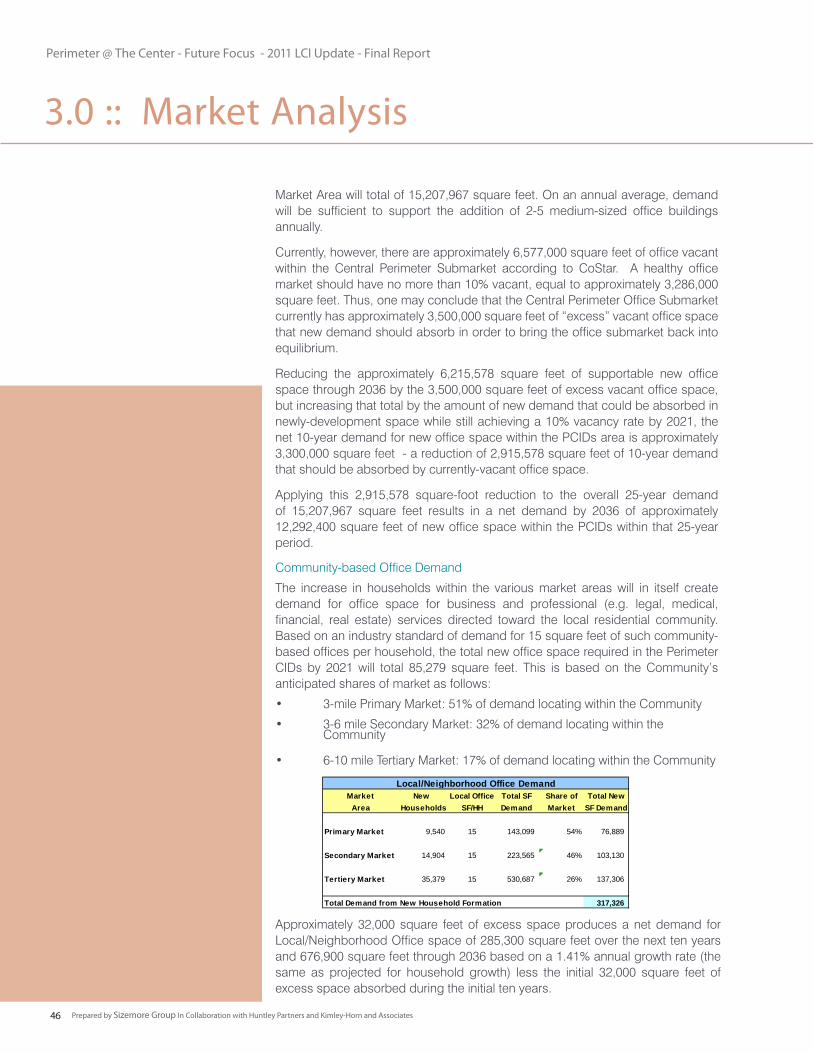
The increase in households within the various market areas will in itself create demand for office space for business and professional (e.g. legal, medical, financial, real estate) services directed toward the local residential community. Based on an industry standard of demand for 15 square feet of such community-based offices per household, the total new office space required in the Perimeter CIDs by 2021 will total 85,279 square feet. This is based on the Community’s anticipated shares of market as follows:
• 3-mile Primary Market: 51% of demand locating within the Community
• 3-6 mile Secondary Market: 32% of demand locating within the Community
• 6-10 mile Tertiary Market: 17% of demand locating within the Community
Market Area will total of 15,207,967 square feet. On an annual average, demand will be sufficient to support the addition of 2-5 medium-sized office buildings annually.
Currently, however, there are approximately 6,577,000 square feet of office vacant within the Central Perimeter Submarket according to CoStar. A healthy office market should have no more than 10% vacant, equal to approximately 3,286,000 square feet. Thus, one may conclude that the Central Perimeter Office Submarket currently has approximately 3,500,000 square feet of “excess” vacant office space that new demand should absorb in order to bring the office submarket back into equilibrium.
Reducing the approximately 6,215,578 square feet of supportable new office space through 2036 by the 3,500,000 square feet of excess vacant office space, but increasing that total by the amount of new demand that could be absorbed in newly-development space while still achieving a 10% vacancy rate by 2021, the net 10-year demand for new office space within the PCIDs area is approximately 3,300,000 square feet - a reduction of 2,915,578 square feet of 10-year demand that should be absorbed by currently-vacant office space.
Applying this 2,915,578 square-foot reduction to the overall 25-year demand of 15,207,967 square feet results in a net demand by 2036 of approximately 12,292,400 square feet of new office space within the PCIDs within that 25-year period.
Community-based Office Demand
Market New Local Office Total SF Share of Total New
Area Households SF/HH Demand Market SF Demand
Primary Market 9,540 15 143,099 54% 76,889
Secondary Market 14,904 15 223,565 46% 103,130
Tertiery Market 35,379 15 530,687 26% 137,306
Total Demand from New Household Formation 317,326
Local/Neighborhood Office Demand
3.0 :: Market Analysis
Approximately 32,000 square feet of excess space produces a net demand for Local/Neighborhood Office space of 285,300 square feet over the next ten years and 676,900 square feet through 2036 based on a 1.41% annual growth rate (the same as projected for household growth) less the initial 32,000 square feet of excess space absorbed during the initial ten years.
Perimeter @ The Center - Future Focus - 2011 LCI Update - Final Report
Prepared by Sizemore Group In Collaboration with Huntley Partners and Kimley-Horn and Associates 47
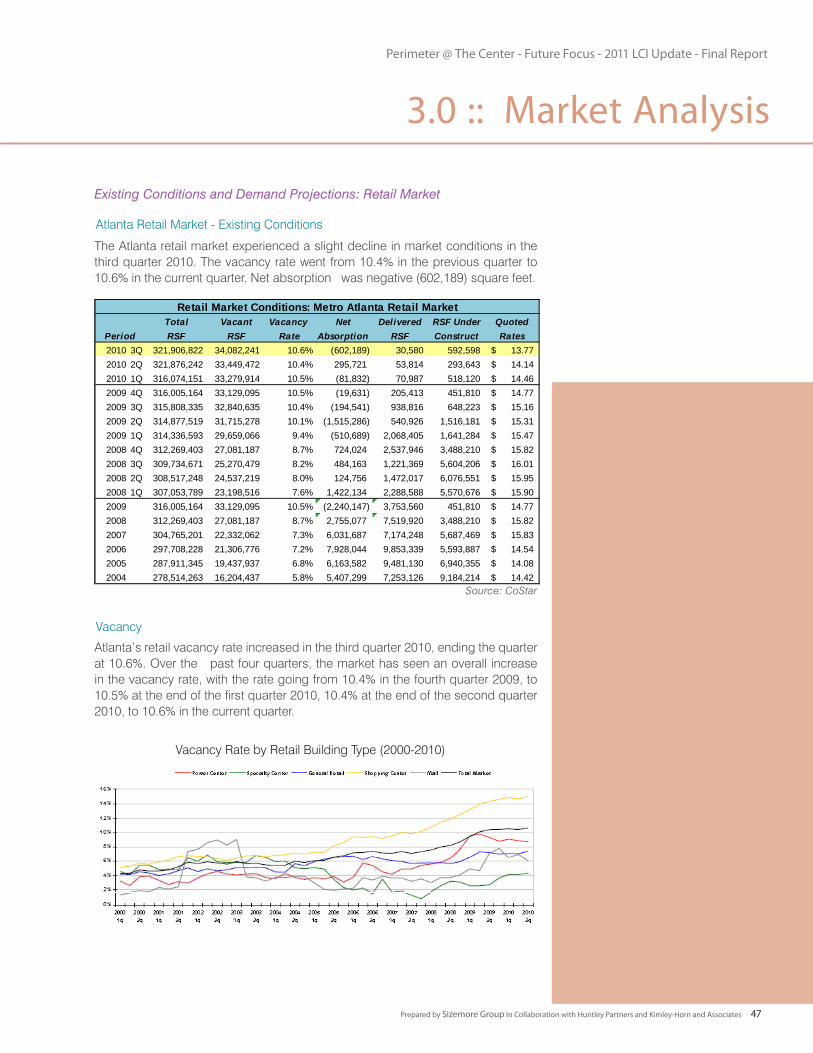
The Atlanta retail market experienced a slight decline in market conditions in the third quarter 2010. The vacancy rate went from 10.4% in the previous quarter to 10.6% in the current quarter. Net absorption was negative (602,189) square feet.
Atlanta’s retail vacancy rate increased in the third quarter 2010, ending the quarter at 10.6%. Over the past four quarters, the market has seen an overall increase in the vacancy rate, with the rate going from 10.4% in the fourth quarter 2009, to 10.5% at the end of the first quarter 2010, 10.4% at the end of the second quarter 2010, to 10.6% in the current quarter.
Existing Conditions and Demand Projections: Retail Market
Atlanta Retail Market - Existing Conditions
Vacancy Rate by Retail Building Type (2000-2010)
Vacancy
Total Vacant Vacancy Net Delivered RSF Under QuotedRSF RSF Rate Absorption RSF Construct Rates
2010 3Q 321,906,822 34,082,241 10.6% (602,189) 30,580 592,598 13.77$ 2010 2Q 321,876,242 33,449,472 10.4% 295,721 53,814 293,643 14.14$ 2010 1Q 316,074,151 33,279,914 10.5% (81,832) 70,987 518,120 14.46$ 2009 4Q 316,005,164 33,129,095 10.5% (19,631) 205,413 451,810 14.77$ 2009 3Q 315,808,335 32,840,635 10.4% (194,541) 938,816 648,223 15.16$ 2009 2Q 314,877,519 31,715,278 10.1% (1,515,286) 540,926 1,516,181 15.31$ 2009 1Q 314,336,593 29,659,066 9.4% (510,689) 2,068,405 1,641,284 15.47$ 2008 4Q 312,269,403 27,081,187 8.7% 724,024 2,537,946 3,488,210 15.82$ 2008 3Q 309,734,671 25,270,479 8.2% 484,163 1,221,369 5,604,206 16.01$ 2008 2Q 308,517,248 24,537,219 8.0% 124,756 1,472,017 6,076,551 15.95$ 2008 1Q 307,053,789 23,198,516 7.6% 1,422,134 2,288,588 5,570,676 15.90$ 2009 316,005,164 33,129,095 10.5% (2,240,147) 3,753,560 451,810 14.77$ 2008 312,269,403 27,081,187 8.7% 2,755,077 7,519,920 3,488,210 15.82$ 2007 304,765,201 22,332,062 7.3% 6,031,687 7,174,248 5,687,469 15.83$ 2006 297,708,228 21,306,776 7.2% 7,928,044 9,853,339 5,593,887 14.54$ 2005 287,911,345 19,437,937 6.8% 6,163,582 9,481,130 6,940,355 14.08$ 2004 278,514,263 16,204,437 5.8% 5,407,299 7,253,126 9,184,214 14.42$
Retail Market Conditions: Metro Atlanta Retail Market
Period
Source: CoStar
3.0 :: Market Analysis
Perimeter @ The Center - Future Focus - 2011 LCI Update - Final Report
Prepared by Sizemore Group In Collaboration with Huntley Partners and Kimley-Horn and Associates48
Absorption
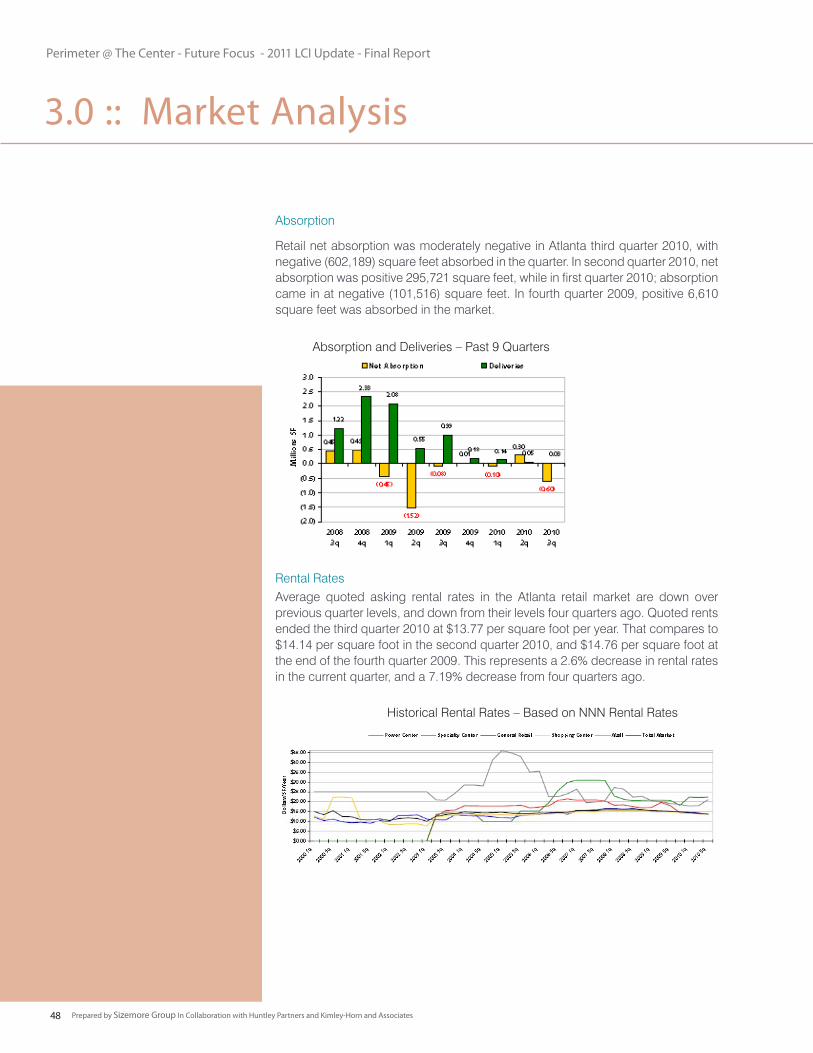
Rental Rates
Historical Rental Rates – Based on NNN Rental Rates
Absorption and Deliveries – Past 9 Quarters
Retail net absorption was moderately negative in Atlanta third quarter 2010, with negative (602,189) square feet absorbed in the quarter. In second quarter 2010, net absorption was positive 295,721 square feet, while in first quarter 2010; absorption came in at negative (101,516) square feet. In fourth quarter 2009, positive 6,610 square feet was absorbed in the market.
Average quoted asking rental rates in the Atlanta retail market are down over previous quarter levels, and down from their levels four quarters ago. Quoted rents ended the third quarter 2010 at $13.77 per square foot per year. That compares to $14.14 per square foot in the second quarter 2010, and $14.76 per square foot at the end of the fourth quarter 2009. This represents a 2.6% decrease in rental rates in the current quarter, and a 7.19% decrease from four quarters ago.
3.0 :: Market Analysis
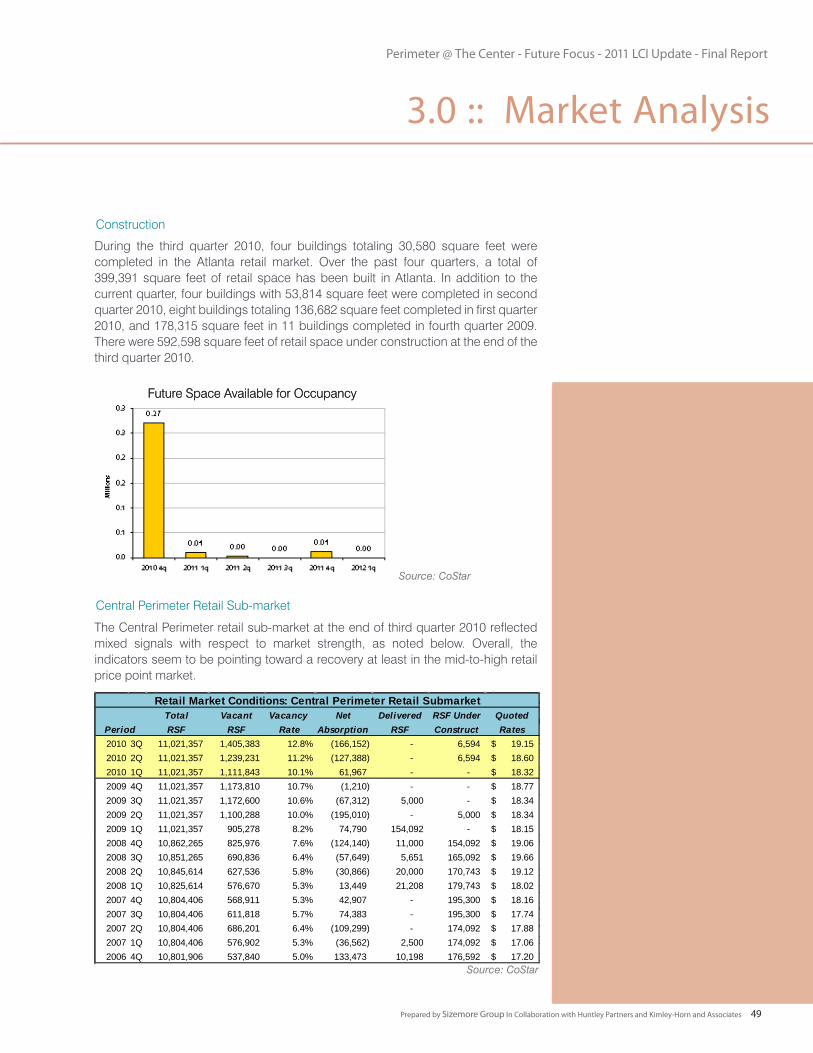
Perimeter @ The Center - Future Focus - 2011 LCI Update - Final Report
Prepared by Sizemore Group In Collaboration with Huntley Partners and Kimley-Horn and Associates 49
During the third quarter 2010, four buildings totaling 30,580 square feet were completed in the Atlanta retail market. Over the past four quarters, a total of 399,391 square feet of retail space has been built in Atlanta. In addition to the current quarter, four buildings with 53,814 square feet were completed in second quarter 2010, eight buildings totaling 136,682 square feet completed in first quarter 2010, and 178,315 square feet in 11 buildings completed in fourth quarter 2009. There were 592,598 square feet of retail space under construction at the end of the third quarter 2010.
The Central Perimeter retail sub-market at the end of third quarter 2010 reflected mixed signals with respect to market strength, as noted below. Overall, the indicators seem to be pointing toward a recovery at least in the mid-to-high retail price point market.
Construction
Vacancy Rate by Retail Building Type (2000-2010)
Future Space Available for Occupancy
Central Perimeter Retail Sub-market
Total Vacant Vacancy Net Delivered RSF Under QuotedRSF RSF Rate Absorption RSF Construct Rates
2010 3Q 11,021,357 1,405,383 12.8% (166,152) - 6,594 19.15$ 2010 2Q 11,021,357 1,239,231 11.2% (127,388) - 6,594 18.60$ 2010 1Q 11,021,357 1,111,843 10.1% 61,967 - - 18.32$ 2009 4Q 11,021,357 1,173,810 10.7% (1,210) - - 18.77$ 2009 3Q 11,021,357 1,172,600 10.6% (67,312) 5,000 - 18.34$ 2009 2Q 11,021,357 1,100,288 10.0% (195,010) - 5,000 18.34$ 2009 1Q 11,021,357 905,278 8.2% 74,790 154,092 - 18.15$ 2008 4Q 10,862,265 825,976 7.6% (124,140) 11,000 154,092 19.06$ 2008 3Q 10,851,265 690,836 6.4% (57,649) 5,651 165,092 19.66$ 2008 2Q 10,845,614 627,536 5.8% (30,866) 20,000 170,743 19.12$ 2008 1Q 10,825,614 576,670 5.3% 13,449 21,208 179,743 18.02$ 2007 4Q 10,804,406 568,911 5.3% 42,907 - 195,300 18.16$ 2007 3Q 10,804,406 611,818 5.7% 74,383 - 195,300 17.74$ 2007 2Q 10,804,406 686,201 6.4% (109,299) - 174,092 17.88$ 2007 1Q 10,804,406 576,902 5.3% (36,562) 2,500 174,092 17.06$ 2006 4Q 10,801,906 537,840 5.0% 133,473 10,198 176,592 17.20$
Period
Retail Market Conditions: Central Perimeter Retail Submarket
Vacancy Rate by Retail Building Type (2000-2010)
Future Space Available for Occupancy
Total Vacant Vacancy Net Delivered RSF Under QuotedRSF RSF Rate Absorption RSF Construct Rates
2010 3Q 11,021,357 1,405,383 12.8% (166,152) - 6,594 19.15$ 2010 2Q 11,021,357 1,239,231 11.2% (127,388) - 6,594 18.60$ 2010 1Q 11,021,357 1,111,843 10.1% 61,967 - - 18.32$ 2009 4Q 11,021,357 1,173,810 10.7% (1,210) - - 18.77$ 2009 3Q 11,021,357 1,172,600 10.6% (67,312) 5,000 - 18.34$ 2009 2Q 11,021,357 1,100,288 10.0% (195,010) - 5,000 18.34$ 2009 1Q 11,021,357 905,278 8.2% 74,790 154,092 - 18.15$ 2008 4Q 10,862,265 825,976 7.6% (124,140) 11,000 154,092 19.06$ 2008 3Q 10,851,265 690,836 6.4% (57,649) 5,651 165,092 19.66$ 2008 2Q 10,845,614 627,536 5.8% (30,866) 20,000 170,743 19.12$ 2008 1Q 10,825,614 576,670 5.3% 13,449 21,208 179,743 18.02$ 2007 4Q 10,804,406 568,911 5.3% 42,907 - 195,300 18.16$ 2007 3Q 10,804,406 611,818 5.7% 74,383 - 195,300 17.74$ 2007 2Q 10,804,406 686,201 6.4% (109,299) - 174,092 17.88$ 2007 1Q 10,804,406 576,902 5.3% (36,562) 2,500 174,092 17.06$ 2006 4Q 10,801,906 537,840 5.0% 133,473 10,198 176,592 17.20$
Period
Retail Market Conditions: Central Perimeter Retail Submarket
Source: CoStar
Source: CoStar
3.0 :: Market Analysis
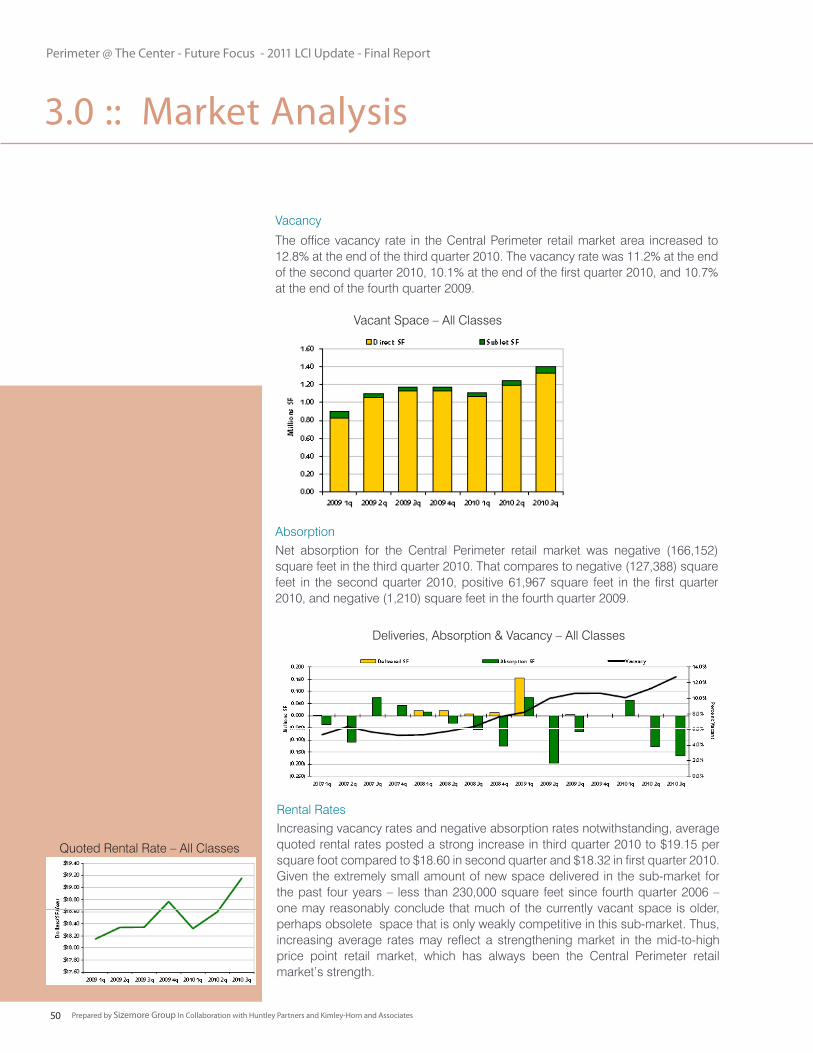
Perimeter @ The Center - Future Focus - 2011 LCI Update - Final Report
Prepared by Sizemore Group In Collaboration with Huntley Partners and Kimley-Horn and Associates50
Vacancy
Absorption
Rental Rates
Deliveries, Absorption & Vacancy – All Classes
Vacant Space – All Classes
The office vacancy rate in the Central Perimeter retail market area increased to 12.8% at the end of the third quarter 2010. The vacancy rate was 11.2% at the end of the second quarter 2010, 10.1% at the end of the first quarter 2010, and 10.7% at the end of the fourth quarter 2009.
Net absorption for the Central Perimeter retail market was negative (166,152) square feet in the third quarter 2010. That compares to negative (127,388) square feet in the second quarter 2010, positive 61,967 square feet in the first quarter 2010, and negative (1,210) square feet in the fourth quarter 2009.
Increasing vacancy rates and negative absorption rates notwithstanding, average quoted rental rates posted a strong increase in third quarter 2010 to $19.15 per square foot compared to $18.60 in second quarter and $18.32 in first quarter 2010. Given the extremely small amount of new space delivered in the sub-market for the past four years – less than 230,000 square feet since fourth quarter 2006 – one may reasonably conclude that much of the currently vacant space is older, perhaps obsolete space that is only weakly competitive in this sub-market. Thus, increasing average rates may reflect a strengthening market in the mid-to-high price point retail market, which has always been the Central Perimeter retail market’s strength.
Quoted Rental Rate – All Classes
3.0 :: Market Analysis
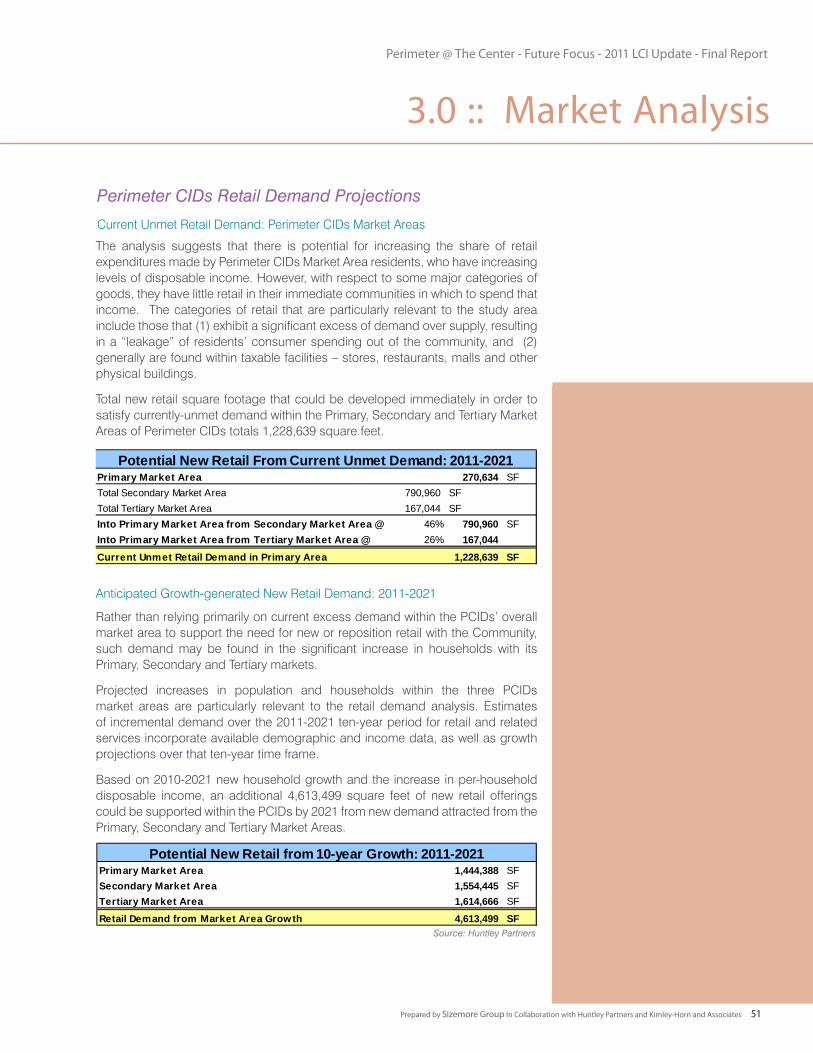
Perimeter @ The Center - Future Focus - 2011 LCI Update - Final Report
Prepared by Sizemore Group In Collaboration with Huntley Partners and Kimley-Horn and Associates 51
The analysis suggests that there is potential for increasing the share of retail expenditures made by Perimeter CIDs Market Area residents, who have increasing levels of disposable income. However, with respect to some major categories of goods, they have little retail in their immediate communities in which to spend that income. The categories of retail that are particularly relevant to the study area include those that (1) exhibit a significant excess of demand over supply, resulting in a “leakage” of residents’ consumer spending out of the community, and (2) generally are found within taxable facilities – stores, restaurants, malls and other physical buildings.
Total new retail square footage that could be developed immediately in order to satisfy currently-unmet demand within the Primary, Secondary and Tertiary Market Areas of Perimeter CIDs totals 1,228,639 square feet.
Rather than relying primarily on current excess demand within the PCIDs’ overall market area to support the need for new or reposition retail with the Community, such demand may be found in the significant increase in households with its Primary, Secondary and Tertiary markets.
Projected increases in population and households within the three PCIDs market areas are particularly relevant to the retail demand analysis. Estimates of incremental demand over the 2011-2021 ten-year period for retail and related services incorporate available demographic and income data, as well as growth projections over that ten-year time frame.
Based on 2010-2021 new household growth and the increase in per-household disposable income, an additional 4,613,499 square feet of new retail offerings could be supported within the PCIDs by 2021 from new demand attracted from the Primary, Secondary and Tertiary Market Areas.
Perimeter CIDs Retail Demand Projections
Current Unmet Retail Demand: Perimeter CIDs Market Areas
Anticipated Growth-generated New Retail Demand: 2011-2021
Source: Huntley Partners
Primary Market Area 270,634 SFTotal Secondary Market Area 790,960 SFTotal Tertiary Market Area 167,044 SFInto Primary Market Area from Secondary Market Area @ 46% 790,960 SFInto Primary Market Area from Tertiary Market Area @ 26% 167,044 Current Unmet Retail Demand in Primary Area 1,228,639 SF
Potential New Retail From Current Unmet Demand: 2011-2021
Primary Market Area 1,444,388 SFSecondary Market Area 1,554,445 SFTertiary Market Area 1,614,666 SF
Retail Demand from Market Area Growth 4,613,499 SF
Potential New Retail from 10-year Growth: 2011-2021
3.0 :: Market Analysis
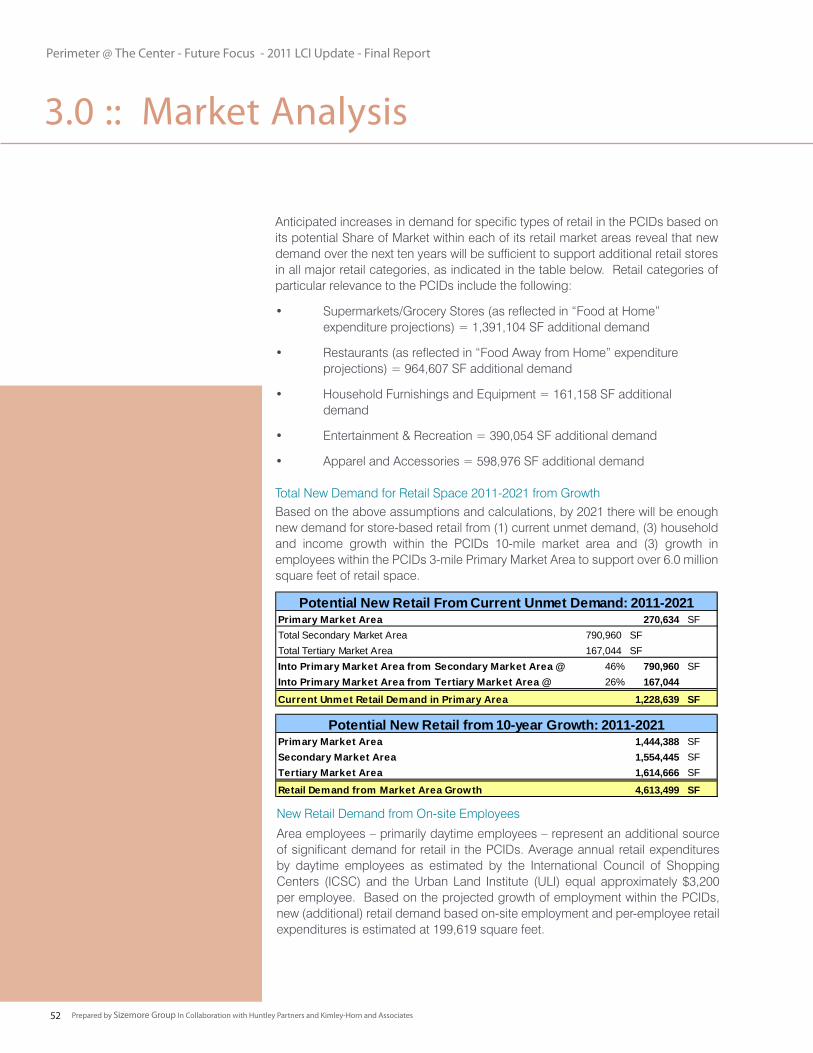
Perimeter @ The Center - Future Focus - 2011 LCI Update - Final Report
Prepared by Sizemore Group In Collaboration with Huntley Partners and Kimley-Horn and Associates52
Total New Demand for Retail Space 2011-2021 from Growth
New Retail Demand from On-site Employees
Anticipated increases in demand for specific types of retail in the PCIDs based on its potential Share of Market within each of its retail market areas reveal that new demand over the next ten years will be sufficient to support additional retail stores in all major retail categories, as indicated in the table below. Retail categories of particular relevance to the PCIDs include the following:
• Supermarkets/Grocery Stores (as reflected in “Food at Home” expenditure projections) = 1,391,104 SF additional demand
• Restaurants (as reflected in “Food Away from Home” expenditure projections) = 964,607 SF additional demand
• Household Furnishings and Equipment = 161,158 SF additional demand
• Entertainment & Recreation = 390,054 SF additional demand
• Apparel and Accessories = 598,976 SF additional demand
Based on the above assumptions and calculations, by 2021 there will be enough new demand for store-based retail from (1) current unmet demand, (3) household and income growth within the PCIDs 10-mile market area and (3) growth in employees within the PCIDs 3-mile Primary Market Area to support over 6.0 million square feet of retail space.
Area employees – primarily daytime employees – represent an additional source of significant demand for retail in the PCIDs. Average annual retail expenditures by daytime employees as estimated by the International Council of Shopping Centers (ICSC) and the Urban Land Institute (ULI) equal approximately $3,200 per employee. Based on the projected growth of employment within the PCIDs, new (additional) retail demand based on-site employment and per-employee retail expenditures is estimated at 199,619 square feet.
Primary Market Area 270,634 SFTotal Secondary Market Area 790,960 SFTotal Tertiary Market Area 167,044 SFInto Primary Market Area from Secondary Market Area @ 46% 790,960 SFInto Primary Market Area from Tertiary Market Area @ 26% 167,044 Current Unmet Retail Demand in Primary Area 1,228,639 SF
Potential New Retail From Current Unmet Demand: 2011-2021
Primary Market Area 1,444,388 SFSecondary Market Area 1,554,445 SFTertiary Market Area 1,614,666 SF
Retail Demand from Market Area Growth 4,613,499 SF
Potential New Retail from 10-year Growth: 2011-2021
3.0 :: Market Analysis
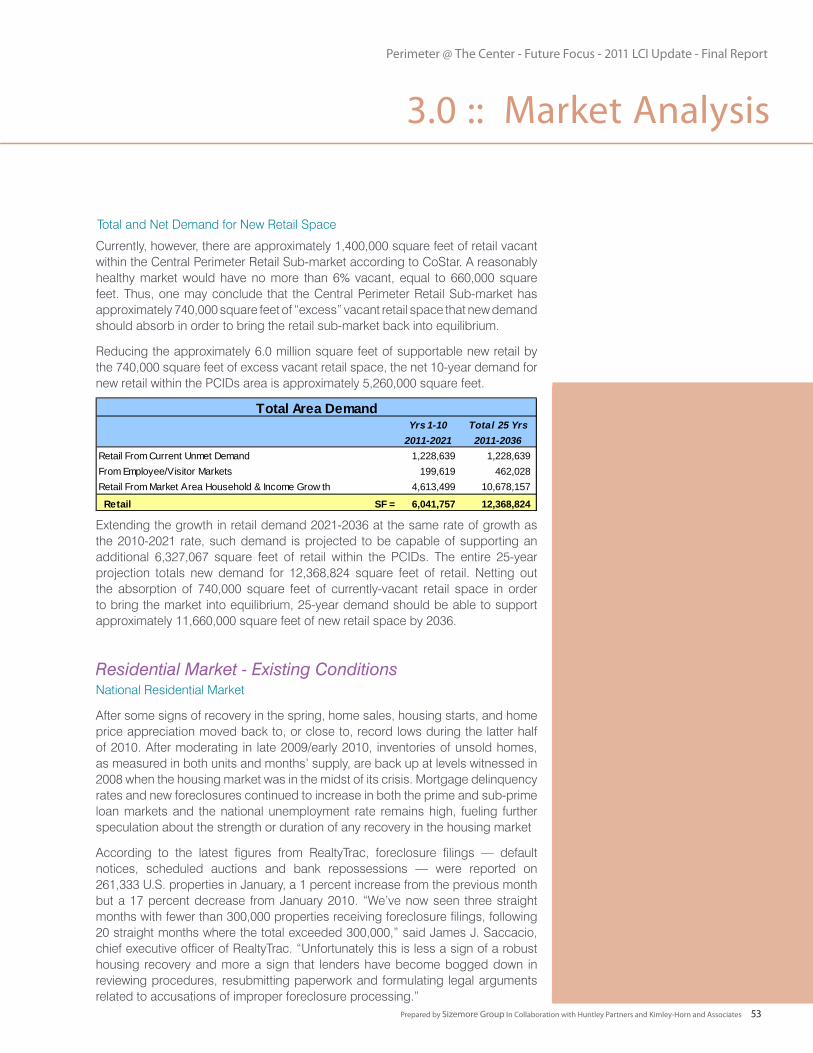
Perimeter @ The Center - Future Focus - 2011 LCI Update - Final Report
Prepared by Sizemore Group In Collaboration with Huntley Partners and Kimley-Horn and Associates 53
Currently, however, there are approximately 1,400,000 square feet of retail vacant within the Central Perimeter Retail Sub-market according to CoStar. A reasonably healthy market would have no more than 6% vacant, equal to 660,000 square feet. Thus, one may conclude that the Central Perimeter Retail Sub-market has approximately 740,000 square feet of “excess” vacant retail space that new demand should absorb in order to bring the retail sub-market back into equilibrium.
Reducing the approximately 6.0 million square feet of supportable new retail by the 740,000 square feet of excess vacant retail space, the net 10-year demand for new retail within the PCIDs area is approximately 5,260,000 square feet.
Extending the growth in retail demand 2021-2036 at the same rate of growth as the 2010-2021 rate, such demand is projected to be capable of supporting an additional 6,327,067 square feet of retail within the PCIDs. The entire 25-year projection totals new demand for 12,368,824 square feet of retail. Netting out the absorption of 740,000 square feet of currently-vacant retail space in order to bring the market into equilibrium, 25-year demand should be able to support approximately 11,660,000 square feet of new retail space by 2036.
National Residential Market
After some signs of recovery in the spring, home sales, housing starts, and home price appreciation moved back to, or close to, record lows during the latter half of 2010. After moderating in late 2009/early 2010, inventories of unsold homes, as measured in both units and months’ supply, are back up at levels witnessed in 2008 when the housing market was in the midst of its crisis. Mortgage delinquency rates and new foreclosures continued to increase in both the prime and sub-prime loan markets and the national unemployment rate remains high, fueling further speculation about the strength or duration of any recovery in the housing market
According to the latest figures from RealtyTrac, foreclosure filings — default notices, scheduled auctions and bank repossessions — were reported on 261,333 U.S. properties in January, a 1 percent increase from the previous month but a 17 percent decrease from January 2010. “We’ve now seen three straight months with fewer than 300,000 properties receiving foreclosure filings, following 20 straight months where the total exceeded 300,000,” said James J. Saccacio, chief executive officer of RealtyTrac. “Unfortunately this is less a sign of a robust housing recovery and more a sign that lenders have become bogged down in reviewing procedures, resubmitting paperwork and formulating legal arguments related to accusations of improper foreclosure processing.”
Residential Market - Existing Conditions
Total and Net Demand for New Retail Space
Yrs 1-10 Total 25 Yrs
2011-2021 2011-2036Retail From Current Unmet Demand 1,228,639 1,228,639 From Employee/Visitor Markets 199,619 462,028 Retail From Market Area Household & Income Grow th 4,613,499 10,678,157
Retail SF = 6,041,757 12,368,824
Total Area Demand
3.0 :: Market Analysis
Perimeter @ The Center - Future Focus - 2011 LCI Update - Final Report
Prepared by Sizemore Group In Collaboration with Huntley Partners and Kimley-Horn and Associates54
Demand from New Household Growth
New Housing Demand due to Turnover
New Housing Demand due to Inducement
Metro Atlanta Residential Market
Atlanta, like the rest of the nation, is weathering an “unusually slow” economic recovery as it struggles with previous overbuilding of residential real estate according to RealtyTrac. Atlanta led the nation in new single-family home construction every year between 1995 and 2005, so it took a big beating when housing turned down during the second half of the decade. Housing prices rose only modestly during the boom years, but lending was overly aggressive and many home buyers had little equity in their homes to begin with. A high proportion of mortgage loans made during the housing boom were either sub prime or Alt-A. The net result has been a surge in mortgage delinquencies and foreclosures, and the problem is likely to linger for some time to come.
Based on historical data, it is projected that the Perimeter CIDs itself can be expected to attract approximately 8% of all Primary Market demand for new housing, 4% of all Secondary Market demand for new housing, and 2% of all Tertiary Market demand.
These capture rates of new demand based on household growth would generate demand during the ten-year 2011-2021 period within the Perimeter CIDs itself of 700 single-family owner-occupied houses, 158 owner-occupied townhomes, and 940 rental units from new household growth within the 0-10 mile Perimeter CIDs Total Market Area – a total of 1,799 residential units.
New housing demand will also be generated by turnover among current residents. These assumptions generate demand during the ten-year 2011-2021 period within the Perimeter CIDs itself of 473 single-family owner-occupied houses, 108 owner-occupied townhomes, and 1,059 rental units – a total of 1,640 units – from turnover within the Market Area, as indicated in the table below.
New housing demand will also be generated by inducement – attracting new residents from outside the Perimeter CIDs Primary, Secondary and Tertiary market areas. Based on historical performance data, it is assumed that induced demand for all new housing demand will be equal to 75% of new demand within the Primary Market, 50% of new demand within the Secondary Market and 30% from within the Tertiary Market – that “total demand” being from both household growth and household turnover combined.
New ten-year (2011-2021) induced demand will equal 472 owner-occupied townhouses, 1,673 owner-occupied single-family detached houses and 3,153 rental units – a total of 5,299 residential units 2011-2021.
PCIDs Market Area Housing Demand
3.0 :: Market Analysis
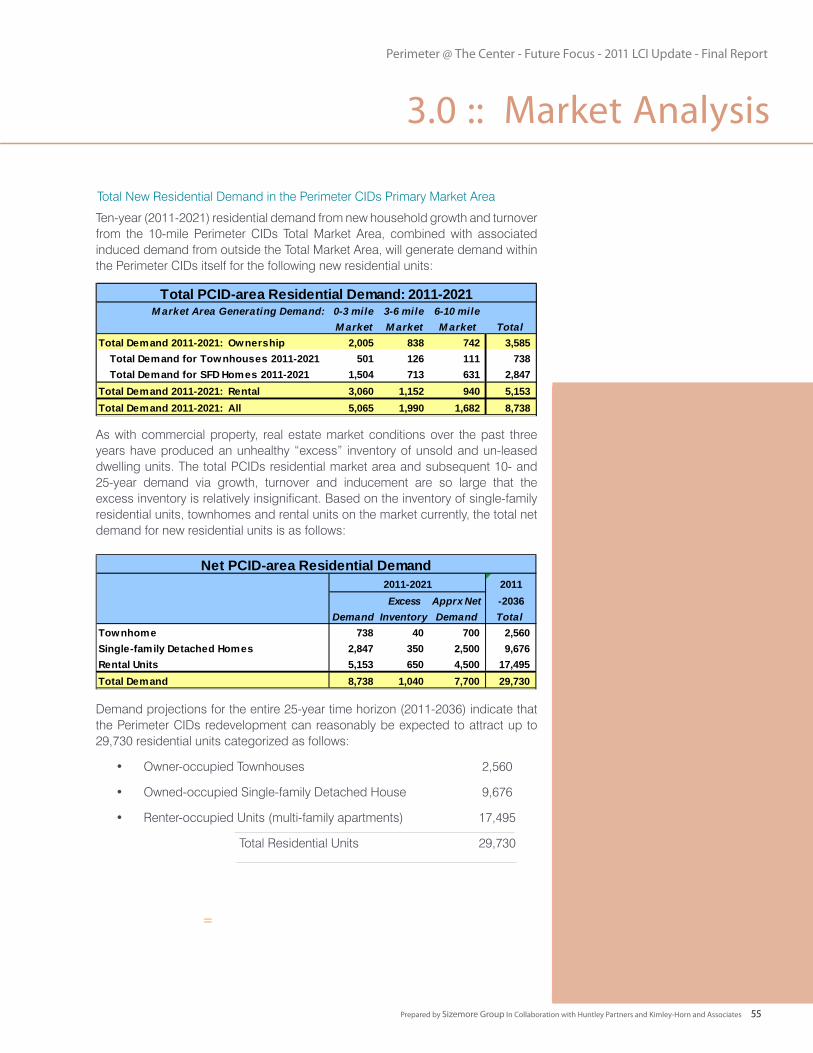
Perimeter @ The Center - Future Focus - 2011 LCI Update - Final Report
Prepared by Sizemore Group In Collaboration with Huntley Partners and Kimley-Horn and Associates 55
Ten-year (2011-2021) residential demand from new household growth and turnover from the 10-mile Perimeter CIDs Total Market Area, combined with associated induced demand from outside the Total Market Area, will generate demand within the Perimeter CIDs itself for the following new residential units:
As with commercial property, real estate market conditions over the past three years have produced an unhealthy “excess” inventory of unsold and un-leased dwelling units. The total PCIDs residential market area and subsequent 10- and 25-year demand via growth, turnover and inducement are so large that the excess inventory is relatively insignificant. Based on the inventory of single-family residential units, townhomes and rental units on the market currently, the total net demand for new residential units is as follows:
Demand projections for the entire 25-year time horizon (2011-2036) indicate that the Perimeter CIDs redevelopment can reasonably be expected to attract up to 29,730 residential units categorized as follows:
• Owner-occupied Townhouses 2,560
• Owned-occupied Single-family Detached House 9,676
• Renter-occupied Units (multi-family apartments) 17,495
Total Residential Units 29,730
=
Total New Residential Demand in the Perimeter CIDs Primary Market Area
M arket Area Generating Demand: 0-3 mile 3-6 mile 6-10 mile
M arket M arket M arket TotalTotal Demand 2011-2021: Ownership 2,005 838 742 3,585 Total Demand for Townhouses 2011-2021 501 126 111 738 Total Demand for SFD Homes 2011-2021 1,504 713 631 2,847 Total Demand 2011-2021: Rental 3,060 1,152 940 5,153 Total Demand 2011-2021: All 5,065 1,990 1,682 8,738
Total PCID-area Residential Demand: 2011-2021
2011
Excess Apprx Net -2036Demand Inventory Demand Total
Townhome 738 40 700 2,560 Single-family Detached Homes 2,847 350 2,500 9,676 Rental Units 5,153 650 4,500 17,495 Total Demand 8,738 1,040 7,700 29,730
Net PCID-area Residential Demand2011-2021
3.0 :: Market Analysis
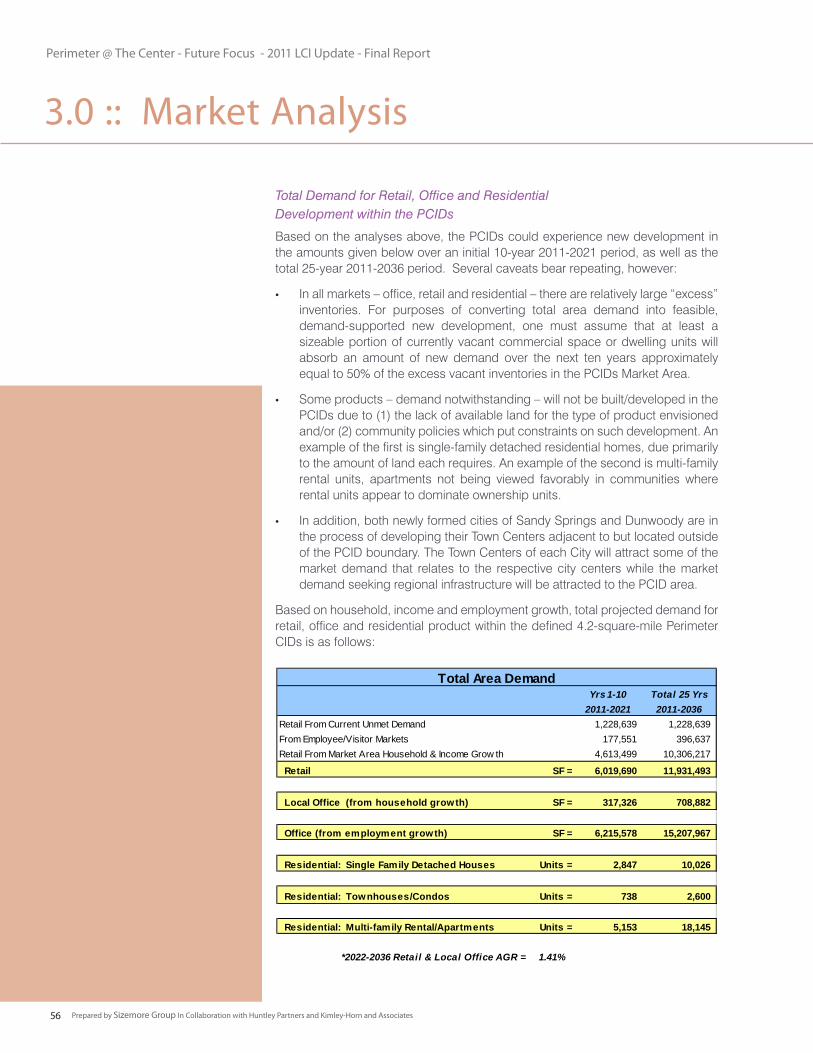
Perimeter @ The Center - Future Focus - 2011 LCI Update - Final Report
Prepared by Sizemore Group In Collaboration with Huntley Partners and Kimley-Horn and Associates56
Based on the analyses above, the PCIDs could experience new development in the amounts given below over an initial 10-year 2011-2021 period, as well as the total 25-year 2011-2036 period. Several caveats bear repeating, however:
In all markets – office, retail and residential – there are relatively large “excess” • inventories. For purposes of converting total area demand into feasible, demand-supported new development, one must assume that at least a sizeable portion of currently vacant commercial space or dwelling units will absorb an amount of new demand over the next ten years approximately equal to 50% of the excess vacant inventories in the PCIDs Market Area.
Some products – demand notwithstanding – will not be built/developed in the • PCIDs due to (1) the lack of available land for the type of product envisioned and/or (2) community policies which put constraints on such development. An example of the first is single-family detached residential homes, due primarily to the amount of land each requires. An example of the second is multi-family rental units, apartments not being viewed favorably in communities where rental units appear to dominate ownership units.
In addition, both newly formed cities of Sandy Springs and Dunwoody are in • the process of developing their Town Centers adjacent to but located outside of the PCID boundary. The Town Centers of each City will attract some of the market demand that relates to the respective city centers while the market demand seeking regional infrastructure will be attracted to the PCID area.
Based on household, income and employment growth, total projected demand for retail, office and residential product within the defined 4.2-square-mile Perimeter CIDs is as follows:
Total Demand for Retail, Office and Residential Development within the PCIDs
3.0 :: Market Analysis
Yrs 1-10 Total 25 Yrs
2011-2021 2011-2036Retail From Current Unmet Demand 1,228,639 1,228,639 From Employee/Visitor Markets 177,551 396,637 Retail From Market Area Household & Income Grow th 4,613,499 10,306,217
Retail SF = 6,019,690 11,931,493
Local Office (from household growth) SF = 317,326 708,882
Office (from employment growth) SF = 6,215,578 15,207,967
Residential: Single Family Detached Houses Units = 2,847 10,026
Residential: Townhouses/Condos Units = 738 2,600
Residential: Multi-family Rental/Apartments Units = 5,153 18,145
*2022-2036 Retail & Local Office AGR = 1.41%
Total Area Demand
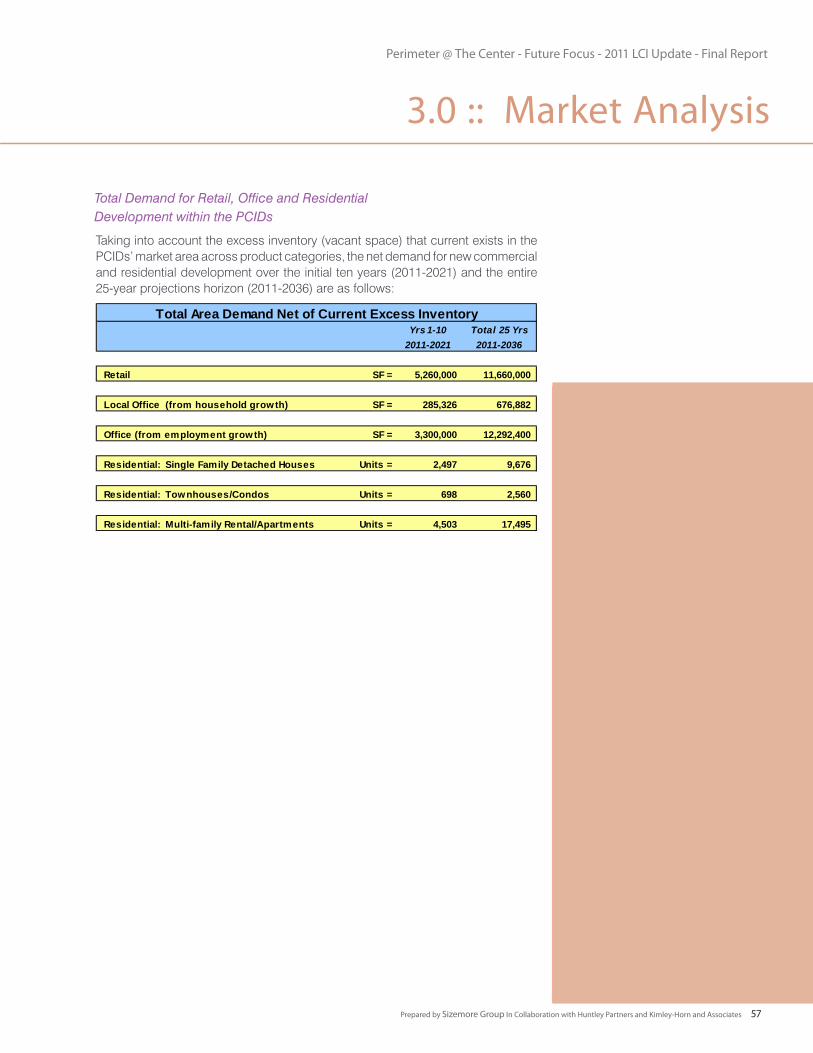
Perimeter @ The Center - Future Focus - 2011 LCI Update - Final Report
Prepared by Sizemore Group In Collaboration with Huntley Partners and Kimley-Horn and Associates 57
Total Demand for Retail, Office and Residential Development within the PCIDs
Taking into account the excess inventory (vacant space) that current exists in the PCIDs’ market area across product categories, the net demand for new commercial and residential development over the initial ten years (2011-2021) and the entire 25-year projections horizon (2011-2036) are as follows:
3.0 :: Market Analysis
Yrs 1-10 Total 25 Yrs
2011-2021 2011-2036
Retail SF = 5,260,000 11,660,000
Local Office (from household growth) SF = 285,326 676,882
Office (from employment growth) SF = 3,300,000 12,292,400
Residential: Single Family Detached Houses Units = 2,497 9,676
Residential: Townhouses/Condos Units = 698 2,560
Residential: Multi-family Rental/Apartments Units = 4,503 17,495
Total Area Demand Net of Current Excess Inventory
Perimeter @ The Center - Future Focus - 2011 LCI Update - Final Report
Prepared by Sizemore Group In Collaboration with Huntley Partners and Kimley-Horn and Associates58
Looking Forward - Recovery Timing
Clearly the entire Metro Atlanta Region has suffered from the national economic downturn that began in 2007. Given the severity of the current “Great Recession,” economists have generally lowered expectations of what a recovery may look like and what a return to normal growth will be. These lowered expectations are summed up by the media’s use of the phase “a return to the new normal” in describing an economic recovery that stabilizes at much lower – but hopefully less volatile and more sustainable – growth rates than those experienced in the heady economic expansions and associated bubbles that characterized recoveries in the past several decades.
As applied to Metro Atlanta’s recovery to levels of “new normal” growth, a weak consensus (major differences of opinion remain as to the timing and extent of recovery) has emerged pointing to recoveries in the markets for major types of development as follows:
• Residential: Slight improvement in housing sales through 2011 coupled with continuing declines in sale prices as sellers – particularly banks writing down foreclosure inventories – increasingly prioritize moving product over pricing. Slight improvement in sales and prices is anticipated through 2012 with some degree of stabilization in the market being achieved by the end of 2013. The “new normal” is for the overall residential market is projected to be achieved in mid-to-late 2013 and early 2014 for sale properties. Rental properties are beginning to strengthen with respect to both occupancy and effective rates, with the “new normal” for apartments being reached in 2012.
• Retail: Declining rates and occupancy continuing and perhaps temporarily accelerating through mid-2011, with market stabilization in late-2011 and continuing through 2012. However, a “new normal” is not anticipated until 2013-2014.
• Office: Basically the same pattern of recovery as retail, but with larger inventories and longer lead times for new development than retail, “new normal” stabilization occurring in 2014-2015.
• Hotels: New location-specific deals will continue during 2011 even with overall declines in rates and occupancy. The hospitality market should see signs of substantive recovery as reflected in the increasing availability of capital in 2012, building to the “new normal” in 2013.
3.0 :: Market Analysis
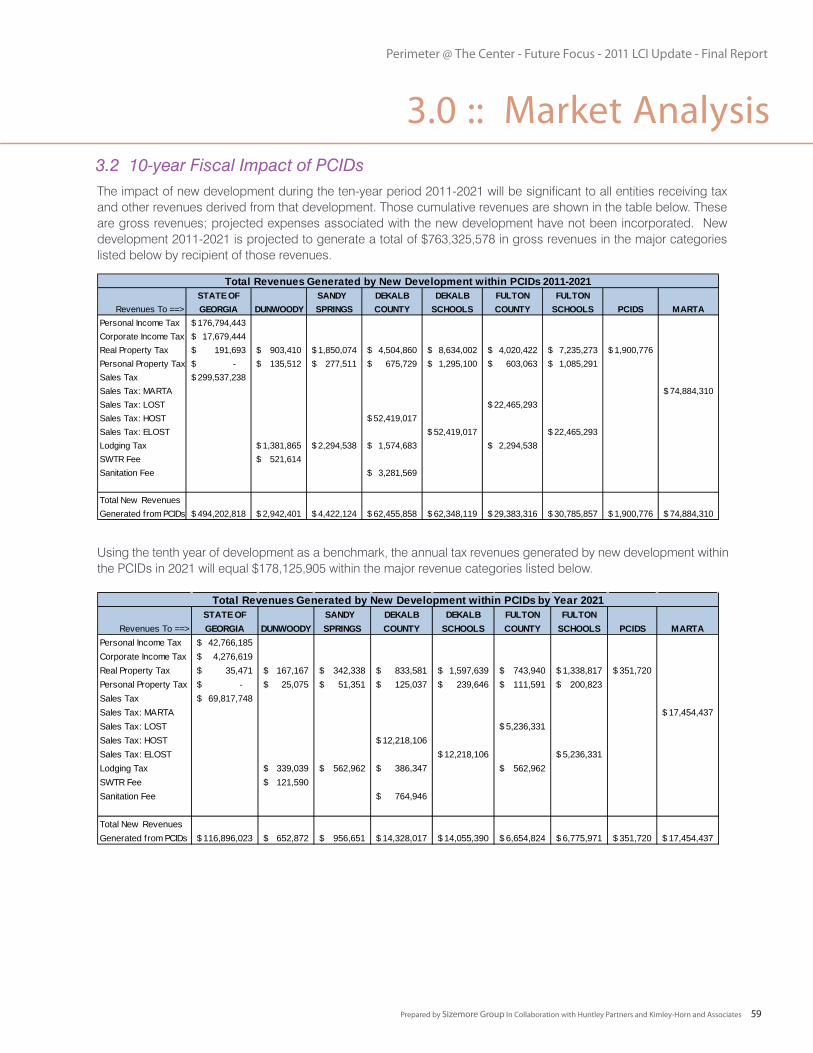
Perimeter @ The Center - Future Focus - 2011 LCI Update - Final Report
Prepared by Sizemore Group In Collaboration with Huntley Partners and Kimley-Horn and Associates 59
3.0 :: Market Analysis
The impact of new development during the ten-year period 2011-2021 will be significant to all entities receiving tax and other revenues derived from that development. Those cumulative revenues are shown in the table below. These are gross revenues; projected expenses associated with the new development have not been incorporated. New development 2011-2021 is projected to generate a total of $763,325,578 in gross revenues in the major categories listed below by recipient of those revenues.
Using the tenth year of development as a benchmark, the annual tax revenues generated by new development within the PCIDs in 2021 will equal $178,125,905 within the major revenue categories listed below.
3.2 10-year Fiscal Impact of PCIDs
STATE OF SANDY DEKALB DEKALB FULTON FULTON
Revenues To ==> GEORGIA DUNWOODY SPRINGS COUNTY SCHOOLS COUNTY SCHOOLS PCIDS MARTAPersonal Income Tax 176,794,443$ Corporate Income Tax 17,679,444$ Real Property Tax 191,693$ 903,410$ 1,850,074$ 4,504,860$ 8,634,002$ 4,020,422$ 7,235,273$ 1,900,776$ Personal Property Tax -$ 135,512$ 277,511$ 675,729$ 1,295,100$ 603,063$ 1,085,291$ Sales Tax 299,537,238$ Sales Tax: MARTA 74,884,310$ Sales Tax: LOST 22,465,293$ Sales Tax: HOST 52,419,017$ Sales Tax: ELOST 52,419,017$ 22,465,293$ Lodging Tax 1,381,865$ 2,294,538$ 1,574,683$ 2,294,538$ SWTR Fee 521,614$ Sanitation Fee 3,281,569$
Total New RevenuesGenerated from PCIDs 494,202,818$ 2,942,401$ 4,422,124$ 62,455,858$ 62,348,119$ 29,383,316$ 30,785,857$ 1,900,776$ 74,884,310$
Total Revenues Generated by New Development within PCIDs 2011-2021
STATE OF SANDY DEKALB DEKALB FULTON FULTON
Revenues To ==> GEORGIA DUNWOODY SPRINGS COUNTY SCHOOLS COUNTY SCHOOLS PCIDS MARTAPersonal Income Tax 42,766,185$ Corporate Income Tax 4,276,619$ Real Property Tax 35,471$ 167,167$ 342,338$ 833,581$ 1,597,639$ 743,940$ 1,338,817$ 351,720$ Personal Property Tax -$ 25,075$ 51,351$ 125,037$ 239,646$ 111,591$ 200,823$ Sales Tax 69,817,748$ Sales Tax: MARTA 17,454,437$ Sales Tax: LOST 5,236,331$ Sales Tax: HOST 12,218,106$ Sales Tax: ELOST 12,218,106$ 5,236,331$ Lodging Tax 339,039$ 562,962$ 386,347$ 562,962$ SWTR Fee 121,590$ Sanitation Fee 764,946$
Total New RevenuesGenerated from PCIDs 116,896,023$ 652,872$ 956,651$ 14,328,017$ 14,055,390$ 6,654,824$ 6,775,971$ 351,720$ 17,454,437$
Total Revenues Generated by New Development within PCIDs by Year 2021

Perimeter @ The Center - Future Focus - 2011 LCI Update - Final Report
Prepared by Sizemore Group In Collaboration with Huntley Partners and Kimley-Horn and Associates60
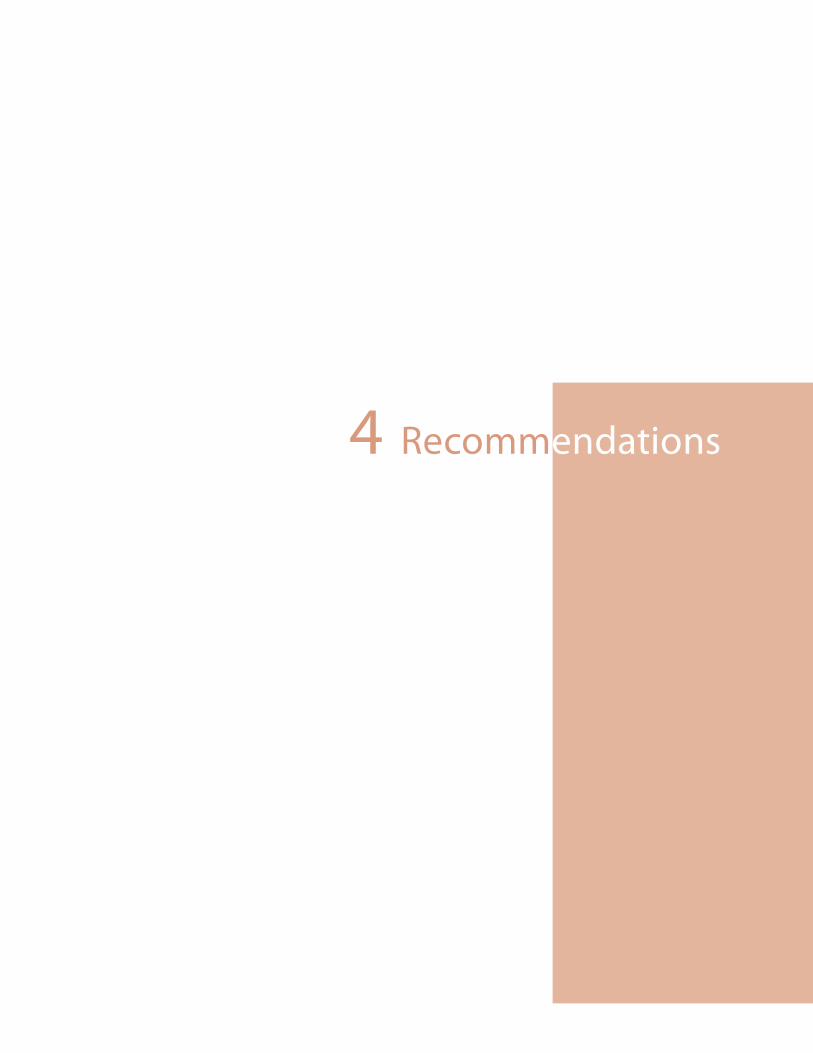
Perimeter @ The Center - Future Focus - 2011 LCI Update - Final Report
Prepared by Sizemore Group In Collaboration with Huntley Partners and Kimley-Horn and Associates 61
4 Recommendations

Perimeter @ The Center - Future Focus - 2011 LCI Update - Final Report
Prepared by Sizemore Group In Collaboration with Huntley Partners and Kimley-Horn and Associates62
“It’s a community where if people don’t want
an automobile,they don’t have to have one.”
Ray LaHoodSecretary of U.S. Department of Transportation
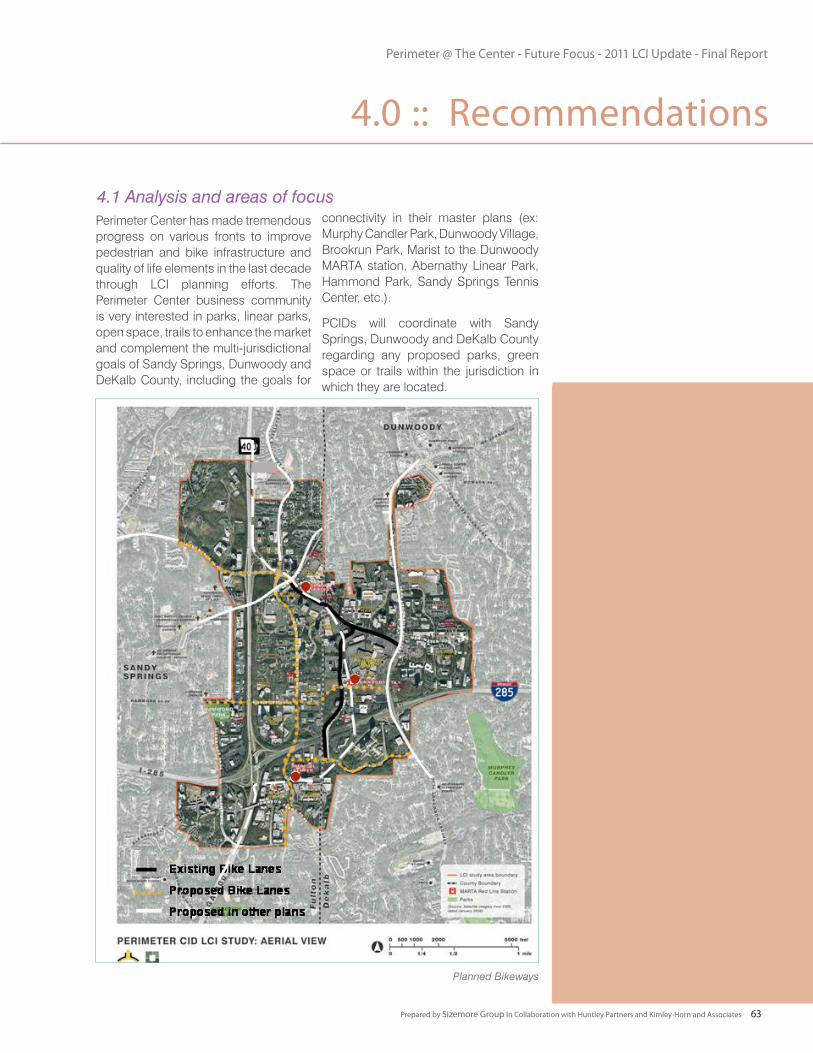
Perimeter @ The Center - Future Focus - 2011 LCI Update - Final Report
Prepared by Sizemore Group In Collaboration with Huntley Partners and Kimley-Horn and Associates 63
Perimeter Center has made tremendous progress on various fronts to improve pedestrian and bike infrastructure and quality of life elements in the last decade through LCI planning efforts. The Perimeter Center business community is very interested in parks, linear parks, open space, trails to enhance the market and complement the multi-jurisdictional goals of Sandy Springs, Dunwoody and DeKalb County, including the goals for
connectivity in their master plans (ex: Murphy Candler Park, Dunwoody Village, Brookrun Park, Marist to the Dunwoody MARTA station, Abernathy Linear Park, Hammond Park, Sandy Springs Tennis Center, etc.).
PCIDs will coordinate with Sandy Springs, Dunwoody and DeKalb County regarding any proposed parks, green space or trails within the jurisdiction in which they are located.
4.0 :: Recommendations
4.1 Analysis and areas of focus
Planned Bikeways
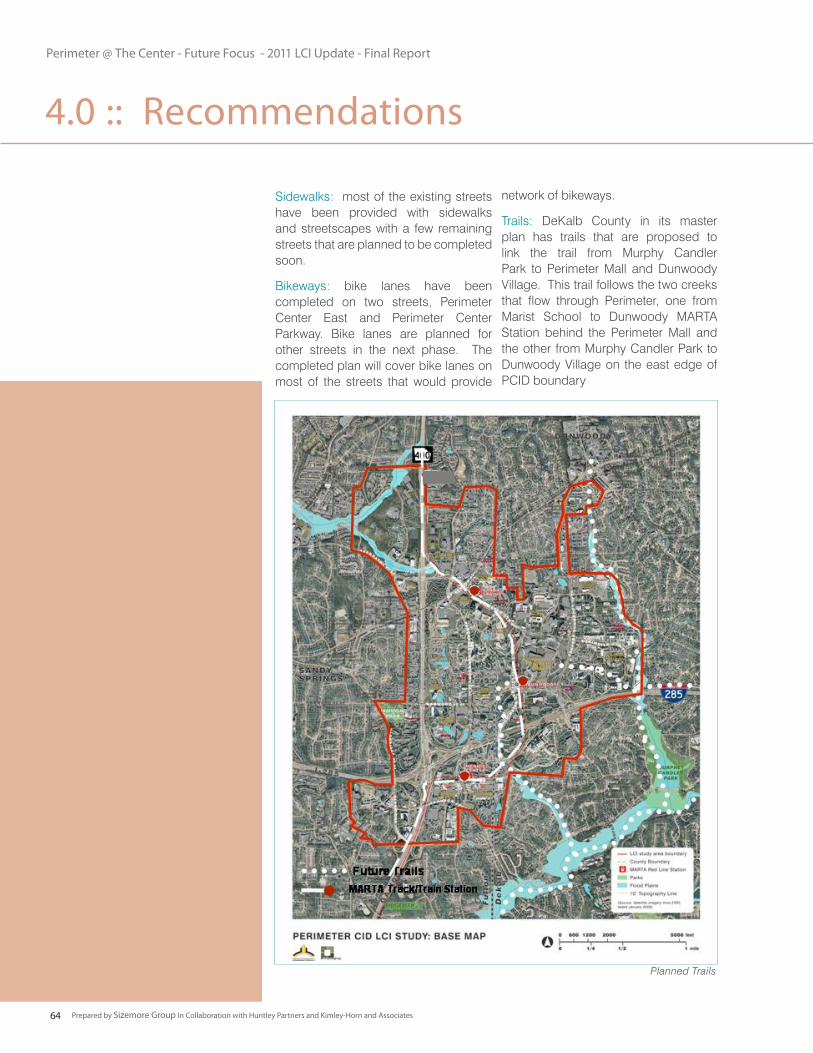
Perimeter @ The Center - Future Focus - 2011 LCI Update - Final Report
Prepared by Sizemore Group In Collaboration with Huntley Partners and Kimley-Horn and Associates64
4.0 :: Recommendations
Sidewalks: most of the existing streets have been provided with sidewalks and streetscapes with a few remaining streets that are planned to be completed soon.
Bikeways: bike lanes have been completed on two streets, Perimeter Center East and Perimeter Center Parkway. Bike lanes are planned for other streets in the next phase. The completed plan will cover bike lanes on most of the streets that would provide
Planned Trails
network of bikeways.
Trails: DeKalb County in its master plan has trails that are proposed to link the trail from Murphy Candler Park to Perimeter Mall and Dunwoody Village. This trail follows the two creeks that flow through Perimeter, one from Marist School to Dunwoody MARTA Station behind the Perimeter Mall and the other from Murphy Candler Park to Dunwoody Village on the east edge of PCID boundary
Perimeter @ The Center - Future Focus - 2011 LCI Update - Final Report
Prepared by Sizemore Group In Collaboration with Huntley Partners and Kimley-Horn and Associates 65
Green Spaces: Hammond Park at Hammond Drive and Glenridge Connector is the only public park within PCID boundary. Hammond Park is located on the western end of the PCIDs boundary to the west of GA 400 freeway. Hammond Park is currently being upgraded by the City of Sandy Springs. There are a number of small private pocket parks, ponds, small plazas within the office parks, retail and residential developments. There is no civic plaza
within PCIDs boundaries. Perimeter would benefit from civic gathering spaces and green space connectivity to other community and regional parks of Dunwoody, Sandy Springs and DeKalb.
There are several parks in Dunwoody (Brook Run Park and others) that have good facilities. Connectivity to these parks will benefit Perimeter. PCIDs can partner in supporting and promoting activities that benefit Perimeter residents, businesses and visitors.
Murphy Candler Park
Existing parks
4.0 :: Recommendations
Hammond Park
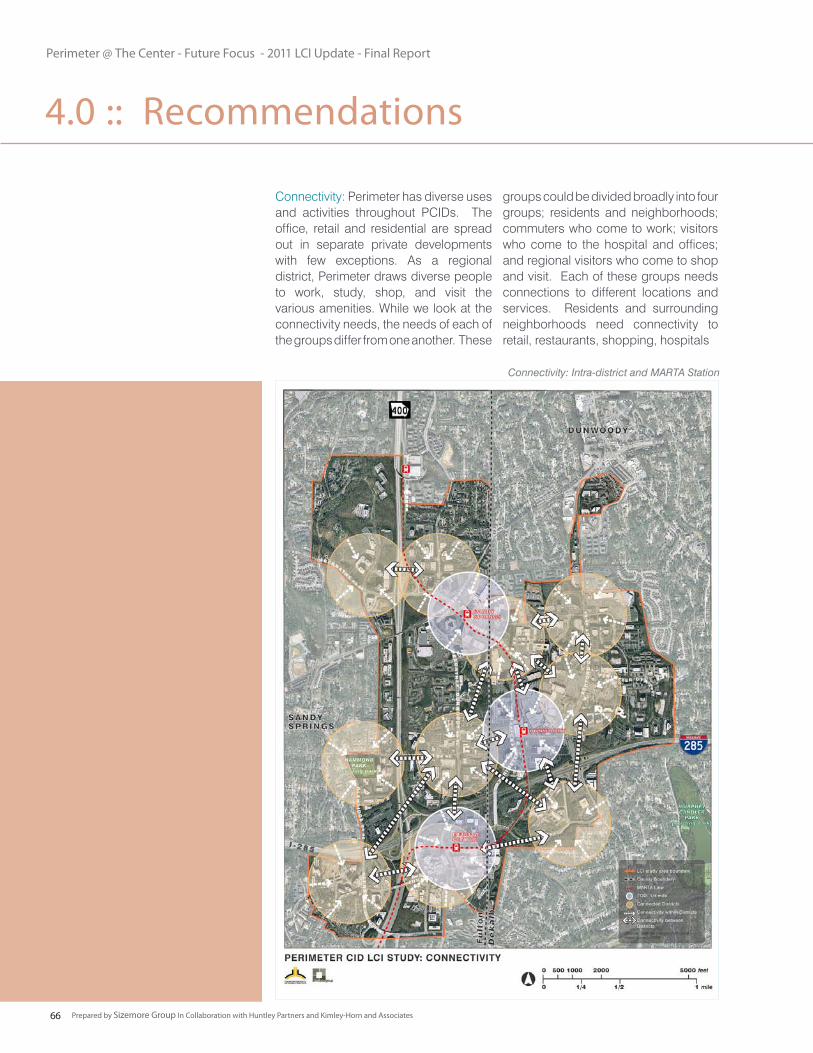
Perimeter @ The Center - Future Focus - 2011 LCI Update - Final Report
Prepared by Sizemore Group In Collaboration with Huntley Partners and Kimley-Horn and Associates66
groups could be divided broadly into four groups; residents and neighborhoods; commuters who come to work; visitors who come to the hospital and offices; and regional visitors who come to shop and visit. Each of these groups needs connections to different locations and services. Residents and surrounding neighborhoods need connectivity to retail, restaurants, shopping, hospitals
Connectivity: Perimeter has diverse uses and activities throughout PCIDs. The office, retail and residential are spread out in separate private developments with few exceptions. As a regional district, Perimeter draws diverse people to work, study, shop, and visit the various amenities. While we look at the connectivity needs, the needs of each of the groups differ from one another. These
Connectivity: Intra-district and MARTA Station
4.0 :: Recommendations
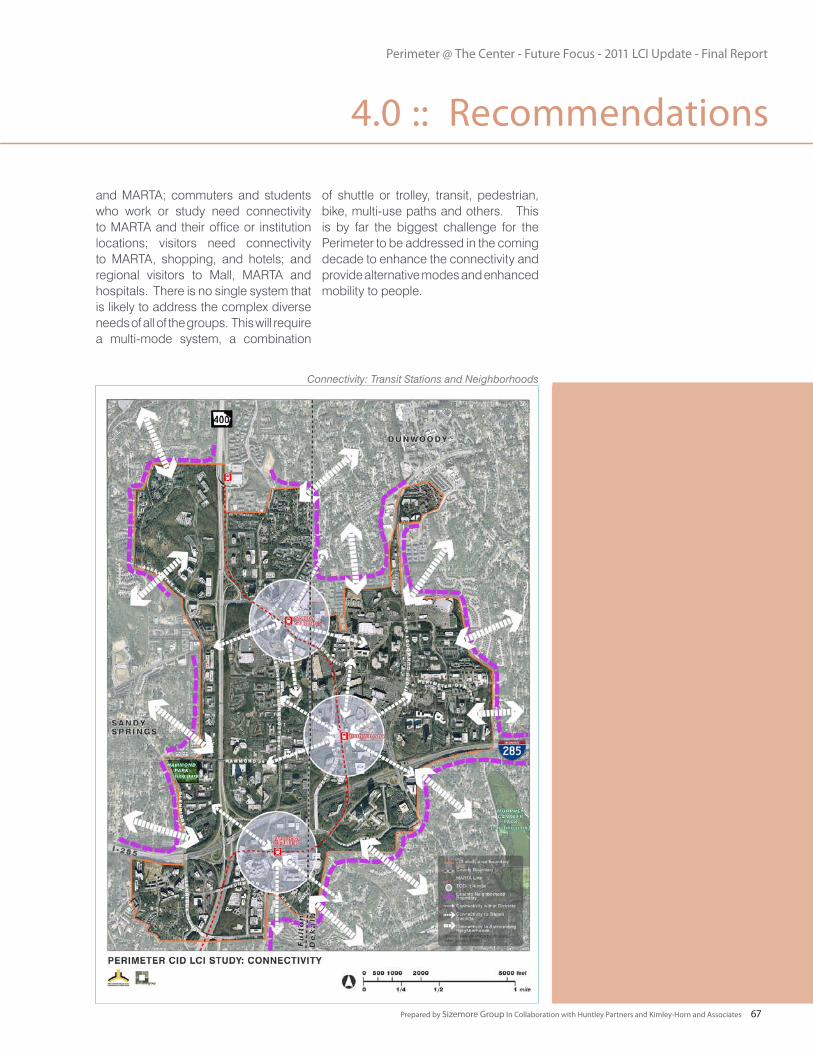
Perimeter @ The Center - Future Focus - 2011 LCI Update - Final Report
Prepared by Sizemore Group In Collaboration with Huntley Partners and Kimley-Horn and Associates 67
and MARTA; commuters and students who work or study need connectivity to MARTA and their office or institution locations; visitors need connectivity to MARTA, shopping, and hotels; and regional visitors to Mall, MARTA and hospitals. There is no single system that is likely to address the complex diverse needs of all of the groups. This will require a multi-mode system, a combination
of shuttle or trolley, transit, pedestrian, bike, multi-use paths and others. This is by far the biggest challenge for the Perimeter to be addressed in the coming decade to enhance the connectivity and provide alternative modes and enhanced mobility to people.
Connectivity: Transit Stations and Neighborhoods
4.0 :: Recommendations
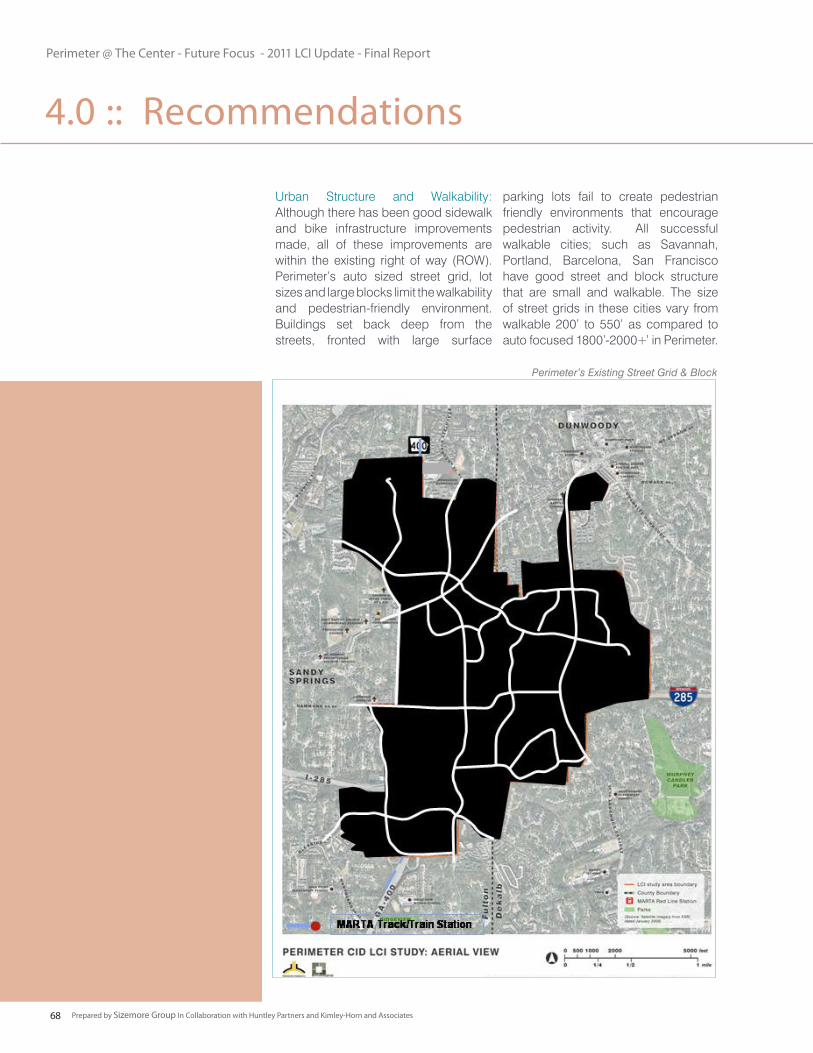
Perimeter @ The Center - Future Focus - 2011 LCI Update - Final Report
Prepared by Sizemore Group In Collaboration with Huntley Partners and Kimley-Horn and Associates68
parking lots fail to create pedestrian friendly environments that encourage pedestrian activity. All successful walkable cities; such as Savannah, Portland, Barcelona, San Francisco have good street and block structure that are small and walkable. The size of street grids in these cities vary from walkable 200’ to 550’ as compared to auto focused 1800’-2000+’ in Perimeter.
Urban Structure and Walkability: Although there has been good sidewalk and bike infrastructure improvements made, all of these improvements are within the existing right of way (ROW). Perimeter’s auto sized street grid, lot sizes and large blocks limit the walkability and pedestrian-friendly environment. Buildings set back deep from the streets, fronted with large surface
Perimeter’s Existing Street Grid & Block
4.0 :: Recommendations
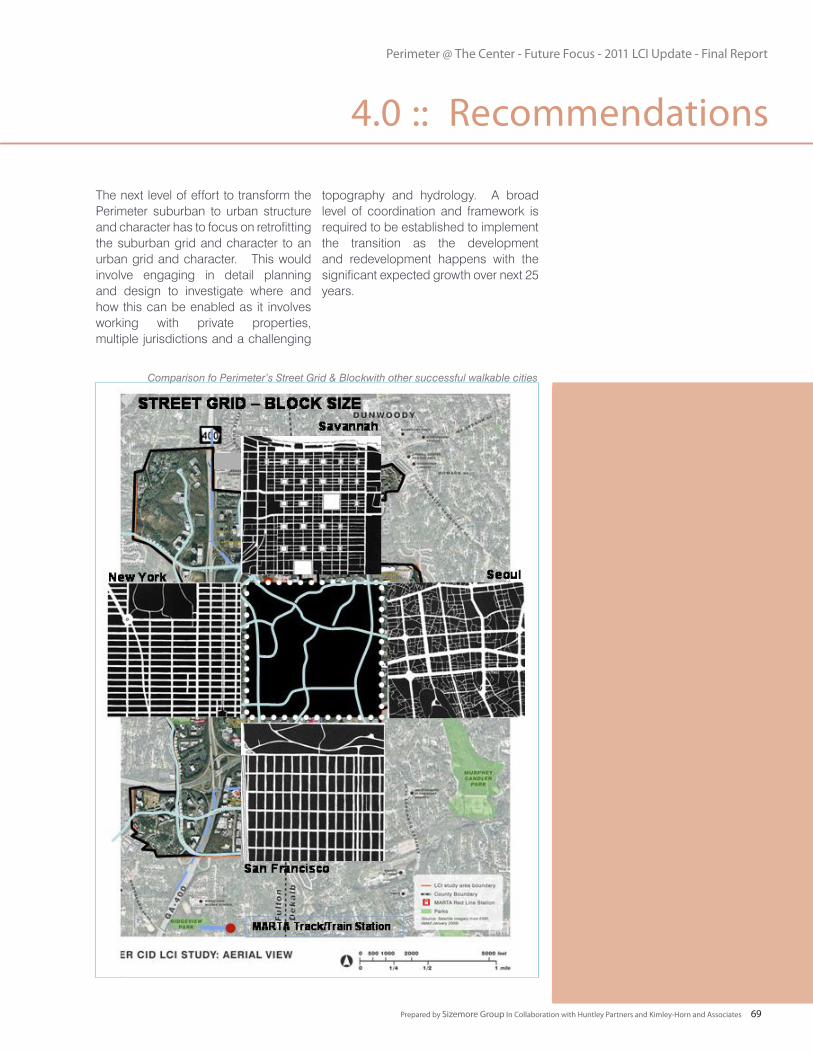
Perimeter @ The Center - Future Focus - 2011 LCI Update - Final Report
Prepared by Sizemore Group In Collaboration with Huntley Partners and Kimley-Horn and Associates 69
The next level of effort to transform the Perimeter suburban to urban structure and character has to focus on retrofitting the suburban grid and character to an urban grid and character. This would involve engaging in detail planning and design to investigate where and how this can be enabled as it involves working with private properties, multiple jurisdictions and a challenging
topography and hydrology. A broad level of coordination and framework is required to be established to implement the transition as the development and redevelopment happens with the significant expected growth over next 25 years.
Comparison fo Perimeter’s Street Grid & Blockwith other successful walkable cities
4.0 :: Recommendations
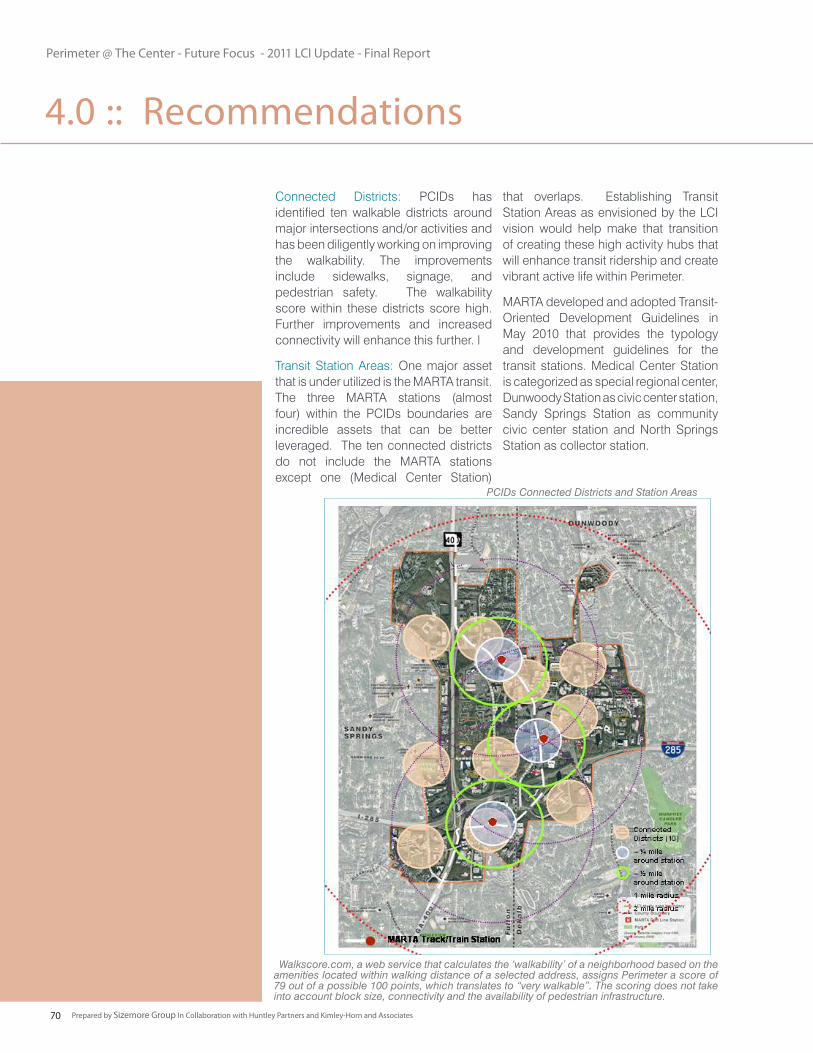
Perimeter @ The Center - Future Focus - 2011 LCI Update - Final Report
Prepared by Sizemore Group In Collaboration with Huntley Partners and Kimley-Horn and Associates70
that overlaps. Establishing Transit Station Areas as envisioned by the LCI vision would help make that transition of creating these high activity hubs that will enhance transit ridership and create vibrant active life within Perimeter.
MARTA developed and adopted Transit-Oriented Development Guidelines in May 2010 that provides the typology and development guidelines for the transit stations. Medical Center Station is categorized as special regional center, Dunwoody Station as civic center station, Sandy Springs Station as community civic center station and North Springs Station as collector station.
Connected Districts: PCIDs has identified ten walkable districts around major intersections and/or activities and has been diligently working on improving the walkability. The improvements include sidewalks, signage, and pedestrian safety. The walkability score within these districts score high. Further improvements and increased connectivity will enhance this further. l
Transit Station Areas: One major asset that is under utilized is the MARTA transit. The three MARTA stations (almost four) within the PCIDs boundaries are incredible assets that can be better leveraged. The ten connected districts do not include the MARTA stations except one (Medical Center Station)
Walkscore.com, a web service that calculates the ‘walkability’ of a neighborhood based on the amenities located within walking distance of a selected address, assigns Perimeter a score of 79 out of a possible 100 points, which translates to “very walkable”. The scoring does not take into account block size, connectivity and the availability of pedestrian infrastructure.
PCIDs Connected Districts and Station Areas
4.0 :: Recommendations
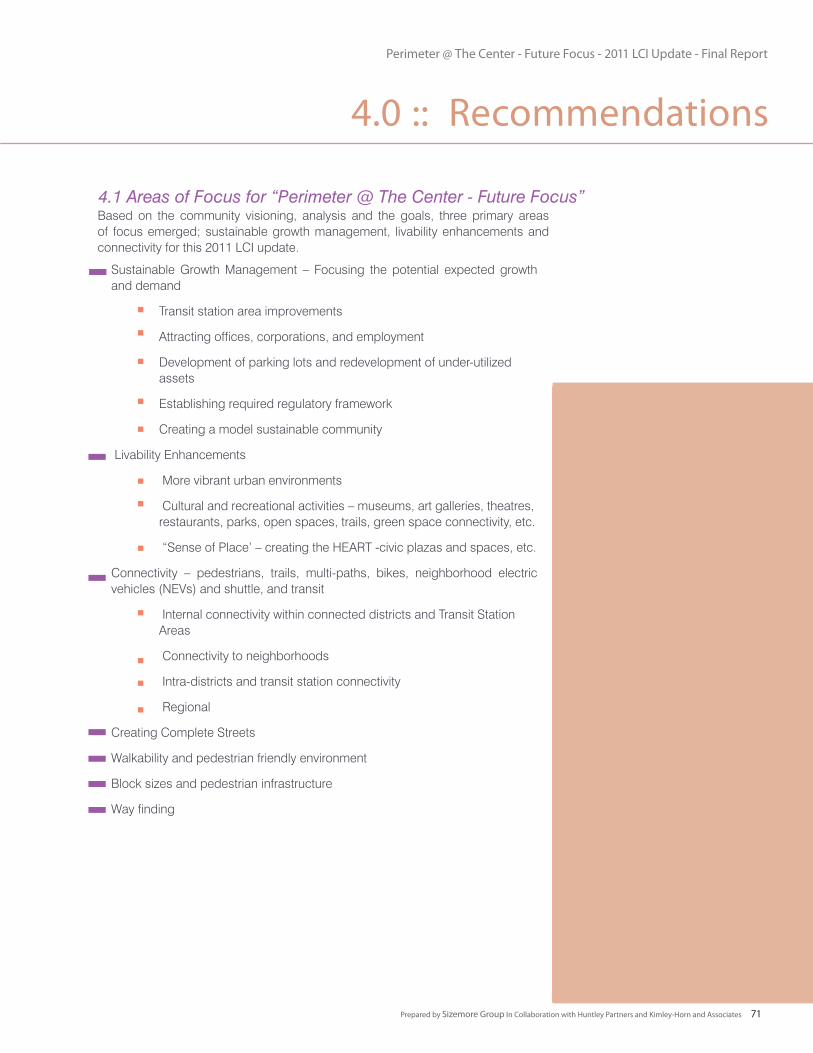
Perimeter @ The Center - Future Focus - 2011 LCI Update - Final Report
Prepared by Sizemore Group In Collaboration with Huntley Partners and Kimley-Horn and Associates 71
4.1 Areas of Focus for “Perimeter @ The Center - Future Focus”
Sustainable Growth Management – Focusing the potential expected growth and demand
Transit station area improvements
Attracting offices, corporations, and employment
Development of parking lots and redevelopment of under-utilized assets
Establishing required regulatory framework
Creating a model sustainable community
Livability Enhancements
More vibrant urban environments
Cultural and recreational activities – museums, art galleries, theatres, restaurants, parks, open spaces, trails, green space connectivity, etc.
“Sense of Place’ – creating the HEART -civic plazas and spaces, etc.
Connectivity – pedestrians, trails, multi-paths, bikes, neighborhood electric vehicles (NEVs) and shuttle, and transit
Internal connectivity within connected districts and Transit Station Areas
Connectivity to neighborhoods
Intra-districts and transit station connectivity
Regional
Creating Complete Streets
Walkability and pedestrian friendly environment
Block sizes and pedestrian infrastructure
Way finding
Based on the community visioning, analysis and the goals, three primary areas of focus emerged; sustainable growth management, livability enhancements and connectivity for this 2011 LCI update.
4.0 :: Recommendations

Perimeter @ The Center - Future Focus - 2011 LCI Update - Final Report
Prepared by Sizemore Group In Collaboration with Huntley Partners and Kimley-Horn and Associates72
The market analysis projects a significant demand for Perimeter for the next 25 year horizon. The demand for office and retail is almost as much as the current inventory and the residential is five times that of today. The potential demand certainly gives the Perimeter a
great opportunity to make the transition from regional center to a urban thriving walkable transit based Perimeter as desired by the LCI vision. Following is the estimated projected demand.
4.2 Development Potential
4.0 :: Recommendations
Yrs 1-10 Total 25 Yrs
2011-2021 2011-2036Retail From Current Unmet Demand 1,228,639 1,228,639 From Employee/Visitor Markets 177,551 396,637 Retail From Market Area Household & Income Grow th 4,613,499 10,306,217
Retail SF = 6,019,690 11,931,493
Local Office (from household growth) SF = 317,326 708,882
Office (from employment growth) SF = 6,215,578 15,207,967
Residential: Single Family Detached Houses Units = 2,847 10,026
Residential: Townhouses/Condos Units = 738 2,600
Residential: Multi-family Rental/Apartments Units = 5,153 18,145
*2022-2036 Retail & Local Office AGR = 1.41%
Total Area Demand
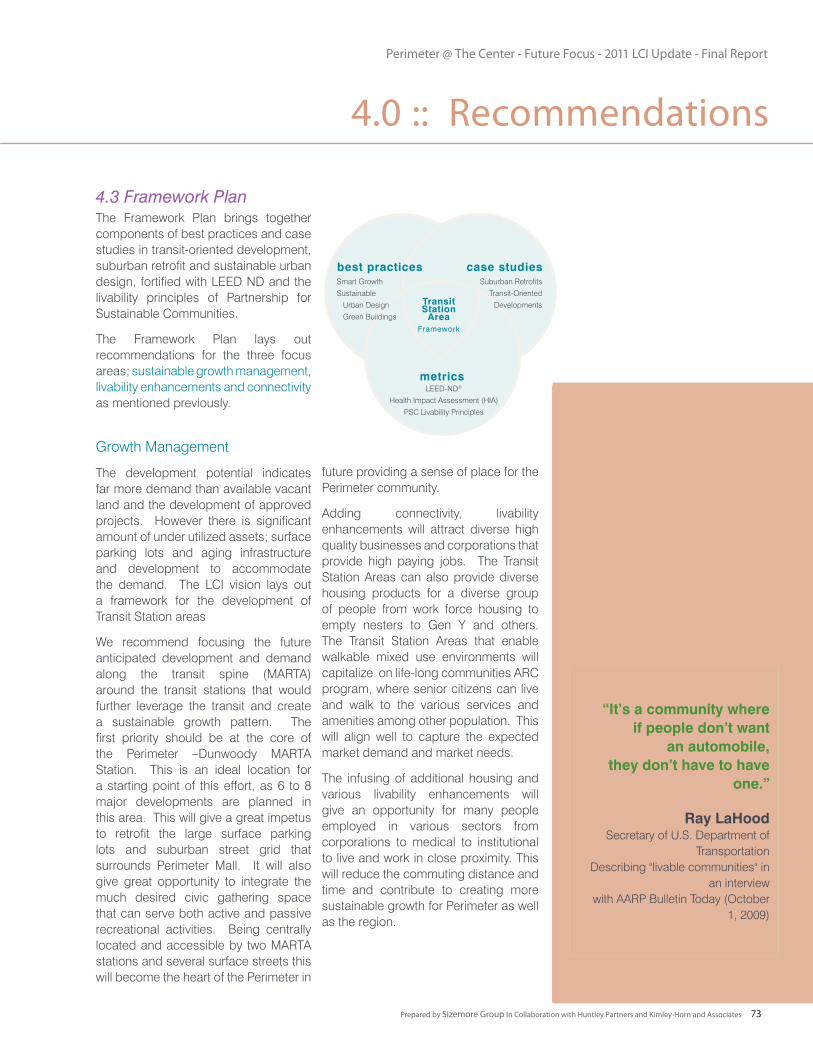
Perimeter @ The Center - Future Focus - 2011 LCI Update - Final Report
Prepared by Sizemore Group In Collaboration with Huntley Partners and Kimley-Horn and Associates 73
The Framework Plan brings together components of best practices and case studies in transit-oriented development, suburban retrofit and sustainable urban design, fortified with LEED ND and the livability principles of Partnership for Sustainable Communities.
The Framework Plan lays out recommendations for the three focus areas; sustainable growth management, livability enhancements and connectivity as mentioned previously.
Growth Management
The development potential indicates far more demand than available vacant land and the development of approved projects. However there is significant amount of under utilized assets; surface parking lots and aging infrastructure and development to accommodate the demand. The LCI vision lays out a framework for the development of Transit Station areas
We recommend focusing the future anticipated development and demand along the transit spine (MARTA) around the transit stations that would further leverage the transit and create a sustainable growth pattern. The first priority should be at the core of the Perimeter –Dunwoody MARTA Station. This is an ideal location for a starting point of this effort, as 6 to 8 major developments are planned in this area. This will give a great impetus to retrofit the large surface parking lots and suburban street grid that surrounds Perimeter Mall. It will also give great opportunity to integrate the much desired civic gathering space that can serve both active and passive recreational activities. Being centrally located and accessible by two MARTA stations and several surface streets this will become the heart of the Perimeter in
future providing a sense of place for the Perimeter community.
Adding connectivity, livability enhancements will attract diverse high quality businesses and corporations that provide high paying jobs. The Transit Station Areas can also provide diverse housing products for a diverse group of people from work force housing to empty nesters to Gen Y and others. The Transit Station Areas that enable walkable mixed use environments will capitalize on life-long communities ARC program, where senior citizens can live and walk to the various services and amenities among other population. This will align well to capture the expected market demand and market needs.
The infusing of additional housing and various livability enhancements will give an opportunity for many people employed in various sectors from corporations to medical to institutional to live and work in close proximity. This will reduce the commuting distance and time and contribute to creating more sustainable growth for Perimeter as well as the region.
4.3 Framework Plan
best practices
Transit Station
AreaFramework
case studies
metrics
Smart Growth
Sustainable
Urban Design
Green Buildings
Suburban Retrofits
Transit-Oriented
Developments
LEED-ND®
Health Impact Assessment (HIA)
PSC Livability Principles
“It’s a community where if people don’t want
an automobile,they don’t have to have
one.”
Ray LaHoodSecretary of U.S. Department of
TransportationDescribing "livable communities" in
an interview with AARP Bulletin Today (October
1, 2009)
4.0 :: Recommendations
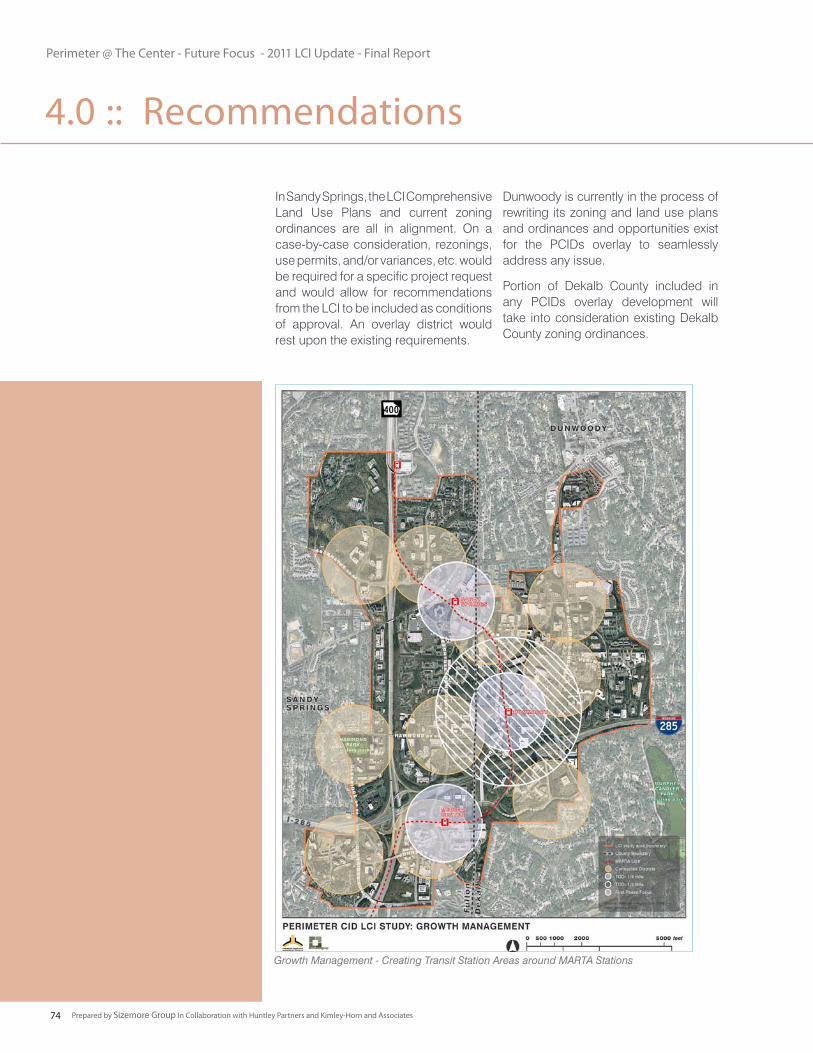
Perimeter @ The Center - Future Focus - 2011 LCI Update - Final Report
Prepared by Sizemore Group In Collaboration with Huntley Partners and Kimley-Horn and Associates74
Dunwoody is currently in the process of rewriting its zoning and land use plans and ordinances and opportunities exist for the PCIDs overlay to seamlessly address any issue.
Portion of Dekalb County included in any PCIDs overlay development will take into consideration existing Dekalb County zoning ordinances.
In Sandy Springs, the LCI Comprehensive Land Use Plans and current zoning ordinances are all in alignment. On a case-by-case consideration, rezonings, use permits, and/or variances, etc. would be required for a specific project request and would allow for recommendations from the LCI to be included as conditions of approval. An overlay district would rest upon the existing requirements.
Growth Management - Creating Transit Station Areas around MARTA Stations
4.0 :: Recommendations
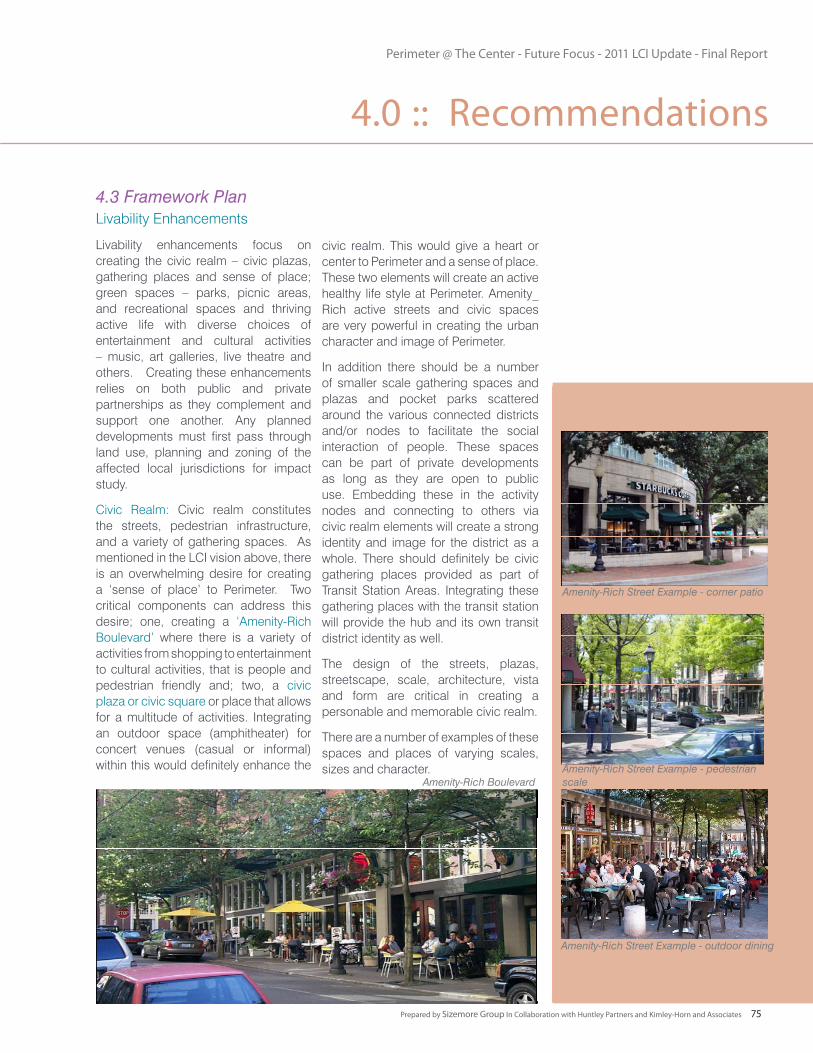
Perimeter @ The Center - Future Focus - 2011 LCI Update - Final Report
Prepared by Sizemore Group In Collaboration with Huntley Partners and Kimley-Horn and Associates 75
Livability Enhancements
Livability enhancements focus on creating the civic realm – civic plazas, gathering places and sense of place; green spaces – parks, picnic areas, and recreational spaces and thriving active life with diverse choices of entertainment and cultural activities – music, art galleries, live theatre and others. Creating these enhancements relies on both public and private partnerships as they complement and support one another. Any planned developments must first pass through land use, planning and zoning of the affected local jurisdictions for impact study.
Civic Realm: Civic realm constitutes the streets, pedestrian infrastructure, and a variety of gathering spaces. As mentioned in the LCI vision above, there is an overwhelming desire for creating a ‘sense of place’ to Perimeter. Two critical components can address this desire; one, creating a ‘Amenity-Rich Boulevard’ where there is a variety of activities from shopping to entertainment to cultural activities, that is people and pedestrian friendly and; two, a civic plaza or civic square or place that allows for a multitude of activities. Integrating an outdoor space (amphitheater) for concert venues (casual or informal) within this would definitely enhance the
civic realm. This would give a heart or center to Perimeter and a sense of place. These two elements will create an active healthy life style at Perimeter. Amenity_Rich active streets and civic spaces are very powerful in creating the urban character and image of Perimeter.
In addition there should be a number of smaller scale gathering spaces and plazas and pocket parks scattered around the various connected districts and/or nodes to facilitate the social interaction of people. These spaces can be part of private developments as long as they are open to public use. Embedding these in the activity nodes and connecting to others via civic realm elements will create a strong identity and image for the district as a whole. There should definitely be civic gathering places provided as part of Transit Station Areas. Integrating these gathering places with the transit station will provide the hub and its own transit district identity as well.
The design of the streets, plazas, streetscape, scale, architecture, vista and form are critical in creating a personable and memorable civic realm.
There are a number of examples of these spaces and places of varying scales, sizes and character.
4.3 Framework Plan
Amenity-Rich Boulevard Amenity-Rich Street Example - pedestrian scale
Amenity-Rich Street Example - corner patio
Amenity-Rich Street Example - outdoor dining
4.0 :: Recommendations
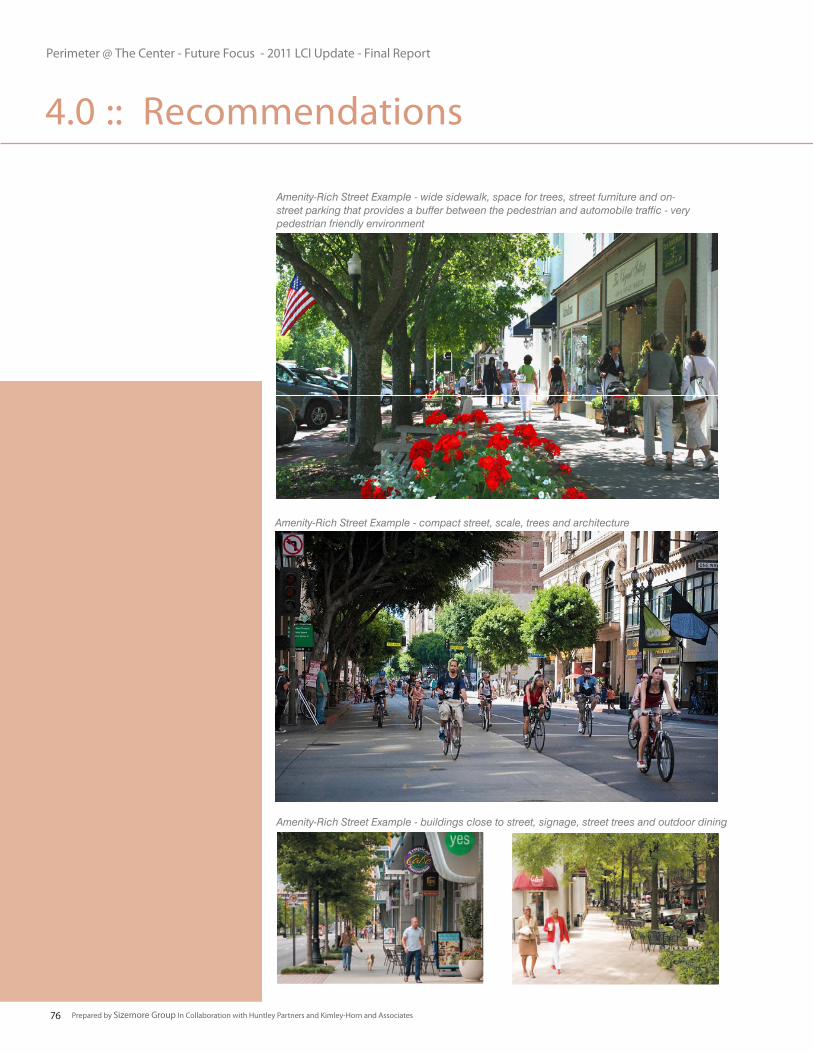
Perimeter @ The Center - Future Focus - 2011 LCI Update - Final Report
Prepared by Sizemore Group In Collaboration with Huntley Partners and Kimley-Horn and Associates76
Amenity-Rich Street Example - wide sidewalk, space for trees, street furniture and on-street parking that provides a buffer between the pedestrian and automobile traffic - very pedestrian friendly environment
Amenity-Rich Street Example - compact street, scale, trees and architecture
Amenity-Rich Street Example - buildings close to street, signage, street trees and outdoor dining
4.0 :: Recommendations
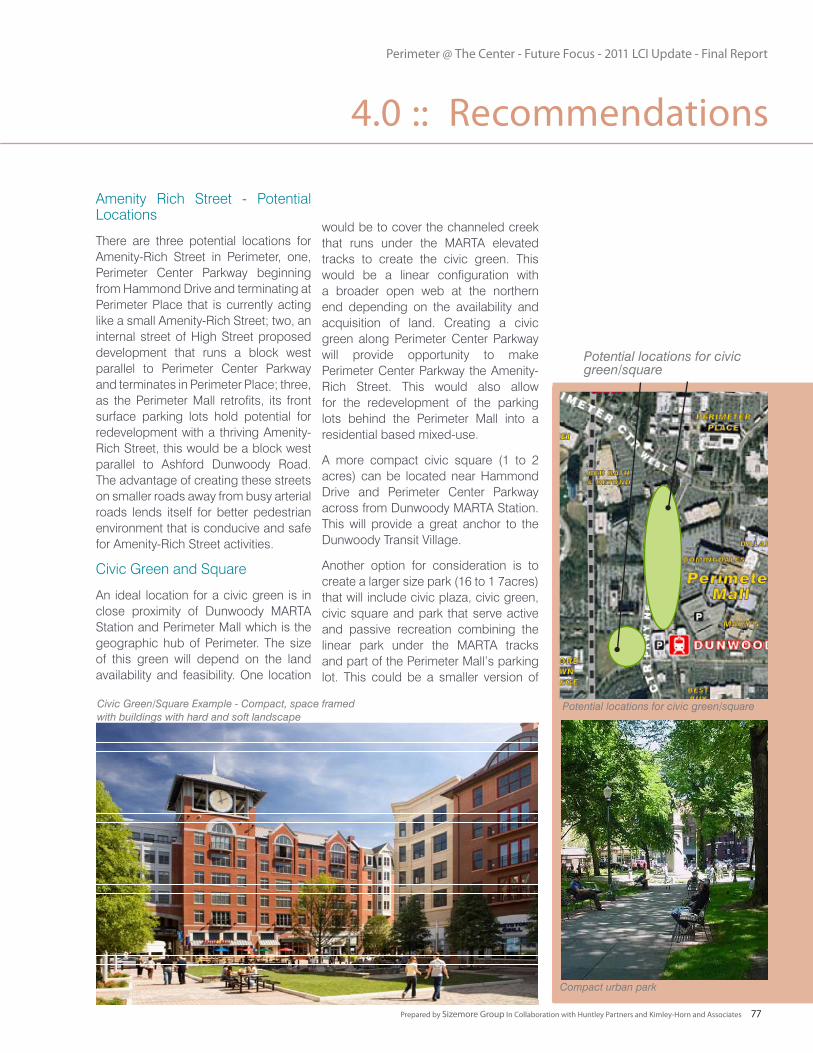
Perimeter @ The Center - Future Focus - 2011 LCI Update - Final Report
Prepared by Sizemore Group In Collaboration with Huntley Partners and Kimley-Horn and Associates 77
Amenity Rich Street - Potential Locations
There are three potential locations for Amenity-Rich Street in Perimeter, one, Perimeter Center Parkway beginning from Hammond Drive and terminating at Perimeter Place that is currently acting like a small Amenity-Rich Street; two, an internal street of High Street proposed development that runs a block west parallel to Perimeter Center Parkway and terminates in Perimeter Place; three, as the Perimeter Mall retrofits, its front surface parking lots hold potential for redevelopment with a thriving Amenity-Rich Street, this would be a block west parallel to Ashford Dunwoody Road. The advantage of creating these streets on smaller roads away from busy arterial roads lends itself for better pedestrian environment that is conducive and safe for Amenity-Rich Street activities.
Civic Green and Square
An ideal location for a civic green is in close proximity of Dunwoody MARTA Station and Perimeter Mall which is the geographic hub of Perimeter. The size of this green will depend on the land availability and feasibility. One location
would be to cover the channeled creek that runs under the MARTA elevated tracks to create the civic green. This would be a linear configuration with a broader open web at the northern end depending on the availability and acquisition of land. Creating a civic green along Perimeter Center Parkway will provide opportunity to make Perimeter Center Parkway the Amenity-Rich Street. This would also allow for the redevelopment of the parking lots behind the Perimeter Mall into a residential based mixed-use.
A more compact civic square (1 to 2 acres) can be located near Hammond Drive and Perimeter Center Parkway across from Dunwoody MARTA Station. This will provide a great anchor to the Dunwoody Transit Village.
Another option for consideration is to create a larger size park (16 to 1 7acres) that will include civic plaza, civic green, civic square and park that serve active and passive recreation combining the linear park under the MARTA tracks and part of the Perimeter Mall’s parking lot. This could be a smaller version of
Civic Green/Square Example - Compact, space framed with buildings with hard and soft landscape
Potential locations for civic green/square
Potential locations for civic green/square
Compact urban park
4.0 :: Recommendations
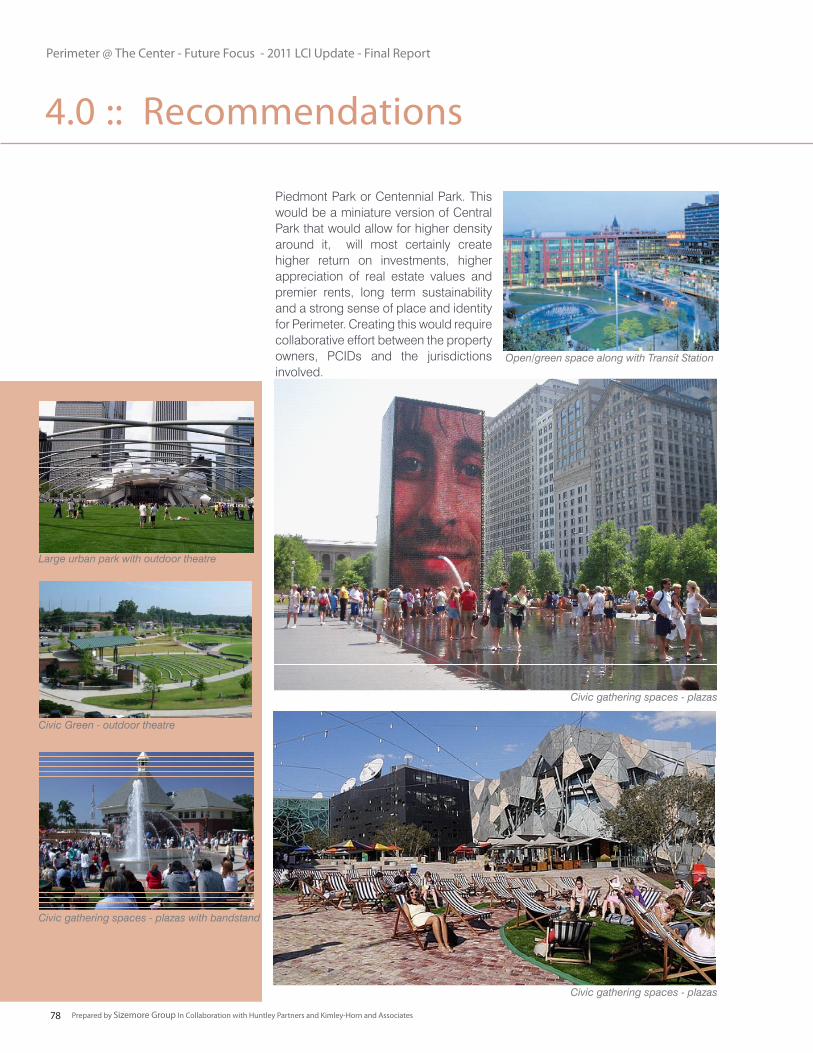
Perimeter @ The Center - Future Focus - 2011 LCI Update - Final Report
Prepared by Sizemore Group In Collaboration with Huntley Partners and Kimley-Horn and Associates78
Piedmont Park or Centennial Park. This would be a miniature version of Central Park that would allow for higher density around it, will most certainly create higher return on investments, higher appreciation of real estate values and premier rents, long term sustainability and a strong sense of place and identity for Perimeter. Creating this would require collaborative effort between the property owners, PCIDs and the jurisdictions involved.
Open/green space along with Transit Station
Civic gathering spaces - plazas
Civic gathering spaces - plazas
Civic gathering spaces - plazas with bandstand
Civic Green - outdoor theatre
Large urban park with outdoor theatre
4.0 :: Recommendations
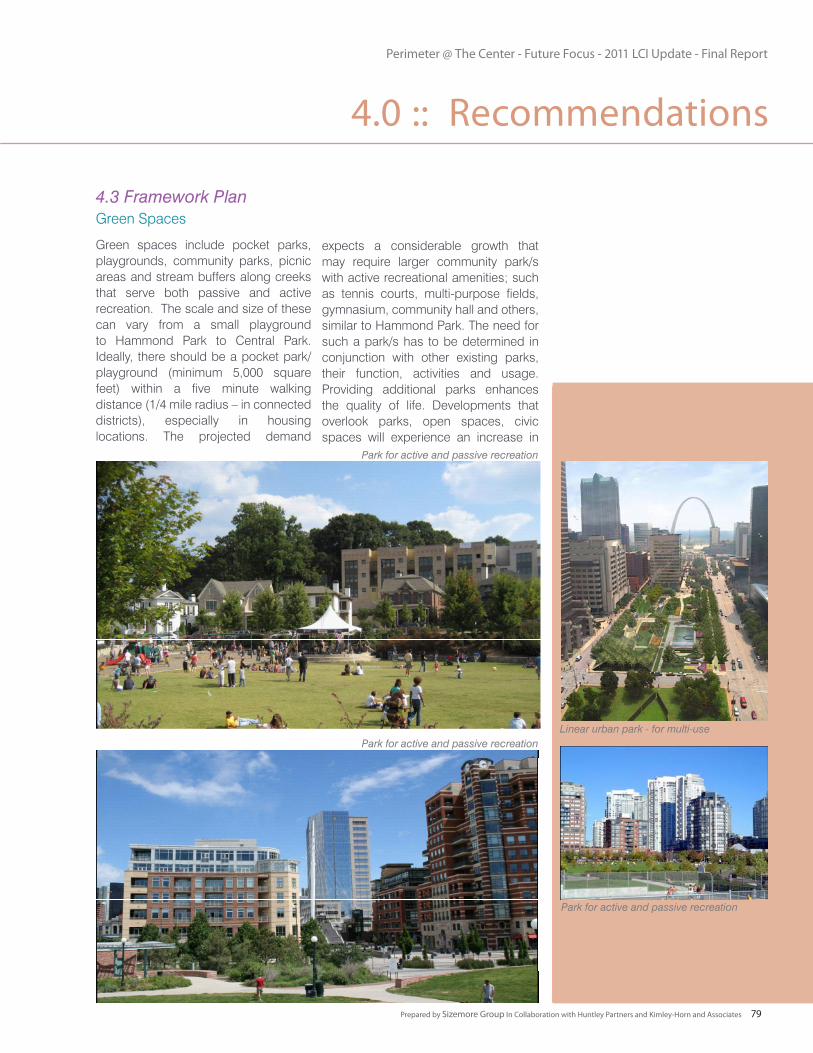
Perimeter @ The Center - Future Focus - 2011 LCI Update - Final Report
Prepared by Sizemore Group In Collaboration with Huntley Partners and Kimley-Horn and Associates 79
Green Spaces
Green spaces include pocket parks, playgrounds, community parks, picnic areas and stream buffers along creeks that serve both passive and active recreation. The scale and size of these can vary from a small playground to Hammond Park to Central Park. Ideally, there should be a pocket park/playground (minimum 5,000 square feet) within a five minute walking distance (1/4 mile radius – in connected districts), especially in housing locations. The projected demand
expects a considerable growth that may require larger community park/s with active recreational amenities; such as tennis courts, multi-purpose fields, gymnasium, community hall and others, similar to Hammond Park. The need for such a park/s has to be determined in conjunction with other existing parks, their function, activities and usage. Providing additional parks enhances the quality of life. Developments that overlook parks, open spaces, civic spaces will experience an increase in
4.3 Framework Plan
Park for active and passive recreation
Park for active and passive recreation
Park for active and passive recreation
Linear urban park - for multi-use
4.0 :: Recommendations
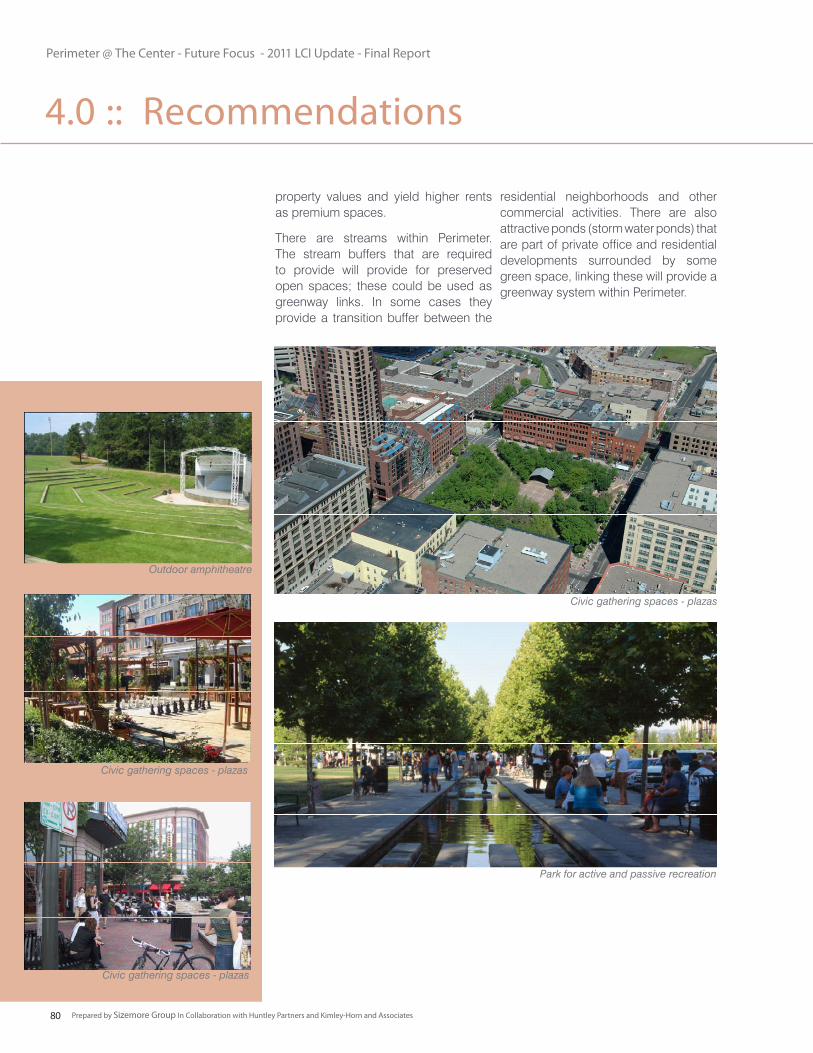
Perimeter @ The Center - Future Focus - 2011 LCI Update - Final Report
Prepared by Sizemore Group In Collaboration with Huntley Partners and Kimley-Horn and Associates80
property values and yield higher rents as premium spaces.
There are streams within Perimeter. The stream buffers that are required to provide will provide for preserved open spaces; these could be used as greenway links. In some cases they provide a transition buffer between the
residential neighborhoods and other commercial activities. There are also attractive ponds (storm water ponds) that are part of private office and residential developments surrounded by some green space, linking these will provide a greenway system within Perimeter.
Civic gathering spaces - plazas
Civic gathering spaces - plazas
Civic gathering spaces - plazas
Outdoor amphitheatre
Park for active and passive recreation
4.0 :: Recommendations
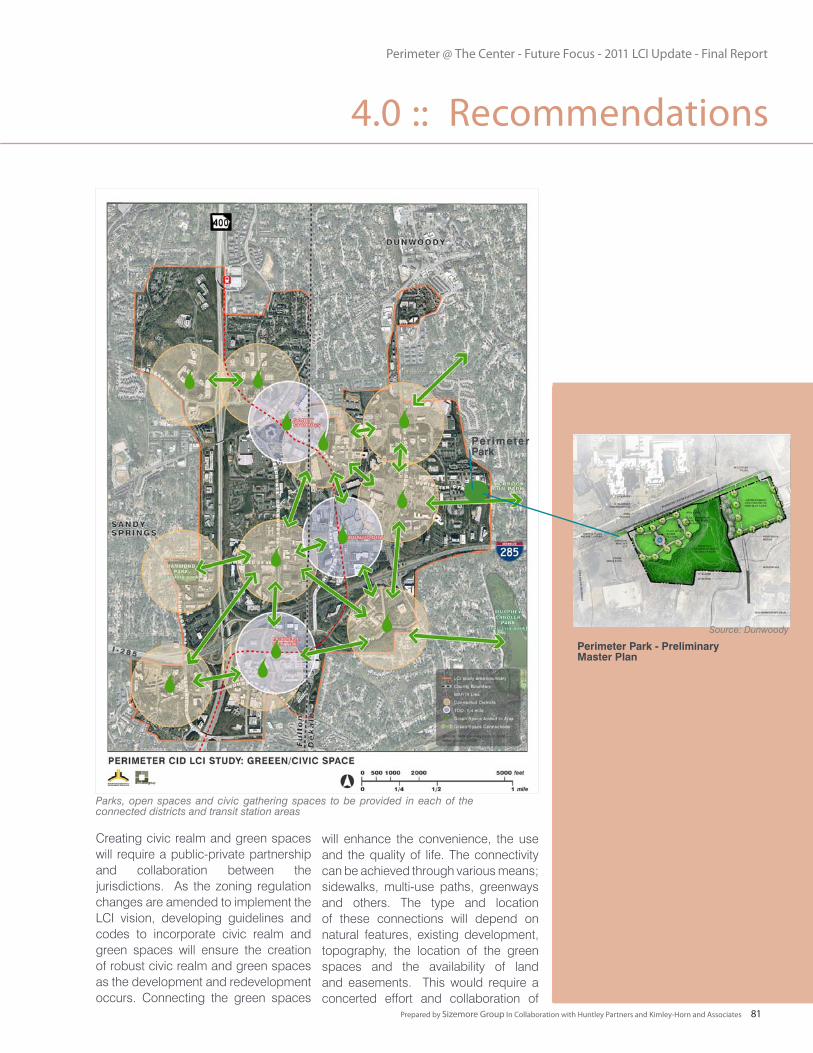
Perimeter @ The Center - Future Focus - 2011 LCI Update - Final Report
Prepared by Sizemore Group In Collaboration with Huntley Partners and Kimley-Horn and Associates 81
Parks, open spaces and civic gathering spaces to be provided in each of the connected districts and transit station areas
Creating civic realm and green spaces will require a public-private partnership and collaboration between the jurisdictions. As the zoning regulation changes are amended to implement the LCI vision, developing guidelines and codes to incorporate civic realm and green spaces will ensure the creation of robust civic realm and green spaces as the development and redevelopment occurs. Connecting the green spaces
will enhance the convenience, the use and the quality of life. The connectivity can be achieved through various means; sidewalks, multi-use paths, greenways and others. The type and location of these connections will depend on natural features, existing development, topography, the location of the green spaces and the availability of land and easements. This would require a concerted effort and collaboration of
4.0 :: Recommendations
Perimeter Park
Perimeter Park - Preliminary Master Plan
Source: Dunwoody
Perimeter @ The Center - Future Focus - 2011 LCI Update - Final Report
Prepared by Sizemore Group In Collaboration with Huntley Partners and Kimley-Horn and Associates82
collaboration between the jurisdictions, school board and other partners that are involved. Locating schools closer to residents and providing a good multiple mode connectivity will be of great importance. Enabling children to walk to school would improve the health and quality of life. Locating the schools with a link to greenway system will enable connectivity to other nodes and neighborhoods. As the regulatory framework is amended to implement the LCI vision, guidelines and framework for establishing the required schools should be addressed.
public-private partnership.
Dunwoody has a Park Master Plan that proposes new parks and renovations to existing parks and trail network to connect them. Brook Run Park is the largest park in Dunwoody with various active and passive recreational amenities. Development of new parks in Perimeter has to be done in conjunction with these parks and available amenities. PCIDs can work with corporations, sponsors and parks system (in all three jurisdictions) to promote programs, advertising, education, marketing and branding to enhance the quality of life.
Culture
Promoting cultural activities will add another dimension to quality of life at Perimeter. The presence of Art Institute of Atlanta and Spruill Center for Arts can help spur more art focused activities. Both private and non-profits can take a lead in building this element, PCIDs can assist in facilitating more activities. Dunwoody recognizes such a need and is making efforts to attract more facilities and activities. Attracting a regionally, nationally or internationally recognized museum, art gallery, or a theatre can boost this effort. Locating such a facility to be part of the civic green or civic square or Amenity-Rich Boulevard will add another dimension to the quality of life in Perimeter.
Schools
Schools are a critical component. As more resident population flows into Perimeter there will be need for more schools. The type of housing and demographics are likely to attract the Gen Y generation that is likely to have younger children. The initial need may be more for the elementary and middle schools. Establishing good private, charter and/or public schools will be important in attracting the future population into Perimeter. This is a complex issue that requires an involved understanding and
4.0 :: Recommendations
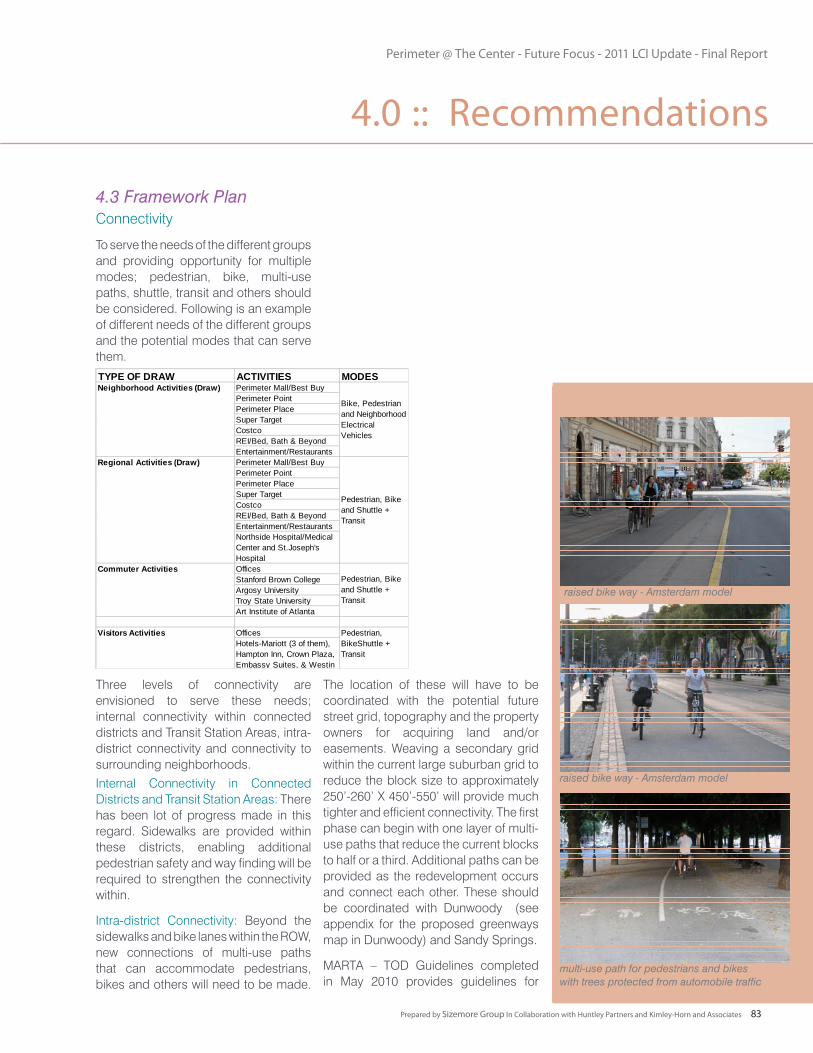
Perimeter @ The Center - Future Focus - 2011 LCI Update - Final Report
Prepared by Sizemore Group In Collaboration with Huntley Partners and Kimley-Horn and Associates 83
Connectivity
To serve the needs of the different groups and providing opportunity for multiple modes; pedestrian, bike, multi-use paths, shuttle, transit and others should be considered. Following is an example of different needs of the different groups and the potential modes that can serve them.
Three levels of connectivity are envisioned to serve these needs; internal connectivity within connected districts and Transit Station Areas, intra-district connectivity and connectivity to surrounding neighborhoods.Internal Connectivity in Connected Districts and Transit Station Areas: There has been lot of progress made in this regard. Sidewalks are provided within these districts, enabling additional pedestrian safety and way finding will be required to strengthen the connectivity within.
Intra-district Connectivity: Beyond the sidewalks and bike lanes within the ROW, new connections of multi-use paths that can accommodate pedestrians, bikes and others will need to be made.
The location of these will have to be coordinated with the potential future street grid, topography and the property owners for acquiring land and/or easements. Weaving a secondary grid within the current large suburban grid to reduce the block size to approximately 250’-260’ X 450’-550’ will provide much tighter and efficient connectivity. The first phase can begin with one layer of multi-use paths that reduce the current blocks to half or a third. Additional paths can be provided as the redevelopment occurs and connect each other. These should be coordinated with Dunwoody (see appendix for the proposed greenways map in Dunwoody) and Sandy Springs.
MARTA – TOD Guidelines completed in May 2010 provides guidelines for
4.3 Framework Plan
TYPE OF DRAW ACTIVITIES MODESPerimeter Mall/Best BuyPerimeter PointPerimeter PlaceSuper TargetCostcoREI/Bed, Bath & BeyondEntertainment/RestaurantsPerimeter Mall/Best BuyPerimeter PointPerimeter PlaceSuper TargetCostcoREI/Bed, Bath & BeyondEntertainment/RestaurantsNorthside Hospital/Medical Center and St.Joseph's HospitalOfficesStanford Brown CollegeArgosy UniversityTroy State UniversityArt Institute of Atlanta
OfficesHotels-Mariott (3 of them), Hampton Inn, Crown Plaza, Embassy Suites, & Westin
Bike, Pedestrian and Neighborhood Electrical Vehicles
Pedestrian, Bike and Shuttle + Transit
Pedestrian, Bike and Shuttle + Transit
Pedestrian, BikeShuttle + Transit
Regional Activities (Draw)
Commuter Activities
Visitors Activities
Neighborhood Activities (Draw)
raised bike way - Amsterdam model
raised bike way - Amsterdam model
multi-use path for pedestrians and bikes with trees protected from automobile traffic
4.0 :: Recommendations
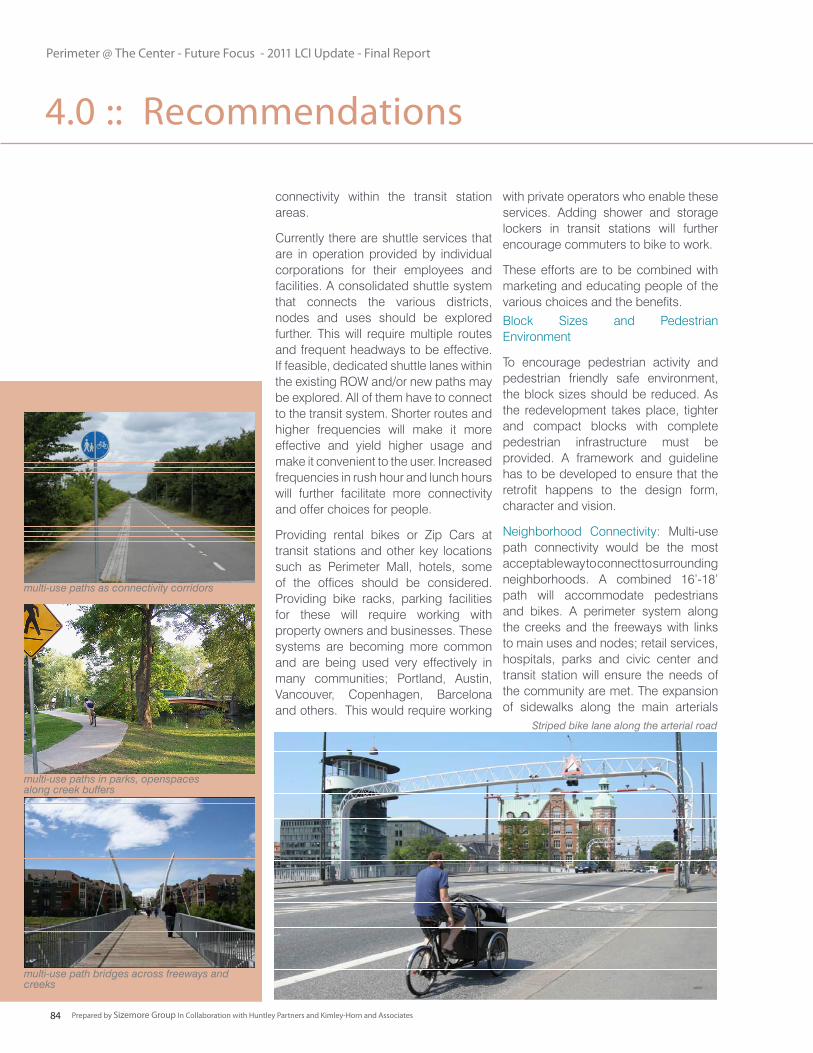
Perimeter @ The Center - Future Focus - 2011 LCI Update - Final Report
Prepared by Sizemore Group In Collaboration with Huntley Partners and Kimley-Horn and Associates84
with private operators who enable these services. Adding shower and storage lockers in transit stations will further encourage commuters to bike to work.
These efforts are to be combined with marketing and educating people of the various choices and the benefits. Block Sizes and Pedestrian Environment
To encourage pedestrian activity and pedestrian friendly safe environment, the block sizes should be reduced. As the redevelopment takes place, tighter and compact blocks with complete pedestrian infrastructure must be provided. A framework and guideline has to be developed to ensure that the retrofit happens to the design form, character and vision.
Neighborhood Connectivity: Multi-use path connectivity would be the most acceptable way to connect to surrounding neighborhoods. A combined 16’-18’ path will accommodate pedestrians and bikes. A perimeter system along the creeks and the freeways with links to main uses and nodes; retail services, hospitals, parks and civic center and transit station will ensure the needs of the community are met. The expansion of sidewalks along the main arterials
connectivity within the transit station areas.
Currently there are shuttle services that are in operation provided by individual corporations for their employees and facilities. A consolidated shuttle system that connects the various districts, nodes and uses should be explored further. This will require multiple routes and frequent headways to be effective. If feasible, dedicated shuttle lanes within the existing ROW and/or new paths may be explored. All of them have to connect to the transit system. Shorter routes and higher frequencies will make it more effective and yield higher usage and make it convenient to the user. Increased frequencies in rush hour and lunch hours will further facilitate more connectivity and offer choices for people.
Providing rental bikes or Zip Cars at transit stations and other key locations such as Perimeter Mall, hotels, some of the offices should be considered. Providing bike racks, parking facilities for these will require working with property owners and businesses. These systems are becoming more common and are being used very effectively in many communities; Portland, Austin, Vancouver, Copenhagen, Barcelona and others. This would require working
Striped bike lane along the arterial road
multi-use paths in parks, openspaces along creek buffers
multi-use paths as connectivity corridors
multi-use path bridges across freeways and creeks
4.0 :: Recommendations
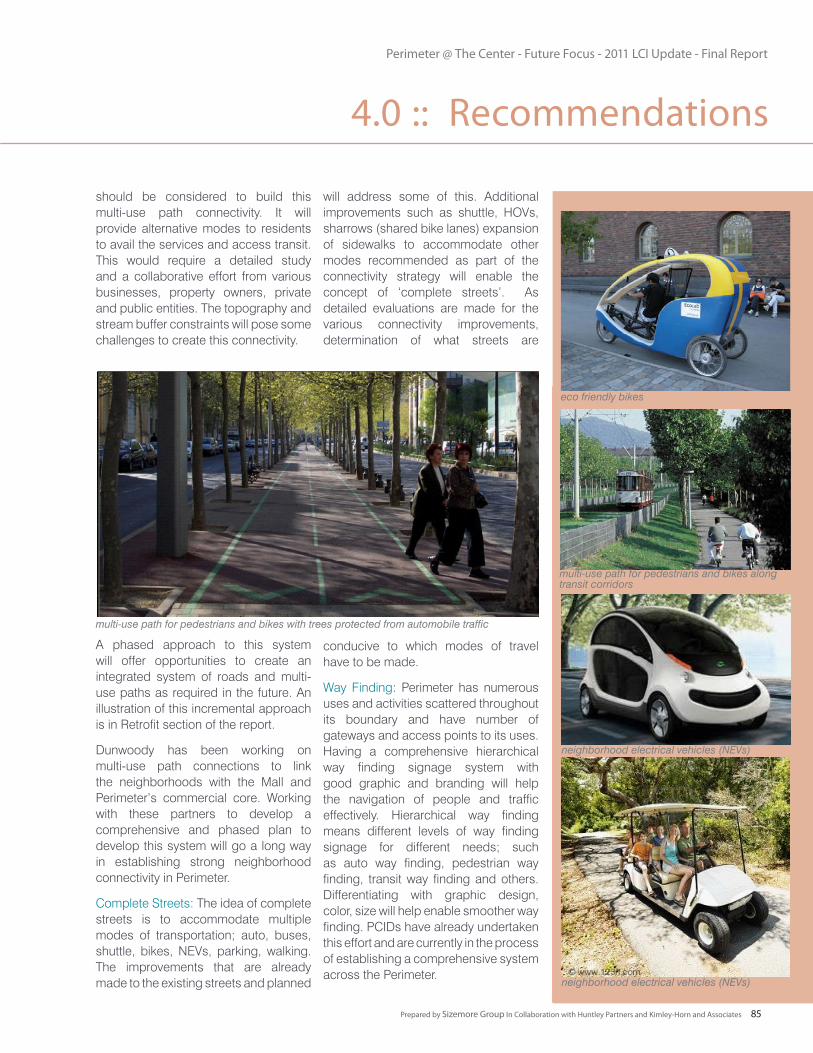
Perimeter @ The Center - Future Focus - 2011 LCI Update - Final Report
Prepared by Sizemore Group In Collaboration with Huntley Partners and Kimley-Horn and Associates 85
should be considered to build this multi-use path connectivity. It will provide alternative modes to residents to avail the services and access transit. This would require a detailed study and a collaborative effort from various businesses, property owners, private and public entities. The topography and stream buffer constraints will pose some challenges to create this connectivity.
A phased approach to this system will offer opportunities to create an integrated system of roads and multi-use paths as required in the future. An illustration of this incremental approach is in Retrofit section of the report.
Dunwoody has been working on multi-use path connections to link the neighborhoods with the Mall and Perimeter’s commercial core. Working with these partners to develop a comprehensive and phased plan to develop this system will go a long way in establishing strong neighborhood connectivity in Perimeter.
Complete Streets: The idea of complete streets is to accommodate multiple modes of transportation; auto, buses, shuttle, bikes, NEVs, parking, walking. The improvements that are already made to the existing streets and planned
will address some of this. Additional improvements such as shuttle, HOVs, sharrows (shared bike lanes) expansion of sidewalks to accommodate other modes recommended as part of the connectivity strategy will enable the concept of ‘complete streets’. As detailed evaluations are made for the various connectivity improvements, determination of what streets are
conducive to which modes of travel have to be made.
Way Finding: Perimeter has numerous uses and activities scattered throughout its boundary and have number of gateways and access points to its uses. Having a comprehensive hierarchical way finding signage system with good graphic and branding will help the navigation of people and traffic effectively. Hierarchical way finding means different levels of way finding signage for different needs; such as auto way finding, pedestrian way finding, transit way finding and others. Differentiating with graphic design, color, size will help enable smoother way finding. PCIDs have already undertaken this effort and are currently in the process of establishing a comprehensive system across the Perimeter.
multi-use path for pedestrians and bikes with trees protected from automobile traffic
multi-use path for pedestrians and bikes along transit corridors
eco friendly bikes
neighborhood electrical vehicles (NEVs)
neighborhood electrical vehicles (NEVs)
4.0 :: Recommendations
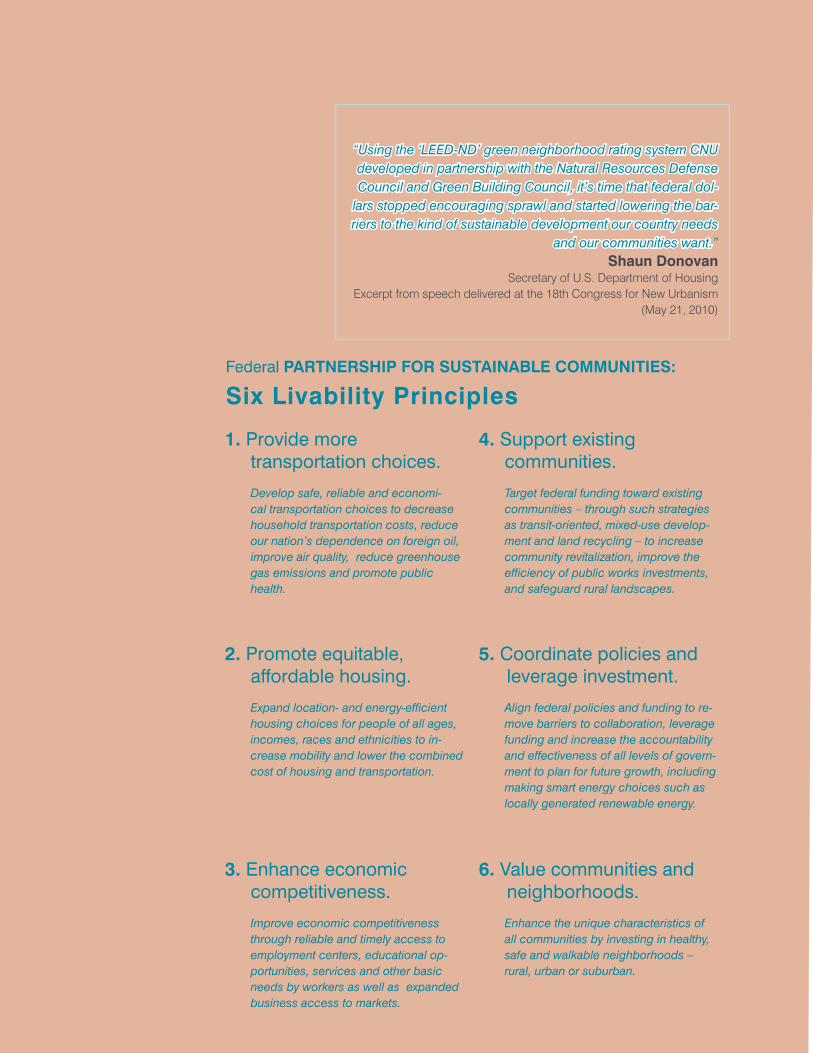
Perimeter @ The Center - Future Focus - 2011 LCI Update - Final Report
Prepared by Sizemore Group In Collaboration with Huntley Partners and Kimley-Horn and Associates86
“Using the ‘LEED-ND’ green neighborhood rating system CNU developed in partnership with the Natural Resources Defense Council and Green Building Council, it’s time that federal dol-
lars stopped encouraging sprawl and started lowering the bar-riers to the kind of sustainable development our country needs
and our communities want.”Shaun Donovan
Secretary of U.S. Department of HousingExcerpt from speech delivered at the 18th Congress for New Urbanism
(May 21, 2010)
6. Value communities and neighborhoods.
Enhance the unique characteristics of all communities by investing in healthy, safe and walkable neighborhoods – rural, urban or suburban.
Federal PARTNERSHIP FOR SUSTAINABLE COMMUNITIES:
Six Livability Principles
1. Provide more transportation choices.
Develop safe, reliable and economi-cal transportation choices to decrease household transportation costs, reduce our nation’s dependence on foreign oil, improve air quality, reduce greenhouse gas emissions and promote public health.
2. Promote equitable, affordable housing.
Expand location- and energy-efficient housing choices for people of all ages, incomes, races and ethnicities to in-crease mobility and lower the combined cost of housing and transportation.
3. Enhance economic competitiveness.
Improve economic competitiveness through reliable and timely access to employment centers, educational op-portunities, services and other basic needs by workers as well as expanded business access to markets.
4. Support existing communities.
Target federal funding toward existing communities – through such strategies as transit-oriented, mixed-use develop-ment and land recycling – to increase community revitalization, improve the efficiency of public works investments, and safeguard rural landscapes.
5. Coordinate policies and leverage investment.
Align federal policies and funding to re-move barriers to collaboration, leverage funding and increase the accountability and effectiveness of all levels of govern-ment to plan for future growth, including making smart energy choices such as locally generated renewable energy.
Perimeter @ The Center - Future Focus - 2011 LCI Update - Final Report
Prepared by Sizemore Group In Collaboration with Huntley Partners and Kimley-Horn and Associates 87
Retrofit illustration model applies the Framework Plan components; sustainable growth management, livability enhancements and connectivity to illustrate the transformation from suburban to urban model of Perimeter. The area chosen for the model is the core of Perimeter – area around the Dunwoody MARTA Station and Perimeter Mall as shown below.
The federal government will begin to use the principles of new urbanism and metrics of LEED ND to guide federal spending to encourage sustainable development pattern that mitigate sprawl.
Sustainable Growth Management
As discussed above, focusing the potential growth demand into the Transit Station areas by creating a high density mixed use walkable transit station areas will provide the various housing options and choices that support the anticipated demand and life-long communities. This will also bring the social and economic diversity. Creating the transit oriented development around the transit will leverage the transit further and contribute to the regional goals of sustainable growth. The retrofit model area is identified as the first phase focus of this effort. This will help achieve jobs to housing balance as well.
Sustainable Design Form Based/ Smart Codes overlay should include sustainable design guidelines to address the water quality & conservation, energy conservation and efficiency design that promote walkable and healthy environments. Offering transit, bike, shuttle and other alternatives to automobile travel will improve the air quality. Incentives should be considered for encouraging sustainable design – LEED ND for neighborhoods and LEED for buildings
4.4 Retrofit Illustration Model – Regional Center to New Urban Model
4.0 :: Recommendations
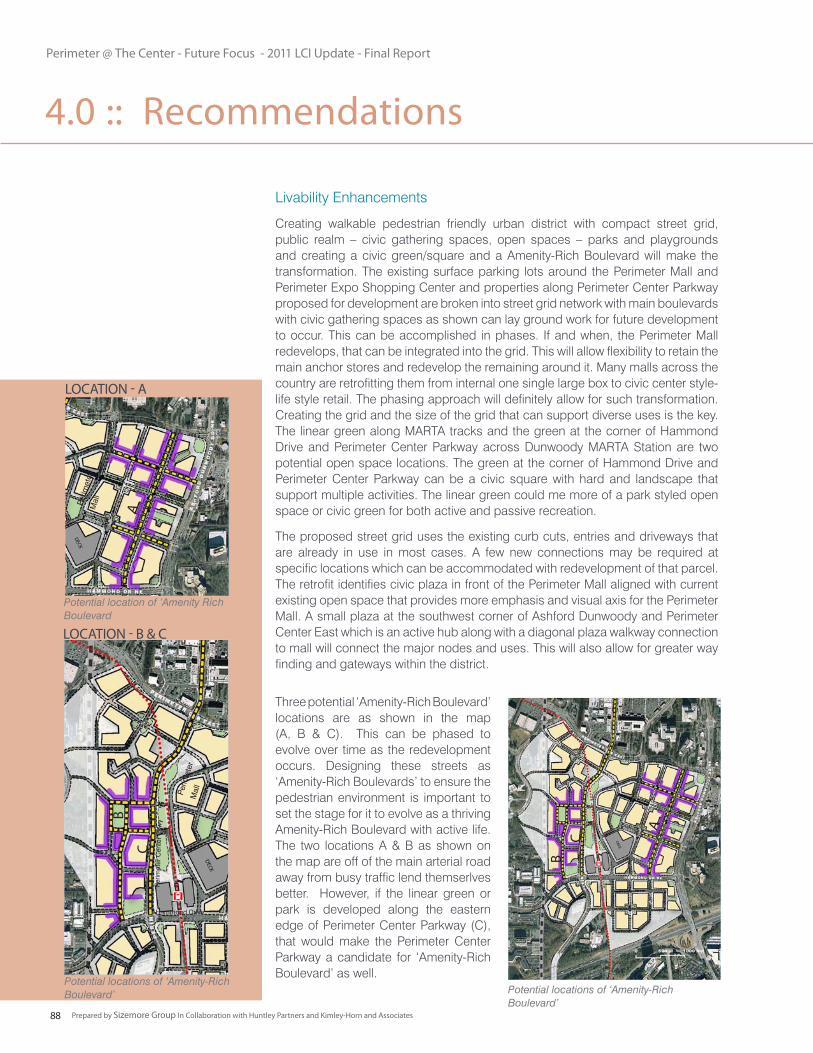
Perimeter @ The Center - Future Focus - 2011 LCI Update - Final Report
Prepared by Sizemore Group In Collaboration with Huntley Partners and Kimley-Horn and Associates88
Livability Enhancements
Creating walkable pedestrian friendly urban district with compact street grid, public realm – civic gathering spaces, open spaces – parks and playgrounds and creating a civic green/square and a Amenity-Rich Boulevard will make the transformation. The existing surface parking lots around the Perimeter Mall and Perimeter Expo Shopping Center and properties along Perimeter Center Parkway proposed for development are broken into street grid network with main boulevards with civic gathering spaces as shown can lay ground work for future development to occur. This can be accomplished in phases. If and when, the Perimeter Mall redevelops, that can be integrated into the grid. This will allow flexibility to retain the main anchor stores and redevelop the remaining around it. Many malls across the country are retrofitting them from internal one single large box to civic center style-life style retail. The phasing approach will definitely allow for such transformation. Creating the grid and the size of the grid that can support diverse uses is the key. The linear green along MARTA tracks and the green at the corner of Hammond Drive and Perimeter Center Parkway across Dunwoody MARTA Station are two potential open space locations. The green at the corner of Hammond Drive and Perimeter Center Parkway can be a civic square with hard and landscape that support multiple activities. The linear green could me more of a park styled open space or civic green for both active and passive recreation.
The proposed street grid uses the existing curb cuts, entries and driveways that are already in use in most cases. A few new connections may be required at specific locations which can be accommodated with redevelopment of that parcel. The retrofit identifies civic plaza in front of the Perimeter Mall aligned with current existing open space that provides more emphasis and visual axis for the Perimeter Mall. A small plaza at the southwest corner of Ashford Dunwoody and Perimeter Center East which is an active hub along with a diagonal plaza walkway connection to mall will connect the major nodes and uses. This will also allow for greater way finding and gateways within the district.
Three potential ‘Amenity-Rich Boulevard’ locations are as shown in the map (A, B & C). This can be phased to evolve over time as the redevelopment occurs. Designing these streets as ‘Amenity-Rich Boulevards’ to ensure the pedestrian environment is important to set the stage for it to evolve as a thriving Amenity-Rich Boulevard with active life. The two locations A & B as shown on the map are off of the main arterial road away from busy traffic lend themserlves better. However, if the linear green or park is developed along the eastern edge of Perimeter Center Parkway (C), that would make the Perimeter Center Parkway a candidate for ‘Amenity-Rich Boulevard’ as well.
Potential locations of ‘Amenity-Rich Boulevard’
Potential locations of ‘Amenity-Rich Boulevard’
Potential location of ‘Amenity Rich Boulevard
4.0 :: Recommendations
LOCATION - A
LOCATION - B & C
B
B
A
A
C
C
Perim
eter
M
all
Perim
eter
M
all
Per
imet
er C
ente
r P
kwy
Hammond Drive
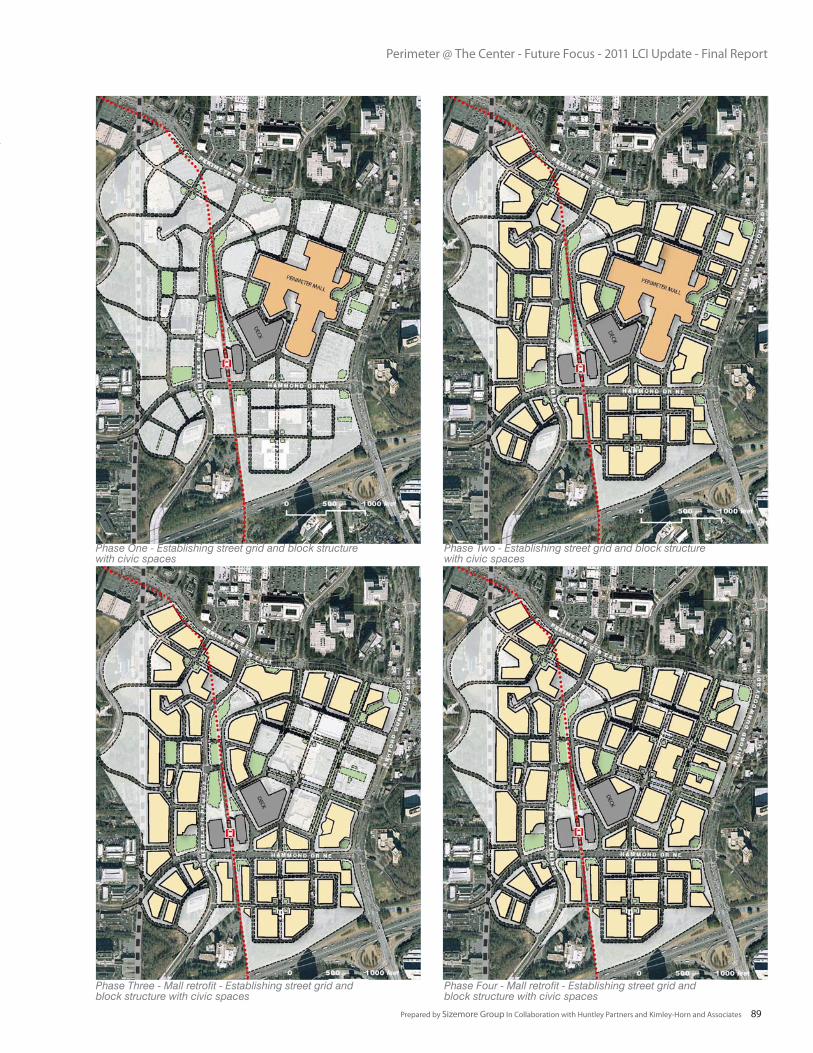
Perimeter @ The Center - Future Focus - 2011 LCI Update - Final Report
Prepared by Sizemore Group In Collaboration with Huntley Partners and Kimley-Horn and Associates 89
Phase Three - Mall retrofit - Establishing street grid and block structure with civic spaces
Phase Four - Mall retrofit - Establishing street grid and block structure with civic spaces
Phase Two - Establishing street grid and block structure with civic spaces
Phase One - Establishing street grid and block structure with civic spaces

Perimeter @ The Center - Future Focus - 2011 LCI Update - Final Report
Prepared by Sizemore Group In Collaboration with Huntley Partners and Kimley-Horn and Associates90
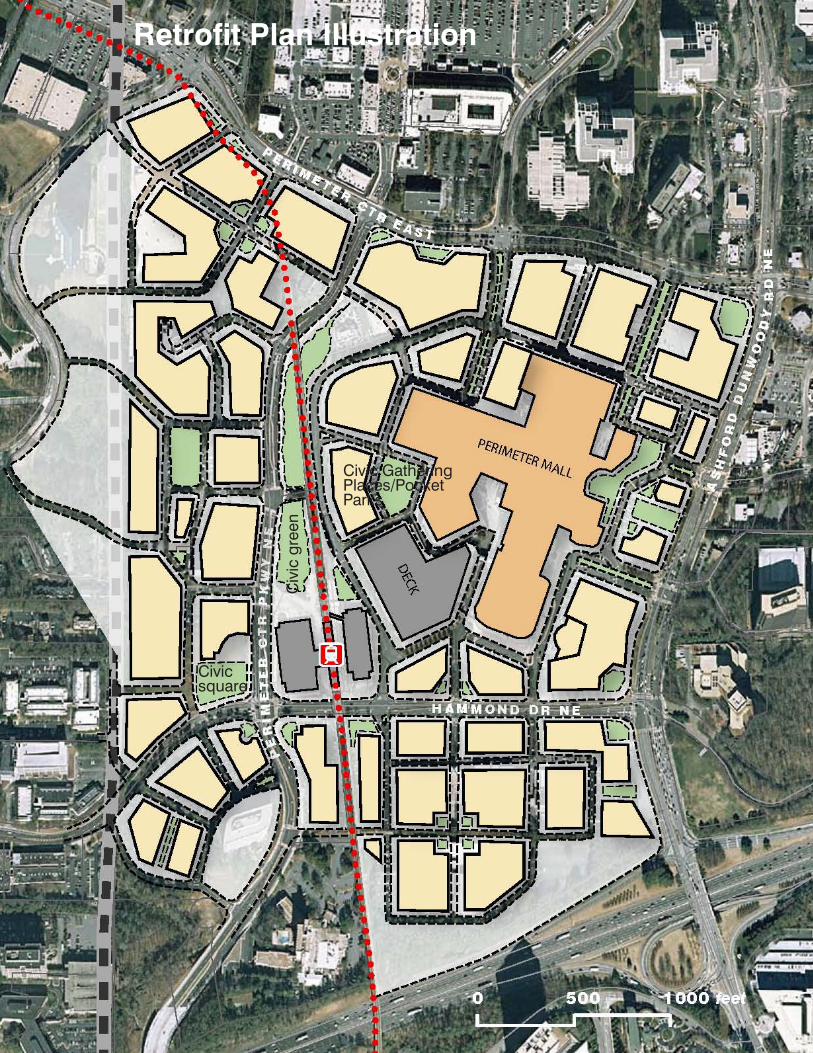
Perimeter @ The Center - Future Focus - 2011 LCI Update - Final Report
Prepared by Sizemore Group In Collaboration with Huntley Partners and Kimley-Horn and Associates 91
Civ
ic g
reen
Civic square
Civic Gathering Places/Pocket Parks
Retrofit Plan Illustration
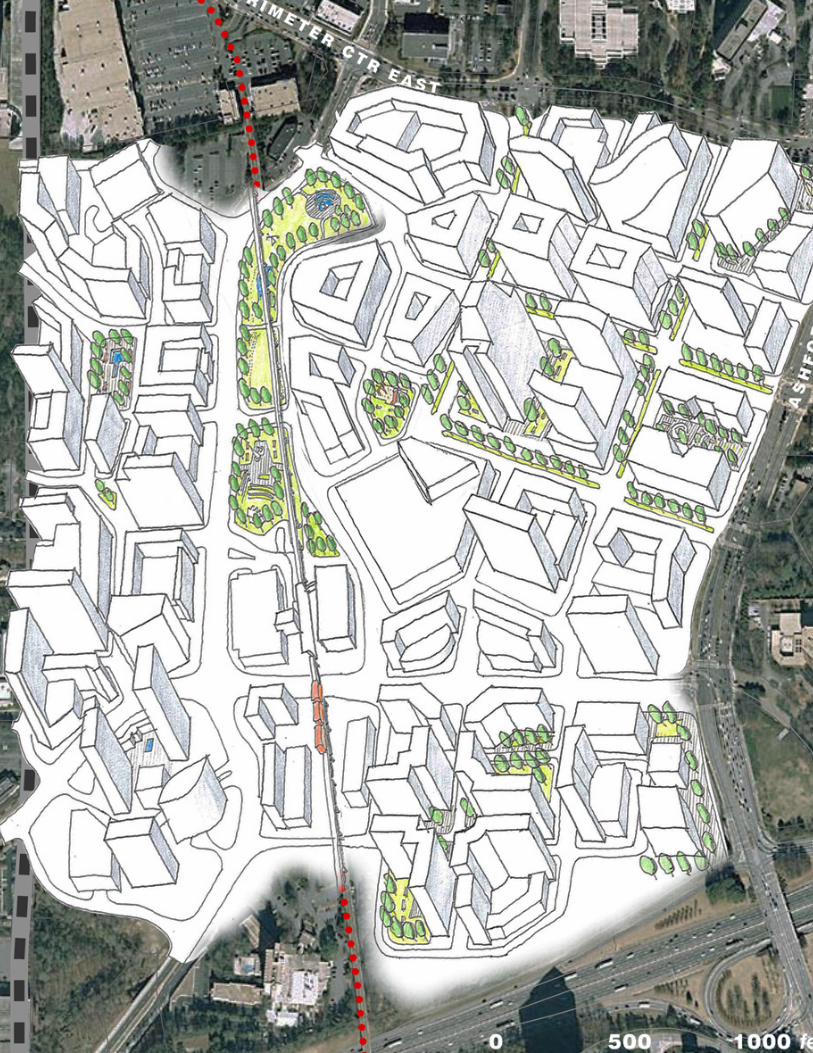
Perimeter @ The Center - Future Focus - 2011 LCI Update - Final Report
Prepared by Sizemore Group In Collaboration with Huntley Partners and Kimley-Horn and Associates92
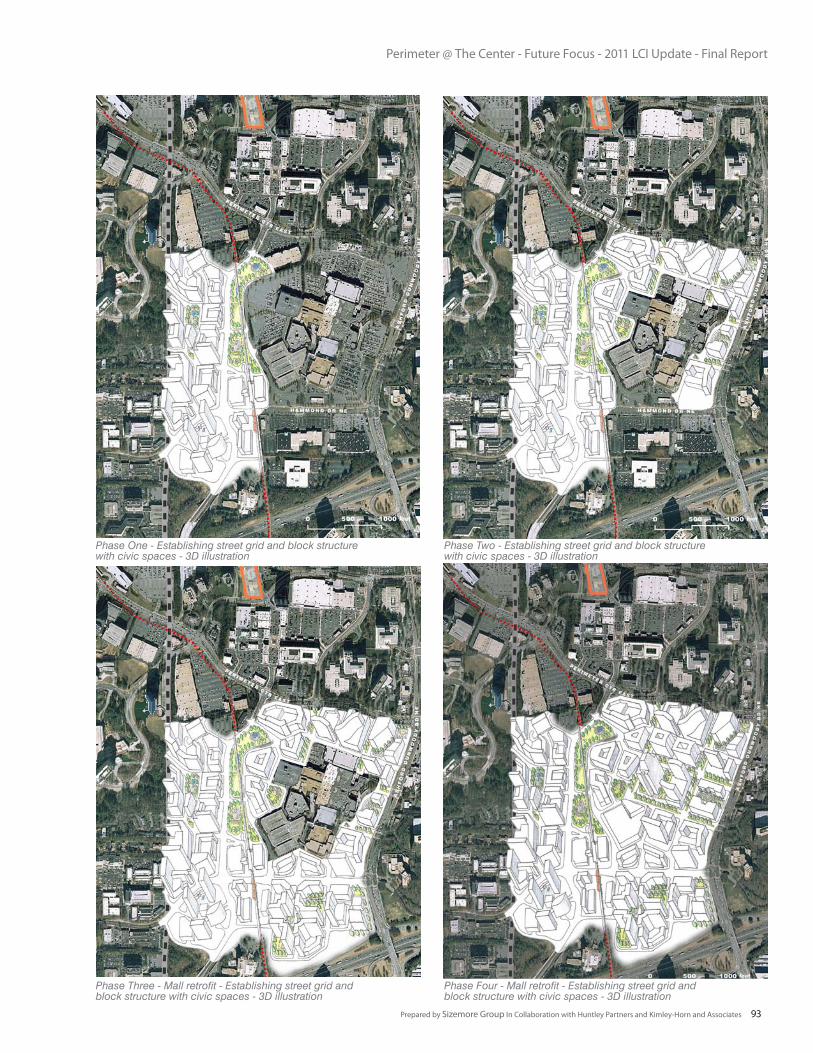
Perimeter @ The Center - Future Focus - 2011 LCI Update - Final Report
Prepared by Sizemore Group In Collaboration with Huntley Partners and Kimley-Horn and Associates 93
Phase Three - Mall retrofit - Establishing street grid and block structure with civic spaces - 3D illustration
Phase Four - Mall retrofit - Establishing street grid and block structure with civic spaces - 3D illustration
Phase Two - Establishing street grid and block structure with civic spaces - 3D illustration
Phase One - Establishing street grid and block structure with civic spaces - 3D illustration
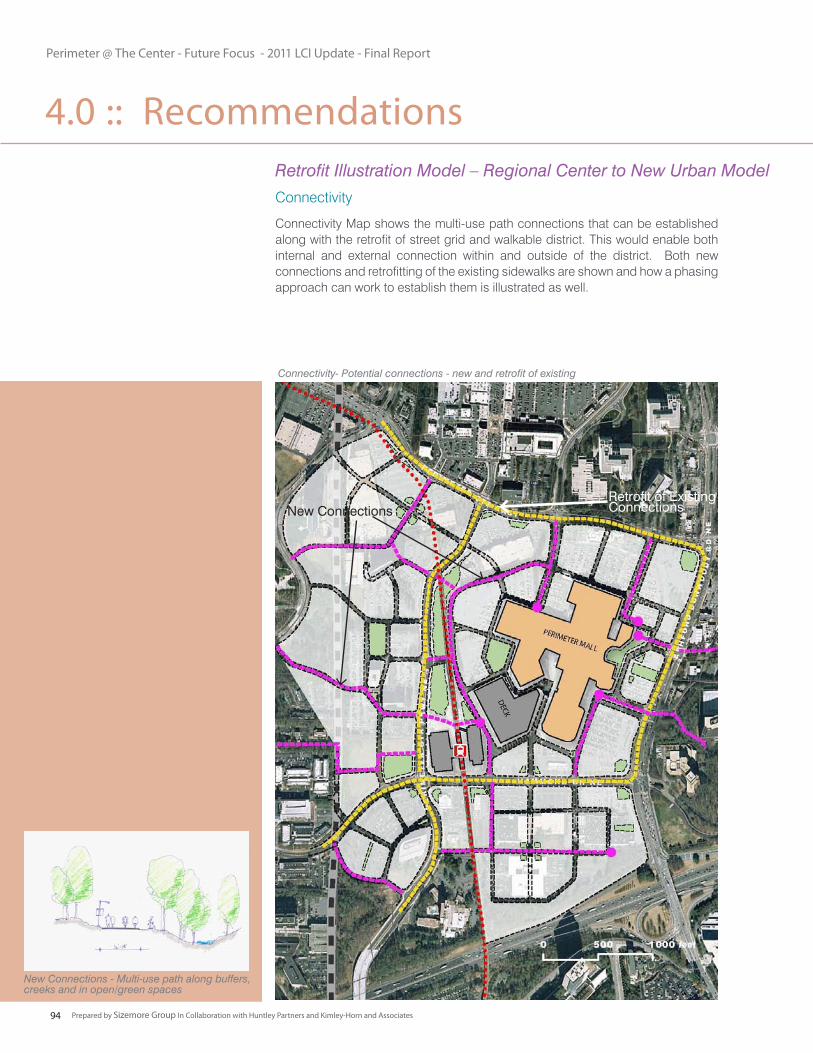
Perimeter @ The Center - Future Focus - 2011 LCI Update - Final Report
Prepared by Sizemore Group In Collaboration with Huntley Partners and Kimley-Horn and Associates94
Connectivity
Connectivity Map shows the multi-use path connections that can be established along with the retrofit of street grid and walkable district. This would enable both internal and external connection within and outside of the district. Both new connections and retrofitting of the existing sidewalks are shown and how a phasing approach can work to establish them is illustrated as well.
Retrofit Illustration Model – Regional Center to New Urban Model
Connectivity- Potential connections - new and retrofit of existing
New Connections - Multi-use path along buffers, creeks and in open/green spaces
New ConnectionsRetrofit of Existing Connections
4.0 :: Recommendations
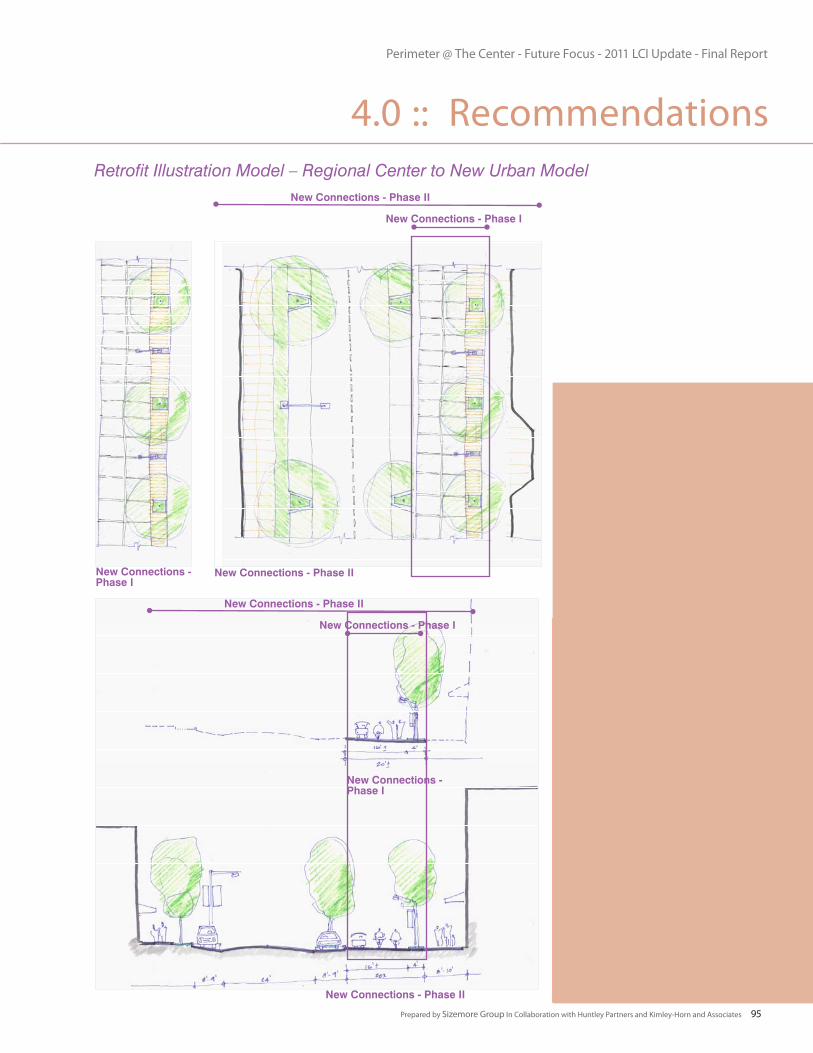
Perimeter @ The Center - Future Focus - 2011 LCI Update - Final Report
Prepared by Sizemore Group In Collaboration with Huntley Partners and Kimley-Horn and Associates 95
Retrofit Illustration Model – Regional Center to New Urban Model
New Connections - Phase I
New Connections - Phase I
New Connections - Phase II
New Connections - Phase II
New Connections - Phase II
New Connections - Phase II
New Connections - Phase I
New Connections - Phase I
4.0 :: Recommendations
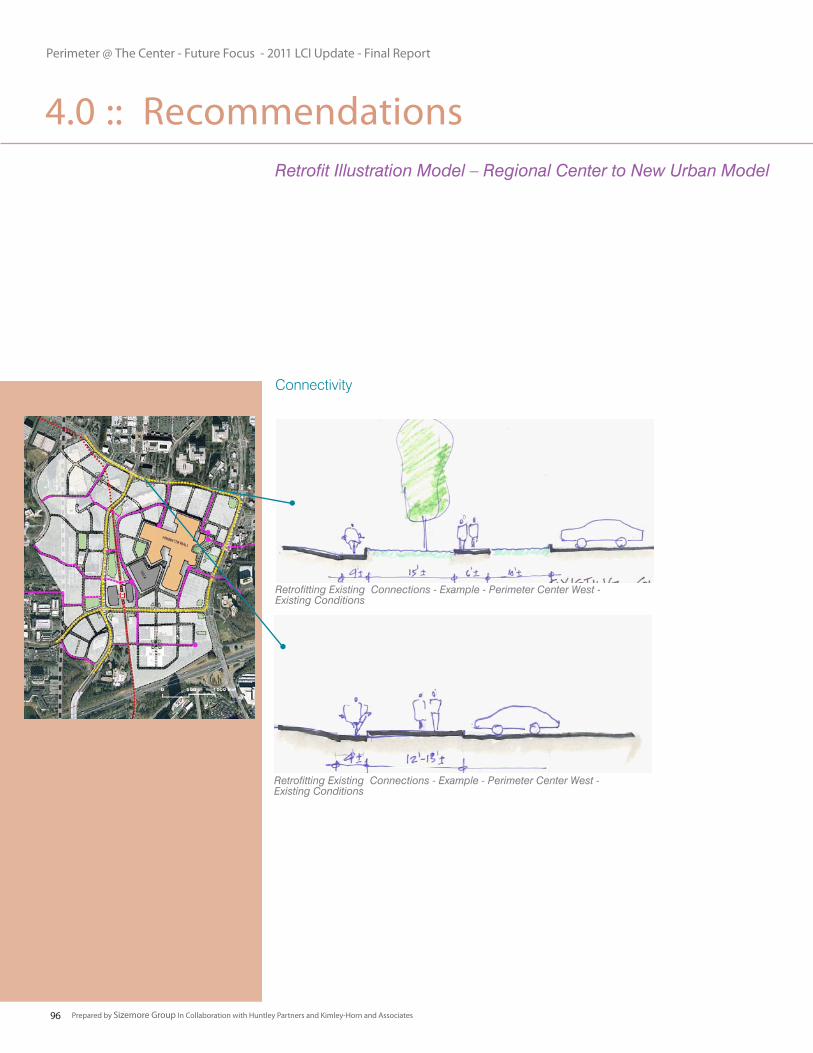
Perimeter @ The Center - Future Focus - 2011 LCI Update - Final Report
Prepared by Sizemore Group In Collaboration with Huntley Partners and Kimley-Horn and Associates96
Connectivity
Retrofit Illustration Model – Regional Center to New Urban Model
Retrofitting Existing Connections - Example - Perimeter Center West - Existing Conditions
Retrofitting Existing Connections - Example - Perimeter Center West - Existing Conditions
4.0 :: Recommendations
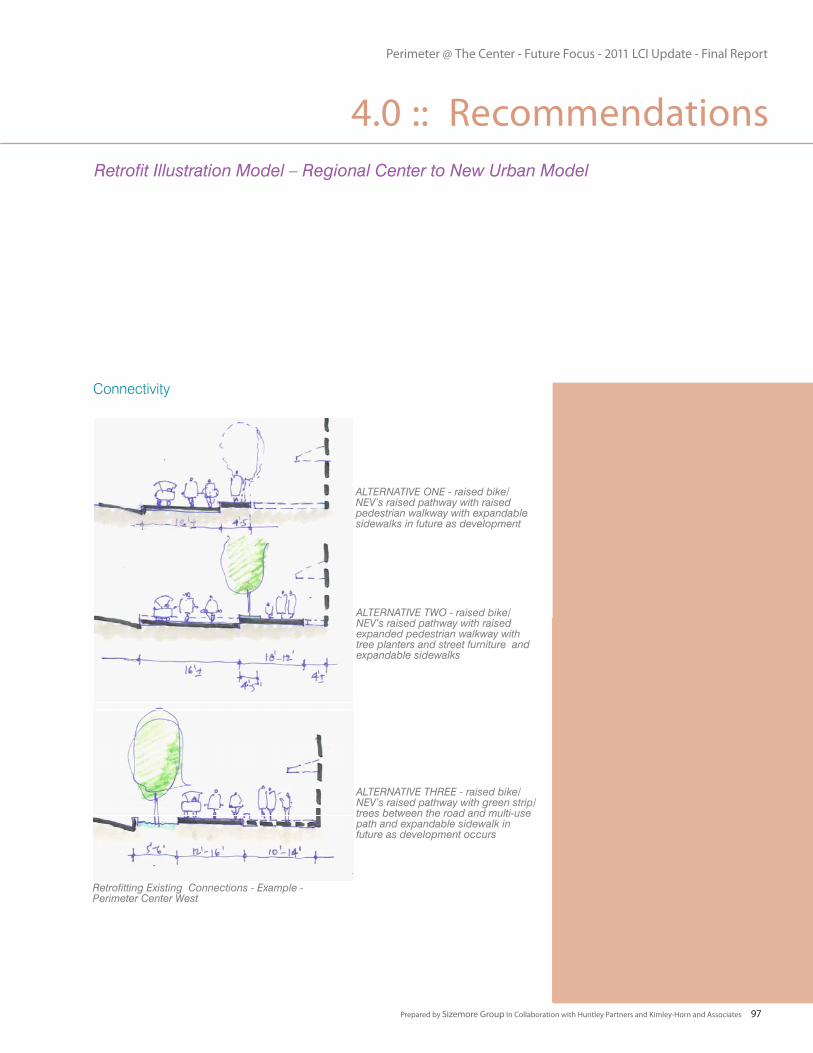
Perimeter @ The Center - Future Focus - 2011 LCI Update - Final Report
Prepared by Sizemore Group In Collaboration with Huntley Partners and Kimley-Horn and Associates 97
Connectivity
Retrofit Illustration Model – Regional Center to New Urban Model
Retrofitting Existing Connections - Example - Perimeter Center West
ALTERNATIVE ONE - raised bike/NEV’s raised pathway with raised pedestrian walkway with expandable sidewalks in future as development
ALTERNATIVE TWO - raised bike/NEV’s raised pathway with raised expanded pedestrian walkway with tree planters and street furniture and expandable sidewalks
ALTERNATIVE THREE - raised bike/NEV’s raised pathway with green strip/trees between the road and multi-use path and expandable sidewalk in future as development occurs
4.0 :: Recommendations

Perimeter @ The Center - Future Focus - 2011 LCI Update - Final Report
Prepared by Sizemore Group In Collaboration with Huntley Partners and Kimley-Horn and Associates98

Perimeter @ The Center - Future Focus - 2011 LCI Update - Final Report
Prepared by Sizemore Group In Collaboration with Huntley Partners and Kimley-Horn and Associates 99
5 Implementation

Perimeter @ The Center - Future Focus - 2011 LCI Update - Final Report
Prepared by Sizemore Group In Collaboration with Huntley Partners and Kimley-Horn and Associates100
Perimeter @ The Center - Future Focus - 2011 LCI Update - Final Report
Prepared by Sizemore Group In Collaboration with Huntley Partners and Kimley-Horn and Associates 101
The implementation framework is created for Perimeter to achieve the goals of the LCI program, community vision and the LCI Framework Plan. The LCI update further promotes the efficient land use and growth management, sustainable retrofit, integrated transit to promote alternative modes and sustainable living, enhanced internal and external connectivity and quality of life. All of these goals are targeted toward achieving a sustainable transformation of Perimeter from suburban to urban thriving mixed-use community - a premier livable center -
The implementation of the LCI Vision and Framework Plan will require collaboration of many stakeholders; Sandy Springs, Dunwoody, DeKalb, Fulton, property owners, businesses, development community, corporations, MARTA, ARC, GDOT, non-profits and others. The initiatives and efforts fall in both private and public sector realm. PCIDs leadership has been successfully implementing initiatives and projects that include efforts from private and public sector and they have established good partnerships with the various partners to realize the common vision.
Since the inception of the LCI Plan in 2001, the PCIDs have worked towards creating an effective implementation structure to execute transportation projects and planning efforts. Working with the DeKalb and Fulton Counties and GDOT guidelines have established program managers for their projects. They pro-actively move forward with design work on projects that would be funded in the future. This has enabled them to fast track projects and also be competitive for the funds. Along with implementing the projects, PCIDs continue their active involvement in attracting high quality developers in creating high quality mixed-use projects in Perimeter. The PCIDs will ensure that efforts are made to create a cross-jurisdictional overlay, collaborative
zoning and standards. Examples of multi-jurisdictional standards may be: lighting, ordinances, zoning and way finding.
The implementation framework includes transportation projects and planning initiatives. The implementation strategies set the framework for development, implementation of projects and planning initiatives. Following are the implementation strategies.
Sustainable Growth Management
Form Based/Smart Code Overlay In order to realize the vision, the current zoning regulations have to be modified to reconcile with the adopted comprehensive plans of Dunwoody, Sandy Springs and DeKalb. A sustainable form based code or a smart code overlay needs to be established for the Perimeter to address the use, density, height, public realm, street section, neighborhood design, architecture and urban design, open spaces and other amenities. This should address the Transit Station Areas, its form and character clearly as well. Establishing this regulatory framework provides a clear picture of Perimeter’s vision to the development community without any ambiguity. It will also help them with clearer pro-forma understanding and securing financing. The code should establish the housing options and choices that are recommended. It should also provide guidelines for comprehensive stormwater management strategy that can facilitate combined systems versus parcel based.
Incentives
Development incentives should be considered for developments as a trade off for providing community amenities beyond the minimum requirements such as parks, green spaces, right of way for multi-use paths and other connectivity, shared parking, work force
5.0 :: Implementation5.1 Implementation Strategies
Perimeter @ The Center - Future Focus - 2011 LCI Update - Final Report
Prepared by Sizemore Group In Collaboration with Huntley Partners and Kimley-Horn and Associates102
development that can benefit everyone involved. This can help secure the financing at lower borrowing costs. This will not only help the debt servicing but will leverage the resources further.
Transit Station Areas
A detailed Station Area Plan should be undertaken for the Transit Station Areas to layout a plan that delineates the public realm, open spaces, street grid, connectivity and others. Developing these plans will inform the changes required for the form based code or smart code overlay district. The first priority would be the Dunwoody Station Transit Village. This focused plan will provide opportunity to involve the property owners and an effective utilization of land, infrastructure, transit and resources.
Livability Enhancements
Civic Square
Establishing the location of the civic square/green will put a stake in the ground for the future transformation. PCIDs should work with the property owners and MARTA and other partners to determine the location and the size. This should be followed with acquisition of land, planning and design. The realization of this will require a public-private partnership. Creating an outdoor space or amphitheater for multi-use activities should be part of this effort.
Amenity Rich Boulevard
Creating an Amenity Rich Boulevard will have to be done in a phased manner. Working with Perimeter Mall owners undertake transformation of the driveways into streets with streetscapes. Identify the phasing approach of these segments of improvements. Work with GID Urban Development Group in creating an Amenity Rich Boulevard as part of the high street development. Develop a detailed concept design of the Amenity Rich Boulevard as a model that can be adopted to the Amenity Rich
housing, schools, civic facilities and amenities such as YMCA, library, city hall, community center, energy efficiency and innovative green projects, LEED and LEED ND projects and others. The incentives could include additional density or FAR, tax incentives and infrastructure funding.
PCIDs can consider establishing Development Fund that may be funded with additional tax dedicated for special purposes for a specific duration (similar to SPLOST), which can be used for creating the civic square and Amenity Rich Boulevard development. Alternatively, if additional taxing is not feasible, dedicating a portion of current tax to that fund can be considered.
Parking Management
As the growth and higher density redevelopment occurs, there will be additional need and demand for parking. The future demand and growth is likely to replace the existing surface parking lots to parking decks. Efficient and shared use of parking will address the parking needs. A comprehensive phased parking management strategy should be considered that may involve common shared parking between various uses, developments and ownership. Some of the decks could be funded through public private partnership. Integrating these with the transit parking decks should be considered. On street parking for new streets should be added. This comprehensive strategy will offer an opportunity to evaluate the potential of parking fees and the revenue possibilities. A comprehensive parking management study should be undertaken to determine the future strategies, plans and projects.
Joint Development
Joint development could be an effective mechanism to create the Transit Station Areas. A joint partnership between the land owners around the transit stations can enable a comprehensive
5.0 :: Implementation
Perimeter @ The Center - Future Focus - 2011 LCI Update - Final Report
Prepared by Sizemore Group In Collaboration with Huntley Partners and Kimley-Horn and Associates 103
Boulevard design as the implementation occurs. Work with Perimeter Place to incorporate the Amenity Rich Boulevard from Perimeter Center West entrance. When successful in creating the linear green along the MARTA tracks, work with High Street development to make Perimeter Center Parkway frontage conducive to a Amenity Rich Boulevard.
Civic Realm Places
Parks, Open Spaces and Civic Gathering Spaces: Transit Village Plans and the form based code or smart code overlay district should layout the type, size and location of these civic realm spaces for the Perimeter. Work with property owners and jurisdictions to implement in a phased manner as development and redevelopment occurs. Work with property owners to determine the feasibility of some of the existing open spaces to open for public. Incentives to enable this could include the maintenance of these spaces by PCIDs or by deeding the land to jurisdictions it belongs and maintenance by those jurisdictions.
Culture, Art and Entertainment
Work with Art Institute and Spruill Center for the Arts and other institutions to promote and attract more activities. Create a branding and marketing strategy in collaboration with these partners. Provide incentives to attract museums and art shows and cultural activities. The incentives could include tax incentives, land acquisition and infrastructure improvements. Actively attract cultural and entertainment amenities to enhance options and choice. Establish a task force or a committee to undertake this initiative on an on-going basis.
Create Public Arts Program
Working with the various partners, develop and implement a Public Arts Program, which will reinforce Perimeter’s image, branding and civic
center’s identity. Provide community oriented cultural amenities and facilities to support a wide range of arts for children, adults and seniors, including visual, music, dance and literary at the community level. Sponsor and support public and community building events such as wine festivals, food festivals, art fairs, concerts, exercise and fitness program, health awareness drives, and others. Provide public art and structures in civic realm; civic square, plazas, in the form of sculpture, fountains, kiosks, gateways and others. Establish a committee to undertake this initiative on an on-going basis.
Schools
Work with school board and other partners to determine the future needs of the schools and the types. Identify the areas and locations for these schools. Determine the feasibility of private, charter and public schools. Continue to work with the various public and private partners to establish these schools
Safety
Review the data on incidents to determine the type of issues and the locations. Develop mitigation efforts required and work with private and public partners to implement strategies to improve safety. The improvements may include education, additional surveillance, lighting, visual exposure, additional police, security presence and others. This would involve public-private partnership.
Connectivity
Connectivity Study
Undertake a detailed study to determine the various connectivity systems as mentioned above; multi-use paths, bikes, and others. Identify the various projects and work with partners and property owners to implement them in a phased approach.
Shuttle Study
Undertake a shuttle feasibility study to determine the ridership, routes, costs, timings and operational systems.
Transit Station Connectivity
Work with MARTA to develop a detail plan with projects that will enable the transit station to be pedestrian and bike friendly. The detail plan should include enhanced way finding signage to make it easy for transit users to navigate their way to various destinations (hotels, businesses, shops, etc.). Consider providing bike racks, showers and lockers.
Multi-use Paths
Determine the feasibility of retrofitting existing sidewalks to multi-use paths.
Pedestrian Safety
Undertake projects for each of the connected districts to identify the pedestrian safety improvements required and implement the plan.
Way Finding
Develop a comprehensive way finding plan for Perimeter.
5.0 :: Implementation
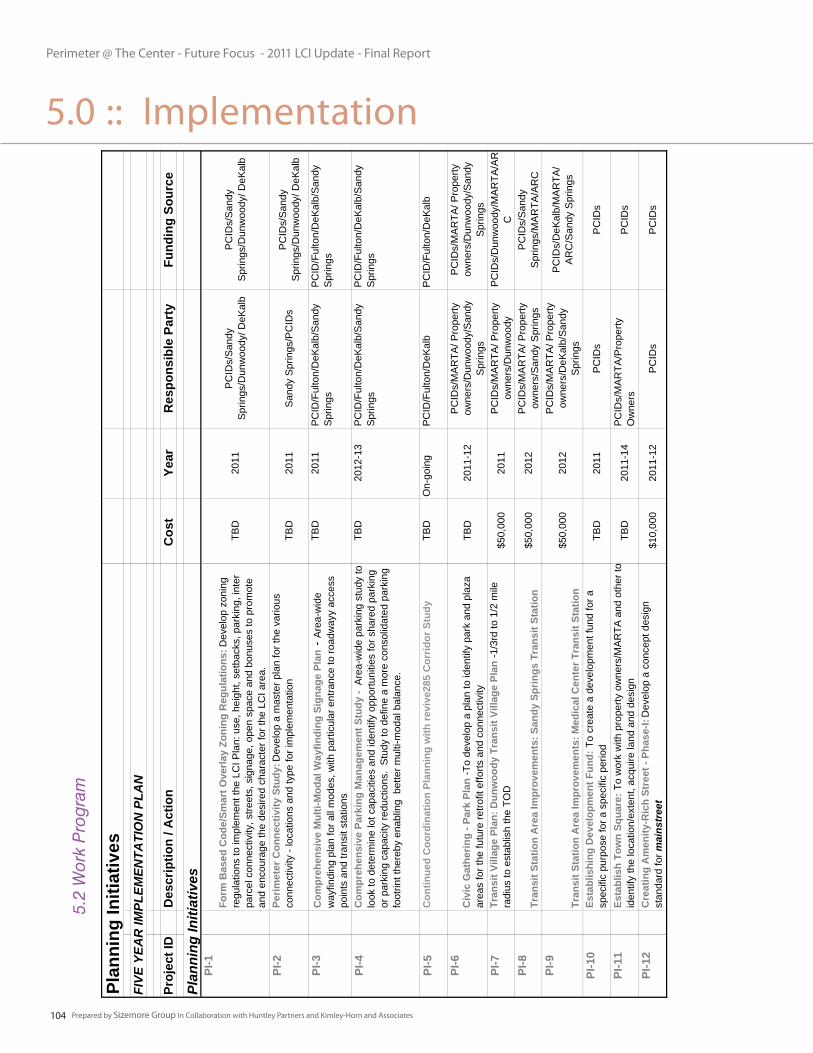
Perimeter @ The Center - Future Focus - 2011 LCI Update - Final Report
Prepared by Sizemore Group In Collaboration with Huntley Partners and Kimley-Horn and Associates104
5.2
Wor
k P
rogr
am
5.0 :: ImplementationPl
anni
ng In
itiat
ives
FIVE
YEA
R IM
PLEM
ENTA
TIO
N P
LAN
Proj
ect I
DD
escr
iptio
n / A
ctio
nC
ost
Year
Res
pons
ible
Par
tyFu
ndin
g So
urce
Plan
ning
Initi
ativ
esPI
-1Fo
rm B
ased
Cod
e/Sm
art O
verla
y Zo
ning
Reg
ulat
ions
: Dev
elop
zon
ing
regu
latio
ns to
impl
emen
t the
LC
I Pla
n: u
se, h
eigh
t, se
tbac
ks, p
arki
ng, i
nter
pa
rcel
con
nect
ivity
, stre
ets,
sig
nage
, ope
n sp
ace
and
bonu
ses
to p
rom
ote
and
enco
urag
e th
e de
sire
d ch
arac
ter f
or th
e LC
I are
a.
TBD
2011
PC
IDs/
San
dyS
prin
gs/D
unw
oody
/ DeK
alb
PC
IDs/
San
dyS
prin
gs/D
unw
oody
/ DeK
alb
PI-2
Perim
eter
Con
nect
ivity
Stu
dy: D
evel
op a
mas
ter p
lan
for t
he v
ario
us
conn
ectiv
ity -
loca
tions
and
type
for i
mpl
emen
tatio
nTB
D20
11S
andy
Spr
ings
/PC
IDs
PC
IDs/
San
dyS
prin
gs/D
unw
oody
/ DeK
alb
PI-3
Com
preh
ensi
ve M
ulti-
Mod
al W
ayfin
ding
Sig
nage
Pla
n - A
rea-
wid
ew
ayfin
ding
pla
n fo
r all
mod
es, w
ith p
artic
ular
ent
ranc
e to
road
way
y ac
cess
po
ints
and
tran
sit s
tatio
ns
TBD
2011
PC
ID/F
ulto
n/D
eKal
b/S
andy
S
prin
gsP
CID
/Ful
ton/
DeK
alb/
San
dyS
prin
gs
PI-4
Com
preh
ensi
ve P
arki
ng M
anag
emen
t Stu
dy -
Are
a-w
ide
park
ing
stud
y to
lo
ok to
det
erm
ine
lot c
apac
ities
and
iden
tify
oppo
rtuni
ties
for s
hare
d pa
rkin
g or
par
king
cap
acity
redu
ctio
ns.
Stu
dy to
def
ine
a m
ore
cons
olid
ated
par
king
fo
otrin
t the
reby
ena
blin
g b
ette
r mul
ti-m
odal
bal
ance
.
TBD
2012
-13
PC
ID/F
ulto
n/D
eKal
b/S
andy
S
prin
gsP
CID
/Ful
ton/
DeK
alb/
San
dyS
prin
gs
PI-5
Con
tinue
d C
oord
inat
ion
Plan
ning
with
revi
ve28
5 C
orrid
or S
tudy
TBD
On-
goin
gP
CID
/Ful
ton/
DeK
alb
PC
ID/F
ulto
n/D
eKal
b
PI-6
Civ
ic G
athe
ring
- Par
k Pl
an -T
o de
velo
p a
plan
to id
entif
y pa
rk a
nd p
laza
ar
eas
for t
he fu
ture
retro
fit e
fforts
and
con
nect
ivity
TBD
2011
-12
PC
IDs/
MA
RTA
/ Pro
perty
ow
ners
/Dun
woo
dy/S
andy
Spr
ings
PC
IDs/
MA
RTA
/ Pro
perty
ow
ners
/Dun
woo
dy/S
andy
Spr
ings
PI-7
Tran
sit V
illag
e Pl
an: D
unw
oody
Tra
nsit
Villa
ge P
lan
-1/3
rd to
1/2
mile
ra
dius
to e
stab
lish
the
TOD
$50,
000
2011
PC
IDs/
MA
RTA
/ Pro
perty
ow
ners
/Dun
woo
dyP
CID
s/D
unw
oody
/MA
RTA
/AR
CPI
-8Tr
ansi
t Sta
tion
Are
a Im
prov
emen
ts: S
andy
Spr
ings
Tra
nsit
Stat
ion
$50,
000
2012
PC
IDs/
MA
RTA
/ Pro
perty
ow
ners
/San
dy S
prin
gsP
CID
s/S
andy
Spr
ings
/MA
RTA
/AR
CPI
-9
Tran
sit S
tatio
n A
rea
Impr
ovem
ents
: Med
ical
Cen
ter T
rans
it St
atio
n$5
0,00
020
12P
CID
s/M
AR
TA/ P
rope
rty
owne
rs/D
eKal
b/S
andy
Spr
ings
PC
IDs/
DeK
alb/
MA
RTA
/A
RC
/San
dy S
prin
gs
PI-1
0Es
tabl
ishi
ng D
evel
opm
ent F
und:
To
crea
te a
dev
elop
men
t fun
d fo
r a
spec
ific
purp
ose
for a
spe
cific
per
iod
TBD
2011
PC
IDs
PC
IDs
PI-1
1Es
tabl
ish
Tow
n Sq
uare
: To
wor
k w
ith p
rope
rty o
wne
rs/M
AR
TA a
nd o
ther
toid
entif
y th
e lo
catio
n/ex
tent
, acq
uire
land
and
des
ign
TBD
2011
-14
PC
IDs/
MA
RTA
/Pro
perty
Ow
ners
PC
IDs
PI-1
2C
reat
ing
Am
enity
-Ric
h St
reet
- Ph
ase-
I: D
evel
op a
con
cept
des
ign
stan
dard
for m
ains
tree
t$1
0,00
020
11-1
2P
CID
sP
CID
s
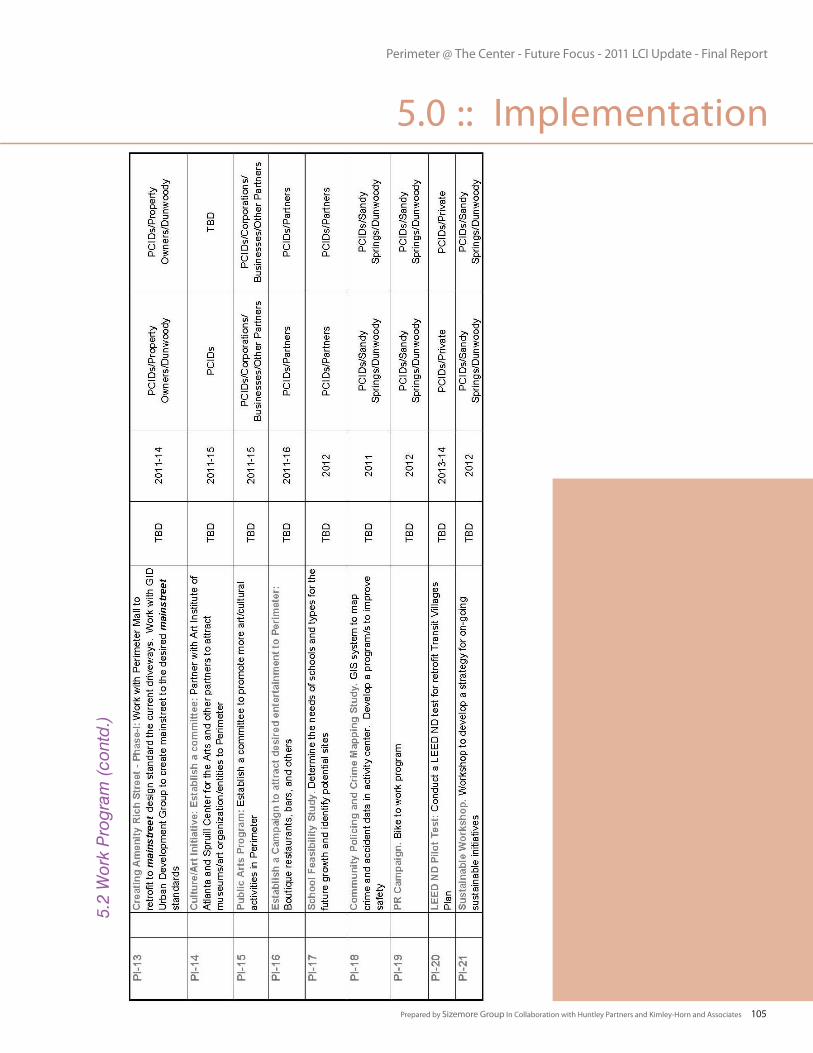
Perimeter @ The Center - Future Focus - 2011 LCI Update - Final Report
Prepared by Sizemore Group In Collaboration with Huntley Partners and Kimley-Horn and Associates 105
5.2
Wor
k P
rogr
am (
cont
d.)
5.0 :: Implementation
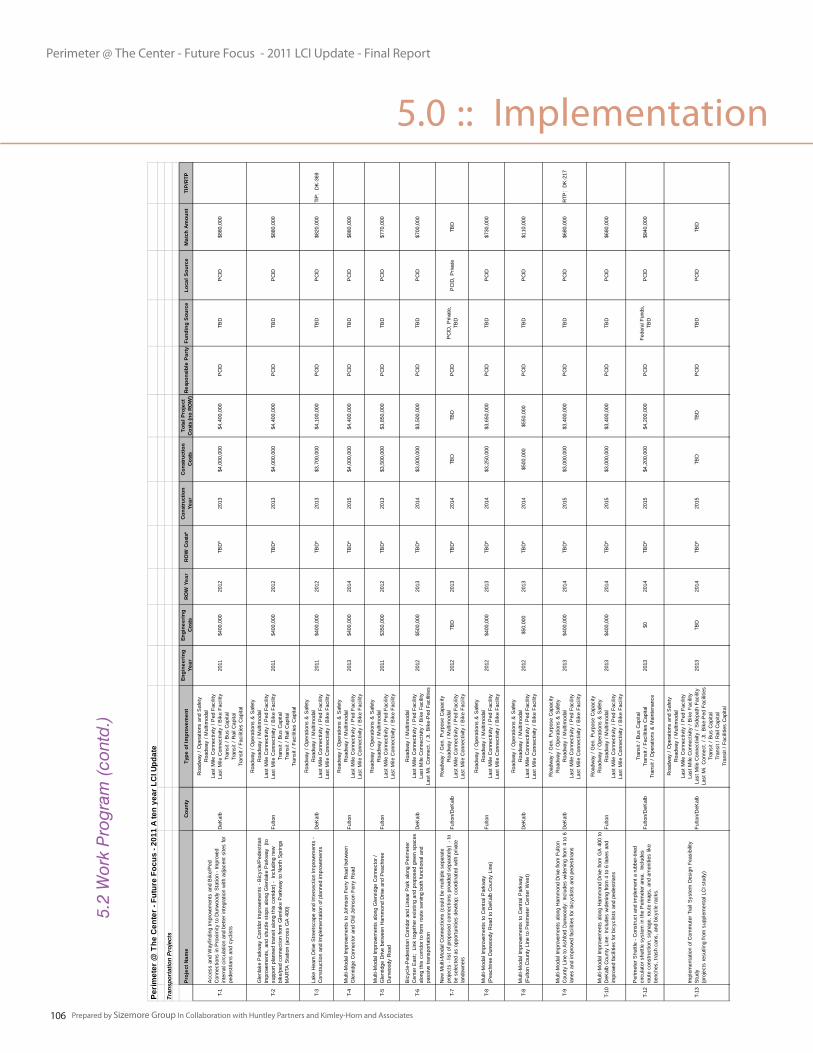
Perimeter @ The Center - Future Focus - 2011 LCI Update - Final Report
Prepared by Sizemore Group In Collaboration with Huntley Partners and Kimley-Horn and Associates106
5.2
Wor
k P
rogr
am (
cont
d.)
5.0 :: ImplementationPe
rimet
er @
The
Cen
ter -
Fut
ure
Focu
s - 2
011
A te
n ye
ar L
CI U
pdat
e
Tran
spor
tatio
n Pr
ojec
ts
Proj
ect N
ame
Coun
tyTy
pe o
f Im
prov
emen
tEn
gine
erin
g Ye
arEn
gine
erin
g Co
sts
ROW
Yea
rRO
W C
osts
*Co
nstru
ctio
n Ye
arCo
nstru
ctio
n Co
sts
Tota
l Pro
ject
Co
sts
(no
ROW
)Re
spon
sibl
e Pa
rtyFu
ndin
g So
urce
Loca
l Sou
rce
Mat
ch A
mou
ntTI
P/RT
P
T-1
Acc
ess
and
Way
findi
ng Im
prov
emen
ts a
nd B
ike/
Ped
C
onne
ctio
ns in
Pro
xim
ity to
Dun
woo
dy S
tatio
n - I
mpr
oved
in
tern
al c
ircul
atio
n an
d be
tter i
nteg
ratio
n w
ith a
djac
ent s
ites
for
pede
stria
ns a
nd c
yclis
ts
DeK
alb
Roa
dway
/ O
pera
tions
and
Saf
ety
Roa
dway
/ M
ultim
odal
Last
Mile
Con
nect
ivity
/ P
ed F
acili
tyLa
st M
ile C
onne
ctivi
ty /
Bik
e Fa
cilit
yTr
ansi
t / B
us C
apita
lTr
ansi
t / R
ail C
apita
lTr
ansi
t / F
acili
ties
Cap
ital
2011
$400
,000
20
12TB
D*
2013
$4,0
00,0
00
$4,4
00,0
00P
CID
TBD
PC
ID$8
80,0
00
T-2
Gle
nlak
e P
arkw
ay C
orrid
or Im
prov
emen
ts -
Bic
ycle
/Ped
estri
an
Impr
ovem
ents
, and
shu
ttle
stop
s al
ong
Gle
nlak
e P
arkw
ay (
to
supp
ort p
lann
ed tr
ansi
t alo
ng th
is c
orrid
or) -
Inc
ludi
ng n
ew
bike
/ped
con
nect
ion
from
Gle
nlak
e P
arkw
ay to
Nor
th S
prin
gs
MA
RTA
Sta
tion
(acr
oss
GA
400
)
Fulto
n
Roa
dway
/ O
pera
tions
& S
afet
yR
oadw
ay /
Mul
timod
alLa
st M
ile C
onne
ctivi
ty /
Ped
Fac
ility
Last
Mile
Con
nect
ivity
/ B
ike
Faci
lity
Tran
sit /
Bus
Cap
ital
Tran
sit /
Rai
l Cap
ital
Tran
sit /
Fac
ilitie
s C
apita
l
2011
$400
,000
20
12TB
D*
2013
$4,0
00,0
00
$4,4
00,0
00P
CID
TBD
PC
ID$8
80,0
00
T-3
Lake
Hea
rn D
rive
Stre
etsc
ape
and
Inte
rsec
tion
Impr
ovem
ents
- C
onst
ruct
ion
and
Impl
emen
tatio
n of
pla
nned
impr
ovem
ents
DeK
alb
Roa
dway
/ O
pera
tions
& S
afet
yR
oadw
ay /
Mul
timod
alLa
st M
ile C
onne
ctivi
ty /
Ped
Fac
ility
Last
Mile
Con
nect
ivity
/ B
ike
Faci
lity
2011
$400
,000
20
12TB
D*
2013
$3,7
00,0
00
$4,1
00,0
00P
CID
TBD
PC
ID$8
20,0
00
TIP
: D
K-3
69
T-4
Mul
ti-M
odal
Impr
ovem
ents
to J
ohns
on F
erry
Roa
d be
twee
n G
lenr
idge
Con
nect
or a
nd O
ld J
ohns
on F
erry
Roa
dFu
lton
Roa
dway
/ O
pera
tions
& S
afet
yR
oadw
ay /
Mul
timod
alLa
st M
ile C
onne
ctivi
ty /
Ped
Fac
ility
Last
Mile
Con
nect
ivity
/ B
ike
Faci
lity
2013
$400
,000
20
14TB
D*
2015
$4,0
00,0
00
$4,4
00,0
00P
CID
TBD
PC
ID$8
80,0
00
T-5
Mul
ti-M
odal
Impr
ovem
ents
alo
ng G
lenr
idge
Con
nect
or /
Gle
nrid
ge D
rive
betw
een
Ham
mon
d D
rive
and
Pea
chtre
e D
unw
oody
Roa
dFu
lton
Roa
dway
/ O
pera
tions
& S
afet
yR
oadw
ay /
Mul
timod
alLa
st M
ile C
onne
ctivi
ty /
Ped
Fac
ility
Last
Mile
Con
nect
ivity
/ B
ike
Faci
lity
2011
$350
,000
20
12TB
D*
2013
$3,5
00,0
00
$3,8
50,0
00P
CID
TBD
PC
ID$7
70,0
00
T-6
Bic
ycle
-Ped
estri
an C
orrid
or a
nd L
inea
r Par
k al
ong
Per
imet
er
Cen
ter E
ast;
Lin
k to
geth
er e
xist
ing
and
prop
osed
gre
en s
pace
s al
ong
this
cor
ridor
to fo
rm ro
ute
serv
ing
both
func
tiona
l and
pa
ssive
tran
spor
tatio
n
DeK
alb
Roa
dway
/ M
ultim
odal
Last
Mile
Con
nect
ivity
/ P
ed F
acili
tyLa
st M
ile C
onne
ctivi
ty /
Bik
e Fa
cilit
yLa
st M
i. C
onne
ct. /
Jt.
Bik
e-P
ed F
acili
ties
2012
$500
,000
20
13TB
D*
2014
$3,0
00,0
00
$3,5
00,0
00P
CID
TBD
PC
ID$7
00,0
00
T-7
New
Mul
ti-M
odal
Con
nect
ions
(cou
ld b
e m
ultip
le s
epar
ate
proj
ects
- lis
t of p
ropo
sed
conn
ectio
ns p
rovid
ed s
epar
atel
y) -
to
be s
elec
ted
as o
ppor
tuni
ties
deve
lop;
coo
rdin
ated
with
priv
ate
land
owne
rs
Fulto
n/D
eKal
b
Roa
dway
/ G
en. P
urpo
se C
apac
ityR
oadw
ay /
Mul
timod
alLa
st M
ile C
onne
ctivi
ty /
Ped
Fac
ility
Last
Mile
Con
nect
ivity
/ B
ike
Faci
lity
2012
TBD
2013
TBD
*20
14TB
DTB
DP
CID
PC
ID, P
rivat
e,
TBD
PC
ID, P
rivat
eTB
D
T-8
Mul
ti-M
odal
Impr
ovem
ents
to C
entra
l Par
kway
(P
each
tree
Dun
woo
dy R
oad
to D
eKal
b C
ount
y Li
ne)
Fulto
n
Roa
dway
/ O
pera
tions
& S
afet
yR
oadw
ay /
Mul
timod
alLa
st M
ile C
onne
ctivi
ty /
Ped
Fac
ility
Last
Mile
Con
nect
ivity
/ B
ike
Faci
lity
2012
$400
,000
20
13TB
D*
2014
$3,2
50,0
00
$3,6
50,0
00P
CID
TBD
PC
ID$7
30,0
00
T-8
Mul
ti-M
odal
Impr
ovem
ents
to C
entra
l Par
kway
(F
ulto
n C
ount
y Li
ne to
Per
imet
er C
ente
r Wes
t)D
eKal
b
Roa
dway
/ O
pera
tions
& S
afet
yR
oadw
ay /
Mul
timod
alLa
st M
ile C
onne
ctivi
ty /
Ped
Fac
ility
Last
Mile
Con
nect
ivity
/ B
ike
Faci
lity
2012
$50,
000
2013
TBD
*20
14$5
00,0
00
$550
,000
PC
IDTB
DP
CID
$110
,000
T-9
Mul
ti-M
odal
Impr
ovem
ents
alo
ng H
amm
ond
Driv
e fro
m F
ulto
n C
ount
y Li
ne to
Ash
ford
Dun
woo
dy: I
nclu
des
wid
enin
g fro
m 4
to 6
la
nes
and
impr
oved
faci
litie
s fo
r bic
yclis
ts a
nd p
edes
trian
sD
eKal
b
Roa
dway
/ G
en. P
urpo
se C
apac
ityR
oadw
ay /
Ope
ratio
ns &
Saf
ety
Roa
dway
/ M
ultim
odal
Last
Mile
Con
nect
ivity
/ P
ed F
acili
tyLa
st M
ile C
onne
ctivi
ty /
Bik
e Fa
cilit
y
2013
$400
,000
20
14TB
D*
2015
$3,0
00,0
00
$3,4
00,0
00P
CID
TBD
PC
ID$6
80,0
00
RTP
: D
K-2
17
T-10
Mul
ti-M
odal
Impr
ovem
ents
alo
ng H
amm
ond
Driv
e fro
m G
A 4
00 to
D
eKal
b C
ount
y Li
ne: I
nclu
des
wid
enin
g fro
m 4
to 6
lane
s an
d im
prov
ed fa
cilit
ies
for b
icyc
lists
and
ped
estri
ans
Fulto
n
Roa
dway
/ G
en. P
urpo
se C
apac
ityR
oadw
ay /
Ope
ratio
ns &
Saf
ety
Roa
dway
/ M
ultim
odal
Last
Mile
Con
nect
ivity
/ P
ed F
acili
tyLa
st M
ile C
onne
ctivi
ty /
Bik
e Fa
cilit
y
2013
$400
,000
20
14TB
D*
2015
$3,0
00,0
00
$3,4
00,0
00P
CID
TBD
PC
ID$6
80,0
00
T-12
Per
imet
er S
huttl
e - C
onst
ruct
and
impl
emen
t a ru
bber
-tire
d ci
rcul
ator
shu
ttle
syst
em in
the
Per
imet
er a
rea.
Inc
lude
sro
ute
cons
truct
ion,
sig
nage
, rou
te m
aps,
and
am
eniti
es li
ke
benc
hes,
tras
h ca
ns, a
nd b
icyc
le ra
cks.
Fulto
n/D
eKal
bTr
ansi
t / B
us C
apita
lTr
ansi
t / F
acili
ties
Cap
ital
Tran
sit /
Ope
ratio
ns &
Mai
nten
ance
2013
$0
2014
TBD
*20
15$4
,200
,000
$4
,200
,000
PC
IDFe
dera
l Fun
ds,
TBD
PC
ID$8
40,0
00
T-13
Impl
emen
tatio
n of
Com
mut
er T
rail
Sys
tem
Des
ign
Feas
ibili
ty
Stu
dy(p
roje
cts
resu
tling
from
sup
plem
enta
l LC
I stu
dy)
Fulto
n/D
eKal
b
Roa
dway
/ O
pera
tions
and
Saf
ety
Roa
dway
/ M
ultim
odal
Last
Mile
Con
nect
ivity
/ P
ed F
acili
tyLa
st M
ile C
onne
ctivi
ty /
Bik
e Fa
cilit
yLa
st M
ile C
onne
ctivi
ty /
Sid
epat
h Fa
cilit
yLa
st M
i. C
onne
ct. /
Jt.
Bik
e-P
ed F
acili
ties
Tran
sit /
Bus
Cap
ital
Tran
sit /
Rai
l Cap
ital
Tran
sit /
Fac
ilitie
s C
apita
l
2013
TBD
2014
TBD
*20
15TB
DTB
DP
CID
TBD
PC
IDTB
D
T-14
Geo
grap
hic
Tran
sit T
rack
ing
Tech
nolo
gy in
tegr
ated
with
S
mar
tpho
ne A
pplic
atio
ns a
nd A
rea
Mes
sage
Boa
rds
(for R
ail,
Bus
es, a
nd S
huttl
es -
Nex
tBus
Tec
hnol
ogy
or s
imila
r)Fu
lton/
DeK
alb
Tran
sit /
Bus
Cap
ital
Tran
sit /
Rai
l Cap
ital
Tran
sit /
Fac
ilitie
s C
apita
lTr
ansi
t / O
pera
tions
& M
aint
enan
ceO
ther
/ TD
M &
Air
Qua
lity
Oth
er /
Pla
nnin
g
2014
$0
2015
0*20
16$1
00,0
00
$100
,000
PC
IDTB
DP
CID
$20,
000
T-15
Enh
ance
d B
us S
tops
for E
xist
ing
Tran
sit S
ervic
es (2
diff
eren
t sc
ales
dep
endi
ng o
n lo
catio
n) -
Don
e in
par
tner
ship
with
GR
TA,
MA
TRA
, priv
ate
land
ow
ners
; pr
ovid
e sh
elte
red
stop
s w
ith tr
ash
cans
, lig
htin
g, b
us s
ched
ules
, are
a di
rect
orie
s
Fulto
n/D
eKal
bTr
ansi
t / B
us C
apita
lTr
ansi
t / F
acili
ties
Cap
ital
Tran
sit /
Ope
ratio
ns &
Mai
nten
ance
2014
$50,
000
2015
TBD
*20
16$5
00,0
00
$550
,000
PC
IDTB
DP
CID
$110
,000
T-16
Acc
ess
and
Way
findi
ng E
nhan
cem
ents
and
Bik
e/P
ed
Con
nect
ions
in P
roxi
mity
to S
andy
Spr
ings
Sta
tion
- Im
prov
ed
inte
rnal
circ
ulat
ion
and
bette
r int
egra
tion
with
adj
acen
t site
s fo
r pe
dest
rians
and
cyc
lists
Fulto
n
Roa
dway
/ O
pera
tions
and
Saf
ety
Roa
dway
/ M
ultim
odal
Last
Mile
Con
nect
ivity
/ P
ed F
acili
tyLa
st M
ile C
onne
ctivi
ty /
Bik
e Fa
cilit
yTr
ansi
t / B
us C
apita
lTr
ansi
t / R
ail C
apita
lTr
ansi
t / F
acili
ties
Cap
ital
2014
$500
,000
20
15TB
D*
2016
$3,5
00,0
00
$4,0
00,0
00P
CID
TBD
PC
ID$8
00,0
00
T-17
Acc
ess
and
Way
findi
ng E
nhan
cem
ents
and
Bik
e/P
ed
Con
nect
ions
in P
roxi
mity
to M
edic
al C
ente
r Sta
tion
- Im
prov
ed
inte
rnal
circ
ulat
ion
and
bette
r int
egra
tion
with
adj
acen
t site
s fo
r pe
dest
rians
and
cyc
lists
Fulto
n
Roa
dway
/ O
pera
tions
and
Saf
ety
Roa
dway
/ M
ultim
odal
Last
Mile
Con
nect
ivity
/ P
ed F
acili
tyLa
st M
ile C
onne
ctivi
ty /
Bik
e Fa
cilit
yTr
ansi
t / B
us C
apita
lTr
ansi
t / R
ail C
apita
lTr
ansi
t / F
acili
ties
Cap
ital
2014
$500
,000
20
15TB
D*
2016
$3,5
00,0
00
$4,0
00,0
00P
CID
TBD
PC
ID$8
00,0
00
T-18
Per
imet
er B
icyc
le P
rogr
am -
Bik
e sh
are
prog
ram
, bic
ycle
fa
cilit
ies
plan
ning
, Per
imet
er b
icyc
le ro
ute
and
faci
litie
s m
ap,
bicy
cle
educ
atio
n an
d ou
treac
h, Z
ipca
r loc
atio
nsFu
lton/
DeK
alb
Last
Mile
Con
nect
ivity
/ B
ike
Faci
lity
Oth
er /
TDM
& A
ir Q
ualit
yO
ther
/ P
lann
ing
2015
$0
2016
0*20
17$5
00,0
00
$500
,000
PC
IDTB
DP
CID
$100
,000
T-19
Mul
ti-M
odal
Impr
ovem
ents
and
Inte
rsec
tion
Impr
ovem
ent
Pro
gram
for P
each
tree-
Dun
woo
dy R
oad
(from
I-28
5 to
Abe
rnat
hy
Roa
d)Fu
lton
Roa
dway
/ O
pera
tions
& S
afet
yR
oadw
ay /
Mul
timod
alLa
st M
ile C
onne
ctivi
ty /
Ped
Fac
ility
Last
Mile
Con
nect
ivity
/ B
ike
Faci
lity
2015
$400
,000
20
16TB
D*
2017
$3,0
00,0
00
$3,4
00,0
00P
CID
TBD
PC
ID$6
80,0
00
TIP
: FN
-AR
-14
4, F
N-2
50
T-20
Mul
ti-M
odal
Impr
ovem
ents
to
Mer
idia
n M
arks
Roa
d / H
ollis
C
obb
Circ
le b
etw
een
Gle
nrid
ge C
onne
ctor
and
Pea
chtre
e R
oad
Fulto
n
Roa
dway
/ O
pera
tions
& S
afet
yR
oadw
ay /
Mul
timod
alLa
st M
ile C
onne
ctivi
ty /
Ped
Fac
ility
Last
Mile
Con
nect
ivity
/ B
ike
Faci
lity
2015
$300
,000
20
16TB
D*
2017
$3,6
00,0
00
$3,9
00,0
00P
CID
TBD
PC
ID$7
80,0
00
T-21
Ash
ford
Dun
woo
dy In
ters
ectio
n Im
prov
emen
ts -
Incl
udes
pe
dest
rian
impr
ovem
ents
at:
- Per
imet
er S
umm
it P
arkw
ay- A
shfo
rd G
reen
- Ash
ford
Par
kway
Nor
th- A
shfo
rd P
arkw
ay S
outh
- Lak
e H
earn
- Mt V
erno
n- A
shfo
rd G
able
s / V
alle
y V
iew
DeK
alb
Roa
dway
/ O
pera
tions
& S
afet
yR
oadw
ay /
Mul
timod
alLa
st M
ile C
onne
ctivi
ty /
Ped
Fac
ility
2015
$300
,000
20
16TB
D*
2017
$3,0
00,0
00
$3,3
00,0
00P
CID
TBD
PC
ID$6
60,0
00
TIP
: D
K-3
01D
K-3
02D
K-3
03D
K-3
04D
K-3
05D
K-3
06D
K-3
13
T-22
Mul
ti-U
se P
aths
con
nect
ive a
nd re
spon
sive
to tr
ail p
lann
ing
in
adja
cent
com
mun
ities
; stu
b ou
t loc
atio
ns fr
om w
ithin
the
PC
IDs
coul
d in
clud
e so
uth
from
Per
imet
er C
ente
r Par
kway
or e
ast f
rom
A
sbur
y S
quar
e or
Per
imet
er C
ente
r Eas
t (on
ly to
fund
por
tion
with
in P
CID
bou
ndar
y)
DeK
alb
Last
Mile
Con
nect
ivity
/ P
ed F
acili
tyLa
st M
ile C
onne
ctivi
ty /
Bik
e Fa
cilit
yLa
st M
i. C
onne
ct. /
Jt.
Bik
e-P
ed F
acili
ties
Oth
er /
TDM
& A
ir Q
ualit
yO
ther
/ P
lann
ing
2015
$200
,000
20
16TB
D*
2017
$2,0
00,0
00
$2,2
00,0
00P
CID
TBD
PC
ID$4
40,0
00
T-23
Mul
ti-M
odal
Impr
ovem
ents
to A
shfo
rd D
unw
oody
Impr
ovem
ents
(to
pot
entia
lly in
clud
e M
ulti-
Use
Pat
h)D
eKal
b
Roa
dway
/ O
pera
tions
& S
afet
yR
oadw
ay /
Mul
timod
alLa
st M
ile C
onne
ctivi
ty /
Ped
Fac
ility
Last
Mile
Con
nect
ivity
/ B
ike
Faci
lity
Last
Mi.
Con
nect
. / J
t. B
ike-
Ped
Fac
ilitie
s
2015
$500
,000
20
16TB
D*
2017
$3,5
00,0
00
$4,0
00,0
00P
CID
TBD
PC
ID$8
00,0
00
Not
es:
Inte
rnal
road
ways
may
be
done
in p
artn
ersh
ip w
ith a
priv
ate
deve
lope
r.P
roje
cts
have
bee
n de
velo
ped
as p
art o
f a p
lann
ing-
leve
l ana
lysi
s. S
ome
maj
or d
esire
d co
mpo
nent
s - s
uch
as la
ndsc
aped
med
ians
, or r
ight
-awa
y fo
r a s
idep
ath
for e
xam
ple
- may
nee
d to
be
incl
uded
as
long
er-te
rm p
hase
d co
mpo
nent
s as
det
erm
ined
dur
ing
corr
idor
-spe
cific
des
ign
proc
esse
s.
Man
y re
late
d/in
tegr
ated
pro
ject
s ar
e di
spla
yed
in g
roup
ings
for t
he p
urpo
ses
of th
is s
tudy
. Th
ese
proj
ects
may
nee
d to
be
furth
er b
roke
n in
to s
mal
ler g
roup
ings
or s
egm
ents
as
dete
rmin
ed th
roug
h th
e pr
oces
s of
impl
emen
tatio
n.
Long
-Ter
m T
rans
port
atio
n Pr
ojec
ts
Proj
ect N
ame
Coun
tyTy
pe o
f Im
prov
emen
tEn
gine
erin
g Co
sts
ROW
Cos
ts*
Cons
truct
ion
Cost
sTo
tal P
roje
ct
Cost
s (n
o RO
W)
Resp
onsi
ble
Party
Fund
ing
Sour
ceLo
cal S
ourc
e M
atch
Am
ount
T-24
Add
ition
al M
ulti-
Mod
al C
onne
ctio
ns (c
ould
be
mul
tiple
sep
arat
e pr
ojec
ts -
list o
f pot
entia
l con
nect
ions
pro
vided
sep
arat
ely)
- to
be
sel
ecte
d as
opp
ortu
nitie
s de
velo
p; c
oord
inat
ed w
ith p
rivat
e la
ndow
ners
Fulto
n/D
eKal
b
Roa
dway
/ G
en. P
urpo
se C
apac
ityR
oadw
ay /
Mul
timod
alLa
st M
ile C
onne
ctivi
ty /
Ped
Fac
ility
Last
Mile
Con
nect
ivity
/ B
ike
Faci
lity
TBD
TBD
*TB
DTB
DP
CID
PC
ID, P
rivat
e,
TBD
PC
ID, P
rivat
eTB
D
T-25
Mul
ti-U
se P
ath
from
Lak
e H
earn
Driv
e to
Per
imet
er S
umm
it P
arkw
ayD
eKal
b
Last
Mile
Con
nect
ivity
/ P
ed F
acili
tyLa
st M
ile C
onne
ctivi
ty /
Bik
e Fa
cilit
yLa
st M
i. C
onne
ct. /
Jt.
Bik
e-P
ed F
acili
ties
Oth
er /
TDM
& A
ir Q
ualit
yO
ther
/ P
lann
ing
$60,
000
TBD
*$6
00,0
00
$660
,000
PC
IDTB
DP
CID
$130
,000
T-26
Mul
ti-U
se P
ath
alon
g P
erim
eter
Cen
ter W
est
DeK
alb
Roa
dway
/ M
ultim
odal
Last
Mile
Con
nect
ivity
/ P
ed F
acili
tyLa
st M
ile C
onne
ctivi
ty /
Bik
e Fa
cilit
yLa
st M
i. C
onne
ct. /
Jt.
Bik
e-P
ed F
acili
ties
$70,
000
TBD
*$7
00,0
00
$770
,000
PC
IDTB
DP
CID
$150
,000
T-27
Mul
ti-U
se P
ath
alon
g P
erim
eter
Cen
ter W
est
Fulto
n
Roa
dway
/ M
ultim
odal
Last
Mile
Con
nect
ivity
/ P
ed F
acili
tyLa
st M
ile C
onne
ctivi
ty /
Bik
e Fa
cilit
yLa
st M
i. C
onne
ct. /
Jt.
Bik
e-P
ed F
acili
ties
$300
,000
TB
D*
$2,0
00,0
00
$2,3
00,0
00P
CID
TBD
PC
ID$4
60,0
00
T-28
Mul
ti-U
se P
ath
alon
g M
t Ver
non
Hig
hway
Fulto
n
Roa
dway
/ M
ultim
odal
Last
Mile
Con
nect
ivity
/ P
ed F
acili
tyLa
st M
ile C
onne
ctivi
ty /
Bik
e Fa
cilit
yLa
st M
i. C
onne
ct. /
Jt.
Bik
e-P
ed F
acili
ties
$300
,000
TB
D*
$2,0
00,0
00
$2,3
00,0
00P
CID
TBD
PC
ID$4
60,0
00
Not
es:
Pro
ject
s lis
ted
in th
e lo
ng-te
rm li
st m
ay b
ecom
e sh
ort-t
erm
prio
ritie
s du
e to
unf
ores
een
circ
umst
ance
s an
d op
portu
nitie
s ov
er th
e ne
xt fi
ve y
ears
.
Inte
rnal
road
ways
may
be
done
in p
artn
ersh
ip w
ith a
priv
ate
deve
lope
r.P
roje
cts
have
bee
n de
velo
ped
as p
art o
f a p
lann
ing-
leve
l ana
lysi
s. S
ome
maj
or d
esire
d co
mpo
nent
s - s
uch
as la
ndsc
aped
med
ians
, or r
ight
-awa
y fo
r a s
idep
ath
for e
xam
ple
- may
nee
d to
be
incl
uded
as
long
er-te
rm p
hase
d co
mpo
nent
s as
det
erm
ined
dur
ing
corr
idor
-spe
cific
des
ign
proc
esse
s.
Man
y re
late
d/in
tegr
ated
pro
ject
s ar
e di
spla
yed
in g
roup
ings
for t
he p
urpo
ses
of th
is s
tudy
. Th
ese
proj
ects
may
nee
d to
be
furth
er b
roke
n in
to s
mal
ler g
roup
ings
or s
egm
ents
as
dete
rmin
ed th
roug
h th
e pr
oces
s of
impl
emen
tatio
n.
*Rig
ht-o
f-way
cos
ts fo
r the
pur
pose
s of
this
stu
dy a
re u
nabl
e to
be
dete
rmin
ed fo
r spe
cific
cor
ridor
s du
e to
the
man
y va
ryin
g an
d po
tent
ially
com
bine
d m
etho
ds o
f pro
cure
men
t. S
ome
right
-of-w
ay m
ay b
e pu
rcha
sed
dire
ctly
; how
ever
, som
e rig
ht-o
f-way
cos
ts m
ay b
e re
duce
d or
elim
inat
ed if
pro
perty
is a
cqui
red
thro
ugh
nego
tiatio
ns w
ith p
rope
rty o
wner
s/de
velo
pers
or b
y ea
sem
ent.
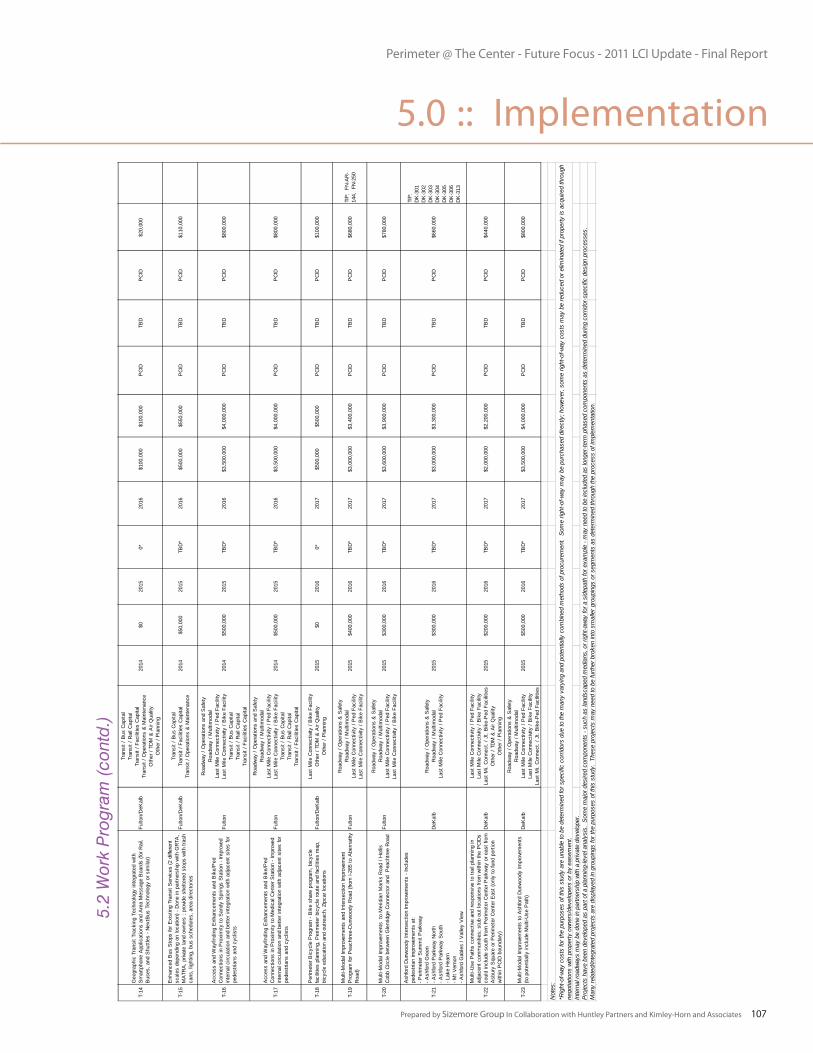
Perimeter @ The Center - Future Focus - 2011 LCI Update - Final Report
Prepared by Sizemore Group In Collaboration with Huntley Partners and Kimley-Horn and Associates 107
5.2
Wor
k P
rogr
am (
cont
d.)
5.0 :: Implementation
Perim
eter
@ T
he C
ente
r - F
utur
e Fo
cus
- 201
1 A
ten
year
LC
I Upd
ate
Tran
spor
tatio
n Pr
ojec
ts
Proj
ect N
ame
Coun
tyTy
pe o
f Im
prov
emen
tEn
gine
erin
g Ye
arEn
gine
erin
g Co
sts
ROW
Yea
rRO
W C
osts
*Co
nstru
ctio
n Ye
arCo
nstru
ctio
n Co
sts
Tota
l Pro
ject
Co
sts
(no
ROW
)Re
spon
sibl
e Pa
rtyFu
ndin
g So
urce
Loca
l Sou
rce
Mat
ch A
mou
ntTI
P/RT
P
T-1
Acc
ess
and
Way
findi
ng Im
prov
emen
ts a
nd B
ike/
Ped
C
onne
ctio
ns in
Pro
xim
ity to
Dun
woo
dy S
tatio
n - I
mpr
oved
in
tern
al c
ircul
atio
n an
d be
tter i
nteg
ratio
n w
ith a
djac
ent s
ites
for
pede
stria
ns a
nd c
yclis
ts
DeK
alb
Roa
dway
/ O
pera
tions
and
Saf
ety
Roa
dway
/ M
ultim
odal
Last
Mile
Con
nect
ivity
/ P
ed F
acili
tyLa
st M
ile C
onne
ctivi
ty /
Bik
e Fa
cilit
yTr
ansi
t / B
us C
apita
lTr
ansi
t / R
ail C
apita
lTr
ansi
t / F
acili
ties
Cap
ital
2011
$400
,000
20
12TB
D*
2013
$4,0
00,0
00
$4,4
00,0
00P
CID
TBD
PC
ID$8
80,0
00
T-2
Gle
nlak
e P
arkw
ay C
orrid
or Im
prov
emen
ts -
Bic
ycle
/Ped
estri
an
Impr
ovem
ents
, and
shu
ttle
stop
s al
ong
Gle
nlak
e P
arkw
ay (
to
supp
ort p
lann
ed tr
ansi
t alo
ng th
is c
orrid
or) -
Inc
ludi
ng n
ew
bike
/ped
con
nect
ion
from
Gle
nlak
e P
arkw
ay to
Nor
th S
prin
gs
MA
RTA
Sta
tion
(acr
oss
GA
400
)
Fulto
n
Roa
dway
/ O
pera
tions
& S
afet
yR
oadw
ay /
Mul
timod
alLa
st M
ile C
onne
ctivi
ty /
Ped
Fac
ility
Last
Mile
Con
nect
ivity
/ B
ike
Faci
lity
Tran
sit /
Bus
Cap
ital
Tran
sit /
Rai
l Cap
ital
Tran
sit /
Fac
ilitie
s C
apita
l
2011
$400
,000
20
12TB
D*
2013
$4,0
00,0
00
$4,4
00,0
00P
CID
TBD
PC
ID$8
80,0
00
T-3
Lake
Hea
rn D
rive
Stre
etsc
ape
and
Inte
rsec
tion
Impr
ovem
ents
- C
onst
ruct
ion
and
Impl
emen
tatio
n of
pla
nned
impr
ovem
ents
DeK
alb
Roa
dway
/ O
pera
tions
& S
afet
yR
oadw
ay /
Mul
timod
alLa
st M
ile C
onne
ctivi
ty /
Ped
Fac
ility
Last
Mile
Con
nect
ivity
/ B
ike
Faci
lity
2011
$400
,000
20
12TB
D*
2013
$3,7
00,0
00
$4,1
00,0
00P
CID
TBD
PC
ID$8
20,0
00
TIP
: D
K-3
69
T-4
Mul
ti-M
odal
Impr
ovem
ents
to J
ohns
on F
erry
Roa
d be
twee
n G
lenr
idge
Con
nect
or a
nd O
ld J
ohns
on F
erry
Roa
dFu
lton
Roa
dway
/ O
pera
tions
& S
afet
yR
oadw
ay /
Mul
timod
alLa
st M
ile C
onne
ctivi
ty /
Ped
Fac
ility
Last
Mile
Con
nect
ivity
/ B
ike
Faci
lity
2013
$400
,000
20
14TB
D*
2015
$4,0
00,0
00
$4,4
00,0
00P
CID
TBD
PC
ID$8
80,0
00
T-5
Mul
ti-M
odal
Impr
ovem
ents
alo
ng G
lenr
idge
Con
nect
or /
Gle
nrid
ge D
rive
betw
een
Ham
mon
d D
rive
and
Pea
chtre
e D
unw
oody
Roa
dFu
lton
Roa
dway
/ O
pera
tions
& S
afet
yR
oadw
ay /
Mul
timod
alLa
st M
ile C
onne
ctivi
ty /
Ped
Fac
ility
Last
Mile
Con
nect
ivity
/ B
ike
Faci
lity
2011
$350
,000
20
12TB
D*
2013
$3,5
00,0
00
$3,8
50,0
00P
CID
TBD
PC
ID$7
70,0
00
T-6
Bic
ycle
-Ped
estri
an C
orrid
or a
nd L
inea
r Par
k al
ong
Per
imet
er
Cen
ter E
ast;
Lin
k to
geth
er e
xist
ing
and
prop
osed
gre
en s
pace
s al
ong
this
cor
ridor
to fo
rm ro
ute
serv
ing
both
func
tiona
l and
pa
ssive
tran
spor
tatio
n
DeK
alb
Roa
dway
/ M
ultim
odal
Last
Mile
Con
nect
ivity
/ P
ed F
acili
tyLa
st M
ile C
onne
ctivi
ty /
Bik
e Fa
cilit
yLa
st M
i. C
onne
ct. /
Jt.
Bik
e-P
ed F
acili
ties
2012
$500
,000
20
13TB
D*
2014
$3,0
00,0
00
$3,5
00,0
00P
CID
TBD
PC
ID$7
00,0
00
T-7
New
Mul
ti-M
odal
Con
nect
ions
(cou
ld b
e m
ultip
le s
epar
ate
proj
ects
- lis
t of p
ropo
sed
conn
ectio
ns p
rovid
ed s
epar
atel
y) -
to
be s
elec
ted
as o
ppor
tuni
ties
deve
lop;
coo
rdin
ated
with
priv
ate
land
owne
rs
Fulto
n/D
eKal
b
Roa
dway
/ G
en. P
urpo
se C
apac
ityR
oadw
ay /
Mul
timod
alLa
st M
ile C
onne
ctivi
ty /
Ped
Fac
ility
Last
Mile
Con
nect
ivity
/ B
ike
Faci
lity
2012
TBD
2013
TBD
*20
14TB
DTB
DP
CID
PC
ID, P
rivat
e,
TBD
PC
ID, P
rivat
eTB
D
T-8
Mul
ti-M
odal
Impr
ovem
ents
to C
entra
l Par
kway
(P
each
tree
Dun
woo
dy R
oad
to D
eKal
b C
ount
y Li
ne)
Fulto
n
Roa
dway
/ O
pera
tions
& S
afet
yR
oadw
ay /
Mul
timod
alLa
st M
ile C
onne
ctivi
ty /
Ped
Fac
ility
Last
Mile
Con
nect
ivity
/ B
ike
Faci
lity
2012
$400
,000
20
13TB
D*
2014
$3,2
50,0
00
$3,6
50,0
00P
CID
TBD
PC
ID$7
30,0
00
T-8
Mul
ti-M
odal
Impr
ovem
ents
to C
entra
l Par
kway
(F
ulto
n C
ount
y Li
ne to
Per
imet
er C
ente
r Wes
t)D
eKal
b
Roa
dway
/ O
pera
tions
& S
afet
yR
oadw
ay /
Mul
timod
alLa
st M
ile C
onne
ctivi
ty /
Ped
Fac
ility
Last
Mile
Con
nect
ivity
/ B
ike
Faci
lity
2012
$50,
000
2013
TBD
*20
14$5
00,0
00
$550
,000
PC
IDTB
DP
CID
$110
,000
T-9
Mul
ti-M
odal
Impr
ovem
ents
alo
ng H
amm
ond
Driv
e fro
m F
ulto
n C
ount
y Li
ne to
Ash
ford
Dun
woo
dy: I
nclu
des
wid
enin
g fro
m 4
to 6
la
nes
and
impr
oved
faci
litie
s fo
r bic
yclis
ts a
nd p
edes
trian
sD
eKal
b
Roa
dway
/ G
en. P
urpo
se C
apac
ityR
oadw
ay /
Ope
ratio
ns &
Saf
ety
Roa
dway
/ M
ultim
odal
Last
Mile
Con
nect
ivity
/ P
ed F
acili
tyLa
st M
ile C
onne
ctivi
ty /
Bik
e Fa
cilit
y
2013
$400
,000
20
14TB
D*
2015
$3,0
00,0
00
$3,4
00,0
00P
CID
TBD
PC
ID$6
80,0
00
RTP
: D
K-2
17
T-10
Mul
ti-M
odal
Impr
ovem
ents
alo
ng H
amm
ond
Driv
e fro
m G
A 4
00 to
D
eKal
b C
ount
y Li
ne: I
nclu
des
wid
enin
g fro
m 4
to 6
lane
s an
d im
prov
ed fa
cilit
ies
for b
icyc
lists
and
ped
estri
ans
Fulto
n
Roa
dway
/ G
en. P
urpo
se C
apac
ityR
oadw
ay /
Ope
ratio
ns &
Saf
ety
Roa
dway
/ M
ultim
odal
Last
Mile
Con
nect
ivity
/ P
ed F
acili
tyLa
st M
ile C
onne
ctivi
ty /
Bik
e Fa
cilit
y
2013
$400
,000
20
14TB
D*
2015
$3,0
00,0
00
$3,4
00,0
00P
CID
TBD
PC
ID$6
80,0
00
T-12
Per
imet
er S
huttl
e - C
onst
ruct
and
impl
emen
t a ru
bber
-tire
d ci
rcul
ator
shu
ttle
syst
em in
the
Per
imet
er a
rea.
Inc
lude
sro
ute
cons
truct
ion,
sig
nage
, rou
te m
aps,
and
am
eniti
es li
ke
benc
hes,
tras
h ca
ns, a
nd b
icyc
le ra
cks.
Fulto
n/D
eKal
bTr
ansi
t / B
us C
apita
lTr
ansi
t / F
acili
ties
Cap
ital
Tran
sit /
Ope
ratio
ns &
Mai
nten
ance
2013
$0
2014
TBD
*20
15$4
,200
,000
$4
,200
,000
PC
IDFe
dera
l Fun
ds,
TBD
PC
ID$8
40,0
00
T-13
Impl
emen
tatio
n of
Com
mut
er T
rail
Sys
tem
Des
ign
Feas
ibili
ty
Stu
dy(p
roje
cts
resu
tling
from
sup
plem
enta
l LC
I stu
dy)
Fulto
n/D
eKal
b
Roa
dway
/ O
pera
tions
and
Saf
ety
Roa
dway
/ M
ultim
odal
Last
Mile
Con
nect
ivity
/ P
ed F
acili
tyLa
st M
ile C
onne
ctivi
ty /
Bik
e Fa
cilit
yLa
st M
ile C
onne
ctivi
ty /
Sid
epat
h Fa
cilit
yLa
st M
i. C
onne
ct. /
Jt.
Bik
e-P
ed F
acili
ties
Tran
sit /
Bus
Cap
ital
Tran
sit /
Rai
l Cap
ital
Tran
sit /
Fac
ilitie
s C
apita
l
2013
TBD
2014
TBD
*20
15TB
DTB
DP
CID
TBD
PC
IDTB
D
T-14
Geo
grap
hic
Tran
sit T
rack
ing
Tech
nolo
gy in
tegr
ated
with
S
mar
tpho
ne A
pplic
atio
ns a
nd A
rea
Mes
sage
Boa
rds
(for R
ail,
Bus
es, a
nd S
huttl
es -
Nex
tBus
Tec
hnol
ogy
or s
imila
r)Fu
lton/
DeK
alb
Tran
sit /
Bus
Cap
ital
Tran
sit /
Rai
l Cap
ital
Tran
sit /
Fac
ilitie
s C
apita
lTr
ansi
t / O
pera
tions
& M
aint
enan
ceO
ther
/ TD
M &
Air
Qua
lity
Oth
er /
Pla
nnin
g
2014
$0
2015
0*20
16$1
00,0
00
$100
,000
PC
IDTB
DP
CID
$20,
000
T-15
Enh
ance
d B
us S
tops
for E
xist
ing
Tran
sit S
ervic
es (2
diff
eren
t sc
ales
dep
endi
ng o
n lo
catio
n) -
Don
e in
par
tner
ship
with
GR
TA,
MA
TRA
, priv
ate
land
ow
ners
; pr
ovid
e sh
elte
red
stop
s w
ith tr
ash
cans
, lig
htin
g, b
us s
ched
ules
, are
a di
rect
orie
s
Fulto
n/D
eKal
bTr
ansi
t / B
us C
apita
lTr
ansi
t / F
acili
ties
Cap
ital
Tran
sit /
Ope
ratio
ns &
Mai
nten
ance
2014
$50,
000
2015
TBD
*20
16$5
00,0
00
$550
,000
PC
IDTB
DP
CID
$110
,000
T-16
Acc
ess
and
Way
findi
ng E
nhan
cem
ents
and
Bik
e/P
ed
Con
nect
ions
in P
roxi
mity
to S
andy
Spr
ings
Sta
tion
- Im
prov
ed
inte
rnal
circ
ulat
ion
and
bette
r int
egra
tion
with
adj
acen
t site
s fo
r pe
dest
rians
and
cyc
lists
Fulto
n
Roa
dway
/ O
pera
tions
and
Saf
ety
Roa
dway
/ M
ultim
odal
Last
Mile
Con
nect
ivity
/ P
ed F
acili
tyLa
st M
ile C
onne
ctivi
ty /
Bik
e Fa
cilit
yTr
ansi
t / B
us C
apita
lTr
ansi
t / R
ail C
apita
lTr
ansi
t / F
acili
ties
Cap
ital
2014
$500
,000
20
15TB
D*
2016
$3,5
00,0
00
$4,0
00,0
00P
CID
TBD
PC
ID$8
00,0
00
T-17
Acc
ess
and
Way
findi
ng E
nhan
cem
ents
and
Bik
e/P
ed
Con
nect
ions
in P
roxi
mity
to M
edic
al C
ente
r Sta
tion
- Im
prov
ed
inte
rnal
circ
ulat
ion
and
bette
r int
egra
tion
with
adj
acen
t site
s fo
r pe
dest
rians
and
cyc
lists
Fulto
n
Roa
dway
/ O
pera
tions
and
Saf
ety
Roa
dway
/ M
ultim
odal
Last
Mile
Con
nect
ivity
/ P
ed F
acili
tyLa
st M
ile C
onne
ctivi
ty /
Bik
e Fa
cilit
yTr
ansi
t / B
us C
apita
lTr
ansi
t / R
ail C
apita
lTr
ansi
t / F
acili
ties
Cap
ital
2014
$500
,000
20
15TB
D*
2016
$3,5
00,0
00
$4,0
00,0
00P
CID
TBD
PC
ID$8
00,0
00
T-18
Per
imet
er B
icyc
le P
rogr
am -
Bik
e sh
are
prog
ram
, bic
ycle
fa
cilit
ies
plan
ning
, Per
imet
er b
icyc
le ro
ute
and
faci
litie
s m
ap,
bicy
cle
educ
atio
n an
d ou
treac
h, Z
ipca
r loc
atio
nsFu
lton/
DeK
alb
Last
Mile
Con
nect
ivity
/ B
ike
Faci
lity
Oth
er /
TDM
& A
ir Q
ualit
yO
ther
/ P
lann
ing
2015
$0
2016
0*20
17$5
00,0
00
$500
,000
PC
IDTB
DP
CID
$100
,000
T-19
Mul
ti-M
odal
Impr
ovem
ents
and
Inte
rsec
tion
Impr
ovem
ent
Pro
gram
for P
each
tree-
Dun
woo
dy R
oad
(from
I-28
5 to
Abe
rnat
hy
Roa
d)Fu
lton
Roa
dway
/ O
pera
tions
& S
afet
yR
oadw
ay /
Mul
timod
alLa
st M
ile C
onne
ctivi
ty /
Ped
Fac
ility
Last
Mile
Con
nect
ivity
/ B
ike
Faci
lity
2015
$400
,000
20
16TB
D*
2017
$3,0
00,0
00
$3,4
00,0
00P
CID
TBD
PC
ID$6
80,0
00
TIP
: FN
-AR
-14
4, F
N-2
50
T-20
Mul
ti-M
odal
Impr
ovem
ents
to
Mer
idia
n M
arks
Roa
d / H
ollis
C
obb
Circ
le b
etw
een
Gle
nrid
ge C
onne
ctor
and
Pea
chtre
e R
oad
Fulto
n
Roa
dway
/ O
pera
tions
& S
afet
yR
oadw
ay /
Mul
timod
alLa
st M
ile C
onne
ctivi
ty /
Ped
Fac
ility
Last
Mile
Con
nect
ivity
/ B
ike
Faci
lity
2015
$300
,000
20
16TB
D*
2017
$3,6
00,0
00
$3,9
00,0
00P
CID
TBD
PC
ID$7
80,0
00
T-21
Ash
ford
Dun
woo
dy In
ters
ectio
n Im
prov
emen
ts -
Incl
udes
pe
dest
rian
impr
ovem
ents
at:
- Per
imet
er S
umm
it P
arkw
ay- A
shfo
rd G
reen
- Ash
ford
Par
kway
Nor
th- A
shfo
rd P
arkw
ay S
outh
- Lak
e H
earn
- Mt V
erno
n- A
shfo
rd G
able
s / V
alle
y V
iew
DeK
alb
Roa
dway
/ O
pera
tions
& S
afet
yR
oadw
ay /
Mul
timod
alLa
st M
ile C
onne
ctivi
ty /
Ped
Fac
ility
2015
$300
,000
20
16TB
D*
2017
$3,0
00,0
00
$3,3
00,0
00P
CID
TBD
PC
ID$6
60,0
00
TIP
: D
K-3
01D
K-3
02D
K-3
03D
K-3
04D
K-3
05D
K-3
06D
K-3
13
T-22
Mul
ti-U
se P
aths
con
nect
ive a
nd re
spon
sive
to tr
ail p
lann
ing
in
adja
cent
com
mun
ities
; stu
b ou
t loc
atio
ns fr
om w
ithin
the
PC
IDs
coul
d in
clud
e so
uth
from
Per
imet
er C
ente
r Par
kway
or e
ast f
rom
A
sbur
y S
quar
e or
Per
imet
er C
ente
r Eas
t (on
ly to
fund
por
tion
with
in P
CID
bou
ndar
y)
DeK
alb
Last
Mile
Con
nect
ivity
/ P
ed F
acili
tyLa
st M
ile C
onne
ctivi
ty /
Bik
e Fa
cilit
yLa
st M
i. C
onne
ct. /
Jt.
Bik
e-P
ed F
acili
ties
Oth
er /
TDM
& A
ir Q
ualit
yO
ther
/ P
lann
ing
2015
$200
,000
20
16TB
D*
2017
$2,0
00,0
00
$2,2
00,0
00P
CID
TBD
PC
ID$4
40,0
00
T-23
Mul
ti-M
odal
Impr
ovem
ents
to A
shfo
rd D
unw
oody
Impr
ovem
ents
(to
pot
entia
lly in
clud
e M
ulti-
Use
Pat
h)D
eKal
b
Roa
dway
/ O
pera
tions
& S
afet
yR
oadw
ay /
Mul
timod
alLa
st M
ile C
onne
ctivi
ty /
Ped
Fac
ility
Last
Mile
Con
nect
ivity
/ B
ike
Faci
lity
Last
Mi.
Con
nect
. / J
t. B
ike-
Ped
Fac
ilitie
s
2015
$500
,000
20
16TB
D*
2017
$3,5
00,0
00
$4,0
00,0
00P
CID
TBD
PC
ID$8
00,0
00
Not
es:
Inte
rnal
road
ways
may
be
done
in p
artn
ersh
ip w
ith a
priv
ate
deve
lope
r.P
roje
cts
have
bee
n de
velo
ped
as p
art o
f a p
lann
ing-
leve
l ana
lysi
s. S
ome
maj
or d
esire
d co
mpo
nent
s - s
uch
as la
ndsc
aped
med
ians
, or r
ight
-awa
y fo
r a s
idep
ath
for e
xam
ple
- may
nee
d to
be
incl
uded
as
long
er-te
rm p
hase
d co
mpo
nent
s as
det
erm
ined
dur
ing
corr
idor
-spe
cific
des
ign
proc
esse
s.
Man
y re
late
d/in
tegr
ated
pro
ject
s ar
e di
spla
yed
in g
roup
ings
for t
he p
urpo
ses
of th
is s
tudy
. Th
ese
proj
ects
may
nee
d to
be
furth
er b
roke
n in
to s
mal
ler g
roup
ings
or s
egm
ents
as
dete
rmin
ed th
roug
h th
e pr
oces
s of
impl
emen
tatio
n.
Long
-Ter
m T
rans
port
atio
n Pr
ojec
ts
Proj
ect N
ame
Coun
tyTy
pe o
f Im
prov
emen
tEn
gine
erin
g Co
sts
ROW
Cos
ts*
Cons
truct
ion
Cost
sTo
tal P
roje
ct
Cost
s (n
o RO
W)
Resp
onsi
ble
Party
Fund
ing
Sour
ceLo
cal S
ourc
e M
atch
Am
ount
T-24
Add
ition
al M
ulti-
Mod
al C
onne
ctio
ns (c
ould
be
mul
tiple
sep
arat
e pr
ojec
ts -
list o
f pot
entia
l con
nect
ions
pro
vided
sep
arat
ely)
- to
be
sel
ecte
d as
opp
ortu
nitie
s de
velo
p; c
oord
inat
ed w
ith p
rivat
e la
ndow
ners
Fulto
n/D
eKal
b
Roa
dway
/ G
en. P
urpo
se C
apac
ityR
oadw
ay /
Mul
timod
alLa
st M
ile C
onne
ctivi
ty /
Ped
Fac
ility
Last
Mile
Con
nect
ivity
/ B
ike
Faci
lity
TBD
TBD
*TB
DTB
DP
CID
PC
ID, P
rivat
e,
TBD
PC
ID, P
rivat
eTB
D
T-25
Mul
ti-U
se P
ath
from
Lak
e H
earn
Driv
e to
Per
imet
er S
umm
it P
arkw
ayD
eKal
b
Last
Mile
Con
nect
ivity
/ P
ed F
acili
tyLa
st M
ile C
onne
ctivi
ty /
Bik
e Fa
cilit
yLa
st M
i. C
onne
ct. /
Jt.
Bik
e-P
ed F
acili
ties
Oth
er /
TDM
& A
ir Q
ualit
yO
ther
/ P
lann
ing
$60,
000
TBD
*$6
00,0
00
$660
,000
PC
IDTB
DP
CID
$130
,000
T-26
Mul
ti-U
se P
ath
alon
g P
erim
eter
Cen
ter W
est
DeK
alb
Roa
dway
/ M
ultim
odal
Last
Mile
Con
nect
ivity
/ P
ed F
acili
tyLa
st M
ile C
onne
ctivi
ty /
Bik
e Fa
cilit
yLa
st M
i. C
onne
ct. /
Jt.
Bik
e-P
ed F
acili
ties
$70,
000
TBD
*$7
00,0
00
$770
,000
PC
IDTB
DP
CID
$150
,000
T-27
Mul
ti-U
se P
ath
alon
g P
erim
eter
Cen
ter W
est
Fulto
n
Roa
dway
/ M
ultim
odal
Last
Mile
Con
nect
ivity
/ P
ed F
acili
tyLa
st M
ile C
onne
ctivi
ty /
Bik
e Fa
cilit
yLa
st M
i. C
onne
ct. /
Jt.
Bik
e-P
ed F
acili
ties
$300
,000
TB
D*
$2,0
00,0
00
$2,3
00,0
00P
CID
TBD
PC
ID$4
60,0
00
T-28
Mul
ti-U
se P
ath
alon
g M
t Ver
non
Hig
hway
Fulto
n
Roa
dway
/ M
ultim
odal
Last
Mile
Con
nect
ivity
/ P
ed F
acili
tyLa
st M
ile C
onne
ctivi
ty /
Bik
e Fa
cilit
yLa
st M
i. C
onne
ct. /
Jt.
Bik
e-P
ed F
acili
ties
$300
,000
TB
D*
$2,0
00,0
00
$2,3
00,0
00P
CID
TBD
PC
ID$4
60,0
00
Not
es:
Pro
ject
s lis
ted
in th
e lo
ng-te
rm li
st m
ay b
ecom
e sh
ort-t
erm
prio
ritie
s du
e to
unf
ores
een
circ
umst
ance
s an
d op
portu
nitie
s ov
er th
e ne
xt fi
ve y
ears
.
Inte
rnal
road
ways
may
be
done
in p
artn
ersh
ip w
ith a
priv
ate
deve
lope
r.P
roje
cts
have
bee
n de
velo
ped
as p
art o
f a p
lann
ing-
leve
l ana
lysi
s. S
ome
maj
or d
esire
d co
mpo
nent
s - s
uch
as la
ndsc
aped
med
ians
, or r
ight
-awa
y fo
r a s
idep
ath
for e
xam
ple
- may
nee
d to
be
incl
uded
as
long
er-te
rm p
hase
d co
mpo
nent
s as
det
erm
ined
dur
ing
corr
idor
-spe
cific
des
ign
proc
esse
s.
Man
y re
late
d/in
tegr
ated
pro
ject
s ar
e di
spla
yed
in g
roup
ings
for t
he p
urpo
ses
of th
is s
tudy
. Th
ese
proj
ects
may
nee
d to
be
furth
er b
roke
n in
to s
mal
ler g
roup
ings
or s
egm
ents
as
dete
rmin
ed th
roug
h th
e pr
oces
s of
impl
emen
tatio
n.
*Rig
ht-o
f-way
cos
ts fo
r the
pur
pose
s of
this
stu
dy a
re u
nabl
e to
be
dete
rmin
ed fo
r spe
cific
cor
ridor
s du
e to
the
man
y va
ryin
g an
d po
tent
ially
com
bine
d m
etho
ds o
f pro
cure
men
t. S
ome
right
-of-w
ay m
ay b
e pu
rcha
sed
dire
ctly
; how
ever
, som
e rig
ht-o
f-way
cos
ts m
ay b
e re
duce
d or
elim
inat
ed if
pro
perty
is a
cqui
red
thro
ugh
nego
tiatio
ns w
ith p
rope
rty o
wner
s/de
velo
pers
or b
y ea
sem
ent.
*Rig
ht-o
f-way
cos
ts fo
r the
pur
pose
s of
this
stu
dy a
re u
nabl
e to
be
dete
rmin
ed fo
r spe
cific
cor
ridor
s du
e to
the
man
y va
ryin
g an
d po
tent
ially
com
bine
d m
etho
ds o
f pro
cure
men
t. S
ome
right
-of-w
ay m
ay b
e pu
rcha
sed
dire
ctly
; how
ever
, som
e rig
ht-o
f-way
cos
ts m
ay b
e re
duce
d or
elim
inat
ed if
pro
perty
is a
cqui
red
thro
ugh
nego
tiatio
ns w
ith p
rope
rty o
wner
s/de
velo
pers
or b
y ea
sem
ent.
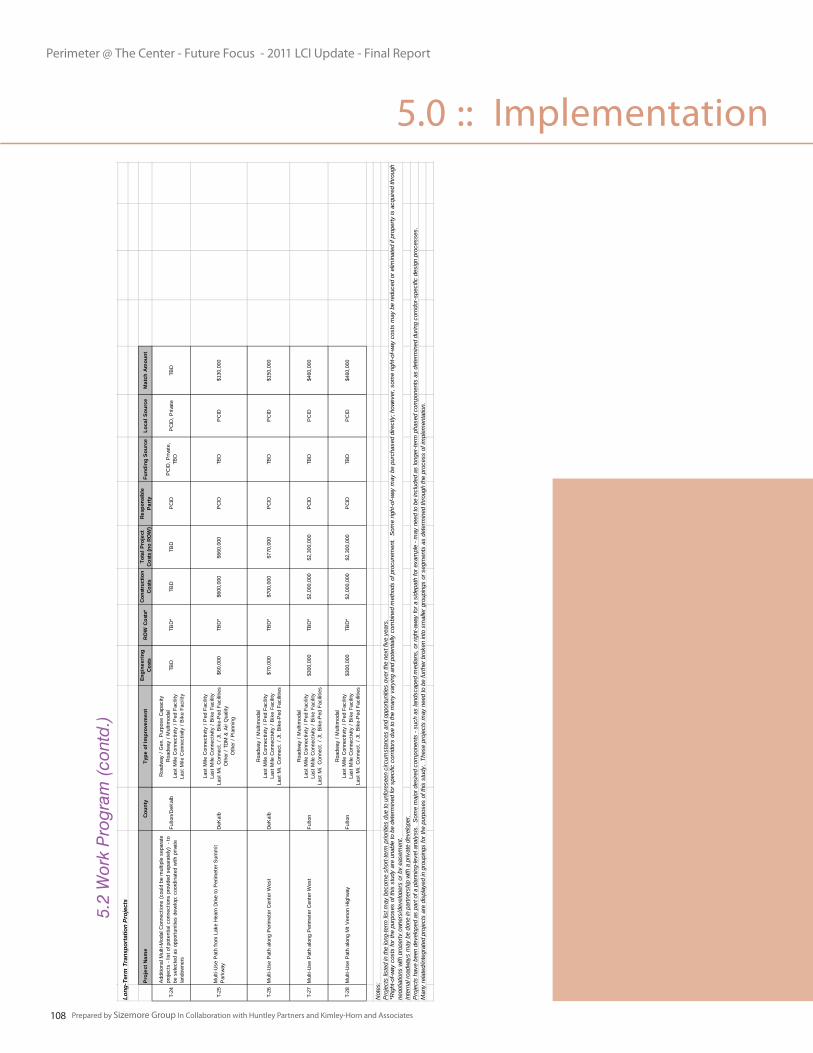
Perimeter @ The Center - Future Focus - 2011 LCI Update - Final Report
Prepared by Sizemore Group In Collaboration with Huntley Partners and Kimley-Horn and Associates108
5.2
Wor
k P
rogr
am (
cont
d.)
5.0 :: Implementation
Perim
eter
@ T
he C
ente
r - F
utur
e Fo
cus
- 201
1 A
ten
year
LC
I Upd
ate
Tran
spor
tatio
n Pr
ojec
ts
Proj
ect N
ame
Coun
tyTy
pe o
f Im
prov
emen
tEn
gine
erin
g Ye
arEn
gine
erin
g Co
sts
ROW
Yea
rRO
W C
osts
*Co
nstru
ctio
n Ye
arCo
nstru
ctio
n Co
sts
Tota
l Pro
ject
Co
sts
(no
ROW
)Re
spon
sibl
e Pa
rtyFu
ndin
g So
urce
Loca
l Sou
rce
Mat
ch A
mou
ntTI
P/RT
P
T-1
Acc
ess
and
Way
findi
ng Im
prov
emen
ts a
nd B
ike/
Ped
C
onne
ctio
ns in
Pro
xim
ity to
Dun
woo
dy S
tatio
n - I
mpr
oved
in
tern
al c
ircul
atio
n an
d be
tter i
nteg
ratio
n w
ith a
djac
ent s
ites
for
pede
stria
ns a
nd c
yclis
ts
DeK
alb
Roa
dway
/ O
pera
tions
and
Saf
ety
Roa
dway
/ M
ultim
odal
Last
Mile
Con
nect
ivity
/ P
ed F
acili
tyLa
st M
ile C
onne
ctivi
ty /
Bik
e Fa
cilit
yTr
ansi
t / B
us C
apita
lTr
ansi
t / R
ail C
apita
lTr
ansi
t / F
acili
ties
Cap
ital
2011
$400
,000
20
12TB
D*
2013
$4,0
00,0
00
$4,4
00,0
00P
CID
TBD
PC
ID$8
80,0
00
T-2
Gle
nlak
e P
arkw
ay C
orrid
or Im
prov
emen
ts -
Bic
ycle
/Ped
estri
an
Impr
ovem
ents
, and
shu
ttle
stop
s al
ong
Gle
nlak
e P
arkw
ay (
to
supp
ort p
lann
ed tr
ansi
t alo
ng th
is c
orrid
or) -
Inc
ludi
ng n
ew
bike
/ped
con
nect
ion
from
Gle
nlak
e P
arkw
ay to
Nor
th S
prin
gs
MA
RTA
Sta
tion
(acr
oss
GA
400
)
Fulto
n
Roa
dway
/ O
pera
tions
& S
afet
yR
oadw
ay /
Mul
timod
alLa
st M
ile C
onne
ctivi
ty /
Ped
Fac
ility
Last
Mile
Con
nect
ivity
/ B
ike
Faci
lity
Tran
sit /
Bus
Cap
ital
Tran
sit /
Rai
l Cap
ital
Tran
sit /
Fac
ilitie
s C
apita
l
2011
$400
,000
20
12TB
D*
2013
$4,0
00,0
00
$4,4
00,0
00P
CID
TBD
PC
ID$8
80,0
00
T-3
Lake
Hea
rn D
rive
Stre
etsc
ape
and
Inte
rsec
tion
Impr
ovem
ents
- C
onst
ruct
ion
and
Impl
emen
tatio
n of
pla
nned
impr
ovem
ents
DeK
alb
Roa
dway
/ O
pera
tions
& S
afet
yR
oadw
ay /
Mul
timod
alLa
st M
ile C
onne
ctivi
ty /
Ped
Fac
ility
Last
Mile
Con
nect
ivity
/ B
ike
Faci
lity
2011
$400
,000
20
12TB
D*
2013
$3,7
00,0
00
$4,1
00,0
00P
CID
TBD
PC
ID$8
20,0
00
TIP
: D
K-3
69
T-4
Mul
ti-M
odal
Impr
ovem
ents
to J
ohns
on F
erry
Roa
d be
twee
n G
lenr
idge
Con
nect
or a
nd O
ld J
ohns
on F
erry
Roa
dFu
lton
Roa
dway
/ O
pera
tions
& S
afet
yR
oadw
ay /
Mul
timod
alLa
st M
ile C
onne
ctivi
ty /
Ped
Fac
ility
Last
Mile
Con
nect
ivity
/ B
ike
Faci
lity
2013
$400
,000
20
14TB
D*
2015
$4,0
00,0
00
$4,4
00,0
00P
CID
TBD
PC
ID$8
80,0
00
T-5
Mul
ti-M
odal
Impr
ovem
ents
alo
ng G
lenr
idge
Con
nect
or /
Gle
nrid
ge D
rive
betw
een
Ham
mon
d D
rive
and
Pea
chtre
e D
unw
oody
Roa
dFu
lton
Roa
dway
/ O
pera
tions
& S
afet
yR
oadw
ay /
Mul
timod
alLa
st M
ile C
onne
ctivi
ty /
Ped
Fac
ility
Last
Mile
Con
nect
ivity
/ B
ike
Faci
lity
2011
$350
,000
20
12TB
D*
2013
$3,5
00,0
00
$3,8
50,0
00P
CID
TBD
PC
ID$7
70,0
00
T-6
Bic
ycle
-Ped
estri
an C
orrid
or a
nd L
inea
r Par
k al
ong
Per
imet
er
Cen
ter E
ast;
Lin
k to
geth
er e
xist
ing
and
prop
osed
gre
en s
pace
s al
ong
this
cor
ridor
to fo
rm ro
ute
serv
ing
both
func
tiona
l and
pa
ssive
tran
spor
tatio
n
DeK
alb
Roa
dway
/ M
ultim
odal
Last
Mile
Con
nect
ivity
/ P
ed F
acili
tyLa
st M
ile C
onne
ctivi
ty /
Bik
e Fa
cilit
yLa
st M
i. C
onne
ct. /
Jt.
Bik
e-P
ed F
acili
ties
2012
$500
,000
20
13TB
D*
2014
$3,0
00,0
00
$3,5
00,0
00P
CID
TBD
PC
ID$7
00,0
00
T-7
New
Mul
ti-M
odal
Con
nect
ions
(cou
ld b
e m
ultip
le s
epar
ate
proj
ects
- lis
t of p
ropo
sed
conn
ectio
ns p
rovid
ed s
epar
atel
y) -
to
be s
elec
ted
as o
ppor
tuni
ties
deve
lop;
coo
rdin
ated
with
priv
ate
land
owne
rs
Fulto
n/D
eKal
b
Roa
dway
/ G
en. P
urpo
se C
apac
ityR
oadw
ay /
Mul
timod
alLa
st M
ile C
onne
ctivi
ty /
Ped
Fac
ility
Last
Mile
Con
nect
ivity
/ B
ike
Faci
lity
2012
TBD
2013
TBD
*20
14TB
DTB
DP
CID
PC
ID, P
rivat
e,
TBD
PC
ID, P
rivat
eTB
D
T-8
Mul
ti-M
odal
Impr
ovem
ents
to C
entra
l Par
kway
(P
each
tree
Dun
woo
dy R
oad
to D
eKal
b C
ount
y Li
ne)
Fulto
n
Roa
dway
/ O
pera
tions
& S
afet
yR
oadw
ay /
Mul
timod
alLa
st M
ile C
onne
ctivi
ty /
Ped
Fac
ility
Last
Mile
Con
nect
ivity
/ B
ike
Faci
lity
2012
$400
,000
20
13TB
D*
2014
$3,2
50,0
00
$3,6
50,0
00P
CID
TBD
PC
ID$7
30,0
00
T-8
Mul
ti-M
odal
Impr
ovem
ents
to C
entra
l Par
kway
(F
ulto
n C
ount
y Li
ne to
Per
imet
er C
ente
r Wes
t)D
eKal
b
Roa
dway
/ O
pera
tions
& S
afet
yR
oadw
ay /
Mul
timod
alLa
st M
ile C
onne
ctivi
ty /
Ped
Fac
ility
Last
Mile
Con
nect
ivity
/ B
ike
Faci
lity
2012
$50,
000
2013
TBD
*20
14$5
00,0
00
$550
,000
PC
IDTB
DP
CID
$110
,000
T-9
Mul
ti-M
odal
Impr
ovem
ents
alo
ng H
amm
ond
Driv
e fro
m F
ulto
n C
ount
y Li
ne to
Ash
ford
Dun
woo
dy: I
nclu
des
wid
enin
g fro
m 4
to 6
la
nes
and
impr
oved
faci
litie
s fo
r bic
yclis
ts a
nd p
edes
trian
sD
eKal
b
Roa
dway
/ G
en. P
urpo
se C
apac
ityR
oadw
ay /
Ope
ratio
ns &
Saf
ety
Roa
dway
/ M
ultim
odal
Last
Mile
Con
nect
ivity
/ P
ed F
acili
tyLa
st M
ile C
onne
ctivi
ty /
Bik
e Fa
cilit
y
2013
$400
,000
20
14TB
D*
2015
$3,0
00,0
00
$3,4
00,0
00P
CID
TBD
PC
ID$6
80,0
00
RTP
: D
K-2
17
T-10
Mul
ti-M
odal
Impr
ovem
ents
alo
ng H
amm
ond
Driv
e fro
m G
A 4
00 to
D
eKal
b C
ount
y Li
ne: I
nclu
des
wid
enin
g fro
m 4
to 6
lane
s an
d im
prov
ed fa
cilit
ies
for b
icyc
lists
and
ped
estri
ans
Fulto
n
Roa
dway
/ G
en. P
urpo
se C
apac
ityR
oadw
ay /
Ope
ratio
ns &
Saf
ety
Roa
dway
/ M
ultim
odal
Last
Mile
Con
nect
ivity
/ P
ed F
acili
tyLa
st M
ile C
onne
ctivi
ty /
Bik
e Fa
cilit
y
2013
$400
,000
20
14TB
D*
2015
$3,0
00,0
00
$3,4
00,0
00P
CID
TBD
PC
ID$6
80,0
00
T-12
Per
imet
er S
huttl
e - C
onst
ruct
and
impl
emen
t a ru
bber
-tire
d ci
rcul
ator
shu
ttle
syst
em in
the
Per
imet
er a
rea.
Inc
lude
sro
ute
cons
truct
ion,
sig
nage
, rou
te m
aps,
and
am
eniti
es li
ke
benc
hes,
tras
h ca
ns, a
nd b
icyc
le ra
cks.
Fulto
n/D
eKal
bTr
ansi
t / B
us C
apita
lTr
ansi
t / F
acili
ties
Cap
ital
Tran
sit /
Ope
ratio
ns &
Mai
nten
ance
2013
$0
2014
TBD
*20
15$4
,200
,000
$4
,200
,000
PC
IDFe
dera
l Fun
ds,
TBD
PC
ID$8
40,0
00
T-13
Impl
emen
tatio
n of
Com
mut
er T
rail
Sys
tem
Des
ign
Feas
ibili
ty
Stu
dy(p
roje
cts
resu
tling
from
sup
plem
enta
l LC
I stu
dy)
Fulto
n/D
eKal
b
Roa
dway
/ O
pera
tions
and
Saf
ety
Roa
dway
/ M
ultim
odal
Last
Mile
Con
nect
ivity
/ P
ed F
acili
tyLa
st M
ile C
onne
ctivi
ty /
Bik
e Fa
cilit
yLa
st M
ile C
onne
ctivi
ty /
Sid
epat
h Fa
cilit
yLa
st M
i. C
onne
ct. /
Jt.
Bik
e-P
ed F
acili
ties
Tran
sit /
Bus
Cap
ital
Tran
sit /
Rai
l Cap
ital
Tran
sit /
Fac
ilitie
s C
apita
l
2013
TBD
2014
TBD
*20
15TB
DTB
DP
CID
TBD
PC
IDTB
D
T-14
Geo
grap
hic
Tran
sit T
rack
ing
Tech
nolo
gy in
tegr
ated
with
S
mar
tpho
ne A
pplic
atio
ns a
nd A
rea
Mes
sage
Boa
rds
(for R
ail,
Bus
es, a
nd S
huttl
es -
Nex
tBus
Tec
hnol
ogy
or s
imila
r)Fu
lton/
DeK
alb
Tran
sit /
Bus
Cap
ital
Tran
sit /
Rai
l Cap
ital
Tran
sit /
Fac
ilitie
s C
apita
lTr
ansi
t / O
pera
tions
& M
aint
enan
ceO
ther
/ TD
M &
Air
Qua
lity
Oth
er /
Pla
nnin
g
2014
$0
2015
0*20
16$1
00,0
00
$100
,000
PC
IDTB
DP
CID
$20,
000
T-15
Enh
ance
d B
us S
tops
for E
xist
ing
Tran
sit S
ervic
es (2
diff
eren
t sc
ales
dep
endi
ng o
n lo
catio
n) -
Don
e in
par
tner
ship
with
GR
TA,
MA
TRA
, priv
ate
land
ow
ners
; pr
ovid
e sh
elte
red
stop
s w
ith tr
ash
cans
, lig
htin
g, b
us s
ched
ules
, are
a di
rect
orie
s
Fulto
n/D
eKal
bTr
ansi
t / B
us C
apita
lTr
ansi
t / F
acili
ties
Cap
ital
Tran
sit /
Ope
ratio
ns &
Mai
nten
ance
2014
$50,
000
2015
TBD
*20
16$5
00,0
00
$550
,000
PC
IDTB
DP
CID
$110
,000
T-16
Acc
ess
and
Way
findi
ng E
nhan
cem
ents
and
Bik
e/P
ed
Con
nect
ions
in P
roxi
mity
to S
andy
Spr
ings
Sta
tion
- Im
prov
ed
inte
rnal
circ
ulat
ion
and
bette
r int
egra
tion
with
adj
acen
t site
s fo
r pe
dest
rians
and
cyc
lists
Fulto
n
Roa
dway
/ O
pera
tions
and
Saf
ety
Roa
dway
/ M
ultim
odal
Last
Mile
Con
nect
ivity
/ P
ed F
acili
tyLa
st M
ile C
onne
ctivi
ty /
Bik
e Fa
cilit
yTr
ansi
t / B
us C
apita
lTr
ansi
t / R
ail C
apita
lTr
ansi
t / F
acili
ties
Cap
ital
2014
$500
,000
20
15TB
D*
2016
$3,5
00,0
00
$4,0
00,0
00P
CID
TBD
PC
ID$8
00,0
00
T-17
Acc
ess
and
Way
findi
ng E
nhan
cem
ents
and
Bik
e/P
ed
Con
nect
ions
in P
roxi
mity
to M
edic
al C
ente
r Sta
tion
- Im
prov
ed
inte
rnal
circ
ulat
ion
and
bette
r int
egra
tion
with
adj
acen
t site
s fo
r pe
dest
rians
and
cyc
lists
Fulto
n
Roa
dway
/ O
pera
tions
and
Saf
ety
Roa
dway
/ M
ultim
odal
Last
Mile
Con
nect
ivity
/ P
ed F
acili
tyLa
st M
ile C
onne
ctivi
ty /
Bik
e Fa
cilit
yTr
ansi
t / B
us C
apita
lTr
ansi
t / R
ail C
apita
lTr
ansi
t / F
acili
ties
Cap
ital
2014
$500
,000
20
15TB
D*
2016
$3,5
00,0
00
$4,0
00,0
00P
CID
TBD
PC
ID$8
00,0
00
T-18
Per
imet
er B
icyc
le P
rogr
am -
Bik
e sh
are
prog
ram
, bic
ycle
fa
cilit
ies
plan
ning
, Per
imet
er b
icyc
le ro
ute
and
faci
litie
s m
ap,
bicy
cle
educ
atio
n an
d ou
treac
h, Z
ipca
r loc
atio
nsFu
lton/
DeK
alb
Last
Mile
Con
nect
ivity
/ B
ike
Faci
lity
Oth
er /
TDM
& A
ir Q
ualit
yO
ther
/ P
lann
ing
2015
$0
2016
0*20
17$5
00,0
00
$500
,000
PC
IDTB
DP
CID
$100
,000
T-19
Mul
ti-M
odal
Impr
ovem
ents
and
Inte
rsec
tion
Impr
ovem
ent
Pro
gram
for P
each
tree-
Dun
woo
dy R
oad
(from
I-28
5 to
Abe
rnat
hy
Roa
d)Fu
lton
Roa
dway
/ O
pera
tions
& S
afet
yR
oadw
ay /
Mul
timod
alLa
st M
ile C
onne
ctivi
ty /
Ped
Fac
ility
Last
Mile
Con
nect
ivity
/ B
ike
Faci
lity
2015
$400
,000
20
16TB
D*
2017
$3,0
00,0
00
$3,4
00,0
00P
CID
TBD
PC
ID$6
80,0
00
TIP
: FN
-AR
-14
4, F
N-2
50
T-20
Mul
ti-M
odal
Impr
ovem
ents
to
Mer
idia
n M
arks
Roa
d / H
ollis
C
obb
Circ
le b
etw
een
Gle
nrid
ge C
onne
ctor
and
Pea
chtre
e R
oad
Fulto
n
Roa
dway
/ O
pera
tions
& S
afet
yR
oadw
ay /
Mul
timod
alLa
st M
ile C
onne
ctivi
ty /
Ped
Fac
ility
Last
Mile
Con
nect
ivity
/ B
ike
Faci
lity
2015
$300
,000
20
16TB
D*
2017
$3,6
00,0
00
$3,9
00,0
00P
CID
TBD
PC
ID$7
80,0
00
T-21
Ash
ford
Dun
woo
dy In
ters
ectio
n Im
prov
emen
ts -
Incl
udes
pe
dest
rian
impr
ovem
ents
at:
- Per
imet
er S
umm
it P
arkw
ay- A
shfo
rd G
reen
- Ash
ford
Par
kway
Nor
th- A
shfo
rd P
arkw
ay S
outh
- Lak
e H
earn
- Mt V
erno
n- A
shfo
rd G
able
s / V
alle
y V
iew
DeK
alb
Roa
dway
/ O
pera
tions
& S
afet
yR
oadw
ay /
Mul
timod
alLa
st M
ile C
onne
ctivi
ty /
Ped
Fac
ility
2015
$300
,000
20
16TB
D*
2017
$3,0
00,0
00
$3,3
00,0
00P
CID
TBD
PC
ID$6
60,0
00
TIP
: D
K-3
01D
K-3
02D
K-3
03D
K-3
04D
K-3
05D
K-3
06D
K-3
13
T-22
Mul
ti-U
se P
aths
con
nect
ive a
nd re
spon
sive
to tr
ail p
lann
ing
in
adja
cent
com
mun
ities
; stu
b ou
t loc
atio
ns fr
om w
ithin
the
PC
IDs
coul
d in
clud
e so
uth
from
Per
imet
er C
ente
r Par
kway
or e
ast f
rom
A
sbur
y S
quar
e or
Per
imet
er C
ente
r Eas
t (on
ly to
fund
por
tion
with
in P
CID
bou
ndar
y)
DeK
alb
Last
Mile
Con
nect
ivity
/ P
ed F
acili
tyLa
st M
ile C
onne
ctivi
ty /
Bik
e Fa
cilit
yLa
st M
i. C
onne
ct. /
Jt.
Bik
e-P
ed F
acili
ties
Oth
er /
TDM
& A
ir Q
ualit
yO
ther
/ P
lann
ing
2015
$200
,000
20
16TB
D*
2017
$2,0
00,0
00
$2,2
00,0
00P
CID
TBD
PC
ID$4
40,0
00
T-23
Mul
ti-M
odal
Impr
ovem
ents
to A
shfo
rd D
unw
oody
Impr
ovem
ents
(to
pot
entia
lly in
clud
e M
ulti-
Use
Pat
h)D
eKal
b
Roa
dway
/ O
pera
tions
& S
afet
yR
oadw
ay /
Mul
timod
alLa
st M
ile C
onne
ctivi
ty /
Ped
Fac
ility
Last
Mile
Con
nect
ivity
/ B
ike
Faci
lity
Last
Mi.
Con
nect
. / J
t. B
ike-
Ped
Fac
ilitie
s
2015
$500
,000
20
16TB
D*
2017
$3,5
00,0
00
$4,0
00,0
00P
CID
TBD
PC
ID$8
00,0
00
Not
es:
Inte
rnal
road
ways
may
be
done
in p
artn
ersh
ip w
ith a
priv
ate
deve
lope
r.P
roje
cts
have
bee
n de
velo
ped
as p
art o
f a p
lann
ing-
leve
l ana
lysi
s. S
ome
maj
or d
esire
d co
mpo
nent
s - s
uch
as la
ndsc
aped
med
ians
, or r
ight
-awa
y fo
r a s
idep
ath
for e
xam
ple
- may
nee
d to
be
incl
uded
as
long
er-te
rm p
hase
d co
mpo
nent
s as
det
erm
ined
dur
ing
corr
idor
-spe
cific
des
ign
proc
esse
s.
Man
y re
late
d/in
tegr
ated
pro
ject
s ar
e di
spla
yed
in g
roup
ings
for t
he p
urpo
ses
of th
is s
tudy
. Th
ese
proj
ects
may
nee
d to
be
furth
er b
roke
n in
to s
mal
ler g
roup
ings
or s
egm
ents
as
dete
rmin
ed th
roug
h th
e pr
oces
s of
impl
emen
tatio
n.
Long
-Ter
m T
rans
port
atio
n Pr
ojec
ts
Proj
ect N
ame
Coun
tyTy
pe o
f Im
prov
emen
tEn
gine
erin
g Co
sts
ROW
Cos
ts*
Cons
truct
ion
Cost
sTo
tal P
roje
ct
Cost
s (n
o RO
W)
Resp
onsi
ble
Party
Fund
ing
Sour
ceLo
cal S
ourc
e M
atch
Am
ount
T-24
Add
ition
al M
ulti-
Mod
al C
onne
ctio
ns (c
ould
be
mul
tiple
sep
arat
e pr
ojec
ts -
list o
f pot
entia
l con
nect
ions
pro
vided
sep
arat
ely)
- to
be
sel
ecte
d as
opp
ortu
nitie
s de
velo
p; c
oord
inat
ed w
ith p
rivat
e la
ndow
ners
Fulto
n/D
eKal
b
Roa
dway
/ G
en. P
urpo
se C
apac
ityR
oadw
ay /
Mul
timod
alLa
st M
ile C
onne
ctivi
ty /
Ped
Fac
ility
Last
Mile
Con
nect
ivity
/ B
ike
Faci
lity
TBD
TBD
*TB
DTB
DP
CID
PC
ID, P
rivat
e,
TBD
PC
ID, P
rivat
eTB
D
T-25
Mul
ti-U
se P
ath
from
Lak
e H
earn
Driv
e to
Per
imet
er S
umm
it P
arkw
ayD
eKal
b
Last
Mile
Con
nect
ivity
/ P
ed F
acili
tyLa
st M
ile C
onne
ctivi
ty /
Bik
e Fa
cilit
yLa
st M
i. C
onne
ct. /
Jt.
Bik
e-P
ed F
acili
ties
Oth
er /
TDM
& A
ir Q
ualit
yO
ther
/ P
lann
ing
$60,
000
TBD
*$6
00,0
00
$660
,000
PC
IDTB
DP
CID
$130
,000
T-26
Mul
ti-U
se P
ath
alon
g P
erim
eter
Cen
ter W
est
DeK
alb
Roa
dway
/ M
ultim
odal
Last
Mile
Con
nect
ivity
/ P
ed F
acili
tyLa
st M
ile C
onne
ctivi
ty /
Bik
e Fa
cilit
yLa
st M
i. C
onne
ct. /
Jt.
Bik
e-P
ed F
acili
ties
$70,
000
TBD
*$7
00,0
00
$770
,000
PC
IDTB
DP
CID
$150
,000
T-27
Mul
ti-U
se P
ath
alon
g P
erim
eter
Cen
ter W
est
Fulto
n
Roa
dway
/ M
ultim
odal
Last
Mile
Con
nect
ivity
/ P
ed F
acili
tyLa
st M
ile C
onne
ctivi
ty /
Bik
e Fa
cilit
yLa
st M
i. C
onne
ct. /
Jt.
Bik
e-P
ed F
acili
ties
$300
,000
TB
D*
$2,0
00,0
00
$2,3
00,0
00P
CID
TBD
PC
ID$4
60,0
00
T-28
Mul
ti-U
se P
ath
alon
g M
t Ver
non
Hig
hway
Fulto
n
Roa
dway
/ M
ultim
odal
Last
Mile
Con
nect
ivity
/ P
ed F
acili
tyLa
st M
ile C
onne
ctivi
ty /
Bik
e Fa
cilit
yLa
st M
i. C
onne
ct. /
Jt.
Bik
e-P
ed F
acili
ties
$300
,000
TB
D*
$2,0
00,0
00
$2,3
00,0
00P
CID
TBD
PC
ID$4
60,0
00
Not
es:
Pro
ject
s lis
ted
in th
e lo
ng-te
rm li
st m
ay b
ecom
e sh
ort-t
erm
prio
ritie
s du
e to
unf
ores
een
circ
umst
ance
s an
d op
portu
nitie
s ov
er th
e ne
xt fi
ve y
ears
.
Inte
rnal
road
ways
may
be
done
in p
artn
ersh
ip w
ith a
priv
ate
deve
lope
r.P
roje
cts
have
bee
n de
velo
ped
as p
art o
f a p
lann
ing-
leve
l ana
lysi
s. S
ome
maj
or d
esire
d co
mpo
nent
s - s
uch
as la
ndsc
aped
med
ians
, or r
ight
-awa
y fo
r a s
idep
ath
for e
xam
ple
- may
nee
d to
be
incl
uded
as
long
er-te
rm p
hase
d co
mpo
nent
s as
det
erm
ined
dur
ing
corr
idor
-spe
cific
des
ign
proc
esse
s.
Man
y re
late
d/in
tegr
ated
pro
ject
s ar
e di
spla
yed
in g
roup
ings
for t
he p
urpo
ses
of th
is s
tudy
. Th
ese
proj
ects
may
nee
d to
be
furth
er b
roke
n in
to s
mal
ler g
roup
ings
or s
egm
ents
as
dete
rmin
ed th
roug
h th
e pr
oces
s of
impl
emen
tatio
n.
*Rig
ht-o
f-way
cos
ts fo
r the
pur
pose
s of
this
stu
dy a
re u
nabl
e to
be
dete
rmin
ed fo
r spe
cific
cor
ridor
s du
e to
the
man
y va
ryin
g an
d po
tent
ially
com
bine
d m
etho
ds o
f pro
cure
men
t. S
ome
right
-of-w
ay m
ay b
e pu
rcha
sed
dire
ctly
; how
ever
, som
e rig
ht-o
f-way
cos
ts m
ay b
e re
duce
d or
elim
inat
ed if
pro
perty
is a
cqui
red
thro
ugh
nego
tiatio
ns w
ith p
rope
rty o
wner
s/de
velo
pers
or b
y ea
sem
ent.
*Rig
ht-o
f-way
cos
ts fo
r the
pur
pose
s of
this
stu
dy a
re u
nabl
e to
be
dete
rmin
ed fo
r spe
cific
cor
ridor
s du
e to
the
man
y va
ryin
g an
d po
tent
ially
com
bine
d m
etho
ds o
f pro
cure
men
t. S
ome
right
-of-w
ay m
ay b
e pu
rcha
sed
dire
ctly
; how
ever
, som
e rig
ht-o
f-way
cos
ts m
ay b
e re
duce
d or
elim
inat
ed if
pro
perty
is a
cqui
red
thro
ugh
nego
tiatio
ns w
ith p
rope
rty o
wner
s/de
velo
pers
or b
y ea
sem
ent.
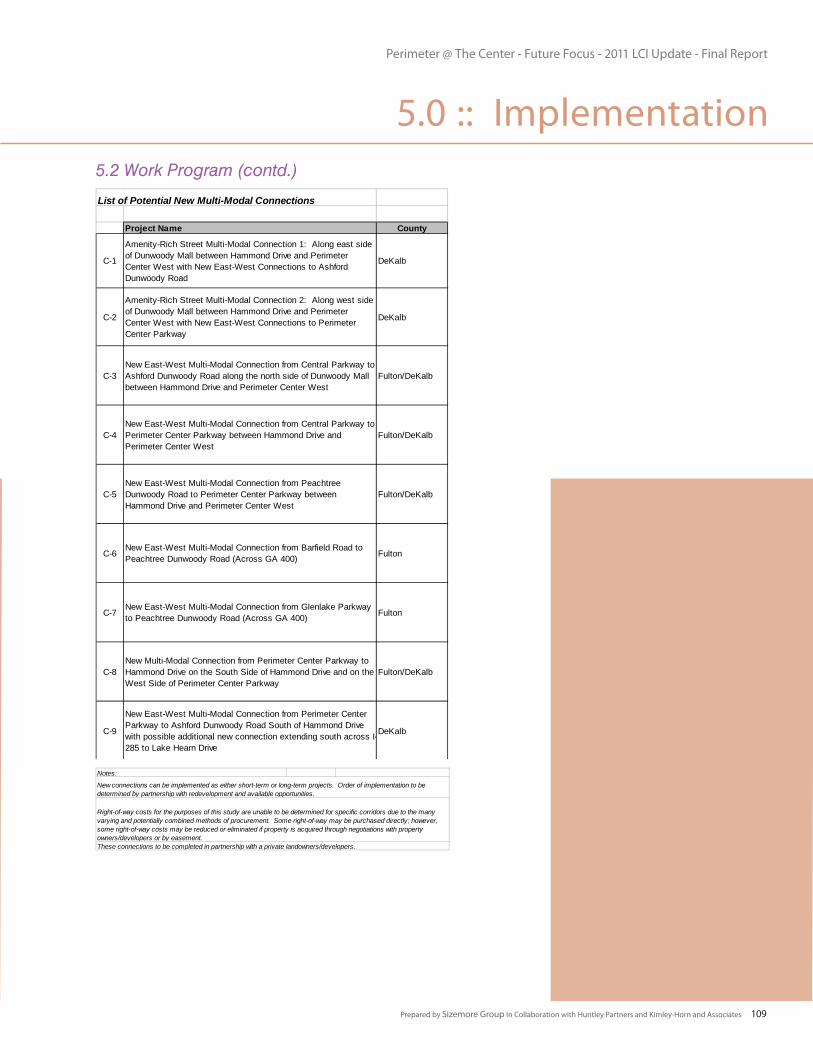
Perimeter @ The Center - Future Focus - 2011 LCI Update - Final Report
Prepared by Sizemore Group In Collaboration with Huntley Partners and Kimley-Horn and Associates 109
5.2 Work Program (contd.)
5.0 :: Implementation
Notes:
These connections to be completed in partnership with a private landowners/developers.
Right-of-way costs for the purposes of this study are unable to be determined for specific corridors due to the many varying and potentially combined methods of procurement. Some right-of-way may be purchased directly; however, some right-of-way costs may be reduced or eliminated if property is acquired through negotiations with property owners/developers or by easement.
New connections can be implemented as either short-term or long-term projects. Order of implementation to be determined by partnership with redevelopment and available opportunities.
List of Potential New Multi-Modal Connections
Project Name County
C-1
Amenity-Rich Street Multi-Modal Connection 1: Along east side of Dunwoody Mall between Hammond Drive and Perimeter Center West with New East-West Connections to Ashford Dunwoody Road
DeKalb
C-2
Amenity-Rich Street Multi-Modal Connection 2: Along west side of Dunwoody Mall between Hammond Drive and Perimeter Center West with New East-West Connections to Perimeter Center Parkway
DeKalb
C-3New East-West Multi-Modal Connection from Central Parkway to Ashford Dunwoody Road along the north side of Dunwoody Mall between Hammond Drive and Perimeter Center West
Fulton/DeKalb
C-4New East-West Multi-Modal Connection from Central Parkway to Perimeter Center Parkway between Hammond Drive and Perimeter Center West
Fulton/DeKalb
C-5New East-West Multi-Modal Connection from Peachtree Dunwoody Road to Perimeter Center Parkway between Hammond Drive and Perimeter Center West
Fulton/DeKalb
C-6New East-West Multi-Modal Connection from Barfield Road to Peachtree Dunwoody Road (Across GA 400) Fulton
C-7New East-West Multi-Modal Connection from Glenlake Parkway to Peachtree Dunwoody Road (Across GA 400) Fulton
C-8New Multi-Modal Connection from Perimeter Center Parkway to Hammond Drive on the South Side of Hammond Drive and on the West Side of Perimeter Center Parkway
Fulton/DeKalb
C-9
New East-West Multi-Modal Connection from Perimeter Center Parkway to Ashford Dunwoody Road South of Hammond Drive with possible additional new connection extending south across I-285 to Lake Hearn Drive
DeKalb
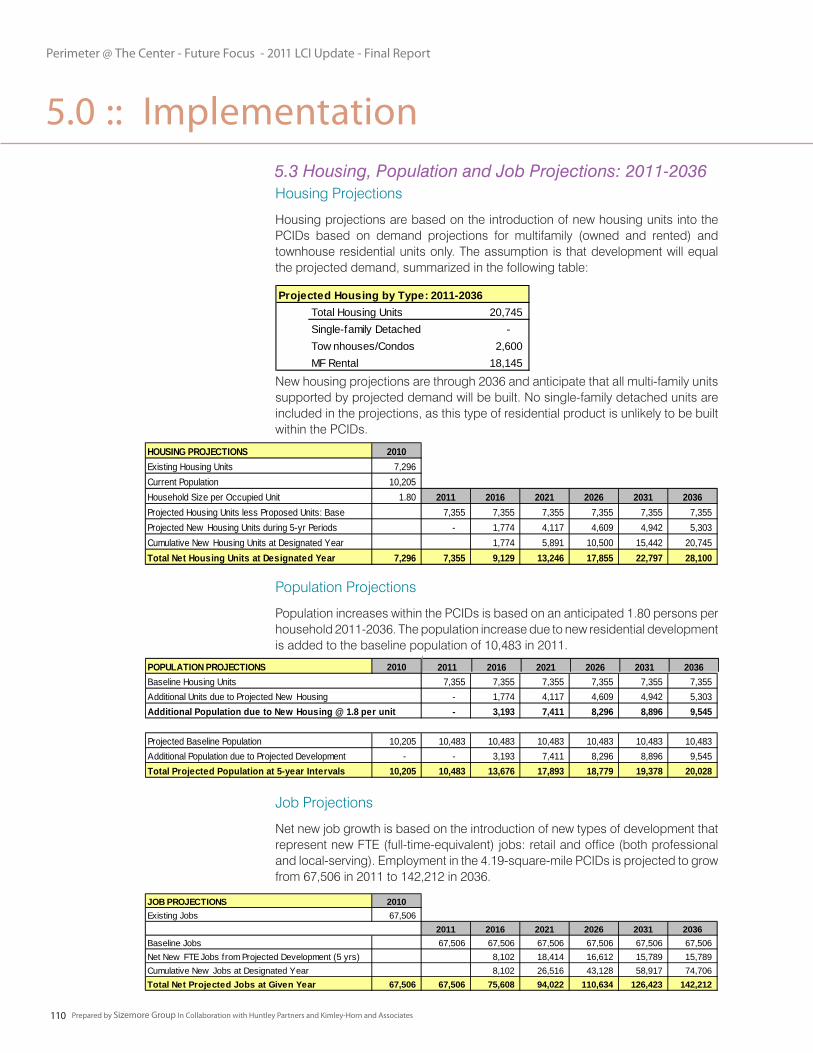
Perimeter @ The Center - Future Focus - 2011 LCI Update - Final Report
Prepared by Sizemore Group In Collaboration with Huntley Partners and Kimley-Horn and Associates110
5.3 Housing, Population and Job Projections: 2011-2036Housing Projections
Housing projections are based on the introduction of new housing units into the PCIDs based on demand projections for multifamily (owned and rented) and townhouse residential units only. The assumption is that development will equal the projected demand, summarized in the following table:
New housing projections are through 2036 and anticipate that all multi-family units supported by projected demand will be built. No single-family detached units are included in the projections, as this type of residential product is unlikely to be built within the PCIDs.
Population Projections
Population increases within the PCIDs is based on an anticipated 1.80 persons per household 2011-2036. The population increase due to new residential development is added to the baseline population of 10,483 in 2011.
Job Projections
Net new job growth is based on the introduction of new types of development that represent new FTE (full-time-equivalent) jobs: retail and office (both professional and local-serving). Employment in the 4.19-square-mile PCIDs is projected to grow from 67,506 in 2011 to 142,212 in 2036.
5.0 :: Implementation
Projected Housing by Type: 2011-2036Total Housing Units 20,745 Single-family Detached - Tow nhouses/Condos 2,600 MF Rental 18,145
HOUSING PROJECTIONS 2010Existing Housing Units 7,296 Current Population 10,205 Household Size per Occupied Unit 1.80 2011 2016 2021 2026 2031 2036Projected Housing Units less Proposed Units: Base 7,355 7,355 7,355 7,355 7,355 7,355 Projected New Housing Units during 5-yr Periods - 1,774 4,117 4,609 4,942 5,303 Cumulative New Housing Units at Designated Year 1,774 5,891 10,500 15,442 20,745 Total Net Housing Units at Designated Year 7,296 7,355 9,129 13,246 17,855 22,797 28,100
POPULATION PROJECTIONS 2010Baseline Housing Units 7,355 7,355 7,355 7,355 7,355 7,355 Additional Units due to Projected New Housing - 1,774 4,117 4,609 4,942 5,303 Additional Population due to New Housing @ 1.8 per unit - 3,193 7,411 8,296 8,896 9,545
Projected Baseline Population 10,205 10,483 10,483 10,483 10,483 10,483 10,483 Additional Population due to Projected Development - - 3,193 7,411 8,296 8,896 9,545 Total Projected Population at 5-year Intervals 10,205 10,483 13,676 17,893 18,779 19,378 20,028
HOUSING PROJECTIONS 2010Existing Housing Units 7,296 Current Population 10,205 Household Size per Occupied Unit 1.80 2011 2016 2021 2026 2031 2036Projected Housing Units less Proposed Units: Base 7,355 7,355 7,355 7,355 7,355 7,355 Projected New Housing Units during 5-yr Periods - 1,774 4,117 4,609 4,942 5,303 Cumulative New Housing Units at Designated Year 1,774 5,891 10,500 15,442 20,745 Total Net Housing Units at Designated Year 7,296 7,355 9,129 13,246 17,855 22,797 28,100
JOB PROJECTIONS 2010Existing Jobs 67,506
2011 2016 2021 2026 2031 2036Baseline Jobs 67,506 67,506 67,506 67,506 67,506 67,506 Net New FTE Jobs from Projected Development (5 yrs) 8,102 18,414 16,612 15,789 15,789 Cumulative New Jobs at Designated Year 8,102 26,516 43,128 58,917 74,706 Total Net Projected Jobs at Given Year 67,506 67,506 75,608 94,022 110,634 126,423 142,212
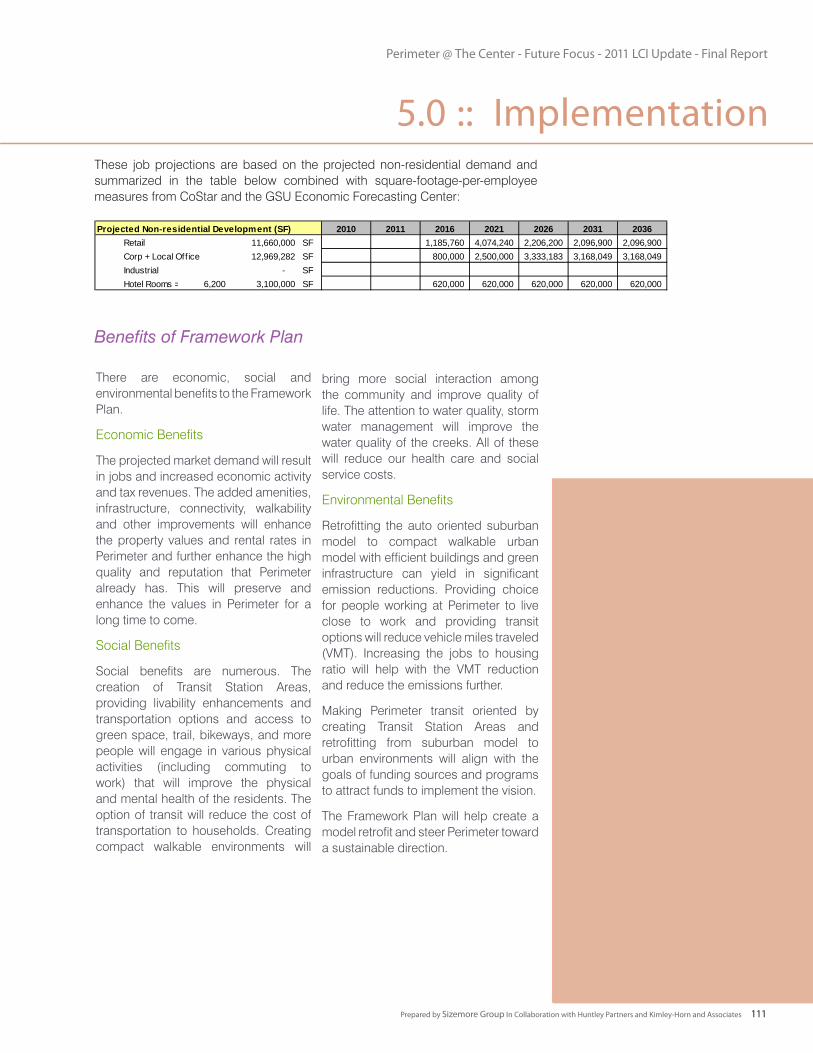
Perimeter @ The Center - Future Focus - 2011 LCI Update - Final Report
Prepared by Sizemore Group In Collaboration with Huntley Partners and Kimley-Horn and Associates 111
These job projections are based on the projected non-residential demand and summarized in the table below combined with square-footage-per-employee measures from CoStar and the GSU Economic Forecasting Center:
There are economic, social and environmental benefits to the Framework Plan.
Economic Benefits
The projected market demand will result in jobs and increased economic activity and tax revenues. The added amenities, infrastructure, connectivity, walkability and other improvements will enhance the property values and rental rates in Perimeter and further enhance the high quality and reputation that Perimeter already has. This will preserve and enhance the values in Perimeter for a long time to come.
Social Benefits
Social benefits are numerous. The creation of Transit Station Areas, providing livability enhancements and transportation options and access to green space, trail, bikeways, and more people will engage in various physical activities (including commuting to work) that will improve the physical and mental health of the residents. The option of transit will reduce the cost of transportation to households. Creating compact walkable environments will
bring more social interaction among the community and improve quality of life. The attention to water quality, storm water management will improve the water quality of the creeks. All of these will reduce our health care and social service costs.
Environmental Benefits
Retrofitting the auto oriented suburban model to compact walkable urban model with efficient buildings and green infrastructure can yield in significant emission reductions. Providing choice for people working at Perimeter to live close to work and providing transit options will reduce vehicle miles traveled (VMT). Increasing the jobs to housing ratio will help with the VMT reduction and reduce the emissions further.
Making Perimeter transit oriented by creating Transit Station Areas and retrofitting from suburban model to urban environments will align with the goals of funding sources and programs to attract funds to implement the vision.
The Framework Plan will help create a model retrofit and steer Perimeter toward a sustainable direction.
Benefits of Framework Plan
5.0 :: Implementation
Projected Non-residential Development (SF) 2010 2011 2016 2021 2026 2031 2036Retail 11,660,000 SF 1,185,760 4,074,240 2,206,200 2,096,900 2,096,900 Corp + Local Off ice 12,969,282 SF 800,000 2,500,000 3,333,183 3,168,049 3,168,049 Industrial - SFHotel Rooms = 6,200 3,100,000 SF 620,000 620,000 620,000 620,000 620,000
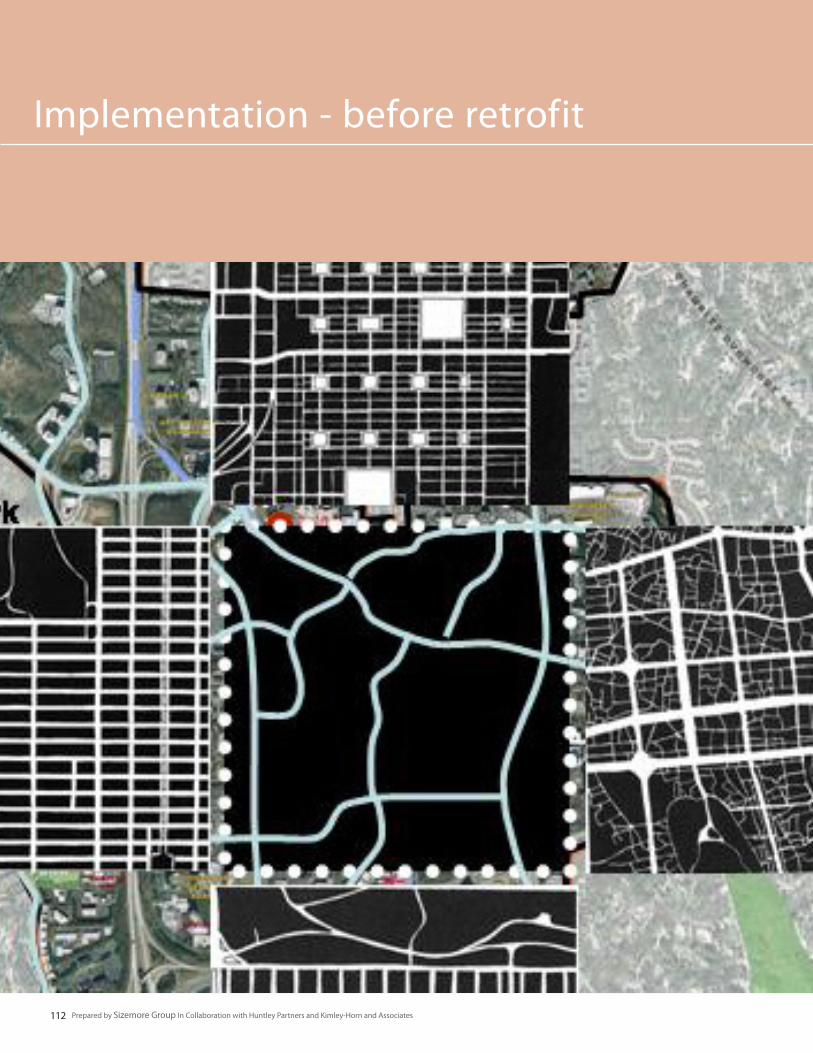
Perimeter @ The Center - Future Focus - 2011 LCI Update - Final Report
Prepared by Sizemore Group In Collaboration with Huntley Partners and Kimley-Horn and Associates112
Implementation - before retrofit
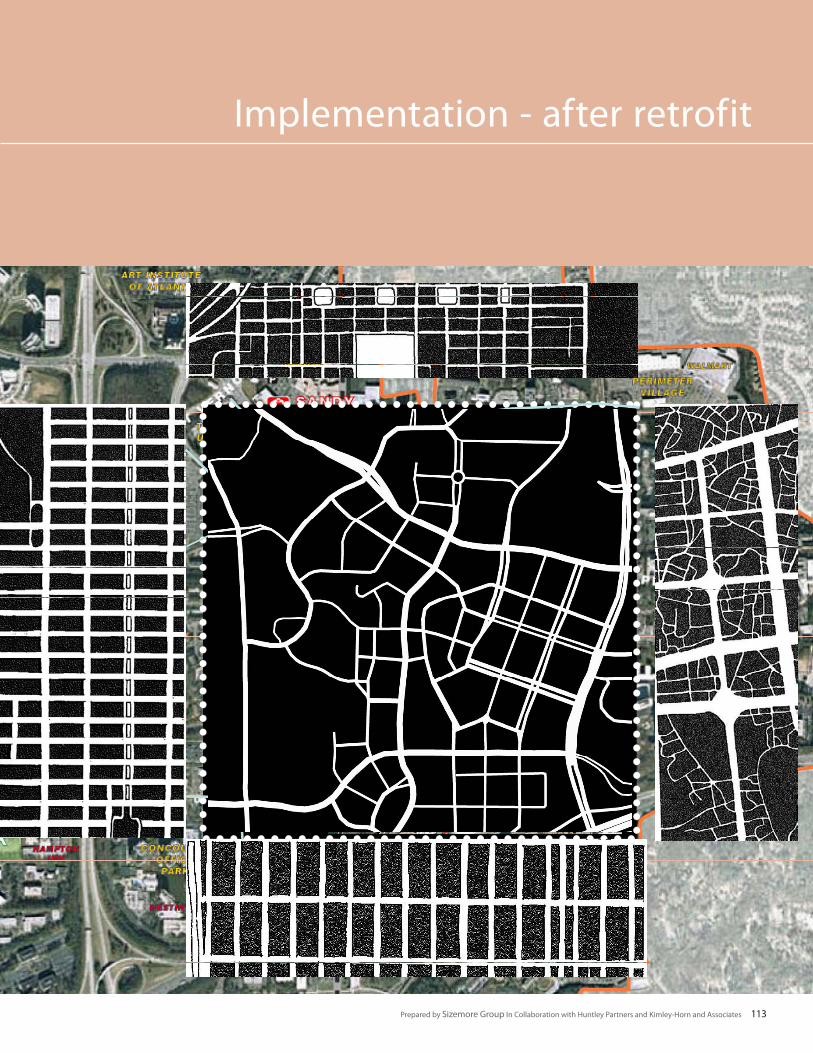
Perimeter @ The Center - Future Focus - 2011 LCI Update - Final Report
Prepared by Sizemore Group In Collaboration with Huntley Partners and Kimley-Horn and Associates 113
Implementation - after retrofit

Perimeter @ The Center - Future Focus - 2011 LCI Update - Final Report
Prepared by Sizemore Group In Collaboration with Huntley Partners and Kimley-Horn and Associates114
Perimeter @ The Center - Future Focus - 2011 LCI Update - Final Report
Prepared by Sizemore Group In Collaboration with Huntley Partners and Kimley-Horn and Associates 115
6 Appendix

Perimeter @ The Center - Future Focus - 2011 LCI Update - Final Report
Prepared by Sizemore Group In Collaboration with Huntley Partners and Kimley-Horn and Associates116
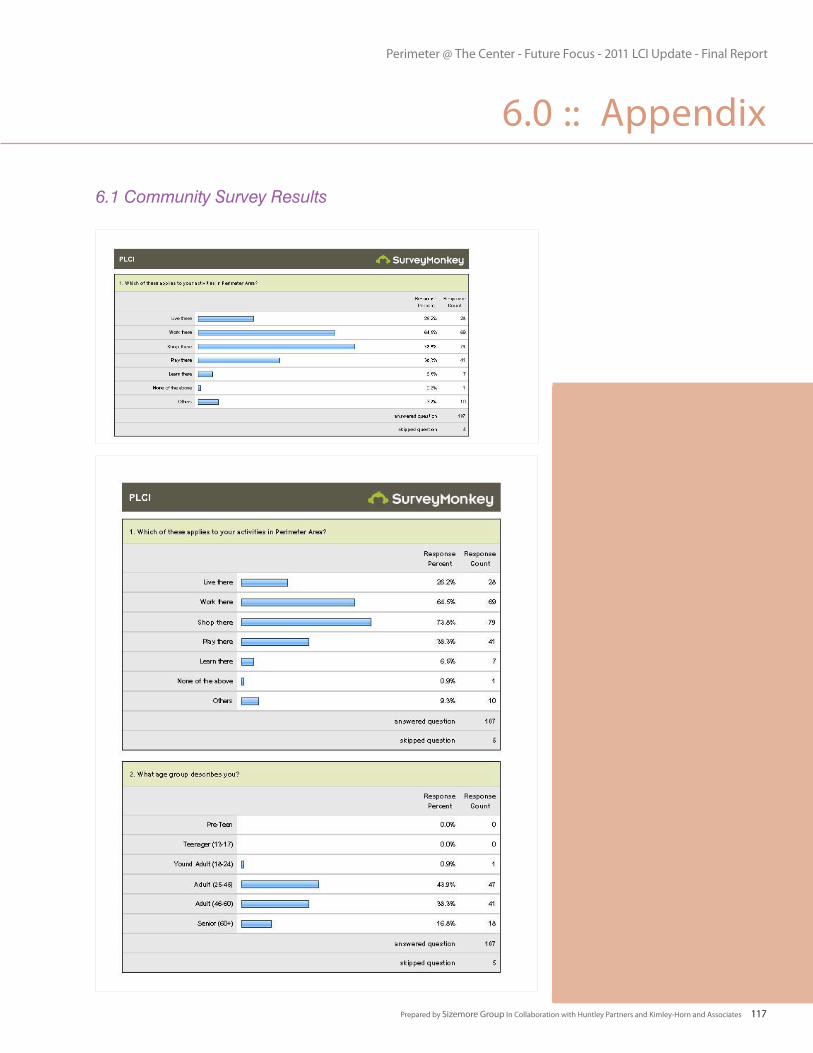
Perimeter @ The Center - Future Focus - 2011 LCI Update - Final Report
Prepared by Sizemore Group In Collaboration with Huntley Partners and Kimley-Horn and Associates 117
6.0 :: Appendix
6.1 Community Survey Results
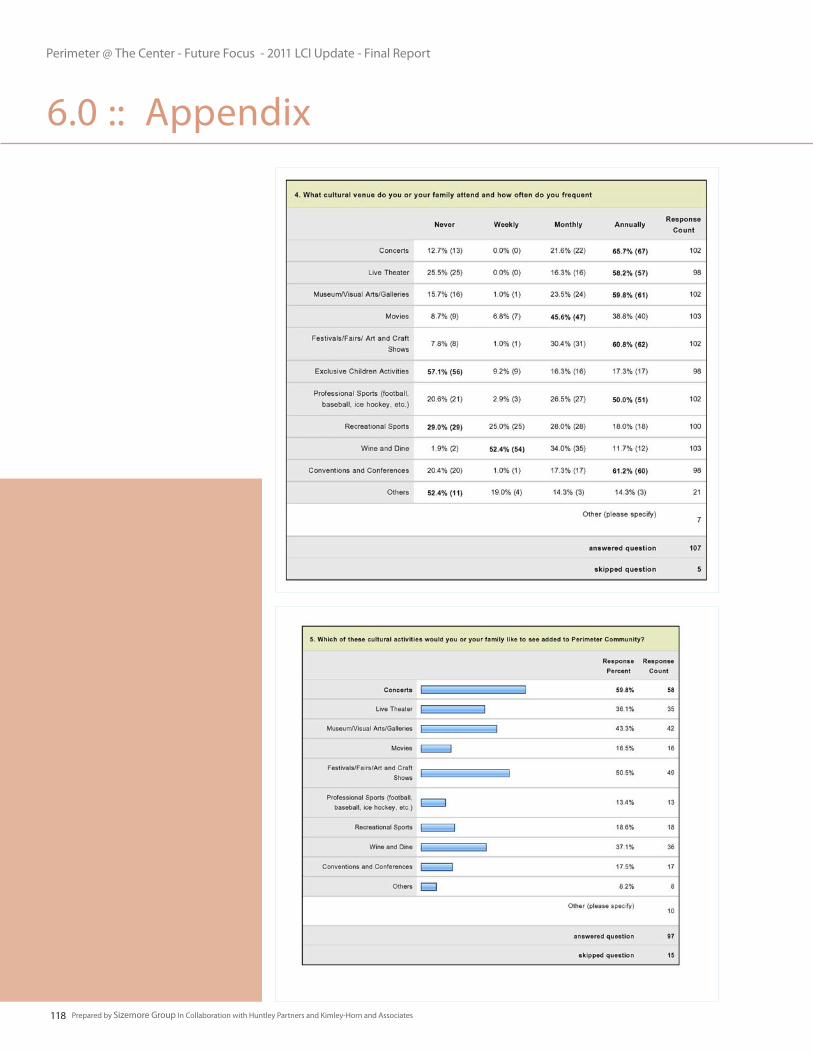
Perimeter @ The Center - Future Focus - 2011 LCI Update - Final Report
Prepared by Sizemore Group In Collaboration with Huntley Partners and Kimley-Horn and Associates118
6.0 :: Appendix
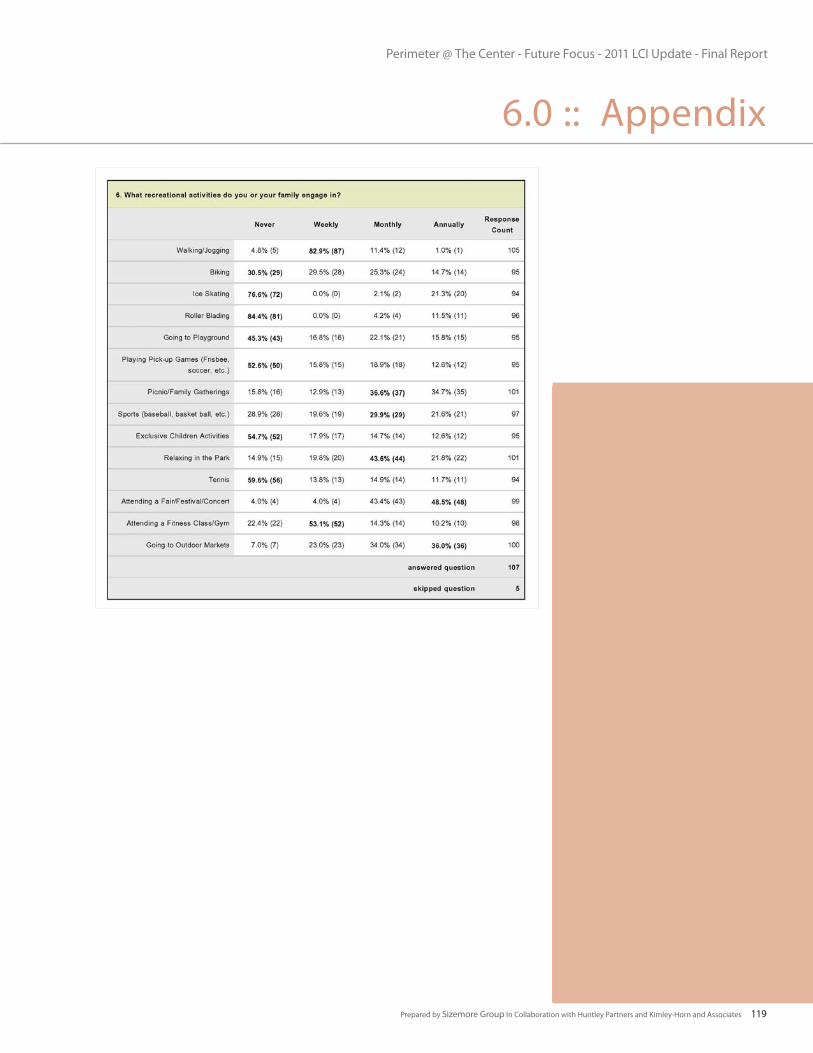
Perimeter @ The Center - Future Focus - 2011 LCI Update - Final Report
Prepared by Sizemore Group In Collaboration with Huntley Partners and Kimley-Horn and Associates 119
6.0 :: Appendix
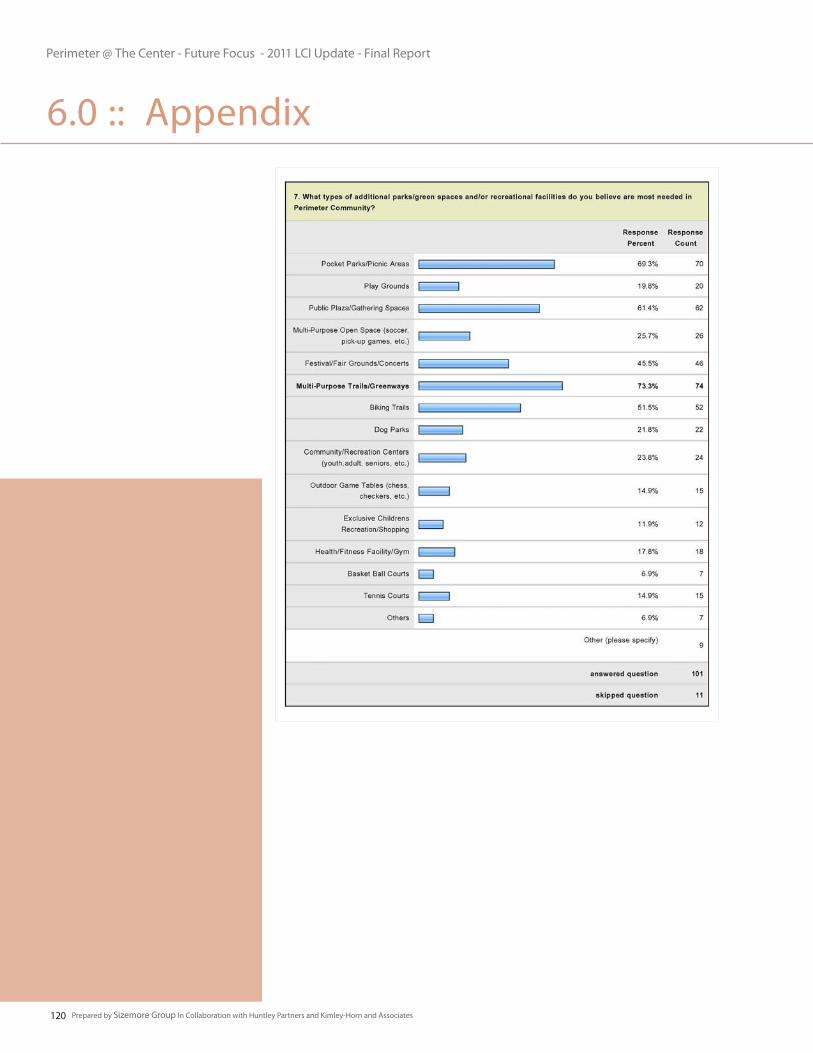
Perimeter @ The Center - Future Focus - 2011 LCI Update - Final Report
Prepared by Sizemore Group In Collaboration with Huntley Partners and Kimley-Horn and Associates120
6.0 :: Appendix
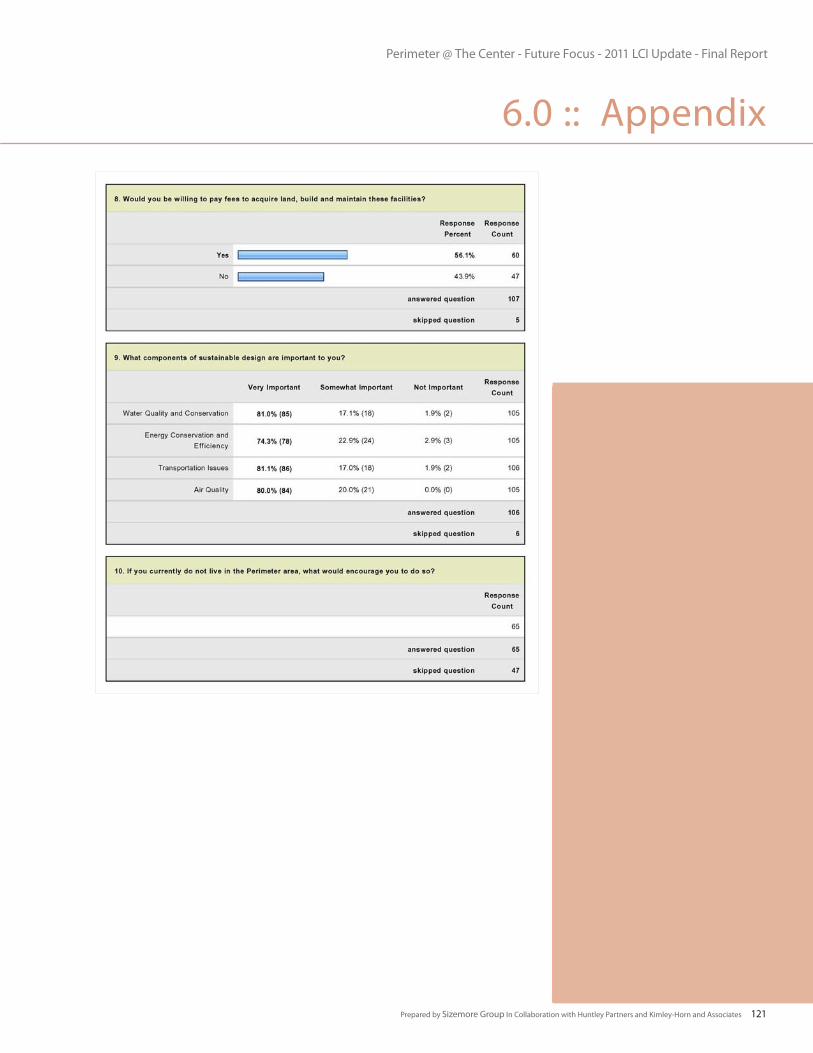
Perimeter @ The Center - Future Focus - 2011 LCI Update - Final Report
Prepared by Sizemore Group In Collaboration with Huntley Partners and Kimley-Horn and Associates 121
6.0 :: Appendix
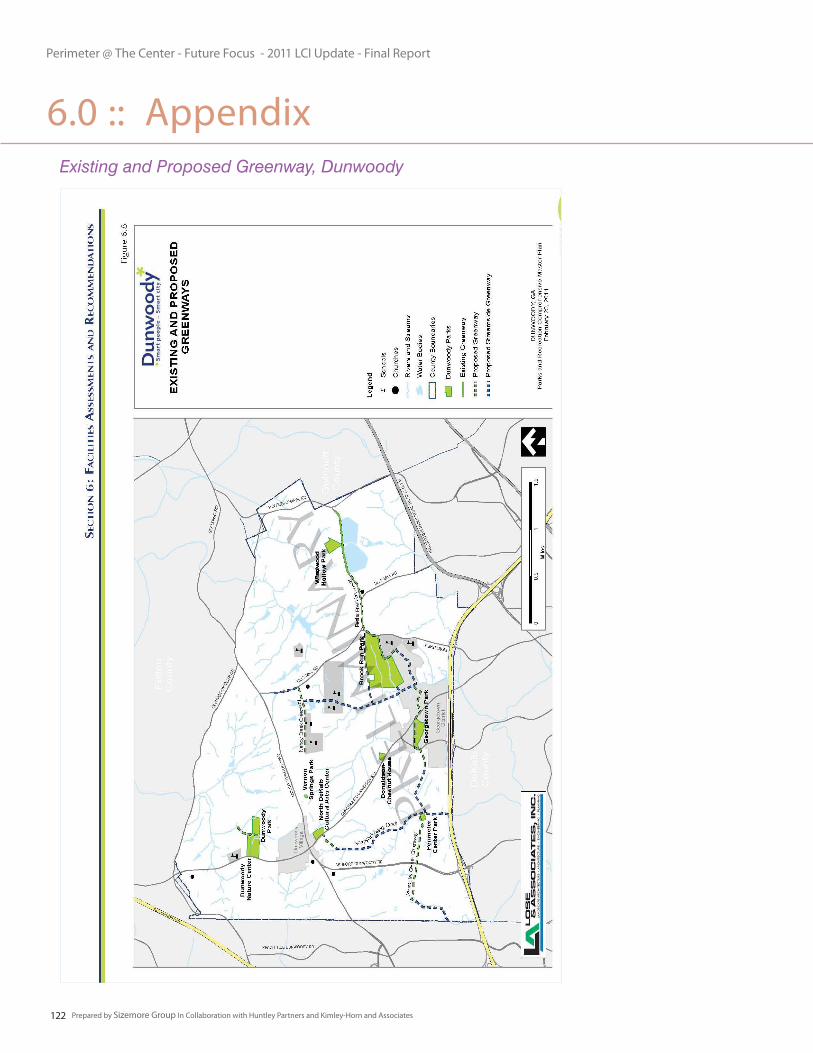
Perimeter @ The Center - Future Focus - 2011 LCI Update - Final Report
Prepared by Sizemore Group In Collaboration with Huntley Partners and Kimley-Horn and Associates122
6.0 :: AppendixExisting and Proposed Greenway, Dunwoody
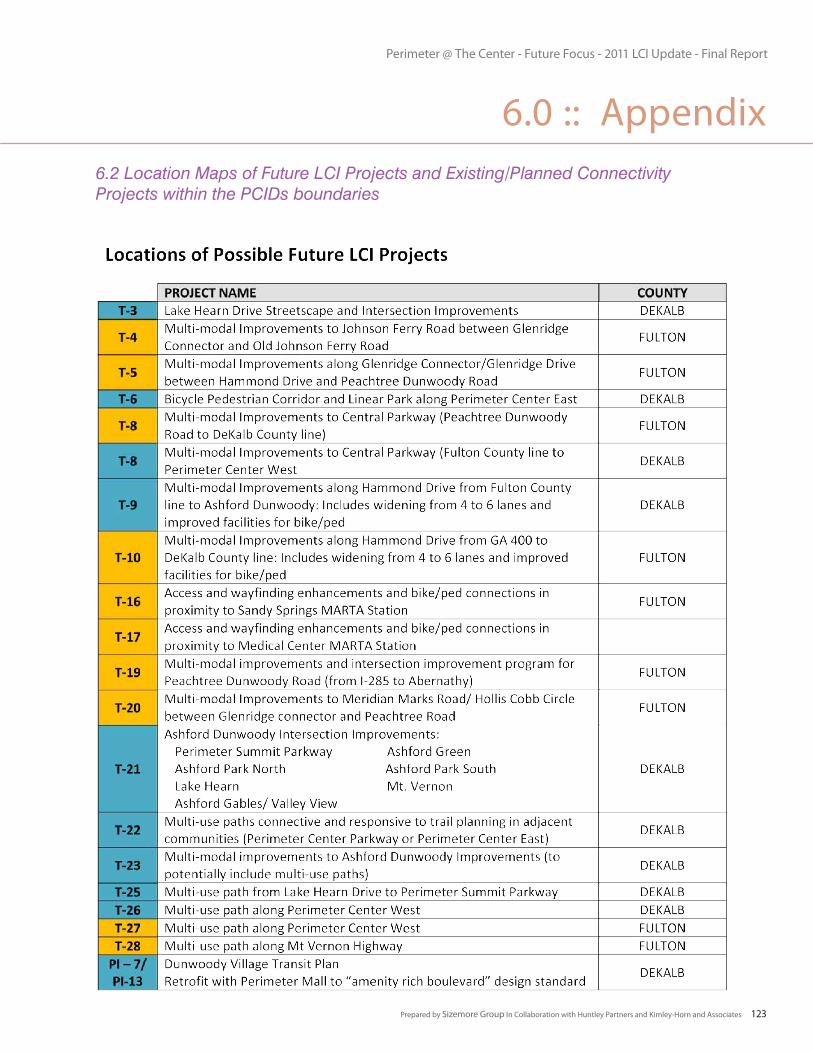
Perimeter @ The Center - Future Focus - 2011 LCI Update - Final Report
Prepared by Sizemore Group In Collaboration with Huntley Partners and Kimley-Horn and Associates 123
6.0 :: Appendix6.2 Location Maps of Future LCI Projects and Existing/Planned Connectivity Projects within the PCIDs boundaries
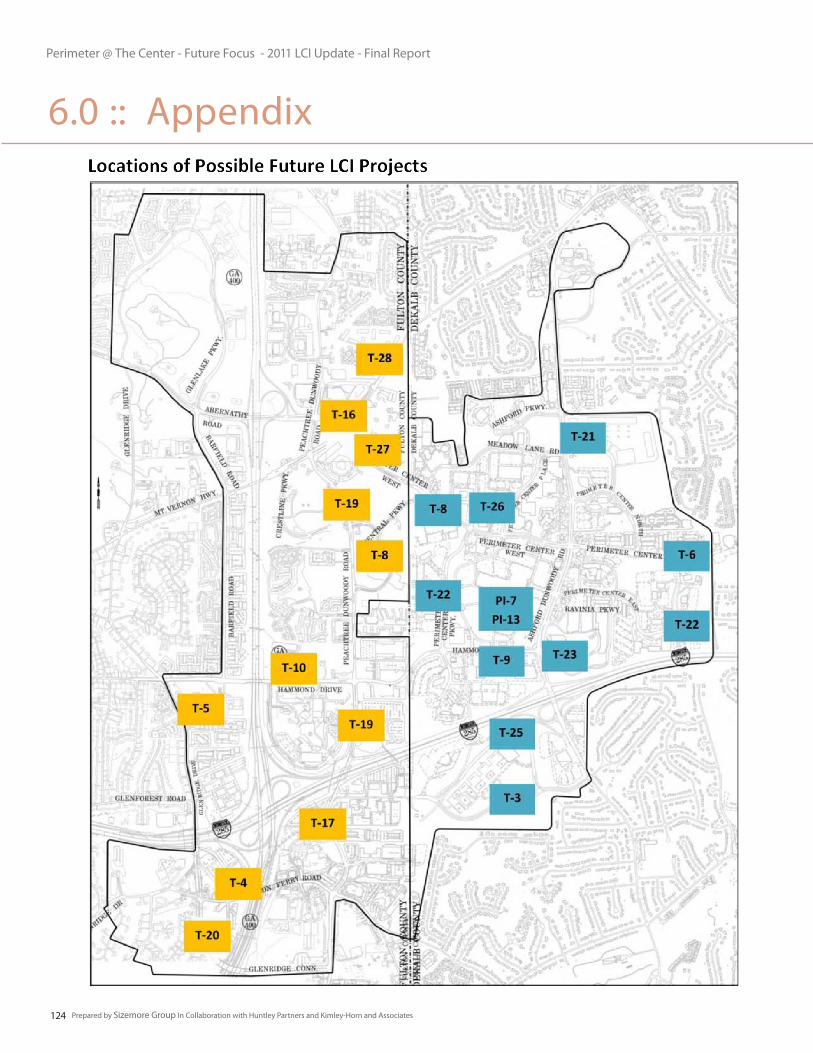
Perimeter @ The Center - Future Focus - 2011 LCI Update - Final Report
Prepared by Sizemore Group In Collaboration with Huntley Partners and Kimley-Horn and Associates124
6.0 :: Appendix
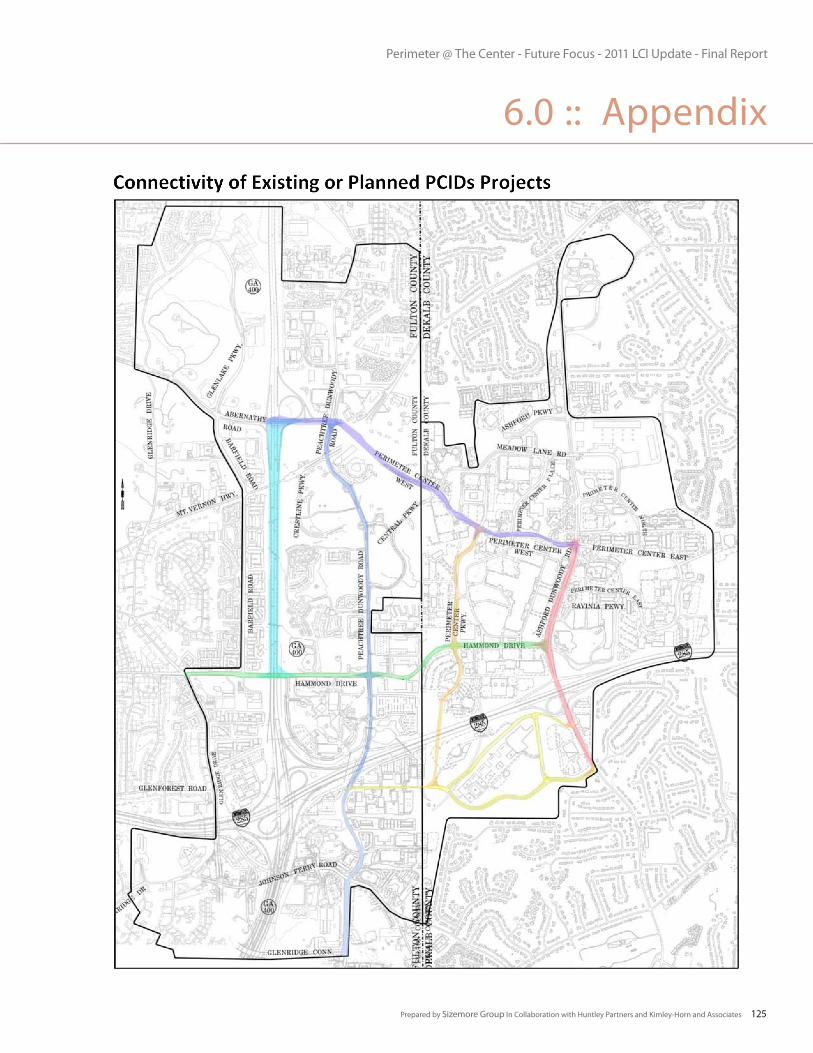
Perimeter @ The Center - Future Focus - 2011 LCI Update - Final Report
Prepared by Sizemore Group In Collaboration with Huntley Partners and Kimley-Horn and Associates 125
6.0 :: Appendix
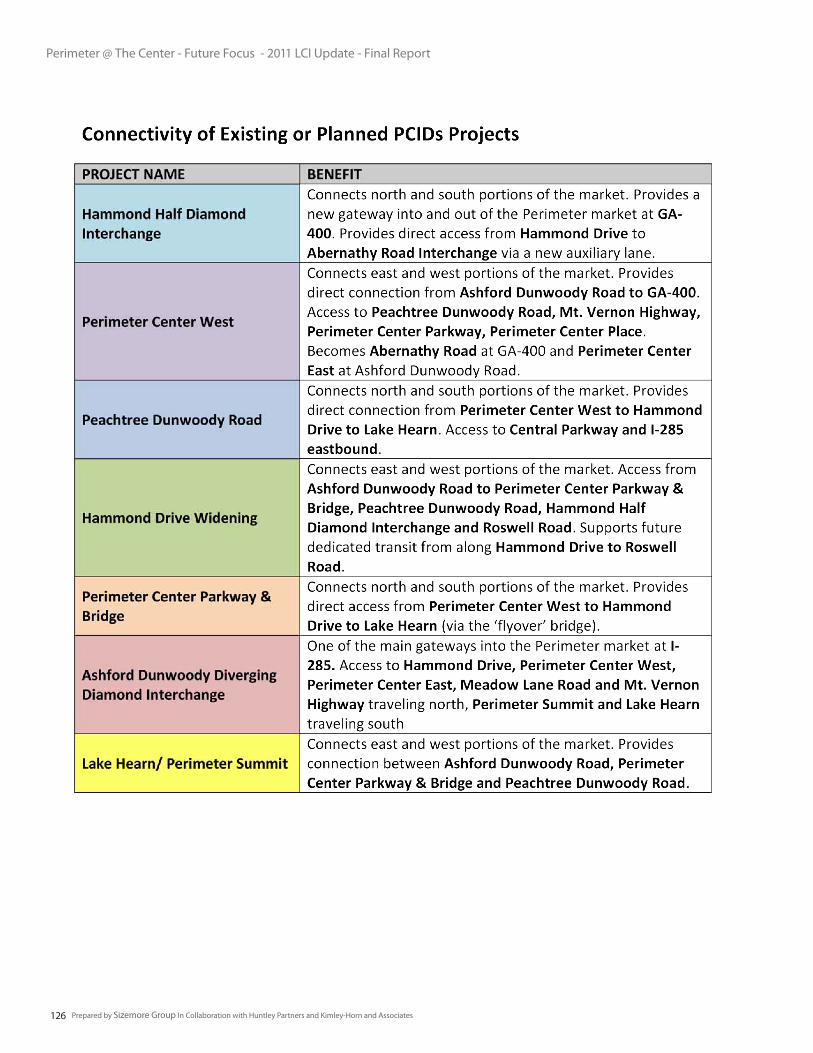
Perimeter @ The Center - Future Focus - 2011 LCI Update - Final Report
Prepared by Sizemore Group In Collaboration with Huntley Partners and Kimley-Horn and Associates126
Perimeter @ The Center - Future Focus - 2011 LCI Update - Final Report
Prepared by Sizemore Group In Collaboration with Huntley Partners and Kimley-Horn and Associates 127
6.3 Addendum- Future Transit Corridor from Ashford Dunwoody Road to Roswell Road
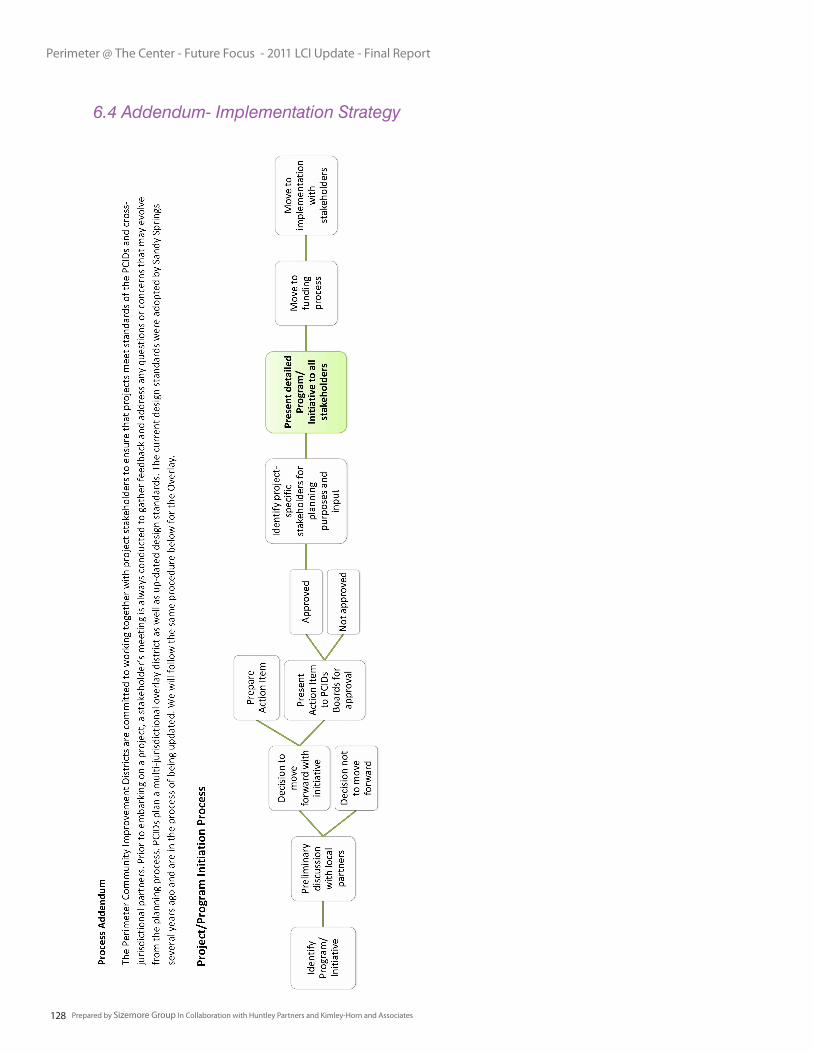
Perimeter @ The Center - Future Focus - 2011 LCI Update - Final Report
Prepared by Sizemore Group In Collaboration with Huntley Partners and Kimley-Horn and Associates128
6.4 Addendum- Implementation Strategy


Sizemore Group1700 Commerce Drive, NWAtlanta, GeorgiaTel: 404-605-0690Fax: 4040-605-0890www.sizemoregroup.com