performance tuning for high performance computing systems
TRANSCRIPT

Performance Tuning for High Performance
Computing Systems
By
Himanshu Pahuja
Thesis submitted in partial fulfilment of the requirements for the
Degree of Master of Information Technology (Honours)
in the Caulfield School of Information Technology at
Monash University, Australia
August, 2011

DECLARATION
I declare that the thesis contains no material that has been
accepted for the award of any degree in any University and
that, to the best of my knowledge, this thesis contains no
material previously published or written by any other person
except where due reference is made in the text.
Signed
Date
Caulfield School of Information Technology
Monash University
Australia

Copyright Notices Notice 1 Under the Copyright Act 1968, this thesis must be used only under the normal conditions of scholarly fair dealing. In particular no results or conclusions should be extracted from it, nor should it be copied or closely paraphrased in whole or in part without the written consent of the author. Proper written acknowledgement should be made for any assistance obtained from this thesis. Notice 2 I certify that I have made all reasonable efforts to secure copyright permissions for third-party content included in this thesis and have not knowingly added copyright content to my work without the owner's permission.

ACKNOWLEDGEMENT
I thank my supervisor Dr. Jefferson Tan for his continuous
guidance, innovative ideas and motivation in this research.
I thank my friends who have supported me throughout the
year. Special mentions go to Anjali and Chandni.
I also acknowledge my fellow Honours students (Hasn, Haihao
and Sepehr) for making the last year extremely enjoyable.
Finally, I dedicate this thesis to my parents,
Mr Rakesh Kumar Pahuja and Mrs Madhu Pahuja, in appreciation
of their love and support.

Performance Tuning for High Performance Computing Systems
ABSTRACT
A Distributed System is composed by integration between loosely coupled
software components and the underlying hardware resources that can be
distributed over the standard internet framework. High Performance
Computing used to involve utilization of supercomputers which could churn
a lot of computing power to process massively complex computational
tasks, but is now evolving across distributed systems, thereby having the
ability to utilize geographically distributed computing resources.
We often do not realize that today, we unknowingly are dependent on one
or the other distributed high performance computing systems. With the
world progressing towards paradigms such as cloud computing, installing
software and buying high end computing systems will be a thing of the past,
with everything being accessible through the internet. So much dependent
on such systems will ensure their quick growth and the amount of resources
under these systems will increase drastically in count as well. We are
though not ready for such a development, mainly because the domain of
resource utilization still lacks some control for the user and the system
developer as well. This thesis therefore explores the specific domain of
resource utilization across a computing grid and highlights a key aspect of
resource allocation.
We also describe a performance tuning application that validates our
proposed hypothesis by highlighting the amount of resource savings that
can be achieved if such an optimization is incorporated.
Table of Contents
1 Chapter 1 Introduction 1.1 PREAMBLE ………………………………………………………………………..…………………… 1
1.2 OBJECTIVES ………………………………………………………………………..………………….. 2
1.3 OUTLINE …………..…………………………………………………………..…………………… 4
2 Chapter 2 – High Performance Computing 2.1 HIGH PERFORMANCE COMPUTING SYSTEM ………………………………………… 5
2.1.1 NETWORKING INFRASTRUCTURE ……………………………. 5
2.1.2 DATA PLACEMENT AND ACCESS TECHNIQUES ………………. 6
2.1.3 JOB SCHEDULER ……………………………………………………. 7
2.1.4 RESOURCE MANAGER ……………………………………………………… 9
2.1.5 RESOURCE ALLOCATOR ……………………………………………………… 12
2.1.6 APPLICATION TUNING …………………………………………………….. 14
2.1.7 SOME OPTIMIZED HPC SYSTEMS …………………………… 15
2.2 PERFORMANCE EVALUATION OF HPC …………………………………………………….. 16
2.2.1 FAULTS ..……………………………………………………………….. 17
3 Chapter 3 – Performance Tuning Implementation 3.1 ONTOLOGY ATTACHMENT ………………………………………………………………… 18
3.1.1 RESOURCE FIRST ……………………………………………………. 19
3.1.2 JOB FIRST …………………………………………………………………. 20
3.1.3 METRIC FIRST …………………………………………………………………. 21
3.2 EXPERIMENTAL SETUP …………………………………………………………………………….. 22
3.2.1 STATISTICAL DATA COLLECTION ………………………………………. 22
3.2.1.1 HPC SYSTEM INTERFACES …………………………. 22
3.2.1.1.1 NIMROD …………………………. 22
3.2.1.1.2 MONASH SUN GRID ……………. 24
3.2.1.2 SELECTED METRICS ……………………………………… 27
3.2.1.3 DATA COLLECTION MECHANISM ….………… 27
3.2.1.3.1 CONSTANT MONITORING 28
3.2.1.3.2 JOB STATISTICS COLLECTION 28
3.2.1.3.3 JOB STATISTICS COMPILER 29
3.2.2 STATISTICAL DATA ANALYSIS ……………………….……………. 30
3.2.2.1 DATA SET …………………………………………………. 30
3.2.2.2 RESULT SET …………………………………………………. 32

3.2.3 DATA ANALYSER AND PERFORMANCE TUNER …………… 35
3.2.3.1 COMPONENTS ……………………………………. 35
3.2.3.1.1 DATA SOURCE ………….. 35
3.2.3.1.2 ONTOLOGY BUILDER 36
3.2.3.1.3 SCENARIO BUILDER …….……. 39
4 Chapter 4 – Optimizer Integration 4.1 OPTIMIZER INTEGRATION ……………………………………………………………………… 44
4.2 ADVANTAGES …………………………………………………………………………………… 46
4.3 DRAWBACKS …………………………………………………………………………………… 47
5 Chapter 5 – Summary 5.1 RESEARCH SUMMARY & CONTRIBUTIONS ………………….…………………………. 48
5.2 FUTURE WORK …………..…………………………………………………………………………………… 50
5.3 REFERENCES ……………………………………………………………………………………………….. 51
6 Appendix 6.1 DATA SET ……………………………………………………………………………………………….. 54
6.2 SOURCE CODE ……………………………………………………………………………………………….. 54
6.3 SCRIPTS ……………………………………………………………………………………………….. 54
List of Figures
Figure 1 RESOURCE FIRST MODEL .................................................................................................... 19
Figure 2 JOB FIRST MODEL ............................................................................................................... 20
Figure 3 METRIC FIRST MODEL ........................................................................................................ 21
Figure 4 MONASH SUN GRID UTILIZATION ....................................................................................... 26
Figure 5 - Monash sun grid usage statistics ...................................................................................... 30
Figure 6 ONTOLOGY BUILDER .......................................................................................................... 35
Figure 7 Data organization process flow .......................................................................................... 37
Figure 8 PERFORMANCE TUNER - SCENARIO SIMULATOR ................................................................ 39
Figure 9 JOB PROCESSING - LEvel 1 data flow diagram ..................................................................... 44
Figure 10 OPTIMIZATION MODULE ON NIMROD (Nimrod) ............................................................... 46
List of Tables
Table 1 NIMROD TOOLS (Nimrod) .................................................................................................... 22
Table 2 MSG Execute Nodes (Monash Sun Grid) .............................................................................. 24
Table 3 RESULT SET 1 ....................................................................................................................... 32
Table 4 RESULT SET 2 ....................................................................................................................... 33
Table 5 RESULT SET 3 ....................................................................................................................... 34
Table 6 SIMULATION RESULTS ......................................................................................................... 40
Table 7 JOB TYPE: SHELL SCRIPTS: RESULT SET ................................................................................. 42
Table 8 JOB TYPE: GLOBUS JOB: RESULT SET .................................................................................... 43
1 | P a g e
1.1. PREAMBLE The first high performance computer surfaced in the 1960s and was known as the CDC
6600 series, designed by Seymour Cray. The same organization continued to evolve the
design and introduced the T3E system series in 1996. Today, Cray’s Jaguar is ranked as
the second best High Performance Computer, the best being NUDT’s Tianhe-1A.
The 50 years of development greatly revamped the design and performance of the High
Performance Systems exponentially.
High Performance Computing (HPC) or the computing paradigm wherein
supercomputers and computer clusters are used to solve advanced computational
problems, has been around for a while now and there have been quite a number of
investigations in the domain as well. These have particularly led to development of
paradigms such as High Throughput Computing (HTC), a computer science term to
describe the use of many computing resources over long periods of time to accomplish a
computational task; Grid Computing, a term referring to the combination of computer
resources from multiple administrative domains to reach common goal; and Cloud
Computing which is Internet-based computing, whereby shared resources, software, and
information are provided to computers and other devices on demand, like the electricity
grid. . These are basically the branches of the same tree with different aspects. They
focus on different requirements yet with a common principle. The key idea is seamless
integration of computing power that is spread across a city, a country or the entire
globe. Different objectives branched out to different paradigms and products such as
Computational Grids for scientific research and Cloud Computing for fulfilling computing
requirements through shared resources. The architecture of high performance
distributed system, particularly of a Grid System has three core components. A Task
Manager to receive jobs from Authenticated Users, Task Scheduler to schedule jobs and
a Resource Manager to manage the resources and their allocation as well. The domain
of Authentication and Task Management has been explored well and solutions such as
Shibboleth which is an Internet2 Middleware Initiative project that has created an
architecture and open-source implementation for federated identity-
based authentication and authorization infrastructure based on Security Assertion
Markup Language, have served fairly well. The next link of Task Allocation or Execution
as we may say has not been managed stupendously. Most of concern has been taken by
2 | P a g e
security and authentication aspects related to resource sharing. The focus is now
perhaps on Intelligent Task Schedulers (ITS).
The evaluation metrics for a HPC system are therefore peculiarly designed to provide a
fair analysis of their benchmarks. These metrics are the metrics which help in measuring
their efficiency. They also help us analyse the shortcomings and highlight the key indices
that can be useful for improvising the associated aspects of computing.
Hence in this very context, HPC environments can be defined as performance oriented
computing architectures that provide extreme computational power with the help of
shared resources over a network. The performance aspects of this environment attract
performance evaluation indeed. An evaluation schema would be able to present a
statistical view of the concerned scenario. This schema that constitutes the metrics by all
means should provide information to identify key areas prone to inefficiencies or areas
that can be optimized for improving the performance thresholds. This is the field which
lacks specifications and standards. The major use of such a dataset would enable scope
for performance tuning in various High Performance computing scenarios to achieve
desired results.
This particular performance tweaking for various performances oriented computing
scenarios is the subject of this research, hence titled “Performance Tuning for High
Performance Computing Systems”.
1.2. OBJECTIVES
The existing research in this domain has not considered linking statistical information
from resource usage with the job requirements. This crucial aspect can open a plethora
of opportunities that can be utilized in either tuning or optimizing the performance of
HPC systems.
The advent of optimized computing requirements has made resource sharing more of a
necessity than a choice. Systems such as Nimrod and Condor utilize the computing
power distributed across varying geographies and assist in executing complex tasks. The
progress in development of such systems has been quite remarkable, but paradigms
such as HPC still lack that perfect Task Scheduler which can analyse the state of the
distributed system and allocate jobs with a sense of intelligence. This is perhaps one of
the key challenges that Distributed Computing faces today.
There have been remarkable efforts to bridge this gap between Task Scheduling and
Task Execution, such as the Grid Harvest Service (Wu & Sun, 2006) which defines a
performance evaluation and task scheduling system. It is based on a prediction model
that can schedule three types of tasks i.e. Single Task, Meta-Task and Parallel Processing.

3 | P a g e
A lot of analysis happens across the distributed system before a resource is allocated to
a job. The state of the distributed system is measured in terms of Resource Usage
History. This aspect provides the Job scheduler with an opportunity to keep a track of
efficient resources and improve the overall performance. Ontology based Grid Resource
management systems (Amarnath, Somasundaram, Ellappan, & Buyya, 2009) present the
benefits of engaging the job scheduler with an ontology based on resource
characteristics, so as to have a better match between job requirements and available
resources. This though overlooks the relation that exists between types of jobs and their
resource counterparts.
The limitations in the existing researches provide the motivation for this research and
also assist in framing the objectives of this research.
The objectives have therefore been divided into three core components.
1. Resource Usage Statistics.
1.1. It is very important to extract the most accurate information without significant
performance negation to any component of the distributed system. Therefore
besides just having a Statistics builder, it is quite crucial to decide the placement of
such a component within the layers of the system itself.
2. Statistical Analysis
2.1. The statistics gathered under the first objective will be utilized to identify relations if
any, amongst the jobs submitted by users with the resources that they are executed
on. This will help in defining the affinity factor of a job.
3. Simulation Application
3.1. Lastly, a heuristics based Simulation application to utilize the statistics and
demonstrate a sample job scheduling operation using the performance tuning
options.

4 | P a g e
1.3. OUTLINE
The thesis has been organized into following chapters.
Chapter 2 provides a comprehensive literature review on HPC Systems’ composition.
We present an analysis and critique the various issues related to performance
dependency on various components of a HPC System.
Chapter 3 begins by describing the concept of Performance Tuning, the methods
implemented for Statistic Builder and an analysis of the collected data set. This
chapter also demonstrates the sample job scheduling application.
Chapter 4 discusses the placement of such an Optimization Module within the layers
of a HPC system.
Chapter 5 presents an analysis of the proposed mechanism.
Chapter 6 summarizes and concludes the thesis with an outline of the future work.

5 | P a g e
High Performance Computing scenarios such as Grids are composed of well-defined entities.
These include an authentication service, job schedulers and resource managers or resource
allocators. They have been defined in order to manage and accomplish the task of utilizing
the geographically distributed computing power. These entities need a robust networking
infrastructure to communicate, besides having recommended physical specifications. This is
quite a standard requirement for all the computing and processing entities alike, such as the
resource managing servers; worker nodes etc., for the entire architecture to have some an
accepted level of performance.
The review presented ahead highlights the purpose of these constituting entities and their
current utilization in the domain of high performance computing.
2.1 HIGH PERFORMANCE COMPUTING SYSTEM
An HPC System can be defined as a distinct collection of computing resources grouped
together to achieve a common goal. They interact with the help of a computer network
which may or may not be a part of the Distributed system but is very crucial for the
performance of the entire system. Therefore we begin our literature analysis highlighting
the importance of network infrastructure.
2.1.1 NETWORKING INFRASTRUCTURE
Networking infrastructure forms the backbone of distributed computing, as it enables the
communication amongst various computing entities. It comprises the selection of protocols,
connection modes and other specifications. If these characteristics are not chosen carefully,
it could alleviate the number of faults. The faults could happen due to frequent packet
drops, congestion, inefficient routing protocols, or simply disconnection between services.
Many researches have proposed efficient and robust mechanisms to encounter some typical
faults that hinder performance. The ever growing need for greater computation power and
recent advances in field of VLSI has led to rapid development of new generation-cluster and
grid computing systems (Azad, Khaoua, & Zomaya, 2005). Performance of any such system is
highly influenced by the interconnection network employed for inter-nodal communication.
All the computing resources of a distributed system connected with each other require a

6 | P a g e
basic set of network configuration to have connectivity. Efficient approaches to dynamically
reconfigure the nodes that belong to a distributed system are vital for the performance of
such systems.
Routing algorithms is an integral part of this basic configuration and play an important role
in the performance of the entire system. This is because an efficient algorithm will have a
lower rate of packet drops or transferring packets out of order. Adaptive routing (Azad,
Khaoua, & Zomaya, 2005) assists in enforcing in-order packet delivery in system wide area
networks. It selects the route of a packet dynamically, after considering the state of the
network at real time. This is crucial for massively parallel computers and system area
networks as certain MPI libraries will not accept packets out of order.
This efficiency in the supporting network infrastructure drastically improves the throughput
of a distributed computing system. Phoebus is one such model capable of dynamically
allocating network resources and using segment specific transport protocols between
gateways (Kissel, Swany, & Brown, 2010). Most of the existing networks bind end-to-end
communication to transport protocol whereas Phoebus utilizes session layer protocols and
is thus able to break end-to-end connections into a chain of connections each of which can
be chosen across the best accessible network segment. This mechanism is not a way around
congestion but an effective methodology for bulk data transfer.
2.1.2 DATA PLACEMENT AND ACCESS TECHNIQUES
Sharing data is essential in any distributed computing environment as it may slow down
parallel execution of involved applications. Data placement therefore becomes important as
it further defines the workflows associated with data fetching and recording mechanisms.
This aspect is very prominent in affecting the performance of the entire system (Azad,
Khaoua, & Zomaya, 2005). Also data placement jobs commonly known as storage requests
cannot be treated as computational jobs.
Data placement impacts performance due to the very fact that jobs that are associated with
data that is either locally available or can be accessed without consuming much resources,
execute more efficiently than jobs which have to utilize more resources to access the
required data. This is derived from the effect of spatial layout of jobs on I/O hotspots
(regions with frequent access of data and are usually busy with requests). This very layout of
jobs determines the performance and cannot be improved with the addition of I/O nodes.
Data access aspect has further been resolved with two options (Azad, Khaoua, & Zomaya,
2005). A Distributed Virtual Shared Memory system based on infini-band architecture is
based on next generation of an interconnection technique.
This data representation scheme incarnates a data entity into a set of objects that are then
distributed in the cluster. A runtime support system manages the incarnated objects and
7 | P a g e
data access is possible only with the help of an appropriate interface. This technique though
has few limitations in terms of generalizing the concept for all the applications.
A compilation of such a data management strategy has been implemented in ARTS (Buttner,
Nolte, & Schrode-Preikschat, 1999) (Adaptable RunTime System) which is a middleware
defined and implemented for the PEACE (W.Schroder-Preikschat, 1994) family of parallel
operating systems. The high performance middleware layer is applicable to performance
sensitive virtual shared memory systems. The reason behind the development of this
middleware was the lack of performance in existing common operating systems, the
consumption of processing power in complex system call mechanisms and the huge
resource utilization by the operating system alone. The middleware provides quite basic
services for distributed processing in a global object space. This global environment consists
of active and passive objects which themselves reside in distributed domains or virtual
groups. Passive objects are under the influence of Active objects and hence can only be
manipulated by them. These two entities come handy in the implementation of shared
memory paradigm. Since passive objects act like children of active objects, they are very
well utilized for concurrent invocation of procedures with the help of temporary resources.
Resource sharing is further implemented for processes using the same hierarchy of objects.
For resources to be shared, each process creates a clone of its dual (active and passive)
object instances and transfers these clones to other processes. Only the user segment of the
process is copied to the cloned process whereas the system level segment is shared by all
clones. This effective resource sharing protects system level information from being
modified by remote entities, yet providing easy access to user level information. Therefore
enabling the clients to customize specific aspects of system services dynamically and
remove the requirement of maintaining client specific data at the server.
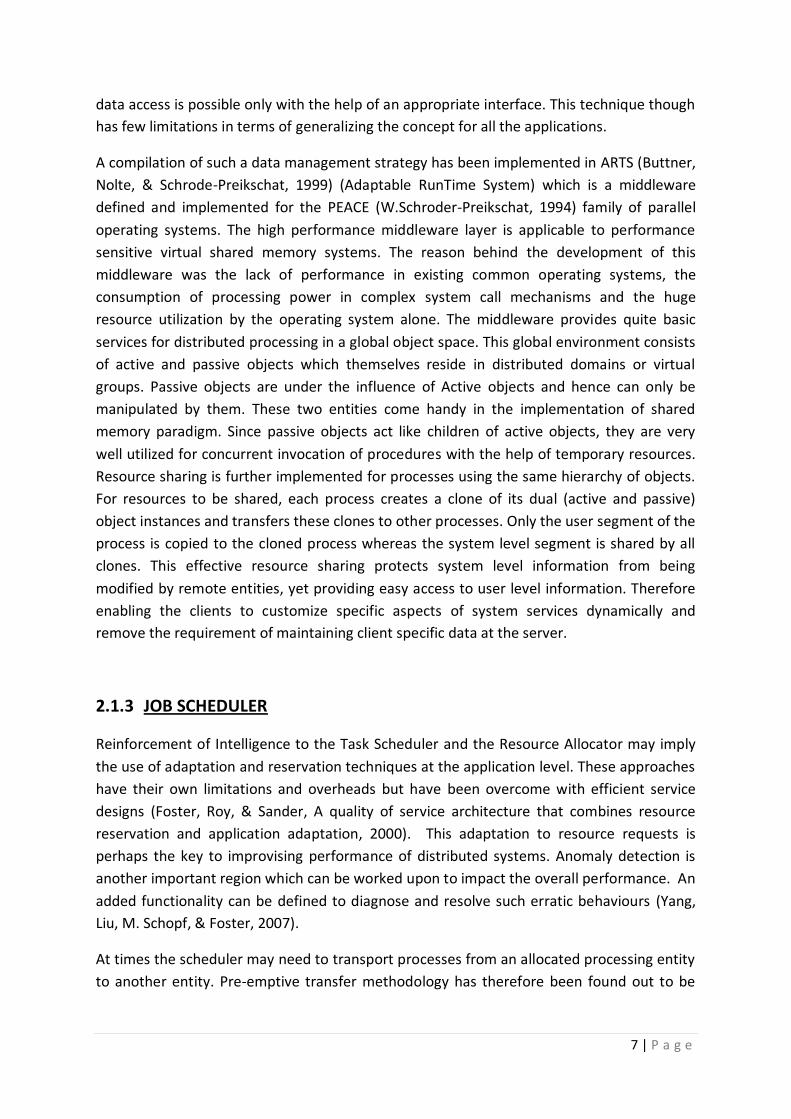
2.1.3 JOB SCHEDULER
Reinforcement of Intelligence to the Task Scheduler and the Resource Allocator may imply
the use of adaptation and reservation techniques at the application level. These approaches
have their own limitations and overheads but have been overcome with efficient service
designs (Foster, Roy, & Sander, A quality of service architecture that combines resource
reservation and application adaptation, 2000). This adaptation to resource requests is
perhaps the key to improvising performance of distributed systems. Anomaly detection is
another important region which can be worked upon to impact the overall performance. An
added functionality can be defined to diagnose and resolve such erratic behaviours (Yang,
Liu, M. Schopf, & Foster, 2007).
At times the scheduler may need to transport processes from an allocated processing entity
to another entity. Pre-emptive transfer methodology has therefore been found out to be
8 | P a g e
much better than remote execution, even though the memory transfer is expensive
(Harchol-Balter & Downey, 1997).
Adaptation techniques that are applied to the Resource Managers can be very well applied
to Schedulers as well. Also the application of heuristics to schedulers has been found to be
effective in improvising the performance of the system (Casanova, Legrand, Zagorodnov, &
Berman, 2000). These improvisations may not belong to a particular entity but do contribute
heavily towards the entire workflow. The FALKON (Raicu, Zhao, Dumitrescu, Foster, &
Wilde, 2007) framework presents some of the key features such as Multi Level scheduling
which can be very useful to enhance the performance. The schedules generated by such
mechanisms are mostly dependent on task deadlines. A schedule is although believed to be
optimal if it achieves the smallest possible value for ‘system hazard’ which is defined as the
maximum normalized task flow-time and is a better performance measure than task
deadlines (Peng & Shin, 1993).
Many a times, parallel applications are migrated over to distributed computing systems with
heterogeneous resources. It may require a level of load balancing in respect to various
components of the application itself (Korkhov, Krzhizhanovskaya, & Sloot, 2008). Therefore
an adaptive technique for load balancing of parallel applications assists in improvising the
performance of the application and the distributed system indeed. This is primarily because
performance of parallel applications when hosted across heterogeneous resources is very
much dependent on quality of workload distribution. This workload distribution can be
achieved from functional decomposition or domain decomposition (Korkhov,
Krzhizhanovskaya, & Sloot, 2008) but involves additional processing. It can be combined
with application tuning fundamentals to improve the efficiency of the job scheduler.
Job schedulers for parallel machines are often built to optimize metrics that may not deliver
the best possible application performance. A comparison of performance associated with
various job scheduling and processor allocating algorithms (Li, 2005) highlights that another
feature that would empower the job scheduler to dynamically manage resource allocations,
would be the ability to allocate and deallocate resources between applications at run time.
This brings the job scheduler much closer to the resource manager and allocator, thereby
bridging the gap between the two entities. IScheduling (Weissman, Abburi, & England, 2003)
is an application aware job scheduler that can dynamically control resource allocation
between active and queued applications even during the execution. This allows the
iScheduler to have certain policies and rules to assign system performance a priority over
application performance. It is basically based on three main ideas.
2.1.3.1 Cost prediction - Considers the costs of allocation and deallocation of resources to
respective applications in terms of resource consumption, wastage, achieving task deadline
etc.
9 | P a g e
2.1.3.2 Adaptivity - Responds to the dynamic environment in an efficient manner. This may
include reacting to application or hardware faults or other dynamic run-time events.
2.1.3.3 Admission Control - Controls the submission of an application to a queue or directly
to processing sub-system. This is crucial as it needs to evaluate the current situation in
terms of resource availability and requirements of the entering application.
Alternate perspective highlights that a job scheduler that considers priorities and deadlines
associated with tasks usually does not require the knowledge of the global state. This idea is
very much efficient in maintaining the performance thresholds of the system, but only in
respect to critical applications meeting deadlines (Liu & Baskiyar, 2009). The non-critical
applications will however suffer under such a policy and the overall performance of the
system will not be the best achievable.
A job scheduler would be much more efficient if supplied with fault aware policies (Al-
Azzoni & Down, 2008). The decisions made by the job scheduler will be more effective and
aware of the current and a possible state of the environment in terms of jobs in queue, jobs
in execution and last but not the least the persistent faults as well.
Imparting the job scheduler with flexibility to perform dynamic resource scheduling or load
balancing is deemed beneficial only when required and also prevents the mechanism from
becoming a burdensome cost factor. Balancing of processor load without regard for
communication costs can deteriorate performance when network communication becomes
a dominant factor.
A point of discussion would be related to the overheads introduced by these entity specific
features or improvisations as we define them. A mechanism to consider these overheads
and at the same time minimize the execution time as well is of utmost importance when
considering such modifications (Ito, Ohsaki, & Imase, 2005).
2.1.4 RESOURCE MANAGER
A resource manager plays an important role within a Distributed System. It is important to
keep a track of the status of various resources that constitute the system. It is critical to Task
Allocation and Scheduling as well. If a resource goes unavailable without informing the Task
Manager, the Task Manager would consider the resource to be available and allocate it to
the task. The task may then return incomplete or failed and hence will require another
phase of processing, bringing down the throughput of the entire system.
In grid computing, the term resource management refers to the operations used to control
how capabilities provided by the resources and services of a grid are made available to
other entities such as users, applications, or peer services (Foster & Kesselman, The Grid:
Blueprint for a New Computing, 2004). Resources can be computational, storage, network
or blocks of code, with each having a specific attribute defining its processor utilization, disk
space, memory or network bandwidth (Foster & Kesselman, The Grid: Blueprint for a New
10 | P a g e
Computing, 2004). Resource management is quite a critical component for any distributed
computing architecture, specifically for a grid. The main responsibilities of a resource
manager include resource selection for jobs in queue, resource monitoring and task
migration in case of faults or resource failures.
Resources can be managed in two possible ways. The first is more of a manual responsibility
for the user to search for desired resources using an information service and submitting the
selection of resource to the local resource manager, while the second one refers to the
utilization of a designated resource manager. The first method is not only an added
responsibility for the user but is inefficient as well. The user may not be aware of the status
or capabilities of the chosen resources, and therefore this random selection may lead to
performance degradation due to the consumption of non-productive resources.
Such resource managers are available in Condor-G (Frey, Foster, Livny, Tannenbaum, &
Tuecke, 2001), PBS (Papakhian, 1998), and Legion (Grimshaw & Wulf, 1996). Condor-G
utilizes the efficiencies of components present in Globus and Condor to enable the users to
use multi-domain resources (Leea, Chungb, China, Leea, & Leea, 2005) with the help of a
genetic algorithm named Gang-Matching.
The existing approaches as employed in Condor and Globus do not focus on best resource
selection and hence have a constrained performance. They have focused on fault tolerance
issues but do not provide a generic work flow for dealing with failures and rectifying them.
Globus specifically lacks a fault tolerance mechanism.
The efficient resource manager (Leea, Chungb, China, Leea, & Leea, 2005) utilizes a genetic
algorithm to provide the set of optimal resources for job execution. The user describes a
resource type, a resource condition, and the number of resources using Resource
Specification Language. Resource manager utilizes this information to discover resources
that satisfy these requirements. The Monitoring and Discovery service provides information
about resources available in the grid and generates the list of prospective resources that fit
the job requirements (Leea, Chungb, China, Leea, & Leea, 2005).
The components of this resource manager are:
2.1.4.1 RSL Parser-RSL is the specification language used by the Globus Toolkit to
describe task configuration and service requirements (Foster & Kesselman, The Grid:
Blueprint for a New Computing, 2004). A user can specify necessary resources using RSL. To
execute a job with the resource manager, the user describes a resource type, a resource
condition, and the number of resources using RSL.
2.1.4.2 Resource Search Agent-handles the responsibility of discovering resources
that are accessible and would be able to satisfy the requirements posed by the user. Being
based on the Globus Toolkit architecture, it uses the Monitoring and Discovery service to
achieve the defined objectives.
11 | P a g e
2.1.4.3 Resource Selection Agent-utilizes the list of resources supplied by the search
agent and determines the optimal resource. It executes the genetic algorithm (Leea,
Chungb, China, Leea, & Leea, 2005) to find the optimal resources for an efficient job
execution. Here, optimal resources are those that minimize the longest execution time of
jobs that are running on grids.
2.1.4.4 Execution Time Predictor-does the job of predicting the execution time for a
given job. An RTA (Running Time Advisor) (Dinda, 2002) is used to predict the running time
for a computation bound task.
2.1.4.5 Resource Allocation Request Agent- converts the user RSL into a ground RSL
for sending resource allocation requests to the GRAM. Further this entity uses the
Dynamically Updated Request Online Coallocator (DUROC) (Foster & Kesselman, The Grid:
Blueprint for a New Computing, 2004)for co-allocating resources.
2.1.4.6 Genetic Algorithm-utilized by the resource selection agent incorporates the
iterated evaluation of multiple mutations constituted by the resources received as input. It
defines a threshold value for fitness of selected resources. The combinations are generated
by employing a single point crossover mechanism across the list of input resources that are
deemed fit by the algorithm. Eventually using mutation to select the members from the new
generation developed.
Handling Failures is another aspect that a resource manager should consider. An efficient
resource manager efficiently handles following types of failures (Leea, Chungb, China, Leea,
& Leea, 2005).
2.1.4.7 Process failure
2.1.4.7.1 A process stops (process stop failure)
2.1.4.7.2 A starvation of process (process QoS failure)
2.1.4.8 Processor failure
2.1.4.8.1 A processor crash (processor stop failure)
2.1.4.8.2 A decrease of processor throughput due to burst job
(processor QoS failure)
2.1.4.9 Network failure
2.1.4.9.1 A network disconnection and partition (network disconnection
failure)

12 | P a g e
2.1.4.9.2 A decrease of network bandwidth due to communication
traffic (network QoS failure)
There are a number of techniques (Ravindran, Devarasetty, & Shirazi, 2002) that enable
continuous monitoring of application at run-time for verifying the status of its real-time
requirements, detecting anomalies or failures. They even dynamically allocate resources by
duplicating sub-tasks of the specific application in order to achieve load sharing. These
techniques aim to minimize the missed-deadline ratios of the associated tasks. A predictive
resource allocation algorithm helps in determining the number of sub-task replicas that will
be required for making the application suitable to current workload situation in the system.
The design of such resource managers highlights the importance of three things.
A resource manager requires support and intelligence to evaluate the fitness of available
resources and their suitability for a give job.
It should also be aware of the time for which these optimal resources should be allocated to
a job and be able to adjust allocation at run time.
A resource manager should at the very minimum, be tolerant to the defined failures.
2.1.5 RESOURCE ALLOCATOR
Many works do not emphasize the development of adaptive resource allocation algorithms,
but rather focus on challenges of system implementation, often using naive resource
allocations mechanisms as place holders. Other works target resource allocation in its full
complexity, formulate a precise optimization problem and good algorithm to solve this
problem but do not define the implications of incorporating such individually efficient
entities into a distributed system.
Resource allocation in parallel supercomputers requires the user to specify a couple of
things beforehand (Cirne, 2002).
How many processors are to be allocated to the job
For how long does the job requires processors to be allocated.
So a number of requests are supplied to the supercomputer for executing a job. The
supercomputer may choose from the many options available and execute the job.
Application scheduler estimates the turnaround for each request based on the current state
and decides upon a particular request. Jobs receive a dedicated partition to run for a pre-
established amount of time. Arriving jobs may not find enough resources to execute
13 | P a g e
immediately and hence have to wait in queue that is controlled by supercomputer scheduler
(Cirne, 2002).
Moldable Job is another paradigm that has been employed to improve the performance of a
HPC. A moldable job can run on partitions of different sizes even though it may not be
possible to change the size of the partition during execution. Since moldable jobs can use
multiple partition sizes, there are multiple requests that can be used to submit a given
moldable job.
In reality most jobs execute for less time than they request, therefore a delta time always
exists where in the processors are not executing any job. Common practice in
supercomputer scheduling exhibits some key features:
Out of order jobs start up
Allocation recycle
o If requested time is not used it is allocated to another job.
Aging
Avoid starvation of large jobs.
To address these very issues, it is ideal to have a conservative backfilling mechanism. A
conservative backfilling mechanism uses allocation lists to backfill vacant slots with most
suitable jobs.
Making appropriate decisions for allocating hardware resources is always a key challenge,
especially for services that have conflicting demands. Here appropriate implies meeting QoS
requirements, ensuring fairness among services, maximizing platform utilization, and
maximizing service defined utility functions (Stillwell, Schanzenbach, Vivien, & Casanova,
2010).
Many times resource allocation involves sharing servers among application instances. It is
also important for the resource provider to maximize revenue for such a service. This
requires the resource allocator to employ number of profiling techniques to obtain
statistical bounds on the resource usage and therefore minimize resource needs. But this
idea involves a number of challenges (Urgaonkar, Shenoy, & Roscoe, Resource Overbooking
and Application profiling in shared hosting platforms, 2002). Resource allocation systems
control how multiple services share the platform. Each service consists of one or multiple
VM instances and system ensures that requests to the services are dispatched to
appropriate servers. A mechanism to handle such scenarios includes the definition of two
resource needs (Urgaonkar, Shenoy, Chandra, Goyal, & Wood, 2008)
2.1.5.1 Fluid Resource needs – specifies the maximum fraction of a resource that the
service could use if alone on the server and implies that the service cannot benefit from a
larger fraction but can operate with a smaller fraction at cost of reduced performance.

14 | P a g e
2.1.5.2 Rigid Resource needs- imply that specific fraction of a resource is required
and the requesting service will not benefit from a larger fraction and cannot operate with
lesser fraction.
Determining actual values of these resource fractions is the key issue. To reason on the
resource fractions allocated to services and optimize the allocation as well, a metric named
‘yield’ has been defined (Mi, Casale, Cherkasova, & Smirni, 2008). A service is allocated
resource fractions based on its ‘yield’ value and the remaining resources are allocated to
services beyond their QoS requirements. The yield metric enables the resource allocator to
strike a balance between resource demands posed by two services without affecting the
performance of the entire system. It also enables the resource allocator to maximize the
efficiency of jobs by providing them with a good deal in the form of resources. This type of
resource allocation has been formulated to maximize minimum yield over all services,
thereby making the least happy service as happy as possible. The design was evaluated with
a number of algorithms to achieve best resource allocation and defined the ‘chose pack
vector algorithm’ to be most promising as it runs at best speeds and is very effective.
Another metric ‘stretch’ is applicable to time bound computational jobs rather than
continuous services and is defined as the job’s flow time (Bender, Chakrabarti, &
Muthukrishnan, 1998).
2.1.6 APPLICATION TUNING
The system efficiency can be also be increased by exploring the possibilities of application
tuning. Tuning basically refers to the ability of an application to trade of resource
requirements with other dimensions such as time, resource specification, quality of results
(Chang, Karamcheti, & Kedem, 2000). This provides flexibility in decisions made by the
resource manager to select resources for the submitted jobs.
Application tuning though requires the representation of a generic language or ontology
with which the scope of tuning can be defined. The language and scheduler extensions
defined for the MILAN (Baratloo, Dasgupta, Karamcheti, & Kedem, 1999) meta-computing
environment apparently improve resource utilization with the feature of application tuning.
The middleware layers constituting MILAN enable reliable, efficient and predictable
execution of applications on a dynamically changing group of nodes.
Resource allocations in MILAN use two-level strategy. The application conveys its
requirements to the resource broker, which monitors resource availability in the entire
system and dynamically divides them amongst the queued jobs. An application manager
controls the second level of the strategy. This entity further divides the resource allocations
amongst the individual tasks of the assigned computation or job. This flow of resource
15 | P a g e
allocation though is quite efficient but lacks intelligent resource allocations because the
selections are made on the basis of availability and not suitability.
Application tuning requires the application to be analysed to a specific depth in order to
figure out its various paths of execution, which further assist in determining application
profiles. These profiles enable the tuning mechanism to make decisions in respect to trade-
offs and help the resource manager select the most appropriate resource for the task. The
term appropriate refers to a resource which is available and allocation of which will not
hamper the performance of the system.
Application tuning incorporates primarily two types of modifications. The first one applies
variations to behaviours constituting the application and the second one studies the effects
of resource variations on the outputs generated.
MATE (Caymes-Scutari, Morajko, Margalef, & Luque, 2010) (Monitoring, Analysis and Tuning
Environment) is another model based on the same paradigm of application tuning to
achieve better performance. This model though evolves with each execution cycle and is
able to make better decisions regarding tuning of parallel applications.
2.1.7 SOME OPTIMIZED HPC SYSTEMS
The defined entities when empowered and brought together can assist in establishing a
performance oriented and efficient distributed system.
The idea can be summarized effectively by comparing it with the mechanism defined for
FireGrid (Han, et al., 2010). The basis behind FireGrid is an efficient response system to
support large scale emergencies. The proposed mechanism is utilized to model a solution
where in the advantages of distributed computing are utilized to impart efficiency and
accuracy to the decision support system being used for responding to emergencies. The
mechanism consists of two tasks.
The first task is data gathering, where in information reflecting the state of the environment
is gathered in the form of metrics. This information can be gathered in varying ways
described earlier and as suitable for the scenario.
The second task involves data interpretation. This task is apparently a critical entity in the
system and provides an analysis of the information gathered in a form that can be used by
the system to generate a set of possible suggestions.
A logical representation of the information is defined with the help of an ontology specific
to the system. This ontology not only provides the system to model information in an
efficient manner but also enables the model to be accurately utilized by the processing
entities. Therefore, the ontology proves to be a common ground for enabling understanding
between the information generator and the user of the information. The FireGrid was
tested with the help of K-CRISP simulation model that generated large number of
16 | P a g e
independent scenarios to be processed by the system and the results were strongly in
favour of the system.
The provision of an efficient system support for concurrent applications has always been an
issue. There are two potential hindrances to this provision (Cruz & Park, 1999). First one is
the presence of an effective mechanism to maintain relationships among data or task
objects with respect to their semantics. Second is the scheduling algorithm that should be
able to match coupled processes to their costs. DUNES (Cruz & Park, 1999) is a system
support environment designed to overcome these hindrances with following characteristics.
2.1.7.1 Dependency Maintenance
DUNES makes sure that functional dependency of the form process to process, process to
file is maintained by the system in presence of dynamic scheduling. So if a process migrates
to another host, its relations are kept intact with preserved semantics
2.1.7.2 Performance features
Moderates overhead costs by employing active and passive end point caching.
Communication sensitive load balancing at algorithm level affects dynamic scheduling which
is itself linked to communication costs.
2.2 PERFORMANCE EVALUATION OF HIGH PERFORMANCE COMPUTING
SYSTEMS
Over the past few years of research in this domain, harnessing the collective power for
distributed computing had become an ultimate goal. This goal was though coupled with a
number of specific requirements. Today, harnessing the distributed computing potential
alone is no more a complex task and the focus has shifted to perfecting the mechanism of
harnessing itself. Performance evaluation is therefore necessary to judge this perfection.
In order to fine tune performance, it needs to be evaluated. This is a challenge in itself
considering the distributed nature of high performance computing scenarios such as
computational grids. Generalized Stochastic Petri Nets is a viable solution for this problem
(Bruneo, Scarpa, & Puliafito, 2010).
A work flow is established to record time stamps for various events and using this gathered
data set to accomplish performance evaluation in terms of throughput, resource utilization,
response time etc. The jobs are primarily segregated on the basis of types which reflect the
queue type as well. A chain of logging events is triggered upon variation in status of each
job. These logging events enable recording of data reflecting times when job state
transitions from one state to another. For instance a job transitioned into ready from its
17 | P a g e
waiting state, or from running state to its finished state. These recorded time stamps enable
the calculation of the duration that each job spent in each of the states constituting its life
cycle. The calculation when magnified to the view of the system provides a fair evaluation of
the performance during the specific period.
The defined model also highlights the necessity of such an evaluation to adhere to the
service licence agreements held with the clients. The performance evaluation model though
is quite effective, has not been utilized to support the entities constituting the distributed
system. This important data set if shared with the entities of a distributed system, would
improve the performance drastically.
Petri-Nets can also be applied to evaluate the performance of scheduling algorithms that
are used in real time distributed systems. S-Nets (Balaji, Patnaik, Jenkins, & Goel, 1992) is an
example of such a scenario.
2.2.1 FAULTS
Faults tend to become hindrance to the performance of any computing scenario. Their
detection is an overhead and should be compensated with their resolution alone. An
algorithm based fault tolerant model (Bosilca, Delmas, Dongarra, & Langou, 2009) for high
performance computing would be worth the associated computational overhead, only if
such faults can be recovered within the scope of the job itself. The fault tolerance system
(Bosilca, Delmas, Dongarra, & Langou, 2009) described in context of high performance
computing is capable of detecting and correcting errors during computation itself. This is
achieved with the utilization of additional processors to store redundant information. The
information is stored in the form of checksums which represent an efficient and memory
effective way of supporting multiple failures (Bosilca, Delmas, Dongarra, & Langou, 2009).
This redundant information is fetched when required with the help of processor matrices.
This approach is very much practical but not scalable enough to incorporate large amounts
of data sharing. As a good number of processors would be utilized in keeping redundant
information and could turn out to be more expensive in terms of performance and
throughput.
18 | P a g e
Tuning is a process often used for overcoming bottlenecks in any system and optimizing its
performance. This process also involves a trade-off between different aspects of the
concerned system. If a system has two evaluation metrics, for instance consider the case of
a car, it has two basic evaluation metrics, Top Speed and Acceleration. Performance Tuning
for a car would either aim at maximizing Top Speed or Acceleration. So there is a trade-off
between Top Speed and Acceleration as increasing the top speed of the car will bring the
acceleration down and vice versa.
Similar is the case for High Performance Computing Systems. The metrics within the scope
of this thesis are CPU usage, MEMORY usage and VIRTUAL MEMORY usage. It is a fair
assumption that if the performance tuner tries to optimize CPU usage, there would be
potential increase in MEMORY usage and vice versa.
Optimized utilization of resources is not the only reason to incorporate Performance Tuning
in high performance computing systems. The fact that most of these systems are designated
as pay per use systems, the organizations providing such systems as services need to have
stringent control over allocation of resources and at the same time be flexible enough to
provide these resources with an agreed level of service. This will not only provide efficient
resource utilization but also enable the system owners to charge differently for various
levels of service provided to users. So by categorizing resources amongst quality levels, the
cost controlling department will be able to charge more for resources at higher quality
levels as compared to those at lower qualities.
3.1 ONTOLOGY ATTACHMENT
Performance Tuning does not necessarily require the support of ontology to describe the
underlying resources and their corresponding metrics, but having a system describing
ontology enables efficient organization of resources amongst desired quality levels and also
makes it easier for the job scheduler to query the ontology and retrieve the list of suitable
resources.
System Ontology therefore can be built up to organize the available resources into desired
hierarchies or levels. Selecting the relation and order of hierarchies is an important aspect
while building up system ontologies. There are different options to build up such
hierarchies.
19 | P a g e
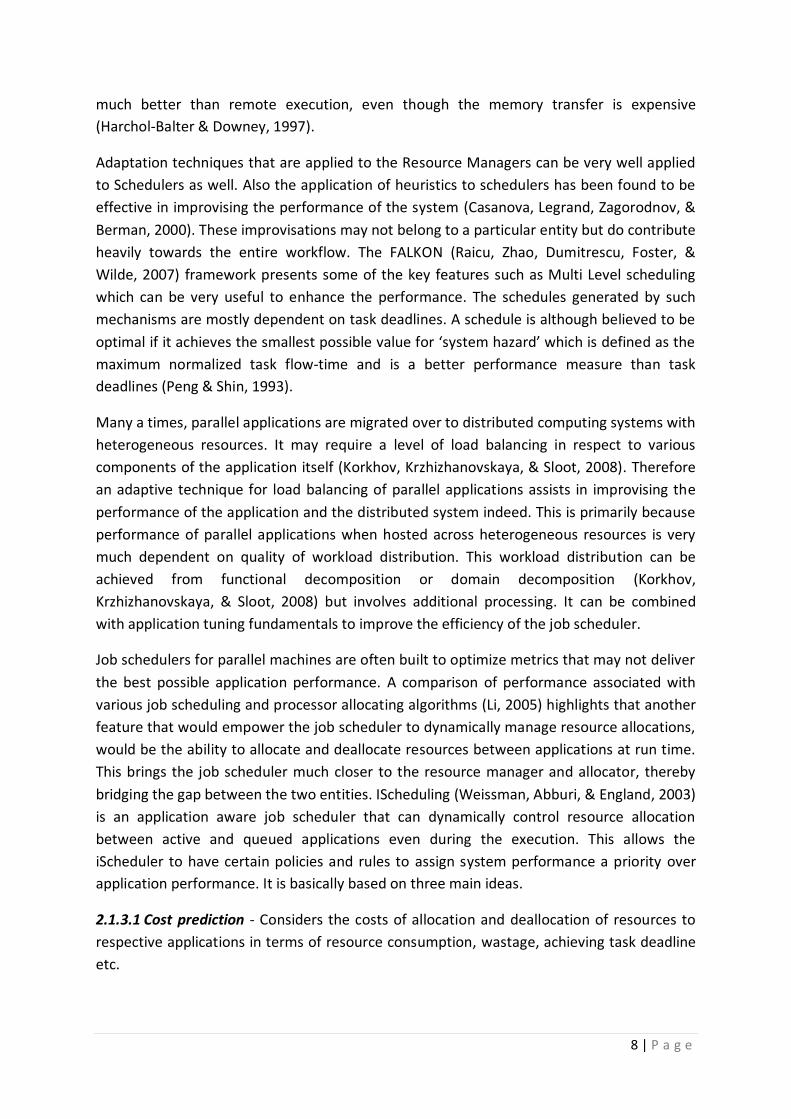
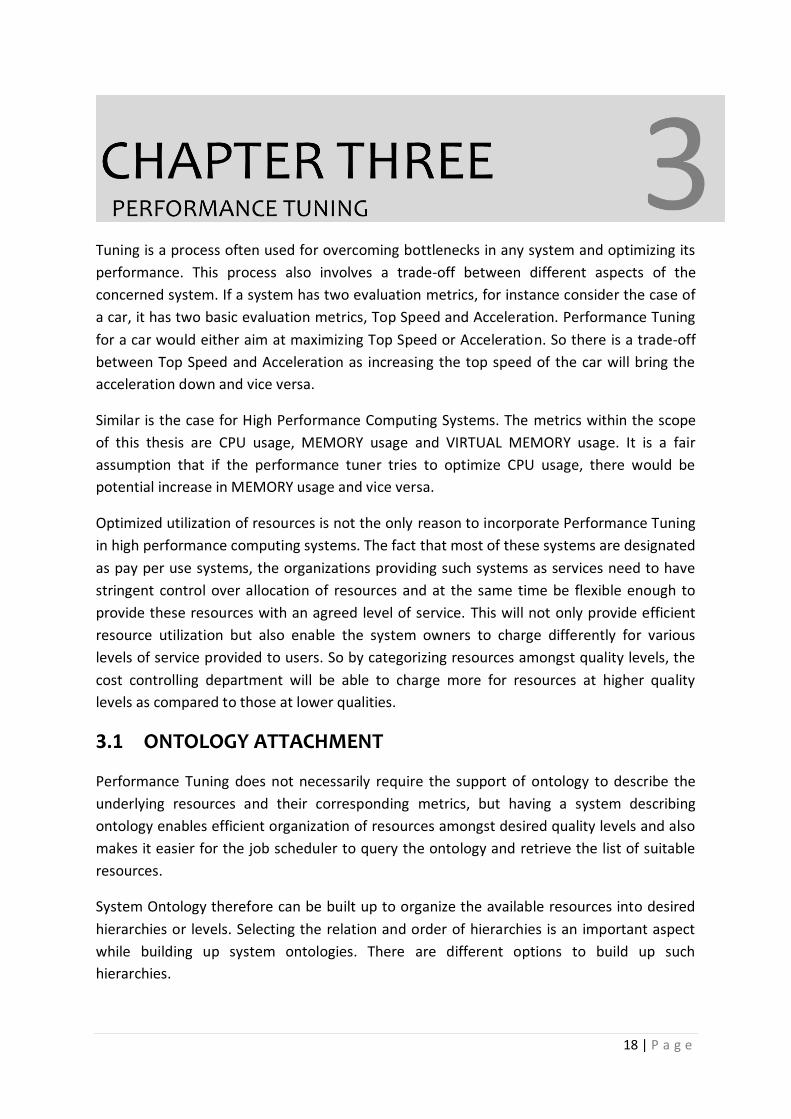
3.1.1 Resource First
This order of building up selects the resources as head nodes. The next level
of hierarchy includes job groups. Further down the depth, are the system
aspects followed by quality level designations. This has been illustrated in the
figure below.
FIGURE 1 RESOURCE FIRST MODEL
This model though is the simplest, but calls for some complex querying when
a set of optimized resources is required for a particular job. The job group is
the first set of information that is determined upon receiving a job for
execution. If this model would have been utilized for resource categorization,
it would first look for suitable resources, then navigate through the matching
job groups to find match for required quality levels of the corresponding
aspects. So in this model, a depth scan will be required for each resource
node.
RESOURCES
NODE 1
JOB GROUP A
JOB GROUP B
JOB GROUP C
CPU
LEVEL 5
MEMORY
LEVEL 2
NODE 2 NODE 3 NODE 4
20 | P a g e
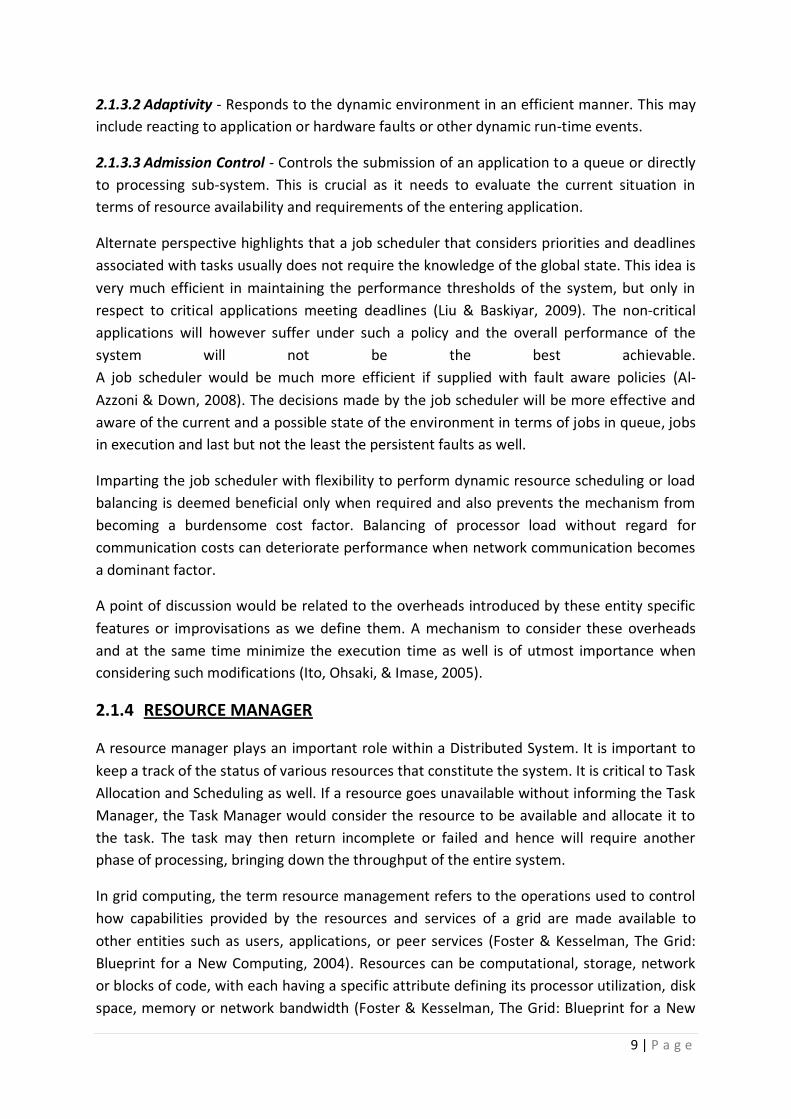
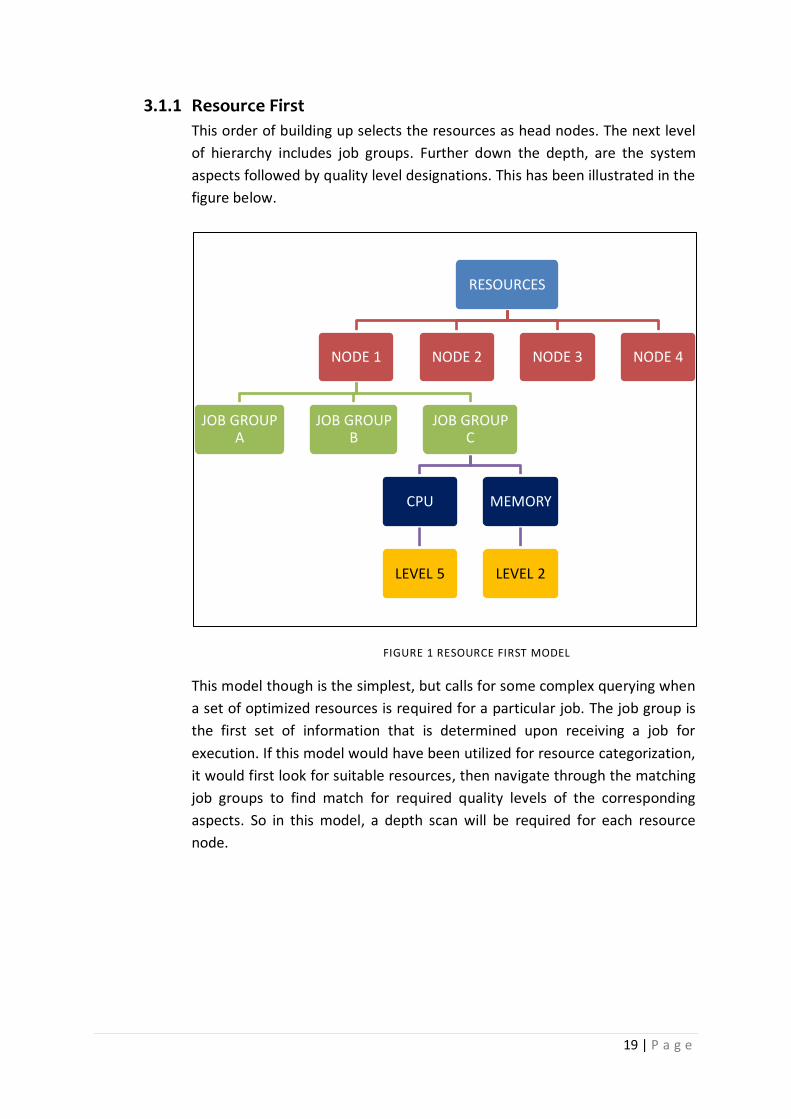
3.1.2 Job First
This model starts with Job First grouping. Job groups sit at the top of the tree,
followed by various system aspects. The quality levels are defined for each of
these aspects and finally the resources are associated with these quality
levels. Such a model has been illustrated in the figure below.
FIGURE 2 JOB FIRST MODEL
This model overcomes the scanning required for each resource node in the
previous model and hence is more efficient and simple. This model also
requires minimum redundancy of nodes, as each job group will have a fixed
number of aspects as its children and will be consistent across ‘n’ number of
job groups.
JOBS
JOB GROUP 1
CPU
LEVEL 5
NODE 3 NODE 4
MEMORY VIRTUAL MEMORY
LEVEL 2
NODE 1 NODE 2
LEVEL 4
NODE 6
JOB GROUP 2
JOB GROUP 3
21 | P a g e
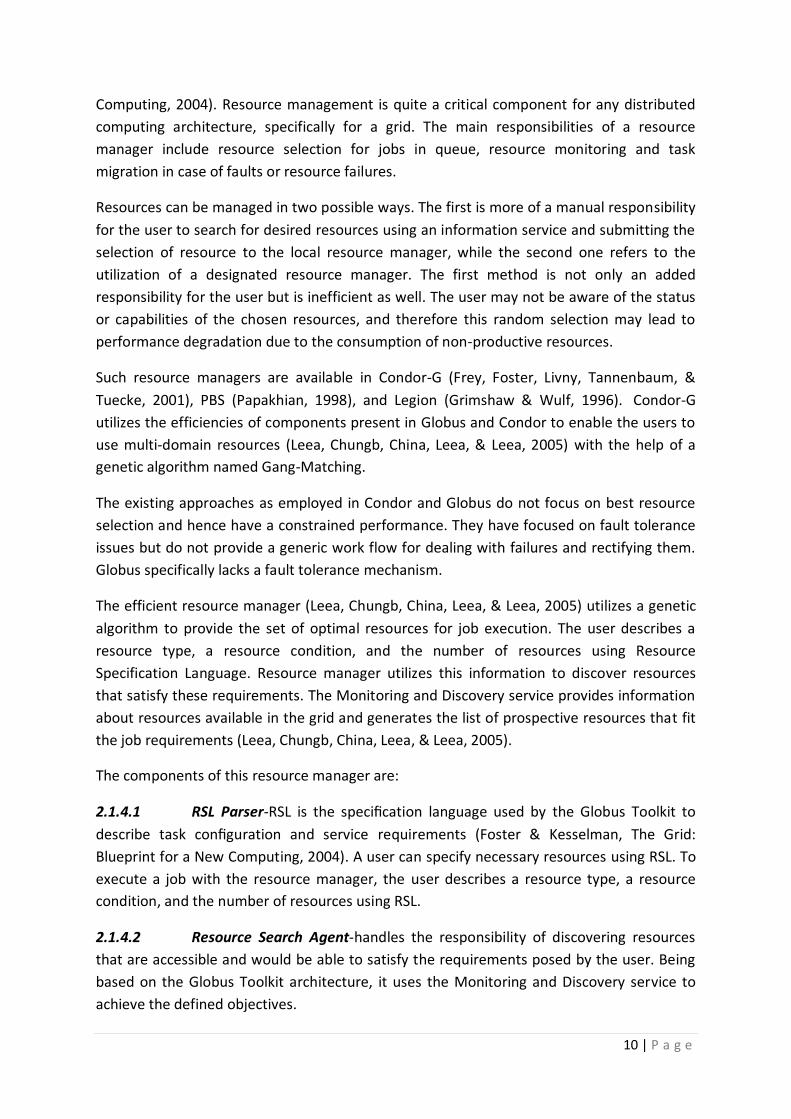
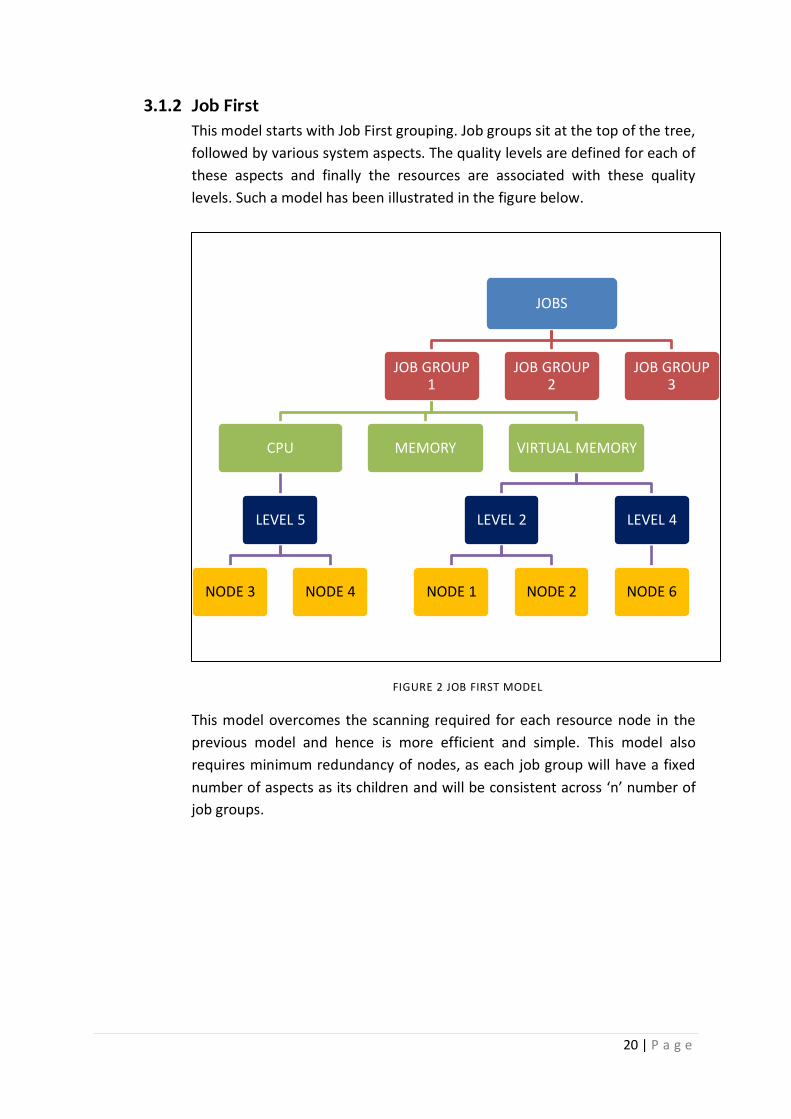
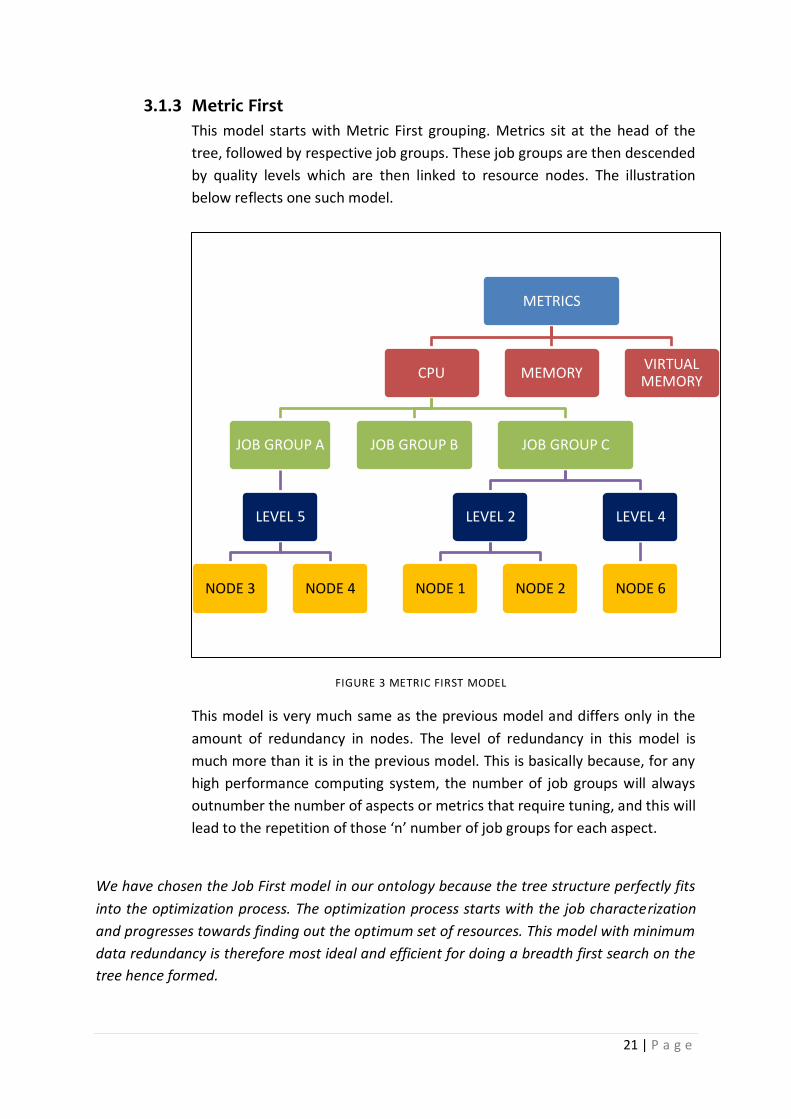
3.1.3 Metric First
This model starts with Metric First grouping. Metrics sit at the head of the
tree, followed by respective job groups. These job groups are then descended
by quality levels which are then linked to resource nodes. The illustration
below reflects one such model.
FIGURE 3 METRIC FIRST MODEL
This model is very much same as the previous model and differs only in the
amount of redundancy in nodes. The level of redundancy in this model is
much more than it is in the previous model. This is basically because, for any
high performance computing system, the number of job groups will always
outnumber the number of aspects or metrics that require tuning, and this will
lead to the repetition of those ‘n’ number of job groups for each aspect.
We have chosen the Job First model in our ontology because the tree structure perfectly fits
into the optimization process. The optimization process starts with the job characterization
and progresses towards finding out the optimum set of resources. This model with minimum
data redundancy is therefore most ideal and efficient for doing a breadth first search on the
tree hence formed.
METRICS
CPU
JOB GROUP A
LEVEL 5
NODE 3 NODE 4
JOB GROUP B JOB GROUP C
LEVEL 2
NODE 1 NODE 2
LEVEL 4
NODE 6
MEMORY VIRTUAL MEMORY
22 | P a g e
3.2 EXPERIMENTAL SETUP
Performance Tuning requires scoping of the system to highlight specific metrics which can
be tuned. This further requires gathering system usage statistics and their analysis.
Therefore the objectives for the first phase of experimentation are as follows:-
3.2.1 Statistical-Data Collection
3.2.2 Statistical-Data Analysis
3.2.1 Statistical-Data Collection
For the purpose of this study, we had access to two distributed system interfaces, Nimrod
and Monash Sun Grid.
3.2.1.1 HPC SYSTEM INTERFACES
3.2.1.1.1 Nimrod
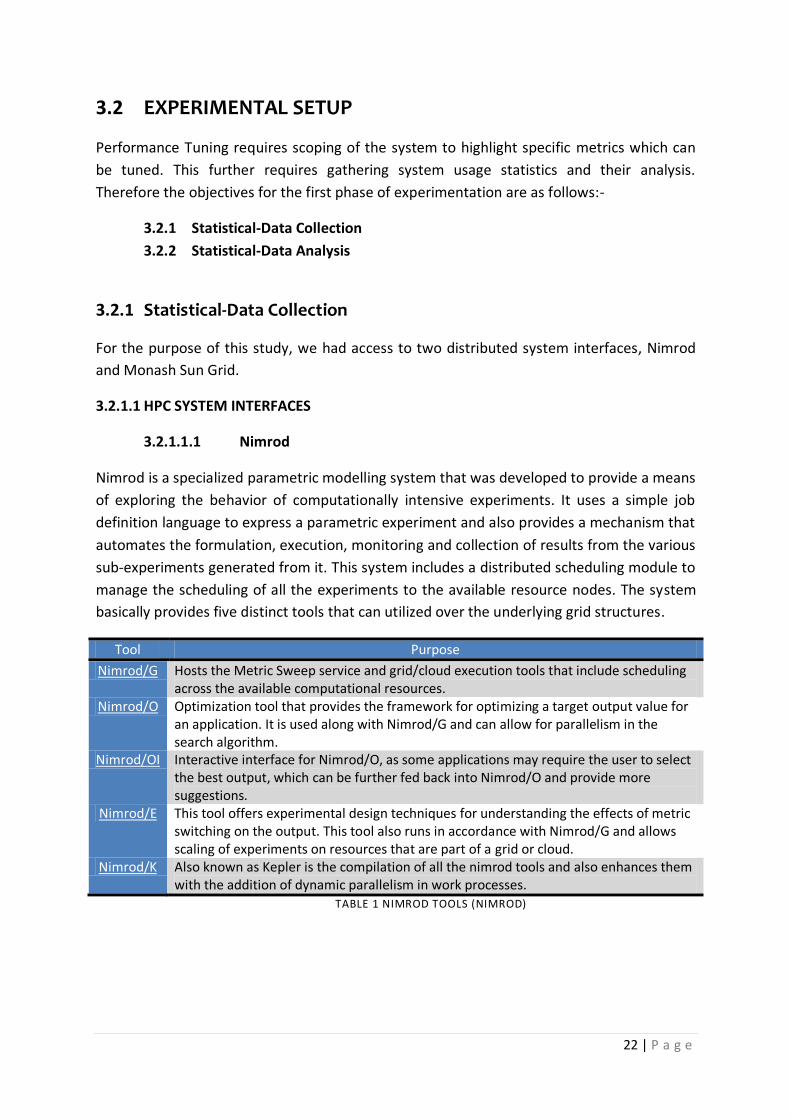
Nimrod is a specialized parametric modelling system that was developed to provide a means
of exploring the behavior of computationally intensive experiments. It uses a simple job
definition language to express a parametric experiment and also provides a mechanism that
automates the formulation, execution, monitoring and collection of results from the various
sub-experiments generated from it. This system includes a distributed scheduling module to
manage the scheduling of all the experiments to the available resource nodes. The system
basically provides five distinct tools that can utilized over the underlying grid structures.
Tool Purpose
Nimrod/G Hosts the Metric Sweep service and grid/cloud execution tools that include scheduling across the available computational resources.
Nimrod/O Optimization tool that provides the framework for optimizing a target output value for an application. It is used along with Nimrod/G and can allow for parallelism in the search algorithm.
Nimrod/OI Interactive interface for Nimrod/O, as some applications may require the user to select the best output, which can be further fed back into Nimrod/O and provide more suggestions.
Nimrod/E This tool offers experimental design techniques for understanding the effects of metric switching on the output. This tool also runs in accordance with Nimrod/G and allows scaling of experiments on resources that are part of a grid or cloud.
Nimrod/K Also known as Kepler is the compilation of all the nimrod tools and also enhances them with the addition of dynamic parallelism in work processes.
TABLE 1 NIMROD TOOLS (NIMROD)

23 | P a g e
3.2.1.1.1.1 Access Methods
Nimrod can be accessed through two basic modes. Users can log in to the Nimrod portal at
https://messagelab.monash.edu.au/NimrodMeRC/. Alternatively, Nimrod can also be
accessed by using ‘ssh’ or any other shell login utility like ‘Putty’ and connecting to
nimrod.messagelab.monash.edu.au .
3.2.1.1.1.2 Job Characteristics
Nimrod/G works on the basis of experiment describing plan files which are written using a
simple declarative language. The plan files consist of two sections. The metrics involved in
the experiment are defined in the first section, while the tasks required to complete the
execution of one instance of the job are defined in the second section.
3.2.1.1.1.2.1 Parameters
This is basically the list of values that can be constant or dynamic. Their scope and
type can be defined in the following format:
parameter <name> <type> [<domain>]
Name defines the identity of the parameter and should be unique for each
parameter. Nimrod creates environment variables for each defined parameter and uses it
during the execution of the job.
Type describes the attribute of the parameter. There are basically four self-
describing types that are allowed, namely Float, Integer, Text and Files.
Domain defines the range of values that the variable can have during the execution
of experiment. The domain can be a single value, range of values, a random value, multiple
random selections from a list known as selectanyof, or a single random selection from a
given list known as selectoneof.
The above information about Nimrod High Performance System has been taken from
https://messagelab.monash.edu.au/NimrodG (Nimrod)
24 | P a g e
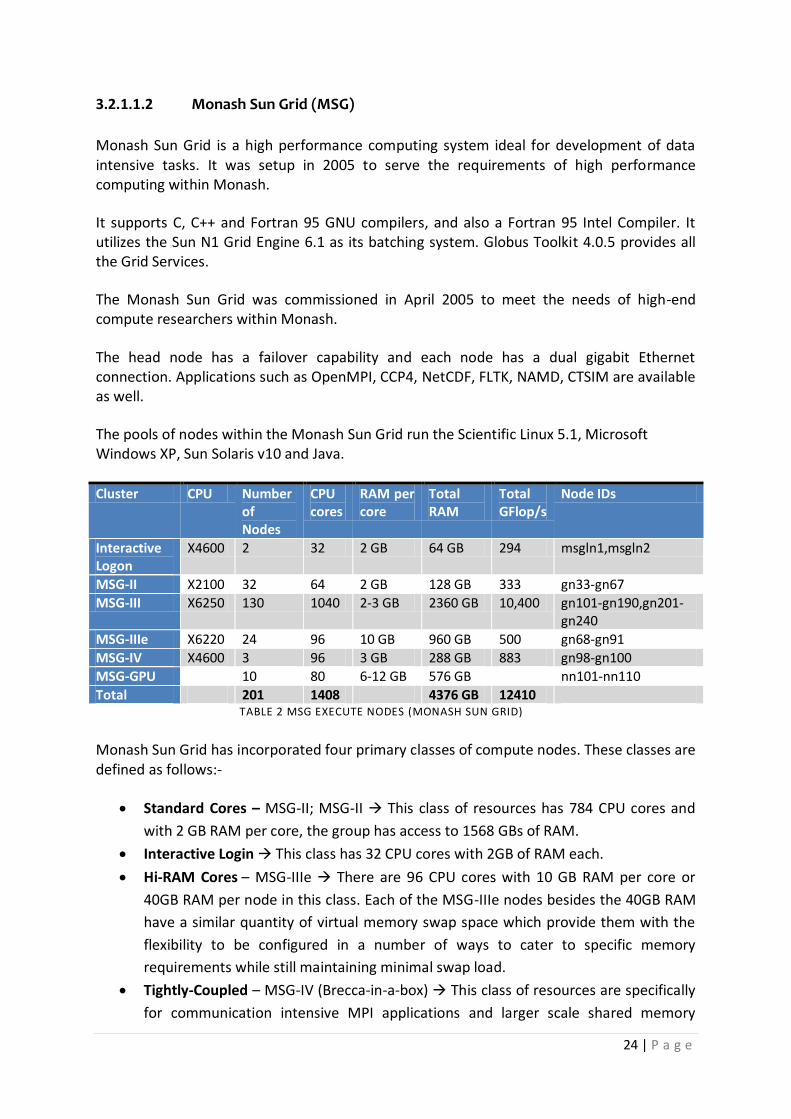
3.2.1.1.2 Monash Sun Grid (MSG)
Monash Sun Grid is a high performance computing system ideal for development of data intensive tasks. It was setup in 2005 to serve the requirements of high performance computing within Monash.
It supports C, C++ and Fortran 95 GNU compilers, and also a Fortran 95 Intel Compiler. It utilizes the Sun N1 Grid Engine 6.1 as its batching system. Globus Toolkit 4.0.5 provides all the Grid Services.
The Monash Sun Grid was commissioned in April 2005 to meet the needs of high-end compute researchers within Monash.
The head node has a failover capability and each node has a dual gigabit Ethernet connection. Applications such as OpenMPI, CCP4, NetCDF, FLTK, NAMD, CTSIM are available as well.
The pools of nodes within the Monash Sun Grid run the Scientific Linux 5.1, Microsoft Windows XP, Sun Solaris v10 and Java.
Cluster CPU Number of Nodes
CPU cores
RAM per core
Total RAM
Total GFlop/s
Node IDs
Interactive Logon
X4600 2 32 2 GB 64 GB 294 msgln1,msgln2
MSG-II X2100 32 64 2 GB 128 GB 333 gn33-gn67
MSG-III X6250 130 1040 2-3 GB 2360 GB 10,400 gn101-gn190,gn201-gn240
MSG-IIIe X6220 24 96 10 GB 960 GB 500 gn68-gn91
MSG-IV X4600 3 96 3 GB 288 GB 883 gn98-gn100
MSG-GPU 10 80 6-12 GB 576 GB nn101-nn110
Total 201 1408 4376 GB 12410 TABLE 2 MSG EXECUTE NODES (MONASH SUN GRID)
Monash Sun Grid has incorporated four primary classes of compute nodes. These classes are defined as follows:-
Standard Cores – MSG-II; MSG-II This class of resources has 784 CPU cores and
with 2 GB RAM per core, the group has access to 1568 GBs of RAM.
Interactive Login This class has 32 CPU cores with 2GB of RAM each.
Hi-RAM Cores – MSG-IIIe There are 96 CPU cores with 10 GB RAM per core or
40GB RAM per node in this class. Each of the MSG-IIIe nodes besides the 40GB RAM
have a similar quantity of virtual memory swap space which provide them with the
flexibility to be configured in a number of ways to cater to specific memory
requirements while still maintaining minimal swap load.
Tightly-Coupled – MSG-IV (Brecca-in-a-box) This class of resources are specifically
for communication intensive MPI applications and larger scale shared memory

25 | P a g e
applications that require up to 32 processes. The group includes 96 CPU cores with 3
GB RAM per core, making it a whopping 96 GB RAM per node. The nodes are
supplied with high-bandwidth hyper-transport and Infiniband CPU/Memory
interconnects. The 32 CPU cores within each Sun X4600 chassis, inter-communicate
with the RAM via AMD hyper-transport bus SMP architecture and the Infiniband
interconnecting between the three nodes.
MSG was also enforced with GPU (Graphics Processing Unit) processing capabilities with the
help of five nVidia Tesla S1070 quad-GPU arrays. Addition of CPU cores was further required
to support this GPU processing. Therefore, this allocation provides a total of 4800 GPU ALU
(Algorithmic Logic Units) that yield double precision 2Tflop/sec and single precision
20Tflop/sec besides the additional computing capacity of 5Gflop/sec per watt for suitable
applications that can adapt to parallel processing on the GPU architecture.
The above information about Monash Sun Grid has been taken from
http://www.monash.edu.au/eresearch/services/mcg/msg.html (Monash Sun Grid)
3.2.1.1.2.1 Access Methods
The Monash Sun Grid provides access to two nodes for submission of jobs. Users can
log in to the Grid portal at msgln1.its.monash.edu.au or msgln2.its.monash.edu.au
using ‘ssh’ or any other shell login utilities like ‘Putty’. Since the Grid runs on Globus
Toolkit, users can use the Globus Client tools to connect and execute jobs on
Monash Sun Grid.
The jobs can be in the form of shell scripts, MPI programs, Gaussian Job Scripts,
NAMD program and other supported GNU Compiler source files as well. Since the
Monash Sun Grid supports Globus Toolkit as well, it can very well accept Globus jobs
as well. (Monash Sun Grid Usage Guide)
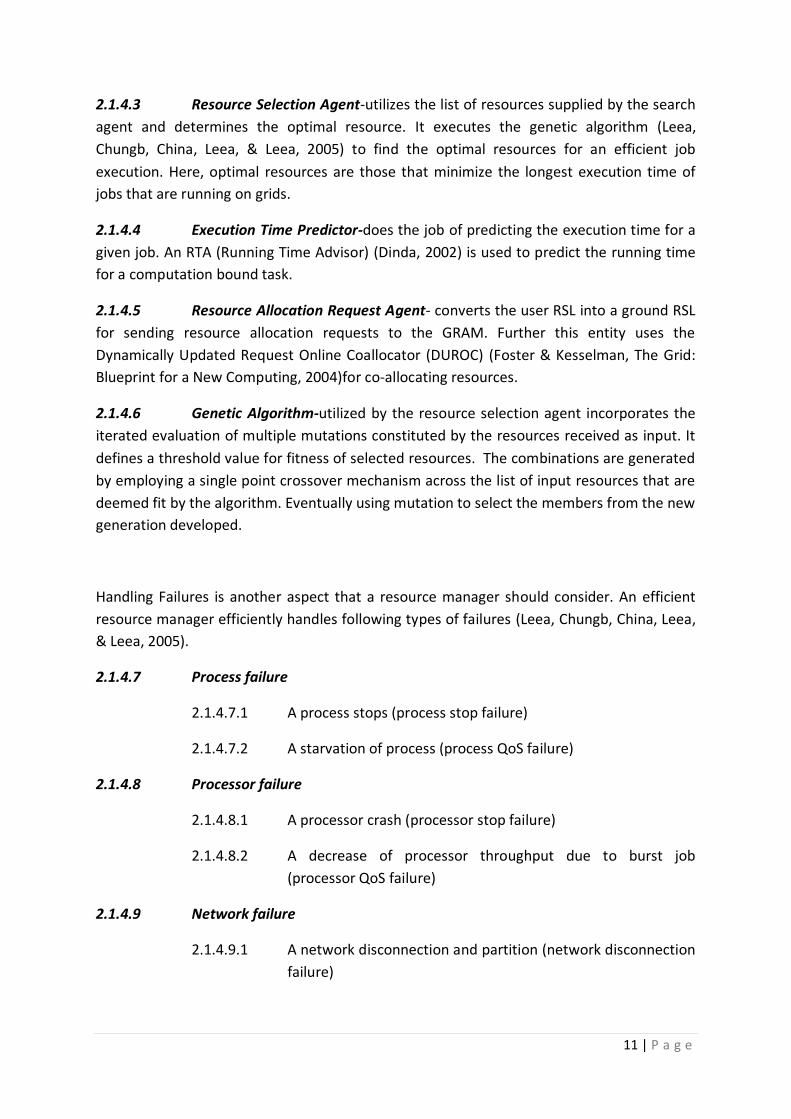
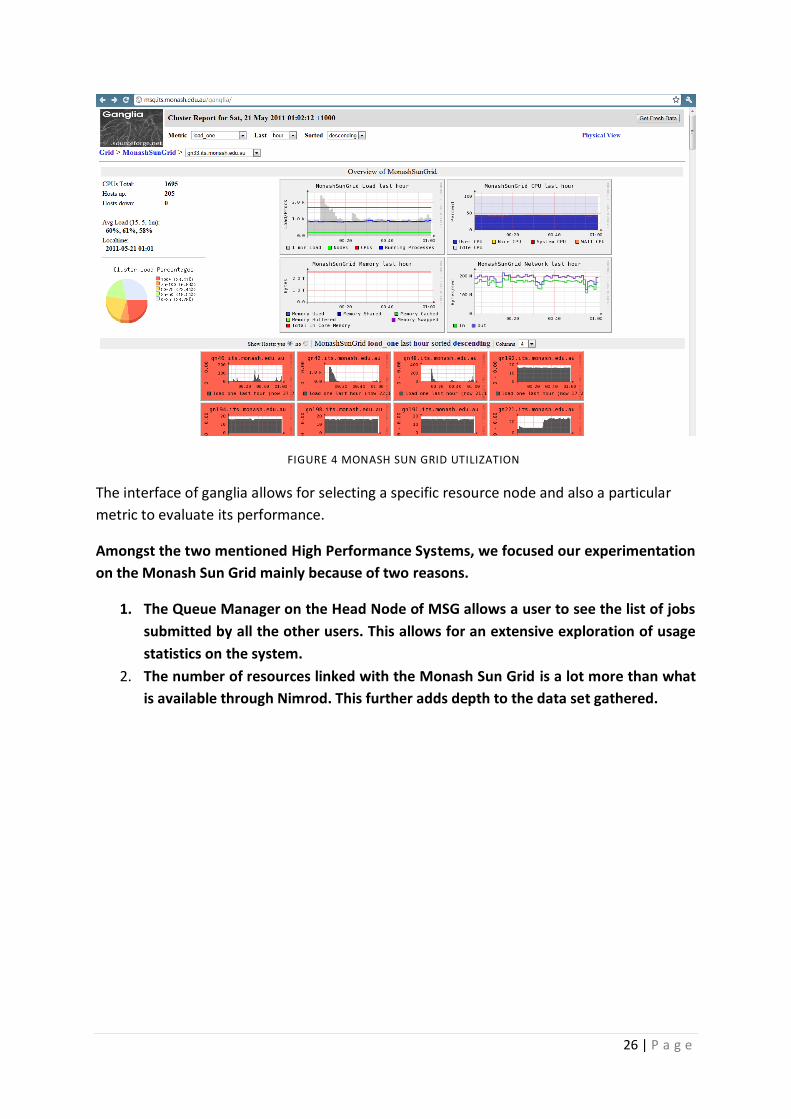
3.2.1.1.2.2 Resource Usage
The Monash Sun Grid Utilization can be monitored with the help of Ganglia
monitoring system installed there in. this monitoring system can be accessed at
http://msg.its.monash.edu.au/ganglia/ (Monash Sun Grid Resource Utilization).
Ganglia System enables a user to not only analyse system utilization but provides
node utilization as well.
26 | P a g e
FIGURE 4 MONASH SUN GRID UTILIZATION
The interface of ganglia allows for selecting a specific resource node and also a particular
metric to evaluate its performance.
Amongst the two mentioned High Performance Systems, we focused our experimentation
on the Monash Sun Grid mainly because of two reasons.
1. The Queue Manager on the Head Node of MSG allows a user to see the list of jobs
submitted by all the other users. This allows for an extensive exploration of usage
statistics on the system.
2. The number of resources linked with the Monash Sun Grid is a lot more than what
is available through Nimrod. This further adds depth to the data set gathered.
27 | P a g e
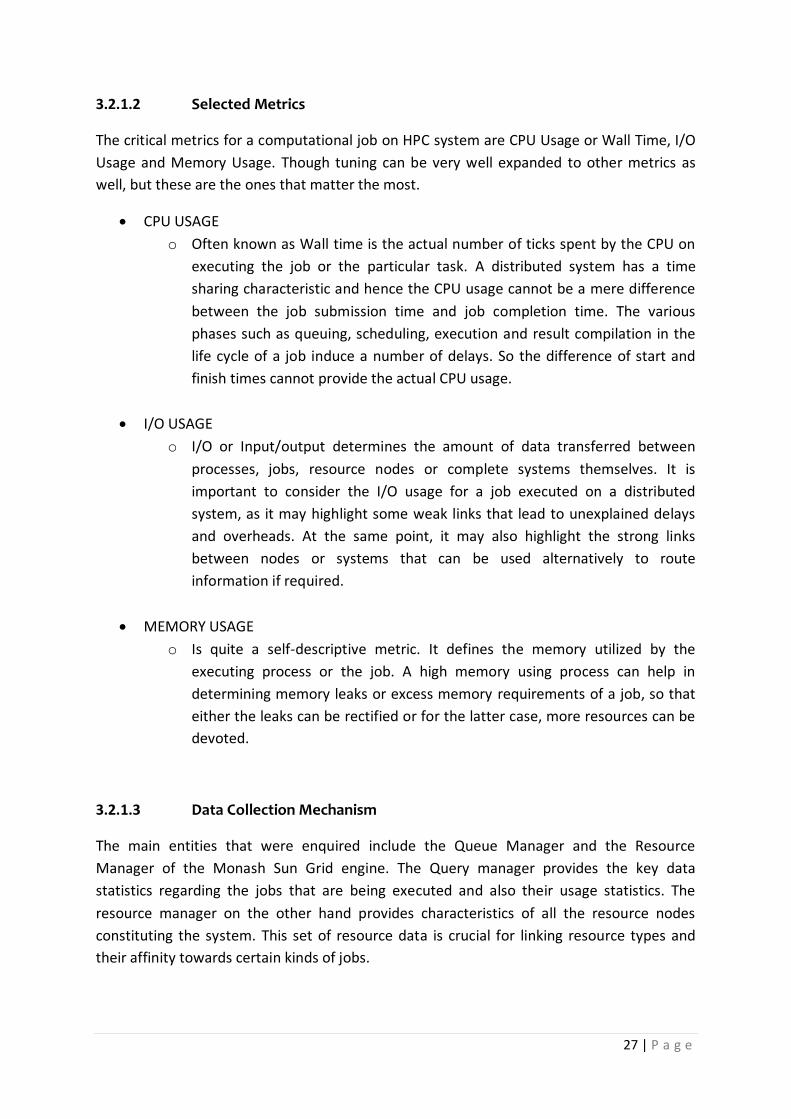
3.2.1.2 Selected Metrics
The critical metrics for a computational job on HPC system are CPU Usage or Wall Time, I/O
Usage and Memory Usage. Though tuning can be very well expanded to other metrics as
well, but these are the ones that matter the most.
CPU USAGE
o Often known as Wall time is the actual number of ticks spent by the CPU on
executing the job or the particular task. A distributed system has a time
sharing characteristic and hence the CPU usage cannot be a mere difference
between the job submission time and job completion time. The various
phases such as queuing, scheduling, execution and result compilation in the
life cycle of a job induce a number of delays. So the difference of start and
finish times cannot provide the actual CPU usage.
I/O USAGE
o I/O or Input/output determines the amount of data transferred between
processes, jobs, resource nodes or complete systems themselves. It is
important to consider the I/O usage for a job executed on a distributed
system, as it may highlight some weak links that lead to unexplained delays
and overheads. At the same point, it may also highlight the strong links
between nodes or systems that can be used alternatively to route
information if required.
MEMORY USAGE
o Is quite a self-descriptive metric. It defines the memory utilized by the
executing process or the job. A high memory using process can help in
determining memory leaks or excess memory requirements of a job, so that
either the leaks can be rectified or for the latter case, more resources can be
devoted.
3.2.1.3 Data Collection Mechanism
The main entities that were enquired include the Queue Manager and the Resource
Manager of the Monash Sun Grid engine. The Query manager provides the key data
statistics regarding the jobs that are being executed and also their usage statistics. The
resource manager on the other hand provides characteristics of all the resource nodes
constituting the system. This set of resource data is crucial for linking resource types and
their affinity towards certain kinds of jobs.

28 | P a g e
We have therefore defined a group of scripts to gather the required statistics. These scripts
run on the head node of the Monash Sun Grid and simulate a system monitor to gather
information. The scripts perform the following tasks.
3.2.1.3.1 Constant Monitoring
i. This script starts of by recording the resource allocations along with
available information.
ii. It then recursively calls the subsequent scripts which handle the task
of gathering job statistics.
SCRIPT
#echo "START" > MasterJobID.txt
#echo "START" > JobUsage.txt
echo "START"
while true;
do
Qstat | grep "gn" > Test.file
cut -d\ -f1 Test.file > TempJobList.txt
./AutoFilter.sh TempJobList.txt
./CompileJobUsage.sh
done
3.2.1.3.2 Job Statistics Collection
i. This script records the Job Name, Job Script and the Usage definition
for all jobs in respective files.
SCRIPT
cat $1 | while read line;
do
chkFlag=`cat MasterJobID.txt | grep $line | wc -l;`
if [ $chkFlag == "0" ];
then
qstat -j $line | grep "cpu" > tempJobState.txt
chkFlag=`cat tempJobState.txt | grep "N/A" | wc -l;`
if [ $chkFlag == "0" ];
then
echo "Adding Job : " $line
echo `Qstat | grep "$line"` >> JobResource.txt
echo $line >> MasterJobID.txt
fi
fi
29 | P a g e
echo `qstat -j $line | grep "job_name"` > "$line"_Name
echo `qstat -j $line | grep "script_file"` > "$line"_Script
echo `qstat -j $line | grep "cpu"` > "$line"_Usage
done
3.2.1.3.3 Job Statistics Compiler
i. In case the Constant Monitoring script detects that a job has finished
execution and is no longer active, this script is executed to record the last
available job information into a common <output-file> and deletes the
temporary files created by the collection script.
SCRIPT
cat MasterJobID.txt | while read jobid;
do
if [ $jobid != "START" ];
then
active=`Qstat | grep $jobid | wc -l`
if [ $active == "0" ];
then
chkFlag=`cat JobUsage.txt | grep $jobid | wc -l;`
if [ $chkFlag == "0" ];
then
jn=`cat "$jobid"_Name | grep "job_name"`
js=`cat "$jobid"_Script | grep "script_file"`
ju=`cat "$jobid"_Usage | grep "cpu"`
jr=`cat JobResource.txt | grep $jobid`
echo $jobid $ju $jn $jr $js >> JobUsage.txt
echo "Completed Job : " $jobid
rm "$jobid"_Usage
rm "$jobid"_Name
rm "$jobid"_Script
fi
fi
fi
done
30 | P a g e
This mechanism assures that the total job usage is compiled rather than job usage at any
particular time.
3.2.2 Statistical-Data Analysis
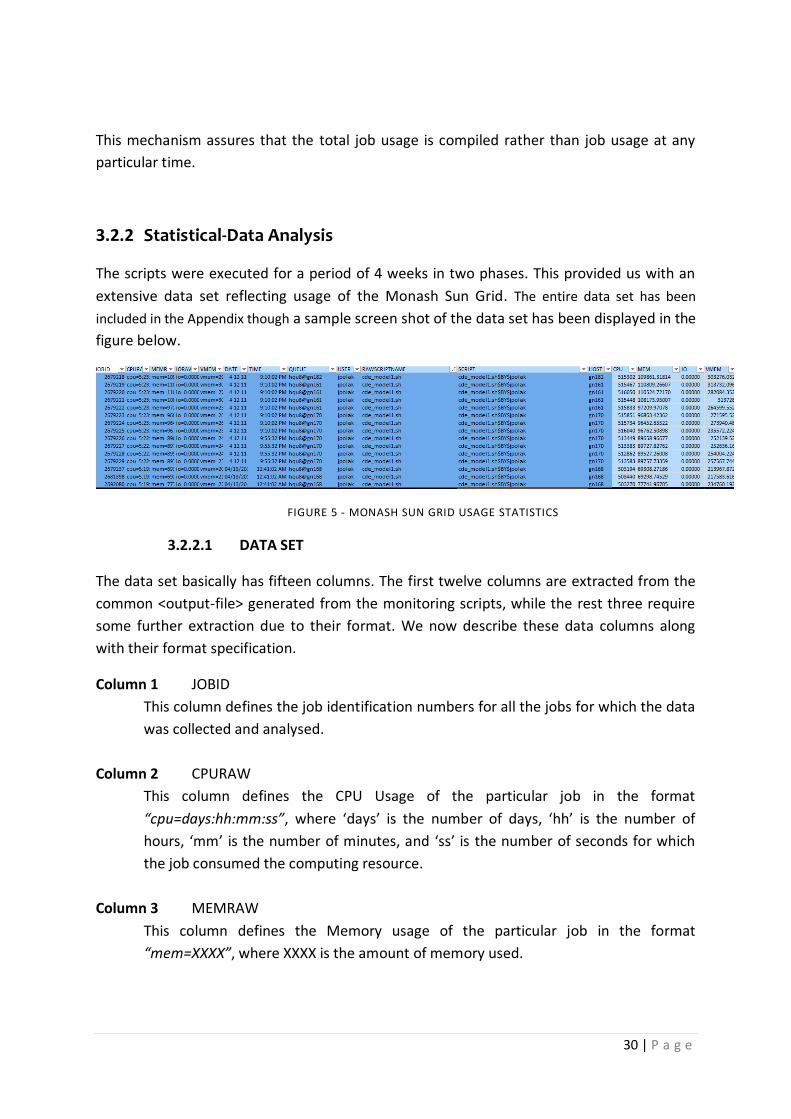
The scripts were executed for a period of 4 weeks in two phases. This provided us with an
extensive data set reflecting usage of the Monash Sun Grid. The entire data set has been
included in the Appendix though a sample screen shot of the data set has been displayed in the
figure below.
FIGURE 5 - MONASH SUN GRID USAGE STATISTICS
3.2.2.1 DATA SET
The data set basically has fifteen columns. The first twelve columns are extracted from the
common <output-file> generated from the monitoring scripts, while the rest three require
some further extraction due to their format. We now describe these data columns along
with their format specification.
Column 1 JOBID
This column defines the job identification numbers for all the jobs for which the data
was collected and analysed.
Column 2 CPURAW
This column defines the CPU Usage of the particular job in the format
“cpu=days:hh:mm:ss”, where ‘days’ is the number of days, ‘hh’ is the number of
hours, ‘mm’ is the number of minutes, and ‘ss’ is the number of seconds for which
the job consumed the computing resource.
Column 3 MEMRAW
This column defines the Memory usage of the particular job in the format
“mem=XXXX”, where XXXX is the amount of memory used.
31 | P a g e
Column 4 IORAW
This column defines the Input/Output reads of the particular job in the format
“io=XXXX”, where XXXX is the amount of data reads.
Column 5 VMEMRAW
This column defines the Virtual Memory usage of the particular job in the format
“vmem=XXXX”, where XXXX is the amount of memory used.
Column 6 DATE
This column defines the Date on which the particular job was submitted.
Column 7 TIME
This column defines the Date on which the particular job was submitted.
Column 8 QUEUE
This column defines the Grid Node on which the particular job was executed.
Column 9 USER
This column defines the User who submitted that particular job.
Column 10 RAWSCRIPTNAME
This column defines the script name that constitutes the execution files for that
particular job.
Column 11 SCRIPT
At times, different users may submit jobs with the same script name. Therefore this
column is used to identify distinct job scripts. It has the format “<script
name>$BY$<user>”.
Column 12 HOST
This column defines the name of the node on which the job was executed. This is
extracted from QUEUE column which also has Queue names appended to it.
Column 13 CPU
This column filters out the RAWCPU to reflect the CPU USAGE in units of seconds
only.
Column 14 MEM
This column extracts the MEMORY USAGE from the RAWMEM column without the
keyword “mem” included.
32 | P a g e
Column 15 IO
This column extracts the IO USAGE from the RAWIO column without the keyword
“io” included.
Column 16 VMEM
This column extracts the VIRTUAL MEMORY USAGE from the RAWVMEM column
without the keyword “vmem” included.
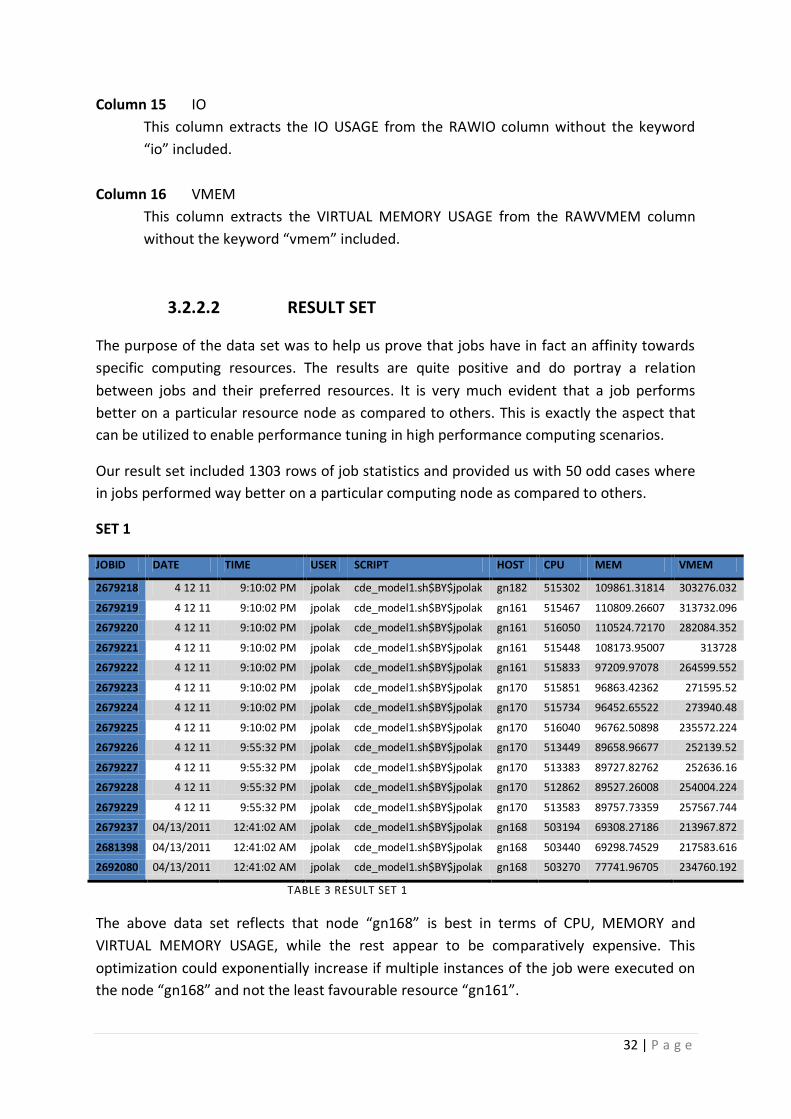
3.2.2.2 RESULT SET
The purpose of the data set was to help us prove that jobs have in fact an affinity towards
specific computing resources. The results are quite positive and do portray a relation
between jobs and their preferred resources. It is very much evident that a job performs
better on a particular resource node as compared to others. This is exactly the aspect that
can be utilized to enable performance tuning in high performance computing scenarios.
Our result set included 1303 rows of job statistics and provided us with 50 odd cases where
in jobs performed way better on a particular computing node as compared to others.
SET 1
JOBID DATE TIME USER SCRIPT HOST CPU MEM VMEM
2679218 4 12 11 9:10:02 PM jpolak cde_model1.sh$BY$jpolak gn182 515302 109861.31814 303276.032
2679219 4 12 11 9:10:02 PM jpolak cde_model1.sh$BY$jpolak gn161 515467 110809.26607 313732.096
2679220 4 12 11 9:10:02 PM jpolak cde_model1.sh$BY$jpolak gn161 516050 110524.72170 282084.352
2679221 4 12 11 9:10:02 PM jpolak cde_model1.sh$BY$jpolak gn161 515448 108173.95007 313728
2679222 4 12 11 9:10:02 PM jpolak cde_model1.sh$BY$jpolak gn161 515833 97209.97078 264599.552
2679223 4 12 11 9:10:02 PM jpolak cde_model1.sh$BY$jpolak gn170 515851 96863.42362 271595.52
2679224 4 12 11 9:10:02 PM jpolak cde_model1.sh$BY$jpolak gn170 515734 96452.65522 273940.48
2679225 4 12 11 9:10:02 PM jpolak cde_model1.sh$BY$jpolak gn170 516040 96762.50898 235572.224
2679226 4 12 11 9:55:32 PM jpolak cde_model1.sh$BY$jpolak gn170 513449 89658.96677 252139.52
2679227 4 12 11 9:55:32 PM jpolak cde_model1.sh$BY$jpolak gn170 513383 89727.82762 252636.16
2679228 4 12 11 9:55:32 PM jpolak cde_model1.sh$BY$jpolak gn170 512862 89527.26008 254004.224
2679229 4 12 11 9:55:32 PM jpolak cde_model1.sh$BY$jpolak gn170 513583 89757.73359 257567.744
2679237 04/13/2011 12:41:02 AM jpolak cde_model1.sh$BY$jpolak gn168 503194 69308.27186 213967.872
2681398 04/13/2011 12:41:02 AM jpolak cde_model1.sh$BY$jpolak gn168 503440 69298.74529 217583.616
2692080 04/13/2011 12:41:02 AM jpolak cde_model1.sh$BY$jpolak gn168 503270 77741.96705 234760.192
TABLE 3 RESULT SET 1
The above data set reflects that node “gn168” is best in terms of CPU, MEMORY and
VIRTUAL MEMORY USAGE, while the rest appear to be comparatively expensive. This
optimization could exponentially increase if multiple instances of the job were executed on
the node “gn168” and not the least favourable resource “gn161”.
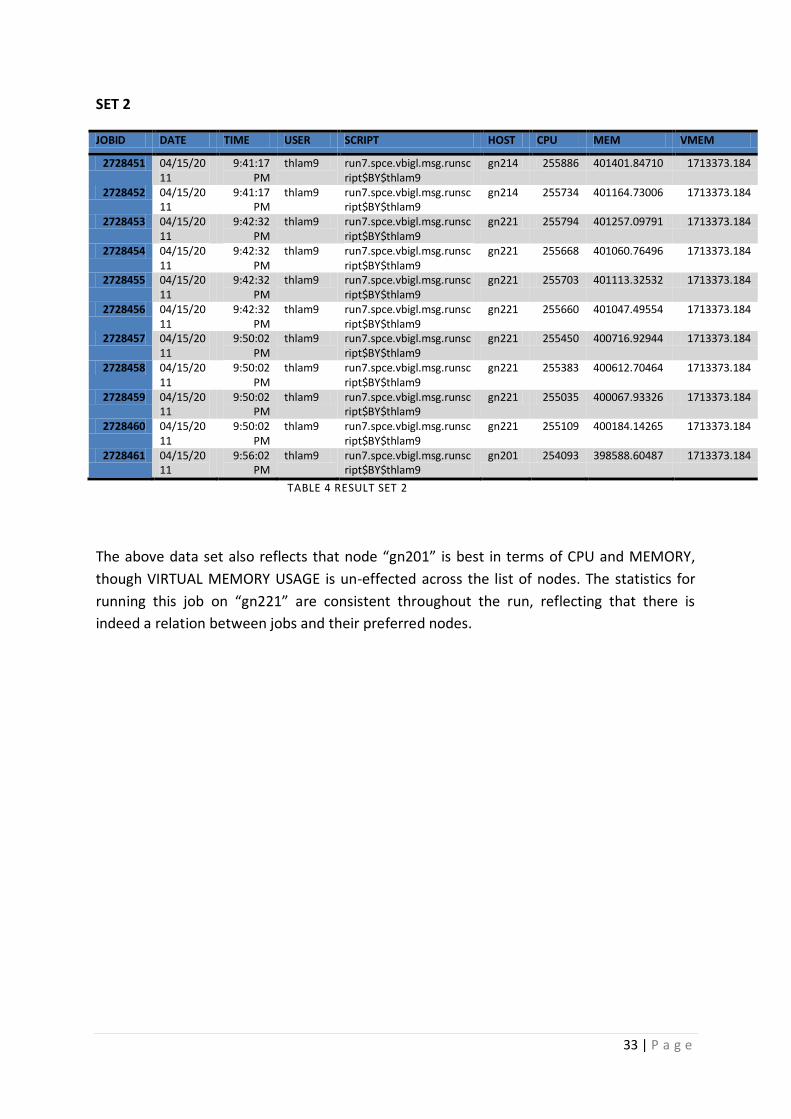
33 | P a g e
SET 2
JOBID DATE TIME USER SCRIPT HOST CPU MEM VMEM
2728451 04/15/2011
9:41:17 PM
thlam9 run7.spce.vbigl.msg.runscript$BY$thlam9
gn214 255886 401401.84710 1713373.184
2728452 04/15/2011
9:41:17 PM
thlam9 run7.spce.vbigl.msg.runscript$BY$thlam9
gn214 255734 401164.73006 1713373.184
2728453 04/15/2011
9:42:32 PM
thlam9 run7.spce.vbigl.msg.runscript$BY$thlam9
gn221 255794 401257.09791 1713373.184
2728454 04/15/2011
9:42:32 PM
thlam9 run7.spce.vbigl.msg.runscript$BY$thlam9
gn221 255668 401060.76496 1713373.184
2728455 04/15/2011
9:42:32 PM
thlam9 run7.spce.vbigl.msg.runscript$BY$thlam9
gn221 255703 401113.32532 1713373.184
2728456 04/15/2011
9:42:32 PM
thlam9 run7.spce.vbigl.msg.runscript$BY$thlam9
gn221 255660 401047.49554 1713373.184
2728457 04/15/2011
9:50:02 PM
thlam9 run7.spce.vbigl.msg.runscript$BY$thlam9
gn221 255450 400716.92944 1713373.184
2728458 04/15/2011
9:50:02 PM
thlam9 run7.spce.vbigl.msg.runscript$BY$thlam9
gn221 255383 400612.70464 1713373.184
2728459 04/15/2011
9:50:02 PM
thlam9 run7.spce.vbigl.msg.runscript$BY$thlam9
gn221 255035 400067.93326 1713373.184
2728460 04/15/2011
9:50:02 PM
thlam9 run7.spce.vbigl.msg.runscript$BY$thlam9
gn221 255109 400184.14265 1713373.184
2728461 04/15/2011
9:56:02 PM
thlam9 run7.spce.vbigl.msg.runscript$BY$thlam9
gn201 254093 398588.60487 1713373.184
TABLE 4 RESULT SET 2
The above data set also reflects that node “gn201” is best in terms of CPU and MEMORY,
though VIRTUAL MEMORY USAGE is un-effected across the list of nodes. The statistics for
running this job on “gn221” are consistent throughout the run, reflecting that there is
indeed a relation between jobs and their preferred nodes.
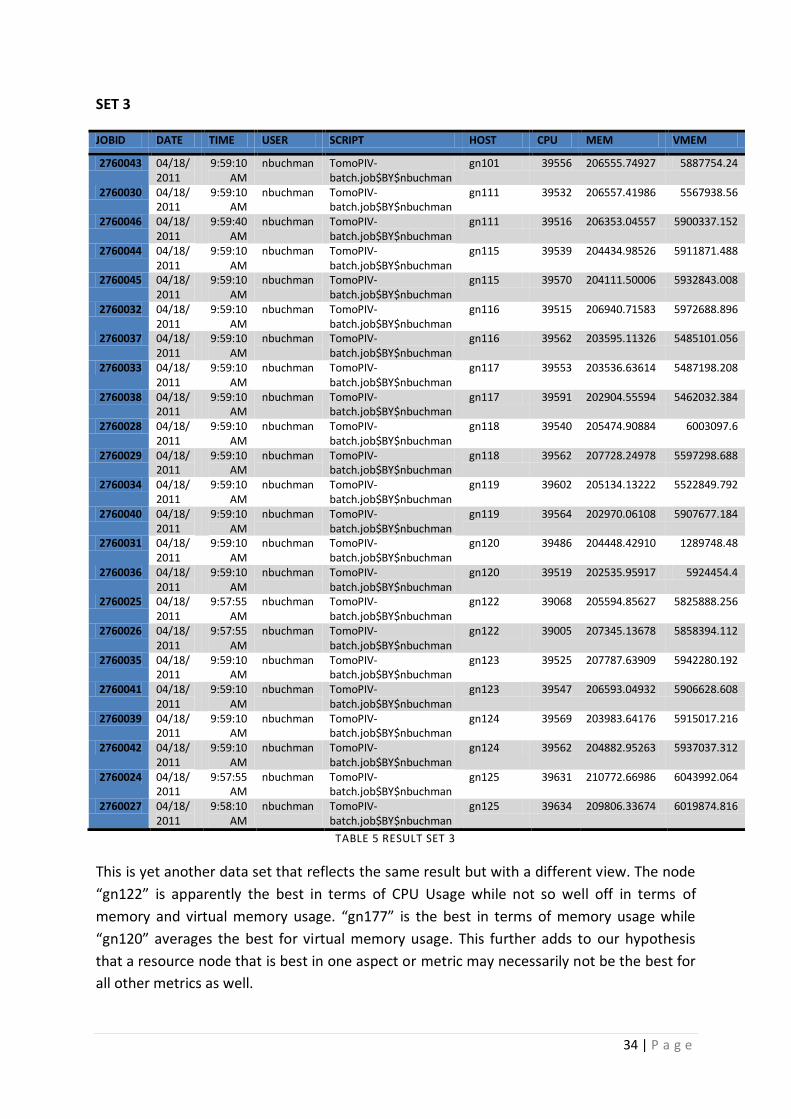
34 | P a g e
SET 3
JOBID DATE TIME USER SCRIPT HOST CPU MEM VMEM
2760043 04/18/2011
9:59:10 AM
nbuchman TomoPIV-batch.job$BY$nbuchman
gn101 39556 206555.74927 5887754.24
2760030 04/18/2011
9:59:10 AM
nbuchman TomoPIV-batch.job$BY$nbuchman
gn111 39532 206557.41986 5567938.56
2760046 04/18/2011
9:59:40 AM
nbuchman TomoPIV-batch.job$BY$nbuchman
gn111 39516 206353.04557 5900337.152
2760044 04/18/2011
9:59:10 AM
nbuchman TomoPIV-batch.job$BY$nbuchman
gn115 39539 204434.98526 5911871.488
2760045 04/18/2011
9:59:10 AM
nbuchman TomoPIV-batch.job$BY$nbuchman
gn115 39570 204111.50006 5932843.008
2760032 04/18/2011
9:59:10 AM
nbuchman TomoPIV-batch.job$BY$nbuchman
gn116 39515 206940.71583 5972688.896
2760037 04/18/2011
9:59:10 AM
nbuchman TomoPIV-batch.job$BY$nbuchman
gn116 39562 203595.11326 5485101.056
2760033 04/18/2011
9:59:10 AM
nbuchman TomoPIV-batch.job$BY$nbuchman
gn117 39553 203536.63614 5487198.208
2760038 04/18/2011
9:59:10 AM
nbuchman TomoPIV-batch.job$BY$nbuchman
gn117 39591 202904.55594 5462032.384
2760028 04/18/2011
9:59:10 AM
nbuchman TomoPIV-batch.job$BY$nbuchman
gn118 39540 205474.90884 6003097.6
2760029 04/18/2011
9:59:10 AM
nbuchman TomoPIV-batch.job$BY$nbuchman
gn118 39562 207728.24978 5597298.688
2760034 04/18/2011
9:59:10 AM
nbuchman TomoPIV-batch.job$BY$nbuchman
gn119 39602 205134.13222 5522849.792
2760040 04/18/2011
9:59:10 AM
nbuchman TomoPIV-batch.job$BY$nbuchman
gn119 39564 202970.06108 5907677.184
2760031 04/18/2011
9:59:10 AM
nbuchman TomoPIV-batch.job$BY$nbuchman
gn120 39486 204448.42910 1289748.48
2760036 04/18/2011
9:59:10 AM
nbuchman TomoPIV-batch.job$BY$nbuchman
gn120 39519 202535.95917 5924454.4
2760025 04/18/2011
9:57:55 AM
nbuchman TomoPIV-batch.job$BY$nbuchman
gn122 39068 205594.85627 5825888.256
2760026 04/18/2011
9:57:55 AM
nbuchman TomoPIV-batch.job$BY$nbuchman
gn122 39005 207345.13678 5858394.112
2760035 04/18/2011
9:59:10 AM
nbuchman TomoPIV-batch.job$BY$nbuchman
gn123 39525 207787.63909 5942280.192
2760041 04/18/2011
9:59:10 AM
nbuchman TomoPIV-batch.job$BY$nbuchman
gn123 39547 206593.04932 5906628.608
2760039 04/18/2011
9:59:10 AM
nbuchman TomoPIV-batch.job$BY$nbuchman
gn124 39569 203983.64176 5915017.216
2760042 04/18/2011
9:59:10 AM
nbuchman TomoPIV-batch.job$BY$nbuchman
gn124 39562 204882.95263 5937037.312
2760024 04/18/2011
9:57:55 AM
nbuchman TomoPIV-batch.job$BY$nbuchman
gn125 39631 210772.66986 6043992.064
2760027 04/18/2011
9:58:10 AM
nbuchman TomoPIV-batch.job$BY$nbuchman
gn125 39634 209806.33674 6019874.816
TABLE 5 RESULT SET 3
This is yet another data set that reflects the same result but with a different view. The node
“gn122” is apparently the best in terms of CPU Usage while not so well off in terms of
memory and virtual memory usage. “gn177” is the best in terms of memory usage while
“gn120” averages the best for virtual memory usage. This further adds to our hypothesis
that a resource node that is best in one aspect or metric may necessarily not be the best for
all other metrics as well.
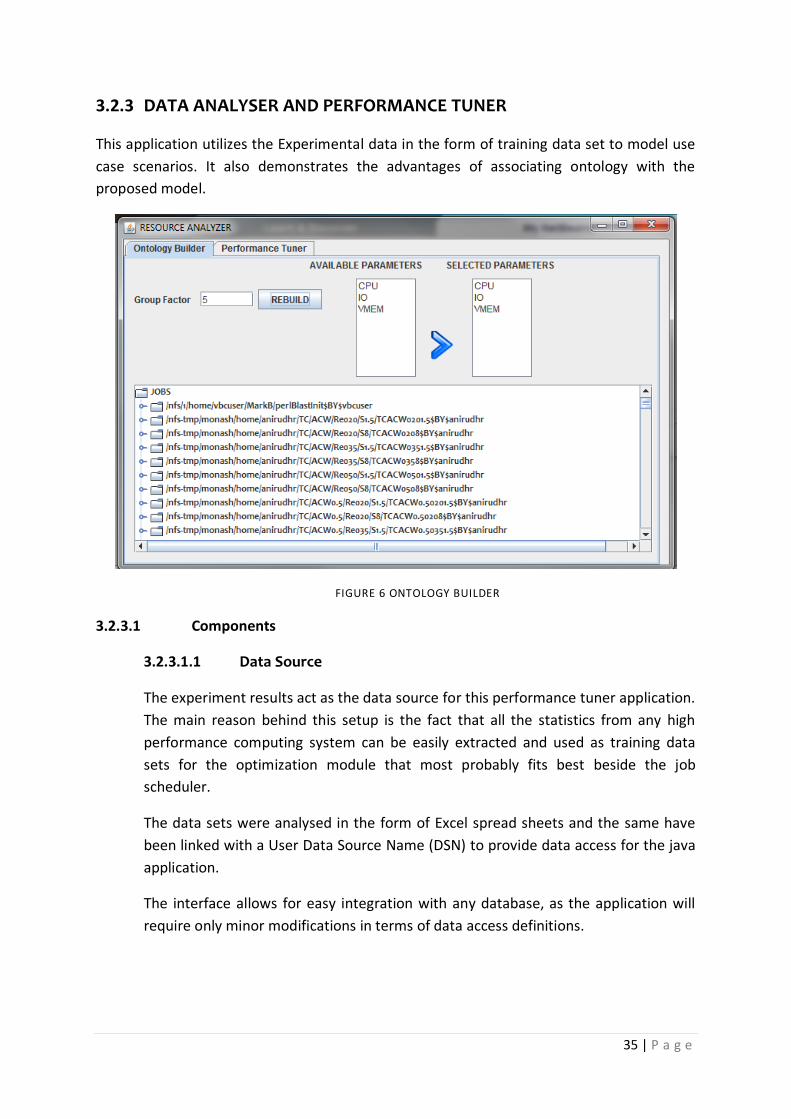
35 | P a g e
3.2.3 DATA ANALYSER AND PERFORMANCE TUNER
This application utilizes the Experimental data in the form of training data set to model use
case scenarios. It also demonstrates the advantages of associating ontology with the
proposed model.
FIGURE 6 ONTOLOGY BUILDER
3.2.3.1 Components
3.2.3.1.1 Data Source
The experiment results act as the data source for this performance tuner application.
The main reason behind this setup is the fact that all the statistics from any high
performance computing system can be easily extracted and used as training data
sets for the optimization module that most probably fits best beside the job
scheduler.
The data sets were analysed in the form of Excel spread sheets and the same have
been linked with a User Data Source Name (DSN) to provide data access for the java
application.
The interface allows for easy integration with any database, as the application will
require only minor modifications in terms of data access definitions.

36 | P a g e
The schema for this database is quite simple with only one table.
RESULTS (JOBID, CPURAW, MEMRAW, IORAW, VMEMRAW, DATE, TIME,
QUEUE, USER, SCRIPT, HOST, CPU, MEM, IO, VMEM)
3.2.3.1.2 Ontology Builder
The objective of this module is to organize the data set in a form of an ontology that
can be utilized by the Scenario Builder to select resources. The module requires two
primary inputs.
GROUP FACTOR
This integer type value defines the number of quality levels that the
resources should be divided into. These quality levels are linked with a
metric of judgement i.e. CPU USAGE, MEMORY USAGE, I/O and
VIRTUAL MEMORY USAGE and not just the resource itself. So a
resource can be at Quality Level 1 for CPU USAGE indicating that it is
most favourable for that particular job, and can also be at Quality
Level 5 for MEMORY USAGE indicating that it is the least favourable
for that job.
PROCESS FLOW
Due to the limited scope of this thesis, we have considered each job
as a different job group.
The sorting and grouping of the data set is done through the following
process.
1. Select a Job Group.
2. Get all the resources on which this job set has been executed.
3. For each selected metric:
i. Define the most favourable value – LEAST VALUE
The most favourable value for a metric such as CPU
usage will be the least of the lot.
ii. Define the least favourable value – MAXIMUM VALUE
The least favourable value for a metric such as
Memory usage will be the maximum of the lot.
iii. Divide the range of available values that is the difference
between the MAXIMUM VALUE obtained in step ii and
the LEAST VALUE obtained in step I, with the grouping
factor. This gives us the slot width.
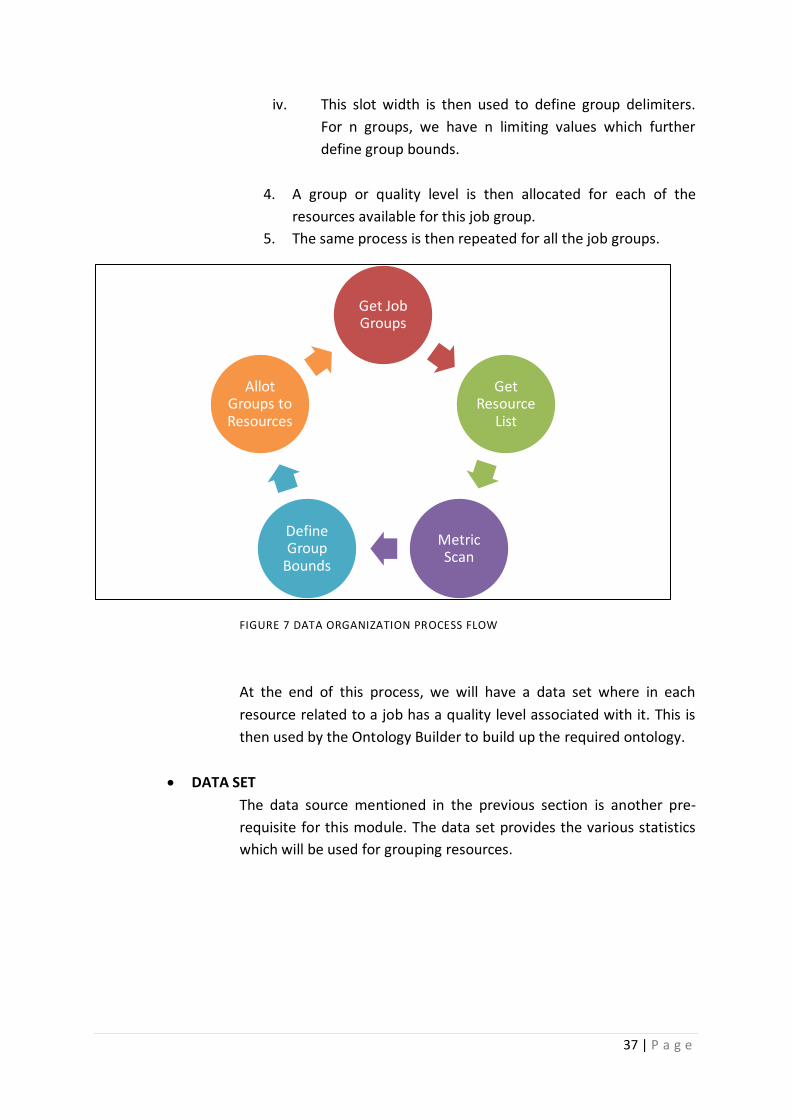
37 | P a g e
iv. This slot width is then used to define group delimiters.
For n groups, we have n limiting values which further
define group bounds.
4. A group or quality level is then allocated for each of the
resources available for this job group.
5. The same process is then repeated for all the job groups.
FIGURE 7 DATA ORGANIZATION PROCESS FLOW
At the end of this process, we will have a data set where in each
resource related to a job has a quality level associated with it. This is
then used by the Ontology Builder to build up the required ontology.
DATA SET
The data source mentioned in the previous section is another pre-
requisite for this module. The data set provides the various statistics
which will be used for grouping resources.
Get Job Groups
Get Resource
List
Metric Scan
Define Group
Bounds
Allot Groups to Resources

38 | P a g e
PROCESS FLOW
The organized data set is then scanned through the job sets to build
up a Job first tree of the data set. The Job groups form the head node,
followed by selected metrics. The metrics are then descended by the
important quality levels which further connect with the resources at
the bottom of the tree. The process for building up is therefore as
follows.
1. Start with a root node : JOB GROUPS
2. For Each Job Group
i. Add Job Group node to root.
ii. For Each Metric : Add Metric node to Job Group Node
A. For Each Quality Level defined for this metric under this job
group : Add Quality Level Node to Metric Node
a. For Each Resource under this Quality Level : Add
Resource Node to Quality Level
3. Repeat until end of data set
The end of this process provides us with a Job First model of the experimental data that can
be easily queried to request for the most suitable resource for a particular job with the help
of a depth first search on the required job group.
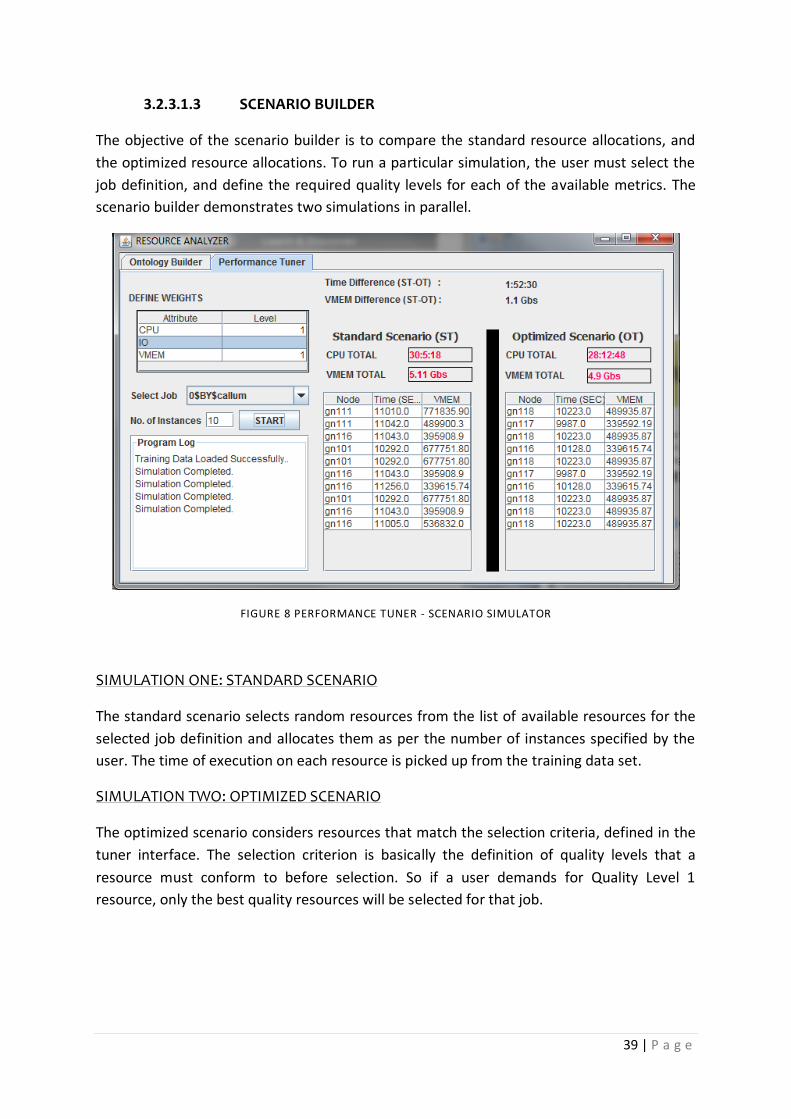
39 | P a g e
3.2.3.1.3 SCENARIO BUILDER
The objective of the scenario builder is to compare the standard resource allocations, and
the optimized resource allocations. To run a particular simulation, the user must select the
job definition, and define the required quality levels for each of the available metrics. The
scenario builder demonstrates two simulations in parallel.
FIGURE 8 PERFORMANCE TUNER - SCENARIO SIMULATOR
SIMULATION ONE: STANDARD SCENARIO
The standard scenario selects random resources from the list of available resources for the
selected job definition and allocates them as per the number of instances specified by the
user. The time of execution on each resource is picked up from the training data set.
SIMULATION TWO: OPTIMIZED SCENARIO
The optimized scenario considers resources that match the selection criteria, defined in the
tuner interface. The selection criterion is basically the definition of quality levels that a
resource must conform to before selection. So if a user demands for Quality Level 1
resource, only the best quality resources will be selected for that job.
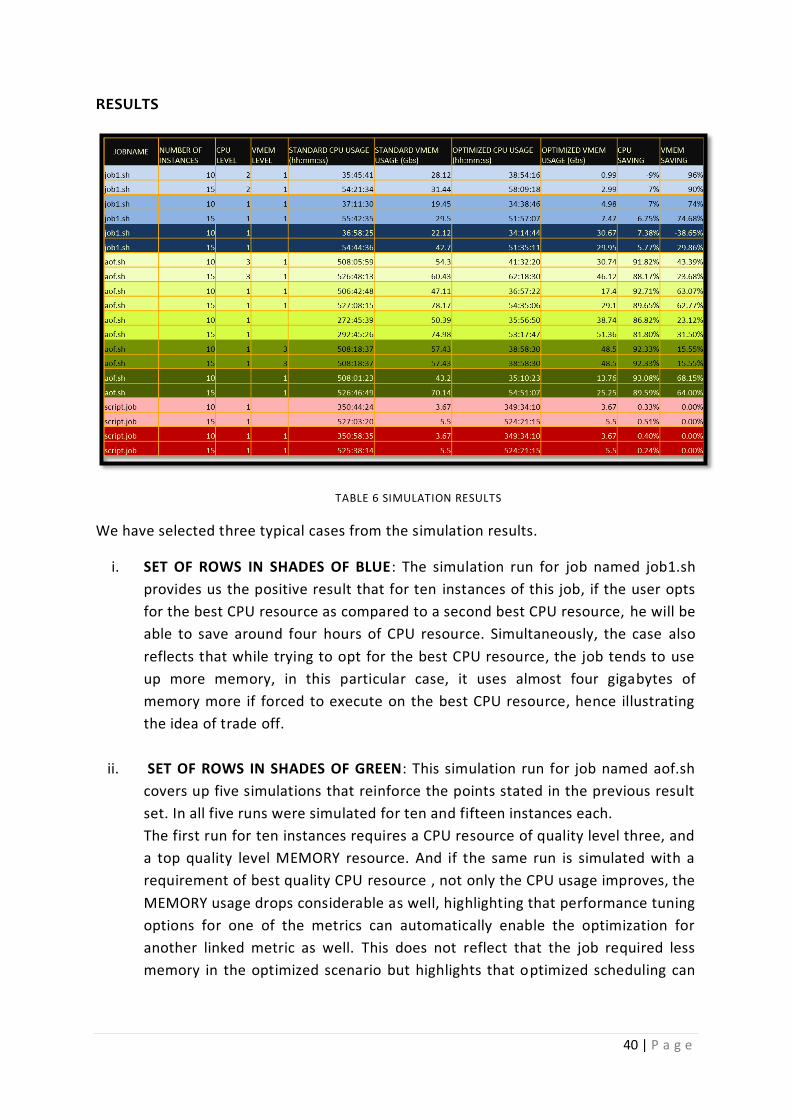
40 | P a g e
RESULTS
TABLE 6 SIMULATION RESULTS
We have selected three typical cases from the simulation results.
i. SET OF ROWS IN SHADES OF BLUE: The simulation run for job named job1.sh
provides us the positive result that for ten instances of this job, if the user opts
for the best CPU resource as compared to a second best CPU resource, he will be
able to save around four hours of CPU resource. Simultaneously, the case also
reflects that while trying to opt for the best CPU resource, the job tends to use
up more memory, in this particular case, it uses almost four gigabytes of
memory more if forced to execute on the best CPU resource, hence illustrating
the idea of trade off.
ii. SET OF ROWS IN SHADES OF GREEN: This simulation run for job named aof.sh
covers up five simulations that reinforce the points stated in the previous result
set. In all five runs were simulated for ten and fifteen instances each.
The first run for ten instances requires a CPU resource of quality level three, and
a top quality level MEMORY resource. And if the same run is simulated with a
requirement of best quality CPU resource , not only the CPU usage improves, the
MEMORY usage drops considerable as well, highlighting that performance tuning
options for one of the metrics can automatically enable the optimization for
another linked metric as well. This does not reflect that the job required less
memory in the optimized scenario but highlights that optimized scheduling can

41 | P a g e
impact the overall memory demands for a more ideal set of jobs running on a
given node.
And there are two possibilities for such a case. Consider CPU requirement to be
a major requirement, and the remaining or other linked metrics to be minor
requirement (MEMORY in this case).
POSSIBILITY 1. The major requirement (CPU) is optimized
but the minor requirements are increased, reflecting that
the selected resource though is helpful in optimizing the
major requirement but only at an increased cost of minor
requirement (MEMORY).
POSSIBILITY 2. The major requirement (CPU) is optimized
and the minor requirement is also optimized to the best,
reflecting that the chosen resource is the most optimized
resource for this particular job.
Therefore, if quality requirements are waived off from one of these metrics, the
remaining metric achieves maximum optimization, but the metric that has been
left out, takes a bad hit. So performance tuning options can not only help in
achieving optimized resource utilization, but can also help the meta schedulers
realize the minimum resource requirements for a particular job and make
necessary allocations. Such simulation results can very well supplement scenario
evaluations for considering metrics such as yield and stretch discussed earlier in
chapter two.
iii. SET OF ROWS IN SHADES OF RED: This simulation run for job named ‘script.job’
covers up two sets of simulations that highlight one of the drawbacks of this
system. At times, the system may encounter jobs or job groups which do not
have any optimizations available, and for such cases, the optimization scenario
will not be much different from the standard scenario, thereby rendering the
processing efforts useless.
JOB CLASSIFICATION
The following result sets provide an overview of the optimizations that can be achieved with
a generic class of jobs and not merely for instances of the same job. It should be noted that
suitable classification of jobs into practical categories is beyond the scope of this thesis, and
the results below have been provided to reflect the validity of the hypothesis. The
categories chosen below are only for illustration purposes and do not imply in practice.
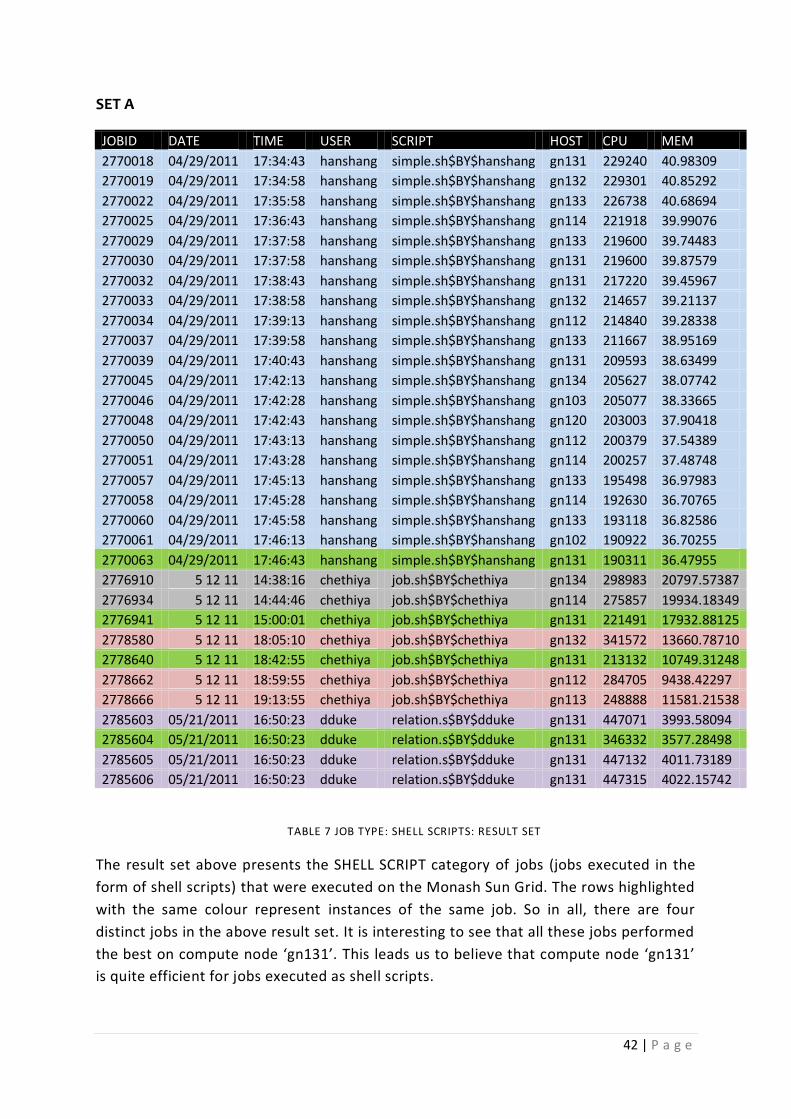
42 | P a g e
SET A
JOBID DATE TIME USER SCRIPT HOST CPU MEM
2770018 04/29/2011 17:34:43 hanshang simple.sh$BY$hanshang gn131 229240 40.98309
2770019 04/29/2011 17:34:58 hanshang simple.sh$BY$hanshang gn132 229301 40.85292
2770022 04/29/2011 17:35:58 hanshang simple.sh$BY$hanshang gn133 226738 40.68694
2770025 04/29/2011 17:36:43 hanshang simple.sh$BY$hanshang gn114 221918 39.99076
2770029 04/29/2011 17:37:58 hanshang simple.sh$BY$hanshang gn133 219600 39.74483
2770030 04/29/2011 17:37:58 hanshang simple.sh$BY$hanshang gn131 219600 39.87579
2770032 04/29/2011 17:38:43 hanshang simple.sh$BY$hanshang gn131 217220 39.45967
2770033 04/29/2011 17:38:58 hanshang simple.sh$BY$hanshang gn132 214657 39.21137
2770034 04/29/2011 17:39:13 hanshang simple.sh$BY$hanshang gn112 214840 39.28338
2770037 04/29/2011 17:39:58 hanshang simple.sh$BY$hanshang gn133 211667 38.95169
2770039 04/29/2011 17:40:43 hanshang simple.sh$BY$hanshang gn131 209593 38.63499
2770045 04/29/2011 17:42:13 hanshang simple.sh$BY$hanshang gn134 205627 38.07742
2770046 04/29/2011 17:42:28 hanshang simple.sh$BY$hanshang gn103 205077 38.33665
2770048 04/29/2011 17:42:43 hanshang simple.sh$BY$hanshang gn120 203003 37.90418
2770050 04/29/2011 17:43:13 hanshang simple.sh$BY$hanshang gn112 200379 37.54389
2770051 04/29/2011 17:43:28 hanshang simple.sh$BY$hanshang gn114 200257 37.48748
2770057 04/29/2011 17:45:13 hanshang simple.sh$BY$hanshang gn133 195498 36.97983
2770058 04/29/2011 17:45:28 hanshang simple.sh$BY$hanshang gn114 192630 36.70765
2770060 04/29/2011 17:45:58 hanshang simple.sh$BY$hanshang gn133 193118 36.82586
2770061 04/29/2011 17:46:13 hanshang simple.sh$BY$hanshang gn102 190922 36.70255
2770063 04/29/2011 17:46:43 hanshang simple.sh$BY$hanshang gn131 190311 36.47955
2776910 5 12 11 14:38:16 chethiya job.sh$BY$chethiya gn134 298983 20797.57387
2776934 5 12 11 14:44:46 chethiya job.sh$BY$chethiya gn114 275857 19934.18349
2776941 5 12 11 15:00:01 chethiya job.sh$BY$chethiya gn131 221491 17932.88125
2778580 5 12 11 18:05:10 chethiya job.sh$BY$chethiya gn132 341572 13660.78710
2778640 5 12 11 18:42:55 chethiya job.sh$BY$chethiya gn131 213132 10749.31248
2778662 5 12 11 18:59:55 chethiya job.sh$BY$chethiya gn112 284705 9438.42297
2778666 5 12 11 19:13:55 chethiya job.sh$BY$chethiya gn113 248888 11581.21538
2785603 05/21/2011 16:50:23 dduke relation.s$BY$dduke gn131 447071 3993.58094
2785604 05/21/2011 16:50:23 dduke relation.s$BY$dduke gn131 346332 3577.28498
2785605 05/21/2011 16:50:23 dduke relation.s$BY$dduke gn131 447132 4011.73189
2785606 05/21/2011 16:50:23 dduke relation.s$BY$dduke gn131 447315 4022.15742
TABLE 7 JOB TYPE: SHELL SCRIPTS: RESULT SET
The result set above presents the SHELL SCRIPT category of jobs (jobs executed in the
form of shell scripts) that were executed on the Monash Sun Grid. The rows highlighted
with the same colour represent instances of the same job. So in all, there are four
distinct jobs in the above result set. It is interesting to see that all these jobs performed
the best on compute node ‘gn131’. This leads us to believe that compute node ‘gn131’
is quite efficient for jobs executed as shell scripts.
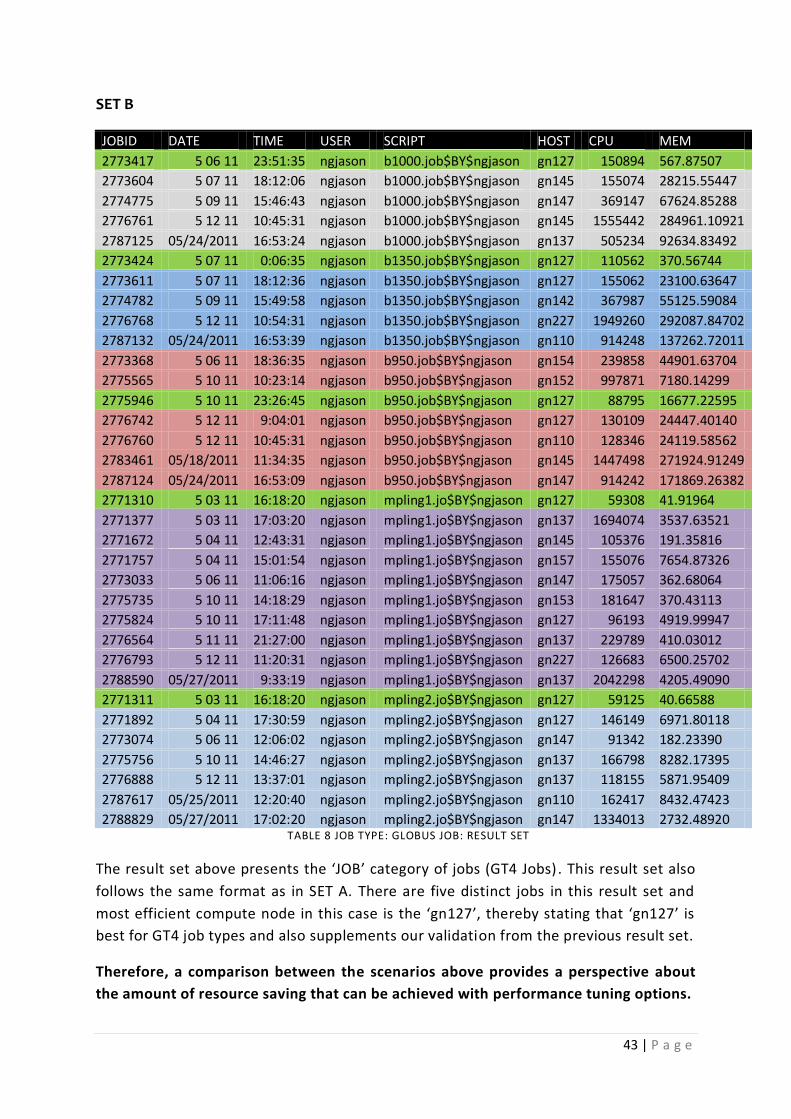
43 | P a g e
SET B
JOBID DATE TIME USER SCRIPT HOST CPU MEM
2773417 5 06 11 23:51:35 ngjason b1000.job$BY$ngjason gn127 150894 567.87507
2773604 5 07 11 18:12:06 ngjason b1000.job$BY$ngjason gn145 155074 28215.55447
2774775 5 09 11 15:46:43 ngjason b1000.job$BY$ngjason gn147 369147 67624.85288
2776761 5 12 11 10:45:31 ngjason b1000.job$BY$ngjason gn145 1555442 284961.10921
2787125 05/24/2011 16:53:24 ngjason b1000.job$BY$ngjason gn137 505234 92634.83492
2773424 5 07 11 0:06:35 ngjason b1350.job$BY$ngjason gn127 110562 370.56744
2773611 5 07 11 18:12:36 ngjason b1350.job$BY$ngjason gn127 155062 23100.63647
2774782 5 09 11 15:49:58 ngjason b1350.job$BY$ngjason gn142 367987 55125.59084
2776768 5 12 11 10:54:31 ngjason b1350.job$BY$ngjason gn227 1949260 292087.84702
2787132 05/24/2011 16:53:39 ngjason b1350.job$BY$ngjason gn110 914248 137262.72011
2773368 5 06 11 18:36:35 ngjason b950.job$BY$ngjason gn154 239858 44901.63704
2775565 5 10 11 10:23:14 ngjason b950.job$BY$ngjason gn152 997871 7180.14299
2775946 5 10 11 23:26:45 ngjason b950.job$BY$ngjason gn127 88795 16677.22595
2776742 5 12 11 9:04:01 ngjason b950.job$BY$ngjason gn127 130109 24447.40140
2776760 5 12 11 10:45:31 ngjason b950.job$BY$ngjason gn110 128346 24119.58562
2783461 05/18/2011 11:34:35 ngjason b950.job$BY$ngjason gn145 1447498 271924.91249
2787124 05/24/2011 16:53:09 ngjason b950.job$BY$ngjason gn147 914242 171869.26382
2771310 5 03 11 16:18:20 ngjason mpling1.jo$BY$ngjason gn127 59308 41.91964
2771377 5 03 11 17:03:20 ngjason mpling1.jo$BY$ngjason gn137 1694074 3537.63521
2771672 5 04 11 12:43:31 ngjason mpling1.jo$BY$ngjason gn145 105376 191.35816
2771757 5 04 11 15:01:54 ngjason mpling1.jo$BY$ngjason gn157 155076 7654.87326
2773033 5 06 11 11:06:16 ngjason mpling1.jo$BY$ngjason gn147 175057 362.68064
2775735 5 10 11 14:18:29 ngjason mpling1.jo$BY$ngjason gn153 181647 370.43113
2775824 5 10 11 17:11:48 ngjason mpling1.jo$BY$ngjason gn127 96193 4919.99947
2776564 5 11 11 21:27:00 ngjason mpling1.jo$BY$ngjason gn137 229789 410.03012
2776793 5 12 11 11:20:31 ngjason mpling1.jo$BY$ngjason gn227 126683 6500.25702
2788590 05/27/2011 9:33:19 ngjason mpling1.jo$BY$ngjason gn137 2042298 4205.49090
2771311 5 03 11 16:18:20 ngjason mpling2.jo$BY$ngjason gn127 59125 40.66588
2771892 5 04 11 17:30:59 ngjason mpling2.jo$BY$ngjason gn127 146149 6971.80118
2773074 5 06 11 12:06:02 ngjason mpling2.jo$BY$ngjason gn147 91342 182.23390
2775756 5 10 11 14:46:27 ngjason mpling2.jo$BY$ngjason gn137 166798 8282.17395
2776888 5 12 11 13:37:01 ngjason mpling2.jo$BY$ngjason gn137 118155 5871.95409
2787617 05/25/2011 12:20:40 ngjason mpling2.jo$BY$ngjason gn110 162417 8432.47423
2788829 05/27/2011 17:02:20 ngjason mpling2.jo$BY$ngjason gn147 1334013 2732.48920 TABLE 8 JOB TYPE: GLOBUS JOB: RESULT SET
The result set above presents the ‘JOB’ category of jobs (GT4 Jobs) . This result set also
follows the same format as in SET A. There are five distinct jobs in this result set and
most efficient compute node in this case is the ‘gn127’, thereby stating that ‘gn127’ is
best for GT4 job types and also supplements our validation from the previous result set.
Therefore, a comparison between the scenarios above provides a perspective about
the amount of resource saving that can be achieved with performance tuning options.
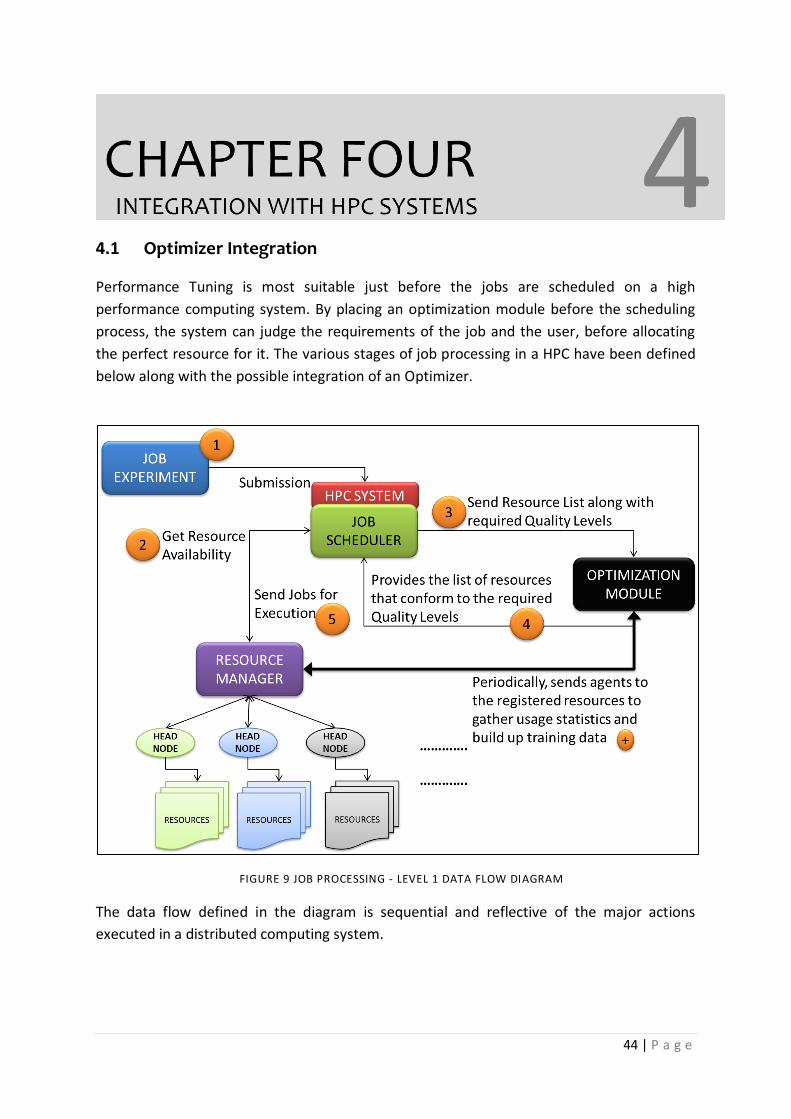
44 | P a g e
4.1 Optimizer Integration
Performance Tuning is most suitable just before the jobs are scheduled on a high
performance computing system. By placing an optimization module before the scheduling
process, the system can judge the requirements of the job and the user, before allocating
the perfect resource for it. The various stages of job processing in a HPC have been defined
below along with the possible integration of an Optimizer.
FIGURE 9 JOB PROCESSING - LEVEL 1 DATA FLOW DIAGRAM
The data flow defined in the diagram is sequential and reflective of the major actions
executed in a distributed computing system.

45 | P a g e
1) The users submit the jobs to desired HPC through an appropriate interface.
a) After receiving the job, the underlying security mechanism verifies the
authenticity of the user and the associated resource certificates.
2) The job after a genuine validation reaches the job scheduler. The job scheduler then
queries the resource manager for a status update on the required resources. The
required resources are mostly determined by the user, as a user has access to only a
specific number and type of resources.
3) In a standard scenario, once the scheduler has the updated status of the required
resources, it starts allocating those resources to the job immediately. Whereas in an
optimized scenario, this availability list will be passed on to the optimization module
along with the required quality level as defined in the previous section.
4) The optimization module then replies back with a list of resources sorted on the
basis of quality levels, so as to make sure that the allocation of jobs happens only
across the resources that are at par with the user’s requirement.
5) The job scheduler then resumes with its responsibilities of resource allocation with
the optimized selection of resources.
Considering the existing scenario of Nimrod, the placement of the optimization module
would be best suited beside the Job Scheduler. This is necessary because the role of the
optimization module is critical prominently before the jobs are actually sent to resource
queues. Another requirement for the optimization module is the training data, which
basically assist the optimizer to make decisions regarding the quality level of resources. The
optimization module requires periodic updates from the Globus actuator to maintain its
training data. The Globus actuator generally handles the responsibility of maintaining job
states across the distributed resources and also initiating additional tasks to support the
process. The Globus actuator of nimrod has an additional responsibility of running a Prepare
task that collects information about the resource node. This includes various usage statistics
such as CPU usage, IO usage, MEMORY usage, number of jobs executed along with job
details, and much more. All this information is exactly the requirement of building up the
training data required by the optimizer module.
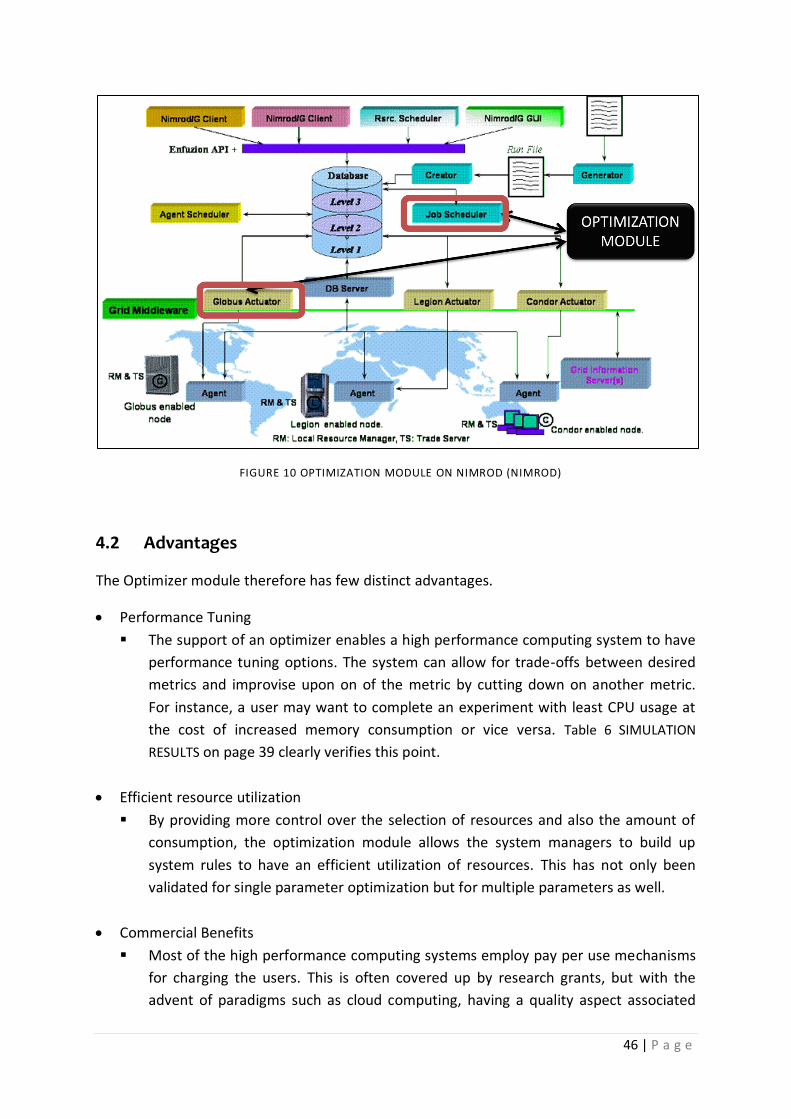
46 | P a g e
FIGURE 10 OPTIMIZATION MODULE ON NIMROD (NIMROD)
4.2 Advantages
The Optimizer module therefore has few distinct advantages.
Performance Tuning
The support of an optimizer enables a high performance computing system to have
performance tuning options. The system can allow for trade-offs between desired
metrics and improvise upon on of the metric by cutting down on another metric.
For instance, a user may want to complete an experiment with least CPU usage at
the cost of increased memory consumption or vice versa. Table 6 SIMULATION
RESULTS on page 39 clearly verifies this point.
Efficient resource utilization
By providing more control over the selection of resources and also the amount of
consumption, the optimization module allows the system managers to build up
system rules to have an efficient utilization of resources. This has not only been
validated for single parameter optimization but for multiple parameters as well.
Commercial Benefits
Most of the high performance computing systems employ pay per use mechanisms
for charging the users. This is often covered up by research grants, but with the
advent of paradigms such as cloud computing, having a quality aspect associated
47 | P a g e
with usage will provide additional leverage while charging customers. Consumption
of high quality resources will have higher usage rates as compared to lower quality
resources. This will not only provide commercial benefits for the resource owners,
but also act as an incentive for them keep their resources maintained at higher
quality levels, thereby providing them with the ability to have assured service and
quality agreements.
4.3 Drawbacks
The system even though is quite promising on optimizing resource utilization and also
efficient job execution, has a couple of drawbacks or better described as overheads.
Processing Overheads
Since the optimizer will build up system ontologies to query for resources with
acceptable quality levels, the process will have some processing overheads. This
processing might induce some delays but considering the amount of saving the
module indicates, this overhead will be very much worth the efforts.
Training Data Maintenance
The training data forms a critical component of the optimizer and requires constant
maintenance. It needs to be updated quite regularly so as to keep the optimizer up
to date with the requirements of the entire computing system. Every job that is
executed on a resource has the capacity to bring about some opportunities for
performance tuning on that particular resource and this is the key idea behind
tapping the computing power intelligently.

48 | P a g e
5.1 Research Summary & Contributions
High Performance Computing environments are highly dynamic with resources having
varied availability constraints and jobs having varied complexities. This is primarily due to
dependence on a number of distributed components that include networking, data access
mechanisms, job scheduling procedures, and resource managers, though not all of these
components can provide leverage for optimizing system usage. We focused on the resource
allocation functionality which forms the key responsibility of a job scheduler. Fundamentally
standard procedures of resource allocation are not only inefficient but also incorporate
decent amount of wastage which otherwise could be preserved. From the comprehensive
experimentation on resource utilization that was carried out for this thesis, we can establish
a key relation between jobs and their corresponding resources. Therefore, this thesis
uncovers an aspect of high performance computing systems that can be exploited for
efficient resource utilization and enabling performance tuning options in a high
performance computing system.
In this research, we have presented two things, a basic mechanism for extracting resource
utilization statistics in a high performance computing system and a performance
optimization and tuning component that utilizes these statistics. The performance tuning
component has been developed so as to demonstrate the effective utilization of gathered
statistics. Our proposed mechanism is adapted from the common paradigm of machine
learning.
The performance optimization and tuner application illustrates the feasibility of our
proposed concept. The various sub-components of this application have been defined in
detail along with the underlying algorithms. Further we have also defined and justified its
placement in high performance oriented distributed system.
The Performance Tuner based Scenario Simulator component also provides a clear
comparison between the resource utilization with the traditional approach of allocation on
basis of availability and the optimized approach of allocation on the basis of suitability.
The contributions of our research are therefore as follows.
We have analysed the resource utilization across Monash Sun Grid for a period of six
months and gathered usage statistics during the same period. We also explored a
number of ways of gathering these statistics before narrowing down to the simplest

49 | P a g e
and most effective methodology. Traditional approaches even though monitor
system utilization but do not make use of such usage statistics to support the job
scheduler in taking resource allocation decisions.
The usage statistics gathered from the grid very well support our hypothesis of a
relationship existing between Jobs and resources, thereby indicating that resources
in fact are inclined towards certain type of jobs. So this research has also enabled us
to state that there is a strong affinity between jobs and resources.
We have also explored the various data organization models that can be utilized to
make a supporting ontology. The resulting ontology very neatly organizes the
gathered usage statistics. This ontology helps in efficiently modelling a data structure
that can very well integrate system description along with its usage. The ontology is
very well capable of describing the various resources being used by the system as a
unit, links them with jobs these resources executed and most importantly their
associated performance levels or quality levels as defined earlier. The ontology
further forms the critical requirement for the performance tuning and scenario
illustrating application.
We have developed a heuristics based performance tuner simulator that illustrates
the utilization of such ontology to enable the job scheduler in taking effective
decisions. This application not only builds up the required ontology from the training
data set but also uses the same to present a comparison between the traditional
approach of resource allocation and the approach suggested in this research. The
application allows the user to define the required performance levels and select the
job that can be run for simulation.
Lastly, we have also discussed the placement of such an optimization tool in a real
world distributed system. This model is not only limited to the conceptual phase but
is very much practical and feasible indeed.
In summary, this research identifies the key relation between jobs and underlying resources
on which these jobs are executed. It also provides a sample application that can be scaled
up for deployment in real life high performance computing systems.
We now outline the future research scope for this project.

50 | P a g e
5.2 Future Work
Two extensions of this project have been identified to be potential areas for extended
research.
The current implementation of the optimization framework does not integrate data
collection as a part of the performance tuner. It would though be interesting to
explore the various options for achieving the integration. This could possible use the
capabilities of Mobile Agents or Web Services for enabling collection of usage
statistics through the push or pull method.
Secondly, the implementation section highlights the importance of job groups. The
job groupings will have to be done on the basis of a pre-submission analysis of the
job. This Artificial Intelligence based job analyser will evaluate the job in terms of its
requirements of a particular system metric. For instance, it will predict that the job
requires the highest quality level.

51 | P a g e
5.3 BIBLIOGRAPHY
Al-Azzoni, I., & Down, D. G. (2008, August). Dynamic scheduling for heterogeneous Desktop Grids.
9th IEEE/ACM International Conference on Grid Computing, 2008 , 136 - 143.
Amarnath, B. R., Somasundaram, T. S., Ellappan, M., & Buyya, R. (2009). Ontology-based Grid
resource management. Softw. Pract. Exper., 39, 1419-1438.
Azad, H., Khaoua, M., & Zomaya, A. (2005). Design and performance of networks for super-, cluster-
and grid computing. Journal of parallel and distributed computing, 65, 1119-1122.
Balaji, S., Patnaik, L. M., Jenkins, L., & Goel, P. S. (1992). S-Nets: A Petri Net Based Model for
Performance. JOURNAL OF PARALLEL AND DISTRIBUTED COMPUTING(15), 225-237.
Baratloo, A., Dasgupta, P., Karamcheti, V., & Kedem, Z. (1999). Metacomputing with MILAN.
Proceedings of the 8th Heterogenous Computing Workshop (p. 169). IEEE Computer Society .
Bender, M., Chakrabarti, S., & Muthukrishnan, S. (1998). Flow and stretch metrics for scheduling
continuous job streams. Proceedings of symposium on discrete algorithms, (pp. 270-279).
Bosilca, G., Delmas, R., Dongarra, J., & Langou, J. (2009). Algorithm-based fault tolerance applied to
high performance computing. Journal of Parallel and Distributed Computing Systems(69),
410–416.
Bruneo, D., Scarpa, M., & Puliafito, A. (2010). Performance Evaluation of gLite Grids through GSPNs.
IEEE TRANSACTIONS ON PARALLEL AND DISTRIBUTED SYSTEMS, 21, 1611 - 1625.
Buttner, L., Nolte, J., & Schrode-Preikschat, W. (1999, June). Arts of Peace-A High-Performance
middleware layer for Parallel Distributed Computing. Journal of Parallel and Distributed
Computing, 59, 155-179.
Casanova, H., Legrand, A., Zagorodnov, D., & Berman, F. (2000). Heuristics for scheduling parameter
sweep applications in Grid environments. Proceedings of the Ninth Heterogeneous
Computing Workshop, (pp. 349-363).
Caymes-Scutari, P., Morajko, A., Margalef, T., & Luque, E. (2010). Scalable, dynamic monitoring,
analysis and tuning environment for parallel applications. Journal of Parallel and Distributed
Computing( 70 ), 330-337.
Chang, F., Karamcheti, V., & Kedem, Z. (2000). Exploiting Application Tunability for Efficient,
Predictable Resource Management in Parallel. Journal of Parallel and Distributed Computing(
60), 1420-1445.
Cirne, W. (2002). Using moldability to improve Performance of Supercomputer Jobs. Journal of
Parallel and Distributed Computing(62), 1571-1601.
Cruz, J., & Park, K. (1999). Toward performance drive System support for distributed computing in
clustered environments. Journal of parallel and distributed computing(59), 132-154.
Dinda, P. (2002). Online Prediction of the Running Time of Tasks. Cluster Computing, 5(3), 225-236.

52 | P a g e
Foster, I., & Kesselman, C. (1997). Globus: a metacomputing infrastructure. Internation Journal of
Supercomputer Applications(11), 2.
Foster, I., & Kesselman, C. (2004). The Grid: Blueprint for a New Computing. Los Altos, California:
Morgan Kaufmann Publishers.
Foster, I., Roy, A., & Sander, V. (2000). A quality of service architecture that combines resource
reservation and application adaptation. Proceedings of the Eighth International Workshop on
Quality of Service 2000, (pp. 181 - 188).
Frey, J., Foster, I., Livny, M., Tannenbaum, T., & Tuecke, S. (2001). Condor-G: A Computation,
Management Agent for Multi-Institutional Grids. Madison: University of Wisconsin.
Grimshaw, A., & Wulf, W. (1996). Legion—a view from 50,000 feet. Proceedings of 5th IEEE
Symposium on High Performance Distributed Computing, 1996, (pp. 89 - 99 ).
Han, L., Potter, S., Beckett, G., Pringle, G., Welch, S., Koo, S.-H., et al. (2010, July). FireGrid: An e-
infrastructure for next-generation emergency response support. Journal of Parallel
Distributed Computing, 70, 1128-1141.
Harchol-Balter, M., & Downey, A. (1997). Exploiting process lifetime distributions for dynamic load
balancing. ACM Trans. Comput. Syst., 253-285.
Ito, T., Ohsaki, H., & Imase, M. (2005). On parameter tuning of data transfer protocol GridFTP for
wide-area grid computing. 2nd International Conference on Broadband Networks, (pp. 1338 -
1344 Vol. 2 ).
Kissel, E., Swany, M., & Brown, A. (2010, August). Phoebus: A system for high throughput data
movement. Journal of Parallel and Distributed Computing, In-press.
Korkhov, V. V., Krzhizhanovskaya, V. V., & Sloot, P. (2008). A Grid-based Virtual Reactor: Parallel
performance and adaptive load balancing. JOURNAL OF PARALLEL AND DISTRIBUTED
COMPUTING(68), 596-608.
Leea, H., Chungb, K., China, S., Leea, J., & Leea, D. (2005). A resource management and fault
tolerance services in grid computing. Journal of Parallel Distributed Computing(65), 1305 –
1317.
Li, K. (2005). Job Scheduling and processor allocation for grid computing on metacomputers. Journal
of Parallel and Distributed Computing(65), 1406-1418.
Liu, C., & Baskiyar, S. (2009). A general distributed scalable grid scheduler for independent tasks.
Journal of Parallel and Distributed Computing(69), 307-314.
Mi, N., Casale, G., Cherkasova, L., & Smirni, E. (2008). Burstiness in multi-tier applications symptoms,
causes and new models. Proceedings of 9th ACM/IFIP/USENIX international conference on
middleware, (pp. 265-286).
Monash Sun Grid. (n.d.). Retrieved June 1, 2011, from
http://www.monash.edu.au/eresearch/services/mcg/msg.html

53 | P a g e
Monash Sun Grid Resource Utilization. (n.d.). Retrieved June 1, 2011, from
http://msg.its.monash.edu.au/ganglia/
Monash Sun Grid Usage Guide. (n.d.). Retrieved June 1, 2011, from https://confluence-
vre.its.monash.edu.au/display/mcgwiki/MSG+User+Guide
Nimrod. (n.d.). (Monash University) Retrieved June 1, 2011, from Nimrod:
https://messagelab.monash.edu.au/NimrodG
Papakhian, M. (1998). Comparing job-management systems: the user’s perspective. IEEE
Computational Science & Engineering, 4 - 9 .
Peng, D. T., & Shin, K. G. (1993). A New performance measure for scheduling independent real time
tasks. Journal of Parallel and Distributed Computing(19), 11-26.
Raicu, I., Zhao, Y., Dumitrescu, C., Foster, I., & Wilde, M. (2007). Falkon: A Fast and LightWeight Task
Execution Framework. Proceedings of the 2007 ACM/IEEE Conference on Supercomputing,
2007. SC '07. , (pp. 1 - 12 ).
Ravindran, B., Devarasetty, R. K., & Shirazi, B. (2002). Adaptive Resource Management Algorithms for
Periodic Tasks in Dynamic Real-Time Distributed Systems. Journal of Parallel and Distributed
Computing(62), 1527–1547.
Stillwell, M., Schanzenbach, D., Vivien, F., & Casanova, H. (2010). Resource Allocation algorithms for
virtualized service hosting platforms. Journal of parallel and distributed computing(70), 962-
974.
Urgaonkar, B., Shenoy, P., & Roscoe, R. (2002). Resource Overbooking and Application profiling in
shared hosting platforms. Sigops operating system review(36), pp. 239-254.
Urgaonkar, B., Shenoy, P., Chandra, A., Goyal, P., & Wood, T. (2008). Agile dynamic provisioning of
multi tier internet applications. ACM Trans. Auton. Adapt. Syst.(1), 1-39.
W.Schroder-Preikschat. (1994). The Logical Design of Parallel Operating Systems. NJ.
Weissman, J. B., Abburi, Ã. L., & England, D. (2003). Integrated scheduling: the best of both worlds.
Journal of Parallel and Distributed Computing(63), 649–668.
Wu, M., & Sun, X.-H. (2006). Grid harvest service:A performance system of grid computing. J. Parallel
Distrib. Comput., 1322-1337.
Yang, L., Liu, C., M. Schopf, J., & Foster, I. (2007). Anomaly detection and diagnosis in grid
environments. Proceedings of the 2007 ACM/IEEE conference on Supercomputing, (pp. 1-9).

54 | P a g e
Due to extensive nature of the data set and corresponding software developed for the
purpose of this thesis, the following items have been provided in the digital copy of this
project:
6.1 DATA SET
6.2 SOURCE CODE
6.3 SCRIPTS
[PLEASE REFER TO THE DIGITAL COPY FOR ADDITIONAL RESOURCES]