performance of ceres-rice and ceres-wheat models in rice–wheat systems: a review
TRANSCRIPT

AGRICULTURAL
wwwelseviercomlocateagsy
Agricultural Systems 90 (2006) 5ndash31
SYSTEMS
Review
Performance of CERES-Rice and CERES-Wheatmodels in ricendashwheat systems A review
J Timsina E Humphreys
CSIRO Land and Water Research Station Road Hanwood Griffith NSW 2680 Australia
Received 1 December 2004 received in revised form 22 September 2005 accepted 23 November 2005
Abstract
Ricendashwheat (RW) systems are critical to food security and livelihoods of rural and urbanpoor in south Asia and China and to regional economies in southeast Australia The sustain-ability of RW systems in south Asia is however threatened by yield stagnation or decline anddeclining partial factor productivity soil organic C and water availability Crop models poten-tially offer a means to readily explore management options to increase yield and to determinetrade-off between yield resource-use efficiency and environmental outcomes This paperreviews the performance of CERES-Rice and CERES-Wheat in Asia and Australia in relationto their potential application towards increasing resource use efficiency and yield of RWsystems
The performance of the models was evaluated using simulated and observed data on anthe-sis and maturity dates in-season LAI and growth final grain yield and its components andsoil water and N balances from published studies across Asia and Australia and then by com-puting the statistical parameters for the major characters Over the four data sets examined foranthesis and six for maturity dates CERES-Rice predicted those dates fairly well (normalisedRMSE = 4ndash5 D-index = 094ndash095) but over the 11 sets for grain and 4 for biomass yieldthe predictions were more variable (normalised RMSE = 23 for both D-index 090 and 076for grain and biomass respectively) Model performance was poorer under conditions of lowN water deficit and low temperatures during the reproductive stages Over the three data setsexamined CERES-Wheat predicted the anthesis and maturity dates quite well (normalisedRMSE = 4ndash5 D-index = 094ndash099) and over eight sets for grain and two sets for biomass
0308-521X$ - see front matter 2005 Elsevier Ltd All rights reserved
doi101016jagsy200511007
Corresponding author Tel +61 2 6960 1571 fax +61 2 6960 1600E-mail address jagadishtimsinacsiroau (J Timsina)
6 J Timsina E Humphreys Agricultural Systems 90 (2006) 5ndash31
yield the model predicted them also reasonably well (RMSE = 13ndash16 D-index = 086ndash097)Only one study evaluated the DSSAT RW sequence model with fairly satisfactory predictionsof rice and wheat yields over 20 years with adequate N but not the long-term change in soilorganic C and N Predictions of in-season LAI and crop growth and soil and water processeswere quite limited to investigate the robustness of model processes
Application of models to evaluate options to increase water and N use efficiency requiresthe ability to perform well at the margin where deficit stress begins While both models gen-erally perform satisfactorily under water and N non-limiting conditions the little evidenceavailable suggests that they do not perform well under resource-limiting situations We recom-mend that the modelsrsquo key processes under the water and N limiting conditions be furtherevaluated urgently The DSSAT sequence model also needs to be further evaluated againstobservations for a range of locations and management using data from long-term experimentsin RW systems 2005 Elsevier Ltd All rights reserved
Keywords CERES-Rice CERES-Wheat Ricendashwheat system Model evaluation Asia Australia
Contents
1 Introduction 62 Procedure for model evaluation 83 Calibration of models 104 Evaluation of CERES-Rice 10
41 Phenology 1042 Grain and biomass yields and yield components 1743 Other variables 19
5 Evaluation of CERES-Wheat 21
51 Phenology 2152 Growth and grain yield 2153 Other variables 2454 Model comparisons 24
6 Evaluation of the CERES RW sequence model 267 General discussion and conclusions 26
Acknowledgements 28References 28
1 Introduction
Rice and wheat are the two most important crops in Asia and Australia Whilepredominantly grown as monoculture these crops are also grown in annualsequences in sub-tropical climates on about 13 Mha in the Indo-Gangetic Plains(IGP) of south Asia and on about 34 Mha in the Yangtse River Basin in China(Timsina and Connor 2001 Dawe et al 2004) and in less intensive highly
J Timsina E Humphreys Agricultural Systems 90 (2006) 5ndash31 7
mechanised conditions in the temperate climate of south eastern Australia (Humph-reys et al 2004) Ricendashwheat (RW) systems are critical to food security and funda-mental to employment income and livelihood for hundreds of millions of rural andurban poor of south Asia and China and also contribute to national revenue tovarying degrees (Paroda et al 1994 Timsina and Connor 2001) However the sus-tainability of RW system is threatened by stagnating or declining yields increasinggaps between potential experimental and farmersrsquo yields and declining partial fac-tor productivity soil organic carbon and water availability (Timsina and Connor2001 Ladha et al 2003 Humphreys et al 2004)
Ricendashwheat systems are complex from both bio-physical and socio-economicviewpoints Understanding the problems and developing solutions for RW systemsrequire systematic research the resources for which are shrinking globally More-over field experimentation can only be used to investigate a limited number of vari-ables in a reductionist manner under a few site-specific conditions Crop models onthe other hand can potentially be used to integrate knowledge of the bio-physicalprocesses governing the plantndashsoilndashatmosphere system to evaluate the productionuncertainties associated with various management options and to extrapolate resultsto other sites and climates Simulating RW sequences requires models that candescribe the dynamic and at times extreme changes in soil hydrological conditionsassociated with growing continuously flooded rice in sequence with wheat grown inunsaturated soil and their profound impacts on nutrient dynamics especially N
There are many rice and wheat simulation models but only a few that simulatecrop sequences Initiatives for modelling RW sequences began as early as 1994through collaboration between the International Rice Research Institute (IRRI)and Wageningen University and between IRRI and the International FertilizerDevelopment Centre (IFDC) The former collaboration through the Systems Anal-ysis for Rice Production (SARP) project resulted in the development and validationof a RW prototype model for wheat after rice in a tropical environment in the Phil-ippines (Bouman et al 1994 Timsina et al 1994) while the latter resulted in thevalidation and application of CERES-Rice and CERES-Wheat (Crop Estimationthrough Resource and Environment Synthesis CERES) for RW sequences of north-ern Bangladesh and northwest India (Timsina et al 1995 1996 1998)
The decision support system for agrotechnology transfer (DSSAT) developed bythe International Benchmark Systems Network for Agrotechnology Transfer (IBS-NAT) contains multiple crop models including CERES-Rice and CERES-Wheatand provides a facility for simulating crop sequences The DSSATCERES modelssimulate crop growth development and yield taking into account the effects ofweather management genetics and soil water C and N These models are contin-uously being refined and modified The latest version (DSSAT ver 40) differs fromearlier versions with minor changes to growth and water balance processes but largechanges to integration procedures modularity and the user interface (Porter et al2003 Jones et al 2003 Hoogenboom et al 2004) The model processes forCERES-Rice and CERES-Wheat are documented in a fragmented way in variouspublications (Table 1) Some researchers have also modified the CERES code toimprove or add processes relevant to their applications or to build new models such
Table 1Sources of documentation of model processes in CERES-Rice and CERES-Wheat
Crop Process Documentation
All cereals Phenology Ritchie and NeSmith (1991)Ritchie et al (1998)
Rice and wheat Phenology Alociljha and Ritchie (1991)Hodges and Ritchie (1991) Singh(1994) Singh et al (1999)
All crops Water balance Ritchie (1998)All cereals N and soil
organic matterGodwin and Jones (1991) Singh(1994) Godwin et al (1990)Godwin and Singh (1991 1998)Gijsman et al (2002)
Rice Cold injury Godwin et al (1994) Timsinaet al (2004)
8 J Timsina E Humphreys Agricultural Systems 90 (2006) 5ndash31
as for methane generation and emission (MERES Methane Emissions from RiceEcosystems Matthews et al 2000a) tillage (Andales et al 2000) salinity (Castrig-nano et al 1998 Humphreys et al 2003ab) cold injury (Godwin et al 1994 Tim-sina et al 2004) and seedling growth and transplanting shock (Salam et al 2001)
All crop models should be evaluated in the environment of interest if the results ofapplications are to be credible To facilitate the model evaluation process Hunt andBoote (1998) provided the data required for the calibration and validation of whileTsuji et al (1994) provided the descriptions of input and output file structures forthe DSSAT models There are many studies on the calibration and validation ofCERES-Rice and CERES-Wheat around the world but there has been very littlequantitative and systematic evaluation on their performance using robust statisticalcriteria and no attempt to synthesise the results of those evaluations The objectivesof this review are (i) to compile and analyse results of the performance of CERES-Rice and CERES-Wheat using various statistical criteria (ii) to identify the capabil-ities and limitations of these models for application in RW systems (iii) to identifyfuture needs to enable the models to be applied to contribute to solving the resourceand food security problems of these systems
2 Procedure for model evaluation
Model evaluation requires well-defined criteria Several statistical methods foranalysing model performance are available (Jones and Kiniry 1986 Willmott1982 Willmott et al 1985) Jones and Kiniry (1986) used means and standarddeviations (SD) for observed and simulated data and linear regression parameterssuch as intercept (a) slope (b) and coefficient of determination (R2) HoweverThornton and Hansen (1996) concluded that use of the F-test (to test the nullhypothesis that the regression line has unit slope and an intercept of zero) canbe severely misleading They showed that the probability of rejection of a valid
J Timsina E Humphreys Agricultural Systems 90 (2006) 5ndash31 9
model may increase with sample size and pointed out that this is not an accept-able behaviour for a validation test of complex simulation models Willmott(1982) and Willmott et al (1985) recommended the use of RMSE or RMSD (rootmean square error or deviation) RMSEs (root mean square error systematic)RMSEu (root mean square error unsystematic) and D-index (index of agree-ment) but suggested that RMSE is the lsquolsquobestrsquorsquo measure as it summarises the meandifference in the units of observed and predicted values RMSEs indicates the bias(deviation of the actual slope from the 11 line) compared with the random var-iation (RMSEu) that may occur The D-index is a descriptive (both relative andbounded) measure and can be applied to make cross-comparisons between mod-els (Willmott 1982 Willmott et al 1985) Kobayashi and Salam (2000) usedmean squared deviation (MSD the square of RMSE or RMSD) but concludedthat RMSD is probably more intuitive than MSD because the deviation isexpressed on a relative basis against observations
To evaluate the performance of the models we compiled the published data onsimulated and observed results from several studies across Asia and Australia andthen computed a range of statistical parameters for each data set where these hadnot been originally presented by the authors (Tables 4 and 5) These included meansSDs a b R2 RMSE RMSEs RMSEu relative RMSE MSD and D-index Amodel reproduces experimental data perfectly when a is 0 b is 1 R2 is 1 RMSE(and RMSEs) is 0 RMSEu approaches the value of RMSE and D-index is 1 Theseparameters were calculated as follows
RMSE frac14 N1Xn
ifrac141
P i Oieth THORN2 05
RMSEs frac14 N1Xn
ifrac141
bP i Oi
2 05
RMSEu frac14 N1Xn
ifrac141
P i bP i
2 05
Normalised ethrelativeTHORN RMSE frac14 RMSE=O
D-index frac14 1Xn
ifrac141
P i Oieth THORN2=Xn
ifrac141
P 0i thorn O0i
2
P ij j frac14 athorn bOi
P i frac14 P 0i O O0i frac14 Oi O
where Pi and Oi are predicted and observed values and O is the mean observed valueover several replicates O has an associated standard deviation which is often ignoredin model evaluation and any difference between simulations and observations isattributed solely to model inadequacies (eg Kobayashi and Salam 2000 Gauchet al 2003) In this review model performance was judged on various qualitativeand quantitative criteria but with more weight on RMSE and D-index
10 J Timsina E Humphreys Agricultural Systems 90 (2006) 5ndash31
3 Calibration of models
Model calibration or parameterisation is the adjustment of parameters so thatsimulated values compare well with observed ones The genetic coefficients used inCERES models characterise the growth and development of crop varieties differingin maturity The coefficients for CERES-Rice and CERES-Wheat reported in the lit-eraure are summarised in Tables 2 and 3 The coefficients for rice from Asia aremostly for short duration Indica varieties while the two from Australia are for longduration Japonicas one of which (Calrose) a tall variety is no longer grown Thecoefficients for wheat variety RR21 derived from separate studies in India and Nepalwere very similar (Timsina et al 1995 1997) but there were differences for HD2329derived by Hundal and Kaur (1997) and Pathak et al (2003) using CERES-Wheatver 2 and ver 35 respectively The reasons for differences in the coefficients inthe latter two studies for the same genotype are unknown and neither report pro-vided data or methodologies used to calculate the coefficients The coefficientsreported in Tables 2 and 3 were mostly derived from results of a single site soil sea-son and sowing date without explicitly reporting any methodology or even withoutthe values of the coefficients Many studies did not even report the model versionused nor provide cultivar names or phenological information making it difficultfor the reader to calculate or assign any coefficients Mall and Aggarwal (2002) how-ever used data from more than one site or climate to derive the coefficients of sevenrice cultivars and Hundal and Kaur (1997) used more than one year of data toderive the coefficients for a wheat cultivar Coefficients derived from observationsfor a range of sowing dates and seasonal conditions are likely to be more robust thanthose derived from a limited range of conditions
4 Evaluation of CERES-Rice
CERES-Rice has been evaluated for many tropical and sub-tropical locationsacross Asia and in temperate climates in Japan and Australia (Table 4 Figs 1and 2) Most of these studies however provided only qualitative or graphical anal-ysis and many did not provide sufficient detail to calculate statistical parameters forquantitative evaluation of the models
41 Phenology
Tropics Alociljha and Ritchie (1991) reported good agreement between observedand predicted number of days to anthesis and maturity with normalised RMSE of4 and 3 and D-index of 065 and 087 respectively for three upland rice cultivars(IR 43 UPLRi 5 UPLRi 7) in the Philippines For three sites in Bangkok with ver20 Tongyai (1994) concluded that the number of days to physiological maturity wasoverestimated by 9ndash12 d In north and northeast Thailand also with ver 20 Jintra-wat (1995) however reported accurate predictions of phenology for both photope-riod sensitive and insensitive cultivars but the heading dates were underestimated
Table 2Genetic coefficients for rice cultivars grown in Asia and Australia determined for CERES-Rice
Cultivar Type Duration Stature Location Soil Coefficients Source
P1 P2O P2R P5 G1 G2 G3
BR14 Indica Short (130 d) Semi-dwarf NashipurBangladesh
Sandy clayloam
560 115 200 500 45 0026 1 Timsina et al(1998)
BR11 Indica Medium(150 d)
Semi-dwarf NashipurBangladesh
Sandy clayloam
825 115 300 390 52 0024 1 Timsina et al(1998)
Pant-4 Indica Pantnagar India Silty clayloam
830 114 160 300 35 003 1 Timsina et al(1995)
Masuli Indica Long Semi-dwarf Nepal 830 114 200 600 35 003 1 Timsina et al(1997)
Chaite-2 Indica Short Dwarf Nepal 560 115 200 500 45 0026 1 Timsina et al(1997)
IR52 Indica Short Semidwarf Philippines 425 118 125 454 72 1 1 Hoogenboomet al (1997)
Jaya Indica Kerala India Loam 830 15 50 277 728 0028 1 Saseendranet al (1998ab)
IR36 Indica Short Semidwarf IRRI Philippines 450 117 149 350 68 0023 1 Hoogenboomet al (1997)
IR8 Indica Pantnagar India Loam siltyclay loam
880 121 52 550 65 0028 1 Timsina et al(1995)
IR72 India Short Semidwarf Philippines 400 12 100 580 76 0023 1 Hoogenboomet al (1997)
Amaroo Japonica Long Semidwarf Southern NSWAustralia
Mundiwaclay loam
370 145 750 85 80 0026 1 Meyer et al(1994)
Calrose Japonica Lonh Tall Southern NSWAustralia
Mundiwaclay loam
325 14 600 92 75 0025 1 Meyer et al(1994)
PR106 Indica Several sites India ndash 500 115 150 300 60 0024 1 Pathak et al(2003)
China early na na 100 124 130 332 55 0025 1 Hoogenboomet al (1997)
China late na 100 12 166 328 55 0025 1 Hoogenboomet al (1997)
J
Tim
sina
E
H
um
ph
reys
A
gricu
ltura
lS
ystem
s9
0(
20
06
)5
ndash3
111
Table 3Genetic coefficients for spring wheat cultivars grown in Asia and Australia determined for CERES-Wheat
Cultivar Stature Duration Location Soil Climate Coefficients Source
P1V P1D P5 G1 G2 G3 PHINT
Kanchan Semi-dwarf Medium(105 d)
NashipurBangladesh
Sandy clayloam
Sub-tropical 10 13 43 50 40 27 99 Timsina et al(1998)
Sowgat Semi-dwarf Medium(108 d)
NashipurBangladesh
Sandy clayloam
Sub-tropical 10 30 40 55 45 27 97 Timsina et al(1998)
RR21 Semi-dwarf Short PantnagarIndia
Loam siltyclay loam
Sub-tropical 10 15 50 40 29 24 95 Timsina et al(1996)
RR21 Semi-dwarf Short Nepal ndash Sub-tropical 10 15 50 35 29 24 90 Timsina et al(1997)
UP262 Semi-dwarf Medium Nepal Loam siltyclay loam
Sub-tropical 10 30 50 40 29 24 90 Timsina et al(1997)
HD2009 Semi-dwarf Medium PantnagarIndia
Loam siltyclay loam
Sub-tropical 10 23 40 40 29 24 95 Timsina et al(1996)
HD2329 Semi-dwarf Medium LudhianaIndia
Sandy loam Sub-tropicalsemi-arid
05 25 35 25 29 40 Hundal and Kaur(1997)
HD2329 Semi-dwarf Medium Several sitesIndia
ndash ndash 05 32 26 34 35 42 95 Pathak et al(2003)
ANZA Dwarf Short Los BanosPhilippines
Clay Tropical 00 34 20 35 27 44 95 Timsina et al(1996)
UPLW1 Dwarf Short Los BanosPhilippines
Clay Tropical 00 40 70 50 40 30 95 Timsina et al(1996)
UPLW3 Dwarf Short Los BanosPhilippines
Clay Tropical 00 35 70 50 40 30 95 Timsina et al(1996)
Janz Semi-dwarf Long Southern NSWAustralia
Clay Temperatesemi-arid
05 30 28 29 13 44 95 Humphreys et al(2005)
Yecora Dwarf Short Southern NSW Clay Temperate 05 28 20 32 30 44 95 Humphreys et al(2005)
Bindawarra Semi-dwarf Long Southern NSW Clay Temperate 05 32 25 26 25 44 95 Humphreys et al(2005)
12J
T
imsin
a
E
Hu
mp
hrey
s
Ag
ricultu
ral
Sy
stems
90
(2
00
6)
5ndash
31
Table 4Evaluation results for CERES-Rice predictions of phenology grain and biomass yields for various data sets (simulated and observed data are from variousstudies reported under lsquodata setsrsquo)
Data sets N Xobs (SD) Xsim (SD) a b R2 AbsoluteRMSE
RMSEs RMSEu RMSEnormalised ()
D-index
Grain yield (tha)
Alociljha and Ritchie(1991)
18 49 (095) 43 (120) 291 046 034 114 064 095 23 070
Godwin et al (1994) 12 46 (22) 46 (20) 046 088 064 130 059 116 29 096Jintrawat (1995) 31 40 (12) 47 (13) 156 055 035 128 080 1 32 074Timsina et al (1995) 27 55 (15) 60 (19) 266 047 033 166 069 151 30 079Timsina et al (1998) 12 57 (22) 56 (28) 160 073 081 119 024 117 21 094Amien et al (1996) 26 52 (15) 44 (14) 095 096 083 098 081 056 19 089Saseendran et al
(1998ab)8 52 (10) 53 (12) 052 089 099 018 014 010 3 099
Matthews et al(2000ab)
18 38 (12) 46 (15) 070 068 074 110 077 072 27 084
Rao et al (2002) ndash 1993data
14 50 (07) 49 (08) 075 087 098 017 013 011 3 099
Pathak et al (2004) 58 53 (16) 53 (18) 111 079 084 072 098 072 18 095Timsina et al (2004) 25 64 (30) 62 (34) 125 082 086 126 022 125 20 096All data sets 250 50 (18) 51 (19) 119 074 067 114 022 112 23 090
Biomass yield (tha)
Alociljha and Ritchie(1991)
18 114 (22) 108 (27) 599 050 038 228 086 205 20 096
Saseendran et al(1998ab)
8 101 (15) 117 (11) 101 095 045 189 174 074 19 056
Matthews et al (2000b) 18 118 (32) 135 (31) 683 037 012 390 272 279 33 055Pathak et al (2004) 58 124 (29) 111 (35) 518 067 061 255 137 215 22 083All data sets 102 120 (28) 115 (32) 589 053 037 274 096 257 23 076
Anthesis (d)
Alociljha and Ritchie (1991) 15 949 (40) 949 (33) 4718 050 017 386 255 291 4 065Timsina et al (1995) 13 953 (66) 917 (54) 2637 075 039 624 473 408 7 072
(continued on next page)
J
Tim
sina
E
H
um
ph
reys
A
gricu
ltura
lS
ystem
s9
0(
20
06
)5
ndash3
113
Table 4 (continued)
Data sets N Xobs (SD) Xsim (SD) a b R2 AbsoluteRMSE
RMSEs RMSEu RMSEnormalised()
D-index
Timsina et al (1998) 11 840 (129) 818 (134) 819 093 093 409 218 346 5 098Saseendran et al
(1998ab)8 765 (28) 785 (44) 5688 025 015 442 225 291 6 065
All data sets 47 893 (105) 882 (99) 570 095 080 477 198 434 5 094
Maturity (d)
Alociljha and Ritchie(1991)
15 1222 (66) 1222 (48) 1394 111 066 379 264 273 3 087
Seino (1995) 4 133 (141) 1333 (119) 2297 117 098 238 077 186 2 100Timsina et al (1995) 13 1149 (157) 1168 (168) 1323 087 087 623 193 593 5 096Saseendran et al
(1998ab)8 1155 (61) 1188 (43) 380 129 084 415 382 163 4 084
Salam et al (personalcommunication)
4 108 (281) 107 (294) 68 094 097 450 294 509 4 099
Timsina et al (1998) 18 1206 (140) 1193 (124) 552 106 087 500 369 446 4 096All data sets 62 1189 (121) 1194 (112) 188 098 083 494 189 456 4 095
N number of data pairs Xobs mean of observed values Xsim mean of simulated values SD standard deviation a slope of linear relation between simulatedand observed values b intercept of linear relation between simulated and observed values R2 adjusted linear correlation coefficient between simulated andobserved values RMSE absolute root mean square error
14J
T
imsin
a
E
Hu
mp
hrey
s
Ag
ricultu
ral
Sy
stems
90
(2
00
6)
5ndash
31
a
Anthesis
60
80
100
12 0
60 80 100 120
Observed (d)
Sim
ulat
ed (
d)
Sassendran et al(1998ab)Alojilha amp Ritchie (1991)
Timsina et al (1995)
Timsina et al (1998)
RMSE=5D-index=094
b
Maturity
60
80
100
120
140
160
60 80 100 120 140 16 0
Observed (d)
Sim
ulat
ed (
d)
Saseendra etal (1998ab)Alojilha ampRitchie (1991)salam (perscommun)Timsina et al(1995)Timsina et al(1998)Seino (1995)
RMSE= 4D-index= 096
Fig 1 Simulated and observed days to (a) anthesis and (b) maturity of rice across a range of experimentsin Asia
J Timsina E Humphreys Agricultural Systems 90 (2006) 5ndash31 15
for a photo-sensitive cultivar especially for early planting dates The capability tosimulate photoperiod effects has since been included in CERES-Rice As a resultCERES-Rice accurately predicted the days to maturity of a photoperiod sensitivecultivar KDML 105 at six sites in northeast Thailand though the number of daysto panicle initiation and anthesis were overpredicted (Boonjung 2000)
a
Grain yield
0
4
8
12
16
0 4 8 12 16Observed (tha)
Sim
ulat
ed (
tha)
Rao et al (2002)
Amien et al (1996)
Jintrawat (1995)Saseendran et al(1998ab)Alojilha amp Ritchie (1991)Matthews et al (2000ab)
Timsina et al (1995)
RMSE=23D-index= 090
b
Biomass yield
5
10
15
20
5 10 15Observed (tha)
Sim
ulat
ed (
tha)
20
Saseendran et al(1998ab)
Alojilha amp Ritchie (1991)
Matthews et al (2000)
Pathak et al (2004)
RMSE= 23D-index= 076
Fig 2 Simulated and observed (a) grain and (b) biomass yields of rice across a range of experiments inAsia and Australia
16 J Timsina E Humphreys Agricultural Systems 90 (2006) 5ndash31
Sub-tropics and temperate At temperate and sub-tropical locations in Japan(Seino 1995) the model predicted days to physiological maturity of unspecified cul-tivars quite well with normalised RMSE = 2 and D-index = 10 In sub-tropicalnorthwest India (Timsina et al 1995) the absolute RMSE for both anthesis andmaturity was 6 d but D-index was 072 for anthesis and 096 for maturity indicatingless satisfactory performance of the model In sub-tropical northern Bangladesh(Timsina et al 1998) however both graphical display and statistical analyses
J Timsina E Humphreys Agricultural Systems 90 (2006) 5ndash31 17
suggested very good agreement for anthesis and maturity dates of BR11 and BR14with normalised RMSE of 5 and 4 and D-index of 098 and 096 respectively Insouth India (Saseendran et al 1998ab) prediction of anthesis was less accurate withRMSEs of Jaya and IR8 of 44 and 42 d and D-index = 065 and 084 respectively
Comparison with other models Mall and Aggarwal (2002) compared the perfor-mance of CERES-Rice and ORYZA1N at 11 locations from north to south Indiaincluding four in northwest India Predicted values were within 15 of observationsfor both models with similar RMSE of 45 d (CERES-Rice) and 48 d (ORYZA1N)In another study CERES-Rice ORYZA1 ORYZA-European RICAM SIMRIWand TRYM were compared in four diverse rice-growing environments in Asia usingmean squared deviation (MSD) which ranged from 87 to 238 d for growth durationCERES-Rice RICAM SIMRIW and TRYM had smaller MSDs than ORYZAand all models simulated growth duration well in China but not in the Philippinesand Japan (M Salam personal communication)
All environments Combined analysis of all data from the 4ndash6 studies shows rea-sonable predictive capability of CERES-Rice for the number of days to anthesisand maturity (Fig 1 Table 4) There is slightly greater precision for prediction ofmaturity date than anthesis as reflected in the smaller scatter about the 11 lineintercept closer to 0 and slope closer to 10 and slightly higher R2 and lower norma-lised RMSE Whether any greater precision in predicting maturity than anthesis dateactually reflects the model capability or relative accuracy of determination of actualanthesis and maturity dates in the field is an interesting question worthy of furtherinvestigation Few studies report how they actually determined these stages in thefield
42 Grain and biomass yields and yield components
Tropics Amien et al (1996) reported that the CERES-Rice (ver 3) under-pre-dicted grain yield by 10ndash20 at all locations in Indonesia except at Sukamandi inwest Java due to underprediction of grain weight (R2 = 083 RMSE = 098 tha)In different locations in Thailand the model predicted grain and biomass yields quitewell despite poor prediction of the dates of phenological events (Tongyai 1994)(Table 4) Jintrawat (1995) however reported that both grainsm2 and single grainweight as well as phenological events were predicted well leading to good predictionsof grain yield in Thailand Using MERES (with CERES-Rice growth routine) Mat-thews et al (2000b) reported fairly good prediction of grain and above-ground bio-mass yield (RMSE = 11 and 39 tha respectively) at Los Banos Philippines andHangzhou China except for three treatments with mid-season drainage in the dryseason at Los Banos
Sub-tropics In Kerala India Saseendran et al (1998ab) predicted grain andstraw yields of Jaya and IR8 within 3 and 27 of measured yields (RMSE = 02and 19 tha) with D-index of 099 and 056 respectively (Table 4) Rao et al(2002) also reported good yield prediction in Kerala (RMSE = 02 tha D-index = 099) for all transplanting dates for three cultivars in one year Howeverin another year in which heavy rains and incidences of gallmidge brownspot and
18 J Timsina E Humphreys Agricultural Systems 90 (2006) 5ndash31
rice bug during flowering stage resulted in high sterility the data were not used formodel evaluation In northern Bangladesh simulated yields of BR14 and BR11 wereeither over or underestimated (RMSE = 12 tha D-index = 094) with large under-predictions for 0 N (Timsina et al 1998) Some of the discrepancy at high N rateswas due to insect damage and lodging which the model is unable to predict Mah-mood et al (2003) also reported satisfactory performance of the model withobserved yields from 29 to 67 tha and simulated from 26 to 73 tha and RMSEof 13 tha for central and northern Bangladesh
In northwest India RMSE for grain yield was 17 tha and D-index was 079indicating large discrepancy between simulated and observed data (Timsina et al1995) largely due to inaccurate prediction of dates of phenological events Pathaket al (2004) evaluated CSM-CERES-Rice ver 40 using data from a range of waterregimes (saturated to frequent intermittent wetting and drying to prolonged mid-sea-son drying) and N (0 to recommended to supra-optimal dose) management treat-ments for three RW growing environments in northwest India There was goodagreement for grain yield (RMSE = 072 tha D-index = 095) and reasonableagreement for dry matter yield (RMSE = 26 tha D-index = 083) in well-fertilized(N) treatments but generally poor agreement for the 0 N treatments
Temperate In Japan simulated grain yields at three sites were within 0ndash5 ofobserved yields (Seino 1995) In one site in southern Australia simulated grainand total biomass yields were within 10 and 3 respectively of the observed yieldsin 1 year but across several years and sites there were large discrepancies especiallyin cold years due to the modelrsquos inability to simulate sterility induced by cold dam-age (Godwin et al 1994 Meyer et al 1994)
All environments Combined analysis of 11 data sets for grain and 4 sets for bio-mass yield revealed that the data were more scattered around 11 line intercept andslope closer to 0 and 10 respectively absolute RMSE lower and D-index higher forgrain yield than biomass yield indicating better accuracy and precision for formerthan the latter Normalised RMSE for both traits was 23 while absolute RMSEand D-index were 114 and 274 tha and 090 and 076 for grain and biomass yieldrespectively Accuracy and precision of their prediction was however not as good asanthesis and maturity dates (Fig 2 Table 4) However these data sets also includecrops affected by lodging and insect damage at high N rate heavy rain during anthe-sis and grain filling and cold damage When these crops are removed from the anal-ysis the precision of the model predictions is increased with normalisedRMSE = 14 and D-index = 096 and intercept and slope became closer to 0 and10 respectively for the grain yield
Comparison with other models Bachelet et al (1993) compared observed grainyields with yields predicted by CERES-Rice and MACROS (Modules of AnnualCrop Growth Simulator) (Penning de Vries et al 1989) under various climatesUsing default coefficients predictions by both models were fairly reliable althoughthe fit was closer for MACROS than CERES With derived coefficients however thereverse was the case Kropff et al (1994) reported that ORYZA1 CERES-RiceSIMRIW and TRYM overestimated yields in the wet season at IRRI and withthe exception of ORYZA1 predicted LAI inaccurately in the dry and wet season
J Timsina E Humphreys Agricultural Systems 90 (2006) 5ndash31 19
at IRRI and at Kyoto Japan and Yanco Australia Mall and Aggarwal (2002)however concluded that both CERES-Rice and ORYZA1N predicted grain yieldssatisfactorily (within plusmn15) especially for yields above 4 tha with RMSE of 07and 06 tha respectively Both models predicted grain number fairly accurately overthe range 15000ndash32000 grainsm2 with ORYZA1N performing better thanCERES-Rice at lower but the latter performing better at higher yield levels Bothmodels were unable to adequately simulate growth and yield under N and water def-icit stresses
In another study with six models all models closely predicted yields for early sow-ing at Moroika Japan and Nan Chang China but not for late sowing at Nan Changand for the dry season at IRRI The largest deviations were for SIMRIW andORYZA1 followed in order by TRYM CERES-Rice ORYZA-European andRICAM For harvest index RICAM and ORYZA1 had the largest MSD for NanChang early and late seasons while CERES-Rice had the largest MSD at MoroikaCERES-Rice also had the highest deviations for biomass yield (M Salam personalcommunication)
43 Other variables
Growth Only a few published reports are available on the performance ofCERES-Rice in predicting in-season biomass and leaf area Mall and Aggarwal(2002) reported good agreement for LAI using both CERES-Rice and ORYZA1Nwith slightly better agreement by CERES Both models underpredicted peak LAIdue to limited calibration and inaccurate initialisation of soil mineral N and soilwater Meyer et al (1994) in Australia also reported underestimation of peakLAI and panicle density by CERES-Rice (ver 21) although it predicted the timeof complete canopy closure (LAI 3) reasonably accurately Salam et al (2001)reported that CERES-Rice overestimated root and leaf dry matter and underesti-mated culm dry matter during the 30-d period of seedling growth and overestimatedthe duration of the transplanting shock period With the inclusion of new nurserygrowth and transplanting shock routines simulations of seedling growth and thetransplanting shock period improved greatly but not the yield response to trans-planting shock
Nitrogen With ver 20 Godwin et al (1990) and Buresh et al (1991) reportedpredicted N loss through urea of 6ndash58 vs observed loss of 5ndash49 kgha from eight irri-gated lowland rice experiments at three sites in the Philippines with treatments rang-ing from continuous flooding to alternate wetting and drying (AWD) In most casesespecially in continuously-flooded soil with low percolation rates (lt02 cmd) themodel predicted negligible denitrification loss consistent with field measurementsfrom 15N balance (Buresh and de Datta 1990) In the AWD treatments howeverthe predicted losses exceeded those from measurements due to overprediction of soildrying during periods of water deficit insufficient lag time for the onset of nitrifica-tion following soil drying and overestimation of the denitrification upon refloodingBuresh et al (1991) also reported that CERES-Rice was sensitive to above- andbelow-ground residue inputs initial soil ammoniumndashN concentration and N
20 J Timsina E Humphreys Agricultural Systems 90 (2006) 5ndash31
mineralisation rate Pathak et al (2004) evaluated the model (ver 40) for soil min-eral N and loss processes from rice fields under RW systems for Delhi and Punjab innorthwest India Simulation of soil mineral N in the surface layer (0ndash15 cm) was gen-erally poor but the model predicted N leaching losses similar to those in field exper-iments reported in the literature It also predicted higher denitrification and lowerammonia volatilisation losses for urea applied at 120 kg Nha compared toobserved losses
Using ver 20 Godwin et al (1990) and Buresh et al (1991) also reported pre-dicted crop N uptake of 40ndash145 vs observed uptake of 35ndash150 kgha from the abovesame experiments and treatments in the Philippines With ver 35 Timsina et al(1998) reported that both observed and simulated total crop N uptake by two ricecultivars ranged from 48ndash175 kgha with absolute RMSE of 17 kgha in northernBangladesh while with ver 40 Pathak et al (2004) reported good agreement espe-cially for grain N uptake with RMSE of 21 kgha and D-index of 086 in a RW sys-tem in Delhi
In southern Australia too with ver 21 predicted total biomass and N uptakewere within 3 of the observed values but N partitioning between straw and grainwas poor (Meyer et al 1994)
Methane emission With MERES Matthews et al (2000ab) reported good agree-ment for seasonal patterns and quantities of methane emission from rice straw andgreen manure treatments for a dry season crop at IRRI (simulated 0ndash450 vsobserved 0ndash480 kg CH4-Cha) and for seasonal methane emissions at Maligaya(simulated 150ndash450 vs observed 125ndash570 kg) Philippines and Hangzhou China(simulated 30ndash200 vs observed 70ndash360 kg) though with rice straw at IRRI themodel slightly overpredicted the plume of methane at the second drainage just beforeharvest They concluded that rice yield predicted by MERES was sensitive to rootdeath coefficient specific root exudation rate root transmissivity green manureaddition initial size of oxidised alternative electron acceptor pool seasonal temper-ature crop duration floodwater depth drainage period type of organic amend-ments phosphogypsum and percolation rate In a recent study however MERESgreatly overestimated the emissions from a rice field in a RW system in Delhi(Pathak et al 2004)
Evapotranspiration and deep drainage Using ver 21 Meyer et al (1994) reportedthat in temperate southern NSW the pattern of observed ET matched predicted ETwithin 2 over the whole season Using ver 40 Pathak et al (2004) also reportedconsistency between simulated ET and deep drainage from rice fields in Delhi andPunjab and typical values reported in the literature
Cold damage Cold damage due to low temperature during the early pollen micro-spore (EPM) stage is a common occurrence in Australian rice fields with severestdamage with high N fertility and shallow water (Williams and Angus 1994 Guna-wardena et al 2003) Using ver 21 Meyer et al (1994) reported large discrepanciesbetween observed and simulated yields with most discrepancies when low tempera-tures occurred during EPM Godwin et al (1994) developed a chilling injury routine(ver 21C) and obtained good agreement between simulated and observed yields forsprinkler irrigation treatments affected by cold damage That version did not take
J Timsina E Humphreys Agricultural Systems 90 (2006) 5ndash31 21
into account the effects of floodwater temperature and assimilate availability on pol-len cell survival throughout the chilling event (Doug Godwin personal communica-tion) Moreover that version was not tested further against other data setsConsequently Timsina et al (2004) developed new floodwater temperature and chill-ing injury routines and incorporated them into ver 40 using the most recent under-standing of the mechanisms of chilling injury in rice The new version (ver 40C)improved the ability to simulate rice response to low temperature compared withver 21C
5 Evaluation of CERES-Wheat
CERES-Wheat has been evaluated in many places in north and south AmericaEurope and Africa but only in few parts of Asia and Australia As for CERES-Rice most of those studies provided only qualitative or graphical analysis withoutcalculating any statistical parameters
51 Phenology
Prediction of wheat phenology was evaluated in three studies in tropical and sub-tropical RW regions of IGP in south Asia one in temperate and sub-tropical regionin Japan and one in southeast temperate Australia (Fig 3 Table 5) For the IGPTimsina et al (1995) reported that the model overestimated the time to anthesis(RMSE = 86 d D-index = 087) and maturity (RMSE = 87 d D-index = 099) ofRR21 and HD2009 at Pantnagar while Hundal and Kaur (1997) reported much bet-ter agreement (RMSE = 40 and 38 d D-index = 084 and 093 respectively) forHD2329 at Ludhiana both in NW India In northern Bangladesh (Timsina et al1998) also prediction of anthesis of Kanchan and Sowgat (RMSE = 20 d D-index = 090) was good while the date of maturity was generally overestimated(RMSE = 35 d D-index = 052) Seino (1995) reported that CERES-Wheat pre-dicted the days from sowing to physiological maturity within 1ndash25 of observedin northern (temperate) and central (sub-tropical) Japan In southern NSW Humph-reys et al (2005) reported that ver 35 predicted anthesis and maturity of Janz andYecora quite well in 2 out of 3 experiments Taken all data sets together predictionsfor both anthesis and maturity were quite similar though there was a tendency forbetter prediction for maturity as indicated by slightly higher R2 and D-index lowernormalised RMSE and better spread of data around 11 line (Fig 3 Table 5)
52 Growth and grain yield
Evaluation of CERES-Wheat and Wheat-W in a warm tropical environment atIRRI suggested that both models predict grain yield poorly due to high temperaturesduring the entire crop cycle especially during emergence and grain-filling period(Timsina et al 1995) Evaluation of CERES-Wheat for growth and grain yieldof wheat in the sub-tropical environment of northwest India however showed
a
Anthesis
70
80
90
100
110
70 80 90 100 110
Observed (d)
Sim
ulat
ed (
d)
Hundal amp Kaur (1997)
Timsina et al (1998)
Timsina et al (1995)
RMSE= 5D-index= 094
b
Maturity
100
110
120
130
140
150
100 110 120 130 140 150
Observed (d)
Sim
ulat
ed (
d)
Hundal amp Kaur (1997)
Timsina et al (1998)
Timsina et al (1995)
RMSE= 4D-index= 099
Fig 3 Simulated and observed days to (a) anthesis and (b) maturity of wheat across a range ofexperiments in Asia
22 J Timsina E Humphreys Agricultural Systems 90 (2006) 5ndash31
reasonable predictive ability (Timsina et al 1995 Hundal and Kaur 1997) Hundaland Kaur (1997) concluded that the model can be used for yield prediction for thecentral irrigated plains of the Indian Punjab but that there is also a need for closerexamination of the quantitative relationships governing the partitioning of photo-synthates into biomass and grain yield Similarly in sub-tropical northern Bangla-desh yield predictions for eight treatment combinations of N water and sowing
Table 5Evaluation results for CERES-Wheat predictions of phenology and grain and biomass yields for various data sets (simulated and observed data are fromvarious studies reported under lsquodata setsrsquo)
Data sets N Xobs (SD) Xsim (SD) a b R2 AbsoluteRMSE
RMSEs RMSEu RMSE()
D-index
Grain yield (tha)
Seino (1995) 3 34 (07) 32 (06) 027 097 087 027 019 019 8 094Timsina et al (1995) 26 34 (13) 35 (11) 026 110 085 051 027 044 15 096Timsina et al (1998) 24 31 (15) 33 (16) 014 090 097 035 021 028 11 099Hundal and Kaur (1997) 29 42 (06) 39 (07) 150 070 063 053 031 042 12 084Nain et al (2002) 30 28 (09) 28 (09) 012 096 096 019 008 019 7 099Godwin et al (2002) 6 46 (09) 45 (09) 003 101 099 011 008 007 2 100Heng et al (2000) 19 46 (18) 48 (16) 009 098 079 079 037 070 17 094All data sets 137 36 (14) 36 (13) 015 096 088 048 010 022 13 097
Biomass yield (tha)
Hundal and Kaur (1997) 29 106 (13) 116 (14) 393 057 040 154 111 106 15 066Heng et al (2000) 19 116 (39) 107 (31) 048 114 080 202 150 134 17 091All data sets 48 110 (27) 113 (22) 086 090 058 174 098 144 16 086
Anthesis (d)
Timsina et al (1995) 10 822 (120) 885 (126) 864 083 077 856 635 574 10 087Timsina et al (1998) 24 778 (34) 796 (27) 188 121 096 201 193 055 3 090Hundal and Kaur (1997) 29 937 (60) 932 (44) 180 102 056 396 274 286 4 084All data sets 64 857 (98) 872 (86) 427 103 081 449 255 369 5 094
Maturity (d)
Timsina et al (1995) 13 1418 (502) 1411 (456) 168 102 097 866 240 832 6 099Timsina et al (1998) 24 1105 (27) 1130 (15) 3592 066 013 354 327 135 3 052Hundal and Kaur (1997) 29 1297 (77) 1277 (71) 505 098 082 384 239 306 3 093All data sets 66 1251 (252) 1250 (238) 479 104 096 508 191 471 4 099
N number of data pairs Xobs mean of observed values Xsim mean of simulated values SD standard deviation a slope of linear relation between simulatedand observed values b intercept of linear relation between simulated and observed values R2 adjusted linear correlation coefficient between simulated andobserved values RMSE root mean square error
J
Tim
sina
E
H
um
ph
reys
A
gricu
ltura
lS
ystem
s9
0(
20
06
)5
ndash3
123
24 J Timsina E Humphreys Agricultural Systems 90 (2006) 5ndash31
dates were quite good (RMSE = 04 tha D-index = 099) (Timsina et al 1998) Inanother study in India Bangladesh and China (Heng et al 2000) there were reason-ably good predictions of grain and biomass yields as judged by several statisticalparameters (low intercepts slope = 098 R2 = 079 normalised RMSE = 17 andD-index = 094) All these studies in the sub-tropical environments were carriedout in the IGP where RW systems predominate
Seino (1995) reported predicted grain yields within 1ndash2 of observed(RMSE = 027 tha D-index = 094) in several locations in Japan Otter-Nackeet al (1986) validated an early version of the model for a range of cultivars in manycountries including temperate rainfed environments across Australia They reportedthat the model explained about 60 of the variation in grain yield but the evalua-tion for time course of LAI and above ground biomass N uptake and root weightresponses to N rate showed variable results Humphreys et al (2005) evaluated ver30 with three cultivars in field and lysimeter experiments in the rice-growing regionof southern Australia where the model performed well for grain yield Taken all datasets together accuracy and precision of predictions of grain yield was better thanbiomass yield as reflected by better spread of data around 11 line intercept andslope closer to 0 and 10 respectively lower RMSE and higher R2 and D-indexfor grain than biomass yield (Fig 4 Table 5)
53 Other variables
Humphreys et al (2005) reported that the ver 30 predicted well the time courseof biomass production and LAI volumetric soil water content and root lengthdensity and daily ET of three cultivars in rice-growing areas of southern AustraliaRecently with CSM-CERES-Wheat (ver 40) Timsina et al (2005) reported sim-ulated deep drainage losses beyond 09 m depth of 0ndash165 mm and ET of 338ndash662 mm for a range of sowing dates and irrigation methods Deep drainage washigher for flood irrigation compared with sprinkler irrigation and rainfed but ETwas higher for sprinkler Both deep drainage and ET were within the ranges ofobserved values reported by Humphreys et al (2003ab) Comprehensive evalua-tions of this nature are important to demonstrate robustness of the model pro-cesses to simulate the effect of water stress on growth and yield for sub-tropicaland temperate environments
54 Model comparisons
Nain et al (2002) used combined analyses from the technology-trend modeland CERES-Wheat for several locations in India and reported a mean grainyield of 282 tha RMSE of 02 tha and D-index of 099 indicating good perfor-mance of the model under lsquolsquohighrsquorsquo input conditions Godwin et al (2002) com-pared the predictions of CERES-Wheat (ver 35) and SWAGMAN-Destinyagainst data from irrigated wheat in southern Australia and concluded that bothmodels predict in-season LAI total biomass root length density and soil watercontent and final grain yield quite satisfactorily in temperate Australia In con-
a
Grain yield
0
2
4
6
8
0 42 6 8
Observed (tha)
Sim
ulat
ed (
tha)
Hundal amp Kaur(1997)Timsina et al(1998)Timsina et al(1996)Nain et al(2002)Heng et al(2000)Timsina et al(1995)Seino (1995)
Godwin et al(2002)
RMSE=13D-index= 097
b
Biomass yield
4
8
12
16
20
4 8 12 16 20
Observed (d)
Sim
ulat
ed (
d)
Hundal amp Kaur (1997)
Heng et al (2000)
RMSE=16D-index= 086
Fig 4 Simulated and observed grain and biomass yields of wheat across a range of experiments in Asiaand Australia
J Timsina E Humphreys Agricultural Systems 90 (2006) 5ndash31 25
trast after comparing the accuracy of eight simulation models for several lowyield potential temperate environments including Australia OrsquoLeary (2000)concluded that yield underestimation under stressed conditions was a common
26 J Timsina E Humphreys Agricultural Systems 90 (2006) 5ndash31
problem of all models and suggested the need of better models especially forvery low yield levels (lt1 tha)
6 Evaluation of the CERES RW sequence model
Timsina et al (1996) the only reported model validation study for RW systemused 20 yearsrsquo experimental and historical weather data from Pantnagar to val-idate the DSSAT sequence model (ver 35) In the experiment planting datescultivars and initial conditions varied across years so the model was manuallyreset prior to each season using observed initial soil mineral N and soil waterplanting dates and cultivars The model satisfactorily predicted the seasonal fluc-tuations in rice and wheat yields and the long-term trends for each crop over 20years though the predictions were more accurate with N fertilizer applicationthan with no added N The model also greatly overestimated the long-termdecline in soil organic carbon (SOC) and nitrogen (SON) The discrepancies inyield were partly due to inadequate model input data especially initial soil min-eral N and soil water prior to each crop but poor predictions of SOC and SONwere also due to the presence of only one pool of SOM in that version ofDSSAT (ver 35) DSSAT ver 40 includes the option of using a CENTURY-based SOM routine which has three SOM pools (passive slow and active micro-bial) (Gijsman et al 2002) However this is yet to be tested for RW system andthe CENTURY module does not simulate flooded soils
7 General discussion and conclusions
There are many reports of the evaluation of CERES-Rice in the RW areas oftropical and sub-tropical Asia but only a few for CERES-Wheat Most evaluationshave been limited to dates of anthesis and maturity and grain and biomass yieldsBoth models generally predicted anthesis and maturity within a few days of observeddates CERES-Rice predicted grain and biomass yields quite variably across a rangeof tropical to temperate locations with generally good predictions under optimal Nand water conditions (predicted values usually within 10ndash15 of observations) butnot under stress (N deficit water deficit low temperature) CERES-Wheat howevergenerally predicted the grain and biomass yields quite satisfactorily except at verylow yield levels (lt1 tha) or in high temperature environments
The variable performance of the models is probably due to a combination of defi-ciencies in model inputs experimental observations inclusion of non-modelled fac-tors (such as disease lodging pests storms) in model validation and insufficientcapture of model processes Possible input deficiencies include insufficient data forderivation of robust genetic coefficients lack of data on initial soil mineral N andwater and lack of proper soil characterisation (especially hydraulic properties)Few of the above reports of model evaluation state how these inputs were derivedor how genetic coefficients were determined
J Timsina E Humphreys Agricultural Systems 90 (2006) 5ndash31 27
The variable performance of the models and in particular of CERES-Rice high-lights the importance of proper calibration and evaluation in the environment ofinterest before applying them to evaluate management options This is especiallyimportant in the absence of reports on evaluation of model processes as reflectedin the modelsrsquo relative inabilities to predict a range of crop soil and waterparameters
Better evidence of the ability of the models to simulate a range of importantparameters other than yield such as time course of biomass production leaf areadevelopment N uptake soil water and mineral N dynamics and components ofthe water and N balances is also highly desirable to demonstrate the robustnessof model processes and to increase the confidence in the use of model There areno reports of rigorous evaluations of both models for variables related to increasingresource-use efficiency such as water and N management The results of the few stud-ies where some of these components have been determined are however generallyencouraging
Further model testing and improvements are thus needed under water and N lim-iting conditions before they can be used with confidence to explore managementoptions to increase resource use efficiency such as stretching irrigation intervalsand placement of N fertilizers for RW systems in both Asia and Australia Thisis particularly important because of the strong dependence of N transport and trans-formations on the hydrology of the system the risk of soil water deficit stress duringnon-ponded periods and the problem of cold damage during early pollen micro-spore in the Australian environment There is also a need to improve the abilityof CERES-Wheat to simulate the effect of high temperatures especially during grainfilling to examine trade-offs between yield and water use requirement by changingsowing date in both the tropical and sub-tropical RW regions of Asia and temperateAustralia In Australia the model also needs to be able to examine the trade-offbetween sowing late to avoid frost damage vs shortened grain filling during warmerweather
Only one study evaluated the performance of the DSSAT RW sequence modelbut with initial mineral N and soil water content based on observations inputtedfor each crop This work demonstrated that the model predicts the long-term grainyield of component crops fairly satisfactorily but not the long-term changes in SOCand SON suggesting that the sequence model needs further evaluation against datafrom a range of locations and management The results of long-term experimentscould be useful for this purpose however availability of adequate and good qualitydata availability is always a problem
In conclusion while it seems that CERES-Rice and CERES-Wheat have per-formed reasonably well in RW regions of Asia and Australia evaluations and appli-cations addressing resource use efficiency and sustainability issues are lacking Betterdata from field experiments designed to address these issues and further model eval-uations improvements and applications are needed to address the issues of yieldstagnation or decline and increasing yield gaps and finally to contribute to solvingthe resource and food security problems in RW systems of Asia and to regional econ-omies of Australia
28 J Timsina E Humphreys Agricultural Systems 90 (2006) 5ndash31
Acknowledgements
We thank FWT Penning de Vries (IWMI) and James W Jones (University ofFlorida) for reviewing an earlier draft and Ken Boote (University of Florida) forreviewing a later draft of the manuscript We are also grateful to Doug Godwin(Consultant to CSIRO Land and Water) for various discussions on the global per-formance of CERES models We are grateful to the Australian Centre for Interna-tional Agricultural Research for funding support for our research on RW system
References
Alociljha EC Ritchie JT 1991 A model for the phenology of rice In Hodges T (Ed) PredictingCrop Phenology CRC Press Boca Raton FL USA pp 181ndash189
Amien I Rejekingrum P Pramudia A Susanti E 1996 Effects of interannual climate variability andclimate change on rice yield in Java Indonesia Water Air Soil Pollut 92 29ndash39
Andales AA Batchelor WD Anderson CE Farnham DE Whigham DK 2000 Incorporatingtillage effects into a soybean model Agri Syst 66 69ndash98
Bachelet D Van Sickle J Gay CA 1993 The impacts of climate change on rice yield evaluation ofthe efficacy of different modelling approaches In Penning de Vries FWT et al (Eds) SystemsApproaches for Agricultural Development Kluwer Academic Publishers The Netherlands pp 145ndash174
Boonjung H 2000 Climate Variability and Rice Production in Rainfed Rice Area in NortheastThailand Risk Analysis and Management Applications pp 202ndash205 Available from lthttpwwwearthscapeorgrmainrsitesclchhtmlgt
Bouman BAM Penning de Vries FWT Wan Harun WS Timsina J Hartkamp AD 1994Optimising RW rotations under water-limited conditions Paper presented at the symposium lsquolsquoScenariostudies for the rural environmentrsquorsquo 12ndash15 September 1994 Wageningen Netherlands and the lsquolsquoThirdCongress of the European Society for Agronomy 18ndash22 September 1994 Podowa Italy 4 p
Buresh RJ de Datta SK 1990 Denitrification losses from puddled rice soils in the tropics Biol FertSoils 9 1ndash13
Buresh RJ Singh U Godwin DC Ritchie JT de Datta SK 1991 Simulating soil nitrogentransformations with CERES-Rice Agrotechnol Transf 13 7ndash10
Castrignano A Katerji N Karam F Mastrorilli M Hamdy A 1998 A modified version ofCERES-Maize model for predicting crop response to salinity stress Ecol Model 111 107ndash120
Dawe D Frolking S Li C 2004 Trends in ricendashwheat area in China Field Crops Res 87 89ndash95Gauch HG Hwang JTG Fick GW 2003 Model evaluation by comparison of model-based
predictions and measured values Agron J 95 1442ndash1446Gijsman AJ Hoogenboom G Parton WJ Kerridge PC 2002 Modifying DSSAT for low-input
agricultural systems using a SOMresidue module from CENTURY Agron J 94 462ndash474Godwin D Jones CA 1991 Nitrogen dynamics in soil-crop systems In Hanks RJ Ritchie JT
(Eds) Modeling Plant and Soil systems Agronomy Monograph 31 American Society of AgronomyMadison WI USA pp 287ndash321
Godwin D Singh U 1991 Modelling nitrogen dynamics in rice cropping systems In Deturck PPonnamperuma FN (Eds) Rice Production on Acid Soils of the Tropics Institute of FundamentalStudies Kandy Sri Lanka pp 287ndash294
Godwin D Singh U 1998 Nitrogen balance and crop response to nitrogen in upland and lowlandcropping systems In Tsuji GY Hoogenboom G Thornton PK (Eds) UnderstandingOptions for Agricultural Production Kluwer Academic Publishers Dordrecht The Netherlandspp 55ndash78
J Timsina E Humphreys Agricultural Systems 90 (2006) 5ndash31 29
Godwin DC Singh U Buresh RJ De Datta SK 1990 Modelling N dynamics in relation to ricegrowth and yield In Transactions of the 14th Int Cong Soil Sci Kyoto Japan Int Soc Soil SciJapan pp 320ndash325
Godwin DC Meyer WS Singh U 1994 Simulation of the effect of chilling injury and nitrogensupply on floret fertility and yield in rice Aust J Exp Agri 34 921ndash926
Godwin D Humphreys E Smith DJ Timsina J Xevi E Meyer WS 2002 Application ofSWAGMAN destiny to ricendashwheat cropping systems In Humphreys E Timsina J (Eds)Modelling Irrigated Cropping Systems with Special Attention to RicendashWheat Sequences and RaisedBed Planting Proceedings of a Workshop CSIRO Land and Water Griffith NSW Australia 25ndash28February 2002 CSIRO Land and Water Technical Report 2502 pp 69ndash82
Gunawardena TA Fukai S Blamey FPC 2003 Low temperature induced spikelet sterility in rice INitrogen fertilization and sensitive reproductive period Aust J Agri Res 54 937ndash946
Heng LK Baethgen WE Moutoonnet P 2000 The collection of a minimum dataset and theapplication of DSSAT for optimizing wheat yield in irrigated cropping systems pp 7ndash17 InOptimizing Nitrogen Fertilizer Application to Irrigated Wheat IAEA TECDOC-1164 2000 p 245
Hodges T Ritchie JT 1991 The CERES-Wheat phenology model In Hodges T (Ed) PredictingCrop Phenology CRC Press Boca Raton FL USA pp 133ndash143
Hoogenboom G Georgiev G Singh U 1997 Performance of the CERES-Rice model for threelocations in the Asian Region Report of the Workshop lsquolsquoClimate Variability AgriculturalProductivity and Food Security in the Asian Monsoon Regionrsquorsquo A Joint STARTWCRPIGBP-GCTE Workshop 19ndash22 February 1997 Bogor Indonesia START Report 19972 pp35ndash42
Hoogenboom G Jones JW Porter CH Wilkens PW Boote KJ Batchelor WD Hunt LATsuji GY 2004 DSSAT 40 vol 1 Overview ICASA University of Hawaii Honolulu USA
Humphreys E Edraki M Bethune M 2003 Deep drainage and crop water use for irrigated annualcrops and pastures in Australia ndash a review of determinations in fields and lysimeters CSIRO Land andwater Technical Report 1403 33 pp
Humphreys E Smith DJ White RJG Xevi E Godwin DC 2003 MaizeMan ndash a decision supportsystem for water and nitrogen management In Fifth Australian Maize Conference Proceedings 18thndash20th February 2003 Toowoomba Queensland Australia pp 127ndash134
Humphreys E Meisner C Gupta R Timsina J Beecher HG Yong Lu T Yadvinder-Singh GillMA Masih I Jia Guo Z Thompson JA 2004 Water saving in ricendashwheat systems PlantProduction Science 8 242ndash258
Humphreys E Smith DJ Fattore A Bhuiyan AM Fawcett BJ 2005 Quantifying andmaximising the benefits of crops after rice CRC for Sustainable Rice Production Final Report Project1205 Yanco NSW Australia
Hundal SS Kaur P 1997 Application of the CERES-Wheat model to yield predictions in the irrigatedplains of the Indian Punjab J Agric Sci Cambridge 129 13ndash18
Hunt LA Boote KJ 1998 Data for model operation calibration and validation In Tsuji GYHoogenboom G Thornton PK (Eds) Understanding Options for Agricultural ProductionSystems Approaches for Sustainable Agricultural Development Kluwer Academic Publishers GreatBritain pp 9ndash39
Jintrawat A 1995 A decision support system for rapid assessment of lowland rice-based croppingalternatives in Thailand Agri Syst 47 245ndash258
Jones CA Kiniry JR (Eds) 1986 CERES-Maize A Simulation Model of Maize Growth andDevelopment Texas AampM University Press College Station TX p 194
Jones JW Hoogenboom G Porter CH Boote KJ Batchelor WD Hunt LA Wilkens PWSingh U Gijsman AJ Ritchie JT 2003 The DSSAT cropping system model Eur J Agron 18235ndash265
Kobayashi K Salam MU 2000 Comparing simulated and measured values using mean squareddeviation and its components Agron J 92 345ndash352
Kropff MJ Williams RL Horie T Angus JF Singh U Centeno HG Cassman KG 1994Predicting yield potential of rice in different environments In Humphreys et al (Eds) Temperate Rice
30 J Timsina E Humphreys Agricultural Systems 90 (2006) 5ndash31
ndash Achievements and Potential Proceedings of Temperate Rice Conference Yanco NSW Australiapp 657ndash663
Ladha JK Pathak H Tirol-Padre A Dawe D Gupta RK 2003 Productivity trends in intensivericendashwheat cropping systems in Asia In Ladha JK Hill JE Duxbury JM Gupta RK BureshRJ (Eds) Improving the Productivity and Sustainability of RicendashWheat Systems Issues andImpactsrsquo ASA Special Publication 65 (ASA Inc CSSA Inc SSSA Inc Madison USA) pp 45ndash76
Mahmood Meo M Legates DR Morrissey ML The CERES-Rice model-based estimates of potentialmonsoon season rainfed rice productivity in Bangladesh The Professional Geographer 55 259ndash273
Mall RK Aggarwal PK 2002 Climate change and rice yields in diverse agro-environments of India IEvaluation of impact assessment models Climate Change 52 315ndash330
Matthews RB Wassmann R Arah J 2000a Using a cropsoil simulation model and GIS techniquesto assess methane emissions from rice fields in Asia I Model development Nutr Cycl Agroecosyst58 141ndash159
Matthews RB Wassmann R Buendia LV Knox JW 2000b Using a cropsoil simulation modeland GIS techniques to assess methane emissions from rice fields in Asia II Model validation andsensitivity analysis Nutr Cycl Agroecosyst 58 161ndash177
Meyer WS White RJG Smith DJ Baer BD 1994 Monitoring a rice crop to validate the CERES-Rice model CSIRO Technical Memorandum 9413 September 1994 26 p
Nain AS Dadhwal VK Singh TP 2002 Real time wheat yield assessment using technology trendand crop simulation model with minimal data set Curr Sci 82 1255ndash1258
OrsquoLeary GJ 2000 Can contemporary wheat models simulate grain yield accurately in low-potentialenvironments In White JW Grace PR (Eds) Modelling Extremes of Wheat and maize CropPerformance in the Tropics Proceedings of a Workshop CIMMYT El Batan Mexico 19ndash22 April1999 NRG-GIS Series 00-01 Mexico DF CIMMYT pp 5ndash10
Otter-Nacke S Godwin D Ritchie JT 1986 Testing and Validating the CERES-Wheat Model inDiverse Environments IFDC Muscle Shoals AL USA p 147
Paroda RS Woodhead T Singh RB 1994 Sustainability of RW Production Systems in Asia RAPAPub 199411 FAO Bangkok Thailand 209 p
Pathak H Ladha JK Aggarwal PK Peng S Das S Yadvinder-Singh Bijay-Singh Kamra SKMishra B Sastri ASRAS Aggarwal HP Das DK Gupta RK 2003 Trends of climaticpotential and on-farm yields of rice and wheat in the Indo-Gangetic plains Field Crops Res 80 223ndash234
Pathak H Timsina J Humphreys E Godwin DC Bijay-Singh Shukla AK Singh U MatthewsRB 2004 Simulation of rice crop performance and water and N dynamics and methane emissionsfor rice in northwest India using CERES-Rice model CSIRO Land and Water Technical Report 2304 CSIRO Land and Water Griffith NSW 2680 Australia 111 p Available from ltwwwclwcsir-oaupublicationstechnical2004gt
Penning de Vries FWT Jansen DM ten Berge HFM Bakema A 1989 Simulation ofEcophysiological Processes of Growth in Several Annual Crops PUDOC Wageningen TheNetherlands p 271
Porter CH Hoogenboom G Batchelor WD Jones JW Gijsman AJ 2003 DSSAT v40 CropModels Overview of changes relative to DSSAT v35 University of Florida Gainesville USA
Rao GSLHV Sebastian S Subash N 2002 Crop growth simulation models of rice under humidclimates Available from lthttpwwwcommonorthwestealthknowledgenortheasttMetCDChap-ter7C7P06htmgt
Ritchie JT 1998 Soil water balance and plant stress In Tsuji GY Hoogenboom G Thornton PK(Eds) Understanding Options for Agricultural Production Kluwer Academic Publishers DordrechtThe Netherlands pp 41ndash54
Ritchie JT NeSmith DS 1991 Temperature and crop development In Hanks RJ Ritchie JT(Eds) Modeling Plant and Soil Systems Agronomy Monograph 31 American Society of AgronomyMadison WI USA pp 5ndash29
Ritchie JT Singh U Godwin D Bowen WT 1998 Cereal growth development and yield InTsuji GY Hoogenboom G Thornton PK (Eds) Understanding Options for AgriculturalProduction Kluwer Academic Publishers Dordrecht The Netherlands pp 79ndash98
J Timsina E Humphreys Agricultural Systems 90 (2006) 5ndash31 31
Salam MU Jones JW Kobayashi K 2001 Predicting nursery growth and transplanting shock inrice Exp Agri 37 65ndash81
Saseendran SA Hubbard KG Singh KK Mendiratta N Rathore LS Singh SV 1998aOptimum transplanting dates for rice in Kerala India determined using both CERES v30 andClimProb Agron J 90 185ndash190
Saseendran SA Singh KK Rathore LS Rao GSLHVP Mendiratta N Lakshmi Narayan KSingh SV 1998b Evaluation of the CERES-Rice v30 model for the climate conditions of the stateof Kerala India Meterol Appl 5 385ndash392
Seino H 1995 Implications of climate change for crop production in Japan In Climate Change andAgriculture Analysis of Potential International Impacts ASA Special Publication Number 59 ASAMadison WI pp 293ndash306
Singh U 1994 Nitrogen management strategies for lowland rice cropping systems In Proceedings of theInternational Conference on Fertilizer Usage in the Tropics (FERTROP) Malaysian Society of SoilScience Kuala Lumpur Malaysia pp 110ndash130
Singh U Wilkens PW Chude V Oikeh S 1999 Predicting the effect of nitrogen deficiency on cropgrowth duration and yield In Proceedings of the Fourth International Conference on PrecisionAgriculture ASA-CSSA-SSSA Madison WI USA pp 1379ndash1393
Thornton PK Hansen JW 1996 A note on regressing real-world data on model output Agri Syst 411ndash414
Timsina J Connor DJ 2001 Productivity and management of RW systems issues and challengesField Crops Res 69 93ndash132
Timsina J Bouman BAM Penning de Vries FWT Van Kraalingen DWG Wan Sulaiman WanHarun 1994 Modelling tropical RW systems In Proceedings of SARP lsquolsquoApplication Workshoprsquorsquo onthe Application Program lsquoAgroecological Zonation and Characterisationrsquo and lsquoCrop rotationoptimisationrsquo IRRI Philippines pp 58ndash70
Timsina J Singh U Singh Y Lansigan FP 1995 Addressing sustainability of RW systems testingand applications of CERES and SUCROS models In Proceedings of the International Rice ResearchConference 13ndash17 February 1995 IRRI Los Banos Philippines pp 633ndash656
Timsina J Singh U Singh Y 1996 Addressing sustainability of RW systems analysis of long-termexperimentation and simulation In Kropff et al (Eds) Applications of Systems Approaches at theField Level Kluwer Academic Publishers Dordrecht The Netherlands pp 383ndash397
Timsina J Adhikari B Ganesh-KC 1997 Modelling and simulation of rice wheat and maize crops forselected sites and the potential effects of climate change on their productivity in Nepal ConsultancyReport submitted to Ministry of Agric Harihar Bhawan Kathmandu Nepal 55 p
Timsina J Singh U Badaruddin M Meisner C 1998 Cultivar nitrogen and moisture effects on aRW sequence experimentation and simulation Agron J 90 119ndash130
Timsina J Singh U Godwin D Humphreys E 2004 Modelling chilling injury in rice using CERES-Rice ver 41 In CD-Rom Proceedings of the International Rice Cold Tolerance Workshop 22ndash23July 2004 Canberra ACT Australia
Timsina J Humphreys E Godwin D Matthews S 2005 Evaluation of options for increasing waterproductivity of irrigated wheat using CSM-Wheat V40 In MODSIM05 Conference MelbourneAustralia
Tongyai C 1994 Impact of climate change on simulated rice production in Thailand In Rosenzweig CIglesias A (Eds) Implications of Climate Change for International Agriculture Crop ModellingStudy US Environmental Protection Agency EPA 230-B-94-003 Washington DC
Tsuji GY Uehara G Balas S 1994 DSSAT v3 vol 2 University of Hawaii Honolulu Hawaii p 284Williams RL Angus JF 1994 Deep water protects high-nitrogen crops from low-temperature
damage Aust J Exp Agri 34 927ndash932Willmott CJ 1982 Some comments on the evaluation of model performance Bull Am Meterol Soc
63 1309ndash1313Willmott CJ Ackleson SG Davis RE Feddema JJ Klink KM Legates DR OrsquoConnell J
Rowe CM 1985 Statistics for the evaluation and comparison of models J Geophys Res 90 (C5)8995ndash9005
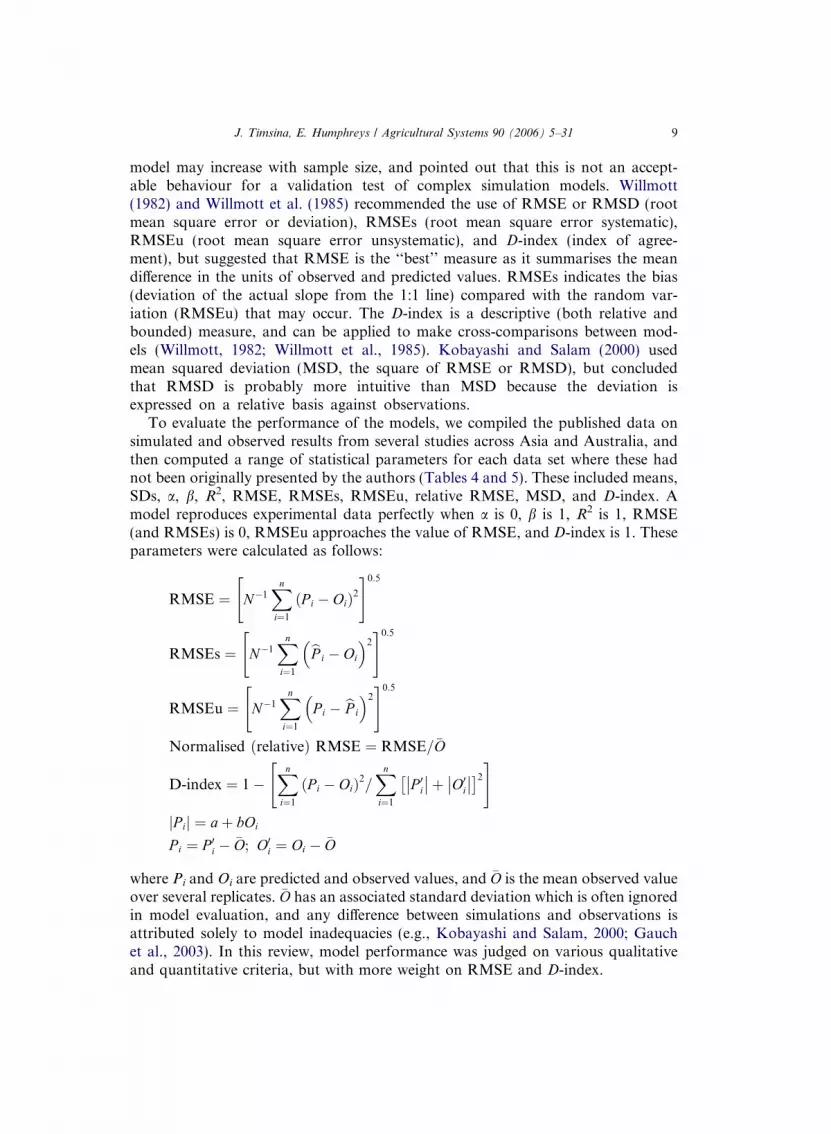
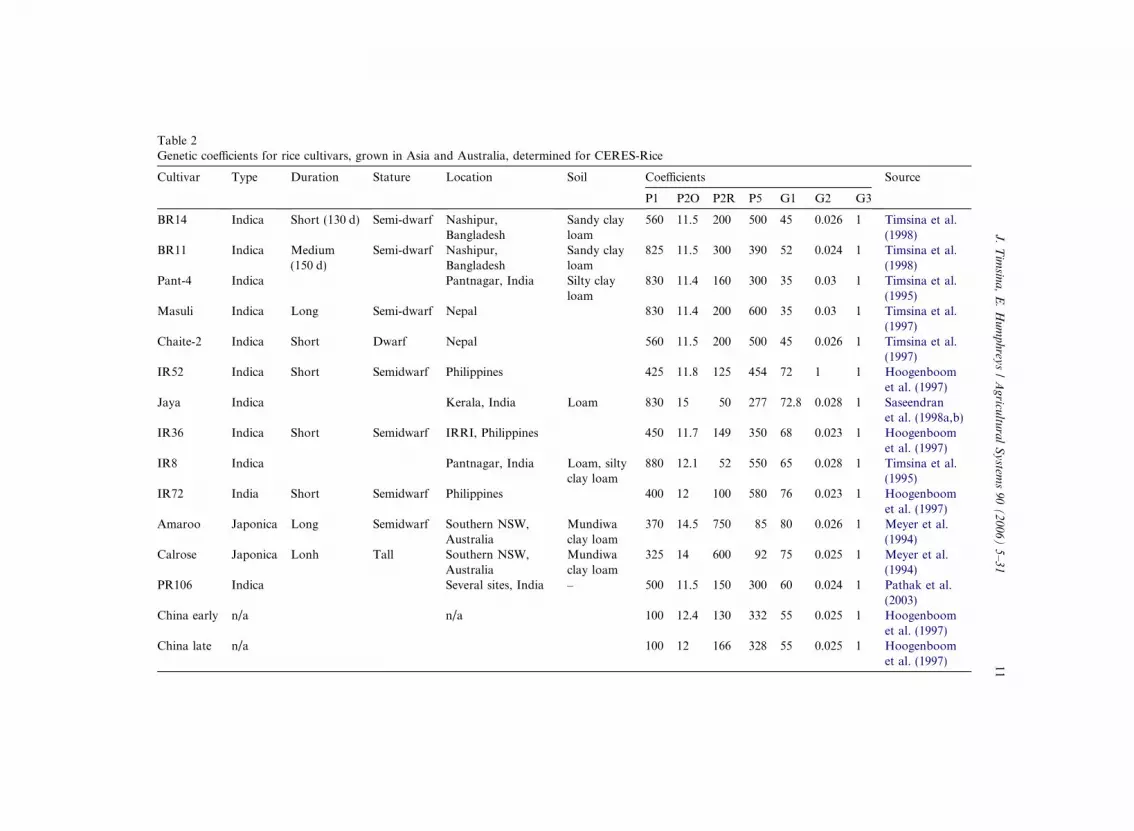
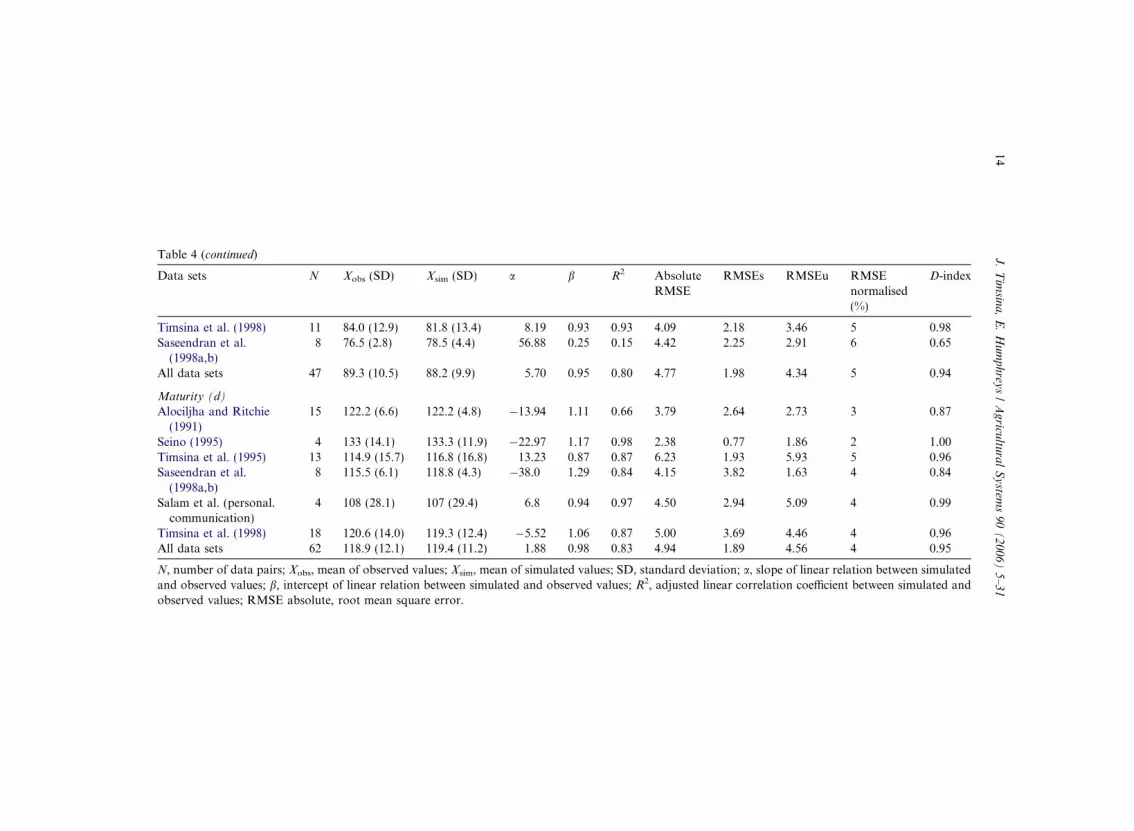

a
Anthesis
60
80
100
12 0
60 80 100 120
Observed (d)
Sim
ulat
ed (
d)
Sassendran et al(1998ab)Alojilha amp Ritchie (1991)
Timsina et al (1995)
Timsina et al (1998)
RMSE=5D-index=094
b
Maturity
60
80
100
120
140
160
60 80 100 120 140 16 0
Observed (d)
Sim
ulat
ed (
d)
Saseendra etal (1998ab)Alojilha ampRitchie (1991)salam (perscommun)Timsina et al(1995)Timsina et al(1998)Seino (1995)
RMSE= 4D-index= 096
Fig 1 Simulated and observed days to (a) anthesis and (b) maturity of rice across a range of experimentsin Asia
J Timsina E Humphreys Agricultural Systems 90 (2006) 5ndash31 15
for a photo-sensitive cultivar especially for early planting dates The capability tosimulate photoperiod effects has since been included in CERES-Rice As a resultCERES-Rice accurately predicted the days to maturity of a photoperiod sensitivecultivar KDML 105 at six sites in northeast Thailand though the number of daysto panicle initiation and anthesis were overpredicted (Boonjung 2000)
a
Grain yield
0
4
8
12
16
0 4 8 12 16Observed (tha)
Sim
ulat
ed (
tha)
Rao et al (2002)
Amien et al (1996)
Jintrawat (1995)Saseendran et al(1998ab)Alojilha amp Ritchie (1991)Matthews et al (2000ab)
Timsina et al (1995)
RMSE=23D-index= 090
b
Biomass yield
5
10
15
20
5 10 15Observed (tha)
Sim
ulat
ed (
tha)
20
Saseendran et al(1998ab)
Alojilha amp Ritchie (1991)
Matthews et al (2000)
Pathak et al (2004)
RMSE= 23D-index= 076
Fig 2 Simulated and observed (a) grain and (b) biomass yields of rice across a range of experiments inAsia and Australia
16 J Timsina E Humphreys Agricultural Systems 90 (2006) 5ndash31
Sub-tropics and temperate At temperate and sub-tropical locations in Japan(Seino 1995) the model predicted days to physiological maturity of unspecified cul-tivars quite well with normalised RMSE = 2 and D-index = 10 In sub-tropicalnorthwest India (Timsina et al 1995) the absolute RMSE for both anthesis andmaturity was 6 d but D-index was 072 for anthesis and 096 for maturity indicatingless satisfactory performance of the model In sub-tropical northern Bangladesh(Timsina et al 1998) however both graphical display and statistical analyses
J Timsina E Humphreys Agricultural Systems 90 (2006) 5ndash31 17
suggested very good agreement for anthesis and maturity dates of BR11 and BR14with normalised RMSE of 5 and 4 and D-index of 098 and 096 respectively Insouth India (Saseendran et al 1998ab) prediction of anthesis was less accurate withRMSEs of Jaya and IR8 of 44 and 42 d and D-index = 065 and 084 respectively
Comparison with other models Mall and Aggarwal (2002) compared the perfor-mance of CERES-Rice and ORYZA1N at 11 locations from north to south Indiaincluding four in northwest India Predicted values were within 15 of observationsfor both models with similar RMSE of 45 d (CERES-Rice) and 48 d (ORYZA1N)In another study CERES-Rice ORYZA1 ORYZA-European RICAM SIMRIWand TRYM were compared in four diverse rice-growing environments in Asia usingmean squared deviation (MSD) which ranged from 87 to 238 d for growth durationCERES-Rice RICAM SIMRIW and TRYM had smaller MSDs than ORYZAand all models simulated growth duration well in China but not in the Philippinesand Japan (M Salam personal communication)
All environments Combined analysis of all data from the 4ndash6 studies shows rea-sonable predictive capability of CERES-Rice for the number of days to anthesisand maturity (Fig 1 Table 4) There is slightly greater precision for prediction ofmaturity date than anthesis as reflected in the smaller scatter about the 11 lineintercept closer to 0 and slope closer to 10 and slightly higher R2 and lower norma-lised RMSE Whether any greater precision in predicting maturity than anthesis dateactually reflects the model capability or relative accuracy of determination of actualanthesis and maturity dates in the field is an interesting question worthy of furtherinvestigation Few studies report how they actually determined these stages in thefield
42 Grain and biomass yields and yield components
Tropics Amien et al (1996) reported that the CERES-Rice (ver 3) under-pre-dicted grain yield by 10ndash20 at all locations in Indonesia except at Sukamandi inwest Java due to underprediction of grain weight (R2 = 083 RMSE = 098 tha)In different locations in Thailand the model predicted grain and biomass yields quitewell despite poor prediction of the dates of phenological events (Tongyai 1994)(Table 4) Jintrawat (1995) however reported that both grainsm2 and single grainweight as well as phenological events were predicted well leading to good predictionsof grain yield in Thailand Using MERES (with CERES-Rice growth routine) Mat-thews et al (2000b) reported fairly good prediction of grain and above-ground bio-mass yield (RMSE = 11 and 39 tha respectively) at Los Banos Philippines andHangzhou China except for three treatments with mid-season drainage in the dryseason at Los Banos
Sub-tropics In Kerala India Saseendran et al (1998ab) predicted grain andstraw yields of Jaya and IR8 within 3 and 27 of measured yields (RMSE = 02and 19 tha) with D-index of 099 and 056 respectively (Table 4) Rao et al(2002) also reported good yield prediction in Kerala (RMSE = 02 tha D-index = 099) for all transplanting dates for three cultivars in one year Howeverin another year in which heavy rains and incidences of gallmidge brownspot and
18 J Timsina E Humphreys Agricultural Systems 90 (2006) 5ndash31
rice bug during flowering stage resulted in high sterility the data were not used formodel evaluation In northern Bangladesh simulated yields of BR14 and BR11 wereeither over or underestimated (RMSE = 12 tha D-index = 094) with large under-predictions for 0 N (Timsina et al 1998) Some of the discrepancy at high N rateswas due to insect damage and lodging which the model is unable to predict Mah-mood et al (2003) also reported satisfactory performance of the model withobserved yields from 29 to 67 tha and simulated from 26 to 73 tha and RMSEof 13 tha for central and northern Bangladesh
In northwest India RMSE for grain yield was 17 tha and D-index was 079indicating large discrepancy between simulated and observed data (Timsina et al1995) largely due to inaccurate prediction of dates of phenological events Pathaket al (2004) evaluated CSM-CERES-Rice ver 40 using data from a range of waterregimes (saturated to frequent intermittent wetting and drying to prolonged mid-sea-son drying) and N (0 to recommended to supra-optimal dose) management treat-ments for three RW growing environments in northwest India There was goodagreement for grain yield (RMSE = 072 tha D-index = 095) and reasonableagreement for dry matter yield (RMSE = 26 tha D-index = 083) in well-fertilized(N) treatments but generally poor agreement for the 0 N treatments
Temperate In Japan simulated grain yields at three sites were within 0ndash5 ofobserved yields (Seino 1995) In one site in southern Australia simulated grainand total biomass yields were within 10 and 3 respectively of the observed yieldsin 1 year but across several years and sites there were large discrepancies especiallyin cold years due to the modelrsquos inability to simulate sterility induced by cold dam-age (Godwin et al 1994 Meyer et al 1994)
All environments Combined analysis of 11 data sets for grain and 4 sets for bio-mass yield revealed that the data were more scattered around 11 line intercept andslope closer to 0 and 10 respectively absolute RMSE lower and D-index higher forgrain yield than biomass yield indicating better accuracy and precision for formerthan the latter Normalised RMSE for both traits was 23 while absolute RMSEand D-index were 114 and 274 tha and 090 and 076 for grain and biomass yieldrespectively Accuracy and precision of their prediction was however not as good asanthesis and maturity dates (Fig 2 Table 4) However these data sets also includecrops affected by lodging and insect damage at high N rate heavy rain during anthe-sis and grain filling and cold damage When these crops are removed from the anal-ysis the precision of the model predictions is increased with normalisedRMSE = 14 and D-index = 096 and intercept and slope became closer to 0 and10 respectively for the grain yield
Comparison with other models Bachelet et al (1993) compared observed grainyields with yields predicted by CERES-Rice and MACROS (Modules of AnnualCrop Growth Simulator) (Penning de Vries et al 1989) under various climatesUsing default coefficients predictions by both models were fairly reliable althoughthe fit was closer for MACROS than CERES With derived coefficients however thereverse was the case Kropff et al (1994) reported that ORYZA1 CERES-RiceSIMRIW and TRYM overestimated yields in the wet season at IRRI and withthe exception of ORYZA1 predicted LAI inaccurately in the dry and wet season
J Timsina E Humphreys Agricultural Systems 90 (2006) 5ndash31 19
at IRRI and at Kyoto Japan and Yanco Australia Mall and Aggarwal (2002)however concluded that both CERES-Rice and ORYZA1N predicted grain yieldssatisfactorily (within plusmn15) especially for yields above 4 tha with RMSE of 07and 06 tha respectively Both models predicted grain number fairly accurately overthe range 15000ndash32000 grainsm2 with ORYZA1N performing better thanCERES-Rice at lower but the latter performing better at higher yield levels Bothmodels were unable to adequately simulate growth and yield under N and water def-icit stresses
In another study with six models all models closely predicted yields for early sow-ing at Moroika Japan and Nan Chang China but not for late sowing at Nan Changand for the dry season at IRRI The largest deviations were for SIMRIW andORYZA1 followed in order by TRYM CERES-Rice ORYZA-European andRICAM For harvest index RICAM and ORYZA1 had the largest MSD for NanChang early and late seasons while CERES-Rice had the largest MSD at MoroikaCERES-Rice also had the highest deviations for biomass yield (M Salam personalcommunication)
43 Other variables
Growth Only a few published reports are available on the performance ofCERES-Rice in predicting in-season biomass and leaf area Mall and Aggarwal(2002) reported good agreement for LAI using both CERES-Rice and ORYZA1Nwith slightly better agreement by CERES Both models underpredicted peak LAIdue to limited calibration and inaccurate initialisation of soil mineral N and soilwater Meyer et al (1994) in Australia also reported underestimation of peakLAI and panicle density by CERES-Rice (ver 21) although it predicted the timeof complete canopy closure (LAI 3) reasonably accurately Salam et al (2001)reported that CERES-Rice overestimated root and leaf dry matter and underesti-mated culm dry matter during the 30-d period of seedling growth and overestimatedthe duration of the transplanting shock period With the inclusion of new nurserygrowth and transplanting shock routines simulations of seedling growth and thetransplanting shock period improved greatly but not the yield response to trans-planting shock
Nitrogen With ver 20 Godwin et al (1990) and Buresh et al (1991) reportedpredicted N loss through urea of 6ndash58 vs observed loss of 5ndash49 kgha from eight irri-gated lowland rice experiments at three sites in the Philippines with treatments rang-ing from continuous flooding to alternate wetting and drying (AWD) In most casesespecially in continuously-flooded soil with low percolation rates (lt02 cmd) themodel predicted negligible denitrification loss consistent with field measurementsfrom 15N balance (Buresh and de Datta 1990) In the AWD treatments howeverthe predicted losses exceeded those from measurements due to overprediction of soildrying during periods of water deficit insufficient lag time for the onset of nitrifica-tion following soil drying and overestimation of the denitrification upon refloodingBuresh et al (1991) also reported that CERES-Rice was sensitive to above- andbelow-ground residue inputs initial soil ammoniumndashN concentration and N
20 J Timsina E Humphreys Agricultural Systems 90 (2006) 5ndash31
mineralisation rate Pathak et al (2004) evaluated the model (ver 40) for soil min-eral N and loss processes from rice fields under RW systems for Delhi and Punjab innorthwest India Simulation of soil mineral N in the surface layer (0ndash15 cm) was gen-erally poor but the model predicted N leaching losses similar to those in field exper-iments reported in the literature It also predicted higher denitrification and lowerammonia volatilisation losses for urea applied at 120 kg Nha compared toobserved losses
Using ver 20 Godwin et al (1990) and Buresh et al (1991) also reported pre-dicted crop N uptake of 40ndash145 vs observed uptake of 35ndash150 kgha from the abovesame experiments and treatments in the Philippines With ver 35 Timsina et al(1998) reported that both observed and simulated total crop N uptake by two ricecultivars ranged from 48ndash175 kgha with absolute RMSE of 17 kgha in northernBangladesh while with ver 40 Pathak et al (2004) reported good agreement espe-cially for grain N uptake with RMSE of 21 kgha and D-index of 086 in a RW sys-tem in Delhi
In southern Australia too with ver 21 predicted total biomass and N uptakewere within 3 of the observed values but N partitioning between straw and grainwas poor (Meyer et al 1994)
Methane emission With MERES Matthews et al (2000ab) reported good agree-ment for seasonal patterns and quantities of methane emission from rice straw andgreen manure treatments for a dry season crop at IRRI (simulated 0ndash450 vsobserved 0ndash480 kg CH4-Cha) and for seasonal methane emissions at Maligaya(simulated 150ndash450 vs observed 125ndash570 kg) Philippines and Hangzhou China(simulated 30ndash200 vs observed 70ndash360 kg) though with rice straw at IRRI themodel slightly overpredicted the plume of methane at the second drainage just beforeharvest They concluded that rice yield predicted by MERES was sensitive to rootdeath coefficient specific root exudation rate root transmissivity green manureaddition initial size of oxidised alternative electron acceptor pool seasonal temper-ature crop duration floodwater depth drainage period type of organic amend-ments phosphogypsum and percolation rate In a recent study however MERESgreatly overestimated the emissions from a rice field in a RW system in Delhi(Pathak et al 2004)
Evapotranspiration and deep drainage Using ver 21 Meyer et al (1994) reportedthat in temperate southern NSW the pattern of observed ET matched predicted ETwithin 2 over the whole season Using ver 40 Pathak et al (2004) also reportedconsistency between simulated ET and deep drainage from rice fields in Delhi andPunjab and typical values reported in the literature
Cold damage Cold damage due to low temperature during the early pollen micro-spore (EPM) stage is a common occurrence in Australian rice fields with severestdamage with high N fertility and shallow water (Williams and Angus 1994 Guna-wardena et al 2003) Using ver 21 Meyer et al (1994) reported large discrepanciesbetween observed and simulated yields with most discrepancies when low tempera-tures occurred during EPM Godwin et al (1994) developed a chilling injury routine(ver 21C) and obtained good agreement between simulated and observed yields forsprinkler irrigation treatments affected by cold damage That version did not take
J Timsina E Humphreys Agricultural Systems 90 (2006) 5ndash31 21
into account the effects of floodwater temperature and assimilate availability on pol-len cell survival throughout the chilling event (Doug Godwin personal communica-tion) Moreover that version was not tested further against other data setsConsequently Timsina et al (2004) developed new floodwater temperature and chill-ing injury routines and incorporated them into ver 40 using the most recent under-standing of the mechanisms of chilling injury in rice The new version (ver 40C)improved the ability to simulate rice response to low temperature compared withver 21C
5 Evaluation of CERES-Wheat
CERES-Wheat has been evaluated in many places in north and south AmericaEurope and Africa but only in few parts of Asia and Australia As for CERES-Rice most of those studies provided only qualitative or graphical analysis withoutcalculating any statistical parameters
51 Phenology
Prediction of wheat phenology was evaluated in three studies in tropical and sub-tropical RW regions of IGP in south Asia one in temperate and sub-tropical regionin Japan and one in southeast temperate Australia (Fig 3 Table 5) For the IGPTimsina et al (1995) reported that the model overestimated the time to anthesis(RMSE = 86 d D-index = 087) and maturity (RMSE = 87 d D-index = 099) ofRR21 and HD2009 at Pantnagar while Hundal and Kaur (1997) reported much bet-ter agreement (RMSE = 40 and 38 d D-index = 084 and 093 respectively) forHD2329 at Ludhiana both in NW India In northern Bangladesh (Timsina et al1998) also prediction of anthesis of Kanchan and Sowgat (RMSE = 20 d D-index = 090) was good while the date of maturity was generally overestimated(RMSE = 35 d D-index = 052) Seino (1995) reported that CERES-Wheat pre-dicted the days from sowing to physiological maturity within 1ndash25 of observedin northern (temperate) and central (sub-tropical) Japan In southern NSW Humph-reys et al (2005) reported that ver 35 predicted anthesis and maturity of Janz andYecora quite well in 2 out of 3 experiments Taken all data sets together predictionsfor both anthesis and maturity were quite similar though there was a tendency forbetter prediction for maturity as indicated by slightly higher R2 and D-index lowernormalised RMSE and better spread of data around 11 line (Fig 3 Table 5)
52 Growth and grain yield
Evaluation of CERES-Wheat and Wheat-W in a warm tropical environment atIRRI suggested that both models predict grain yield poorly due to high temperaturesduring the entire crop cycle especially during emergence and grain-filling period(Timsina et al 1995) Evaluation of CERES-Wheat for growth and grain yieldof wheat in the sub-tropical environment of northwest India however showed
a
Anthesis
70
80
90
100
110
70 80 90 100 110
Observed (d)
Sim
ulat
ed (
d)
Hundal amp Kaur (1997)
Timsina et al (1998)
Timsina et al (1995)
RMSE= 5D-index= 094
b
Maturity
100
110
120
130
140
150
100 110 120 130 140 150
Observed (d)
Sim
ulat
ed (
d)
Hundal amp Kaur (1997)
Timsina et al (1998)
Timsina et al (1995)
RMSE= 4D-index= 099
Fig 3 Simulated and observed days to (a) anthesis and (b) maturity of wheat across a range ofexperiments in Asia
22 J Timsina E Humphreys Agricultural Systems 90 (2006) 5ndash31
reasonable predictive ability (Timsina et al 1995 Hundal and Kaur 1997) Hundaland Kaur (1997) concluded that the model can be used for yield prediction for thecentral irrigated plains of the Indian Punjab but that there is also a need for closerexamination of the quantitative relationships governing the partitioning of photo-synthates into biomass and grain yield Similarly in sub-tropical northern Bangla-desh yield predictions for eight treatment combinations of N water and sowing
Table 5Evaluation results for CERES-Wheat predictions of phenology and grain and biomass yields for various data sets (simulated and observed data are fromvarious studies reported under lsquodata setsrsquo)
Data sets N Xobs (SD) Xsim (SD) a b R2 AbsoluteRMSE
RMSEs RMSEu RMSE()
D-index
Grain yield (tha)
Seino (1995) 3 34 (07) 32 (06) 027 097 087 027 019 019 8 094Timsina et al (1995) 26 34 (13) 35 (11) 026 110 085 051 027 044 15 096Timsina et al (1998) 24 31 (15) 33 (16) 014 090 097 035 021 028 11 099Hundal and Kaur (1997) 29 42 (06) 39 (07) 150 070 063 053 031 042 12 084Nain et al (2002) 30 28 (09) 28 (09) 012 096 096 019 008 019 7 099Godwin et al (2002) 6 46 (09) 45 (09) 003 101 099 011 008 007 2 100Heng et al (2000) 19 46 (18) 48 (16) 009 098 079 079 037 070 17 094All data sets 137 36 (14) 36 (13) 015 096 088 048 010 022 13 097
Biomass yield (tha)
Hundal and Kaur (1997) 29 106 (13) 116 (14) 393 057 040 154 111 106 15 066Heng et al (2000) 19 116 (39) 107 (31) 048 114 080 202 150 134 17 091All data sets 48 110 (27) 113 (22) 086 090 058 174 098 144 16 086
Anthesis (d)
Timsina et al (1995) 10 822 (120) 885 (126) 864 083 077 856 635 574 10 087Timsina et al (1998) 24 778 (34) 796 (27) 188 121 096 201 193 055 3 090Hundal and Kaur (1997) 29 937 (60) 932 (44) 180 102 056 396 274 286 4 084All data sets 64 857 (98) 872 (86) 427 103 081 449 255 369 5 094
Maturity (d)
Timsina et al (1995) 13 1418 (502) 1411 (456) 168 102 097 866 240 832 6 099Timsina et al (1998) 24 1105 (27) 1130 (15) 3592 066 013 354 327 135 3 052Hundal and Kaur (1997) 29 1297 (77) 1277 (71) 505 098 082 384 239 306 3 093All data sets 66 1251 (252) 1250 (238) 479 104 096 508 191 471 4 099
N number of data pairs Xobs mean of observed values Xsim mean of simulated values SD standard deviation a slope of linear relation between simulatedand observed values b intercept of linear relation between simulated and observed values R2 adjusted linear correlation coefficient between simulated andobserved values RMSE root mean square error
J
Tim
sina
E
H
um
ph
reys
A
gricu
ltura
lS
ystem
s9
0(
20
06
)5
ndash3
123
24 J Timsina E Humphreys Agricultural Systems 90 (2006) 5ndash31
dates were quite good (RMSE = 04 tha D-index = 099) (Timsina et al 1998) Inanother study in India Bangladesh and China (Heng et al 2000) there were reason-ably good predictions of grain and biomass yields as judged by several statisticalparameters (low intercepts slope = 098 R2 = 079 normalised RMSE = 17 andD-index = 094) All these studies in the sub-tropical environments were carriedout in the IGP where RW systems predominate
Seino (1995) reported predicted grain yields within 1ndash2 of observed(RMSE = 027 tha D-index = 094) in several locations in Japan Otter-Nackeet al (1986) validated an early version of the model for a range of cultivars in manycountries including temperate rainfed environments across Australia They reportedthat the model explained about 60 of the variation in grain yield but the evalua-tion for time course of LAI and above ground biomass N uptake and root weightresponses to N rate showed variable results Humphreys et al (2005) evaluated ver30 with three cultivars in field and lysimeter experiments in the rice-growing regionof southern Australia where the model performed well for grain yield Taken all datasets together accuracy and precision of predictions of grain yield was better thanbiomass yield as reflected by better spread of data around 11 line intercept andslope closer to 0 and 10 respectively lower RMSE and higher R2 and D-indexfor grain than biomass yield (Fig 4 Table 5)
53 Other variables
Humphreys et al (2005) reported that the ver 30 predicted well the time courseof biomass production and LAI volumetric soil water content and root lengthdensity and daily ET of three cultivars in rice-growing areas of southern AustraliaRecently with CSM-CERES-Wheat (ver 40) Timsina et al (2005) reported sim-ulated deep drainage losses beyond 09 m depth of 0ndash165 mm and ET of 338ndash662 mm for a range of sowing dates and irrigation methods Deep drainage washigher for flood irrigation compared with sprinkler irrigation and rainfed but ETwas higher for sprinkler Both deep drainage and ET were within the ranges ofobserved values reported by Humphreys et al (2003ab) Comprehensive evalua-tions of this nature are important to demonstrate robustness of the model pro-cesses to simulate the effect of water stress on growth and yield for sub-tropicaland temperate environments
54 Model comparisons
Nain et al (2002) used combined analyses from the technology-trend modeland CERES-Wheat for several locations in India and reported a mean grainyield of 282 tha RMSE of 02 tha and D-index of 099 indicating good perfor-mance of the model under lsquolsquohighrsquorsquo input conditions Godwin et al (2002) com-pared the predictions of CERES-Wheat (ver 35) and SWAGMAN-Destinyagainst data from irrigated wheat in southern Australia and concluded that bothmodels predict in-season LAI total biomass root length density and soil watercontent and final grain yield quite satisfactorily in temperate Australia In con-
a
Grain yield
0
2
4
6
8
0 42 6 8
Observed (tha)
Sim
ulat
ed (
tha)
Hundal amp Kaur(1997)Timsina et al(1998)Timsina et al(1996)Nain et al(2002)Heng et al(2000)Timsina et al(1995)Seino (1995)
Godwin et al(2002)
RMSE=13D-index= 097
b
Biomass yield
4
8
12
16
20
4 8 12 16 20
Observed (d)
Sim
ulat
ed (
d)
Hundal amp Kaur (1997)
Heng et al (2000)
RMSE=16D-index= 086
Fig 4 Simulated and observed grain and biomass yields of wheat across a range of experiments in Asiaand Australia
J Timsina E Humphreys Agricultural Systems 90 (2006) 5ndash31 25
trast after comparing the accuracy of eight simulation models for several lowyield potential temperate environments including Australia OrsquoLeary (2000)concluded that yield underestimation under stressed conditions was a common
26 J Timsina E Humphreys Agricultural Systems 90 (2006) 5ndash31
problem of all models and suggested the need of better models especially forvery low yield levels (lt1 tha)
6 Evaluation of the CERES RW sequence model
Timsina et al (1996) the only reported model validation study for RW systemused 20 yearsrsquo experimental and historical weather data from Pantnagar to val-idate the DSSAT sequence model (ver 35) In the experiment planting datescultivars and initial conditions varied across years so the model was manuallyreset prior to each season using observed initial soil mineral N and soil waterplanting dates and cultivars The model satisfactorily predicted the seasonal fluc-tuations in rice and wheat yields and the long-term trends for each crop over 20years though the predictions were more accurate with N fertilizer applicationthan with no added N The model also greatly overestimated the long-termdecline in soil organic carbon (SOC) and nitrogen (SON) The discrepancies inyield were partly due to inadequate model input data especially initial soil min-eral N and soil water prior to each crop but poor predictions of SOC and SONwere also due to the presence of only one pool of SOM in that version ofDSSAT (ver 35) DSSAT ver 40 includes the option of using a CENTURY-based SOM routine which has three SOM pools (passive slow and active micro-bial) (Gijsman et al 2002) However this is yet to be tested for RW system andthe CENTURY module does not simulate flooded soils
7 General discussion and conclusions
There are many reports of the evaluation of CERES-Rice in the RW areas oftropical and sub-tropical Asia but only a few for CERES-Wheat Most evaluationshave been limited to dates of anthesis and maturity and grain and biomass yieldsBoth models generally predicted anthesis and maturity within a few days of observeddates CERES-Rice predicted grain and biomass yields quite variably across a rangeof tropical to temperate locations with generally good predictions under optimal Nand water conditions (predicted values usually within 10ndash15 of observations) butnot under stress (N deficit water deficit low temperature) CERES-Wheat howevergenerally predicted the grain and biomass yields quite satisfactorily except at verylow yield levels (lt1 tha) or in high temperature environments
The variable performance of the models is probably due to a combination of defi-ciencies in model inputs experimental observations inclusion of non-modelled fac-tors (such as disease lodging pests storms) in model validation and insufficientcapture of model processes Possible input deficiencies include insufficient data forderivation of robust genetic coefficients lack of data on initial soil mineral N andwater and lack of proper soil characterisation (especially hydraulic properties)Few of the above reports of model evaluation state how these inputs were derivedor how genetic coefficients were determined
J Timsina E Humphreys Agricultural Systems 90 (2006) 5ndash31 27
The variable performance of the models and in particular of CERES-Rice high-lights the importance of proper calibration and evaluation in the environment ofinterest before applying them to evaluate management options This is especiallyimportant in the absence of reports on evaluation of model processes as reflectedin the modelsrsquo relative inabilities to predict a range of crop soil and waterparameters
Better evidence of the ability of the models to simulate a range of importantparameters other than yield such as time course of biomass production leaf areadevelopment N uptake soil water and mineral N dynamics and components ofthe water and N balances is also highly desirable to demonstrate the robustnessof model processes and to increase the confidence in the use of model There areno reports of rigorous evaluations of both models for variables related to increasingresource-use efficiency such as water and N management The results of the few stud-ies where some of these components have been determined are however generallyencouraging
Further model testing and improvements are thus needed under water and N lim-iting conditions before they can be used with confidence to explore managementoptions to increase resource use efficiency such as stretching irrigation intervalsand placement of N fertilizers for RW systems in both Asia and Australia Thisis particularly important because of the strong dependence of N transport and trans-formations on the hydrology of the system the risk of soil water deficit stress duringnon-ponded periods and the problem of cold damage during early pollen micro-spore in the Australian environment There is also a need to improve the abilityof CERES-Wheat to simulate the effect of high temperatures especially during grainfilling to examine trade-offs between yield and water use requirement by changingsowing date in both the tropical and sub-tropical RW regions of Asia and temperateAustralia In Australia the model also needs to be able to examine the trade-offbetween sowing late to avoid frost damage vs shortened grain filling during warmerweather
Only one study evaluated the performance of the DSSAT RW sequence modelbut with initial mineral N and soil water content based on observations inputtedfor each crop This work demonstrated that the model predicts the long-term grainyield of component crops fairly satisfactorily but not the long-term changes in SOCand SON suggesting that the sequence model needs further evaluation against datafrom a range of locations and management The results of long-term experimentscould be useful for this purpose however availability of adequate and good qualitydata availability is always a problem
In conclusion while it seems that CERES-Rice and CERES-Wheat have per-formed reasonably well in RW regions of Asia and Australia evaluations and appli-cations addressing resource use efficiency and sustainability issues are lacking Betterdata from field experiments designed to address these issues and further model eval-uations improvements and applications are needed to address the issues of yieldstagnation or decline and increasing yield gaps and finally to contribute to solvingthe resource and food security problems in RW systems of Asia and to regional econ-omies of Australia
28 J Timsina E Humphreys Agricultural Systems 90 (2006) 5ndash31
Acknowledgements
We thank FWT Penning de Vries (IWMI) and James W Jones (University ofFlorida) for reviewing an earlier draft and Ken Boote (University of Florida) forreviewing a later draft of the manuscript We are also grateful to Doug Godwin(Consultant to CSIRO Land and Water) for various discussions on the global per-formance of CERES models We are grateful to the Australian Centre for Interna-tional Agricultural Research for funding support for our research on RW system
References
Alociljha EC Ritchie JT 1991 A model for the phenology of rice In Hodges T (Ed) PredictingCrop Phenology CRC Press Boca Raton FL USA pp 181ndash189
Amien I Rejekingrum P Pramudia A Susanti E 1996 Effects of interannual climate variability andclimate change on rice yield in Java Indonesia Water Air Soil Pollut 92 29ndash39
Andales AA Batchelor WD Anderson CE Farnham DE Whigham DK 2000 Incorporatingtillage effects into a soybean model Agri Syst 66 69ndash98
Bachelet D Van Sickle J Gay CA 1993 The impacts of climate change on rice yield evaluation ofthe efficacy of different modelling approaches In Penning de Vries FWT et al (Eds) SystemsApproaches for Agricultural Development Kluwer Academic Publishers The Netherlands pp 145ndash174
Boonjung H 2000 Climate Variability and Rice Production in Rainfed Rice Area in NortheastThailand Risk Analysis and Management Applications pp 202ndash205 Available from lthttpwwwearthscapeorgrmainrsitesclchhtmlgt
Bouman BAM Penning de Vries FWT Wan Harun WS Timsina J Hartkamp AD 1994Optimising RW rotations under water-limited conditions Paper presented at the symposium lsquolsquoScenariostudies for the rural environmentrsquorsquo 12ndash15 September 1994 Wageningen Netherlands and the lsquolsquoThirdCongress of the European Society for Agronomy 18ndash22 September 1994 Podowa Italy 4 p
Buresh RJ de Datta SK 1990 Denitrification losses from puddled rice soils in the tropics Biol FertSoils 9 1ndash13
Buresh RJ Singh U Godwin DC Ritchie JT de Datta SK 1991 Simulating soil nitrogentransformations with CERES-Rice Agrotechnol Transf 13 7ndash10
Castrignano A Katerji N Karam F Mastrorilli M Hamdy A 1998 A modified version ofCERES-Maize model for predicting crop response to salinity stress Ecol Model 111 107ndash120
Dawe D Frolking S Li C 2004 Trends in ricendashwheat area in China Field Crops Res 87 89ndash95Gauch HG Hwang JTG Fick GW 2003 Model evaluation by comparison of model-based
predictions and measured values Agron J 95 1442ndash1446Gijsman AJ Hoogenboom G Parton WJ Kerridge PC 2002 Modifying DSSAT for low-input
agricultural systems using a SOMresidue module from CENTURY Agron J 94 462ndash474Godwin D Jones CA 1991 Nitrogen dynamics in soil-crop systems In Hanks RJ Ritchie JT
(Eds) Modeling Plant and Soil systems Agronomy Monograph 31 American Society of AgronomyMadison WI USA pp 287ndash321
Godwin D Singh U 1991 Modelling nitrogen dynamics in rice cropping systems In Deturck PPonnamperuma FN (Eds) Rice Production on Acid Soils of the Tropics Institute of FundamentalStudies Kandy Sri Lanka pp 287ndash294
Godwin D Singh U 1998 Nitrogen balance and crop response to nitrogen in upland and lowlandcropping systems In Tsuji GY Hoogenboom G Thornton PK (Eds) UnderstandingOptions for Agricultural Production Kluwer Academic Publishers Dordrecht The Netherlandspp 55ndash78
J Timsina E Humphreys Agricultural Systems 90 (2006) 5ndash31 29
Godwin DC Singh U Buresh RJ De Datta SK 1990 Modelling N dynamics in relation to ricegrowth and yield In Transactions of the 14th Int Cong Soil Sci Kyoto Japan Int Soc Soil SciJapan pp 320ndash325
Godwin DC Meyer WS Singh U 1994 Simulation of the effect of chilling injury and nitrogensupply on floret fertility and yield in rice Aust J Exp Agri 34 921ndash926
Godwin D Humphreys E Smith DJ Timsina J Xevi E Meyer WS 2002 Application ofSWAGMAN destiny to ricendashwheat cropping systems In Humphreys E Timsina J (Eds)Modelling Irrigated Cropping Systems with Special Attention to RicendashWheat Sequences and RaisedBed Planting Proceedings of a Workshop CSIRO Land and Water Griffith NSW Australia 25ndash28February 2002 CSIRO Land and Water Technical Report 2502 pp 69ndash82
Gunawardena TA Fukai S Blamey FPC 2003 Low temperature induced spikelet sterility in rice INitrogen fertilization and sensitive reproductive period Aust J Agri Res 54 937ndash946
Heng LK Baethgen WE Moutoonnet P 2000 The collection of a minimum dataset and theapplication of DSSAT for optimizing wheat yield in irrigated cropping systems pp 7ndash17 InOptimizing Nitrogen Fertilizer Application to Irrigated Wheat IAEA TECDOC-1164 2000 p 245
Hodges T Ritchie JT 1991 The CERES-Wheat phenology model In Hodges T (Ed) PredictingCrop Phenology CRC Press Boca Raton FL USA pp 133ndash143
Hoogenboom G Georgiev G Singh U 1997 Performance of the CERES-Rice model for threelocations in the Asian Region Report of the Workshop lsquolsquoClimate Variability AgriculturalProductivity and Food Security in the Asian Monsoon Regionrsquorsquo A Joint STARTWCRPIGBP-GCTE Workshop 19ndash22 February 1997 Bogor Indonesia START Report 19972 pp35ndash42
Hoogenboom G Jones JW Porter CH Wilkens PW Boote KJ Batchelor WD Hunt LATsuji GY 2004 DSSAT 40 vol 1 Overview ICASA University of Hawaii Honolulu USA
Humphreys E Edraki M Bethune M 2003 Deep drainage and crop water use for irrigated annualcrops and pastures in Australia ndash a review of determinations in fields and lysimeters CSIRO Land andwater Technical Report 1403 33 pp
Humphreys E Smith DJ White RJG Xevi E Godwin DC 2003 MaizeMan ndash a decision supportsystem for water and nitrogen management In Fifth Australian Maize Conference Proceedings 18thndash20th February 2003 Toowoomba Queensland Australia pp 127ndash134
Humphreys E Meisner C Gupta R Timsina J Beecher HG Yong Lu T Yadvinder-Singh GillMA Masih I Jia Guo Z Thompson JA 2004 Water saving in ricendashwheat systems PlantProduction Science 8 242ndash258
Humphreys E Smith DJ Fattore A Bhuiyan AM Fawcett BJ 2005 Quantifying andmaximising the benefits of crops after rice CRC for Sustainable Rice Production Final Report Project1205 Yanco NSW Australia
Hundal SS Kaur P 1997 Application of the CERES-Wheat model to yield predictions in the irrigatedplains of the Indian Punjab J Agric Sci Cambridge 129 13ndash18
Hunt LA Boote KJ 1998 Data for model operation calibration and validation In Tsuji GYHoogenboom G Thornton PK (Eds) Understanding Options for Agricultural ProductionSystems Approaches for Sustainable Agricultural Development Kluwer Academic Publishers GreatBritain pp 9ndash39
Jintrawat A 1995 A decision support system for rapid assessment of lowland rice-based croppingalternatives in Thailand Agri Syst 47 245ndash258
Jones CA Kiniry JR (Eds) 1986 CERES-Maize A Simulation Model of Maize Growth andDevelopment Texas AampM University Press College Station TX p 194
Jones JW Hoogenboom G Porter CH Boote KJ Batchelor WD Hunt LA Wilkens PWSingh U Gijsman AJ Ritchie JT 2003 The DSSAT cropping system model Eur J Agron 18235ndash265
Kobayashi K Salam MU 2000 Comparing simulated and measured values using mean squareddeviation and its components Agron J 92 345ndash352
Kropff MJ Williams RL Horie T Angus JF Singh U Centeno HG Cassman KG 1994Predicting yield potential of rice in different environments In Humphreys et al (Eds) Temperate Rice
30 J Timsina E Humphreys Agricultural Systems 90 (2006) 5ndash31
ndash Achievements and Potential Proceedings of Temperate Rice Conference Yanco NSW Australiapp 657ndash663
Ladha JK Pathak H Tirol-Padre A Dawe D Gupta RK 2003 Productivity trends in intensivericendashwheat cropping systems in Asia In Ladha JK Hill JE Duxbury JM Gupta RK BureshRJ (Eds) Improving the Productivity and Sustainability of RicendashWheat Systems Issues andImpactsrsquo ASA Special Publication 65 (ASA Inc CSSA Inc SSSA Inc Madison USA) pp 45ndash76
Mahmood Meo M Legates DR Morrissey ML The CERES-Rice model-based estimates of potentialmonsoon season rainfed rice productivity in Bangladesh The Professional Geographer 55 259ndash273
Mall RK Aggarwal PK 2002 Climate change and rice yields in diverse agro-environments of India IEvaluation of impact assessment models Climate Change 52 315ndash330
Matthews RB Wassmann R Arah J 2000a Using a cropsoil simulation model and GIS techniquesto assess methane emissions from rice fields in Asia I Model development Nutr Cycl Agroecosyst58 141ndash159
Matthews RB Wassmann R Buendia LV Knox JW 2000b Using a cropsoil simulation modeland GIS techniques to assess methane emissions from rice fields in Asia II Model validation andsensitivity analysis Nutr Cycl Agroecosyst 58 161ndash177
Meyer WS White RJG Smith DJ Baer BD 1994 Monitoring a rice crop to validate the CERES-Rice model CSIRO Technical Memorandum 9413 September 1994 26 p
Nain AS Dadhwal VK Singh TP 2002 Real time wheat yield assessment using technology trendand crop simulation model with minimal data set Curr Sci 82 1255ndash1258
OrsquoLeary GJ 2000 Can contemporary wheat models simulate grain yield accurately in low-potentialenvironments In White JW Grace PR (Eds) Modelling Extremes of Wheat and maize CropPerformance in the Tropics Proceedings of a Workshop CIMMYT El Batan Mexico 19ndash22 April1999 NRG-GIS Series 00-01 Mexico DF CIMMYT pp 5ndash10
Otter-Nacke S Godwin D Ritchie JT 1986 Testing and Validating the CERES-Wheat Model inDiverse Environments IFDC Muscle Shoals AL USA p 147
Paroda RS Woodhead T Singh RB 1994 Sustainability of RW Production Systems in Asia RAPAPub 199411 FAO Bangkok Thailand 209 p
Pathak H Ladha JK Aggarwal PK Peng S Das S Yadvinder-Singh Bijay-Singh Kamra SKMishra B Sastri ASRAS Aggarwal HP Das DK Gupta RK 2003 Trends of climaticpotential and on-farm yields of rice and wheat in the Indo-Gangetic plains Field Crops Res 80 223ndash234
Pathak H Timsina J Humphreys E Godwin DC Bijay-Singh Shukla AK Singh U MatthewsRB 2004 Simulation of rice crop performance and water and N dynamics and methane emissionsfor rice in northwest India using CERES-Rice model CSIRO Land and Water Technical Report 2304 CSIRO Land and Water Griffith NSW 2680 Australia 111 p Available from ltwwwclwcsir-oaupublicationstechnical2004gt
Penning de Vries FWT Jansen DM ten Berge HFM Bakema A 1989 Simulation ofEcophysiological Processes of Growth in Several Annual Crops PUDOC Wageningen TheNetherlands p 271
Porter CH Hoogenboom G Batchelor WD Jones JW Gijsman AJ 2003 DSSAT v40 CropModels Overview of changes relative to DSSAT v35 University of Florida Gainesville USA
Rao GSLHV Sebastian S Subash N 2002 Crop growth simulation models of rice under humidclimates Available from lthttpwwwcommonorthwestealthknowledgenortheasttMetCDChap-ter7C7P06htmgt
Ritchie JT 1998 Soil water balance and plant stress In Tsuji GY Hoogenboom G Thornton PK(Eds) Understanding Options for Agricultural Production Kluwer Academic Publishers DordrechtThe Netherlands pp 41ndash54
Ritchie JT NeSmith DS 1991 Temperature and crop development In Hanks RJ Ritchie JT(Eds) Modeling Plant and Soil Systems Agronomy Monograph 31 American Society of AgronomyMadison WI USA pp 5ndash29
Ritchie JT Singh U Godwin D Bowen WT 1998 Cereal growth development and yield InTsuji GY Hoogenboom G Thornton PK (Eds) Understanding Options for AgriculturalProduction Kluwer Academic Publishers Dordrecht The Netherlands pp 79ndash98
J Timsina E Humphreys Agricultural Systems 90 (2006) 5ndash31 31
Salam MU Jones JW Kobayashi K 2001 Predicting nursery growth and transplanting shock inrice Exp Agri 37 65ndash81
Saseendran SA Hubbard KG Singh KK Mendiratta N Rathore LS Singh SV 1998aOptimum transplanting dates for rice in Kerala India determined using both CERES v30 andClimProb Agron J 90 185ndash190
Saseendran SA Singh KK Rathore LS Rao GSLHVP Mendiratta N Lakshmi Narayan KSingh SV 1998b Evaluation of the CERES-Rice v30 model for the climate conditions of the stateof Kerala India Meterol Appl 5 385ndash392
Seino H 1995 Implications of climate change for crop production in Japan In Climate Change andAgriculture Analysis of Potential International Impacts ASA Special Publication Number 59 ASAMadison WI pp 293ndash306
Singh U 1994 Nitrogen management strategies for lowland rice cropping systems In Proceedings of theInternational Conference on Fertilizer Usage in the Tropics (FERTROP) Malaysian Society of SoilScience Kuala Lumpur Malaysia pp 110ndash130
Singh U Wilkens PW Chude V Oikeh S 1999 Predicting the effect of nitrogen deficiency on cropgrowth duration and yield In Proceedings of the Fourth International Conference on PrecisionAgriculture ASA-CSSA-SSSA Madison WI USA pp 1379ndash1393
Thornton PK Hansen JW 1996 A note on regressing real-world data on model output Agri Syst 411ndash414
Timsina J Connor DJ 2001 Productivity and management of RW systems issues and challengesField Crops Res 69 93ndash132
Timsina J Bouman BAM Penning de Vries FWT Van Kraalingen DWG Wan Sulaiman WanHarun 1994 Modelling tropical RW systems In Proceedings of SARP lsquolsquoApplication Workshoprsquorsquo onthe Application Program lsquoAgroecological Zonation and Characterisationrsquo and lsquoCrop rotationoptimisationrsquo IRRI Philippines pp 58ndash70
Timsina J Singh U Singh Y Lansigan FP 1995 Addressing sustainability of RW systems testingand applications of CERES and SUCROS models In Proceedings of the International Rice ResearchConference 13ndash17 February 1995 IRRI Los Banos Philippines pp 633ndash656
Timsina J Singh U Singh Y 1996 Addressing sustainability of RW systems analysis of long-termexperimentation and simulation In Kropff et al (Eds) Applications of Systems Approaches at theField Level Kluwer Academic Publishers Dordrecht The Netherlands pp 383ndash397
Timsina J Adhikari B Ganesh-KC 1997 Modelling and simulation of rice wheat and maize crops forselected sites and the potential effects of climate change on their productivity in Nepal ConsultancyReport submitted to Ministry of Agric Harihar Bhawan Kathmandu Nepal 55 p
Timsina J Singh U Badaruddin M Meisner C 1998 Cultivar nitrogen and moisture effects on aRW sequence experimentation and simulation Agron J 90 119ndash130
Timsina J Singh U Godwin D Humphreys E 2004 Modelling chilling injury in rice using CERES-Rice ver 41 In CD-Rom Proceedings of the International Rice Cold Tolerance Workshop 22ndash23July 2004 Canberra ACT Australia
Timsina J Humphreys E Godwin D Matthews S 2005 Evaluation of options for increasing waterproductivity of irrigated wheat using CSM-Wheat V40 In MODSIM05 Conference MelbourneAustralia
Tongyai C 1994 Impact of climate change on simulated rice production in Thailand In Rosenzweig CIglesias A (Eds) Implications of Climate Change for International Agriculture Crop ModellingStudy US Environmental Protection Agency EPA 230-B-94-003 Washington DC
Tsuji GY Uehara G Balas S 1994 DSSAT v3 vol 2 University of Hawaii Honolulu Hawaii p 284Williams RL Angus JF 1994 Deep water protects high-nitrogen crops from low-temperature
damage Aust J Exp Agri 34 927ndash932Willmott CJ 1982 Some comments on the evaluation of model performance Bull Am Meterol Soc
63 1309ndash1313Willmott CJ Ackleson SG Davis RE Feddema JJ Klink KM Legates DR OrsquoConnell J
Rowe CM 1985 Statistics for the evaluation and comparison of models J Geophys Res 90 (C5)8995ndash9005
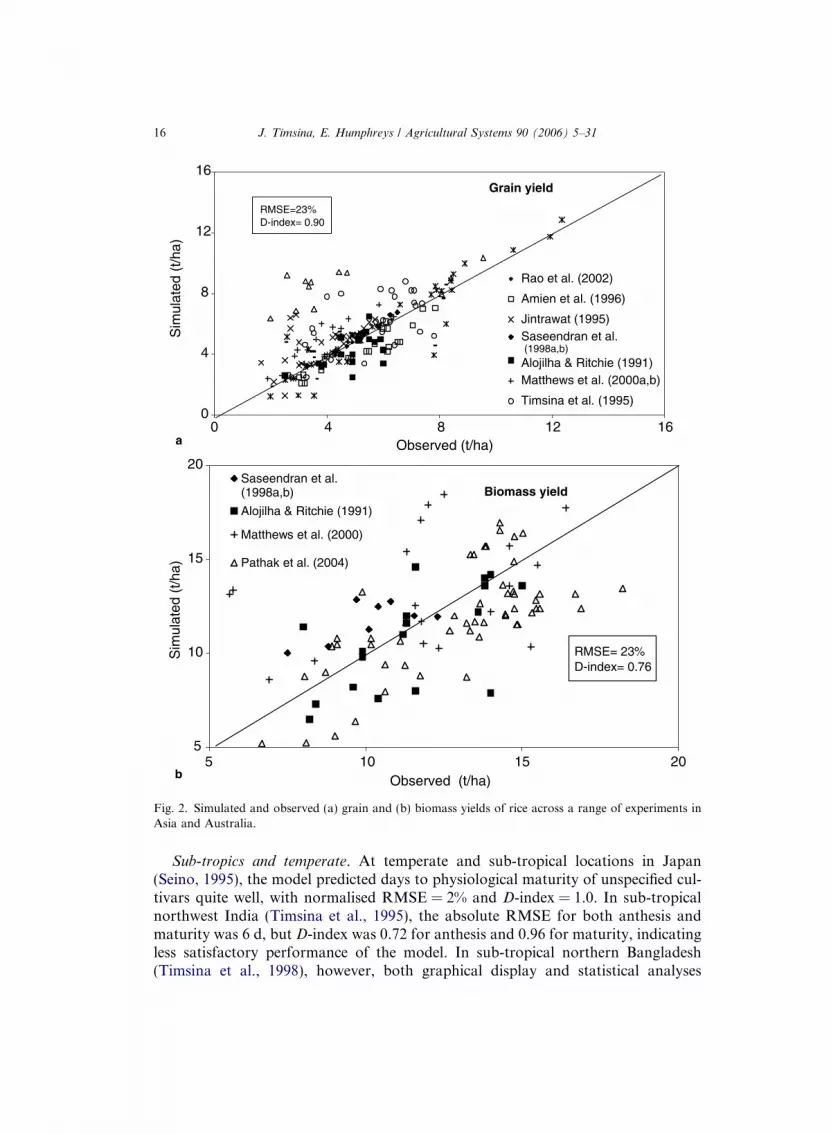
a
Grain yield
0
4
8
12
16
0 4 8 12 16Observed (tha)
Sim
ulat
ed (
tha)
Rao et al (2002)
Amien et al (1996)
Jintrawat (1995)Saseendran et al(1998ab)Alojilha amp Ritchie (1991)Matthews et al (2000ab)
Timsina et al (1995)
RMSE=23D-index= 090
b
Biomass yield
5
10
15
20
5 10 15Observed (tha)
Sim
ulat
ed (
tha)
20
Saseendran et al(1998ab)
Alojilha amp Ritchie (1991)
Matthews et al (2000)
Pathak et al (2004)
RMSE= 23D-index= 076
Fig 2 Simulated and observed (a) grain and (b) biomass yields of rice across a range of experiments inAsia and Australia
16 J Timsina E Humphreys Agricultural Systems 90 (2006) 5ndash31
Sub-tropics and temperate At temperate and sub-tropical locations in Japan(Seino 1995) the model predicted days to physiological maturity of unspecified cul-tivars quite well with normalised RMSE = 2 and D-index = 10 In sub-tropicalnorthwest India (Timsina et al 1995) the absolute RMSE for both anthesis andmaturity was 6 d but D-index was 072 for anthesis and 096 for maturity indicatingless satisfactory performance of the model In sub-tropical northern Bangladesh(Timsina et al 1998) however both graphical display and statistical analyses
J Timsina E Humphreys Agricultural Systems 90 (2006) 5ndash31 17
suggested very good agreement for anthesis and maturity dates of BR11 and BR14with normalised RMSE of 5 and 4 and D-index of 098 and 096 respectively Insouth India (Saseendran et al 1998ab) prediction of anthesis was less accurate withRMSEs of Jaya and IR8 of 44 and 42 d and D-index = 065 and 084 respectively
Comparison with other models Mall and Aggarwal (2002) compared the perfor-mance of CERES-Rice and ORYZA1N at 11 locations from north to south Indiaincluding four in northwest India Predicted values were within 15 of observationsfor both models with similar RMSE of 45 d (CERES-Rice) and 48 d (ORYZA1N)In another study CERES-Rice ORYZA1 ORYZA-European RICAM SIMRIWand TRYM were compared in four diverse rice-growing environments in Asia usingmean squared deviation (MSD) which ranged from 87 to 238 d for growth durationCERES-Rice RICAM SIMRIW and TRYM had smaller MSDs than ORYZAand all models simulated growth duration well in China but not in the Philippinesand Japan (M Salam personal communication)
All environments Combined analysis of all data from the 4ndash6 studies shows rea-sonable predictive capability of CERES-Rice for the number of days to anthesisand maturity (Fig 1 Table 4) There is slightly greater precision for prediction ofmaturity date than anthesis as reflected in the smaller scatter about the 11 lineintercept closer to 0 and slope closer to 10 and slightly higher R2 and lower norma-lised RMSE Whether any greater precision in predicting maturity than anthesis dateactually reflects the model capability or relative accuracy of determination of actualanthesis and maturity dates in the field is an interesting question worthy of furtherinvestigation Few studies report how they actually determined these stages in thefield
42 Grain and biomass yields and yield components
Tropics Amien et al (1996) reported that the CERES-Rice (ver 3) under-pre-dicted grain yield by 10ndash20 at all locations in Indonesia except at Sukamandi inwest Java due to underprediction of grain weight (R2 = 083 RMSE = 098 tha)In different locations in Thailand the model predicted grain and biomass yields quitewell despite poor prediction of the dates of phenological events (Tongyai 1994)(Table 4) Jintrawat (1995) however reported that both grainsm2 and single grainweight as well as phenological events were predicted well leading to good predictionsof grain yield in Thailand Using MERES (with CERES-Rice growth routine) Mat-thews et al (2000b) reported fairly good prediction of grain and above-ground bio-mass yield (RMSE = 11 and 39 tha respectively) at Los Banos Philippines andHangzhou China except for three treatments with mid-season drainage in the dryseason at Los Banos
Sub-tropics In Kerala India Saseendran et al (1998ab) predicted grain andstraw yields of Jaya and IR8 within 3 and 27 of measured yields (RMSE = 02and 19 tha) with D-index of 099 and 056 respectively (Table 4) Rao et al(2002) also reported good yield prediction in Kerala (RMSE = 02 tha D-index = 099) for all transplanting dates for three cultivars in one year Howeverin another year in which heavy rains and incidences of gallmidge brownspot and
18 J Timsina E Humphreys Agricultural Systems 90 (2006) 5ndash31
rice bug during flowering stage resulted in high sterility the data were not used formodel evaluation In northern Bangladesh simulated yields of BR14 and BR11 wereeither over or underestimated (RMSE = 12 tha D-index = 094) with large under-predictions for 0 N (Timsina et al 1998) Some of the discrepancy at high N rateswas due to insect damage and lodging which the model is unable to predict Mah-mood et al (2003) also reported satisfactory performance of the model withobserved yields from 29 to 67 tha and simulated from 26 to 73 tha and RMSEof 13 tha for central and northern Bangladesh
In northwest India RMSE for grain yield was 17 tha and D-index was 079indicating large discrepancy between simulated and observed data (Timsina et al1995) largely due to inaccurate prediction of dates of phenological events Pathaket al (2004) evaluated CSM-CERES-Rice ver 40 using data from a range of waterregimes (saturated to frequent intermittent wetting and drying to prolonged mid-sea-son drying) and N (0 to recommended to supra-optimal dose) management treat-ments for three RW growing environments in northwest India There was goodagreement for grain yield (RMSE = 072 tha D-index = 095) and reasonableagreement for dry matter yield (RMSE = 26 tha D-index = 083) in well-fertilized(N) treatments but generally poor agreement for the 0 N treatments
Temperate In Japan simulated grain yields at three sites were within 0ndash5 ofobserved yields (Seino 1995) In one site in southern Australia simulated grainand total biomass yields were within 10 and 3 respectively of the observed yieldsin 1 year but across several years and sites there were large discrepancies especiallyin cold years due to the modelrsquos inability to simulate sterility induced by cold dam-age (Godwin et al 1994 Meyer et al 1994)
All environments Combined analysis of 11 data sets for grain and 4 sets for bio-mass yield revealed that the data were more scattered around 11 line intercept andslope closer to 0 and 10 respectively absolute RMSE lower and D-index higher forgrain yield than biomass yield indicating better accuracy and precision for formerthan the latter Normalised RMSE for both traits was 23 while absolute RMSEand D-index were 114 and 274 tha and 090 and 076 for grain and biomass yieldrespectively Accuracy and precision of their prediction was however not as good asanthesis and maturity dates (Fig 2 Table 4) However these data sets also includecrops affected by lodging and insect damage at high N rate heavy rain during anthe-sis and grain filling and cold damage When these crops are removed from the anal-ysis the precision of the model predictions is increased with normalisedRMSE = 14 and D-index = 096 and intercept and slope became closer to 0 and10 respectively for the grain yield
Comparison with other models Bachelet et al (1993) compared observed grainyields with yields predicted by CERES-Rice and MACROS (Modules of AnnualCrop Growth Simulator) (Penning de Vries et al 1989) under various climatesUsing default coefficients predictions by both models were fairly reliable althoughthe fit was closer for MACROS than CERES With derived coefficients however thereverse was the case Kropff et al (1994) reported that ORYZA1 CERES-RiceSIMRIW and TRYM overestimated yields in the wet season at IRRI and withthe exception of ORYZA1 predicted LAI inaccurately in the dry and wet season
J Timsina E Humphreys Agricultural Systems 90 (2006) 5ndash31 19
at IRRI and at Kyoto Japan and Yanco Australia Mall and Aggarwal (2002)however concluded that both CERES-Rice and ORYZA1N predicted grain yieldssatisfactorily (within plusmn15) especially for yields above 4 tha with RMSE of 07and 06 tha respectively Both models predicted grain number fairly accurately overthe range 15000ndash32000 grainsm2 with ORYZA1N performing better thanCERES-Rice at lower but the latter performing better at higher yield levels Bothmodels were unable to adequately simulate growth and yield under N and water def-icit stresses
In another study with six models all models closely predicted yields for early sow-ing at Moroika Japan and Nan Chang China but not for late sowing at Nan Changand for the dry season at IRRI The largest deviations were for SIMRIW andORYZA1 followed in order by TRYM CERES-Rice ORYZA-European andRICAM For harvest index RICAM and ORYZA1 had the largest MSD for NanChang early and late seasons while CERES-Rice had the largest MSD at MoroikaCERES-Rice also had the highest deviations for biomass yield (M Salam personalcommunication)
43 Other variables
Growth Only a few published reports are available on the performance ofCERES-Rice in predicting in-season biomass and leaf area Mall and Aggarwal(2002) reported good agreement for LAI using both CERES-Rice and ORYZA1Nwith slightly better agreement by CERES Both models underpredicted peak LAIdue to limited calibration and inaccurate initialisation of soil mineral N and soilwater Meyer et al (1994) in Australia also reported underestimation of peakLAI and panicle density by CERES-Rice (ver 21) although it predicted the timeof complete canopy closure (LAI 3) reasonably accurately Salam et al (2001)reported that CERES-Rice overestimated root and leaf dry matter and underesti-mated culm dry matter during the 30-d period of seedling growth and overestimatedthe duration of the transplanting shock period With the inclusion of new nurserygrowth and transplanting shock routines simulations of seedling growth and thetransplanting shock period improved greatly but not the yield response to trans-planting shock
Nitrogen With ver 20 Godwin et al (1990) and Buresh et al (1991) reportedpredicted N loss through urea of 6ndash58 vs observed loss of 5ndash49 kgha from eight irri-gated lowland rice experiments at three sites in the Philippines with treatments rang-ing from continuous flooding to alternate wetting and drying (AWD) In most casesespecially in continuously-flooded soil with low percolation rates (lt02 cmd) themodel predicted negligible denitrification loss consistent with field measurementsfrom 15N balance (Buresh and de Datta 1990) In the AWD treatments howeverthe predicted losses exceeded those from measurements due to overprediction of soildrying during periods of water deficit insufficient lag time for the onset of nitrifica-tion following soil drying and overestimation of the denitrification upon refloodingBuresh et al (1991) also reported that CERES-Rice was sensitive to above- andbelow-ground residue inputs initial soil ammoniumndashN concentration and N
20 J Timsina E Humphreys Agricultural Systems 90 (2006) 5ndash31
mineralisation rate Pathak et al (2004) evaluated the model (ver 40) for soil min-eral N and loss processes from rice fields under RW systems for Delhi and Punjab innorthwest India Simulation of soil mineral N in the surface layer (0ndash15 cm) was gen-erally poor but the model predicted N leaching losses similar to those in field exper-iments reported in the literature It also predicted higher denitrification and lowerammonia volatilisation losses for urea applied at 120 kg Nha compared toobserved losses
Using ver 20 Godwin et al (1990) and Buresh et al (1991) also reported pre-dicted crop N uptake of 40ndash145 vs observed uptake of 35ndash150 kgha from the abovesame experiments and treatments in the Philippines With ver 35 Timsina et al(1998) reported that both observed and simulated total crop N uptake by two ricecultivars ranged from 48ndash175 kgha with absolute RMSE of 17 kgha in northernBangladesh while with ver 40 Pathak et al (2004) reported good agreement espe-cially for grain N uptake with RMSE of 21 kgha and D-index of 086 in a RW sys-tem in Delhi
In southern Australia too with ver 21 predicted total biomass and N uptakewere within 3 of the observed values but N partitioning between straw and grainwas poor (Meyer et al 1994)
Methane emission With MERES Matthews et al (2000ab) reported good agree-ment for seasonal patterns and quantities of methane emission from rice straw andgreen manure treatments for a dry season crop at IRRI (simulated 0ndash450 vsobserved 0ndash480 kg CH4-Cha) and for seasonal methane emissions at Maligaya(simulated 150ndash450 vs observed 125ndash570 kg) Philippines and Hangzhou China(simulated 30ndash200 vs observed 70ndash360 kg) though with rice straw at IRRI themodel slightly overpredicted the plume of methane at the second drainage just beforeharvest They concluded that rice yield predicted by MERES was sensitive to rootdeath coefficient specific root exudation rate root transmissivity green manureaddition initial size of oxidised alternative electron acceptor pool seasonal temper-ature crop duration floodwater depth drainage period type of organic amend-ments phosphogypsum and percolation rate In a recent study however MERESgreatly overestimated the emissions from a rice field in a RW system in Delhi(Pathak et al 2004)
Evapotranspiration and deep drainage Using ver 21 Meyer et al (1994) reportedthat in temperate southern NSW the pattern of observed ET matched predicted ETwithin 2 over the whole season Using ver 40 Pathak et al (2004) also reportedconsistency between simulated ET and deep drainage from rice fields in Delhi andPunjab and typical values reported in the literature
Cold damage Cold damage due to low temperature during the early pollen micro-spore (EPM) stage is a common occurrence in Australian rice fields with severestdamage with high N fertility and shallow water (Williams and Angus 1994 Guna-wardena et al 2003) Using ver 21 Meyer et al (1994) reported large discrepanciesbetween observed and simulated yields with most discrepancies when low tempera-tures occurred during EPM Godwin et al (1994) developed a chilling injury routine(ver 21C) and obtained good agreement between simulated and observed yields forsprinkler irrigation treatments affected by cold damage That version did not take
J Timsina E Humphreys Agricultural Systems 90 (2006) 5ndash31 21
into account the effects of floodwater temperature and assimilate availability on pol-len cell survival throughout the chilling event (Doug Godwin personal communica-tion) Moreover that version was not tested further against other data setsConsequently Timsina et al (2004) developed new floodwater temperature and chill-ing injury routines and incorporated them into ver 40 using the most recent under-standing of the mechanisms of chilling injury in rice The new version (ver 40C)improved the ability to simulate rice response to low temperature compared withver 21C
5 Evaluation of CERES-Wheat
CERES-Wheat has been evaluated in many places in north and south AmericaEurope and Africa but only in few parts of Asia and Australia As for CERES-Rice most of those studies provided only qualitative or graphical analysis withoutcalculating any statistical parameters
51 Phenology
Prediction of wheat phenology was evaluated in three studies in tropical and sub-tropical RW regions of IGP in south Asia one in temperate and sub-tropical regionin Japan and one in southeast temperate Australia (Fig 3 Table 5) For the IGPTimsina et al (1995) reported that the model overestimated the time to anthesis(RMSE = 86 d D-index = 087) and maturity (RMSE = 87 d D-index = 099) ofRR21 and HD2009 at Pantnagar while Hundal and Kaur (1997) reported much bet-ter agreement (RMSE = 40 and 38 d D-index = 084 and 093 respectively) forHD2329 at Ludhiana both in NW India In northern Bangladesh (Timsina et al1998) also prediction of anthesis of Kanchan and Sowgat (RMSE = 20 d D-index = 090) was good while the date of maturity was generally overestimated(RMSE = 35 d D-index = 052) Seino (1995) reported that CERES-Wheat pre-dicted the days from sowing to physiological maturity within 1ndash25 of observedin northern (temperate) and central (sub-tropical) Japan In southern NSW Humph-reys et al (2005) reported that ver 35 predicted anthesis and maturity of Janz andYecora quite well in 2 out of 3 experiments Taken all data sets together predictionsfor both anthesis and maturity were quite similar though there was a tendency forbetter prediction for maturity as indicated by slightly higher R2 and D-index lowernormalised RMSE and better spread of data around 11 line (Fig 3 Table 5)
52 Growth and grain yield
Evaluation of CERES-Wheat and Wheat-W in a warm tropical environment atIRRI suggested that both models predict grain yield poorly due to high temperaturesduring the entire crop cycle especially during emergence and grain-filling period(Timsina et al 1995) Evaluation of CERES-Wheat for growth and grain yieldof wheat in the sub-tropical environment of northwest India however showed
a
Anthesis
70
80
90
100
110
70 80 90 100 110
Observed (d)
Sim
ulat
ed (
d)
Hundal amp Kaur (1997)
Timsina et al (1998)
Timsina et al (1995)
RMSE= 5D-index= 094
b
Maturity
100
110
120
130
140
150
100 110 120 130 140 150
Observed (d)
Sim
ulat
ed (
d)
Hundal amp Kaur (1997)
Timsina et al (1998)
Timsina et al (1995)
RMSE= 4D-index= 099
Fig 3 Simulated and observed days to (a) anthesis and (b) maturity of wheat across a range ofexperiments in Asia
22 J Timsina E Humphreys Agricultural Systems 90 (2006) 5ndash31
reasonable predictive ability (Timsina et al 1995 Hundal and Kaur 1997) Hundaland Kaur (1997) concluded that the model can be used for yield prediction for thecentral irrigated plains of the Indian Punjab but that there is also a need for closerexamination of the quantitative relationships governing the partitioning of photo-synthates into biomass and grain yield Similarly in sub-tropical northern Bangla-desh yield predictions for eight treatment combinations of N water and sowing
Table 5Evaluation results for CERES-Wheat predictions of phenology and grain and biomass yields for various data sets (simulated and observed data are fromvarious studies reported under lsquodata setsrsquo)
Data sets N Xobs (SD) Xsim (SD) a b R2 AbsoluteRMSE
RMSEs RMSEu RMSE()
D-index
Grain yield (tha)
Seino (1995) 3 34 (07) 32 (06) 027 097 087 027 019 019 8 094Timsina et al (1995) 26 34 (13) 35 (11) 026 110 085 051 027 044 15 096Timsina et al (1998) 24 31 (15) 33 (16) 014 090 097 035 021 028 11 099Hundal and Kaur (1997) 29 42 (06) 39 (07) 150 070 063 053 031 042 12 084Nain et al (2002) 30 28 (09) 28 (09) 012 096 096 019 008 019 7 099Godwin et al (2002) 6 46 (09) 45 (09) 003 101 099 011 008 007 2 100Heng et al (2000) 19 46 (18) 48 (16) 009 098 079 079 037 070 17 094All data sets 137 36 (14) 36 (13) 015 096 088 048 010 022 13 097
Biomass yield (tha)
Hundal and Kaur (1997) 29 106 (13) 116 (14) 393 057 040 154 111 106 15 066Heng et al (2000) 19 116 (39) 107 (31) 048 114 080 202 150 134 17 091All data sets 48 110 (27) 113 (22) 086 090 058 174 098 144 16 086
Anthesis (d)
Timsina et al (1995) 10 822 (120) 885 (126) 864 083 077 856 635 574 10 087Timsina et al (1998) 24 778 (34) 796 (27) 188 121 096 201 193 055 3 090Hundal and Kaur (1997) 29 937 (60) 932 (44) 180 102 056 396 274 286 4 084All data sets 64 857 (98) 872 (86) 427 103 081 449 255 369 5 094
Maturity (d)
Timsina et al (1995) 13 1418 (502) 1411 (456) 168 102 097 866 240 832 6 099Timsina et al (1998) 24 1105 (27) 1130 (15) 3592 066 013 354 327 135 3 052Hundal and Kaur (1997) 29 1297 (77) 1277 (71) 505 098 082 384 239 306 3 093All data sets 66 1251 (252) 1250 (238) 479 104 096 508 191 471 4 099
N number of data pairs Xobs mean of observed values Xsim mean of simulated values SD standard deviation a slope of linear relation between simulatedand observed values b intercept of linear relation between simulated and observed values R2 adjusted linear correlation coefficient between simulated andobserved values RMSE root mean square error
J
Tim
sina
E
H
um
ph
reys
A
gricu
ltura
lS
ystem
s9
0(
20
06
)5
ndash3
123
24 J Timsina E Humphreys Agricultural Systems 90 (2006) 5ndash31
dates were quite good (RMSE = 04 tha D-index = 099) (Timsina et al 1998) Inanother study in India Bangladesh and China (Heng et al 2000) there were reason-ably good predictions of grain and biomass yields as judged by several statisticalparameters (low intercepts slope = 098 R2 = 079 normalised RMSE = 17 andD-index = 094) All these studies in the sub-tropical environments were carriedout in the IGP where RW systems predominate
Seino (1995) reported predicted grain yields within 1ndash2 of observed(RMSE = 027 tha D-index = 094) in several locations in Japan Otter-Nackeet al (1986) validated an early version of the model for a range of cultivars in manycountries including temperate rainfed environments across Australia They reportedthat the model explained about 60 of the variation in grain yield but the evalua-tion for time course of LAI and above ground biomass N uptake and root weightresponses to N rate showed variable results Humphreys et al (2005) evaluated ver30 with three cultivars in field and lysimeter experiments in the rice-growing regionof southern Australia where the model performed well for grain yield Taken all datasets together accuracy and precision of predictions of grain yield was better thanbiomass yield as reflected by better spread of data around 11 line intercept andslope closer to 0 and 10 respectively lower RMSE and higher R2 and D-indexfor grain than biomass yield (Fig 4 Table 5)
53 Other variables
Humphreys et al (2005) reported that the ver 30 predicted well the time courseof biomass production and LAI volumetric soil water content and root lengthdensity and daily ET of three cultivars in rice-growing areas of southern AustraliaRecently with CSM-CERES-Wheat (ver 40) Timsina et al (2005) reported sim-ulated deep drainage losses beyond 09 m depth of 0ndash165 mm and ET of 338ndash662 mm for a range of sowing dates and irrigation methods Deep drainage washigher for flood irrigation compared with sprinkler irrigation and rainfed but ETwas higher for sprinkler Both deep drainage and ET were within the ranges ofobserved values reported by Humphreys et al (2003ab) Comprehensive evalua-tions of this nature are important to demonstrate robustness of the model pro-cesses to simulate the effect of water stress on growth and yield for sub-tropicaland temperate environments
54 Model comparisons
Nain et al (2002) used combined analyses from the technology-trend modeland CERES-Wheat for several locations in India and reported a mean grainyield of 282 tha RMSE of 02 tha and D-index of 099 indicating good perfor-mance of the model under lsquolsquohighrsquorsquo input conditions Godwin et al (2002) com-pared the predictions of CERES-Wheat (ver 35) and SWAGMAN-Destinyagainst data from irrigated wheat in southern Australia and concluded that bothmodels predict in-season LAI total biomass root length density and soil watercontent and final grain yield quite satisfactorily in temperate Australia In con-
a
Grain yield
0
2
4
6
8
0 42 6 8
Observed (tha)
Sim
ulat
ed (
tha)
Hundal amp Kaur(1997)Timsina et al(1998)Timsina et al(1996)Nain et al(2002)Heng et al(2000)Timsina et al(1995)Seino (1995)
Godwin et al(2002)
RMSE=13D-index= 097
b
Biomass yield
4
8
12
16
20
4 8 12 16 20
Observed (d)
Sim
ulat
ed (
d)
Hundal amp Kaur (1997)
Heng et al (2000)
RMSE=16D-index= 086
Fig 4 Simulated and observed grain and biomass yields of wheat across a range of experiments in Asiaand Australia
J Timsina E Humphreys Agricultural Systems 90 (2006) 5ndash31 25
trast after comparing the accuracy of eight simulation models for several lowyield potential temperate environments including Australia OrsquoLeary (2000)concluded that yield underestimation under stressed conditions was a common
26 J Timsina E Humphreys Agricultural Systems 90 (2006) 5ndash31
problem of all models and suggested the need of better models especially forvery low yield levels (lt1 tha)
6 Evaluation of the CERES RW sequence model
Timsina et al (1996) the only reported model validation study for RW systemused 20 yearsrsquo experimental and historical weather data from Pantnagar to val-idate the DSSAT sequence model (ver 35) In the experiment planting datescultivars and initial conditions varied across years so the model was manuallyreset prior to each season using observed initial soil mineral N and soil waterplanting dates and cultivars The model satisfactorily predicted the seasonal fluc-tuations in rice and wheat yields and the long-term trends for each crop over 20years though the predictions were more accurate with N fertilizer applicationthan with no added N The model also greatly overestimated the long-termdecline in soil organic carbon (SOC) and nitrogen (SON) The discrepancies inyield were partly due to inadequate model input data especially initial soil min-eral N and soil water prior to each crop but poor predictions of SOC and SONwere also due to the presence of only one pool of SOM in that version ofDSSAT (ver 35) DSSAT ver 40 includes the option of using a CENTURY-based SOM routine which has three SOM pools (passive slow and active micro-bial) (Gijsman et al 2002) However this is yet to be tested for RW system andthe CENTURY module does not simulate flooded soils
7 General discussion and conclusions
There are many reports of the evaluation of CERES-Rice in the RW areas oftropical and sub-tropical Asia but only a few for CERES-Wheat Most evaluationshave been limited to dates of anthesis and maturity and grain and biomass yieldsBoth models generally predicted anthesis and maturity within a few days of observeddates CERES-Rice predicted grain and biomass yields quite variably across a rangeof tropical to temperate locations with generally good predictions under optimal Nand water conditions (predicted values usually within 10ndash15 of observations) butnot under stress (N deficit water deficit low temperature) CERES-Wheat howevergenerally predicted the grain and biomass yields quite satisfactorily except at verylow yield levels (lt1 tha) or in high temperature environments
The variable performance of the models is probably due to a combination of defi-ciencies in model inputs experimental observations inclusion of non-modelled fac-tors (such as disease lodging pests storms) in model validation and insufficientcapture of model processes Possible input deficiencies include insufficient data forderivation of robust genetic coefficients lack of data on initial soil mineral N andwater and lack of proper soil characterisation (especially hydraulic properties)Few of the above reports of model evaluation state how these inputs were derivedor how genetic coefficients were determined
J Timsina E Humphreys Agricultural Systems 90 (2006) 5ndash31 27
The variable performance of the models and in particular of CERES-Rice high-lights the importance of proper calibration and evaluation in the environment ofinterest before applying them to evaluate management options This is especiallyimportant in the absence of reports on evaluation of model processes as reflectedin the modelsrsquo relative inabilities to predict a range of crop soil and waterparameters
Better evidence of the ability of the models to simulate a range of importantparameters other than yield such as time course of biomass production leaf areadevelopment N uptake soil water and mineral N dynamics and components ofthe water and N balances is also highly desirable to demonstrate the robustnessof model processes and to increase the confidence in the use of model There areno reports of rigorous evaluations of both models for variables related to increasingresource-use efficiency such as water and N management The results of the few stud-ies where some of these components have been determined are however generallyencouraging
Further model testing and improvements are thus needed under water and N lim-iting conditions before they can be used with confidence to explore managementoptions to increase resource use efficiency such as stretching irrigation intervalsand placement of N fertilizers for RW systems in both Asia and Australia Thisis particularly important because of the strong dependence of N transport and trans-formations on the hydrology of the system the risk of soil water deficit stress duringnon-ponded periods and the problem of cold damage during early pollen micro-spore in the Australian environment There is also a need to improve the abilityof CERES-Wheat to simulate the effect of high temperatures especially during grainfilling to examine trade-offs between yield and water use requirement by changingsowing date in both the tropical and sub-tropical RW regions of Asia and temperateAustralia In Australia the model also needs to be able to examine the trade-offbetween sowing late to avoid frost damage vs shortened grain filling during warmerweather
Only one study evaluated the performance of the DSSAT RW sequence modelbut with initial mineral N and soil water content based on observations inputtedfor each crop This work demonstrated that the model predicts the long-term grainyield of component crops fairly satisfactorily but not the long-term changes in SOCand SON suggesting that the sequence model needs further evaluation against datafrom a range of locations and management The results of long-term experimentscould be useful for this purpose however availability of adequate and good qualitydata availability is always a problem
In conclusion while it seems that CERES-Rice and CERES-Wheat have per-formed reasonably well in RW regions of Asia and Australia evaluations and appli-cations addressing resource use efficiency and sustainability issues are lacking Betterdata from field experiments designed to address these issues and further model eval-uations improvements and applications are needed to address the issues of yieldstagnation or decline and increasing yield gaps and finally to contribute to solvingthe resource and food security problems in RW systems of Asia and to regional econ-omies of Australia
28 J Timsina E Humphreys Agricultural Systems 90 (2006) 5ndash31
Acknowledgements
We thank FWT Penning de Vries (IWMI) and James W Jones (University ofFlorida) for reviewing an earlier draft and Ken Boote (University of Florida) forreviewing a later draft of the manuscript We are also grateful to Doug Godwin(Consultant to CSIRO Land and Water) for various discussions on the global per-formance of CERES models We are grateful to the Australian Centre for Interna-tional Agricultural Research for funding support for our research on RW system
References
Alociljha EC Ritchie JT 1991 A model for the phenology of rice In Hodges T (Ed) PredictingCrop Phenology CRC Press Boca Raton FL USA pp 181ndash189
Amien I Rejekingrum P Pramudia A Susanti E 1996 Effects of interannual climate variability andclimate change on rice yield in Java Indonesia Water Air Soil Pollut 92 29ndash39
Andales AA Batchelor WD Anderson CE Farnham DE Whigham DK 2000 Incorporatingtillage effects into a soybean model Agri Syst 66 69ndash98
Bachelet D Van Sickle J Gay CA 1993 The impacts of climate change on rice yield evaluation ofthe efficacy of different modelling approaches In Penning de Vries FWT et al (Eds) SystemsApproaches for Agricultural Development Kluwer Academic Publishers The Netherlands pp 145ndash174
Boonjung H 2000 Climate Variability and Rice Production in Rainfed Rice Area in NortheastThailand Risk Analysis and Management Applications pp 202ndash205 Available from lthttpwwwearthscapeorgrmainrsitesclchhtmlgt
Bouman BAM Penning de Vries FWT Wan Harun WS Timsina J Hartkamp AD 1994Optimising RW rotations under water-limited conditions Paper presented at the symposium lsquolsquoScenariostudies for the rural environmentrsquorsquo 12ndash15 September 1994 Wageningen Netherlands and the lsquolsquoThirdCongress of the European Society for Agronomy 18ndash22 September 1994 Podowa Italy 4 p
Buresh RJ de Datta SK 1990 Denitrification losses from puddled rice soils in the tropics Biol FertSoils 9 1ndash13
Buresh RJ Singh U Godwin DC Ritchie JT de Datta SK 1991 Simulating soil nitrogentransformations with CERES-Rice Agrotechnol Transf 13 7ndash10
Castrignano A Katerji N Karam F Mastrorilli M Hamdy A 1998 A modified version ofCERES-Maize model for predicting crop response to salinity stress Ecol Model 111 107ndash120
Dawe D Frolking S Li C 2004 Trends in ricendashwheat area in China Field Crops Res 87 89ndash95Gauch HG Hwang JTG Fick GW 2003 Model evaluation by comparison of model-based
predictions and measured values Agron J 95 1442ndash1446Gijsman AJ Hoogenboom G Parton WJ Kerridge PC 2002 Modifying DSSAT for low-input
agricultural systems using a SOMresidue module from CENTURY Agron J 94 462ndash474Godwin D Jones CA 1991 Nitrogen dynamics in soil-crop systems In Hanks RJ Ritchie JT
(Eds) Modeling Plant and Soil systems Agronomy Monograph 31 American Society of AgronomyMadison WI USA pp 287ndash321
Godwin D Singh U 1991 Modelling nitrogen dynamics in rice cropping systems In Deturck PPonnamperuma FN (Eds) Rice Production on Acid Soils of the Tropics Institute of FundamentalStudies Kandy Sri Lanka pp 287ndash294
Godwin D Singh U 1998 Nitrogen balance and crop response to nitrogen in upland and lowlandcropping systems In Tsuji GY Hoogenboom G Thornton PK (Eds) UnderstandingOptions for Agricultural Production Kluwer Academic Publishers Dordrecht The Netherlandspp 55ndash78
J Timsina E Humphreys Agricultural Systems 90 (2006) 5ndash31 29
Godwin DC Singh U Buresh RJ De Datta SK 1990 Modelling N dynamics in relation to ricegrowth and yield In Transactions of the 14th Int Cong Soil Sci Kyoto Japan Int Soc Soil SciJapan pp 320ndash325
Godwin DC Meyer WS Singh U 1994 Simulation of the effect of chilling injury and nitrogensupply on floret fertility and yield in rice Aust J Exp Agri 34 921ndash926
Godwin D Humphreys E Smith DJ Timsina J Xevi E Meyer WS 2002 Application ofSWAGMAN destiny to ricendashwheat cropping systems In Humphreys E Timsina J (Eds)Modelling Irrigated Cropping Systems with Special Attention to RicendashWheat Sequences and RaisedBed Planting Proceedings of a Workshop CSIRO Land and Water Griffith NSW Australia 25ndash28February 2002 CSIRO Land and Water Technical Report 2502 pp 69ndash82
Gunawardena TA Fukai S Blamey FPC 2003 Low temperature induced spikelet sterility in rice INitrogen fertilization and sensitive reproductive period Aust J Agri Res 54 937ndash946
Heng LK Baethgen WE Moutoonnet P 2000 The collection of a minimum dataset and theapplication of DSSAT for optimizing wheat yield in irrigated cropping systems pp 7ndash17 InOptimizing Nitrogen Fertilizer Application to Irrigated Wheat IAEA TECDOC-1164 2000 p 245
Hodges T Ritchie JT 1991 The CERES-Wheat phenology model In Hodges T (Ed) PredictingCrop Phenology CRC Press Boca Raton FL USA pp 133ndash143
Hoogenboom G Georgiev G Singh U 1997 Performance of the CERES-Rice model for threelocations in the Asian Region Report of the Workshop lsquolsquoClimate Variability AgriculturalProductivity and Food Security in the Asian Monsoon Regionrsquorsquo A Joint STARTWCRPIGBP-GCTE Workshop 19ndash22 February 1997 Bogor Indonesia START Report 19972 pp35ndash42
Hoogenboom G Jones JW Porter CH Wilkens PW Boote KJ Batchelor WD Hunt LATsuji GY 2004 DSSAT 40 vol 1 Overview ICASA University of Hawaii Honolulu USA
Humphreys E Edraki M Bethune M 2003 Deep drainage and crop water use for irrigated annualcrops and pastures in Australia ndash a review of determinations in fields and lysimeters CSIRO Land andwater Technical Report 1403 33 pp
Humphreys E Smith DJ White RJG Xevi E Godwin DC 2003 MaizeMan ndash a decision supportsystem for water and nitrogen management In Fifth Australian Maize Conference Proceedings 18thndash20th February 2003 Toowoomba Queensland Australia pp 127ndash134
Humphreys E Meisner C Gupta R Timsina J Beecher HG Yong Lu T Yadvinder-Singh GillMA Masih I Jia Guo Z Thompson JA 2004 Water saving in ricendashwheat systems PlantProduction Science 8 242ndash258
Humphreys E Smith DJ Fattore A Bhuiyan AM Fawcett BJ 2005 Quantifying andmaximising the benefits of crops after rice CRC for Sustainable Rice Production Final Report Project1205 Yanco NSW Australia
Hundal SS Kaur P 1997 Application of the CERES-Wheat model to yield predictions in the irrigatedplains of the Indian Punjab J Agric Sci Cambridge 129 13ndash18
Hunt LA Boote KJ 1998 Data for model operation calibration and validation In Tsuji GYHoogenboom G Thornton PK (Eds) Understanding Options for Agricultural ProductionSystems Approaches for Sustainable Agricultural Development Kluwer Academic Publishers GreatBritain pp 9ndash39
Jintrawat A 1995 A decision support system for rapid assessment of lowland rice-based croppingalternatives in Thailand Agri Syst 47 245ndash258
Jones CA Kiniry JR (Eds) 1986 CERES-Maize A Simulation Model of Maize Growth andDevelopment Texas AampM University Press College Station TX p 194
Jones JW Hoogenboom G Porter CH Boote KJ Batchelor WD Hunt LA Wilkens PWSingh U Gijsman AJ Ritchie JT 2003 The DSSAT cropping system model Eur J Agron 18235ndash265
Kobayashi K Salam MU 2000 Comparing simulated and measured values using mean squareddeviation and its components Agron J 92 345ndash352
Kropff MJ Williams RL Horie T Angus JF Singh U Centeno HG Cassman KG 1994Predicting yield potential of rice in different environments In Humphreys et al (Eds) Temperate Rice
30 J Timsina E Humphreys Agricultural Systems 90 (2006) 5ndash31
ndash Achievements and Potential Proceedings of Temperate Rice Conference Yanco NSW Australiapp 657ndash663
Ladha JK Pathak H Tirol-Padre A Dawe D Gupta RK 2003 Productivity trends in intensivericendashwheat cropping systems in Asia In Ladha JK Hill JE Duxbury JM Gupta RK BureshRJ (Eds) Improving the Productivity and Sustainability of RicendashWheat Systems Issues andImpactsrsquo ASA Special Publication 65 (ASA Inc CSSA Inc SSSA Inc Madison USA) pp 45ndash76
Mahmood Meo M Legates DR Morrissey ML The CERES-Rice model-based estimates of potentialmonsoon season rainfed rice productivity in Bangladesh The Professional Geographer 55 259ndash273
Mall RK Aggarwal PK 2002 Climate change and rice yields in diverse agro-environments of India IEvaluation of impact assessment models Climate Change 52 315ndash330
Matthews RB Wassmann R Arah J 2000a Using a cropsoil simulation model and GIS techniquesto assess methane emissions from rice fields in Asia I Model development Nutr Cycl Agroecosyst58 141ndash159
Matthews RB Wassmann R Buendia LV Knox JW 2000b Using a cropsoil simulation modeland GIS techniques to assess methane emissions from rice fields in Asia II Model validation andsensitivity analysis Nutr Cycl Agroecosyst 58 161ndash177
Meyer WS White RJG Smith DJ Baer BD 1994 Monitoring a rice crop to validate the CERES-Rice model CSIRO Technical Memorandum 9413 September 1994 26 p
Nain AS Dadhwal VK Singh TP 2002 Real time wheat yield assessment using technology trendand crop simulation model with minimal data set Curr Sci 82 1255ndash1258
OrsquoLeary GJ 2000 Can contemporary wheat models simulate grain yield accurately in low-potentialenvironments In White JW Grace PR (Eds) Modelling Extremes of Wheat and maize CropPerformance in the Tropics Proceedings of a Workshop CIMMYT El Batan Mexico 19ndash22 April1999 NRG-GIS Series 00-01 Mexico DF CIMMYT pp 5ndash10
Otter-Nacke S Godwin D Ritchie JT 1986 Testing and Validating the CERES-Wheat Model inDiverse Environments IFDC Muscle Shoals AL USA p 147
Paroda RS Woodhead T Singh RB 1994 Sustainability of RW Production Systems in Asia RAPAPub 199411 FAO Bangkok Thailand 209 p
Pathak H Ladha JK Aggarwal PK Peng S Das S Yadvinder-Singh Bijay-Singh Kamra SKMishra B Sastri ASRAS Aggarwal HP Das DK Gupta RK 2003 Trends of climaticpotential and on-farm yields of rice and wheat in the Indo-Gangetic plains Field Crops Res 80 223ndash234
Pathak H Timsina J Humphreys E Godwin DC Bijay-Singh Shukla AK Singh U MatthewsRB 2004 Simulation of rice crop performance and water and N dynamics and methane emissionsfor rice in northwest India using CERES-Rice model CSIRO Land and Water Technical Report 2304 CSIRO Land and Water Griffith NSW 2680 Australia 111 p Available from ltwwwclwcsir-oaupublicationstechnical2004gt
Penning de Vries FWT Jansen DM ten Berge HFM Bakema A 1989 Simulation ofEcophysiological Processes of Growth in Several Annual Crops PUDOC Wageningen TheNetherlands p 271
Porter CH Hoogenboom G Batchelor WD Jones JW Gijsman AJ 2003 DSSAT v40 CropModels Overview of changes relative to DSSAT v35 University of Florida Gainesville USA
Rao GSLHV Sebastian S Subash N 2002 Crop growth simulation models of rice under humidclimates Available from lthttpwwwcommonorthwestealthknowledgenortheasttMetCDChap-ter7C7P06htmgt
Ritchie JT 1998 Soil water balance and plant stress In Tsuji GY Hoogenboom G Thornton PK(Eds) Understanding Options for Agricultural Production Kluwer Academic Publishers DordrechtThe Netherlands pp 41ndash54
Ritchie JT NeSmith DS 1991 Temperature and crop development In Hanks RJ Ritchie JT(Eds) Modeling Plant and Soil Systems Agronomy Monograph 31 American Society of AgronomyMadison WI USA pp 5ndash29
Ritchie JT Singh U Godwin D Bowen WT 1998 Cereal growth development and yield InTsuji GY Hoogenboom G Thornton PK (Eds) Understanding Options for AgriculturalProduction Kluwer Academic Publishers Dordrecht The Netherlands pp 79ndash98
J Timsina E Humphreys Agricultural Systems 90 (2006) 5ndash31 31
Salam MU Jones JW Kobayashi K 2001 Predicting nursery growth and transplanting shock inrice Exp Agri 37 65ndash81
Saseendran SA Hubbard KG Singh KK Mendiratta N Rathore LS Singh SV 1998aOptimum transplanting dates for rice in Kerala India determined using both CERES v30 andClimProb Agron J 90 185ndash190
Saseendran SA Singh KK Rathore LS Rao GSLHVP Mendiratta N Lakshmi Narayan KSingh SV 1998b Evaluation of the CERES-Rice v30 model for the climate conditions of the stateof Kerala India Meterol Appl 5 385ndash392
Seino H 1995 Implications of climate change for crop production in Japan In Climate Change andAgriculture Analysis of Potential International Impacts ASA Special Publication Number 59 ASAMadison WI pp 293ndash306
Singh U 1994 Nitrogen management strategies for lowland rice cropping systems In Proceedings of theInternational Conference on Fertilizer Usage in the Tropics (FERTROP) Malaysian Society of SoilScience Kuala Lumpur Malaysia pp 110ndash130
Singh U Wilkens PW Chude V Oikeh S 1999 Predicting the effect of nitrogen deficiency on cropgrowth duration and yield In Proceedings of the Fourth International Conference on PrecisionAgriculture ASA-CSSA-SSSA Madison WI USA pp 1379ndash1393
Thornton PK Hansen JW 1996 A note on regressing real-world data on model output Agri Syst 411ndash414
Timsina J Connor DJ 2001 Productivity and management of RW systems issues and challengesField Crops Res 69 93ndash132
Timsina J Bouman BAM Penning de Vries FWT Van Kraalingen DWG Wan Sulaiman WanHarun 1994 Modelling tropical RW systems In Proceedings of SARP lsquolsquoApplication Workshoprsquorsquo onthe Application Program lsquoAgroecological Zonation and Characterisationrsquo and lsquoCrop rotationoptimisationrsquo IRRI Philippines pp 58ndash70
Timsina J Singh U Singh Y Lansigan FP 1995 Addressing sustainability of RW systems testingand applications of CERES and SUCROS models In Proceedings of the International Rice ResearchConference 13ndash17 February 1995 IRRI Los Banos Philippines pp 633ndash656
Timsina J Singh U Singh Y 1996 Addressing sustainability of RW systems analysis of long-termexperimentation and simulation In Kropff et al (Eds) Applications of Systems Approaches at theField Level Kluwer Academic Publishers Dordrecht The Netherlands pp 383ndash397
Timsina J Adhikari B Ganesh-KC 1997 Modelling and simulation of rice wheat and maize crops forselected sites and the potential effects of climate change on their productivity in Nepal ConsultancyReport submitted to Ministry of Agric Harihar Bhawan Kathmandu Nepal 55 p
Timsina J Singh U Badaruddin M Meisner C 1998 Cultivar nitrogen and moisture effects on aRW sequence experimentation and simulation Agron J 90 119ndash130
Timsina J Singh U Godwin D Humphreys E 2004 Modelling chilling injury in rice using CERES-Rice ver 41 In CD-Rom Proceedings of the International Rice Cold Tolerance Workshop 22ndash23July 2004 Canberra ACT Australia
Timsina J Humphreys E Godwin D Matthews S 2005 Evaluation of options for increasing waterproductivity of irrigated wheat using CSM-Wheat V40 In MODSIM05 Conference MelbourneAustralia
Tongyai C 1994 Impact of climate change on simulated rice production in Thailand In Rosenzweig CIglesias A (Eds) Implications of Climate Change for International Agriculture Crop ModellingStudy US Environmental Protection Agency EPA 230-B-94-003 Washington DC
Tsuji GY Uehara G Balas S 1994 DSSAT v3 vol 2 University of Hawaii Honolulu Hawaii p 284Williams RL Angus JF 1994 Deep water protects high-nitrogen crops from low-temperature
damage Aust J Exp Agri 34 927ndash932Willmott CJ 1982 Some comments on the evaluation of model performance Bull Am Meterol Soc
63 1309ndash1313Willmott CJ Ackleson SG Davis RE Feddema JJ Klink KM Legates DR OrsquoConnell J
Rowe CM 1985 Statistics for the evaluation and comparison of models J Geophys Res 90 (C5)8995ndash9005
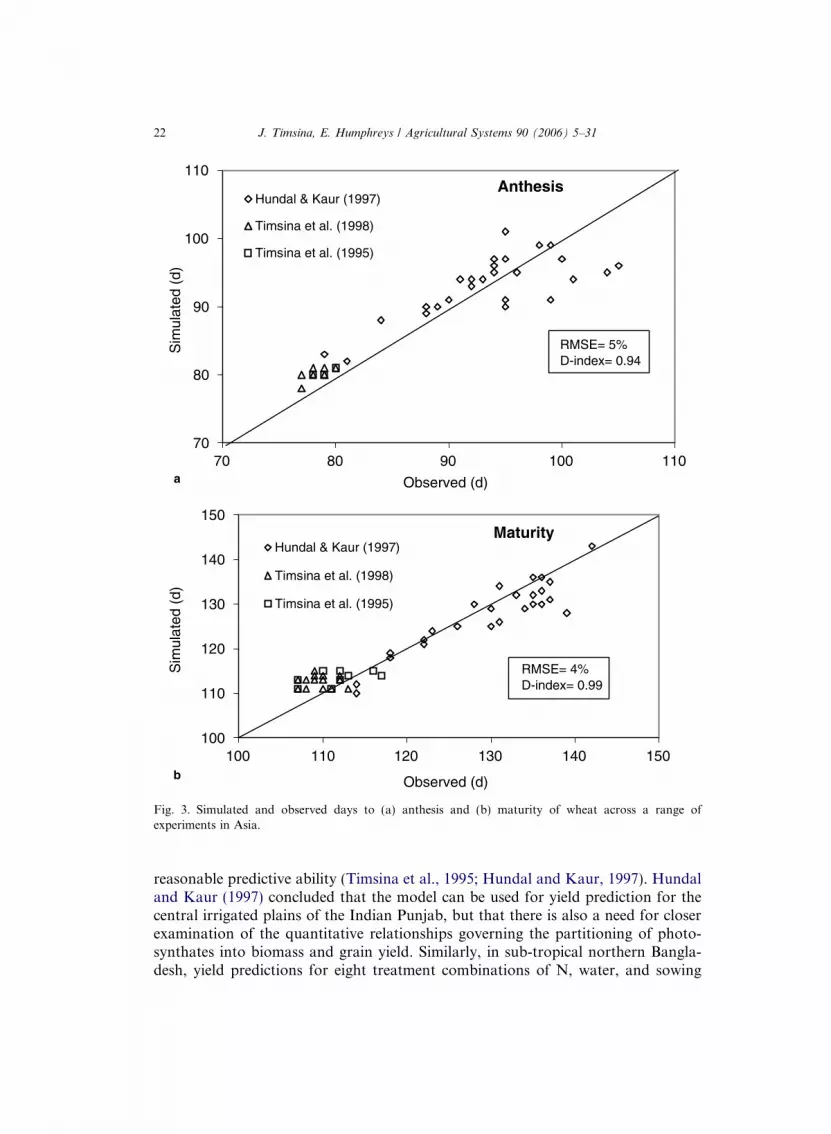
a
Anthesis
70
80
90
100
110
70 80 90 100 110
Observed (d)
Sim
ulat
ed (
d)
Hundal amp Kaur (1997)
Timsina et al (1998)
Timsina et al (1995)
RMSE= 5D-index= 094
b
Maturity
100
110
120
130
140
150
100 110 120 130 140 150
Observed (d)
Sim
ulat
ed (
d)
Hundal amp Kaur (1997)
Timsina et al (1998)
Timsina et al (1995)
RMSE= 4D-index= 099
Fig 3 Simulated and observed days to (a) anthesis and (b) maturity of wheat across a range ofexperiments in Asia
22 J Timsina E Humphreys Agricultural Systems 90 (2006) 5ndash31
reasonable predictive ability (Timsina et al 1995 Hundal and Kaur 1997) Hundaland Kaur (1997) concluded that the model can be used for yield prediction for thecentral irrigated plains of the Indian Punjab but that there is also a need for closerexamination of the quantitative relationships governing the partitioning of photo-synthates into biomass and grain yield Similarly in sub-tropical northern Bangla-desh yield predictions for eight treatment combinations of N water and sowing
Table 5Evaluation results for CERES-Wheat predictions of phenology and grain and biomass yields for various data sets (simulated and observed data are fromvarious studies reported under lsquodata setsrsquo)
Data sets N Xobs (SD) Xsim (SD) a b R2 AbsoluteRMSE
RMSEs RMSEu RMSE()
D-index
Grain yield (tha)
Seino (1995) 3 34 (07) 32 (06) 027 097 087 027 019 019 8 094Timsina et al (1995) 26 34 (13) 35 (11) 026 110 085 051 027 044 15 096Timsina et al (1998) 24 31 (15) 33 (16) 014 090 097 035 021 028 11 099Hundal and Kaur (1997) 29 42 (06) 39 (07) 150 070 063 053 031 042 12 084Nain et al (2002) 30 28 (09) 28 (09) 012 096 096 019 008 019 7 099Godwin et al (2002) 6 46 (09) 45 (09) 003 101 099 011 008 007 2 100Heng et al (2000) 19 46 (18) 48 (16) 009 098 079 079 037 070 17 094All data sets 137 36 (14) 36 (13) 015 096 088 048 010 022 13 097
Biomass yield (tha)
Hundal and Kaur (1997) 29 106 (13) 116 (14) 393 057 040 154 111 106 15 066Heng et al (2000) 19 116 (39) 107 (31) 048 114 080 202 150 134 17 091All data sets 48 110 (27) 113 (22) 086 090 058 174 098 144 16 086
Anthesis (d)
Timsina et al (1995) 10 822 (120) 885 (126) 864 083 077 856 635 574 10 087Timsina et al (1998) 24 778 (34) 796 (27) 188 121 096 201 193 055 3 090Hundal and Kaur (1997) 29 937 (60) 932 (44) 180 102 056 396 274 286 4 084All data sets 64 857 (98) 872 (86) 427 103 081 449 255 369 5 094
Maturity (d)
Timsina et al (1995) 13 1418 (502) 1411 (456) 168 102 097 866 240 832 6 099Timsina et al (1998) 24 1105 (27) 1130 (15) 3592 066 013 354 327 135 3 052Hundal and Kaur (1997) 29 1297 (77) 1277 (71) 505 098 082 384 239 306 3 093All data sets 66 1251 (252) 1250 (238) 479 104 096 508 191 471 4 099
N number of data pairs Xobs mean of observed values Xsim mean of simulated values SD standard deviation a slope of linear relation between simulatedand observed values b intercept of linear relation between simulated and observed values R2 adjusted linear correlation coefficient between simulated andobserved values RMSE root mean square error
J
Tim
sina
E
H
um
ph
reys
A
gricu
ltura
lS
ystem
s9
0(
20
06
)5
ndash3
123
24 J Timsina E Humphreys Agricultural Systems 90 (2006) 5ndash31
dates were quite good (RMSE = 04 tha D-index = 099) (Timsina et al 1998) Inanother study in India Bangladesh and China (Heng et al 2000) there were reason-ably good predictions of grain and biomass yields as judged by several statisticalparameters (low intercepts slope = 098 R2 = 079 normalised RMSE = 17 andD-index = 094) All these studies in the sub-tropical environments were carriedout in the IGP where RW systems predominate
Seino (1995) reported predicted grain yields within 1ndash2 of observed(RMSE = 027 tha D-index = 094) in several locations in Japan Otter-Nackeet al (1986) validated an early version of the model for a range of cultivars in manycountries including temperate rainfed environments across Australia They reportedthat the model explained about 60 of the variation in grain yield but the evalua-tion for time course of LAI and above ground biomass N uptake and root weightresponses to N rate showed variable results Humphreys et al (2005) evaluated ver30 with three cultivars in field and lysimeter experiments in the rice-growing regionof southern Australia where the model performed well for grain yield Taken all datasets together accuracy and precision of predictions of grain yield was better thanbiomass yield as reflected by better spread of data around 11 line intercept andslope closer to 0 and 10 respectively lower RMSE and higher R2 and D-indexfor grain than biomass yield (Fig 4 Table 5)
53 Other variables
Humphreys et al (2005) reported that the ver 30 predicted well the time courseof biomass production and LAI volumetric soil water content and root lengthdensity and daily ET of three cultivars in rice-growing areas of southern AustraliaRecently with CSM-CERES-Wheat (ver 40) Timsina et al (2005) reported sim-ulated deep drainage losses beyond 09 m depth of 0ndash165 mm and ET of 338ndash662 mm for a range of sowing dates and irrigation methods Deep drainage washigher for flood irrigation compared with sprinkler irrigation and rainfed but ETwas higher for sprinkler Both deep drainage and ET were within the ranges ofobserved values reported by Humphreys et al (2003ab) Comprehensive evalua-tions of this nature are important to demonstrate robustness of the model pro-cesses to simulate the effect of water stress on growth and yield for sub-tropicaland temperate environments
54 Model comparisons
Nain et al (2002) used combined analyses from the technology-trend modeland CERES-Wheat for several locations in India and reported a mean grainyield of 282 tha RMSE of 02 tha and D-index of 099 indicating good perfor-mance of the model under lsquolsquohighrsquorsquo input conditions Godwin et al (2002) com-pared the predictions of CERES-Wheat (ver 35) and SWAGMAN-Destinyagainst data from irrigated wheat in southern Australia and concluded that bothmodels predict in-season LAI total biomass root length density and soil watercontent and final grain yield quite satisfactorily in temperate Australia In con-
a
Grain yield
0
2
4
6
8
0 42 6 8
Observed (tha)
Sim
ulat
ed (
tha)
Hundal amp Kaur(1997)Timsina et al(1998)Timsina et al(1996)Nain et al(2002)Heng et al(2000)Timsina et al(1995)Seino (1995)
Godwin et al(2002)
RMSE=13D-index= 097
b
Biomass yield
4
8
12
16
20
4 8 12 16 20
Observed (d)
Sim
ulat
ed (
d)
Hundal amp Kaur (1997)
Heng et al (2000)
RMSE=16D-index= 086
Fig 4 Simulated and observed grain and biomass yields of wheat across a range of experiments in Asiaand Australia
J Timsina E Humphreys Agricultural Systems 90 (2006) 5ndash31 25
trast after comparing the accuracy of eight simulation models for several lowyield potential temperate environments including Australia OrsquoLeary (2000)concluded that yield underestimation under stressed conditions was a common
26 J Timsina E Humphreys Agricultural Systems 90 (2006) 5ndash31
problem of all models and suggested the need of better models especially forvery low yield levels (lt1 tha)
6 Evaluation of the CERES RW sequence model
Timsina et al (1996) the only reported model validation study for RW systemused 20 yearsrsquo experimental and historical weather data from Pantnagar to val-idate the DSSAT sequence model (ver 35) In the experiment planting datescultivars and initial conditions varied across years so the model was manuallyreset prior to each season using observed initial soil mineral N and soil waterplanting dates and cultivars The model satisfactorily predicted the seasonal fluc-tuations in rice and wheat yields and the long-term trends for each crop over 20years though the predictions were more accurate with N fertilizer applicationthan with no added N The model also greatly overestimated the long-termdecline in soil organic carbon (SOC) and nitrogen (SON) The discrepancies inyield were partly due to inadequate model input data especially initial soil min-eral N and soil water prior to each crop but poor predictions of SOC and SONwere also due to the presence of only one pool of SOM in that version ofDSSAT (ver 35) DSSAT ver 40 includes the option of using a CENTURY-based SOM routine which has three SOM pools (passive slow and active micro-bial) (Gijsman et al 2002) However this is yet to be tested for RW system andthe CENTURY module does not simulate flooded soils
7 General discussion and conclusions
There are many reports of the evaluation of CERES-Rice in the RW areas oftropical and sub-tropical Asia but only a few for CERES-Wheat Most evaluationshave been limited to dates of anthesis and maturity and grain and biomass yieldsBoth models generally predicted anthesis and maturity within a few days of observeddates CERES-Rice predicted grain and biomass yields quite variably across a rangeof tropical to temperate locations with generally good predictions under optimal Nand water conditions (predicted values usually within 10ndash15 of observations) butnot under stress (N deficit water deficit low temperature) CERES-Wheat howevergenerally predicted the grain and biomass yields quite satisfactorily except at verylow yield levels (lt1 tha) or in high temperature environments
The variable performance of the models is probably due to a combination of defi-ciencies in model inputs experimental observations inclusion of non-modelled fac-tors (such as disease lodging pests storms) in model validation and insufficientcapture of model processes Possible input deficiencies include insufficient data forderivation of robust genetic coefficients lack of data on initial soil mineral N andwater and lack of proper soil characterisation (especially hydraulic properties)Few of the above reports of model evaluation state how these inputs were derivedor how genetic coefficients were determined
J Timsina E Humphreys Agricultural Systems 90 (2006) 5ndash31 27
The variable performance of the models and in particular of CERES-Rice high-lights the importance of proper calibration and evaluation in the environment ofinterest before applying them to evaluate management options This is especiallyimportant in the absence of reports on evaluation of model processes as reflectedin the modelsrsquo relative inabilities to predict a range of crop soil and waterparameters
Better evidence of the ability of the models to simulate a range of importantparameters other than yield such as time course of biomass production leaf areadevelopment N uptake soil water and mineral N dynamics and components ofthe water and N balances is also highly desirable to demonstrate the robustnessof model processes and to increase the confidence in the use of model There areno reports of rigorous evaluations of both models for variables related to increasingresource-use efficiency such as water and N management The results of the few stud-ies where some of these components have been determined are however generallyencouraging
Further model testing and improvements are thus needed under water and N lim-iting conditions before they can be used with confidence to explore managementoptions to increase resource use efficiency such as stretching irrigation intervalsand placement of N fertilizers for RW systems in both Asia and Australia Thisis particularly important because of the strong dependence of N transport and trans-formations on the hydrology of the system the risk of soil water deficit stress duringnon-ponded periods and the problem of cold damage during early pollen micro-spore in the Australian environment There is also a need to improve the abilityof CERES-Wheat to simulate the effect of high temperatures especially during grainfilling to examine trade-offs between yield and water use requirement by changingsowing date in both the tropical and sub-tropical RW regions of Asia and temperateAustralia In Australia the model also needs to be able to examine the trade-offbetween sowing late to avoid frost damage vs shortened grain filling during warmerweather
Only one study evaluated the performance of the DSSAT RW sequence modelbut with initial mineral N and soil water content based on observations inputtedfor each crop This work demonstrated that the model predicts the long-term grainyield of component crops fairly satisfactorily but not the long-term changes in SOCand SON suggesting that the sequence model needs further evaluation against datafrom a range of locations and management The results of long-term experimentscould be useful for this purpose however availability of adequate and good qualitydata availability is always a problem
In conclusion while it seems that CERES-Rice and CERES-Wheat have per-formed reasonably well in RW regions of Asia and Australia evaluations and appli-cations addressing resource use efficiency and sustainability issues are lacking Betterdata from field experiments designed to address these issues and further model eval-uations improvements and applications are needed to address the issues of yieldstagnation or decline and increasing yield gaps and finally to contribute to solvingthe resource and food security problems in RW systems of Asia and to regional econ-omies of Australia
28 J Timsina E Humphreys Agricultural Systems 90 (2006) 5ndash31
Acknowledgements
We thank FWT Penning de Vries (IWMI) and James W Jones (University ofFlorida) for reviewing an earlier draft and Ken Boote (University of Florida) forreviewing a later draft of the manuscript We are also grateful to Doug Godwin(Consultant to CSIRO Land and Water) for various discussions on the global per-formance of CERES models We are grateful to the Australian Centre for Interna-tional Agricultural Research for funding support for our research on RW system
References
Alociljha EC Ritchie JT 1991 A model for the phenology of rice In Hodges T (Ed) PredictingCrop Phenology CRC Press Boca Raton FL USA pp 181ndash189
Amien I Rejekingrum P Pramudia A Susanti E 1996 Effects of interannual climate variability andclimate change on rice yield in Java Indonesia Water Air Soil Pollut 92 29ndash39
Andales AA Batchelor WD Anderson CE Farnham DE Whigham DK 2000 Incorporatingtillage effects into a soybean model Agri Syst 66 69ndash98
Bachelet D Van Sickle J Gay CA 1993 The impacts of climate change on rice yield evaluation ofthe efficacy of different modelling approaches In Penning de Vries FWT et al (Eds) SystemsApproaches for Agricultural Development Kluwer Academic Publishers The Netherlands pp 145ndash174
Boonjung H 2000 Climate Variability and Rice Production in Rainfed Rice Area in NortheastThailand Risk Analysis and Management Applications pp 202ndash205 Available from lthttpwwwearthscapeorgrmainrsitesclchhtmlgt
Bouman BAM Penning de Vries FWT Wan Harun WS Timsina J Hartkamp AD 1994Optimising RW rotations under water-limited conditions Paper presented at the symposium lsquolsquoScenariostudies for the rural environmentrsquorsquo 12ndash15 September 1994 Wageningen Netherlands and the lsquolsquoThirdCongress of the European Society for Agronomy 18ndash22 September 1994 Podowa Italy 4 p
Buresh RJ de Datta SK 1990 Denitrification losses from puddled rice soils in the tropics Biol FertSoils 9 1ndash13
Buresh RJ Singh U Godwin DC Ritchie JT de Datta SK 1991 Simulating soil nitrogentransformations with CERES-Rice Agrotechnol Transf 13 7ndash10
Castrignano A Katerji N Karam F Mastrorilli M Hamdy A 1998 A modified version ofCERES-Maize model for predicting crop response to salinity stress Ecol Model 111 107ndash120
Dawe D Frolking S Li C 2004 Trends in ricendashwheat area in China Field Crops Res 87 89ndash95Gauch HG Hwang JTG Fick GW 2003 Model evaluation by comparison of model-based
predictions and measured values Agron J 95 1442ndash1446Gijsman AJ Hoogenboom G Parton WJ Kerridge PC 2002 Modifying DSSAT for low-input
agricultural systems using a SOMresidue module from CENTURY Agron J 94 462ndash474Godwin D Jones CA 1991 Nitrogen dynamics in soil-crop systems In Hanks RJ Ritchie JT
(Eds) Modeling Plant and Soil systems Agronomy Monograph 31 American Society of AgronomyMadison WI USA pp 287ndash321
Godwin D Singh U 1991 Modelling nitrogen dynamics in rice cropping systems In Deturck PPonnamperuma FN (Eds) Rice Production on Acid Soils of the Tropics Institute of FundamentalStudies Kandy Sri Lanka pp 287ndash294
Godwin D Singh U 1998 Nitrogen balance and crop response to nitrogen in upland and lowlandcropping systems In Tsuji GY Hoogenboom G Thornton PK (Eds) UnderstandingOptions for Agricultural Production Kluwer Academic Publishers Dordrecht The Netherlandspp 55ndash78
J Timsina E Humphreys Agricultural Systems 90 (2006) 5ndash31 29
Godwin DC Singh U Buresh RJ De Datta SK 1990 Modelling N dynamics in relation to ricegrowth and yield In Transactions of the 14th Int Cong Soil Sci Kyoto Japan Int Soc Soil SciJapan pp 320ndash325
Godwin DC Meyer WS Singh U 1994 Simulation of the effect of chilling injury and nitrogensupply on floret fertility and yield in rice Aust J Exp Agri 34 921ndash926
Godwin D Humphreys E Smith DJ Timsina J Xevi E Meyer WS 2002 Application ofSWAGMAN destiny to ricendashwheat cropping systems In Humphreys E Timsina J (Eds)Modelling Irrigated Cropping Systems with Special Attention to RicendashWheat Sequences and RaisedBed Planting Proceedings of a Workshop CSIRO Land and Water Griffith NSW Australia 25ndash28February 2002 CSIRO Land and Water Technical Report 2502 pp 69ndash82
Gunawardena TA Fukai S Blamey FPC 2003 Low temperature induced spikelet sterility in rice INitrogen fertilization and sensitive reproductive period Aust J Agri Res 54 937ndash946
Heng LK Baethgen WE Moutoonnet P 2000 The collection of a minimum dataset and theapplication of DSSAT for optimizing wheat yield in irrigated cropping systems pp 7ndash17 InOptimizing Nitrogen Fertilizer Application to Irrigated Wheat IAEA TECDOC-1164 2000 p 245
Hodges T Ritchie JT 1991 The CERES-Wheat phenology model In Hodges T (Ed) PredictingCrop Phenology CRC Press Boca Raton FL USA pp 133ndash143
Hoogenboom G Georgiev G Singh U 1997 Performance of the CERES-Rice model for threelocations in the Asian Region Report of the Workshop lsquolsquoClimate Variability AgriculturalProductivity and Food Security in the Asian Monsoon Regionrsquorsquo A Joint STARTWCRPIGBP-GCTE Workshop 19ndash22 February 1997 Bogor Indonesia START Report 19972 pp35ndash42
Hoogenboom G Jones JW Porter CH Wilkens PW Boote KJ Batchelor WD Hunt LATsuji GY 2004 DSSAT 40 vol 1 Overview ICASA University of Hawaii Honolulu USA
Humphreys E Edraki M Bethune M 2003 Deep drainage and crop water use for irrigated annualcrops and pastures in Australia ndash a review of determinations in fields and lysimeters CSIRO Land andwater Technical Report 1403 33 pp
Humphreys E Smith DJ White RJG Xevi E Godwin DC 2003 MaizeMan ndash a decision supportsystem for water and nitrogen management In Fifth Australian Maize Conference Proceedings 18thndash20th February 2003 Toowoomba Queensland Australia pp 127ndash134
Humphreys E Meisner C Gupta R Timsina J Beecher HG Yong Lu T Yadvinder-Singh GillMA Masih I Jia Guo Z Thompson JA 2004 Water saving in ricendashwheat systems PlantProduction Science 8 242ndash258
Humphreys E Smith DJ Fattore A Bhuiyan AM Fawcett BJ 2005 Quantifying andmaximising the benefits of crops after rice CRC for Sustainable Rice Production Final Report Project1205 Yanco NSW Australia
Hundal SS Kaur P 1997 Application of the CERES-Wheat model to yield predictions in the irrigatedplains of the Indian Punjab J Agric Sci Cambridge 129 13ndash18
Hunt LA Boote KJ 1998 Data for model operation calibration and validation In Tsuji GYHoogenboom G Thornton PK (Eds) Understanding Options for Agricultural ProductionSystems Approaches for Sustainable Agricultural Development Kluwer Academic Publishers GreatBritain pp 9ndash39
Jintrawat A 1995 A decision support system for rapid assessment of lowland rice-based croppingalternatives in Thailand Agri Syst 47 245ndash258
Jones CA Kiniry JR (Eds) 1986 CERES-Maize A Simulation Model of Maize Growth andDevelopment Texas AampM University Press College Station TX p 194
Jones JW Hoogenboom G Porter CH Boote KJ Batchelor WD Hunt LA Wilkens PWSingh U Gijsman AJ Ritchie JT 2003 The DSSAT cropping system model Eur J Agron 18235ndash265
Kobayashi K Salam MU 2000 Comparing simulated and measured values using mean squareddeviation and its components Agron J 92 345ndash352
Kropff MJ Williams RL Horie T Angus JF Singh U Centeno HG Cassman KG 1994Predicting yield potential of rice in different environments In Humphreys et al (Eds) Temperate Rice
30 J Timsina E Humphreys Agricultural Systems 90 (2006) 5ndash31
ndash Achievements and Potential Proceedings of Temperate Rice Conference Yanco NSW Australiapp 657ndash663
Ladha JK Pathak H Tirol-Padre A Dawe D Gupta RK 2003 Productivity trends in intensivericendashwheat cropping systems in Asia In Ladha JK Hill JE Duxbury JM Gupta RK BureshRJ (Eds) Improving the Productivity and Sustainability of RicendashWheat Systems Issues andImpactsrsquo ASA Special Publication 65 (ASA Inc CSSA Inc SSSA Inc Madison USA) pp 45ndash76
Mahmood Meo M Legates DR Morrissey ML The CERES-Rice model-based estimates of potentialmonsoon season rainfed rice productivity in Bangladesh The Professional Geographer 55 259ndash273
Mall RK Aggarwal PK 2002 Climate change and rice yields in diverse agro-environments of India IEvaluation of impact assessment models Climate Change 52 315ndash330
Matthews RB Wassmann R Arah J 2000a Using a cropsoil simulation model and GIS techniquesto assess methane emissions from rice fields in Asia I Model development Nutr Cycl Agroecosyst58 141ndash159
Matthews RB Wassmann R Buendia LV Knox JW 2000b Using a cropsoil simulation modeland GIS techniques to assess methane emissions from rice fields in Asia II Model validation andsensitivity analysis Nutr Cycl Agroecosyst 58 161ndash177
Meyer WS White RJG Smith DJ Baer BD 1994 Monitoring a rice crop to validate the CERES-Rice model CSIRO Technical Memorandum 9413 September 1994 26 p
Nain AS Dadhwal VK Singh TP 2002 Real time wheat yield assessment using technology trendand crop simulation model with minimal data set Curr Sci 82 1255ndash1258
OrsquoLeary GJ 2000 Can contemporary wheat models simulate grain yield accurately in low-potentialenvironments In White JW Grace PR (Eds) Modelling Extremes of Wheat and maize CropPerformance in the Tropics Proceedings of a Workshop CIMMYT El Batan Mexico 19ndash22 April1999 NRG-GIS Series 00-01 Mexico DF CIMMYT pp 5ndash10
Otter-Nacke S Godwin D Ritchie JT 1986 Testing and Validating the CERES-Wheat Model inDiverse Environments IFDC Muscle Shoals AL USA p 147
Paroda RS Woodhead T Singh RB 1994 Sustainability of RW Production Systems in Asia RAPAPub 199411 FAO Bangkok Thailand 209 p
Pathak H Ladha JK Aggarwal PK Peng S Das S Yadvinder-Singh Bijay-Singh Kamra SKMishra B Sastri ASRAS Aggarwal HP Das DK Gupta RK 2003 Trends of climaticpotential and on-farm yields of rice and wheat in the Indo-Gangetic plains Field Crops Res 80 223ndash234
Pathak H Timsina J Humphreys E Godwin DC Bijay-Singh Shukla AK Singh U MatthewsRB 2004 Simulation of rice crop performance and water and N dynamics and methane emissionsfor rice in northwest India using CERES-Rice model CSIRO Land and Water Technical Report 2304 CSIRO Land and Water Griffith NSW 2680 Australia 111 p Available from ltwwwclwcsir-oaupublicationstechnical2004gt
Penning de Vries FWT Jansen DM ten Berge HFM Bakema A 1989 Simulation ofEcophysiological Processes of Growth in Several Annual Crops PUDOC Wageningen TheNetherlands p 271
Porter CH Hoogenboom G Batchelor WD Jones JW Gijsman AJ 2003 DSSAT v40 CropModels Overview of changes relative to DSSAT v35 University of Florida Gainesville USA
Rao GSLHV Sebastian S Subash N 2002 Crop growth simulation models of rice under humidclimates Available from lthttpwwwcommonorthwestealthknowledgenortheasttMetCDChap-ter7C7P06htmgt
Ritchie JT 1998 Soil water balance and plant stress In Tsuji GY Hoogenboom G Thornton PK(Eds) Understanding Options for Agricultural Production Kluwer Academic Publishers DordrechtThe Netherlands pp 41ndash54
Ritchie JT NeSmith DS 1991 Temperature and crop development In Hanks RJ Ritchie JT(Eds) Modeling Plant and Soil Systems Agronomy Monograph 31 American Society of AgronomyMadison WI USA pp 5ndash29
Ritchie JT Singh U Godwin D Bowen WT 1998 Cereal growth development and yield InTsuji GY Hoogenboom G Thornton PK (Eds) Understanding Options for AgriculturalProduction Kluwer Academic Publishers Dordrecht The Netherlands pp 79ndash98
J Timsina E Humphreys Agricultural Systems 90 (2006) 5ndash31 31
Salam MU Jones JW Kobayashi K 2001 Predicting nursery growth and transplanting shock inrice Exp Agri 37 65ndash81
Saseendran SA Hubbard KG Singh KK Mendiratta N Rathore LS Singh SV 1998aOptimum transplanting dates for rice in Kerala India determined using both CERES v30 andClimProb Agron J 90 185ndash190
Saseendran SA Singh KK Rathore LS Rao GSLHVP Mendiratta N Lakshmi Narayan KSingh SV 1998b Evaluation of the CERES-Rice v30 model for the climate conditions of the stateof Kerala India Meterol Appl 5 385ndash392
Seino H 1995 Implications of climate change for crop production in Japan In Climate Change andAgriculture Analysis of Potential International Impacts ASA Special Publication Number 59 ASAMadison WI pp 293ndash306
Singh U 1994 Nitrogen management strategies for lowland rice cropping systems In Proceedings of theInternational Conference on Fertilizer Usage in the Tropics (FERTROP) Malaysian Society of SoilScience Kuala Lumpur Malaysia pp 110ndash130
Singh U Wilkens PW Chude V Oikeh S 1999 Predicting the effect of nitrogen deficiency on cropgrowth duration and yield In Proceedings of the Fourth International Conference on PrecisionAgriculture ASA-CSSA-SSSA Madison WI USA pp 1379ndash1393
Thornton PK Hansen JW 1996 A note on regressing real-world data on model output Agri Syst 411ndash414
Timsina J Connor DJ 2001 Productivity and management of RW systems issues and challengesField Crops Res 69 93ndash132
Timsina J Bouman BAM Penning de Vries FWT Van Kraalingen DWG Wan Sulaiman WanHarun 1994 Modelling tropical RW systems In Proceedings of SARP lsquolsquoApplication Workshoprsquorsquo onthe Application Program lsquoAgroecological Zonation and Characterisationrsquo and lsquoCrop rotationoptimisationrsquo IRRI Philippines pp 58ndash70
Timsina J Singh U Singh Y Lansigan FP 1995 Addressing sustainability of RW systems testingand applications of CERES and SUCROS models In Proceedings of the International Rice ResearchConference 13ndash17 February 1995 IRRI Los Banos Philippines pp 633ndash656
Timsina J Singh U Singh Y 1996 Addressing sustainability of RW systems analysis of long-termexperimentation and simulation In Kropff et al (Eds) Applications of Systems Approaches at theField Level Kluwer Academic Publishers Dordrecht The Netherlands pp 383ndash397
Timsina J Adhikari B Ganesh-KC 1997 Modelling and simulation of rice wheat and maize crops forselected sites and the potential effects of climate change on their productivity in Nepal ConsultancyReport submitted to Ministry of Agric Harihar Bhawan Kathmandu Nepal 55 p
Timsina J Singh U Badaruddin M Meisner C 1998 Cultivar nitrogen and moisture effects on aRW sequence experimentation and simulation Agron J 90 119ndash130
Timsina J Singh U Godwin D Humphreys E 2004 Modelling chilling injury in rice using CERES-Rice ver 41 In CD-Rom Proceedings of the International Rice Cold Tolerance Workshop 22ndash23July 2004 Canberra ACT Australia
Timsina J Humphreys E Godwin D Matthews S 2005 Evaluation of options for increasing waterproductivity of irrigated wheat using CSM-Wheat V40 In MODSIM05 Conference MelbourneAustralia
Tongyai C 1994 Impact of climate change on simulated rice production in Thailand In Rosenzweig CIglesias A (Eds) Implications of Climate Change for International Agriculture Crop ModellingStudy US Environmental Protection Agency EPA 230-B-94-003 Washington DC
Tsuji GY Uehara G Balas S 1994 DSSAT v3 vol 2 University of Hawaii Honolulu Hawaii p 284Williams RL Angus JF 1994 Deep water protects high-nitrogen crops from low-temperature
damage Aust J Exp Agri 34 927ndash932Willmott CJ 1982 Some comments on the evaluation of model performance Bull Am Meterol Soc
63 1309ndash1313Willmott CJ Ackleson SG Davis RE Feddema JJ Klink KM Legates DR OrsquoConnell J
Rowe CM 1985 Statistics for the evaluation and comparison of models J Geophys Res 90 (C5)8995ndash9005
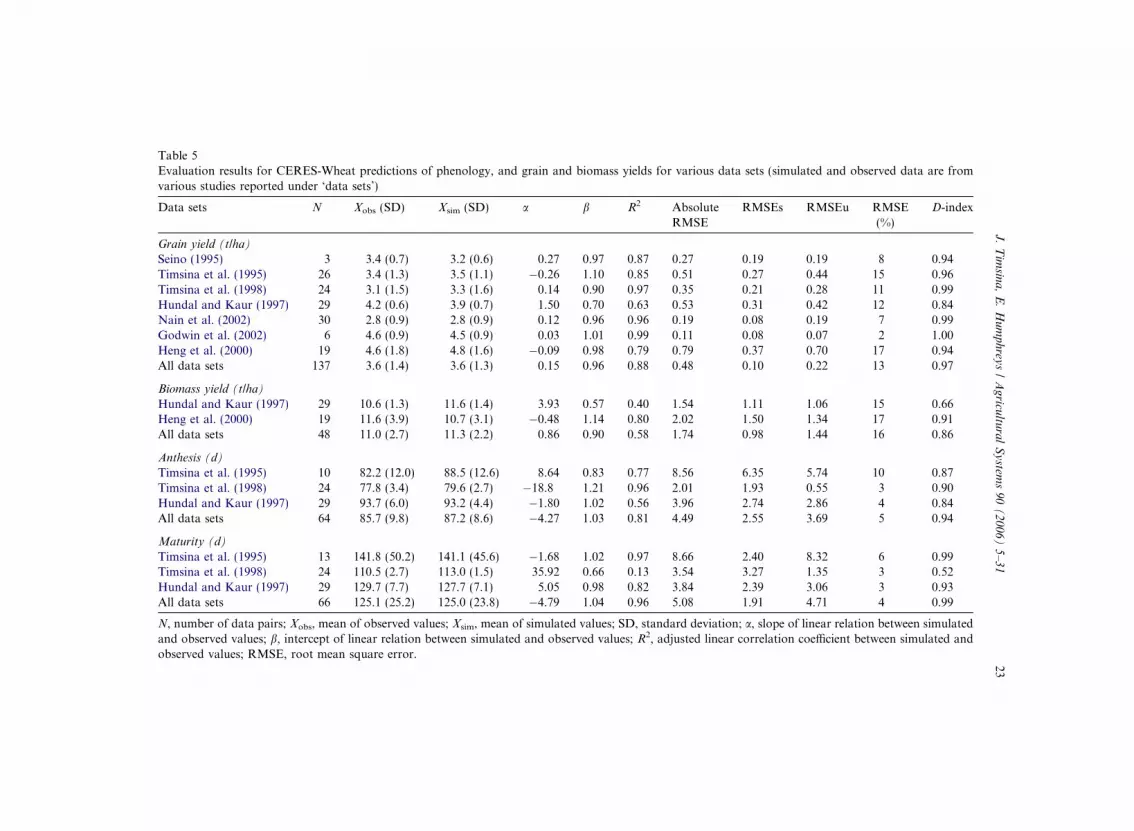
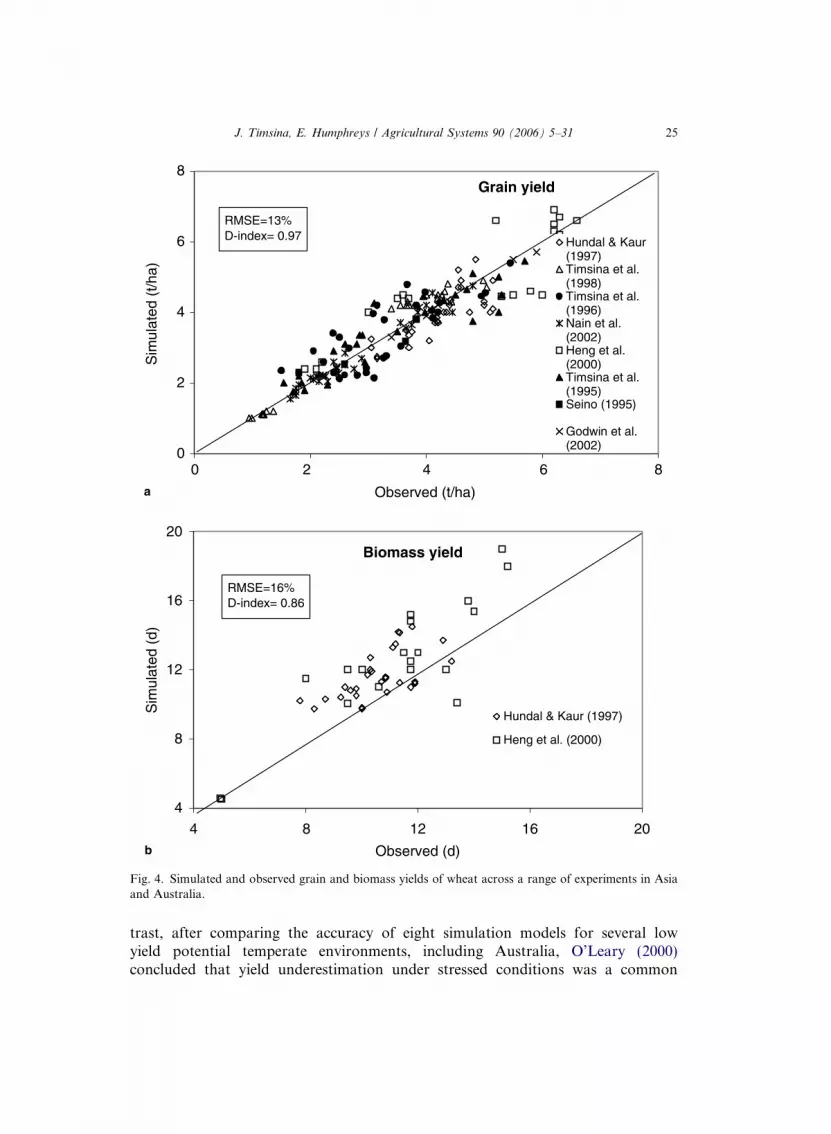