performance measure properties and incentive system design
TRANSCRIPT

IZA DP No. 1356
Performance Measure Properties and Incentives
Michael GibbsKenneth A. MerchantWim A. Van der StedeMark E. Vargus
DI
SC
US
SI
ON
P
AP
ER
S
ER
IE
S
Forschungsinstitut
zur Zukunft der Arbeit
Institute for the Study
of Labor
October 2004

Performance Measure Properties and Incentives
Michael Gibbs University of Chicago and IZA Bonn
Kenneth A. Merchant University of Southern California
Wim A. Van der Stede University of Southern California
Mark E. Vargus
University of Texas, Dallas
Discussion Paper No. 1356 October 2004
IZA
P.O. Box 7240 53072 Bonn
Germany
Phone: +49-228-3894-0 Fax: +49-228-3894-180
Email: [email protected]
Any opinions expressed here are those of the author(s) and not those of the institute. Research disseminated by IZA may include views on policy, but the institute itself takes no institutional policy positions. The Institute for the Study of Labor (IZA) in Bonn is a local and virtual international research center and a place of communication between science, politics and business. IZA is an independent nonprofit company supported by Deutsche Post World Net. The center is associated with the University of Bonn and offers a stimulating research environment through its research networks, research support, and visitors and doctoral programs. IZA engages in (i) original and internationally competitive research in all fields of labor economics, (ii) development of policy concepts, and (iii) dissemination of research results and concepts to the interested public. IZA Discussion Papers often represent preliminary work and are circulated to encourage discussion. Citation of such a paper should account for its provisional character. A revised version may be available directly from the author.

IZA Discussion Paper No. 1356 October 2004
ABSTRACT
Performance Measure Properties and Incentives∗
We examine the effects of performance measure properties on incentive system design, using data on incentive contracts for auto dealership managers. The data include information on five properties: two indicators of risk; two indicators of distortion; and one indicator of potential manipulation. We find that these properties have important effects on incentive system design. First, firms appear to choose the “best” performance measure available along these dimensions, and use it for the most important (primary) formula bonus. Second, the properties of this primary performance measure are important determinants of the weight placed on the measure for explicit. Third, firms appear to use other performance measures to balance multitask incentives relative to the primary performance measure. Specifically, we find evidence that second and third bonuses are used to provide better incentives for cooperation and to reduce incentives for manipulation. Fourth, we present evidence that subjectivity, through discretionary bonuses based on subjective performance evaluations, and also through implicit incentives for promotions and other rewards, also appear to play the same roles. JEL Classification: M52, J33 Keywords: performance measures, incentives Corresponding author: Michael Gibbs Graduate School of Business University of Chicago Chicago, IL 60637 USA Email: [email protected]
∗ This paper was formerly titled “The Structure of Incentive Contracts.” We are grateful to an unnamed consulting firm for giving us access to their data and clients, and for numerous discussions that helped us understand the auto dealership business and clarify the data. We thank Shannon Anderson, Mark Bradshaw, Jim Brickley, Leslie Eldenburg, Joan Luft, Margaret Meyer, Kevin J. Murphy, Walter Oi, Canice Prendergast, Michael Raith, Jim Rebitzer, Edward Reidl, Bernard Salanié, Sally Widener, and seminar participants at Arizona, Harvard, Rice, Rochester, University of Aarhus, Universidad de Navarra, Universitat Pompeu Fabra, USC, and conferences of the AAA Management Accounting Section, BMAS, CAED (Aarhus), CEPR (Stockholm), and the Society of Labor Economists for helpful comments on various drafts. Liu Zheng provided helpful research assistance.

1
PERFORMANCE MEASURE PROPERTIES AND INCENTIVES
1. INTRODUCTION
One of the most important issues in designing incentive systems is performance measurement, not
only as the basis for calculating bonuses, but also as input for various other forms of incentives. The
choice of performance measures is also intimately related to the definition of the job. A more broadly de-
fined job, with a larger variety of tasks and broader decision rights, may require a broader performance
measure, or the use of multiple performance measures.
A good performance measure is one that represents an employee’s multiple contributions to firm
value, without imposing undue risk on the employee. In practice, however, performance measurement
appears to be a significant challenge in incentive systems. Most measures inadequately gauge an em-
ployee’s impact on firm value, especially for employees who perform complex and highly interdependent
jobs and who are not at the highest organizational levels. This means that measures generally impose risk
on employees. Another result is that performance measures often distort incentives. If there are multiple
tasks, then the performance measure may not measure all of them, or may weight them incorrectly. In
fact, distortions may arise or worsen because firms choose “narrower” (less inclusive) performance meas-
ures to reduce risk. Many performance measures are also prone to manipulation. Both distortion and ma-
nipulation result because employees are rewarded for an inevitably imperfect measure, not for their actual
performance, and so they have incentives to maximize the measure rather than performance. Finally, per-
formance measure properties may also play a key role in subjective performance evaluations and other
forms of incentives (e.g., as inputs for promotions). For example, subjectivity can be used to reduce the
total compensation risk that employees face (e.g., through ex post backing out of uncontrollable factors),
reduce distortions, or reduce incentives for manipulation (e.g., through ex post settling up).

2
Performance measure problems have received increasing attention in agency theory. The original
models (e.g., Holmstrom 1979) emphasized uncontrollable risk (noise). Later models began to incorporate
multitask-incentive considerations (e.g., Holmstrom & Milgrom 1991; Baker 1992), which motivated a
formal consideration of distortions and manipulation (e.g., Demski, Frimor & Sappington 2004). More
recent work has considered the effects of risk and distortions induced by performance measures (e.g.,
Prendergast 2002; Baker 2002). In accounting, there is a substantial theoretical (Banker & Datar 1989;
Feltham & Xie 1994) and empirical (Bushman, Indjejikian & Smith 1996; Ittner, Larcker & Rajan 1997;
Ittner & Larcker 2002) literature analyzing performance measure properties. Most of this literature, how-
ever, focuses on corporate-wide accounting numbers, and their use in executive incentive contracts in re-
lation to another performance measure, stock price. In economics, there has been less study of perform-
ance measure properties, possibly because the issues have only recently been given theoretical emphasis.
Recent exceptions include Van Praag & Cools (2001) and Ortega (2002).
We contribute to this empirical literature by using a rich and unique dataset that we collected by
developing and administering a survey to managers in auto dealerships. Using a survey of our own design
allows us to study important issues in incentive system design that have been largely ignored to date, be-
cause data on these issues have not been available. The data include information on up to three bonuses
tied by formula to quantitative performance measures, discretionary bonuses based on subjective perform-
ance evaluations, and implicit incentives (e.g., promotion prospects). The survey includes five questions
asking about the properties of performance measures used for each formula bonus. There are two indica-
tors for the risk of the performance measure. There are also two indicators for the extent to which the
measure distorts incentives: causing a short-term emphasis or (not) encouraging cooperation. These are
two of the most common examples of potential distortions from quantitative performance measures that
are discussed in the economics and accounting literatures. Finally, there is an indicator of the extent to
which the measure motivates manipulation to improve measured performance.
We analyze the effects of performance measures on the incentives offered to the managers in our
sample. The results suggest that dealerships choose the “best” performance measure (in terms of risk, dis-

3
tortion, and potential for manipulation) among those available, and place the strongest incentives on a
bonus calculated from this measure. This “primary” bonus tends to be more prevalent and larger than bo-
nuses based on other performance measures. The functional form for the formula used to calculate the
primary bonus tends to be different from those of other bonuses as well. Thus, the structure of this pri-
mary bonus varies with the performance measure properties (risk, distortion, and manipulability) as pre-
dicted by traditional agency theory. We also find that the properties of this “best” performance measure
are an important consideration in determining other, implicit incentives (e.g., promotions or raises).
Some dealerships offer additional (“secondary”) formula bonuses based on other performance
measures. Our results suggest that these are used at least in part to adjust for weaknesses in the primary
performance measure – in particular, to rebalance multitask incentives and reduce incentives to manipu-
late the primary performance measure. For example, additional bonuses are more important when their
performance measures are relatively better at eliciting cooperation than is the performance measure on the
primary bonus. Similarly, discretionary bonuses based on subjective performance evaluations also appear
to play a role in reducing the employee’s incentives to manipulate performance.
Overall, our results suggest two key conclusions. First, performance measure properties are im-
portant to both the strength of incentives and to balancing multitask incentives. Second, interrelationships
between instruments illustrate that the incentive plan is a system of parts that work together, including
both formal incentives (formula bonuses based on quantitative performance measures) and informal in-
centives (discretionary bonuses and implicit rewards). Perhaps the strongest evidence in this regard is that
firms in our sample appear to use several instruments (second and third bonuses, implicit incentives, and
discretionary bonuses) to reduce the manager’s incentives for manipulation.
In the next section we develop the hypotheses. Section 3 describes the data. One important con-
tribution of this paper is to collect survey data on incentive issues that have been difficult to measure and
study previously. We hope that the results presented here are good evidence that such survey methods
have a promising role in future research on organizational economics. Section 4 presents our findings, and
Section 5 concludes.

4
2. THEORY
In this section, we develop our main predictions drawing on the recent agency literature analyzing
performance measures, notably Feltham & Xie (1994) and Baker (2002). Our goal is to motivate three
points. The first is that performance measure properties affect the weight given to a bonus in an incentive
system. The second is that multitask incentives are improved by using multiple performance measures,
because they have different relative properties (e.g., tendency to distort incentives). The third is that
judgment by the supervisor (such as for discretionary bonuses or other implicit incentives) can be used to
improve the overall evaluation given the properties of available performance measures. Our primary goal
is to analyze these issues empirically. Therefore, we briefly sketch out the theoretical points (not all of
which are captured in a single existing model in the literature), and then turn to the data.
In the remainder of this paper, we use the following terminology. Performance measure refers to
quantitative measures such as accounting profits or number of cars sold. Similarly, formula bonus refers
to a bonus that is calculated using a mathematical formula based on a quantitative performance measure.
In our dataset, we distinguish up to three formula bonuses, each using only a single performance measure.
The primary (or first) bonus is the most important as reported by the survey respondents. The secondary
(or second and third) bonuses are the other two that respondents may report being eligible for. Subjective
evaluation refers to evaluations of performance by the supervisor that are based on judgment and ulti-
mately cannot be verified the way performance measures can (though the supervisor may use perform-
ance measures as inputs into the subjective assessment). Subjective evaluations can include subjective
measures of performance, subjective weighting of quantitative measures, or both. In our dataset, many
managers are awarded a discretionary bonus based on such an evaluation. Implicit incentives refer to re-
wards other than bonuses, such as promotions or raises, that are awarded subjectively rather than through
a formula.

5
Incentives Based on a Single Measure
Consider a simple multitask agency problem (Baker 2002; based on Feltham & Xie 1994), with
employee actions a (bold refers to vectors), linear production function f, and linear performance measure
g, so that:
V = employee’s contribution to firm value = f•a + ε,
P = employee’s performance measure = g•a + φ.
The term a denotes an n-dimensional vector of employee actions, f represents marginal products
of effort, and g represents marginal effects of employee actions on the performance measure.1 ε represents
random factors that affect firm value, while φ represents performance measurement error. If the firm is
risk neutral, bonus contracts are linear and the employee has negative exponential utility with coefficient
of absolute risk aversion h, then Baker (2002) shows that the optimal incentive intensity if firm value V is
used as the sole performance measure is:
(1) ,h2²F
²Fb 2
*V
εσ+=
where F is the length of the vector f. (1) illustrates the familiar result that optimal incentives are de-
creasing in the employee’s risk aversion, increasing in the marginal product of effort, and decreasing in
the noise of the performance measure. Alternatively, we could rewrite (1) in terms of the signal to noise
ratio, F²/σε².
Similarly, the optimal incentive intensity if P is used as the sole performance measure is:
(2) .h2²G
)cos(GFb 2
*P
φσ+θ⋅⋅
=
1 Most of the predictions that we discuss could be derived from a single-task incentive model in which the agent’s actions cause positive or negative externalities on others in the firm (Lambert & Larcker 1987; Bushman, Indjejikian & Smith 1996). For example, additional performance measures could be used if they provide additional signals about performance that better capture the externalities. However, a multitask model is more realistic because the

6
As in (1), (2) also depends on the employee’s risk aversion, the marginal product of effort F, and the riski-
ness of the performance measure. It also depends on the marginal effect of effort on the performance
measure G (length of the vector g). The interesting new result in (2), however, is that incentives are de-
creasing in the extent to which g distorts incentives relative to f, cos(θ), which is the cosine of the angle
between the vectors f and g. For example, suppose that f and g are identical, so that the performance
measure has zero distortion. In that case, cos(θ) = 1. On the other hand, if f and g are orthogonal, then
cos(θ) = 0, and the performance measure has no value in the incentive system. These results illustrate
several important properties of any performance measure: they can be risky, they vary in the extent to
which employee actions affect the measure (and ultimately firm value), and they can distort incentives.
Another important property of performance measures that has not received much theoretical at-
tention in economics is that they may be manipulated by an employee to improve the performance meas-
ure, but not firm value (and perhaps at the expense of firm value). In the accounting literature, Feltham &
Xie (1994) discuss manipulation in the context of this model by describing manipulation as a case where
g includes some actions that are not in f. In other words, the employee can take actions that affect the
evaluation but not actual firm value. This is really a special case of distorted incentives (a measure can be
distorted by inappropriately weighting effects of some tasks that contribute to firm value, or by including
some tasks that do not affect firm value). This form of manipulation is predictable ex ante just as any dis-
tortion: it changes the employee’s relative incentives to perform different aspects of the job. Thus, a per-
formance measure should be given lower weight for incentives the more that it is manipulable in this
sense.
However, there is a second, more subtle sense of the term manipulation: in some cases, the em-
ployee gains specific knowledge after the incentive contract is set, during the evaluation period, which
may be used strategically to improve the performance measure. One way to model this type of manipula-
department managers we study have many aspects to their jobs. Moreover, the issues of distortion and manipulation

7
tion would be to assume that marginal products of effort or the marginal effects of effort on performance
are stochastic (that is, that f and/or g are stochastic), and that the employee observes a signal about the
state of nature prior to choosing effort (Baker 1992). Then the employee can respond to the situation op-
portunistically by optimizing the performance measure instead of firm value. In this case, manipulation of
the measure occurs in some states, but not in others, so the extent of the distortion in incentives is uncer-
tain when the contract is set. There are two implications in this case. First, the possibility of distortion in
incentives should lead the principal to put a lower weight on the performance measure for incentives.
Second, if the principal can observe her own signals about the state of nature, typically ex post (or at least
after the contract is written), then subjective evaluations can play a role in reducing distortions as well. Ex
post re-weighting of multitask incentives via subjective evaluations or implicit incentives can reduce ex
ante incentives for employees to manipulate performance (Gibbs, Merchant, Van der Stede & Vargus
2004).
Finally, while most agency models describe bonuses based formulaically on a performance meas-
ure, in practice performance measures are often (probably usually) used for other incentive instruments
that are more implicit, such as decisions about decision authority, promotions, and dismissal. Hence, we
expect that if a performance measure is used for these incentives at all, such use will vary with the per-
formance measure’s properties in the same ways that it would for formula bonuses.
Incentives Based on Multiple Measures
Consider the possibility of adding a bonus based on additional performance measures. There are
several reasons to do so (Feltham & Xie 1994). Additional performance measures could be used to reduce
the employee’s risk, to the extent that they are negatively correlated with the first performance measure.
Additional measures could also be used to reduce distortions. If one measure gives relatively strong em-
phasis to one dimension of performance, and another gives relatively less, then an incentive on the second
in practice seem to reflect multitask issues, not merely externalities.

8
could be used to rebalance incentives from the first. For example, Feltham & Xie (1994) show that a sec-
ond performance measure can reduce risk if it provides additional signals about uncontrollables that can
be used to “back out” measurement error from the first performance measure. They also show that a sec-
ond measure can reduce distortions if it measures the effects of some actions that the first performance
measure excludes (or more generally, does not properly weight). Similarly, Baker (2002) shows that when
both V and P are used in an incentive system, the weight on each is a decreasing function of its riskiness
relative to the other measure, and of its distortion relative to the other measure. In other words, the weight
on a performance measure depends on its properties relative to other performance measures that are used.
Empirical Predictions
The discussion above highlights several important properties of performance measures: their
riskiness; the extent to which they are controllable by employee actions; the extent to which they distort
incentives; and the extent to which they might be manipulated by the employee. Moreover, multiple per-
formance measures might be used in combination – with different bonuses given for each – to reduce risk
or distortions (including the simpler form of “manipulation”). Finally, supervisor judgment through a dis-
cretionary bonus or implicit incentives might also be used to reduce risk or distortions, and also to reduce
the potential for manipulation.
The incentive contracts that we study often involve more than one formula bonus based on quan-
titative performance measures (as well as discretionary bonuses and implicit incentives). However, ana-
lyzing the data (see below), it became clear that there tends to be a practical distinction between the “pri-
mary” bonus and other “secondary” bonuses. For example, for contracts with more than a single formula
bonus, one bonus is usually much larger than the others. Moreover, this primary bonus uses different per-
formance measures and the formula that calculates the bonus tends to have a different structure. This sug-
gests what seems to be a reasonable heuristic in setting up incentive systems. First, pick the best perform-
ance measure of those available: the one with lower risk, or lower distortions, or lower potential for ma-
nipulation (or some combination, depending on which of these concerns is most important). Second, if

9
necessary, choose secondary performance measures for additional bonuses to mitigate weaknesses in in-
centives from the primary bonus. While this is admittedly not an outcome of formal theory, it seems emi-
nently reasonable as a practical approach, and is consistent with our discussions with auto dealership
managers and industry consultants. To the extent that this is valid, we would expect that the first set of
theoretical considerations discussed above – risk, distortion, and potential for manipulation – would be
most important in determining the incentive intensity for the primary bonus. Then secondary bonuses
would be designed more as a function of their performance measure properties relative to the properties
of the first performance measure.
Thus, our predictions about properties of the performance measure for the primary bonus are:
1. The primary performance measure will be given greater weight (for both the primary bo-nus and implicit incentives), the lower its risk, distortion, or potential for manipulation.
2. The primary performance measure will have lower risk, distortion, or potential manipu-lation than the second or third performance measures.
We argued that additional performance measures could be used to reduce risk, distortions, and
manipulation (Feltham & Xie 1994; Baker 2002). With our data, however, it is not possible to test for the
possibility that additional performance measures could reduce risk from incentives on an initial perform-
ance measure,2 so for the secondary bonuses we focus on their use in reducing distortions or manipula-
tion. We predict that:
3. The second and third performance measures will be given greater weight, the lower their distortion or potential for manipulation relative to the primary performance measure.
Finally, discretionary bonuses might be used to improve the overall evaluation and incentive con-
tract, given properties of available performance measures. Such bonuses are based on ex post evaluations,
so they may be particularly useful as a form of ex post settling up if the supervisor observes signals about

10
performance measurement error incorporated into quantitative performance measures, or the employee’s
strategic behavior (distortion or manipulation). Hence, we predict that:
4. Discretionary bonuses are more likely to be used, the greater the risk, distortion, or po-tential for manipulation of the primary performance measure.
To test the predictions, we need data on incentive contracts, performance measures, properties of
these measures, and use of subjectivity for incentives. Some of these concepts are not available in tradi-
tional datasets, so we employ survey data to analyze variables that have not been studied before.
3. DATA
Data collection took place in collaboration with an automotive dealership-consulting firm. The
firm allowed us to develop a survey on incentive and organizational practices, and send it to their client
dealerships throughout the U.S. Prior to developing the survey, we spent a day at a large dealership in the
San Diego area interviewing the owner (who owns several dealerships) and personnel. This acquainted us
with the car dealer business, job design, and incentive issues for managers, and the language they use. In
addition, several years before the project, the consulting firm surveyed clients on incentive practices. We
used these survey questions and responses, and our field interviews, to develop our survey. The initial
version was scrutinized by five of the firm’s consultants, and discussed with them at length. A revised pi-
lot-test survey was mailed to 24 dealerships. Based on the pilot study, we changed the format of the com-
pensation questions significantly.
We developed five surveys, for the owner (A-survey), general manager (B), and the managers of
the service (C), new car sales (D), and used car sales (E) departments. The owner survey was relatively
short, asking about ownership, bonus payments, and owner demographics. The general manager survey
included questions about the dealership’s competitive environment, strategy, management practices, and
2 This would be the case when the second measure backs out some noise that is contained in the first measure. We do not have measures of such a statistical relationship between measurement errors in different performance measures.

11
performance. The service, new car, and used car department surveys were largely identical except for
relevant word substitutions. The most important part of surveys B-E asked detailed questions about the
structure of the compensation package, including salary, bonuses, performance measures, and subjective
evaluations. Outside the compensation section, the surveys principally contained Likert scales (that is,
responses coded on an integer scale, typically 1-5, representing strength of the answer to a qualitative
question). Of these, we use two multi-item scales to assess the degree of competition and dealer-
ship/department emphasis on customer service in this study (see Appendix).
We mailed the final set of five surveys in March 1999 to 1,203 dealerships, along with both our
cover letter and a letter from the consulting firm stating their support for the study. We sent a reminder
letter (without replacement) to non-participants after four weeks. Six weeks after that, we did a telephone
follow-up to dealerships from which we had received at least one survey.3 We received 1,057 surveys
(A:277; B:250; C:205; D:186; E:139), or 18% of those mailed. A few surveys were not useful, most com-
monly because they were returned blank. Of the 185 D-respondents (new car), 39 had a combined new
and used car sales department, and hence were instructed to complete survey D only and discard E. At the
dealership level, we have at least one survey from 326 different dealerships, or 27%. We found no evi-
dence of sample selection bias on the basis of performance, size, geography, or manufacturer (e.g., for-
eign or domestic).
Where feasible, survey responses were keypunched by a professional data entry firm. Compensa-
tion contract data were coded in two steps. First, a doctoral student (who was knowledgeable about the
academic literature and partly involved in the survey design) coded the contracts literally as written by the
respondents; i.e., without interpretation or loss of information. Next, the authors went through each sur-
3 Our response rate could have been improved by a second follow-up with replacement (Dillman 1978). The first mailing and one follow-up (reminder letter) yielded 977 replies, leaving 5,038 non-replies. However, printing, ad-ministration, and mailing costs would have made the potential incremental replies prohibitively expensive. More-over, the consulting firm did not want us to approach their clients too aggressively.
12
vey to reduce variability in wording of performance measures and to double-check numerical entries. We
also called several respondents to ask for clarification. Finally, we conducted several data integrity checks
to further ensure coding accuracy.
Our sample is unusual, so we discuss briefly both the positive and negative features of the data.
First, the information covers formal incentive plans, subjective evaluations, respondent assessments of
various incentive system aspects, and organization design. To our knowledge, this is the most detailed
information on incentive plans yet studied. Much of the detail comes from the fact that we designed and
administered a survey, which allowed asking questions about topics that have rarely been studied in the
literature. However, survey data have downsides. It can be difficult getting surveys filled out; our sample
size is not very large. More importantly, survey data tend to be noisy: much of the information is, by its
very nature, perceptual and difficult to quantify. This is also true with our data. Such data can, however,
shed light on important questions that are otherwise difficult or impossible to study.
Our study also follows the relatively recent trend towards industry studies (e.g., Ichniowski, Shaw
& Prennushi 1997). A weakness of such studies, including this one, is that it is difficult to gauge how gen-
eralizable they are beyond the industry studied. None of our theoretical predictions and analyses, how-
ever, is specific to the auto dealer industry. Industry studies do have virtues. Because we had a good idea
of the kinds of jobs the respondents worked in, we were able to write questions that were less abstract and
better fit the context. In this sense it may be that our data are less noisy than those from general surveys of
participants in a wide variety of circumstances. Furthermore, by holding industry constant, much variation
is controlled for. In this industry, all firms have essentially the same organizational structures (except that
some combine new and used car sales into one department), with essentially the same job designs for
general and department managers across dealerships.
Variables
Formula Bonuses. Managers could earn up to three formula bonuses, calculated by formula as a
function of a quantitative performance measure. The survey, which we administered in early 1999, asked

13
for a description of the formula, including any floors, caps, or performance thresholds; commission rates;
and lump sum payments, for any such bonus the manager was eligible for in 1998.
Since the objective is to study incentives, ideally the commission rate or incentive intensity would
be of interest. However, there are several practical difficulties. First, contracts use a variety of perform-
ance measures, which are not comparable across departments or dealerships. Even when dealerships use
the same nominal measure, there is substantial variation in accounting methods used to calculate the
measure. Second, contracts often have multiple piecewise-linear segments with different commission
rates, and it is not clear which segment is relevant for incentives in a particular situation. Finally, contracts
also sometimes use lump-sum bonuses, which are not in the same form as linear commissions, and for
which the correct measure of incentive intensity is not clear. For these reasons, we analyze determinants
of the total bonus. Virtually all incentive theories predict that effort, and thus expected performance, will
be positively related to the strength of the incentive. Thus, the total bonus is a proxy for the strength of the
incentive, and has the virtue of being comparable across different dealerships, departments, bonus formu-
las, and performance measures. The bonus regressions are Tobits because all managers were eligible for a
bonus, but some did not receive one if performance was too low.4
Performance Measures. Most performance measures are variants on gross profit (revenue less
the cost of goods sold) or net profit (revenue less all accounting costs). Because the cost of goods sold is
generally the manufacturer’s invoice price on cars or parts, it is typically beyond the control of the man-
ager. Thus, gross profit is similar to revenue from the perspective of the manager, though it does motivate
4 Because the data include multiple observations from the same dealership, we ran all relevant analyses in the paper with Huber-White robust standard errors as a check. There were no important differences in inferences. In fact, there is substantial variety in incentive contracts (performance measures and formulas) for managers in the same dealer-ship, perhaps because they run different types of departments.

14
the manager to consider profit margin. A smaller number of contracts used units of car sales or of cars in
inventory as the performance measure.5
Properties of Performance Measures. The survey also included questions to assess five proper-
ties of each performance measure: “To what extent does this measure: (1) reflect factors outside your con-
trol; (2) reflect your overall performance; (3) cause you to focus on short-term goals; (4) encourage coop-
eration with other departments; and (5) motivate manipulating the measure to meet the performance tar-
get?” Responses were recorded on a fully-anchored scale ranging from 1 (Not at All) to 5 (Very High).
These five performance measures properties are the focus of our analyses.
It is often difficult to match agency theoretic concepts directly to data, because models tend to be
highly stylized. While our five available empirical measures are perhaps not perfect analogues of the
theoretical variables, we believe that they effectively proxy for the three key concepts of risk, distortion,
and manipulation, as follows.
The first is a proxy for the riskiness of the measure, in the classic sense of noise that is beyond the
employee’s control. Therefore, using standard agency theory, we predict that performance measures with
larger values of this proxy will be given weaker incentives. Previous studies using different proxies for
risk, however, have often been unsuccessful at finding a negative relationship between uncontrollable risk
and incentives (Prendergast 2002).
The theoretical analog of the second performance measure property is less clear. If a measure re-
flects the employee’s overall performance, it may mean that it does not have much uncontrollable risk. It
may also mean that there is risk, but that the employee has some control over it because signals about the
risk are observed prior to choosing actions. Finally, it could reflect that the marginal effects of the em-
5 Less than a handful of contracts involve penalties. These are for inventory performance measures, such as the number of cars on the lot for over 30 days. Virtually all measures are at or above the manager’s department level (that is, at the department, at a combination of departments such as new and used combined, or at the dealership level). Most new and/or used car sales department managers are evaluated based on their own department or dealer-

15
ployee’s actions on the measure are large. Regardless of the interpretation, a larger value for this variable
clearly indicates a “better” performance measure, so we predict that it will have a positive effect on the
strength of incentives.
The third and fourth properties are two of the most common distortions caused by accounting per-
formance measures. By their nature, accounting measures gauge performance in a given period, are
backward looking, and tend to ignore investments in intangibles; thus they tend to emphasize short-term
incentives. Similarly, the effects of an employee’s cooperation may not show up directly in accounting
measures. We predict that the first (i.e., short-term focus) will have a negative effect on the strength of
incentives, whereas the second (i.e., encourage cooperation) will have a positive effect.
The final performance measure property is a proxy for the extent to which the performance meas-
ure motivates manipulation. Recall that there are two senses to the term manipulation in practice. One is
caused by a performance measure that motivates employee actions that do not improve firm value. This is
more like what we term distortion – the measure is incomplete or incongruent with firm value, causing the
employee to focus on measured performance at the expense of firm value. The second is caused by an
employee observing private signals about the state of the world during production, and altering multitask
efforts strategically to improve the performance measure at the expense of firm value. Regardless of
whether this measure captures one or both of these types of manipulation, we predict that this variable
will have a negative effect on the strength of incentives.
Implicit Incentives and Discretionary Bonuses. For each performance measure the survey asked:
“If you fail to achieve target performance for this measure, to what extent do you believe that the follow-
ing will be adversely affected: operating autonomy; pay raise; promotion prospects; and continued em-
ployment.” Responses were recorded on a fully-anchored scale ranging from 1 (Not at All) to 5 (Very
High). The survey also asked for the amount of any discretionary bonus awarded in 1998.
ship profits. About 20% of service department managers receive their primary bonus based on profit of a subset of their department, with most of the rest being evaluated on departmental profit.

16
Controls. Although our primary focus is on the effects of performance measure properties, we
also include various controls in the analyses. Most regressions include dummy variables for whether the
manager is a general manager (instead of a department manager), or is a service department manager (in-
stead of a used or new car sales department manager). This is to control for broad differences in job de-
sign. Service department jobs may be more complex than those in sales departments, with more tasks that
are difficult to quantify. This may affect the implementation of multitask incentives. In particular, it may
mute overall formal incentives, if performance measures do not adequately weight hard-to-measure tasks
(Holmstrom & Milgrom 1991). We predict that general managers will have stronger incentives, because
of higher marginal product of effort, and service department managers will have weaker incentives (on
formula bonuses), because service department jobs are likely to involve many more tasks on which per-
formance is difficult to measure (e.g., quality of repairs, customer satisfaction, timeliness of service, and
appropriate billing of hours and use of replacement parts).
Along similar lines, we include a measure of the emphasis placed on customer service at the de-
partment (for department managers) or dealership (for general managers) level. We measure emphasis on
customer service from several survey questions that essentially assess the extent of dealership/department
focus on price vs. customer service. A factor analysis of these survey questions results in empirical scales
that match the customer service concept as expected (see Appendix). Similar to our argument above about
service department managers, we predict that incentives on formula bonuses will be weaker when there is
a stronger emphasis on customer service.
We also include a measure of the degree of competition (see Appendix). Recent work in agency
theory distinguishes between riskiness that is uncontrollable by the employee – noise as in classic agency
theory – and riskiness that may be at least partly controllable by the employee (Baker 1992; Prendergast
2002; Baker & Jorgensen 2002), and hence, to which the employee should respond dynamically. The ar-
gument is similar to the one we made above about the second type of manipulability. If the work envi-
ronment (marginal product of effort) is stochastic, and the employee observes signals about the state of
the world after the contract is written but before choosing actions, then the firm will want to provide some

17
incentives for the employee to exploit this specific knowledge to the advantage of the firm. Therefore, we
expect that employees will be given stronger incentives in more competitive environments in order to mo-
tivate them to react dynamically (Raith 2003).
Finally, agency theory predicts that the marginal product of effort is a determinant of the strength
of incentives. As proxies for this, we include the number of employees reporting to the manager (a meas-
ure of resources under the manager’s control),6 and the manager’s experience in the position (a measure
of human capital). We predict that both will be positively related to the strength of incentives.
Sample Statistics
Out of 274 owners, 272 indicated that their dealership is privately held. They have owned their
dealership for 21 years on average, and average ownership share is about 67%. About 52% of respondents
own just one dealership; 17% own two; 10% own three; the rest own four or more. Fifty-four percent of
the general managers are in charge of just one dealership; 23% two; the rest manage three or more. The
average number of employees in a dealership is 91. About a fourth of dealerships integrate new and used
car sales into one department. Departments tend to have about 10-30 employees. Managers have a large
amount of industry experience – 15 years or more – on average.
Not all managers earned a base salary; for example, only 80% of new car sales managers did so.
Since sales is such a large part of a dealership’s business, it is perhaps not surprising that salespeople
sometimes receive no base salary, and instead are paid purely on commission. Most received at least one
formula bonus. In addition, roughly 25% received a second, and another 10% received a third. Bonuses
were labeled 1-3 by the order in which respondents listed them. Bonus 1 was always the largest in terms
of the actual size of bonuses in all but a handful of cases. Because the first formula bonus listed by re-
spondents is almost always largest, and is much more likely to be received, we refer to this bonus in the
6 Using industry or dealership experience yielded similar results.

18
analyses below as the primary bonus. The performance measure associated with it is referred to as the
primary performance measure.
About 20-25% received a discretionary bonus, and the average discretionary bonus was about the
same as the average second formula bonus, or about one-third to one-half of salary. In other work, we ex-
amine the use of discretionary bonuses in detail (Gibbs, Merchant, Van der Stede & Vargus 2004). Finally,
dealers sometimes offer small, idiosyncratic incentives, often called spiffs, such as travel incentives or
small monetary rewards sponsored by the manufacturer. Since the manufacturer typically implements
these with little control by the dealership (and we have no information on how they were awarded), we do
not focus on spiffs in this paper.7
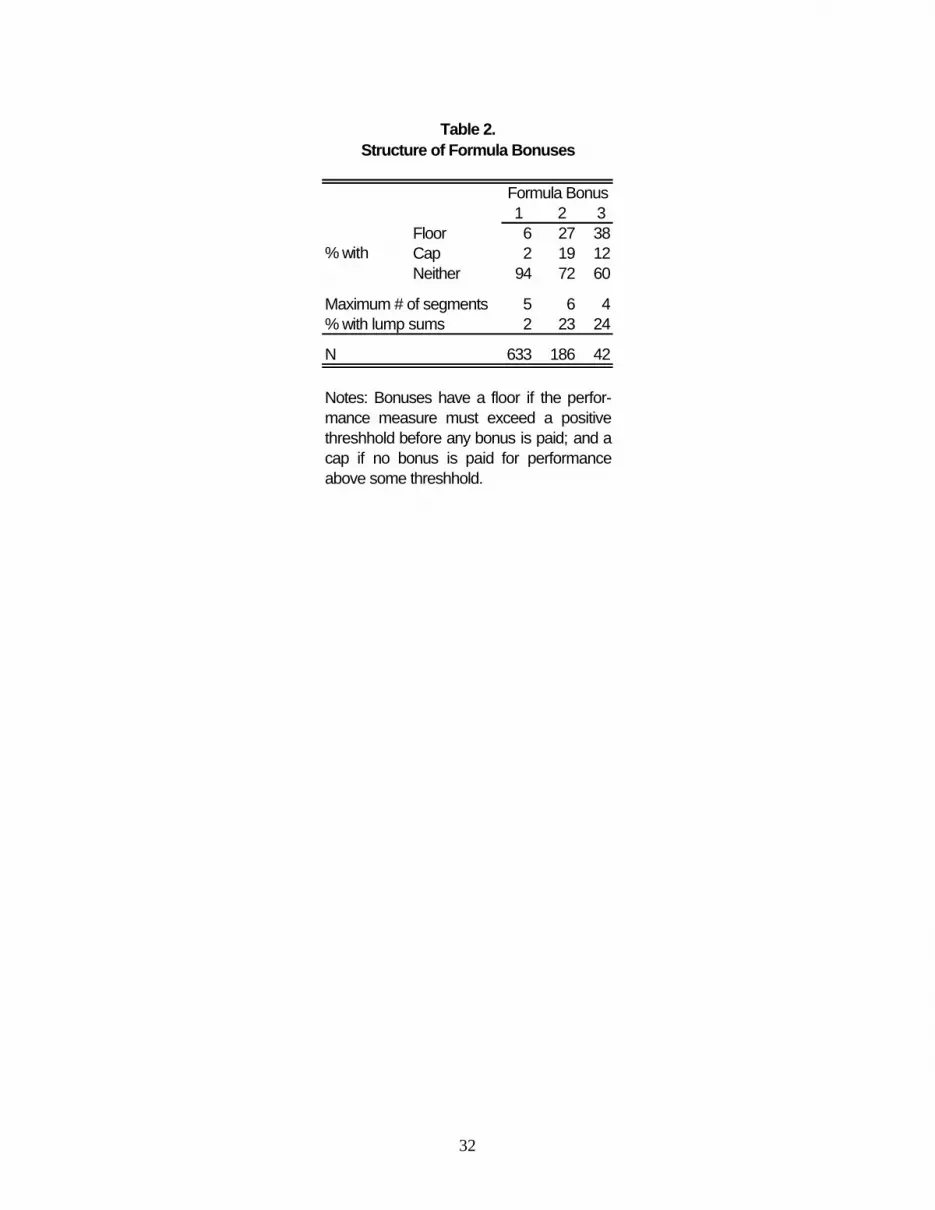
Table 2 provides summary statistics on bonus formulas. There does seem to be a practical dis-
tinction between the primary bonus and the other two. First consider primary bonus formulas. Few have a
floor, or threshold that performance must exceed before the bonus is earned (however, all have at least an
implicit threshold at zero performance). Even fewer have a cap, or maximum bonus. Only 2% involve
lump sum payoffs; all of the rest are piecewise linear, with up to five different slopes. Incidentally, all are
convex: where there are multiple segments, slopes are always steeper for higher levels of performance.
This is consistent with declining marginal utility of income, or increasing marginal disutility of effort.
The formulas for the second and third bonuses look quite different from those for the primary bo-
nus. They are much more likely to have a floor or a cap. They are also more likely to involve lump sum
bonuses, either in addition to or instead of piecewise linear commissions. The lump sum bonuses can be
quite large in some cases. One interpretation for the prevalence of lump sums is that these provide a crude
adjustment to balance multitask incentives. By providing thresholds and lump sum bonuses based on
other performance measures, they provide some incentives for the manager to put forth at least some ef-
fort toward tasks that are not well motivated by the primary measure. Such an approach may be adequate,

19
compared to using linear commissions for the second and third measures, for tasks for which it is costly to
have very low levels of effort, but beyond some level there is little additional upside to greater effort on
that task (Lazear 1998). An example might be safety or quality oriented tasks. At some point, performance
is already so good that further effort is too costly given the incremental improvement in performance. Re-
gardless of the explanation, prevalence of lump sums in the second and third formula bonuses, and lack in
the first, seems consistent with the idea that they are intended to play different practical roles. Overall, the
patterns in Tables 1-2 of the first bonus compared to the second and third bonuses provide preliminary
evidence in support of our second prediction.
4. RESULTS
Determinants of the Primary Bonus
Table 3 presents analyses of the determinants of the primary formula bonus. The regressions pro-
vide relatively good support for our predictions outlined in our first prediction. Almost all of the coeffi-
cients on the five performance measure properties have the predicted signs. When the primary perform-
ance measure reflects factors outside the manager’s control, and thus is more risky, it is significantly
likely to lead to a lower primary bonus for department managers, though not for general managers. Thus,
we do find at least some evidence that incentives are weaker when performance measures contain more
uncontrollable risk. When a measure better reflects the manager’s overall performance, it tends to lead to
higher bonuses for general managers.
Distortions also seem to matter for the weight placed on performance measures. A short-term fo-
cus leads to significantly lower bonuses for general managers and the overall sample. If the measure en-
courages cooperation, the effect is even stronger, and applies to the department manager sample as well.
7 More generally, manufacturers play no role in the setting of incentive contracts within dealerships.

20
However, the results regarding potential manipulation are not as strong as expected. Although all
three coefficients are negative, none is significant. One interpretation is that manipulation is likely with
all available quantitative performance measures, and so the dealership must address manipulation through
other incentives. We provide evidence on this point below.
The regressions in Table 3 also show strong support for more traditional predictions of incentive
models. Proxies for the manager’s marginal product of effort or human capital generally increase the
strength of estimated incentives. The degree of competition, our proxy for controllable risk, is signifi-
cantly related to incentives, especially for general managers (consistent with Raith 2003). Finally, proxies
for difficulty of measuring performance (such as in service departments and in dealerships/departments
that put more emphasis on customer service) tend to be negatively related to the strength of incentives, as
predicted.
Table 4 provides evidence on the effects of properties of the primary performance measure on
implicit incentives. For the performance measure used for each formula bonus, the survey included ques-
tions about how the measure was potentially used for implicit incentives for operating autonomy, pay
raises, promotions, and continued employment. Table 4 presents ordered probits with these as dependent
variables, with the same independent variables as in Table 3.
Two of the most important roles for discretion in incentives are to reduce risk by filtering out the
effects of some measurement error from the employee’s total evaluation; and to reduce the employee’s
incentive to distort their efforts or manipulate the measure (Gibbs, Merchant, Van der Stede & Vargus
2004). Both require using ex post signals about effort or the production environment to “fix” problems
with quantitative performance measures. Consider first the objective of reducing risk. The riskier the
measure, the less should it be used for either explicit or implicit incentives. Therefore, the predicted sign
on the coefficient for this property in Table 4 is negative. By contrast, the second measure could be inter-
preted as a proxy for low risk; it is an overall indicator of the precision of the measure. Therefore, we pre-
dict it to have a positive coefficient.

21
Now consider the second objective, reducing incentives to distort effort or manipulate perform-
ance. If a performance measure is more likely to distort effort or be manipulated, implicit incentives are
more likely to be affected, in order to reduce the temptation. Consider, for example, a case where the pri-
mary performance measure is reported to highly motivate manipulation. If the manager failed to meet tar-
get performance for that measure, even though it is highly manipulable, then it is even more likely that the
manager had very poor performance – so poor that even manipulation could not get it above the target.
On the other hand, if performance was very high, it might have been caused by manipulation. In either
case, implicit incentives are likely to play some role in improving the evaluation and overall pay-
performance link. Hence, we predict a positive coefficient on the manipulation variable in Table 4. A
similar argument applies to the extent to which the measure causes a short-term focus. We have no spe-
cific prediction about the effect of the fourth property (encourages cooperation) on implicit incentives.
Table 4 provides evidence that some properties of the primary performance measure affect im-
plicit incentives, though not all. The more that the primary measure reflects the manager’s overall per-
formance, the more likely is it to be taken into consideration for implicit incentives. The finding that this
property affects the manager’s operating autonomy is suggestive of the idea that managers will be given
greater decision rights if they can be given incentives based on performance measures that are better
aligned with firm value (Jensen & Meckling 1992). The other strong result in Table 4 is that manipulation
appears to be addressed through implicit incentives. All measures of implicit incentives are significantly
more likely to be affected by the primary performance measure if the measure is more likely to motivate
manipulation. Many kinds of manipulation are detected ex post, so implicit incentives or discretionary
bonuses are probably the only way to deter manipulative behavior. Since potential for manipulation did
not appear to reduce use of the primary performance measure in formula bonuses (in Table 3), it is inter-
esting to see that dealerships do appear to address manipulation through the use of judgment rather than
reducing formula incentives. The same is generally not true, however, for the measure of distortion (short-
term focus). Perhaps manipulation tends to be easier to detect ex post, or requires more judgment.

22
Relationships between the Primary and Other Bonuses
Tables 1-2 showed evidence consistent with the idea that additional bonuses play a different role
than the primary bonus. Table 5 presents a formal analysis of our second prediction, that the primary per-
formance measure will tend to have better properties (lower risk, distortion, and potential for manipula-
tion) than measures used for the second and third bonuses. The table shows summary statistics for the five
performance measure properties for all three formula bonuses.
Larger values of the second and fourth, and smaller values of the first, third and fifth properties,
indicate a better performance measure. The second column of Table 5 shows the predicted comparison of
means between a pair of performance measures (PM1 v. PM2; PM1 v. PM3; PM2 v. PM3). For example,
we predict that the primary measure will have lower average values on the extent to which the measure
reflects factors outside the manager’s control than will the second or third measure. We do not predict that
the second measure will tend to have better properties than the third, since these measures are viewed as
adjustments to the primary performance measure. However, it would not be surprising that this is the case,
since the manager listed the second bonus before the third, which may reflect a preference ordering, so
those statistics are also provided. To test the predictions in column 2, we conduct t-tests comparing the
means.8
On the first performance measure property (factors outside the manager’s control), the null that
the primary performance measure has the same value as the second or third measure is strongly rejected.
Instead the primary measure is more likely to have a lower (better) value reported, as predicted. Similarly,
the differences are as predicted for the second and fourth properties: the primary measure is significantly
more likely to reflect the manager’s overall performance, and to encourage cooperation, than are the other
performance measures.
8 We perform t-tests using the full set of data on all three performance measures, and also on the restricted sample where the manager had earned both bonuses. Inferences were unchanged for both sets of tests.

23
However, the patterns in relative values of the third and fifth properties are the opposite of what
was predicted. The primary measure is more likely to cause a short-term focus, and is also more likely to
be manipulated by the manager. Perhaps this should not be surprising, however. The primary measure is
most likely to be a measure of annual revenue or profits. Such a measure is certainly short term, and fi-
nancial measures are often manipulable (e.g., “sandbagging” sales or expenditures near the end of the cal-
endar year to manipulate which year they are credited/debited to – see Demski, Frimor & Sappington
2004). Moreover, most performance measures available in a dealership are financial, and likely to have
these properties. It may be that the best way to address such problems is through implicit incentives or
discretionary bonuses. Table 4 already shows this for manipulation.9
Finally, one interpretation suggested by Table 5 is that the primary performance measure is cho-
sen largely because it has the lowest risk, and is most under the manager’s control. Secondary bonuses are
then used more to improve distorted incentives (especially for cooperation). Given the large weight and
prevalence of the primary bonus compared to the second and third bonuses, this seems plausible since it is
the largest component of the employee’s bonus income.
Table 6 presents evidence on the third (multitask incentive) prediction that the second and third
bonuses will be used to rebalance distorted incentives, and to deter manipulation of the first performance
measure. To examine this, the table presents Tobits predicting the magnitude of the second and third bo-
nuses. The key independent variables are ratios of their performance measure properties, divided by the
9 There is a potential bias in Table 5. We would prefer that the respondents answered questions about the perform-ance measure properties independently from the weight that was placed on them for their incentives. Greater weight might magnify their response to the last three questions, which are worded in such a way that they evoke incentive responses (cause short-term focus; encourage cooperation; motivate manipulation). If so, this would bias responses toward larger values (“Very High” rather than “Not at All”) for the primary measure compared to measures two or three, and for measure two compared to measure three. This would make it more difficult to reject the hypothesis for the third and fifth property, and easier to reject for the fourth. Given this potential bias, the evidence in Table 5 (combined with Tables 1-2) seems largely consistent with the idea that the primary performance measure tends to have better properties.

24
corresponding values for the primary performance measure.10 For example, suppose that the first measure
only weakly encourages cooperation. Ceteris paribus, it is more valuable to put weight on a second meas-
ure if it is relatively effective at encouraging cooperation. This is similar to the predictions from the two
performance measures version of Baker’s model (2002).
Table 6 shows support for our third prediction for some performance measure properties, but not
for all. In general, most of the signs are in the predicted directions. The estimated effects are not signifi-
cant for the variable measuring the relative extent to which the second or third performance measure
causes a short-term focus. However, the results do show statistical significance for the relative extent to
which the second or third measure encourage cooperation, and the relative extent to which they are poten-
tially manipulable. The second and third performance measures appear to be used to improve incentives
for cooperation in cases where the primary measure does not do so. Similarly, they appear to be used to
reduce temptations to manipulate performance.
Table 7 provides evidence on the fourth prediction, that discretionary bonuses might be used to
back out of the overall evaluation any detected measurement error or manipulation of performance meas-
ures by the employee. We focus on the effects of the primary performance measure’s properties on discre-
tionary incentives. Such backing out is only relevant to the extent that the employee actually received a
bonus based on the performance measure. For example, suppose that a performance measure is reported
to reflect factors outside the manager’s control, which we interpret as uncontrollable noise in the measure.
This means that the measure will reward the employee for good luck, and punish for bad luck. The princi-
pal might reduce risk by including other signals about performance or measurement error, through ex post
subjective evaluations. If this is the case, the discretionary bonus will tend to be smaller when the primary
10 The models in Table 6 do not include all of the controls used in Table 3, because our presumption is that the most important issue in setting second or third bonuses is to balance incentives relative to the primary bonus. Including all of the controls in Table 6, however, does not change the conclusions.

25
bonus is larger (to reverse some of the reward for good luck), and vice versa. Similarly, suppose that the
measure is reported to be highly manipulable. If the employee has good performance and is awarded a
large primary bonus, then there is some chance that the bonus was based in part on manipulation of the
measure, so the prediction is that the discretionary bonus will be smaller when the primary bonus is large,
and vice versa. A similar argument applies to the extent to which the measure encourages short-term
thinking, since the manager might make short-term decisions in order to improve the performance meas-
ure (and especially to meet any performance targets in the bonus formula). For these reasons, in the re-
gressions in Table 7, these three performance measure properties are interacted with the overall level of
the primary bonus (measured in $1000s).
Table 7 also includes several other variables that might affect the use of discretionary bonuses.
The degree of competition is a proxy for the possibility of controllable risk. Discretionary bonuses can be
an effective way to motivate employees to make use of their specific knowledge during the evaluation
period, since they are ex post evaluations. We thus predict a positive coefficient on this variable. Empha-
sis on customer service is a measure of the difficulty of quantitative performance measurement. Standard
multitask incentive theory predicts that formal bonuses will be less important when performance is more
difficult to measure. But an alternative is to use subjective evaluations instead. If this is true, then we ex-
pect a positive coefficient on this variable. Finally, for subjective evaluations to be an effective part of an
incentive system there has to be adequate trust between the manager and the supervisor. As a crude proxy
for this, we include the manager’s years of experience in the current position, under the revealed prefer-
ence argument that the longer someone has been in the job, the more they have developed a good working
relationship with their supervisor (Gibbs, Merchant, Van der Stede & Vargus 2004). Again, a positive co-
efficient is predicted for this variable.
Finally, it is not clear whether the level of discretionary bonus is important or not. It may be the
case that simply using some discretion to adjust for an inadequate primary performance measure is what is
necessary. For this reason, Table 7 shows both a Tobit and a Logit for the discretionary bonus.

26
The key finding in both regressions in Table 7 is that the discretionary bonus appears to be
smaller when the primary bonus was larger and was based on a measure that was more likely to motivate
manipulation. This appears to be part of a multi-pronged strategy: as shown above, manipulation is also
addressed through implicit incentives such as promotion prospects (Table 4), and through the second and
third bonus (Table 6). The fact that we find four different instruments (both other formula bonuses, im-
plicit incentives, and the discretionary bonus) by which manipulation is addressed may explain why the
potential for manipulation does not seem to affect the primary bonus, and why we found no evidence in
Table 5 that the primary bonus is less manipulable than the second or third.
Table 7 also reveals that the use of discretionary bonuses is more important for managers with
greater experience in their current position, consistent with the idea that good relational contracting is im-
portant to the effective use of discretion in incentive systems. The other predictions are not supported.
5. CONCLUSIONS
In this paper we studied an important component of incentive systems that has received little
theoretical or empirical attention in economics: properties of performance measures. We find clear evi-
dence that performance measure properties matter to incentives (both formula bonuses and implicit incen-
tives such as promotion prospects and threat of dismissal). The riskiness of the bonus tends to reduce its
use for incentives. Similarly, the extent to which the measure distorts incentives (especially for coopera-
tion; to a lesser extent for short-term focus) reduces the weight it is given. However, we do not find that
potential for manipulation reduces the weight placed on the measure for a formula bonus. It may be that
most available measures at auto dealerships, which are some version of revenues or profits, inevitably
have a short-term focus and may be manipulable.
Though not our focus, our evidence corroborates some familiar predictions of agency theory. In-
centives tend to be stronger when the manager has greater human capital, the marginal product of effort is
larger, and there is greater controllable risk (measured by the extent of product-market competition). The

27
latter result provides some evidence consistent with recent models of controllable risk and incentives
(Prendergast 2002; Baker & Jorgensen 2002).
Performance measure properties also appear to be an important consideration for multitask incen-
tives. Many managers earn a second or third formula bonus. We present evidence in support of our predic-
tion that the firm chooses the “best” performance measure, and uses that for the primary formula bonus. It
then uses other formula bonuses to rebalance incentives to reduce distortions (particularly with respect to
cooperation), and to reduce temptations to manipulate performance. There is no significant evidence that
other bonuses are given greater weight when the primary measure is relatively riskier, however (though
the estimated signs were usually in the expected direction). These interactions between bonuses differ
markedly from most of the empirical literature on multitask incentives. Much of the literature has focused
on the idea that overall incentives will tend to be muted when some tasks are more difficult to measure
than others (e.g., Slade 1996). Here we emphasize a different aspect – that a set of bonuses based on dif-
ferent performance measures might be used to balance incentives across multiple aspects of the job.
Importantly, performance measure properties play a role when firms use implicit incentives to
balance multitask incentives. The primary measure’s properties affect the manager’s operating autonomy,
raise, promotion prospects, and threat of dismissal. The extent to which the measure reflects the man-
ager’s overall performance, and has potential for manipulation, have the most important effects on these
implicit incentives. In addition, the managers often earn discretionary bonuses. These bonuses appear to
be used in part to reduce incentives to manipulate quantitative measures. In related work (Gibbs, Mer-
chant, Van der Stede & Vargus 2004), we found that the firms in this sample appear to use discretionary
bonuses to compensate the manager for low performance in some cases, presumably to reduce the man-
ager’s downside risk from imperfect performance measures.
To study these questions, we collected a rich dataset on incentive systems in automobile dealer-
ships. By developing and administering a survey, and focusing on a single industry, we were able to ob-
tain more detail on incentive practices than is available in typical datasets. The data include information
on important aspects of incentive systems that have been relatively under-studied, such as properties of

28
performance measures, manipulation of performance, behavioral aspects of incentive contracts, and sub-
jective performance evaluation. One of the goals was to analyze incentive issues that have not been exten-
sively studied. Another was to explore the value of using survey data to measure concepts that are diffi-
cult to obtain data for, largely because they are difficult to quantify. We feel that the results presented here
other are encouraging, and that more collection of similar data would yield valuable insights into the
structure and effects of incentive systems.

29
REFERENCES
Baker, George (1992). “Incentive Contracts and Performance Measurement.” Journal of Political Econ-omy 100(3): 598-614.
_____ (2002). “Distortion and Risk in Optimal Incentive Contracts.” Journal of Human Resources 37(4): 728-752.
_____ & Bjorn Jorgensen (2002). “Turbulence, Risk, and Incentives.” Working Paper, Harvard Business School.
Banker, Rajiv D. & Srikant M. Datar (1989). “Sensitivity, Precision, and Linear Aggregation of Signals for Performance Evaluation.” Journal of Accounting Research 27 (Spring): 21-39.
Bushman, Robert, Raffi Indjejikian & Abbie Smith (1996). “CEO Compensation: The Role of Individual Performance Evaluation.” Journal of Accounting and Economics 21 (April): 161-193.
Demski, Joel S., Hans Frimor & David E. M. Sappington (2004). “Efficient Manipulation in a Repeated Setting.” Journal of Accounting Research 42 (1): 31-49.
Dillman, Don A. (1978). Mail and Telephone Surveys: The Total Design Method. NY: Wiley.
Gibbs, Michael, Kenneth A. Merchant, Wim A. Van der Stede & Mark E. Vargus (2004). “Determinants and Effects of Subjectivity in Incentives.” The Accounting Review 79(2): in press.
Holmstrom, Bengt (1979). “Moral Hazard and Observability.” Bell Journal of Economics 10: 74-91.
_____ & Paul Milgrom (1991). “Multitask Principal-Agent Analyses: Incentive Contracts, Asset Owner-ship, and Job Design.” Journal of Law, Economics, and Organization 7: 24-52.
Ichniowski, Casey, Kathryn Shaw & Giovanni Prennushi. (1997). “The Effects of Human Resource Man-agement Practices on Productivity: A Study of Steel Finishing Lines.” American Economic Review 87(3): 291-313.
Ittner, Christopher D. & David F. Larcker (2002). “Determinants of Performance Measure Choices in Worker Incentive Plans.” Journal of Labor Economics 20(2): S58-91.
_____, _____ & Madhav V. Rajan (1997). “The Choice of Performance Measures in Annual Bonus Con-tracts.” The Accounting Review 72(2): 231-255.
Jensen, Michael & William Meckling. 1992. “Specific and General Knowledge and Organizational Struc-ture.” In Contract Economics, eds. Lars Werin and Hans Wijkander. Oxford: Blackwell.
Lambert, Richard A. & David F. Larcker (1997). “An Analysis of the Use of Accounting and Market Measures of Performance in Executive Compensation Contracts.” Journal of Accounting Research 25 (supplement): 85-125.
Lazear, Edward P. (1998). Personnel Economics for Managers. New York: Wiley.

30
Ortega, Jaime (2002). “Employee Discretion and Performance Pay: Testing Multi-Task Theory.” Working Paper, Universidad Carlos III de Madrid.
Prendergast, Canice (1999). “The Provision of Incentives in Firms.” Journal of Economic Literature 37: 7-63.
_____ (2002). “The Tenuous Tradeoff between Incentives and Risk.” Journal of Political Economy 110(5): 1071-1102.
Raith, Michael (2003). “Competition, Risk, and Managerial Incentives.” American Economic Review 93:1425-1436.
Slade, Margaret (1996). “Multitask Agency and Contract Choice.” International Economic Review 37(2): 465-486.
Van Praag, Mirjam & Kees Cools (2001). “Performance Measure Selection: Aligning the Principal’s Ob-jective and the Agent’s Effort.” Working Paper, University of Amsterdam.

31
New Used Service
GMs who are owners 26% — — —New / Used combined — 24% — —# direct reports 22.5 17.0 11.0 29.2Years of industry experience 20.9 15.6 17.1 23.2N 250 185 136 205
Total Compensation $179,915 $71,830 $70,813 $61,935
Salary 94% 80% 80% 87%Formula Bonus 1 65% 58% 59% 64%Formula Bonus 2 10% 25% 25% 24%Formula Bonus 3 4% 11% 10% 10%Discretionary Bonus 20% 24% 24% 20%Spiffs 8% 16% 10% 32%
Salary $80,672 $33,555 $34,050 $33,247Formula Bonus 1 130,893 53,635 47,715 37,462Formula Bonus 2 31,629 20,070 21,050 9,866Formula Bonus 3 48,633 9,197 12,099 6,579Discretionary Bonus 36,449 20,135 13,295 10,728Spiffs 9,174 4,239 2,190 3,427
Notes: Means for components of compensation calculated only for managersreceiving a positive amount. % Receiving is less than % eligible becausemanagers did not receive a bonus when performance was too low. "New"statistics include departments that combine New and Used car sales.
% Receiving
$ if Received
Table 1.Summary Statistics
Department ManagersGeneralManager
a. Department Characteristics
b. Manager's Compensation
32
1 2 3Floor 6 27 38Cap 2 19 12Neither 94 72 60
Maximum # of segments 5 6 4% with lump sums 2 23 24
N 633 186 42
% with
Notes: Bonuses have a floor if the perfor-mance measure must exceed a positivethreshhold before any bonus is paid; and acap if no bonus is paid for performanceabove some threshhold.
Table 2.Structure of Formula Bonuses
Formula Bonus

33
Coef. SE Coef. SE Coef. SE
Intercept -119,861 51,921 -252,872 173,505 -33,948 22,873 ***
Reflects factors outside mgr.'s control – -3,917 5,730 2,866 15,655 -4,986 2,709 **Reflects mgr.'s overall performance + 20,729 5,831 *** 41,745 16,240 *** 4,775 2,712 **Causes short term focus – -5,840 5,177 * -23,256 14,686 ** 657 2,384Encourages cooperation + 13,595 5,126 *** 33,783 18,839 ** 6,643 2,175 ***Motivates manipulating the measure – -2,724 4,112 -3,542 11,482 -1,322 1,895
# of employees + 130 249 -52 495 306 162 **Degree of competition + 15,747 7,346 ** 82,217 27,332 *** 2,094 3,094Emphasis on customer service – -10,826 8,354 * -69,255 27,919 *** 4,723 3,637
Experience + 2,654 958 *** 6,989 2,773 *** 733 440 **General Manager + 74,411 14,020 ***Service Department manager – -2,852 14,967 -13,738 6,084 ***
N% Bonus > 0
Manager characteristics
Job characteristics
Performance measure properties
Table 3.Determinants of Primary Formula Bonus
All Dept. ManagersGeneral ManagersPred.sign
Notes: Tobits predicting the magnitude of Formula bonus 1. SE = standard error. *** = significant at 1%; ** = 5%; * = 10%. Predicted signsof coefficients are shown after variable names; 1-tailed tests in those cases. The first 5 variables are responses to survey questions (1-5scale) asking about properties of performance measures. The variables "Degree of competition" and "Emphasis on customer service" areconstructured from several survey questions using factor analysis (see Appendix A). See Section 3 of the text for more information onvariables.
40972%
57076%
16186%

34
Coef. SE Coef. SE Coef. SE Coef. SE
Reflects factors outside mgr.'s control – 0.147 0.048 0.091 0.048 0.006 0.048 0.121 0.048Reflects mgr.'s overall performance + 0.151 0.049 *** 0.111 0.049 *** 0.082 0.049 ** 0.164 0.049 ***Causes short term focus + 0.034 0.043 0.002 0.043 0.097 0.044 *** 0.048 0.043Encourages cooperation ? 0.004 0.043 0.004 0.042 0.06 0.043 -0.016 0.042Motivates manipulating the measure + 0.124 0.034 *** 0.078 0.034 *** 0.115 0.034 *** 0.103 0.034 ***
General Manager -0.272 0.114 ** -0.366 0.112 *** -0.581 0.115 *** -0.459 0.114 ***Service Department manager 0.128 0.11 -0.026 0.109 -0.268 0.11 ** -0.063 0.109
Cutoffs 1 0.457 0.266 -0.096 0.263 0.18 0.27 0.466 0.2712 1.279 0.268 0.52 0.263 0.867 0.271 1.233 0.2733 2.307 0.274 1.133 0.265 1.703 0.274 2.114 0.2784 3.09 0.287 1.909 0.27 2.528 0.282 2.691 0.285
NLikelihood RatioProb. > χ²
Pred.sign
Performance measure properties
0.00
580
0.00
587
0.0058.15 33.21 67.75 62.24
Table 4.Effects of Performance Measure Properties on Implicit Incentives
d. Continued Employment
Notes: Dependent variables are responses to: "If you fail to achieve target performance for this measure, to what extent do you believe that thefollowing will be adversely affected?" Survey responses scaled 1-5: 1 = Not at All, 2 = Low, 3 = Medium, 4 = High, 5 = Very High. SE = standarderror. *** = significant at 1%; ** = 5%; * = 10%. Predicted signs of coefficients are shown after variable names; 1-tailed tests in those cases.
a. Operating Autonomy
b. Pay Raisec. Promotion Prospects
583
0.00
588
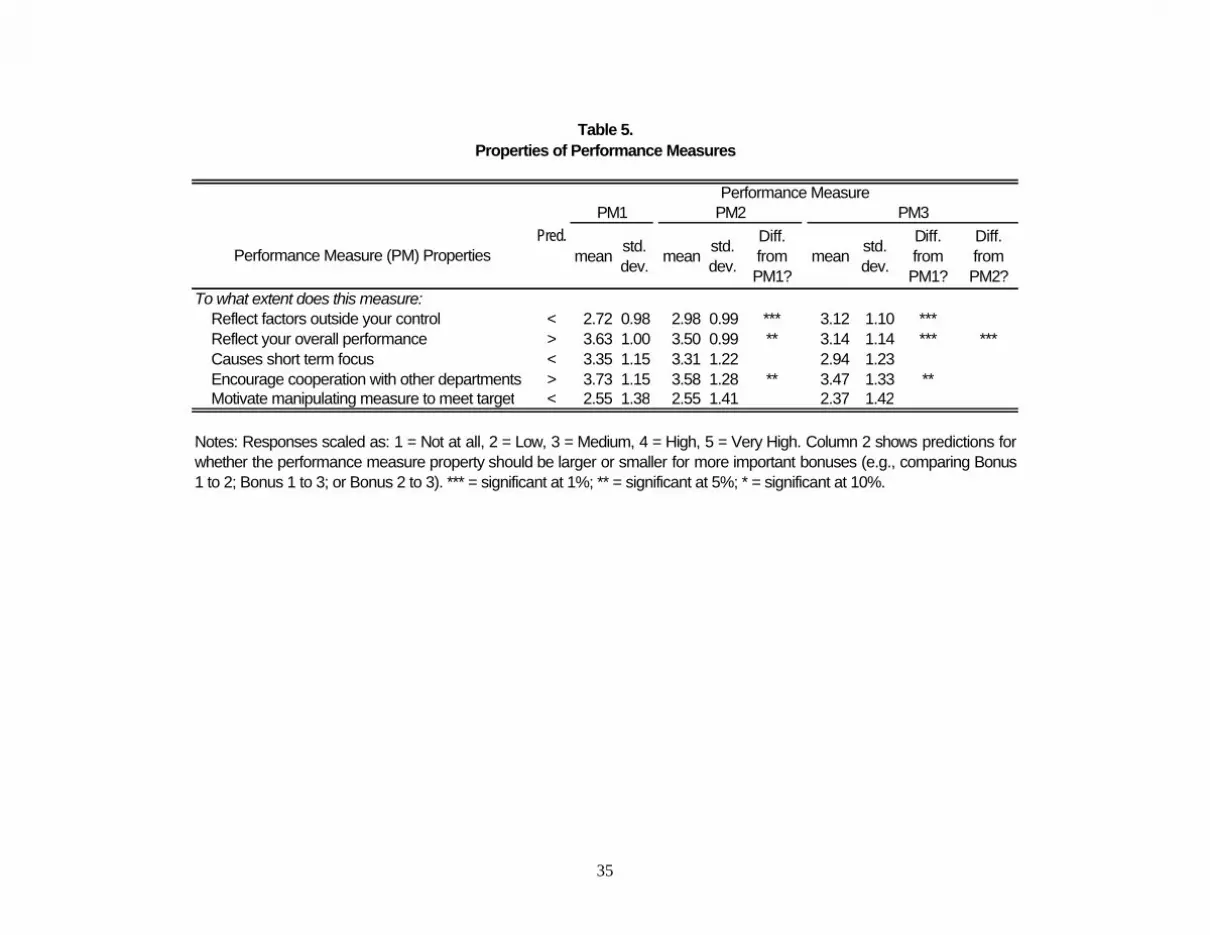
35
meanstd.dev.
meanstd.dev.
Diff. from PM1?
meanstd.dev.
Diff. from PM1?
Diff. from PM2?
Reflect factors outside your control < 2.72 0.98 2.98 0.99 *** 3.12 1.10 ***Reflect your overall performance > 3.63 1.00 3.50 0.99 ** 3.14 1.14 *** ***Causes short term focus < 3.35 1.15 3.31 1.22 2.94 1.23Encourage cooperation with other departments > 3.73 1.15 3.58 1.28 ** 3.47 1.33 **Motivate manipulating measure to meet target < 2.55 1.38 2.55 1.41 2.37 1.42
Pred.
Notes: Responses scaled as: 1 = Not at all, 2 = Low, 3 = Medium, 4 = High, 5 = Very High. Column 2 shows predictions forwhether the performance measure property should be larger or smaller for more important bonuses (e.g., comparing Bonus1 to 2; Bonus 1 to 3; or Bonus 2 to 3). *** = significant at 1%; ** = significant at 5%; * = significant at 10%.
PM2 PM3
Table 5.Properties of Performance Measures
Performance Measure
To what extent does this measure:
PM1
Performance Measure (PM) Properties

36
Intercept 3,101 8,396 7,353 8,622 505 4,452 -119 4,699
Causes short term focus – -4,073 5,902 -8,403 6,312 * -1,570 2,680 -1,574 2,874Encourages cooperation + 13,604 4,286 *** 13,333 4,211 *** 5,963 2,295 *** 6,004 2,434 ***Motivates manipulating the measure – -5,697 3,466 ** -5,257 3,482 * -5,764 3,473 ** -5,455 3,646 *
General Manager 2,124 5,132 -723 4,928Service Department manager -10,049 3,998 ** -10,075 3,901 ** -1,161 2,909 -1,153 3,051
N% Bonus (#2 or 3) > 0
Pred.sign
Notes: Tobits predicting magnitude of Formula Bonuses 2-3. SE = standard error. *** = significant at 1%; ** = 5%; * = 10%. Predicted signs are shownafter variable names; 1-tailed tests in those cases.
Table 6.Effects of Performance Measure Properties on Other Formula Bonuses
Perf. measure properties relative to Perf. meas. 1
52%186 100 91221
63% 63% 52%
Formula Bonus 2 Formula Bonus 3Dept. Mgrs. OnlyAll All Dept. Mgrs. Only

37
Coef. SE Coef. SE
Intercept -58,335.61 26,220.99 -1.14 0.83 *
Primary Bonus ($1K) × Reflects factors outside mgr.'s control – 39.22 32.30 0.0013 0.0011Primary Bonus ($1K) × Causes short term focus – -12.48 28.60 -0.0012 0.0010Primary Bonus ($1K) × Motivates manipulating the measure – -40.67 20.32 ** -0.0075 0.0006 **
Degree of competition + 930.44 4,310.71 -0.08 0.14Emphasis on customer service + 1,702.74 4,930.91 0.08 0.16Experience + 1,015.94 544.54 ** 0.03 0.02 **
General Manager -6,382.37 8,145.65 -0.41 0.27Service Department manager -20,559.46 8,687.18 ** -0.71 0.28 **
N% Discretionary Bonus > 0
Effects of Performance Measure Properties on Discretionary BonusTable 7.
Notes: Tobit/logit predicting size and incidence of discretionary bonus. SE = standard error. *** = significant at 1%; ** = 5%; * =10%. Predicted signs are shown after variable names; 1-tailed tests in those cases.
58821%
58821%
Tobit LogitPred.sign

38
Factor Loadings
(Cronbach a)
(a=.72)In your trading area, how much competition does your dealership face?
0.87
How intense is competition for good employees in the car dealer 0.70How intense is price competition for new cars? 0.81
(a=.84)Evaluate department managers on customer service performance? -0.82Review customer service issues in meetings with department managers?
0.78
Consider customer service to be a way to increase profits? 0.77Find customer service important relative to financial performance? 0.68Provide feedback to dept. mgrs. about customer service performance?
0.67
Provide training to employees to increase customer service awareness?
0.43
(a=.92)Involve personnel in customer service improvement? 0.78Hold personnel responsible for customer service? 0.77Discuss customer service in personnel meetings? 0.80Consider customer service a way to increase profits? 0.73Make customer service data available to personnel? 0.78Use customer service data to evaluate your personnel? 0.77Display customer service data at employee workstations? 0.59Give employees feedback on customer service performance? 0.82Have employees participate in customer service improvement decisions?
0.73
Build ongoing awareness about customer service among employees? 0.84
Notes: Factor analysis with principal component extraction and oblique rotation (d = 0). The Kaiser-Meyer-Olkin measure of sampling adequacy is adequately high (0.80). The Bartlett test of sphericityyielded highly significant ?² (p = 0.00). The Cronbach Alphas are highly adequate (a > 0.70).
Description of Factor VariablesAppendix.
Perceived Degree of Competition
Survey Questions Used to Construct Factors
To whatextentdo you …
To whatextentdo you …
Emphasis on Customer Service (General Managers)
Emphasis on Customer Service (Department Managers)