penalties and reconviction risk among offenders convicted of
TRANSCRIPT
NSW Bureau of Crime Bureau Brief Statistics and Research Issue paper no. 79
July 2012
Penalties and reconviction risk among offenders convicted of drug driving
Isabel Taussig and Craig Jones
Aims: To investigate: 1) penalties for drug driving; 2) risk of reconviction among drug drivers; and 3) how penalties and reconviction risk vary according to offender characteristics.
Method: Information for 3,770 offenders with proven drug driving offences (2007 - 2011) was extracted from the NSW re-offending database. Aims (1) and (2) were addressed by identifying the most serious penalties for drug driving and the number of convictions accumulated over 12 and 24 months. Aim (3) was addressed by building logistic regression models identifying independent predictors of penalty and recidivism.
Results: The most common principal penalty for drug driving was a fine (60.2% received a fine and the average fine was $581). While 17.2 per cent of offenders had their matters dismissed without conviction, most dismissals (84%) also included a good behaviour bond. Offenders were less likely to have their matters dismissed if they were younger, had concurrent charges or a prior criminal record. One-third (35.3%) had been convicted for a new offence within 24 months. Recidivism was higher for offenders who had a prior criminal record, were not on bail and/or were Indigenous.
Conclusion: The most common outcomes for drug driving are fines and dismissals. Those who have their matters dismissed tend to share characteristics with those at lower risk of recidivism.
Keywords: Drugs, driving, re-offending, sentence length
2010). These behaviours and attitudes ought to be viewed Introduction with significant concern. While there are many methodological
In 2010, 14.7 per cent of Australians aged 14 years or older challenges associated with measuring the contribution of reported using an illicit drug in the previous 12 months. Of illicit drugs to accident risk, the weight of evidence suggests these recent users, 18 per cent reported driving while under
that many substances do increase risk, especially at higher the influence of an illicit drug. The population prevalence of
doses. Experimental studies, such as those conducted in driver drug driving is therefore about 3 per cent (Australian Institute of
simulators, have found impaired driver performance when Health and Welfare [AIHW], 2011). While this prevalence might
driving tasks are performed under the influence of cannabis, appear to be quite low, it is much higher among some groups some forms of benzodiazepines or ecstasy (although evidence of drivers. Men are more likely to report drug driving (21.5% suggests that ecstasy can also improve some aspects of driver of past-year male users reported drug driving over that period behaviour). Epidemiological studies have found increased versus 13.2% of female recent users, AIHW, 2011), as are young accident risk and/or increases in accident culpability among drug users (Jones, Freeman, & Weatherburn, 2003) and injecting drivers testing positive for amphetamines, benzodiazepines, drug users (Darke, Kelly, & Ross, 2004). Darke et al. (2004), for cannabis, cocaine and heroin. The risk is particularly acute when example, found that nine in ten injecting drug users who were these drugs are combined with alcohol (European Monitoring current drivers reported driving under the influence of drugs
in the preceding 12 months. Centre for Drugs and Drug Addiction, 2008).
High rates of drug driving may be at least partly a function of The NSW Police Force has always had legislative provisions
drivers’attitudes towards the risk associated with the behaviour. under the Road Transport (Safety and Traffic Management) Many drug users view their own and others’driving ability to be Act 1999 to charge drivers for driving under the influence of unaffected by illicit drug consumption (Swift, Jones, & Donnelly, illicit drugs. However, until 2006, police had to rely on the
1
appearance or behaviour of a person as evidence on which to base a charge of driving under the influence of a drug (s12 of the Road Transport (Safety and Traffic Management) Act). In 2006, this Act was amended by the Road Transport Legislation Amendment (Drug Testing) Act 2006, which gave police the power to obtain saliva, blood or urine samples from drivers, and also introduced random roadside drug testing (s11B of the Road Transport (Safety and Traffic Management) Act). NSW Police began random roadside drug testing in 2007 and 1.5 per cent of all drug tests returned positive results for illicit drugs in the 2010-11 financial year (NSW Police Force, 2011).
In recent times there has been public concern that drug-driving offenders are not being adequately punished for the offence. A media release from the National Roads and Motorists’ Association (NRMA), for example, stated that ‘over one-quarter (27%) of motorists convicted of driving with illicit drugs in their system got off penalty free’. The NRMA President is quoted as saying that ‘the police are doing their job catching people but the community is being let down by a system that sees too many walk away penalty free’ (Leggett, 2012).
The Crimes (Sentencing Procedures) Act 1999 allows courts to dismiss matters with no or minimal penalty under certain conditions. Section 10 of the Act enables courts to dismiss or conditionally discharge a criminal matter without conviction. People who have their matters dismissed under section 10(1)(a) of the Act are dismissed unconditionally, while those dismissed under s10(1)(b) are dismissed without conviction, subject to the conditions of a good behaviour bond. Breaching the conditions of that bond can result in revocation of the bond, and re-sentencing for the original offence (see s99(1)(b) of the Act). Courts also have the capacity to convict an offender but impose no further penalty (s10A) or to impose a nominal sentence, where the offender is held in custody until the court adjourns. Nominal sentences are sometimes referred to as ‘rising of the court’.
Section 10(3) of the Crimes (Sentencing Procedures) Act stipulates that these dismissal orders are to be given out having regard to: ‘(a) the person’s character, antecedents, age, health and mental conditions, (b) the trivial nature of the offence, (c) the extenuating circumstances in which the offence was committed, and (d) any other matter that the court thinks proper to consider’. Some legal professionals have argued that the apparent overuse of these dismissal penalties reflects a judicial response to mandatory licence disqualifications required under the Road Transport (Safety and Traffic Management) Act. They argue that the mitigating characteristics and antecedents of drug driving matters often outweigh the severity of the mandatory licence disqualification and leave magistrates with little option but to dismiss the matter (Haynes, 2010).
The primary purpose of this brief is to provide statistical evidence bearing on the penalties for drug driving offences. It also aims to identify the extent to which drug driving offenders return to court charged with drug driving and other offences. Finally, the current brief aims to assess how the likelihood of receiving dismissal orders and how risk of reconviction
varies according to various demographic, criminal history and current offence characteristics. It is hoped that this will assist in determining which offenders are more likely to have their matters dismissed and which offenders are more at risk of recidivism. The aims of brief were therefore to investigate:
1. which penalties are imposed for drug driving offences in NSW;
2. what proportion of people are reconvicted following a drug driving offence and for what types of offences they return to court; and
3. how penalties and reconviction risk vary according to the characteristics of offenders.
Method Data source The data for this study were drawn from the Re-offending Database (ROD) which is maintained by the NSW Bureau of Crime Statistics and Research. ROD contains records for all people charged in NSW criminal courts since 1994.
Sample The initial cohort for this study consisted of all people with one or more proven offences under either s11B or s12 of the Road Transport (Safety and Traffic Management) Act in NSW Local Courts between 1 January 2007 and 30 September 2011 (n=5,675). However, there was considerable attrition from this initial sample and the attrition points are shown in Figure 1.
If an individual had more than one finalised court appearance where a drug driving charge was proven during this time period, one appearance was chosen at random and defined as the index court appearance. It is important to limit the sample to one record per offender because the analyses reported here rely on the assumption that each record is independent of the other records. This step eliminated 115 records from the final sample. A further 13 offenders were removed from the sample because they were charged with being a ‘person under the influence of alcohol/drug sit next to a learner’, ‘drive vehicle with illicit drug present in blood etc., 2nd+ offence’, or ‘sit next to learner with illicit drug in blood etc., 1st offence’. These offenders were removed from the sample because these offence categories could have different sentencing and reconviction profiles but too few offenders were charged with these offences to analyse their outcomes separately.
Most of the attrition from the sample occurred because alcohol rather than illicit drugs was involved in the offence (n=1,777). Under s12 of the Act, an offence is proven if the offender was ‘under the influence of alcohol or any other drug’when driving. Offences under s12 of the Act may involve use of alcohol, illicit drugs or both. Although court staff record the drug type for some offences on the electronic court management system (JusticeLink) and also on the paper-based system that preceded it, this information is missing in a number of cases. Where drug type was missing on the court record, police records were searched to identify the type(s) of substance involved in the offence. All records where the drug type on the court/police
2
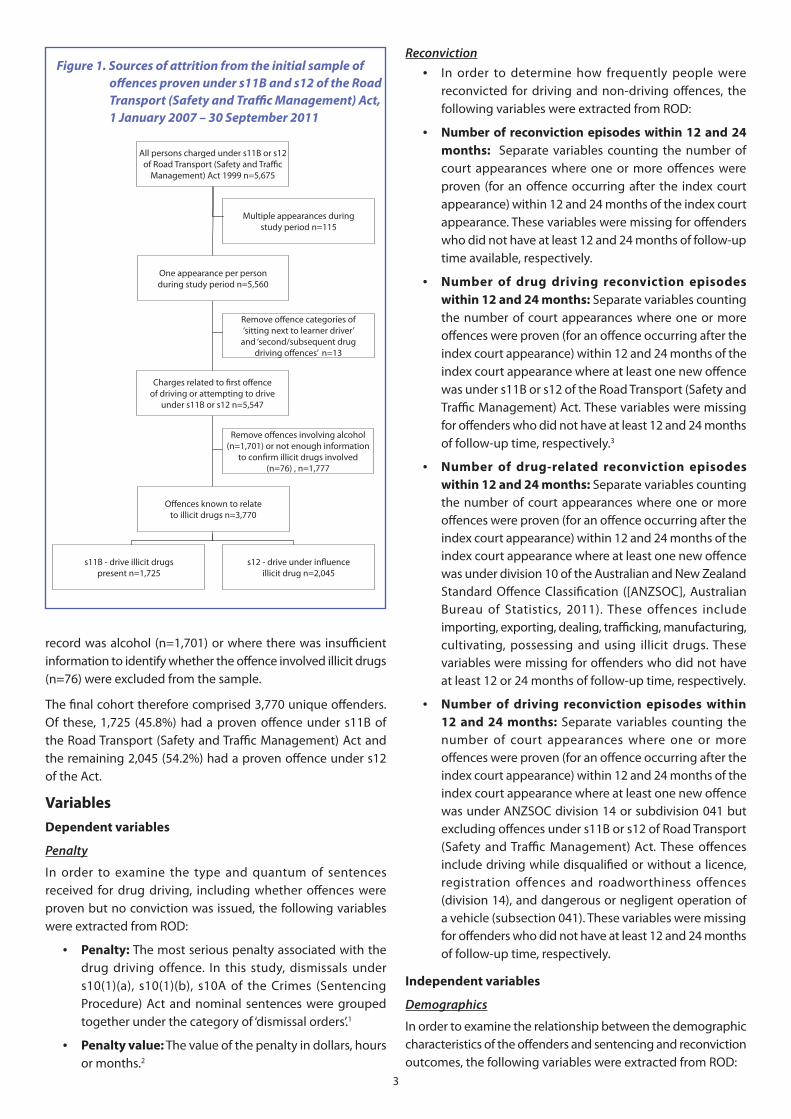
Figure 1. Sources of attrition from the initial sample of offences proven under s11B and s12 of the Road Transport (Safety and Traffic Management) Act, 1 January 2007 – 30 September 2011
All persons charged under s11B or s12 of Road Transport (Safety and Traffic
Management) Act 1999 n=5,675
Multiple appearances during study period n=115
One appearance per person during study period n=5,560
Remove offence categories of ‘sitting next to learner driver’
and ‘second/subsequent drug driving offences’ n=13
Charges related to first offence of driving or attempting to drive
under s11B or s12 n=5,547
Remove offences involving alcohol (n=1,701) or not enough information
to confirm illicit drugs involved (n=76) , n=1,777
Offences known to relate to illicit drugs n=3,770
s12 - drive under influence illicit drug n=2,045
s11B - drive illicit drugs present n=1,725
record was alcohol (n=1,701) or where there was insufficient information to identify whether the offence involved illicit drugs (n=76) were excluded from the sample.
The final cohort therefore comprised 3,770 unique offenders. Of these, 1,725 (45.8%) had a proven offence under s11B of the Road Transport (Safety and Traffic Management) Act and the remaining 2,045 (54.2%) had a proven offence under s12 of the Act.
Variables Dependent variables
Penalty
In order to examine the type and quantum of sentences received for drug driving, including whether offences were proven but no conviction was issued, the following variables were extracted from ROD:
y Penalty: The most serious penalty associated with the drug driving offence. In this study, dismissals under s10(1)(a), s10(1)(b), s10A of the Crimes (Sentencing Procedure) Act and nominal sentences were grouped together under the category of ‘dismissal orders’. 1
y Penalty value: The value of the penalty in dollars, hours or months.2
Reconviction y In order to determine how frequently people were
reconvicted for driving and non-driving offences, the following variables were extracted from ROD:
y Number of reconviction episodes within 12 and 24 months: Separate variables counting the number of court appearances where one or more offences were proven (for an offence occurring after the index court appearance) within 12 and 24 months of the index court appearance. These variables were missing for offenders who did not have at least 12 and 24 months of follow-up time available, respectively.
y Number of drug driving reconviction episodes within 12 and 24 months: Separate variables counting the number of court appearances where one or more offences were proven (for an offence occurring after the index court appearance) within 12 and 24 months of the index court appearance where at least one new offence was under s11B or s12 of the Road Transport (Safety and Traffic Management) Act. These variables were missing for offenders who did not have at least 12 and 24 months of follow-up time, respectively.3
y Number of drug-related reconviction episodes within 12 and 24 months: Separate variables counting the number of court appearances where one or more offences were proven (for an offence occurring after the index court appearance) within 12 and 24 months of the index court appearance where at least one new offence was under division 10 of the Australian and New Zealand Standard Offence Classification ([ANZSOC], Australian Bureau of Statistics, 2011). These offences include importing, exporting, dealing, trafficking, manufacturing, cultivating, possessing and using illicit drugs. These variables were missing for offenders who did not have at least 12 or 24 months of follow-up time, respectively.
y Number of driving reconviction episodes within 12 and 24 months: Separate variables counting the number of court appearances where one or more offences were proven (for an offence occurring after the index court appearance) within 12 and 24 months of the index court appearance where at least one new offence was under ANZSOC division 14 or subdivision 041 but excluding offences under s11B or s12 of Road Transport (Safety and Traffic Management) Act. These offences include driving while disqualified or without a licence, registration offences and roadworthiness offences (division 14), and dangerous or negligent operation of a vehicle (subsection 041). These variables were missing for offenders who did not have at least 12 and 24 months of follow-up time, respectively.
Independent variables
Demographics
In order to examine the relationship between the demographic characteristics of the offenders and sentencing and reconviction outcomes, the following variables were extracted from ROD:
3
y Age: Age of the offender at the time of finalisation of the index offence. This variable was grouped into four approximately even-sized categories based on the distribution of age within the sample: 16 to 23 years, 24 to 30 years, 31 to 38 years and 39 years or more.
y Gender: Male or female.
y Indigenous status: Whether or not the offender identified as Aboriginal or Torres Strait Islander or both at any court appearance since 1994 (0=no, 1=yes, 99=unknown).
y Socio-Economic Indexes for Areas (SEIFA): A variable developed by the Australian Bureau of Statistics (2006) that summarises different aspects of the socio-economic conditions of the postcodes in which offenders were residing at their index court appearance. The factors used to calculate the relative socio-economic index of a given postcode include income, educational achievement and ownership of motor vehicles. This variable was split into quartiles based on the SEIFA scores among those with known postcodes.
Current offence
In order to examine the relationship between the offenders’ current offences and reconviction and sentencing, the following variables were extracted from ROD:
y Principal offence: Principal offence at index court appearance. This was dichotomised into s11B (‘offences involving certain drugs (other than alcohol) in oral fluid, blood or urine’) and s12 (‘use or attempted use of a vehicle under the influence of alcohol or any other drug’) offences.
y Number of concurrent charges: The number of proven concurrent charges at the index appearance, not including the principal offence. This variable was regrouped into 0, 1 and 2 or more concurrent charges.
y Legal representation: Whether or not the offender was legally represented at the index court appearance (0=no, 1=yes, 99=unknown).
y On bail/dispensed: Whether or not the offender was on bail or had bail dispensed with at the time the index court appearance was finalised (0=no, 1=yes).
Prior criminal history
In order to examine the relationship between the offenders’ prior criminal histories and reconviction and sentencing outcomes, the following variables were extracted from ROD:
y Number of prior convictions: Number of court appearances in the five years prior to the index court appearance where one or more offences were proven.
y Prior drug driving convictions: Whether or not any court appearances in the five years prior to the index court appearance resulted in one or more proven offences under s11B or s12 of the Road Transport (Safety and Traffic Management) Act (0=no, 1=yes).4
y Prior drug convictions: Whether or not any court appearances in the five years prior to the index court appearance resulted in one or more proven offences under ANZSOC division 10 (0=no, 1=yes).
y Number of prior driving convictions: Number of court appearances in the five years prior to the index court appearance where one or more offences were proven under ANZSOC division 14 or ANZSOC subdivision 041 but not including s11B or s12 of the Road Transport (Safety and Traffic Management) Act.
y Prior juvenile record: Whether or not the offender had any offences proven in a Children’s Court or had completed the outcome plan from a Youth Justice Conference or had been formally cautioned by police under the Young Offender’s Act 1997 at any time between 1994 (the earliest date available on ROD) and the index court appearance (0=no, 1=yes).
y Prior prison record: Whether or not the offender had any finalised court appearances in the five years prior to the index appearance that resulted in the imposition of a full-time prison sentence or juvenile detention order (0=no, 1=yes).
Analysis The analyses of aims (1) and (2) relating to penalty and reconviction were descriptive. The analyses of aim (3), which sought to identify independent predictors of sentencing and reconviction outcomes involved fitting separate logistic regression models predicting the likelihood of receiving dismissal orders and reconviction. Chi-square tests were conducted in the first instance to determine which variables were related to sentencing outcomes and reconviction at the bivariate level. All variables that were significant at the bivariate level were then entered into a linear regression model and collinearity diagnostics were assessed to determine whether multicollinearity would be a problem in the final models. Variance inflation factors were well within the range that would indicate that multicollinearity was not an issue.
All variables where the p-value at the bivariate level was less than .25 were entered into logistic regression models to determine which risk factors were independently predictive of the respective outcomes (sentencing and reconviction). For the sentencing model, the dependent variable was a binary indicator of whether or not the offender received a dismissal under s10(1)(a), s10(1)(b), s10A or a nominal sentence under the Crimes (Sentencing Procedure) Act (0=no, 1=yes). Efforts to build a model predicting the likelihood of reconviction for a driving offence were unsuccessful. This may relate to the relatively low rate at which people return to court charged with driving offences. The dependent variable for the reconviction analysis was therefore a binary indicator of whether or not the offender had one or more court appearances where any offence was proven in the 24 months following their index court appearance (0=no, 1=yes).
Manual backward elimination modelling strategies were employed to determine the two final models, whereby each
4
non-significant variable was manually and sequentially removed from the model until only those variables that were significantly associated with the outcome at the .05 level were kept in the model. The Hosmer-Lemeshow test and the area under the receiver operating characteristic curve (AUC) were used to assess model fit. The null hypothesis of the Hosmer-Lemeshow test is that the model provides a good fit to the data. As a rule of thumb, Hosmer and Lemeshow suggest that AUC values greater then .9 indicate that the model provides ‘outstanding’ discrimination (in this case, between who will and will not be dismissed/reconvicted), scores between .8 and .9 indicate ‘excellent’ discrimination, scores between .7 and .8 provide‘acceptable’discrimination and scores of .5 indicate that the model discriminates at no better than chance (Hosmer & Lemeshow, 2000).
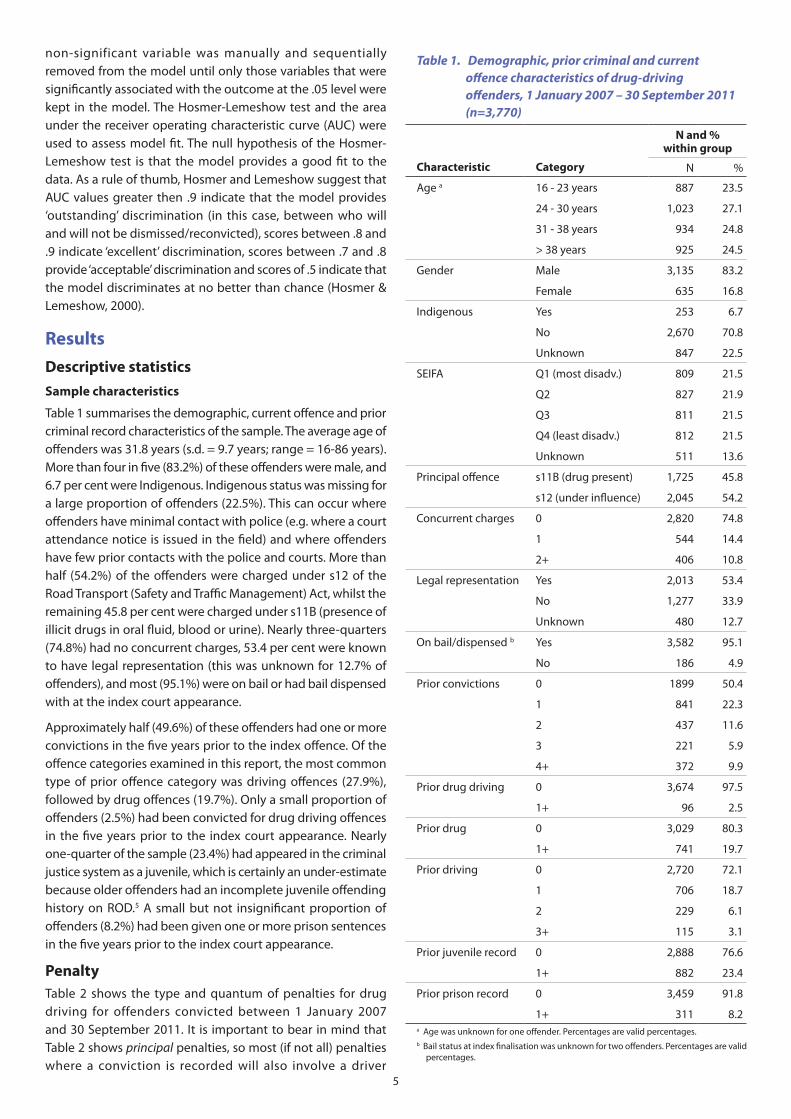
Results Descriptive statistics Sample characteristics
Table 1 summarises the demographic, current offence and prior criminal record characteristics of the sample. The average age of offenders was 31.8 years (s.d. = 9.7 years; range = 16-86 years). More than four in five (83.2%) of these offenders were male, and 6.7 per cent were Indigenous. Indigenous status was missing for a large proportion of offenders (22.5%). This can occur where offenders have minimal contact with police (e.g. where a court attendance notice is issued in the field) and where offenders have few prior contacts with the police and courts. More than half (54.2%) of the offenders were charged under s12 of the Road Transport (Safety and Traffic Management) Act, whilst the remaining 45.8 per cent were charged under s11B (presence of illicit drugs in oral fluid, blood or urine). Nearly three-quarters (74.8%) had no concurrent charges, 53.4 per cent were known to have legal representation (this was unknown for 12.7% of offenders), and most (95.1%) were on bail or had bail dispensed with at the index court appearance.
Approximately half (49.6%) of these offenders had one or more convictions in the five years prior to the index offence. Of the offence categories examined in this report, the most common type of prior offence category was driving offences (27.9%), followed by drug offences (19.7%). Only a small proportion of offenders (2.5%) had been convicted for drug driving offences in the five years prior to the index court appearance. Nearly one-quarter of the sample (23.4%) had appeared in the criminal justice system as a juvenile, which is certainly an under-estimate because older offenders had an incomplete juvenile offending history on ROD.5 A small but not insignificant proportion of offenders (8.2%) had been given one or more prison sentences in the five years prior to the index court appearance.
Penalty Table 2 shows the type and quantum of penalties for drug driving for offenders convicted between 1 January 2007 and 30 September 2011. It is important to bear in mind that Table 2 shows principal penalties, so most (if not all) penalties where a conviction is recorded will also involve a driver
Table 1. Demographic, prior criminal and current offence characteristics of drug-driving offenders, 1 January 2007 – 30 September 2011 (n=3,770)
N and % within group
Characteristic Category N %
Age a 16 - 23 years 887 23.5
24 - 30 years 1,023 27.1
31 - 38 years 934 24.8
> 38 years 925 24.5
Gender Male 3,135 83.2
Female 635 16.8
Indigenous Yes 253 6.7
No 2,670 70.8
Unknown 847 22.5
SEIFA Q1 (most disadv.) 809 21.5
Q2 827 21.9
Q3 811 21.5
Q4 (least disadv.) 812 21.5
Unknown 511 13.6
Principal offence s11B (drug present) 1,725 45.8
s12 (under influence) 2,045 54.2
Concurrent charges 0 2,820 74.8
1 544 14.4
2+ 406 10.8
Legal representation Yes 2,013 53.4
No 1,277 33.9
Unknown 480 12.7
On bail/dispensed b Yes 3,582 95.1
No 186 4.9
Prior convictions 0 1899 50.4
1 841 22.3
2 437 11.6
3 221 5.9
4+ 372 9.9
Prior drug driving 0 3,674 97.5
1+ 96 2.5
Prior drug 0 3,029 80.3
1+ 741 19.7
Prior driving 0 2,720 72.1
1 706 18.7
2 229 6.1
3+ 115 3.1
Prior juvenile record 0 2,888 76.6
1+ 882 23.4
Prior prison record 0 3,459 91.8
1+ 311 8.2 a Age was unknown for one offender. Percentages are valid percentages. b Bail status at index finalisation was unknown for two offenders. Percentages are valid
percentages.
5
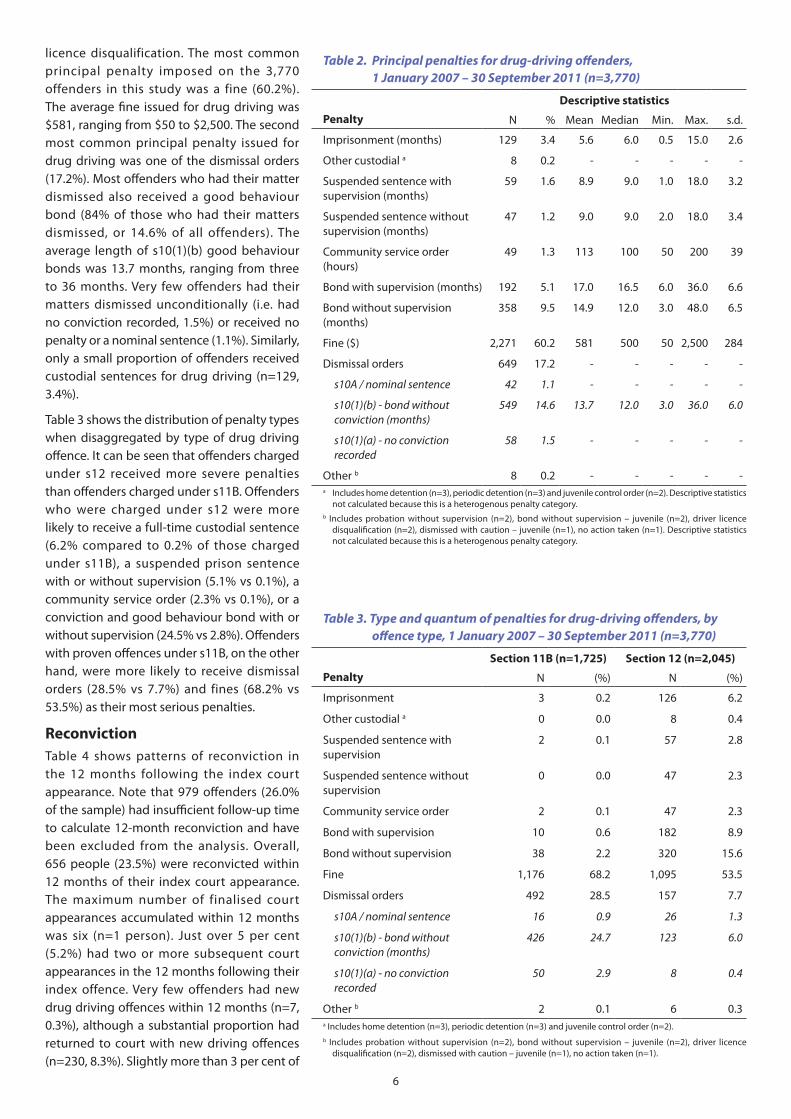
licence disqualification. The most common Table 2. Principal penalties for drug-driving offenders, principal penalty imposed on the 3,770 1 January 2007 – 30 September 2011 (n=3,770) offenders in this study was a fine (60.2%).
Descriptive statistics The average fine issued for drug driving was Penalty N % Mean Median Min. Max. s.d. $581, ranging from $50 to $2,500. The second Imprisonment (months) 129 3.4 5.6 6.0 0.5 15.0 2.6most common principal penalty issued for
drug driving was one of the dismissal orders Other custodial a 8 0.2 - - - -
(17.2%). Most offenders who had their matter Suspended sentence with 59 1.6 8.9 9.0 1.0 18.0 3.2 dismissed also received a good behaviour supervision (months)
bond (84% of those who had their matters Suspended sentence without 47 1.2 9.0 9.0 2.0 18.0 3.4 dismissed, or 14.6% of all offenders). The supervision (months)
average length of s10(1)(b) good behaviour Community service order 49 1.3 113 100 50 200 39 bonds was 13.7 months, ranging from three (hours)
to 36 months. Very few offenders had their Bond with supervision (months) 192 5.1 17.0 16.5 6.0 36.0 6.6 matters dismissed unconditionally (i.e. had Bond without supervision 358 9.5 14.9 12.0 3.0 48.0 6.5 no conviction recorded, 1.5%) or received no (months)
penalty or a nominal sentence (1.1%). Similarly, Fine ($) 2,271 60.2 581 500 50 2,500 284 only a small proportion of offenders received Dismissal orders 649 17.2 - - - - custodial sentences for drug driving (n=129,
s10A / nominal sentence 42 1.1 - - - - 3.4%).
s10(1)(b) - bond without 549 14.6 13.7 12.0 3.0 36.0 6.0 Table 3 shows the distribution of penalty types conviction (months)
when disaggregated by type of drug driving s10(1)(a) - no conviction 58 1.5 - - - - offence. It can be seen that offenders charged recorded
under s12 received more severe penalties Other b 8 0.2 - - - - athan offenders charged under s11B. Offenders Includes home detention (n=3), periodic detention (n=3) and juvenile control order (n=2). Descriptive statistics
not calculated because this is a heterogenous penalty category. who were charged under s12 were more b Includes probation without supervision (n=2), bond without supervision – juvenile (n=2), driver licence
likely to receive a full-time custodial sentence disqualification (n=2), dismissed with caution – juvenile (n=1), no action taken (n=1). Descriptive statistics not calculated because this is a heterogenous penalty category. (6.2% compared to 0.2% of those charged
under s11B), a suspended prison sentence with or without supervision (5.1% vs 0.1%), a community service order (2.3% vs 0.1%), or a conviction and good behaviour bond with or Table 3. Type and quantum of penalties for drug-driving offenders, by without supervision (24.5% vs 2.8%). Offenders offence type, 1 January 2007 – 30 September 2011 (n=3,770) with proven offences under s11B, on the other Section 11B (n=1,725) Section 12 (n=2,045) hand, were more likely to receive dismissal Penalty N (%) N (%)orders (28.5% vs 7.7%) and fines (68.2% vs
Imprisonment 3 0.2 126 6.253.5%) as their most serious penalties.
Other custodial a 0 0.0 8 0.4 Reconviction Suspended sentence with 2 0.1 57 2.8 Table 4 shows patterns of reconviction in supervision
the 12 months following the index court Suspended sentence without 0 0.0 47 2.3 appearance. Note that 979 offenders (26.0% supervision
of the sample) had insufficient follow-up time Community service order 2 0.1 47 2.3 to calculate 12-month reconviction and have Bond with supervision 10 0.6 182 8.9 been excluded from the analysis. Overall, Bond without supervision 38 2.2 320 15.6 656 people (23.5%) were reconvicted within
Fine 1,176 68.2 1,095 53.512 months of their index court appearance. Dismissal orders 492 28.5 157 7.7The maximum number of finalised court
appearances accumulated within 12 months s10A / nominal sentence 16 0.9 26 1.3
was six (n=1 person). Just over 5 per cent s10(1)(b) - bond without 426 24.7 123 6.0 (5.2%) had two or more subsequent court conviction (months)
appearances in the 12 months following their s10(1)(a) - no conviction 50 2.9 8 0.4 index offence. Very few offenders had new recorded
drug driving offences within 12 months (n=7, Other b 2 0.1 6 0.3 0.3%), although a substantial proportion had a Includes home detention (n=3), periodic detention (n=3) and juvenile control order (n=2).
returned to court with new driving offences b Includes probation without supervision (n=2), bond without supervision – juvenile (n=2), driver licence disqualification (n=2), dismissed with caution – juvenile (n=1), no action taken (n=1).
(n=230, 8.3%). Slightly more than 3 per cent of 6
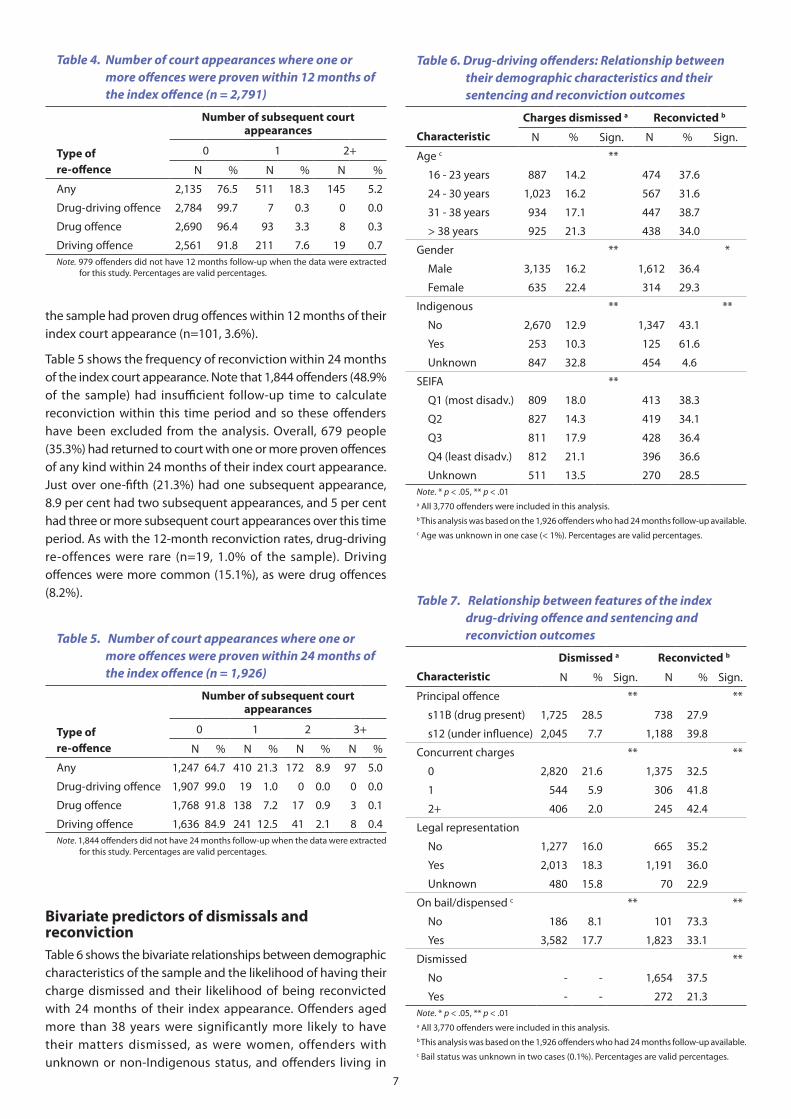
Table 4. Number of court appearances where one or Table 6. Drug-driving offenders: Relationship between more offences were proven within 12 months of their demographic characteristics and their the index offence (n = 2,791) sentencing and reconviction outcomes
Number of subsequent court appearances
Type of 0 1 2+
re-offence N % N % N %
Any 2,135 76.5 511 18.3 145 5.2
Drug-driving offence 2,784 99.7 7 0.3 0 0.0
Drug offence 2,690 96.4 93 3.3 8 0.3
Driving offence 2,561 91.8 211 7.6 19 0.7 Note. 979 offenders did not have 12 months follow-up when the data were extracted
for this study. Percentages are valid percentages.
the sample had proven drug offences within 12 months of their index court appearance (n=101, 3.6%).
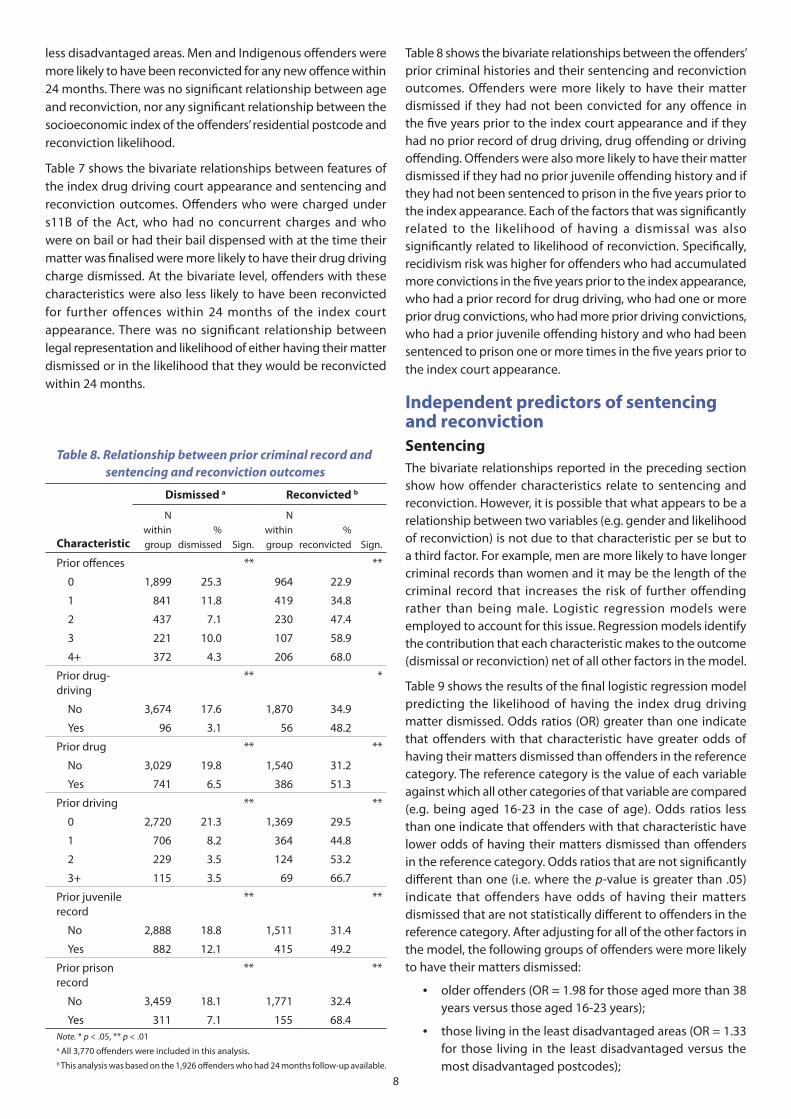
Table 5 shows the frequency of reconviction within 24 months of the index court appearance. Note that 1,844 offenders (48.9% of the sample) had insufficient follow-up time to calculate reconviction within this time period and so these offenders have been excluded from the analysis. Overall, 679 people (35.3%) had returned to court with one or more proven offences of any kind within 24 months of their index court appearance. Just over one-fifth (21.3%) had one subsequent appearance, 8.9 per cent had two subsequent appearances, and 5 per cent had three or more subsequent court appearances over this time period. As with the 12-month reconviction rates, drug-driving re-offences were rare (n=19, 1.0% of the sample). Driving offences were more common (15.1%), as were drug offences (8.2%).
Table 5. Number of court appearances where one or more offences were proven within 24 months of the index offence (n = 1,926)
Number of subsequent court appearances
Type of 0 1 2 3+
re-offence N % N % N % N %
Any 1,247 64.7 410 21.3 172 8.9 97 5.0
Drug-driving offence 1,907 99.0 19 1.0 0 0.0 0 0.0
Drug offence 1,768 91.8 138 7.2 17 0.9 3 0.1
Driving offence 1,636 84.9 241 12.5 41 2.1 8 0.4 Note. 1,844 offenders did not have 24 months follow-up when the data were extracted
for this study. Percentages are valid percentages.
Bivariate predictors of dismissals and reconviction Table 6 shows the bivariate relationships between demographic characteristics of the sample and the likelihood of having their charge dismissed and their likelihood of being reconvicted with 24 months of their index appearance. Offenders aged more than 38 years were significantly more likely to have their matters dismissed, as were women, offenders with unknown or non-Indigenous status, and offenders living in
Charges dismissed a Reconvicted b
Characteristic N % Sign. N % Sign.
Age c **
16 - 23 years 887 14.2 474 37.6
24 - 30 years 1,023 16.2 567 31.6
31 - 38 years 934 17.1 447 38.7
> 38 years 925 21.3 438 34.0
Gender ** *
Male
Female
3,135
635
16.2
22.4
1,612
314
36.4
29.3
Indigenous
No
Yes
2,670
253
12.9
10.3
**
1,347
125
43.1
61.6
**
Unknown 847 32.8 454 4.6
SEIFA
Q1 (most disadv.)
Q2
Q3
Q4 (least disadv.)
Unknown
809
827
811
812
511
18.0
14.3
17.9
21.1
13.5
**
413
419
428
396
270
38.3
34.1
36.4
36.6
28.5 Note. * p < .05, ** p < .01 a All 3,770 offenders were included in this analysis. b This analysis was based on the 1,926 offenders who had 24 months follow-up available. c Age was unknown in one case (< 1%). Percentages are valid percentages.
Table 7. Relationship between features of the index drug-driving offence and sentencing and reconviction outcomes
Dismissed a Reconvicted b
Characteristic N % Sign. N % Sign.
Principal offence ** **
s11B (drug present) 1,725 28.5 738 27.9
s12 (under influence) 2,045 7.7 1,188 39.8
Concurrent charges ** **
0 2,820 21.6 1,375 32.5
1 544 5.9 306 41.8
2+ 406 2.0 245 42.4
Legal representation
No 1,277 16.0 665 35.2
Yes 2,013 18.3 1,191 36.0
Unknown 480 15.8 70 22.9
On bail/dispensed c ** **
No 186 8.1 101 73.3
Yes 3,582 17.7 1,823 33.1
Dismissed **
No - - 1,654 37.5
Yes - - 272 21.3 Note. * p < .05, ** p < .01 a All 3,770 offenders were included in this analysis. b This analysis was based on the 1,926 offenders who had 24 months follow-up available. c Bail status was unknown in two cases (0.1%). Percentages are valid percentages.
7
less disadvantaged areas. Men and Indigenous offenders were more likely to have been reconvicted for any new offence within 24 months. There was no significant relationship between age and reconviction, nor any significant relationship between the socioeconomic index of the offenders’residential postcode and reconviction likelihood.
Table 7 shows the bivariate relationships between features of the index drug driving court appearance and sentencing and reconviction outcomes. Offenders who were charged under s11B of the Act, who had no concurrent charges and who were on bail or had their bail dispensed with at the time their matter was finalised were more likely to have their drug driving charge dismissed. At the bivariate level, offenders with these characteristics were also less likely to have been reconvicted for further offences within 24 months of the index court appearance. There was no significant relationship between legal representation and likelihood of either having their matter dismissed or in the likelihood that they would be reconvicted within 24 months.
Table 8. Relationship between prior criminal record and sentencing and reconviction outcomes
Dismissed a Reconvicted b
N N within % within %
Characteristic group dismissed Sign. group reconvicted Sign.
Prior offences ** **
0 1,899 25.3 964 22.9
1 841 11.8 419 34.8
2 437 7.1 230 47.4
3 221 10.0 107 58.9
4+ 372 4.3 206 68.0
Prior drug- ** * driving
No 3,674 17.6 1,870 34.9
Yes 96 3.1 56 48.2
Prior drug ** **
No 3,029 19.8 1,540 31.2
Yes 741 6.5 386 51.3
Prior driving ** **
0 2,720 21.3 1,369 29.5
1 706 8.2 364 44.8
2 229 3.5 124 53.2
3+ 115 3.5 69 66.7
Prior juvenile ** ** record
No 2,888 18.8 1,511 31.4
Yes 882 12.1 415 49.2
Prior prison ** ** record
No 3,459 18.1 1,771 32.4
Yes 311 7.1 155 68.4 Note. * p < .05, ** p < .01 a All 3,770 offenders were included in this analysis. b This analysis was based on the 1,926 offenders who had 24 months follow-up available.
Table 8 shows the bivariate relationships between the offenders’ prior criminal histories and their sentencing and reconviction outcomes. Offenders were more likely to have their matter dismissed if they had not been convicted for any offence in the five years prior to the index court appearance and if they had no prior record of drug driving, drug offending or driving offending. Offenders were also more likely to have their matter dismissed if they had no prior juvenile offending history and if they had not been sentenced to prison in the five years prior to the index appearance. Each of the factors that was significantly related to the likelihood of having a dismissal was also significantly related to likelihood of reconviction. Specifically, recidivism risk was higher for offenders who had accumulated more convictions in the five years prior to the index appearance, who had a prior record for drug driving, who had one or more prior drug convictions, who had more prior driving convictions, who had a prior juvenile offending history and who had been sentenced to prison one or more times in the five years prior to the index court appearance.
Independent predictors of sentencing and reconviction Sentencing The bivariate relationships reported in the preceding section show how offender characteristics relate to sentencing and reconviction. However, it is possible that what appears to be a relationship between two variables (e.g. gender and likelihood of reconviction) is not due to that characteristic per se but to a third factor. For example, men are more likely to have longer criminal records than women and it may be the length of the criminal record that increases the risk of further offending rather than being male. Logistic regression models were employed to account for this issue. Regression models identify the contribution that each characteristic makes to the outcome (dismissal or reconviction) net of all other factors in the model.
Table 9 shows the results of the final logistic regression model predicting the likelihood of having the index drug driving matter dismissed. Odds ratios (OR) greater than one indicate that offenders with that characteristic have greater odds of having their matters dismissed than offenders in the reference category. The reference category is the value of each variable against which all other categories of that variable are compared (e.g. being aged 16-23 in the case of age). Odds ratios less than one indicate that offenders with that characteristic have lower odds of having their matters dismissed than offenders in the reference category. Odds ratios that are not significantly different than one (i.e. where the p-value is greater than .05) indicate that offenders have odds of having their matters dismissed that are not statistically different to offenders in the reference category. After adjusting for all of the other factors in the model, the following groups of offenders were more likely to have their matters dismissed:
y older offenders (OR = 1.98 for those aged more than 38 years versus those aged 16-23 years);
y those living in the least disadvantaged areas (OR = 1.33 for those living in the least disadvantaged versus the most disadvantaged postcodes);
8
y those charged under s11B of the Act (OR = 3.19 relative to those charged under s12 of the Act); and
y offenders who were legally represented (OR = 1.77 relative to those without legal representation).
The following groups had lower odds of having their matters dismissed:
y men (OR = 0.72 for men relative to women);
y those with concurrent charges (OR = 0.39 and OR = 0.17, respectively, for those with 1 and 2+ concurrent charges relative to those with none);
Table 9. Logistic regression model predicting likelihood of having index drug driving matter dismissed (n=3,767)
Odds ratio Variable Category (95% C.I.) p-value a
Age 16-23 years -
24-30 years 1.36 (1.04,1.80) .027
31-38 years 1.54 (1.16,2.03) .003
>38 years 1.98 (1.51,2.59) <.001
Gender Female -
Male 0.72 (0.57,0.91) .006
SEIFA Q1 (most disadv.) -
Q2 0.75 (0.56,1.00) .054
Q3 1.04 (0.79,1.38) .771
Q4 (least disadv.) 1.33 (1.01,1.74) .043
Unknown 0.59 (0.42,0.83) .002
Index offence s11B (drug present) 3.19 (2.56,3.97) <.001
s12 (under influence) -
Concurrent 0 -charges 1 0.39 (0.26,0.57) <.001
2+ 0.17 (0.08,0.35) <.001
Legally No -represented Yes 1.77 (1.44,2.18) <.001
Unknown 1.12 (0.82,1.52) .490
Prior 0 -convictions 1 0.69 (0.51,0.94) .020
2 0.59 (0.36,0.95) .029
3 1.17 (0.65,2.09) .605
4+ 0.69 (0.35,1.37) .288
Prior drugs No -
Yes 0.63 (0.43,0.93) .020
Prior driving 0 -
1 0.59 (0.41,0.86) .005
2 0.29 (0.13,0.65) .003
3+ 0.33 (0.11,1.04) .058
Indigenous No -
Yes 0.98 (0.62,1.56) .944
Unknown 1.65 (1.33,2.05) <.001
Constant - <.001 (-2.268) Note. Age was unknown for one offender, and bail status at finalisation is unknown
for two offenders. a P-values are Wald chi-square p-values.
Hosmer-Lemeshow chi-square = 6.66, p = .574; AUC =.791
y offenders with a small number of prior convictions (OR = 0.69 and OR = 0.59, respectively, for those with 1 or 2 prior convictions relative to those with no priors), although, for reasons that are not clear, offenders with 3 or 4+ prior convictions were no more or less likely to have their matter dismissed than those with no prior convictions;
y offenders with prior drug convictions (OR = 0.63 relative to those without prior drug convictions);
y offenders with more prior driving convictions (OR = 0.59, OR = 0.29 and OR = 0.33, respectively, for those with 1, 2 and 3+ prior driving convictions relative to those with none), although the 3+ comparison was not statistically significant at the .05 level (p = .058).
Both the Hosmer-Lemeshow test (chi-sq = 6.66, p = .574) and the AUC statistic (.791) indicate that the model provided an acceptable fit to the data.
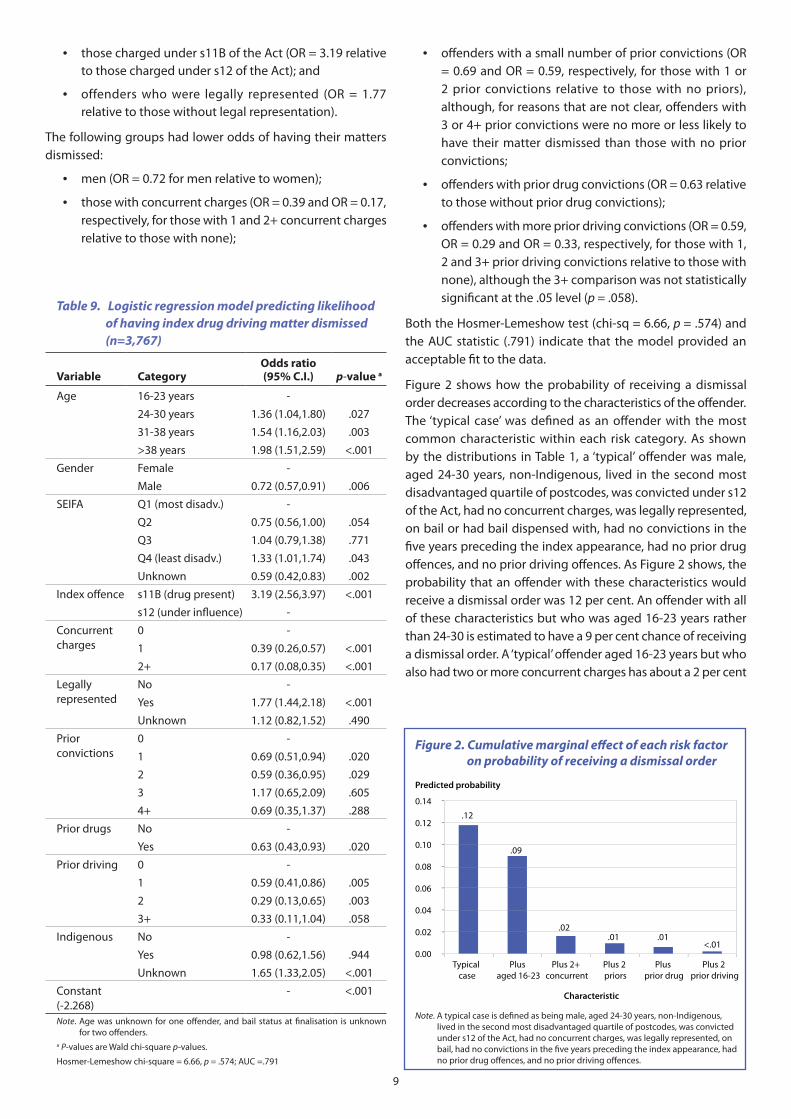
Figure 2 shows how the probability of receiving a dismissal order decreases according to the characteristics of the offender. The ‘typical case’ was defined as an offender with the most common characteristic within each risk category. As shown by the distributions in Table 1, a ‘typical’ offender was male, aged 24-30 years, non-Indigenous, lived in the second most disadvantaged quartile of postcodes, was convicted under s12 of the Act, had no concurrent charges, was legally represented, on bail or had bail dispensed with, had no convictions in the five years preceding the index appearance, had no prior drug offences, and no prior driving offences. As Figure 2 shows, the probability that an offender with these characteristics would receive a dismissal order was 12 per cent. An offender with all of these characteristics but who was aged 16-23 years rather than 24-30 is estimated to have a 9 per cent chance of receiving a dismissal order. A ‘typical’ offender aged 16-23 years but who also had two or more concurrent charges has about a 2 per cent
Figure 2. Cumulative marginal effect of each risk factor on probability of receiving a dismissal order
Predicted probability
0.14
0.12
0.10
0.08
0.06
0.04
0.02
0.00
.12
.09
.02 .01 .01
<.01
Typical Plus Plus 2+ Plus 2 Plus Plus 2 case aged 16-23 concurrent priors prior drug prior driving
Characteristic
Note. A typical case is defined as being male, aged 24-30 years, non-Indigenous, lived in the second most disadvantaged quartile of postcodes, was convicted under s12 of the Act, had no concurrent charges, was legally represented, on bail, had no convictions in the five years preceding the index appearance, had no prior drug offences, and no prior driving offences.
9
chance of receiving a dismissal order. An offender with all five characteristics that decrease the odds of receiving a dismissal order has a less than 1 per cent chance of having their matter dismissed.
Reconviction
Table 10 shows the results of the final logistic regression model predicting the likelihood of reconviction within 24 months of the index court appearance. After adjusting for all of the other factors in the model, the following groups of offenders were more likely to be reconvicted within 24 months:
y those with a juvenile criminal history (OR = 1.36 compared with those without such a history);
y those who had accumulated more convictions in the five years leading up to the index appearance (OR = 1.47, OR = 2.14 and OR = 2.69, respectively, for those with 2, 3 and 4+ convictions relative to those with none); and
y Indigenous offenders (OR = 1.55 relative to non-Indigenous offenders).
The following groups had lower odds of reconviction within 24 months of the index appearance:
y offenders who were on bail or had their bail dispensed with at finalisation (OR = 0.43 relative to offenders who were bail refused at finalisation); and
y offenders for whom Indigenous status was unknown (OR = 0.09 relative to non-Indigenous offenders).
Both the Hosmer-Lemeshow chi-square test (3.50, p = .744) and the AUC statistic (.743) indicate that the model provided an acceptable fit to the data.
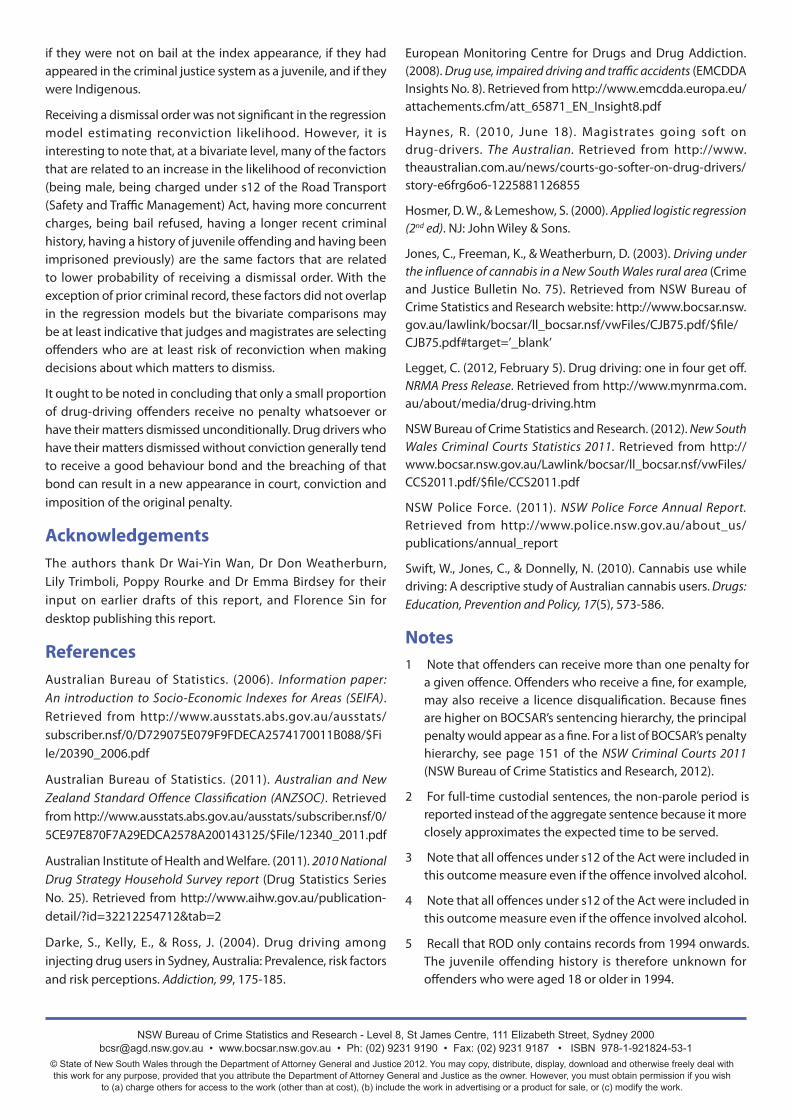
Figure 3 shows how the probability of reconviction changes according to the characteristics of the offender. The ‘typical case’ was defined as an offender with the most common
Table 10. Logistic regression model predicting likelihood of reconviction within 24 months of the index appearance (n=1,924)
Variable Category Odds ratio (95% C.I.) p-value a
On bail/dispensed No -
Yes 0.43 (0.27,0.70) .001
Juvenile history No -
Yes 1.36 (1.07,1.73) .013
Prior convictions 0 -
1 0.98 (0.75,1.29) .907
2 1.47 (1.07,2.01) .018
3 2.14 (1.39,3.29) .001
4+ 2.69 (1.88,3.86) <.001
Indigenous No -
Yes 1.55 (1.04,2.30) .032
Unknown 0.09 (0.06,0.14) <.001
Constant (0.208) - .428 Note. Bail status at finalisation is unknown for two offenders. a P-values are Wald chi-square p-values.
Hosmer-Lemeshow chi-square = 3.50, p = .744; AUC = .743
Figure 3. Cumulative marginal effect of each risk factor on probability of re-offending within 24 months of index appearance
Predicted probability
0.35
0.59
0.69
0.84 0.87
0.00
0.10
0.20
0.30
0.40
0.50
0.60
0.70
0.80
0.90
1.00
Typical Plus 4+ Plus Plus refused Plus prior case priors Indigenous bail juvenile
Characteristic
Note. A typical case is defined as a non-Indigenous offender who was on bail, had no convictions in the five years preceding the index appearance, and had no prior juvenile record on ROD
characteristic within each risk category. As shown in Table 1, this was defined as a non-Indigenous offender who was on bail, had no convictions in the five years preceding the index appearance, and had no prior juvenile record on ROD. As Figure 3 shows, the probability that an offender with these characteristics would be reconvicted for any offence within 24 months was 35 per cent. An offender with all of these characteristics but who also had four or more convictions prior to the index appearance is estimated to have a 59 per cent chance of being reconvicted. An offender who has four or more prior convictions and is also Indigenous has a 69 per cent chance of reconviction. An offender who has these risk factors, is bail refused and has a prior criminal record as a juvenile is estimated to have an 87 per cent chance of being reconvicted.
Summary The most common penalty imposed on drug drivers in this study was a fine (60.2%), followed by a bond without conviction (14.6%). Overall, 17.2 per cent of offenders received some form of dismissal order. Older offenders, female offenders, those who lived in less disadvantaged neighbourhoods, those charged under Section 11B (drive with illicit drug present in urine, saliva or blood), those with no concurrent charges, those who were legally represented, and those with no convictions in the five years leading up to the index appearance were more likely to receive dismissal orders.
Overall, 23.5 per cent of offenders had been reconvicted for a new offence within 12 months and 35.3 per cent had been reconvicted within 24 months. Only 1 per cent of drug-driving offenders had been reconvicted for a new drug driving offence within 24 months, although approximately 15 per cent had been reconvicted for a new driving offence within 24 months. While it was not possible to build a good model estimating the likelihood of reconviction for driving offences, the probability that an offender would be reconvicted for any offence increased if they had more convictions leading up to the index conviction,
10
if they were not on bail at the index appearance, if they had appeared in the criminal justice system as a juvenile, and if they were Indigenous.
Receiving a dismissal order was not significant in the regression model estimating reconviction likelihood. However, it is interesting to note that, at a bivariate level, many of the factors that are related to an increase in the likelihood of reconviction (being male, being charged under s12 of the Road Transport (Safety and Traffic Management) Act, having more concurrent charges, being bail refused, having a longer recent criminal history, having a history of juvenile offending and having been imprisoned previously) are the same factors that are related to lower probability of receiving a dismissal order. With the exception of prior criminal record, these factors did not overlap in the regression models but the bivariate comparisons may be at least indicative that judges and magistrates are selecting offenders who are at least risk of reconviction when making decisions about which matters to dismiss.
It ought to be noted in concluding that only a small proportion of drug-driving offenders receive no penalty whatsoever or have their matters dismissed unconditionally. Drug drivers who have their matters dismissed without conviction generally tend to receive a good behaviour bond and the breaching of that bond can result in a new appearance in court, conviction and imposition of the original penalty.
Acknowledgements The authors thank Dr Wai-Yin Wan, Dr Don Weatherburn, Lily Trimboli, Poppy Rourke and Dr Emma Birdsey for their input on earlier drafts of this report, and Florence Sin for desktop publishing this report.
References Australian Bureau of Statistics. (2006). Information paper: An introduction to Socio-Economic Indexes for Areas (SEIFA). Retrieved from http://www.ausstats.abs.gov.au/ausstats/ subscriber.nsf/0/D729075E079F9FDECA2574170011B088/$Fi le/20390_2006.pdf
Australian Bureau of Statistics. (2011). Australian and New Zealand Standard Offence Classification (ANZSOC). Retrieved from http://www.ausstats.abs.gov.au/ausstats/subscriber.nsf/0/ 5CE97E870F7A29EDCA2578A200143125/$File/12340_2011.pdf
Australian Institute of Health and Welfare. (2011). 2010 National Drug Strategy Household Survey report (Drug Statistics Series No. 25). Retrieved from http://www.aihw.gov.au/publicationdetail/?id=32212254712&tab=2
Darke, S., Kelly, E., & Ross, J. (2004). Drug driving among injecting drug users in Sydney, Australia: Prevalence, risk factors and risk perceptions. Addiction, 99, 175-185.
European Monitoring Centre for Drugs and Drug Addiction. (2008). Drug use, impaired driving and traffic accidents (EMCDDA Insights No. 8). Retrieved from http://www.emcdda.europa.eu/ attachements.cfm/att_65871_EN_Insight8.pdf
Haynes, R. (2010, June 18). Magistrates going soft on drug-drivers. The Australian. Retrieved from http://www. theaustralian.com.au/news/courts-go-softer-on-drug-drivers/ story-e6frg6o6-1225881126855
Hosmer, D. W., & Lemeshow, S. (2000). Applied logistic regression (2nd ed). NJ: John Wiley & Sons.
Jones, C., Freeman, K., & Weatherburn, D. (2003). Driving under the influence of cannabis in a New South Wales rural area (Crime and Justice Bulletin No. 75). Retrieved from NSW Bureau of Crime Statistics and Research website: http://www.bocsar.nsw. gov.au/lawlink/bocsar/ll_bocsar.nsf/vwFiles/CJB75.pdf/$file/ CJB75.pdf#target=’_blank’
Legget, C. (2012, February 5). Drug driving: one in four get off. NRMA Press Release. Retrieved from http://www.mynrma.com. au/about/media/drug-driving.htm
NSW Bureau of Crime Statistics and Research. (2012). New South Wales Criminal Courts Statistics 2011. Retrieved from http:// www.bocsar.nsw.gov.au/Lawlink/bocsar/ll_bocsar.nsf/vwFiles/ CCS2011.pdf/$file/CCS2011.pdf
NSW Police Force. (2011). NSW Police Force Annual Report. Retrieved from http://www.police.nsw.gov.au/about_us/ publications/annual_report
Swift, W., Jones, C., & Donnelly, N. (2010). Cannabis use while driving: A descriptive study of Australian cannabis users. Drugs: Education, Prevention and Policy, 17(5), 573-586.
Notes 1 Note that offenders can receive more than one penalty for
a given offence. Offenders who receive a fine, for example, may also receive a licence disqualification. Because fines are higher on BOCSAR’s sentencing hierarchy, the principal penalty would appear as a fine. For a list of BOCSAR’s penalty hierarchy, see page 151 of the NSW Criminal Courts 2011 (NSW Bureau of Crime Statistics and Research, 2012).
2 For full-time custodial sentences, the non-parole period is reported instead of the aggregate sentence because it more closely approximates the expected time to be served.
3 Note that all offences under s12 of the Act were included in this outcome measure even if the offence involved alcohol.
4 Note that all offences under s12 of the Act were included in this outcome measure even if the offence involved alcohol.
5 Recall that ROD only contains records from 1994 onwards. The juvenile offending history is therefore unknown for offenders who were aged 18 or older in 1994.
NSW Bureau of Crime Statistics and Research - Level 8, St James Centre, 111 Elizabeth Street, Sydney 2000 [email protected] • www.bocsar.nsw.gov.au • Ph: (02) 9231 9190 • Fax: (02) 9231 9187 • ISBN 978-1-921824-53-1
© State of New South Wales through the Department of Attorney General and Justice 2012. You may copy, distribute, display, download and otherwise freely deal with this work for any purpose, provided that you attribute the Department of Attorney General and Justice as the owner. However, you must obtain permission if you wish
to (a) charge others for access to the work (other than at cost), (b) include the work in advertising or a product for sale, or (c) modify the work.