peer review c39.pdf - universitas diponegoro
TRANSCRIPT

LEMBAR
HASIL PENILAIAN SEJAWAT SEBIDANG ATAU PEER REVIEW
KARYA ILMIAH : PROSIDING
Judul Jurnal Ilmiah
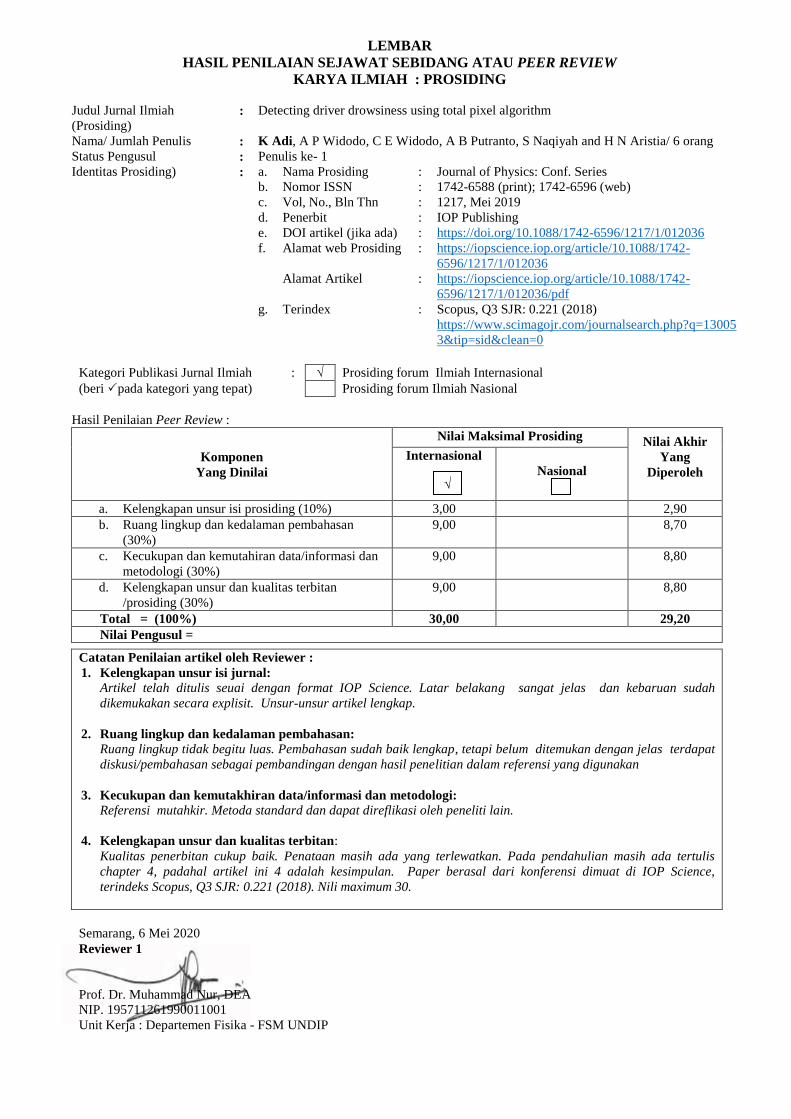
(Prosiding) : Detecting driver drowsiness using total pixel algorithm
Nama/ Jumlah Penulis : K Adi, A P Widodo, C E Widodo, A B Putranto, S Naqiyah and H N Aristia/ 6 orang
Status Pengusul : Penulis ke- 1
Identitas Prosiding) : a. Nama Prosiding : Journal of Physics: Conf. Series
b. Nomor ISSN : 1742-6588 (print); 1742-6596 (web)
c. Vol, No., Bln Thn : 1217, Mei 2019
d. Penerbit : IOP Publishing
e. DOI artikel (jika ada) : https://doi.org/10.1088/1742-6596/1217/1/012036
f. Alamat web Prosiding : https://iopscience.iop.org/article/10.1088/1742-
6596/1217/1/012036
Alamat Artikel : https://iopscience.iop.org/article/10.1088/1742-
6596/1217/1/012036/pdf
g. Terindex : Scopus, Q3 SJR: 0.221 (2018)
https://www.scimagojr.com/journalsearch.php?q=13005
3&tip=sid&clean=0
Kategori Publikasi Jurnal Ilmiah : √ Prosiding forum Ilmiah Internasional
(beri pada kategori yang tepat) Prosiding forum Ilmiah Nasional
Hasil Penilaian Peer Review :
Komponen Yang Dinilai Nilai Reviewer
Nilai Rata-rata Reviewer 1 Reviewer 2
a. Kelengkapan unsur isi jurnal (10%)
2,90 3,00 2,95
b. Ruang lingkup dan kedalaman
pembahasan (30%)
8,70 8,70 8,70
c. Kecukupan dan kemutahiran
data/informasi dan metodologi (30%)
8,80 8,60 8,70
d. Kelengkapan unsur dan kualitas
terbitan/jurnal (30%)
8,80 8,70 8,75
Total = (100%)
29,20 29,00 29,10
Semarang, 6 Mei 2020
Reviewer 1
Prof. Dr. Muhammad Nur, DEA
NIP. 195711261990011001
Unit Kerja : Departemen Fisika - FSM UNDIP
Reviewer 2
Prof. Dr. Heri Sutanto, SSi, MSi
NIP. 197502151998021001
Unit Kerja : Departemen Fisika - FSM UNDIP
LEMBAR
HASIL PENILAIAN SEJAWAT SEBIDANG ATAU PEER REVIEW
KARYA ILMIAH : PROSIDING
Judul Jurnal Ilmiah
(Prosiding) : Detecting driver drowsiness using total pixel algorithm
Nama/ Jumlah Penulis : K Adi, A P Widodo, C E Widodo, A B Putranto, S Naqiyah and H N Aristia/ 6 orang
Status Pengusul : Penulis ke- 1
Identitas Prosiding) : a. Nama Prosiding : Journal of Physics: Conf. Series
b. Nomor ISSN : 1742-6588 (print); 1742-6596 (web)
c. Vol, No., Bln Thn : 1217, Mei 2019
d. Penerbit : IOP Publishing
e. DOI artikel (jika ada) : https://doi.org/10.1088/1742-6596/1217/1/012036
f. Alamat web Prosiding : https://iopscience.iop.org/article/10.1088/1742-
6596/1217/1/012036
Alamat Artikel : https://iopscience.iop.org/article/10.1088/1742-
6596/1217/1/012036/pdf
g. Terindex : Scopus, Q3 SJR: 0.221 (2018)
https://www.scimagojr.com/journalsearch.php?q=13005
3&tip=sid&clean=0
Kategori Publikasi Jurnal Ilmiah : √ Prosiding forum Ilmiah Internasional
(beri pada kategori yang tepat) Prosiding forum Ilmiah Nasional
Hasil Penilaian Peer Review :
Komponen
Yang Dinilai
Nilai Maksimal Prosiding Nilai Akhir
Yang
Diperoleh
Internasional
Nasional
a. Kelengkapan unsur isi prosiding (10%) 3,00 2,90
b. Ruang lingkup dan kedalaman pembahasan
(30%)
9,00 8,70
c. Kecukupan dan kemutahiran data/informasi dan
metodologi (30%)
9,00 8,80
d. Kelengkapan unsur dan kualitas terbitan
/prosiding (30%)
9,00 8,80
Total = (100%) 30,00 29,20
Nilai Pengusul =
Catatan Penilaian artikel oleh Reviewer :
1. Kelengkapan unsur isi jurnal:
Artikel telah ditulis seuai dengan format IOP Science. Latar belakang sangat jelas dan kebaruan sudah
dikemukakan secara explisit. Unsur-unsur artikel lengkap.
2. Ruang lingkup dan kedalaman pembahasan:
Ruang lingkup tidak begitu luas. Pembahasan sudah baik lengkap, tetapi belum ditemukan dengan jelas terdapat
diskusi/pembahasan sebagai pembandingan dengan hasil penelitian dalam referensi yang digunakan
3. Kecukupan dan kemutakhiran data/informasi dan metodologi:
Referensi mutahkir. Metoda standard dan dapat direflikasi oleh peneliti lain.
4. Kelengkapan unsur dan kualitas terbitan:
Kualitas penerbitan cukup baik. Penataan masih ada yang terlewatkan. Pada pendahulian masih ada tertulis
chapter 4, padahal artikel ini 4 adalah kesimpulan. Paper berasal dari konferensi dimuat di IOP Science,
terindeks Scopus, Q3 SJR: 0.221 (2018). Nili maximum 30.
Semarang, 6 Mei 2020
Reviewer 1
Prof. Dr. Muhammad Nur, DEA
NIP. 195711261990011001
Unit Kerja : Departemen Fisika - FSM UNDIP
√

LEMBAR
HASIL PENILAIAN SEJAWAT SEBIDANG ATAU PEER REVIEW
KARYA ILMIAH : PROSIDING
Judul Jurnal Ilmiah
(Prosiding) : Detecting driver drowsiness using total pixel algorithm
Nama/ Jumlah Penulis : K Adi, A P Widodo, C E Widodo, A B Putranto, S Naqiyah and H N Aristia/ 6 orang
Status Pengusul : Penulis ke- 1
Identitas Prosiding) : a. Nama Prosiding : Journal of Physics: Conf. Series
b. Nomor ISSN : 1742-6588 (print); 1742-6596 (web)
c. Vol, No., Bln Thn : 1217, Mei 2019
d. Penerbit : IOP Publishing
e. DOI artikel (jika ada) : https://doi.org/10.1088/1742-6596/1217/1/012036
f. Alamat web Prosiding : https://iopscience.iop.org/article/10.1088/1742-
6596/1217/1/012036
Alamat Artikel : https://iopscience.iop.org/article/10.1088/1742-
6596/1217/1/012036/pdf
g. Terindex : Scopus, Q3 SJR: 0.221 (2018)
https://www.scimagojr.com/journalsearch.php?q=13005
3&tip=sid&clean=0
Kategori Publikasi Jurnal Ilmiah : √ Prosiding forum Ilmiah Internasional
(beri pada kategori yang tepat) Prosiding forum Ilmiah Nasional
Hasil Penilaian Peer Review :
Komponen
Yang Dinilai
Nilai Maksimal Prosiding Nilai Akhir
Yang
Diperoleh
Internasional
Nasional
e. Kelengkapan unsur isi prosiding (10%) 3,00 3,00
f. Ruang lingkup dan kedalaman pembahasan
(30%)
9,00 8,70
g. Kecukupan dan kemutahiran data/informasi dan
metodologi (30%)
9,00 8,60
h. Kelengkapan unsur dan kualitas terbitan
/prosiding (30%)
9,00 8,70
Total = (100%) 30,00 29,00
Nilai Pengusul =
Catatan Penilaian artikel oleh Reviewer :
1. Kelengkapan unsur isi jurnal: Artikel telah ditulis secara lengkap mulai dari judul, abstrak, pendahuluan hingga referensi dan sesuai template
Journal of Physics: Conf. Series . Scope prosiding relevan dengan artikel yang ditulis.
2. Ruang lingkup dan kedalaman pembahasan: Ruang lingkup kedalaman pembahasan baik dan kurang mendalam. Konfirmasi atau perbandingan hasil dengan
peneliti atau artikel lain tidak ada.
3. Kecukupan dan kemutakhiran data/informasi dan metodologi: Data penelitian yang diperoleh masih minim. Hasil penelitian sudah sesuai dengan metodologi riset yang dilakukan.
Artikel disusun berdasarkan total 13 referensi dan 5 referensi tidak mutakhir.
4. Kelengkapan unsur dan kualitas terbitan: Secara umum kelengkapan unsur artikel lengkap. Kualitas penerbit baik. Tahapan pengecekan format kurang teliti
seperti pada referensi No 10 tidak ada tahunnya. Prosiding telah terindeks Scopus dengan SJR (2018) 0.22.
Semarang, 6 Mei 2020
Reviewer 2
Prof. Dr. Heri Sutanto, SSi, MSi
NIP. 197502151998021001
Unit Kerja : Departemen Fisika - FSM UNDIP
√

Journal of Physics: Conference Series
PAPER • OPEN ACCESS
The 8th International Seminar on New Paradigm and Innovation onNatural Science and Its ApplicationTo cite this article: 2019 J. Phys.: Conf. Ser. 1217 011001
View the article online for updates and enhancements.
This content was downloaded from IP address 114.5.242.162 on 22/05/2020 at 13:56

Content from this work may be used under the terms of the Creative Commons Attribution 3.0 licence. Any further distributionof this work must maintain attribution to the author(s) and the title of the work, journal citation and DOI.
Published under licence by IOP Publishing Ltd
ISNPINSA 2018
IOP Conf. Series: Journal of Physics: Conf. Series 1217 (2019) 011001
IOP Publishing
doi:10.1088/1742-6596/1217/1/011001
1
PREFACE
The 8th International Seminar on New Paradigm and Innovation on Natural Sciences and Its
Application (ISNPINSA-8) is annual seminars organized by Faculty of Sciences and
Mathematics (FSM) Diponegoro University and has been successfully conducted since 2011.
The ISNPINSA-8 was held in Semarang, Indonesia on September 26th 2018. The aims of
ISNPINSA are to facilitate brain storming and state of the art information in field of sciences
and mathematics; to increase innovation of technology that can be applied in industries; to
contribute in formulating strategy to increase the role of science for community; and to
stimulate collaboration between industries, researchers and government to increase
community welfare. The theme of 8th ISNPINSA in 2018 is “Science and Applied Science for
Sustainable Development Goals”.
The number of participants of the seminar were 272 including keynote speakers, invited
speakers, oral presenters, poster presenters, and non presenters coming from various
institutions of various countries, including Japan, Philippines, Thailand, Malaysia, Australia,
Bangladesh, China, Kazakhtan, Vietnam and those who come from all parts of Indonesia
consist of researchers, lecturers, postgraduate and undergraduate students from various
universities. There are 272 papers were presented in this seminar, consist of 5 keynote
speakers, 237 oral presentations, and 30 poster presentations. After the selection process,
there are 184 articles selected papers to be published in the present conference proceeding.
This is the largest number of papers and participants for eight times the implementation of
ISNPINSA. The scope of the field of participants comes from various fields including
biology, physics, chemistry, statistics, mathematics, informatics, environment, public health,
and relevant fields that contribute to sustainable development.
The Editors
Dr.Eng. Ali Khumaeni
Sapto Purnomo Putro, Ph.D.
Rully Rahadian, Ph.D.

ISNPINSA 2018
IOP Conf. Series: Journal of Physics: Conf. Series 1217 (2019) 011001
IOP Publishing
doi:10.1088/1742-6596/1217/1/011001
2
CONFERENCE PHOTOGRAPHS
Opening ceremony by Dr.Eng. Ali Khumaeni (Chairman of The 8th ISNPINSA 2018)
Welcoming speech by Prof. Dr. Widowati (Dean of Faculty of Science and Mathematics,
Diponegoro University)

ISNPINSA 2018
IOP Conf. Series: Journal of Physics: Conf. Series 1217 (2019) 011001
IOP Publishing
doi:10.1088/1742-6596/1217/1/011001
3
Welcoming speech by Prof. Dr. Ambariyanto, M.Sc (Vice Rector of Research and
Innovation, Diponegoro University)
Photo session (Vice Rector of Diponegoro University, Dean of Faculty of Science and
Mathematics, Keynote Speakers, and Committee)

ISNPINSA 2018
IOP Conf. Series: Journal of Physics: Conf. Series 1217 (2019) 011001
IOP Publishing
doi:10.1088/1742-6596/1217/1/011001
4
Photo session (Organizing Committee)
Plenary Session by Prof. Kaemwich Jantama, Ph.D. (Suranaree University of Technology,
Thailand)

ISNPINSA 2018
IOP Conf. Series: Journal of Physics: Conf. Series 1217 (2019) 011001
IOP Publishing
doi:10.1088/1742-6596/1217/1/011001
5
Plenary Session by Prof. Dr Henk Heijnis (Australian Nuclear Science and Technology
Organization (ANSTO), Australia)

ISNPINSA 2018
IOP Conf. Series: Journal of Physics: Conf. Series 1217 (2019) 011001
IOP Publishing
doi:10.1088/1742-6596/1217/1/011001
6
PEER REVIEW STATEMENT
“All papers published in this volume of Journal of Physics: Conference Series have been peer
reviewed through processes administered by the Editors. Reviewers were conducted by
expert referees to the profesional and scientific standards expected of a proceedings journal
published by IOP Publishing.”

ISNPINSA 2018
IOP Conf. Series: Journal of Physics: Conf. Series 1217 (2019) 011001
IOP Publishing
doi:10.1088/1742-6596/1217/1/011001
7
LIST OF REFEREES AND EDITORS
1. Prof. Dr. Widowati
2. Prof. Mustafid, Ph.D.
3. Prof. Dr. Wahyu Setia Budi
4. Prof. Dr. Heri Sutanto
5. Sapto P Putro, Ph.D.
6. Dr. Jafron W. Hidayat
7. Dr. Munifatul Izzati
8. Dr. Budi Warsito
9. Dr. Eng. Ali Khumaeni
10. Dr. Di Asih I Maruddani
11. Dr. Muhammad Nur, DEA
12. Dr. Kusworo Adi
13. Dr. Endang Kusdiyantini, DEA
14. Rully Rahadian, Ph.D.
15. Anto Budiharjo, Ph.D.
16. Dr. Tri Retnaningsih Soeprobowati
17. Ismiyarto, Ph.D.
18. Dr. Retno Ariadi Lusiana
19. Dr. Tarno
20. Dr. Eng. Adi Wibowo
21. Dr. Sutimin
22. Alan Prahutama, M.Si
23. Dr. Rukun Santoso
24. Dr. Redemtus Heru Tjahyana
25. Dinar Mutiara Kusumo Nugraheni, Ph.D.
26. Dr. Titik Widiharih
27. Dr. Hermin Pancasakti
28. Dr. Agung janika Sitasiwi
29. Dr. Erma Prihastanti
30. Heri Sugito, M.Si.
31. Fajar Ariyanto, M.Si.
32. Dr. Udi Harmoko
33. Dr. Rahmat Gernowo

ISNPINSA 2018
IOP Conf. Series: Journal of Physics: Conf. Series 1217 (2019) 011001
IOP Publishing
doi:10.1088/1742-6596/1217/1/011001
8
LIST OF SPEAKER
Keynote Speaker:
Prof. Elmer S. Estacio, Ph.D. National Institute of Phyics, University of the
Philippines, Manila, Philippines
Prof. Dr. Kazuyoshi Kurihara University of Fukui, Japan
Prof. Dr. Kaemwich Jantama, Ph.D. Suranaree University of Technology, Thailand
Prof. Dr. Hendrik Heijnis Australian Nuclear Science and Technology,
Australia
Prof. Dr. I Gede Wenten Institut Teknologi Bandung, Indonesia
Invited Speaker:
Dr. Retno Kusumaningrum Diponegoro University, Semarang, Indonesia
Dr. Sutimin Diponegoro University, Semarang, Indonesia
Prof. Dr. Heri Sutanto Diponegoro University, Semarang, Indonesia
Vincensius Gunawan, Ph.D. Diponegoro University, Semarang, Indonesia
Rully Rahadian, Ph.D. Diponegoro University, Semarang, Indonesia
Dr.rer.nat. Anto Budiharjo Diponegoro University, Semarang, Indonesia
Pratama Jujur Wibawa, Ph.D. Diponegoro University, Semarang, Indonesia
Dr. Nor Basid Prasetya Diponegoro University, Semarang, Indonesia
Dr. Rukun Santoso Diponegoro University, Semarang, Indonesia

ISNPINSA 2018
IOP Conf. Series: Journal of Physics: Conf. Series 1217 (2019) 011001
IOP Publishing
doi:10.1088/1742-6596/1217/1/011001
9
LIST OF COMMITTEE
Steering Committee:
Prof. Dr. Muhammad Zainuri, Diponegoro University, Indonesia
Prof. Dr. Widowati, Diponegoro University, Indonesia
Prof. Dr. Heru Susanto, Diponegoro University, Indonesia
Dr. Muhammad Nur, Diponegoro University, Indonesia
Prof. Dr. Wahyu Setia Budi, Diponegoro University, Indonesia
Prof. Dr. Mustafid, Diponegoro University, Indonesia
Sapto Purnomo P, Ph.D, Diponegoro University, Indonesia
Organising Committee:
Dr.Eng. Ali Khumaeni, S.Si. M.E. (Chairman)
Rully Rahadian, SSi, MSi, PhD (Vice-Chairman I)
Dr. Di Asih I Maruddani, S.Si, M.Si (Vice-Chairman II)
Dr. R. Heru Tjahjana (Member)
Dr. Tarno, M.Si (Member)
Dr. Susilo Haryanto (Member)
Yayuk Astuti, Ph.D (Member)
Adi Darmawan, Ph.D (Member)
Agus Setyo Utomo, M.M (Member)
Dewi Kusrini, M.Si. (Member)
Dr. Kusworo Adi, M.T (Member)
Dr. Dwi Hadiyanti, M.Si (Member)
Dr. Endah D Hastuti, M.Si (Member)
Farikhin, Ph.D (Member)
Ragil Saputro, M.T (Member)
Dra. Dwi Ispriyanti, M.Si (Member)
Heri Sugito, M.Sc (Member)
Alan Prahutama, M.Si (Member)
Fajar Arianto, M.Si (Member)
Bagus Rahmawan Trianto, S.Kom (Member)
Alik Maulidiyah, S.Si (Member)

Journal of Physics: Conference Series
PAPER • OPEN ACCESS
Peer review statementTo cite this article: 2019 J. Phys.: Conf. Ser. 1217 011002
View the article online for updates and enhancements.
This content was downloaded from IP address 114.5.242.162 on 22/05/2020 at 13:55

Content from this work may be used under the terms of the Creative Commons Attribution 3.0 licence. Any further distributionof this work must maintain attribution to the author(s) and the title of the work, journal citation and DOI.
Published under licence by IOP Publishing Ltd
ISNPINSA 2018
IOP Conf. Series: Journal of Physics: Conf. Series 1217 (2019) 011002
IOP Publishing
doi:10.1088/1742-6596/1217/1/011002
1
Peer review statement
All papers published in this volume of Journal of Physics: Conference Series have been peer reviewedthrough processes administered by the proceedings Editors. Reviews were conducted by expert referees tothe professional and scientific standards expected of a proceedings journal published by IOP Publishing.

Author details
1 of 1◅ Return to search results
Adi, K.Author ID: 57200265615
Affiliation(s):
, Semarang, Indonesia
http://orcid.org/0000-0002-7702-6554
Universitas Diponegoro View more
View potential author matches
Other name formats: Adi, K. Adi, Kusworo
Subject area: Computer Science Engineering Physics and Astronomy Environmental Science Social Sciences
Energy Mathematics Medicine Earth and Planetary Sciences Decision Sciences
Health Professions View all
Documents by author
35Analyze author output
Total citations
66 by documents51
View citation overview
h-index:
4❓
View h-graph
Document andcitation trends:
Years
Docum
ents C
itations
Documents
Citations
2006 20200
8
0
21
Profile actions
Edit author profile
Connect to ORCID ❓
AlertsSet citation alertSet document alert
❓ Learn more about ScopusProfiles ↗
KAUniversitas Diponegoro35 Documents
K. Adi ⬈
Is this you?
Sort on:
Document title Authors Year Source Cited by
, , , (...), ,
2019185(1), pp. 42-49
0
Open Access
, , 2019125,22006
0
35 Documents Cited by 51 documents 48 co-authors Topics
▻ View in search results format ▻View 394 references Date (newest)
Export all Add all to list Set document alert Set document feed
A SIMPLIFIED METHOD for the WATER-EQUIVALENT DIAMETERCALCULATION to ESTIMATE PATIENT DOSE in CT EXAMINATIONS
Anam, C. Arif, I. Haryanto,F. Adi, K. Dougherty,G.
Radiation Protection Dosimetry
View abstract View at Publisher Related documents
System of Performance Evaluation of Rice Paddy Production withData Envelopment Analysis
Hidayah, Q.H. MustafidAdi, K.
E3S Web of Conferences
View abstract View at Publisher Related documents
Brought to you by Universitas Diponegoro
Search Sources Lists ↗SciVal Create account Sign in

Document title Authors Year Source Cited by
Open Access
, ,, (...),
,
2019
25(3), pp. 179-187
0
, , , (...), ,
201939(3), pp. 783-793
Open Access
, 20191217(1),12033
0
Open Access
, , , ,
20191217(1),12032
0
Open Access, ,
, (...), ,
20191217(1),12036
0
, , 2019 Proceeding - 2019 International Conference ofArtificial Intelligence and InformationTechnology, ICAIIT 20198834622, pp. 255-259
0
Open Access
, , 201873,13004
0
, , 2018 2018 International Seminar on Research ofInformation Technology and Intelligent Systems,ISRITI 20188864330, pp. 459-464
0
, ,,
20181977,020007
0
Open Access
, ,,
,
20181025(1),012025
Automated MTF measurement in CT images with a simple wirephantom
Anam, C. Fujibuchi, T.Haryanto, F. Muhlisin,Z. Dougherty, G.
Polish Journal of Medical Physics andEngineering
View abstract View at Publisher Related documents
Assessment of patient dose and noise level of clinical CT images:Automated measurements
Anam, C. Budi, W.S. Adi,K. Fujibuchi, T.Dougherty, G.
Journal of Radiological Protection 4
View abstract View at Publisher Related documents
Finger edge contour perimeter as a biometric based identificationsystem
Widodo, C.E. Adi, K. Journal of Physics: Conference Series
View abstract View at Publisher Related documents
Richardson number model for turbulence motion analysis aroundairport runway
Gernowo, R. Saputro,H.D. Setiawan, A. Adi, K.Widodo, A.P.
Journal of Physics: Conference Series
View abstract View at Publisher Related documents
Detecting driver drowsiness using total pixel algorithm Adi, K. Widodo, A.P.Widodo, C.E. Naqiyah,S. Aristia, H.N.
Journal of Physics: Conference Series
View abstract View at Publisher Related documents
Determining the Threshold Value for Identification of the GobletCells in Chicken Small Intestine
Sepriana, D. Adi, K.Widodo, C.E.
View abstract View at Publisher Related documents
Information System Prediction with Weighted Moving Average(WMA) Method and Optimization Distribution Using VehiclesRouting Problem (VRP) Model for Batik Product
Nugrahani, T.A. Adi, K.Suseno, J.E.
E3S Web of Conferences
View abstract View at Publisher Related documents
Logic scoring of preference method for determining landfill withgeographic information system
Pirmanto, D. Suseno, J.E.Adi, K.
View abstract View at Publisher Related documents
Design of crack detection system for concrete built infrastructurebased on fiber optic sensors
Hidayah, F.N. Budi, W.S.Adi, K. Supardjo
AIP Conference Proceedings
View abstract View at Publisher Related documents
Automatic vehicle counting using background subtraction methodon gray scale images and morphology operation
Adi, K. Widodo, A.P.Widodo, C.E. Pamungkas,A. Putranto, A.B.
Journal of Physics: Conference Series 1
View abstract View at Publisher Related documents

Document title Authors Year Source Cited by
Open Access
, ,, ,
20181025(1),012023
Open Access
, , 201831,11007
Open Access
, , 201831,10006
0
, ,, (...),
,
2018
11(2), pp. 8-12
, , 201723(7), pp. 6593-6597
, ,,
201723(7), pp. 6618-6622
0
Open Access
, , 2017855(1),012063
0
, , 2017 Proceedings - 2016 3rd International Conferenceon Information Technology, Computer, andElectrical Engineering, ICITACEE 20167892450, pp. 253-259
Hazard mitigation with cloud model based rainfall and convectivedata
Gernowo, R. Adi, K.Yulianto, T. Seniyatis, S.Yatunnisa, A.A.
Journal of Physics: Conference Series 1
View abstract View at Publisher Related documents
Application Mail Tracking Using RSA Algorithm As Security Data andHOT-Fit a Model for Evaluation System
Permadi, G.S. Adi, K.Gernowo, R.
E3S Web of Conferences 3
View abstract View at Publisher Related documents
The Decision Support System (DSS) Application to Determination ofDiabetes Mellitus Patient Menu Using a Genetic Algorithm Method
Zuliyana, N. Suseno, J.E.Adi, K.
E3S Web of Conferences
View abstract View at Publisher Related documents
Detection lung cancer using Gray Level Co-Occurrence Matrix(GLCM) and back propagation neural network classification
Adi, K. Widodo, C.E.Widodo, A.P.Pamungkas, A. Syifa, R.A.
Journal of Engineering Science and TechnologyReview
3
View abstract Related documents
Convective cloud model for analyzing of heavy rainfall of weatherextreme at Semarang Indonesia
Gernowo, R. Adi, K.Yulianto, T.
Advanced Science Letters 2
View abstract View at Publisher Related documents
Beef marbling identification using color analysis and decision treeclassification
Adi, K. Pujiyanto, S.Nurhayati, O.D.Pamungkas, A.
Advanced Science Letters
View abstract View at Publisher Related documents
Calculation of Lung Cancer Volume of Target Based on ThoraxComputed Tomography Images using Active Contour SegmentationMethod for Treatment Planning System
Yosandha, F.P. Adi, K.Widodo, C.E.
Journal of Physics: Conference Series
View abstract View at Publisher Related documents
Detection of the beef quality: Using mobile-based K-mean clusteringmethod
Nurhayati, O.D. Adi, K.Pujiyanto, S.
2
View abstract View at Publisher Related documents
Display: results per page20 1 2
Top of page
The data displayed above is compiled exclusively from documents indexed in the Scopus database. To request corrections to any inaccuraciesor provide any further feedback, please use the .Author Feedback Wizard
About Scopus
What is Scopus
Content coverage
Scopus blog
Scopus API
Language
⽇本語に切り替える切换到简体中文
切換到繁體中文
Русский язык
Customer Service
Help
Contact us

Document details
7 of 35
Detecting driver drowsiness using total pixel algorithm (Conference Paper)(Open Access)
, , , , ,
Departmen of Physics, Faculty of Science and Mathematics, Diponegoro University, IndonesiaDepartmen of Informatics, Faculty of Science and Mathematics, Diponegoro University, Indonesia
AbstractAdvancement in transportation technology certainly comes with numerous positive impacts. Nonetheless, somenegative aspects including growing numbers of traffic accidents cannot be taken for granted. Factors that triggertraffic accidents range from human errors, vehicle mishaps, to the environment itself. Human error is somehow thefactor that often causes traffic accidents. This research aims to propose a method of detecting drowsiness using thetotal pixel algorithm for drivers, with the help of video cameras connected to a computer. It was expected that it wouldhelp reduce the number of traffic accidents. The method employed in this research is detecting drivers' faces bysegmenting RGB images into YCbCr color spectrum, determining the area of the eyes, and classifying eyes conditionusing total pixel algorithm. The system developed has been able to detect drowsiness in drivers without glasses with90.5% to 92% accuracy. However, for the detection of objects with glasses ranging from 72.8% to 74.8% accuracy. ©Published under licence by IOP Publishing Ltd.
SciVal Topic Prominence
Topic:
Prominence percentile: 89.103
Indexed keywords
Engineeringcontrolled terms:
Errors Glass Object detection Pixels Video cameras
Engineeringuncontrolled terms
Color spectra Driver drowsiness Human errors RGB images Transportation technology
Engineering mainheading:
Accidents
Funding details
Funding textThis research was funded University in 2018
◅ Back to results ◅ Previous ▻Next
Export Download Print E-mail Save to PDF ⋆ Add to List ▻More...
View at Publisher
Journal of Physics: Conference SeriesVolume 1217, Issue 1, 17 June 2019, Article number 120368th International Seminar on New Paradigm and Innovation on Natural Sciences and ItsApplication, ISNPINSA 2018; Semarang, Central Java; Indonesia; 26 September 2018 through ;Code 148936
Adi, K.a Widodo, A.P.b Widodo, C.E.a Putranto, A.B.a Naqiyah, S.a Aristia, H.N.a
a
b
View references (13)
Face recognition | Fatigue of materials | Eye center
PlumX MetricsUsage, Captures, Mentions,Social Media and Citationsbeyond Scopus.
Metrics
Cited by 0 documents
Inform me when this documentis cited in Scopus:
Related documents
Find more related documents inScopus based on:
❓ ▻View all metrics
Set citation alert ▻
▻Set citation feed
▻Authors ▻Keywords
Brought to you by Universitas Diponegoro
Search Sources Lists ↗SciVal Create account Sign in

References (13)
Bergasa, L.M., Nuevo, J., Sotelo, M.A., Barea, R., Lopez, E.
(2008) Studies in Computational Intelligence, 132, pp. 19-37. .ISBN: 978-354079256-7doi: 10.1007/978-3-540-79257-4_2
Fuletra, J.D., Bosamiya, D.(2013) International Journal on Recent and Innovation Trends in Computing and Communication, 1, p. 11.
Viola, P., Jones, M.J.
(2004) International Journal of Computer Vision, 57 (2), pp. 137-154. .doi: 10.1023/B:VISI.0000013087.49260.fb
Sim, D.-G., Park, R.-H., Kim, R.-C., Lee, S.U., Kim, I.-C.
(2002) IEEE Transactions on Pattern Analysis and Machine Intelligence, 24 (1), pp. 1-18. .doi: 10.1109/34.982881
Yow, K.C., Cipola, R.(1997) Image and Vision Computing, 15.
Sigari, M.H., Fathy, M., Soryani, M.(2013) International Journal of Vehicular Technology, 2013.2013
Gurram, K.K.C., Jain, H., Naresh(2014) International Journal of Advanced Trends in Computer Science and Engineering, 3, p. 1.
Singh, S.K., Chauhan, D.S., Vatsa, M., Singh, R.(2003) Tamkang Journal of Science and Engineering, 6, p. 4. .
Reddy, R.V.K., Raju, K.P., Kumar, L.R., Kumar, M.J.(2016) International Journal of Computer Applications, 147, p. 7.
ISSN: 17426588Source Type: Conference ProceedingOriginal language: English
DOI: 10.1088/1742-6596/1217/1/012036Document Type: Conference PaperVolume Editors: Khumaeni A.,Putro S.P.,Rahadian R.Publisher: Institute of Physics Publishing
▻View in search results format
All Export Print E-mail Save to PDF Create bibliography
1
Visual monitoring of driver inattention
Cited 24 times
View at Publisher
2
3
Robust Real-Time Face Detection
Cited 8799 times
View at Publisher
4
Integrated position estimation using aerial image sequences
Cited 91 times
View at Publisher
5
6
7
8Cited 2 times
9

7 of 35
Adi, K., Widodo, A.P., Widodo, C.E., Pamungkas, A., Putranto, A.B.Journal of Physics: Conference Series, 1025.
Bhargavi, K., Jyothi, S.(2014) International Journal of Innovative Research & Development, 3, p. 2.
Adi, K., Pujiyanto, S., Nurhayati, O.D., Pamungkas, A.(2017) Journal of Food Quality, 2017
Adi, K., Widodo, C.E., Sugiharto, A., Maulana, B.S.Q., Pamungkas, A.
(2016) Proceedings - 2016 3rd International Conference on Information Technology, Computer, andElectrical Engineering, ICITACEE 2016, art. no. 7892443, pp. 220-222.ISBN: 978-150901434-7doi: 10.1109/ICITACEE.2016.7892443
© Copyright 2019 Elsevier B.V., All rights reserved.
10
11
12
13
Calculation of phantom volume for computed tomography (CT) scan images
View at Publisher
◅ Back to results ◅ Previous ▻Next Top of page
About Scopus
What is Scopus
Content coverage
Scopus blog
Scopus API
Privacy matters
Language
⽇本語に切り替える切换到简体中文
切換到繁體中文
Русский язык
Customer Service
Help
Contact us
Copyright © . All rights reserved. Scopus® is a registered trademark of Elsevier B.V.
We use cookies to help provide and enhance our service and tailor content. By continuing, you agree to the.
↗Terms and conditions ↗Privacy policy
↗Elsevier B.V
use of cookies

Journal of Physics: Conference Series
PAPER • OPEN ACCESS
An investigation of a CT noise reduction using a modified of wienerfiltering-edge detectionTo cite this article: C Anam et al 2019 J. Phys.: Conf. Ser. 1217 012022
View the article online for updates and enhancements.
This content was downloaded from IP address 118.96.138.242 on 07/06/2020 at 14:16

Content from this work may be used under the terms of the Creative Commons Attribution 3.0 licence. Any further distributionof this work must maintain attribution to the author(s) and the title of the work, journal citation and DOI.
Published under licence by IOP Publishing Ltd
ISNPINSA 2018
IOP Conf. Series: Journal of Physics: Conf. Series 1217 (2019) 012022
IOP Publishing
doi:10.1088/1742-6596/1217/1/012022
1
An investigation of a CT noise reduction using a modified of
wiener filtering-edge detection
C Anam1,*
, T Fujibuchi2, T Toyoda
2, N Sato
2, F Haryanto
3, R Widita
3, I Arif
3 and
G Dougherty4
1 Department of Physics, Faculty of Mathematics and Natural Sciences, Diponegoro
University, Jl. Prof. Soedarto SH, Tembalang, Semarang 50275, Indonesia. 2 Department of Health Sciences, Faculty of Medical Sciences, Kyushu University, 3-
1-1 Maidashi, Higashi-ku, Fukuoka 812-8582, Japan. 3 Department of Physics, Faculty of Mathematics and Natural Sciences, Bandung
Institute of Technology, Ganesha 10, Bandung 40132, Indonesia. 4 Applied Physics and Medical Imaging, California State University Channel Islands,
Camarillo, CA 93012, USA.
E-mail: [email protected]
Abstract. The aims of this study were to investigate the noise reduction in a CT image using a
modified Wiener filtering-edge detection method. We modified the noise reduction algorithm
of a combination of the Wiener filter and edge detection by addition of a dilation stage after
edge detection. We then evaluated kernel size of the Wiener filter, threshold values in the edge detection, and size of structuring elements in the dilation process. Images of adult
anthropomorphic and self-built wire phantoms were acquired by the new 4-row multislice CT
Toshiba Alexion™. The images of the anthropomorphic phantom were used for a visual
evaluation, while the images of the wire-phantom were used to obtain the spatial resolution and
noise of the images. A Wiener filter-edge detection filter coupled with dilation, potentially
reduced more CT noise. We found that the spatial resolution and noise of the filtered images
were influenced by the size of the Wiener filter kernel, threshold of edge detection, and size of
structuring element.
1. Introduction
Several approaches have been proposed to reduce CT dose without compromising image quality. One method has been proposed is the tube current modulation (TCM) [1, 2]. In TCM, tube currents
decrease and increase proportionally with the decreasing and increasing attenuation of body parts [3].
Tube current modulation could be implemented by the rotation of the x-ray tube (angle-modulation) or by modulation in the direction of the longitudinal axis (Z-modulation), or a combination of both [4].
Another method proposed for reducing the dose is to utilize iterative reconstruction (IR) [5], instead of
filtered back-projection (FBP). In fact, the IR technique is not only iterative during reconstruction but
also iteratively processes in either the sinogram [6] or image spaces [7], in accordance with the specific physical modeling or statistical approaches. There are several IR software products used by
major CT vendors including ASIR, AIDR, VEO, IRIS, SAFIRE, and iDose [8]. However, the details
of the algorithms are very sparse, and they are still considered proprietary algorithms [5]. Another method that can be used for CT dose reduction is the use of noise reduction in the image
space [8]. A noisy image due to acquisition with a small tube current-time (mAs) parameter can have

ISNPINSA 2018
IOP Conf. Series: Journal of Physics: Conf. Series 1217 (2019) 012022
IOP Publishing
doi:10.1088/1742-6596/1217/1/012022
2
its noise suppressed by a post-processing noise reduction algorithm, but this tends to reduce the spatial resolution of the image. Kalra et al. [9] reported that the application of noise reduction has the
potential to reduce patient dose by approximately 50% with only a slight decrease in image quality.
However, they did not explain the details of the six filters used. Other advanced noise reduction algorithms are available, including bilateral filtering [10], non-local means (NLM) filtering [11], and
wavelet filtering [12]. Some of these methods even generate low noise images with a relatively good
spatial resolution, but they require relatively heavy computation. One proposal for a noise reduction algorithm that would maintain spatial resolution and use only
light computation is to combine the Wiener filter with edge detection [13]. In this algorithm, the two
processes are applied separately, and the resulting images are arranged selectively in order to choose
low noise images with a relatively good spatial resolution [13]. This study aims to improve the method by adding dilation and evaluate the spatial resolution of these images with MTF curves.
2. Method
2.1. Post-Processing Filter
In this study, we modified the noise reduction algorithm that has been introduced previously [13],
using a combination of the Wiener filter and edge detection. We added a dilation stage after edge
detection so that the edge area would be wider compared to the use of edge detection only. Figure 1 shows the noise reduction algorithm. It was accomplished by two processes.
Figure 1. The algorithm of the post-processing filtering using a combination of Wiener filtering and
edge detection.
The first was the process of filtering the image using the Wiener filter, which is an adaptive post-
processing filter which considers both the local and global variance of the image. The Wiener filter uses equation (1) to produce a less noisy image h(x,y) from the noisy image g(x,y).
)),((),(2
22
yxgyxh
L
gL (1)
where σg is the global variance of the noisy image, σL is the local variance of the image, and μ is the
local mean around each pixel. In homogeneous areas, σL is small, and the filter performs more noise

ISNPINSA 2018
IOP Conf. Series: Journal of Physics: Conf. Series 1217 (2019) 012022
IOP Publishing
doi:10.1088/1742-6596/1217/1/012022
3
reduction, and around the edges σL is large, and the filter performs little noise reduction. The result is expected to be an image with low noise, without significantly decreasing the spatial resolution. In this
study, the Wiener filter process was implemented pixel by pixel using kernels of 3x3, 5x5, and 7x7
pixels. The second process was edge detection and dilation. In this research, the Prewitt method was used.
The kernel of Prewitt was then convolved with the original image, g(x,y), to find the gradient image in
x-axis and y-axis. After obtaining the two-dimensional gradient image, a threshold value for the edges were determined. The pixel value was set equal to 1 for a gradient more than the threshold value
which was considered the edge of an object, while below the threshold value the pixel value was set to
0 and was not considered an edge. From this process, we obtained the image depicting the edge of an
object, q(x, y). We evaluated the effect of varying the threshold value of edge detection, using values of 0.0001, 0.0005 and 0.0010.
From this edge detection process, boundaries between objects were obtained. A pixel value is 1 at
boundaries among objects and otherwise is 0. However, the boundaries among objects may be only a narrow line. To widen the area of this edge, a dilation operation was used. The dilation process
converts the pixel value of the image from 0 to 1 around the edge so that it becomes wider, k(x, y).
Dilation could be carried out using a structuring element (strel) with various geometries and various
ranges. In this study, we used diamond-shaped strels with ranges of 2, 3 and 4 pixels. After the two separate processes were completed, a new image was composed using equation (2).
hkkgf )1( (2)
Equation (2) indicates that at the edge region or k(x,y) = 1, a new image is taken from the original
image g(x,y), while at the outside of edge or k(x,y) = 0, a new image is taken from the image that has
been filtered with the Wiener filter h(x,y).
2.2. CT Scanner and Phantoms
The evaluation of the modified the Wiener filter-edge detection was carried out using the images of
phantoms scanned by the 4-row multislice CT Toshiba Alexion™ installed at the Department of Health Sciences, Faculty of Medical Sciences, Kyushu University, Japan. Two types of phantoms
were used, the first was an adult anthropomorphic phantom and the second was a self-built wire
phantom (Figure 2). The wire phantom comprised a CT injector syringe of 200 ml volume (Kyorindo Nemoto Co., LTD, Japan) filled with tap water, with a tin wire of diameter 0.1 mm along the center.
Figure 2. (a) Adult anthropomorphic phantom, (b) self-built wire phantom.
The anthropomorphic phantom was scanned in the head using axial mode. The images of the
anthropomorphic phantom were used for a visual evaluation of the novel noise reduction method. The phantom was scanned with a tube voltage of 120 kVp, tube current of 100 mA, rotation time of 0.75 s,
a field of view of 430 mm, slice thickness of 4x3 mm, and the image was reconstructed with a FC13
filter. The wire phantom was used to obtain the spatial resolution of the system using MTF curves
[14]. The noise was calculated from homogeneous areas in this phantom image. The wire phantom was scanned along the center of the longitudinal axis in axial mode, using a tube voltage of 120 kVp, a
field of view of 7 cm, rotation time of 1 s, and slice thickness of 4x4 mm. The wire phantom images
were reconstructed using the FC13 filter (for soft tissue exams) and FC30 filter (for bone exams). The regions of interest (ROI) for the MTF and noise calculations are presented in Figure 3. The
center position of the ROI for the MTF calculation was at the center of the wire image, at position

ISNPINSA 2018
IOP Conf. Series: Journal of Physics: Conf. Series 1217 (2019) 012022
IOP Publishing
doi:10.1088/1742-6596/1217/1/012022
4
(255, 290). The ROI size was 130x130 pixels. After obtaining the line spread function (LSF) in the x-axis, we found the MTF curve using the Fourier transform:
dxexLSFxLSFFMTF xj 2)())(()( (3)
where ω indicates the spatial frequency and F indicates the Fourier transform.
The ROI for the noise calculation was 100x100 pixels, located in a homogeneous area of the image.
The center of the ROI was at position (240, 210). The noise was calculated as the standard deviation of pixels in the ROI.
Figure 3. Region of interest for (a) MTF calculation, and (b) noise calculation.
3. Results
3.1. Modified Wiener Filter-Edge Detection
Figure 4 shows the axial image of the anthropomorphic phantom (a) before filtering, (b) after filtering using the Wiener filter, and (c) after filtering using the modified Wiener filter-edge detection. The
filtered image used a Wiener filter kernel of 3x3 pixels with an edge detection threshold of 0.0005,
followed by dilation using a diamond-shaped kernel with a structural element (strel) range of 3 pixels.
The spatial resolution of the image decreased significantly after Wiener filtering, with the edges of the temporal bones becoming noticeably blurred. In contrast, using the modified Wiener filter-edge
detection, the spatial resolution remained as good as the original image, i.e., the edges of the temporal
bones were still very sharp. The novel noise reduction generated images with low noise as if filtered by the Wiener filter alone.
Figures 4 shows the subjective appearance of the spatial resolution and noise in the images. A more
objective description of the spatial resolution can be evaluated from the MTF curve, and noise can be calculated as the standard deviation in a homogeneous area. Figure 5 shows the MTF curves of the
images of the wire phantom. The spatial resolution of the images filtered by the Wiener filter
decreased significantly compared to the original image, whereas the spatial resolution of the images
filtered by the modified Wiener filter-edge hardly changed at all compared to the original image. Values of MTF10%, MTF50%, and noise for each are presented in Table 1. The modified Wiener
filter-edge detection produced MTF10% and MTF50% values that are higher than the Wiener filter
alone. The modified Wiener filter-edge detection produced the same noise as the Wiener filter alone. The deviation standards of both were 2.17 HU and 6.15 HU for FC13 and FC30, respectively.

ISNPINSA 2018
IOP Conf. Series: Journal of Physics: Conf. Series 1217 (2019) 012022
IOP Publishing
doi:10.1088/1742-6596/1217/1/012022
5
Figure 4. (a) Axial CT image of the head anthropomorphic phantom, (a) original image, (b) result of Wiener filtering, (c) result of modified Wiener filter-edge detection. The first row shows a zoomed
view of the temporal bones (spatial resolution), and the second row is a zoomed view of the center of
the images (noise).
Figure 5. MTF curves of the original image, after Wiener filtering and after filtering by the
combination Wiener filter-edge detection.
Table 1. MTF10%, MTF50%, and noise of the original image, after Wiener filtering and after
modified Wiener-filter-edge detection. Images FC13 FC30
MTF10%
(cycle/mm) MTF50%
(cycle/mm) Noise (HU) MTF10%
(cycle/mm) MTF50%
(cycle/mm) Noise
(HU)
Original 0.86 0.47 2.63 1.12 0.86 9.07
Wiener filter 0.76 0.43 2.17 0.97 0.74 6.51 Combination 0.84 0.45 2.17 1.05 0.79 6.51
3.2. Evaluation of Modified Wiener Filter-Edge Detection
For a modified Wiener filter-edge detection, it is possible that spatial resolution and noise are influenced by many factors: kernel size of the Wiener filter, threshold values in the edge detection, and
size of structuring elements in the dilation process. The impact of various kernel sizes of Wiener filter
(3x3, 5x5, and 7x7 pixels) on the MTF curves are shown in Figure 6. The larger kernel size in the Wiener filter produced a lower spatial resolution in the image. Values MTF10%, MTF50%, and noise
for each variation are presented in Table 2. It is clear that the larger kernel size also produces lower
image noise.
The result of the modified Wiener filter-edge detection is not only influenced by the characteristics of the Wiener filter but is influenced by the threshold values used in the edge detection algorithm
itself. In this study, we used a Prewitt mask with threshold values of 0.0001, 0.0005, and 0.0010. The

ISNPINSA 2018
IOP Conf. Series: Journal of Physics: Conf. Series 1217 (2019) 012022
IOP Publishing
doi:10.1088/1742-6596/1217/1/012022
6
MTF curves for the various threshold values are shown in Figure 7, and the values of MTF10%, MTF50%, and noise are presented in Table 3. It is clear that increasing the threshold value reduced the
spatial resolution of the image, but its effect on image noise is not straightforward. Dilation results in a
wider edge around objects in the image, depending on the range of the structuring element (strel) used. In this study, we used strel values of 2, 3, and 4 pixels. The MTF curves obtained are shown in Figure
9. The values of MTF10%, MTF50%, and noise are shown in Table 4. Larger values of strel range
produced a higher spatial resolution, although the effect is not as great as the effect of varying the edge detection threshold. Its effect on noise image is not straightforward.
Figure 6. The MTF curves for various kernel sizes of the Wiener filter (3x3, 5x5 and 7x7 pixels), (a)
FC13 and (b) FC30.
Figure 7. The MTF curves for various threshold values in the edge detection algorithm (0.0001, 0.0005 and 0.0010), (a) FC13, and (b) FC30.
4. Discussion
The major limitation of the noise reduction is a poorer spatial resolution. To overcome this effect, several noise reduction methods have been developed which maintain the spatial resolution of the
image [9-11]. A noise reduction technique combining the Wiener filter and edge detection has been
reported [12], but not studied in detail. The spatial resolution of the image was conducted subjectively
using a line-pair phantom. The study only used one value of kernel size in the Wiener filter and only one threshold value for edge detection [12]. The current study investigated the performance of the
algorithm and improved the method by adding a dilation process after edge detection.

ISNPINSA 2018
IOP Conf. Series: Journal of Physics: Conf. Series 1217 (2019) 012022
IOP Publishing
doi:10.1088/1742-6596/1217/1/012022
7
Figure 8. The MTF curves for dilation structuring elements of 2, 3 and 4 pixels, (a) FC13 and (b)
FC30.
Table 2. MTF10%, MTF50%, and noise for various kernel size of Wiener filter for FC13 and FC30.
Kernel
Variation
FC13 FC30
MTF10%
(cycle/mm)
MTF50%
(cycle/mm)
Noise
(HU)
MTF10%
(cycle/mm)
MTF50%
(cycle/mm)
Noise
(HU)
3x3 0.86 0.46 2.42 1.08 0.84 8.01 5x5 0.84 0.45 2.17 1.05 0.79 6.51 7x7 0.83 0.43 1.94 1.01 0.75 5.04
Table 3. MTF10%, MTF50%, and noise for various threshold value of edge detection.
Threshold
Variation
FC13 FC30
MTF10%
(cycle/mm)
MTF50%
(cycle/mm)
Noise
(HU)
MTF10%
(cycle/mm)
MTF50%
(cycle/mm)
Noise
(HU)
0.0001 0.86 0.46 2.17 1.08 0.84 8.63 0.0005 0.84 0.45 2.17 1.05 0.79 6.51 0.0010 0.83 0.43 2.17 1.01 0.75 6.51
Table 4. MTF10%, MTF50%, and noise for various sizes of structuring element.
STREL
variation
FC13 FC30
MTF10%
(cycle/mm)
MTF50%
(cycle/mm)
Noise
(HU)
MTF10%
(cycle/mm)
MTF50%
(cycle/mm)
Noise
(HU)
STREL 2 0.83 0.44 2.17 1.04 0.76 6.51 STREL 3 0.84 0.45 2.17 1.05 0.79 6.51 STREL 4 0.85 0.45 2.17 1.07 0.82 6.51
Image spatial resolution and noise are influenced by many parameters in this method, including the
kernel size in the Wiener filter, the edge detection threshold value, and the size of the structuring element used for dilation. An increase in the kernel size of Wiener filter results in a larger reduction of
spatial resolution and noise. Since every pixel value is compared with a wider area of neighboring
pixel values, it becomes more uniform. The more uniform pixel values lead to lower spatial resolution and noise. An increase in the threshold value during edge detection also causes a reduction in spatial
resolution and noise. This is because fewer edges are detected so that the new image is taken more
from the Wiener filtered image. An increase in the size of the structuring element causes an increase in
spatial resolution and noise. This is because the edge area becomes wider so that the image is taken more from the original image. Optimization of these parameters is determined by the specific image
characteristics, e.g., type of body part being imaged, and the type of reconstruction filters.

ISNPINSA 2018
IOP Conf. Series: Journal of Physics: Conf. Series 1217 (2019) 012022
IOP Publishing
doi:10.1088/1742-6596/1217/1/012022
8
5. Conclusions A combination of Wiener filter and edge detection, coupled with dilation, potentially reduced more CT
noise. The spatial resolution and noise of the filtered images were influenced by the values of the size
of the Wiener filter kernel, the threshold of edge detection, and size of the structuring element.
Acknowledgments
This work was funded by the Penelitian Dasar Unggulan Perguruan Tinggi (PDUPT) 2018, Ministry
of Research Technology and Higher Education of the Republic of Indonesia, contract number: 532z/I1.C01/PL/2018.
References
[1] Gies M, Kalender WA, Wolf H, Suess C, Madsen MT. Dose reduction in CT by anatomically
adapted tube current modulation. I. Simulation studies. Med Phys. 1999; 26: 2235-2247. [2] Anam C, Haryanto F, Widita R, Arif I, Dougherty G, McLean D. Int J Radiat Res. 2018; 16:
289-297.
[3] Anam C, Haryanto F, Widita R, Arif I, Dougherty G. Information (Japan). 2017; 20: 377-382. [4] McCollough CH, Bruesewitz MR, Kofler Jr JM. CT dose reduction and dose management
tools: overview of available options. Radiographics. 2006; 26: 503-512.
[5] Beister M, Kolditz D, Kalender WA. Iterative reconstruction methods in X-ray CT. Phys Med.
2012; 28: 94-108. [6] Hsieh J. Adaptive streak artifact reduction in computed tomography resulting from excessive x-
ray photon noise. Med Phys. 1998; 25: 2139-2147.
[7] Winklehner A, Karlo C, Puippe G, Schmidt B, Flohr T, Goetti R, et al. Raw data-based iterative reconstruction in body CTA: evaluation of radiation dose saving potential. Eur Radiol. 2011;
21: 2521-2526.
[8] Kamezawa H, Arimura H, Shirieda K, Kameda N, Ohki M. Feasibility of patient dose reduction based on various noise suppression filters for cone-beam computed tomography in an
image-guided patient positioning system. Phys Med Biol. 2016; 61: 3609–3636.
[9] Kalra MK, Maher MM, Sahani DV, Blake MA, Hahn PF, Avinash GB, et al. Low-dose CT of
the abdomen: Evaluation of image improvement with use of noise reduction filters—pilot study. Radiology. 2003; 228: 251–256.
[10] Al-Hinnawi AR, Daear M, Huwaijah S. Assessment of bilateral filter on 1/2-dose chest-pelvis
CT views. Radiol Phys Technol. 2013; 6: 385–398. [11] Buades A, Coll B, Morel JM. A review of image denoising algorithms, with a new one.
Multiscale Model Simul. 2005; 4: 490–530.
[12] Borsdorf A, Raupach R, Flohr T, Hornegger J. Wavelet-based noise reduction in CT images using correlation analysis. IEEE Transactions on Medical Imaging. 2008; 27: 1685-1703.
[13] Anam C, Haryanto F, Widita R, Arif I. AIP Conf Proc. 2015; 1677: 040004.
[14] Anam C, Fujibuchi T, Budi WS, Haryanto F, Dougherty. J Appl Clin Med Phys. 2018; 1-9. doi:
10.1002/acm2.12476.

Journal of Physics: Conference Series
PAPER • OPEN ACCESS
Growth and fabrication of 850 nm AlGaAs/GaAs vertical cavity surfaceemitting laser structureTo cite this article: N I Cabello et al 2019 J. Phys.: Conf. Ser. 1217 012003
View the article online for updates and enhancements.
This content was downloaded from IP address 118.96.138.242 on 07/06/2020 at 14:14

Content from this work may be used under the terms of the Creative Commons Attribution 3.0 licence. Any further distributionof this work must maintain attribution to the author(s) and the title of the work, journal citation and DOI.
Published under licence by IOP Publishing Ltd
ISNPINSA 2018
IOP Conf. Series: Journal of Physics: Conf. Series 1217 (2019) 012003
IOP Publishing
doi:10.1088/1742-6596/1217/1/012003
1
Growth and fabrication of 850 nm AlGaAs/GaAs vertical
cavity surface emitting laser structure
N I Cabello*, P M Tingzon, H A Husay, J D Vasquez, R Jagus, K L Patrocenio, K
C Gonzales, G A Catindig, E A Prieto, A Somintac, A Salvador and E Estacio
National Institute of Physics, College of Science, University of the Philippines
NIP Bldg, National Science Complex, Diliman, Quezon City 1101, Philippines
E-mail: [email protected]
Abstract. In this work, we demonstrate the NIP's all in-house development of a vertical cavity
surface emitting laser structure. The VCSEL structure grown via MBE consists of an AlAs/AlGaAs distributed Bragg reflector and an AlGaAs/GaAs quantum well designed to
issue at the 850 nm region. Reflectance spectroscopy showed that the stop band is centered
around the designed wavelength. The electroluminescence spectra displayed that the maximum
light emission corresponded to its design. This is a crucial step in the NIP's development of
semiconductor lasers, leading towards future high-speed and highly-tunable VCSEL devices.
1. Introduction
Semiconductor lasers have been at the forefront of high-speed interconnects, thanks to the
development of lasers capable of operating at gigahertz speeds [1]. Expansion to other applications such as proximity sensing [2] and light detection and ranging (LIDAR) [3] have driven further
research on this field. For high-speed devices, switching speeds at the gigahertz range are desired [1],
while high tuning speeds and increased tunability are sought for wavelength-tunable devices [4]. With its molecular beam epitaxy (MBE) and device fabrication facilities, the National Institute of Physics
(NIP) has recently renewed its research thrust in this field, most notably on vertical cavity surface
emitting lasers (VCSELs). The VCSEL is a type of semiconductor laser with light emission orthogonal to the wafer plane. Its
main advantages over other conventional semiconductor lasers such as edge-emitting lasers are the
ease of coupling to optical fibers, direct wafer scale probing and low threshold operation [5]. A
standard VCSEL design is composed of an optical cavity with an active region in the center, which is usually a quantum well (QW). The optical cavity is then sandwiched between two distributed Bragg
reflectors (DBRs), which are highly reflecting mirrors composed of alternating high and low refractive
index medium materials. The stop band of the DBR, which is the wavelength region with the highest reflectance, should coincide with the QW emission wavelength. Oxidation apertures, usually situated
near the active region, are also employed for optical and current confinement [6].
In this paper, we report on the all in-house development of an AlGaAs/GaAs-based DBR VCSEL structure at the chip level. The whole process entails the whole production processes: the growth of the
layers, device fabrication, and characterization of both as-grown and device-fabricated layers.
Oxidation was also performed to explore the possibility of current and optical confinement effects [6].
2. Experimental Details

ISNPINSA 2018
IOP Conf. Series: Journal of Physics: Conf. Series 1217 (2019) 012003
IOP Publishing
doi:10.1088/1742-6596/1217/1/012003
2
The VCSEL layers were grown using a Riber 32P molecular beam epitaxy chamber and are detailed in Figure 1. The layers were grown on an-GaAs substrate, starting with 24.5 DBR pairs of Si-doped
AlAs/Al0.29Ga0.71As layers. The λ-cavity was composed of 248 nm Al0.29Ga0.71As spacer, at the middle
of which is the active region composed of three 90 Å GaAs QWs with 80 Å of Al0.29Ga0.71As barriers in between the wells. On top of the cavity is another 25 pairs of Be-doped Al0.29Ga0.71As/AlAs layers,
which was terminated by a 20 nm Be-doped GaAs cap. To confirm the presence of the DBR, the wafer
was subjected to normal incidence reflectance spectroscopy, in which light from a tungsten-halogen lamp dispersed by a Spex 500M monochromator was used as excitation, and a Si photodiode was used
for detection. Scanning electron microscopy (SEM) using a Hitachi SU8230 was used to observe the
morphology and measure the thickness of the grown layers.
Figure 1. MBE layer details of the VCSEL structure.
The wafer was then cleaved to 1cm×1cm chips, which were then degreased using acetone, methanol
and deionized H2O. Mesas with 250 μm diameter were patterned onto the chips using a Karl Suss
MJB3 mask aligner. The mesas were etched in piranha solution until the first few bottom DBR pairs
below the active region were accessed. One of the chips was then oxidized for one hr at 430°C in a tube furnace with ambient H2O vapor and N2 carrier gas. The extent of oxidation along the mesa was
measured using a Wyko interferometer. Top metal contacts were then patterned onto both unoxidized
and oxidized samples using the MJB3, and 147 nm of indium were deposited onto on both front and backside using resistive evaporation. The current-voltage (IV) curves of the fabricated devices were
taken using a Tektronix 370A curve tracer and electroluminescence (EL) spectroscopy was performed
using a 10× objective to collect the EL signal, which was fiber-fed to an Andor Shamrock 303i spectrometer equipped with a CCD detector.
3. Results and Discussion
The SEM images of the as-grown layers are shown in Figure 2. While the DBR layers are mostly
consistent regarding thicknesses, there are two outlier AlGaAs layers present at the bottom DBR, which were at the 11
th and 15
th layers.

ISNPINSA 2018
IOP Conf. Series: Journal of Physics: Conf. Series 1217 (2019) 012003
IOP Publishing
doi:10.1088/1742-6596/1217/1/012003
3
Figure 2. (a) SEM image of the whole VCSEL structure. The green and yellow arrows label the 11th
and 15th bottom DBR AlGaAs layers, respectively, which were the outlier layers. (b) Higher
magnification SEM image in the region of the 15th bottom DBR AlGaAs layer, which is labeled by the
yellow arrow.
The thicknesses of the layers are summarized in Table 1. The cause of the outlier layers in the 11th
and 15th AlGaAs layers is possibly due to sudden overflux of gallium during growth of the bottom
DBR. The top DBRs were close to their nominal thicknesses, which is confirmed by the high reflectance at the 850 nm region as shown in its reflectance spectrum in Figure 3. The nominal
emission wavelength of the 90 Å quantum well at 850 nm was within the stop band, and the stop
band’s width was measured to be 127.5 nm. Table 1. Measured DBR layer thicknesses.
Layer Measured Thickness
(nm)
Nominal Thickness
(nm) % Error
AlGaAs DBR layers 54.3 ± 4.4
62 12.4
AlGaAs outlier DBR Layers 180.6 ± 2.7 62 191.3
AlAs DBR layers 73.0 ± 9.1 71 2.8
Figure 3. Reflectance spectra of the as-grown VCSEL structure. The dotted line indicates the
nominal emission wavelength of the QWs.

ISNPINSA 2018
IOP Conf. Series: Journal of Physics: Conf. Series 1217 (2019) 012003
IOP Publishing
doi:10.1088/1742-6596/1217/1/012003
4
The optical and Wyko image of the oxidized sample depicting the oxidation fronts is shown in Figure 4. There is an observable band at the outer edge of the mesa structure from both optical and
Wyko image. This corresponds to the oxidized parts of the AlAs layers exposed along the sidewall of
the mesa having been oxidized to Al2O3. From Figure 4b, the unoxidized aperture was measured to be 172.33 μm, which is the remaining conducting region within the mesa.
Figure 3. (a) Optical and (b) Wyko images of the oxidized mesa
structures. Scale bar in (a) is 50 μm.
The IV curves for both oxidized and unoxidized fabricated devices are shown in Figure 4a. For the unoxidized sample, the turn-on voltage was 2.8 V, and the forward bias resistance was at 7.66 kΩ. For
the oxidized sample, the turn-on voltage was 6.0 V, and the forward bias resistance was at 9.43 kΩ.
The high forward bias resistance for both devices was due to the use of AlAs instead of high Al mole fraction AlGaAs for the DBR layers. The increased resistance in the oxidized sample was due to a
conversion of the exposed AlAs DBR layers to Al2O3, which has higher resistivity than AlAs [7,8].
Performing grading between AlGaAs and AlAs could lower the forward bias resistance [9].
Figure 4. (a) I-V curves and (b) EL spectra of the unoxidized and oxidized VCSEL structure. The EL spectra were taken with each of devices driven at 20 mA.
The devices were then driven to 20 mA, and the resulting EL spectra are shown in Figure 6. Both unoxidized and unoxidized sample display EL emission at around 850 nm and FWHM of roughly 2.4
nm, which corresponds to the QW emission wavelength and the λ-cavity wavelength. There is a
marked 2.8× increase in the EL intensity from the unoxidized sample to the oxidized sample. This is
due to the increased current confinement in the oxidized sample resulting from the reduced conducting region in the mesa [6,10]. However, the EL intensities for both samples are too low to be indicative of

ISNPINSA 2018
IOP Conf. Series: Journal of Physics: Conf. Series 1217 (2019) 012003
IOP Publishing
doi:10.1088/1742-6596/1217/1/012003
5
lasing. The samples did not lase possibly due to the imperfect bottom DBR mirror. Table 2 summarizes the fabricated laser structures’ optoelectronic properties.
Table 2. Optoelectronic properties of fabricated laser structures. Peak emission wavelength, FWHM, and EL intensity were taken at 20mA source current.
Sample
Turn-on
Voltage
(V)
Forward Bias
Resistance
(kΩ)
Peak EL
Wavelength
(nm)
Peak EL
FWHM
(nm)
Peak EL
Intensity
(counts)
Unoxidized 2.8
7.66 850.8 2.4 369
1 hr Oxidized 6.0 9.43 850.1 2.5 1050
4. Conclusion An all in-house 850 nm AlGaAs/GaAs VCSEL structure was successfully fabricated. The high forward bias resistance attributed to the use of AlAs instead of high mole fraction AlGaAs in the
DBRs. Increased forward bias resistance from unoxidized to oxidized samples was due to oxidation of
AlAs to Al2O3. EL emission centered at 850 nm resulted from effective top DBR, cavity and an active
region. However, lasing was not achieved in both samples due to imperfections in the bottom DBR. The increase in the EL intensity in the oxidized samples was due to current confinement resulting from
the reduced conducting region within the mesa.
Acknowledgments
This work was sponsored in part by grants from UP Systems Grant, DOST-GIA, DOST-PCIEERD
and CHED-PCARI (IIID-2015-13).
References
[1] Ou Y, Gustavsson J S, Westbergh P, Haglund A, Larsson A, and Joel A 2009 IEEE Photon.
Tech. Lett. 21 (24) 1840-1842
[2] Marciniak M, Piskorski L, Gębski M, Dems M, Wasiak M, Panajotov K, Lott J A, and Czyszanowski T 2018 J. Lightw. Technol. 36 (16) 3185-3192
[3] Warren M E, Podva D, Dacha P, Block M K, Helms C J, Maynard J, Carson R F 2018 Proc.
SPIE 10552, Vertical-Cavity Surface-Emitting Lasers XXII, 105520E [4] Li K, Chase C, Qiao P, and Chang-Hasnain C J 2017 Opt. Exp. 25 (10) 11844-11854
[5] Chuang S L 2009 Physics of Photonic Devices (Hoboken: John Wiley & Sons, Inc.)
[6] Grabherr M, Jäger R, Michalzik R, Weigl B, Reiner G, and Ebeling K J 1997 IEEE Photon. Tech. Lett. 9 (10) 1304-1306
[7] Madelung O 1991 Semiconductors Group IV Elements and III -V Compounds (Berlin: Springer
– Verlag)
[8] Shackelford J F, Alexander W 2001 CRC Materials Science and Engineering Handbook (Boca Raton: CRC Press LLC)
[9] Hong M, Mannaerts, J P, Hong, J M, Fischer R J, Tai K, Kwo J, Vandenberg J M, Wang Y H,
Gamelin J 1991 J. Cryst. Growth 111 (1) 1071-1075 [10] Choquette K D, Lear K L, Schneider R P, and Geib K M 1995 Appl. Phys. Lett. 66 (25) 3413-
3415